UNITED STATES
SECURITIES AND EXCHANGE COMMISSION
Washington, D.C. 20549
FORM N-CSR
CERTIFIED SHAREHOLDER REPORT OF
REGISTERED MANAGEMENT INVESTMENT COMPANIES
Investment Company Act file number 811-08326
MFS VARIABLE INSURANCE TRUST
(Exact name of registrant as specified in charter)
111 Huntington Avenue, Boston, Massachusetts 02199
(Address of principal executive offices) (Zip code)
Susan S. Newton
Massachusetts Financial Services Company
111 Huntington Avenue
Boston, Massachusetts 02199
(Name and address of agents for service)
Registrant’s telephone number, including area code: (617) 954-5000
Date of fiscal year end: December 31
Date of reporting period: December 31, 2014
| ITEM 1. | REPORTS TO STOCKHOLDERS. |
ANNUAL REPORT
December 31, 2014

MFS® CORE EQUITY SERIES
MFS® Variable Insurance Trust

VVS-ANN
MFS® CORE EQUITY SERIES
CONTENTS
The report is prepared for the general information of contract owners. It is authorized for distribution to prospective investors only when preceded or accompanied by a current prospectus.
NOT FDIC INSURED Ÿ MAY LOSE VALUE Ÿ NO BANK OR CREDIT UNION GUARANTEE Ÿ NOT A DEPOSIT Ÿ NOT INSURED BY ANY FEDERAL GOVERNMENT AGENCY OR NCUA/NCUSIF
MFS Core Equity Series
LETTER FROM THE CHAIRMAN

Dear Contract Owners:
As 2015 begins, sharply lower oil prices are reshaping the global economy, adding to deflationary pressures in the eurozone and exacerbating challenges faced by oil exporters such as Russia. The U.S. economy stands on firmer ground, having expanded steadily over the past year. The U.S. labor market has regained momentum, consumer confidence is buoyant and gasoline prices have tumbled, boosting prospects for a stronger economic rebound in 2015.
Other regions are struggling. The eurozone economy is barely expanding, and the European Central Bank (ECB) has introduced large-scale asset purchases.
Despite Japan’s efforts to strengthen its economy, its sales tax increase last spring tipped the country into a recession, leading to additional monetary stimulus from the Bank of Japan. China’s economy is slowing as it transitions to a more sustainable basis, and its growth rate will likely continue to decline.
As always, active risk management is integral to how we at MFS® manage your investments. We use a collaborative process, sharing insights across asset classes, regions and economic sectors. Our global investment team uses a diversified, multidisciplined, long-term approach.
Applying proven principles, such as asset allocation and diversification, can best serve investors over the long term. We are confident that this approach can help you as you work with your financial advisors to reach your goals in the years ahead.
Respectfully,

Robert J. Manning
Chairman
MFS Investment Management
February 13, 2015
The opinions expressed in this letter are subject to change and may not be relied upon for investment advice. No forecasts can be guaranteed.
1
MFS Core Equity Series
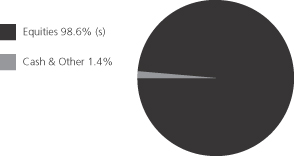
PORTFOLIO COMPOSITION
Portfolio structure
| | | | |
| Top ten holdings | | | | |
| Apple, Inc. | | | 2.6% | |
| American International Group, Inc. | | | 1.6% | |
| Hess Corp. | | | 1.6% | |
| Visa, Inc., “A” | | | 1.6% | |
| JPMorgan Chase & Co. | | | 1.4% | |
| Wells Fargo & Co. | | | 1.3% | |
| MetLife, Inc. | | | 1.3% | |
| Twenty-First Century Fox, Inc. | | | 1.3% | |
| Discover Financial Services | | | 1.2% | |
| Chevron Corp. | | | 1.2% | |
| | | | |
| Equity sectors | | | | |
| Financial Services | | | 18.7% | |
| Technology | | | 15.7% | |
| Health Care | | | 14.1% | |
| Industrial Goods & Services | | | 7.2% | |
| Retailing | | | 7.1% | |
| Energy | | | 7.0% | |
| Consumer Staples | | | 6.7% | |
| Leisure (s) | | | 5.1% | |
| Utilities & Communications | | | 5.1% | |
| Special Products & Services | | | 4.0% | |
| Basic Materials | | | 3.4% | |
| Autos & Housing | | | 2.5% | |
| Transportation | | | 2.0% | |
| (s) | Includes securities sold short. |
Cash & Other can include cash, other assets less liabilities, offsets to derivative positions, and short-term securities.
Percentages are based on net assets as of 12/31/14.
The portfolio is actively managed and current holdings may be different.
2
MFS Core Equity Series
MANAGEMENT REVIEW
Summary of Results
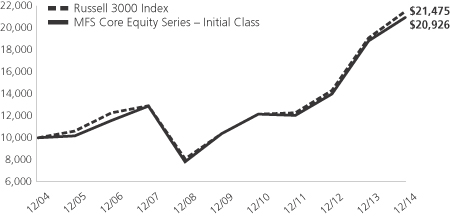
For the twelve months ended December 31, 2014, Initial Class shares of the MFS Core Equity Series (“fund”) provided a total return of 11.24%, while Service Class shares of the fund provided a total return of 10.97%. These compare with a return of 12.56% over the same period for the fund’s benchmark, the Russell 3000 Index.
Market Environment
Early in the period, US equities suffered what proved to be a temporary setback due to concerns over emerging markets as well as what was perceived at the time to be a pause in US economic growth, partially caused by extreme weather events and a weak December 2013 labor market report. Markets soon recovered as the economic pause concluded and investors appeared to have become increasingly comfortable that newly-installed US Federal Reserve (“Fed”) Chair Janet Yellen would not make any substantial changes to the trajectory of Fed monetary policy.
A generally risk-friendly, carry trade environment persisted from February 2014 until mid-year. While geopolitical tensions flared in the Middle East and Russia/Ukraine, any market setbacks were short-lived as improving economic growth in the US, coupled with prospects for easier monetary policy in regions with slowing growth, such as Japan, Europe and China, supported risk assets. For example, the European Central Bank (“ECB”) cut policy interest rates into negative territory and, by the end of the period, expectations were for additional rate cuts and the announcement for non-conventional easing measures. Similarly, the Bank of Japan surprised markets late in the period with fresh stimulus measures given lackluster growth trends. The related decline in developed market government bond yields and credit spreads were also supportive for equity markets. At the end of the period, the US equity market was trading close to all-time highs and US Treasury yields were close to their lows for the period. However, credit markets did not fare as well in the second half of 2014, particularly US high yield and emerging market debt. The higher weightings of oil and gas credits in these asset classes resulted in widening spreads and increased volatility as oil prices began to decline in an accelerated fashion in the fourth quarter.
Detractors from Performance
Weak stock selection in the special products & services sector detracted from performance relative to the Russell 3000 Index. The fund’s overweight position in postsecondary education provider ITT Educational Services (h) held back relative returns. Shares of ITT Educational Services declined during the period reflecting weaker trends in new student enrollment and potential regulatory issues brought forward by the Securities and Exchange Commission (“SEC”). In addition, the Department of Education introduced sanctions against ITT Educational Services as the company did not submit 2013 audited financials within the deadline date which further pressured the stock.
Stock selection was also a negative factor affecting relative performance in the leisure sector, particularly the fund’s overweight positions in digital coupon marketplace operator RetailMeNot (h) and casino resorts operator Wynn Resorts. Shares of Wynn Resorts were negatively impacted by downward operating trends across the industry. The share price decline was also affected by the adverse impact from regulatory risks centered around anticorruption policies on the company’s Macau operations.
Elsewhere, the fund’s overweight positions in food retail stores operator Fairway Group Holdings, global integrated energy company Hess, oil and natural gas exploration and production company Noble Energy, complex metal parts manufacturer for the aerospace industry Precision Castparts and global industrial manufacturing and engineering company Colfax dampened relative performance. Shares of Fairway Group Holdings were pressured due to disappointing earnings results and the announcement that the company’s long-serving CEO was retiring. The timing of the fund’s ownership in shares of software giant Microsoft (h) and not owning strong-performing semiconductor company Intel, further weighed on relative returns.
Contributors to Performance
Stock selection in the health care sector contributed to relative performance. The fund’s overweight positions in development stage biopharmaceutical company Puma Biotechnology, medical devices and supply products manufacturer Covidien and specialty pharmaceutical company Actavis boosted results. Shares of Covidien skyrocketed late in the reporting period as the company announced that Medtronic had entered into an agreement to acquire the company at a significant premium.
Stock selection was also a positive factor affecting performance in the autos & housing sector. Within this sector, overweighting strong-performing paint and coating manufacturer Sherwin-Williams helped relative results. Shares of Sherwin-Williams rose as the company beat market expectations on the back of strong volume trends across all segments which were the primary drivers behind the outperformance. Additionally, the company raised its earnings guidance for the full year which also helped relative returns.
Elsewhere, the fund’s overweight positions in analog semiconductor devices developer Avago Technologies, computer and personal electronics maker Hewlett-Packard and retailer Burlington Stores aided relative performance. Shares of Hewlett-Packard benefited from total company sales growth driven by the PC segment. Additionally, Hewlett-Packard posted very strong free cash flows that
3
MFS Core Equity Series
Management Review – continued
could potentially provide adequate funds for stock repurchases, dividends and strategic Mergers & Acquisitions (M&A) activity. Not holding weak-performing diversified industrial conglomerate General Electric, internet retailer Amazon.com and diversified technology products and services company International Business Machines (IBM) also benefited relative returns as all three stocks underperformed the benchmark during the reporting period.
Respectfully,
Joseph MacDougall
Portfolio Manager
| (h) | Security was not held in the portfolio at period end. |
The views expressed in this report are those of the portfolio manager only through the end of the period of the report as stated on the cover and do not necessarily reflect the views of MFS or any other person in the MFS organization. These views are subject to change at any time based on market or other conditions, and MFS disclaims any responsibility to update such views. These views may not be relied upon as investment advice or an indication of trading intent on behalf of any MFS portfolio. References to specific securities are not recommendations of such securities, and may not be representative of any MFS portfolio’s current or future investments.
4
MFS Core Equity Series
PERFORMANCE SUMMARY THROUGH 12/31/14
The following chart illustrates the historical performance of the fund in comparison to its benchmark(s). Benchmarks are unmanaged and may not be invested in directly. Benchmark returns do not reflect any fees or expenses. The performance of other share classes will be greater than or less than that of the class depicted below. (See Notes to Performance Summary.)
Performance data shown represents past performance and is no guarantee of future results. Investment return and principal value fluctuate so your units, when sold, may be worth more or less than the original cost; current performance may be lower or higher than quoted. The performance shown does not reflect the deduction of taxes, if any, that a contract holder would pay on fund distributions or the redemption of contract units. The returns for the fund shown also do not reflect the deduction of expenses associated with variable products, such as mortality and expense risk charges, separate account charges, and sales charges imposed by the insurance company separate accounts. Such expenses would reduce the overall returns shown.
Growth of a Hypothetical $10,000 Investment
Total Returns through 12/31/14
Average annual total returns
| | | | | | | | | | | | |
| | | Share Class | | Class inception date | | 1-yr | | 5-yr | | 10-yr | | |
| | | Initial Class | | 8/14/96 | | 11.24% | | 15.09% | | 7.66% | | |
| | | Service Class | | 5/01/00 | | 10.97% | | 14.78% | | 7.40% | | |
| | | | |
| Comparative benchmark | | | | | | | | |
| | | Russell 3000 Index (f) | | 12.56% | | 15.63% | | 7.94% | | |
| (f) | Source: FactSet Research Systems Inc. |
Benchmark Definition
Russell 3000 Index – constructed to provide a comprehensive barometer for the 3,000 largest U.S. companies based on total market capitalization, which represents approximately 98% of the investable U.S. equity market.
It is not possible to invest directly in an index.
Notes to Performance Summary
Average annual total return represents the average annual change in value for each share class for the periods presented.
Performance results reflect any applicable expense subsidies and waivers in effect during the periods shown. Without such subsidies and waivers the fund’s performance results would be less favorable. Please see the prospectus and financial statements for complete details. All results are historical and assume the reinvestment of any dividends and capital gains distributions.
Performance results do not include adjustments made for financial reporting purposes in accordance with U.S. generally accepted accounting principles and may differ from amounts reported in the financial highlights.
From time to time the fund may receive proceeds from litigation settlements, without which performance would be lower.
5
MFS Core Equity Series
EXPENSE TABLE
Fund Expenses Borne by the Contract Holders During the Period,
July 1, 2014 through December 31, 2014
As a contract holder of the fund, you incur ongoing costs, including management fees; distribution and/or service (12b-1) fees; and other fund expenses. This example is intended to help you understand your ongoing costs (in dollars) of investing in the fund and to compare these costs with the ongoing costs of investing in other mutual funds.
The example is based on an investment of $1,000 invested at the beginning of the period and held for the entire period July 1, 2014 through December 31, 2014.
Actual Expenses
The first line for each share class in the following table provides information about actual account values and actual expenses. You may use the information in this line, together with the amount you invested, to estimate the expenses that you paid over the period. Simply divide your account value by $1,000 (for example, an $8,600 account value divided by $1,000 = 8.6), then multiply the result by the number in the first line under the heading entitled “Expenses Paid During Period” to estimate the expenses you paid on your account during this period.
Hypothetical Example for Comparison Purposes
The second line for each share class in the following table provides information about hypothetical account values and hypothetical expenses based on the fund’s actual expense ratio and an assumed rate of return of 5% per year before expenses, which is not the fund’s actual return. The hypothetical account values and expenses may not be used to estimate the actual ending account balance or expenses you paid for the period. You may use this information to compare the ongoing costs of investing in the fund and other funds. To do so, compare this 5% hypothetical example with the 5% hypothetical examples that appear in the shareholder reports of the other funds.
Please note that the expenses shown in the table are meant to highlight the fund’s ongoing costs only and do not take into account the fees and expenses imposed under the variable contracts through which your investment in the fund is made. Therefore, the second line for each share class in the table is useful in comparing ongoing costs associated with an investment in vehicles (such as the fund) which fund benefits under variable annuity and variable life insurance contracts and to qualified pension and retirement plans only, and will not help you determine the relative total costs of investing in the fund through variable annuity and variable life insurance contracts. If the fees and expenses imposed under the variable contracts were included, your costs would have been higher.
| | | | | | | | | | | | | | | | | | |
| Share Class | | | | Annualized
Expense Ratio | | | Beginning
Account Value
7/01/14 | | | Ending
Account Value
12/31/14 | | | Expenses Paid During Period (p) 7/01/14-12/31/14 | |
| Initial Class | | Actual | | | 0.90% | | | | $1,000.00 | | | | $1,052.10 | | | | $4.66 | |
| | Hypothetical (h) | | | 0.90% | | | | $1,000.00 | | | | $1,020.67 | | | | $4.58 | |
| Service Class | | Actual | | | 1.15% | | | | $1,000.00 | | | | $1,050.66 | | | | $5.94 | |
| | Hypothetical (h) | | | 1.15% | | | | $1,000.00 | | | | $1,019.41 | | | | $5.85 | |
| (h) | 5% class return per year before expenses. |
| (p) | “Expenses Paid During Period” are equal to each class’s annualized expense ratio, as shown above, multiplied by the average account value over the period, multiplied by 184/365 (to reflect the one-half year period). |
6
MFS Core Equity Series
PORTFOLIO OF INVESTMENTS – 12/31/14
The Portfolio of Investments is a complete list of all securities owned by your fund. It is categorized by broad-based asset classes.
| | | | | | | | |
| Issuer | | Shares/Par | | | Value ($) | |
| | | | | | | | |
| COMMON STOCKS – 98.8% | |
| Aerospace – 3.2% | | | | | | | | |
| Honeywell International, Inc. | | | 8,226 | | | $ | 821,934 | |
| Precision Castparts Corp. | | | 2,047 | | | | 493,081 | |
| Textron, Inc. | | | 2,808 | | | | 118,245 | |
| United Technologies Corp. | | | 6,401 | | | | 736,115 | |
| | | | | | | | |
| | | $ | 2,169,375 | |
| | | | | | | | |
| Alcoholic Beverages – 0.3% | | | | | | | | |
| Constellation Brands, Inc., “A” (a) | | | 1,823 | | | $ | 178,964 | |
| | | | | | | | |
| Apparel Manufacturers – 0.9% | |
| NIKE, Inc., “B” | | | 571 | | | $ | 54,902 | |
| PVH Corp. | | | 3,341 | | | | 428,216 | |
| VF Corp. | | | 1,710 | | | | 128,079 | |
| | | | | | | | |
| | | $ | 611,197 | |
| | | | | | | | |
| Automotive – 1.2% | | | | | | | | |
| Delphi Automotive PLC | | | 4,701 | | | $ | 341,857 | |
| Harley-Davidson, Inc. | | | 4,023 | | | | 265,156 | |
| Johnson Controls, Inc. | | | 4,600 | | | | 222,364 | |
| | | | | | | | |
| | | $ | 829,377 | |
| | | | | | | | |
| Biotechnology – 1.7% | | | | | | | | |
| Alexion Pharmaceuticals, Inc. (a) | | | 2,135 | | | $ | 395,039 | |
| Biogen Idec, Inc. (a) | | | 1,501 | | | | 509,514 | |
| Exact Sciences Corp. (a) | | | 1,303 | | | | 35,754 | |
| Illumina, Inc. (a) | | | 168 | | | | 31,009 | |
| MiMedx Group, Inc. (a)(l) | | | 3,812 | | | | 43,952 | |
| Puma Biotechnology, Inc. (a) | | | 839 | | | | 158,798 | |
| | | | | | | | |
| | | $ | 1,174,066 | |
| | | | | | | | |
| Broadcasting – 2.5% | | | | | | | | |
| Time Warner, Inc. | | | 7,236 | | | $ | 618,099 | |
| Twenty-First Century Fox, Inc. | | | 22,352 | | | | 858,429 | |
| Walt Disney Co. | | | 2,135 | | | | 201,096 | |
| | | | | | | | |
| | | $ | 1,677,624 | |
| | | | | | | | |
| Brokerage & Asset Managers – 1.7% | |
| Affiliated Managers Group, Inc. (a) | | | 671 | | | $ | 142,413 | |
| BlackRock, Inc. | | | 893 | | | | 319,301 | |
| Franklin Resources, Inc. | | | 3,732 | | | | 206,641 | |
| FXCM, Inc., “A” | | | 7,862 | | | | 130,273 | |
| NASDAQ OMX Group, Inc. | | | 7,690 | | | | 368,812 | |
| | | | | | | | |
| | | $ | 1,167,440 | |
| | | | | | | | |
| Business Services – 2.6% | |
| Accenture PLC, “A” | | | 2,886 | | | $ | 257,749 | |
| Bright Horizons Family Solutions, Inc. (a) | | | 6,809 | | | | 320,091 | |
| Fidelity National Information Services, Inc. | | | 5,869 | | | | 365,052 | |
| FleetCor Technologies, Inc. (a) | | | 1,491 | | | | 221,727 | |
| Forrester Research, Inc. | | | 2,896 | | | | 113,987 | |
| Gartner, Inc. (a) | | | 3,127 | | | | 263,325 | |
| Global Payments, Inc. | | | 654 | | | | 52,797 | |
| Wex, Inc. (a) | | | 1,497 | | | | 148,083 | |
| | | | | | | | |
| | | $ | 1,742,811 | |
| | | | | | | | |
| | | | | | | | |
| Issuer | | Shares/Par | | | Value ($) | |
| | | | | | | | |
| COMMON STOCKS – continued | | | | | |
| Cable TV – 1.3% | | | | | | | | |
| Charter Communications, Inc., “A” (a) | | | 1,676 | | | $ | 279,255 | |
| Comcast Corp., “Special A” | | | 3,522 | | | | 202,744 | |
| Time Warner Cable, Inc. | | | 2,411 | | | | 366,617 | |
| | | | | | | | |
| | | $ | 848,616 | |
| | | | | | | | |
| Chemicals – 1.4% | | | | | | | | |
| Agrium, Inc. | | | 2,106 | | | $ | 199,397 | |
| E.I. du Pont de Nemours & Co. | | | 5,969 | | | | 441,348 | |
| LyondellBasell Industries N.V., “A” | | | 3,404 | | | | 270,244 | |
| | | | | | | | |
| | | $ | 910,989 | |
| | | | | | | | |
| Computer Software – 4.1% | | | | | | | | |
| Adobe Systems, Inc. (a) | | | 5,431 | | | $ | 394,834 | |
| Check Point Software Technologies Ltd. (a) | | | 8,197 | | | | 644,038 | |
| Intuit, Inc. | | | 1,998 | | | | 184,196 | |
| Oracle Corp. | | | 11,959 | | | | 537,796 | |
| Qlik Technologies, Inc. (a) | | | 10,668 | | | | 329,535 | |
| Salesforce.com, Inc. (a) | | | 11,092 | | | | 657,867 | |
| | | | | | | | |
| | | $ | 2,748,266 | |
| | | | | | | | |
| Computer Software – Systems – 4.5% | |
| Apple, Inc. (s) | | | 15,645 | | | $ | 1,726,895 | |
| EMC Corp. | | | 25,656 | | | | 763,009 | |
| Hewlett-Packard Co. | | | 3,583 | | | | 143,786 | |
| NCR Corp. (a) | | | 6,778 | | | | 197,511 | |
| SS&C Technologies Holdings, Inc. | | | 3,754 | | | | 219,571 | |
| | | | | | | | |
| | | $ | 3,050,772 | |
| | | | | | | | |
| Construction – 1.3% | | | | | | | | |
| Fortune Brands Home & Security, Inc. | | | 6,300 | | | $ | 285,201 | |
| Pool Corp. | | | 1,424 | | | | 90,339 | |
| Sherwin-Williams Co. | | | 1,916 | | | | 503,985 | |
| | | | | | | | |
| | | $ | 879,525 | |
| | | | | | | | |
| Consumer Products – 2.4% | | | | | | | | |
| Colgate-Palmolive Co. | | | 6,486 | | | $ | 448,766 | |
| Estee Lauder Cos., Inc., “A” | | | 1,854 | | | | 141,275 | |
| Newell Rubbermaid, Inc. | | | 8,085 | | | | 307,958 | |
| Procter & Gamble Co. | | | 8,008 | | | | 729,449 | |
| | | | | | | | |
| | | $ | 1,627,448 | |
| | | | | | | | |
| Consumer Services – 1.4% | | | | | | | | |
| Nord Anglia Education, Inc. (a) | | | 11,449 | | | $ | 218,447 | |
| Priceline Group, Inc. (a) | | | 627 | | | | 714,912 | |
| | | | | | | | |
| | | $ | 933,359 | |
| | | | | | | | |
| Containers – 0.1% | | | | | | | | |
| Crown Holdings, Inc. (a) | | | 1,784 | | | $ | 90,806 | |
| | | | | | | | |
| Electrical Equipment – 1.8% | | | | | | | | |
| Advanced Drainage Systems, Inc. | | | 9,773 | | | $ | 224,584 | |
| AMETEK, Inc. | | | 5,836 | | | | 307,149 | |
| Danaher Corp. | | | 6,957 | | | | 596,284 | |
| W.W. Grainger, Inc. | | | 375 | | | | 95,584 | |
| | | | | | | | |
| | | $ | 1,223,601 | |
| | | | | | | | |
7
MFS Core Equity Series
Portfolio of Investments – continued
| | | | | | | | |
| Issuer | | Shares/Par | | | Value ($) | |
| | | | | | | | |
| COMMON STOCKS – continued | | | | | |
| Electronics – 3.9% | | | | | | | | |
| Altera Corp. | | | 15,854 | | | $ | 585,647 | |
| Avago Technologies Ltd. | | | 3,637 | | | | 365,846 | |
| Broadcom Corp., “A” | | | 7,738 | | | | 335,288 | |
| Freescale Semiconductor Ltd. (a) | | | 2,952 | | | | 74,479 | |
| KLA-Tencor Corp. | | | 2,973 | | | | 209,061 | |
| Mellanox Technologies Ltd. (a) | | | 4,671 | | | | 199,592 | |
| Rubicon Technology, Inc. (a)(l) | | | 11,907 | | | | 54,415 | |
| Skyworks Solutions, Inc. | | | 1,445 | | | | 105,066 | |
| Texas Instruments, Inc. | | | 12,120 | | | | 647,996 | |
| Ultratech, Inc. (a) | | | 4,513 | | | | 83,761 | |
| | | | | | | | |
| | | $ | 2,661,151 | |
| | | | | | | | |
| Energy – Independent – 3.0% | | | | | | | | |
| Access Midstream Partners LP | | | 2,427 | | | $ | 131,543 | |
| Anadarko Petroleum Corp. | | | 3,655 | | | | 301,538 | |
| Clayton Williams Energy, Inc. (a) | | | 693 | | | | 44,213 | |
| Concho Resources, Inc. (a) | | | 838 | | | | 83,591 | |
| CONSOL Energy, Inc. | | | 1,267 | | | | 42,837 | |
| Energy XXI (Bermuda) Ltd. | | | 4,119 | | | | 13,428 | |
| EOG Resources, Inc. | | | 3,354 | | | | 308,803 | |
| Goodrich Petroleum Corp. (a)(l) | | | 6,722 | | | | 29,846 | |
| Marathon Petroleum Corp. | | | 4,224 | | | | 381,258 | |
| Memorial Resource Development Corp. (a) | | | 7,959 | | | | 143,501 | |
| Noble Energy, Inc. | | | 2,871 | | | | 136,172 | |
| PDC Energy, Inc. (a) | | | 767 | | | | 31,654 | |
| Peabody Energy Corp. | | | 1,394 | | | | 10,790 | |
| Pioneer Natural Resources Co. | | | 971 | | | | 144,533 | |
| Rice Energy, Inc. (a) | | | 2,303 | | | | 48,294 | |
| Sanchez Energy Corp. (a) | | | 2,031 | | | | 18,868 | |
| Targa Resources Corp. | | | 1,159 | | | | 122,912 | |
| | | | | | | | |
| | | $ | 1,993,781 | |
| | | | | | | | |
| Energy – Integrated – 2.9% | | | | | | | | |
| Chevron Corp. | | | 7,359 | | | $ | 825,533 | |
| Hess Corp. (s) | | | 14,845 | | | | 1,095,858 | |
| | | | | | | | |
| | | $ | 1,921,391 | |
| | | | | | | | |
| Food & Beverages – 2.8% | | | | | | | | |
| Coca-Cola Co. | | | 16,776 | | | $ | 708,283 | |
| Flowers Foods, Inc. | | | 6,946 | | | | 133,294 | |
| General Mills, Inc. | | | 5,452 | | | | 290,755 | |
| Mondelez International, Inc. | | | 10,275 | | | | 373,239 | |
| Pinnacle Foods, Inc. | | | 5,579 | | | | 196,939 | |
| WhiteWave Foods Co., “A” (a) | | | 6,151 | | | | 215,223 | |
| | | | | | | | |
| | | $ | 1,917,733 | |
| | | | | | | | |
| Food & Drug Stores – 1.1% | | | | | | | | |
| CVS Health Corp. | | | 7,281 | | | $ | 701,233 | |
| Fairway Group Holdings Corp. (a)(l) | | | 18,924 | | | | 59,611 | |
| | | | | | | | |
| | | $ | 760,844 | |
| | | | | | | | |
| Gaming & Lodging – 0.7% | | | | | | | | |
| Starwood Hotels & Resorts Worldwide, Inc. | | | 1,579 | | | $ | 128,010 | |
| Wynn Resorts Ltd. | | | 2,195 | | | | 326,528 | |
| | | | | | | | |
| | | $ | 454,538 | |
| | | | | | | | |
| | | | | | | | |
| Issuer | | Shares/Par | | | Value ($) | |
| | | | | | | | |
| COMMON STOCKS – continued | | | | | |
| General Merchandise – 1.5% | | | | | | | | |
| Five Below, Inc. (a) | | | 3,810 | | | $ | 155,562 | |
| Kohl’s Corp. | | | 5,794 | | | | 353,666 | |
| Target Corp. | | | 6,738 | | | | 511,482 | |
| | | | | | | | |
| | | $ | 1,020,710 | |
| | | | | | | | |
| Health Maintenance Organizations – 1.1% | | | | | |
| UnitedHealth Group, Inc. | | | 7,061 | | | $ | 713,796 | |
| | | | | | | | |
| Insurance – 3.1% | | | | | | | | |
| American International Group, Inc. | | | 19,784 | | | $ | 1,108,102 | |
| MetLife, Inc. | | | 15,952 | | | | 862,844 | |
| Safety Insurance Group, Inc. | | | 2,016 | | | | 129,044 | |
| | | | | | | | |
| | | $ | 2,099,990 | |
| | | | | | | | |
| Internet – 3.0% | | | | | | | | |
| Facebook, Inc., “A “ (a) | | | 7,080 | | | $ | 552,382 | |
| Google, Inc., “A” (a) | | | 1,297 | | | | 688,266 | |
| Google, Inc., “C” (a) | | | 1,018 | | | | 535,875 | |
| LinkedIn Corp., “A” (a) | | | 1,074 | | | | 246,709 | |
| | | | | | | | |
| | | $ | 2,023,232 | |
| | | | | | | | |
| Machinery & Tools – 2.1% | | | | | | | | |
| Colfax Corp. (a) | | | 5,821 | | | $ | 300,189 | |
| Eaton Corp. PLC | | | 1,665 | | | | 113,153 | |
| IPG Photonics Corp. (a) | | | 2,619 | | | | 196,215 | |
| Joy Global, Inc. | | | 5,437 | | | | 252,929 | |
| Roper Industries, Inc. | | | 3,659 | | | | 572,085 | |
| | | | | | | | |
| | | $ | 1,434,571 | |
| | | | | | | | |
| Major Banks – 5.4% | | | | | | | | |
| Bank of America Corp. | | | 41,354 | | | $ | 739,823 | |
| Goldman Sachs Group, Inc. | | | 1,989 | | | | 385,528 | |
| JPMorgan Chase & Co. (s) | | | 14,590 | | | | 913,042 | |
| Morgan Stanley | | | 8,986 | | | | 348,657 | |
| State Street Corp. | | | 4,692 | | | | 368,322 | |
| Wells Fargo & Co. | | | 15,843 | | | | 868,513 | |
| | | | | | | | |
| | | $ | 3,623,885 | |
| | | | | | | | |
| Medical & Health Technology & Services – 1.1% | | | | | |
| Cerner Corp. (a) | | | 1,473 | | | $ | 95,244 | |
| Express Scripts Holding Co. (a) | | | 3,419 | | | | 289,487 | |
| Healthcare Services Group, Inc. | | | 3,709 | | | | 114,719 | |
| McKesson Corp. | | | 1,071 | | | | 222,318 | |
| | | | | | | | |
| | | $ | 721,768 | |
| | | | | | | | |
| Medical Equipment – 4.6% | | | | | | | | |
| Abbott Laboratories | | | 16,551 | | | $ | 745,126 | |
| AtriCure, Inc. (a) | | | 4,563 | | | | 91,077 | |
| Cepheid, Inc. (a) | | | 1,601 | | | | 86,678 | |
| Cooper Cos., Inc. | | | 2,571 | | | | 416,733 | |
| Covidien PLC | | | 5,104 | | | | 522,037 | |
| DENTSPLY International, Inc. | | | 2,406 | | | | 128,168 | |
| DexCom, Inc. (a) | | | 1,298 | | | | 71,455 | |
| Heartware International, Inc. (a) | | | 476 | | | | 34,953 | |
| OraSure Technologies, Inc. (a) | | | 3,821 | | | | 38,745 | |
| STERIS Corp. | | | 778 | | | | 50,453 | |
| Stryker Corp. | | | 6,372 | | | | 601,071 | |
8
MFS Core Equity Series
Portfolio of Investments – continued
| | | | | | | | |
| Issuer | | Shares/Par | | | Value ($) | |
| | | | | | | | |
| COMMON STOCKS – continued | | | | | |
| Medical Equipment – continued | | | | | | | | |
| TearLab Corp. (a) | | | 14,680 | | | $ | 38,902 | |
| Thermo Fisher Scientific, Inc. | | | 2,006 | | | | 251,332 | |
| | | | | | | | |
| | | $ | 3,076,730 | |
| | | | | | | | |
| Metals & Mining – 0.3% | | | | | | | | |
| First Quantum Minerals Ltd. | | | 6,434 | | | $ | 91,432 | |
| Lundin Mining Corp. (a) | | | 27,049 | | | | 133,173 | |
| | | | | | | | |
| | | $ | 224,605 | |
| | | | | | | | |
| Natural Gas – Pipeline – 0.3% | | | | | | | | |
| Williams Cos., Inc. | | | 4,484 | | | $ | 201,511 | |
| | | | | | | | |
| Network & Telecom – 0.2% | | | | | | | | |
| Ixia (a) | | | 9,159 | | | $ | 103,039 | |
| | | | | | | | |
| Oil Services – 1.1% | | | | | | | | |
| Forum Energy Technologies, Inc. (a) | | | 1,720 | | | $ | 35,656 | |
| Halliburton Co. | | | 3,322 | | | | 130,654 | |
| Schlumberger Ltd. | | | 7,089 | | | | 605,471 | |
| | | | | | | | |
| | | $ | 771,781 | |
| | | | | | | | |
| Other Banks & Diversified Financials – 5.0% | | | | | |
| American Express Co. | | | 4,526 | | | $ | 421,099 | |
| BB&T Corp. | | | 10,129 | | | | 393,917 | |
| Discover Financial Services | | | 12,774 | | | | 836,569 | |
| EuroDekania Ltd. | | | 50,820 | | | | 27,673 | |
| PrivateBancorp, Inc. | | | 9,803 | | | | 327,420 | |
| Texas Capital Bancshares, Inc. (a) | | | 4,787 | | | | 260,078 | |
| Visa, Inc., “A” | | | 4,168 | | | | 1,092,850 | |
| | | | | | | | |
| | | $ | 3,359,606 | |
| | | | | | | | |
| Pharmaceuticals – 5.6% | | | | | | | | |
| AbbVie, Inc. | | | 8,186 | | | $ | 535,692 | |
| Actavis PLC (a) | | | 3,106 | | | | 799,515 | |
| Bristol-Myers Squibb Co. | | | 11,797 | | | | 696,377 | |
| Eli Lilly & Co. | | | 4,029 | | | | 277,961 | |
| Endo International PLC (a) | | | 5,372 | | | | 387,429 | |
| Merck & Co., Inc. | | | 7,997 | | | | 454,150 | |
| Valeant Pharmaceuticals International, Inc. (a) | | | 4,916 | | | | 703,529 | |
| | | | | | | | |
| | | $ | 3,854,653 | |
| | | | | | | | |
| Railroad & Shipping – 1.4% | | | | | | | | |
| Canadian Pacific Railway Ltd. | | | 2,101 | | | $ | 404,842 | |
| Union Pacific Corp. | | | 4,785 | | | | 570,037 | |
| | | | | | | | |
| | | $ | 974,879 | |
| | | | | | | | |
| Real Estate – 3.5% | | | | | | | | |
| Equity Lifestyle Properties, Inc., REIT | | | 8,443 | | | $ | 435,237 | |
| Gramercy Property Trust, Inc., REIT | | | 33,102 | | | | 228,404 | |
| Medical Properties Trust, Inc., REIT | | | 27,629 | | | | 380,728 | |
| Mid-America Apartment Communities, Inc., REIT | | | 6,804 | | | | 508,123 | |
| Plum Creek Timber Co. Inc., REIT | | | 9,748 | | | | 417,117 | |
| Tanger Factory Outlet Centers, Inc., REIT | | | 10,732 | | | | 396,655 | |
| | | | | | | | |
| | | $ | 2,366,264 | |
| | | | | | | | |
| | | | | | | | |
| Issuer | | Shares/Par | | | Value ($) | |
| | | | | | | | |
| COMMON STOCKS – continued | | | | | |
| Restaurants – 1.0% | | | | | | | | |
| Domino’s Pizza, Inc. | | | 2,049 | | | $ | 192,954 | |
| YUM! Brands, Inc. | | | 6,175 | | | | 449,849 | |
| | | | | | | | |
| | | $ | 642,803 | |
| | | | | | | | |
| Specialty Chemicals – 1.6% | | | | | | | | |
| Albemarle Corp. | | | 6,296 | | | $ | 378,578 | |
| Amira Nature Foods Ltd. (a)(l) | | | 3,680 | | | | 52,808 | |
| Axalta Coating Systems Ltd. (a) | | | 12,151 | | | | 316,169 | |
| W.R. Grace & Co. (a) | | | 3,375 | | | | 321,941 | |
| | | | | | | | |
| | | $ | 1,069,496 | |
| | | | | | | | |
| Specialty Stores – 3.6% | | | | | | | | |
| AutoZone, Inc. (a) | | | 502 | | | $ | 310,793 | |
| Bed Bath & Beyond, Inc. (a) | | | 4,971 | | | | 378,641 | |
| Burlington Stores, Inc. (a) | | | 7,766 | | | | 367,021 | |
| L Brands, Inc. | | | 4,657 | | | | 403,063 | |
| Ross Stores, Inc. | | | 4,029 | | | | 379,774 | |
| Sally Beauty Holdings, Inc. (a) | | | 7,329 | | | | 225,293 | |
| Urban Outfitters, Inc. (a) | | | 9,836 | | | | 345,539 | |
| | | | | | | | |
| | | $ | 2,410,124 | |
| | | | | | | | |
| Telecommunications – Wireless – 1.1% | | | | | |
| American Tower Corp., REIT | | | 7,670 | | | $ | 758,180 | |
| | | | | | | | |
| Telephone Services – 1.1% | | | | | | | | |
| Verizon Communications, Inc. | | | 16,561 | | | $ | 774,724 | |
| | | | | | | | |
| Tobacco – 1.2% | | | | | | | | |
| Altria Group, Inc. | | | 7,579 | | | $ | 373,417 | |
| Philip Morris International, Inc. | | | 4,946 | | | | 402,852 | |
| | | | | | | | |
| | | $ | 776,269 | |
| | | | | | | | |
| Trucking – 0.6% | | | | | | | | |
| Swift Transportation Co. (a) | | | 14,144 | | | $ | 404,943 | |
| | | | | | | | |
| Utilities – Electric Power – 2.5% | | | | | | | | |
| American Electric Power Co., Inc. | | | 4,543 | | | $ | 275,851 | |
| Calpine Corp. (a) | | | 7,847 | | | | 173,654 | |
| CMS Energy Corp. | | | 8,099 | | | | 281,440 | |
| Dominion Resources, Inc. | | | 2,420 | | | | 186,098 | |
| Edison International | | | 3,684 | | | | 241,228 | |
| Exelon Corp. | | | 4,466 | | | | 165,599 | |
| NextEra Energy, Inc. | | | 1,365 | | | | 145,086 | |
| NRG Energy, Inc. | | | 4,454 | | | | 120,035 | |
| Pattern Energy Group, Inc. | | | 4,494 | | | | 110,822 | |
| | | | | | | | |
| | | $ | 1,699,813 | |
| | | | | | | | |
Total Common Stocks
(Identified Cost, $54,449,971) | | | $ | 66,681,046 | |
| | | | | | | | |
|
| MONEY MARKET FUNDS – 1.4% | |
| MFS Institutional Money Market Portfolio, 0.09%, at Cost and Net Asset Value (v) | | | 961,007 | | | $ | 961,007 | |
| | | | | | | | |
9
MFS Core Equity Series
Portfolio of Investments – continued
| | | | | | | | |
| Issuer | | Shares/Par | | | Value ($) | |
| | | | | | | | |
| COLLATERAL FOR SECURITIES LOANED – 0.2% | |
| Navigator Securities Lending Prime Portfolio, 0.16%, at Cost and Net Asset Value (j) | | | 139,694 | | | $ | 139,694 | |
| | | | | | | | |
Total Collateral for Securities Loaned
(Identified Cost, $139,694) | | | $ | 139,694 | |
| | | | | | | | |
Total Investments
(Identified Cost, $55,550,672) | | | | | | $ | 67,781,747 | |
| | | | | | | | |
|
| SECURITIES SOLD SHORT – (0.2)% | |
| Gaming & Lodging – (0.2)% | | | | | | | | |
Marriott International, Inc., “A”
(Proceeds Received, $130,560) | | | (1,944 | ) | | $ | (151,690 | ) |
| | | | | | | | |
OTHER ASSETS, LESS
LIABILITIES – (0.2)% | | | | (177,441 | ) |
| | | | | | | | |
| NET ASSETS – 100.0% | | | $ | 67,452,616 | |
| | | | | | | | |
| (a) | | Non-income producing security. |
| (j) | | The rate quoted is the annualized seven-day yield of the fund at period end. |
| (l) | | A portion of this security is on loan. |
| (s) | | Security or a portion of the security was pledged to cover collateral requirements for securities sold short and/or certain derivative transactions. |
| (v) | | Underlying affiliated fund that is available only to investment companies managed by MFS. The rate quoted for the MFS Institutional Money Market Portfolio is the annualized seven-day yield of the fund at period end. |
At December 31, 2014, the fund had cash collateral of $9,626 and other liquid securities with an aggregate value of $707,209 to cover any commitments for securities sold short. Cash collateral is comprised of “Deposits with brokers” on the Statement of Assets and Liabilities.
The following abbreviations are used in this report and are defined:
| PLC | | Public Limited Company |
| REIT | | Real Estate Investment Trust |
See Notes to Financial Statements
10
MFS Core Equity Series
FINANCIAL STATEMENTS | STATEMENT OF ASSETS AND LIABILITIES
This statement represents your fund’s balance sheet, which details the assets and liabilities comprising the total value of the fund.
| | | | | | | | |
At 12/31/14 | | | | | | | | |
Assets | | | | | | | | |
Investments – | | | | | | | | |
Non-affiliated issuers, at value (identified cost, $54,589,665) | | | $66,820,740 | | | | | |
Underlying affiliated funds, at cost and value | | | 961,007 | | | | | |
Total investments, at value, including $138,848 of securities on loan (identified cost, $55,550,672) | | | $67,781,747 | | | | | |
| Deposits with brokers | | | 9,626 | | | | | |
| Receivables for | | | | | | | | |
Fund shares sold | | | 6,512 | | | | | |
Interest and dividends | | | 62,163 | | | | | |
Other assets | | | 739 | | | | | |
Total assets | | | | | | | $67,860,787 | |
Liabilities | | | | | | | | |
Payables for | | | | | | | | |
Securities sold short, at value (proceeds received, $130,560) | | | $151,690 | | | | | |
Fund shares reacquired | | | 57,200 | | | | | |
Collateral for securities loaned, at value | | | 139,694 | | | | | |
Payable to affiliates | | | | | | | | |
Investment adviser | | | 5,645 | | | | | |
Shareholder servicing costs | | | 163 | | | | | |
Distribution and/or service fees | | | 56 | | | | | |
Payable for independent Trustees’ compensation | | | 9 | | | | | |
Accrued expenses and other liabilities | | | 53,714 | | | | | |
Total liabilities | | | | | | | $408,171 | |
Net assets | | | | | | | $67,452,616 | |
Net assets consist of | | | | | | | | |
Paid-in capital | | | $53,826,742 | | | | | |
Unrealized appreciation (depreciation) on investments | | | 12,209,945 | | | | | |
Accumulated net realized gain (loss) on investments and foreign currency | | | 968,746 | | | | | |
Undistributed net investment income | | | 447,183 | | | | | |
Net assets | | | | | | | $67,452,616 | |
Shares of beneficial interest outstanding | | | | | | | 2,594,002 | |
| | | | | | | | | | | | |
| | | Net assets | | | Shares
outstanding | | | Net asset value
per share | |
Initial Class | | | $63,438,158 | | | | 2,439,124 | | | | $26.01 | |
Service Class | | | 4,014,458 | | | | 154,878 | | | | 25.92 | |
See Notes to Financial Statements
11
MFS Core Equity Series
FINANCIAL STATEMENTS | STATEMENT OF OPERATIONS
This statement describes how much your fund earned in investment income and accrued in expenses. It also describes any gains and/or losses generated by fund operations.
| | | | | | | | |
Year ended 12/31/14 | | | | | | | | |
Net investment income | | | | | |
Income | | | | | | | | |
Dividends | | | $1,042,951 | | | | | |
Interest | | | 7,659 | | | | | |
Dividends from underlying affiliated funds | | | 502 | | | | | |
Foreign taxes withheld | | | (1,742 | ) | | | | |
Total investment income | | | | | | | $1,049,370 | |
| Expenses | | | | | | | | |
Management fee | | | $491,993 | | | | | |
Distribution and/or service fees | | | 10,141 | | | | | |
Shareholder servicing costs | | | 22,587 | | | | | |
Administrative services fee | | | 19,594 | | | | | |
Independent Trustees’ compensation | | | 2,677 | | | | | |
Custodian fee | | | 16,738 | | | | | |
Shareholder communications | | | 25,100 | | | | | |
Audit and tax fees | | | 54,655 | | | | | |
Legal fees | | | 548 | | | | | |
Dividend and interest expense on securities sold short | | | 1,181 | | | | | |
Miscellaneous | | | 10,801 | | | | | |
Total expenses | | | | | | | $656,015 | |
Fees paid indirectly | | | (1 | ) | | | | |
Reduction of expenses by investment adviser | | | (53,800 | ) | | | | |
Net expenses | | | | | | | $602,214 | |
Net investment income | | | | | | | $447,156 | |
Realized and unrealized gain (loss) on investments and foreign currency | | | | | | | | |
Realized gain (loss) (identified cost basis) | | | | | | | | |
Investments | | | $8,461,990 | | | | | |
Foreign currency | | | 47 | | | | | |
Net realized gain (loss) on investments and foreign currency | | | | | | | $8,462,037 | |
Change in unrealized appreciation (depreciation) | | | | | | | | |
Investments | | | $(2,022,422 | ) | | | | |
Securities sold short | | | (21,130 | ) | | | | |
Net unrealized gain (loss) on investments | | | | | | | $(2,043,552 | ) |
Net realized and unrealized gain (loss) on investments | | | | | | | $6,418,485 | |
Change in net assets from operations | | | | | | | $6,865,641 | |
See Notes to Financial Statements
12
MFS Core Equity Series
FINANCIAL STATEMENTS | STATEMENTS OF CHANGES IN NET ASSETS
These statements describe the increases and/or decreases in net assets resulting from operations, any distributions, and any shareholder transactions.
| | | | | | | | |
For years ended 12/31 | | | 2014 | | | | 2013 | |
Change in net assets | | | | | | | | |
From operations | | | | | | | | |
Net investment income | | | $447,156 | | | | $495,965 | |
Net realized gain (loss) on investments and foreign currency | | | 8,462,037 | | | | 9,126,033 | |
Net unrealized gain (loss) on investments and foreign currency translation | | | (2,043,552 | ) | | | 8,871,412 | |
Change in net assets from operations | | | $6,865,641 | | | | $18,493,410 | |
Distributions declared to shareholders | | | | | | | | |
From net investment income | | | $(494,579 | ) | | | $(618,002 | ) |
Change in net assets from fund share transactions | | | $(6,329,774 | ) | | | $(7,406,477 | ) |
Total change in net assets | | | $41,288 | | | | $10,468,931 | |
Net assets | | | | | | | | |
At beginning of period | | | 67,411,328 | | | | 56,942,397 | |
At end of period (including undistributed net investment income of $447,183 and
$494,589, respectively) | | | $67,452,616 | | | | $67,411,328 | |
See Notes to Financial Statements
13
MFS Core Equity Series
FINANCIAL STATEMENTS | FINANCIAL HIGHLIGHTS
The financial highlights table is intended to help you understand the fund’s financial performance for the past 5 years. Certain information reflects financial results for a single fund share. The total returns in the table represent the rate by which an investor would have earned (or lost) on an investment in the fund share class (assuming reinvestment of all distributions) held for the entire period.
| | | | | | | | | | | | | | | | | | | | |
| Initial Class | | Years ended 12/31 | |
| | | 2014 | | | 2013 | | | 2012 | | | 2011 | | | 2010 | |
Net asset value, beginning of period | | | $23.56 | | | | $17.68 | | | | $15.33 | | | | $15.65 | | | | $13.49 | |
| Income (loss) from investment operations | | | | | | | | | | | | | | | | | | | | |
Net investment income (d) | | | $0.17 | | | | $0.17 | | | | $0.18 | | | | $0.11 | | | | $0.13 | |
Net realized and unrealized gain (loss) on investments
and foreign currency | | | 2.47 | | | | 5.92 | | | | 2.30 | | | | (0.28 | ) | | | 2.18 | |
Total from investment operations | | | $2.64 | | | | $6.09 | | | | $2.48 | | | | $(0.17 | ) | | | $2.31 | |
| Less distributions declared to shareholders | | | | | | | | | | | | | | | | | | | | |
From net investment income | | | $(0.19 | ) | | | $(0.21 | ) | | | $(0.13 | ) | | | $(0.15 | ) | | | $(0.15 | ) |
| Net asset value, end of period (x) | | | $26.01 | | | | $23.56 | | | | $17.68 | | | | $15.33 | | | | $15.65 | |
| Total return (%) (k)(r)(s)(x) | | | 11.24 | | | | 34.60 | | | | 16.23 | | | | (1.02 | ) | | | 17.21 | |
Ratios (%) (to average net assets)
and Supplemental data: | | | | | | | | | | | | | | | | | | | | |
Expenses before expense reductions (f) | | | 0.98 | | | | 1.00 | | | | 1.00 | | | | 1.00 | | | | 1.01 | |
Expenses after expense reductions (f) | | | 0.90 | | | | 0.90 | | | | 0.90 | | | | 0.91 | | | | 0.91 | |
Net investment income | | | 0.70 | | | | 0.80 | | | | 1.05 | | | | 0.72 | | | | 0.93 | |
Portfolio turnover | | | 50 | | | | 57 | | | | 64 | | | | 68 | | | | 69 | |
Net assets at end of period (000 omitted) | | | $63,438 | | | | $63,166 | | | | $53,504 | | | | $54,471 | | | | $62,602 | |
| Supplemental Ratios (%): | | | | | | | | | | | | | | | | | | | | |
Ratio of expenses to average net assets after expense reductions excluding
short sale dividend and interest expense (f) | | | 0.90 | | | | 0.90 | | | | 0.90 | | | | 0.90 | | | | 0.90 | |
See Notes to Financial Statements
14
MFS Core Equity Series
Financial Highlights – continued
| | | | | | | | | | | | | | | | | | | | |
| Service Class | | Years ended 12/31 | |
| | | 2014 | | | 2013 | | | 2012 | | | 2011 | | | 2010 | |
Net asset value, beginning of period | | | $23.48 | | | | $17.63 | | | | $15.28 | | | | $15.59 | | | | $13.45 | |
| Income (loss) from investment operations | | | | | | | | | | | | | | | | | | | | |
Net investment income (d) | | | $0.11 | | | | $0.11 | | | | $0.14 | | | | $0.07 | | | | $0.09 | |
Net realized and unrealized gain (loss) on investments
and foreign currency | | | 2.46 | | | | 5.90 | | | | 2.29 | | | | (0.27 | ) | | | 2.17 | |
Total from investment operations | | | $2.57 | | | | $6.01 | | | | $2.43 | | | | $(0.20 | ) | | | $2.26 | |
| Less distributions declared to shareholders | | | | | | | | | | | | | | | | | | | | |
From net investment income | | | $(0.13 | ) | | | $(0.16 | ) | | | $(0.08 | ) | | | $(0.11 | ) | | | $(0.12 | ) |
Net asset value, end of period (x) | | | $25.92 | | | | $23.48 | | | | $17.63 | | | | $15.28 | | | | $15.59 | |
Total return (%) (k)(r)(s)(x) | | | 10.97 | | | | 34.23 | | | | 15.95 | | | | (1.28 | ) | | | 16.86 | |
Ratios (%) (to average net assets)
and Supplemental data: | | | | | | | | | | | | | | | | | | | | |
Expenses before expense reductions (f) | | | 1.23 | | | | 1.25 | | | | 1.25 | | | | 1.25 | | | | 1.26 | |
Expenses after expense reductions (f) | | | 1.15 | | | | 1.15 | | | | 1.15 | | | | 1.16 | | | | 1.16 | |
Net investment income | | | 0.45 | | | | 0.55 | | | | 0.81 | | | | 0.47 | | | | 0.67 | |
Portfolio turnover | | | 50 | | | | 57 | | | | 64 | | | | 68 | | | | 69 | |
Net assets at end of period (000 omitted) | | | $4,014 | | | | $4,245 | | | | $3,438 | | | | $3,537 | | | | $4,623 | |
| Supplemental Ratios (%): | | | | | | | | | | | | | | | | | | | | |
Ratio of expenses to average net assets after expense reductions excluding
short sale dividend and interest expense (f) | | | 1.15 | | | | 1.15 | | | | 1.15 | | | | 1.15 | | | | 1.15 | |
| (d) | Per share data is based on average shares outstanding. |
| (f) | Ratios do not reflect reductions from fees paid indirectly, if applicable. |
| (k) | The total return does not reflect expenses that apply to separate accounts. Inclusion of these charges would reduce the total return figures for all periods shown. |
| (r) | Certain expenses have been reduced without which performance would have been lower. |
| (s) | From time to time the fund may receive proceeds from litigation settlements, without which performance would be lower. |
| (x) | The net asset values per share and total returns have been calculated on net assets which include adjustments made in accordance with U.S. generally accepted accounting principles required at period end for financial reporting purposes. |
See Notes to Financial Statements
15
MFS Core Equity Series
NOTES TO FINANCIAL STATEMENTS
| (1) | | Business and Organization |
MFS Core Equity Series (the fund) is a diversified series of MFS Variable Insurance Trust (the trust). The trust is organized as a Massachusetts business trust and is registered under the Investment Company Act of 1940, as amended, as an open-end management investment company. The shareholders of each series of the trust are separate accounts of insurance companies, which offer variable annuity and/or life insurance products, and qualified retirement and pension plans.
The fund is an investment company and accordingly follows the investment company accounting and reporting guidance of the Financial Accounting Standards Board (FASB) Accounting Standards Codification Topic 946 Financial Services – Investment Companies.
| (2) | | Significant Accounting Policies |
General – The preparation of financial statements in conformity with U.S. generally accepted accounting principles requires management to make estimates and assumptions that affect the reported amounts of assets and liabilities, and disclosure of contingent assets and liabilities at the date of the financial statements and the reported amounts of increases and decreases in net assets from operations during the reporting period. Actual results could differ from those estimates. In the preparation of these financial statements, management has evaluated subsequent events occurring after the date of the fund’s Statement of Assets and Liabilities through the date that the financial statements were issued.
In June 2014, FASB issued Accounting Standards Update 2014-11, Transfers and Servicing (Topic 860) – Repurchase-to-Maturity Transactions, Repurchase Financings, and Disclosures (“ASU 2014-11”). ASU 2014-11 changes the accounting for repurchase-to-maturity transactions (i.e., repurchase agreements that settle at the same time as the maturity of the transferred financial asset) and enhances the required disclosures for repurchase agreements and other similar transactions. Although still evaluating the potential impacts of ASU 2014-11 to the fund, management expects that the impact of the fund’s adoption will be limited to additional financial statement disclosures which would first be effective for interim reporting periods beginning after March 15, 2015.
Balance Sheet Offsetting – The fund’s accounting policy with respect to balance sheet offsetting is that, absent an event of default by the counterparty or a termination of the agreement, the International Swaps and Derivatives Association (ISDA) Master Agreement does not result in an offset of reported amounts of financial assets and financial liabilities in the Statement of Assets and Liabilities across transactions between the fund and the applicable counterparty. The fund’s right to setoff may be restricted or prohibited by the bankruptcy or insolvency laws of the particular jurisdiction to which a specific master netting agreement counterparty is subject. Balance sheet offsetting disclosures, to the extent applicable to the fund, have been included in the fund’s Significant Accounting Policies note under the captions for each of the fund’s in-scope financial instruments and transactions.
Investment Valuations – Equity securities, including restricted equity securities, are generally valued at the last sale or official closing price as provided by a third-party pricing service on the market or exchange on which they are primarily traded. Equity securities, for which there were no sales reported that day, are generally valued at the last quoted daily bid quotation as provided by a third-party pricing service on the market or exchange on which such securities are primarily traded. Equity securities held short, for which there were no sales reported for that day, are generally valued at the last quoted daily ask quotation as provided by a third-party pricing service on the market or exchange on which such securities are primarily traded. Short-term instruments with a maturity at issuance of 60 days or less may be valued at amortized cost, which approximates market value. Exchange-traded options are generally valued at the last sale or official closing price as provided by a third-party pricing service on the exchange on which such options are primarily traded. Exchange-traded options for which there were no sales reported that day are generally valued at the last daily bid quotation as provided by a third-party pricing service on the exchange on which such options are primarily traded. Options not traded on an exchange are generally valued at a broker/dealer bid quotation. Foreign currency options are generally valued at valuations provided by a third-party pricing service. Open-end investment companies are generally valued at net asset value per share. Securities and other assets generally valued on the basis of information from a third-party pricing service may also be valued at a broker/dealer bid quotation. Values obtained from third-party pricing services can utilize both transaction data and market information such as yield, quality, coupon rate, maturity, type of issue, trading characteristics, and other market data. The values of foreign securities and other assets and liabilities expressed in foreign currencies are converted to U.S. dollars using the mean of bid and asked prices for rates provided by a third-party pricing service.
The Board of Trustees has delegated primary responsibility for determining or causing to be determined the value of the fund’s investments (including any fair valuation) to the adviser pursuant to valuation policies and procedures approved by the Board. If the adviser determines that reliable market quotations are not readily available, investments are valued at fair value as determined in good faith by the adviser in accordance with such procedures under the oversight of the Board of Trustees. Under the fund’s valuation policies and procedures, market quotations are not considered to be readily available for most types of debt instruments and floating rate loans and many types of derivatives. These investments are generally valued at fair value based on information from third-party pricing services. In addition, investments may be valued at fair value if the adviser determines that an investment’s value has been materially affected by events occurring after the close of the exchange or market on which the investment is principally
16
MFS Core Equity Series
Notes to Financial Statements – continued
traded (such as foreign exchange or market) and prior to the determination of the fund’s net asset value, or after the halting of trading of a specific security where trading does not resume prior to the close of the exchange or market on which the security is principally traded. Events that occur on a frequent basis after foreign markets close (such as developments in foreign markets and significant movements in the U.S. markets) and prior to the determination of the fund’s net asset value may be deemed to have a material effect on the value of securities traded in foreign markets. Accordingly, the fund’s foreign equity securities may often be valued at fair value. The adviser generally relies on third-party pricing services or other information (such as the correlation with price movements of similar securities in the same or other markets; the type, cost and investment characteristics of the security; the business and financial condition of the issuer; and trading and other market data) to assist in determining whether to fair value and at what value to fair value an investment. The value of an investment for purposes of calculating the fund’s net asset value can differ depending on the source and method used to determine value. When fair valuation is used, the value of an investment used to determine the fund’s net asset value may differ from quoted or published prices for the same investment. There can be no assurance that the fund could obtain the fair value assigned to an investment if it were to sell the investment at the same time at which the fund determines its net asset value per share.
Various inputs are used in determining the value of the fund’s assets or liabilities. These inputs are categorized into three broad levels. In certain cases, the inputs used to measure fair value may fall into different levels of the fair value hierarchy. In such cases, an investment’s level within the fair value hierarchy is based on the lowest level of input that is significant to the fair value measurement. The fund’s assessment of the significance of a particular input to the fair value measurement in its entirety requires judgment, and considers factors specific to the investment. Level 1 includes unadjusted quoted prices in active markets for identical assets or liabilities. Level 2 includes other significant observable market-based inputs (including quoted prices for similar securities, interest rates, prepayment speed, and credit risk). Level 3 includes unobservable inputs, which may include the adviser’s own assumptions in determining the fair value of investments. The following is a summary of the levels used as of December 31, 2014 in valuing the fund’s assets or liabilities:
| | | | | | | | | | | | | | | | |
| Investments at Value | | Level 1 | | | Level 2 | | | Level 3 | | | Total | |
| Equity Securities: | | | | | | | | | | | | | | | | |
United States | | | $64,205,707 | | | | $— | | | | $— | | | | $64,205,707 | |
Canada | | | 1,532,373 | | | | — | | | | — | | | | 1,532,373 | |
Israel | | | 644,038 | | | | — | | | | — | | | | 644,038 | |
Hong Kong | | | 218,447 | | | | — | | | | — | | | | 218,447 | |
United Arab Emirates | | | 52,808 | | | | — | | | | — | | | | 52,808 | |
Cayman Islands | | | — | | | | — | | | | 27,673 | | | | 27,673 | |
| Mutual Funds | | | 1,100,701 | | | | — | | | | — | | | | 1,100,701 | |
| Total Investments | | | $67,754,074 | | | | $— | | | | $27,673 | | | | $67,781,747 | |
| Short Sales | | | $(151,690 | ) | | | $— | | | | $— | | | | $(151,690 | ) |
For further information regarding security characteristics, see the Portfolio of Investments.
The following is a reconciliation of level 3 assets for which significant unobservable inputs were used to determine fair value. The fund’s policy is to recognize transfers between the levels as of the end of the period. The table presents the activity of level 3 securities held at the beginning and the end of the period.
| | | | |
| | | Equity Securities | |
| Balance as of 12/31/13 | | | $47,191 | |
Change in unrealized appreciation (depreciation) | | | (19,087 | ) |
Proceeds from a tender offer | | | (431 | ) |
| Balance as of 12/31/14 | | | $27,673 | |
The net change in unrealized appreciation (depreciation) from investments still held as level 3 at December 31, 2014 is $(19,087). At December 31, 2014, the fund held one level 3 security.
Foreign Currency Translation – Purchases and sales of foreign investments, income, and expenses are converted into U.S. dollars based upon currency exchange rates prevailing on the respective dates of such transactions or on the reporting date for foreign denominated receivables and payables. Gains and losses attributable to foreign currency exchange rates on sales of securities are recorded for financial statement purposes as net realized gains and losses on investments. Gains and losses attributable to foreign exchange rate movements on receivables, payables, income and expenses are recorded for financial statement purposes as foreign currency transaction gains and losses. That portion of both realized and unrealized gains and losses on investments that results from fluctuations in foreign currency exchange rates is not separately disclosed.
Derivatives – The fund uses derivatives for different purposes, primarily to increase or decrease exposure to a particular market or segment of the market, or security, to increase or decrease interest rate or currency exposure, or as alternatives to direct investments. Derivatives are used for hedging or non-hedging purposes. While hedging can reduce or eliminate losses, it can also reduce or
17
MFS Core Equity Series
Notes to Financial Statements – continued
eliminate gains. When the fund uses derivatives as an investment to increase market exposure, or for hedging purposes, gains and losses from derivative instruments may be substantially greater than the derivative’s original cost.
The derivative instruments used by the fund were purchased options. At December 31, 2014, the fund did not have any outstanding derivative instruments.
The following table presents, by major type of derivative contract, the realized gain (loss) on derivatives held by the fund for the year ended December 31, 2014 as reported in the Statement of Operations:
| | | | |
| Risk | | Investments (Purchased Options) | |
| Equity | | | $11 | |
The following table presents, by major type of derivative contract, the change in unrealized appreciation (depreciation) on derivatives held by the fund for the year ended December 31, 2014 as reported in the Statement of Operations:
| | | | |
| Risk | | Investments (Purchased Options) | |
| Equity | | | $759 | |
Derivative counterparty credit risk is managed through formal evaluation of the creditworthiness of all potential counterparties. On certain, but not all, over-the-counter derivatives, the fund attempts to reduce its exposure to counterparty credit risk whenever possible by entering into an ISDA Master Agreement on a bilateral basis with each of the counterparties with whom it undertakes a significant volume of transactions. The ISDA Master Agreement gives each party to the agreement the right to terminate all transactions traded under such agreement if there is a certain deterioration in the credit quality of the other party. Upon an event of default or a termination of the ISDA Master Agreement, the non-defaulting party has the right to close out all transactions traded under such agreement and to net amounts owed under each transaction to one net amount payable by one party to the other. This right to close out and net payments across all transactions traded under the ISDA Master Agreement could result in a reduction of the fund’s credit risk to such counterparty equal to any amounts payable by the fund under the applicable transactions, if any. The fund’s right to setoff may be restricted or prohibited by the bankruptcy or insolvency laws of the particular jurisdiction to which a specific ISDA counterparty is subject.
Collateral and margin requirements differ by type of derivative. Margin requirements are set by the broker or clearing house for cleared derivatives (i.e., futures contracts, cleared swaps, and exchange-traded options) while collateral terms are contract specific for over-the-counter traded derivatives (i.e., forward foreign currency exchange contracts, uncleared swap agreements, and over-the-counter options). For derivatives traded under an ISDA Master Agreement, the collateral requirements are netted across all transactions traded under such agreement and one amount is posted from one party to the other to collateralize such obligations. Cash that has been segregated to cover the fund’s collateral or margin obligations under derivative contracts, if any, will be reported separately in the Statement of Assets and Liabilities as “Restricted cash” or “Deposits with brokers.” Securities pledged as collateral or margin for the same purpose, if any, are noted in the Portfolio of Investments.
Purchased Options – The fund purchased call options for a premium. Purchased call options entitle the holder to buy a specified number of shares or units of a particular security, currency or index at a specified price at a specified date or within a specified period of time. Purchasing call options may hedge against an anticipated increase in the dollar cost of securities or currency to be acquired or increase the fund’s exposure to an underlying instrument.
The premium paid is initially recorded as an investment in the Statement of Assets and Liabilities. That investment is subsequently marked-to-market daily with the difference between the premium paid and the market value of the purchased option being recorded as unrealized appreciation or depreciation. Premiums paid for purchased call options which have expired are treated as realized losses on investments in the Statement of Operations. Upon the exercise or closing of a purchased call option, the premium paid is added to the cost of the security or financial instrument purchased.
Whether or not the option is exercised, the fund’s maximum risk of loss from purchasing an option is the amount of premium paid. All option contracts involve credit risk if the counterparty to the option contract fails to perform. For over-the-counter options, this risk is mitigated in cases where there is an ISDA Master Agreement between the fund and the counterparty providing for netting as described above and for posting of collateral by the counterparty to the fund to cover the fund’s exposure to the counterparty under such ISDA Master Agreement.
Short Sales – The fund entered into short sales whereby it sells a security it does not own in anticipation of a decline in the value of that security. The fund will realize a gain if the security price decreases and a loss if the security price increases between the date of the short sale and the date on which the fund replaces the borrowed security. Losses from short sales can exceed the proceeds of the security sold; and they can also exceed the potential loss from an ordinary buy and sell transaction. The amount of any premium, dividends, or interest the fund may be required to pay in connection with a short sale will be recognized as a fund expense. During
18
MFS Core Equity Series
Notes to Financial Statements – continued
the year ended December 31, 2014, this expense amounted to $1,181. The fund segregates cash or marketable securities in an amount that, when combined with the amount of proceeds from the short sale deposited with the broker, at least equals the current market value of the security sold short.
Security Loans – Under its Securities Lending Agency Agreement with the fund, State Street Bank and Trust Company (“State Street”), as lending agent, loans the securities of the fund to certain qualified institutions (the “Borrowers”) approved by the fund. The loans are collateralized by cash and/or U.S. Treasury and federal agency obligations in an amount typically at least equal to the market value of the securities loaned. The market value of the loaned securities is determined at the close of business of the fund and any additional required collateral is delivered to the fund on the next business day. State Street provides the fund with indemnification against Borrower default. In the event of Borrower default, State Street will for the benefit of the fund either purchase securities identical to those loaned or, when such purchase is commercially impracticable, pay the fund the market value of the loaned securities. In return, State Street assumes the fund’s rights to the related collateral. If the collateral value is less than the cost to purchase identical securities, State Street is responsible for the shortfall, but only to the extent that such shortfall is not due to a decline in collateral value resulting from collateral reinvestment for which the fund bears the risk of loss. On loans collateralized by cash, the cash collateral is invested in a money market fund or short-term securities. At period end, the fund had investment securities on loan with a fair value of $138,848 and a related liability of $139,694 for cash collateral received on securities loaned, both of which are presented gross on the Statement of Assets and Liabilities. The collateral received on securities loaned exceeded the value of securities on loan at period end. The liability for cash collateral for securities loaned is carried at fair value, which is categorized as level 2 within the fair value hierarchy. A portion of the income generated upon investment of the collateral is remitted to the Borrowers, and the remainder is allocated between the fund and the lending agent. On loans collateralized by U.S. Treasury and/or federal agency obligations, a fee is received from the Borrower, and is allocated between the fund and the lending agent. Income from securities lending is included in “Interest” income in the Statement of Operations. The dividend and interest income earned on the securities loaned is accounted for in the same manner as other dividend and interest income.
Indemnifications – Under the fund’s organizational documents, its officers and Trustees may be indemnified against certain liabilities and expenses arising out of the performance of their duties to the fund. Additionally, in the normal course of business, the fund enters into agreements with service providers that may contain indemnification clauses. The fund’s maximum exposure under these agreements is unknown as this would involve future claims that may be made against the fund that have not yet occurred.
Investment Transactions and Income – Investment transactions are recorded on the trade date. Interest income is recorded on the accrual basis. Dividends received in cash are recorded on the ex-dividend date. Certain dividends from foreign securities will be recorded when the fund is informed of the dividend if such information is obtained subsequent to the ex-dividend date. Dividend and interest payments received in additional securities are recorded on the ex-dividend or ex-interest date in an amount equal to the value of the security on such date.
The fund may receive proceeds from litigation settlements. Any proceeds received from litigation involving portfolio holdings are reflected in the Statement of Operations in realized gain/loss if the security has been disposed of by the fund or in unrealized gain/loss if the security is still held by the fund. Any other proceeds from litigation not related to portfolio holdings are reflected as other income in the Statement of Operations.
Fees Paid Indirectly – The fund’s custody fee may be reduced according to an arrangement that measures the value of cash deposited with the custodian by the fund. This amount, for the year ended December 31, 2014, is shown as a reduction of total expenses in the Statement of Operations.
Tax Matters and Distributions – The fund intends to qualify as a regulated investment company, as defined under Subchapter M of the Internal Revenue Code, and to distribute all of its taxable income, including realized capital gains. As a result, no provision for federal income tax is required. The fund’s federal tax returns, when filed, will remain subject to examination by the Internal Revenue Service for a three year period. Management has analyzed the fund’s tax positions taken on federal and state tax returns for all open tax years and does not believe that there are any uncertain tax positions that require recognition of a tax liability. Foreign taxes, if any, have been accrued by the fund in the accompanying financial statements in accordance with the applicable foreign tax law. Foreign income taxes may be withheld by certain countries in which the fund invests. Additionally, capital gains realized by the fund on securities issued in or by certain foreign countries may be subject to capital gains tax imposed by those countries.
Distributions to shareholders are recorded on the ex-dividend date. Income and capital gain distributions are determined in accordance with income tax regulations, which may differ from U.S. generally accepted accounting principles. Certain capital accounts in the financial statements are periodically adjusted for permanent differences in order to reflect their tax character. These adjustments have no impact on net assets or net asset value per share. Temporary differences which arise from recognizing certain items of income, expense, gain or loss in different periods for financial statement and tax purposes will reverse at some time in the future. Distributions in excess of net investment income or net realized gains are temporary overdistributions for financial statement purposes resulting from differences in the recognition or classification of income or distributions for financial statement and tax purposes.
19
MFS Core Equity Series
Notes to Financial Statements – continued
During the year ended December 31, 2014, there were no significant adjustments due to differences between book and tax accounting.
The tax character of distributions declared to shareholders for the last two fiscal years is as follows:
| | | | | | | | |
| | | 12/31/14 | | | 12/31/13 | |
| Ordinary income (including any short-term capital gains) | | | $494,579 | | | | $618,002 | |
The federal tax cost and the tax basis components of distributable earnings were as follows:
| | | | |
| As of 12/31/14 | | | | |
| Cost of investments | | | $55,561,155 | |
| Gross appreciation | | | 14,417,448 | |
| Gross depreciation | | | (2,196,856 | ) |
| Net unrealized appreciation (depreciation) | | | $12,220,592 | |
| Undistributed ordinary income | | | 447,183 | |
| Undistributed long-term capital gain | | | 989,689 | |
| Other temporary differences | | | (31,590 | ) |
Multiple Classes of Shares of Beneficial Interest – The fund offers multiple classes of shares, which differ in their respective distribution and/or service fees. The fund’s income, realized and unrealized gain (loss), and common expenses are allocated to shareholders based on the daily net assets of each class. Dividends are declared separately for each class. Differences in per share dividend rates are generally due to differences in separate class expenses. The fund’s distributions declared to shareholders as reported in the Statements of Changes in Net Assets are presented by class as follows:
| | | | | | | | |
| | | From net investment
income | |
| | | Year ended
12/31/14 | | | Year ended
12/31/13 | |
| Initial Class | | | $473,006 | | | | $587,561 | |
| Service Class | | | 21,573 | | | | 30,441 | |
| Total | | | $494,579 | | | | $618,002 | |
| (3) | | Transactions with Affiliates |
Investment Adviser – The fund has an investment advisory agreement with MFS to provide overall investment management and related administrative services and facilities to the fund. The management fee is computed daily and paid monthly at the following annual rates:
| | | | |
| First $1 billion of average daily net assets | | | 0.75% | |
| Average daily net assets in excess of $1 billion | | | 0.65% | |
MFS has agreed in writing to reduce its management fee by a specified amount if certain MFS mutual fund assets exceed thresholds agreed to by MFS and the fund’s Board of Trustees. For the year ended December 31, 2014, this management fee reduction amounted to $3,024, which is included in the reduction of total expenses in the Statement of Operations. The management fee incurred for the year ended December 31, 2014 was equivalent to an annual effective rate of 0.75% of the fund’s average daily net assets.
The investment adviser has agreed in writing to pay a portion of the fund’s total annual operating expenses, excluding interest, taxes, extraordinary expenses, brokerage and transaction costs and investment-related expenses (such as short sale dividend and interest expenses incurred in connection with the fund’s investment activity), such that total annual operating expenses do not exceed 0.90% of average daily net assets for the Initial Class shares and 1.15% of average daily net assets for the Service Class shares. This written agreement will continue until modified by the fund’s Board of Trustees, but such agreement will continue at least until April 30, 2016. For the year ended December 31, 2014, this reduction amounted to $50,662 and is included in the reduction of total expenses in the Statement of Operations.
Distributor – MFS Fund Distributors, Inc. (MFD), a wholly-owned subsidiary of MFS, is the distributor of shares of the fund. The Trustees have adopted a distribution plan for the Service Class shares pursuant to Rule 12b-1 under the Investment Company Act of 1940.
The fund’s distribution plan provides that the fund will pay MFD distribution and/or service fees equal to 0.25% per annum of its average daily net assets attributable to Service Class shares as partial consideration for services performed and expenses incurred by MFD and financial intermediaries (including participating insurance companies that invest in the fund to fund variable annuity and variable life insurance contracts, sponsors of qualified retirement and pension plans that invest in the fund, and affiliates of these participating insurance companies and plan sponsors) in connection with the sale and distribution of the Service Class shares. MFD may subsequently pay all, or a portion, of the distribution and/or service fees to financial intermediaries.
20
MFS Core Equity Series
Notes to Financial Statements – continued
Shareholder Servicing Agent – MFS Service Center, Inc. (MFSC), a wholly-owned subsidiary of MFS, receives a fee from the fund for its services as shareholder servicing agent. For the year ended December 31, 2014, the fee was $21,932, which equated to 0.0334% annually of the fund’s average daily net assets. MFSC also receives payment from the fund for out-of-pocket expenses paid by MFSC on behalf of the fund. For the year ended December 31, 2014, these costs amounted to $655.
Administrator – MFS provides certain financial, legal, shareholder communications, compliance, and other administrative services to the fund. Under an administrative services agreement, the fund partially reimburses MFS the costs incurred to provide these services. The fund is charged an annual fixed amount of $17,500 plus a fee based on average daily net assets. The administrative services fee incurred for the year ended December 31, 2014 was equivalent to an annual effective rate of 0.0299% of the fund’s average daily net assets.
Trustees’ and Officers’ Compensation – The fund pays compensation to independent Trustees in the form of a retainer, attendance fees, and additional compensation to Board and Committee chairpersons. The fund does not pay compensation directly to Trustees or officers of the fund who are also officers of the investment adviser, all of whom receive remuneration for their services to the fund from MFS. Certain officers and Trustees of the fund are officers or directors of MFS, MFD, and MFSC.
Other – Effective November 1, 2014, this fund and certain other funds managed by MFS (the funds) have entered into a service agreement (the ISO Agreement) which provides for payment of fees solely by the funds to Tarantino LLC in return for the provision of services of an Independent Senior Officer (ISO) for the funds. Frank L. Tarantino serves as the ISO and is an officer of the funds and the sole member of Tarantino LLC. The funds can terminate the ISO Agreement with Tarantino LLC at any time under the terms of the ISO Agreement. Prior to November 1, 2014, the funds had entered into services agreements (the Compliance Officer Agreements) which provided for payment of fees by the funds to Tarantino LLC and Griffin Compliance LLC in return for the provision of services of an Independent Chief Compliance Officer (ICCO) and Assistant ICCO, respectively, for the funds. Prior to November 1, 2014, Frank L. Tarantino served as the ICCO. Effective October 31, 2014, Mr. Tarantino resigned as ICCO and the Compliance Officer Agreement between the funds and Tarantino LLC was terminated. Prior to June 1, 2014, Robyn L. Griffin served as the Assistant ICCO and was an officer of the funds. Ms. Griffin is the sole member of Griffin Compliance LLC. Effective May 31, 2014, Ms. Griffin resigned as Assistant ICCO and the Compliance Officer Agreement between the funds and Griffin Compliance LLC was terminated. For the year ended December 31, 2014, the aggregate fees paid by the fund under these agreements were $277 and are included in “Miscellaneous” expense in the Statement of Operations. MFS had agreed to reimburse the fund for a portion of the payments made by the fund for the services under the Compliance Officer Agreements in the amount of $114, which is included in the reduction of total expenses in the Statement of Operations. Additionally, MFS has agreed to bear all expenses associated with office space, other administrative support, and supplies provided to the ICCO, Assistant ICCO, and ISO.
The fund invests in the MFS Institutional Money Market Portfolio which is managed by MFS and seeks current income consistent with preservation of capital and liquidity. Income earned on this investment is included in “Dividends from underlying affiliated funds” in the Statement of Operations. This money market fund does not pay a management fee to MFS.
For the year ended December 31, 2014, purchases and sales of investments, other than purchased option transactions, and short-term obligations, aggregated $32,744,689 and $39,384,040, respectively.
| (5) | | Shares of Beneficial Interest |
The fund’s Declaration of Trust permits the Trustees to issue an unlimited number of full and fractional shares of beneficial interest. Transactions in fund shares were as follows:
| | | | | | | | | | | | | | | | |
| | | Year ended 12/31/14 | | | Year ended 12/31/13 | |
| | | Shares | | | Amount | | | Shares | | | Amount | |
| Shares sold | | | | | | | | | | | | | | | | |
Initial Class | | | 188,516 | | | | $4,667,830 | | | | 378,017 | | | | $7,890,348 | |
Service Class | | | 3,563 | | | | 85,900 | | | | 28,308 | | | | 593,152 | |
| | | 192,079 | | | | $4,753,730 | | | | 406,325 | | | | $8,483,500 | |
| Shares issued to shareholders in reinvestment of distributions | | | | | | | | | | | | | | | | |
Initial Class | | | 18,689 | | | | $473,006 | | | | 28,006 | | | | $587,561 | |
Service Class | | | 854 | | | | 21,573 | | | | 1,454 | | | | 30,441 | |
| | | 19,543 | | | | $494,579 | | | | 29,460 | | | | $618,002 | |
| Shares reacquired | | | | | | | | | | | | | | | | |
Initial Class | | | (449,384 | ) | | | $(10,848,496 | ) | | | (751,219 | ) | | | $(15,580,081 | ) |
Service Class | | | (30,318 | ) | | | (729,587 | ) | | | (44,031 | ) | | | (927,898 | ) |
| | | (479,702 | ) | | | $(11,578,083 | ) | | | (795,250 | ) | | | $(16,507,979 | ) |
21
MFS Core Equity Series
Notes to Financial Statements – continued
| | | | | | | | | | | | | | | | |
| | | Year ended 12/31/14 | | | Year ended 12/31/13 | |
| | | Shares | | | Amount | | | Shares | | | Amount | |
| Net change | | | | | | | | | | | | | | | | |
Initial Class | | | (242,179 | ) | | | $(5,707,660 | ) | | | (345,196 | ) | | | $(7,102,172 | ) |
Service Class | | | (25,901 | ) | | | (622,114 | ) | | | (14,269 | ) | | | (304,305 | ) |
| | | (268,080 | ) | | | $(6,329,774 | ) | | | (359,465 | ) | | | $(7,406,477 | ) |
The fund and certain other funds managed by MFS participate in a $1.1 billion unsecured committed line of credit, subject to a $1 billion sublimit, provided by a syndication of banks under a credit agreement. Borrowings may be made for temporary financing needs. Interest is charged to each fund, based on its borrowings, generally at a rate equal to the higher of the Federal Reserve funds rate or one month LIBOR plus an agreed upon spread. A commitment fee, based on the average daily, unused portion of the committed line of credit, is allocated among the participating funds at the end of each calendar quarter. In addition, the fund and other funds managed by MFS have established unsecured uncommitted borrowing arrangements with certain banks for temporary financing needs. Interest is charged to each fund, based on its borrowings, at a rate equal to the Federal Reserve funds rate plus an agreed upon spread. For the year ended December 31, 2014, the fund’s commitment fee and interest expense were $237 and $0, respectively, and are included in “Miscellaneous” expense in the Statement of Operations.
| (7) | | Transactions in Underlying Affiliated Funds – Affiliated Issuers |
An affiliated issuer may be considered one in which the fund owns 5% or more of the outstanding voting securities, or a company which is under common control. For the purposes of this report, the fund assumes the following to be an affiliated issuer:
| | | | | | | | | | | | | | | | |
| Underlying Affiliated Fund | | Beginning
Shares/Par
Amount | | | Acquisitions
Shares/Par
Amount | | | Dispositions
Shares/Par
Amount | | | Ending
Shares/Par
Amount | |
| MFS Institutional Money Market Portfolio | | | 704,325 | | | | 13,500,308 | | | | (13,243,626 | ) | | | 961,007 | |
| | | | |
| Underlying Affiliated Fund | | Realized
Gain (Loss) | | | Capital Gain
Distributions | | | Dividend
Income | | | Ending
Value | |
| MFS Institutional Money Market Portfolio | | | $— | | | | $— | | | | $502 | | | | $961,007 | |
On December 2, 2014, the Board of Trustees of the fund approved a proposed Agreement and Plan of Reorganization, whereby MFS Core Equity Series, a series of MFS Variable Insurance Trust would be reorganized into MFS Core Equity Portfolio, a portfolio of MFS Variable Insurance Trust II. The Agreement and Plan of Reorganization is subject to the approval of the shareholders of the MFS Core Equity Series. The proposed Agreement and Plan of Reorganization provides for the transfer of the assets of the MFS Core Equity Series to the MFS Core Equity Portfolio and the assumption by the MFS Core Equity Portfolio of the liabilities of the MFS Core Equity Series in exchange solely for shares of beneficial interest in the MFS Core Equity Portfolio. Immediately following the transfer, the MFS Core Equity Portfolio shares received by the MFS Core Equity Series will be distributed to shareholders, pro rata, and the MFS Core Equity Series will be liquidated and terminated. If approved by shareholders, it is expected that the reorganization will occur on or around March 27, 2015.
22
MFS Core Equity Series
REPORT OF INDEPENDENT REGISTERED PUBLIC ACCOUNTING FIRM
To the Board of Trustees of MFS Variable Insurance Trust and the Shareholders of
MFS Core Equity Series:
We have audited the accompanying statement of assets and liabilities, including the portfolio of investments, of MFS Core Equity Series (one of the series of MFS Variable Insurance Trust) (the “Fund”) as of December 31, 2014, and the related statement of operations for the year then ended, the statements of changes in net assets for each of the two years in the period then ended, and the financial highlights for each of the five years in the period then ended. These financial statements and financial highlights are the responsibility of the Fund’s management. Our responsibility is to express an opinion on these financial statements and financial highlights based on our audits.
We conducted our audits in accordance with the standards of the Public Company Accounting Oversight Board (United States). Those standards require that we plan and perform the audit to obtain reasonable assurance about whether the financial statements and financial highlights are free of material misstatement. The Fund is not required to have, nor were we engaged to perform, an audit of its internal control over financial reporting. Our audits included consideration of internal control over financial reporting as a basis for designing audit procedures that are appropriate in the circumstances, but not for the purpose of expressing an opinion on the effectiveness of the Fund’s internal control over financial reporting. Accordingly, we express no such opinion. An audit also includes examining, on a test basis, evidence supporting the amounts and disclosures in the financial statements, assessing the accounting principles used and significant estimates made by management, as well as evaluating the overall financial statement presentation. Our procedures included confirmation of securities owned as of December 31, 2014, by correspondence with the custodian. We believe that our audits provide a reasonable basis for our opinion.
In our opinion, the financial statements and financial highlights referred to above present fairly, in all material respects, the financial position of MFS Core Equity Series as of December 31, 2014, the results of its operations for the year then ended, the changes in its net assets for each of the two years in the period then ended, and the financial highlights for each of the five years in the period then ended, in conformity with accounting principles generally accepted in the United States of America.
DELOITTE & TOUCHE LLP
Boston, Massachusetts
February 13, 2015
23
MFS Core Equity Series
TRUSTEES AND OFFICERS – IDENTIFICATION AND BACKGROUND
The Trustees and Officers of the Trust, as of February 1, 2015, are listed below, together with their principal occupations during the past five years. (Their titles may have varied during that period.) The address of each Trustee and Officer is 111 Huntington Avenue, Boston, Massachusetts 02199-7618.
| | | | | | | | |
Name, Age | | Position(s)
Held with Fund | | Trustee/Officer
Since (h) | | Principal Occupations
During the Past Five Years | | Other Directorships (j) |
| INTERESTED TRUSTEES |
Robert J. Manning (k) (age 51) | | Trustee | | February 2004 | | Massachusetts Financial Services Company, Chairman, Co-Chief Executive Officer and Director; President (until 2009); Chief Investment Officer (until 2010) | | N/A |
| | | | |
Robin A. Stelmach (k) (age 53) | | Trustee and President | | January 2014 | | Massachusetts Financial Services Company, Executive Vice President and Chief Operating Officer | | N/A |
| | | |
| INDEPENDENT TRUSTEES | | | | | | |
David H. Gunning (age 72) | | Trustee and Chair of Trustees | | January 2004 | | Private investor | | Lincoln Electric Holdings, Inc. (welding equipment manufacturer), Director; Development Alternatives, Inc. (consulting), Director/Non-Executive Chairman |
| | | | |
Steven E. Buller (age 63) | | Trustee | | February 2014 | | Chairman, Financial Accounting Standards Advisory Council; Standing Advisory Group, Public Company Accounting Oversight Board, Member (until 2014); BlackRock, Inc. (investment management), Managing Director (until 2014), BlackRock Finco UK (investment management), Director (until 2014) | | N/A |
| | | | |
Robert E. Butler (age 73) | | Trustee | | January 2006 | | Consultant – investment company industry regulatory and compliance matters | | N/A |
| | | | |
Maureen R. Goldfarb (age 59) | | Trustee | | January 2009 | | Private investor | | N/A |
| | | | |
William R. Gutow (age 73) | | Trustee | | December 1993 | | Private investor and real estate consultant; Capitol Entertainment Management Company (video franchise), Vice Chairman | | Texas Donuts (donut franchise), Vice Chairman (until 2010) |
| | | | |
Michael Hegarty (age 70) | | Trustee | | December 2004 | | Private investor | | Brookfield Office Properties, Inc. (real estate), Director; Rouse Properties Inc. (real estate), Director; Capmark Financial Group Inc. (real estate), Director |
| | | | |
John P. Kavanaugh (age 60) | | Trustee | | January 2009 | | Private investor | | N/A |
| | | | |
Maryanne L. Roepke (age 58) | | Trustee | | May 2014 | | American Century Investments (investment management), Senior Vice President and Chief Compliance Officer (until 2014) | | N/A |
| | | | |
Laurie J. Thomsen (age 57) | | Trustee | | March 2005 | | Private investor; New Profit, Inc. (venture philanthropy), Executive Partner (until 2010) | | The Travelers Companies (insurance), Director |
| | | | |
Robert W. Uek (age 73) | | Trustee | | January 2006 | | Consultant to investment company industry | | N/A |
| | | | |
| OFFICERS | | | | | | | | |
Christopher R. Bohane (k) (age 41) | | Assistant Secretary and Assistant Clerk | | July 2005 | | Massachusetts Financial Services Company, Vice President and Assistant General Counsel | | N/A |
| | | | |
Kino Clark (k) (age 46) | | Assistant Treasurer | | January 2012 | | Massachusetts Financial Services Company, Vice President | | N/A |
| | | | |
Thomas H. Connors (k) (age 55) | | Assistant Secretary and Assistant Clerk | | September 2012 | | Massachusetts Financial Services Company, Vice President and Senior Counsel; Deutsche Investment Management Americas Inc. (financial service provider), Director and Senior Counsel (until 2012) | | N/A |
24
MFS Core Equity Series
Trustees and Officers – continued
| | | | | | | | |
Name, Age | | Position(s)
Held with Fund | | Trustee/Officer
Since (h) | | Principal Occupations
During the Past Five Years | | Other Directorships (j) |
Ethan D. Corey (k) (age 51) | | Assistant
Secretary and Assistant Clerk | | July 2005 | | Massachusetts Financial Services Company, Senior Vice President and Associate General Counsel | | N/A |
| | | | |
David L. DiLorenzo (k) (age 46) | | Treasurer | | July 2005 | | Massachusetts Financial Services Company, Senior Vice President | | N/A |
| | | | |
Timothy M. Fagan (k) (age 46) | | Chief Compliance Officer | | November 2014 | | Massachusetts Financial Services Company, Chief Compliance Officer; Vice President and Senior Counsel (until 2012) | | N/A |
| | | | |
Brian E. Langenfeld (k) (age 41) | | Assistant
Secretary and Assistant Clerk | | June 2006 | | Massachusetts Financial Services Company, Vice President and Senior Counsel | | N/A |
| | | | |
Susan S. Newton (k) (age 64) | | Assistant
Secretary and Assistant Clerk | | May 2005 | | Massachusetts Financial Services Company, Senior Vice President and Associate General Counsel | | N/A |
| | | | |
Susan A. Pereira (k) (age 44) | | Assistant
Secretary and Assistant Clerk | | July 2005 | | Massachusetts Financial Services Company, Vice President and Senior Counsel | | N/A |
| | | | |
Kasey L. Phillips (k) (age 44) | | Assistant Treasurer | | September 2012 | | Massachusetts Financial Services Company, Vice President; Wells Fargo Funds Management, LLC, Senior Vice President, Fund Treasurer (until 2012) | | N/A |
| | | | |
Mark N. Polebaum (k) (age 62) | | Secretary and
Clerk | | January 2006 | | Massachusetts Financial Services Company, Executive Vice President, General Counsel and Secretary | | N/A |
| | | | |
Matthew A. Stowe (k) (age 40) | | Assistant Secretary and Assistant Clerk | | October 2014 | | Massachusetts Financial Services Company, Vice President and Senior Counsel | | N/A |
| | | | |
Frank L. Tarantino (age 70) | | Independent
Senior Officer | | June 2004 | | Tarantino LLC (provider of compliance services), Principal | | N/A |
| | | | |
Richard S. Weitzel (k) (age 44) | | Assistant Secretary and Assistant Clerk | | October 2007 | | Massachusetts Financial Services Company, Senior Vice President and Associate General Counsel | | N/A |
| | | | |
James O. Yost (k) (age 54) | | Deputy Treasurer | | September 1990 | | Massachusetts Financial Services Company, Senior Vice President | | N/A |
| (h) | Date first appointed to serve as Trustee/officer of an MFS Fund. Each Trustee has served continuously since appointment unless indicated otherwise. For the period from December 15, 2004 until February 22, 2005, Mr. Manning served as Advisory Trustee. Prior to January 2012, Messrs. DiLorenzo and Yost served as Assistant Treasurers of the Funds. Ms. Stelmach was appointed as President of the Funds as of October 1, 2014. |
| (j) | Directorships or trusteeships of companies required to report to the Securities and Exchange Commission (i.e., “public companies”). |
| (k) | “Interested person” of the Trust within the meaning of the Investment Company Act of 1940 (referred to as the 1940 Act), which is the principal federal law governing investment companies like the fund, as a result of a position with MFS. The address of MFS is 111 Huntington Avenue, Boston, Massachusetts 02199-7618. |
Each Trustee (except Ms. Stelmach, Mr. Buller and Ms. Roepke) has been elected by shareholders and each Trustee and officer holds office until his or her successor is chosen and qualified or until his or her earlier death, resignation, retirement or removal. The Trust does not hold annual meetings for the purpose of electing Trustees, and Trustees are not elected for fixed terms. Messrs. Butler, Kavanaugh, Uek and Mses. Thomsen and Roepke are members of the Trust’s Audit Committee.
Each of the Fund’s Trustees and officers holds comparable positions with certain other funds of which MFS or a subsidiary is the investment adviser or distributor, and, in the case of the officers, with certain affiliates of MFS. As of February 1, 2015, the Trustees served as board members of 135 funds within the MFS Family of Funds.
25
MFS Core Equity Series
Trustees and Officers – continued
The Statement of Additional Information for the Fund includes further information about the Trustees and is available without charge upon request by calling 1-800-225-2606.
| | |
Investment Adviser Massachusetts Financial Services Company 111 Huntington Avenue Boston, MA 02199-7618 | | Custodian State Street Bank and Trust Company 1 Lincoln Street Boston, MA 02111-2900 |
Distributor MFS Fund Distributors, Inc. 111 Huntington Avenue Boston, MA 02199-7618 | | Independent Registered Public Accounting Firm Deloitte & Touche LLP 200 Berkeley Street Boston, MA 02116 |
Portfolio Manager Joseph MacDougall | | |
��
26
MFS Core Equity Series
BOARD REVIEW OF INVESTMENT ADVISORY AGREEMENT
The Investment Company Act of 1940 requires that both the full Board of Trustees and a majority of the non-interested (“independent”) Trustees, voting separately, annually approve the continuation of the Fund’s investment advisory agreement with MFS. The Trustees consider matters bearing on the Fund and its advisory arrangements at their meetings throughout the year, including a review of performance data at each regular meeting. In addition, the independent Trustees met several times over the course of three months beginning in May and ending in July, 2014 (“contract review meetings”) for the specific purpose of considering whether to approve the continuation of the investment advisory agreement for the Fund and the other investment companies that the Board oversees (the “MFS Funds”). The independent Trustees were assisted in their evaluation of the Fund’s investment advisory agreement by independent legal counsel, from whom they received separate legal advice and with whom they met separately from MFS during various contract review meetings. The independent Trustees were also assisted in this process by the MFS Funds’ Independent Chief Compliance Officer, a full-time senior officer appointed by and reporting to the independent Trustees.
In connection with their deliberations regarding the continuation of the investment advisory agreement, the Trustees, including the independent Trustees, considered such information and factors as they believed, in light of the legal advice furnished to them and their own business judgment, to be relevant. The investment advisory agreement for the Fund was considered separately, although the Trustees also took into account the common interests of all MFS Funds in their review. As described below, the Trustees considered the nature, quality, and extent of the various investment advisory, administrative, and shareholder services performed by MFS under the existing investment advisory agreement and other arrangements with the Fund.
In connection with their contract review meetings, the Trustees received and relied upon materials that included, among other items: (i) information provided by Lipper Inc., an independent third party, on the investment performance of the Fund for various time periods ended December 31, 2013 and the investment performance of a group of funds with substantially similar investment classifications/objectives (the “Lipper performance universe”), (ii) information provided by Lipper Inc. on the Fund’s advisory fees and other expenses and the advisory fees and other expenses of comparable funds identified by Lipper Inc. (the “Lipper expense group”), (iii) information provided by MFS on the advisory fees of comparable portfolios of other clients of MFS, including institutional separate accounts and other clients, (iv) information as to whether and to what extent applicable expense waivers, reimbursements or fee “breakpoints” are observed for the Fund, (v) information regarding MFS’ financial results and financial condition, including MFS’ and certain of its affiliates’ estimated profitability from services performed for the Fund and the MFS Funds as a whole, and compared to MFS’ institutional business, (vi) MFS’ views regarding the outlook for the mutual fund industry and the strategic business plans of MFS, (vii) descriptions of various functions performed by MFS for the Funds, such as compliance monitoring and portfolio trading practices, and (viii) information regarding the overall organization of MFS, including information about MFS’ senior management and other personnel providing investment advisory, administrative and other services to the Fund and the other MFS Funds. The comparative performance, fee and expense information prepared and provided by Lipper Inc. was not independently verified and the independent Trustees did not independently verify any information provided to them by MFS.
The Trustees’ conclusion as to the continuation of the investment advisory agreement was based on a comprehensive consideration of all information provided to the Trustees and not the result of any single factor. Some of the factors that figured particularly in the Trustees’ deliberations are described below, although individual Trustees may have evaluated the information presented differently from one another, giving different weights to various factors. It is also important to recognize that the fee arrangements for the Fund and other MFS Funds are the result of years of review and discussion between the independent Trustees and MFS, that certain aspects of such arrangements may receive greater scrutiny in some years than in others, and that the Trustees’ conclusions may be based, in part, on their consideration of these same arrangements during the course of the year and in prior years.
Based on information provided by Lipper Inc. and MFS, the Trustees reviewed the Fund’s total return investment performance as well as the performance of peer groups of funds over various time periods. The Trustees placed particular emphasis on the total return performance of the Fund’s Initial Class shares in comparison to the performance of funds in its Lipper performance universe over the three-year period ended December 31, 2013, which the Trustees believed was a long enough period to reflect differing market conditions. The total return performance of the Fund’s Initial Class shares was in the 2nd quintile relative to the other funds in the universe for this three-year period (the 1st quintile being the best performers and the 5th quintile being the worst performers). The total return performance of the Fund’s Initial Class shares was in the 2nd quintile for each of the one- and five-year periods ended December 31, 2013 relative to the Lipper performance universe. Because of the passage of time, these performance results may differ from the performance results for more recent periods, including those shown elsewhere in this report.
In the course of their deliberations, the Trustees took into account information provided by MFS in connection with the contract review meetings, as well as during investment review meetings conducted with portfolio management personnel during the course of the year regarding the Fund’s performance. After reviewing these and related factors, the Trustees concluded, within the context of their overall conclusions regarding the investment advisory agreement, that they were satisfied with MFS’ responses and efforts relating to investment performance.
27
MFS Core Equity Series
Board Review of Investment Advisory Agreement – continued
In assessing the reasonableness of the Fund’s advisory fee, the Trustees considered, among other information, the Fund’s advisory fee and the total expense ratio of the Fund’s Initial Class shares as a percentage of average daily net assets and the advisory fee and total expense ratios of peer groups of funds based on information provided by Lipper Inc. The Trustees considered that MFS currently observes an expense limitation for the Fund, which may not be changed without the Trustees’ approval. The Trustees also considered that, according to the Lipper data (which takes into account any fee reductions or expense limitations that were in effect during the Fund’s last fiscal year), the Fund’s effective advisory fee rate and total expense ratio were each approximately at the Lipper expense group median.
The Trustees also considered the advisory fees charged by MFS to any comparable institutional accounts. In comparing these fees, the Trustees considered information provided by MFS as to the generally broader scope of services provided by MFS to the Fund in comparison to institutional accounts, the higher demands placed on MFS’ investment personnel and trading infrastructure as a result of the daily cash in-flows and out-flows of the Fund, and the impact on MFS and expenses associated with the more extensive regulatory regime to which the Fund is subject in comparison to institutional accounts.
The Trustees also considered whether the Fund may benefit from any economies of scale in the management of the Fund in the event of growth in assets of the Fund and/or growth in assets of the MFS Funds as a whole. They noted that the Fund’s advisory fee rate schedule is subject to a contractual breakpoint that reduces the Fund’s advisory fee rate on average daily net assets over $1 billion. The Trustees also noted that MFS has agreed in writing to waive a portion of the management fees of certain MFS Funds, including the Fund, if the total combined assets of certain funds within the MFS Funds’ complex increase above agreed upon thresholds (the “group fee waiver”), enabling the Fund’s shareholders to share in the benefits from any economies of scale at the complex level. The group fee waiver is reviewed and renewed annually between the Board and MFS. The Trustees concluded that the breakpoint and the group fee waiver were sufficient to allow the Fund to benefit from economies of scale as its assets and overall complex assets grow.
The Trustees also considered information prepared by MFS relating to MFS’ costs and profits with respect to the Fund, the MFS Funds considered as a group, and other investment companies and accounts advised by MFS, as well as MFS’ methodologies used to determine and allocate its costs to the MFS Funds, the Fund and other accounts and products for purposes of estimating profitability.
After reviewing these and other factors described herein, the Trustees concluded, within the context of their overall conclusions regarding the investment advisory agreement, that the advisory fees charged to the Fund represent reasonable compensation in light of the services being provided by MFS to the Fund.
In addition, the Trustees considered MFS’ resources and related efforts to continue to retain, attract and motivate capable personnel to serve the Fund. The Trustees also considered current and developing conditions in the financial services industry, including the presence of large and well-capitalized companies which are spending, and appear to be prepared to continue to spend, substantial sums to engage personnel and to provide services to competing investment companies. In this regard, the Trustees also considered the financial resources of MFS and its ultimate parent, Sun Life Financial Inc. The Trustees also considered the advantages and possible disadvantages to the Fund of having an adviser that also serves other investment companies as well as other accounts.
The Trustees also considered the nature, quality, cost, and extent of administrative, transfer agency, and distribution services provided to the Fund by MFS and its affiliates under agreements and plans other than the investment advisory agreement, including any 12b-1 fees the Fund pays to MFS Fund Distributors, Inc., an affiliate of MFS. The Trustees also considered the nature, extent and quality of certain other services MFS performs or arranges for on the Fund’s behalf, which may include securities lending programs, directed expense payment programs, class action recovery programs, and MFS’ interaction with third-party service providers, principally custodians and sub-custodians. The Trustees concluded that the various non-advisory services provided by MFS and its affiliates on behalf of the Fund were satisfactory.
The Trustees also considered benefits to MFS from the use of the Fund’s portfolio brokerage commissions, if applicable, to pay for investment research and various other factors. Additionally, the Trustees considered so-called “fall-out benefits” to MFS such as reputational value derived from serving as investment manager to the Fund.
Based on their evaluation of factors that they deemed to be material, including those factors described above, the Board of Trustees, including the independent Trustees, concluded that the Fund’s investment advisory agreement with MFS should be continued for an additional one-year period, commencing August 1, 2014.
28
MFS Core Equity Series
PROXY VOTING POLICIES AND INFORMATION
MFS votes proxies on behalf of the fund pursuant to proxy voting policies and procedures that are available without charge, upon request, by calling 1-800-225-2606, by visiting the Proxy Voting section of mfs.com or by visiting the SEC’s Web site at http://www.sec.gov.
Information regarding how the fund voted proxies relating to portfolio securities during the most recent twelve-month period ended June 30 is available without charge by visiting the Proxy Voting section of mfs.com or by visiting the SEC’s Web site at http://www.sec.gov.
QUARTERLY PORTFOLIO DISCLOSURE
The fund will file a complete schedule of portfolio holdings with the Securities and Exchange Commission (the Commission) for the first and third quarters of each fiscal year on Form N-Q. The fund’s Form N-Q is available on the EDGAR database on the Commission’s Internet Web site at http://www.sec.gov, and may be reviewed and copied at the:
Public Reference Room
Securities and Exchange Commission
100 F Street, NE, Room 1580
Washington, D.C. 20549
Information on the operation of the Public Reference Room may be obtained by calling the Commission at 1-800-SEC-0330. Copies of the fund’s Form N-Q also may be obtained, upon payment of a duplicating fee, by electronic request at the following e-mail address: publicinfo@sec.gov or by writing the Public Reference Section at the above address.
FURTHER INFORMATION
From time to time, MFS may post important information about the fund or the MFS funds on the MFS web site (mfs.com). This information is available by visiting the “Market Commentary” and “Announcements” sub sections in the “Market Outlooks” section of mfs.com or by clicking on the fund’s name under “Variable Insurance Portfolios — VIT” in the “Products” section of mfs.com.
FEDERAL TAX INFORMATION (unaudited)
The following information is provided pursuant to provisions of the Internal Revenue Code.
For corporate shareholders, 100% of the ordinary income dividends paid during the fiscal year qualify for the corporate dividends received deduction.
29
rev. 3/11
| | | | |
| FACTS | | WHAT DOES MFS DO WITH YOUR
PERSONAL INFORMATION? | |  |
| | |
| Why? | | Financial companies choose how they share your personal information. Federal law gives consumers the right to limit some but not all sharing. Federal law also requires us to tell you how we collect, share, and protect your personal information. Please read this notice carefully to understand what we do. |
| | |
| What? | | The types of personal information we collect and share depend on the product or service you have with us. This information can include: • Social Security number and account balances • Account transactions and transaction history • Checking account information and wire transfer instructions When you are no longer our customer, we continue to share your information as described in this notice. |
| | |
| How? | | All financial companies need to share customers’ personal information to run their everyday business. In the section below, we list the reasons financial companies can share their customers’ personal information; the reasons MFS chooses to share; and whether you can limit this sharing. |
| | | | |
Reasons we can share your
personal information | | Does MFS share? | | Can you limit this
sharing? |
For our everyday business purposes – such as to process your transactions, maintain your account(s), respond to court orders and legal investigations, or report to credit bureaus | | Yes | | No |
For our marketing purposes – to offer our products and services to you | | No | | We don’t share |
| For joint marketing with other financial companies | | No | | We don’t share |
For our affiliates’ everyday business purposes – information about your transactions and experiences | | No | | We don’t share |
For our affiliates’ everyday business purposes – information about your creditworthiness | | No | | We don’t share |
| For nonaffiliates to market to you | | No | | We don’t share |
| | |
| Questions? | | Call 800-225-2606 or go to mfs.com. |
30
| | |
| Who we are |
| Who is providing this notice? | | MFS Funds, MFS Investment Management, MFS Institutional Advisors, Inc., MFS Fund Distributors, Inc., MFS Heritage Trust Company, and MFS Service Center, Inc. |
| | |
| What we do |
| How does MFS protect my personal information? | | To protect your personal information from unauthorized access and use, we use security measures that comply with federal law. These measures include procedural, electronic, and physical safeguards for the protection of the personal information we collect about you. |
How does MFS
collect my personal information? | | We collect your personal information, for example, when you • open an account or provide account information • direct us to buy securities or direct us to sell your securities • make a wire transfer We also collect your personal information from others, such as credit bureaus, affiliates and other companies. |
| Why can’t I limit all sharing? | | Federal law gives you the right to limit only • sharing for affiliates’ everyday business purposes – information about your creditworthiness • affiliates from using your information to market to you • sharing for nonaffiliates to market to you State laws and individual companies may give you additional rights to limit sharing. |
| | |
| Definitions |
| Affiliates | | Companies related by common ownership or control. They can be financial and nonfinancial companies. •MFS does not share personal information with affiliates, except for everyday business purposes as described on page one of this notice. |
| Nonaffiliates | | Companies not related by common ownership or control. They can be financial and nonfinancial companies. •MFS does not share with nonaffiliates so they can market to you. |
| Joint Marketing | | A formal agreement between nonaffiliated financial companies that together market financial products or services to you. •MFS doesn’t jointly market. |
| | |
| Other important information |
| If you own an MFS product or receive an MFS service in the name of a third party such as a bank or broker-dealer, their privacy policy may apply to you instead of ours. |
31
ANNUAL REPORT
December 31, 2014

MFS® GLOBAL EQUITY SERIES
MFS® Variable Insurance Trust

VGE-ANN
MFS® GLOBAL EQUITY SERIES
CONTENTS
The report is prepared for the general information of contract owners. It is authorized for distribution to prospective investors only when preceded or accompanied by a current prospectus.
NOT FDIC INSURED Ÿ MAY LOSE VALUE Ÿ NO BANK OR CREDIT UNION GUARANTEE Ÿ NOT A DEPOSIT Ÿ NOT INSURED BY ANY FEDERAL GOVERNMENT AGENCY OR NCUA/NCUSIF
MFS Global Equity Series
LETTER FROM THE CHAIRMAN

Dear Contract Owners:
As 2015 begins, sharply lower oil prices are reshaping the global economy, adding to deflationary pressures in the eurozone and exacerbating challenges faced by oil exporters such as Russia. The U.S. economy stands on firmer ground, having expanded steadily over the past year. The U.S. labor market has regained momentum, consumer confidence is buoyant and gasoline prices have tumbled, boosting prospects for a stronger economic rebound in 2015.
Other regions are struggling. The eurozone economy is barely expanding, and the European Central Bank (ECB) has introduced large-scale asset purchases.
Despite Japan’s efforts to strengthen its economy, its sales tax increase last spring tipped the country into a recession, leading to additional monetary stimulus from the Bank of Japan. China’s economy is slowing as it transitions to a more sustainable basis, and its growth rate will likely continue to decline.
As always, active risk management is integral to how we at MFS® manage your investments. We use a collaborative process, sharing insights across asset classes, regions and economic sectors. Our global investment team uses a diversified, multidisciplined, long-term approach.
Applying proven principles, such as asset allocation and diversification, can best serve investors over the long term. We are confident that this approach can help you as you work with your financial advisors to reach your goals in the years ahead.
Respectfully,

Robert J. Manning
Chairman
MFS Investment Management
February 13, 2015
The opinions expressed in this letter are subject to change and may not be relied upon for investment advice. No forecasts can be guaranteed.
1
MFS Global Equity Series
PORTFOLIO COMPOSITION
Portfolio structure

| | | | |
| Top ten holdings | | | | |
| Walt Disney Co. | | | 3.2% | |
| Time Warner, Inc. | | | 2.6% | |
| Honeywell International, Inc. | | | 2.5% | |
| Nestle S.A. | | | 2.5% | |
| Linde AG | | | 2.5% | |
| Reckitt Benckiser Group PLC | | | 2.4% | |
| Thermo Fisher Scientific, Inc. | | | 2.4% | |
| Accenture PLC, “A” | | | 2.3% | |
| State Street Corp. | | | 2.3% | |
| Visa, Inc., “A” | | | 2.2% | |
| |
| Equity sectors | | | | |
| Consumer Staples | | | 16.9% | |
| Financial Services | | | 16.0% | |
| Health Care | | | 13.4% | |
| Leisure | | | 12.0% | |
| Industrial Goods & Services | | | 8.6% | |
| Basic Materials | | | 7.1% | |
| Technology | | | 6.6% | |
| Retailing | | | 6.3% | |
| Special Products & Services | | | 5.0% | |
| Transportation | | | 3.9% | |
| Energy | | | 2.4% | |
| Autos & Housing | | | 1.1% | |
| | | | |
| Issuer country weightings (x) | | | | |
| United States | | | 55.5% | |
| United Kingdom | | | 9.6% | |
| Switzerland | | | 8.1% | |
| France | | | 7.8% | |
| Germany | | | 7.2% | |
| Netherlands | | | 2.3% | |
| Canada | | | 2.0% | |
| Japan | | | 1.6% | |
| Sweden | | | 1.1% | |
| Other Countries | | | 4.8% | |
| |
| Currency exposure weightings (y) | | | | |
| United States Dollar | | | 58.3% | |
| Euro | | | 17.7% | |
| British Pound Sterling | | | 9.6% | |
| Swiss Franc | | | 8.1% | |
| Japanese Yen | | | 1.6% | |
| Swedish Krona | | | 1.1% | |
| Brazilian Real | | | 1.0% | |
| Danish Krone | | | 0.7% | |
| South Korean Won | | | 0.7% | |
| Other Currencies | | | 1.2% | |
| (x) | Represents the portfolio’s exposure to issuer countries as a percentage of a portfolio’s net assets. For purposes of this presentation, United States includes Cash & Other. |
| (y) | Represents the portfolio’s exposure to a particular currency as a percentage of a portfolio’s net assets. For purposes of this presentation, United States Dollar includes Cash & Other. |
Cash & Other can include cash, other assets less liabilities, offsets to derivative positions, and short-term securities.
Percentages are based on net assets as of 12/31/14.
The portfolio is actively managed and current holdings may be different.
2
MFS Global Equity Series
MANAGEMENT REVIEW
Summary of Results
For the twelve months ended December 31, 2014, Initial Class shares of the MFS Global Equity Series (“fund”) provided a total return of 3.87%, while Service Class shares of the fund provided a total return of 3.63%. These compare with a return of 5.50% over the same period for the fund’s benchmark, the MSCI World Index.
Market Environment
Early in the period, US equities suffered what proved to be a temporary setback due to concerns over emerging markets as well as what was perceived at the time to be a pause in US economic growth, partially caused by extreme weather events and a weak December 2013 labor market report. Markets soon recovered as the economic pause concluded and investors appeared to have become increasingly comfortable that newly-installed US Federal Reserve (“Fed”) Chair Janet Yellen would not make any substantial changes to the trajectory of Fed monetary policy.
A generally risk-friendly, carry trade environment persisted from February 2014 until mid-year. While geopolitical tensions flared in the Middle East and Russia/Ukraine, any market setbacks were short-lived as improving economic growth in the US, coupled with prospects for easier monetary policy in regions with slowing growth, such as Japan, Europe and China, supported risk assets. For example, the European Central Bank (“ECB”) cut policy interest rates into negative territory and, by the end of the period, expectations were for additional rate cuts and the announcement for non-conventional easing measures. Similarly, the Bank of Japan surprised markets late in the period with fresh stimulus measures given lackluster growth trends. The related decline in developed market government bond yields and credit spreads were also supportive for equity markets. At the end of the period, the US equity market was trading close to all-time highs and US Treasury yields were close to their lows for the period. However, credit markets did not fare as well in the second half of 2014, particularly US high yield and emerging market debt. The higher weightings of oil and gas credits in these asset classes resulted in widening spreads and increased volatility as oil prices began to decline in an accelerated fashion in the fourth quarter.
Detractors from Performance
Stock selection in the consumer staples sector detracted from performance relative to the MSCI World Index. Overweight positions in pulp and paper manufacturer and consumer goods company Svenska Cellulosa Aktiebolaget (Sweden), international premium drinks manufacturer and distributer Diageo (United Kingdom) and alcoholic and non-alcoholic beverages producer Carlsberg (Denmark) held back relative results as all three stocks lagged the benchmark during the period. Shares of Svenska Cellulosa Aktiebolaget declined during the period as a result of expenses from growth initiatives and restructuring.
Weak stock selection in the health care sector also weighed on relative performance. Although there were no individual stocks within this sector that were among the fund’s largest relative detractors during the period, performance suffered from not owning shares in companies that received takeover approaches.
An underweight position in the technology sector further detracted from relative results. Not owning shares of strong-performing computer and personal electronics maker Apple and software giant Microsoft hampered relative returns. Shares of Apple appreciated steadily over the period due to strong consumer demand for the company’s iPhone 6 and 6 Plus smartphones resulting in strong sales and gross margin figures. The stock price was also strengthened by the announcement of an increased dividend and a $30 billion expansion of its capital return program by the end of 2015.
Elsewhere, overweight positions in industrial gas supplier Linde (Germany), banking firm Standard Chartered (United Kingdom), electrical distribution equipment manufacturer Schneider Electric (France) and oil and gas turnkey contractor Saipem (Italy) hurt relative performance. Shares of Linde declined during the period reflecting lower prices for medical gases in North America and what appeared to have been investors’ concerns that significant exposure to emerging markets economies may be negatively impacted by slowing growth and currency devaluations. Later on in the period, the company reduced its 2014 earnings guidance due to recognized impairment losses and also lowered its earnings forecast for 2016-2017 citing reduced growth estimates for the global economy. The fund’s holdings of Russian bank Sberbank of Russia (b) also weighed on relative returns.
Contributors to Performance
An underweight position in the energy sector benefited relative results as the sector delivered weak performance for the reporting period. However, there were no individual stocks within this sector that were among the fund’s largest relative contributors.
Stock selection in the leisure sector also aided relative performance. Within this sector, overweight positions in strong-performing media conglomerate Walt Disney and media firm Time Warner boosted relative returns. Shares of Walt Disney appreciated on the back of exceptionally strong box office results of its hit animation film “Frozen”, as well as strong performance in its cable and studio segment. The share price of Time Warner increased after the company announced the spin off its publishing unit Time Inc., effective
3
MFS Global Equity Series
Management Review – continued
June 6, 2014, which appeared to have been viewed by investors as a generally positive move. Additionally, management increased the full year outlook for 2014 partially reflecting a boost from strong box office results, particularly from its release of the new film “Godzilla”, with $93.2 million of US domestic sales in its opening weekend.
Stocks in other sectors that bolstered relative results included overweight positions in railroad company Canadian National Railway (Canada), medical device maker Medtronic, global payments technology company Visa, diversified technology company 3M, automotive replacement parts distributor AutoZone, enterprise software products maker Oracle, global financial services provider Bank of New York Mellon and medical equipment manufacturer Stryker. Shares of Canadian National Railway grew steadily over the period due to solid revenue growth and an improved operational metrics. Towards the end of the reporting period, management raised its full-year guidance on a favorable outlook for demand and pricing which appeared to have been well received by investors.
Respectfully,
| | |
| David Mannheim | | Roger Morley |
| Portfolio Manager | | Portfolio Manager |
| (b) | Security is not a benchmark constituent. |
The views expressed in this report are those of the portfolio managers only through the end of the period of the report as stated on the cover and do not necessarily reflect the views of MFS or any other person in the MFS organization. These views are subject to change at any time based on market or other conditions, and MFS disclaims any responsibility to update such views. These views may not be relied upon as investment advice or an indication of trading intent on behalf of any MFS portfolio. References to specific securities are not recommendations of such securities, and may not be representative of any MFS portfolio’s current or future investments.
4
MFS Global Equity Series
PERFORMANCE SUMMARY THROUGH 12/31/14
The following chart illustrates the historical performance of the fund in comparison to its benchmark(s). Benchmarks are unmanaged and may not be invested in directly. Benchmark returns do not reflect any fees or expenses. The performance of other share classes will be greater than or less than that of the class depicted below. (See Notes to Performance Summary.)
Performance data shown represents past performance and is no guarantee of future results. Investment return and principal value fluctuate so your units, when sold, may be worth more or less than the original cost; current performance may be lower or higher than quoted. The performance shown does not reflect the deduction of taxes, if any, that a contract holder would pay on fund distributions or the redemption of contract units. The returns for the fund shown also do not reflect the deduction of expenses associated with variable products, such as mortality and expense risk charges, separate account charges, and sales charges imposed by the insurance company separate accounts. Such expenses would reduce the overall returns shown.
Growth of a Hypothetical $10,000 Investment
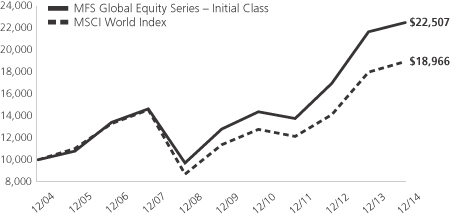
Total Returns through 12/31/14
Average annual total returns
| | | | | | | | | | | | |
| | | Share Class | | Class inception date | | 1-yr | | 5-yr | | 10-yr | | |
| | | Initial Class | | 5/03/99 | | 3.87% | | 11.97% | | 8.45% | | |
| | | Service Class | | 5/01/00 | | 3.63% | | 11.70% | | 8.07% | | |
| | | | |
| Comparative benchmark | | | | | | | | |
| | | MSCI World Index (f) | | 5.50% | | 10.81% | | 6.61% | | |
| (f) | Source: FactSet Research Systems Inc. |
Benchmark Definition
MSCI World Index – a market capitalization-weighted index that is designed to measure equity market performance in the global developed markets.
It is not possible to invest directly in an index.
Notes to Performance Summary
Average annual total return represents the average annual change in value for each share class for the periods presented.
Performance results reflect any applicable expense subsidies and waivers in effect during the periods shown. Without such subsidies and waivers the fund’s performance results would be less favorable. Please see the prospectus and financial statements for complete details. All results are historical and assume the reinvestment of any dividends and capital gains distributions.
Performance results do not include adjustments made for financial reporting purposes in accordance with U.S. generally accepted accounting principles and may differ from amounts reported in the financial highlights.
From time to time the fund may receive proceeds from litigation settlements, without which performance would be lower.
5
MFS Global Equity Series
EXPENSE TABLE
Fund Expenses Borne by the Contract Holders During the Period,
July 1, 2014 through December 31, 2014
As a contract holder of the fund, you incur ongoing costs, including management fees; distribution and/or service (12b-1) fees; and other fund expenses. This example is intended to help you understand your ongoing costs (in dollars) of investing in the fund and to compare these costs with the ongoing costs of investing in other mutual funds.
The example is based on an investment of $1,000 invested at the beginning of the period and held for the entire period July 1, 2014 through December 31, 2014.
Actual Expenses
The first line for each share class in the following table provides information about actual account values and actual expenses. You may use the information in this line, together with the amount you invested, to estimate the expenses that you paid over the period. Simply divide your account value by $1,000 (for example, an $8,600 account value divided by $1,000 = 8.6), then multiply the result by the number in the first line under the heading entitled “Expenses Paid During Period” to estimate the expenses you paid on your account during this period.
Hypothetical Example for Comparison Purposes
The second line for each share class in the following table provides information about hypothetical account values and hypothetical expenses based on the fund’s actual expense ratio and an assumed rate of return of 5% per year before expenses, which is not the fund’s actual return. The hypothetical account values and expenses may not be used to estimate the actual ending account balance or expenses you paid for the period. You may use this information to compare the ongoing costs of investing in the fund and other funds. To do so, compare this 5% hypothetical example with the 5% hypothetical examples that appear in the shareholder reports of the other funds.
Please note that the expenses shown in the table are meant to highlight the fund’s ongoing costs only and do not take into account the fees and expenses imposed under the variable contracts through which your investment in the fund is made. Therefore, the second line for each share class in the table is useful in comparing ongoing costs associated with an investment in vehicles (such as the fund) which fund benefits under variable annuity and variable life insurance contracts and to qualified pension and retirement plans only, and will not help you determine the relative total costs of investing in the fund through variable annuity and variable life insurance contracts. If the fees and expenses imposed under the variable contracts were included, your costs would have been higher.
| | | | | | | | | | | | | | | | | | |
| Share Class | | | | Annualized
Expense Ratio | | | Beginning
Account Value
7/01/14 | | | Ending Account Value
12/31/14 | | | Expenses Paid
During Period (p)
7/01/14-12/31/14 | |
| Initial Class | | Actual | | | 1.03% | | | | $1,000.00 | | | | $991.69 | | | | $5.17 | |
| | Hypothetical (h) | | | 1.03% | | | | $1,000.00 | | | | $1,020.01 | | | | $5.24 | |
| Service Class | | Actual | | | 1.28% | | | | $1,000.00 | | | | $990.66 | | | | $6.42 | |
| | Hypothetical (h) | | | 1.28% | | | | $1,000.00 | | | | $1,018.75 | | | | $6.51 | |
| (h) | 5% class return per year before expenses. |
| (p) | “Expenses Paid During Period” are equal to each class’s annualized expense ratio, as shown above, multiplied by the average account value over the period, multiplied by 184/365 (to reflect the one-half year period). |
Notes to Expense Table
Changes to the fund’s fee arrangements occurred during the six month period. Had these fee changes been in effect throughout the entire six month period, the annualized expense ratios, the actual expenses paid during the period and the hypothetical expenses paid during the period would have been approximately 1.00%, $5.02 and $5.09 for Initial Class and 1.25%, $6.27 and $6.36 for Service Class, respectively. For further information about the fund’s fee arrangements and changes to those fee arrangements, please see Note 3 in the Notes to Financial Statements.
6
MFS Global Equity Series
PORTFOLIO OF INVESTMENTS – 12/31/14
The Portfolio of Investments is a complete list of all securities owned by your fund. It is categorized by broad-based asset classes.
| | | | | | | | |
| Issuer | | Shares/Par | | | Value ($) | |
| | | | | | | | |
| COMMON STOCKS – 99.3% | | | | | |
| Aerospace – 5.3% | | | | | | | | |
| Honeywell International, Inc. | | | 14,735 | | | $ | 1,472,321 | |
| MTU Aero Engines Holding AG | | | 4,324 | | | | 377,560 | |
| United Technologies Corp. | | | 10,995 | | | | 1,264,425 | |
| | | | | | | | |
| | | $ | 3,114,306 | |
| | | | | | | | |
| Alcoholic Beverages – 5.7% | | | | | | | | |
| AmBev S.A. | | | 53,268 | | | $ | 331,113 | |
| Carlsberg A.S., “B” | | | 5,005 | | | | 388,666 | |
| Diageo PLC | | | 41,639 | | | | 1,194,254 | |
| Heineken N.V. | | | 9,140 | | | | 649,299 | |
| Pernod Ricard S.A. | | | 6,691 | | | | 741,878 | |
| | | | | | | | |
| | | $ | 3,305,210 | |
| | | | | | | | |
| Apparel Manufacturers – 3.5% | | | | | | | | |
| Burberry Group PLC | | | 13,880 | | | $ | 351,700 | |
| Compagnie Financiere Richemont S.A. | | | 6,913 | | | | 612,335 | |
| LVMH Moet Hennessy Louis Vuitton S.A. | | | 6,134 | | | | 969,994 | |
| NIKE, Inc., “B” | | | 888 | | | | 85,381 | |
| | | | | | | | |
| | | $ | 2,019,410 | |
| | | | | | | | |
| Automotive – 1.1% | | | | | | | | |
| Delphi Automotive PLC | | | 7,197 | | | $ | 523,366 | |
| Harley-Davidson, Inc. | | | 1,837 | | | | 121,077 | |
| | | | | | | | |
| | | $ | 644,443 | |
| | | | | | | | |
| Broadcasting – 8.6% | | | | | | | | |
| Omnicom Group, Inc. | | | 7,659 | | | $ | 593,343 | |
| Time Warner, Inc. | | | 17,859 | | | | 1,525,516 | |
| Viacom, Inc., “B” | | | 2,587 | | | | 194,672 | |
| Walt Disney Co. | | | 19,732 | | | | 1,858,557 | |
| WPP PLC | | | 39,000 | | | | 809,102 | |
| | | | | | | | |
| | | $ | 4,981,190 | |
| | | | | | | | |
| Brokerage & Asset Managers – 1.9% | | | | | |
| Deutsche Boerse AG | | | 4,343 | | | $ | 311,216 | |
| Franklin Resources, Inc. | | | 14,688 | | | | 813,275 | |
| | | | | | | | |
| | | $ | 1,124,491 | |
| | | | | | | | |
| Business Services – 5.0% | | | | | |
| Accenture PLC, “A” | | | 15,212 | | | $ | 1,358,584 | |
| Adecco S.A. | | | 7,136 | | | | 488,844 | |
| Brenntag AG | | | 4,510 | | | | 253,820 | |
| Compass Group PLC | | | 42,009 | | | | 716,015 | |
| NOW, Inc. (a) | | | 3,382 | | | | 87,019 | |
| | | | | | | | |
| | | $ | 2,904,282 | |
| | | | | | | | |
| Cable TV – 1.5% | | | | | |
| British Sky Broadcasting Group PLC | | | 28,306 | | | $ | 393,969 | |
| Time Warner Cable, Inc. | | | 3,252 | | | | 494,499 | |
| | | | | | | | |
| | | $ | 888,468 | |
| | | | | | | | |
| Chemicals – 1.8% | | | | | |
| 3M Co. | | | 6,389 | | | $ | 1,049,840 | |
| | | | | | | | |
| | | | | | | | |
| Issuer | | Shares/Par | | | Value ($) | |
| | | | | | | | |
| COMMON STOCKS – continued | | | | | |
| Computer Software – 2.7% | | | | | |
| Check Point Software Technologies Ltd. (a) | | | 3,511 | | | $ | 275,859 | |
| Dassault Systems S.A. | | | 1,850 | | | | 112,588 | |
| Oracle Corp. | | | 26,218 | | | | 1,179,023 | |
| | | | | | | | |
| | | $ | 1,567,470 | |
| | | | | | | | |
| Consumer Products – 6.1% | | | | | |
| Colgate-Palmolive Co. | | | 11,853 | | | $ | 820,109 | |
| International Flavors & Fragrances, Inc. | | | 4,229 | | | | 428,651 | |
| Procter & Gamble Co. | | | 2,340 | | | | 213,151 | |
| Reckitt Benckiser Group PLC | | | 17,447 | | | | 1,407,474 | |
| Svenska Cellulosa Aktiebolaget | | | 30,702 | | | | 663,041 | |
| | | | | | | | |
| | | $ | 3,532,426 | |
| | | | | | | | |
| Electrical Equipment – 3.2% | | | | | |
| Amphenol Corp., “A” | | | 7,515 | | | $ | 404,382 | |
| Legrand S.A. | | | 12,157 | | | | 636,405 | |
| Rockwell Automation, Inc. | | | 1,266 | | | | 140,779 | |
| Schneider Electric S.A. | | | 9,550 | | | | 693,921 | |
| | | | | | | | |
| | | $ | 1,875,487 | |
| | | | | | | | |
| Electronics – 2.6% | | | | | |
| Altera Corp. | | | 6,223 | | | $ | 229,878 | |
| Hoya Corp. | | | 16,400 | | | | 549,088 | |
| Microchip Technology, Inc. | | | 8,544 | | | | 385,420 | |
| Samsung Electronics Co. Ltd. | | | 313 | | | | 376,242 | |
| | | | | | | | |
| | | $ | 1,540,628 | |
| | | | | | | | |
| Energy – Independent – 0.4% | | | | | |
| INPEX Corp. | | | 19,400 | | | $ | 215,250 | |
| | | | | | | | |
| Food & Beverages – 5.1% | | | | | |
| Danone S.A. | | | 14,301 | | | $ | 940,813 | |
| Kellogg Co. | | | 8,951 | | | | 585,753 | |
| Nestle S.A. | | | 20,050 | | | | 1,469,696 | |
| | | | | | | | |
| | | $ | 2,996,262 | |
| | | | | | | | |
| Food & Drug Stores – 0.3% | | | | | |
| Lawson, Inc. | | | 2,500 | | | $ | 151,171 | |
| | | | | | | | |
| Gaming & Lodging – 0.7% | | | | | |
| Sands China Ltd. | | | 23,200 | | | $ | 112,840 | |
| William Hill PLC | | | 31,817 | | | | 178,926 | |
| Wynn Resorts Ltd. | | | 798 | | | | 118,710 | |
| | | | | | | | |
| | | $ | 410,476 | |
| | | | | | | | |
| Insurance – 0.4% | | | | | |
| Swiss Re Ltd. | | | 2,505 | | | $ | 209,602 | |
| | | | | | | | |
| Internet – 0.6% | | | | | |
| eBay, Inc. (a) | | | 6,333 | | | $ | 355,408 | |
| | | | | | | | |
| Major Banks – 6.0% | | | | | |
| Bank of New York Mellon Corp. | | | 23,875 | | | $ | 968,609 | |
| Goldman Sachs Group, Inc. | | | 3,744 | | | | 725,700 | |
| Standard Chartered PLC | | | 28,283 | | | | 424,509 | |
| State Street Corp. | | | 17,289 | | | | 1,357,187 | |
| | | | | | | | |
| | | $ | 3,476,005 | |
| | | | | | | | |
7
MFS Global Equity Series
Portfolio of Investments – continued
| | | | | | | | |
| Issuer | | Shares/Par | | | Value ($) | |
| | | | | | | | |
| COMMON STOCKS – continued | | | | | |
| Medical Equipment – 8.9% | | | | | |
| DENTSPLY International, Inc. | | | 9,175 | | | $ | 488,752 | |
| Medtronic, Inc. | | | 11,631 | | | | 839,758 | |
| Sonova Holding AG | | | 2,503 | | | | 366,923 | |
| St. Jude Medical, Inc. | | | 11,667 | | | | 758,705 | |
| Stryker Corp. | | | 8,081 | | | | 762,281 | |
| Thermo Fisher Scientific, Inc. | | | 11,083 | | | | 1,388,589 | |
| Waters Corp. (a) | | | 4,854 | | | | 547,143 | |
| | | | | | | | |
| | | $ | 5,152,151 | |
| | | | | | | | |
| Network & Telecom – 0.7% | | | | | |
| Cisco Systems, Inc. | | | 14,403 | | | $ | 400,619 | |
| | | | | | | | |
| Oil Services – 2.1% | | | | | |
| National Oilwell Varco, Inc. | | | 4,779 | | | $ | 313,168 | |
| Saipem S.p.A. (a) | | | 8,098 | | | | 85,048 | |
| Schlumberger Ltd. | | | 9,566 | | | | 817,032 | |
| | | | | | | | |
| | | $ | 1,215,248 | |
| | | | | | | | |
| Other Banks & Diversified Financials – 7.7% | | | | | |
| American Express Co. | | | 9,967 | | | $ | 927,330 | |
| Credicorp Ltd. | | | 849 | | | | 135,993 | |
| Erste Group Bank AG | | | 8,620 | | | | 197,626 | |
| Grupo Financiero Banorte S.A. de C.V. | | | 39,164 | | | | 215,546 | |
| Itau Unibanco Holding S.A., ADR | | | 20,546 | | | | 267,303 | |
| Julius Baer Group Ltd. | | | 8,009 | | | | 365,491 | |
| Kasikornbank Co. Ltd. | | | 32,500 | | | | 225,825 | |
| Komercni Banka A.S. | | | 537 | | | | 110,630 | |
| Sberbank of Russia, ADR | | | 13,428 | | | | 53,957 | |
| UBS AG (a) | | | 39,050 | | | | 671,258 | |
| Visa, Inc., “A” | | | 4,967 | | | | 1,302,347 | |
| | | | | | | | |
| | | $ | 4,473,306 | |
| | | | | | | | |
| Pharmaceuticals – 4.5% | | | | | |
| Bayer AG | | | 9,468 | | | $ | 1,294,613 | |
| Indivior PLC (a) | | | 16,170 | | | | 37,653 | |
| Johnson & Johnson | | | 3,990 | | | | 417,234 | |
| Merck KGaA | | | 5,116 | | | | 485,468 | |
| Roche Holding AG | | | 1,444 | | | | 391,382 | |
| | | | | | | | |
| | | $ | 2,626,350 | |
| | | | | | | | |
| Railroad & Shipping – 2.2% | | | | | |
| Canadian National Railway Co. | | | 17,114 | | | $ | 1,179,326 | |
| Kuehne & Nagel, Inc. AG | | | 832 | | | | 113,095 | |
| | | | | | | | |
| | | $ | 1,292,421 | |
| | | | | | | | |
| Restaurants – 1.2% | | | | | |
| McDonald’s Corp. | | | 6,514 | | | $ | 610,362 | |
| Whitbread PLC | | | 1,159 | | | | 85,531 | |
| | | | | | | | |
| | | $ | 695,893 | |
| | | | | | | | |
| Specialty Chemicals – 5.3% | | | | | |
| Akzo Nobel N.V. | | | 10,202 | | | $ | 707,454 | |
| L’Air Liquide S.A. | | | 2,521 | | | | 311,063 | |
| Linde AG | | | 7,757 | | | | 1,447,377 | |
| Praxair, Inc. | | | 4,698 | | | | 608,673 | |
| | | | | | | | |
| | | $ | 3,074,567 | |
| | | | | | | | |
| | | | | | | | |
| Issuer | | Shares/Par | | | Value ($) | |
| | | | | | | | |
| COMMON STOCKS – continued | | | | | |
| Specialty Stores – 2.5% | | | | | |
| AutoZone, Inc. (a) | | | 1,003 | | | $ | 620,967 | |
| Hermes International | | | 298 | | | | 106,303 | |
| Sally Beauty Holdings, Inc. (a) | | | 14,311 | | | | 439,920 | |
| Urban Outfitters, Inc. (a) | | | 8,929 | | | | 313,676 | |
| | | | | | | | |
| | | $ | 1,480,866 | |
| | | | | | | | |
| Trucking – 1.7% | | | | | |
| United Parcel Service, Inc., “B” | | | 8,897 | | | $ | 989,079 | |
| | | | | | | | |
Total Common Stocks
(Identified Cost, $36,487,430) | | | $ | 57,762,325 | |
| | | | | | | | |
| |
| MONEY MARKET FUNDS – 0.7% | | | | | |
| MFS Institutional Money Market Portfolio, 0.09%, at Cost and Net Asset Value (v) | | | 390,900 | | | $ | 390,900 | |
| | | | | | | | |
Total Investments
(Identified Cost, $36,878,330) | | | | | | $ | 58,153,225 | |
| | | | | | | | |
OTHER ASSETS, LESS
LIABILITIES – 0.0% | | | | 14,598 | |
| | | | | | | | |
| NET ASSETS – 100.0% | | | $ | 58,167,823 | |
| | | | | | | | |
| (a) | | Non-income producing security. |
| (v) | | Underlying affiliated fund that is available only to investment companies managed by MFS. The rate quoted for the MFS Institutional Money Market Portfolio is the annualized seven-day yield of the fund at period end. |
The following abbreviations are used in this report and are defined:
| ADR | | American Depositary Receipt |
| PLC | | Public Limited Company |
See Notes to Financial Statements
8
MFS Global Equity Series
FINANCIAL STATEMENTS | STATEMENT OF ASSETS AND LIABILITIES
This statement represents your fund’s balance sheet, which details the assets and liabilities comprising the total value of the fund.
| | | | | | | | |
At 12/31/14 | | | | | | | | |
Assets | | | | | | | | |
Investments – | | | | | | | | |
Non-affiliated issuers, at value (identified cost, $36,487,430) | | | $57,762,325 | | | | | |
Underlying affiliated funds, at cost and value | | | 390,900 | | | | | |
Total investments, at value (identified cost, $36,878,330) | | | $58,153,225 | | | | | |
Cash | | | 3,178 | | | | | |
Receivables for | | | | | | | | |
Fund shares sold | | | 38,521 | | | | | |
Interest and dividends | | | 108,987 | | | | | |
Receivable from investment adviser | | | 6,736 | | | | | |
Other assets | | | 706 | | | | | |
Total assets | | | | | | | $58,311,353 | |
Liabilities | | | | | | | | |
Payable to custodian | | | $13,168 | | | | | |
Payables for | | | | | | | | |
Investments purchased | | | 3 | | | | | |
Fund shares reacquired | | | 65,413 | | | | | |
Payable to affiliates | | | | | | | | |
Shareholder servicing costs | | | 104 | | | | | |
Distribution and/or service fees | | | 90 | | | | | |
Deferred country tax expense payable | | | 9,125 | | | | | |
Accrued expenses and other liabilities | | | 55,627 | | | | | |
Total liabilities | | | | | | | $143,530 | |
Net assets | | | | | | | $58,167,823 | |
Net assets consist of | | | | | | | | |
Paid-in capital | | | $34,743,828 | | | | | |
Unrealized appreciation (depreciation) on investments and translation of assets and liabilities in foreign currencies
(net of $9,125 deferred country tax) | | | 21,262,391 | | | | | |
Accumulated net realized gain (loss) on investments and foreign currency | | | 1,554,909 | | | | | |
Undistributed net investment income | | | 606,695 | | | | | |
Net assets | | | | | | | $58,167,823 | |
Shares of beneficial interest outstanding | | | | | | | 2,970,161 | |
| | | | | | | | | | | | |
| | | Net assets | | | Shares outstanding | | | Net asset value per share | |
Initial Class | | | $51,635,243 | | | | 2,635,142 | | | | $19.59 | |
Service Class | | | 6,532,580 | | | | 335,019 | | | | 19.50 | |
See Notes to Financial Statements
9
MFS Global Equity Series
FINANCIAL STATEMENTS | STATEMENT OF OPERATIONS
This statement describes how much your fund earned in investment income and accrued in expenses. It also describes any gains and/or losses generated by fund operations.
| | | | | | | | |
Year ended 12/31/14 | | | | | | | | |
Net investment income | | | | | | | | |
Income | | | | | | | | |
Dividends | | | $1,351,477 | | | | | |
Interest | | | 18,155 | | | | | |
Dividends from underlying affiliated funds | | | 398 | | | | | |
Foreign taxes withheld | | | (78,638 | ) | | | | |
Total investment income | | | | | | | $1,291,392 | |
Expenses | | | | | | | | |
Management fee | | | $601,733 | | | | | |
Distribution and/or service fees | | | 17,697 | | | | | |
Shareholder servicing costs | | | 16,847 | | | | | |
Administrative services fee | | | 18,847 | | | | | |
Independent Trustees’ compensation | | | 2,655 | | | | | |
Custodian fee | | | 44,114 | | | | | |
Shareholder communications | | | 15,655 | | | | | |
Audit and tax fees | | | 58,552 | | | | | |
Legal fees | | | 531 | | | | | |
Miscellaneous | | | 9,649 | | | | | |
Total expenses | | | | | | | $786,280 | |
Fees paid indirectly | | | (1 | ) | | | | |
Reduction of expenses by investment adviser | | | (113,458 | ) | | | | |
Net expenses | | | | | | | $672,821 | |
Net investment income | | | | | | | $618,571 | |
Realized and unrealized gain (loss) on investments and foreign currency | | | | | | | | |
Realized gain (loss) (identified cost basis) | | | | | | | | |
Investments (net of $2,419 country tax) | | | $1,925,391 | | | | | |
Foreign currency | | | (7,331 | ) | | | | |
Net realized gain (loss) on investments and foreign currency | | | | | | | $1,918,060 | |
Change in unrealized appreciation (depreciation) | | | | | | | | |
Investments (net of $8,686 increase in deferred country tax) | | | $(283,740 | ) | | | | |
Translation of assets and liabilities in foreign currencies | | | (4,534 | ) | | | | |
Net unrealized gain (loss) on investments and foreign currency translation | | | | | | | $(288,274 | ) |
Net realized and unrealized gain (loss) on investments and foreign currency | | | | | | | $1,629,786 | |
Change in net assets from operations | | | | | | | $2,248,357 | |
See Notes to Financial Statements
10
MFS Global Equity Series
FINANCIAL STATEMENTS | STATEMENTS OF CHANGES IN NET ASSETS
These statements describe the increases and/or decreases in net assets resulting from operations, any distributions, and any shareholder transactions.
| | | | | | | | |
For years ended 12/31 | | | 2014 | | | | 2013 | |
Change in net assets | | | | | | | | |
From operations | | | | | | | | |
Net investment income | | | $618,571 | | | | $429,878 | |
Net realized gain (loss) on investments and foreign currency | | | 1,918,060 | | | | 775,418 | |
Net unrealized gain (loss) on investments and foreign currency translation | | | (288,274 | ) | | | 11,940,619 | |
Change in net assets from operations | | | $2,248,357 | | | | $13,145,915 | |
Distributions declared to shareholders | | | | | | | | |
From net investment income | | | $(423,888 | ) | | | $(472,008 | ) |
From net realized gain on investments | | | (597,485 | ) | | | — | |
Total distributions declared to shareholders | | | $(1,021,373 | ) | | | $(472,008 | ) |
Change in net assets from fund share transactions | | | $(4,151,496 | ) | | | $2,994,644 | |
Total change in net assets | | | $(2,924,512 | ) | | | $15,668,551 | |
Net assets | | | | | | | | |
At beginning of period | | | 61,092,335 | | | | 45,423,784 | |
At end of period (including undistributed net investment income of $606,695 and
$423,108, respectively) | | | $58,167,823 | | | | $61,092,335 | |
See Notes to Financial Statements
11
MFS Global Equity Series
FINANCIAL STATEMENTS | FINANCIAL HIGHLIGHTS
The financial highlights table is intended to help you understand the fund’s financial performance for the past 5 years. Certain information reflects financial results for a single fund share. The total returns in the table represent the rate by which an investor would have earned (or lost) on an investment in the fund share class (assuming reinvestment of all distributions) held for the entire period.
| | | | | | | | | | | | | | | | | | | | |
| Initial Class | | Years ended 12/31 | |
| | | 2014 | | | 2013 | | | 2012 | | | 2011 | | | 2010 | |
Net asset value, beginning of period | | | $19.18 | | | | $15.14 | | | | $12.71 | | | | $13.40 | | | | $12.04 | |
| Income (loss) from investment operations | | | | | | | | | | | | | | | | | | | | |
Net investment income (d) | | | $0.20 | | | | $0.14 | | | | $0.16 | | | | $0.14 | | | | $0.11 | |
Net realized and unrealized gain (loss) on investments
and foreign currency | | | 0.54 | | | | 4.05 | | | | 2.76 | | | | (0.72 | ) | | | 1.37 | |
Total from investment operations | | | $0.74 | | | | $4.19 | | | | $2.92 | | | | $(0.58 | ) | | | $1.48 | |
| Less distributions declared to shareholders | | | | | | | | | | | | | | | | | | | | |
From net investment income | | | $(0.14 | ) | | | $(0.15 | ) | | | $(0.16 | ) | | | $(0.11 | ) | | | $(0.12 | ) |
From net realized gain on investments | | | (0.19 | ) | | | — | | | | (0.33 | ) | | | — | | | | — | |
Total distributions declared to shareholders | | | $(0.33 | ) | | | $(0.15 | ) | | | $(0.49 | ) | | | $(0.11 | ) | | | $(0.12 | ) |
Net asset value, end of period (x) | | | $19.59 | | | | $19.18 | | | | $15.14 | | | | $12.71 | | | | $13.40 | |
Total return (%) (k)(r)(s)(x) | | | 3.87 | | | | 27.81 | | | | 23.34 | | | | (4.32 | ) | | | 12.36 | |
Ratios (%) (to average net assets)
and Supplemental data: | | | | | | | | | | | | | | | | | | | | |
Expenses before expense reductions (f) | | | 1.28 | | | | 1.31 | | | | 1.30 | | | | 1.40 | | | | 1.38 | |
Expenses after expense reductions (f) | | | 1.09 | | | | 1.15 | | | | 1.15 | | | | 1.15 | | | | 1.15 | |
Net investment income | | | 1.06 | | | | 0.82 | | | | 1.15 | | | | 1.08 | | | | 0.88 | |
Portfolio turnover | | | 15 | | | | 25 | | | | 21 | | | | 15 | | | | 18 | |
Net assets at end of period (000 omitted) | | | $51,635 | | | | $54,075 | | | | $41,297 | | | | $35,426 | | | | $39,966 | |
See Notes to Financial Statements
12
MFS Global Equity Series
Financial Highlights – continued
| | | | | | | | | | | | | | | | | | | | |
| Service Class | | Years ended 12/31 | |
| | | 2014 | | | 2013 | | | 2012 | | | 2011 | | | 2010 | |
Net asset value, beginning of period | | | $19.10 | | | | $15.09 | | | | $12.68 | | | | $13.37 | | | | $12.03 | |
| Income (loss) from investment operations | | | | | | | | | | | | | | | | | | | | |
Net investment income (d) | | | $0.15 | | | | $0.09 | | | | $0.12 | | | | $0.11 | | | | $0.08 | |
Net realized and unrealized gain (loss) on investments
and foreign currency | | | 0.54 | | | | 4.05 | | | | 2.75 | | | | (0.71 | ) | | | 1.36 | |
Total from investment operations | | | $0.69 | | | | $4.14 | | | | $2.87 | | | | $(0.60 | ) | | | $1.44 | |
| Less distributions declared to shareholders | | | | | | | | | | | | | | | | | | | | |
From net investment income | | | $(0.10 | ) | | | $(0.13 | ) | | | $(0.13 | ) | | | $(0.09 | ) | | | $(0.10 | ) |
From net realized gain on investments | | | (0.19 | ) | | | — | | | | (0.33 | ) | | | — | | | | — | |
Total distributions declared to shareholders | | | $(0.29 | ) | | | $(0.13 | ) | | | $(0.46 | ) | | | $(0.09 | ) | | | $(0.10 | ) |
Net asset value, end of period (x) | | | $19.50 | | | | $19.10 | | | | $15.09 | | | | $12.68 | | | | $13.37 | |
Total return (%) (k)(r)(s)(x) | | | 3.63 | | | | 27.52 | | | | 22.98 | | | | (4.53 | ) | | | 12.05 | |
Ratios (%) (to average net assets)
and Supplemental data: | | | | | | | | | | | | | | | | | | | | |
Expenses before expense reductions (f) | | | 1.53 | | | | 1.56 | | | | 1.54 | | | | 1.65 | | | | 1.63 | |
Expenses after expense reductions (f) | | | 1.34 | | | | 1.40 | | | | 1.40 | | | | 1.40 | | | | 1.40 | |
Net investment income | | | 0.80 | | | | 0.54 | | | | 0.87 | | | | 0.83 | | | | 0.64 | |
Portfolio turnover | | | 15 | | | | 25 | | | | 21 | | | | 15 | | | | 18 | |
Net assets at end of period (000 omitted) | | | $6,533 | | | | $7,018 | | | | $4,127 | | | | $2,640 | | | | $2,474 | |
| (d) | Per share data is based on average shares outstanding. |
| (f) | Ratios do not reflect reductions from fees paid indirectly, if applicable. |
| (k) | The total return does not reflect expenses that apply to separate accounts. Inclusion of these charges would reduce the total return figures for all periods shown. |
| (r) | Certain expenses have been reduced without which performance would have been lower. |
| (s) | From time to time the fund may receive proceeds from litigation settlements, without which performance would be lower. |
| (x) | The net asset values per share and total returns have been calculated on net assets which include adjustments made in accordance with U.S. generally accepted accounting principles required at period end for financial reporting purposes. |
See Notes to Financial Statements
13
MFS Global Equity Series
NOTES TO FINANCIAL STATEMENTS
| (1) | | Business and Organization |
MFS Global Equity Series (the fund) is a diversified series of MFS Variable Insurance Trust (the trust). The trust is organized as a Massachusetts business trust and is registered under the Investment Company Act of 1940, as amended, as an open-end management investment company. The shareholders of each series of the trust are separate accounts of insurance companies, which offer variable annuity and/or life insurance products, and qualified retirement and pension plans.
The fund is an investment company and accordingly follows the investment company accounting and reporting guidance of the Financial Accounting Standards Board (FASB) Accounting Standards Codification Topic 946 Financial Services – Investment Companies.
| (2) | | Significant Accounting Policies |
General – The preparation of financial statements in conformity with U.S. generally accepted accounting principles requires management to make estimates and assumptions that affect the reported amounts of assets and liabilities, and disclosure of contingent assets and liabilities at the date of the financial statements and the reported amounts of increases and decreases in net assets from operations during the reporting period. Actual results could differ from those estimates. In the preparation of these financial statements, management has evaluated subsequent events occurring after the date of the fund’s Statement of Assets and Liabilities through the date that the financial statements were issued. The fund invests in foreign securities. Investments in foreign securities are vulnerable to the effects of changes in the relative values of the local currency and the U.S. dollar and to the effects of changes in each country’s legal, political, and economic environment.
In June 2014, FASB issued Accounting Standards Update 2014-11, Transfers and Servicing (Topic 860) – Repurchase-to-Maturity Transactions, Repurchase Financings, and Disclosures (“ASU 2014-11”). ASU 2014-11 changes the accounting for repurchase-to-maturity transactions (i.e., repurchase agreements that settle at the same time as the maturity of the transferred financial asset) and enhances the required disclosures for repurchase agreements and other similar transactions. Although still evaluating the potential impacts of ASU 2014-11 to the fund, management expects that the impact of the fund’s adoption will be limited to additional financial statement disclosures which would first be effective for interim reporting periods beginning after March 15, 2015.
Balance Sheet Offsetting – The fund’s accounting policy with respect to balance sheet offsetting is that, absent an event of default by the counterparty or a termination of the agreement, the International Swaps and Derivatives Association (ISDA) Master Agreement does not result in an offset of reported amounts of financial assets and financial liabilities in the Statement of Assets and Liabilities across transactions between the fund and the applicable counterparty. The fund’s right to setoff may be restricted or prohibited by the bankruptcy or insolvency laws of the particular jurisdiction to which a specific master netting agreement counterparty is subject. Balance sheet offsetting disclosures, to the extent applicable to the fund, have been included in the fund’s Significant Accounting Policies note under the captions for each of the fund’s in-scope financial instruments and transactions.
Investment Valuations – Equity securities, including restricted equity securities, are generally valued at the last sale or official closing price as provided by a third-party pricing service on the market or exchange on which they are primarily traded. Equity securities, for which there were no sales reported that day, are generally valued at the last quoted daily bid quotation as provided by a third-party pricing service on the market or exchange on which such securities are primarily traded. Short-term instruments with a maturity at issuance of 60 days or less may be valued at amortized cost, which approximates market value. Open-end investment companies are generally valued at net asset value per share. Securities and other assets generally valued on the basis of information from a third-party pricing service may also be valued at a broker/dealer bid quotation. Values obtained from third-party pricing services can utilize both transaction data and market information such as yield, quality, coupon rate, maturity, type of issue, trading characteristics, and other market data. The values of foreign securities and other assets and liabilities expressed in foreign currencies are converted to U.S. dollars using the mean of bid and asked prices for rates provided by a third-party pricing service.
The Board of Trustees has delegated primary responsibility for determining or causing to be determined the value of the fund’s investments (including any fair valuation) to the adviser pursuant to valuation policies and procedures approved by the Board. If the adviser determines that reliable market quotations are not readily available, investments are valued at fair value as determined in good faith by the adviser in accordance with such procedures under the oversight of the Board of Trustees. Under the fund’s valuation policies and procedures, market quotations are not considered to be readily available for most types of debt instruments and floating rate loans and many types of derivatives. These investments are generally valued at fair value based on information from third-party pricing services. In addition, investments may be valued at fair value if the adviser determines that an investment’s value has been materially affected by events occurring after the close of the exchange or market on which the investment is principally traded (such as foreign exchange or market) and prior to the determination of the fund’s net asset value, or after the halting of trading of a specific security where trading does not resume prior to the close of the exchange or market on which the security is principally traded. Events that occur on a frequent basis after foreign markets close (such as developments in foreign markets and significant movements in the U.S. markets) and prior to the determination of the fund’s net asset value may be deemed to have a material effect on the value of securities traded in foreign markets. Accordingly, the fund’s foreign equity securities may often be
14
MFS Global Equity Series
Notes to Financial Statements – continued
valued at fair value. The adviser generally relies on third-party pricing services or other information (such as the correlation with price movements of similar securities in the same or other markets; the type, cost and investment characteristics of the security; the business and financial condition of the issuer; and trading and other market data) to assist in determining whether to fair value and at what value to fair value an investment. The value of an investment for purposes of calculating the fund’s net asset value can differ depending on the source and method used to determine value. When fair valuation is used, the value of an investment used to determine the fund’s net asset value may differ from quoted or published prices for the same investment. There can be no assurance that the fund could obtain the fair value assigned to an investment if it were to sell the investment at the same time at which the fund determines its net asset value per share.
Various inputs are used in determining the value of the fund’s assets or liabilities. These inputs are categorized into three broad levels. In certain cases, the inputs used to measure fair value may fall into different levels of the fair value hierarchy. In such cases, an investment’s level within the fair value hierarchy is based on the lowest level of input that is significant to the fair value measurement. The fund’s assessment of the significance of a particular input to the fair value measurement in its entirety requires judgment, and considers factors specific to the investment. Level 1 includes unadjusted quoted prices in active markets for identical assets or liabilities. Level 2 includes other significant observable market-based inputs (including quoted prices for similar securities, interest rates, prepayment speed, and credit risk). Level 3 includes unobservable inputs, which may include the adviser’s own assumptions in determining the fair value of investments. The following is a summary of the levels used as of December 31, 2014 in valuing the fund’s assets or liabilities:
| | | | | | | | | | | | | | | | |
| Investments at Value | | Level 1 | | | Level 2 | | | Level 3 | | | Total | |
| Equity Securities: | | | | | | | | | | | | | | | | |
United States | | | $31,900,270 | | | | $— | | | | $— | | | | $31,900,270 | |
United Kingdom | | | 462,161 | | | | 5,136,971 | | | | — | | | | 5,599,132 | |
Switzerland | | | 671,258 | | | | 4,017,368 | | | | — | | | | 4,688,626 | |
France | | | 106,303 | | | | 4,406,661 | | | | — | | | | 4,512,964 | |
Germany | | | 4,170,054 | | | | — | | | | — | | | | 4,170,054 | |
Netherlands | | | — | | | | 1,356,753 | | | | — | | | | 1,356,753 | |
Canada | | | 1,179,326 | | | | — | | | | — | | | | 1,179,326 | |
Japan | | | — | | | | 915,509 | | | | — | | | | 915,509 | |
Sweden | | | — | | | | 663,041 | | | | — | | | | 663,041 | |
Other Countries | | | 894,702 | | | | 1,881,948 | | | | — | | | | 2,776,650 | |
| Mutual Funds | | | 390,900 | | | | — | | | | — | | | | 390,900 | |
| Total Investments | | | $39,774,974 | | | | $18,378,251 | | | | $— | | | | $58,153,225 | |
For further information regarding security characteristics, see the Portfolio of Investments.
Of the level 2 investments presented above, equity investments amounting to $17,435,002 would have been considered level 1 investments at the beginning of the period. The primary reason for changes in the classifications between levels 1 and 2 occurs when foreign equity securities are fair valued using other observable market-based inputs in place of the closing exchange price due to events occurring after the close of the exchange or market on which the investment is principally traded. The fund’s foreign equity securities may often be valued at fair value. The fund’s policy is to recognize transfers between the levels as of the end of the period.
Foreign Currency Translation – Purchases and sales of foreign investments, income, and expenses are converted into U.S. dollars based upon currency exchange rates prevailing on the respective dates of such transactions or on the reporting date for foreign denominated receivables and payables. Gains and losses attributable to foreign currency exchange rates on sales of securities are recorded for financial statement purposes as net realized gains and losses on investments. Gains and losses attributable to foreign exchange rate movements on receivables, payables, income and expenses are recorded for financial statement purposes as foreign currency transaction gains and losses. That portion of both realized and unrealized gains and losses on investments that results from fluctuations in foreign currency exchange rates is not separately disclosed.
Security Loans – Under its Securities Lending Agency Agreement with the fund, State Street Bank and Trust Company (“State Street”), as lending agent, loans the securities of the fund to certain qualified institutions (the “Borrowers”) approved by the fund. The loans are collateralized by cash and/or U.S. Treasury and federal agency obligations in an amount typically at least equal to the market value of the securities loaned. On loans collateralized by cash, the cash collateral is invested in a money market fund. The market value of the loaned securities is determined at the close of business of the fund and any additional required collateral is delivered to the fund on the next business day. State Street provides the fund with indemnification against Borrower default. In the event of Borrower default, State Street will for the benefit of the fund either purchase securities identical to those loaned or, when such purchase is commercially impracticable, pay the fund the market value of the loaned securities. In return, State Street assumes the fund’s rights to the related collateral. If the collateral value is less than the cost to purchase identical securities, State Street is responsible for the shortfall, but only to the extent that such shortfall is not due to a decline in collateral value resulting from collateral reinvestment for which the fund bears the risk of loss. A portion of the income generated upon investment of the collateral
15
MFS Global Equity Series
Notes to Financial Statements – continued
is remitted to the Borrowers, and the remainder is allocated between the fund and the lending agent. On loans collateralized by U.S. Treasury and/or federal agency obligations, a fee is received from the Borrower, and is allocated between the fund and the lending agent. Income from securities lending is included in “Interest” income in the Statement of Operations. The dividend and interest income earned on the securities loaned is accounted for in the same manner as other dividend and interest income. At December 31, 2014, there were no securities on loan or collateral outstanding.
Indemnifications – Under the fund’s organizational documents, its officers and Trustees may be indemnified against certain liabilities and expenses arising out of the performance of their duties to the fund. Additionally, in the normal course of business, the fund enters into agreements with service providers that may contain indemnification clauses. The fund’s maximum exposure under these agreements is unknown as this would involve future claims that may be made against the fund that have not yet occurred.
Investment Transactions and Income – Investment transactions are recorded on the trade date. Interest income is recorded on the accrual basis. Dividends received in cash are recorded on the ex-dividend date. Certain dividends from foreign securities will be recorded when the fund is informed of the dividend if such information is obtained subsequent to the ex-dividend date. Dividend and interest payments received in additional securities are recorded on the ex-dividend or ex-interest date in an amount equal to the value of the security on such date.
The fund may receive proceeds from litigation settlements. Any proceeds received from litigation involving portfolio holdings are reflected in the Statement of Operations in realized gain/loss if the security has been disposed of by the fund or in unrealized gain/loss if the security is still held by the fund. Any other proceeds from litigation not related to portfolio holdings are reflected as other income in the Statement of Operations.
Fees Paid Indirectly – The fund’s custody fee may be reduced according to an arrangement that measures the value of cash deposited with the custodian by the fund. This amount, for the year ended December 31, 2014, is shown as a reduction of total expenses in the Statement of Operations.
Tax Matters and Distributions – The fund intends to qualify as a regulated investment company, as defined under Subchapter M of the Internal Revenue Code, and to distribute all of its taxable income, including realized capital gains. As a result, no provision for federal income tax is required. The fund’s federal tax returns, when filed, will remain subject to examination by the Internal Revenue Service for a three year period. Management has analyzed the fund’s tax positions taken on federal and state tax returns for all open tax years and does not believe that there are any uncertain tax positions that require recognition of a tax liability. Foreign taxes, if any, have been accrued by the fund in the accompanying financial statements in accordance with the applicable foreign tax law. Foreign income taxes may be withheld by certain countries in which the fund invests. Additionally, capital gains realized by the fund on securities issued in or by certain foreign countries may be subject to capital gains tax imposed by those countries.
Distributions to shareholders are recorded on the ex-dividend date. Income and capital gain distributions are determined in accordance with income tax regulations, which may differ from U.S. generally accepted accounting principles. Certain capital accounts in the financial statements are periodically adjusted for permanent differences in order to reflect their tax character. These adjustments have no impact on net assets or net asset value per share. Temporary differences which arise from recognizing certain items of income, expense, gain or loss in different periods for financial statement and tax purposes will reverse at some time in the future. Distributions in excess of net investment income or net realized gains are temporary overdistributions for financial statement purposes resulting from differences in the recognition or classification of income or distributions for financial statement and tax purposes.
Book/tax differences primarily relate to wash sale loss deferrals.
The tax character of distributions declared to shareholders for the last two fiscal years is as follows:
| | | | | | | | |
| | | 12/31/14 | | | 12/31/13 | |
| Ordinary income (including any short-term capital gains) | | | $674,837 | | | | $472,008 | |
| Long-term capital gain | | | 346,536 | | | | — | |
| Total distributions | | | $1,021,373 | | | | $472,008 | |
The federal tax cost and the tax basis components of distributable earnings were as follows:
| | | | |
| As of 12/31/14 | | | | |
| Cost of investments | | | $37,275,375 | |
| Gross appreciation | | | 21,844,461 | |
| Gross depreciation | | | (966,611 | ) |
| Net unrealized appreciation (depreciation) | | | $20,877,850 | |
| Undistributed ordinary income | | | 836,120 | |
| Undistributed long-term capital gain | | | 1,722,529 | |
| Other temporary differences | | | (12,504 | ) |
16
MFS Global Equity Series
Notes to Financial Statements – continued
Multiple Classes of Shares of Beneficial Interest – The fund offers multiple classes of shares, which differ in their respective distribution and/or service fees. The fund’s income, realized and unrealized gain (loss), and common expenses are allocated to shareholders based on the daily net assets of each class. Dividends are declared separately for each class. Differences in per share dividend rates are generally due to differences in separate class expenses. The fund’s distributions declared to shareholders as reported in the Statements of Changes in Net Assets are presented by class as follows:
| | | | | | | | | | | | | | | | |
| | | From net investment
income | | | From net realized gain on
investments | |
| | | Year ended
12/31/14 | | | Year ended
12/31/13 | | | Year ended
12/31/14 | | | Year ended
12/31/13 | |
| Initial Class | | | $386,822 | | | | $427,233 | | | | $527,323 | | | | $— | |
| Service Class | | | 37,066 | | | | 44,775 | | | | 70,162 | | | | — | |
| Total | | | $423,888 | | | | $472,008 | | | | $597,485 | | | | $— | |
| (3) | | Transactions with Affiliates |
Investment Adviser – The fund has an investment advisory agreement with MFS to provide overall investment management and related administrative services and facilities to the fund. The management fee is computed daily and paid monthly at the following annual rates:
| | | | |
| First $1 billion of average daily net assets | | | 1.00% | |
| Average daily net assets in excess of $1 billion | | | 0.90% | |
The investment adviser has agreed in writing to reduce its management fee to 0.90% of average daily net assets. This written agreement will continue until modified by the fund’s Board of Trustees, but such agreement will continue at least until April 30, 2016. For the year ended December 31, 2014, this management fee reduction amounted to $60,185, which is included in the reduction of total expenses in the Statement of Operations. MFS has also agreed in writing to reduce its management fee by a specified amount if certain MFS mutual fund assets exceed thresholds agreed to by MFS and the fund’s Board of Trustees. For the year ended December 31, 2014, this management fee reduction amounted to $2,772, which is included in the reduction of total expenses in the Statement of Operations. The management fee incurred for the year ended December 31, 2014 was equivalent to an annual effective rate of 0.90% of the fund’s average daily net assets.
The investment adviser has agreed in writing to pay a portion of the fund’s total annual operating expenses, excluding interest, taxes, extraordinary expenses, brokerage and transaction costs, and investment-related expenses, such that total annual operating expenses do not exceed 1.15% of average daily net assets for the Initial Class shares and 1.40% of average daily net assets for the Service Class shares. This written agreement expired on July 31, 2014. For the period January 1, 2014 through July 31, 2014, this reduction amounted to $6,726, which is included in the reduction of total expenses in the Statement of Operations. Effective August 1, 2014, the investment adviser has agreed in writing to pay a portion of the fund’s total annual operating expenses, excluding interest, taxes, extraordinary expenses, brokerage and transaction costs, and investment-related expenses, such that total annual operating expenses do not exceed 1.00% of average daily net assets for the Initial Class shares and 1.25% of average daily net assets for the Service Class shares. This written agreement will continue until modified by the fund’s Board of Trustees, but such agreement will continue at least until April 30, 2016. For the period August 1, 2014 through December 31, 2014, this reduction amounted to $43,670, which is included in the reduction of total expenses in the Statement of Operations.
Distributor – MFS Fund Distributors, Inc. (MFD), a wholly-owned subsidiary of MFS, is the distributor of shares of the fund. The Trustees have adopted a distribution plan for the Service Class shares pursuant to Rule 12b-1 under the Investment Company Act of 1940.
The fund’s distribution plan provides that the fund will pay MFD distribution and/or service fees equal to 0.25% per annum of its average daily net assets attributable to Service Class shares as partial consideration for services performed and expenses incurred by MFD and financial intermediaries (including participating insurance companies that invest in the fund to fund variable annuity and variable life insurance contracts, sponsors of qualified retirement and pension plans that invest in the fund, and affiliates of these participating insurance companies and plan sponsors) in connection with the sale and distribution of the Service Class shares. MFD may subsequently pay all, or a portion, of the distribution and/or service fees to financial intermediaries.
Shareholder Servicing Agent – MFS Service Center, Inc. (MFSC), a wholly-owned subsidiary of MFS, receives a fee from the fund for its services as shareholder servicing agent. For the year ended December 31, 2014, the fee was $16,527, which equated to 0.0275% annually of the fund’s average daily net assets. MFSC also receives payment from the fund for out-of-pocket expenses paid by MFSC on behalf of the fund. For the year ended December 31, 2014, these costs amounted to $320.
Administrator – MFS provides certain financial, legal, shareholder communications, compliance, and other administrative services to the fund. Under an administrative services agreement, the fund partially reimburses MFS the costs incurred to provide these services.
17
MFS Global Equity Series
Notes to Financial Statements – continued
The fund is charged an annual fixed amount of $17,500 plus a fee based on average daily net assets. The administrative services fee incurred for the year ended December 31, 2014 was equivalent to an annual effective rate of 0.0313% of the fund’s average daily net assets.
Trustees’ and Officers’ Compensation – The fund pays compensation to independent Trustees in the form of a retainer, attendance fees, and additional compensation to Board and Committee chairpersons. The fund does not pay compensation directly to Trustees or officers of the fund who are also officers of the investment adviser, all of whom receive remuneration for their services to the fund from MFS. Certain officers and Trustees of the fund are officers or directors of MFS, MFD, and MFSC.
Other – Effective November 1, 2014, this fund and certain other funds managed by MFS (the funds) have entered into a service agreement (the ISO Agreement) which provides for payment of fees solely by the funds to Tarantino LLC in return for the provision of services of an Independent Senior Officer (ISO) for the funds. Frank L. Tarantino serves as the ISO and is an officer of the funds and the sole member of Tarantino LLC. The funds can terminate the ISO Agreement with Tarantino LLC at any time under the terms of the ISO Agreement. Prior to November 1, 2014, the funds had entered into services agreements (the Compliance Officer Agreements) which provided for payment of fees by the funds to Tarantino LLC and Griffin Compliance LLC in return for the provision of services of an Independent Chief Compliance Officer (ICCO) and Assistant ICCO, respectively, for the funds. Prior to November 1, 2014, Frank L. Tarantino served as the ICCO. Effective October 31, 2014, Mr. Tarantino resigned as ICCO and the Compliance Officer Agreement between the funds and Tarantino LLC was terminated. Prior to June 1, 2014, Robyn L. Griffin served as the Assistant ICCO and was an officer of the funds. Ms. Griffin is the sole member of Griffin Compliance LLC. Effective May 31, 2014, Ms. Griffin resigned as Assistant ICCO and the Compliance Officer Agreement between the funds and Griffin Compliance LLC was terminated. For the year ended December 31, 2014, the aggregate fees paid by the fund under these agreements were $267 and are included in “Miscellaneous” expense in the Statement of Operations. MFS had agreed to reimburse the fund for a portion of the payments made by the fund for the services under the Compliance Officer Agreements in the amount of $105, which is included in the reduction of total expenses in the Statement of Operations. Additionally, MFS has agreed to bear all expenses associated with office space, other administrative support, and supplies provided to the ICCO, Assistant ICCO, and ISO.
The fund invests in the MFS Institutional Money Market Portfolio which is managed by MFS and seeks current income consistent with preservation of capital and liquidity. Income earned on this investment is included in “Dividends from underlying affiliated funds” in the Statement of Operations. This money market fund does not pay a management fee to MFS.
For the year ended December 31, 2014, purchases and sales of investments, other than short-term obligations, aggregated $8,953,215 and $13,414,652, respectively.
| (5) | | Shares of Beneficial Interest |
The fund’s Declaration of Trust permits the Trustees to issue an unlimited number of full and fractional shares of beneficial interest. Transactions in fund shares were as follows:
| | | | | | | | | | | | | | | | |
| | | Year ended 12/31/14 | | | Year ended 12/31/13 | |
| | | Shares | | | Amount | | | Shares | | | Amount | |
| Shares sold | | | | | | | | | | | | | | | | |
Initial Class | | | 441,453 | | | | $8,518,356 | | | | 1,080,417 | | | | $18,196,735 | |
Service Class | | | 152,649 | | | | 2,923,655 | | | | 209,654 | | | | 3,549,138 | |
| | | 594,102 | | | | $11,442,011 | | | | 1,290,071 | | | | $21,745,873 | |
| Shares issued to shareholders in reinvestment of distributions | | | | | | | | | | | | | | | | |
Initial Class | | | 46,759 | | | | $914,145 | | | | 24,710 | | | | $427,233 | |
Service Class | | | 5,507 | | | | 107,228 | | | | 2,597 | | | | 44,775 | |
| | | 52,266 | | | | $1,021,373 | | | | 27,307 | | | | $472,008 | |
| Shares reacquired | | | | | | | | | | | | | | | | |
Initial Class | | | (671,843 | ) | | | $(12,966,190 | ) | | | (1,013,492 | ) | | | $(17,180,166 | ) |
Service Class | | | (190,527 | ) | | | (3,648,690 | ) | | | (118,247 | ) | | | (2,043,071 | ) |
| | | (862,370 | ) | | | $(16,614,880 | ) | | | (1,131,739 | ) | | | $(19,223,237 | ) |
| Net change | | | | | | | | | | | | | | | | |
Initial Class | | | (183,631 | ) | | | $(3,533,689 | ) | | | 91,635 | | | | $1,443,802 | |
Service Class | | | (32,371 | ) | | | (617,807 | ) | | | 94,004 | | | | 1,550,842 | |
| | | (216,002 | ) | | | $(4,151,496 | ) | | | 185,639 | | | | $2,994,644 | |
18
MFS Global Equity Series
Notes to Financial Statements – continued
The fund and certain other funds managed by MFS participate in a $1.1 billion unsecured committed line of credit, subject to a $1 billion sublimit, provided by a syndication of banks under a credit agreement. Borrowings may be made for temporary financing needs. Interest is charged to each fund, based on its borrowings, generally at a rate equal to the higher of the Federal Reserve funds rate or one month LIBOR plus an agreed upon spread. A commitment fee, based on the average daily, unused portion of the committed line of credit, is allocated among the participating funds at the end of each calendar quarter. In addition, the fund and other funds managed by MFS have established unsecured uncommitted borrowing arrangements with certain banks for temporary financing needs. Interest is charged to each fund, based on its borrowings, at a rate equal to the Federal Reserve funds rate plus an agreed upon spread. For the year ended December 31, 2014, the fund’s commitment fee and interest expense were $223 and $0, respectively, and are included in “Miscellaneous” expense in the Statement of Operations.
| (7) | | Transactions in Underlying Affiliated Funds – Affiliated Issuers |
An affiliated issuer may be considered one in which the fund owns 5% or more of the outstanding voting securities, or a company which is under common control. For the purposes of this report, the fund assumes the following to be an affiliated issuer:
| | | | | | | | | | | | | | | | |
| Underlying Affiliated Fund | | Beginning
Shares/Par
Amount | | | Acquisitions
Shares/Par
Amount | | | Dispositions
Shares/Par
Amount | | | Ending
Shares/Par
Amount | |
| MFS Institutional Money Market Portfolio | | | 168,568 | | | | 13,471,261 | | | | (13,248,929 | ) | | | 390,900 | |
| | | | |
| Underlying Affiliated Fund | | Realized
Gain (Loss) | | | Capital Gain
Distributions | | | Dividend
Income | | | Ending
Value | |
| MFS Institutional Money Market Portfolio | | | $— | | | | $— | | | | $398 | | | | $390,900 | |
19
MFS Global Equity Series
REPORT OF INDEPENDENT REGISTERED PUBLIC ACCOUNTING FIRM
To the Board of Trustees of MFS Variable Insurance Trust and the Shareholders of MFS Global Equity Series:
We have audited the accompanying statement of assets and liabilities, including the portfolio of investments, of MFS Global Equity Series (one of the series of MFS Variable Insurance Trust) (the “Fund”) as of December 31, 2014, and the related statement of operations for the year then ended, the statements of changes in net assets for each of the two years in the period then ended, and the financial highlights for each of the five years in the period then ended. These financial statements and financial highlights are the responsibility of the Fund’s management. Our responsibility is to express an opinion on these financial statements and financial highlights based on our audits.
We conducted our audits in accordance with the standards of the Public Company Accounting Oversight Board (United States). Those standards require that we plan and perform the audit to obtain reasonable assurance about whether the financial statements and financial highlights are free of material misstatement. The Fund is not required to have, nor were we engaged to perform, an audit of its internal control over financial reporting. Our audits included consideration of internal control over financial reporting as a basis for designing audit procedures that are appropriate in the circumstances, but not for the purpose of expressing an opinion on the effectiveness of the Fund’s internal control over financial reporting. Accordingly, we express no such opinion. An audit also includes examining, on a test basis, evidence supporting the amounts and disclosures in the financial statements, assessing the accounting principles used and significant estimates made by management, as well as evaluating the overall financial statement presentation. Our procedures included confirmation of securities owned as of December 31, 2014, by correspondence with the custodian and brokers; where replies were not received from brokers, we performed other auditing procedures. We believe that our audits provide a reasonable basis for our opinion.
In our opinion, the financial statements and financial highlights referred to above present fairly, in all material respects, the financial position of MFS Global Equity Series as of December 31, 2014, the results of its operations for the year then ended, the changes in its net assets for each of the two years in the period then ended, and the financial highlights for each of the five years in the period then ended, in conformity with accounting principles generally accepted in the United States of America.
DELOITTE & TOUCHE LLP
Boston, Massachusetts
February 13, 2015
20
MFS Global Equity Series
TRUSTEES AND OFFICERS – IDENTIFICATION AND BACKGROUND
The Trustees and Officers of the Trust, as of February 1, 2015, are listed below, together with their principal occupations during the past five years. (Their titles may have varied during that period.) The address of each Trustee and Officer is 111 Huntington Avenue, Boston, Massachusetts 02199-7618.
| | | | | | | | |
Name, Age | | Position(s)
Held with Fund | | Trustee/Officer
Since (h) | | Principal Occupations
During the Past Five Years | | Other Directorships (j) |
| INTERESTED TRUSTEES |
Robert J. Manning (k) (age 51) | | Trustee | | February 2004 | | Massachusetts Financial Services Company, Chairman, Co-Chief Executive Officer and Director; President (until 2009); Chief Investment Officer (until 2010) | | N/A |
| | | | |
Robin A. Stelmach (k) (age 53) | | Trustee and President | | January 2014 | | Massachusetts Financial Services Company, Executive Vice President and Chief Operating Officer | | N/A |
| | | |
| INDEPENDENT TRUSTEES | | | | | | |
David H. Gunning (age 72) | | Trustee and Chair of Trustees | | January 2004 | | Private investor | | Lincoln Electric Holdings, Inc. (welding equipment manufacturer), Director; Development Alternatives, Inc. (consulting), Director/Non-Executive Chairman |
| | | | |
Steven E. Buller (age 63) | | Trustee | | February 2014 | | Chairman, Financial Accounting Standards Advisory Council; Standing Advisory Group, Public Company Accounting Oversight Board, Member (until 2014); BlackRock, Inc. (investment management), Managing Director (until 2014), BlackRock Finco UK (investment management), Director (until 2014) | | N/A |
| | | | |
Robert E. Butler (age 73) | | Trustee | | January 2006 | | Consultant – investment company industry regulatory and compliance matters | | N/A |
| | | | |
Maureen R. Goldfarb (age 59) | | Trustee | | January 2009 | | Private investor | | N/A |
| | | | |
William R. Gutow (age 73) | | Trustee | | December 1993 | | Private investor and real estate consultant; Capitol Entertainment Management Company (video franchise), Vice Chairman | | Texas Donuts (donut franchise), Vice Chairman (until 2010) |
| | | | |
Michael Hegarty (age 70) | | Trustee | | December 2004 | | Private investor | | Brookfield Office Properties, Inc. (real estate), Director; Rouse Properties Inc. (real estate), Director; Capmark Financial Group Inc. (real estate), Director |
| | | | |
John P. Kavanaugh (age 60) | | Trustee | | January 2009 | | Private investor | | N/A |
| | | | |
Maryanne L. Roepke (age 58) | | Trustee | | May 2014 | | American Century Investments (investment management), Senior Vice President and Chief Compliance Officer (until 2014) | | N/A |
| | | | |
Laurie J. Thomsen (age 57) | | Trustee | | March 2005 | | Private investor; New Profit, Inc. (venture philanthropy), Executive Partner (until 2010) | | The Travelers Companies (insurance), Director |
| | | | |
Robert W. Uek (age 73) | | Trustee | | January 2006 | | Consultant to investment company industry | | N/A |
| | | | |
| OFFICERS | | | | | | | | |
Christopher R. Bohane (k) (age 41) | | Assistant Secretary and Assistant Clerk | | July 2005 | | Massachusetts Financial Services Company, Vice President and Assistant General Counsel | | N/A |
| | | | |
Kino Clark (k) (age 46) | | Assistant Treasurer | | January 2012 | | Massachusetts Financial Services Company, Vice President | | N/A |
| | | | |
Thomas H. Connors (k) (age 55) | | Assistant Secretary and Assistant Clerk | | September 2012 | | Massachusetts Financial Services Company, Vice President and Senior Counsel; Deutsche Investment Management Americas Inc. (financial service provider), Director and Senior Counsel (until 2012) | | N/A |
21
MFS Global Equity Series
Trustees and Officers – continued
| | | | | | | | |
Name, Age | | Position(s)
Held with Fund | | Trustee/Officer
Since (h) | | Principal Occupations
During the Past Five Years | | Other Directorships (j) |
Ethan D. Corey (k) (age 51) | | Assistant
Secretary and Assistant Clerk | | July 2005 | | Massachusetts Financial Services Company, Senior Vice President and Associate General Counsel | | N/A |
| | | | |
David L. DiLorenzo (k) (age 46) | | Treasurer | | July 2005 | | Massachusetts Financial Services Company, Senior Vice President | | N/A |
| | | | |
Timothy M. Fagan (k) (age 46) | | Chief Compliance Officer | | November 2014 | | Massachusetts Financial Services Company, Chief Compliance Officer; Vice President and Senior Counsel (until 2012) | | N/A |
| | | | |
Brian E. Langenfeld (k) (age 41) | | Assistant
Secretary and Assistant Clerk | | June 2006 | | Massachusetts Financial Services Company, Vice President and Senior Counsel | | N/A |
| | | | |
Susan S. Newton (k) (age 64) | | Assistant
Secretary and Assistant Clerk | | May 2005 | | Massachusetts Financial Services Company, Senior Vice President and Associate General Counsel | | N/A |
| | | | |
Susan A. Pereira (k) (age 44) | | Assistant
Secretary and Assistant Clerk | | July 2005 | | Massachusetts Financial Services Company, Vice President and Senior Counsel | | N/A |
| | | | |
Kasey L. Phillips (k) (age 44) | | Assistant Treasurer | | September 2012 | | Massachusetts Financial Services Company, Vice President; Wells Fargo Funds Management, LLC, Senior Vice President, Fund Treasurer (until 2012) | | N/A |
| | | | |
Mark N. Polebaum (k) (age 62) | | Secretary and
Clerk | | January 2006 | | Massachusetts Financial Services Company, Executive Vice President, General Counsel and Secretary | | N/A |
| | | | |
Matthew A. Stowe (k) (age 40) | | Assistant Secretary and Assistant Clerk | | October 2014 | | Massachusetts Financial Services Company, Vice President and Senior Counsel | | N/A |
| | | | |
Frank L. Tarantino (age 70) | | Independent
Senior Officer | | June 2004 | | Tarantino LLC (provider of compliance services), Principal | | N/A |
| | | | |
Richard S. Weitzel (k) (age 44) | | Assistant Secretary and Assistant Clerk | | October 2007 | | Massachusetts Financial Services Company, Senior Vice President and Associate General Counsel | | N/A |
| | | | |
James O. Yost (k) (age 54) | | Deputy Treasurer | | September 1990 | | Massachusetts Financial Services Company, Senior Vice President | | N/A |
| (h) | Date first appointed to serve as Trustee/officer of an MFS Fund. Each Trustee has served continuously since appointment unless indicated otherwise. For the period from December 15, 2004 until February 22, 2005, Mr. Manning served as Advisory Trustee. Prior to January 2012, Messrs. DiLorenzo and Yost served as Assistant Treasurers of the Funds. Ms. Stelmach was appointed as President of the Funds as of October 1, 2014. |
| (j) | Directorships or trusteeships of companies required to report to the Securities and Exchange Commission (i.e., “public companies”). |
| (k) | “Interested person” of the Trust within the meaning of the Investment Company Act of 1940 (referred to as the 1940 Act), which is the principal federal law governing investment companies like the fund, as a result of a position with MFS. The address of MFS is 111 Huntington Avenue, Boston, Massachusetts 02199-7618. |
Each Trustee (except Ms. Stelmach, Mr. Buller and Ms. Roepke) has been elected by shareholders and each Trustee and officer holds office until his or her successor is chosen and qualified or until his or her earlier death, resignation, retirement or removal. The Trust does not hold annual meetings for the purpose of electing Trustees, and Trustees are not elected for fixed terms. Messrs. Butler, Kavanaugh, Uek and Mses. Thomsen and Roepke are members of the Trust’s Audit Committee.
Each of the Fund’s Trustees and officers holds comparable positions with certain other funds of which MFS or a subsidiary is the investment adviser or distributor, and, in the case of the officers, with certain affiliates of MFS. As of February 1, 2015, the Trustees served as board members of 135 funds within the MFS Family of Funds.
22
MFS Global Equity Series
Trustees and Officers – continued
The Statement of Additional Information for the Fund includes further information about the Trustees and is available without charge upon request by calling 1-800-225-2606.
| | |
Investment Adviser Massachusetts Financial Services Company 111 Huntington Avenue Boston, MA 02199-7618 | | Custodian State Street Bank and Trust Company 1 Lincoln Street Boston, MA 02111-2900 |
Distributor MFS Fund Distributors, Inc. 111 Huntington Avenue Boston, MA 02199-7618 | | Independent Registered Public Accounting Firm Deloitte & Touche LLP 200 Berkeley Street Boston, MA 02116 |
Portfolio Managers David Mannheim Roger Morley | | |
23
MFS Global Equity Series
BOARD REVIEW OF INVESTMENT ADVISORY AGREEMENT
The Investment Company Act of 1940 requires that both the full Board of Trustees and a majority of the non-interested (“independent”) Trustees, voting separately, annually approve the continuation of the Fund’s investment advisory agreement with MFS. The Trustees consider matters bearing on the Fund and its advisory arrangements at their meetings throughout the year, including a review of performance data at each regular meeting. In addition, the independent Trustees met several times over the course of three months beginning in May and ending in July, 2014 (“contract review meetings”) for the specific purpose of considering whether to approve the continuation of the investment advisory agreement for the Fund and the other investment companies that the Board oversees (the “MFS Funds”). The independent Trustees were assisted in their evaluation of the Fund’s investment advisory agreement by independent legal counsel, from whom they received separate legal advice and with whom they met separately from MFS during various contract review meetings. The independent Trustees were also assisted in this process by the MFS Funds’ Independent Chief Compliance Officer, a full-time senior officer appointed by and reporting to the independent Trustees.
In connection with their deliberations regarding the continuation of the investment advisory agreement, the Trustees, including the independent Trustees, considered such information and factors as they believed, in light of the legal advice furnished to them and their own business judgment, to be relevant. The investment advisory agreement for the Fund was considered separately, although the Trustees also took into account the common interests of all MFS Funds in their review. As described below, the Trustees considered the nature, quality, and extent of the various investment advisory, administrative, and shareholder services performed by MFS under the existing investment advisory agreement and other arrangements with the Fund.
In connection with their contract review meetings, the Trustees received and relied upon materials that included, among other items: (i) information provided by Lipper Inc., an independent third party, on the investment performance of the Fund for various time periods ended December 31, 2013 and the investment performance of a group of funds with substantially similar investment classifications/objectives (the “Lipper performance universe”), (ii) information provided by Lipper Inc. on the Fund’s advisory fees and other expenses and the advisory fees and other expenses of comparable funds identified by Lipper Inc. (the “Lipper expense group”), (iii) information provided by MFS on the advisory fees of comparable portfolios of other clients of MFS, including institutional separate accounts and other clients, (iv) information as to whether and to what extent applicable expense waivers, reimbursements or fee “breakpoints” are observed for the Fund, (v) information regarding MFS’ financial results and financial condition, including MFS’ and certain of its affiliates’ estimated profitability from services performed for the Fund and the MFS Funds as a whole, and compared to MFS’ institutional business, (vi) MFS’ views regarding the outlook for the mutual fund industry and the strategic business plans of MFS, (vii) descriptions of various functions performed by MFS for the Funds, such as compliance monitoring and portfolio trading practices, and (viii) information regarding the overall organization of MFS, including information about MFS’ senior management and other personnel providing investment advisory, administrative and other services to the Fund and the other MFS Funds. The comparative performance, fee and expense information prepared and provided by Lipper Inc. was not independently verified and the independent Trustees did not independently verify any information provided to them by MFS.
The Trustees’ conclusion as to the continuation of the investment advisory agreement was based on a comprehensive consideration of all information provided to the Trustees and not the result of any single factor. Some of the factors that figured particularly in the Trustees’ deliberations are described below, although individual Trustees may have evaluated the information presented differently from one another, giving different weights to various factors. It is also important to recognize that the fee arrangements for the Fund and other MFS Funds are the result of years of review and discussion between the independent Trustees and MFS, that certain aspects of such arrangements may receive greater scrutiny in some years than in others, and that the Trustees’ conclusions may be based, in part, on their consideration of these same arrangements during the course of the year and in prior years.
Based on information provided by Lipper Inc. and MFS, the Trustees reviewed the Fund’s total return investment performance as well as the performance of peer groups of funds over various time periods. The Trustees placed particular emphasis on the total return performance of the Fund’s Initial Class shares in comparison to the performance of funds in its Lipper performance universe over the three-year period ended December 31, 2013, which the Trustees believed was a long enough period to reflect differing market conditions. The total return performance of the Fund’s Initial Class shares was in the 1st quintile relative to the other funds in the universe for this three-year period (the 1st quintile being the best performers and the 5th quintile being the worst performers). The total return performance of the Fund’s Initial Class shares was in the 2nd quintile for each of the one- and five-year periods ended December 31, 2013 relative to the Lipper performance universe. Because of the passage of time, these performance results may differ from the performance results for more recent periods, including those shown elsewhere in this report.
In the course of their deliberations, the Trustees took into account information provided by MFS in connection with the contract review meetings, as well as during investment review meetings conducted with portfolio management personnel during the course of the year regarding the Fund’s performance. After reviewing these and related factors, the Trustees concluded, within the context of their overall conclusions regarding the investment advisory agreement, that they were satisfied with MFS’ responses and efforts relating to investment performance.
24
MFS Global Equity Series
Board Review of Investment Advisory Agreement – continued
In assessing the reasonableness of the Fund’s advisory fee, the Trustees considered, among other information, the Fund’s advisory fee and the total expense ratio of the Fund’s Initial Class shares as a percentage of average daily net assets and the advisory fee and total expense ratios of peer groups of funds based on information provided by Lipper Inc. The Trustees considered that MFS has agreed in writing to reduce its advisory fee on average daily net assets up to $1 billion, which may not be changed without the Trustees’ approval. The Trustees also considered that MFS currently observes an expense limitation for the Fund, and that MFS has agreed to further reduce such expense limitation for the fund, which may not be changed without the Trustees’ approval. The Trustees considered that, according to the Lipper data (which takes into account any fee reductions or expense limitations that were in effect during the Fund’s last fiscal year), the Fund’s effective advisory fee rate and total expense ratio were each higher than the Lipper expense group median.
The Trustees also considered the advisory fees charged by MFS to any comparable institutional accounts. In comparing these fees, the Trustees considered information provided by MFS as to the generally broader scope of services provided by MFS to the Fund in comparison to institutional accounts, the higher demands placed on MFS’ investment personnel and trading infrastructure as a result of the daily cash in-flows and out-flows of the Fund, and the impact on MFS and expenses associated with the more extensive regulatory regime to which the Fund is subject in comparison to institutional accounts.
The Trustees also considered whether the Fund may benefit from any economies of scale in the management of the Fund in the event of growth in assets of the Fund and/or growth in assets of the MFS Funds as a whole. They noted that the Fund’s advisory fee rate schedule is subject to a contractual breakpoint that reduces the Fund’s advisory fee rate on average daily net assets over $1 billion. However, such breakpoint is not applicable because the Fund is currently subject to the advisory fee reduction described above. Accordingly, the Trustees determined not to recommend any advisory fee breakpoint changes at this time. The Trustees also noted that MFS has agreed in writing to waive a portion of the management fees of certain MFS Funds, including the Fund, if the total combined assets of certain funds within the MFS Funds’ complex increase above agreed upon thresholds (the “group fee waiver”), enabling the Fund’s shareholders to share in the benefits from any economies of scale at the complex level. The group fee waiver is reviewed and renewed annually between the Board and MFS. The Trustees concluded that the breakpoint and the group fee waiver were sufficient to allow the Fund to benefit from economies of scale as its assets and overall complex assets grow.
The Trustees also considered information prepared by MFS relating to MFS’ costs and profits with respect to the Fund, the MFS Funds considered as a group, and other investment companies and accounts advised by MFS, as well as MFS’ methodologies used to determine and allocate its costs to the MFS Funds, the Fund and other accounts and products for purposes of estimating profitability.
After reviewing these and other factors described herein, the Trustees concluded, within the context of their overall conclusions regarding the investment advisory agreement, that the advisory fees charged to the Fund represent reasonable compensation in light of the services being provided by MFS to the Fund.
In addition, the Trustees considered MFS’ resources and related efforts to continue to retain, attract and motivate capable personnel to serve the Fund. The Trustees also considered current and developing conditions in the financial services industry, including the presence of large and well-capitalized companies which are spending, and appear to be prepared to continue to spend, substantial sums to engage personnel and to provide services to competing investment companies. In this regard, the Trustees also considered the financial resources of MFS and its ultimate parent, Sun Life Financial Inc. The Trustees also considered the advantages and possible disadvantages to the Fund of having an adviser that also serves other investment companies as well as other accounts.
The Trustees also considered the nature, quality, cost, and extent of administrative, transfer agency, and distribution services provided to the Fund by MFS and its affiliates under agreements and plans other than the investment advisory agreement, including any 12b-1 fees the Fund pays to MFS Fund Distributors, Inc., an affiliate of MFS. The Trustees also considered the nature, extent and quality of certain other services MFS performs or arranges for on the Fund’s behalf, which may include securities lending programs, directed expense payment programs, class action recovery programs, and MFS’ interaction with third-party service providers, principally custodians and sub-custodians. The Trustees concluded that the various non-advisory services provided by MFS and its affiliates on behalf of the Fund were satisfactory.
The Trustees also considered benefits to MFS from the use of the Fund’s portfolio brokerage commissions, if applicable, to pay for investment research and various other factors. Additionally, the Trustees considered so-called “fall-out benefits” to MFS such as reputational value derived from serving as investment manager to the Fund.
Based on their evaluation of factors that they deemed to be material, including those factors described above, the Board of Trustees, including the independent Trustees, concluded that the Fund’s investment advisory agreement with MFS should be continued for an additional one-year period, commencing August 1, 2014.
25
MFS Global Equity Series
PROXY VOTING POLICIES AND INFORMATION
MFS votes proxies on behalf of the fund pursuant to proxy voting policies and procedures that are available without charge, upon request, by calling 1-800-225-2606, by visiting the Proxy Voting section of mfs.com or by visiting the SEC’s Web site at http://www.sec.gov.
Information regarding how the fund voted proxies relating to portfolio securities during the most recent twelve-month period ended June 30 is available without charge by visiting the Proxy Voting section of mfs.com or by visiting the SEC’s Web site at http://www.sec.gov.
QUARTERLY PORTFOLIO DISCLOSURE
The fund will file a complete schedule of portfolio holdings with the Securities and Exchange Commission (the Commission) for the first and third quarters of each fiscal year on Form N-Q. The fund’s Form N-Q is available on the EDGAR database on the Commission’s Internet Web site at http://www.sec.gov, and may be reviewed and copied at the:
Public Reference Room
Securities and Exchange Commission
100 F Street, NE, Room 1580
Washington, D.C. 20549
Information on the operation of the Public Reference Room may be obtained by calling the Commission at 1-800-SEC-0330. Copies of the fund’s Form N-Q also may be obtained, upon payment of a duplicating fee, by electronic request at the following e-mail address: publicinfo@sec.gov or by writing the Public Reference Section at the above address.
FURTHER INFORMATION
From time to time, MFS may post important information about the fund or the MFS funds on the MFS web site (mfs.com). This information is available by visiting the “Market Commentary” and “Announcements” sub sections in the “Market Outlooks” section of mfs.com or by clicking on the fund’s name under “Variable Insurance Portfolios — VIT” in the “Products” section of mfs.com.
FEDERAL TAX INFORMATION (unaudited)
The following information is provided pursuant to provisions of the Internal Revenue Code.
The fund designates $382,000 as capital gain dividends paid during the fiscal year.
For corporate shareholders, 54.96% of the ordinary income dividends paid during the fiscal year qualify for the corporate dividends received deduction.
Income derived from foreign sources was $762,699. The fund intends to pass through foreign tax credits of $63,168 for the fiscal year.
26
rev. 3/11
| | | | |
| FACTS | | WHAT DOES MFS DO WITH YOUR
PERSONAL INFORMATION? | |  |
| | |
| Why? | | Financial companies choose how they share your personal information. Federal law gives consumers the right to limit some but not all sharing. Federal law also requires us to tell you how we collect, share, and protect your personal information. Please read this notice carefully to understand what we do. |
| | |
| What? | | The types of personal information we collect and share depend on the product or service you have with us. This information can include: • Social Security number and account balances • Account transactions and transaction history • Checking account information and wire transfer instructions When you are no longer our customer, we continue to share your information as described in this notice. |
| | |
| How? | | All financial companies need to share customers’ personal information to run their everyday business. In the section below, we list the reasons financial companies can share their customers’ personal information; the reasons MFS chooses to share; and whether you can limit this sharing. |
| | | | |
Reasons we can share your
personal information | | Does MFS share? | | Can you limit this
sharing? |
For our everyday business purposes – such as to process your transactions, maintain your account(s), respond to court orders and legal investigations, or report to credit bureaus | | Yes | | No |
For our marketing purposes – to offer our products and services to you | | No | | We don’t share |
| For joint marketing with other financial companies | | No | | We don’t share |
For our affiliates’ everyday business purposes – information about your transactions and experiences | | No | | We don’t share |
For our affiliates’ everyday business purposes – information about your creditworthiness | | No | | We don’t share |
| For nonaffiliates to market to you | | No | | We don’t share |
| | |
| Questions? | | Call 800-225-2606 or go to mfs.com. |
27
| | |
| Who we are |
| Who is providing this notice? | | MFS Funds, MFS Investment Management, MFS Institutional Advisors, Inc., MFS Fund Distributors, Inc., MFS Heritage Trust Company, and MFS Service Center, Inc. |
| | |
| What we do |
| How does MFS protect my personal information? | | To protect your personal information from unauthorized access and use, we use security measures that comply with federal law. These measures include procedural, electronic, and physical safeguards for the protection of the personal information we collect about you. |
How does MFS
collect my personal information? | | We collect your personal information, for example, when you • open an account or provide account information • direct us to buy securities or direct us to sell your securities • make a wire transfer We also collect your personal information from others, such as credit bureaus, affiliates and other companies. |
| Why can’t I limit all sharing? | | Federal law gives you the right to limit only • sharing for affiliates’ everyday business purposes – information about your creditworthiness • affiliates from using your information to market to you • sharing for nonaffiliates to market to you State laws and individual companies may give you additional rights to limit sharing. |
| | |
| Definitions |
| Affiliates | | Companies related by common ownership or control. They can be financial and nonfinancial companies. •MFS does not share personal information with affiliates, except for everyday business purposes as described on page one of this notice. |
| Nonaffiliates | | Companies not related by common ownership or control. They can be financial and nonfinancial companies. •MFS does not share with nonaffiliates so they can market to you. |
| Joint Marketing | | A formal agreement between nonaffiliated financial companies that together market financial products or services to you. •MFS doesn’t jointly market. |
| | |
| Other important information |
| If you own an MFS product or receive an MFS service in the name of a third party such as a bank or broker-dealer, their privacy policy may apply to you instead of ours. |
28
ANNUAL REPORT
December 31, 2014

MFS® GROWTH SERIES
MFS® Variable Insurance Trust

VEG-ANN
MFS® GROWTH SERIES
CONTENTS
The report is prepared for the general information of contract owners. It is authorized for distribution to prospective investors only when preceded or accompanied by a current prospectus.
NOT FDIC INSURED Ÿ MAY LOSE VALUE Ÿ NO BANK OR CREDIT UNION GUARANTEE Ÿ NOT A DEPOSIT Ÿ NOT INSURED BY ANY FEDERAL GOVERNMENT AGENCY OR NCUA/NCUSIF
MFS Growth Series
LETTER FROM THE CHAIRMAN

Dear Contract Owners:
As 2015 begins, sharply lower oil prices are reshaping the global economy, adding to deflationary pressures in the eurozone and exacerbating challenges faced by oil exporters such as Russia. The U.S. economy stands on firmer ground, having expanded steadily over the past year. The U.S. labor market has regained momentum, consumer confidence is buoyant and gasoline prices have tumbled, boosting prospects for a stronger economic rebound in 2015.
Other regions are struggling. The eurozone economy is barely expanding, and the European Central Bank (ECB) has introduced large-scale asset purchases.
Despite Japan’s efforts to strengthen its economy, its sales tax increase last spring tipped the country into a recession, leading to additional monetary stimulus from the Bank of Japan. China’s economy is slowing as it transitions to a more sustainable basis, and its growth rate will likely continue to decline.
As always, active risk management is integral to how we at MFS® manage your investments. We use a collaborative process, sharing insights across asset classes, regions and economic sectors. Our global investment team uses a diversified, multidisciplined, long-term approach.
Applying proven principles, such as asset allocation and diversification, can best serve investors over the long term. We are confident that this approach can help you as you work with your financial advisors to reach your goals in the years ahead.
Respectfully,

Robert J. Manning
Chairman
MFS Investment Management
February 13, 2015
The opinions expressed in this letter are subject to change and may not be relied upon for investment advice. No forecasts can be guaranteed.
1
MFS Growth Series
PORTFOLIO COMPOSITION
Portfolio structure
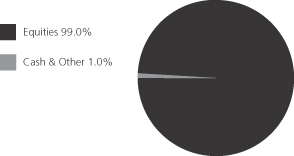
| | | | |
| Top ten holdings | | | | |
| Visa, Inc., “A” | | | 3.3% | |
| Apple, Inc. | | | 3.3% | |
| Facebook, Inc., “A” | | | 2.5% | |
| Google, Inc., “A” | | | 2.4% | |
| Danaher Corp. | | | 2.4% | |
| MasterCard, Inc., “A” | | | 2.3% | |
| Thermo Fisher Scientific, Inc. | | | 2.2% | |
| Google, Inc., “C” | | | 2.2% | |
| Actavis PLC | | | 2.0% | |
| American Tower Corp., REIT | | | 2.0% | |
| | | | |
| Equity sectors | | | | |
| Health Care | | | 20.6% | |
| Technology | | | 19.0% | |
| Retailing | | | 12.2% | |
| Financial Services | | | 11.0% | |
| Leisure | | | 9.4% | |
| Industrial Goods & Services | | | 6.9% | |
| Special Products & Services | | | 5.1% | |
| Consumer Staples | | | 4.9% | |
| Energy | | | 2.6% | |
| Utilities & Communications | | | 2.0% | |
| Transportation | | | 1.9% | |
| Basic Materials | | | 1.7% | |
| Autos & Housing | | | 1.7% | |
Cash & Other can include cash, other assets less liabilities, offsets to derivative positions, and short-term securities.
Percentages are based on net assets as of 12/31/14.
The portfolio is actively managed and current holdings may be different.
2
MFS Growth Series
MANAGEMENT REVIEW
Summary of Results
For the twelve months ended December 31, 2014, Initial Class shares of the MFS Growth Series (“fund”) provided a total return of 8.94%, while Service Class shares of the fund provided a total return of 8.68%. These compare with a return of 13.05% over the same period for the fund’s benchmark, the Russell 1000 Growth Index.
Market Environment
Early in the period, US equities suffered what proved to be a temporary setback due to concerns over emerging markets as well as what was perceived at the time to be a pause in US economic growth, partially caused by extreme weather events and a weak December 2013 labor market report. Markets soon recovered as the economic pause concluded and investors appeared to have become increasingly comfortable that newly-installed US Federal Reserve (“Fed”) Chair Janet Yellen would not make any substantial changes to the trajectory of Fed monetary policy.
A generally risk-friendly, carry trade environment persisted from February 2014 until mid-year. While geopolitical tensions flared in the Middle East and Russia/Ukraine, any market setbacks were short-lived as improving economic growth in the US, coupled with prospects for easier monetary policy in regions with slowing growth, such as Japan, Europe and China, supported risk assets. For example, the European Central Bank (“ECB”) cut policy interest rates into negative territory and, by the end of the period, expectations were for additional rate cuts and the announcement for non-conventional easing measures. Similarly, the Bank of Japan surprised markets late in the period with fresh stimulus measures given lackluster growth trends. The related decline in developed market government bond yields and credit spreads were also supportive for equity markets. At the end of the period, the US equity market was trading close to all-time highs and US Treasury yields were close to their lows for the period. However, credit markets did not fare as well in the second half of 2014, particularly US high yield and emerging market debt. The higher weightings of oil and gas credits in these asset classes resulted in widening spreads and increased volatility as oil prices began to decline in an accelerated fashion in the fourth quarter.
Detractors from Performance
Weak stock selection in the technology sector held back performance relative to the Russell 1000 Growth Index. An underweight position in computer and personal electronics maker Apple, and not holding shares of software giant Microsoft, dampened relative results as both stocks outpaced the benchmark during the reporting period. The portfolio’s overweight position in poor-performing internet search giant Google further weighed on relative returns. Shares of Google fell as the company missed analysts’ estimates for both revenue and income for four consecutive quarters. The company continued to face headwinds from a maturing internet search market, challenges with monetizing mobile search and regulatory anti-trust rulings in the European Union.
Stock selection in the consumer staples sector, and the combination of stock selection and an underweight position in the transportation sector, also hurt relative performance. However, there were no stocks within either sector that were among the fund’s top relative detractors over the reporting period.
Stock selection and an overweight position in the leisure sector were additional negative factors for relative performance. Here, overweight positions in casino resorts operators, Wynn Resorts and Las Vegas Sands, and global media company Discovery Communications hampered relative results. Shares of Discovery Communications fell as soft sales totals in US Networks, decreased margins in International networks and higher-than-anticipated corporate expenses weighed on the company’s bottom line. Additionally, management unexpectedly lowered earnings guidance due to foreign exchange headwinds and ongoing weakness in domestic ad revenues which further pressured the stock.
Elsewhere, overweight positions in Precision Castparts, a complex metal parts manufacturer for the aerospace industry, and oil and natural gas exploration and production company Noble Energy detracted from relative performance. Shares of Precision Castparts declined on weak earnings due to lower revenues which resulted from decreased organic growth and unexpected changes in delivery schedules. Not holding stand-out-performing eye and skin care products maker Allergan and biotechnology firm Amgen also dampened relative performance as both stocks outperformed the benchmark during the reporting period.
Contributors to Performance
An overweight position in the health care sector contributed to relative performance. Holdings of medical equipment and supplies company Covidien (b) and the fund’s overweight positions in specialty pharmaceutical company Actavis and biopharmaceutical companies, Alexion Pharmaceuticals and Regeneron Pharmaceuticals, bolstered relative results. Shares of Covidien skyrocketed late in the reporting period as the company announced that Medtronic had entered into an agreement to acquire the company at a significant premium.
Security selection in the utilities & communications sector further aided relative performance. Avoiding poor-performing telecommunications company Verizon and an overweight position in strong-performing broadcast and communication tower
3
MFS Growth Series
Management Review – continued
management firm American Tower positively impacted relative returns. Shares of American Tower rose as the company’s international operations segment exhibited accelerated growth trends and its US operations segment posted growth surpassing management’s outlook. A solid guidance raise coupled with a decrease in net leverage further strengthened results.
Elsewhere, not holding diversified technology products and services company International Business Machines (IBM) and the fund’s overweight positions in hotel chain operator Marriott International, paint manufacturer and distributor Sherwin Williams and off-price retail apparel and home accessories stores operator Ross Stores, benefited relative performance. Shares of Ross Stores rose after the company reported earnings results that beat consensus estimates, primarily due to comparable store sales and gross margin growth. Increased merchandise margins, reflecting higher markups due to an improvement in procurements costs and lower mark downs as a result of tighter inventory controls, also helped the stock.
Respectfully,
| | |
| Eric Fischman | | Matthew Sabel |
| Portfolio Manager | | Portfolio Manager |
| (b) | Security is not a benchmark constituent. |
Note to Contract Owners: Effective April 30, 2014, Matthew Sabel is also a Portfolio Manager of the Fund.
The views expressed in this report are those of the portfolio managers only through the end of the period of the report as stated on the cover and do not necessarily reflect the views of MFS or any other person in the MFS organization. These views are subject to change at any time based on market or other conditions, and MFS disclaims any responsibility to update such views. These views may not be relied upon as investment advice or an indication of trading intent on behalf of any MFS portfolio. References to specific securities are not recommendations of such securities, and may not be representative of any MFS portfolio’s current or future investments.
4
MFS Growth Series
PERFORMANCE SUMMARY THROUGH 12/31/14
The following chart illustrates the historical performance of the fund in comparison to its benchmark(s). Benchmarks are unmanaged and may not be invested in directly. Benchmark returns do not reflect any fees or expenses. The performance of other share classes will be greater than or less than that of the class depicted below. (See Notes to Performance Summary.)
Performance data shown represents past performance and is no guarantee of future results. Investment return and principal value fluctuate so your units, when sold, may be worth more or less than the original cost; current performance may be lower or higher than quoted. The performance shown does not reflect the deduction of taxes, if any, that a contract holder would pay on fund distributions or the redemption of contract units. The returns for the fund shown also do not reflect the deduction of expenses associated with variable products, such as mortality and expense risk charges, separate account charges, and sales charges imposed by the insurance company separate accounts. Such expenses would reduce the overall returns shown.
Growth of a Hypothetical $10,000 Investment
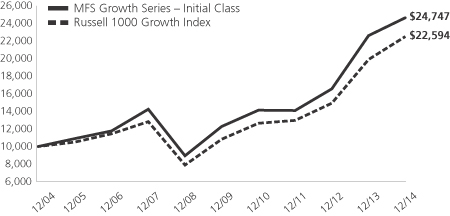
Total Returns through 12/31/14
Average annual total returns
| | | | | | | | | | | | |
| | | Share Class | | Class inception date | | 1-yr | | 5-yr | | 10-yr | | |
| | | Initial Class | | 7/24/95 | | 8.94% | | 15.01% | | 9.48% | | |
| | | Service Class | | 5/01/00 | | 8.68% | | 14.72% | | 9.21% | | |
| | | | |
| Comparative benchmark | | | | | | | | |
| | | Russell 1000 Growth Index (f) | | 13.05% | | 15.81% | | 8.49% | | |
| (f) | Source: FactSet Research Systems Inc. |
Benchmark Definition
Russell 1000 Growth Index – constructed to provide a comprehensive barometer for growth securities in the large-cap segment of the U.S. equity universe. Companies in this index generally have higher price-to-book ratios and higher forecasted growth values.
It is not possible to invest directly in an index.
Notes to Performance Summary
Average annual total return represents the average annual change in value for each share class for the periods presented.
Performance results reflect any applicable expense subsidies and waivers in effect during the periods shown. Without such subsidies and waivers the fund’s performance results would be less favorable. Please see the prospectus and financial statements for complete details. All results are historical and assume the reinvestment of any dividends and capital gains distributions.
Performance results do not include adjustments made for financial reporting purposes in accordance with U.S. generally accepted accounting principles and may differ from amounts reported in the financial highlights.
From time to time the fund may receive proceeds from litigation settlements, without which performance would be lower.
5
MFS Growth Series
EXPENSE TABLE
Fund Expenses Borne by the Contract Holders During the Period,
July 1, 2014 through December 31, 2014
As a contract holder of the fund, you incur ongoing costs, including management fees; distribution and/or service (12b-1) fees; and other fund expenses. This example is intended to help you understand your ongoing costs (in dollars) of investing in the fund and to compare these costs with the ongoing costs of investing in other mutual funds.
The example is based on an investment of $1,000 invested at the beginning of the period and held for the entire period July 1, 2014 through December 31, 2014.
Actual Expenses
The first line for each share class in the following table provides information about actual account values and actual expenses. You may use the information in this line, together with the amount you invested, to estimate the expenses that you paid over the period. Simply divide your account value by $1,000 (for example, an $8,600 account value divided by $1,000 = 8.6), then multiply the result by the number in the first line under the heading entitled “Expenses Paid During Period” to estimate the expenses you paid on your account during this period.
Hypothetical Example for Comparison Purposes
The second line for each share class in the following table provides information about hypothetical account values and hypothetical expenses based on the fund’s actual expense ratio and an assumed rate of return of 5% per year before expenses, which is not the fund’s actual return. The hypothetical account values and expenses may not be used to estimate the actual ending account balance or expenses you paid for the period. You may use this information to compare the ongoing costs of investing in the fund and other funds. To do so, compare this 5% hypothetical example with the 5% hypothetical examples that appear in the shareholder reports of the other funds.
Please note that the expenses shown in the table are meant to highlight the fund’s ongoing costs only and do not take into account the fees and expenses imposed under the variable contracts through which your investment in the fund is made. Therefore, the second line for each share class in the table is useful in comparing ongoing costs associated with an investment in vehicles (such as the fund) which fund benefits under variable annuity and variable life insurance contracts and to qualified pension and retirement plans only, and will not help you determine the relative total costs of investing in the fund through variable annuity and variable life insurance contracts. If the fees and expenses imposed under the variable contracts were included, your costs would have been higher.
| | | | | | | | | | | | | | | | | | |
| Share Class | | | | Annualized
Expense Ratio | | | Beginning
Account Value
7/01/14 | | | Ending Account Value
12/31/14 | | | Expenses Paid
During Period (p)
7/01/14-12/31/14 | |
| Initial Class | | Actual | | | 0.76% | | | | $1,000.00 | | | | $1,059.62 | | | | $3.95 | |
| | Hypothetical (h) | | | 0.76% | | | | $1,000.00 | | | | $1,021.37 | | | | $3.87 | |
| Service Class | | Actual | | | 1.01% | | | | $1,000.00 | | | | $1,058.32 | | | | $5.24 | |
| | Hypothetical (h) | | | 1.01% | | | | $1,000.00 | | | | $1,020.11 | | | | $5.14 | |
| (h) | 5% class return per year before expenses. |
| (p) | “Expenses Paid During Period” are equal to each class’s annualized expense ratio, as shown above, multiplied by the average account value over the period, multiplied by 184/365 (to reflect the one-half year period). |
6
MFS Growth Series
PORTFOLIO OF INVESTMENTS – 12/31/14
The Portfolio of Investments is a complete list of all securities owned by your fund. It is categorized by broad-based asset classes.
| | | | | | | | |
| Issuer | | Shares/Par | | | Value ($) | |
| | | | | | | | |
| COMMON STOCKS – 99.0% | | | | | |
| Aerospace – 2.0% | | | | | |
| Honeywell International, Inc. | | | 135,693 | | | $ | 13,558,444 | |
| Precision Castparts Corp. | | | 71,878 | | | | 17,313,973 | |
| | | | | | | | |
| | | $ | 30,872,417 | |
| | | | | | | | |
| Alcoholic Beverages – 1.2% | | | | | |
| Constellation Brands, Inc., “A” (a) | | | 126,769 | | | $ | 12,444,913 | |
| Pernod Ricard S.A. | | | 51,999 | | | | 5,765,491 | |
| | | | | | | | |
| | | $ | 18,210,404 | |
| | | | | | | | |
| Apparel Manufacturers – 3.2% | | | | | |
| LVMH Moet Hennessy Louis Vuitton S.A. | | | 53,161 | | | $ | 8,406,565 | |
| NIKE, Inc., “B” | | | 109,543 | | | | 10,532,559 | |
| PVH Corp. | | | 63,803 | | | | 8,177,631 | |
| VF Corp. | | | 305,408 | | | | 22,875,059 | |
| | | | | | | | |
| | | $ | 49,991,814 | |
| | | | | | | | |
| Automotive – 0.2% | | | | | |
| BorgWarner Transmission Systems, Inc. | | | 55,837 | | | $ | 3,068,243 | |
| | | | | | | | |
| Biotechnology – 7.4% | | | | | |
| Alexion Pharmaceuticals, Inc. (a) | | | 132,722 | | | $ | 24,557,552 | |
| Biogen Idec, Inc. (a) | | | 66,225 | | | | 22,480,076 | |
| Celgene Corp. (a) | | | 192,933 | | | | 21,581,485 | |
| Gilead Sciences, Inc. (a) | | | 125,361 | | | | 11,816,528 | |
| Isis Pharmaceuticals, Inc. (a) | | | 43,204 | | | | 2,667,415 | |
| Puma Biotechnology, Inc. (a) | | | 23,826 | | | | 4,509,547 | |
| Regeneron Pharmaceuticals, Inc. (a) | | | 47,133 | | | | 19,336,313 | |
| Vertex Pharmaceuticals, Inc. (a) | | | 61,292 | | | | 7,281,490 | |
| | | | | | | | |
| | | $ | 114,230,406 | |
| | | | | | | | |
| Broadcasting – 3.7% | | | | | |
| Discovery Communications, Inc., “C” (a) | | | 79,248 | | | $ | 2,672,243 | |
| Time Warner, Inc. | | | 189,525 | | | | 16,189,226 | |
| Twenty-First Century Fox, Inc. | | | 724,431 | | | | 27,821,773 | |
| Walt Disney Co. | | | 104,946 | | | | 9,884,864 | |
| | | | | | | | |
| | | $ | 56,568,106 | |
| | | | | | | | |
| Brokerage & Asset Managers – 3.2% | | | | | |
| Affiliated Managers Group, Inc. (a) | | | 50,263 | | | $ | 10,667,819 | |
| BlackRock, Inc. | | | 34,503 | | | | 12,336,893 | |
| Intercontinental Exchange, Inc. | | | 119,119 | | | | 26,121,606 | |
| | | | | | | | |
| | | $ | 49,126,318 | |
| | | | | | | | |
| Business Services – 3.3% | | | | | |
| Cognizant Technology Solutions Corp., “A” (a) | | | 415,898 | | | $ | 21,901,189 | |
| Equifax, Inc. | | | 31,846 | | | | 2,575,386 | |
| FleetCor Technologies, Inc. (a) | | | 111,314 | | | | 16,553,505 | |
| Realogy Holdings Corp. (a) | | | 106,170 | | | | 4,723,503 | |
| Verisk Analytics, Inc., “A” (a) | | | 75,515 | | | | 4,836,736 | |
| | | | | | | | |
| | | $ | 50,590,319 | |
| | | | | | | | |
| Cable TV – 1.3% | | | | | |
| Comcast Corp., “Special A” | | | 362,930 | | | $ | 20,892,065 | |
| | | | | | | | |
| | | | | | | | |
| Issuer | | Shares/Par | | | Value ($) | |
| | | | | | | | |
| COMMON STOCKS – continued | | | | | |
| Chemicals – 1.1% | | | | | |
| Monsanto Co. | | | 138,156 | | | $ | 16,505,497 | |
| | | | | | | | |
| Computer Software – 3.6% | | | | | |
| Adobe Systems, Inc. (a) | | | 176,170 | | | $ | 12,807,559 | |
| Citrix Systems, Inc. (a) | | | 24,799 | | | | 1,582,176 | |
| Oracle Corp. | | | 429,695 | | | | 19,323,384 | |
| Salesforce.com, Inc. (a) | | | 363,357 | | | | 21,550,704 | |
| | | | | | | | |
| | | $ | 55,263,823 | |
| | | | | | | | |
| Computer Software – Systems – 5.2% | | | | | |
| Apple, Inc. | | | 458,888 | | | $ | 50,652,057 | |
| EMC Corp. | | | 1,010,888 | | | | 30,063,809 | |
| | | | | | | | |
| | | $ | 80,715,866 | |
| | | | | | | | |
| Construction – 1.5% | | | | | |
| Sherwin-Williams Co. | | | 89,194 | | | $ | 23,461,590 | |
| | | | | | | | |
| Consumer Products – 1.5% | | | | | |
| Colgate-Palmolive Co. | | | 236,464 | | | $ | 16,360,944 | |
| Estee Lauder Cos., Inc., “A” | | | 96,793 | | | | 7,375,627 | |
| | | | | | | | |
| | | $ | 23,736,571 | |
| | | | | | | | |
| Consumer Services – 1.8% | | | | | |
| Ctrip.com International Ltd., ADR (a) | | | 25,854 | | | $ | 1,176,357 | |
| Priceline Group, Inc. (a) | | | 24,035 | | | | 27,404,947 | |
| | | | | | | | |
| | | $ | 28,581,304 | |
| | | | | | | | |
| Electrical Equipment – 3.4% | | | | | |
| AMETEK, Inc. | | | 286,045 | | | $ | 15,054,548 | |
| Danaher Corp. | | | 430,976 | | | | 36,938,953 | |
| | | | | | | | |
| | | $ | 51,993,501 | |
| | | | | | | | |
| Electronics – 1.0% | | | | | |
| Altera Corp. | | | 146,646 | | | $ | 5,417,103 | |
| Avago Technologies Ltd. | | | 38,060 | | | | 3,828,455 | |
| Broadcom Corp., “A” | | | 162,397 | | | | 7,036,662 | |
| | | | | | | | |
| | | $ | 16,282,220 | |
| | | | | | | | |
| Energy – Independent – 1.9% | | | | | |
| Anadarko Petroleum Corp. | | | 126,487 | | | $ | 10,435,178 | |
| Concho Resources, Inc. (a) | | | 32,450 | | | | 3,236,888 | |
| Noble Energy, Inc. | | | 160,828 | | | | 7,628,072 | |
| Pioneer Natural Resources Co. | | | 49,456 | | | | 7,361,526 | |
| | | | | | | | |
| | | $ | 28,661,664 | |
| | | | | | | | |
| Entertainment – 0.3% | | | | | |
| Netflix, Inc. (a) | | | 12,984 | | | $ | 4,435,464 | |
| | | | | | | | |
| Food & Beverages – 2.0% | | | | | |
| Danone S.A. | | | 112,295 | | | $ | 7,387,494 | |
| Mead Johnson Nutrition Co., “A” | | | 122,616 | | | | 12,327,813 | |
| Mondelez International, Inc. | | | 305,293 | | | | 11,089,768 | |
| | | | | | | | |
| | | $ | 30,805,075 | |
| | | | | | | | |
| Food & Drug Stores – 1.0% | | | | | |
| CVS Health Corp. | | | 156,703 | | | $ | 15,092,066 | |
| | | | | | | | |
7
MFS Growth Series
Portfolio of Investments – continued
| | | | | | | | |
| Issuer | | Shares/Par | | | Value ($) | |
| | | | | | | | |
| COMMON STOCKS – continued | | | | | |
| Gaming & Lodging – 2.5% | | | | | |
| Hilton Worldwide Holdings, Inc. (a) | | | 213,029 | | | $ | 5,557,927 | |
| Las Vegas Sands Corp. | | | 139,244 | | | | 8,098,431 | |
| Marriott International, Inc., “A” | | | 162,363 | | | | 12,669,185 | |
| Wynn Resorts Ltd. | | | 79,811 | | | | 11,872,684 | |
| | | | | | | | |
| | | $ | 38,198,227 | |
| | | | | | | | |
| General Merchandise – 0.9% | | | | | |
| Costco Wholesale Corp. | | | 95,686 | | | $ | 13,563,491 | |
| | | | | | | | |
| Insurance – 0.2% | | | | | |
| MetLife, Inc. | | | 57,141 | | | $ | 3,090,757 | |
| | | | | | | | |
| Internet – 9.1% | | | | | |
| Alibaba Group Holding Ltd., ADR (a) | | | 13,662 | | | $ | 1,420,028 | |
| Facebook, Inc., “A “ (a) | | | 498,084 | | | | 38,860,514 | |
| Google, Inc., “A” (a) | | | 70,597 | | | | 37,463,004 | |
| Google, Inc., “C” (a) | | | 63,253 | | | | 33,296,379 | |
| LinkedIn Corp., “A” (a) | | | 70,700 | | | | 16,240,497 | |
| Twitter, Inc. (a) | | | 114,590 | | | | 4,110,343 | |
| Yahoo!, Inc. (a) | | | 185,273 | | | | 9,358,139 | |
| | | | | | | | |
| | | $ | 140,748,904 | |
| | | | | | | | |
| Machinery & Tools – 1.5% | | | | | |
| Colfax Corp. (a) | | | 156,795 | | | $ | 8,085,918 | |
| Roper Industries, Inc. | | | 96,083 | | | | 15,022,577 | |
| | | | | | | | |
| | | $ | 23,108,495 | |
| | | | | | | | |
| Major Banks – 0.7% | | | | | |
| Morgan Stanley | | | 284,326 | | | $ | 11,031,849 | |
| | | | | | | | |
| Medical & Health Technology & Services – 2.1% | |
| Cerner Corp. (a) | | | 192,700 | | | $ | 12,459,982 | |
| McKesson Corp. | | | 97,246 | | | | 20,186,325 | |
| | | | | | | | |
| | | $ | 32,646,307 | |
| | | | | | | | |
| Medical Equipment – 5.1% | | | | | |
| Abbott Laboratories | | | 346,931 | | | $ | 15,618,834 | |
| C.R. Bard, Inc. | | | 37,945 | | | | 6,322,396 | |
| Cooper Cos., Inc. | | | 35,651 | | | | 5,778,671 | |
| Covidien PLC | | | 166,382 | | | | 17,017,551 | |
| Thermo Fisher Scientific, Inc. | | | 276,559 | | | | 34,650,077 | |
| | | | | | | | |
| | | $ | 79,387,529 | |
| | | | | | | | |
| Oil Services – 0.7% | | | | | |
| Schlumberger Ltd. | | | 128,835 | | | $ | 11,003,797 | |
| | | | | | | | |
| Other Banks & Diversified Financials – 6.9% | | | | | |
| American Express Co. | | | 209,960 | | | $ | 19,534,678 | |
| MasterCard, Inc., “A” | | | 415,943 | | | | 35,837,649 | |
| Visa, Inc., “A” | | | 194,547 | | | | 51,010,223 | |
| | | | | | | | |
| | | $ | 106,382,550 | |
| | | | | | | | |
| Pharmaceuticals – 6.0% | | | | | |
| AbbVie, Inc. | | | 159,437 | | | $ | 10,433,557 | |
| Actavis PLC (a) | | | 121,105 | | | | 31,173,638 | |
| Bristol-Myers Squibb Co. | | | 403,829 | | | | 23,838,026 | |
| Merck & Co., Inc. | | | 119,001 | | | | 6,758,067 | |
| Receptos, Inc. (a) | | | 22,114 | | | | 2,709,186 | |
| | | | | | | | |
| Issuer | | Shares/Par | | | Value ($) | |
| | | | | | | | |
| COMMON STOCKS – continued | | | | | |
| Pharmaceuticals – continued | | | | | |
| Valeant Pharmaceuticals International, Inc. (a) | | | 67,493 | | | $ | 9,658,923 | |
| Zoetis, Inc. | | | 176,807 | | | | 7,608,005 | |
| | | | | | | | |
| | | $ | 92,179,402 | |
| | | | | | | | |
| Printing & Publishing – 0.4% | | | | | |
| Moody’s Corp. | | | 60,995 | | | $ | 5,843,931 | |
| | | | | | | | |
| Railroad & Shipping – 1.4% | | | | | |
| Canadian Pacific Railway Ltd. | | | 13,660 | | | $ | 2,632,145 | |
| Kansas City Southern Co. | | | 43,890 | | | | 5,355,897 | |
| Union Pacific Corp. | | | 116,766 | | | | 13,910,334 | |
| | | | | | | | |
| | | $ | 21,898,376 | |
| | | | | | | | |
| Restaurants – 1.3% | | | | | |
| Starbucks Corp. | | | 221,908 | | | $ | 18,207,551 | |
| YUM! Brands, Inc. | | | 21,434 | | | | 1,561,467 | |
| | | | | | | | |
| | | $ | 19,769,018 | |
| | | | | | | | |
| Specialty Chemicals – 0.7% | | | | | |
| Airgas, Inc. | | | 48,926 | | | $ | 5,635,297 | |
| Ecolab, Inc. | | | 43,559 | | | | 4,552,787 | |
| | | | | | | | |
| | | $ | 10,188,084 | |
| | | | | | | | |
| Specialty Stores – 7.0% | | | | | |
| Amazon.com, Inc. (a) | | | 39,338 | | | $ | 12,208,548 | |
| AutoZone, Inc. (a) | | | 17,367 | | | | 10,752,083 | |
| Burlington Stores, Inc. (a) | | | 109,619 | | | | 5,180,594 | |
| L Brands, Inc. | | | 139,315 | | | | 12,057,713 | |
| Ross Stores, Inc. | | | 309,340 | | | | 29,158,388 | |
| Tiffany & Co. | | | 74,964 | | | | 8,010,653 | |
| TJX Cos., Inc. | | | 311,912 | | | | 21,390,925 | |
| Tractor Supply Co. | | | 109,892 | | | | 8,661,687 | |
| Urban Outfitters, Inc. (a) | | | 41,406 | | | | 1,454,593 | |
| | | | | | | | |
| | | $ | 108,875,184 | |
| | | | | | | | |
| Telecommunications – Wireless – 2.0% | | | | | |
| American Tower Corp., REIT | | | 314,635 | | | $ | 31,101,670 | |
| | | | | | | | |
| Tobacco – 0.2% | | | | | |
| Philip Morris International, Inc. | | | 37,795 | | | $ | 3,078,403 | |
| | | | | | | | |
| Trucking – 0.5% | | | | | |
| United Parcel Service, Inc., “B” | | | 63,907 | | | $ | 7,104,541 | |
| | | | | | | | |
Total Common Stocks
(Identified Cost, $1,025,382,112) | | | $ | 1,528,285,248 | |
| | | | | | | | |
| |
| MONEY MARKET FUNDS – 1.3% | | | | | |
| MFS Institutional Money Market Portfolio, 0.09%, at Cost and Net Asset Value (v) | | | 19,395,311 | | | $ | 19,395,311 | |
| | | | | | | | |
Total Investments
(Identified Cost, $1,044,777,423) | | | $ | 1,547,680,559 | |
| | | | | | | | |
OTHER ASSETS, LESS
LIABILITIES – (0.3)% | | | | (4,682,749 | ) |
| | | | | | | | |
| NET ASSETS – 100.0% | | | $ | 1,542,997,810 | |
| | | | | | | | |
8
MFS Growth Series
Portfolio of Investments – continued
| (a) | | Non-income producing security. |
| (v) | | Underlying affiliated fund that is available only to investment companies managed by MFS. The rate quoted for the MFS Institutional Money Market Portfolio is the annualized seven-day yield of the fund at period end. |
The following abbreviations are used in this report and are defined:
| ADR | | American Depositary Receipt |
| PLC | | Public Limited Company |
| REIT | | Real Estate Investment Trust |
See Notes to Financial Statements
9
MFS Growth Series
FINANCIAL STATEMENTS | STATEMENT OF ASSETS AND LIABILITIES
This statement represents your fund’s balance sheet, which details the assets and liabilities comprising the total value of the fund.
| | | | | | | | |
At 12/31/14 | | | | | | | | |
Assets | | | | | | | | |
Investments – | | | | | | | | |
Non-affiliated issuers, at value (identified cost, $1,025,382,112) | | | $1,528,285,248 | | | | | |
Underlying affiliated funds, at cost and value | | | 19,395,311 | | | | | |
Total investments, at value (identified cost, $1,044,777,423) | | | $1,547,680,559 | | | | | |
Receivables for | | | | | | | | |
Investments sold | | | 1,493,442 | | | | | |
Fund shares sold | | | 620,626 | | | | | |
Interest and dividends | | | 1,126,516 | | | | | |
Other assets | | | 9,817 | | | | | |
Total assets | | | | | | | $1,550,930,960 | |
Liabilities | | | | | | | | |
Payable to custodian | | | $116,488 | | | | | |
Payables for | | | | | | | | |
Investments purchased | | | 3,288,796 | | | | | |
Fund shares reacquired | | | 4,295,345 | | | | | |
Payable to affiliates | | | | | | | | |
Investment adviser | | | 52,775 | | | | | |
Shareholder servicing costs | | | 633 | | | | | |
Distribution and/or service fees | | | 3,866 | | | | | |
Payable for independent Trustees’ compensation | | | 9 | | | | | |
Accrued expenses and other liabilities | | | 175,238 | | | | | |
Total liabilities | | | | | | | $7,933,150 | |
Net assets | | | | | | | $1,542,997,810 | |
Net assets consist of | | | | | | | | |
Paid-in capital | | | $955,933,538 | | | | | |
Unrealized appreciation (depreciation) on investments and translation of assets and liabilities in foreign currencies | | | 502,905,939 | | | | | |
Accumulated net realized gain (loss) on investments and foreign currency | | | 82,057,881 | | | | | |
Undistributed net investment income | | | 2,100,452 | | | | | |
Net assets | | | | | | | $1,542,997,810 | |
Shares of beneficial interest outstanding | | | | | | | 38,992,147 | |
| | | | | | | | | | | | |
| | | Net assets | | | Shares outstanding | | | Net asset value per share | |
Initial Class | | | $1,263,934,723 | | | | 31,794,856 | | | | $39.75 | |
Service Class | | | 279,063,087 | | | | 7,197,291 | | | | 38.77 | |
See Notes to Financial Statements
10
MFS Growth Series
FINANCIAL STATEMENTS | STATEMENT OF OPERATIONS
This statement describes how much your fund earned in investment income and accrued in expenses. It also describes any gains and/or losses generated by fund operations.
| | | | | | | | |
Year ended 12/31/14 | | | | | | | | |
Net investment income | | | | | | | | |
Income | | | | | | | | |
Dividends | | | $14,394,306 | | | | | |
Interest | | | 103,652 | | | | | |
Dividends from underlying affiliated funds | | | 20,885 | | | | | |
Foreign taxes withheld | | | (198,598 | ) | | | | |
Total investment income | | | | | | | $14,320,245 | |
Expenses | | | | | | | | |
Management fee | | | $10,951,918 | | | | | |
Distribution and/or service fees | | | 641,116 | | | | | |
Shareholder servicing costs | | | 91,960 | | | | | |
Administrative services fee | | | 215,995 | | | | | |
Independent Trustees’ compensation | | | 32,713 | | | | | |
Custodian fee | | | 133,094 | | | | | |
Shareholder communications | | | 112,038 | | | | | |
Audit and tax fees | | | 55,989 | | | | | |
Legal fees | | | 13,453 | | | | | |
Miscellaneous | | | 40,332 | | | | | |
Total expenses | | | | | | | $12,288,608 | |
Fees paid indirectly | | | (6 | ) | | | | |
Reduction of expenses by investment adviser | | | (73,183 | ) | | | | |
Net expenses | | | | | | | $12,215,419 | |
Net investment income | | | | | | | $2,104,826 | |
Realized and unrealized gain (loss) on investments and foreign currency | | | | | | | | |
Realized gain (loss) (identified cost basis) | | | | | | | | |
Investments | | | $93,280,909 | | | | | |
Foreign currency | | | (3,840 | ) | | | | |
Net realized gain (loss) on investments and foreign currency | | | | | | | $93,277,069 | |
Change in unrealized appreciation (depreciation) | | | | | | | | |
Investments | | | $34,225,938 | | | | | |
Translation of assets and liabilities in foreign currencies | | | 2,803 | | | | | |
Net unrealized gain (loss) on investments and foreign currency translation | | | | | | | $34,228,741 | |
Net realized and unrealized gain (loss) on investments and foreign currency | | | | | | | $127,505,810 | |
Change in net assets from operations | | | | | | | $129,610,636 | |
See Notes to Financial Statements
11
MFS Growth Series
FINANCIAL STATEMENTS | STATEMENTS OF CHANGES IN NET ASSETS
These statements describe the increases and/or decreases in net assets resulting from operations, any distributions, and any shareholder transactions.
| | | | | | | | |
For years ended 12/31 | | | 2014 | | | | 2013 | |
Change in net assets | | | | | | | | |
From operations | | | | | | | | |
Net investment income | | | $2,104,826 | | | | $1,231,688 | |
Net realized gain (loss) on investments and foreign currency | | | 93,277,069 | | | | 101,361,807 | |
Net unrealized gain (loss) on investments and foreign currency translation | | | 34,228,741 | | | | 315,012,859 | |
Change in net assets from operations | | | $129,610,636 | | | | $417,606,354 | |
Distributions declared to shareholders | | | | | | | | |
From net investment income | | | $(1,315,037 | ) | | | $(2,907,322 | ) |
From net realized gain on investments | | | (101,856,096 | ) | | | (9,897,269 | ) |
Total distributions declared to shareholders | | | $(103,171,133 | ) | | | $(12,804,591 | ) |
Change in net assets from fund share transactions | | | $(34,019,063 | ) | | | $4,106,615 | |
Total change in net assets | | | $(7,579,560 | ) | | | $408,908,378 | |
Net assets | | | | | | | | |
At beginning of period | | | 1,550,577,370 | | | | 1,141,668,992 | |
At end of period (including undistributed net investment income of $2,100,452 and
$1,241,314, respectively) | | | $1,542,997,810 | | | | $1,550,577,370 | |
See Notes to Financial Statements
12
MFS Growth Series
FINANCIAL STATEMENTS | FINANCIAL HIGHLIGHTS
The financial highlights table is intended to help you understand the fund’s financial performance for the past 5 years. Certain information reflects financial results for a single fund share. The total returns in the table represent the rate by which an investor would have earned (or lost) on an investment in the fund share class (assuming reinvestment of all distributions) held for the entire period.
| | | | | | | | | | | | | | | | | | | | |
| Initial Class | | Years ended 12/31 | |
| | | 2014 | | | 2013 | | | 2012 | | | 2011 | | | 2010 | |
Net asset value, beginning of period | | | $39.07 | | | | $28.83 | | | | $24.56 | | | | $24.69 | | | | $21.43 | |
| Income (loss) from investment operations | | | | | | | | | | | | | | | | | | | | |
Net investment income (loss) (d) | | | $0.07 | | | | $0.04 | | | | $0.13 | | | | $(0.00 | )(w) | | | $0.05 | |
Net realized and unrealized gain (loss) on investments
and foreign currency | | | 3.33 | | | | 10.53 | | | | 4.14 | | | | (0.08 | ) | | | 3.24 | |
Total from investment operations | | | $3.40 | | | | $10.57 | | | | $4.27 | | | | $(0.08 | ) | | | $3.29 | |
| Less distributions declared to shareholders | | | | | | | | | | | | | | | | | | | | |
From net investment income | | | $(0.04 | ) | | | $(0.08 | ) | | | $— | | | | $(0.05 | ) | | | $(0.03 | ) |
From net realized gain on investments | | | (2.68 | ) | | | (0.25 | ) | | | — | | | | — | | | | — | |
Total distributions declared to shareholders | | | $(2.72 | ) | | | $(0.33 | ) | | | $— | | | | $(0.05 | ) | | | $(0.03 | ) |
Net asset value, end of period (x) | | | $39.75 | | | | $39.07 | | | | $28.83 | | | | $24.56 | | | | $24.69 | |
Total return (%) (k)(r)(s)(x) | | | 8.94 | | | | 36.85 | | | | 17.39 | | | | (0.32 | ) | | | 15.34 | |
Ratios (%) (to average net assets) and Supplemental data: | | | | | | | | | | | | | | | | | | | | |
Expenses before expense reductions (f) | | | 0.76 | | | | 0.77 | | | | 0.82 | | | | 0.84 | | | | 0.85 | |
Expenses after expense reductions (f) | | | 0.76 | | | | 0.77 | | | | 0.82 | | | | 0.84 | | | | 0.85 | |
Net investment income | | | 0.18 | | | | 0.13 | | | | 0.45 | | | | (0.00 | )(w) | | | 0.24 | |
Portfolio turnover | | | 36 | | | | 43 | | | | 52 | | | | 75 | | | | 100 | |
Net assets at end of period (000 omitted) | | | $1,263,935 | | | | $1,308,361 | | | | $1,007,422 | | | | $461,382 | | | | $503,497 | |
See Notes to Financial Statements
13
MFS Growth Series
Financial Highlights – continued
| | | | | | | | | | | | | | | | | | | | |
| Service Class | | Years ended 12/31 | |
| | | 2014 | | | 2013 | | | 2012 | | | 2011 | | | 2010 | |
Net asset value, beginning of period | | | $38.22 | | | | $28.25 | | | | $24.13 | | | | $24.27 | | | | $21.10 | |
| Income (loss) from investment operations | | | | | | | | | | | | | | | | | | | | |
Net investment income (loss) (d) | | | $(0.02 | ) | | | $(0.04 | ) | | | $0.07 | | | | $(0.06 | ) | | | $0.00 | (w) |
Net realized and unrealized gain (loss) on investments
and foreign currency | | | 3.25 | | | | 10.30 | | | | 4.05 | | | | (0.08 | ) | | | 3.17 | |
Total from investment operations | | | $3.23 | | | | $10.26 | | | | $4.12 | | | | $(0.14 | ) | | | $3.17 | |
| Less distributions declared to shareholders | | | | | | | | | | | | | | | | | | | | |
From net investment income | | | $— | | | | $(0.04 | ) | | | $— | | | | $(0.00 | )(w) | | | $— | |
From net realized gain on investments | | | (2.68 | ) | | | (0.25 | ) | | | — | | | | — | | | | — | |
Total distributions declared to shareholders | | | $(2.68 | ) | | | $(0.29 | ) | | | $— | | | | $(0.00 | )(w) | | | $— | |
Net asset value, end of period (x) | | | $38.77 | | | | $38.22 | | | | $28.25 | | | | $24.13 | | | | $24.27 | |
Total return (%) (k)(r)(s)(x) | | | 8.68 | | | | 36.49 | | | | 17.07 | | | | (0.56 | ) | | | 15.02 | |
Ratios (%) (to average net assets)
and Supplemental data: | | | | | | | | | | | | | | | | | | | | |
Expenses before expense reductions (f) | | | 1.01 | | | | 1.02 | | | | 1.07 | | | | 1.09 | | | | 1.10 | |
Expenses after expense reductions (f) | | | 1.01 | | | | 1.02 | | | | 1.07 | | | | 1.09 | | | | 1.10 | |
Net investment income (loss) | | | (0.06 | ) | | | (0.12 | ) | | | 0.26 | | | | (0.25 | ) | | | 0.02 | |
Portfolio turnover | | | 36 | | | | 43 | | | | 52 | | | | 75 | | | | 100 | |
Net assets at end of period (000 omitted) | | | $279,063 | | | | $242,216 | | | | $134,247 | | | | $56,810 | | | | $43,161 | |
| (d) | | Per share data is based on average shares outstanding. |
| (f) | | Ratios do not reflect reductions from fees paid indirectly, if applicable. |
| (k) | | The total return does not reflect expenses that apply to separate accounts. Inclusion of these charges would reduce the total return figures for all periods shown. |
| (r) | | Certain expenses have been reduced without which performance would have been lower. |
| (s) | | From time to time the fund may receive proceeds from litigation settlements, without which performance would be lower. |
| (w) | | Per share amount was less than $0.01 or ratio was less than 0.01%. |
| (x) | | The net asset values per share and total returns have been calculated on net assets which include adjustments made in accordance with U.S. generally accepted accounting principles required at period end for financial reporting purposes. |
See Notes to Financial Statements
14
MFS Growth Series
NOTES TO FINANCIAL STATEMENTS
| (1) | | Business and Organization |
MFS Growth Series (the fund) is a diversified series of MFS Variable Insurance Trust (the trust). The trust is organized as a Massachusetts business trust and is registered under the Investment Company Act of 1940, as amended, as an open-end management investment company. The shareholders of each series of the trust are separate accounts of insurance companies, which offer variable annuity and/or life insurance products, and qualified retirement and pension plans.
The fund is an investment company and accordingly follows the investment company accounting and reporting guidance of the Financial Accounting Standards Board (FASB) Accounting Standards Codification Topic 946 Financial Services – Investment Companies.
| (2) | | Significant Accounting Policies |
General – The preparation of financial statements in conformity with U.S. generally accepted accounting principles requires management to make estimates and assumptions that affect the reported amounts of assets and liabilities, and disclosure of contingent assets and liabilities at the date of the financial statements and the reported amounts of increases and decreases in net assets from operations during the reporting period. Actual results could differ from those estimates. In the preparation of these financial statements, management has evaluated subsequent events occurring after the date of the fund’s Statement of Assets and Liabilities through the date that the financial statements were issued.
In June 2014, FASB issued Accounting Standards Update 2014-11, Transfers and Servicing (Topic 860) – Repurchase-to-Maturity Transactions, Repurchase Financings, and Disclosures (“ASU 2014-11”). ASU 2014-11 changes the accounting for repurchase-to-maturity transactions (i.e., repurchase agreements that settle at the same time as the maturity of the transferred financial asset) and enhances the required disclosures for repurchase agreements and other similar transactions. Although still evaluating the potential impacts of ASU 2014-11 to the fund, management expects that the impact of the fund’s adoption will be limited to additional financial statement disclosures which would first be effective for interim reporting periods beginning after March 15, 2015.
Balance Sheet Offsetting – The fund’s accounting policy with respect to balance sheet offsetting is that, absent an event of default by the counterparty or a termination of the agreement, the International Swaps and Derivatives Association (ISDA) Master Agreement does not result in an offset of reported amounts of financial assets and financial liabilities in the Statement of Assets and Liabilities across transactions between the fund and the applicable counterparty. The fund’s right to setoff may be restricted or prohibited by the bankruptcy or insolvency laws of the particular jurisdiction to which a specific master netting agreement counterparty is subject. Balance sheet offsetting disclosures, to the extent applicable to the fund, have been included in the fund’s Significant Accounting Policies note under the captions for each of the fund’s in-scope financial instruments and transactions.
Investment Valuations – Equity securities, including restricted equity securities, are generally valued at the last sale or official closing price as provided by a third-party pricing service on the market or exchange on which they are primarily traded. Equity securities, for which there were no sales reported that day, are generally valued at the last quoted daily bid quotation as provided by a third-party pricing service on the market or exchange on which such securities are primarily traded. Short-term instruments with a maturity at issuance of 60 days or less may be valued at amortized cost, which approximates market value. Open-end investment companies are generally valued at net asset value per share. Securities and other assets generally valued on the basis of information from a third-party pricing service may also be valued at a broker/dealer bid quotation. Values obtained from third-party pricing services can utilize both transaction data and market information such as yield, quality, coupon rate, maturity, type of issue, trading characteristics, and other market data. The values of foreign securities and other assets and liabilities expressed in foreign currencies are converted to U.S. dollars using the mean of bid and asked prices for rates provided by a third-party pricing service.
The Board of Trustees has delegated primary responsibility for determining or causing to be determined the value of the fund’s investments (including any fair valuation) to the adviser pursuant to valuation policies and procedures approved by the Board. If the adviser determines that reliable market quotations are not readily available, investments are valued at fair value as determined in good faith by the adviser in accordance with such procedures under the oversight of the Board of Trustees. Under the fund’s valuation policies and procedures, market quotations are not considered to be readily available for most types of debt instruments and floating rate loans and many types of derivatives. These investments are generally valued at fair value based on information from third-party pricing services. In addition, investments may be valued at fair value if the adviser determines that an investment’s value has been materially affected by events occurring after the close of the exchange or market on which the investment is principally traded (such as foreign exchange or market) and prior to the determination of the fund’s net asset value, or after the halting of trading of a specific security where trading does not resume prior to the close of the exchange or market on which the security is principally traded. Events that occur on a frequent basis after foreign markets close (such as developments in foreign markets and significant movements in the U.S. markets) and prior to the determination of the fund’s net asset value may be deemed to have a material effect on the value of securities traded in foreign markets. Accordingly, the fund’s foreign equity securities may often be valued at fair value. The adviser generally relies on third-party pricing services or other information (such as the correlation with price movements of similar securities in the same or other markets; the type, cost and investment characteristics of the security; the
15
MFS Growth Series
Notes to Financial Statements – continued
business and financial condition of the issuer; and trading and other market data) to assist in determining whether to fair value and at what value to fair value an investment. The value of an investment for purposes of calculating the fund’s net asset value can differ depending on the source and method used to determine value. When fair valuation is used, the value of an investment used to determine the fund’s net asset value may differ from quoted or published prices for the same investment. There can be no assurance that the fund could obtain the fair value assigned to an investment if it were to sell the investment at the same time at which the fund determines its net asset value per share.
Various inputs are used in determining the value of the fund’s assets or liabilities. These inputs are categorized into three broad levels. In certain cases, the inputs used to measure fair value may fall into different levels of the fair value hierarchy. In such cases, an investment’s level within the fair value hierarchy is based on the lowest level of input that is significant to the fair value measurement. The fund’s assessment of the significance of a particular input to the fair value measurement in its entirety requires judgment, and considers factors specific to the investment. Level 1 includes unadjusted quoted prices in active markets for identical assets or liabilities. Level 2 includes other significant observable market-based inputs (including quoted prices for similar securities, interest rates, prepayment speed, and credit risk). Level 3 includes unobservable inputs, which may include the adviser’s own assumptions in determining the fair value of investments. The following is a summary of the levels used as of December 31, 2014 in valuing the fund’s assets or liabilities:
| | | | | | | | | | | | | | | | |
| Investments at Value | | Level 1 | | | Level 2 | | | Level 3 | | | Total | |
| Equity Securities: | | | | | | | | | | | | | | | | |
United States | | | $1,491,838,243 | | | | $— | | | | $— | | | | $1,491,838,243 | |
France | | | — | | | | 21,559,551 | | | | — | | | | 21,559,551 | |
Canada | | | 12,291,069 | | | | — | | | | — | | | | 12,291,069 | |
China | | | 2,596,385 | | | | — | | | | — | | | | 2,596,385 | |
| Mutual Funds | | | 19,395,311 | | | | — | | | | — | | | | 19,395,311 | |
| Total Investments | | | $1,526,121,008 | | | | $21,559,551 | | | | $— | | | | $1,547,680,559 | |
For further information regarding security characteristics, see the Portfolio of Investments.
Of the level 2 investments presented above, equity investments amounting to $21,559,551 would have been considered level 1 investments at the beginning of the period. The primary reason for changes in the classifications between levels 1 and 2 occurs when foreign equity securities are fair valued using other observable market-based inputs in place of the closing exchange price due to events occurring after the close of the exchange or market on which the investment is principally traded. The fund’s foreign equity securities may often be valued at fair value. The fund’s policy is to recognize transfers between the levels as of the end of the period.
Foreign Currency Translation – Purchases and sales of foreign investments, income, and expenses are converted into U.S. dollars based upon currency exchange rates prevailing on the respective dates of such transactions or on the reporting date for foreign denominated receivables and payables. Gains and losses attributable to foreign currency exchange rates on sales of securities are recorded for financial statement purposes as net realized gains and losses on investments. Gains and losses attributable to foreign exchange rate movements on receivables, payables, income and expenses are recorded for financial statement purposes as foreign currency transaction gains and losses. That portion of both realized and unrealized gains and losses on investments that results from fluctuations in foreign currency exchange rates is not separately disclosed.
Security Loans – Under its Securities Lending Agency Agreement with the fund, State Street Bank and Trust Company (“State Street”), as lending agent, loans the securities of the fund to certain qualified institutions (the “Borrowers”) approved by the fund. The loans are collateralized by cash and/or U.S. Treasury and federal agency obligations in an amount typically at least equal to the market value of the securities loaned. On loans collateralized by cash, the cash collateral is invested in a money market fund. The market value of the loaned securities is determined at the close of business of the fund and any additional required collateral is delivered to the fund on the next business day. State Street provides the fund with indemnification against Borrower default. In the event of Borrower default, State Street will for the benefit of the fund either purchase securities identical to those loaned or, when such purchase is commercially impracticable, pay the fund the market value of the loaned securities. In return, State Street assumes the fund’s rights to the related collateral. If the collateral value is less than the cost to purchase identical securities, State Street is responsible for the shortfall, but only to the extent that such shortfall is not due to a decline in collateral value resulting from collateral reinvestment for which the fund bears the risk of loss. A portion of the income generated upon investment of the collateral is remitted to the Borrowers, and the remainder is allocated between the fund and the lending agent. On loans collateralized by U.S. Treasury and/or federal agency obligations, a fee is received from the Borrower, and is allocated between the fund and the lending agent. Income from securities lending is included in “Interest” income in the Statement of Operations. The dividend and interest income earned on the securities loaned is accounted for in the same manner as other dividend and interest income. At December 31, 2014, there were no securities on loan or collateral outstanding.
Indemnifications – Under the fund’s organizational documents, its officers and Trustees may be indemnified against certain liabilities and expenses arising out of the performance of their duties to the fund. Additionally, in the normal course of business, the
16
MFS Growth Series
Notes to Financial Statements – continued
fund enters into agreements with service providers that may contain indemnification clauses. The fund’s maximum exposure under these agreements is unknown as this would involve future claims that may be made against the fund that have not yet occurred.
Investment Transactions and Income – Investment transactions are recorded on the trade date. Interest income is recorded on the accrual basis. Dividends received in cash are recorded on the ex-dividend date. Certain dividends from foreign securities will be recorded when the fund is informed of the dividend if such information is obtained subsequent to the ex-dividend date. Dividend and interest payments received in additional securities are recorded on the ex-dividend or ex-interest date in an amount equal to the value of the security on such date.
The fund may receive proceeds from litigation settlements. Any proceeds received from litigation involving portfolio holdings are reflected in the Statement of Operations in realized gain/loss if the security has been disposed of by the fund or in unrealized gain/loss if the security is still held by the fund. Any other proceeds from litigation not related to portfolio holdings are reflected as other income in the Statement of Operations.
Fees Paid Indirectly – The fund’s custody fee may be reduced according to an arrangement that measures the value of cash deposited with the custodian by the fund. This amount, for the year ended December 31, 2014, is shown as a reduction of total expenses in the Statement of Operations.
Tax Matters and Distributions – The fund intends to qualify as a regulated investment company, as defined under Subchapter M of the Internal Revenue Code, and to distribute all of its taxable income, including realized capital gains. As a result, no provision for federal income tax is required. The fund’s federal tax returns, when filed, will remain subject to examination by the Internal Revenue Service for a three year period. Management has analyzed the fund’s tax positions taken on federal and state tax returns for all open tax years and does not believe that there are any uncertain tax positions that require recognition of a tax liability. Foreign taxes, if any, have been accrued by the fund in the accompanying financial statements in accordance with the applicable foreign tax law. Foreign income taxes may be withheld by certain countries in which the fund invests. Additionally, capital gains realized by the fund on securities issued in or by certain foreign countries may be subject to capital gains tax imposed by those countries.
Distributions to shareholders are recorded on the ex-dividend date. Income and capital gain distributions are determined in accordance with income tax regulations, which may differ from U.S. generally accepted accounting principles. Certain capital accounts in the financial statements are periodically adjusted for permanent differences in order to reflect their tax character. These adjustments have no impact on net assets or net asset value per share. Temporary differences which arise from recognizing certain items of income, expense, gain or loss in different periods for financial statement and tax purposes will reverse at some time in the future. Distributions in excess of net investment income or net realized gains are temporary overdistributions for financial statement purposes resulting from differences in the recognition or classification of income or distributions for financial statement and tax purposes.
Book/tax differences primarily relate to wash sale loss deferrals.
The tax character of distributions declared to shareholders for the last two fiscal years is as follows:
| | | | | | | | |
| | | 12/31/14 | | | 12/31/13 | |
| Ordinary income (including any short-term capital gains) | | | $28,519,200 | | | | $2,907,322 | |
| Long-term capital gains | | | 74,651,933 | | | | 9,897,269 | |
| Total distributions | | | $103,171,133 | | | | $12,804,591 | |
The federal tax cost and the tax basis components of distributable earnings were as follows:
| | | | |
| As of 12/31/14 | | | | |
| Cost of investments | | | $1,046,878,830 | |
| Gross appreciation | | | 511,395,743 | |
| Gross depreciation | | | (10,594,014 | ) |
| Net unrealized appreciation (depreciation) | | | $500,801,729 | |
| Undistributed ordinary income | | | 3,887,306 | |
| Undistributed long-term capital gain | | | 82,537,653 | |
| Other temporary differences | | | (162,416 | ) |
Multiple Classes of Shares of Beneficial Interest – The fund offers multiple classes of shares, which differ in their respective distribution and/or service fees. The fund’s income, realized and unrealized gain (loss), and common expenses are allocated to shareholders based on the daily net assets of each class. Dividends are declared separately for each class. Differences in per share
17
MFS Growth Series
Notes to Financial Statements – continued
dividend rates are generally due to differences in separate class expenses. The fund’s distributions declared to shareholders as reported in the Statements of Changes in Net Assets are presented by class as follows:
| | | | | | | | | | | | | | | | |
| | | From net investment
income | | | From net realized gain on
investments | |
| | | Year ended
12/31/14 | | | Year ended
12/31/13 | | | Year ended
12/31/14 | | | Year ended
12/31/13 | |
| Initial Class | | | $1,315,037 | | | | $2,673,098 | | | | $83,920,326 | | | | $8,467,219 | |
| Service Class | | | — | | | | 234,224 | | | | 17,935,770 | | | | 1,430,050 | |
| Total | | | $1,315,037 | | | | $2,907,322 | | | | $101,856,096 | | | | $9,897,269 | |
| (3) | | Transactions with Affiliates |
Investment Adviser – The fund has an investment advisory agreement with MFS to provide overall investment management and related administrative services and facilities to the fund. The management fee is computed daily and paid monthly at the following annual rates:
| | | | |
| First $1 billion of average daily net assets | | | 0.75% | |
| Average daily net assets in excess of $1 billion | | | 0.65% | |
MFS has agreed in writing to reduce its management fee by a specified amount if certain MFS mutual fund assets exceed thresholds agreed to by MFS and the fund’s Board of Trustees. For the year ended December 31, 2014, this management fee reduction amounted to $70,529, which is included in the reduction of total expenses in the Statement of Operations. The management fee incurred for the year ended December 31, 2014 was equivalent to an annual effective rate of 0.71% of the fund’s average daily net assets.
Distributor – MFS Fund Distributors, Inc. (MFD), a wholly-owned subsidiary of MFS, is the distributor of shares of the fund. The Trustees have adopted a distribution plan for the Service Class shares pursuant to Rule 12b-1 under the Investment Company Act of 1940.
The fund’s distribution plan provides that the fund will pay MFD distribution and/or service fees equal to 0.25% per annum of its average daily net assets attributable to Service Class shares as partial consideration for services performed and expenses incurred by MFD and financial intermediaries (including participating insurance companies that invest in the fund to fund variable annuity and variable life insurance contracts, sponsors of qualified retirement and pension plans that invest in the fund, and affiliates of these participating insurance companies and plan sponsors) in connection with the sale and distribution of the Service Class shares. MFD may subsequently pay all, or a portion, of the distribution and/or service fees to financial intermediaries.
Shareholder Servicing Agent – MFS Service Center, Inc. (MFSC), a wholly-owned subsidiary of MFS, receives a fee from the fund for its services as shareholder servicing agent. For the year ended December 31, 2014, the fee was $89,291, which equated to 0.0058% annually of the fund’s average daily net assets. MFSC also receives payment from the fund for out-of-pocket expenses paid by MFSC on behalf of the fund. For the year ended December 31, 2014, these costs amounted to $2,669.
Administrator – MFS provides certain financial, legal, shareholder communications, compliance, and other administrative services to the fund. Under an administrative services agreement, the fund partially reimburses MFS the costs incurred to provide these services. The fund is charged an annual fixed amount of $17,500 plus a fee based on average daily net assets. The administrative services fee incurred for the year ended December 31, 2014 was equivalent to an annual effective rate of 0.0141% of the fund’s average daily net assets.
Trustees’ and Officers’ Compensation – The fund pays compensation to independent Trustees in the form of a retainer, attendance fees, and additional compensation to Board and Committee chairpersons. The fund does not pay compensation directly to Trustees or officers of the fund who are also officers of the investment adviser, all of whom receive remuneration for their services to the fund from MFS. Certain officers and Trustees of the fund are officers or directors of MFS, MFD, and MFSC.
Other – Effective November 1, 2014, this fund and certain other funds managed by MFS (the funds) have entered into a service agreement (the ISO Agreement) which provides for payment of fees solely by the funds to Tarantino LLC in return for the provision of services of an Independent Senior Officer (ISO) for the funds. Frank L. Tarantino serves as the ISO and is an officer of the funds and the sole member of Tarantino LLC. The funds can terminate the ISO Agreement with Tarantino LLC at any time under the terms of the ISO Agreement. Prior to November 1, 2014, the funds had entered into services agreements (the Compliance Officer Agreements) which provided for payment of fees by the funds to Tarantino LLC and Griffin Compliance LLC in return for the provision of services of an Independent Chief Compliance Officer (ICCO) and Assistant ICCO, respectively, for the funds. Prior to November 1, 2014, Frank L. Tarantino served as the ICCO. Effective October 31, 2014, Mr. Tarantino resigned as ICCO and the Compliance Officer Agreement between the funds and Tarantino LLC was terminated. Prior to June 1, 2014, Robyn L. Griffin served as the Assistant ICCO and was an officer of the funds. Ms. Griffin is the sole member of Griffin Compliance LLC. Effective May 31, 2014, Ms. Griffin resigned as Assistant ICCO and the Compliance Officer Agreement between the funds and Griffin Compliance LLC
18
MFS Growth Series
Notes to Financial Statements – continued
was terminated. For the year ended December 31, 2014, the aggregate fees paid by the fund under these agreements were $7,365 and are included in “Miscellaneous” expense in the Statement of Operations. MFS had agreed to reimburse the fund for a portion of the payments made by the fund for the services under the Compliance Officer Agreements in the amount of $2,654, which is included in the reduction of total expenses in the Statement of Operations. Additionally, MFS has agreed to bear all expenses associated with office space, other administrative support, and supplies provided to the ICCO, Assistant ICCO, and ISO.
The fund invests in the MFS Institutional Money Market Portfolio which is managed by MFS and seeks current income consistent with preservation of capital and liquidity. Income earned on this investment is included in “Dividends from underlying affiliated funds” in the Statement of Operations. This money market fund does not pay a management fee to MFS.
For the year ended December 31, 2014, purchases and sales of investments, other than short-term obligations, aggregated $549,519,870 and $676,948,394, respectively.
| (5) | | Shares of Beneficial Interest |
The fund’s Declaration of Trust permits the Trustees to issue an unlimited number of full and fractional shares of beneficial interest. Transactions in fund shares were as follows:
| | | | | | | | | | | | | | | | |
| | | Year ended 12/31/14 | | | Year ended 12/31/13 | |
| | | Shares | | | Amount | | | Shares | | | Amount | |
| Shares sold | | | | | | | | | | | | | | | | |
Initial Class | | | 1,933,212 | | | | $75,547,700 | | | | 5,035,809 | | | | $169,845,931 | |
Service Class | | | 2,525,829 | | | | 96,644,801 | | | | 2,764,608 | | | | 91,199,853 | |
| | | 4,459,041 | | | | $172,192,501 | | | | 7,800,417 | | | | $261,045,784 | |
| Shares issued to shareholders in reinvestment of distributions | | | | | | | | | | | | | | | | |
Initial Class | | | 2,206,955 | | | | $84,945,696 | | | | 330,769 | | | | $11,140,317 | |
Service Class | | | 477,396 | | | | 17,935,770 | | | | 50,463 | | | | 1,664,274 | |
| | | 2,684,351 | | | | $102,881,466 | | | | 381,232 | | | | $12,804,591 | |
| Shares reacquired | | | | | | | | | | | | | | | | |
Initial Class | | | (5,836,614 | ) | | | $(229,260,814 | ) | | | (6,822,186 | ) | | | $(229,194,954 | ) |
Service Class | | | (2,143,317 | ) | | | (79,832,216 | ) | | | (1,230,190 | ) | | | (40,548,806 | ) |
| | | (7,979,931 | ) | | | $(309,093,030 | ) | | | (8,052,376 | ) | | | $(269,743,760 | ) |
| Net change | | | | | | | | | | | | | | | | |
Initial Class | | | (1,696,447 | ) | | | $(68,767,418 | ) | | | (1,455,608 | ) | | | $(48,208,706 | ) |
Service Class | | | 859,908 | | | | 34,748,355 | | | | 1,584,881 | | | | 52,315,321 | |
| | | (836,539 | ) | | | $(34,019,063 | ) | | | 129,273 | | | | $4,106,615 | |
The fund is one of several mutual funds in which certain MFS funds may invest. The MFS funds do not invest in the underlying funds for the purpose of exercising management or control. At the end of the period, the MFS Moderate Allocation Portfolio, the MFS Growth Allocation Portfolio, and the MFS Conservative Allocation Portfolio were the owners of record of approximately 12%, 4%, and 3%, respectively, of the value of outstanding voting shares of the fund.
The fund and certain other funds managed by MFS participate in a $1.1 billion unsecured committed line of credit, subject to a $1 billion sublimit, provided by a syndication of banks under a credit agreement. Borrowings may be made for temporary financing needs. Interest is charged to each fund, based on its borrowings, generally at a rate equal to the higher of the Federal Reserve funds rate or one month LIBOR plus an agreed upon spread. A commitment fee, based on the average daily, unused portion of the committed line of credit, is allocated among the participating funds at the end of each calendar quarter. In addition, the fund and other funds managed by MFS have established unsecured uncommitted borrowing arrangements with certain banks for temporary financing needs. Interest is charged to each fund, based on its borrowings, at a rate equal to the Federal Reserve funds rate plus an agreed upon spread. For the year ended December 31, 2014, the fund’s commitment fee and interest expense were $5,688 and $0, respectively, and are included in “Miscellaneous” expense in the Statement of Operations.
19
MFS Growth Series
Notes to Financial Statements – continued
| (7) | | Transactions in Underlying Affiliated Funds – Affiliated Issuers |
An affiliated issuer may be considered one in which the fund owns 5% or more of the outstanding voting securities, or a company which is under common control. For the purposes of this report, the fund assumes the following to be an affiliated issuer:
| | | | | | | | | | | | | | | | |
| Underlying Affiliated Fund | | Beginning
Shares/Par
Amount | | | Acquisitions
Shares/Par
Amount | | | Dispositions
Shares/Par
Amount | | | Ending
Shares/Par
Amount | |
| MFS Institutional Money Market Portfolio | | | 22,764,729 | | | | 269,874,861 | | | | (273,244,279 | ) | | | 19,395,311 | |
| | | | |
| Underlying Affiliated Fund | | Realized
Gain (Loss) | | | Capital Gain
Distributions | | | Dividend
Income | | | Ending
Value | |
| MFS Institutional Money Market Portfolio | | | $— | | | | $— | | | | $20,885 | | | | $19,395,311 | |
20
MFS Growth Series
REPORT OF INDEPENDENT REGISTERED PUBLIC ACCOUNTING FIRM
To the Board of Trustees of MFS Variable Insurance Trust and the Shareholders of
MFS Growth Series:
We have audited the accompanying statement of assets and liabilities, including the portfolio of investments, of MFS Growth Series (one of the series of MFS Variable Insurance Trust) (the “Fund”) as of December 31, 2014, and the related statement of operations for the year then ended, the statements of changes in net assets for each of the two years in the period then ended, and the financial highlights for each of the five years in the period then ended. These financial statements and financial highlights are the responsibility of the Fund’s management. Our responsibility is to express an opinion on these financial statements and financial highlights based on our audits.
We conducted our audits in accordance with the standards of the Public Company Accounting Oversight Board (United States). Those standards require that we plan and perform the audit to obtain reasonable assurance about whether the financial statements and financial highlights are free of material misstatement. The Fund is not required to have, nor were we engaged to perform, an audit of its internal control over financial reporting. Our audits included consideration of internal control over financial reporting as a basis for designing audit procedures that are appropriate in the circumstances, but not for the purpose of expressing an opinion on the effectiveness of the Fund’s internal control over financial reporting. Accordingly, we express no such opinion. An audit also includes examining, on a test basis, evidence supporting the amounts and disclosures in the financial statements, assessing the accounting principles used and significant estimates made by management, as well as evaluating the overall financial statement presentation. Our procedures included confirmation of securities owned as of December 31, 2014, by correspondence with the custodian and brokers; where replies were not received from brokers, we performed other auditing procedures. We believe that our audits provide a reasonable basis for our opinion.
In our opinion, the financial statements and financial highlights referred to above present fairly, in all material respects, the financial position of MFS Growth Series as of December 31, 2014, the results of its operations for the year then ended, the changes in its net assets for each of the two years in the period then ended, and the financial highlights for each of the five years in the period then ended, in conformity with accounting principles generally accepted in the United States of America.
DELOITTE & TOUCHE LLP
Boston, Massachusetts
February 13, 2015
21
MFS Growth Series
TRUSTEES AND OFFICERS – IDENTIFICATION AND BACKGROUND
The Trustees and Officers of the Trust, as of February 1, 2015, are listed below, together with their principal occupations during the past five years. (Their titles may have varied during that period.) The address of each Trustee and Officer is 111 Huntington Avenue, Boston, Massachusetts 02199-7618.
| | | | | | | | |
Name, Age | | Position(s)
Held with Fund | | Trustee/Officer
Since (h) | | Principal Occupations
During the Past Five Years | | Other Directorships (j) |
| INTERESTED TRUSTEES |
Robert J. Manning (k) (age 51) | | Trustee | | February 2004 | | Massachusetts Financial Services Company, Chairman, Co-Chief Executive Officer and Director; President (until 2009); Chief Investment Officer (until 2010) | | N/A |
| | | | |
Robin A. Stelmach (k) (age 53) | | Trustee and President | | January 2014 | | Massachusetts Financial Services Company, Executive Vice President and Chief Operating Officer | | N/A |
| | | |
| INDEPENDENT TRUSTEES | | | | | | |
David H. Gunning (age 72) | | Trustee and Chair of Trustees | | January 2004 | | Private investor | | Lincoln Electric Holdings, Inc. (welding equipment manufacturer), Director; Development Alternatives, Inc. (consulting), Director/Non-Executive Chairman |
| | | | |
Steven E. Buller (age 63) | | Trustee | | February 2014 | | Chairman, Financial Accounting Standards Advisory Council; Standing Advisory Group, Public Company Accounting Oversight Board, Member (until 2014); BlackRock, Inc. (investment management), Managing Director (until 2014), BlackRock Finco UK (investment management), Director (until 2014) | | N/A |
| | | | |
Robert E. Butler (age 73) | | Trustee | | January 2006 | | Consultant – investment company industry regulatory and compliance matters | | N/A |
| | | | |
Maureen R. Goldfarb (age 59) | | Trustee | | January 2009 | | Private investor | | N/A |
| | | | |
William R. Gutow (age 73) | | Trustee | | December 1993 | | Private investor and real estate consultant; Capitol Entertainment Management Company (video franchise), Vice Chairman | | Texas Donuts (donut franchise), Vice Chairman (until 2010) |
| | | | |
Michael Hegarty (age 70) | | Trustee | | December 2004 | | Private investor | | Brookfield Office Properties, Inc. (real estate), Director; Rouse Properties Inc. (real estate), Director; Capmark Financial Group Inc. (real estate), Director |
| | | | |
John P. Kavanaugh (age 60) | | Trustee | | January 2009 | | Private investor | | N/A |
| | | | |
Maryanne L. Roepke (age 58) | | Trustee | | May 2014 | | American Century Investments (investment management), Senior Vice President and Chief Compliance Officer (until 2014) | | N/A |
| | | | |
Laurie J. Thomsen (age 57) | | Trustee | | March 2005 | | Private investor; New Profit, Inc. (venture philanthropy), Executive Partner (until 2010) | | The Travelers Companies (insurance), Director |
| | | | |
Robert W. Uek (age 73) | | Trustee | | January 2006 | | Consultant to investment company industry | | N/A |
| | | | |
| OFFICERS | | | | | | | | |
Christopher R. Bohane (k) (age 41) | | Assistant Secretary and Assistant Clerk | | July 2005 | | Massachusetts Financial Services Company, Vice President and Assistant General Counsel | | N/A |
| | | | |
Kino Clark (k) (age 46) | | Assistant Treasurer | | January 2012 | | Massachusetts Financial Services Company, Vice President | | N/A |
| | | | |
Thomas H. Connors (k) (age 55) | | Assistant Secretary and Assistant Clerk | | September 2012 | | Massachusetts Financial Services Company, Vice President and Senior Counsel; Deutsche Investment Management Americas Inc. (financial service provider), Director and Senior Counsel (until 2012) | | N/A |
22
MFS Growth Series
Trustees and Officers – continued
| | | | | | | | |
Name, Age | | Position(s)
Held with Fund | | Trustee/Officer
Since (h) | | Principal Occupations
During the Past Five Years | | Other Directorships (j) |
Ethan D. Corey (k) (age 51) | | Assistant
Secretary and Assistant Clerk | | July 2005 | | Massachusetts Financial Services Company, Senior Vice President and Associate General Counsel | | N/A |
| | | | |
David L. DiLorenzo (k) (age 46) | | Treasurer | | July 2005 | | Massachusetts Financial Services Company, Senior Vice President | | N/A |
| | | | |
Timothy M. Fagan (k) (age 46) | | Chief Compliance Officer | | November 2014 | | Massachusetts Financial Services Company, Chief Compliance Officer; Vice President and Senior Counsel (until 2012) | | N/A |
| | | | |
Brian E. Langenfeld (k) (age 41) | | Assistant
Secretary and Assistant Clerk | | June 2006 | | Massachusetts Financial Services Company, Vice President and Senior Counsel | | N/A |
| | | | |
Susan S. Newton (k) (age 64) | | Assistant
Secretary and Assistant Clerk | | May 2005 | | Massachusetts Financial Services Company, Senior Vice President and Associate General Counsel | | N/A |
| | | | |
Susan A. Pereira (k) (age 44) | | Assistant
Secretary and Assistant Clerk | | July 2005 | | Massachusetts Financial Services Company, Vice President and Senior Counsel | | N/A |
| | | | |
Kasey L. Phillips (k) (age 44) | | Assistant Treasurer | | September 2012 | | Massachusetts Financial Services Company, Vice President; Wells Fargo Funds Management, LLC, Senior Vice President, Fund Treasurer (until 2012) | | N/A |
| | | | |
Mark N. Polebaum (k) (age 62) | | Secretary and
Clerk | | January 2006 | | Massachusetts Financial Services Company, Executive Vice President, General Counsel and Secretary | | N/A |
| | | | |
Matthew A. Stowe (k) (age 40) | | Assistant Secretary and Assistant Clerk | | October 2014 | | Massachusetts Financial Services Company, Vice President and Senior Counsel | | N/A |
| | | | |
Frank L. Tarantino (age 70) | | Independent
Senior Officer | | June 2004 | | Tarantino LLC (provider of compliance services), Principal | | N/A |
| | | | |
Richard S. Weitzel (k) (age 44) | | Assistant Secretary and Assistant Clerk | | October 2007 | | Massachusetts Financial Services Company, Senior Vice President and Associate General Counsel | | N/A |
| | | | |
James O. Yost (k) (age 54) | | Deputy Treasurer | | September 1990 | | Massachusetts Financial Services Company, Senior Vice President | | N/A |
| (h) | Date first appointed to serve as Trustee/officer of an MFS Fund. Each Trustee has served continuously since appointment unless indicated otherwise. For the period from December 15, 2004 until February 22, 2005, Mr. Manning served as Advisory Trustee. Prior to January 2012, Messrs. DiLorenzo and Yost served as Assistant Treasurers of the Funds. Ms. Stelmach was appointed as President of the Funds as of October 1, 2014. |
| (j) | Directorships or trusteeships of companies required to report to the Securities and Exchange Commission (i.e., “public companies”). |
| (k) | “Interested person” of the Trust within the meaning of the Investment Company Act of 1940 (referred to as the 1940 Act), which is the principal federal law governing investment companies like the fund, as a result of a position with MFS. The address of MFS is 111 Huntington Avenue, Boston, Massachusetts 02199-7618. |
Each Trustee (except Ms. Stelmach, Mr. Buller and Ms. Roepke) has been elected by shareholders and each Trustee and officer holds office until his or her successor is chosen and qualified or until his or her earlier death, resignation, retirement or removal. The Trust does not hold annual meetings for the purpose of electing Trustees, and Trustees are not elected for fixed terms. Messrs. Butler, Kavanaugh, Uek and Mses. Thomsen and Roepke are members of the Trust’s Audit Committee.
Each of the Fund’s Trustees and officers holds comparable positions with certain other funds of which MFS or a subsidiary is the investment adviser or distributor, and, in the case of the officers, with certain affiliates of MFS. As of February 1, 2015, the Trustees served as board members of 135 funds within the MFS Family of Funds.
23
MFS Growth Series
Trustees and Officers – continued
The Statement of Additional Information for the Fund includes further information about the Trustees and is available without charge upon request by calling 1-800-225-2606.
| | |
Investment Adviser Massachusetts Financial Services Company 111 Huntington Avenue Boston, MA 02199-7618 | | Custodian State Street Bank and Trust Company 1 Lincoln Street Boston, MA 02111-2900 |
Distributor MFS Fund Distributors, Inc. 111 Huntington Avenue Boston, MA 02199-7618 | | Independent Registered Public Accounting Firm Deloitte & Touche LLP 200 Berkeley Street Boston, MA 02116 |
Portfolio Managers Eric Fischman Matthew Sabel | | |
24
MFS Growth Series
BOARD REVIEW OF INVESTMENT ADVISORY AGREEMENT
The Investment Company Act of 1940 requires that both the full Board of Trustees and a majority of the non-interested (“independent”) Trustees, voting separately, annually approve the continuation of the Fund’s investment advisory agreement with MFS. The Trustees consider matters bearing on the Fund and its advisory arrangements at their meetings throughout the year, including a review of performance data at each regular meeting. In addition, the independent Trustees met several times over the course of three months beginning in May and ending in July, 2014 (“contract review meetings”) for the specific purpose of considering whether to approve the continuation of the investment advisory agreement for the Fund and the other investment companies that the Board oversees (the “MFS Funds”). The independent Trustees were assisted in their evaluation of the Fund’s investment advisory agreement by independent legal counsel, from whom they received separate legal advice and with whom they met separately from MFS during various contract review meetings. The independent Trustees were also assisted in this process by the MFS Funds’ Independent Chief Compliance Officer, a full-time senior officer appointed by and reporting to the independent Trustees.
In connection with their deliberations regarding the continuation of the investment advisory agreement, the Trustees, including the independent Trustees, considered such information and factors as they believed, in light of the legal advice furnished to them and their own business judgment, to be relevant. The investment advisory agreement for the Fund was considered separately, although the Trustees also took into account the common interests of all MFS Funds in their review. As described below, the Trustees considered the nature, quality, and extent of the various investment advisory, administrative, and shareholder services performed by MFS under the existing investment advisory agreement and other arrangements with the Fund.
In connection with their contract review meetings, the Trustees received and relied upon materials that included, among other items: (i) information provided by Lipper Inc., an independent third party, on the investment performance of the Fund for various time periods ended December 31, 2013 and the investment performance of a group of funds with substantially similar investment classifications/objectives (the “Lipper performance universe”), (ii) information provided by Lipper Inc. on the Fund’s advisory fees and other expenses and the advisory fees and other expenses of comparable funds identified by Lipper Inc. (the “Lipper expense group”), (iii) information provided by MFS on the advisory fees of comparable portfolios of other clients of MFS, including institutional separate accounts and other clients, (iv) information as to whether and to what extent applicable expense waivers, reimbursements or fee “breakpoints” are observed for the Fund, (v) information regarding MFS’ financial results and financial condition, including MFS’ and certain of its affiliates’ estimated profitability from services performed for the Fund and the MFS Funds as a whole, and compared to MFS’ institutional business, (vi) MFS’ views regarding the outlook for the mutual fund industry and the strategic business plans of MFS, (vii) descriptions of various functions performed by MFS for the Funds, such as compliance monitoring and portfolio trading practices, and (viii) information regarding the overall organization of MFS, including information about MFS’ senior management and other personnel providing investment advisory, administrative and other services to the Fund and the other MFS Funds. The comparative performance, fee and expense information prepared and provided by Lipper Inc. was not independently verified and the independent Trustees did not independently verify any information provided to them by MFS.
The Trustees’ conclusion as to the continuation of the investment advisory agreement was based on a comprehensive consideration of all information provided to the Trustees and not the result of any single factor. Some of the factors that figured particularly in the Trustees’ deliberations are described below, although individual Trustees may have evaluated the information presented differently from one another, giving different weights to various factors. It is also important to recognize that the fee arrangements for the Fund and other MFS Funds are the result of years of review and discussion between the independent Trustees and MFS, that certain aspects of such arrangements may receive greater scrutiny in some years than in others, and that the Trustees’ conclusions may be based, in part, on their consideration of these same arrangements during the course of the year and in prior years.
Based on information provided by Lipper Inc. and MFS, the Trustees reviewed the Fund’s total return investment performance as well as the performance of peer groups of funds over various time periods. The Trustees placed particular emphasis on the total return performance of the Fund’s Initial Class shares in comparison to the performance of funds in its Lipper performance universe over the three-year period ended December 31, 2013, which the Trustees believed was a long enough period to reflect differing market conditions. The total return performance of the Fund’s Initial Class shares was in the 2nd quintile relative to the other funds in the universe for this three-year period (the 1st quintile being the best performers and the 5th quintile being the worst performers). The total return performance of the Fund’s Initial Class shares was in the 2nd quintile for each of the one- and five-year periods ended December 31, 2013 relative to the Lipper performance universe. Because of the passage of time, these performance results may differ from the performance results for more recent periods, including those shown elsewhere in this report.
In the course of their deliberations, the Trustees took into account information provided by MFS in connection with the contract review meetings, as well as during investment review meetings conducted with portfolio management personnel during the course of the year regarding the Fund’s performance. After reviewing these and related factors, the Trustees concluded, within the context of their overall conclusions regarding the investment advisory agreement, that they were satisfied with MFS’ responses and efforts relating to investment performance.
25
MFS Growth Series
Board Review of Investment Advisory Agreement – continued
In assessing the reasonableness of the Fund’s advisory fee, the Trustees considered, among other information, the Fund’s advisory fee and the total expense ratio of the Fund’s Initial Class shares as a percentage of average daily net assets and the advisory fee and total expense ratios of peer groups of funds based on information provided by Lipper Inc. The Trustees considered that, according to the Lipper data (which takes into account any fee reductions or expense limitations that were in effect during the Fund’s last fiscal year), the Fund’s effective advisory fee rate and total expense ratio were each higher than the Lipper expense group median.
The Trustees also considered the advisory fees charged by MFS to any comparable institutional accounts. In comparing these fees, the Trustees considered information provided by MFS as to the generally broader scope of services provided by MFS to the Fund in comparison to institutional accounts, the higher demands placed on MFS’ investment personnel and trading infrastructure as a result of the daily cash in-flows and out-flows of the Fund, and the impact on MFS and expenses associated with the more extensive regulatory regime to which the Fund is subject in comparison to institutional accounts.
The Trustees also considered whether the Fund may benefit from any economies of scale in the management of the Fund in the event of growth in assets of the Fund and/or growth in assets of the MFS Funds as a whole. They noted that the Fund’s advisory fee rate schedule is subject to a contractual breakpoint that reduces the Fund’s advisory fee rate on average daily net assets over $1 billion. The Trustees also noted that MFS has agreed in writing to waive a portion of the management fees of certain MFS Funds, including the Fund, if the total combined assets of certain funds within the MFS Funds’ complex increase above agreed upon thresholds (the “group fee waiver”), enabling the Fund’s shareholders to share in the benefits from any economies of scale at the complex level. The group fee waiver is reviewed and renewed annually between the Board and MFS. The Trustees concluded that the breakpoint and the group fee waiver were sufficient to allow the Fund to benefit from economies of scale as its assets and overall complex assets grow.
The Trustees also considered information prepared by MFS relating to MFS’ costs and profits with respect to the Fund, the MFS Funds considered as a group, and other investment companies and accounts advised by MFS, as well as MFS’ methodologies used to determine and allocate its costs to the MFS Funds, the Fund and other accounts and products for purposes of estimating profitability.
After reviewing these and other factors described herein, the Trustees concluded, within the context of their overall conclusions regarding the investment advisory agreement, that the advisory fees charged to the Fund represent reasonable compensation in light of the services being provided by MFS to the Fund.
In addition, the Trustees considered MFS’ resources and related efforts to continue to retain, attract and motivate capable personnel to serve the Fund. The Trustees also considered current and developing conditions in the financial services industry, including the presence of large and well-capitalized companies which are spending, and appear to be prepared to continue to spend, substantial sums to engage personnel and to provide services to competing investment companies. In this regard, the Trustees also considered the financial resources of MFS and its ultimate parent, Sun Life Financial Inc. The Trustees also considered the advantages and possible disadvantages to the Fund of having an adviser that also serves other investment companies as well as other accounts.
The Trustees also considered the nature, quality, cost, and extent of administrative, transfer agency, and distribution services provided to the Fund by MFS and its affiliates under agreements and plans other than the investment advisory agreement, including any 12b-1 fees the Fund pays to MFS Fund Distributors, Inc., an affiliate of MFS. The Trustees also considered the nature, extent and quality of certain other services MFS performs or arranges for on the Fund’s behalf, which may include securities lending programs, directed expense payment programs, class action recovery programs, and MFS’ interaction with third-party service providers, principally custodians and sub-custodians. The Trustees concluded that the various non-advisory services provided by MFS and its affiliates on behalf of the Fund were satisfactory.
The Trustees also considered benefits to MFS from the use of the Fund’s portfolio brokerage commissions, if applicable, to pay for investment research and various other factors. Additionally, the Trustees considered so-called “fall-out benefits” to MFS such as reputational value derived from serving as investment manager to the Fund.
Based on their evaluation of factors that they deemed to be material, including those factors described above, the Board of Trustees, including the independent Trustees, concluded that the Fund’s investment advisory agreement with MFS should be continued for an additional one-year period, commencing August 1, 2014.
26
MFS Growth Series
PROXY VOTING POLICIES AND INFORMATION
MFS votes proxies on behalf of the fund pursuant to proxy voting policies and procedures that are available without charge, upon request, by calling 1-800-225-2606, by visiting the Proxy Voting section of mfs.com or by visiting the SEC’s Web site at http://www.sec.gov.
Information regarding how the fund voted proxies relating to portfolio securities during the most recent twelve-month period ended June 30 is available without charge by visiting the Proxy Voting section of mfs.com or by visiting the SEC’s Web site at http://www.sec.gov.
QUARTERLY PORTFOLIO DISCLOSURE
The fund will file a complete schedule of portfolio holdings with the Securities and Exchange Commission (the Commission) for the first and third quarters of each fiscal year on Form N-Q. The fund’s Form N-Q is available on the EDGAR database on the Commission’s Internet Web site at http://www.sec.gov, and may be reviewed and copied at the:
Public Reference Room
Securities and Exchange Commission
100 F Street, NE, Room 1580
Washington, D.C. 20549
Information on the operation of the Public Reference Room may be obtained by calling the Commission at 1-800-SEC-0330. Copies of the fund’s Form N-Q also may be obtained, upon payment of a duplicating fee, by electronic request at the following e-mail address: publicinfo@sec.gov or by writing the Public Reference Section at the above address.
FURTHER INFORMATION
From time to time, MFS may post important information about the fund or the MFS funds on the MFS web site (mfs.com). This information is available by visiting the “Market Commentary” and “Announcements” sub sections in the “Market Outlooks” section of mfs.com or by clicking on the fund’s name under “Variable Insurance Portfolios — VIT” in the “Products” section of mfs.com.
FEDERAL TAX INFORMATION (unaudited)
The following information is provided pursuant to provisions of the Internal Revenue Code.
The fund designates $82,118,000 as capital gain dividends paid during the fiscal year.
For corporate shareholders, 36.45% of the ordinary income dividends paid during the fiscal year qualify for the corporate dividends received deduction.
27
rev. 3/11
| | | | |
| FACTS | | WHAT DOES MFS DO WITH YOUR
PERSONAL INFORMATION? | |  |
| | |
| Why? | | Financial companies choose how they share your personal information. Federal law gives consumers the right to limit some but not all sharing. Federal law also requires us to tell you how we collect, share, and protect your personal information. Please read this notice carefully to understand what we do. |
| | |
| What? | | The types of personal information we collect and share depend on the product or service you have with us. This information can include: • Social Security number and account balances • Account transactions and transaction history • Checking account information and wire transfer instructions When you are no longer our customer, we continue to share your information as described in this notice. |
| | |
| How? | | All financial companies need to share customers’ personal information to run their everyday business. In the section below, we list the reasons financial companies can share their customers’ personal information; the reasons MFS chooses to share; and whether you can limit this sharing. |
| | | | |
Reasons we can share your
personal information | | Does MFS share? | | Can you limit this
sharing? |
For our everyday business purposes – such as to process your transactions, maintain your account(s), respond to court orders and legal investigations, or report to credit bureaus | | Yes | | No |
For our marketing purposes – to offer our products and services to you | | No | | We don’t share |
| For joint marketing with other financial companies | | No | | We don’t share |
For our affiliates’ everyday business purposes – information about your transactions and experiences | | No | | We don’t share |
For our affiliates’ everyday business purposes – information about your creditworthiness | | No | | We don’t share |
| For nonaffiliates to market to you | | No | | We don’t share |
| | |
| Questions? | | Call 800-225-2606 or go to mfs.com. |
28
| | |
| Who we are |
| Who is providing this notice? | | MFS Funds, MFS Investment Management, MFS Institutional Advisors, Inc., MFS Fund Distributors, Inc., MFS Heritage Trust Company, and MFS Service Center, Inc. |
| | |
| What we do |
| How does MFS protect my personal information? | | To protect your personal information from unauthorized access and use, we use security measures that comply with federal law. These measures include procedural, electronic, and physical safeguards for the protection of the personal information we collect about you. |
How does MFS
collect my personal information? | | We collect your personal information, for example, when you • open an account or provide account information • direct us to buy securities or direct us to sell your securities • make a wire transfer We also collect your personal information from others, such as credit bureaus, affiliates and other companies. |
| Why can’t I limit all sharing? | | Federal law gives you the right to limit only • sharing for affiliates’ everyday business purposes – information about your creditworthiness • affiliates from using your information to market to you • sharing for nonaffiliates to market to you State laws and individual companies may give you additional rights to limit sharing. |
| | |
| Definitions |
| Affiliates | | Companies related by common ownership or control. They can be financial and nonfinancial companies. •MFS does not share personal information with affiliates, except for everyday business purposes as described on page one of this notice. |
| Nonaffiliates | | Companies not related by common ownership or control. They can be financial and nonfinancial companies. •MFS does not share with nonaffiliates so they can market to you. |
| Joint Marketing | | A formal agreement between nonaffiliated financial companies that together market financial products or services to you. •MFS doesn’t jointly market. |
| | |
| Other important information |
| If you own an MFS product or receive an MFS service in the name of a third party such as a bank or broker-dealer, their privacy policy may apply to you instead of ours. |
29
ANNUAL REPORT
December 31, 2014

MFS® INVESTORS GROWTH STOCK SERIES
MFS® Variable Insurance Trust

VGS-ANN
MFS® INVESTORS GROWTH STOCK SERIES
CONTENTS
The report is prepared for the general information of contract owners. It is authorized for distribution to prospective investors only when preceded or accompanied by a current prospectus.
NOT FDIC INSURED Ÿ MAY LOSE VALUE Ÿ NO BANK OR CREDIT UNION GUARANTEE Ÿ NOT A DEPOSIT Ÿ NOT INSURED BY ANY FEDERAL GOVERNMENT AGENCY OR NCUA/NCUSIF
MFS Investors Growth Stock Series
LETTER FROM THE CHAIRMAN

Dear Contract Owners:
As 2015 begins, sharply lower oil prices are reshaping the global economy, adding to deflationary pressures in the eurozone and exacerbating challenges faced by oil exporters such as Russia. The U.S. economy stands on firmer ground, having expanded steadily over the past year. The U.S. labor market has regained momentum, consumer confidence is buoyant and gasoline prices have tumbled, boosting prospects for a stronger economic rebound in 2015.
Other regions are struggling. The eurozone economy is barely expanding, and the European Central Bank (ECB) has introduced large-scale asset purchases.
Despite Japan’s efforts to strengthen its economy, its sales tax increase last spring tipped the country into a recession, leading to additional monetary stimulus from the Bank of Japan. China’s economy is slowing as it transitions to a more sustainable basis, and its growth rate will likely continue to decline.
As always, active risk management is integral to how we at MFS® manage your investments. We use a collaborative process, sharing insights across asset classes, regions and economic sectors. Our global investment team uses a diversified, multidisciplined, long-term approach.
Applying proven principles, such as asset allocation and diversification, can best serve investors over the long term. We are confident that this approach can help you as you work with your financial advisors to reach your goals in the years ahead.
Respectfully,

Robert J. Manning
Chairman
MFS Investment Management
February 13, 2015
The opinions expressed in this letter are subject to change and may not be relied upon for investment advice. No forecasts can be guaranteed.
1
MFS Investors Growth Stock Series
PORTFOLIO COMPOSITION
Portfolio structure
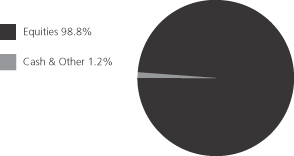
| | | | |
| Top ten holdings | |
| Google, Inc., “A” | | | 4.2% | |
| Accenture PLC, “A” | | | 4.1% | |
| Visa, Inc., “A” | | | 4.0% | |
| Colgate-Palmolive Co. | | | 3.5% | |
| Danaher Corp. | | | 3.3% | |
| United Technologies Corp. | | | 3.1% | |
| Oracle Corp. | | | 2.9% | |
| CVS Health Corp. | | | 2.8% | |
| Schlumberger Ltd. | | | 2.8% | |
| EMC Corp. | | | 2.4% | |
| | | | |
| Equity sectors | |
| Industrial Goods & Services | | | 14.2% | |
| Health Care | | | 13.9% | |
| Technology | | | 13.5% | |
| Consumer Staples | | | 12.3% | |
| Retailing | | | 9.7% | |
| Financial Services | | | 9.2% | |
| Leisure | | | 9.2% | |
| Special Products & Services | | | 7.7% | |
| Basic Materials | | | 3.2% | |
| Energy | | | 3.2% | |
| Autos & Housing | | | 2.1% | |
| Transportation | | | 0.6% | |
Cash & Other can include cash, other assets less liabilities, offsets to derivative positions, and short-term securities.
Percentages are based on net assets as of 12/31/14.
The portfolio is actively managed and current holdings may be different.
2
MFS Investors Growth Stock Series
MANAGEMENT REVIEW
Summary of Results
For the twelve months ended December 31, 2014, Initial Class shares of the MFS Investors Growth Stock Series (“fund”) provided a total return of 11.45%, while Service Class shares of the fund provided a total return of 11.11%. These compare with a return of 13.05% over the same period for the fund’s benchmark, the Russell 1000 Growth Index.
Market Environment
Early in the period, US equities suffered what proved to be a temporary setback due to concerns over emerging markets as well as what was perceived at the time to be a pause in US economic growth, partially caused by extreme weather events and a weak December 2013 labor market report. Markets soon recovered as the economic pause concluded and investors appeared to have become increasingly comfortable that newly-installed US Federal Reserve (“Fed”) Chair Janet Yellen would not make any substantial changes to the trajectory of Fed monetary policy.
A generally risk-friendly, carry trade environment persisted from February 2014 until mid-year. While geopolitical tensions flared in the Middle East and Russia/Ukraine, any market setbacks were short-lived as improving economic growth in the US, coupled with prospects for easier monetary policy in regions with slowing growth, such as Japan, Europe and China, supported risk assets. For example, the European Central Bank (“ECB”) cut policy interest rates into negative territory and, by the end of the period, expectations were for additional rate cuts and the announcement for non-conventional easing measures. Similarly, the Bank of Japan surprised markets late in the period with fresh stimulus measures given lackluster growth trends. The related decline in developed market government bond yields and credit spreads were also supportive for equity markets. At the end of the period, the US equity market was trading close to all-time highs and US Treasury yields were close to their lows for the period. However, credit markets did not fare as well in the second half of 2014, particularly US high yield and emerging market debt. The higher weightings of oil and gas credits in these asset classes resulted in widening spreads and increased volatility as oil prices began to decline in an accelerated fashion in the fourth quarter.
Detractors from Performance
Stock selection in the technology sector detracted from the fund’s performance relative to the Russell 1000 Growth Index. An underweight position in computer and personal electronics maker Apple and not holding software giant Microsoft and social networking service provider Facebook dampened relative results as all three stocks outpaced the benchmark during the reporting period. An overweight position in poor-performing internet giant Google further weighed on relative returns. Shares of Google fell as the company missed analysts’ estimates for both revenue and income for four consecutive quarters. The company continued to face headwinds from a maturing internet search market, challenges with monetizing mobile search and regulatory anti-trust rulings in the European Union.
Stock selection and an underweight position in the transportation sector also had a negative impact on relative performance. Not holding railroad and freight transportation services provider Union Pacific hindered relative results. Shares of Union Pacific benefited from positive earnings primarily due to increased volume, a beneficial pricing environment and share repurchases.
Stock selection in the health care sector also hurt relative returns. However, no individual stocks within this sector were among the fund’s top relative detractors during the reporting period.
Other individual stocks that detracted from relative performance included an overweight position in global media company Discovery Communications, investment management firm Franklin Resources and building systems and aerospace products and services provider United Technologies. Holdings of French international food producer Danone (b) and French luxury goods company LVMH (b) also dampened relative performance as both stocks underperformed the benchmark during the reporting period. Shares of Danone fell as weakness in two of the company’s key dairy markets, the Eurozone and the United States, and also in its Baby Food segment, hurt results. Additionally, investors appeared to have been concerned about the negative impact on sales that resulted from the Fonterra product recall in mainland China.
Contributors to Performance
The combination of an underweight position and stock selection in the energy sector benefited relative returns. There were no individual stocks within this sector that were among the fund’s top relative contributors during the reporting period.
Strong stock selection within the industrial goods & services sector further supported relative performance, led by the fund’s holdings of sensors and controls manufacturer Sensata Technologies (b). Shares of Sensata Technologies appreciated after the company reported results showing positive earnings trends, particularly in the European auto segment.
Elsewhere, not holding internet retailer Amazon.com and telecommunications company Verizon Communications strengthened relative performance. Overweight positions in drugstore retailer CVS Health, animal health products manufacturer Zoetis, paint and coating company Sherwin Williams and data storage systems provider EMC also aided relative results. Shares of EMC benefited from revenues that came in ahead of consensus and the company’s announcement of an acceleration in its buyback program for the rest
3
MFS Investors Growth Stock Series
Management Review – continued
of 2014 which was positive for the stock. Holdings of media firm Time Warner (b) and semiconductor manufacturer Taiwan Semiconductor (b) (Taiwan) and an underweight position in poor-performing diversified technology products and services company International Business Machines (IBM) (h) further supported relative returns.
Respectfully,
Jeffrey Constantino
Portfolio Manager
| (b) | Security is not a benchmark constituent. |
| (h) | Security was not held in the portfolio at period end. |
The views expressed in this report are those of the portfolio manager only through the end of the period of the report as stated on the cover and do not necessarily reflect the views of MFS or any other person in the MFS organization. These views are subject to change at any time based on market or other conditions, and MFS disclaims any responsibility to update such views. These views may not be relied upon as investment advice or an indication of trading intent on behalf of any MFS portfolio. References to specific securities are not recommendations of such securities, and may not be representative of any MFS portfolio’s current or future investments.
4
MFS Investors Growth Stock Series
PERFORMANCE SUMMARY THROUGH 12/31/14
The following chart illustrates the historical performance of the fund in comparison to its benchmark(s). Benchmarks are unmanaged and may not be invested in directly. Benchmark returns do not reflect any fees or expenses. The performance of other share classes will be greater than or less than that of the class depicted below. (See Notes to Performance Summary.)
Performance data shown represents past performance and is no guarantee of future results. Investment return and principal value fluctuate so your units, when sold, may be worth more or less than the original cost; current performance may be lower or higher than quoted. The performance shown does not reflect the deduction of taxes, if any, that a contract holder would pay on fund distributions or the redemption of contract units. The returns for the fund shown also do not reflect the deduction of expenses associated with variable products, such as mortality and expense risk charges, separate account charges, and sales charges imposed by the insurance company separate accounts. Such expenses would reduce the overall returns shown.
Growth of a Hypothetical $10,000 Investment
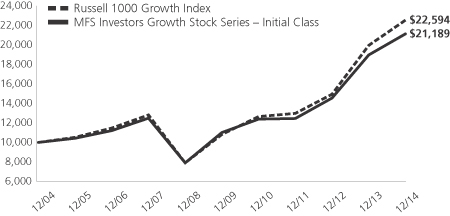
Total Returns through 12/31/14
Average annual total returns
| | | | | | | | | | | | |
| | | Share Class | | Class inception date | | 1-yr | | 5-yr | | 10-yr | | |
| | | Initial Class | | 5/03/99 | | 11.45% | | 13.95% | | 7.80% | | |
| | | Service Class | | 5/01/00 | | 11.11% | | 13.67% | | 7.53% | | |
| | | | |
| Comparative benchmark | | | | | | | | |
| | | Russell 1000 Growth Index (f) | | 13.05% | | 15.81% | | 8.49% | | |
| (f) | Source: FactSet Research Systems Inc. |
Benchmark Definition
Russell 1000 Growth Index – constructed to provide a comprehensive barometer for growth securities in the large-cap segment of the U.S. equity universe. Companies in this index generally have higher price-to-book ratios and higher forecasted growth values.
It is not possible to invest directly in an index.
Notes to Performance Summary
Average annual total return represents the average annual change in value for each share class for the periods presented.
Performance results reflect any applicable expense subsidies and waivers in effect during the periods shown. Without such subsidies and waivers the fund’s performance results would be less favorable. Please see the prospectus and financial statements for complete details. All results are historical and assume the reinvestment of any dividends and capital gains distributions.
Performance results do not include adjustments made for financial reporting purposes in accordance with U.S. generally accepted accounting principles and may differ from amounts reported in the financial highlights.
From time to time the fund may receive proceeds from litigation settlements, without which performance would be lower.
5
MFS Investors Growth Stock Series
EXPENSE TABLE
Fund Expenses Borne by the Contract Holders During the Period,
July 1, 2014 through December 31, 2014
As a contract holder of the fund, you incur ongoing costs, including management fees; distribution and/or service (12b-1) fees; and other fund expenses. This example is intended to help you understand your ongoing costs (in dollars) of investing in the fund and to compare these costs with the ongoing costs of investing in other mutual funds.
The example is based on an investment of $1,000 invested at the beginning of the period and held for the entire period July 1, 2014 through December 31, 2014.
Actual Expenses
The first line for each share class in the following table provides information about actual account values and actual expenses. You may use the information in this line, together with the amount you invested, to estimate the expenses that you paid over the period. Simply divide your account value by $1,000 (for example, an $8,600 account value divided by $1,000 = 8.6), then multiply the result by the number in the first line under the heading entitled “Expenses Paid During Period” to estimate the expenses you paid on your account during this period.
Hypothetical Example for Comparison Purposes
The second line for each share class in the following table provides information about hypothetical account values and hypothetical expenses based on the fund’s actual expense ratio and an assumed rate of return of 5% per year before expenses, which is not the fund’s actual return. The hypothetical account values and expenses may not be used to estimate the actual ending account balance or expenses you paid for the period. You may use this information to compare the ongoing costs of investing in the fund and other funds. To do so, compare this 5% hypothetical example with the 5% hypothetical examples that appear in the shareholder reports of the other funds.
Please note that the expenses shown in the table are meant to highlight the fund’s ongoing costs only and do not take into account the fees and expenses imposed under the variable contracts through which your investment in the fund is made. Therefore, the second line for each share class in the table is useful in comparing ongoing costs associated with an investment in vehicles (such as the fund) which fund benefits under variable annuity and variable life insurance contracts and to qualified pension and retirement plans only, and will not help you determine the relative total costs of investing in the fund through variable annuity and variable life insurance contracts. If the fees and expenses imposed under the variable contracts were included, your costs would have been higher.
| | | | | | | | | | | | | | | | | | |
| Share Class | | | | Annualized
Expense Ratio | | | Beginning
Account Value
7/01/14 | | | Ending Account Value
12/31/14 | | | Expenses Paid
During Period (p)
7/01/14-12/31/14 | |
| Initial Class | | Actual | | | 0.82% | | | | $1,000.00 | | | | $1,064.49 | | | | $4.27 | |
| | Hypothetical (h) | | | 0.82% | | | | $1,000.00 | | | | $1,021.07 | | | | $4.18 | |
| Service Class | | Actual | | | 1.07% | | | | $1,000.00 | | | | $1,063.51 | | | | $5.57 | |
| | Hypothetical (h) | | | 1.07% | | | | $1,000.00 | | | | $1,019.81 | | | | $5.45 | |
| (h) | 5% class return per year before expenses. |
| (p) | “Expenses Paid During Period” are equal to each class’s annualized expense ratio, as shown above, multiplied by the average account value over the period, multiplied by 184/365 (to reflect the one-half year period). |
6
MFS Investors Growth Stock Series
PORTFOLIO OF INVESTMENTS – 12/31/14
The Portfolio of Investments is a complete list of all securities owned by your fund. It is categorized by broad-based asset classes.
| | | | | | | | |
| Issuer | | Shares/Par | | | Value ($) | |
| | | | | | | | |
| COMMON STOCKS – 98.8% | | | | | | | | |
| Aerospace – 4.0% | | | | | | | | |
| Precision Castparts Corp. | | | 15,250 | | | $ | 3,673,419 | |
| United Technologies Corp. | | | 107,747 | | | | 12,390,905 | |
| | | | | | | | |
| | | | | | $ | 16,064,324 | |
| | | | | | | | |
| Alcoholic Beverages – 2.1% | | | | | | | | |
| AmBev S.A., ADR | | | 441,328 | | | $ | 2,745,060 | |
| Pernod Ricard S.A. | | | 51,845 | | | | 5,748,416 | |
| | | | | | | | |
| | | | | | $ | 8,493,476 | |
| | | | | | | | |
| Apparel Manufacturers – 5.2% | | | | | | | | |
| Burberry Group PLC | | | 109,734 | | | $ | 2,780,510 | |
| LVMH Moet Hennessy Louis Vuitton S.A. | | | 51,657 | | | | 8,168,732 | |
| NIKE, Inc., “B” | | | 49,606 | | | | 4,769,617 | |
| VF Corp. | | | 66,388 | | | | 4,972,461 | |
| | | | | | | | |
| | | | | | $ | 20,691,320 | |
| | | | | | | | |
| Automotive – 0.9% | | | | | | | | |
| Johnson Controls, Inc. | | | 72,898 | | | $ | 3,523,889 | |
| | | | | | | | |
| Broadcasting – 8.3% | | | | | | | | |
| Discovery Communications, Inc., “A” (a) | | | 141,859 | | | $ | 4,887,043 | |
| Omnicom Group, Inc. | | | 19,857 | | | | 1,538,322 | |
| Time Warner, Inc. | | | 106,496 | | | | 9,096,888 | |
| Twenty-First Century Fox, Inc. | | | 246,850 | | | | 9,480,274 | |
| Viacom, Inc., “B” | | | 21,048 | | | | 1,583,862 | |
| Walt Disney Co. | | | 71,434 | | | | 6,728,368 | |
| | | | | | | | |
| | | | | | $ | 33,314,757 | |
| | | | | | | | |
| Brokerage & Asset Managers – 4.0% | | | | | |
| Charles Schwab Corp. | | | 65,199 | | | $ | 1,968,358 | |
| CME Group, Inc. | | | 64,010 | | | | 5,674,487 | |
| Franklin Resources, Inc. | | | 147,484 | | | | 8,166,189 | |
| | | | | | | | |
| | | | | | $ | 15,809,034 | |
| | | | | | | | |
| Business Services – 7.7% | | | | | | | | |
| Accenture PLC, “A” | | | 184,706 | | | $ | 16,496,093 | |
| Cognizant Technology Solutions Corp., “A” (a) | | | 90,914 | | | | 4,787,531 | |
| Equifax, Inc. | | | 68,237 | | | | 5,518,326 | |
| Fidelity National Information Services, Inc. | | | 65,778 | | | | 4,091,392 | |
| | | | | | | | |
| | | | | | $ | 30,893,342 | |
| | | | | | | | |
| Chemicals – 1.6% | | | | | | | | |
| Monsanto Co. | | | 53,707 | | | $ | 6,416,375 | |
| | | | | | | | |
| Computer Software – 2.9% | | | | | | | | |
| Oracle Corp. | | | 260,777 | | | $ | 11,727,142 | |
| | | | | | | | |
| Computer Software – Systems – 3.3% | | | | | |
| Apple, Inc. | | | 32,166 | | | $ | 3,550,483 | |
| EMC Corp. | | | 329,253 | | | | 9,791,984 | |
| | | | | | | | |
| | | | | | $ | 13,342,467 | |
| | | | | | | | |
| Construction – 1.2% | | | | | | | | |
| Sherwin-Williams Co. | | | 18,778 | | | $ | 4,939,365 | |
| | | | | | | | |
| | | | | | | | |
| Issuer | | Shares/Par | | | Value ($) | |
| | | | | | | | |
| COMMON STOCKS – continued | | | | | |
| Consumer Products – 6.4% | | | | | | | | |
| Church & Dwight Co., Inc. | | | 33,532 | | | $ | 2,642,657 | |
| Colgate-Palmolive Co. | | | 202,020 | | | | 13,977,764 | |
| L’Oreal S.A. | | | 18,802 | | | | 3,156,613 | |
| Procter & Gamble Co. | | | 63,133 | | | | 5,750,785 | |
| | | | | | | | |
| | | | | | $ | 25,527,819 | |
| | | | | | | | |
| Electrical Equipment – 9.2% | | | | | | | | |
| Amphenol Corp., “A” | | | 58,323 | | | $ | 3,138,361 | |
| Danaher Corp. | | | 154,888 | | | | 13,275,450 | |
| Mettler-Toledo International, Inc. (a) | | | 23,938 | | | | 7,240,287 | |
| Sensata Technologies Holding B.V. (a) | | | 100,661 | | | | 5,275,643 | |
| W.W. Grainger, Inc. | | | 30,353 | | | | 7,736,676 | |
| | | | | | | | |
| | | | | | $ | 36,666,417 | |
| | | | | | | | |
| Electronics – 2.4% | | | | | | | | |
| Microchip Technology, Inc. | | | 101,838 | | | $ | 4,593,912 | |
| Taiwan Semiconductor Manufacturing Co. Ltd., ADR | | | 219,474 | | | | 4,911,828 | |
| | | | | | | | |
| | | | | | $ | 9,505,740 | |
| | | | | | | | |
| Energy – Independent – 0.4% | | | | | | | | |
| Occidental Petroleum Corp. | | | 20,052 | | | $ | 1,616,392 | |
| | | | | | | | |
| Food & Beverages – 3.8% | | | | | | | | |
| Danone S.A. | | | 98,729 | | | $ | 6,495,035 | |
| Mead Johnson Nutrition Co., “A” | | | 64,069 | | | | 6,441,497 | |
| PepsiCo, Inc. | | | 21,504 | | | | 2,033,418 | |
| | | | | | | | |
| | | | | | $ | 14,969,950 | |
| | | | | | | | |
| Food & Drug Stores – 2.8% | | | | | | | | |
| CVS Health Corp. | | | 117,412 | | | $ | 11,307,950 | |
| | | | | | | | |
| Internet – 4.9% | | | | | | | | |
| eBay, Inc. (a) | | | 50,481 | | | $ | 2,832,994 | |
| Google, Inc., “A” (a) | | | 31,471 | | | | 16,700,401 | |
| | | | | | | | |
| | | | | | $ | 19,533,395 | |
| | | | | | | | |
| Machinery & Tools – 1.0% | | | | | | | | |
| Colfax Corp. (a) | | | 77,186 | | | $ | 3,980,482 | |
| | | | | | | | |
| Medical & Health Technology & Services – 2.8% | |
| Express Scripts Holding Co. (a) | | | 109,693 | | | $ | 9,287,706 | |
| Patterson Cos., Inc. | | | 40,302 | | | | 1,938,526 | |
| | | | | | | | |
| | | | | | $ | 11,226,232 | |
| | | | | | | | |
| Medical Equipment – 7.9% | | | | | | | | |
| Abbott Laboratories | | | 131,350 | | | $ | 5,913,377 | |
| DENTSPLY International, Inc. | | | 162,756 | | | | 8,670,012 | |
| St. Jude Medical, Inc. | | | 31,763 | | | | 2,065,548 | |
| Thermo Fisher Scientific, Inc. | | | 76,001 | | | | 9,522,165 | |
| Waters Corp. (a) | | | 47,196 | | | | 5,319,933 | |
| | | | | | | | |
| | | | | | $ | 31,491,035 | |
| | | | | | | | |
| Oil Services – 2.8% | | | | | | | | |
| Schlumberger Ltd. | | | 129,649 | | | $ | 11,073,321 | |
| | | | | | | | |
7
MFS Investors Growth Stock Series
Portfolio of Investments – continued
| | | | | | | | |
| Issuer | | Shares/Par | | | Value ($) | |
| | | | | | | | |
| COMMON STOCKS – continued | | | | | |
| Other Banks & Diversified Financials – 5.3% | | | | | |
| MasterCard, Inc., “A” | | | 59,785 | | | $ | 5,151,076 | |
| Visa, Inc., “A” | | | 60,803 | | | | 15,942,547 | |
| | | | | | | | |
| | | | | | $ | 21,093,623 | |
| | | | | | | | |
| Pharmaceuticals – 3.2% | | | | | | | | |
| Allergan, Inc. | | | 11,310 | | | $ | 2,404,393 | |
| Johnson & Johnson | | | 26,563 | | | | 2,777,693 | |
| Zoetis, Inc. | | | 177,363 | | | | 7,631,930 | |
| | | | | | | | |
| | | | | | $ | 12,814,016 | |
| | | | | | | | |
| Restaurants – 0.8% | | | | | | | | |
| McDonald’s Corp. | | | 35,844 | | | $ | 3,358,583 | |
| | | | | | | | |
| Specialty Chemicals – 1.6% | | | | | | | | |
| Praxair, Inc. | | | 48,687 | | | $ | 6,307,888 | |
| | | | | | | | |
| Specialty Stores – 1.7% | | | | | | | | |
| AutoZone, Inc. (a) | | | 9,821 | | | $ | 6,080,279 | |
| Hermes International | | | 2,496 | | | | 890,380 | |
| | | | | | | | |
| | | | | | $ | 6,970,659 | |
| | | | | | | | |
| Trucking – 0.6% | | | | | | | | |
| Expeditors International of Washington, Inc. | | | 53,278 | | | $ | 2,376,732 | |
| | | | | | | | |
Total Common Stocks
(Identified Cost, $262,018,774) | | | | | | $ | 395,035,725 | |
| | | | | | | | |
| | | | | | | | |
| Issuer | | Shares/Par | | | Value ($) | |
| | | | | | | | |
| MONEY MARKET FUNDS – 1.0% | | | | | |
| MFS Institutional Money Market Portfolio, 0.09%, at Cost and Net Asset Value (v) | | | 4,184,681 | | | $ | 4,184,681 | |
| | | | | | | | |
Total Investments
(Identified Cost, $266,203,455) | | | | | | $ | 399,220,406 | |
| | | | | | | | |
OTHER ASSETS, LESS
LIABILITIES – 0.2% | | | | | | | 612,968 | |
| | | | | | | | |
| NET ASSETS – 100.0% | | | | | | $ | 399,833,374 | |
| | | | | | | | |
| (a) | | Non-income producing security. |
| (v) | | Underlying affiliated fund that is available only to investment companies managed by MFS. The rate quoted for the MFS Institutional Money Market Portfolio is the annualized seven-day yield of the fund at period end. |
The following abbreviations are used in this report and are defined:
| ADR | | American Depositary Receipt |
| PLC | | Public Limited Company |
See Notes to Financial Statements
8
MFS Investors Growth Stock Series
FINANCIAL STATEMENTS | STATEMENT OF ASSETS AND LIABILITIES
This statement represents your fund’s balance sheet, which details the assets and liabilities comprising the total value of the fund.
| | | | | | | | |
At 12/31/14 | | | | | | | | |
Assets | | | | | | | | |
Investments – | | | | | | | | |
Non-affiliated issuers, at value (identified cost, $262,018,774) | | | $395,035,725 | | | | | |
Underlying affiliated funds, at cost and value | | | 4,184,681 | | | | | |
Total investments, at value (identified cost, $266,203,455) | | | $399,220,406 | | | | | |
Receivables for | | | | | | | | |
Fund shares sold | | | 937,739 | | | | | |
Interest and dividends | | | 640,704 | | | | | |
Other assets | | | 2,730 | | | | | |
Total assets | | | | | | | $400,801,579 | |
Liabilities | | | | | | | | |
Payable to custodian | | | $112,233 | | | | | |
Payables for | | | | | | | | |
Investments purchased | | | 62,421 | | | | | |
Fund shares reacquired | | | 704,366 | | | | | |
Payable to affiliates | | | | | | | | |
Investment adviser | | | 14,536 | | | | | |
Shareholder servicing costs | | | 292 | | | | | |
Distribution and/or service fees | | | 4,604 | | | | | |
Payable for independent Trustees’ compensation | | | 7 | | | | | |
Accrued expenses and other liabilities | | | 69,746 | | | | | |
Total liabilities | | | | | | | $968,205 | |
Net assets | | | | | | | $399,833,374 | |
Net assets consist of | | | | | | | | |
Paid-in capital | | | $237,810,141 | | | | | |
Unrealized appreciation (depreciation) on investments and translation of assets and liabilities in foreign currencies | | | 133,017,398 | | | | | |
Accumulated net realized gain (loss) on investments and foreign currency | | | 26,684,591 | | | | | |
Undistributed net investment income | | | 2,321,244 | | | | | |
Net assets | | | | | | | $399,833,374 | |
Shares of beneficial interest outstanding | | | | | | | 25,464,142 | |
| | | | | | | | | | | | |
| | | Net assets | | | Shares
outstanding | | | Net asset value
per share | |
| Initial Class | | | $67,825,388 | | | | 4,227,861 | | | | $16.04 | |
| Service Class | | | 332,007,986 | | | | 21,236,281 | | | | 15.63 | |
See Notes to Financial Statements
9
MFS Investors Growth Stock Series
FINANCIAL STATEMENTS | STATEMENT OF OPERATIONS
This statement describes how much your fund earned in investment income and accrued in expenses. It also describes any gains and/or losses generated by fund operations.
| | | | | | | | |
Year ended 12/31/14 | | | | | | | | |
Net investment income | | | | | | | | |
Income | | | | | | | | |
Dividends | | | $6,528,355 | | | | | |
Interest | | | 91,001 | | | | | |
Dividends from underlying affiliated funds | | | 2,860 | | | | | |
Foreign taxes withheld | | | (242,149 | ) | | | | |
Total investment income | | | | | | | $6,380,067 | |
Expenses | | | | | | | | |
Management fee | | | $2,969,771 | | | | | |
Distribution and/or service fees | | | 820,329 | | | | | |
Shareholder servicing costs | | | 42,396 | | | | | |
Administrative services fee | | | 63,614 | | | | | |
Independent Trustees’ compensation | | | 9,311 | | | | | |
Custodian fee | | | 49,076 | | | | | |
Shareholder communications | | | 44,701 | | | | | |
Audit and tax fees | | | 54,085 | | | | | |
Legal fees | | | 3,377 | | | | | |
Miscellaneous | | | 15,644 | | | | | |
Total expenses | | | | | | | $4,072,304 | |
Reduction of expenses by investment adviser | | | (18,748 | ) | | | | |
Net expenses | | | | | | | $4,053,556 | |
Net investment income | | | | | | | $2,326,511 | |
Realized and unrealized gain (loss) on investments and foreign currency | | | | | | | | |
Realized gain (loss) (identified cost basis) | | | | | | | | |
Investments | | | $47,840,622 | | | | | |
Foreign currency | | | (4,599 | ) | | | | |
Net realized gain (loss) on investments and foreign currency | | | | | | | $47,836,023 | |
Change in unrealized appreciation (depreciation) | | | | | | | | |
Investments | | | $(9,335,863 | ) | | | | |
Translation of assets and liabilities in foreign currencies | | | (1,520 | ) | | | | |
Net unrealized gain (loss) on investments and foreign currency translation | | | | | | | $(9,337,383 | ) |
Net realized and unrealized gain (loss) on investments and foreign currency | | | | | | | $38,498,640 | |
Change in net assets from operations | | | | | | | $40,825,151 | |
See Notes to Financial Statements
10
MFS Investors Growth Stock Series
FINANCIAL STATEMENTS | STATEMENTS OF CHANGES IN NET ASSETS
These statements describe the increases and/or decreases in net assets resulting from operations, any distributions, and any shareholder transactions.
| | | | | | | | |
For years ended 12/31 | | | 2014 | | | | 2013 | |
Change in net assets | | | | | | | | |
From operations | | | | | | | | |
Net investment income | | | $2,326,511 | | | | $1,240,982 | |
Net realized gain (loss) on investments and foreign currency | | | 47,836,023 | | | | 21,768,699 | |
Net unrealized gain (loss) on investments and foreign currency translation | | | (9,337,383 | ) | | | 78,298,340 | |
Change in net assets from operations | | | $40,825,151 | | | | $101,308,021 | |
Distributions declared to shareholders | | | | | | | | |
From net investment income | | | $(1,236,268 | ) | | | $(1,774,121 | ) |
From net realized gain on investments | | | (21,700,351 | ) | | | (12,243,874 | ) |
Total distributions declared to shareholders | | | $(22,936,619 | ) | | | $(14,017,995 | ) |
Change in net assets from fund share transactions | | | $(45,862,768 | ) | | | $(4,654,343 | ) |
Total change in net assets | | | $(27,974,236 | ) | | | $82,635,683 | |
Net assets | | | | | | | | |
At beginning of period | | | 427,807,610 | | | | 345,171,927 | |
At end of period (including undistributed net investment income of $2,321,244 and
$1,235,600, respectively) | | | $399,833,374 | | | | $427,807,610 | |
See Notes to Financial Statements
11
MFS Investors Growth Stock Series
FINANCIAL STATEMENTS | FINANCIAL HIGHLIGHTS
The financial highlights table is intended to help you understand the fund’s financial performance for the past 5 years. Certain information reflects financial results for a single fund share. The total returns in the table represent the rate by which an investor would have earned (or lost) on an investment in the fund share class (assuming reinvestment of all distributions) held for the entire period.
| | | | | | | | | | | | | | | | | | | | |
| Initial Class | | Years ended 12/31 | |
| | | 2014 | | | 2013 | | | 2012 | | | 2011 | | | 2010 | |
Net asset value, beginning of period | | | $15.32 | | | | $12.21 | | | | $11.01 | | | | $11.01 | | | | $9.83 | |
| Income (loss) from investment operations | | | | | | | | | | | | | | | | | | | | |
Net investment income (d) | | | $0.12 | | | | $0.07 | | | | $0.08 | | | | $0.05 | | | | $0.05 | |
Net realized and unrealized gain (loss) on investments
and foreign currency | | | 1.58 | | | | 3.57 | | | | 1.77 | | | | 0.01 | | | | 1.17 | |
Total from investment operations | | | $1.70 | | | | $3.64 | | | | $1.85 | | | | $0.06 | | | | $1.22 | |
| Less distributions declared to shareholders | | | | | | | | | | | | | | | | | | | | |
From net investment income | | | $(0.08 | ) | | | $(0.09 | ) | | | $(0.06 | ) | | | $(0.06 | ) | | | $(0.04 | ) |
From net realized gain on investments | | | (0.90 | ) | | | (0.44 | ) | | | (0.59 | ) | | | — | | | | — | |
Total distributions declared to shareholders | | | $(0.98 | ) | | | $(0.53 | ) | | | $(0.65 | ) | | | $(0.06 | ) | | | $(0.04 | ) |
Net asset value, end of period (x) | | | $16.04 | | | | $15.32 | | | | $12.21 | | | | $11.01 | | | | $11.01 | |
Total return (%) (k)(r)(s)(x) | | | 11.45 | | | | 30.29 | | | | 16.97 | | | | 0.58 | | | | 12.47 | |
Ratios (%) (to average net assets)
and Supplemental data: | | | | | | | | | | | | | | | | | | | | |
Expenses before expense reductions (f) | | | 0.82 | | | | 0.82 | | | | 0.83 | | | | 0.82 | | | | 0.88 | |
Expenses after expense reductions (f) | | | 0.82 | | | | 0.82 | | | | 0.83 | | | | 0.82 | | | | 0.88 | |
Net investment income | | | 0.79 | | | | 0.52 | | | | 0.70 | | | | 0.46 | | | | 0.49 | |
Portfolio turnover | | | 24 | | | | 26 | | | | 30 | | | | 28 | | | | 44 | |
Net assets at end of period (000 omitted) | | | $67,825 | | | | $71,949 | | | | $71,432 | | | | $77,136 | | | | $83,355 | |
See Notes to Financial Statements
12
MFS Investors Growth Stock Series
Financial Highlights – continued
| | | | | | | | | | | | | | | | | | | | |
| Service Class | | Years ended 12/31 | |
| | | 2014 | | | 2013 | | | 2012 | | | 2011 | | | 2010 | |
Net asset value, beginning of period | | | $14.96 | | | | $11.93 | | | | $10.77 | | | | $10.76 | | | | $9.62 | |
| Income (loss) from investment operations | | | | | | | | | | | | | | | | | | | | |
Net investment income (d) | | | $0.08 | | | | $0.04 | | | | $0.05 | | | | $0.02 | | | | $0.02 | |
Net realized and unrealized gain (loss) on investments
and foreign currency | | | 1.53 | | | | 3.49 | | | | 1.73 | | | | 0.02 | | | | 1.15 | |
Total from investment operations | | | $1.61 | | | | $3.53 | | | | $1.78 | | | | $0.04 | | | | $1.17 | |
| Less distributions declared to shareholders | | | | | | | | | | | | | | | | | | | | |
From net investment income | | | $(0.04 | ) | | | $(0.06 | ) | | | $(0.03 | ) | | | $(0.03 | ) | | | $(0.03 | ) |
From net realized gain on investments | | | (0.90 | ) | | | (0.44 | ) | | | (0.59 | ) | | | — | | | | — | |
Total distributions declared to shareholders | | | $(0.94 | ) | | | $(0.50 | ) | | | $(0.62 | ) | | | $(0.03 | ) | | | $(0.03 | ) |
Net asset value, end of period (x) | | | $15.63 | | | | $14.96 | | | | $11.93 | | | | $10.77 | | | | $10.76 | |
Total return (%) (k)(r)(s)(x) | | | 11.11 | | | | 30.05 | | | | 16.68 | | | | 0.37 | | | | 12.15 | |
Ratios (%) (to average net assets)
and Supplemental data: | | | | | | | | | | | | | | | | | | | | |
Expenses before expense reductions (f) | | | 1.07 | | | | 1.07 | | | | 1.08 | | | | 1.07 | | | | 1.12 | |
Expenses after expense reductions (f) | | | 1.07 | | | | 1.07 | | | | 1.08 | | | | 1.07 | | | | 1.12 | |
Net investment income | | | 0.55 | | | | 0.28 | | | | 0.46 | | | | 0.21 | | | | 0.23 | |
Portfolio turnover | | | 24 | | | | 26 | | | | 30 | | | | 28 | | | | 44 | |
Net assets at end of period (000 omitted) | | | $332,008 | | | | $355,858 | | | | $273,740 | | | | $252,058 | | | | $276,777 | |
| (d) | Per share data is based on average shares outstanding. |
| (f) | Ratios do not reflect reductions from fees paid indirectly, if applicable. |
| (k) | The total return does not reflect expenses that apply to separate accounts. Inclusion of these charges would reduce the total return figures for all periods shown. |
| (r) | Certain expenses have been reduced without which performance would have been lower. |
| (s) | From time to time the fund may receive proceeds from litigation settlements, without which performance would be lower. |
| (x) | The net asset values per share and total returns have been calculated on net assets which include adjustments made in accordance with U.S. generally accepted accounting principles required at period end for financial reporting purposes. |
See Notes to Financial Statements
13
MFS Investors Growth Stock Series
NOTES TO FINANCIAL STATEMENTS
| (1) | | Business and Organization |
MFS Investors Growth Stock Series (the fund) is a diversified series of MFS Variable Insurance Trust (the trust). The trust is organized as a Massachusetts business trust and is registered under the Investment Company Act of 1940, as amended, as an open-end management investment company. The shareholders of each series of the trust are separate accounts of insurance companies, which offer variable annuity and/or life insurance products, and qualified retirement and pension plans.
The fund is an investment company and accordingly follows the investment company accounting and reporting guidance of the Financial Accounting Standards Board (FASB) Accounting Standards Codification Topic 946 Financial Services – Investment Companies.
| (2) | | Significant Accounting Policies |
General – The preparation of financial statements in conformity with U.S. generally accepted accounting principles requires management to make estimates and assumptions that affect the reported amounts of assets and liabilities, and disclosure of contingent assets and liabilities at the date of the financial statements and the reported amounts of increases and decreases in net assets from operations during the reporting period. Actual results could differ from those estimates. In the preparation of these financial statements, management has evaluated subsequent events occurring after the date of the fund’s Statement of Assets and Liabilities through the date that the financial statements were issued.
In June 2014, FASB issued Accounting Standards Update 2014-11, Transfers and Servicing (Topic 860) – Repurchase-to-Maturity Transactions, Repurchase Financings, and Disclosures (“ASU 2014-11”). ASU 2014-11 changes the accounting for repurchase-to-maturity transactions (i.e., repurchase agreements that settle at the same time as the maturity of the transferred financial asset) and enhances the required disclosures for repurchase agreements and other similar transactions. Although still evaluating the potential impacts of ASU 2014-11 to the fund, management expects that the impact of the fund’s adoption will be limited to additional financial statement disclosures which would first be effective for interim reporting periods beginning after March 15, 2015.
Balance Sheet Offsetting – The fund’s accounting policy with respect to balance sheet offsetting is that, absent an event of default by the counterparty or a termination of the agreement, the International Swaps and Derivatives Association (ISDA) Master Agreement does not result in an offset of reported amounts of financial assets and financial liabilities in the Statement of Assets and Liabilities across transactions between the fund and the applicable counterparty. The fund’s right to setoff may be restricted or prohibited by the bankruptcy or insolvency laws of the particular jurisdiction to which a specific master netting agreement counterparty is subject. Balance sheet offsetting disclosures, to the extent applicable to the fund, have been included in the fund’s Significant Accounting Policies note under the captions for each of the fund’s in-scope financial instruments and transactions.
Investment Valuations – Equity securities, including restricted equity securities, are generally valued at the last sale or official closing price as provided by a third-party pricing service on the market or exchange on which they are primarily traded. Equity securities, for which there were no sales reported that day, are generally valued at the last quoted daily bid quotation as provided by a third-party pricing service on the market or exchange on which such securities are primarily traded. Short-term instruments with a maturity at issuance of 60 days or less may be valued at amortized cost, which approximates market value. Open-end investment companies are generally valued at net asset value per share. Securities and other assets generally valued on the basis of information from a third-party pricing service may also be valued at a broker/dealer bid quotation. Values obtained from third-party pricing services can utilize both transaction data and market information such as yield, quality, coupon rate, maturity, type of issue, trading characteristics, and other market data. The values of foreign securities and other assets and liabilities expressed in foreign currencies are converted to U.S. dollars using the mean of bid and asked prices for rates provided by a third-party pricing service.
The Board of Trustees has delegated primary responsibility for determining or causing to be determined the value of the fund’s investments (including any fair valuation) to the adviser pursuant to valuation policies and procedures approved by the Board. If the adviser determines that reliable market quotations are not readily available, investments are valued at fair value as determined in good faith by the adviser in accordance with such procedures under the oversight of the Board of Trustees. Under the fund’s valuation policies and procedures, market quotations are not considered to be readily available for most types of debt instruments and floating rate loans and many types of derivatives. These investments are generally valued at fair value based on information from third-party pricing services. In addition, investments may be valued at fair value if the adviser determines that an investment’s value has been materially affected by events occurring after the close of the exchange or market on which the investment is principally traded (such as foreign exchange or market) and prior to the determination of the fund’s net asset value, or after the halting of trading of a specific security where trading does not resume prior to the close of the exchange or market on which the security is principally traded. Events that occur on a frequent basis after foreign markets close (such as developments in foreign markets and significant movements in the U.S. markets) and prior to the determination of the fund’s net asset value may be deemed to have a material effect on the value of securities traded in foreign markets. Accordingly, the fund’s foreign equity securities may often be valued at fair value. The adviser generally relies on third-party pricing services or other information (such as the correlation with price
14
MFS Investors Growth Stock Series
Notes to Financial Statements – continued
movements of similar securities in the same or other markets; the type, cost and investment characteristics of the security; the business and financial condition of the issuer; and trading and other market data) to assist in determining whether to fair value and at what value to fair value an investment. The value of an investment for purposes of calculating the fund’s net asset value can differ depending on the source and method used to determine value. When fair valuation is used, the value of an investment used to determine the fund’s net asset value may differ from quoted or published prices for the same investment. There can be no assurance that the fund could obtain the fair value assigned to an investment if it were to sell the investment at the same time at which the fund determines its net asset value per share.
Various inputs are used in determining the value of the fund’s assets or liabilities. These inputs are categorized into three broad levels. In certain cases, the inputs used to measure fair value may fall into different levels of the fair value hierarchy. In such cases, an investment’s level within the fair value hierarchy is based on the lowest level of input that is significant to the fair value measurement. The fund’s assessment of the significance of a particular input to the fair value measurement in its entirety requires judgment, and considers factors specific to the investment. Level 1 includes unadjusted quoted prices in active markets for identical assets or liabilities. Level 2 includes other significant observable market-based inputs (including quoted prices for similar securities, interest rates, prepayment speed, and credit risk). Level 3 includes unobservable inputs, which may include the adviser’s own assumptions in determining the fair value of investments. The following is a summary of the levels used as of December 31, 2014 in valuing the fund’s assets or liabilities:
| | | | | | | | | | | | | | | | |
| Investments at Value | | Level 1 | | | Level 2 | | | Level 3 | | | Total | |
| Equity Securities: | | | | | | | | | | | | | | | | |
United States | | | $360,139,151 | | | | $— | | | | $— | | | | $360,139,151 | |
France | | | 890,380 | | | | 23,568,796 | | | | — | | | | 24,459,176 | |
Taiwan | | | 4,911,828 | | | | — | | | | — | | | | 4,911,828 | |
United Kingdom | | | — | | | | 2,780,510 | | | | — | | | | 2,780,510 | |
Brazil | | | 2,745,060 | | | | — | | | | — | | | | 2,745,060 | |
| Mutual Funds | | | 4,184,681 | | | | — | | | | — | | | | 4,184,681 | |
| Total Investments | | | $372,871,100 | | | | $26,349,306 | | | | $— | | | | $399,220,406 | |
For further information regarding security characteristics, see the Portfolio of Investments.
Of the level 2 investments presented above, equity investments amounting to $20,412,182 would have been considered level 1 investments at the beginning of the period. The primary reason for changes in the classifications between levels 1 and 2 occurs when foreign equity securities are fair valued using other observable market-based inputs in place of the closing exchange price due to events occurring after the close of the exchange or market on which the investment is principally traded. The fund’s foreign equity securities may often be valued at fair value. The fund’s policy is to recognize transfers between the levels as of the end of the period.
Foreign Currency Translation – Purchases and sales of foreign investments, income, and expenses are converted into U.S. dollars based upon currency exchange rates prevailing on the respective dates of such transactions or on the reporting date for foreign denominated receivables and payables. Gains and losses attributable to foreign currency exchange rates on sales of securities are recorded for financial statement purposes as net realized gains and losses on investments. Gains and losses attributable to foreign exchange rate movements on receivables, payables, income and expenses are recorded for financial statement purposes as foreign currency transaction gains and losses. That portion of both realized and unrealized gains and losses on investments that results from fluctuations in foreign currency exchange rates is not separately disclosed.
Security Loans – Under its Securities Lending Agency Agreement with the fund, State Street Bank and Trust Company (“State Street”), as lending agent, loans the securities of the fund to certain qualified institutions (the “Borrowers”) approved by the fund. The loans are collateralized by cash and/or U.S. Treasury and federal agency obligations in an amount typically at least equal to the market value of the securities loaned. On loans collateralized by cash, the cash collateral is invested in a money market fund. The market value of the loaned securities is determined at the close of business of the fund and any additional required collateral is delivered to the fund on the next business day. State Street provides the fund with indemnification against Borrower default. In the event of Borrower default, State Street will for the benefit of the fund either purchase securities identical to those loaned or, when such purchase is commercially impracticable, pay the fund the market value of the loaned securities. In return, State Street assumes the fund’s rights to the related collateral. If the collateral value is less than the cost to purchase identical securities, State Street is responsible for the shortfall, but only to the extent that such shortfall is not due to a decline in collateral value resulting from collateral reinvestment for which the fund bears the risk of loss. A portion of the income generated upon investment of the collateral is remitted to the Borrowers, and the remainder is allocated between the fund and the lending agent. On loans collateralized by U.S. Treasury and/or federal agency obligations, a fee is received from the Borrower, and is allocated between the fund and the lending agent. Income from securities lending is included in “Interest” income, in the Statement of Operations. The dividend and interest income earned on the securities loaned is accounted for in the same manner as other dividend and interest income. At December 31, 2014, there were no securities on loan or collateral outstanding.
15
MFS Investors Growth Stock Series
Notes to Financial Statements – continued
Indemnifications – Under the fund’s organizational documents, its officers and Trustees may be indemnified against certain liabilities and expenses arising out of the performance of their duties to the fund. Additionally, in the normal course of business, the fund enters into agreements with service providers that may contain indemnification clauses. The fund’s maximum exposure under these agreements is unknown as this would involve future claims that may be made against the fund that have not yet occurred.
Investment Transactions and Income – Investment transactions are recorded on the trade date. Interest income is recorded on the accrual basis. Dividends received in cash are recorded on the ex-dividend date. Certain dividends from foreign securities will be recorded when the fund is informed of the dividend if such information is obtained subsequent to the ex-dividend date. Dividend payments received in additional securities are recorded on the ex-dividend date in an amount equal to the value of the security on such date.
The fund may receive proceeds from litigation settlements. Any proceeds received from litigation involving portfolio holdings are reflected in the Statement of Operations in realized gain/loss if the security has been disposed of by the fund or in unrealized gain/loss if the security is still held by the fund. Any other proceeds from litigation not related to portfolio holdings are reflected as other income in the Statement of Operations.
Fees Paid Indirectly – The fund’s custody fee may be reduced according to an arrangement that measures the value of cash deposited with the custodian by the fund. For the year ended December 31, 2014, custody fees were not reduced.
Tax Matters and Distributions – The fund intends to qualify as a regulated investment company, as defined under Subchapter M of the Internal Revenue Code, and to distribute all of its taxable income, including realized capital gains. As a result, no provision for federal income tax is required. The fund’s federal tax returns, when filed, will remain subject to examination by the Internal Revenue Service for a three year period. Management has analyzed the fund’s tax positions taken on federal and state tax returns for all open tax years and does not believe that there are any uncertain tax positions that require recognition of a tax liability. Foreign taxes, if any, have been accrued by the fund in the accompanying financial statements in accordance with the applicable foreign tax law. Foreign income taxes may be withheld by certain countries in which the fund invests. Additionally, capital gains realized by the fund on securities issued in or by certain foreign countries may be subject to capital gains tax imposed by those countries.
Distributions to shareholders are recorded on the ex-dividend date. Income and capital gain distributions are determined in accordance with income tax regulations, which may differ from U.S. generally accepted accounting principles. Certain capital accounts in the financial statements are periodically adjusted for permanent differences in order to reflect their tax character. These adjustments have no impact on net assets or net asset value per share. Temporary differences which arise from recognizing certain items of income, expense, gain or loss in different periods for financial statement and tax purposes will reverse at some time in the future. Distributions in excess of net investment income or net realized gains are temporary overdistributions for financial statement purposes resulting from differences in the recognition or classification of income or distributions for financial statement and tax purposes.
Book/tax differences primarily relate to wash sale loss deferrals and redemptions in-kind.
The tax character of distributions declared to shareholders for the last two fiscal years is as follows:
| | | | | | | | |
| | | 12/31/14 | | | 12/31/13 | |
| Ordinary income (including any short-term capital gains) | | | $4,820,131 | | | | $4,015,558 | |
| Long-term capital gains | | | 18,116,488 | | | | 10,002,437 | |
| Total distributions | | | $22,936,619 | | | | $14,017,995 | |
The federal tax cost and the tax basis components of distributable earnings were as follows:
| | | | |
| As of 12/31/14 | | | | |
| Cost of investments | | | $266,489,166 | |
| Gross appreciation | | | 133,264,324 | |
| Gross depreciation | | | (533,084 | ) |
| Net unrealized appreciation (depreciation) | | | $132,731,240 | |
| Undistributed ordinary income | | | 5,459,928 | |
| Undistributed long-term capital gain | | | 23,831,618 | |
| Other temporary differences | | | 447 | |
Multiple Classes of Shares of Beneficial Interest – The fund offers multiple classes of shares, which differ in their respective distribution and/or service fees. The fund’s income, realized and unrealized gain (loss), and common expenses are allocated to shareholders based on the daily net assets of each class. Dividends are declared separately for each class. Differences in per share
16
MFS Investors Growth Stock Series
Notes to Financial Statements – continued
dividend rates are generally due to differences in separate class expenses. The fund’s distributions declared to shareholders as reported in the Statements of Changes in Net Assets are presented by class as follows:
| | | | | | | | | | | | | | | | |
| | | From net investment
income | | | From net realized gain on
investments | |
| | | Year ended
12/31/14 | | | Year ended
12/31/13 | | | Year ended
12/31/14 | | | Year ended
12/31/13 | |
| Initial Class | | | $345,675 | | | | $433,291 | | | | $3,713,068 | | | | $2,167,446 | |
| Service Class | | | 890,593 | | | | 1,340,830 | | | | 17,987,283 | | | | 10,076,428 | |
| Total | | | $1,236,268 | | | | $1,774,121 | | | | $21,700,351 | | | | $12,243,874 | |
| (3) | | Transactions with Affiliates |
Investment Adviser – The fund has an investment advisory agreement with MFS to provide overall investment management and related administrative services and facilities to the fund. The management fee is computed daily and paid monthly at the following annual rates:
| | | | |
| First $1 billion of average daily net assets | | | 0.75% | |
| Average daily net assets in excess of $1 billion | | | 0.65% | |
MFS has agreed in writing to reduce its management fee by a specified amount if certain MFS mutual fund assets exceed thresholds agreed to by MFS and the fund’s Board of Trustees. For the year ended December 31, 2014, this management fee reduction amounted to $18,050, which is included in the reduction of total expenses in the Statement of Operations. The management fee incurred for the year ended December 31, 2014 was equivalent to an annual effective rate of 0.75% of the fund’s average daily net assets.
Distributor – MFS Fund Distributors, Inc. (MFD), a wholly-owned subsidiary of MFS, is the distributor of shares of the fund. The Trustees have adopted a distribution plan for the Service Class shares pursuant to Rule 12b-1 under the Investment Company Act of 1940.
The fund’s distribution plan provides that the fund will pay MFD distribution and/or service fees equal to 0.25% per annum of its average daily net assets attributable to Service Class shares as partial consideration for services performed and expenses incurred by MFD and financial intermediaries (including participating insurance companies that invest in the fund to fund variable annuity and variable life insurance contracts, sponsors of qualified retirement and pension plans that invest in the fund, and affiliates of these participating insurance companies and plan sponsors) in connection with the sale and distribution of the Service Class shares. MFD may subsequently pay all, or a portion, of the distribution and/or service fees to financial intermediaries.
Shareholder Servicing Agent – MFS Service Center, Inc. (MFSC), a wholly-owned subsidiary of MFS, receives a fee from the fund for its services as shareholder servicing agent. For the year ended December 31, 2014, the fee was $41,476, which equated to 0.0105% annually of the fund’s average daily net assets. MFSC also receives payment from the fund for out-of-pocket expenses paid by MFSC on behalf of the fund. For the year ended December 31, 2014, these costs amounted to $920.
Administrator – MFS provides certain financial, legal, shareholder communications, compliance, and other administrative services to the fund. Under an administrative services agreement, the fund partially reimburses MFS the costs incurred to provide these services. The fund is charged an annual fixed amount of $17,500 plus a fee based on average daily net assets. The administrative services fee incurred for the year ended December 31, 2014 was equivalent to an annual effective rate of 0.0161% of the fund’s average daily net assets.
Trustees’ and Officers’ Compensation – The fund pays compensation to independent Trustees in the form of a retainer, attendance fees, and additional compensation to Board and Committee chairpersons. The fund does not pay compensation directly to Trustees or officers of the fund who are also officers of the investment adviser, all of whom receive remuneration for their services to the fund from MFS. Certain officers and Trustees of the fund are officers or directors of MFS, MFD, and MFSC.
Other – Effective November 1, 2014, this fund and certain other funds managed by MFS (the funds) have entered into a service agreement (the ISO Agreement) which provides for payment of fees solely by the funds to Tarantino LLC in return for the provision of services of an Independent Senior Officer (ISO) for the funds. Frank L. Tarantino serves as the ISO and is an officer of the funds and the sole member of Tarantino LLC. The funds can terminate the ISO Agreement with Tarantino LLC at any time under the terms of the ISO Agreement. Prior to November 1, 2014, the funds had entered into services agreements (the Compliance Officer Agreements) which provided for payment of fees by the funds to Tarantino LLC and Griffin Compliance LLC in return for the provision of services of an Independent Chief Compliance Officer (ICCO) and Assistant ICCO, respectively, for the funds. Prior to November 1, 2014, Frank L. Tarantino served as the ICCO. Effective October 31, 2014, Mr. Tarantino resigned as ICCO and the Compliance Officer Agreement between the funds and Tarantino LLC was terminated. Prior to June 1, 2014, Robyn L. Griffin served as the Assistant ICCO and was an officer of the funds. Ms. Griffin is the sole member of Griffin Compliance LLC. Effective May 31, 2014, Ms. Griffin resigned as Assistant ICCO and the Compliance Officer Agreement between the funds and Griffin
17
MFS Investors Growth Stock Series
Notes to Financial Statements – continued
Compliance LLC was terminated. For the year ended December 31, 2014, the aggregate fees paid by the fund under these agreements were $1,701 and are included in “Miscellaneous” expense in the Statement of Operations. MFS had agreed to reimburse the fund for a portion of the payments made by the fund for the services under the Compliance Officer Agreements in the amount of $698, which is included in the reduction of total expenses in the Statement of Operations. Additionally, MFS has agreed to bear all expenses associated with office space, other administrative support, and supplies provided to the ICCO, Assistant ICCO, and ISO.
The fund invests in the MFS Institutional Money Market Portfolio which is managed by MFS and seeks current income consistent with preservation of capital and liquidity. Income earned on this investment is included in “Dividends from underlying affiliated funds” in the Statement of Operations. This money market fund does not pay a management fee to MFS.
For the year ended December 31, 2014, purchases and sales of investments, other than in-kind transactions and short-term obligations, aggregated $95,143,736 and $113,303,235, respectively.
| (5) | | Shares of Beneficial Interest |
The fund’s Declaration of Trust permits the Trustees to issue an unlimited number of full and fractional shares of beneficial interest. Transactions in fund shares were as follows:
| | | | | | | | | | | | | | | | |
| | | Year ended 12/31/14 | | | Year ended 12/31/13 | |
| | | Shares | | | Amount | | | Shares | | | Amount | |
| Shares sold | | | | | | | | | | | | | | | | |
Initial Class | | | 286,860 | | | | $4,474,196 | | | | 431,037 | | | | $5,859,312 | |
Service Class | | | 3,700,498 | | | | 55,855,040 | | | | 3,575,827 | | | | 48,248,899 | |
| | | 3,987,358 | | | | $60,329,236 | | | | 4,006,864 | | | | $54,108,211 | |
| Shares issued to shareholders in reinvestment of distributions | | | | | | | | | | | | | | | | |
Initial Class | | | 266,322 | | | | $4,058,743 | | | | 190,809 | | | | $2,600,737 | |
Service Class | | | 1,270,382 | | | | 18,877,876 | | | | 857,152 | | | | 11,417,258 | |
| | | 1,536,704 | | | | $22,936,619 | | | | 1,047,961 | | | | $14,017,995 | |
| Shares reacquired | | | | | | | | | | | | | | | | |
Initial Class | | | (1,020,906 | ) | | | $(15,848,831 | ) | | | (1,778,258 | ) | | | $(24,350,702 | ) |
Service Class | | | (7,528,943 | ) | | | (113,279,792 | ) | | | (3,586,321 | ) | | | (48,429,847 | ) |
| | | (8,549,849 | ) | | | $(129,128,623 | ) | | | (5,364,579 | ) | | | $(72,780,549 | ) |
| Net change | | | | | | | | | | | | | | | | |
Initial Class | | | (467,724 | ) | | | $(7,315,892 | ) | | | (1,156,412 | ) | | | $(15,890,653 | ) |
Service Class | | | (2,558,063 | ) | | | (38,546,876 | ) | | | 846,658 | | | | 11,236,310 | |
| | | (3,025,787 | ) | | | $(45,862,768 | ) | | | (309,754 | ) | | | $(4,654,343 | ) |
The fund and certain other funds managed by MFS participate in a $1.1 billion unsecured committed line of credit, subject to a $1 billion sublimit, provided by a syndication of banks under a credit agreement. Borrowings may be made for temporary financing needs. Interest is charged to each fund, based on its borrowings, generally at a rate equal to the higher of the Federal Reserve funds rate or one month LIBOR plus an agreed upon spread. A commitment fee, based on the average daily, unused portion of the committed line of credit, is allocated among the participating funds at the end of each calendar quarter. In addition, the fund and other funds managed by MFS have established unsecured uncommitted borrowing arrangements with certain banks for temporary financing needs. Interest is charged to each fund, based on its borrowings, at a rate equal to the Federal Reserve funds rate plus an agreed upon spread. For the year ended December 31, 2014, the fund’s commitment fee and interest expense were $1,465 and $0, respectively, and are included in “Miscellaneous” expense in the Statement of Operations.
18
MFS Investors Growth Stock Series
Notes to Financial Statements – continued
| (7) | | Transactions in Underlying Affiliated Funds – Affiliated Issuers |
An affiliated issuer may be considered one in which the fund owns 5% or more of the outstanding voting securities, or a company which is under common control. For the purposes of this report, the fund assumes the following to be an affiliated issuer:
| | | | | | | | | | | | | | | | |
| Underlying Affiliated Fund | | Beginning Shares/Par Amount | | | Acquisitions Shares/Par Amount | | | Dispositions Shares/Par Amount | | | Ending Shares/Par Amount | |
| MFS Institutional Money Market Portfolio | | | 1,053,575 | | | | 65,168,516 | | | | (62,037,410 | ) | | | 4,184,681 | |
| | | | |
| Underlying Affiliated Fund | | Realized Gain (Loss) | | | Capital Gain Distributions | | | Dividend Income | | | Ending Value | |
| MFS Institutional Money Market Portfolio | | | $— | | | | $— | | | | $2,860 | | | | $4,184,681 | |
On May 1, 2014, the fund recorded redemption proceeds for a distribution in-kind of portfolio securities and cash that were valued at $57,740,712. The redeeming shareholder generally receives a pro rata share of the securities held by the fund. The distribution of such securities generated a realized gain of $20,778,489 for the fund.
On December 2, 2014, the Board of Trustees of the fund approved a proposed Agreement and Plan of Reorganization, whereby MFS Investors Growth Stock Series, a series of MFS Variable Insurance Trust would be reorganized into MFS Massachusetts Investors Growth Stock Portfolio, a portfolio of MFS Variable Insurance Trust II. The Agreement and Plan of Reorganization is subject to the approval of the shareholders of the MFS Investors Growth Stock Series. The proposed Agreement and Plan of Reorganization provides for the transfer of the assets of the MFS Investors Growth Stock Series to the MFS Massachusetts Investors Growth Stock Portfolio and the assumption by the MFS Massachusetts Investors Growth Stock Portfolio of the liabilities of the MFS Investors Growth Stock Series in exchange solely for shares of beneficial interest in the MFS Massachusetts Investors Growth Stock Portfolio. Immediately following the transfer, the MFS Massachusetts Investors Growth Stock Portfolio shares received by the MFS Investors Growth Stock Series will be distributed to shareholders, pro rata, and the MFS Investors Growth Stock Series will be liquidated and terminated. If approved by shareholders, it is expected that the reorganization will occur on or around March 27, 2015.
19
MFS Investors Growth Stock Series
REPORT OF INDEPENDENT REGISTERED PUBLIC ACCOUNTING FIRM
To the Board of Trustees of MFS Variable Insurance Trust and the Shareholders of
MFS Investors Growth Stock Series:
We have audited the accompanying statement of assets and liabilities, including the portfolio of investments, of MFS Investors Growth Stock Series (one of the series of MFS Variable Insurance Trust) (the “Fund”) as of December 31, 2014, and the related statement of operations for the year then ended, the statements of changes in net assets for each of the two years in the period then ended, and the financial highlights for each of the five years in the period then ended. These financial statements and financial highlights are the responsibility of the Fund’s management. Our responsibility is to express an opinion on these financial statements and financial highlights based on our audits.
We conducted our audits in accordance with the standards of the Public Company Accounting Oversight Board (United States). Those standards require that we plan and perform the audit to obtain reasonable assurance about whether the financial statements and financial highlights are free of material misstatement. The Fund is not required to have, nor were we engaged to perform, an audit of its internal control over financial reporting. Our audits included consideration of internal control over financial reporting as a basis for designing audit procedures that are appropriate in the circumstances, but not for the purpose of expressing an opinion on the effectiveness of the Fund’s internal control over financial reporting. Accordingly, we express no such opinion. An audit also includes examining, on a test basis, evidence supporting the amounts and disclosures in the financial statements, assessing the accounting principles used and significant estimates made by management, as well as evaluating the overall financial statement presentation. Our procedures included confirmation of securities owned as of December 31, 2014, by correspondence with the custodian and brokers; where replies were not received from brokers, we performed other auditing procedures. We believe that our audits provide a reasonable basis for our opinion.
In our opinion, the financial statements and financial highlights referred to above present fairly, in all material respects, the financial position of MFS Investors Growth Stock Series as of December 31, 2014, the results of its operations for the year then ended, the changes in its net assets for each of the two years in the period then ended, and the financial highlights for each of the five years in the period then ended, in conformity with accounting principles generally accepted in the United States of America.
DELOITTE & TOUCHE LLP
Boston, Massachusetts
February 13, 2015
20
MFS Investors Growth Stock Series
TRUSTEES AND OFFICERS – IDENTIFICATION AND BACKGROUND
The Trustees and Officers of the Trust, as of February 1, 2015, are listed below, together with their principal occupations during the past five years. (Their titles may have varied during that period.) The address of each Trustee and Officer is 111 Huntington Avenue, Boston, Massachusetts 02199-7618.
| | | | | | | | |
Name, Age | | Position(s)
Held with Fund | | Trustee/Officer
Since (h) | | Principal Occupations
During the Past Five Years | | Other Directorships (j) |
| INTERESTED TRUSTEES |
Robert J. Manning (k) (age 51) | | Trustee | | February 2004 | | Massachusetts Financial Services Company, Chairman, Co-Chief Executive Officer and Director; President (until 2009); Chief Investment Officer (until 2010) | | N/A |
| | | | |
Robin A. Stelmach (k) (age 53) | | Trustee and President | | January 2014 | | Massachusetts Financial Services Company, Executive Vice President and Chief Operating Officer | | N/A |
| | | |
| INDEPENDENT TRUSTEES | | | | | | |
David H. Gunning (age 72) | | Trustee and Chair of Trustees | | January 2004 | | Private investor | | Lincoln Electric Holdings, Inc. (welding equipment manufacturer), Director; Development Alternatives, Inc. (consulting), Director/Non-Executive Chairman |
| | | | |
Steven E. Buller (age 63) | | Trustee | | February 2014 | | Chairman, Financial Accounting Standards Advisory Council; Standing Advisory Group, Public Company Accounting Oversight Board, Member (until 2014); BlackRock, Inc. (investment management), Managing Director (until 2014), BlackRock Finco UK (investment management), Director (until 2014) | | N/A |
| | | | |
Robert E. Butler (age 73) | | Trustee | | January 2006 | | Consultant – investment company industry regulatory and compliance matters | | N/A |
| | | | |
Maureen R. Goldfarb (age 59) | | Trustee | | January 2009 | | Private investor | | N/A |
| | | | |
William R. Gutow (age 73) | | Trustee | | December 1993 | | Private investor and real estate consultant; Capitol Entertainment Management Company (video franchise), Vice Chairman | | Texas Donuts (donut franchise), Vice Chairman (until 2010) |
| | | | |
Michael Hegarty (age 70) | | Trustee | | December 2004 | | Private investor | | Brookfield Office Properties, Inc. (real estate), Director; Rouse Properties Inc. (real estate), Director; Capmark Financial Group Inc. (real estate), Director |
| | | | |
John P. Kavanaugh (age 60) | | Trustee | | January 2009 | | Private investor | | N/A |
| | | | |
Maryanne L. Roepke (age 58) | | Trustee | | May 2014 | | American Century Investments (investment management), Senior Vice President and Chief Compliance Officer (until 2014) | | N/A |
| | | | |
Laurie J. Thomsen (age 57) | | Trustee | | March 2005 | | Private investor; New Profit, Inc. (venture philanthropy), Executive Partner (until 2010) | | The Travelers Companies (insurance), Director |
| | | | |
Robert W. Uek (age 73) | | Trustee | | January 2006 | | Consultant to investment company industry | | N/A |
| | | | |
| OFFICERS | | | | | | | | |
Christopher R. Bohane (k) (age 41) | | Assistant Secretary and Assistant Clerk | | July 2005 | | Massachusetts Financial Services Company, Vice President and Assistant General Counsel | | N/A |
| | | | |
Kino Clark (k) (age 46) | | Assistant Treasurer | | January 2012 | | Massachusetts Financial Services Company, Vice President | | N/A |
| | | | |
Thomas H. Connors (k) (age 55) | | Assistant Secretary and Assistant Clerk | | September 2012 | | Massachusetts Financial Services Company, Vice President and Senior Counsel; Deutsche Investment Management Americas Inc. (financial service provider), Director and Senior Counsel (until 2012) | | N/A |
21
MFS Investors Growth Stock Series
Trustees and Officers – continued
| | | | | | | | |
Name, Age | | Position(s)
Held with Fund | | Trustee/Officer
Since (h) | | Principal Occupations
During the Past Five Years | | Other Directorships (j) |
Ethan D. Corey (k) (age 51) | | Assistant
Secretary and Assistant Clerk | | July 2005 | | Massachusetts Financial Services Company, Senior Vice President and Associate General Counsel | | N/A |
| | | | |
David L. DiLorenzo (k) (age 46) | | Treasurer | | July 2005 | | Massachusetts Financial Services Company, Senior Vice President | | N/A |
| | | | |
Timothy M. Fagan (k) (age 46) | | Chief Compliance Officer | | November 2014 | | Massachusetts Financial Services Company, Chief Compliance Officer; Vice President and Senior Counsel (until 2012) | | N/A |
| | | | |
Brian E. Langenfeld (k) (age 41) | | Assistant
Secretary and Assistant Clerk | | June 2006 | | Massachusetts Financial Services Company, Vice President and Senior Counsel | | N/A |
| | | | |
Susan S. Newton (k) (age 64) | | Assistant
Secretary and Assistant Clerk | | May 2005 | | Massachusetts Financial Services Company, Senior Vice President and Associate General Counsel | | N/A |
| | | | |
Susan A. Pereira (k) (age 44) | | Assistant
Secretary and Assistant Clerk | | July 2005 | | Massachusetts Financial Services Company, Vice President and Senior Counsel | | N/A |
| | | | |
Kasey L. Phillips (k) (age 44) | | Assistant Treasurer | | September 2012 | | Massachusetts Financial Services Company, Vice President; Wells Fargo Funds Management, LLC, Senior Vice President, Fund Treasurer (until 2012) | | N/A |
| | | | |
Mark N. Polebaum (k) (age 62) | | Secretary and
Clerk | | January 2006 | | Massachusetts Financial Services Company, Executive Vice President, General Counsel and Secretary | | N/A |
| | | | |
Matthew A. Stowe (k) (age 40) | | Assistant Secretary and Assistant Clerk | | October 2014 | | Massachusetts Financial Services Company, Vice President and Senior Counsel | | N/A |
| | | | |
Frank L. Tarantino (age 70) | | Independent
Senior Officer | | June 2004 | | Tarantino LLC (provider of compliance services), Principal | | N/A |
| | | | |
Richard S. Weitzel (k) (age 44) | | Assistant Secretary and Assistant Clerk | | October 2007 | | Massachusetts Financial Services Company, Senior Vice President and Associate General Counsel | | N/A |
| | | | |
James O. Yost (k) (age 54) | | Deputy Treasurer | | September 1990 | | Massachusetts Financial Services Company, Senior Vice President | | N/A |
| (h) | Date first appointed to serve as Trustee/officer of an MFS Fund. Each Trustee has served continuously since appointment unless indicated otherwise. For the period from December 15, 2004 until February 22, 2005, Mr. Manning served as Advisory Trustee. Prior to January 2012, Messrs. DiLorenzo and Yost served as Assistant Treasurers of the Funds. Ms. Stelmach was appointed as President of the Funds as of October 1, 2014. |
| (j) | Directorships or trusteeships of companies required to report to the Securities and Exchange Commission (i.e., “public companies”). |
| (k) | “Interested person” of the Trust within the meaning of the Investment Company Act of 1940 (referred to as the 1940 Act), which is the principal federal law governing investment companies like the fund, as a result of a position with MFS. The address of MFS is 111 Huntington Avenue, Boston, Massachusetts 02199-7618. |
Each Trustee (except Ms. Stelmach, Mr. Buller and Ms. Roepke) has been elected by shareholders and each Trustee and officer holds office until his or her successor is chosen and qualified or until his or her earlier death, resignation, retirement or removal. The Trust does not hold annual meetings for the purpose of electing Trustees, and Trustees are not elected for fixed terms. Messrs. Butler, Kavanaugh, Uek and Mses. Thomsen and Roepke are members of the Trust’s Audit Committee.
Each of the Fund’s Trustees and officers holds comparable positions with certain other funds of which MFS or a subsidiary is the investment adviser or distributor, and, in the case of the officers, with certain affiliates of MFS. As of February 1, 2015, the Trustees served as board members of 135 funds within the MFS Family of Funds.
22
MFS Investors Growth Stock Series
Trustees and Officers – continued
The Statement of Additional Information for the Fund includes further information about the Trustees and is available without charge upon request by calling 1-800-225-2606.
| | |
Investment Adviser Massachusetts Financial Services Company 111 Huntington Avenue Boston, MA 02199-7618 | | Custodian State Street Bank and Trust Company 1 Lincoln Street Boston, MA 02111-2900 |
Distributor MFS Fund Distributors, Inc. 111 Huntington Avenue Boston, MA 02199-7618 | | Independent Registered Public Accounting Firm Deloitte & Touche LLP 200 Berkeley Street Boston, MA 02116 |
Portfolio Manager Jeffrey Constantino | | |
23
MFS Investors Growth Stock Series
BOARD REVIEW OF INVESTMENT ADVISORY AGREEMENT
The Investment Company Act of 1940 requires that both the full Board of Trustees and a majority of the non-interested (“independent”) Trustees, voting separately, annually approve the continuation of the Fund’s investment advisory agreement with MFS. The Trustees consider matters bearing on the Fund and its advisory arrangements at their meetings throughout the year, including a review of performance data at each regular meeting. In addition, the independent Trustees met several times over the course of three months beginning in May and ending in July, 2014 (“contract review meetings”) for the specific purpose of considering whether to approve the continuation of the investment advisory agreement for the Fund and the other investment companies that the Board oversees (the “MFS Funds”). The independent Trustees were assisted in their evaluation of the Fund’s investment advisory agreement by independent legal counsel, from whom they received separate legal advice and with whom they met separately from MFS during various contract review meetings. The independent Trustees were also assisted in this process by the MFS Funds’ Independent Chief Compliance Officer, a full-time senior officer appointed by and reporting to the independent Trustees.
In connection with their deliberations regarding the continuation of the investment advisory agreement, the Trustees, including the independent Trustees, considered such information and factors as they believed, in light of the legal advice furnished to them and their own business judgment, to be relevant. The investment advisory agreement for the Fund was considered separately, although the Trustees also took into account the common interests of all MFS Funds in their review. As described below, the Trustees considered the nature, quality, and extent of the various investment advisory, administrative, and shareholder services performed by MFS under the existing investment advisory agreement and other arrangements with the Fund.
In connection with their contract review meetings, the Trustees received and relied upon materials that included, among other items: (i) information provided by Lipper Inc., an independent third party, on the investment performance of the Fund for various time periods ended December 31, 2013 and the investment performance of a group of funds with substantially similar investment classifications/objectives (the “Lipper performance universe”), (ii) information provided by Lipper Inc. on the Fund’s advisory fees and other expenses and the advisory fees and other expenses of comparable funds identified by Lipper Inc. (the “Lipper expense group”), (iii) information provided by MFS on the advisory fees of comparable portfolios of other clients of MFS, including institutional separate accounts and other clients, (iv) information as to whether and to what extent applicable expense waivers, reimbursements or fee “breakpoints” are observed for the Fund, (v) information regarding MFS’ financial results and financial condition, including MFS’ and certain of its affiliates’ estimated profitability from services performed for the Fund and the MFS Funds as a whole, and compared to MFS’ institutional business, (vi) MFS’ views regarding the outlook for the mutual fund industry and the strategic business plans of MFS, (vii) descriptions of various functions performed by MFS for the Funds, such as compliance monitoring and portfolio trading practices, and (viii) information regarding the overall organization of MFS, including information about MFS’ senior management and other personnel providing investment advisory, administrative and other services to the Fund and the other MFS Funds. The comparative performance, fee and expense information prepared and provided by Lipper Inc. was not independently verified and the independent Trustees did not independently verify any information provided to them by MFS.
The Trustees’ conclusion as to the continuation of the investment advisory agreement was based on a comprehensive consideration of all information provided to the Trustees and not the result of any single factor. Some of the factors that figured particularly in the Trustees’ deliberations are described below, although individual Trustees may have evaluated the information presented differently from one another, giving different weights to various factors. It is also important to recognize that the fee arrangements for the Fund and other MFS Funds are the result of years of review and discussion between the independent Trustees and MFS, that certain aspects of such arrangements may receive greater scrutiny in some years than in others, and that the Trustees’ conclusions may be based, in part, on their consideration of these same arrangements during the course of the year and in prior years.
Based on information provided by Lipper Inc. and MFS, the Trustees reviewed the Fund’s total return investment performance as well as the performance of peer groups of funds over various time periods. The Trustees placed particular emphasis on the total return performance of the Fund’s Initial Class shares in comparison to the performance of funds in its Lipper performance universe over the three-year period ended December 31, 2013, which the Trustees believed was a long enough period to reflect differing market conditions. The total return performance of the Fund’s Initial Class shares was in the 3rd quintile relative to the other funds in the universe for this three-year period (the 1st quintile being the best performers and the 5th quintile being the worst performers). The total return performance of the Fund’s Initial Class shares was in the 4th quintile for the one-year period and the 3rd quintile for the five-year period ended December 31, 2013 relative to the Lipper performance universe. Because of the passage of time, these performance results may differ from the performance results for more recent periods, including those shown elsewhere in this report.
In the course of their deliberations, the Trustees took into account information provided by MFS in connection with the contract review meetings, as well as during investment review meetings conducted with portfolio management personnel during the course of the year regarding the Fund’s performance. After reviewing these and related factors, the Trustees concluded, within the context of their overall conclusions regarding the investment advisory agreement, that they were satisfied with MFS’ responses and efforts relating to investment performance.
24
MFS Investors Growth Stock Series
Board Review of Investment Advisory Agreement – continued
In assessing the reasonableness of the Fund’s advisory fee, the Trustees considered, among other information, the Fund’s advisory fee and the total expense ratio of the Fund’s Initial Class shares as a percentage of average daily net assets and the advisory fee and total expense ratios of peer groups of funds based on information provided by Lipper Inc. The Trustees considered that, according to the Lipper data (which takes into account any fee reductions or expense limitations that were in effect during the Fund’s last fiscal year), the Fund’s effective advisory fee rate and total expense ratio were each approximately at the Lipper expense group median.
The Trustees also considered the advisory fees charged by MFS to any comparable institutional accounts. In comparing these fees, the Trustees considered information provided by MFS as to the generally broader scope of services provided by MFS to the Fund in comparison to institutional accounts, the higher demands placed on MFS’ investment personnel and trading infrastructure as a result of the daily cash in-flows and out-flows of the Fund, and the impact on MFS and expenses associated with the more extensive regulatory regime to which the Fund is subject in comparison to institutional accounts.
The Trustees also considered whether the Fund may benefit from any economies of scale in the management of the Fund in the event of growth in assets of the Fund and/or growth in assets of the MFS Funds as a whole. They noted that the Fund’s advisory fee rate schedule is subject to a contractual breakpoint that reduces the Fund’s advisory fee rate on average daily net assets over $1 billion. The Trustees also noted that MFS has agreed in writing to waive a portion of the management fees of certain MFS Funds, including the Fund, if the total combined assets of certain funds within the MFS Funds’ complex increase above agreed upon thresholds (the “group fee waiver”), enabling the Fund’s shareholders to share in the benefits from any economies of scale at the complex level. The group fee waiver is reviewed and renewed annually between the Board and MFS. The Trustees concluded that the breakpoint and the group fee waiver were sufficient to allow the Fund to benefit from economies of scale as its assets and overall complex assets grow.
The Trustees also considered information prepared by MFS relating to MFS’ costs and profits with respect to the Fund, the MFS Funds considered as a group, and other investment companies and accounts advised by MFS, as well as MFS’ methodologies used to determine and allocate its costs to the MFS Funds, the Fund and other accounts and products for purposes of estimating profitability.
After reviewing these and other factors described herein, the Trustees concluded, within the context of their overall conclusions regarding the investment advisory agreement, that the advisory fees charged to the Fund represent reasonable compensation in light of the services being provided by MFS to the Fund.
In addition, the Trustees considered MFS’ resources and related efforts to continue to retain, attract and motivate capable personnel to serve the Fund. The Trustees also considered current and developing conditions in the financial services industry, including the presence of large and well-capitalized companies which are spending, and appear to be prepared to continue to spend, substantial sums to engage personnel and to provide services to competing investment companies. In this regard, the Trustees also considered the financial resources of MFS and its ultimate parent, Sun Life Financial Inc. The Trustees also considered the advantages and possible disadvantages to the Fund of having an adviser that also serves other investment companies as well as other accounts.
The Trustees also considered the nature, quality, cost, and extent of administrative, transfer agency, and distribution services provided to the Fund by MFS and its affiliates under agreements and plans other than the investment advisory agreement, including any 12b-1 fees the Fund pays to MFS Fund Distributors, Inc., an affiliate of MFS. The Trustees also considered the nature, extent and quality of certain other services MFS performs or arranges for on the Fund’s behalf, which may include securities lending programs, directed expense payment programs, class action recovery programs, and MFS’ interaction with third-party service providers, principally custodians and sub-custodians. The Trustees concluded that the various non-advisory services provided by MFS and its affiliates on behalf of the Fund were satisfactory.
The Trustees also considered benefits to MFS from the use of the Fund’s portfolio brokerage commissions, if applicable, to pay for investment research and various other factors. Additionally, the Trustees considered so-called “fall-out benefits” to MFS such as reputational value derived from serving as investment manager to the Fund.
Based on their evaluation of factors that they deemed to be material, including those factors described above, the Board of Trustees, including the independent Trustees, concluded that the Fund’s investment advisory agreement with MFS should be continued for an additional one-year period, commencing August 1, 2014.
25
MFS Investors Growth Stock Series
PROXY VOTING POLICIES AND INFORMATION
MFS votes proxies on behalf of the fund pursuant to proxy voting policies and procedures that are available without charge, upon request, by calling 1-800-225-2606, by visiting the Proxy Voting section of mfs.com or by visiting the SEC’s Web site at http://www.sec.gov.
Information regarding how the fund voted proxies relating to portfolio securities during the most recent twelve-month period ended June 30 is available without charge by visiting the Proxy Voting section of mfs.com or by visiting the SEC’s Web site at http://www.sec.gov.
QUARTERLY PORTFOLIO DISCLOSURE
The fund will file a complete schedule of portfolio holdings with the Securities and Exchange Commission (the Commission) for the first and third quarters of each fiscal year on Form N-Q. The fund’s Form N-Q is available on the EDGAR database on the Commission’s Internet Web site at http://www.sec.gov, and may be reviewed and copied at the:
Public Reference Room
Securities and Exchange Commission
100 F Street, NE, Room 1580
Washington, D.C. 20549
Information on the operation of the Public Reference Room may be obtained by calling the Commission at 1-800-SEC-0330. Copies of the fund’s Form N-Q also may be obtained, upon payment of a duplicating fee, by electronic request at the following e-mail address: publicinfo@sec.gov or by writing the Public Reference Section at the above address.
FURTHER INFORMATION
From time to time, MFS may post important information about the fund or the MFS funds on the MFS web site (mfs.com). This information is available by visiting the “Market Commentary” and “Announcements” sub sections in the “Market Outlooks” section of mfs.com or by clicking on the fund’s name under “Variable Insurance Portfolios — VIT” in the “Products” section of mfs.com.
FEDERAL TAX INFORMATION (unaudited)
The following information is provided pursuant to provisions of the Internal Revenue Code.
The fund designates $19,929,000 as capital gain dividends paid during the fiscal year.
For corporate shareholders, 82.17% of the ordinary income dividends paid during the fiscal year qualify for the corporate dividends received deduction.
26
rev. 3/11
| | | | |
| FACTS | | WHAT DOES MFS DO WITH YOUR
PERSONAL INFORMATION? | |  |
| | |
| Why? | | Financial companies choose how they share your personal information. Federal law gives consumers the right to limit some but not all sharing. Federal law also requires us to tell you how we collect, share, and protect your personal information. Please read this notice carefully to understand what we do. |
| | |
| What? | | The types of personal information we collect and share depend on the product or service you have with us. This information can include: • Social Security number and account balances • Account transactions and transaction history • Checking account information and wire transfer instructions When you are no longer our customer, we continue to share your information as described in this notice. |
| | |
| How? | | All financial companies need to share customers’ personal information to run their everyday business. In the section below, we list the reasons financial companies can share their customers’ personal information; the reasons MFS chooses to share; and whether you can limit this sharing. |
| | | | |
Reasons we can share your
personal information | | Does MFS share? | | Can you limit this
sharing? |
For our everyday business purposes – such as to process your transactions, maintain your account(s), respond to court orders and legal investigations, or report to credit bureaus | | Yes | | No |
For our marketing purposes – to offer our products and services to you | | No | | We don’t share |
| For joint marketing with other financial companies | | No | | We don’t share |
For our affiliates’ everyday business purposes – information about your transactions and experiences | | No | | We don’t share |
For our affiliates’ everyday business purposes – information about your creditworthiness | | No | | We don’t share |
| For nonaffiliates to market to you | | No | | We don’t share |
| | |
| Questions? | | Call 800-225-2606 or go to mfs.com. |
27
| | |
| Who we are |
| Who is providing this notice? | | MFS Funds, MFS Investment Management, MFS Institutional Advisors, Inc., MFS Fund Distributors, Inc., MFS Heritage Trust Company, and MFS Service Center, Inc. |
| | |
| What we do |
| How does MFS protect my personal information? | | To protect your personal information from unauthorized access and use, we use security measures that comply with federal law. These measures include procedural, electronic, and physical safeguards for the protection of the personal information we collect about you. |
How does MFS
collect my personal information? | | We collect your personal information, for example, when you • open an account or provide account information • direct us to buy securities or direct us to sell your securities • make a wire transfer We also collect your personal information from others, such as credit bureaus, affiliates and other companies. |
| Why can’t I limit all sharing? | | Federal law gives you the right to limit only • sharing for affiliates’ everyday business purposes – information about your creditworthiness • affiliates from using your information to market to you • sharing for nonaffiliates to market to you State laws and individual companies may give you additional rights to limit sharing. |
| | |
| Definitions |
| Affiliates | | Companies related by common ownership or control. They can be financial and nonfinancial companies. •MFS does not share personal information with affiliates, except for everyday business purposes as described on page one of this notice. |
| Nonaffiliates | | Companies not related by common ownership or control. They can be financial and nonfinancial companies. •MFS does not share with nonaffiliates so they can market to you. |
| Joint Marketing | | A formal agreement between nonaffiliated financial companies that together market financial products or services to you. •MFS doesn’t jointly market. |
| | |
| Other important information |
| If you own an MFS product or receive an MFS service in the name of a third party such as a bank or broker-dealer, their privacy policy may apply to you instead of ours. |
28
ANNUAL REPORT
December 31, 2014

MFS® INVESTORS TRUST SERIES
MFS® Variable Insurance Trust

VGI-ANN
MFS® INVESTORS TRUST SERIES
CONTENTS
The report is prepared for the general information of contract owners. It is authorized for distribution to prospective investors only when preceded or accompanied by a current prospectus.
NOT FDIC INSURED Ÿ MAY LOSE VALUE Ÿ NO BANK OR CREDIT UNION GUARANTEE Ÿ NOT A DEPOSIT Ÿ NOT INSURED BY ANY FEDERAL GOVERNMENT AGENCY OR NCUA/NCUSIF
MFS Investors Trust Series
LETTER FROM THE CHAIRMAN

Dear Contract Owners:
As 2015 begins, sharply lower oil prices are reshaping the global economy, adding to deflationary pressures in the eurozone and exacerbating challenges faced by oil exporters such as Russia. The U.S. economy stands on firmer ground, having expanded steadily over the past year. The U.S. labor market has regained momentum, consumer confidence is buoyant and gasoline prices have tumbled, boosting prospects for a stronger economic rebound in 2015.
Other regions are struggling. The eurozone economy is barely expanding, and the European Central Bank (ECB) has introduced large-scale asset purchases.
Despite Japan’s efforts to strengthen its economy, its sales tax increase last spring tipped the country into a recession, leading to additional monetary stimulus from the Bank of Japan. China’s economy is slowing as it transitions to a more sustainable basis, and its growth rate will likely continue to decline.
As always, active risk management is integral to how we at MFS® manage your investments. We use a collaborative process, sharing insights across asset classes, regions and economic sectors. Our global investment team uses a diversified, multidisciplined, long-term approach.
Applying proven principles, such as asset allocation and diversification, can best serve investors over the long term. We are confident that this approach can help you as you work with your financial advisors to reach your goals in the years ahead.
Respectfully,

Robert J. Manning
Chairman
MFS Investment Management
February 13, 2015
The opinions expressed in this letter are subject to change and may not be relied upon for investment advice. No forecasts can be guaranteed.
1
MFS Investors Trust Series
PORTFOLIO COMPOSITION
Portfolio structure

| | | | |
| Top ten holdings | | | | |
| JPMorgan Chase & Co. | | | 3.0% | |
| Danaher Corp. | | | 2.8% | |
| Visa, Inc., “A” | | | 2.5% | |
| EMC Corp. | | | 2.2% | |
| Johnson & Johnson | | | 2.1% | |
| Procter & Gamble Co. | | | 2.1% | |
| Wells Fargo & Co. | | | 2.1% | |
| Walt Disney Co. | | | 2.0% | |
| United Technologies Corp. | | | 2.0% | |
| American Express Co. | | | 1.9% | |
| | | | |
| Equity sectors | | | | |
| Financial Services | | | 19.4% | |
| Health Care | | | 14.2% | |
| Technology | | | 10.6% | |
| Industrial Goods & Services | | | 9.4% | |
| Consumer Staples | | | 8.0% | |
| Leisure | | | 7.9% | |
| Retailing | | | 7.6% | |
| Energy | | | 5.9% | |
| Special Products & Services | | | 4.4% | |
| Basic Materials | | | 3.7% | |
| Utilities & Communications | | | 3.6% | |
| Transportation | | | 2.2% | |
| Autos & Housing | | | 1.6% | |
Cash & Other can include cash, other assets less liabilities, offsets to derivative positions, and short-term securities.
Percentages are based on net assets as of 12/31/14.
The portfolio is actively managed and current holdings may be different.
2
MFS Investors Trust Series
MANAGEMENT REVIEW
Summary of Results
For the twelve months ended December 31, 2014, Initial Class shares of the MFS Investors Trust Series (“fund”) provided a total return of 11.01%, while Service Class shares of the fund provided a total return of 10.71%. These compare with a return of 13.69% over the same period for the fund’s benchmark, the Standard & Poor’s 500 Stock Index (“S&P 500 Index”).
Market Environment
Early in the period, US equities suffered what proved to be a temporary setback due to concerns over emerging markets as well as what was perceived at the time to be a pause in US economic growth, partially caused by extreme weather events and a weak December 2013 labor market report. Markets soon recovered as the economic pause concluded and investors appeared to have become increasingly comfortable that newly-installed US Federal Reserve (“Fed”) Chair Janet Yellen would not make any substantial changes to the trajectory of Fed monetary policy.
A generally risk-friendly, carry trade environment persisted from February 2014 until mid-year. While geopolitical tensions flared in the Middle East and Russia/Ukraine, any market setbacks were short-lived as improving economic growth in the US, coupled with prospects for easier monetary policy in regions with slowing growth, such as Japan, Europe and China, supported risk assets. For example, the European Central Bank (“ECB”) cut policy interest rates into negative territory and, by the end of the period, expectations were for additional rate cuts and the announcement for non-conventional easing measures. Similarly, the Bank of Japan surprised markets late in the period with fresh stimulus measures given lackluster growth trends. The related decline in developed market government bond yields and credit spreads were also supportive for equity markets. At the end of the period, the US equity market was trading close to all-time highs and US Treasury yields were close to their lows for the period. However, credit markets did not fare as well in the second half of 2014, particularly US high yield and emerging market debt. The higher weightings of oil and gas credits in these asset classes resulted in widening spreads and increased volatility as oil prices began to decline in an accelerated fashion in the fourth quarter.
Detractors from Performance
The combination of weak stock selection and an underweight position in the technology sector was a negative factor for performance relative to the S&P 500 Index. Within this sector, the fund’s underweight position in computer and personal electronics maker Apple, and not holding shares of strong-performing computer electronic components manufacturer Intel and computer and software provider Microsoft, weighed on relative results as all three stocks outperformed the benchmark during the period. The fund’s overweight position in poor-performing internet search giant Google also hurt relative performance. Shares of Google missed analysts’ estimates for both revenue and income for the last four quarters. The company continued to face headwinds from a maturing internet search market, challenges with monetizing mobile search, and regulatory anti-trust rulings in the European Union.
Weak stock selection in the consumer staples sector was another detractor from relative returns, led by the fund’s holdings of international food producer Groupe Danone (b) (France) and alcoholic beverage producer Diageo (b) (United Kingdom) hampered relative performance as both stocks turned in negative performance. Shares of Diageo declined due to the company’s slower sales growth in the emerging markets and North America.
Stock selection in both the health care and basic materials sectors also detracted from relative results. However, there were no individual stocks within either sector that were among the fund’s largest relative detractors during the period.
Elsewhere, the fund’s overweight positions in independent energy company Noble Energy, oil and gas equipment company Cameron International and construction engineering firm Fluor Corp. held back relative performance. Shares of these oil-sensitive companies declined during the period primarily due to a significant decrease in oil prices during the period. Additionally, an overweight position in poor-performing aerospace and defense parts maker Precision Castparts lowered relative performance.
During the reporting period, the fund’s relative currency exposure, resulting primarily from differences between the fund’s and the benchmark’s exposures to holdings of securities denominated in foreign currencies, detracted from relative performance. All of MFS’ investment decisions are driven by the fundamentals of each individual opportunity and, as such, it is common for our portfolios to have different currency exposure than the benchmark.
Contributors to Performance
Strong stock selection in both the leisure and autos & housing sectors benefited relative performance during the period. Within the leisure sector, the fund’s overweight position in media company Time Warner boosted relative returns as its stock price rose on the back of solid revenue growth. Within autos & housing, the fund’s overweight position in strong-performing paint company Sherwin-Williams aided relative results. The company beat market expectations due to strong volume trends across all segments which were the primary drivers behind the stock’s outperformance.
Stocks in other sectors that benefited relative performance included the fund’s overweight positions in medical equipment manufacturer Covidien, computer products and services provider Hewlett-Packard, and women’s apparel holding company Limited
3
MFS Investors Trust Series
Management Review – continued
Brands as all three stocks posted strong performance during the period. Shares of Covidien skyrocketed during the middle of the period as the company announced that Medtronic had entered into an agreement to acquire the company at a significant premium. The fund’s underweight positions in poor-performing energy companies Exxon Mobil and Chevron, and avoiding shares of weak-performing diversified industrial company General Electric, internet retailer Amazon.com and diversified technology products and services company International Business Machines (IBM), supported relative returns.
Respectfully,
| | |
| T. Kevin Beatty | | Ted Maloney |
| Portfolio Manager | | Portfolio Manager |
| (b) | Security is not a benchmark constituent. |
The views expressed in this report are those of the portfolio managers only through the end of the period of the report as stated on the cover and do not necessarily reflect the views of MFS or any other person in the MFS organization. These views are subject to change at any time based on market or other conditions, and MFS disclaims any responsibility to update such views. These views may not be relied upon as investment advice or an indication of trading intent on behalf of any MFS portfolio. References to specific securities are not recommendations of such securities, and may not be representative of any MFS portfolio’s current or future investments.
4
MFS Investors Trust Series
PERFORMANCE SUMMARY THROUGH 12/31/14
The following chart illustrates the historical performance of the fund in comparison to its benchmark(s). Benchmarks are unmanaged and may not be invested in directly. Benchmark returns do not reflect any fees or expenses. The performance of other share classes will be greater than or less than that of the class depicted below. (See Notes to Performance Summary.)
Performance data shown represents past performance and is no guarantee of future results. Investment return and principal value fluctuate so your units, when sold, may be worth more or less than the original cost; current performance may be lower or higher than quoted. The performance shown does not reflect the deduction of taxes, if any, that a contract holder would pay on fund distributions or the redemption of contract units. The returns for the fund shown also do not reflect the deduction of expenses associated with variable products, such as mortality and expense risk charges, separate account charges, and sales charges imposed by the insurance company separate accounts. Such expenses would reduce the overall returns shown.
Growth of a Hypothetical $10,000 Investment
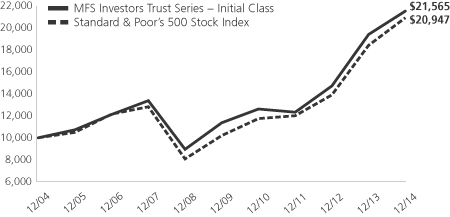
Total Returns through 12/31/14
Average annual total returns
| | | | | | | | | | | | |
| | | Share Class | | Class inception date | | 1-yr | | 5-yr | | 10-yr | | |
| | | Initial Class | | 10/09/95 | | 11.01% | | 13.68% | | 7.99% | | |
| | | Service Class | | 5/01/00 | | 10.71% | | 13.40% | | 7.71% | | |
| | | | |
| Comparative benchmark | | | | | | | | |
| | | Standard & Poor’s 500 Stock Index (f) | | 13.69% | | 15.45% | | 7.67% | | |
| (f) | Source: FactSet Research Systems Inc. |
Benchmark Definition
Standard & Poor’s 500 Stock Index – a market capitalization-weighted index of 500 widely held equity securities, designed to measure broad U.S. equity performance.
It is not possible to invest directly in an index.
Notes to Performance Summary
Average annual total return represents the average annual change in value for each share class for the periods presented.
Performance results reflect any applicable expense subsidies and waivers in effect during the periods shown. Without such subsidies and waivers the fund’s performance results would be less favorable. Please see the prospectus and financial statements for complete details. All results are historical and assume the reinvestment of any dividends and capital gains distributions.
Performance results do not include adjustments made for financial reporting purposes in accordance with U.S. generally accepted accounting principles and may differ from amounts reported in the financial highlights.
From time to time the fund may receive proceeds from litigation settlements, without which performance would be lower.
5
MFS Investors Trust Series
EXPENSE TABLE
Fund Expenses Borne by the Contract Holders During the Period,
July 1, 2014 through December 31, 2014
As a contract holder of the fund, you incur ongoing costs, including management fees; distribution and/or service (12b-1) fees; and other fund expenses. This example is intended to help you understand your ongoing costs (in dollars) of investing in the fund and to compare these costs with the ongoing costs of investing in other mutual funds.
The example is based on an investment of $1,000 invested at the beginning of the period and held for the entire period July 1, 2014 through December 31, 2014.
Actual Expenses
The first line for each share class in the following table provides information about actual account values and actual expenses. You may use the information in this line, together with the amount you invested, to estimate the expenses that you paid over the period. Simply divide your account value by $1,000 (for example, an $8,600 account value divided by $1,000 = 8.6), then multiply the result by the number in the first line under the heading entitled “Expenses Paid During Period” to estimate the expenses you paid on your account during this period.
Hypothetical Example for Comparison Purposes
The second line for each share class in the following table provides information about hypothetical account values and hypothetical expenses based on the fund’s actual expense ratio and an assumed rate of return of 5% per year before expenses, which is not the fund’s actual return. The hypothetical account values and expenses may not be used to estimate the actual ending account balance or expenses you paid for the period. You may use this information to compare the ongoing costs of investing in the fund and other funds. To do so, compare this 5% hypothetical example with the 5% hypothetical examples that appear in the shareholder reports of the other funds.
Please note that the expenses shown in the table are meant to highlight the fund’s ongoing costs only and do not take into account the fees and expenses imposed under the variable contracts through which your investment in the fund is made. Therefore, the second line for each share class in the table is useful in comparing ongoing costs associated with an investment in vehicles (such as the fund) which fund benefits under variable annuity and variable life insurance contracts and to qualified pension and retirement plans only, and will not help you determine the relative total costs of investing in the fund through variable annuity and variable life insurance contracts. If the fees and expenses imposed under the variable contracts were included, your costs would have been higher.
| | | | | | | | | | | | | | | | | | |
| Share Class | | | | Annualized
Expense Ratio | | | Beginning
Account Value
7/01/14 | | | Ending Account Value
12/31/14 | | | Expenses Paid
During Period (p)
7/01/14-12/31/14 | |
| Initial Class | | Actual | | | 0.80% | | | | $1,000.00 | | | | $1,057.12 | | | | $4.15 | |
| | Hypothetical (h) | | | 0.80% | | | | $1,000.00 | | | | $1,021.17 | | | | $4.08 | |
| Service Class | | Actual | | | 1.05% | | | | $1,000.00 | | | | $1,055.60 | | | | $5.44 | |
| | Hypothetical (h) | | | 1.05% | | | | $1,000.00 | | | | $1,019.91 | | | | $5.35 | |
| (h) | 5% class return per year before expenses. |
| (p) | “Expenses Paid During Period” are equal to each class’s annualized expense ratio, as shown above, multiplied by the average account value over the period, multiplied by 184/365 (to reflect the one-half year period). |
6
MFS Investors Trust Series
PORTFOLIO OF INVESTMENTS – 12/31/14
The Portfolio of Investments is a complete list of all securities owned by your fund. It is categorized by broad-based asset classes.
| | | | | | | | |
| Issuer | | Shares/Par | | | Value ($) | |
| | | | | | | | |
| COMMON STOCKS – 98.2% | | | | | | | | |
| Aerospace – 5.0% | | | | | | | | |
| Honeywell International, Inc. | | | 105,644 | | | $ | 10,555,948 | |
| Precision Castparts Corp. | | | 35,668 | | | | 8,591,708 | |
| United Technologies Corp. | | | 109,874 | | | | 12,635,510 | |
| | | | | | | | |
| | | | | | $ | 31,783,166 | |
| | | | | | | | |
| Alcoholic Beverages – 1.7% | �� | | | | | | | |
| Diageo PLC | | | 155,015 | | | $ | 4,446,008 | |
| Pernod Ricard S.A. | | | 59,158 | | | | 6,559,259 | |
| | | | | | | | |
| | | | | | $ | 11,005,267 | |
| | | | | | | | |
| Apparel Manufacturers – 2.4% | | | | | | | | |
| LVMH Moet Hennessy Louis Vuitton S.A. | | | 31,541 | | | $ | 4,987,707 | |
| NIKE, Inc., “B” | | | 40,844 | | | | 3,927,151 | |
| VF Corp. | | | 81,614 | | | | 6,112,889 | |
| | | | | | | | |
| | | | | | $ | 15,027,747 | |
| | | | | | | | |
| Automotive – 0.5% | | | | | | | | |
| Delphi Automotive PLC | | | 41,465 | | | $ | 3,015,335 | |
| | | | | | | | |
| Broadcasting – 5.0% | | | | | | | | |
| Time Warner, Inc. | | | 131,057 | | | $ | 11,194,889 | |
| Twenty-First Century Fox, Inc. | | | 209,067 | | | | 8,029,218 | |
| Walt Disney Co. | | | 137,586 | | | | 12,959,225 | |
| | | | | | | | |
| | | | | | $ | 32,183,332 | |
| | | | | | | | |
| Brokerage & Asset Managers – 2.9% | | | | | |
| BlackRock, Inc. | | | 28,400 | | | $ | 10,154,704 | |
| Franklin Resources, Inc. | | | 40,288 | | | | 2,230,747 | |
| NASDAQ OMX Group, Inc. | | | 128,158 | | | | 6,146,458 | |
| | | | | | | | |
| | | | | | $ | 18,531,909 | |
| | | | | | | | |
| Business Services – 4.4% | | | | | | | | |
| Accenture PLC, “A” | | | 109,639 | | | $ | 9,791,859 | |
| Cognizant Technology Solutions Corp., “A” (a) | | | 183,002 | | | | 9,636,885 | |
| Fidelity National Information Services, Inc. | | | 140,628 | | | | 8,747,062 | |
| | | | | | | | |
| | | | | | $ | 28,175,806 | |
| | | | | | | | |
| Cable TV – 1.8% | | | | | | | | |
| Comcast Corp., “A” | | | 199,123 | | | $ | 11,551,125 | |
| | | | | | | | |
| Computer Software – 1.1% | | | | | | | | |
| Citrix Systems, Inc. (a) | | | 68,276 | | | $ | 4,356,009 | |
| Oracle Corp. | | | 62,688 | | | | 2,819,079 | |
| | | | | | | | |
| | | | | | $ | 7,175,088 | |
| | | | | | | | |
| Computer Software – Systems – 4.2% | | | | | |
| Apple, Inc. | | | 61,302 | | | $ | 6,766,515 | |
| EMC Corp. | | | 463,278 | | | | 13,777,888 | |
| Hewlett-Packard Co. | | | 159,596 | | | | 6,404,587 | |
| | | | | | | | |
| | | | | | $ | 26,948,990 | |
| | | | | | | | |
| Construction – 1.1% | | | | | | | | |
| Sherwin-Williams Co. | | | 27,133 | | | $ | 7,137,064 | |
| | | | | | | | |
| | | | | | | | |
| Issuer | | Shares/Par | | | Value ($) | |
| | | | | | | | |
| COMMON STOCKS – continued | | | | | |
| Consumer Products – 3.8% | | | | | | | | |
| Colgate-Palmolive Co. | | | 75,947 | | | $ | 5,254,773 | |
| Newell Rubbermaid, Inc. | | | 145,609 | | | | 5,546,247 | |
| Procter & Gamble Co. | | | 146,064 | | | | 13,304,970 | |
| | | | | | | | |
| | | | | | $ | 24,105,990 | |
| | | | | | | | |
| Containers – 1.1% | | | | | | | | |
| Crown Holdings, Inc. (a) | | | 143,816 | | | $ | 7,320,234 | |
| | | | | | | | |
| Electrical Equipment – 3.9% | | | | | | | | |
| Danaher Corp. | | | 208,914 | | | $ | 17,906,019 | |
| W.W. Grainger, Inc. | | | 26,463 | | | | 6,745,154 | |
| | | | | | | | |
| | | | | | $ | 24,651,173 | |
| | | | | | | | |
| Electronics – 2.4% | | | | | | | | |
| Altera Corp. | | | 189,890 | | | $ | 7,014,537 | |
| Microchip Technology, Inc. | | | 186,466 | | | | 8,411,481 | |
| | | | | | | | |
| | | | | | $ | 15,426,018 | |
| | | | | | | | |
| Energy – Independent – 3.2% | | | | | | | | |
| EOG Resources, Inc. | | | 100,580 | | | $ | 9,260,401 | |
| Noble Energy, Inc. | | | 126,926 | | | | 6,020,100 | |
| Occidental Petroleum Corp. | | | 61,011 | | | | 4,918,097 | |
| | | | | | | | |
| | | | | | $ | 20,198,598 | |
| | | | | | | | |
| Engineering – Construction – 0.6% | | | | | |
| Fluor Corp. | | | 64,569 | | | $ | 3,914,818 | |
| | | | | | | | |
| Food & Beverages – 2.5% | | | | | | | | |
| Danone S.A. | | | 97,261 | | | $ | 6,398,460 | |
| General Mills, Inc. | | | 46,842 | | | | 2,498,084 | |
| Mondelez International, Inc. | | | 197,355 | | | | 7,168,920 | |
| | | | | | | | |
| | | | | | $ | 16,065,464 | |
| | | | | | | | |
| General Merchandise – 2.1% | | | | | | | | |
| Kohl’s Corp. | | | 102,854 | | | $ | 6,278,208 | |
| Target Corp. | | | 94,649 | | | | 7,184,806 | |
| | | | | | | | |
| | | | | | $ | 13,463,014 | |
| | | | | | | | |
| Insurance – 0.9% | | | | | | | | |
| ACE Ltd. | | | 47,318 | | | $ | 5,435,892 | |
| | | | | | | | |
| Internet – 2.8% | | | | | | | | |
| Google, Inc., “A” (a) | | | 18,891 | | | $ | 10,024,698 | |
| Google, Inc., “C” (a) | | | 15,136 | | | | 7,967,590 | |
| | | | | | | | |
| | | | | | $ | 17,992,288 | |
| | | | | | | | |
| Major Banks – 9.7% | | | | | | | | |
| Bank of America Corp. | | | 479,079 | | | $ | 8,570,723 | |
| Goldman Sachs Group, Inc. | | | 60,650 | | | | 11,755,790 | |
| JPMorgan Chase & Co. | | | 303,007 | | | | 18,962,178 | |
| Morgan Stanley | | | 152,627 | | | | 5,921,928 | |
| State Street Corp. | | | 50,141 | | | | 3,936,069 | |
| Wells Fargo & Co. | | | 241,031 | | | | 13,213,319 | |
| | | | | | | | |
| | | | | | $ | 62,360,007 | |
| | | | | | | | |
7
MFS Investors Trust Series
Portfolio of Investments – continued
| | | | | | | | |
| Issuer | | Shares/Par | | | Value ($) | |
| | | | | | | | |
| COMMON STOCKS – continued | | | | | |
| Medical & Health Technology & Services – 0.9% | | | | | |
| McKesson Corp. | | | 28,689 | | | $ | 5,955,263 | |
| | | | | | | | |
| Medical Equipment – 5.2% | | | | | | | | |
| Abbott Laboratories | | | 129,813 | | | $ | 5,844,181 | |
| Covidien PLC | | | 62,854 | | | | 6,428,707 | |
| St. Jude Medical, Inc. | | | 70,172 | | | | 4,563,285 | |
| Stryker Corp. | | | 62,028 | | | | 5,851,101 | |
| Thermo Fisher Scientific, Inc. | | | 85,775 | | | | 10,746,750 | |
| | | | | | | | |
| | | | | | $ | 33,434,024 | |
| | | | | | | | |
| Oil Services – 2.8% | | | | | | | | |
| Cameron International Corp. (a) | | | 100,635 | | | $ | 5,026,718 | |
| National Oilwell Varco, Inc. | | | 65,630 | | | | 4,300,734 | |
| Schlumberger Ltd. | | | 97,500 | | | | 8,327,475 | |
| | | | | | | | |
| | | | | | $ | 17,654,927 | |
| | | | | | | | |
| Other Banks & Diversified Financials – 5.9% | | | | | |
| American Express Co. | | | 127,640 | | | $ | 11,875,626 | |
| MasterCard, Inc., “A” | | | 112,311 | | | | 9,676,716 | |
| Visa, Inc., “A” | | | 61,487 | | | | 16,121,891 | |
| | | | | | | | |
| | | | | | $ | 37,674,233 | |
| | | | | | | | |
| Pharmaceuticals – 8.0% | | | | | | | | |
| AbbVie, Inc. | | | 93,794 | | | $ | 6,137,879 | |
| Actavis PLC (a) | | | 14,653 | | | | 3,771,829 | |
| Bristol-Myers Squibb Co. | | | 98,897 | | | | 5,837,890 | |
| Eli Lilly & Co. | | | 44,609 | | | | 3,077,575 | |
| Endo International PLC (a) | | | 84,633 | | | | 6,103,732 | |
| Johnson & Johnson | | | 127,593 | | | | 13,342,400 | |
| Pfizer, Inc. | | | 111,386 | | | | 3,469,674 | |
| Valeant Pharmaceuticals International, Inc. (a) | | | 67,071 | | | | 9,598,531 | |
| | | | | | | | |
| | | | | | $ | 51,339,510 | |
| | | | | | | | |
| Railroad & Shipping – 1.3% | | | | | | | | |
| Canadian National Railway Co. | | | 122,391 | | | $ | 8,433,964 | |
| | | | | | | | |
| Restaurants – 1.1% | | | | | | | | |
| McDonald’s Corp. | | | 73,729 | | | $ | 6,908,407 | |
| | | | | | | | |
| Specialty Chemicals – 2.6% | | | | | | | | |
| FMC Corp. | | | 12,278 | | | $ | 700,214 | |
| Linde AG | | | 24,667 | | | | 4,602,609 | |
| Praxair, Inc. | | | 39,464 | | | | 5,112,956 | |
| W.R. Grace & Co. (a) | | | 64,021 | | | | 6,106,963 | |
| | | | | | | | |
| | | | | | $ | 16,522,742 | |
| | | | | | | | |
| Specialty Stores – 3.2% | | | | | | | | |
| Bed Bath & Beyond, Inc. (a) | | | 108,829 | | | $ | 8,289,505 | |
| Hermes International | | | 259 | | | | 92,391 | |
| L Brands, Inc. | | | 63,475 | | | | 5,493,761 | |
| Ross Stores, Inc. | | | 67,959 | | | | 6,405,815 | |
| | | | | | | | |
| | | | | | $ | 20,281,472 | |
| | | | | | | | |
| Telecommunications – Wireless – 1.8% | | | | | |
| American Tower Corp., REIT | | | 114,200 | | | $ | 11,288,670 | |
| | | | | | | | |
| Trucking – 0.8% | | | | | | | | |
| United Parcel Service, Inc., “B” | | | 48,217 | | | $ | 5,360,284 | |
| | | | | | | | |
| | | | | | | | |
| Issuer | | Shares/Par | | | Value ($) | |
| | | | | | | | |
| COMMON STOCKS – continued | | | | | |
| Utilities – Electric Power – 1.5% | | | | | | | | |
| American Electric Power Co., Inc. | | | 72,658 | | | $ | 4,411,794 | |
| CMS Energy Corp. | | | 157,717 | | | | 5,480,666 | |
| | | | | | | | |
| | | | | | $ | 9,892,460 | |
| | | | | | | | |
Total Common Stocks
(Identified Cost, $414,956,717) | | | | | | $ | 628,214,281 | |
| | | | | | | | |
|
| CONVERTIBLE PREFERRED STOCKS – 0.3% | |
| Utilities – Electric Power – 0.3% | | | | | | | | |
Exelon Corp., 6.5%
(Identified Cost, $1,672,245) | | | 33,054 | | | $ | 1,735,335 | |
| | | | | | | | |
| |
| MONEY MARKET FUNDS – 1.5% | | | | | |
| MFS Institutional Money Market Portfolio, 0.09%, at Cost and Net Asset Value (v) | | | 9,693,997 | | | $ | 9,693,997 | |
| | | | | | | | |
Total Investments
(Identified Cost, $426,322,959) | | | | | | $ | 639,643,613 | |
| | | | | | | | |
OTHER ASSETS, LESS
LIABILITIES – 0.0% | | | | | | | 72,841 | |
| | | | | | | | |
| NET ASSETS – 100.0% | | | | | | $ | 639,716,454 | |
| | | | | | | | |
| (a) | | Non-income producing security. |
| (v) | | Underlying affiliated fund that is available only to investment companies managed by MFS. The rate quoted for the MFS Institutional Money Market Portfolio is the annualized seven-day yield of the fund at period end. |
The following abbreviations are used in this report and are defined:
| PLC | | Public Limited Company |
| REIT | | Real Estate Investment Trust |
See Notes to Financial Statements
8
MFS Investors Trust Series
FINANCIAL STATEMENTS | STATEMENT OF ASSETS AND LIABILITIES
This statement represents your fund’s balance sheet, which details the assets and liabilities comprising the total value of the fund.
| | | | | | | | |
At 12/31/14 | | | | | | | | |
Assets | | | | | | | | |
Investments – | | | | | | | | |
Non-affiliated issuers, at value (identified cost, $416,628,962) | | | $629,949,616 | | | | | |
Underlying affiliated funds, at cost and value | | | 9,693,997 | | | | | |
Total investments, at value (identified cost, $426,322,959) | | | $639,643,613 | | | | | |
Cash | | | 22,426 | | | | | |
Receivables for | | | | | | | | |
Fund shares sold | | | 278,630 | | | | | |
Interest and dividends | | | 676,059 | | | | | |
Other assets | | | 3,983 | | | | | |
Total assets | | | | | | | $640,624,711 | |
Liabilities | | | | | | | | |
Payable to custodian | | | $68,629 | | | | | |
Payables for | | | | | | | | |
Investments purchased | | | 17 | | | | | |
Fund shares reacquired | | | 704,915 | | | | | |
Payable to affiliates | | | | | | | | |
Investment adviser | | | 23,209 | | | | | |
Shareholder servicing costs | | | 402 | | | | | |
Distribution and/or service fees | | | 3,925 | | | | | |
Payable for independent Trustees’ compensation | | | 6 | | | | | |
Accrued expenses and other liabilities | | | 107,154 | | | | | |
Total liabilities | | | | | | | $908,257 | |
Net assets | | | | | | | $639,716,454 | |
Net assets consist of | | | | | | | | |
Paid-in capital | | | $360,298,655 | | | | | |
Unrealized appreciation (depreciation) on investments and translation of assets and liabilities in foreign currencies | | | 213,321,695 | | | | | |
Accumulated net realized gain (loss) on investments and foreign currency | | | 61,303,504 | | | | | |
Undistributed net investment income | | | 4,792,600 | | | | | |
Net assets | | | | | | | $639,716,454 | |
Shares of beneficial interest outstanding | | | | | | | 21,119,836 | |
| | | | | | | | | | | | |
| | | Net assets | | | Shares
outstanding | | | Net asset value
per share | |
Initial Class | | | $356,388,799 | | | | 11,717,815 | | | | $30.41 | |
Service Class | | | 283,327,655 | | | | 9,402,021 | | | | 30.13 | |
See Notes to Financial Statements
9
MFS Investors Trust Series
FINANCIAL STATEMENTS | STATEMENT OF OPERATIONS
This statement describes how much your fund earned in investment income and accrued in expenses. It also describes any gains and/or losses generated by fund operations.
| | | | | | | | |
Year ended 12/31/14 | | | | | | | | |
Net investment income | | | | | | | | |
Income | | | | | | | | |
Dividends | | | $10,524,978 | | | | | |
Interest | | | 73,239 | | | | | |
Dividends from underlying affiliated funds | | | 4,220 | | | | | |
Foreign taxes withheld | | | (183,958 | ) | | | | |
Total investment income | | | | | | | $10,418,479 | |
Expenses | | | | | | | | |
Management fee | | | $4,641,318 | | | | | |
Distribution and/or service fees | | | 622,763 | | | | | |
Shareholder servicing costs | | | 67,536 | | | | | |
Administrative services fee | | | 93,638 | | | | | |
Independent Trustees’ compensation | | | 15,584 | | | | | |
Custodian fee | | | 65,727 | | | | | |
Shareholder communications | | | 68,526 | | | | | |
Audit and tax fees | | | 52,630 | | | | | |
Legal fees | | | 5,375 | | | | | |
Miscellaneous | | | 21,209 | | | | | |
Total expenses | | | | | | | $5,654,306 | |
Reduction of expenses by investment adviser | | | (29,551 | ) | | | | |
Net expenses | | | | | | | $5,624,755 | |
Net investment income | | | | | | | $4,793,724 | |
Realized and unrealized gain (loss) on investments and foreign currency | | | | | | | | |
Realized gain (loss) (identified cost basis) | | | | | | | | |
Investments | | | $62,249,569 | | | | | |
Foreign currency | | | (1,087 | ) | | | | |
Net realized gain (loss) on investments and foreign currency | | | | | | | $62,248,482 | |
Change in unrealized appreciation (depreciation) | | | | | | | | |
Investments | | | $(5,856,824 | ) | | | | |
Translation of assets and liabilities in foreign currencies | | | 642 | | | | | |
Net unrealized gain (loss) on investments and foreign currency translation | | | | | | | $(5,856,182 | ) |
Net realized and unrealized gain (loss) on investments and foreign currency | | | | | | | $56,392,300 | |
Change in net assets from operations | | | | | | | $61,186,024 | |
See Notes to Financial Statements
10
MFS Investors Trust Series
FINANCIAL STATEMENTS | STATEMENTS OF CHANGES IN NET ASSETS
These statements describe the increases and/or decreases in net assets resulting from operations, any distributions, and any shareholder transactions.
| | | | | | | | |
For years ended 12/31 | | | 2014 | | | | 2013 | |
Change in net assets | | | | | | | | |
From operations | | | | | | | | |
Net investment income | | | $4,793,724 | | | | $5,380,383 | |
Net realized gain (loss) on investments and foreign currency | | | 62,248,482 | | | | 52,154,454 | |
Net unrealized gain (loss) on investments and foreign currency translation | | | (5,856,182 | ) | | | 117,146,735 | |
Change in net assets from operations | | | $61,186,024 | | | | $174,681,572 | |
Distributions declared to shareholders | | | | | | | | |
From net investment income | | | $(5,376,758 | ) | | | $(6,505,100 | ) |
From net realized gain on investments | | | (47,877,196 | ) | | | — | |
Total distributions declared to shareholders | | | $(53,253,954 | ) | | | $(6,505,100 | ) |
Change in net assets from fund share transactions | | | $(8,620,643 | ) | | | $(124,872,601 | ) |
Total change in net assets | | | $(688,573 | ) | | | $43,303,871 | |
Net assets | | | | | | | | |
At beginning of period | | | 640,405,027 | | | | 597,101,156 | |
At end of period (including undistributed net investment income of $4,792,600 and
$5,376,721, respectively) | | | $639,716,454 | | | | $640,405,027 | |
See Notes to Financial Statements
11
MFS Investors Trust Series
FINANCIAL STATEMENTS | FINANCIAL HIGHLIGHTS
The financial highlights table is intended to help you understand the fund’s financial performance for the past 5 years. Certain information reflects financial results for a single fund share. The total returns in the table represent the rate by which an investor would have earned (or lost) on an investment in the fund share class (assuming reinvestment of all distributions) held for the entire period.
| | | | | | | | | | | | | | | | | | | | |
| Initial Class | | Years ended 12/31 | |
| | | 2014 | | | 2013 | | | 2012 | | | 2011 | | | 2010 | |
Net asset value, beginning of period | | | $29.95 | | | | $22.93 | | | | $19.41 | | | | $20.04 | | | | $18.24 | |
| Income (loss) from investment operations | | | | | | | | | | | | | | | | | | | | |
Net investment income (d) | | | $0.26 | | | | $0.24 | | | | $0.25 | | | | $0.17 | | | | $0.16 | |
Net realized and unrealized gain (loss) on investments and foreign currency | | | 2.92 | | | | 7.07 | | | | 3.46 | | | | (0.61 | ) | | | 1.86 | |
Total from investment operations | | | $3.18 | | | | $7.31 | | | | $3.71 | | | | $(0.44 | ) | | | $2.02 | |
| Less distributions declared to shareholders | | | | | | | | | | | | | | | | | | | | |
From net investment income | | | $(0.30 | ) | | | $(0.29 | ) | | | $(0.19 | ) | | | $(0.19 | ) | | | $(0.22 | ) |
From net realized gain on investments | | | (2.42 | ) | | | — | | | | — | | | | — | | | | — | |
Total distributions declared to shareholders | | | $(2.72 | ) | | | $(0.29 | ) | | | $(0.19 | ) | | | $(0.19 | ) | | | $(0.22 | ) |
Net asset value, end of period (x) | | | $30.41 | | | | $29.95 | | | | $22.93 | | | | $19.41 | | | | $20.04 | |
Total return (%) (k)(r)(s)(x) | | | 11.01 | | | | 32.05 | | | | 19.18 | | | | (2.18 | ) | | | 11.10 | |
Ratios (%) (to average net assets)
and Supplemental data: | | | | | | | | | | | | | | | | | | | | |
Expenses before expense reductions (f) | | | 0.81 | | | | 0.81 | | | | 0.82 | | | | 0.82 | | | | 0.83 | |
Expenses after expense reductions (f) | | | 0.81 | | | | 0.81 | | | | 0.82 | | | | 0.82 | | | | 0.83 | |
Net investment income | | | 0.87 | | | | 0.93 | | | | 1.15 | | | | 0.84 | | | | 0.87 | |
Portfolio turnover | | | 25 | | | | 19 | | | | 28 | | | | 22 | | | | 22 | |
Net assets at end of period (000 omitted) | | | $356,389 | | | | $405,682 | | | | $455,295 | | | | $486,500 | | | | $603,279 | |
12
MFS Investors Trust Series
Financial Highlights – continued
| | | | | | | | | | | | | | | | | | | | |
| Service Class | | Years ended 12/31 | |
| | | 2014 | | | 2013 | | | 2012 | | | 2011 | | | 2010 | |
Net asset value, beginning of period | | | $29.72 | | | | $22.78 | | | | $19.31 | | | | $19.95 | | | | $18.16 | |
| Income (loss) from investment operations | | | | | | | | | | | | | | | | | | | | |
Net investment income (d) | | | $0.19 | | | | $0.18 | | | | $0.20 | | | | $0.12 | | | | $0.11 | |
Net realized and unrealized gain (loss) on investments and foreign currency | | | 2.88 | | | | 7.02 | | | | 3.43 | | | | (0.61 | ) | | | 1.86 | |
Total from investment operations | | | $3.07 | | | | $7.20 | | | | $3.63 | | | | $(0.49 | ) | | | $1.97 | |
| Less distributions declared to shareholders | | | | | | | | | | �� | | | | | | | | | | |
From net investment income | | | $(0.24 | ) | | | $(0.26 | ) | | | $(0.16 | ) | | | $(0.15 | ) | | | $(0.18 | ) |
From net realized gain on investments | | | (2.42 | ) | | | — | | | | — | | | | — | | | | — | |
Total distributions declared to shareholders | | | $(2.66 | ) | | | $(0.26 | ) | | | $(0.16 | ) | | | $(0.15 | ) | | | $(0.18 | ) |
Net asset value, end of period (x) | | | $30.13 | | | | $29.72 | | | | $22.78 | | | | $19.31 | | | | $19.95 | |
Total return (%) (k)(r)(s)(x) | | | 10.71 | | | | 31.74 | | | | 18.83 | | | | (2.42 | ) | | | 10.88 | |
Ratios (%) (to average net assets)
and Supplemental data: | | | | | | | | | | | | | | | | | | | | |
Expenses before expense reductions (f) | | | 1.06 | | | | 1.06 | | | | 1.07 | | | | 1.07 | | | | 1.08 | |
Expenses after expense reductions (f) | | | 1.06 | | | | 1.06 | | | | 1.07 | | | | 1.07 | | | | 1.08 | |
Net investment income | | | 0.63 | | | | 0.67 | | | | 0.93 | | | | 0.60 | | | | 0.63 | |
Portfolio turnover | | | 25 | | | | 19 | | | | 28 | | | | 22 | | | | 22 | |
Net assets at end of period (000 omitted) | | | $283,328 | | | | $234,723 | | | | $141,806 | | | | $78,392 | | | | $62,309 | |
| (d) | Per share data is based on average shares outstanding. |
| (f) | Ratios do not reflect reductions from fees paid indirectly, if applicable. |
| (k) | The total return does not reflect expenses that apply to separate accounts. Inclusion of these charges would reduce the total return figures for all periods shown. |
| (r) | Certain expenses have been reduced without which performance would have been lower. |
| (s) | From time to time the fund may receive proceeds from litigation settlements, without which performance would be lower. |
| (x) | The net asset values per share and total returns have been calculated on net assets which include adjustments made in accordance with U.S. generally accepted accounting principles required at period end for financial reporting purposes. |
See Notes to Financial Statements
13
MFS Investors Trust Series
NOTES TO FINANCIAL STATEMENTS
| (1) | | Business and Organization |
MFS Investors Trust Series (the fund) is a diversified series of MFS Variable Insurance Trust (the trust). The trust is organized as a Massachusetts business trust and is registered under the Investment Company Act of 1940, as amended, as an open-end management investment company. The shareholders of each series of the trust are separate accounts of insurance companies, which offer variable annuity and/or life insurance products, and qualified retirement and pension plans.
The fund is an investment company and accordingly follows the investment company accounting and reporting guidance of the Financial Accounting Standards Board (FASB) Accounting Standards Codification Topic 946 Financial Services – Investment Companies.
| (2) | | Significant Accounting Policies |
General – The preparation of financial statements in conformity with U.S. generally accepted accounting principles requires management to make estimates and assumptions that affect the reported amounts of assets and liabilities, and disclosure of contingent assets and liabilities at the date of the financial statements and the reported amounts of increases and decreases in net assets from operations during the reporting period. Actual results could differ from those estimates. In the preparation of these financial statements, management has evaluated subsequent events occurring after the date of the fund’s Statement of Assets and Liabilities through the date that the financial statements were issued.
In June 2014, FASB issued Accounting Standards Update 2014-11, Transfers and Servicing (Topic 860) – Repurchase-to-Maturity Transactions, Repurchase Financings, and Disclosures (“ASU 2014-11”). ASU 2014-11 changes the accounting for repurchase-to-maturity transactions (i.e., repurchase agreements that settle at the same time as the maturity of the transferred financial asset) and enhances the required disclosures for repurchase agreements and other similar transactions. Although still evaluating the potential impacts of ASU 2014-11 to the fund, management expects that the impact of the fund’s adoption will be limited to additional financial statement disclosures which would first be effective for interim reporting periods beginning after March 15, 2015.
Balance Sheet Offsetting – The fund’s accounting policy with respect to balance sheet offsetting is that, absent an event of default by the counterparty or a termination of the agreement, the International Swaps and Derivatives Association (ISDA) Master Agreement does not result in an offset of reported amounts of financial assets and financial liabilities in the Statement of Assets and Liabilities across transactions between the fund and the applicable counterparty. The fund’s right to setoff may be restricted or prohibited by the bankruptcy or insolvency laws of the particular jurisdiction to which a specific master netting agreement counterparty is subject. Balance sheet offsetting disclosures, to the extent applicable to the fund, have been included in the fund’s Significant Accounting Policies note under the captions for each of the fund’s in-scope financial instruments and transactions.
Investment Valuations – Equity securities, including restricted equity securities, are generally valued at the last sale or official closing price as provided by a third-party pricing service on the market or exchange on which they are primarily traded. Equity securities, for which there were no sales reported that day, are generally valued at the last quoted daily bid quotation as provided by a third-party pricing service on the market or exchange on which such securities are primarily traded. Short-term instruments with a maturity at issuance of 60 days or less may be valued at amortized cost, which approximates market value. Open-end investment companies are generally valued at net asset value per share. Securities and other assets generally valued on the basis of information from a third-party pricing service may also be valued at a broker/dealer bid quotation. Values obtained from third-party pricing services can utilize both transaction data and market information such as yield, quality, coupon rate, maturity, type of issue, trading characteristics, and other market data. The values of foreign securities and other assets and liabilities expressed in foreign currencies are converted to U.S. dollars using the mean of bid and asked prices for rates provided by a third-party pricing service.
The Board of Trustees has delegated primary responsibility for determining or causing to be determined the value of the fund’s investments (including any fair valuation) to the adviser pursuant to valuation policies and procedures approved by the Board. If the adviser determines that reliable market quotations are not readily available, investments are valued at fair value as determined in good faith by the adviser in accordance with such procedures under the oversight of the Board of Trustees. Under the fund’s valuation policies and procedures, market quotations are not considered to be readily available for most types of debt instruments and floating rate loans and many types of derivatives. These investments are generally valued at fair value based on information from third-party pricing services. In addition, investments may be valued at fair value if the adviser determines that an investment’s value has been materially affected by events occurring after the close of the exchange or market on which the investment is principally traded (such as foreign exchange or market) and prior to the determination of the fund’s net asset value, or after the halting of trading of a specific security where trading does not resume prior to the close of the exchange or market on which the security is principally traded. Events that occur on a frequent basis after foreign markets close (such as developments in foreign markets and significant movements in the U.S. markets) and prior to the determination of the fund’s net asset value may be deemed to have a material effect on the value of securities traded in foreign markets. Accordingly, the fund’s foreign equity securities may often be valued at fair value. The adviser generally relies on third-party pricing services or other information (such as the correlation with price
14
MFS Investors Trust Series
Notes to Financial Statements – continued
movements of similar securities in the same or other markets; the type, cost and investment characteristics of the security; the business and financial condition of the issuer; and trading and other market data) to assist in determining whether to fair value and at what value to fair value an investment. The value of an investment for purposes of calculating the fund’s net asset value can differ depending on the source and method used to determine value. When fair valuation is used, the value of an investment used to determine the fund’s net asset value may differ from quoted or published prices for the same investment. There can be no assurance that the fund could obtain the fair value assigned to an investment if it were to sell the investment at the same time at which the fund determines its net asset value per share.
Various inputs are used in determining the value of the fund’s assets or liabilities. These inputs are categorized into three broad levels. In certain cases, the inputs used to measure fair value may fall into different levels of the fair value hierarchy. In such cases, an investment’s level within the fair value hierarchy is based on the lowest level of input that is significant to the fair value measurement. The fund’s assessment of the significance of a particular input to the fair value measurement in its entirety requires judgment, and considers factors specific to the investment. Level 1 includes unadjusted quoted prices in active markets for identical assets or liabilities. Level 2 includes other significant observable market-based inputs (including quoted prices for similar securities, interest rates, prepayment speed, and credit risk). Level 3 includes unobservable inputs, which may include the adviser’s own assumptions in determining the fair value of investments. The following is a summary of the levels used as of December 31, 2014 in valuing the fund’s assets or liabilities:
| | | | | | | | | | | | | | | | |
| Investments at Value | | Level 1 | | | Level 2 | | | Level 3 | | | Total | |
| Equity Securities: | | | | | | | | | | | | | | | | |
United States | | | $584,830,687 | | | | $— | | | | $— | | | | $584,830,687 | |
France | | | 92,391 | | | | 17,945,426 | | | | — | | | | 18,037,817 | |
Canada | | | 18,032,495 | | | | — | | | | — | | | | 18,032,495 | |
Germany | | | 4,602,609 | | | | — | | | | — | | | | 4,602,609 | |
United Kingdom | | | — | | | | 4,446,008 | | | | — | | | | 4,446,008 | |
| Mutual Funds | | | 9,693,997 | | | | — | | | | — | | | | 9,693,997 | |
| Total Investments | | | $617,252,179 | | | | $22,391,434 | | | | $— | | | | $639,643,613 | |
For further information regarding security characteristics, see the Portfolio of Investments.
Of the level 2 investments presented above, equity investments amounting to $22,391,434 would have been considered level 1 investments at the beginning of the period. The primary reason for changes in the classifications between levels 1 and 2 occurs when foreign equity securities are fair valued using other observable market-based inputs in place of the closing exchange price due to events occurring after the close of the exchange or market on which the investment is principally traded. The fund’s foreign equity securities may often be valued at fair value. The fund’s policy is to recognize transfers between the levels as of the end of the period.
Foreign Currency Translation – Purchases and sales of foreign investments, income, and expenses are converted into U.S. dollars based upon currency exchange rates prevailing on the respective dates of such transactions or on the reporting date for foreign denominated receivables and payables. Gains and losses attributable to foreign currency exchange rates on sales of securities are recorded for financial statement purposes as net realized gains and losses on investments. Gains and losses attributable to foreign exchange rate movements on receivables, payables, income and expenses are recorded for financial statement purposes as foreign currency transaction gains and losses. That portion of both realized and unrealized gains and losses on investments that results from fluctuations in foreign currency exchange rates is not separately disclosed.
Security Loans – Under its Securities Lending Agency Agreement with the fund, State Street Bank and Trust Company (“State Street”), as lending agent, loans the securities of the fund to certain qualified institutions (the “Borrowers”) approved by the fund. The loans are collateralized by cash and/or U.S. Treasury and federal agency obligations in an amount typically at least equal to the market value of the securities loaned. On loans collateralized by cash, the cash collateral is invested in a money market fund. The market value of the loaned securities is determined at the close of business of the fund and any additional required collateral is delivered to the fund on the next business day. State Street provides the fund with indemnification against Borrower default. In the event of Borrower default, State Street will for the benefit of the fund either purchase securities identical to those loaned or, when such purchase is commercially impracticable, pay the fund the market value of the loaned securities. In return, State Street assumes the fund’s rights to the related collateral. If the collateral value is less than the cost to purchase identical securities, State Street is responsible for the shortfall, but only to the extent that such shortfall is not due to a decline in collateral value resulting from collateral reinvestment for which the fund bears the risk of loss. A portion of the income generated upon investment of the collateral is remitted to the Borrowers, and the remainder is allocated between the fund and the lending agent. On loans collateralized by U.S. Treasury and/or federal agency obligations, a fee is received from the Borrower, and is allocated between the fund and the lending agent. Income from securities lending is included in “Interest” income, in the Statement of Operations. The dividend and interest income earned on the securities loaned is accounted for in the same manner as other dividend and interest income. At December 31, 2014, there were no securities on loan or collateral outstanding.
15
MFS Investors Trust Series
Notes to Financial Statements – continued
Indemnifications – Under the fund’s organizational documents, its officers and Trustees may be indemnified against certain liabilities and expenses arising out of the performance of their duties to the fund. Additionally, in the normal course of business, the fund enters into agreements with service providers that may contain indemnification clauses. The fund’s maximum exposure under these agreements is unknown as this would involve future claims that may be made against the fund that have not yet occurred.
Investment Transactions and Income – Investment transactions are recorded on the trade date. Interest income is recorded on the accrual basis. Dividends received in cash are recorded on the ex-dividend date. Certain dividends from foreign securities will be recorded when the fund is informed of the dividend if such information is obtained subsequent to the ex-dividend date. Dividend payments received in additional securities are recorded on the ex-dividend date in an amount equal to the value of the security on such date.
The fund may receive proceeds from litigation settlements. Any proceeds received from litigation involving portfolio holdings are reflected in the Statement of Operations in realized gain/loss if the security has been disposed of by the fund or in unrealized gain/loss if the security is still held by the fund. Any other proceeds from litigation not related to portfolio holdings are reflected as other income in the Statement of Operations.
Fees Paid Indirectly – The fund’s custody fee may be reduced according to an arrangement that measures the value of cash deposited with the custodian by the fund. For the year ended December 31, 2014, custody fees were not reduced.
Tax Matters and Distributions – The fund intends to qualify as a regulated investment company, as defined under Subchapter M of the Internal Revenue Code, and to distribute all of its taxable income, including realized capital gains. As a result, no provision for federal income tax is required. The fund’s federal tax returns, when filed, will remain subject to examination by the Internal Revenue Service for a three year period. Management has analyzed the fund’s tax positions taken on federal and state tax returns for all open tax years and does not believe that there are any uncertain tax positions that require recognition of a tax liability. Foreign taxes, if any, have been accrued by the fund in the accompanying financial statements in accordance with the applicable foreign tax law. Foreign income taxes may be withheld by certain countries in which the fund invests. Additionally, capital gains realized by the fund on securities issued in or by certain foreign countries may be subject to capital gains tax imposed by those countries.
Distributions to shareholders are recorded on the ex-dividend date. Income and capital gain distributions are determined in accordance with income tax regulations, which may differ from U.S. generally accepted accounting principles. Certain capital accounts in the financial statements are periodically adjusted for permanent differences in order to reflect their tax character. These adjustments have no impact on net assets or net asset value per share. Temporary differences which arise from recognizing certain items of income, expense, gain or loss in different periods for financial statement and tax purposes will reverse at some time in the future. Distributions in excess of net investment income or net realized gains are temporary overdistributions for financial statement purposes resulting from differences in the recognition or classification of income or distributions for financial statement and tax purposes.
Book/tax differences primarily relate to wash sale loss deferrals.
The tax character of distributions declared to shareholders for the last two fiscal years is as follows:
| | | | | | | | |
| | | 12/31/14 | | | 12/31/13 | |
| Ordinary income (including any short-term capital gains) | | | $10,197,233 | | | | $6,505,100 | |
| Long-term capital gains | | | 43,056,721 | | | | — | |
| Total distributions | | | $53,253,954 | | | | $6,505,100 | |
The federal tax cost and the tax basis components of distributable earnings were as follows:
| | | | |
| As of 12/31/14 | | | | |
| Cost of investments | | | $427,979,520 | |
| Gross appreciation | | | 215,886,323 | |
| Gross depreciation | | | (4,222,230 | ) |
| Net unrealized appreciation (depreciation) | | | $211,664,093 | |
| Undistributed ordinary income | | | 10,174,203 | |
| Undistributed long-term capital gain | | | 57,578,462 | |
| Other temporary differences | | | 1,041 | |
16
MFS Investors Trust Series
Notes to Financial Statements – continued
Multiple Classes of Shares of Beneficial Interest – The fund offers multiple classes of shares, which differ in their respective distribution and/or service fees. The fund’s income, realized and unrealized gain (loss), and common expenses are allocated to shareholders based on the daily net assets of each class. Dividends are declared separately for each class. Differences in per share dividend rates are generally due to differences in separate class expenses. The fund’s distributions declared to shareholders as reported in the Statements of Changes in Net Assets are presented by class as follows:
| | | | | | | | | | | | | | | | |
| | | From net investment
income | | | From net realized gain on
investments | |
| | | Year ended
12/31/14 | | | Year ended
12/31/13 | | | Year ended
12/31/14 | | | Year ended
12/31/13 | |
| Initial Class | | | $3,396,452 | | | | $4,558,137 | | | | $27,760,205 | | | | $— | |
| Service Class | | | 1,980,306 | | | | 1,946,963 | | | | 20,116,991 | | | | — | |
| Total | | | $5,376,758 | | | | $6,505,100 | | | | $47,877,196 | | | | $— | |
| (3) | | Transactions with Affiliates |
Investment Adviser – The fund has an investment advisory agreement with MFS to provide overall investment management and related administrative services and facilities to the fund. The management fee is computed daily and paid monthly at the following annual rates:
| | | | |
| First $1 billion of average daily net assets | | | 0.75% | |
| Average daily net assets in excess of $1 billion | | | 0.65% | |
The investment adviser has agreed in writing to reduce its management fee to 0.60% of the average daily net assets in excess of $2.5 billion. This written agreement will continue until modified by the fund’s Board of Trustees, but such agreement will continue at least until April 30, 2016. For the year ended December 31, 2014, the fund’s average daily net assets did not exceed $2.5 billion and therefore, the management fee was not reduced in accordance with this agreement. MFS has also agreed in writing to reduce its management fee by a specified amount if certain MFS mutual fund assets exceed thresholds agreed to by MFS and the fund’s Board of Trustees. For the year ended December 31, 2014, this management fee reduction amounted to $28,473 which is included in the reduction of total expenses in the Statement of Operations. The management fee incurred for the year ended December 31, 2014 was equivalent to an annual effective rate of 0.75% of the fund’s average daily net assets.
Distributor – MFS Fund Distributors, Inc. (MFD), a wholly-owned subsidiary of MFS, is the distributor of shares of the fund. The Trustees have adopted a distribution plan for the Service Class shares pursuant to Rule 12b-1 under the Investment Company Act of 1940.
The fund’s distribution plan provides that the fund will pay MFD distribution and/or service fees equal to 0.25% per annum of its average daily net assets attributable to Service Class shares as partial consideration for services performed and expenses incurred by MFD and financial intermediaries (including participating insurance companies that invest in the fund to fund variable annuity and variable life insurance contracts, sponsors of qualified retirement and pension plans that invest in the fund, and affiliates of these participating insurance companies and plan sponsors) in connection with the sale and distribution of the Service Class shares. MFD may subsequently pay all, or a portion, of the distribution and/or service fees to financial intermediaries.
Shareholder Servicing Agent – MFS Service Center, Inc. (MFSC), a wholly-owned subsidiary of MFS, receives a fee from the fund for its services as shareholder servicing agent. For the year ended December 31, 2014, the fee was $66,169, which equated to 0.0107% annually of the fund’s average daily net assets. MFSC also receives payment from the fund for out-of-pocket expenses paid by MFSC on behalf of the fund. For the year ended December 31, 2014, these costs amounted to $1,367.
Administrator – MFS provides certain financial, legal, shareholder communications, compliance, and other administrative services to the fund. Under an administrative services agreement, the fund partially reimburses MFS the costs incurred to provide these services. The fund is charged an annual fixed amount of $17,500 plus a fee based on average daily net assets. The administrative services fee incurred for the year ended December 31, 2014 was equivalent to an annual effective rate of 0.0151% of the fund’s average daily net assets.
Trustees’ and Officers’ Compensation – The fund pays compensation to independent Trustees in the form of a retainer, attendance fees, and additional compensation to Board and Committee chairpersons. The fund does not pay compensation directly to Trustees or officers of the fund who are also officers of the investment adviser, all of whom receive remuneration for their services to the fund from MFS. Certain officers and Trustees of the fund are officers or directors of MFS, MFD, and MFSC.
Other – Effective November 1, 2014, this fund and certain other funds managed by MFS (the funds) have entered into a service agreement (the ISO Agreement) which provides for payment of fees solely by the funds to Tarantino LLC in return for the provision of services of an Independent Senior Officer (ISO) for the funds. Frank L. Tarantino serves as the ISO and is an officer of the funds and the sole member of Tarantino LLC. The funds can terminate the ISO Agreement with Tarantino LLC at any time under the terms of the ISO Agreement. Prior to November 1, 2014, the funds had entered into services agreements (the Compliance Officer
17
MFS Investors Trust Series
Notes to Financial Statements – continued
Agreements) which provided for payment of fees by the funds to Tarantino LLC and Griffin Compliance LLC in return for the provision of services of an Independent Chief Compliance Officer (ICCO) and Assistant ICCO, respectively, for the funds. Prior to November 1, 2014, Frank L. Tarantino served as the ICCO. Effective October 31, 2014, Mr. Tarantino resigned as ICCO and the Compliance Officer Agreement between the funds and Tarantino LLC was terminated. Prior to June 1, 2014, Robyn L. Griffin served as the Assistant ICCO and was an officer of the funds. Ms. Griffin is the sole member of Griffin Compliance LLC. Effective May 31, 2014, Ms. Griffin resigned as Assistant ICCO and the Compliance Officer Agreement between the funds and Griffin Compliance LLC was terminated. For the year ended December 31, 2014, the aggregate fees paid by the fund under these agreements were $2,576 and are included in “Miscellaneous” expense in the Statement of Operations. MFS had agreed to reimburse the fund for a portion of the payments made by the fund for the services under the Compliance Officer Agreements in the amount of $1,078, which is included in the reduction of total expenses in the Statement of Operations. Additionally, MFS has agreed to bear all expenses associated with office space, other administrative support, and supplies provided to the ICCO, Assistant ICCO, and ISO.
The fund invests in the MFS Institutional Money Market Portfolio which is managed by MFS and seeks current income consistent with preservation of capital and liquidity. Income earned on this investment is included in “Dividends from underlying affiliated funds” in the Statement of Operations. This money market fund does not pay a management fee to MFS.
For the year ended December 31, 2014, purchases and sales of investments, other than short-term obligations, aggregated $151,586,989 and $214,699,209, respectively.
| (5) | | Shares of Beneficial Interest |
The fund’s Declaration of Trust permits the Trustees to issue an unlimited number of full and fractional shares of beneficial interest. Transactions in fund shares were as follows:
| | | | | | | | | | | | | | | | |
| | | Year ended 12/31/14 | | | Year ended 12/31/13 | |
| | | Shares | | | Amount | | | Shares | | | Amount | |
| Shares sold | | | | | | | | | | | | | | | | |
Initial Class | | | 216,623 | | | | $6,487,891 | | | | 527,522 | | | | $13,502,090 | |
Service Class | | | 3,399,102 | | | | 100,586,085 | | | | 2,975,204 | | | | 77,017,940 | |
| | | 3,615,725 | | | | $107,073,976 | | | | 3,502,726 | | | | $90,520,030 | |
| Shares issued to shareholders in reinvestment of distributions | | | | | | | | | | | | | | | | |
Initial Class | | | 1,070,308 | | | | $31,156,657 | | | | 171,423 | | | | $4,558,137 | |
Service Class | | | 765,407 | | | | 22,097,297 | | | | 73,748 | | | | 1,946,963 | |
| | | 1,835,715 | | | | $53,253,954 | | | | 245,171 | | | | $6,505,100 | |
| Shares reacquired | | | | | | | | | | | | | | | | |
Initial Class | | | (3,114,178 | ) | | | $(93,629,876 | ) | | | (7,012,013 | ) | | | $(185,471,471 | ) |
Service Class | | | (2,661,329 | ) | | | (75,318,697 | ) | | | (1,376,108 | ) | | | (36,426,260 | ) |
| | | (5,775,507 | ) | | | $(168,948,573 | ) | | | (8,388,121 | ) | | | $(221,897,731 | ) |
| Net change | | | | | | | | | | | | | | | | |
Initial Class | | | (1,827,247 | ) | | | $(55,985,328 | ) | | | (6,313,068 | ) | | | $(167,411,244 | ) |
Service Class | | | 1,503,180 | | | | 47,364,685 | | | | 1,672,844 | | | | 42,538,643 | |
| | | (324,067 | ) | | | $(8,620,643 | ) | | | (4,640,224 | ) | | | $(124,872,601 | ) |
The fund and certain other funds managed by MFS participate in a $1.1 billion unsecured committed line of credit, subject to a $1 billion sublimit, provided by a syndication of banks under a credit agreement. Borrowings may be made for temporary financing needs. Interest is charged to each fund, based on its borrowings, generally at a rate equal to the higher of the Federal Reserve funds rate or one month LIBOR plus an agreed upon spread. A commitment fee, based on the average daily, unused portion of the committed line of credit, is allocated among the participating funds at the end of each calendar quarter. In addition, the fund and other funds managed by MFS have established unsecured uncommitted borrowing arrangements with certain banks for temporary financing needs. Interest is charged to each fund, based on its borrowings, at a rate equal to the Federal Reserve funds rate plus an agreed upon spread. For the year ended December 31, 2014, the fund’s commitment fee and interest expense were $2,242 and $0, respectively, and are included in “Miscellaneous” expense in the Statement of Operations.
18
MFS Investors Trust Series
Notes to Financial Statements – continued
| (7) | | Transactions in Underlying Affiliated Funds – Affiliated Issuers |
An affiliated issuer may be considered one in which the fund owns 5% or more of the outstanding voting securities, or a company which is under common control. For the purposes of this report, the fund assumes the following to be an affiliated issuer:
| | | | | | | | | | | | | | | | |
| Underlying Affiliated Fund | | Beginning
Shares/Par
Amount | | | Acquisitions
Shares/ Par
Amount | | | Dispositions
Shares/Par
Amount | | | Ending
Shares/Par
Amount | |
| MFS Institutional Money Market Portfolio | | | 4,298,195 | | | | 106,749,634 | | | | (101,353,832 | ) | | | 9,693,997 | |
| | | | |
| Underlying Affiliated Fund | | Realized Gain (Loss) | | | Capital Gain Distributions | | | Dividend Income | | | Ending Value | |
| MFS Institutional Money Market Portfolio | | | $— | | | | $— | | | | $4,220 | | | | $9,693,997 | |
19
MFS Investors Trust Series
REPORT OF INDEPENDENT REGISTERED PUBLIC ACCOUNTING FIRM
To the Board of Trustees of MFS Variable Insurance Trust and the Shareholders of
MFS Investors Trust Series:
We have audited the accompanying statement of assets and liabilities, including the portfolio of investments, of MFS Investors Trust Series (one of the series of MFS Variable Insurance Trust) (the “Fund”) as of December 31, 2014, and the related statement of operations for the year then ended, the statements of changes in net assets for each of the two years in the period then ended, and the financial highlights for each of the five years in the period then ended. These financial statements and financial highlights are the responsibility of the Fund’s management. Our responsibility is to express an opinion on these financial statements and financial highlights based on our audits.
We conducted our audits in accordance with the standards of the Public Company Accounting Oversight Board (United States). Those standards require that we plan and perform the audit to obtain reasonable assurance about whether the financial statements and financial highlights are free of material misstatement. The Fund is not required to have, nor were we engaged to perform, an audit of its internal control over financial reporting. Our audits included consideration of internal control over financial reporting as a basis for designing audit procedures that are appropriate in the circumstances, but not for the purpose of expressing an opinion on the effectiveness of the Fund’s internal control over financial reporting. Accordingly, we express no such opinion. An audit also includes examining, on a test basis, evidence supporting the amounts and disclosures in the financial statements, assessing the accounting principles used and significant estimates made by management, as well as evaluating the overall financial statement presentation. Our procedures included confirmation of securities owned as of December 31, 2014, by correspondence with the custodian and brokers; where replies were not received from brokers, we performed other auditing procedures. We believe that our audits provide a reasonable basis for our opinion.
In our opinion, the financial statements and financial highlights referred to above present fairly, in all material respects, the financial position of MFS Investors Trust Series as of December 31, 2014, the results of its operations for the year then ended, the changes in its net assets for each of the two years in the period then ended, and the financial highlights for each of the five years in the period then ended, in conformity with accounting principles generally accepted in the United States of America.
DELOITTE & TOUCHE LLP
Boston, Massachusetts
February 13, 2015
20
MFS Investors Trust Series
TRUSTEES AND OFFICERS – IDENTIFICATION AND BACKGROUND
The Trustees and Officers of the Trust, as of February 1, 2015, are listed below, together with their principal occupations during the past five years. (Their titles may have varied during that period.) The address of each Trustee and Officer is 111 Huntington Avenue, Boston, Massachusetts 02199-7618.
| | | | | | | | |
Name, Age | | Position(s)
Held with Fund | | Trustee/Officer
Since (h) | | Principal Occupations
During the Past Five Years | | Other Directorships (j) |
| INTERESTED TRUSTEES |
Robert J. Manning (k) (age 51) | | Trustee | | February 2004 | | Massachusetts Financial Services Company, Chairman, Co-Chief Executive Officer and Director; President (until 2009); Chief Investment Officer (until 2010) | | N/A |
| | | | |
Robin A. Stelmach (k) (age 53) | | Trustee and President | | January 2014 | | Massachusetts Financial Services Company, Executive Vice President and Chief Operating Officer | | N/A |
| | | |
| INDEPENDENT TRUSTEES | | | | | | |
David H. Gunning (age 72) | | Trustee and Chair of Trustees | | January 2004 | | Private investor | | Lincoln Electric Holdings, Inc. (welding equipment manufacturer), Director; Development Alternatives, Inc. (consulting), Director/Non-Executive Chairman |
| | | | |
Steven E. Buller (age 63) | | Trustee | | February 2014 | | Chairman, Financial Accounting Standards Advisory Council; Standing Advisory Group, Public Company Accounting Oversight Board, Member (until 2014); BlackRock, Inc. (investment management), Managing Director (until 2014), BlackRock Finco UK (investment management), Director (until 2014) | | N/A |
| | | | |
Robert E. Butler (age 73) | | Trustee | | January 2006 | | Consultant – investment company industry regulatory and compliance matters | | N/A |
| | | | |
Maureen R. Goldfarb (age 59) | | Trustee | | January 2009 | | Private investor | | N/A |
| | | | |
William R. Gutow (age 73) | | Trustee | | December 1993 | | Private investor and real estate consultant; Capitol Entertainment Management Company (video franchise), Vice Chairman | | Texas Donuts (donut franchise), Vice Chairman (until 2010) |
| | | | |
Michael Hegarty (age 70) | | Trustee | | December 2004 | | Private investor | | Brookfield Office Properties, Inc. (real estate), Director; Rouse Properties Inc. (real estate), Director; Capmark Financial Group Inc. (real estate), Director |
| | | | |
John P. Kavanaugh (age 60) | | Trustee | | January 2009 | | Private investor | | N/A |
| | | | |
Maryanne L. Roepke (age 58) | | Trustee | | May 2014 | | American Century Investments (investment management), Senior Vice President and Chief Compliance Officer (until 2014) | | N/A |
| | | | |
Laurie J. Thomsen (age 57) | | Trustee | | March 2005 | | Private investor; New Profit, Inc. (venture philanthropy), Executive Partner (until 2010) | | The Travelers Companies (insurance), Director |
| | | | |
Robert W. Uek (age 73) | | Trustee | | January 2006 | | Consultant to investment company industry | | N/A |
| | | | |
| OFFICERS | | | | | | | | |
Christopher R. Bohane (k) (age 41) | | Assistant Secretary and Assistant Clerk | | July 2005 | | Massachusetts Financial Services Company, Vice President and Assistant General Counsel | | N/A |
| | | | |
Kino Clark (k) (age 46) | | Assistant Treasurer | | January 2012 | | Massachusetts Financial Services Company, Vice President | | N/A |
| | | | |
Thomas H. Connors (k) (age 55) | | Assistant Secretary and Assistant Clerk | | September 2012 | | Massachusetts Financial Services Company, Vice President and Senior Counsel; Deutsche Investment Management Americas Inc. (financial service provider), Director and Senior Counsel (until 2012) | | N/A |
21
MFS Investors Trust Series
Trustees and Officers – continued
| | | | | | | | |
Name, Age | | Position(s)
Held with Fund | | Trustee/Officer
Since (h) | | Principal Occupations
During the Past Five Years | | Other Directorships (j) |
Ethan D. Corey (k) (age 51) | | Assistant
Secretary and Assistant Clerk | | July 2005 | | Massachusetts Financial Services Company, Senior Vice President and Associate General Counsel | | N/A |
| | | | |
David L. DiLorenzo (k) (age 46) | | Treasurer | | July 2005 | | Massachusetts Financial Services Company, Senior Vice President | | N/A |
| | | | |
Timothy M. Fagan (k) (age 46) | | Chief Compliance Officer | | November 2014 | | Massachusetts Financial Services Company, Chief Compliance Officer; Vice President and Senior Counsel (until 2012) | | N/A |
| | | | |
Brian E. Langenfeld (k) (age 41) | | Assistant
Secretary and Assistant Clerk | | June 2006 | | Massachusetts Financial Services Company, Vice President and Senior Counsel | | N/A |
| | | | |
Susan S. Newton (k) (age 64) | | Assistant
Secretary and Assistant Clerk | | May 2005 | | Massachusetts Financial Services Company, Senior Vice President and Associate General Counsel | | N/A |
| | | | |
Susan A. Pereira (k) (age 44) | | Assistant
Secretary and Assistant Clerk | | July 2005 | | Massachusetts Financial Services Company, Vice President and Senior Counsel | | N/A |
| | | | |
Kasey L. Phillips (k) (age 44) | | Assistant Treasurer | | September 2012 | | Massachusetts Financial Services Company, Vice President; Wells Fargo Funds Management, LLC, Senior Vice President, Fund Treasurer (until 2012) | | N/A |
| | | | |
Mark N. Polebaum (k) (age 62) | | Secretary and
Clerk | | January 2006 | | Massachusetts Financial Services Company, Executive Vice President, General Counsel and Secretary | | N/A |
| | | | |
Matthew A. Stowe (k) (age 40) | | Assistant Secretary and Assistant Clerk | | October 2014 | | Massachusetts Financial Services Company, Vice President and Senior Counsel | | N/A |
| | | | |
Frank L. Tarantino (age 70) | | Independent
Senior Officer | | June 2004 | | Tarantino LLC (provider of compliance services), Principal | | N/A |
| | | | |
Richard S. Weitzel (k) (age 44) | | Assistant Secretary and Assistant Clerk | | October 2007 | | Massachusetts Financial Services Company, Senior Vice President and Associate General Counsel | | N/A |
| | | | |
James O. Yost (k) (age 54) | | Deputy Treasurer | | September 1990 | | Massachusetts Financial Services Company, Senior Vice President | | N/A |
| (h) | Date first appointed to serve as Trustee/officer of an MFS Fund. Each Trustee has served continuously since appointment unless indicated otherwise. For the period from December 15, 2004 until February 22, 2005, Mr. Manning served as Advisory Trustee. Prior to January 2012, Messrs. DiLorenzo and Yost served as Assistant Treasurers of the Funds. Ms. Stelmach was appointed as President of the Funds as of October 1, 2014. |
| (j) | Directorships or trusteeships of companies required to report to the Securities and Exchange Commission (i.e., “public companies”). |
| (k) | “Interested person” of the Trust within the meaning of the Investment Company Act of 1940 (referred to as the 1940 Act), which is the principal federal law governing investment companies like the fund, as a result of a position with MFS. The address of MFS is 111 Huntington Avenue, Boston, Massachusetts 02199-7618. |
Each Trustee (except Ms. Stelmach, Mr. Buller and Ms. Roepke) has been elected by shareholders and each Trustee and officer holds office until his or her successor is chosen and qualified or until his or her earlier death, resignation, retirement or removal. The Trust does not hold annual meetings for the purpose of electing Trustees, and Trustees are not elected for fixed terms. Messrs. Butler, Kavanaugh, Uek and Mses. Thomsen and Roepke are members of the Trust’s Audit Committee.
Each of the Fund’s Trustees and officers holds comparable positions with certain other funds of which MFS or a subsidiary is the investment adviser or distributor, and, in the case of the officers, with certain affiliates of MFS. As of February 1, 2015, the Trustees served as board members of 135 funds within the MFS Family of Funds.
22
MFS Investors Trust Series
Trustees and Officers – continued
The Statement of Additional Information for the Fund includes further information about the Trustees and is available without charge upon request by calling 1-800-225-2606.
| | |
Investment Adviser Massachusetts Financial Services Company 111 Huntington Avenue Boston, MA 02199-7618 | | Custodian State Street Bank and Trust Company 1 Lincoln Street Boston, MA 02111-2900 |
Distributor MFS Fund Distributors, Inc. 111 Huntington Avenue Boston, MA 02199-7618 | | Independent Registered Public Accounting Firm Deloitte & Touche LLP 200 Berkeley Street Boston, MA 02116 |
Portfolio Managers T. Kevin Beatty Ted Maloney | | |
23
MFS Investors Trust Series
BOARD REVIEW OF INVESTMENT ADVISORY AGREEMENT
The Investment Company Act of 1940 requires that both the full Board of Trustees and a majority of the non-interested (“independent”) Trustees, voting separately, annually approve the continuation of the Fund’s investment advisory agreement with MFS. The Trustees consider matters bearing on the Fund and its advisory arrangements at their meetings throughout the year, including a review of performance data at each regular meeting. In addition, the independent Trustees met several times over the course of three months beginning in May and ending in July, 2014 (“contract review meetings”) for the specific purpose of considering whether to approve the continuation of the investment advisory agreement for the Fund and the other investment companies that the Board oversees (the “MFS Funds”). The independent Trustees were assisted in their evaluation of the Fund’s investment advisory agreement by independent legal counsel, from whom they received separate legal advice and with whom they met separately from MFS during various contract review meetings. The independent Trustees were also assisted in this process by the MFS Funds’ Independent Chief Compliance Officer, a full-time senior officer appointed by and reporting to the independent Trustees.
In connection with their deliberations regarding the continuation of the investment advisory agreement, the Trustees, including the independent Trustees, considered such information and factors as they believed, in light of the legal advice furnished to them and their own business judgment, to be relevant. The investment advisory agreement for the Fund was considered separately, although the Trustees also took into account the common interests of all MFS Funds in their review. As described below, the Trustees considered the nature, quality, and extent of the various investment advisory, administrative, and shareholder services performed by MFS under the existing investment advisory agreement and other arrangements with the Fund.
In connection with their contract review meetings, the Trustees received and relied upon materials that included, among other items: (i) information provided by Lipper Inc., an independent third party, on the investment performance of the Fund for various time periods ended December 31, 2013 and the investment performance of a group of funds with substantially similar investment classifications/objectives (the “Lipper performance universe”), (ii) information provided by Lipper Inc. on the Fund’s advisory fees and other expenses and the advisory fees and other expenses of comparable funds identified by Lipper Inc. (the “Lipper expense group”), (iii) information provided by MFS on the advisory fees of comparable portfolios of other clients of MFS, including institutional separate accounts and other clients, (iv) information as to whether and to what extent applicable expense waivers, reimbursements or fee “breakpoints” are observed for the Fund, (v) information regarding MFS’ financial results and financial condition, including MFS’ and certain of its affiliates’ estimated profitability from services performed for the Fund and the MFS Funds as a whole, and compared to MFS’ institutional business, (vi) MFS’ views regarding the outlook for the mutual fund industry and the strategic business plans of MFS, (vii) descriptions of various functions performed by MFS for the Funds, such as compliance monitoring and portfolio trading practices, and (viii) information regarding the overall organization of MFS, including information about MFS’ senior management and other personnel providing investment advisory, administrative and other services to the Fund and the other MFS Funds. The comparative performance, fee and expense information prepared and provided by Lipper Inc. was not independently verified and the independent Trustees did not independently verify any information provided to them by MFS.
The Trustees’ conclusion as to the continuation of the investment advisory agreement was based on a comprehensive consideration of all information provided to the Trustees and not the result of any single factor. Some of the factors that figured particularly in the Trustees’ deliberations are described below, although individual Trustees may have evaluated the information presented differently from one another, giving different weights to various factors. It is also important to recognize that the fee arrangements for the Fund and other MFS Funds are the result of years of review and discussion between the independent Trustees and MFS, that certain aspects of such arrangements may receive greater scrutiny in some years than in others, and that the Trustees’ conclusions may be based, in part, on their consideration of these same arrangements during the course of the year and in prior years.
Based on information provided by Lipper Inc. and MFS, the Trustees reviewed the Fund’s total return investment performance as well as the performance of peer groups of funds over various time periods. The Trustees placed particular emphasis on the total return performance of the Fund’s Initial Class shares in comparison to the performance of funds in its Lipper performance universe over the three-year period ended December 31, 2013, which the Trustees believed was a long enough period to reflect differing market conditions. The total return performance of the Fund’s Initial Class shares was in the 2nd quintile relative to the other funds in the universe for this three-year period (the 1st quintile being the best performers and the 5th quintile being the worst performers). The total return performance of the Fund’s Initial Class shares was in the 3rd quintile for each of the one- and five-year periods ended December 31, 2013 relative to the Lipper performance universe. Because of the passage of time, these performance results may differ from the performance results for more recent periods, including those shown elsewhere in this report.
In the course of their deliberations, the Trustees took into account information provided by MFS in connection with the contract review meetings, as well as during investment review meetings conducted with portfolio management personnel during the course of the year regarding the Fund’s performance. After reviewing these and related factors, the Trustees concluded, within the context of their overall conclusions regarding the investment advisory agreement, that they were satisfied with MFS’ responses and efforts relating to investment performance.
24
MFS Investors Trust Series
Board Review of Investment Advisory Agreement – continued
In assessing the reasonableness of the Fund’s advisory fee, the Trustees considered, among other information, the Fund’s advisory fee and the total expense ratio of the Fund’s Initial Class shares as a percentage of average daily net assets and the advisory fee and total expense ratios of peer groups of funds based on information provided by Lipper Inc. The Trustees considered that, according to the Lipper data (which takes into account any fee reductions or expense limitations that were in effect during the Fund’s last fiscal year), the Fund’s effective advisory fee rate and total expense ratio were each higher than the Lipper expense group median.
The Trustees also considered the advisory fees charged by MFS to any comparable institutional accounts. In comparing these fees, the Trustees considered information provided by MFS as to the generally broader scope of services provided by MFS to the Fund in comparison to institutional accounts, the higher demands placed on MFS’ investment personnel and trading infrastructure as a result of the daily cash in-flows and out-flows of the Fund, and the impact on MFS and expenses associated with the more extensive regulatory regime to which the Fund is subject in comparison to institutional accounts.
The Trustees also considered whether the Fund may benefit from any economies of scale in the management of the Fund in the event of growth in assets of the Fund and/or growth in assets of the MFS Funds as a whole. They noted that the Fund’s advisory fee rate schedule is subject to a contractual breakpoint that reduces the Fund’s advisory fee rate on average daily net assets over $1 billion, and that MFS has agreed in writing to further reduce its advisory fee rate on the Fund’s average daily net assets over $2.5 billion, which may not be changed without the Trustees’ approval. The Trustees also noted that MFS has agreed in writing to waive a portion of the management fees of certain MFS Funds, including the Fund, if the total combined assets of certain funds within the MFS Funds’ complex increase above agreed upon thresholds (the “group fee waiver”), enabling the Fund’s shareholders to share in the benefits from any economies of scale at the complex level. The group fee waiver is reviewed and renewed annually between the Board and MFS. The Trustees concluded that the breakpoints and the group fee waiver were sufficient to allow the Fund to benefit from economies of scale as its assets and overall complex assets grow.
The Trustees also considered information prepared by MFS relating to MFS’ costs and profits with respect to the Fund, the MFS Funds considered as a group, and other investment companies and accounts advised by MFS, as well as MFS’ methodologies used to determine and allocate its costs to the MFS Funds, the Fund and other accounts and products for purposes of estimating profitability.
After reviewing these and other factors described herein, the Trustees concluded, within the context of their overall conclusions regarding the investment advisory agreement, that the advisory fees charged to the Fund represent reasonable compensation in light of the services being provided by MFS to the Fund.
In addition, the Trustees considered MFS’ resources and related efforts to continue to retain, attract and motivate capable personnel to serve the Fund. The Trustees also considered current and developing conditions in the financial services industry, including the presence of large and well-capitalized companies which are spending, and appear to be prepared to continue to spend, substantial sums to engage personnel and to provide services to competing investment companies. In this regard, the Trustees also considered the financial resources of MFS and its ultimate parent, Sun Life Financial Inc. The Trustees also considered the advantages and possible disadvantages to the Fund of having an adviser that also serves other investment companies as well as other accounts.
The Trustees also considered the nature, quality, cost, and extent of administrative, transfer agency, and distribution services provided to the Fund by MFS and its affiliates under agreements and plans other than the investment advisory agreement, including any 12b-1 fees the Fund pays to MFS Fund Distributors, Inc., an affiliate of MFS. The Trustees also considered the nature, extent and quality of certain other services MFS performs or arranges for on the Fund’s behalf, which may include securities lending programs, directed expense payment programs, class action recovery programs, and MFS’ interaction with third-party service providers, principally custodians and sub-custodians. The Trustees concluded that the various non-advisory services provided by MFS and its affiliates on behalf of the Fund were satisfactory.
The Trustees also considered benefits to MFS from the use of the Fund’s portfolio brokerage commissions, if applicable, to pay for investment research and various other factors. Additionally, the Trustees considered so-called “fall-out benefits” to MFS such as reputational value derived from serving as investment manager to the Fund.
Based on their evaluation of factors that they deemed to be material, including those factors described above, the Board of Trustees, including the independent Trustees, concluded that the Fund’s investment advisory agreement with MFS should be continued for an additional one-year period, commencing August 1, 2014.
25
MFS Investors Trust Series
PROXY VOTING POLICIES AND INFORMATION
MFS votes proxies on behalf of the fund pursuant to proxy voting policies and procedures that are available without charge, upon request, by calling 1-800-225-2606, by visiting the Proxy Voting section of mfs.com or by visiting the SEC’s Web site at http://www.sec.gov.
Information regarding how the fund voted proxies relating to portfolio securities during the most recent twelve-month period ended June 30 is available without charge by visiting the Proxy Voting section of mfs.com or by visiting the SEC’s Web site at http://www.sec.gov.
QUARTERLY PORTFOLIO DISCLOSURE
The fund will file a complete schedule of portfolio holdings with the Securities and Exchange Commission (the Commission) for the first and third quarters of each fiscal year on Form N-Q. The fund’s Form N-Q is available on the EDGAR database on the Commission’s Internet Web site at http://www.sec.gov, and may be reviewed and copied at the:
Public Reference Room
Securities and Exchange Commission
100 F Street, NE, Room 1580
Washington, D.C. 20549
Information on the operation of the Public Reference Room may be obtained by calling the Commission at 1-800-SEC-0330. Copies of the fund’s Form N-Q also may be obtained, upon payment of a duplicating fee, by electronic request at the following e-mail address: publicinfo@sec.gov or by writing the Public Reference Section at the above address.
FURTHER INFORMATION
From time to time, MFS may post important information about the fund or the MFS funds on the MFS web site (mfs.com). This information is available by visiting the “Market Commentary” and “Announcements” sub sections in the “Market Outlooks” section of mfs.com or by clicking on the fund’s name under “Variable Insurance Portfolios — VIT” in the “Products” section of mfs.com.
FEDERAL TAX INFORMATION (unaudited)
The following information is provided pursuant to provisions of the Internal Revenue Code.
The fund designates $47,363,000 as capital gain dividends paid during the fiscal year.
For corporate shareholders, 89.95% of the ordinary income dividends paid during the fiscal year qualify for the corporate dividends received deduction.
26
rev. 3/11
| | | | |
| FACTS | | WHAT DOES MFS DO WITH YOUR
PERSONAL INFORMATION? | |  |
| | |
| Why? | | Financial companies choose how they share your personal information. Federal law gives consumers the right to limit some but not all sharing. Federal law also requires us to tell you how we collect, share, and protect your personal information. Please read this notice carefully to understand what we do. |
| | |
| What? | | The types of personal information we collect and share depend on the product or service you have with us. This information can include: • Social Security number and account balances • Account transactions and transaction history • Checking account information and wire transfer instructions When you are no longer our customer, we continue to share your information as described in this notice. |
| | |
| How? | | All financial companies need to share customers’ personal information to run their everyday business. In the section below, we list the reasons financial companies can share their customers’ personal information; the reasons MFS chooses to share; and whether you can limit this sharing. |
| | | | |
Reasons we can share your
personal information | | Does MFS share? | | Can you limit this
sharing? |
For our everyday business purposes – such as to process your transactions, maintain your account(s), respond to court orders and legal investigations, or report to credit bureaus | | Yes | | No |
For our marketing purposes – to offer our products and services to you | | No | | We don’t share |
| For joint marketing with other financial companies | | No | | We don’t share |
For our affiliates’ everyday business purposes – information about your transactions and experiences | | No | | We don’t share |
For our affiliates’ everyday business purposes – information about your creditworthiness | | No | | We don’t share |
| For nonaffiliates to market to you | | No | | We don’t share |
| | |
| Questions? | | Call 800-225-2606 or go to mfs.com. |
27
| | |
| Who we are |
| Who is providing this notice? | | MFS Funds, MFS Investment Management, MFS Institutional Advisors, Inc., MFS Fund Distributors, Inc., MFS Heritage Trust Company, and MFS Service Center, Inc. |
| | |
| What we do |
| How does MFS protect my personal information? | | To protect your personal information from unauthorized access and use, we use security measures that comply with federal law. These measures include procedural, electronic, and physical safeguards for the protection of the personal information we collect about you. |
How does MFS
collect my personal information? | | We collect your personal information, for example, when you • open an account or provide account information • direct us to buy securities or direct us to sell your securities • make a wire transfer We also collect your personal information from others, such as credit bureaus, affiliates and other companies. |
| Why can’t I limit all sharing? | | Federal law gives you the right to limit only • sharing for affiliates’ everyday business purposes – information about your creditworthiness • affiliates from using your information to market to you • sharing for nonaffiliates to market to you State laws and individual companies may give you additional rights to limit sharing. |
| | |
| Definitions |
| Affiliates | | Companies related by common ownership or control. They can be financial and nonfinancial companies. •MFS does not share personal information with affiliates, except for everyday business purposes as described on page one of this notice. |
| Nonaffiliates | | Companies not related by common ownership or control. They can be financial and nonfinancial companies. •MFS does not share with nonaffiliates so they can market to you. |
| Joint Marketing | | A formal agreement between nonaffiliated financial companies that together market financial products or services to you. •MFS doesn’t jointly market. |
| | |
| Other important information |
| If you own an MFS product or receive an MFS service in the name of a third party such as a bank or broker-dealer, their privacy policy may apply to you instead of ours. |
28
ANNUAL REPORT
December 31, 2014

MFS® MID CAP GROWTH SERIES
MFS® Variable Insurance Trust

VMG-ANN
MFS® MID CAP GROWTH SERIES
CONTENTS
The report is prepared for the general information of contract owners. It is authorized for distribution to prospective investors only when preceded or accompanied by a current prospectus.
NOT FDIC INSURED Ÿ MAY LOSE VALUE Ÿ NO BANK OR CREDIT UNION GUARANTEE Ÿ NOT A DEPOSIT Ÿ NOT INSURED BY ANY FEDERAL GOVERNMENT AGENCY OR NCUA/NCUSIF
MFS Mid Cap Growth Series
LETTER FROM THE CHAIRMAN

Dear Contract Owners:
As 2015 begins, sharply lower oil prices are reshaping the global economy, adding to deflationary pressures in the eurozone and exacerbating challenges faced by oil exporters such as Russia. The U.S. economy stands on firmer ground, having expanded steadily over the past year. The U.S. labor market has regained momentum, consumer confidence is buoyant and gasoline prices have tumbled, boosting prospects for a stronger economic rebound in 2015.
Other regions are struggling. The eurozone economy is barely expanding, and the European Central Bank (ECB) has introduced large-scale asset purchases.
Despite Japan’s efforts to strengthen its economy, its sales tax increase last spring tipped the country into a recession, leading to additional monetary stimulus from the Bank of Japan. China’s economy is slowing as it transitions to a more sustainable basis, and its growth rate will likely continue to decline.
As always, active risk management is integral to how we at MFS® manage your investments. We use a collaborative process, sharing insights across asset classes, regions and economic sectors. Our global investment team uses a diversified, multidisciplined, long-term approach.
Applying proven principles, such as asset allocation and diversification, can best serve investors over the long term. We are confident that this approach can help you as you work with your financial advisors to reach your goals in the years ahead.
Respectfully,

Robert J. Manning
Chairman
MFS Investment Management
February 13, 2015
The opinions expressed in this letter are subject to change and may not be relied upon for investment advice. No forecasts can be guaranteed.
1
MFS Mid Cap Growth Series
PORTFOLIO COMPOSITION
Portfolio structure

| | | | |
| Top ten holdings | | | | |
| Actavis PLC | | | 2.7% | |
| Ross Stores, Inc. | | | 2.5% | |
| Gartner, Inc. | | | 2.4% | |
| Jones Lang LaSalle, Inc. | | | 2.3% | |
| FleetCor Technologies, Inc. | | | 1.9% | |
| Bright Horizons Family Solutions, Inc. | | | 1.9% | |
| Roper Industries, Inc. | | | 1.8% | |
| AMETEK, Inc. | | | 1.8% | |
| Henry Schein, Inc. | | | 1.8% | |
| SBA Communications Corp. | | | 1.8% | |
| | | | |
| Equity sectors | | | | |
| Health Care | | | 16.3% | |
| Special Products & Services | | | 15.9% | |
| Industrial Goods & Services | | | 13.1% | |
| Retailing | | | 12.8% | |
| Technology | | | 7.6% | |
| Leisure | | | 7.1% | |
| Financial Services | | | 7.1% | |
| Consumer Staples | | | 5.3% | |
| Autos & Housing | | | 4.1% | |
| Energy | | | 3.3% | |
| Basic Materials | | | 2.7% | |
| Utilities & Communications | | | 2.4% | |
| Transportation | | | 2.0% | |
Cash & Other can include cash, other assets less liabilities, offsets to derivative positions, and short-term securities.
Percentages are based on net assets as of 12/31/14.
The portfolio is actively managed and current holdings may be different.
2
MFS Mid Cap Growth Series
MANAGEMENT REVIEW
Summary of Results
For the twelve months ended December 31, 2014, Initial Class shares of the MFS Mid Cap Growth Series (“fund”) provided a total return of 8.86%, while Service Class shares of the fund provided a total return of 8.56%. These compare with a return of 11.90% over the same period for the fund’s benchmark, the Russell Midcap Growth Index.
Market Environment
Early in the period, US equities suffered what proved to be a temporary setback due to concerns over emerging markets as well as what was perceived at the time to be a pause in US economic growth, partially caused by extreme weather events and a weak December 2013 labor market report. Markets soon recovered as the economic pause concluded and investors appeared to have become increasingly comfortable that newly-installed US Federal Reserve (“Fed”) Chair Janet Yellen would not make any substantial changes to the trajectory of Fed monetary policy.
A generally risk-friendly, carry trade environment persisted from February 2014 until mid-year. While geopolitical tensions flared in the Middle East and Russia/Ukraine, any market setbacks were short-lived as improving economic growth in the US, coupled with prospects for easier monetary policy in regions with slowing growth, such as Japan, Europe and China, supported risk assets. For example, the European Central Bank (“ECB”) cut policy interest rates into negative territory and, by the end of the period, expectations were for additional rate cuts and the announcement for non-conventional easing measures. Similarly, the Bank of Japan surprised markets late in the period with fresh stimulus measures given lackluster growth trends. The related decline in developed market government bond yields and credit spreads were also supportive for equity markets. At the end of the period, the US equity market was trading close to all-time highs and US Treasury yields were close to their lows for the period. However, credit markets did not fare as well in the second half of 2014, particularly US high yield and emerging market debt. The higher weightings of oil and gas credits in these asset classes resulted in widening spreads and increased volatility as oil prices began to decline in an accelerated fashion in the fourth quarter.
Detractors from Performance
Weak stock selection in the leisure sector, and the combination of stock selection and an underweight position in the transportation sector, were negative factors for performance relative to the Russell Midcap Growth Index. There were no individual stocks within either sector that were among the fund’s largest relative detractors.
Security selection in both the financial services and technology sectors also weighed on relative returns. Within the financial services sector, holdings of diversified financial services company Evercore Partners (b) detracted from relative performance. The stock declined as the company reported a strategic merger with investment research company International Strategy & Investment (ISI) and reported weak revenue growth from their investment banking business. Within the technology sector, the fund’s ownership in shares of cloud-based e-commerce solutions company ChannelAdvisor (b)(h) and not holding shares of diversified technology company Avago Technologies weighed on relative results. Shares of Avago Technologies spiked late in the reporting period due to increased growth in the company’s wireless segment, reduced operating expenses and management’s decision to increase guidance.
Elsewhere, the timing of the fund’s ownership in shares of energy company Pioneer Natural Resources, and overweight positions in industrial manufacturing and engineering company Colfax and independent oil and natural gas company Gulfport Energy, dampened relative performance. The fund’s ownership in shares of research and consulting company Advisory Board (b)(h), not holding strong-performing retail store operator Kroger, and an overweight position in oil and gas company Whiting Petroleum (h) also hurt relative results.
The fund’s cash and/or cash equivalents position during the period held back relative performance. Under normal market conditions, the fund strives to be fully invested and generally holds cash to buy new holdings and to provide liquidity. In a period when equity markets rose, as measured by the fund’s benchmark, holding cash hurt performance versus the benchmark, which has no cash position.
Contributors to Performance
Stock selection in the retailing sector positively impacted relative performance. Within this sector, the fund’s ownership in shares of strong-performing apparel retailer Burlington Stores (b), an overweight position in specialty retailer Ross Stores, and the timing of the fund’s ownership in shares of high-end retailer Michael Kors (h) benefited relative performance. Shares of Michael Kors rose markedly early in the reporting period as the company benefited from double-digit growth in sales and increased global demand.
Security selection in the special products & services sector contributed to relative performance, led by the fund’s overweight position in strong-performing financial and professional services company Jones Lang LaSalle. The stock appreciated throughout the reporting period due to higher incentive fees, increased demand and growth in the company’s real estate services business.
3
MFS Mid Cap Growth Series
Management Review – continued
Elsewhere, the fund’s overweight position in pharmaceutical company Actavis, holdings of automotive supplies manufacturer TRW Automotive (b)(h), and the timing of the fund’s ownership in life sciences company Illumina, contributed to relative performance. Holdings of technology company SS&C Technologies (b) and pharmaceutical company Regeneron Pharmaceuticals (b), and the fund’s avoidance of poor-performing diversified energy company Noble Energy, also helped relative results.
Respectfully,
| | | | |
| Eric Fischman | | Paul Gordon | | Matthew Sabel |
| Portfolio Manager | | Portfolio Manager | | Portfolio Manager |
| (b) | Security is not a benchmark constituent. |
| (h) | Security was not held in the portfolio at period end. |
Note to Contract Owners: Effective April 30, 2014, Matthew Sabel is also a Portfolio Manager of the Fund.
The views expressed in this report are those of the portfolio managers only through the end of the period of the report as stated on the cover and do not necessarily reflect the views of MFS or any other person in the MFS organization. These views are subject to change at any time based on market or other conditions, and MFS disclaims any responsibility to update such views. These views may not be relied upon as investment advice or an indication of trading intent on behalf of any MFS portfolio. References to specific securities are not recommendations of such securities, and may not be representative of any MFS portfolio’s current or future investments.
4
MFS Mid Cap Growth Series
PERFORMANCE SUMMARY THROUGH 12/31/14
The following chart illustrates the historical performance of the fund in comparison to its benchmark(s). Benchmarks are unmanaged and may not be invested in directly. Benchmark returns do not reflect any fees or expenses. The performance of other share classes will be greater than or less than that of the class depicted below. (See Notes to Performance Summary.)
Performance data shown represents past performance and is no guarantee of future results. Investment return and principal value fluctuate so your units, when sold, may be worth more or less than the original cost; current performance may be lower or higher than quoted. The performance shown does not reflect the deduction of taxes, if any, that a contract holder would pay on fund distributions or the redemption of contract units. The returns for the fund shown also do not reflect the deduction of expenses associated with variable products, such as mortality and expense risk charges, separate account charges, and sales charges imposed by the insurance company separate accounts. Such expenses would reduce the overall returns shown.
Growth of a Hypothetical $10,000 Investment
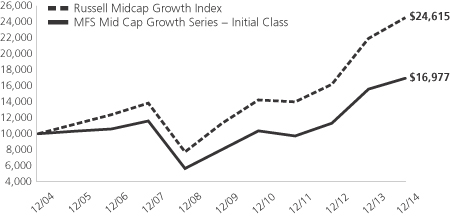
Total Returns through 12/31/14
Average annual total returns
| | | | | | | | | | | | |
| | | Share Class | | Class inception date | | 1-yr | | 5-yr | | 10-yr | | |
| | | Initial Class | | 4/28/00 | | 8.86% | | 16.31% | | 5.44% | | |
| | | Service Class | | 5/01/00 | | 8.56% | | 16.02% | | 5.18% | | |
| | | | |
| Comparative benchmark | | | | | | | | |
| | | Russell Midcap Growth Index (f) | | 11.90% | | 16.94% | | 9.43% | | |
| (f) | Source: FactSet Research Systems Inc. |
Benchmark Definition
Russell Midcap Growth Index – constructed to provide a comprehensive barometer for growth securities in the mid-cap segment of the U.S. equity universe. Companies in this index generally have higher price-to-book ratios and higher forecasted growth values.
It is not possible to invest directly in an index.
Notes to Performance Summary
Average annual total return represents the average annual change in value for each share class for the periods presented.
Performance results reflect any applicable expense subsidies and waivers in effect during the periods shown. Without such subsidies and waivers the fund’s performance results would be less favorable. Please see the prospectus and financial statements for complete details. All results are historical and assume the reinvestment of any dividends and capital gains distributions.
Performance results do not include adjustments made for financial reporting purposes in accordance with U.S. generally accepted accounting principles and may differ from amounts reported in the financial highlights.
From time to time the fund may receive proceeds from litigation settlements, without which performance would be lower.
5
MFS Mid Cap Growth Series
EXPENSE TABLE
Fund Expenses Borne by the Contract Holders During the Period,
July 1, 2014 through December 31, 2014
As a contract holder of the fund, you incur ongoing costs, including management fees; distribution and/or service (12b-1) fees; and other fund expenses. This example is intended to help you understand your ongoing costs (in dollars) of investing in the fund and to compare these costs with the ongoing costs of investing in other mutual funds.
The example is based on an investment of $1,000 invested at the beginning of the period and held for the entire period July 1, 2014 through December 31, 2014.
Actual Expenses
The first line for each share class in the following table provides information about actual account values and actual expenses. You may use the information in this line, together with the amount you invested, to estimate the expenses that you paid over the period. Simply divide your account value by $1,000 (for example, an $8,600 account value divided by $1,000 = 8.6), then multiply the result by the number in the first line under the heading entitled “Expenses Paid During Period” to estimate the expenses you paid on your account during this period.
Hypothetical Example for Comparison Purposes
The second line for each share class in the following table provides information about hypothetical account values and hypothetical expenses based on the fund’s actual expense ratio and an assumed rate of return of 5% per year before expenses, which is not the fund’s actual return. The hypothetical account values and expenses may not be used to estimate the actual ending account balance or expenses you paid for the period. You may use this information to compare the ongoing costs of investing in the fund and other funds. To do so, compare this 5% hypothetical example with the 5% hypothetical examples that appear in the shareholder reports of the other funds.
Please note that the expenses shown in the table are meant to highlight the fund’s ongoing costs only and do not take into account the fees and expenses imposed under the variable contracts through which your investment in the fund is made. Therefore, the second line for each share class in the table is useful in comparing ongoing costs associated with an investment in vehicles (such as the fund) which fund benefits under variable annuity and variable life insurance contracts and to qualified pension and retirement plans only, and will not help you determine the relative total costs of investing in the fund through variable annuity and variable life insurance contracts. If the fees and expenses imposed under the variable contracts were included, your costs would have been higher.
| | | | | | | | | | | | | | | | | | |
| Share Class | | | | Annualized
Expense Ratio | | | Beginning
Account Value
7/01/14 | | | Ending
Account Value
12/31/14 | | | Expenses Paid
During Period (p)
7/01/14-12/31/14 | |
| Initial Class | | Actual | | | 0.80% | | | | $1,000.00 | | | | $1,063.80 | | | | $4.16 | |
| | Hypothetical (h) | | | 0.80% | | | | $1,000.00 | | | | $1,021.17 | | | | $4.08 | |
| Service Class | | Actual | | | 1.05% | | | | $1,000.00 | | | | $1,062.44 | | | | $5.46 | |
| | Hypothetical (h) | | | 1.05% | | | | $1,000.00 | | | | $1,019.91 | | | | $5.35 | |
| (h) | 5% class return per year before expenses. |
| (p) | “Expenses Paid During Period” are equal to each class’s annualized expense ratio, as shown above, multiplied by the average account value over the period, multiplied by 184/365 (to reflect the one-half year period). |
6
MFS Mid Cap Growth Series
PORTFOLIO OF INVESTMENTS – 12/31/14
The Portfolio of Investments is a complete list of all securities owned by your fund. It is categorized by broad-based asset classes.
| | | | | | | | |
| Issuer | | Shares/Par | | | Value ($) | |
| | | | | | | | |
| COMMON STOCKS – 99.8% | | | | | |
| Aerospace – 1.0% | | | | | | | | |
| Textron, Inc. | | | 33,613 | | | $ | 1,415,445 | |
| TransDigm Group, Inc. | | | 16,666 | | | | 3,272,369 | |
| | | | | | | | |
| | | | | | $ | 4,687,814 | |
| | | | | | | | |
| Airlines – 0.8% | | | | | | | | |
| American Airlines Group, Inc. | | | 69,734 | | | $ | 3,739,834 | |
| | | | | | | | |
| Alcoholic Beverages – 0.8% | | | | | | | | |
| Constellation Brands, Inc., “A” (a) | | | 37,544 | | | $ | 3,685,694 | |
| | | | | | | | |
| Apparel Manufacturers – 1.7% | | | | | | | | |
| PVH Corp. | | | 59,331 | | | $ | 7,604,454 | |
| | | | | | | | |
| Automotive – 1.3% | | | | | | | | |
| LKQ Corp. (a) | | | 166,351 | | | $ | 4,677,790 | |
| Mobileye N.V. (a)(l) | | | 35,276 | | | | 1,430,795 | |
| | | | | | | | |
| | | | | | $ | 6,108,585 | |
| | | | | | | | |
| Biotechnology – 4.4% | | | | | | | | |
| Alexion Pharmaceuticals, Inc. (a) | | | 43,420 | | | $ | 8,034,003 | |
| Illumina, Inc. (a) | | | 13,585 | | | | 2,507,519 | |
| Isis Pharmaceuticals, Inc. (a) | | | 24,189 | | | | 1,493,429 | |
| Medivation, Inc. (a) | | | 7,726 | | | | 769,587 | |
| Puma Biotechnology, Inc. (a) | | | 10,028 | | | | 1,898,000 | |
| Regeneron Pharmaceuticals, Inc. (a) | | | 12,279 | | | | 5,037,460 | |
| | | | | | | | |
| | | | | | $ | 19,739,998 | |
| | | | | | | | |
| Broadcasting – 0.7% | | | | | | | | |
| Discovery Communications, Inc., “A” (a) | | | 44,231 | | | $ | 1,523,758 | |
| Discovery Communications, Inc., “C” (a) | | | 44,231 | | | | 1,491,469 | |
| | | | | | | | |
| | | | | | $ | 3,015,227 | |
| | | | | | | | |
| Brokerage & Asset Managers – 4.1% | |
| Affiliated Managers Group, Inc. (a) | | | 35,920 | | | $ | 7,623,661 | |
| Evercore Partners, Inc. | | | 66,276 | | | | 3,470,874 | |
| Intercontinental Exchange, Inc. | | | 34,197 | | | | 7,499,060 | |
| | | | | | | | |
| | | | | | $ | 18,593,595 | |
| | | | | | | | |
| Business Services – 13.2% | | | | | | | | |
| Bright Horizons Family Solutions, Inc. (a) | | | 181,078 | | | $ | 8,512,477 | |
| Cognizant Technology Solutions Corp., “A” (a) | | | 112,132 | | | | 5,904,871 | |
| CoStar Group, Inc. (a) | | | 7,117 | | | | 1,306,895 | |
| Equifax, Inc. | | | 11,965 | | | | 967,610 | |
| FleetCor Technologies, Inc. (a) | | | 57,916 | | | | 8,612,688 | |
| Gartner, Inc. (a) | | | 129,686 | | | | 10,920,858 | |
| Global Payments, Inc. | | | 32,967 | | | | 2,661,426 | |
| IHS, Inc., “A” (a) | | | 42,896 | | | | 4,884,996 | |
| Jones Lang LaSalle, Inc. | | | 69,123 | | | | 10,363,611 | |
| Realogy Holdings Corp. (a) | | | 83,806 | | | | 3,728,529 | |
| Wex, Inc. (a) | | | 19,917 | | | | 1,970,190 | |
| | | | | | | | |
| | | | | | $ | 59,834,151 | |
| | | | | | | | |
| Cable TV – 2.3% | | | | | | | | |
| Charter Communications, Inc., “A” (a) | | | 29,309 | | | $ | 4,883,466 | |
| | | | | | | | |
| Issuer | | Shares/Par | | | Value ($) | |
| | | | | | | | |
| COMMON STOCKS – continued | | | | | |
| Cable TV – continued | | | | | | | | |
| Liberty Global PLC, “A” (a) | | | 56,366 | | | $ | 2,829,855 | |
| Liberty Global PLC, “C” (a) | | | 56,366 | | | | 2,723,041 | |
| | | | | | | | |
| | | | | | $ | 10,436,362 | |
| | | | | | | | |
| Computer Software – 1.7% | | | | | | | | |
| Autodesk, Inc. (a) | | | 43,700 | | | $ | 2,624,622 | |
| Citrix Systems, Inc. (a) | | | 14,519 | | | | 926,312 | |
| NetSuite, Inc. (a) | | | 4,214 | | | | 460,042 | |
| Qlik Technologies, Inc. (a) | | | 118,347 | | | | 3,655,739 | |
| | | | | | | | |
| | | | | | $ | 7,666,715 | |
| | | | | | | | |
| Computer Software – Systems – 3.1% | |
| Benefitfocus, Inc. (a)(l) | | | 22,787 | | | $ | 748,325 | |
| Castlight Health, Inc., “B” (a) | | | 21,292 | | | | 249,116 | |
| Guidewire Software, Inc. (a) | | | 41,393 | | | | 2,095,728 | |
| ServiceNow, Inc. (a) | | | 6,739 | | | | 457,241 | |
| SS&C Technologies Holdings, Inc. | | | 126,219 | | | | 7,382,549 | |
| Vantiv, Inc., “A” (a) | | | 74,524 | | | | 2,527,854 | |
| Workday, Inc. (a) | | | 4,839 | | | | 394,911 | |
| | | | | | | | |
| | | | | | $ | 13,855,724 | |
| | | | | | | | |
| Construction – 2.7% | | | | | | | | |
| Fortune Brands Home & Security, Inc. | | | 88,975 | | | $ | 4,027,898 | |
| Lennox International, Inc. | | | 32,092 | | | | 3,050,986 | |
| Masco Corp. | | | 55,888 | | | | 1,408,378 | |
| Pool Corp. | | | 60,701 | | | | 3,850,871 | |
| | | | | | | | |
| | | | | | $ | 12,338,133 | |
| | | | | | | | |
| Consumer Products – 1.1% | | | | | | | | |
| Newell Rubbermaid, Inc. | | | 125,405 | | | $ | 4,776,676 | |
| | | | | | | | |
| Consumer Services – 2.7% | | | | | | | | |
| Ctrip.com International Ltd., ADR (a) | | | 7,664 | | | $ | 348,712 | |
| Nord Anglia Education, Inc. (a) | | | 151,621 | | | | 2,892,929 | |
| Priceline Group, Inc. (a) | | | 4,491 | | | | 5,120,683 | |
| Servicemaster Global Holdings, Inc. (a) | | | 138,300 | | | | 3,702,291 | |
| | | | | | | | |
| | | | | | $ | 12,064,615 | |
| | | | | | | | |
| Containers – 0.9% | | | | | | | | |
| Crown Holdings, Inc. (a) | | | 82,531 | | | $ | 4,200,828 | |
| | | | | | | | |
| Electrical Equipment – 5.0% | | | | | | | | |
| Advanced Drainage Systems, Inc. | | | 73,472 | | | $ | 1,688,387 | |
| AMETEK, Inc. | | | 157,748 | | | | 8,302,277 | |
| Amphenol Corp., “A” | | | 85,142 | | | | 4,581,491 | |
| Mettler-Toledo International, Inc. (a) | | | 13,738 | | | | 4,155,195 | |
| Sensata Technologies Holding B.V. (a) | | | 77,880 | | | | 4,081,691 | |
| | | | | | | | |
| | | | | | $ | 22,809,041 | |
| | | | | | | | |
| Electronics – 1.3% | | | | | | | | |
| Altera Corp. | | | 99,675 | | | $ | 3,681,995 | |
| Skyworks Solutions, Inc. | | | 33,092 | | | | 2,406,119 | |
| | | | | | | | |
| | | | | | $ | 6,088,114 | |
| | | | | | | | |
7
MFS Mid Cap Growth Series
Portfolio of Investments – continued
| | | | | | | | |
| Issuer | | Shares/Par | | | Value ($) | |
| | | | | | | | |
| COMMON STOCKS – continued | | | | | |
| Energy – Independent – 2.3% | | | | | | | | |
| Cabot Oil & Gas Corp. | | | 30,149 | | | $ | 892,712 | |
| Energen Corp. | | | 14,430 | | | | 920,057 | |
| Gulfport Energy Corp. (a) | | | 68,372 | | | | 2,853,847 | |
| Memorial Resource Development Corp. (a) | | | 72,430 | | | | 1,305,913 | |
| PDC Energy, Inc. (a) | | | 30,935 | | | | 1,276,687 | |
| Pioneer Natural Resources Co. | | | 22,157 | | | | 3,298,069 | |
| | | | | | | | |
| | | | | | $ | 10,547,285 | |
| | | | | | | | |
| Entertainment – 0.5% | | | | | | | | |
| Netflix, Inc. (a) | | | 6,407 | | | $ | 2,188,695 | |
| | | | | | | | |
| Food & Beverages – 3.4% | | | | | | | | |
| Chr. Hansen Holding A.S. | | | 147,878 | | | $ | 6,579,810 | |
| Freshpet, Inc. (a)(l) | | | 61,730 | | | | 1,053,114 | |
| Mead Johnson Nutrition Co., “A” | | | 35,435 | | | | 3,562,635 | |
| WhiteWave Foods Co., “A” (a) | | | 122,398 | | | | 4,282,706 | |
| | | | | | | | |
| | | | | | $ | 15,478,265 | |
| | | | | | | | |
| Gaming & Lodging – 1.9% | | | | | | | | |
| MGM Mirage (a) | | | 147,061 | | | $ | 3,144,164 | |
| Norwegian Cruise Line Holdings Ltd. (a) | | | 41,071 | | | | 1,920,480 | |
| Wynn Resorts Ltd. | | | 22,501 | | | | 3,347,249 | |
| | | | | | | | |
| | | | | | $ | 8,411,893 | |
| | | | | | | | |
| General Merchandise – 1.1% | | | | | | | | |
| Five Below, Inc. (a) | | | 118,526 | | | $ | 4,839,417 | |
| | | | | | | | |
| Insurance – 0.7% | | | | | | | | |
| Lincoln National Corp. | | | 55,929 | | | $ | 3,225,425 | |
| | | | | | | | |
| Internet – 1.6% | | | | | | | | |
| LinkedIn Corp., “A” (a) | | | 18,749 | | | $ | 4,306,833 | |
| Shutterstock, Inc. (a) | | | 32,278 | | | | 2,230,410 | |
| Yelp, Inc. (a) | | | 8,661 | | | | 474,017 | |
| | | | | | | | |
| | | | | | $ | 7,011,260 | |
| | | | | | | | |
| Leisure & Toys – 0.8% | | | | | | | | |
| Brunswick Corp. | | | 74,890 | | | $ | 3,838,861 | |
| | | | | | | | |
| Machinery & Tools – 5.5% | | | | | | | | |
| Colfax Corp. (a) | | | 87,555 | | | $ | 4,515,211 | |
| Flowserve Corp. | | | 60,251 | | | | 3,604,817 | |
| Roper Industries, Inc. | | | 53,165 | | | | 8,312,348 | |
| United Rentals, Inc. (a) | | | 18,110 | | | | 1,847,401 | |
| WABCO Holdings, Inc. (a) | | | 62,146 | | | | 6,511,658 | |
| | | | | | | | |
| | | | | | $ | 24,791,435 | |
| | | | | | | | |
| Major Banks – 0.8% | | | | | | | | |
| Morgan Stanley | | | 90,844 | | | $ | 3,524,747 | |
| | | | | | | | |
| Medical & Health Technology & Services – 3.4% | |
| Cerner Corp. (a) | | | 77,834 | | | $ | 5,032,746 | |
| Henry Schein, Inc. (a) | | | 60,944 | | | | 8,297,526 | |
| IDEXX Laboratories, Inc. (a) | | | 12,958 | | | | 1,921,283 | |
| | | | | | | | |
| | | | | | $ | 15,251,555 | |
| | | | | | | | |
| Medical Equipment – 4.3% | | | | | | | | |
| C.R. Bard, Inc. | | | 35,835 | | | $ | 5,970,828 | |
| Cooper Cos., Inc. | | | 38,666 | | | | 6,267,372 | |
| | | | | | | | |
| Issuer | | Shares/Par | | | Value ($) | |
| | | | | | | | |
| COMMON STOCKS – continued | | | | | |
| Medical Equipment – continued | | | | | | | | |
| PerkinElmer, Inc. | | | 132,391 | | | $ | 5,789,458 | |
| Thermo Fisher Scientific, Inc. | | | 10,557 | | | | 1,322,687 | |
| | | | | | | | |
| | | | | | $ | 19,350,345 | |
| | | | | | | | |
| Oil Services – 1.0% | | | | | | | | |
| Core Laboratories N.V. | | | 15,108 | | | $ | 1,818,097 | |
| FMC Technologies, Inc. (a) | | | 55,975 | | | | 2,621,869 | |
| | | | | | | | |
| | | | | | $ | 4,439,966 | |
| | | | | | | | |
| Other Banks & Diversified Financials – 1.5% | |
| MasterCard, Inc., “A” | | | 78,006 | | | $ | 6,720,997 | |
| | | | | | | | |
| Pharmaceuticals – 4.3% | | | | | | | | |
| Actavis PLC (a) | | | 47,181 | | | $ | 12,144,861 | |
| Endo International PLC (a) | | | 66,064 | | | | 4,764,536 | |
| Intercept Pharmaceuticals, Inc. (a) | | | 2,955 | | | | 460,980 | |
| Receptos, Inc. (a) | | | 6,556 | | | | 803,176 | |
| Salix Pharmaceuticals, Ltd. (a) | | | 11,786 | | | | 1,354,683 | |
| | | | | | | | |
| | | | | | $ | 19,528,236 | |
| | | | | | | | |
| Pollution Control – 1.5% | | | | | | | | |
| Stericycle, Inc. (a) | | | 52,451 | | | $ | 6,875,277 | |
| | | | | | | | |
| Railroad & Shipping – 1.2% | | | | | | | | |
| Kansas City Southern Co. | | | 45,655 | | | $ | 5,571,280 | |
| | | | | | | | |
| Restaurants – 1.0% | | | | | | | | |
| Dunkin Brands Group, Inc. | | | 101,308 | | | $ | 4,320,786 | |
| Zoe’s Kitchen, Inc. (a)(l) | | | 6,314 | | | | 188,852 | |
| | | | | | | | |
| | | | | | $ | 4,509,638 | |
| | | | | | | | |
| Specialty Chemicals – 1.8% | | | | | | | | |
| Airgas, Inc. | | | 20,439 | | | $ | 2,354,164 | |
| PolyOne Corp. | | | 61,369 | | | | 2,326,499 | |
| W.R. Grace & Co. (a) | | | 34,080 | | | | 3,250,891 | |
| | | | | | | | |
| | | | | | $ | 7,931,554 | |
| | | | | | | | |
| Specialty Stores – 10.0% | | | | | | | | |
| Advance Auto Parts, Inc. | | | 40,812 | | | $ | 6,500,535 | |
| Burlington Stores, Inc. (a) | | | 121,837 | | | | 5,758,017 | |
| L Brands, Inc. | | | 13,085 | | | | 1,132,507 | |
| O’Reilly Automotive, Inc. (a) | | | 26,299 | | | | 5,065,713 | |
| Ross Stores, Inc. | | | 122,408 | | | | 11,538,178 | |
| Signet Jewelers Ltd. | | | 37,577 | | | | 4,944,006 | |
| Tiffany & Co. | | | 31,470 | | | | 3,362,884 | |
| Tractor Supply Co. | | | 62,218 | | | | 4,904,023 | |
| Urban Outfitters, Inc. (a) | | | 60,693 | | | | 2,132,145 | |
| | | | | | | | |
| | | | | | $ | 45,338,008 | |
| | | | | | | | |
| Telecommunications – Wireless – 2.4% | |
| American Tower Corp., REIT | | | 29,532 | | | $ | 2,919,238 | |
| SBA Communications Corp. (a) | | | 72,895 | | | | 8,073,850 | |
| | | | | | | | |
| | | | | | $ | 10,993,088 | |
| | | | | | | | |
Total Common Stocks
(Identified Cost, $331,088,035) | | | | | | $ | 451,612,787 | |
| | | | | | | | |
8
MFS Mid Cap Growth Series
Portfolio of Investments – continued
| | | | | | | | |
| Issuer | | Shares/Par | | | Value ($) | |
| | | | | | | | |
| MONEY MARKET FUNDS – 0.6% | | | | | |
| MFS Institutional Money Market Portfolio, 0.09%, at Cost and Net Asset Value (v) | | | 2,561,591 | | | $ | 2,561,591 | |
| | | | | | | | |
|
| COLLATERAL FOR SECURITIES LOANED – 0.4% | |
| Navigator Securities Lending Prime Portfolio, 0.16%, at Cost and Net Asset Value (j) | | | 1,813,318 | | | $ | 1,813,318 | |
| | | | | | | | |
Total Investments
(Identified Cost, $335,462,944) | | | | | | $ | 455,987,696 | |
| | | | | | | | |
OTHER ASSETS, LESS
LIABILITIES – (0.8)% | | | | | | | (3,301,084 | ) |
| | | | | | | | |
| NET ASSETS – 100.0% | | | | | | $ | 452,686,612 | |
| | | | | | | | |
| (a) | Non-income producing security. |
| (j) | The rate quoted is the annualized seven-day yield of the fund at period end. |
| (l) | A portion of this security is on loan. |
| (v) | Underlying affiliated fund that is available only to investment companies managed by MFS. The rate quoted for the MFS Institutional Money Market Portfolio is the annualized seven-day yield of the fund at period end. |
The following abbreviations are used in this report and are defined:
| ADR | | American Depositary Receipt |
| PLC | | Public Limited Company |
| REIT | | Real Estate Investment Trust |
See Notes to Financial Statements
9
MFS Mid Cap Growth Series
FINANCIAL STATEMENTS | STATEMENT OF ASSETS AND LIABILITIES
This statement represents your fund’s balance sheet, which details the assets and liabilities comprising the total value of the fund.
| | | | | | | | |
At 12/31/14 | | | | | | | | |
Assets | | | | | | | | |
Investments – | | | | | | | | |
Non-affiliated issuers, at value (identified cost, $332,901,353) | | | $453,426,105 | | | | | |
Underlying affiliated funds, at cost and value | | | 2,561,591 | | | | | |
Total investments, at value, including $1,754,776 of securities on loan (identified cost, $335,462,944) | | | $455,987,696 | | | | | |
Receivables for | | | | | | | | |
Fund shares sold | | | 34,146 | | | | | |
Interest and dividends | | | 118,169 | | | | | |
Other assets | | | 3,259 | | | | | |
Total assets | | | | | | | $456,143,270 | |
Liabilities | | | | | | | | |
Payables for | | | | | | | | |
Investments purchased | | | $56,863 | | | | | |
Fund shares reacquired | | | 1,497,299 | | | | | |
Collateral for securities loaned, at value | | | 1,813,318 | | | | | |
Payable to affiliates | | | | | | | | |
Investment adviser | | | 16,394 | | | | | |
Shareholder servicing costs | | | 156 | | | | | |
Distribution and/or service fees | | | 1,236 | | | | | |
Payable for independent Trustees’ compensation | | | 2 | | | | | |
Accrued expenses and other liabilities | | | 71,390 | | | | | |
Total liabilities | | | | | | | $3,456,658 | |
Net assets | | | | | | | $452,686,612 | |
Net assets consist of | | | | | | | | |
Paid-in capital | | | $292,432,973 | | | | | |
Unrealized appreciation (depreciation) on investments and translation of assets and liabilities in foreign currencies | | | 120,524,409 | | | | | |
Accumulated net realized gain (loss) on investments and foreign currency | | | 39,729,230 | | | | | |
Net assets | | | | | | | $452,686,612 | |
Shares of beneficial interest outstanding | | | | | | | 52,072,775 | |
| | | | | | | | | | | | |
| | | Net assets | | | Shares
outstanding | | | Net asset value
per share | |
Initial Class | | | $363,787,636 | | | | 41,530,235 | | | | $8.76 | |
Service Class | | | 88,898,976 | | | | 10,542,540 | | | | 8.43 | |
See Notes to Financial Statements
10
MFS Mid Cap Growth Series
FINANCIAL STATEMENTS | STATEMENT OF OPERATIONS
This statement describes how much your fund earned in investment income and accrued in expenses. It also describes any gains and/or losses generated by fund operations.
| | | | | | | | |
Year ended 12/31/14 | | | | | | | | |
Net Investment loss | | | | | | | | |
Income | | | | | | | | |
Dividends | | | $2,126,304 | | | | | |
Interest | | | 29,013 | | | | | |
Dividends from underlying affiliated funds | | | 5,588 | | | | | |
Foreign taxes withheld | | | (19,109 | ) | | | | |
Total investment income | | | | | | | $2,141,796 | |
Expenses | | | | | | | | |
Management fee | | | $3,509,898 | | | | | |
Distribution and/or service fees | | | 226,771 | | | | | |
Shareholder servicing costs | | | 25,828 | | | | | |
Administrative services fee | | | 73,380 | | | | | |
Independent Trustees’ compensation | | | 9,515 | | | | | |
Custodian fee | | | 46,565 | | | | | |
Shareholder communications | | | 25,677 | | | | | |
Audit and tax fees | | | 54,078 | | | | | |
Legal fees | | | 4,031 | | | | | |
Miscellaneous | | | 18,584 | | | | | |
Total expenses | | | | | | | $3,994,327 | |
Fees paid indirectly | | | (12 | ) | | | | |
Reduction of expenses by investment adviser | | | (22,283 | ) | | | | |
Net expenses | | | | | | | $3,972,032 | |
Net investment loss | | | | | | | $(1,830,236 | ) |
Realized and unrealized gain (loss) on investments and foreign currency | | | | | | | | |
Realized gain (loss) (identified cost basis) | | | | | | | | |
Investments | | | $44,597,754 | | | | | |
Foreign currency | | | 262 | | | | | |
Net realized gain (loss) on investments and foreign currency | | | | | | | $44,598,016 | |
Change in unrealized appreciation (depreciation) | | | | | | | | |
Investments | | | $(3,396,292 | ) | | | | |
Translation of assets and liabilities in foreign currencies | | | (592 | ) | | | | |
Net unrealized gain (loss) on investments and foreign currency translation | | | | | | | $(3,396,884 | ) |
Net realized and unrealized gain (loss) on investments and foreign currency | | | | | | | $41,201,132 | |
Change in net assets from operations | | | | | | | $39,370,896 | |
See Notes to Financial Statements
11
MFS Mid Cap Growth Series
FINANCIAL STATEMENTS | STATEMENTS OF CHANGES IN NET ASSETS
These statements describe the increases and/or decreases in net assets resulting from operations, any distributions, and any shareholder transactions.
| | | | | | | | |
For years ended 12/31 | | | 2014 | | | | 2013 | |
Change in net assets | | | | | | | | |
From operations | | | | | | | | |
Net investment loss | | | $(1,830,236 | ) | | | $(1,418,410 | ) |
Net realized gain (loss) on investments and foreign currency | | | 44,598,016 | | | | 56,151,862 | |
Net unrealized gain (loss) on investments and foreign currency translation | | | (3,396,884 | ) | | | 93,085,664 | |
Change in net assets from operations | | | $39,370,896 | | | | $147,819,116 | |
Distributions declared to shareholders | | | | | | | | |
From net realized gain on investments | | | $(50,698,590 | ) | | | $(1,768,591 | ) |
Change in net assets from fund share transactions | | | $(20,051,143 | ) | | | $(98,252,506 | ) |
Total change in net assets | | | $(31,378,837 | ) | | | $47,798,019 | |
Net assets | | | | | | | | |
At beginning of period | | | 484,065,449 | | | | 436,267,430 | |
At end of period | | | $452,686,612 | | | | $484,065,449 | |
See Notes to Financial Statements
12
MFS Mid Cap Growth Series
FINANCIAL STATEMENTS | FINANCIAL HIGHLIGHTS
The financial highlights table is intended to help you understand the fund’s financial performance for the past 5 years. Certain information reflects financial results for a single fund share. The total returns in the table represent the rate by which an investor would have earned (or lost) on an investment in the fund share class (assuming reinvestment of all distributions) held for the entire period.
| | | | | | | | | | | | | | | | | | | | |
| Initial Class | | Years ended 12/31 | |
| | | 2014 | | | 2013 | | | 2012 | | | 2011 | | | 2010 | |
Net asset value, beginning of period | | | $9.00 | | | | $6.56 | | | | $5.63 | | | | $5.99 | | | | $4.62 | |
| Income (loss) from investment operations | | | | | | | | | | | | | | | | | | | | |
Net investment income (loss) (d) | | | $(0.03 | ) | | | $(0.02 | ) | | | $(0.01 | ) | | | $(0.03 | ) | | | $0.00 | (w) |
Net realized and unrealized gain (loss) on investments
and foreign currency | | | 0.80 | | | | 2.49 | | | | 0.94 | | | | (0.33 | ) | | | 1.37 | |
Total from investment operations | | | $0.77 | | | | $2.47 | | | | $0.93 | | | | $(0.36 | ) | | | $1.37 | |
| Less distributions declared to shareholders | | | | | | | | | | | | | | | | | | | | |
From net realized gain on investments | | | $(1.01 | ) | | | $(0.03 | ) | | | $— | | | | $— | | | | $— | |
Net asset value, end of period (x) | | | $8.76 | | | | $9.00 | | | | $6.56 | | | | $5.63 | | | | $5.99 | |
Total return (%) (k)(r)(s)(x) | | | 8.86 | | | | 37.72 | | | | 16.52 | | | | (6.01 | ) | | | 29.65 | |
Ratios (%) (to average net assets)
and Supplemental data: | | | | | | | | | | | | | | | | | | | | |
Expenses before expense reductions (f) | | | 0.81 | | | | 0.81 | | | | 0.89 | | | | 0.88 | | | | 0.88 | |
Expenses after expense reductions (f) | | | 0.80 | | | | 0.81 | | | | 0.89 | | | | 0.88 | | | | 0.88 | |
Net investment income (loss) | | | (0.34 | ) | | | (0.26 | ) | | | (0.10 | ) | | | (0.44 | ) | | | 0.09 | |
Portfolio turnover | | | 49 | | | | 62 | | | | 65 | | | | 71 | | | | 91 | |
Net assets at end of period (000 omitted) | | | $363,788 | | | | $393,212 | | | | $359,488 | | | | $84,387 | | | | $137,567 | |
See Notes to Financial Statements
13
MFS Mid Cap Growth Series
Financial Highlights – continued
| | | | | | | | | | | | | | | | | | | | |
| Service Class | | Years ended 12/31 | |
| | | 2014 | | | 2013 | | | 2012 | | | 2011 | | | 2010 | |
Net asset value, beginning of period | | | $8.72 | | | | $6.38 | | | | $5.48 | | | | $5.84 | | | | $4.52 | |
| Income (loss) from investment operations | | | | | | | | | | | | | | | | | | | | |
Net investment loss (d) | | | $(0.05 | ) | | | $(0.04 | ) | | | $(0.02 | ) | | | $(0.04 | ) | | | $(0.01 | ) |
Net realized and unrealized gain (loss) on investments
and foreign currency | | | 0.77 | | | | 2.41 | | | | 0.92 | | | | (0.32 | ) | | | 1.33 | |
Total from investment operations | | | $0.72 | | | | $2.37 | | | | $0.90 | | | | $(0.36 | ) | | | $1.32 | |
| Less distributions declared to shareholders | | | | | | | | | | | | | | | | | | | | |
From net realized gain on investments | | | $(1.01 | ) | | | $(0.03 | ) | | | $— | | | | $— | | | | $— | |
Net asset value, end of period (x) | | | $8.43 | | | | $8.72 | | | | $6.38 | | | | $5.48 | | | | $5.84 | |
Total return (%) (k)(r)(s)(x) | | | 8.56 | | | | 37.22 | | | | 16.42 | | | | (6.16 | ) | | | 29.20 | |
Ratios (%) (to average net assets)
and Supplemental data: | | | | | | | | | | | | | | | | | | | | |
Expenses before expense reductions (f) | | | 1.06 | | | | 1.06 | | | | 1.14 | | | | 1.13 | | | | 1.13 | |
Expenses after expense reductions (f) | | | 1.05 | | | | 1.06 | | | | 1.14 | | | | 1.13 | | | | 1.13 | |
Net investment loss | | | (0.59 | ) | | | (0.51 | ) | | | (0.35 | ) | | | (0.70 | ) | | | (0.16 | ) |
Portfolio turnover | | | 49 | | | | 62 | | | | 65 | | | | 71 | | | | 91 | |
Net assets at end of period (000 omitted) | | | $88,899 | | | | $90,854 | | | | $76,779 | | | | $30,142 | | | | $35,722 | |
| (d) | | Per share data is based on average shares outstanding. |
| (f) | | Ratios do not reflect reductions from fees paid indirectly, if applicable. |
| (k) | | The total return does not reflect expenses that apply to separate accounts. Inclusion of these charges would reduce the total return figures for all periods shown. |
| (r) | | Certain expenses have been reduced without which performance would have been lower. |
| (s) | | From time to time the fund may receive proceeds from litigation settlements, without which performance would be lower. |
| (w) | | Per share amount was less than $0.01. |
| (x) | | The net asset values per share and total returns have been calculated on net assets which include adjustments made in accordance with U.S. generally accepted accounting principles required at period end for financial reporting purposes. |
See Notes to Financial Statements
14
MFS Mid Cap Growth Series
NOTES TO FINANCIAL STATEMENTS
| (1) | | Business and Organization |
MFS Mid Cap Growth Series (the fund) is a diversified series of MFS Variable Insurance Trust (the trust). The trust is organized as a Massachusetts business trust and is registered under the Investment Company Act of 1940, as amended, as an open-end management investment company. The shareholders of each series of the trust are separate accounts of insurance companies, which offer variable annuity and/or life insurance products, and qualified retirement and pension plans.
The fund is an investment company and accordingly follows the investment company accounting and reporting guidance of the Financial Accounting Standards Board (FASB) Accounting Standards Codification Topic 946 Financial Services – Investment Companies.
| (2) | | Significant Accounting Policies |
General – The preparation of financial statements in conformity with U.S. generally accepted accounting principles requires management to make estimates and assumptions that affect the reported amounts of assets and liabilities, and disclosure of contingent assets and liabilities at the date of the financial statements and the reported amounts of increases and decreases in net assets from operations during the reporting period. Actual results could differ from those estimates. In the preparation of these financial statements, management has evaluated subsequent events occurring after the date of the fund’s Statement of Assets and Liabilities through the date that the financial statements were issued.
In June 2014, FASB issued Accounting Standards Update 2014-11, Transfers and Servicing (Topic 860) – Repurchase-to-Maturity Transactions, Repurchase Financings, and Disclosures (“ASU 2014-11”). ASU 2014-11 changes the accounting for repurchase-to-maturity transactions (i.e., repurchase agreements that settle at the same time as the maturity of the transferred financial asset) and enhances the required disclosures for repurchase agreements and other similar transactions. Although still evaluating the potential impacts of ASU 2014-11 to the fund, management expects that the impact of the fund’s adoption will be limited to additional financial statement disclosures which would first be effective for interim reporting periods beginning after March 15, 2015.
Balance Sheet Offsetting – The fund’s accounting policy with respect to balance sheet offsetting is that, absent an event of default by the counterparty or a termination of the agreement, the International Swaps and Derivatives Association (ISDA) Master Agreement does not result in an offset of reported amounts of financial assets and financial liabilities in the Statement of Assets and Liabilities across transactions between the fund and the applicable counterparty. The fund’s right to setoff may be restricted or prohibited by the bankruptcy or insolvency laws of the particular jurisdiction to which a specific master netting agreement counterparty is subject. Balance sheet offsetting disclosures, to the extent applicable to the fund, have been included in the fund’s Significant Accounting Policies note under the captions for each of the fund’s in-scope financial instruments and transactions.
Investment Valuations – Equity securities, including restricted equity securities, are generally valued at the last sale or official closing price as provided by a third-party pricing service on the market or exchange on which they are primarily traded. Equity securities, for which there were no sales reported that day, are generally valued at the last quoted daily bid quotation as provided by a third-party pricing service on the market or exchange on which such securities are primarily traded. Short-term instruments with a maturity at issuance of 60 days or less may be valued at amortized cost, which approximates market value. Open-end investment companies are generally valued at net asset value per share. Securities and other assets generally valued on the basis of information from a third-party pricing service may also be valued at a broker/dealer bid quotation. Values obtained from third-party pricing services can utilize both transaction data and market information such as yield, quality, coupon rate, maturity, type of issue, trading characteristics, and other market data. The values of foreign securities and other assets and liabilities expressed in foreign currencies are converted to U.S. dollars using the mean of bid and asked prices for rates provided by a third-party pricing service.
The Board of Trustees has delegated primary responsibility for determining or causing to be determined the value of the fund’s investments (including any fair valuation) to the adviser pursuant to valuation policies and procedures approved by the Board. If the adviser determines that reliable market quotations are not readily available, investments are valued at fair value as determined in good faith by the adviser in accordance with such procedures under the oversight of the Board of Trustees. Under the fund’s valuation policies and procedures, market quotations are not considered to be readily available for most types of debt instruments and floating rate loans and many types of derivatives. These investments are generally valued at fair value based on information from third-party pricing services. In addition, investments may be valued at fair value if the adviser determines that an investment’s value has been materially affected by events occurring after the close of the exchange or market on which the investment is principally traded (such as foreign exchange or market) and prior to the determination of the fund’s net asset value, or after the halting of trading of a specific security where trading does not resume prior to the close of the exchange or market on which the security is principally traded. Events that occur on a frequent basis after foreign markets close (such as developments in foreign markets and significant movements in the U.S. markets) and prior to the determination of the fund’s net asset value may be deemed to have a material effect on the value of securities traded in foreign markets. Accordingly, the fund’s foreign equity securities may often be valued at fair value. The adviser generally relies on third-party pricing services or other information (such as the correlation with price
15
MFS Mid Cap Growth Series
Notes to Financial Statements – continued
movements of similar securities in the same or other markets; the type, cost and investment characteristics of the security; the business and financial condition of the issuer; and trading and other market data) to assist in determining whether to fair value and at what value to fair value an investment. The value of an investment for purposes of calculating the fund’s net asset value can differ depending on the source and method used to determine value. When fair valuation is used, the value of an investment used to determine the fund’s net asset value may differ from quoted or published prices for the same investment. There can be no assurance that the fund could obtain the fair value assigned to an investment if it were to sell the investment at the same time at which the fund determines its net asset value per share.
Various inputs are used in determining the value of the fund’s assets or liabilities. These inputs are categorized into three broad levels. In certain cases, the inputs used to measure fair value may fall into different levels of the fair value hierarchy. In such cases, an investment’s level within the fair value hierarchy is based on the lowest level of input that is significant to the fair value measurement. The fund’s assessment of the significance of a particular input to the fair value measurement in its entirety requires judgment, and considers factors specific to the investment. Level 1 includes unadjusted quoted prices in active markets for identical assets or liabilities. Level 2 includes other significant observable market-based inputs (including quoted prices for similar securities, interest rates, prepayment speed, and credit risk). Level 3 includes unobservable inputs, which may include the adviser’s own assumptions in determining the fair value of investments. The following is a summary of the levels used as of December 31, 2014 in valuing the fund’s assets or liabilities:
| | | | | | | | | | | | | | | | |
| Investments at Value | | Level 1 | | | Level 2 | | | Level 3 | | | Total | |
| Equity Securities: | | | | | | | | | | | | | | | | |
United States | | | $440,360,541 | | | | $— | | | | $— | | | | $440,360,541 | |
Denmark | | | — | | | | 6,579,810 | | | | — | | | | 6,579,810 | |
Hong Kong | | | 2,892,929 | | | | — | | | | — | | | | 2,892,929 | |
Netherlands | | | 1,430,795 | | | | — | | | | — | | | | 1,430,795 | |
China | | | 348,712 | | | | — | | | | — | | | | 348,712 | |
| Mutual Funds | | | 4,374,909 | | | | — | | | | — | | | | 4,374,909 | |
| Total Investments | | | $449,407,886 | | | | $6,579,810 | | | | $— | | | | $455,987,696 | |
For further information regarding security characteristics, see the Portfolio of Investments.
Foreign Currency Translation – Purchases and sales of foreign investments, income, and expenses are converted into U.S. dollars based upon currency exchange rates prevailing on the respective dates of such transactions or on the reporting date for foreign denominated receivables and payables. Gains and losses attributable to foreign currency exchange rates on sales of securities are recorded for financial statement purposes as net realized gains and losses on investments. Gains and losses attributable to foreign exchange rate movements on receivables, payables, income and expenses are recorded for financial statement purposes as foreign currency transaction gains and losses. That portion of both realized and unrealized gains and losses on investments that results from fluctuations in foreign currency exchange rates is not separately disclosed.
Security Loans – Under its Securities Lending Agency Agreement with the fund, State Street Bank and Trust Company (“State Street”), as lending agent, loans the securities of the fund to certain qualified institutions (the “Borrowers”) approved by the fund. The loans are collateralized by cash and/or U.S. Treasury and federal agency obligations in an amount typically at least equal to the market value of the securities loaned. On loans collateralized by cash, the cash collateral is invested in a money market fund. The market value of the loaned securities is determined at the close of business of the fund and any additional required collateral is delivered to the fund on the next business day. State Street provides the fund with indemnification against Borrower default. In the event of Borrower default, State Street will for the benefit of the fund either purchase securities identical to those loaned or, when such purchase is commercially impracticable, pay the fund the market value of the loaned securities. In return, State Street assumes the fund’s rights to the related collateral. If the collateral value is less than the cost to purchase identical securities, State Street is responsible for the shortfall, but only to the extent that such shortfall is not due to a decline in collateral value resulting from collateral reinvestment for which the fund bears the risk of loss. At period end, the fund had investment securities on loan with a fair value of $1,754,776 and a related liability of $1,813,318 for cash collateral received on securities loaned, both of which are presented gross in the Statement of Assets and Liabilities. The collateral received on securities loaned exceeded the value of securities on loan at period end. The liability for cash collateral for securities loaned is carried at fair value, which is categorized as level 2 within the fair value hierarchy. A portion of the income generated upon investment of the collateral is remitted to the Borrowers, and the remainder is allocated between the fund and the lending agent. On loans collateralized by U.S. Treasury and/or federal agency obligations, a fee is received from the Borrower, and is allocated between the fund and the lending agent. Income from securities lending is included in “Interest” income in the Statement of Operations. The dividend and interest income earned on the securities loaned is accounted for in the same manner as other dividend and interest income.
Indemnifications – Under the fund’s organizational documents, its officers and Trustees may be indemnified against certain liabilities and expenses arising out of the performance of their duties to the fund. Additionally, in the normal course of business, the
16
MFS Mid Cap Growth Series
Notes to Financial Statements – continued
fund enters into agreements with service providers that may contain indemnification clauses. The fund’s maximum exposure under these agreements is unknown as this would involve future claims that may be made against the fund that have not yet occurred.
Investment Transactions and Income – Investment transactions are recorded on the trade date. Interest income is recorded on the accrual basis. Dividends received in cash are recorded on the ex-dividend date. Certain dividends from foreign securities will be recorded when the fund is informed of the dividend if such information is obtained subsequent to the ex-dividend date. Dividend and interest payments received in additional securities are recorded on the ex-dividend or ex-interest date in an amount equal to the value of the security on such date.
The fund may receive proceeds from litigation settlements. Any proceeds received from litigation involving portfolio holdings are reflected in the Statement of Operations in realized gain/loss if the security has been disposed of by the fund or in unrealized gain/loss if the security is still held by the fund. Any other proceeds from litigation not related to portfolio holdings are reflected as other income in the Statement of Operations.
Fees Paid Indirectly – The fund’s custody fee may be reduced according to an arrangement that measures the value of cash deposited with the custodian by the fund. This amount, for the year ended December 31, 2014, is shown as a reduction of total expenses in the Statement of Operations.
Tax Matters and Distributions – The fund intends to qualify as a regulated investment company, as defined under Subchapter M of the Internal Revenue Code, and to distribute all of its taxable income, including realized capital gains. As a result, no provision for federal income tax is required. The fund’s federal tax returns, when filed, will remain subject to examination by the Internal Revenue Service for a three year period. Management has analyzed the fund’s tax positions taken on federal and state tax returns for all open tax years and does not believe that there are any uncertain tax positions that require recognition of a tax liability. Foreign taxes, if any, have been accrued by the fund in the accompanying financial statements in accordance with the applicable foreign tax law. Foreign income taxes may be withheld by certain countries in which the fund invests. Additionally, capital gains realized by the fund on securities issued in or by certain foreign countries may be subject to capital gains tax imposed by those countries.
Distributions to shareholders are recorded on the ex-dividend date. Income and capital gain distributions are determined in accordance with income tax regulations, which may differ from U.S. generally accepted accounting principles. Certain capital accounts in the financial statements are periodically adjusted for permanent differences in order to reflect their tax character. These adjustments have no impact on net assets or net asset value per share. Temporary differences which arise from recognizing certain items of income, expense, gain or loss in different periods for financial statement and tax purposes will reverse at some time in the future. Distributions in excess of net investment income or net realized gains are temporary overdistributions for financial statement purposes resulting from differences in the recognition or classification of income or distributions for financial statement and tax purposes.
Book/tax differences primarily relate to write-off of capital loss carryforwards and wash sale loss deferrals.
The tax character of distributions declared to shareholders for the last two fiscal years is as follows:
| | | | | | | | |
| | | 12/31/14 | | | 12/31/13 | |
| Ordinary Income (including any short-term capital gains) | | | $27,850,486 | | | | $— | |
| Long-term capital gains | | | 22,848,104 | | | | 1,768,591 | |
| Total distributions | | | $50,698,590 | | | | $1,768,591 | |
The federal tax cost and the tax basis components of distributable earnings were as follows:
| | | | |
| As of 12/31/14 | | | | |
| Cost of investments | | | $336,091,688 | |
| Gross appreciation | | | 126,929,994 | |
| Gross depreciation | | | (7,033,986 | ) |
| Net unrealized appreciation (depreciation) | | | $119,896,008 | |
| Undistributed ordinary income | | | 11,579,972 | |
| Undistributed long-term capital gain | | | 30,654,648 | |
| Capital loss carryforwards | | | (1,876,646 | ) |
| Other temporary differences | | | (343 | ) |
Under the Regulated Investment Company Modernization Act of 2010 (the “Act”), net capital losses recognized for fund fiscal years beginning after December 31, 2010 may be carried forward indefinitely, and their character is retained as short-term and/or long-term losses (“post-enactment losses”). Previously, net capital losses were carried forward for eight years and treated as short-term losses (“pre-enactment losses”). As a transition rule, the Act requires that all post-enactment net capital losses be used before pre-enactment net capital losses.
17
MFS Mid Cap Growth Series
Notes to Financial Statements – continued
As of December 31, 2014, the fund had capital loss carryforwards available to offset future realized gains. Such pre-enactment losses expire as follows:
The availability of $1,876,646 of the capital loss carryforwards, which were acquired on August 17, 2012 in connection with the MFS Mid Cap Growth Portfolio merger, may be limited in a given year.
Multiple Classes of Shares of Beneficial Interest – The fund offers multiple classes of shares, which differ in their respective distribution and/or service fees. The fund’s income, realized and unrealized gain (loss), and common expenses are allocated to shareholders based on the daily net assets of each class. Dividends are declared separately for each class. Differences in per share dividend rates are generally due to differences in separate class expenses. The fund’s distributions declared to shareholders as reported in the Statements of Changes in Net Assets are presented by class as follows:
| | | | | | | | |
| | | From net realized gain on
investments | |
| | | Year ended
12/31/14 | | | Year ended
12/31/13 | |
| Initial Class | | | $40,428,769 | | | | $1,438,939 | |
| Service Class | | | 10,269,821 | | | | 329,652 | |
| Total | | | $50,698,590 | | | | $1,768,591 | |
| (3) | | Transactions with Affiliates |
Investment Adviser – The fund has an investment advisory agreement with MFS to provide overall investment management and related administrative services and facilities to the fund. The management fee is computed daily and paid monthly at the following annual rates:
| | | | |
| First $1 billion of average daily net assets | | | 0.75% | |
| Average daily net assets in excess of $1 billion | | | 0.70% | |
MFS has agreed in writing to reduce its management fee by a specified amount if certain MFS mutual fund assets exceed thresholds agreed to by MFS and the fund’s Board of Trustees. For the year ended December 31, 2014, this management fee reduction amounted to $21,466, which is included in the reduction of total expenses in the Statement of Operations. The management fee incurred for the year ended December 31, 2014 was equivalent to an annual effective rate of 0.75% of the fund’s average daily net assets.
Distributor – MFS Fund Distributors, Inc. (MFD), a wholly-owned subsidiary of MFS, is the distributor of shares of the fund. The Trustees have adopted a distribution plan for the Service Class shares pursuant to Rule 12b-1 under the Investment Company Act of 1940.
The fund’s distribution plan provides that the fund will pay MFD distribution and/or service fees equal to 0.25% per annum of its average daily net assets attributable to Service Class shares as partial consideration for services performed and expenses incurred by MFD and financial intermediaries (including participating insurance companies that invest in the fund to fund variable annuity and variable life insurance contracts, sponsors of qualified retirement and pension plans that invest in the fund, and affiliates of these participating insurance companies and plan sponsors) in connection with the sale and distribution of the Service Class shares. MFD may subsequently pay all, or a portion, of the distribution and/or service fees to financial intermediaries.
Shareholder Servicing Agent – MFS Service Center, Inc. (MFSC), a wholly-owned subsidiary of MFS, receives a fee from the fund for its services as shareholder servicing agent. For the year ended December 31, 2014, the fee was $25,310, which equated to 0.0054% annually of the fund’s average daily net assets. MFSC also receives payment from the fund for out-of-pocket expenses paid by MFSC on behalf of the fund. For the year ended December 31, 2014, these costs amounted to $518.
Administrator – MFS provides certain financial, legal, shareholder communications, compliance, and other administrative services to the fund. Under an administrative services agreement, the fund partially reimburses MFS the costs incurred to provide these services. The fund is charged an annual fixed amount of $17,500 plus a fee based on average daily net assets. The administrative services fee incurred for the year ended December 31, 2014 was equivalent to an annual effective rate of 0.0157% of the fund’s average daily net assets.
Trustees’ and Officers’ Compensation – The fund pays compensation to independent Trustees in the form of a retainer, attendance fees, and additional compensation to Board and Committee chairpersons. The fund does not pay compensation directly to Trustees or officers of the fund who are also officers of the investment adviser, all of whom receive remuneration for their services to the fund from MFS. Certain officers and Trustees of the fund are officers or directors of MFS, MFD, and MFSC.
Other – Effective November 1, 2014, this fund and certain other funds managed by MFS (the funds) have entered into a service agreement (the ISO Agreement) which provides for payment of fees solely by the funds to Tarantino LLC in return for the provision
18
MFS Mid Cap Growth Series
Notes to Financial Statements – continued
of services of an Independent Senior Officer (ISO) for the funds. Frank L. Tarantino serves as the ISO and is an officer of the funds and the sole member of Tarantino LLC. The funds can terminate the ISO Agreement with Tarantino LLC at any time under the terms of the ISO Agreement. Prior to November 1, 2014, the funds had entered into services agreements (the Compliance Officer Agreements) which provided for payment of fees by the funds to Tarantino LLC and Griffin Compliance LLC in return for the provision of services of an Independent Chief Compliance Officer (ICCO) and Assistant ICCO, respectively, for the funds. Prior to November 1, 2014, Frank L. Tarantino served as the ICCO. Effective October 31, 2014, Mr. Tarantino resigned as ICCO and the Compliance Officer Agreement between the funds and Tarantino LLC was terminated. Prior to June 1, 2014, Robyn L. Griffin served as the Assistant ICCO and was an officer of the funds. Ms. Griffin is the sole member of Griffin Compliance LLC. Effective May 31, 2014, Ms. Griffin resigned as Assistant ICCO and the Compliance Officer Agreement between the funds and Griffin Compliance LLC was terminated. For the year ended December 31, 2014, the aggregate fees paid by the fund under these agreements were $2,415 and are included in “Miscellaneous” expense in the Statement of Operations. MFS had agreed to reimburse the fund for a portion of the payments made by the fund for the services under the Compliance Officer Agreements in the amount of $817, which is included in the reduction of total expenses in the Statement of Operations. Additionally, MFS has agreed to bear all expenses associated with office space, other administrative support, and supplies provided to the ICCO, Assistant ICCO, and ISO.
The fund invests in the MFS Institutional Money Market Portfolio which is managed by MFS and seeks current income consistent with preservation of capital and liquidity. Income earned on this investment is included in “Dividends from underlying affiliated funds” in the Statement of Operations. This money market fund does not pay a management fee to MFS.
For the year ended December 31, 2014, purchases and sales of investments, other than short-term obligations, aggregated $226,045,885 and $293,162,515, respectively.
| (5) | | Shares of Beneficial Interest |
The fund’s Declaration of Trust permits the Trustees to issue an unlimited number of full and fractional shares of beneficial interest. Transactions in fund shares were as follows:
| | | | | | | | | | | | | | | | |
| | | Year ended 12/31/14 | | | Year ended 12/31/13 | |
| | | Shares | | | Amount | | | Shares | | | Amount | |
| Shares sold | | | | | | | | | | | | | | | | |
Initial Class | | | 1,604,650 | | | | $14,214,872 | | | | 1,666,825 | | | | $12,309,235 | |
Service Class | | | 1,466,651 | | | | 12,683,994 | | | | 1,304,357 | | | | 10,038,587 | |
| | | 3,071,301 | | | | $26,898,866 | | | | 2,971,182 | | | | $22,347,822 | |
| Shares issued to shareholders in reinvestment of distributions | | | | | | | | | | | | | | | | |
Initial Class | | | 4,756,326 | | | | $40,428,769 | | | | 181,914 | | | | $1,438,939 | |
Service Class | | | 1,253,946 | | | | 10,269,821 | | | | 42,979 | | | | 329,652 | |
| | | 6,010,272 | | | | $50,698,590 | | | | 224,893 | | | | $1,768,591 | |
| Shares reacquired | | | | | | | | | | | | | | | | |
Initial Class | | | (8,510,344 | ) | | | $(75,620,122 | ) | | | (12,944,518 | ) | | | $(100,069,612 | ) |
Service Class | | | (2,594,228 | ) | | | (22,028,477 | ) | | | (2,973,658 | ) | | | (22,299,307 | ) |
| | | (11,104,572 | ) | | | $(97,648,599 | ) | | | (15,918,176 | ) | | | $(122,368,919 | ) |
| Net change | | | | | | | | | | | | | | | | |
Initial Class | | | (2,149,368 | ) | | | $(20,976,481 | ) | | | (11,095,779 | ) | | | $(86,321,438 | ) |
Service Class | | | 126,369 | | | | 925,338 | | | | (1,626,322 | ) | | | (11,931,068 | ) |
| | | (2,022,999 | ) | | | $(20,051,143 | ) | | | (12,722,101 | ) | | | $(98,252,506 | ) |
The fund is one of several mutual funds in which certain MFS funds may invest. The MFS funds do not invest in the underlying funds for the purpose of exercising management or control. At the end of the period, the MFS Moderate Allocation Portfolio, the MFS Growth Allocation Portfolio, and the MFS Conservative Allocation Portfolio were the owners of record of approximately 33%, 11%, and 7%, respectively, of the value of outstanding voting shares of the fund.
The fund and certain other funds managed by MFS participate in a $1.1 billion unsecured committed line of credit, subject to a $1 billion sublimit, provided by a syndication of banks under a credit agreement. Borrowings may be made for temporary financing needs. Interest is charged to each fund, based on its borrowings, generally at a rate equal to the higher of the Federal Reserve funds rate or one month LIBOR plus an agreed upon spread. A commitment fee, based on the average daily, unused portion of the committed line of credit, is allocated among the participating funds at the end of each calendar quarter. In addition, the fund and other funds managed by MFS have established unsecured uncommitted borrowing arrangements with certain banks for temporary
19
MFS Mid Cap Growth Series
Notes to Financial Statements – continued
financing needs. Interest is charged to each fund, based on its borrowings, at a rate equal to the Federal Reserve funds rate plus an agreed upon spread. For the year ended December 31, 2014, the fund’s commitment fee and interest expense were $1,716 and $0, respectively, and are included in “Miscellaneous” expense in the Statement of Operations.
| (7) | | Transactions in Underlying Affiliated Funds – Affiliated Issuers |
An affiliated issuer may be considered one in which the fund owns 5% or more of the outstanding voting securities, or a company which is under common control. For the purposes of this report, the fund assumes the following to be an affiliated issuer:
| | | | | | | | | | | | | | | | |
| Underlying Affiliated Fund | | Beginning
Shares/Par
Amount | | | Acquisitions
Shares/Par
Amount | | | Dispositions
Shares/Par
Amount | | | Ending
Shares/Par
Amount | |
| MFS Institutional Money Market Portfolio | | | 5,406,640 | | | | 102,716,454 | | | | (105,561,503 | ) | | | 2,561,591 | |
| | | | |
| Underlying Affiliated Fund | | Realized
Gain (Loss) | | | Capital Gain
Distributions | | | Dividend
Income | | | Ending
Value | |
| MFS Institutional Money Market Portfolio | | | $— | | | | $— | | | | $5,588 | | | | $2,561,591 | |
20
MFS Mid Cap Growth Series
REPORT OF INDEPENDENT REGISTERED PUBLIC ACCOUNTING FIRM
To the Board of Trustees of MFS Variable Insurance Trust and the Shareholders of
MFS Mid Cap Growth Series:
We have audited the accompanying statement of assets and liabilities, including the portfolio of investments, of MFS Mid Cap Growth Series (one of the series of MFS Variable Insurance Trust) (the “Fund”) as of December 31, 2014, and the related statement of operations for the year then ended, the statements of changes in net assets for each of the two years in the period then ended, and the financial highlights for each of the five years in the period then ended. These financial statements and financial highlights are the responsibility of the Fund’s management. Our responsibility is to express an opinion on these financial statements and financial highlights based on our audits.
We conducted our audits in accordance with the standards of the Public Company Accounting Oversight Board (United States). Those standards require that we plan and perform the audit to obtain reasonable assurance about whether the financial statements and financial highlights are free of material misstatement. The Fund is not required to have, nor were we engaged to perform, an audit of its internal control over financial reporting. Our audits included consideration of internal control over financial reporting as a basis for designing audit procedures that are appropriate in the circumstances, but not for the purpose of expressing an opinion on the effectiveness of the Fund’s internal control over financial reporting. Accordingly, we express no such opinion. An audit also includes examining, on a test basis, evidence supporting the amounts and disclosures in the financial statements, assessing the accounting principles used and significant estimates made by management, as well as evaluating the overall financial statement presentation. Our procedures included confirmation of securities owned as of December 31, 2014, by correspondence with the custodian and brokers; where replies were not received from brokers, we performed other auditing procedures. We believe that our audits provide a reasonable basis for our opinion.
In our opinion, the financial statements and financial highlights referred to above present fairly, in all material respects, the financial position of MFS Mid Cap Growth Series as of December 31, 2014, the results of its operations for the year then ended, the changes in its net assets for each of the two years in the period then ended, and the financial highlights for each of the five years in the period then ended, in conformity with accounting principles generally accepted in the United States of America.
DELOITTE & TOUCHE LLP
Boston, Massachusetts
February 13, 2015
21
MFS Mid Cap Growth Series
TRUSTEES AND OFFICERS – IDENTIFICATION AND BACKGROUND
The Trustees and Officers of the Trust, as of February 1, 2015, are listed below, together with their principal occupations during the past five years. (Their titles may have varied during that period.) The address of each Trustee and Officer is 111 Huntington Avenue, Boston, Massachusetts 02199-7618.
| | | | | | | | |
Name, Age | | Position(s)
Held with Fund | | Trustee/Officer
Since (h) | | Principal Occupations
During the Past Five Years | | Other Directorships (j) |
| INTERESTED TRUSTEES |
Robert J. Manning (k) (age 51) | | Trustee | | February 2004 | | Massachusetts Financial Services Company, Chairman, Co-Chief Executive Officer and Director; President (until 2009); Chief Investment Officer (until 2010) | | N/A |
| | | | |
Robin A. Stelmach (k) (age 53) | | Trustee and President | | January 2014 | | Massachusetts Financial Services Company, Executive Vice President and Chief Operating Officer | | N/A |
| | | |
| INDEPENDENT TRUSTEES | | | | | | |
David H. Gunning (age 72) | | Trustee and Chair of Trustees | | January 2004 | | Private investor | | Lincoln Electric Holdings, Inc. (welding equipment manufacturer), Director; Development Alternatives, Inc. (consulting), Director/Non-Executive Chairman |
| | | | |
Steven E. Buller (age 63) | | Trustee | | February 2014 | | Chairman, Financial Accounting Standards Advisory Council; Standing Advisory Group, Public Company Accounting Oversight Board, Member (until 2014); BlackRock, Inc. (investment management), Managing Director (until 2014), BlackRock Finco UK (investment management), Director (until 2014) | | N/A |
| | | | |
Robert E. Butler (age 73) | | Trustee | | January 2006 | | Consultant – investment company industry regulatory and compliance matters | | N/A |
| | | | |
Maureen R. Goldfarb (age 59) | | Trustee | | January 2009 | | Private investor | | N/A |
| | | | |
William R. Gutow (age 73) | | Trustee | | December 1993 | | Private investor and real estate consultant; Capitol Entertainment Management Company (video franchise), Vice Chairman | | Texas Donuts (donut franchise), Vice Chairman (until 2010) |
| | | | |
Michael Hegarty (age 70) | | Trustee | | December 2004 | | Private investor | | Brookfield Office Properties, Inc. (real estate), Director; Rouse Properties Inc. (real estate), Director; Capmark Financial Group Inc. (real estate), Director |
| | | | |
John P. Kavanaugh (age 60) | | Trustee | | January 2009 | | Private investor | | N/A |
| | | | |
Maryanne L. Roepke (age 58) | | Trustee | | May 2014 | | American Century Investments (investment management), Senior Vice President and Chief Compliance Officer (until 2014) | | N/A |
| | | | |
Laurie J. Thomsen (age 57) | | Trustee | | March 2005 | | Private investor; New Profit, Inc. (venture philanthropy), Executive Partner (until 2010) | | The Travelers Companies (insurance), Director |
| | | | |
Robert W. Uek (age 73) | | Trustee | | January 2006 | | Consultant to investment company industry | | N/A |
| | | | |
| OFFICERS | | | | | | | | |
Christopher R. Bohane (k) (age 41) | | Assistant Secretary and Assistant Clerk | | July 2005 | | Massachusetts Financial Services Company, Vice President and Assistant General Counsel | | N/A |
| | | | |
Kino Clark (k) (age 46) | | Assistant Treasurer | | January 2012 | | Massachusetts Financial Services Company, Vice President | | N/A |
| | | | |
Thomas H. Connors (k) (age 55) | | Assistant Secretary and Assistant Clerk | | September 2012 | | Massachusetts Financial Services Company, Vice President and Senior Counsel; Deutsche Investment Management Americas Inc. (financial service provider), Director and Senior Counsel (until 2012) | | N/A |
22
MFS Mid Cap Growth Series
Trustees and Officers – continued
| | | | | | | | |
Name, Age | | Position(s)
Held with Fund | | Trustee/Officer
Since (h) | | Principal Occupations
During the Past Five Years | | Other Directorships (j) |
Ethan D. Corey (k) (age 51) | | Assistant
Secretary and Assistant Clerk | | July 2005 | | Massachusetts Financial Services Company, Senior Vice President and Associate General Counsel | | N/A |
| | | | |
David L. DiLorenzo (k) (age 46) | | Treasurer | | July 2005 | | Massachusetts Financial Services Company, Senior Vice President | | N/A |
| | | | |
Timothy M. Fagan (k) (age 46) | | Chief Compliance Officer | | November 2014 | | Massachusetts Financial Services Company, Chief Compliance Officer; Vice President and Senior Counsel (until 2012) | | N/A |
| | | | |
Brian E. Langenfeld (k) (age 41) | | Assistant
Secretary and Assistant Clerk | | June 2006 | | Massachusetts Financial Services Company, Vice President and Senior Counsel | | N/A |
| | | | |
Susan S. Newton (k) (age 64) | | Assistant
Secretary and Assistant Clerk | | May 2005 | | Massachusetts Financial Services Company, Senior Vice President and Associate General Counsel | | N/A |
| | | | |
Susan A. Pereira (k) (age 44) | | Assistant
Secretary and Assistant Clerk | | July 2005 | | Massachusetts Financial Services Company, Vice President and Senior Counsel | | N/A |
| | | | |
Kasey L. Phillips (k) (age 44) | | Assistant Treasurer | | September 2012 | | Massachusetts Financial Services Company, Vice President; Wells Fargo Funds Management, LLC, Senior Vice President, Fund Treasurer (until 2012) | | N/A |
| | | | |
Mark N. Polebaum (k) (age 62) | | Secretary and
Clerk | | January 2006 | | Massachusetts Financial Services Company, Executive Vice President, General Counsel and Secretary | | N/A |
| | | | |
Matthew A. Stowe (k) (age 40) | | Assistant Secretary and Assistant Clerk | | October 2014 | | Massachusetts Financial Services Company, Vice President and Senior Counsel | | N/A |
| | | | |
Frank L. Tarantino (age 70) | | Independent
Senior Officer | | June 2004 | | Tarantino LLC (provider of compliance services), Principal | | N/A |
| | | | |
Richard S. Weitzel (k) (age 44) | | Assistant Secretary and Assistant Clerk | | October 2007 | | Massachusetts Financial Services Company, Senior Vice President and Associate General Counsel | | N/A |
| | | | |
James O. Yost (k) (age 54) | | Deputy Treasurer | | September 1990 | | Massachusetts Financial Services Company, Senior Vice President | | N/A |
| (h) | Date first appointed to serve as Trustee/officer of an MFS Fund. Each Trustee has served continuously since appointment unless indicated otherwise. For the period from December 15, 2004 until February 22, 2005, Mr. Manning served as Advisory Trustee. Prior to January 2012, Messrs. DiLorenzo and Yost served as Assistant Treasurers of the Funds. Ms. Stelmach was appointed as President of the Funds as of October 1, 2014. |
| (j) | Directorships or trusteeships of companies required to report to the Securities and Exchange Commission (i.e., “public companies”). |
| (k) | “Interested person” of the Trust within the meaning of the Investment Company Act of 1940 (referred to as the 1940 Act), which is the principal federal law governing investment companies like the fund, as a result of a position with MFS. The address of MFS is 111 Huntington Avenue, Boston, Massachusetts 02199-7618. |
Each Trustee (except Ms. Stelmach, Mr. Buller and Ms. Roepke) has been elected by shareholders and each Trustee and officer holds office until his or her successor is chosen and qualified or until his or her earlier death, resignation, retirement or removal. The Trust does not hold annual meetings for the purpose of electing Trustees, and Trustees are not elected for fixed terms. Messrs. Butler, Kavanaugh, Uek and Mses. Thomsen and Roepke are members of the Trust’s Audit Committee.
Each of the Fund’s Trustees and officers holds comparable positions with certain other funds of which MFS or a subsidiary is the investment adviser or distributor, and, in the case of the officers, with certain affiliates of MFS. As of February 1, 2015, the Trustees served as board members of 135 funds within the MFS Family of Funds.
23
MFS Mid Cap Growth Series
Trustees and Officers – continued
The Statement of Additional Information for the Fund includes further information about the Trustees and is available without charge upon request by calling 1-800-225-2606.
| | |
Investment Adviser Massachusetts Financial Services Company 111 Huntington Avenue Boston, MA 02199-7618 | | Custodian State Street Bank and Trust Company 1 Lincoln Street Boston, MA 02111-2900 |
Distributor MFS Fund Distributors, Inc. 111 Huntington Avenue Boston, MA 02199-7618 | | Independent Registered Public Accounting Firm Deloitte & Touche LLP 200 Berkeley Street Boston, MA 02116 |
Portfolio Managers Eric Fischman Paul Gordon Matthew Sabel | | |
24
MFS Mid Cap Growth Series
BOARD REVIEW OF INVESTMENT ADVISORY AGREEMENT
The Investment Company Act of 1940 requires that both the full Board of Trustees and a majority of the non-interested (“independent”) Trustees, voting separately, annually approve the continuation of the Fund’s investment advisory agreement with MFS. The Trustees consider matters bearing on the Fund and its advisory arrangements at their meetings throughout the year, including a review of performance data at each regular meeting. In addition, the independent Trustees met several times over the course of three months beginning in May and ending in July, 2014 (“contract review meetings”) for the specific purpose of considering whether to approve the continuation of the investment advisory agreement for the Fund and the other investment companies that the Board oversees (the “MFS Funds”). The independent Trustees were assisted in their evaluation of the Fund’s investment advisory agreement by independent legal counsel, from whom they received separate legal advice and with whom they met separately from MFS during various contract review meetings. The independent Trustees were also assisted in this process by the MFS Funds’ Independent Chief Compliance Officer, a full-time senior officer appointed by and reporting to the independent Trustees.
In connection with their deliberations regarding the continuation of the investment advisory agreement, the Trustees, including the independent Trustees, considered such information and factors as they believed, in light of the legal advice furnished to them and their own business judgment, to be relevant. The investment advisory agreement for the Fund was considered separately, although the Trustees also took into account the common interests of all MFS Funds in their review. As described below, the Trustees considered the nature, quality, and extent of the various investment advisory, administrative, and shareholder services performed by MFS under the existing investment advisory agreement and other arrangements with the Fund.
In connection with their contract review meetings, the Trustees received and relied upon materials that included, among other items: (i) information provided by Lipper Inc., an independent third party, on the investment performance of the Fund for various time periods ended December 31, 2013 and the investment performance of a group of funds with substantially similar investment classifications/objectives (the “Lipper performance universe”), (ii) information provided by Lipper Inc. on the Fund’s advisory fees and other expenses and the advisory fees and other expenses of comparable funds identified by Lipper Inc. (the “Lipper expense group”), (iii) information provided by MFS on the advisory fees of comparable portfolios of other clients of MFS, including institutional separate accounts and other clients, (iv) information as to whether and to what extent applicable expense waivers, reimbursements or fee “breakpoints” are observed for the Fund, (v) information regarding MFS’ financial results and financial condition, including MFS’ and certain of its affiliates’ estimated profitability from services performed for the Fund and the MFS Funds as a whole, and compared to MFS’ institutional business, (vi) MFS’ views regarding the outlook for the mutual fund industry and the strategic business plans of MFS, (vii) descriptions of various functions performed by MFS for the Funds, such as compliance monitoring and portfolio trading practices, and (viii) information regarding the overall organization of MFS, including information about MFS’ senior management and other personnel providing investment advisory, administrative and other services to the Fund and the other MFS Funds. The comparative performance, fee and expense information prepared and provided by Lipper Inc. was not independently verified and the independent Trustees did not independently verify any information provided to them by MFS.
The Trustees’ conclusion as to the continuation of the investment advisory agreement was based on a comprehensive consideration of all information provided to the Trustees and not the result of any single factor. Some of the factors that figured particularly in the Trustees’ deliberations are described below, although individual Trustees may have evaluated the information presented differently from one another, giving different weights to various factors. It is also important to recognize that the fee arrangements for the Fund and other MFS Funds are the result of years of review and discussion between the independent Trustees and MFS, that certain aspects of such arrangements may receive greater scrutiny in some years than in others, and that the Trustees’ conclusions may be based, in part, on their consideration of these same arrangements during the course of the year and in prior years.
Based on information provided by Lipper Inc. and MFS, the Trustees reviewed the Fund’s total return investment performance as well as the performance of peer groups of funds over various time periods. The Trustees placed particular emphasis on the total return performance of the Fund’s Initial Class shares in comparison to the performance of funds in its Lipper performance universe over the three-year period ended December 31, 2013, which the Trustees believed was a long enough period to reflect differing market conditions. The total return performance of the Fund’s Initial Class shares was in the 3rd quintile relative to the other funds in the universe for this three-year period (the 1st quintile being the best performers and the 5th quintile being the worst performers). The total return performance of the Fund’s Initial Class shares was in the 2nd quintile for the one-year period and the 3rd quintile for the five-year period ended December 31, 2013 relative to the Lipper performance universe. Because of the passage of time, these performance results may differ from the performance results for more recent periods, including those shown elsewhere in this report.
In the course of their deliberations, the Trustees took into account information provided by MFS in connection with the contract review meetings, as well as during investment review meetings conducted with portfolio management personnel during the course of the year regarding the Fund’s performance. After reviewing these and related factors, the Trustees concluded, within the context of their overall conclusions regarding the investment advisory agreement, that they were satisfied with MFS’ responses and efforts relating to investment performance.
25
MFS Mid Cap Growth Series
Board Review of Investment Advisory Agreement – continued
In assessing the reasonableness of the Fund’s advisory fee, the Trustees considered, among other information, the Fund’s advisory fee and the total expense ratio of the Fund’s Initial Class shares as a percentage of average daily net assets and the advisory fee and total expense ratios of peer groups of funds based on information provided by Lipper Inc. The Trustees considered that, according to the Lipper data (which takes into account any fee reductions or expense limitations that were in effect during the Fund’s last fiscal year), the Fund’s effective advisory fee rate was approximately at the Lipper expense group median and the Fund’s total expense ratio was lower than the Lipper expense group median.
The Trustees also considered the advisory fees charged by MFS to any comparable institutional accounts. In comparing these fees, the Trustees considered information provided by MFS as to the generally broader scope of services provided by MFS to the Fund in comparison to institutional accounts, the higher demands placed on MFS’ investment personnel and trading infrastructure as a result of the daily cash in-flows and out-flows of the Fund, and the impact on MFS and expenses associated with the more extensive regulatory regime to which the Fund is subject in comparison to institutional accounts.
The Trustees also considered whether the Fund may benefit from any economies of scale in the management of the Fund in the event of growth in assets of the Fund and/or growth in assets of the MFS Funds as a whole. They noted that the Fund’s advisory fee rate schedule is subject to a contractual breakpoint that reduces the Fund’s advisory fee rate on average daily net assets over $1 billion. The Trustees also noted that MFS has agreed in writing to waive a portion of the management fees of certain MFS Funds, including the Fund, if the total combined assets of certain funds within the MFS Funds’ complex increase above agreed upon thresholds (the “group fee waiver”), enabling the Fund’s shareholders to share in the benefits from any economies of scale at the complex level. The group fee waiver is reviewed and renewed annually between the Board and MFS. The Trustees concluded that the breakpoint and the group fee waiver were sufficient to allow the Fund to benefit from economies of scale as its assets and overall complex assets grow.
The Trustees also considered information prepared by MFS relating to MFS’ costs and profits with respect to the Fund, the MFS Funds considered as a group, and other investment companies and accounts advised by MFS, as well as MFS’ methodologies used to determine and allocate its costs to the MFS Funds, the Fund and other accounts and products for purposes of estimating profitability.
After reviewing these and other factors described herein, the Trustees concluded, within the context of their overall conclusions regarding the investment advisory agreement, that the advisory fees charged to the Fund represent reasonable compensation in light of the services being provided by MFS to the Fund.
In addition, the Trustees considered MFS’ resources and related efforts to continue to retain, attract and motivate capable personnel to serve the Fund. The Trustees also considered current and developing conditions in the financial services industry, including the presence of large and well-capitalized companies which are spending, and appear to be prepared to continue to spend, substantial sums to engage personnel and to provide services to competing investment companies. In this regard, the Trustees also considered the financial resources of MFS and its ultimate parent, Sun Life Financial Inc. The Trustees also considered the advantages and possible disadvantages to the Fund of having an adviser that also serves other investment companies as well as other accounts.
The Trustees also considered the nature, quality, cost, and extent of administrative, transfer agency, and distribution services provided to the Fund by MFS and its affiliates under agreements and plans other than the investment advisory agreement, including any 12b-1 fees the Fund pays to MFS Fund Distributors, Inc., an affiliate of MFS. The Trustees also considered the nature, extent and quality of certain other services MFS performs or arranges for on the Fund’s behalf, which may include securities lending programs, directed expense payment programs, class action recovery programs, and MFS’ interaction with third-party service providers, principally custodians and sub-custodians. The Trustees concluded that the various non-advisory services provided by MFS and its affiliates on behalf of the Fund were satisfactory.
The Trustees also considered benefits to MFS from the use of the Fund’s portfolio brokerage commissions, if applicable, to pay for investment research and various other factors. Additionally, the Trustees considered so-called “fall-out benefits” to MFS such as reputational value derived from serving as investment manager to the Fund.
Based on their evaluation of factors that they deemed to be material, including those factors described above, the Board of Trustees, including the independent Trustees, concluded that the Fund’s investment advisory agreement with MFS should be continued for an additional one-year period, commencing August 1, 2014.
26
MFS Mid Cap Growth Series
PROXY VOTING POLICIES AND INFORMATION
MFS votes proxies on behalf of the fund pursuant to proxy voting policies and procedures that are available without charge, upon request, by calling 1-800-225-2606, by visiting the Proxy Voting section of mfs.com or by visiting the SEC’s Web site at http://www.sec.gov.
Information regarding how the fund voted proxies relating to portfolio securities during the most recent twelve-month period ended June 30 is available without charge by visiting the Proxy Voting section of mfs.com or by visiting the SEC’s Web site at http://www.sec.gov.
QUARTERLY PORTFOLIO DISCLOSURE
The fund will file a complete schedule of portfolio holdings with the Securities and Exchange Commission (the Commission) for the first and third quarters of each fiscal year on Form N-Q. The fund’s Form N-Q is available on the EDGAR database on the Commission’s Internet Web site at http://www.sec.gov, and may be reviewed and copied at the:
Public Reference Room
Securities and Exchange Commission
100 F Street, NE, Room 1580
Washington, D.C. 20549
Information on the operation of the Public Reference Room may be obtained by calling the Commission at 1-800-SEC-0330. Copies of the fund’s Form N-Q also may be obtained, upon payment of a duplicating fee, by electronic request at the following e-mail address: publicinfo@sec.gov or by writing the Public Reference Section at the above address.
FURTHER INFORMATION
From time to time, MFS may post important information about the fund or the MFS funds on the MFS web site (mfs.com). This information is available by visiting the “Market Commentary” and “Announcements” sub sections in the “Market Outlooks” section of mfs.com or by clicking on the fund’s name under “Variable Insurance Portfolios — VIT” in the “Products” section of mfs.com.
FEDERAL TAX INFORMATION (unaudited)
The following information is provided pursuant to provisions of the Internal Revenue Code.
The fund designates $25,133,000 as capital gain dividends paid during the fiscal year.
For corporate shareholders, 7.15% of the ordinary income dividends paid during the fiscal year qualify for the corporate dividends received deduction.
27
rev. 3/11
| | | | |
| FACTS | | WHAT DOES MFS DO WITH YOUR
PERSONAL INFORMATION? | |  |
| | |
| Why? | | Financial companies choose how they share your personal information. Federal law gives consumers the right to limit some but not all sharing. Federal law also requires us to tell you how we collect, share, and protect your personal information. Please read this notice carefully to understand what we do. |
| | |
| What? | | The types of personal information we collect and share depend on the product or service you have with us. This information can include: • Social Security number and account balances • Account transactions and transaction history • Checking account information and wire transfer instructions When you are no longer our customer, we continue to share your information as described in this notice. |
| | |
| How? | | All financial companies need to share customers’ personal information to run their everyday business. In the section below, we list the reasons financial companies can share their customers’ personal information; the reasons MFS chooses to share; and whether you can limit this sharing. |
| | | | |
Reasons we can share your
personal information | | Does MFS share? | | Can you limit this
sharing? |
For our everyday business purposes – such as to process your transactions, maintain your account(s), respond to court orders and legal investigations, or report to credit bureaus | | Yes | | No |
For our marketing purposes – to offer our products and services to you | | No | | We don’t share |
| For joint marketing with other financial companies | | No | | We don’t share |
For our affiliates’ everyday business purposes – information about your transactions and experiences | | No | | We don’t share |
For our affiliates’ everyday business purposes – information about your creditworthiness | | No | | We don’t share |
| For nonaffiliates to market to you | | No | | We don’t share |
| | |
| Questions? | | Call 800-225-2606 or go to mfs.com. |
28
| | |
| Who we are |
| Who is providing this notice? | | MFS Funds, MFS Investment Management, MFS Institutional Advisors, Inc., MFS Fund Distributors, Inc., MFS Heritage Trust Company, and MFS Service Center, Inc. |
| | |
| What we do |
| How does MFS protect my personal information? | | To protect your personal information from unauthorized access and use, we use security measures that comply with federal law. These measures include procedural, electronic, and physical safeguards for the protection of the personal information we collect about you. |
How does MFS
collect my personal information? | | We collect your personal information, for example, when you • open an account or provide account information • direct us to buy securities or direct us to sell your securities • make a wire transfer We also collect your personal information from others, such as credit bureaus, affiliates and other companies. |
| Why can’t I limit all sharing? | | Federal law gives you the right to limit only • sharing for affiliates’ everyday business purposes – information about your creditworthiness • affiliates from using your information to market to you • sharing for nonaffiliates to market to you State laws and individual companies may give you additional rights to limit sharing. |
| | |
| Definitions |
| Affiliates | | Companies related by common ownership or control. They can be financial and nonfinancial companies. •MFS does not share personal information with affiliates, except for everyday business purposes as described on page one of this notice. |
| Nonaffiliates | | Companies not related by common ownership or control. They can be financial and nonfinancial companies. •MFS does not share with nonaffiliates so they can market to you. |
| Joint Marketing | | A formal agreement between nonaffiliated financial companies that together market financial products or services to you. •MFS doesn’t jointly market. |
| | |
| Other important information |
| If you own an MFS product or receive an MFS service in the name of a third party such as a bank or broker-dealer, their privacy policy may apply to you instead of ours. |
29
ANNUAL REPORT
December 31, 2014

MFS® NEW DISCOVERY SERIES
MFS® Variable Insurance Trust

VND-ANN
MFS® NEW DISCOVERY SERIES
CONTENTS
The report is prepared for the general information of contract owners. It is authorized for distribution to prospective investors only when preceded or accompanied by a current prospectus.
NOT FDIC INSURED Ÿ MAY LOSE VALUE Ÿ NO BANK OR CREDIT UNION GUARANTEE Ÿ NOT A DEPOSIT Ÿ NOT INSURED BY ANY FEDERAL GOVERNMENT AGENCY OR NCUA/NCUSIF
MFS New Discovery Series
LETTER FROM THE CHAIRMAN

Dear Contract Owners:
As 2015 begins, sharply lower oil prices are reshaping the global economy, adding to deflationary pressures in the eurozone and exacerbating challenges faced by oil exporters such as Russia. The U.S. economy stands on firmer ground, having expanded steadily over the past year. The U.S. labor market has regained momentum, consumer confidence is buoyant and gasoline prices have tumbled, boosting prospects for a stronger economic rebound in 2015.
Other regions are struggling. The eurozone economy is barely expanding, and the European Central Bank (ECB) has introduced large-scale asset purchases.
Despite Japan’s efforts to strengthen its economy, its sales tax increase last spring tipped the country into a recession, leading to additional monetary stimulus from the Bank of Japan. China’s economy is slowing as it transitions to a more sustainable basis, and its growth rate will likely continue to decline.
As always, active risk management is integral to how we at MFS® manage your investments. We use a collaborative process, sharing insights across asset classes, regions and economic sectors. Our global investment team uses a diversified, multidisciplined, long-term approach.
Applying proven principles, such as asset allocation and diversification, can best serve investors over the long term. We are confident that this approach can help you as you work with your financial advisors to reach your goals in the years ahead.
Respectfully,

Robert J. Manning
Chairman
MFS Investment Management
February 13, 2015
The opinions expressed in this letter are subject to change and may not be relied upon for investment advice. No forecasts can be guaranteed.
1
MFS New Discovery Series
PORTFOLIO COMPOSITION
Portfolio structure (i)
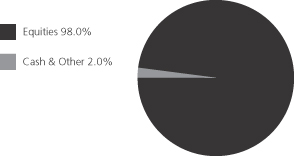
| | | | |
| Top ten holdings (i) | | | | |
| Swift Transportation Co. | | | 2.0% | |
| Bright Horizons Family Solutions, Inc. | | | 1.9% | |
| Urban Outfitters, Inc. | | | 1.7% | |
| Citi Trends, Inc. | | | 1.7% | |
| Dunkin Brands Group, Inc. | | | 1.7% | |
| Albemarle Corp. | | | 1.6% | |
| Ultimate Software Group, Inc. | | | 1.5% | |
| Cvent, Inc. | | | 1.5% | |
| Healthcare Services Group, Inc. | | | 1.5% | |
| Capital Senior Living Corp. | | | 1.5% | |
| | | | |
| Equity sectors (i) | | | | |
| Health Care | | | 25.8% | |
| Technology | | | 14.2% | |
| Special Products & Services | | | 11.6% | |
| Industrial Goods & Services | | | 9.7% | |
| Retailing | | | 7.5% | |
| Leisure | | | 7.2% | |
| Financial Services | | | 5.5% | |
| Energy | | | 4.1% | |
| Transportation | | | 4.0% | |
| Basic Materials | | | 3.6% | |
| Autos & Housing | | | 2.7% | |
| Consumer Staples | | | 1.8% | |
| Utilities & Communications | | | 0.3% | |
| (i) | For purposes of this presentation, the components include the value of securities, less any securities sold short, and reflect the impact of the equivalent exposure of derivative positions. These amounts may be negative from time to time. Equivalent exposure is a calculated amount that translates the derivative position into a reasonable approximation of the amount of the underlying asset that the portfolio would have to hold at a given point in time to have the same price sensitivity that results from the portfolio’s ownership of the derivative contract. When dealing with derivatives, equivalent exposure is a more representative measure of the potential impact of a position on portfolio performance than value. |
Cash & Other can include cash, other assets less liabilities, offsets to derivative positions, and short-term securities.
Percentages are based on net assets as of 12/31/14.
The portfolio is actively managed and current holdings may be different.
2
MFS New Discovery Series
MANAGEMENT REVIEW
Summary of Results
For the twelve months ended December 31, 2014, Initial Class shares of the MFS New Discovery Series (“fund”) provided a total return of –7.26%, while Service Class shares of the fund provided a total return of –7.49%. These compare with a return of 5.60% over the same period for the fund’s benchmark, the Russell 2000 Growth Index.
Market Environment
Early in the period, US equities suffered what proved to be a temporary setback due to concerns over emerging markets as well as what was perceived at the time to be a pause in US economic growth, partially caused by extreme weather events and a weak December 2013 labor market report. Markets soon recovered as the economic pause concluded and investors appeared to have become increasingly comfortable that newly-installed US Federal Reserve (“Fed”) Chair Janet Yellen would not make any substantial changes to the trajectory of Fed monetary policy.
A generally risk-friendly, carry trade environment persisted from February 2014 until mid-year. While geopolitical tensions flared in the Middle East and Russia/Ukraine, any market setbacks were short-lived as improving economic growth in the US, coupled with prospects for easier monetary policy in regions with slowing growth, such as Japan, Europe and China, supported risk assets. For example, the European Central Bank (“ECB”) cut policy interest rates into negative territory and, by the end of the period, expectations were for additional rate cuts and the announcement for non-conventional easing measures. Similarly, the Bank of Japan surprised markets late in the period with fresh stimulus measures given lackluster growth trends. The related decline in developed market government bond yields and credit spreads were also supportive for equity markets. At the end of the period, the US equity market was trading close to all-time highs and US Treasury yields were close to their lows for the period. However, credit markets did not fare as well in the second half of 2014, particularly US high yield and emerging market debt. The higher weightings of oil and gas credits in these asset classes resulted in widening spreads and increased volatility as oil prices began to decline in an accelerated fashion in the fourth quarter.
Detractors from Performance
Weak stock selection in the technology sector detracted from performance relative to the Russell 2000 Growth Index, led by an overweight position in poor-performing cloud-based business solutions company SciQuest. The stock price came under pressure as the company lowered its full-year guidance, primarily due to the loss of several larger enterprise contracts.
Stock selection within the health care sector also hurt relative results. Here, an overweight position in TearLab hindered relative performance as the stock steadily declined over the period. Weaker-than-expected revenues, combined with higher operating expenses, lower order numbers and lower-than-expected utilization were main factors behind the share price depreciation.
Stock selection in the transportation sector was another negative factor impacting relative performance. The fund’s ownership in shares of dry bulk shipping firm Diana Shipping (b) (Greece) and seaborne shipping and logistics company Navios Maritime Holdings (b) detracted from relative results. Shares of Diana Shipping weakened in the second half of the period after the company posted consecutive quarterly losses due to a sluggish demand environment.
Stock selection in the energy sector also dampened relative returns, led by the fund’s holdings of coal mining company Peabody Energy (b) and offshore drilling contractor Atwood Oceanics (b), and an overweight position in metallurgical coal producer Walter Energy (h). Most stocks in the energy sector, including Peabody Energy, were negatively impacted by the sharp correction in the price of oil that occurred late in the year. In addition, Peabody’s weak shipment volumes and thin margins further impacted the stock.
Elsewhere, other top individual detractors from relative performance included an overweight position in food store operator Fairway Group (h) and holdings of graphite electrodes manufacturer Graftech International (b)(h) and Arcos Dorados (b) (Argentina), an operator of McDonald’s franchises in Latin America. Shares of Fairway Group were pressured early in the period due to weak new store sales, especially at the Chelsea store in Manhattan, New York. The CEO’s announced retirement further pressured the stock as investors began to question the company’s future prospects. The stock price of Arcos Dorados declined during the period reflecting political and currency instability in some of its core regions and a lowered growth outlook.
Contributors to Performance
Stock selection in the industrial goods & services sector contributed to relative performance. Within this sector, the fund’s overweight position in pipe producer Advanced Drainage Systems boosted relative performance as its stock price rose substantially after the company went public in late July. Strong volume growth, considerable market share gains reflecting material conversion and increased spending on infrastructure were main factors that drove the stock price.
Stock selection in the special products & services sector also aided relative results. The fund’s holdings of expense management software company Concur Technologies (b)(h), online travel company MakeMyTrip (b) (India) and education services provider Kroton Educacional (b)(h) (Brazil) boosted relative returns. Shares of Concur Technologies increased following the acquisition by German enterprise application software company SAP.
3
MFS New Discovery Series
Management Review – continued
Elsewhere, the fund’s holdings of aluminum and carbon products manufacturer Century Aluminum (b)(h) and online professional network operator LinkedIn (b)(h) helped relative performance. Shares of Century Aluminum appreciated steadily over the period as higher aluminum prices and lower power rates resulted in the company beating estimates and returning to profitability. Additionally, the fund’s overweight positions in natural and organic food company Annie’s (h), urban fashion apparel retailers Citi Trends and Burlington Stores, and transportation services company Swift Transportation also aided relative results. Shares of Annie’s jumped after consumer foods manufacturer General Mills announced it had reached an agreement to acquire Annie’s in early September.
Respectfully,
| | |
| Paul Gordon | | Michael Grossman |
| Portfolio Manager | | Portfolio Manager |
| (b) | Security is not a benchmark constituent. |
| (h) | Security was not held in the portfolio at period end. |
Note to Contract Owners: Effective December 29, 2014, Paul Gordon replaced Thomas Wetherald as a Portfolio Manager of the Fund.
The views expressed in this report are those of the portfolio managers only through the end of the period of the report as stated on the cover and do not necessarily reflect the views of MFS or any other person in the MFS organization. These views are subject to change at any time based on market or other conditions, and MFS disclaims any responsibility to update such views. These views may not be relied upon as investment advice or an indication of trading intent on behalf of any MFS portfolio. References to specific securities are not recommendations of such securities, and may not be representative of any MFS portfolio’s current or future investments.
4
MFS New Discovery Series
PERFORMANCE SUMMARY THROUGH 12/31/14
The following chart illustrates the historical performance of the fund in comparison to its benchmark(s). Benchmarks are unmanaged and may not be invested in directly. Benchmark returns do not reflect any fees or expenses. The performance of other share classes will be greater than or less than that of the class depicted below. (See Notes to Performance Summary.)
Performance data shown represents past performance and is no guarantee of future results. Investment return and principal value fluctuate so your units, when sold, may be worth more or less than the original cost; current performance may be lower or higher than quoted. The performance shown does not reflect the deduction of taxes, if any, that a contract holder would pay on fund distributions or the redemption of contract units. The returns for the fund shown also do not reflect the deduction of expenses associated with variable products, such as mortality and expense risk charges, separate account charges, and sales charges imposed by the insurance company separate accounts. Such expenses would reduce the overall returns shown.
Growth of a Hypothetical $10,000 Investment
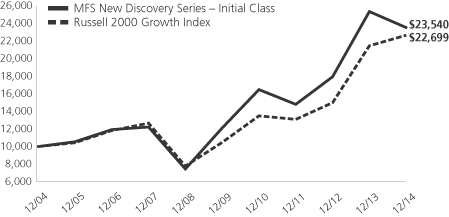
Total Returns through 12/31/14
Average annual total returns
| | | | | | | | | | | | |
| | | Share Class | | Class inception date | | 1-yr | | 5-yr | | 10-yr | | |
| | | Initial Class | | 5/01/98 | | (7.26)% | | 14.25% | | 8.94% | | |
| | | Service Class | | 5/01/00 | | (7.49)% | | 13.96% | | 8.67% | | |
| | | | |
| Comparative benchmark | | | | | | | | |
| | | Russell 2000 Growth Index (f) | | 5.60% | | 16.80% | | 8.54% | | |
| (f) | Source: FactSet Research Systems Inc. |
Benchmark Definition
Russell 2000 Growth Index – constructed to provide a comprehensive barometer for growth securities in the small-cap segment of the U.S. equity universe. Companies in this index generally have higher price-to-book ratios and higher forecasted growth values.
It is not possible to invest directly in an index.
Notes to Performance Summary
Average annual total return represents the average annual change in value for each share class for the periods presented.
Performance results reflect any applicable expense subsidies and waivers in effect during the periods shown. Without such subsidies and waivers the fund’s performance results would be less favorable. Please see the prospectus and financial statements for complete details. All results are historical and assume the reinvestment of any dividends and capital gains distributions.
Performance results do not include adjustments made for financial reporting purposes in accordance with U.S. generally accepted accounting principles and may differ from amounts reported in the financial highlights.
From time to time the fund may receive proceeds from litigation settlements, without which performance would be lower.
5
MFS New Discovery Series
EXPENSE TABLE
Fund Expenses Borne by the Contract Holders During the Period,
July 1, 2014 through December 31, 2014
As a contract holder of the fund, you incur ongoing costs, including management fees; distribution and/or service (12b-1) fees; and other fund expenses. This example is intended to help you understand your ongoing costs (in dollars) of investing in the fund and to compare these costs with the ongoing costs of investing in other mutual funds.
The example is based on an investment of $1,000 invested at the beginning of the period and held for the entire period July 1, 2014 through December 31, 2014.
Actual Expenses
The first line for each share class in the following table provides information about actual account values and actual expenses. You may use the information in this line, together with the amount you invested, to estimate the expenses that you paid over the period. Simply divide your account value by $1,000 (for example, an $8,600 account value divided by $1,000 = 8.6), then multiply the result by the number in the first line under the heading entitled “Expenses Paid During Period” to estimate the expenses you paid on your account during this period.
Hypothetical Example for Comparison Purposes
The second line for each share class in the following table provides information about hypothetical account values and hypothetical expenses based on the fund’s actual expense ratio and an assumed rate of return of 5% per year before expenses, which is not the fund’s actual return. The hypothetical account values and expenses may not be used to estimate the actual ending account balance or expenses you paid for the period. You may use this information to compare the ongoing costs of investing in the fund and other funds. To do so, compare this 5% hypothetical example with the 5% hypothetical examples that appear in the shareholder reports of the other funds.
Please note that the expenses shown in the table are meant to highlight the fund’s ongoing costs only and do not take into account the fees and expenses imposed under the variable contracts through which your investment in the fund is made. Therefore, the second line for each share class in the table is useful in comparing ongoing costs associated with an investment in vehicles (such as the fund) which fund benefits under variable annuity and variable life insurance contracts and to qualified pension and retirement plans only, and will not help you determine the relative total costs of investing in the fund through variable annuity and variable life insurance contracts. If the fees and expenses imposed under the variable contracts were included, your costs would have been higher.
| | | | | | | | | | | | | | | | | | |
| Share Class | | | | Annualized Expense Ratio | | | Beginning Account Value
7/01/14 | | | Ending Account Value
12/31/14 | | | Expenses Paid
During Period (p)
7/01/14-12/31/14 | |
| Initial Class | | Actual | | | 0.95% | | | | $1,000.00 | | | | $942.37 | | | | $4.65 | |
| | Hypothetical (h) | | | 0.95% | | | | $1,000.00 | | | | $1,020.42 | | | | $4.84 | |
| Service Class | | Actual | | | 1.20% | | | | $1,000.00 | | | | $941.18 | | | | $5.87 | |
| | Hypothetical (h) | | | 1.20% | | | | $1,000.00 | | | | $1,019.16 | | | | $6.11 | |
| (h) | 5% class return per year before expenses. |
| (p) | “Expenses Paid During Period” are equal to each class’s annualized expense ratio, as shown above, multiplied by the average account value over the period, multiplied by 184/365 (to reflect the one-half year period). |
Notes to Expense Table
Changes to the fund’s fee arrangements occurred during the six month period. Had these fee changes been in effect throughout the entire six month period, the annualized expense ratios, the actual expenses paid during the period and the hypothetical expenses paid during the period would have been approximately 0.94%, $4.60 and $4.79 for Initial Class and 1.19%, $5.82 and $6.06 for Service Class, respectively. For further information about the fund’s fee arrangements and changes to those fee arrangements, please see Note 3 in the Notes to Financial Statements.
6
MFS New Discovery Series
PORTFOLIO OF INVESTMENTS – 12/31/14
The Portfolio of Investments is a complete list of all securities owned by your fund. It is categorized by broad-based asset classes.
| | | | | | | | |
| Issuer | | Shares/Par | | | Value ($) | |
| | | | | | | | |
| COMMON STOCKS – 97.9% | | | | | |
| Aerospace – 0.7% | | | | | | | | |
| FLIR Systems, Inc. | | | 190,996 | | | $ | 6,171,083 | |
| | | | | | | | |
| Apparel Manufacturers – 0.3% | | | | | | | | |
| Tumi Holdings, Inc. (a) | | | 115,951 | | | $ | 2,751,517 | |
| | | | | | | | |
| Automotive – 0.4% | | | | | | | | |
| Mobileye N.V. (a)(l) | | | 94,035 | | | $ | 3,814,060 | |
| | | | | | | | |
| Biotechnology – 5.0% | | | | | | | | |
| Alnylam Pharmaceuticals, Inc. (a) | | | 24,700 | | | $ | 2,395,900 | |
| AMAG Pharmaceuticals, Inc. (a) | | | 94,058 | | | | 4,008,752 | |
| Amicus Therapeutics, Inc. (a) | | | 340,847 | | | | 2,835,847 | |
| Exact Sciences Corp. (a)(l) | | | 239,271 | | | | 6,565,596 | |
| Isis Pharmaceuticals, Inc. (a) | | | 150,960 | | | | 9,320,270 | |
| MiMedx Group, Inc. (a)(l) | | | 722,327 | | | | 8,328,430 | |
| Novavax, Inc. (a) | | | 290,365 | | | | 1,721,864 | |
| Puma Biotechnology, Inc. (a) | | | 23,426 | | | | 4,433,839 | |
| Tesaro, Inc. (a) | | | 101,953 | | | | 3,791,632 | |
| | | | | | | | |
| | | | | | $ | 43,402,130 | |
| | | | | | | | |
| Broadcasting – 1.2% | | | | | | | | |
| Live Nation, Inc. (a) | | | 379,543 | | | $ | 9,909,868 | |
| | | | | | | | |
| Brokerage & Asset Managers – 1.9% | | | | | |
| FXCM, Inc., “A” | | | 280,444 | | | $ | 4,646,957 | |
| LPL Financial Holdings, Inc. | | | 98,230 | | | | 4,376,147 | |
| NASDAQ OMX Group, Inc. | | | 149,422 | | | | 7,166,279 | |
| | | | | | | | |
| | | | | | $ | 16,189,383 | |
| | | | | | | | |
| Business Services – 7.5% | | | | | | | | |
| Borderfree, Inc. (a) | | | 335,015 | | | $ | 3,001,734 | |
| Bright Horizons Family Solutions, Inc. (a) | | | 340,604 | | | | 16,011,794 | |
| Constant Contact, Inc. (a) | | | 312,996 | | | | 11,486,953 | |
| CoStar Group, Inc. (a) | | | 49,725 | | | | 9,131,002 | |
| Gartner, Inc. (a) | | | 146,329 | | | | 12,322,365 | |
| Ultimate Software Group, Inc. (a) | | | 86,325 | | | | 12,673,805 | |
| | | | | | | | |
| | | | | | $ | 64,627,653 | |
| | | | | | | | |
| Chemicals – 0.2% | | | | | | | | |
| Marrone Bio Innovations, Inc. (a) | | | 374,473 | | | $ | 1,351,848 | |
| | | | | | | | |
| Computer Software – 0.7% | | | | | | | | |
| SolarWinds, Inc. (a) | | | 124,739 | | | $ | 6,215,744 | |
| | | | | | | | |
| Computer Software – Systems – 8.2% | | | | | |
| Cvent, Inc. (a) | | | 454,649 | | | $ | 12,657,428 | |
| Demandware, Inc. (a) | | | 154,999 | | | | 8,918,642 | |
| Exa Corp. (a) | | | 235,760 | | | | 2,777,253 | |
| Fleetmatics Group PLC (a) | | | 225,255 | | | | 7,994,300 | |
| Model N, Inc. (a) | | | 738,854 | | | | 7,846,629 | |
| PROS Holdings, Inc. (a) | | | 140,058 | | | | 3,848,794 | |
| SciQuest, Inc. (a) | | | 558,357 | | | | 8,068,259 | |
| ServiceNow, Inc. (a) | | | 136,517 | | | | 9,262,678 | |
| SS&C Technologies Holdings, Inc. | | | 160,316 | | | | 9,376,883 | |
| | | | | | | | |
| | | | | | $ | 70,750,866 | |
| | | | | | | | |
| | | | | | | | |
| Issuer | | Shares/Par | | | Value ($) | |
| | | | | | | | |
| COMMON STOCKS – continued | |
| Construction – 2.3% | | | | | | | | |
| Eagle Materials, Inc. | | | 111,599 | | | $ | 8,484,872 | |
| Lennox International, Inc. | | | 48,418 | | | | 4,603,099 | |
| Trex Co., Inc. (a) | | | 152,080 | | | | 6,475,566 | |
| | | | | | | | |
| | | | | | $ | 19,563,537 | |
| | | | | | | | |
| Consumer Services – 3.6% | | | | | | | | |
| HomeAway, Inc. (a) | | | 207,747 | | | $ | 6,186,706 | |
| MakeMyTrip Ltd. (a) | | | 236,283 | | | | 6,140,995 | |
| Nord Anglia Education, Inc. (a) | | | 516,532 | | | | 9,855,431 | |
| Servicemaster Global Holdings, Inc. (a) | | | 341,890 | | | | 9,152,395 | |
| | | | | | | | |
| | | | | | $ | 31,335,527 | |
| | | | | | | | |
| Electrical Equipment – 3.6% | | | | | | | | |
| Advanced Drainage Systems, Inc. | | | 439,261 | | | $ | 10,094,218 | |
| AMETEK, Inc. | | | 106,482 | | | | 5,604,148 | |
| MSC Industrial Direct Co., Inc., “A” | | | 58,141 | | | | 4,723,956 | |
| Sensata Technologies Holding B.V. (a) | | | 90,951 | | | | 4,766,742 | |
| TriMas Corp. (a) | | | 193,734 | | | | 6,061,937 | |
| | | | | | | | |
| | | | | | $ | 31,251,001 | |
| | | | | | | | |
| Electronics – 1.6% | | | | | | | | |
| Monolithic Power Systems, Inc. | | | 63,087 | | | $ | 3,137,947 | |
| Silicon Laboratories, Inc. (a) | | | 116,294 | | | | 5,537,920 | |
| Stratasys Ltd. (a) | | | 57,906 | | | | 4,812,568 | |
| | | | | | | | |
| | | | | | $ | 13,488,435 | |
| | | | | | | | |
| Energy – Independent – 2.4% | | | | | | | | |
| Foresight Energy LP | | | 369,460 | | | $ | 6,232,790 | |
| Memorial Resource Development Corp. (a) | | | 218,873 | | | | 3,946,280 | |
| Range Resources Corp. | | | 64,716 | | | | 3,459,070 | |
| Rice Energy, Inc. (a) | | | 263,481 | | | | 5,525,197 | |
| Sanchez Energy Corp. (a) | | | 197,764 | | | | 1,837,228 | |
| | | | | | | | |
| | | | | | $ | 21,000,565 | |
| | | | | | | | |
| Engineering – Construction – 1.4% | | | | | | | | |
| Stantec, Inc. | | | 157,359 | | | $ | 4,324,731 | |
| Team, Inc. (a) | | | 195,488 | | | | 7,909,444 | |
| | | | | | | | |
| | | | | | $ | 12,234,175 | |
| | | | | | | | |
| Entertainment – 0.3% | | | | | | | | |
| DHX Media Ltd. | | | 304,167 | | | $ | 2,591,886 | |
| | | | | | | | |
| Food & Beverages – 1.8% | | | | | | | | |
| Flowers Foods, Inc. | | | 406,146 | | | $ | 7,793,942 | |
| Freshpet, Inc. (a)(l) | | | 438,143 | | | | 7,474,720 | |
| | | | | | | | |
| | | | | | $ | 15,268,662 | |
| | | | | | | | |
| Food & Drug Stores – 0.2% | | | | | | | | |
| Brazil Pharma S.A. (a) | | | 1,946,784 | | | $ | 1,896,836 | |
| | | | | | | | |
| Gaming & Lodging – 2.3% | | | | | | | | |
| Diamond Resorts International, Inc. (a) | | | 310,199 | | | $ | 8,654,552 | |
| Norwegian Cruise Line Holdings Ltd. (a) | | | 232,390 | | | | 10,866,556 | |
| | | | | | | | |
| | | | | | $ | 19,521,108 | |
| | | | | | | | |
7
MFS New Discovery Series
Portfolio of Investments – continued
| | | | | | | | |
| Issuer | | Shares/Par | | | Value ($) | |
| | | | | | | | |
| COMMON STOCKS – continued | |
| General Merchandise – 1.4% | | | | | | | | |
| Five Below, Inc. (a) | | | 299,356 | | | $ | 12,222,705 | |
| | | | | | | | |
| Internet – 3.7% | | | | | | | | |
| Dealertrack Holdings, Inc. (a) | | | 187,669 | | | $ | 8,315,613 | |
| GrubHub, Inc. (a) | | | 192,814 | | | | 7,003,004 | |
| Pandora Media, Inc. (a) | | | 240,995 | | | | 4,296,941 | |
| Shutterstock, Inc. (a) | | | 83,168 | | | | 5,746,909 | |
| Trulia, Inc. (a) | | | 144,435 | | | | 6,648,343 | |
| | | | | | | | |
| | | | | | $ | 32,010,810 | |
| | | | | | | | |
| Machinery & Tools – 3.9% | | | | | | | | |
| Allison Transmission Holdings, Inc. | | | 265,439 | | | $ | 8,998,382 | |
| IPG Photonics Corp. (a) | | | 110,585 | | | | 8,285,028 | |
| Joy Global, Inc. | | | 118,948 | | | | 5,533,461 | |
| Polypore International, Inc. (a) | | | 132,073 | | | | 6,214,035 | |
| WABCO Holdings, Inc. (a) | | | 43,989 | | | | 4,609,167 | |
| | | | | | | | |
| | | | | | $ | 33,640,073 | |
| | | | | | | | |
| Medical & Health Technology & Services – 7.7% | | | | | |
| Adeptus Health, Inc., “A” (a) | | | 63,713 | | | $ | 2,382,866 | |
| Advisory Board Co. (a) | | | 131,817 | | | | 6,456,397 | |
| Brookdale Senior Living, Inc. (a) | | | 317,583 | | | | 11,645,769 | |
| Capital Senior Living Corp. (a) | | | 503,159 | | | | 12,533,691 | |
| Healthcare Services Group, Inc. | | | 408,609 | | | | 12,638,276 | |
| HealthStream, Inc. (a) | | | 290,293 | | | | 8,557,838 | |
| IDEXX Laboratories, Inc. (a) | | | 41,317 | | | | 6,126,072 | |
| INC Research Holdings, Inc., “A” (a) | | | 228,109 | | | | 5,860,120 | |
| | | | | | | | |
| | | | | | $ | 66,201,029 | |
| | | | | | | | |
| Medical Equipment – 10.1% | | | | | | | | |
| Align Technology, Inc. (a) | | | 121,695 | | | $ | 6,803,967 | |
| AtriCure, Inc. (a) | | | 97,727 | | | | 1,950,631 | |
| Cardiovascular Systems, Inc. (a) | | | 303,708 | | | | 9,135,537 | |
| Cepheid, Inc. (a) | | | 158,958 | | | | 8,605,986 | |
| DexCom, Inc. (a) | | | 157,418 | | | | 8,665,861 | |
| GenMark Diagnostics, Inc. (a) | | | 317,174 | | | | 4,316,738 | |
| Masimo Corp. (a) | | | 328,134 | | | | 8,643,050 | |
| Nevro Corp. (a) | | | 90,809 | | | | 3,511,584 | |
| Novadaq Technologies, Inc. (a) | | | 258,222 | | | | 4,291,650 | |
| NxStage Medical, Inc. (a) | | | 216,258 | | | | 3,877,506 | |
| PerkinElmer, Inc. | | | 151,882 | | | | 6,641,800 | |
| STERIS Corp. | | | 110,979 | | | | 7,196,988 | |
| TearLab Corp. (a)(l) | | | 1,160,779 | | | | 3,076,064 | |
| Thoratec Corp. (a) | | | 275,429 | | | | 8,940,425 | |
| Uroplasty, Inc. (a) | | | 673,111 | | | | 1,386,609 | |
| | | | | | | | |
| | | | | | $ | 87,044,396 | |
| | | | | | | | |
| Metals & Mining – 0.8% | | | | | | | | |
| Globe Specialty Metals, Inc. | | | 405,209 | | | $ | 6,981,751 | |
| | | | | | | | |
| Natural Gas – Pipeline – 0.4% | | | | | | | | |
| StealthGas, Inc. (a) | | | 473,937 | | | $ | 2,990,542 | |
| | | | | | | | |
| Oil Services – 1.6% | | | | | | | | |
| Atwood Oceanics, Inc. | | | 142,790 | | | $ | 4,050,952 | |
| Dril-Quip, Inc. (a) | | | 48,426 | | | | 3,715,727 | |
| Frank’s International N.V. | | | 384,610 | | | | 6,396,064 | |
| | | | | | | | |
| | | | | | $ | 14,162,743 | |
| | | | | | | | |
| | | | | | | | |
| Issuer | | Shares/Par | | | Value ($) | |
| | | | | | | | |
| COMMON STOCKS – continued | |
| Other Banks & Diversified Financials – 3.7% | | | | | |
| Air Lease Corp. | | | 179,782 | | | $ | 6,168,320 | |
| Avolon Holdings Ltd. (a) | | | 191,698 | | | | 3,795,620 | |
| CAI International, Inc. (a) | | | 129,726 | | | | 3,009,643 | |
| First Republic Bank | | | 147,063 | | | | 7,664,924 | |
| PrivateBancorp, Inc. | | | 171,005 | | | | 5,711,567 | |
| Texas Capital Bancshares, Inc. (a) | | | 94,406 | | | | 5,129,078 | |
| | | | | | | | |
| | | | | | $ | 31,479,152 | |
| | | | | | | | |
| Pharmaceuticals – 3.0% | | | | | | | | |
| Aratana Therapeutics, Inc. (a) | | | 335,852 | | | $ | 5,984,883 | |
| Intercept Pharmaceuticals, Inc. (a) | | | 22,271 | | | | 3,474,276 | |
| Kythera Biopharmaceuticals, Inc. (a) | | | 154,773 | | | | 5,367,528 | |
| MediWound Ltd. (a) | | | 210,428 | | | | 1,401,450 | |
| Receptos, Inc. (a) | | | 38,925 | | | | 4,768,702 | |
| TherapeuticsMD, Inc. (a) | | | 992,911 | | | | 4,418,454 | |
| | | | | | | | |
| | | | | | $ | 25,415,293 | |
| | | | | | | | |
| Railroad & Shipping – 1.5% | | | | | | | | |
| Diana Shipping, Inc. (a) | | | 1,010,575 | | | $ | 6,780,958 | |
| Navios Maritime Holdings, Inc. | | | 1,389,471 | | | | 5,710,726 | |
| | | | | | | | |
| | | | | | $ | 12,491,684 | |
| | | | | | | | |
| Restaurants – 3.5% | | | | | | | | |
| Arcos Dorados Holdings, Inc. (l) | | | 251,182 | | | $ | 1,358,895 | |
| Chuy’s Holdings, Inc. (a) | | | 360,068 | | | | 7,082,538 | |
| Domino’s Pizza, Inc. | | | 36,395 | | | | 3,427,317 | |
| Dunkin Brands Group, Inc. | | | 333,915 | | | | 14,241,475 | |
| Zoe’s Kitchen, Inc. (a)(l) | | | 125,253 | | | | 3,746,317 | |
| | | | | | | | |
| | | | | | $ | 29,856,542 | |
| | | | | | | | |
| Special Products & Services – 0.4% | | | | | | | | |
| WL Ross Holding Corp., EU (a) | | | 320,994 | | | $ | 3,681,801 | |
| | | | | | | | |
| Specialty Chemicals – 2.6% | | | | | | | | |
| Albemarle Corp. | | | 231,320 | | | $ | 13,909,272 | |
| Axalta Coating Systems Ltd. (a) | | | 175,535 | | | | 4,567,421 | |
| PolyOne Corp. | | | 104,826 | | | | 3,973,954 | |
| | | | | | | | |
| | | | | | $ | 22,450,647 | |
| | | | | | | | |
| Specialty Stores – 5.5% | | | | | | | | |
| Burlington Stores, Inc. (a) | | | 218,690 | | | $ | 10,335,289 | |
| Citi Trends, Inc. (a) | | | 567,597 | | | | 14,331,824 | |
| Lumber Liquidators Holdings, Inc. (a) | | | 125,596 | | | | 8,328,271 | |
| Urban Outfitters, Inc. (a) | | | 411,728 | | | | 14,464,005 | |
| | | | | | | | |
| | | | | | $ | 47,459,389 | |
| | | | | | | | |
| Trucking – 2.5% | | | | | | | | |
| Knight Transportation, Inc. | | | 119,637 | | | $ | 4,026,981 | |
| Swift Transportation Co. (a) | | | 614,995 | | | | 17,607,307 | |
| | | | | | | | |
| | | | | | $ | 21,634,288 | |
| | | | | | | | |
Total Common Stocks
(Identified Cost, $735,909,895) | | | | | | $ | 843,058,729 | |
| | | | | | | | |
8
MFS New Discovery Series
Portfolio of Investments – continued
| | | | | | | | | | | | | | | | |
| Issuer | | Strike
Price | | | First
Exercise | | | Shares/Par | | | Value ($) | |
| | | | | | | | | | | | | | | | |
| WARRANTS – 0.0% | | | | | |
| Food & Drug Stores – 0.0% | | | | | |
| Brasil Pharma S.A. (1 share for 1 warrant) (Identified Cost, $8,762) (a) | | BRL | 5.50 | | | | 6/25/14 | | | | 348,793 | | | $ | 11,809 | |
| | | | | | | | | | | | | | | | |
| |
| MONEY MARKET FUNDS – 1.4% | | | | | |
| MFS Institutional Money Market Portfolio, 0.09%, at Cost and Net Asset Value (v) | | | | 12,092,040 | | | $ | 12,092,040 | |
| | | | | | | | | | | | | | | | |
|
| COLLATERAL FOR SECURITIES LOANED – 1.5% | |
| Navigator Securities Lending Prime Portfolio, 0.16%, at Cost and Net Asset Value (j) | | | | 12,547,815 | | | $ | 12,547,815 | |
| | | | | | | | | | | | | | | | |
Total Investments
(Identified Cost, $760,558,512) | | | | | | | $ | 867,710,393 | |
| | | | | | | | | | | | | | | | |
OTHER ASSETS, LESS
LIABILITIES – (0.8)% | | | | | | | | (6,991,127 | ) |
| | | | | | | | | | | | | | | | |
| NET ASSETS – 100.0% | | | | | | | $ | 860,719,266 | |
| | | | | | | | | | | | | | | | |
| (a) | | Non-income producing security. |
| (j) | | The rate quoted is the annualized seven-day yield of the fund at period end. |
| (l) | | A portion of this security is on loan. |
| (v) | | Underlying affiliated fund that is available only to investment companies managed by MFS. The rate quoted for the MFS Institutional Money Market Portfolio is the annualized seven-day yield of the fund at period end. |
The following abbreviations are used in this report and are defined:
| PLC | | Public Limited Company |
See Notes to Financial Statements
9
MFS New Discovery Series
FINANCIAL STATEMENTS | STATEMENT OF ASSETS AND LIABILITIES
This statement represents your fund’s balance sheet, which details the assets and liabilities comprising the total value of the fund.
| | | | | | | | |
At 12/31/14 | | | | | | | | |
Assets | | | | | | | | |
Investments – | | | | | | | | |
Non-affiliated issuers, at value (identified cost, $748,466,472) | | | $855,618,353 | | | | | |
Underlying affiliated funds, at cost and value | | | 12,092,040 | | | | | |
Total investments, at value, including $12,162,346 of securities on loan (identified cost, $760,558,512) | | | $867,710,393 | | | | | |
Foreign currency, at value (identified cost, $4) | | | 4 | | | | | |
Receivables for | | | | | | | | |
Investments sold | | | 8,287,032 | | | | | |
Fund shares sold | | | 390,028 | | | | | |
Interest and dividends | | | 229,990 | | | | | |
Other assets | | | 5,682 | | | | | |
Total assets | | | | | | | $876,623,129 | |
Liabilities | | | | | | | | |
Payables for | | | | | | | | |
Investments purchased | | | $1,961,951 | | | | | |
Fund shares reacquired | | | 1,175,797 | | | | | |
Collateral for securities loaned, at value (c) | | | 12,547,815 | | | | | |
Payable to affiliates | | | | | | | | |
Investment adviser | | | 35,216 | | | | | |
Shareholder servicing costs | | | 602 | | | | | |
Distribution and/or service fees | | | 6,469 | | | | | |
Payable for independent Trustees’ compensation | | | 2 | | | | | |
Accrued expenses and other liabilities | | | 176,011 | | | | | |
Total liabilities | | | | | | | $15,903,863 | |
Net assets | | | | | | | $860,719,266 | |
Net assets consist of | | | | | | | | |
Paid-in capital | | | $741,166,796 | | | | | |
Unrealized appreciation (depreciation) on investments and translation of assets and liabilities in foreign currencies | | | 107,151,885 | | | | | |
Accumulated net realized gain (loss) on investments and foreign currency | | | 12,400,585 | | | | | |
Net assets | | | | | | | $860,719,266 | |
Shares of beneficial interest outstanding | | | | | | | 54,641,306 | |
| | | | | | | | | | | | |
| | | Net assets | | | Shares
outstanding | | | Net asset value
per share | |
Initial Class | | | $391,473,792 | | | | 23,980,364 | | | | $16.32 | |
Service Class | | | 469,245,474 | | | | 30,660,942 | | | | 15.30 | |
| (c) | Non-cash collateral is not included. |
See Notes to Financial Statements
10
MFS New Discovery Series
FINANCIAL STATEMENTS | STATEMENT OF OPERATIONS
This statement describes how much your fund earned in investment income and accrued in expenses. It also describes any gains and/or losses generated by fund operations.
| | | | | | | | |
Year ended 12/31/14 | | | | | | | | |
Net Investment loss | | | | | | | | |
Income | | | | | | | | |
Dividends | | | $3,537,806 | | | | | |
Income on securities loaned | | | 793,892 | | | | | |
Dividends from underlying affiliated funds | | | 5,850 | | | | | |
Foreign taxes withheld | | | (43,551 | ) | | | | |
Total investment income | | | | | | | $4,293,997 | |
Expenses | | | | | | | | |
Management fee | | | $7,903,402 | | | | | |
Distribution and/or service fees | | | 1,233,334 | | | | | |
Shareholder servicing costs | | | 71,634 | | | | | |
Administrative services fee | | | 128,572 | | | | | |
Independent Trustees’ compensation | | | 23,575 | | | | | |
Custodian fee | | | 103,001 | | | | | |
Shareholder communications | | | 125,998 | | | | | |
Audit and tax fees | | | 57,508 | | | | | |
Legal fees | | | 18,136 | | | | | |
Miscellaneous | | | 32,542 | | | | | |
Total expenses | | | | | | | $9,697,702 | |
Fees paid indirectly | | | (45 | ) | | | | |
Reduction of expenses by investment adviser | | | (105,907 | ) | | | | |
Net expenses | | | | | | | $9,591,750 | |
Net investment loss | | | | | | | $(5,297,753 | ) |
Realized and unrealized gain (loss) on investments and foreign currency | | | | | | | | |
Realized gain (loss) (identified cost basis) | | | | | | | | |
Investments | | | $34,500,700 | | | | | |
Foreign currency | | | 38,013 | | | | | |
Net realized gain (loss) on investments and foreign currency | | | | | | | $34,538,713 | |
Change in unrealized appreciation (depreciation) | | | | | | | | |
Investments | | | $(102,821,743 | ) | | | | |
Translation of assets and liabilities in foreign currencies | | | (286 | ) | | | | |
Net unrealized gain (loss) on investments and foreign currency translation | | | | | | | $(102,822,029 | ) |
Net realized and unrealized gain (loss) on investments and foreign currency | | | | | | | $(68,283,316 | ) |
Change in net assets from operations | | | | | | | $(73,581,069 | ) |
See Notes to Financial Statements
11
MFS New Discovery Series
FINANCIAL STATEMENTS | STATEMENTS OF CHANGES IN NET ASSETS
These statements describe the increases and/or decreases in net assets resulting from operations, any distributions, and any shareholder transactions.
| | | | | | | | |
For years ended 12/31 | | | 2014 | | | | 2013 | |
Change in net assets | | | | | | | | |
From operations | | | | | | | | |
Net investment loss | | | $(5,297,753 | ) | | | $(5,254,098 | ) |
Net realized gain (loss) on investments and foreign currency | | | 34,538,713 | | | | 194,642,704 | |
Net unrealized gain (loss) on investments and foreign currency translation | | | (102,822,029 | ) | | | 123,453,027 | |
Change in net assets from operations | | | $(73,581,069 | ) | | | $312,841,633 | |
Distributions declared to shareholders | | | | | | | | |
From net realized gain on investments | | | $(193,566,218 | ) | | | $(7,635,845 | ) |
Change in net assets from fund share transactions | | | $124,817,247 | | | | $(90,487,438 | ) |
Total change in net assets | | | $(142,330,040 | ) | | | $214,718,350 | |
Net assets | | | | | | | | |
At beginning of period | | | 1,003,049,306 | | | | 788,330,956 | |
At end of period (including undistributed net investment income of $0 and
$100, respectively) | | | $860,719,266 | | | | $1,003,049,306 | |
See Notes to Financial Statements
12
MFS New Discovery Series
FINANCIAL STATEMENTS | FINANCIAL HIGHLIGHTS
The financial highlights table is intended to help you understand the fund’s financial performance for the past 5 years. Certain information reflects financial results for a single fund share. The total returns in the table represent the rate by which an investor would have earned (or lost) on an investment in the fund share class (assuming reinvestment of all distributions) held for the entire period.
| | | | | | | | | | | | | | | | | | | | |
| Initial Class | | Years ended 12/31 | |
| | | 2014 | | | 2013 | | | 2012 | | | 2011 | | | 2010 | |
Net asset value, beginning of period | | | $22.07 | | | | $15.72 | | | | $14.29 | | | | $18.31 | | | | $13.43 | |
| Income (loss) from investment operations | | | | | | | | | | | | | | | | | | | | |
Net investment loss (d) | | | $(0.09 | ) | | | $(0.08 | ) | | | $(0.05 | ) | | | $(0.10 | ) | | | $(0.08 | ) |
Net realized and unrealized gain (loss) on investments
and foreign currency | | | (1.42 | ) | | | 6.59 | | | | 3.00 | | | | (1.70 | ) | | | 4.96 | |
Total from investment operations | | | $(1.51 | ) | | | $6.51 | | | | $2.95 | | | | $(1.80 | ) | | | $4.88 | |
| Less distributions declared to shareholders | | | | | | | | | | | | | | | | | | | | |
From net realized gain on investments | | | $(4.24 | ) | | | $(0.16 | ) | | | $(1.52 | ) | | | $(2.22 | ) | | | $— | |
Net asset value, end of period (x) | | | $16.32 | | | | $22.07 | | | | $15.72 | | | | $14.29 | | | | $18.31 | |
Total return (%) (k)(r)(s)(x) | | | (7.26 | ) | | | 41.52 | | | | 21.22 | | | | (10.27 | ) | | | 36.34 | |
Ratios (%) (to average net assets)
and Supplemental data: | | | | | | | | | | | | | | | | | | | | |
Expenses before expense reductions (f) | | | 0.96 | | | | 0.96 | | | | 0.97 | | | | 0.98 | | | | 1.01 | |
Expenses after expense reductions (f) | | | 0.95 | | | | 0.96 | | | | 0.97 | | | | 0.98 | | | | 1.01 | |
Net investment loss | | | (0.46 | ) | | | (0.44 | ) | | | (0.29 | ) | | | (0.56 | ) | | | (0.54 | ) |
Portfolio turnover | | | 96 | | | | 104 | | | | 122 | | | | 177 | | | | 195 | |
Net assets at end of period (000 omitted) | | | $391,474 | | | | $424,432 | | | | $395,107 | | | | $363,412 | | | | $499,020 | |
| |
| Service Class | | Years ended 12/31 | |
| | | 2014 | | | 2013 | | | 2012 | | | 2011 | | | 2010 | |
Net asset value, beginning of period | | | $21.02 | | | | $15.01 | | | | $13.74 | | | | $17.74 | | | | $13.05 | |
| Income (loss) from investment operations | | | | | | | | | | | | | | | | | | | | |
Net investment loss (d) | | | $(0.13 | ) | | | $(0.12 | ) | | | $(0.08 | ) | | | $(0.14 | ) | | | $(0.11 | ) |
Net realized and unrealized gain (loss) on investments
and foreign currency | | | (1.35 | ) | | | 6.29 | | | | 2.87 | | | | (1.64 | ) | | | 4.80 | |
Total from investment operations | | | $(1.48 | ) | | | $6.17 | | | | $2.79 | | | | $(1.78 | ) | | | $4.69 | |
| Less distributions declared to shareholders | | | | | | | | | | | | | | | | | | | | |
From net realized gain on investments | | | $(4.24 | ) | | | $(0.16 | ) | | | $(1.52 | ) | | | $(2.22 | ) | | | $— | |
Net asset value, end of period (x) | | | $15.30 | | | | $21.02 | | | | $15.01 | | | | $13.74 | | | | $17.74 | |
Total return (%) (k)(r)(s)(x) | | | (7.49 | ) | | | 41.22 | | | | 20.90 | | | | (10.49 | ) | | | 35.94 | |
Ratios (%) (to average net assets)
and Supplemental data: | | | | | | | | | | | | | | | | | | | | |
Expenses before expense reductions (f) | | | 1.21 | | | | 1.21 | | | | 1.22 | | | | 1.23 | | | | 1.26 | |
Expenses after expense reductions (f) | | | 1.20 | | | | 1.21 | | | | 1.22 | | | | 1.23 | | | | 1.26 | |
Net investment loss | | | (0.72 | ) | | | (0.69 | ) | | | (0.53 | ) | | | (0.80 | ) | | | (0.79 | ) |
Portfolio turnover | | | 96 | | | | 104 | | | | 122 | | | | 177 | | | | 195 | |
Net assets at end of period (000 omitted) | | | $469,245 | | | | $578,617 | | | | $393,224 | | | | $312,589 | | | | $324,557 | |
| (d) | Per share data is based on average shares outstanding. |
| (f) | Ratios do not reflect reductions from fees paid indirectly, if applicable. |
| (k) | The total return does not reflect expenses that apply to separate accounts. Inclusion of these charges would reduce the total return figures for all periods shown. |
| (r) | Certain expenses have been reduced without which performance would have been lower. |
| (s) | From time to time the fund may receive proceeds from litigation settlements, without which performance would be lower. |
| (x) | The net asset values per share and total returns have been calculated on net assets which include adjustments made in accordance with U.S. generally accepted accounting principles required at period end for financial reporting purposes. |
See Notes to Financial Statements
13
MFS New Discovery Series
NOTES TO FINANCIAL STATEMENTS
| (1) | | Business and Organization |
MFS New Discovery Series (the fund) is a diversified series of MFS Variable Insurance Trust (the trust). The trust is organized as a Massachusetts business trust and is registered under the Investment Company Act of 1940, as amended, as an open-end management investment company. The shareholders of each series of the trust are separate accounts of insurance companies, which offer variable annuity and/or life insurance products, and qualified retirement and pension plans.
The fund is an investment company and accordingly follows the investment company accounting and reporting guidance of the Financial Accounting Standards Board (FASB) Accounting Standards Codification Topic 946 Financial Services – Investment Companies.
| (2) | | Significant Accounting Policies |
General – The preparation of financial statements in conformity with U.S. generally accepted accounting principles requires management to make estimates and assumptions that affect the reported amounts of assets and liabilities, and disclosure of contingent assets and liabilities at the date of the financial statements and the reported amounts of increases and decreases in net assets from operations during the reporting period. Actual results could differ from those estimates. In the preparation of these financial statements, management has evaluated subsequent events occurring after the date of the fund’s Statement of Assets and Liabilities through the date that the financial statements were issued.
In June 2014, FASB issued Accounting Standards Update 2014-11, Transfers and Servicing (Topic 860) – Repurchase-to-Maturity Transactions, Repurchase Financings, and Disclosures (“ASU 2014-11”). ASU 2014-11 changes the accounting for repurchase-to-maturity transactions (i.e., repurchase agreements that settle at the same time as the maturity of the transferred financial asset) and enhances the required disclosures for repurchase agreements and other similar transactions. Although still evaluating the potential impacts of ASU 2014-11 to the fund, management expects that the impact of the fund’s adoption will be limited to additional financial statement disclosures which would first be effective for interim reporting periods beginning after March 15, 2015.
Balance Sheet Offsetting – The fund’s accounting policy with respect to balance sheet offsetting is that, absent an event of default by the counterparty or a termination of the agreement, the International Swaps and Derivatives Association (ISDA) Master Agreement does not result in an offset of reported amounts of financial assets and financial liabilities in the Statement of Assets and Liabilities across transactions between the fund and the applicable counterparty. The fund’s right to setoff may be restricted or prohibited by the bankruptcy or insolvency laws of the particular jurisdiction to which a specific master netting agreement counterparty is subject. Balance sheet offsetting disclosures, to the extent applicable to the fund, have been included in the fund’s Significant Accounting Policies note under the captions for each of the fund’s in-scope financial instruments and transactions.
Investment Valuations – Equity securities, including restricted equity securities, are generally valued at the last sale or official closing price as provided by a third-party pricing service on the market or exchange on which they are primarily traded. Equity securities, for which there were no sales reported that day, are generally valued at the last quoted daily bid quotation as provided by a third-party pricing service on the market or exchange on which such securities are primarily traded. Short-term instruments with a maturity at issuance of 60 days or less may be valued at amortized cost, which approximates market value. Open-end investment companies are generally valued at net asset value per share. Securities and other assets generally valued on the basis of information from a third-party pricing service may also be valued at a broker/dealer bid quotation. Values obtained from third-party pricing services can utilize both transaction data and market information such as yield, quality, coupon rate, maturity, type of issue, trading characteristics, and other market data. The values of foreign securities and other assets and liabilities expressed in foreign currencies are converted to U.S. dollars using the mean of bid and asked prices for rates provided by a third-party pricing service.
The Board of Trustees has delegated primary responsibility for determining or causing to be determined the value of the fund’s investments (including any fair valuation) to the adviser pursuant to valuation policies and procedures approved by the Board. If the adviser determines that reliable market quotations are not readily available, investments are valued at fair value as determined in good faith by the adviser in accordance with such procedures under the oversight of the Board of Trustees. Under the fund’s valuation policies and procedures, market quotations are not considered to be readily available for most types of debt instruments and floating rate loans and many types of derivatives. These investments are generally valued at fair value based on information from third-party pricing services. In addition, investments may be valued at fair value if the adviser determines that an investment’s value has been materially affected by events occurring after the close of the exchange or market on which the investment is principally traded (such as foreign exchange or market) and prior to the determination of the fund’s net asset value, or after the halting of trading of a specific security where trading does not resume prior to the close of the exchange or market on which the security is principally traded. Events that occur on a frequent basis after foreign markets close (such as developments in foreign markets and significant movements in the U.S. markets) and prior to the determination of the fund’s net asset value may be deemed to have a material effect on the value of securities traded in foreign markets. Accordingly, the fund’s foreign equity securities may often be valued at fair value. The adviser generally relies on third-party pricing services or other information (such as the correlation with price movements of similar securities in the same or other markets; the type, cost and investment characteristics of the security; the
14
MFS New Discovery Series
Notes to Financial Statements – continued
business and financial condition of the issuer; and trading and other market data) to assist in determining whether to fair value and at what value to fair value an investment. The value of an investment for purposes of calculating the fund’s net asset value can differ depending on the source and method used to determine value. When fair valuation is used, the value of an investment used to determine the fund’s net asset value may differ from quoted or published prices for the same investment. There can be no assurance that the fund could obtain the fair value assigned to an investment if it were to sell the investment at the same time at which the fund determines its net asset value per share.
Various inputs are used in determining the value of the fund’s assets or liabilities. These inputs are categorized into three broad levels. In certain cases, the inputs used to measure fair value may fall into different levels of the fair value hierarchy. In such cases, an investment’s level within the fair value hierarchy is based on the lowest level of input that is significant to the fair value measurement. The fund’s assessment of the significance of a particular input to the fair value measurement in its entirety requires judgment, and considers factors specific to the investment. Level 1 includes unadjusted quoted prices in active markets for identical assets or liabilities. Level 2 includes other significant observable market-based inputs (including quoted prices for similar securities, interest rates, prepayment speed, and credit risk). Level 3 includes unobservable inputs, which may include the adviser’s own assumptions in determining the fair value of investments. The following is a summary of the levels used as of December 31, 2014 in valuing the fund’s assets or liabilities:
| | | | | | | | | | | | | | | | |
| Investments at Value | | Level 1 | | | Level 2 | | | Level 3 | | | Total | |
| Equity Securities: | | | | | | | | | | | | | | | | |
United States | | | $784,693,830 | | | | $— | | | | $— | | | | $784,693,830 | |
Greece | | | 15,482,227 | | | | — | | | | — | | | | 15,482,227 | |
Canada | | | 11,208,267 | | | | — | | | | — | | | | 11,208,267 | |
Hong Kong | | | 9,855,431 | | | | — | | | | — | | | | 9,855,431 | |
India | | | 6,140,995 | | | | — | | | | — | | | | 6,140,995 | |
Israel | | | 4,812,568 | | | | — | | | | — | | | | 4,812,568 | |
Netherlands | | | 3,814,060 | | | | — | | | | — | | | | 3,814,060 | |
Ireland | | | 3,795,620 | | | | — | | | | — | | | | 3,795,620 | |
Brazil | | | 1,896,836 | | | | 11,809 | | | | — | | | | 1,908,645 | |
Other Countries | | | 1,358,895 | | | | — | | | | — | | | | 1,358,895 | |
| Mutual Funds | | | 24,639,855 | | | | — | | | | — | | | | 24,639,855 | |
| Total Investments | | | $867,698,584 | | | | $11,809 | | | | $— | | | | $867,710,393 | |
For further information regarding security characteristics, see the Portfolio of Investments.
Foreign Currency Translation – Purchases and sales of foreign investments, income, and expenses are converted into U.S. dollars based upon currency exchange rates prevailing on the respective dates of such transactions or on the reporting date for foreign denominated receivables and payables. Gains and losses attributable to foreign currency exchange rates on sales of securities are recorded for financial statement purposes as net realized gains and losses on investments. Gains and losses attributable to foreign exchange rate movements on receivables, payables, income and expenses are recorded for financial statement purposes as foreign currency transaction gains and losses. That portion of both realized and unrealized gains and losses on investments that results from fluctuations in foreign currency exchange rates is not separately disclosed.
Security Loans – Under its Securities Lending Agency Agreement with the fund, State Street Bank and Trust Company (“State Street”), as lending agent, loans the securities of the fund to certain qualified institutions (the “Borrowers”) approved by the fund. The loans are collateralized by cash and/or U.S. Treasury and federal agency obligations in an amount typically at least equal to the market value of the securities loaned. On loans collateralized by cash, the cash collateral is invested in a money market fund. The market value of the loaned securities is determined at the close of business of the fund and any additional required collateral is delivered to the fund on the next business day. State Street provides the fund with indemnification against Borrower default. In the event of Borrower default, State Street will for the benefit of the fund either purchase securities identical to those loaned or, when such purchase is commercially impracticable, pay the fund the market value of the loaned securities. In return, State Street assumes the fund’s rights to the related collateral. If the collateral value is less than the cost to purchase identical securities, State Street is responsible for the shortfall, but only to the extent that such shortfall is not due to a decline in collateral value resulting from collateral reinvestment for which the fund bears the risk of loss. At period end, the fund had investment securities on loan with a fair value of $12,162,346 and a related liability of $12,547,815 for cash collateral received on securities loaned, both of which are presented gross in the Statement of Assets and Liabilities. Additionally, these loans were collateralized by U.S. Treasury Obligations of $130,200. The collateral received on securities loaned exceeded the value of securities on loan at period end. The liability for cash collateral for securities loaned is carried at fair value, which is categorized as level 2 within the fair value hierarchy. A portion of the income generated upon investment of the collateral is remitted to the Borrowers, and the remainder is allocated between the fund and the lending agent. On loans collateralized by U.S. Treasury and/or federal agency obligations, a fee is received from the
15
MFS New Discovery Series
Notes to Financial Statements – continued
Borrower, and is allocated between the fund and the lending agent. Income from securities lending is separately reported in the Statement of Operations. The dividend and interest income earned on the securities loaned is accounted for in the same manner as other dividend and interest income.
Indemnifications – Under the fund’s organizational documents, its officers and Trustees may be indemnified against certain liabilities and expenses arising out of the performance of their duties to the fund. Additionally, in the normal course of business, the fund enters into agreements with service providers that may contain indemnification clauses. The fund’s maximum exposure under these agreements is unknown as this would involve future claims that may be made against the fund that have not yet occurred.
Investment Transactions and Income – Investment transactions are recorded on the trade date. Interest income is recorded on the accrual basis. Dividends received in cash are recorded on the ex-dividend date. Certain dividends from foreign securities will be recorded when the fund is informed of the dividend if such information is obtained subsequent to the ex-dividend date. Dividend and interest payments received in additional securities are recorded on the ex-dividend or ex-interest date in an amount equal to the value of the security on such date.
The fund may receive proceeds from litigation settlements. Any proceeds received from litigation involving portfolio holdings are reflected in the Statement of Operations in realized gain/loss if the security has been disposed of by the fund or in unrealized gain/loss if the security is still held by the fund. Any other proceeds from litigation not related to portfolio holdings are reflected as other income in the Statement of Operations.
Fees Paid Indirectly – The fund’s custody fee may be reduced according to an arrangement that measures the value of cash deposited with the custodian by the fund. This amount, for the year ended December 31, 2014, is shown as a reduction of total expenses in the Statement of Operations.
Tax Matters and Distributions – The fund intends to qualify as a regulated investment company, as defined under Subchapter M of the Internal Revenue Code, and to distribute all of its taxable income, including realized capital gains. As a result, no provision for federal income tax is required. The fund’s federal tax returns, when filed, will remain subject to examination by the Internal Revenue Service for a three year period. Management has analyzed the fund’s tax positions taken on federal and state tax returns for all open tax years and does not believe that there are any uncertain tax positions that require recognition of a tax liability. Foreign taxes, if any, have been accrued by the fund in the accompanying financial statements in accordance with the applicable foreign tax law. Foreign income taxes may be withheld by certain countries in which the fund invests. Additionally, capital gains realized by the fund on securities issued in or by certain foreign countries may be subject to capital gains tax imposed by those countries.
Distributions to shareholders are recorded on the ex-dividend date. Income and capital gain distributions are determined in accordance with income tax regulations, which may differ from U.S. generally accepted accounting principles. Certain capital accounts in the financial statements are periodically adjusted for permanent differences in order to reflect their tax character. These adjustments have no impact on net assets or net asset value per share. Temporary differences which arise from recognizing certain items of income, expense, gain or loss in different periods for financial statement and tax purposes will reverse at some time in the future. Distributions in excess of net investment income or net realized gains are temporary overdistributions for financial statement purposes resulting from differences in the recognition or classification of income or distributions for financial statement and tax purposes.
Book/tax differences primarily relate to net operating losses, wash sale loss deferrals, and redemptions in-kind.
The tax character of distributions declared to shareholders for the last two fiscal years is as follows:
| | | | | | | | |
| | | 12/31/14 | | | 12/31/13 | |
| Ordinary income (including any short-term capital gains) | | | $119,667,889 | | | | $7,635,845 | |
| Long-term capital gains | | | 73,898,329 | | | | — | |
| Total distributions | | | $193,566,218 | | | | $7,635,845 | |
The federal tax cost and the tax basis components of distributable earnings were as follows:
| | | | |
| As of 12/31/14 | | | | |
| Cost of investments | | | $773,955,337 | |
| Gross appreciation | | | 139,413,946 | |
| Gross depreciation | | | (45,658,890 | ) |
| Net unrealized appreciation (depreciation) | | | $93,755,056 | |
| Undistributed long-term capital gain | | | 25,797,410 | |
| Other temporary differences | | | 4 | |
Multiple Classes of Shares of Beneficial Interest – The fund offers multiple classes of shares, which differ in their respective distribution and/or service fees. The fund’s income, realized and unrealized gain (loss), and common expenses are allocated to
16
MFS New Discovery Series
Notes to Financial Statements – continued
shareholders based on the daily net assets of each class. Dividends are declared separately for each class. Differences in per share dividend rates are generally due to differences in separate class expenses. The fund’s distributions declared to shareholders as reported in the Statements of Changes in Net Assets are presented by class as follows:
| | | | | | | | |
| | | From net realized gain on
investments | |
| | | Year ended
12/31/14 | | | Year ended
12/31/13 | |
| Initial Class | | | $85,766,668 | | | | $3,332,796 | |
| Service Class | | | 107,799,550 | | | | 4,303,049 | |
| Total | | | $193,566,218 | | | | $7,635,845 | |
| (3) | | Transactions with Affiliates |
Investment Adviser – The fund has an investment advisory agreement with MFS to provide overall investment management and related administrative services and facilities to the fund. The management fee is computed daily and paid monthly at the following annual rates:
| | | | |
| First $1 billion of average daily net assets | | | 0.90% | |
| Average daily net assets in excess of $1 billion | | | 0.80% | |
MFS has agreed in writing to reduce its management fee by a specified amount if certain MFS mutual fund assets exceed thresholds agreed to by MFS and the fund’s Board of Trustees. For the year ended December 31, 2014, this management fee reduction amounted to $40,021, which is included in the reduction of total expenses in the Statement of Operations. The management fee incurred for the year ended December 31, 2014 was equivalent to an annual effective rate of 0.90% of the fund’s average daily net assets.
Effective at the close of business on August 8, 2014, the investment adviser agreed in writing to pay a portion of the fund’s total annual operating expenses, excluding interest, taxes, extraordinary expenses, brokerage and transaction costs, and investment-related expenses, such that total annual operating expenses do not exceed 0.94% of average daily net assets for the Initial Class shares and 1.19% of average daily net assets for the Service Class shares. This written agreement will continue until modified by the fund’s Board of Trustees, but such agreement will continue at least until July 31, 2016. For the period August 9, 2014 to December 31, 2014, this reduction amounted to $64,346 and is included in the reduction of total expenses in the Statement of Operations.
Distributor – MFS Fund Distributors, Inc. (MFD), a wholly-owned subsidiary of MFS, is the distributor of shares of the fund. The Trustees have adopted a distribution plan for the Service Class shares pursuant to Rule 12b-1 under the Investment Company Act of 1940.
The fund’s distribution plan provides that the fund will pay MFD distribution and/or service fees equal to 0.25% per annum of its average daily net assets attributable to Service Class shares as partial consideration for services performed and expenses incurred by MFD and financial intermediaries (including participating insurance companies that invest in the fund to fund variable annuity and variable life insurance contracts, sponsors of qualified retirement and pension plans that invest in the fund, and affiliates of these participating insurance companies and plan sponsors) in connection with the sale and distribution of the Service Class shares. MFD may subsequently pay all, or a portion, of the distribution and/or service fees to financial intermediaries.
Shareholder Servicing Agent – MFS Service Center, Inc. (MFSC), a wholly-owned subsidiary of MFS, receives a fee from the fund for its services as shareholder servicing agent. For the year ended December 31, 2014, the fee was $68,665, which equated to 0.0078% annually of the fund’s average daily net assets. MFSC also receives payment from the fund for out-of-pocket expenses paid by MFSC on behalf of the fund. For the year ended December 31, 2014, these costs amounted to $2,969.
Administrator – MFS provides certain financial, legal, shareholder communications, compliance, and other administrative services to the fund. Under an administrative services agreement, the fund partially reimburses MFS the costs incurred to provide these services. The fund is charged an annual fixed amount of $17,500 plus a fee based on average daily net assets. The administrative services fee incurred for the year ended December 31, 2014 was equivalent to an annual effective rate of 0.0146% of the fund’s average daily net assets.
Trustees’ and Officers’ Compensation – The fund pays compensation to independent Trustees in the form of a retainer, attendance fees, and additional compensation to Board and Committee chairpersons. The fund does not pay compensation directly to Trustees or officers of the fund who are also officers of the investment adviser, all of whom receive remuneration for their services to the fund from MFS. Certain officers and Trustees of the fund are officers or directors of MFS, MFD, and MFSC.
Other – Effective November 1, 2014, this fund and certain other funds managed by MFS (the funds) have entered into a service agreement (the ISO Agreement) which provides for payment of fees solely by the funds to Tarantino LLC in return for the provision of services of an Independent Senior Officer (ISO) for the funds. Frank L. Tarantino serves as the ISO and is an officer of the funds
17
MFS New Discovery Series
Notes to Financial Statements – continued
and the sole member of Tarantino LLC. The funds can terminate the ISO Agreement with Tarantino LLC at any time under the terms of the ISO Agreement. Prior to November 1, 2014, the funds had entered into services agreements (the Compliance Officer Agreements) which provided for payment of fees by the funds to Tarantino LLC and Griffin Compliance LLC in return for the provision of services of an Independent Chief Compliance Officer (ICCO) and Assistant ICCO, respectively, for the funds. Prior to November 1, 2014, Frank L. Tarantino served as the ICCO. Effective October 31, 2014, Mr. Tarantino resigned as ICCO and the Compliance Officer Agreement between the funds and Tarantino LLC was terminated. Prior to June 1, 2014, Robyn L. Griffin served as the Assistant ICCO and was an officer of the funds. Ms. Griffin is the sole member of Griffin Compliance LLC. Effective May 31, 2014, Ms. Griffin resigned as Assistant ICCO and the Compliance Officer Agreement between the funds and Griffin Compliance LLC was terminated. For the year ended December 31, 2014, the aggregate fees paid by the fund under these agreements were $3,893 and are included in “Miscellaneous” expense in the Statement of Operations. MFS had agreed to reimburse the fund for a portion of the payments made by the fund for the services under the Compliance Officer Agreements in the amount of $1,540, which is included in the reduction of total expenses in the Statement of Operations. Additionally, MFS has agreed to bear all expenses associated with office space, other administrative support, and supplies provided to the ICCO, Assistant ICCO, and ISO.
The fund invests in the MFS Institutional Money Market Portfolio which is managed by MFS and seeks current income consistent with preservation of capital and liquidity. Income earned on this investment is included in “Dividends from underlying affiliated funds” in the Statement of Operations. This money market fund does not pay a management fee to MFS.
For the year ended December 31, 2014, purchases and sales of investments, other than in-kind transactions and short-term obligations, aggregated $833,064,428 and $1,059,289,202, respectively. Purchases exclude the value of securities acquired in connection with the MFS New Discovery Portfolio merger. (See Note 9.)
| (5) | | Shares of Beneficial Interest |
The fund’s Declaration of Trust permits the Trustees to issue an unlimited number of full and fractional shares of beneficial interest. Transactions in fund shares were as follows:
| | | | | | | | | | | | | | | | |
| | | Year ended 12/31/14 | | | Year ended 12/31/13 | |
| | | Shares | | | Amount | | | Shares | | | Amount | |
| Shares sold | | | | | | | | | | | | | | | | |
Initial Class | | | 2,213,527 | | | | $39,624,819 | | | | 2,748,046 | | | | $50,534,494 | |
Service Class | | | 10,949,098 | | | | 193,646,369 | | | | 7,289,007 | | | | 129,448,987 | |
| | | 13,162,625 | | | | $233,271,188 | | | | 10,037,053 | | | | $179,983,481 | |
| Shares issued in connection with acquisition of MFS New Discovery Portfolio | | | | | | | | | | | | | | | | |
Initial Class | | | 3,770,832 | | | | $76,019,967 | | | | | | | | | |
Service Class | | | 4,528,397 | | | | 86,809,366 | | | | | | | | | |
| | | 8,299,229 | | | | $162,829,333 | | | | | | | | | |
| Shares issued to shareholders in reinvestment of distributions | | | | | | | | | | | | | | | | |
Initial Class | | | 5,138,806 | | | | $85,766,668 | | | | 170,301 | | | | $3,332,796 | |
Service Class | | | 6,883,752 | | | | 107,799,550 | | | | 230,726 | | | | 4,303,049 | |
| | | 12,022,558 | | | | $193,566,218 | | | | 401,027 | | | | $7,635,845 | |
| Shares reacquired | | | | | | | | | | | | | | | | |
Initial Class | | | (6,374,245 | ) | | | $(120,002,831 | ) | | | (8,824,446 | ) | | | $(166,822,453 | ) |
Service Class | | | (19,229,005 | ) | | | (344,846,661 | ) | | | (6,183,909 | ) | | | (111,284,311 | ) |
| | | (25,603,250 | ) | | | $(464,849,492 | ) | | | (15,008,355 | ) | | | $(278,106,764 | ) |
| Net change | | | | | | | | | | | | | | | | |
Initial Class | | | 4,748,920 | | | | $81,408,623 | | | | (5,906,099 | ) | | | $(112,955,163 | ) |
Service Class | | | 3,132,242 | | | | 43,408,624 | | | | 1,335,824 | | | | 22,467,725 | |
| | | 7,881,162 | | | | $124,817,247 | | | | (4,570,275 | ) | | | $(90,487,438 | ) |
The fund is one of several mutual funds in which certain MFS funds may invest. The MFS funds do not invest in the underlying funds for the purpose of exercising management or control. At the end of the period, the MFS Moderate Allocation Portfolio, the MFS Conservative Allocation Portfolio, and the MFS Growth Allocation Portfolio were the owners of record of approximately 4%, 1%, and 1%, respectively, of the value of outstanding voting shares of the fund.
The fund and certain other funds managed by MFS participate in a $1.1 billion unsecured committed line of credit, subject to a $1 billion sublimit, provided by a syndication of banks under a credit agreement. Borrowings may be made for temporary financing needs. Interest is charged to each fund, based on its borrowings, generally at a rate equal to the higher of the Federal Reserve funds
18
MFS New Discovery Series
Notes to Financial Statements – continued
rate or one month LIBOR plus an agreed upon spread. A commitment fee, based on the average daily, unused portion of the committed line of credit, is allocated among the participating funds at the end of each calendar quarter. In addition, the fund and other funds managed by MFS have established unsecured uncommitted borrowing arrangements with certain banks for temporary financing needs. Interest is charged to each fund, based on its borrowings, at a rate equal to the Federal Reserve funds rate plus an agreed upon spread. For the year ended December 31, 2014, the fund’s commitment fee and interest expense were $3,520 and $0, respectively, and are included in “Miscellaneous” expense in the Statement of Operations.
| (7) | | Transactions in Underlying Affiliated Funds – Affiliated Issuers |
An affiliated issuer may be considered one in which the fund owns 5% or more of the outstanding voting securities, or a company which is under common control. For the purposes of this report, the fund assumes the following to be an affiliated issuer:
| | | | | | | | | | | | | | | | |
| Underlying Affiliated Fund | | Beginning Shares/Par Amount | | | Acquisitions Shares/Par Amount | | | Dispositions Shares/Par Amount | | | Ending Shares/Par Amount | |
| MFS Institutional Money Market Portfolio | | | 670,255 | | | | 272,376,828 | | | | (260,955,043 | ) | | | 12,092,040 | |
| | | | |
| Underlying Affiliated Fund | | Realized Gain (Loss) | | | Capital Gain Distributions | | | Dividend Income | | | Ending Value | |
| MFS Institutional Money Market Portfolio | | | $— | | | | $— | | | | $5,850 | | | | $12,092,040 | |
On May 1, 2014, the fund recorded redemption proceeds for a distribution in-kind of portfolio securities and cash that were valued at $22,962,257. The redeeming shareholder generally receives a pro rata share of the securities held by the fund. The distribution of such securities generated a realized gain of $5,228,304 for the fund.
At close of business on August 8, 2014, the fund with net assets of approximately $744,555,881, acquired all of the assets and liabilities of MFS New Discovery Portfolio, a series of MFS Variable Insurance Trust II. The purpose of the transaction was to provide shareholders of MFS New Discovery Portfolio the opportunity to participate in a larger combined portfolio with an identical investment objective and similar investment policies and strategies. The acquisition was accomplished by a tax-free exchange of approximately 8,299,229 shares of the fund (valued at approximately $162,829,333) for all of the assets and liabilities of MFS New Discovery Portfolio. MFS New Discovery Portfolio then distributed the shares of the fund that MFS New Discovery Portfolio received from the fund to its shareholders. MFS New Discovery Portfolio’s investments on that date were valued at approximately $162,758,952 with a cost basis of approximately $153,890,742. For financial reporting purposes, assets received and shares issued by the fund were recorded at fair value; however, the cost basis of the investments received from MFS New Discovery Portfolio were carried forward to align ongoing reporting of the fund’s realized and unrealized gains and losses with amounts distributable to shareholders for tax purposes. Because the combined investment portfolios have been managed as a single integrated portfolio since the acquisition was completed, it is not practicable to separate the amounts of revenue and earnings of MFS New Discovery Portfolio that have been included in the fund’s Statement of Operations since August 8, 2014.
Assuming the acquisition had been completed on January 1, 2014, the fund’s pro forma results of operations for the year ended December 31, 2014 are as follows:
| | | | |
| Net investment income | | | $(5,914,333 | ) |
| Net realized and unrealized gain (loss) on investments and foreign currency | | | (83,400,871 | ) |
| Change in net assets from operations | | | $(89,315,204 | ) |
19
MFS New Discovery Series
REPORT OF INDEPENDENT REGISTERED PUBLIC ACCOUNTING FIRM
To the Board of Trustees of MFS Variable Insurance Trust and the Shareholders of
MFS New Discovery Series:
We have audited the accompanying statement of assets and liabilities, including the portfolio of investments, of MFS New Discovery Series (one of the series of MFS Variable Insurance Trust) (the “Fund”) as of December 31, 2014, and the related statement of operations for the year then ended, the statements of changes in net assets for each of the two years in the period then ended, and the financial highlights for each of the five years in the period then ended. These financial statements and financial highlights are the responsibility of the Fund’s management. Our responsibility is to express an opinion on these financial statements and financial highlights based on our audits.
We conducted our audits in accordance with the standards of the Public Company Accounting Oversight Board (United States). Those standards require that we plan and perform the audit to obtain reasonable assurance about whether the financial statements and financial highlights are free of material misstatement. The Fund is not required to have, nor were we engaged to perform, an audit of its internal control over financial reporting. Our audits included consideration of internal control over financial reporting as a basis for designing audit procedures that are appropriate in the circumstances, but not for the purpose of expressing an opinion on the effectiveness of the Fund’s internal control over financial reporting. Accordingly, we express no such opinion. An audit also includes examining, on a test basis, evidence supporting the amounts and disclosures in the financial statements, assessing the accounting principles used and significant estimates made by management, as well as evaluating the overall financial statement presentation. Our procedures included confirmation of securities owned as of December 31, 2014, by correspondence with the custodian and brokers; where replies were not received from brokers, we performed other auditing procedures. We believe that our audits provide a reasonable basis for our opinion.
In our opinion, the financial statements and financial highlights referred to above present fairly, in all material respects, the financial position of MFS New Discovery Series as of December 31, 2014, the results of its operations for the year then ended, the changes in its net assets for each of the two years in the period then ended, and the financial highlights for each of the five years in the period then ended, in conformity with accounting principles generally accepted in the United States of America.
DELOITTE & TOUCHE LLP
Boston, Massachusetts
February 13, 2015
20
MFS New Discovery Series
TRUSTEES AND OFFICERS – IDENTIFICATION AND BACKGROUND
The Trustees and Officers of the Trust, as of February 1, 2015, are listed below, together with their principal occupations during the past five years. (Their titles may have varied during that period.) The address of each Trustee and Officer is 111 Huntington Avenue, Boston, Massachusetts 02199-7618.
| | | | | | | | |
Name, Age | | Position(s)
Held with Fund | | Trustee/Officer
Since (h) | | Principal Occupations
During the Past Five Years | | Other Directorships (j) |
| INTERESTED TRUSTEES |
Robert J. Manning (k) (age 51) | | Trustee | | February 2004 | | Massachusetts Financial Services Company, Chairman, Co-Chief Executive Officer and Director; President (until 2009); Chief Investment Officer (until 2010) | | N/A |
| | | | |
Robin A. Stelmach (k) (age 53) | | Trustee and President | | January 2014 | | Massachusetts Financial Services Company, Executive Vice President and Chief Operating Officer | | N/A |
| | | |
| INDEPENDENT TRUSTEES | | | | | | |
David H. Gunning (age 72) | | Trustee and Chair of Trustees | | January 2004 | | Private investor | | Lincoln Electric Holdings, Inc. (welding equipment manufacturer), Director; Development Alternatives, Inc. (consulting), Director/Non-Executive Chairman |
| | | | |
Steven E. Buller (age 63) | | Trustee | | February 2014 | | Chairman, Financial Accounting Standards Advisory Council; Standing Advisory Group, Public Company Accounting Oversight Board, Member (until 2014); BlackRock, Inc. (investment management), Managing Director (until 2014), BlackRock Finco UK (investment management), Director (until 2014) | | N/A |
| | | | |
Robert E. Butler (age 73) | | Trustee | | January 2006 | | Consultant – investment company industry regulatory and compliance matters | | N/A |
| | | | |
Maureen R. Goldfarb (age 59) | | Trustee | | January 2009 | | Private investor | | N/A |
| | | | |
William R. Gutow (age 73) | | Trustee | | December 1993 | | Private investor and real estate consultant; Capitol Entertainment Management Company (video franchise), Vice Chairman | | Texas Donuts (donut franchise), Vice Chairman (until 2010) |
| | | | |
Michael Hegarty (age 70) | | Trustee | | December 2004 | | Private investor | | Brookfield Office Properties, Inc. (real estate), Director; Rouse Properties Inc. (real estate), Director; Capmark Financial Group Inc. (real estate), Director |
| | | | |
John P. Kavanaugh (age 60) | | Trustee | | January 2009 | | Private investor | | N/A |
| | | | |
Maryanne L. Roepke (age 58) | | Trustee | | May 2014 | | American Century Investments (investment management), Senior Vice President and Chief Compliance Officer (until 2014) | | N/A |
| | | | |
Laurie J. Thomsen (age 57) | | Trustee | | March 2005 | | Private investor; New Profit, Inc. (venture philanthropy), Executive Partner (until 2010) | | The Travelers Companies (insurance), Director |
| | | | |
Robert W. Uek (age 73) | | Trustee | | January 2006 | | Consultant to investment company industry | | N/A |
| | | | |
| OFFICERS | | | | | | | | |
Christopher R. Bohane (k) (age 41) | | Assistant Secretary and Assistant Clerk | | July 2005 | | Massachusetts Financial Services Company, Vice President and Assistant General Counsel | | N/A |
| | | | |
Kino Clark (k) (age 46) | | Assistant Treasurer | | January 2012 | | Massachusetts Financial Services Company, Vice President | | N/A |
| | | | |
Thomas H. Connors (k) (age 55) | | Assistant Secretary and Assistant Clerk | | September 2012 | | Massachusetts Financial Services Company, Vice President and Senior Counsel; Deutsche Investment Management Americas Inc. (financial service provider), Director and Senior Counsel (until 2012) | | N/A |
21
MFS New Discovery Series
Trustees and Officers – continued
| | | | | | | | |
Name, Age | | Position(s)
Held with Fund | | Trustee/Officer
Since (h) | | Principal Occupations
During the Past Five Years | | Other Directorships (j) |
Ethan D. Corey (k) (age 51) | | Assistant
Secretary and Assistant Clerk | | July 2005 | | Massachusetts Financial Services Company, Senior Vice President and Associate General Counsel | | N/A |
| | | | |
David L. DiLorenzo (k) (age 46) | | Treasurer | | July 2005 | | Massachusetts Financial Services Company, Senior Vice President | | N/A |
| | | | |
Timothy M. Fagan (k) (age 46) | | Chief Compliance Officer | | November 2014 | | Massachusetts Financial Services Company, Chief Compliance Officer; Vice President and Senior Counsel (until 2012) | | N/A |
| | | | |
Brian E. Langenfeld (k) (age 41) | | Assistant
Secretary and Assistant Clerk | | June 2006 | | Massachusetts Financial Services Company, Vice President and Senior Counsel | | N/A |
| | | | |
Susan S. Newton (k) (age 64) | | Assistant
Secretary and Assistant Clerk | | May 2005 | | Massachusetts Financial Services Company, Senior Vice President and Associate General Counsel | | N/A |
| | | | |
Susan A. Pereira (k) (age 44) | | Assistant
Secretary and Assistant Clerk | | July 2005 | | Massachusetts Financial Services Company, Vice President and Senior Counsel | | N/A |
| | | | |
Kasey L. Phillips (k) (age 44) | | Assistant Treasurer | | September 2012 | | Massachusetts Financial Services Company, Vice President; Wells Fargo Funds Management, LLC, Senior Vice President, Fund Treasurer (until 2012) | | N/A |
| | | | |
Mark N. Polebaum (k) (age 62) | | Secretary and
Clerk | | January 2006 | | Massachusetts Financial Services Company, Executive Vice President, General Counsel and Secretary | | N/A |
| | | | |
Matthew A. Stowe (k) (age 40) | | Assistant Secretary and Assistant Clerk | | October 2014 | | Massachusetts Financial Services Company, Vice President and Senior Counsel | | N/A |
| | | | |
Frank L. Tarantino (age 70) | | Independent
Senior Officer | | June 2004 | | Tarantino LLC (provider of compliance services), Principal | | N/A |
| | | | |
Richard S. Weitzel (k) (age 44) | | Assistant Secretary and Assistant Clerk | | October 2007 | | Massachusetts Financial Services Company, Senior Vice President and Associate General Counsel | | N/A |
| | | | |
James O. Yost (k) (age 54) | | Deputy Treasurer | | September 1990 | | Massachusetts Financial Services Company, Senior Vice President | | N/A |
| (h) | Date first appointed to serve as Trustee/officer of an MFS Fund. Each Trustee has served continuously since appointment unless indicated otherwise. For the period from December 15, 2004 until February 22, 2005, Mr. Manning served as Advisory Trustee. Prior to January 2012, Messrs. DiLorenzo and Yost served as Assistant Treasurers of the Funds. Ms. Stelmach was appointed as President of the Funds as of October 1, 2014. |
| (j) | Directorships or trusteeships of companies required to report to the Securities and Exchange Commission (i.e., “public companies”). |
| (k) | “Interested person” of the Trust within the meaning of the Investment Company Act of 1940 (referred to as the 1940 Act), which is the principal federal law governing investment companies like the fund, as a result of a position with MFS. The address of MFS is 111 Huntington Avenue, Boston, Massachusetts 02199-7618. |
Each Trustee (except Ms. Stelmach, Mr. Buller and Ms. Roepke) has been elected by shareholders and each Trustee and officer holds office until his or her successor is chosen and qualified or until his or her earlier death, resignation, retirement or removal. The Trust does not hold annual meetings for the purpose of electing Trustees, and Trustees are not elected for fixed terms. Messrs. Butler, Kavanaugh, Uek and Mses. Thomsen and Roepke are members of the Trust’s Audit Committee.
Each of the Fund’s Trustees and officers holds comparable positions with certain other funds of which MFS or a subsidiary is the investment adviser or distributor, and, in the case of the officers, with certain affiliates of MFS. As of February 1, 2015, the Trustees served as board members of 135 funds within the MFS Family of Funds.
22
MFS New Discovery Series
Trustees and Officers – continued
The Statement of Additional Information for the Fund includes further information about the Trustees and is available without charge upon request by calling 1-800-225-2606.
| | |
Investment Adviser Massachusetts Financial Services Company 111 Huntington Avenue Boston, MA 02199-7618 | | Custodian State Street Bank and Trust Company 1 Lincoln Street Boston, MA 02111-2900 |
Distributor MFS Fund Distributors, Inc. 111 Huntington Avenue Boston, MA 02199-7618 | | Independent Registered Public Accounting Firm Deloitte & Touche LLP 200 Berkeley Street Boston, MA 02116 |
Portfolio Managers Paul Gordon Michael Grossman | | |
23
MFS New Discovery Series
BOARD REVIEW OF INVESTMENT ADVISORY AGREEMENT
The Investment Company Act of 1940 requires that both the full Board of Trustees and a majority of the non-interested (“independent”) Trustees, voting separately, annually approve the continuation of the Fund’s investment advisory agreement with MFS. The Trustees consider matters bearing on the Fund and its advisory arrangements at their meetings throughout the year, including a review of performance data at each regular meeting. In addition, the independent Trustees met several times over the course of three months beginning in May and ending in July, 2014 (“contract review meetings”) for the specific purpose of considering whether to approve the continuation of the investment advisory agreement for the Fund and the other investment companies that the Board oversees (the “MFS Funds”). The independent Trustees were assisted in their evaluation of the Fund’s investment advisory agreement by independent legal counsel, from whom they received separate legal advice and with whom they met separately from MFS during various contract review meetings. The independent Trustees were also assisted in this process by the MFS Funds’ Independent Chief Compliance Officer, a full-time senior officer appointed by and reporting to the independent Trustees.
In connection with their deliberations regarding the continuation of the investment advisory agreement, the Trustees, including the independent Trustees, considered such information and factors as they believed, in light of the legal advice furnished to them and their own business judgment, to be relevant. The investment advisory agreement for the Fund was considered separately, although the Trustees also took into account the common interests of all MFS Funds in their review. As described below, the Trustees considered the nature, quality, and extent of the various investment advisory, administrative, and shareholder services performed by MFS under the existing investment advisory agreement and other arrangements with the Fund.
In connection with their contract review meetings, the Trustees received and relied upon materials that included, among other items: (i) information provided by Lipper Inc., an independent third party, on the investment performance of the Fund for various time periods ended December 31, 2013 and the investment performance of a group of funds with substantially similar investment classifications/objectives (the “Lipper performance universe”), (ii) information provided by Lipper Inc. on the Fund’s advisory fees and other expenses and the advisory fees and other expenses of comparable funds identified by Lipper Inc. (the “Lipper expense group”), (iii) information provided by MFS on the advisory fees of comparable portfolios of other clients of MFS, including institutional separate accounts and other clients, (iv) information as to whether and to what extent applicable expense waivers, reimbursements or fee “breakpoints” are observed for the Fund, (v) information regarding MFS’ financial results and financial condition, including MFS’ and certain of its affiliates’ estimated profitability from services performed for the Fund and the MFS Funds as a whole, and compared to MFS’ institutional business, (vi) MFS’ views regarding the outlook for the mutual fund industry and the strategic business plans of MFS, (vii) descriptions of various functions performed by MFS for the Funds, such as compliance monitoring and portfolio trading practices, and (viii) information regarding the overall organization of MFS, including information about MFS’ senior management and other personnel providing investment advisory, administrative and other services to the Fund and the other MFS Funds. The comparative performance, fee and expense information prepared and provided by Lipper Inc. was not independently verified and the independent Trustees did not independently verify any information provided to them by MFS.
The Trustees’ conclusion as to the continuation of the investment advisory agreement was based on a comprehensive consideration of all information provided to the Trustees and not the result of any single factor. Some of the factors that figured particularly in the Trustees’ deliberations are described below, although individual Trustees may have evaluated the information presented differently from one another, giving different weights to various factors. It is also important to recognize that the fee arrangements for the Fund and other MFS Funds are the result of years of review and discussion between the independent Trustees and MFS, that certain aspects of such arrangements may receive greater scrutiny in some years than in others, and that the Trustees’ conclusions may be based, in part, on their consideration of these same arrangements during the course of the year and in prior years.
Based on information provided by Lipper Inc. and MFS, the Trustees reviewed the Fund’s total return investment performance as well as the performance of peer groups of funds over various time periods. The Trustees placed particular emphasis on the total return performance of the Fund’s Initial Class shares in comparison to the performance of funds in its Lipper performance universe over the three-year period ended December 31, 2013, which the Trustees believed was a long enough period to reflect differing market conditions. The total return performance of the Fund’s Initial Class shares was in the 4th quintile relative to the other funds in the universe for this three-year period (the 1st quintile being the best performers and the 5th quintile being the worst performers). The total return performance of the Fund’s Initial Class shares was in the 3rd quintile for the one-year period and the 1st quintile for the five-year period ended December 31, 2013 relative to the Lipper performance universe. Because of the passage of time, these performance results may differ from the performance results for more recent periods, including those shown elsewhere in this report.
The Trustees expressed concern to MFS about the substandard investment performance of the Fund’s retail counterpart, MFS New Discovery Fund, which has substantially similar investment strategies and experienced substantially similar investment performance as the Fund. In the course of their deliberations, the Trustees took into account information provided by MFS in connection with the contract review meetings, including more recent performance information, as well as during investment review meetings conducted with portfolio management personnel during the course of the year as to MFS’ efforts to improve the performance of the Fund’s
24
MFS New Discovery Series
Board Review of Investment Advisory Agreement – continued
retail counterpart. In addition, the Trustees requested that they receive a separate update on the Fund’s retail counterpart at each of their regular meetings. After reviewing these and related factors, the Trustees concluded, within the context of their overall conclusions regarding the investment advisory agreement, that MFS’ responses and efforts and plans to improve investment performance were sufficient to support approval of the continuance of the investment advisory agreement for an additional one-year period, but that they would continue to closely monitor the performance of the Fund’s retail counterpart.
In assessing the reasonableness of the Fund’s advisory fee, the Trustees considered, among other information, the Fund’s advisory fee and the total expense ratio of the Fund’s Initial Class shares as a percentage of average daily net assets and the advisory fee and total expense ratios of peer groups of funds based on information provided by Lipper Inc. The Trustees considered that, according to the Lipper data (which takes into account any fee reductions or expense limitations that were in effect during the Fund’s last fiscal year), the Fund’s effective advisory fee rate and total expense ratio were each approximately at the Lipper expense group median.
The Trustees also considered the advisory fees charged by MFS to any comparable institutional accounts. In comparing these fees, the Trustees considered information provided by MFS as to the generally broader scope of services provided by MFS to the Fund in comparison to institutional accounts, the higher demands placed on MFS’ investment personnel and trading infrastructure as a result of the daily cash in-flows and out-flows of the Fund, and the impact on MFS and expenses associated with the more extensive regulatory regime to which the Fund is subject in comparison to institutional accounts.
The Trustees also considered whether the Fund may benefit from any economies of scale in the management of the Fund in the event of growth in assets of the Fund and/or growth in assets of the MFS Funds as a whole. They noted that the Fund’s advisory fee rate schedule is subject to a contractual breakpoint that reduces the Fund’s advisory fee rate on average daily net assets over $1 billion. The Trustees also noted that MFS has agreed in writing to waive a portion of the management fees of certain MFS Funds, including the Fund, if the total combined assets of certain funds within the MFS Funds’ complex increase above agreed upon thresholds (the “group fee waiver”), enabling the Fund’s shareholders to share in the benefits from any economies of scale at the complex level. The group fee waiver is reviewed and renewed annually between the Board and MFS. The Trustees concluded that the breakpoint and the group fee waiver were sufficient to allow the Fund to benefit from economies of scale as its assets and overall complex assets grow.
The Trustees also considered information prepared by MFS relating to MFS’ costs and profits with respect to the Fund, the MFS Funds considered as a group, and other investment companies and accounts advised by MFS, as well as MFS’ methodologies used to determine and allocate its costs to the MFS Funds, the Fund and other accounts and products for purposes of estimating profitability.
After reviewing these and other factors described herein, the Trustees concluded, within the context of their overall conclusions regarding the investment advisory agreement, that the advisory fees charged to the Fund represent reasonable compensation in light of the services being provided by MFS to the Fund.
In addition, the Trustees considered MFS’ resources and related efforts to continue to retain, attract and motivate capable personnel to serve the Fund. The Trustees also considered current and developing conditions in the financial services industry, including the presence of large and well-capitalized companies which are spending, and appear to be prepared to continue to spend, substantial sums to engage personnel and to provide services to competing investment companies. In this regard, the Trustees also considered the financial resources of MFS and its ultimate parent, Sun Life Financial Inc. The Trustees also considered the advantages and possible disadvantages to the Fund of having an adviser that also serves other investment companies as well as other accounts.
The Trustees also considered the nature, quality, cost, and extent of administrative, transfer agency, and distribution services provided to the Fund by MFS and its affiliates under agreements and plans other than the investment advisory agreement, including any 12b-1 fees the Fund pays to MFS Fund Distributors, Inc., an affiliate of MFS. The Trustees also considered the nature, extent and quality of certain other services MFS performs or arranges for on the Fund’s behalf, which may include securities lending programs, directed expense payment programs, class action recovery programs, and MFS’ interaction with third-party service providers, principally custodians and sub-custodians. The Trustees concluded that the various non-advisory services provided by MFS and its affiliates on behalf of the Fund were satisfactory.
The Trustees also considered benefits to MFS from the use of the Fund’s portfolio brokerage commissions, if applicable, to pay for investment research and various other factors. Additionally, the Trustees considered so-called “fall-out benefits” to MFS such as reputational value derived from serving as investment manager to the Fund.
Based on their evaluation of factors that they deemed to be material, including those factors described above, the Board of Trustees, including the independent Trustees, concluded that the Fund’s investment advisory agreement with MFS should be continued for an additional one-year period, commencing August 1, 2014.
25
MFS New Discovery Series
PROXY VOTING POLICIES AND INFORMATION
MFS votes proxies on behalf of the fund pursuant to proxy voting policies and procedures that are available without charge, upon request, by calling 1-800-225-2606, by visiting the Proxy Voting section of mfs.com or by visiting the SEC’s Web site at http://www.sec.gov.
Information regarding how the fund voted proxies relating to portfolio securities during the most recent twelve-month period ended June 30 is available without charge by visiting the Proxy Voting section of mfs.com or by visiting the SEC’s Web site at http://www.sec.gov.
QUARTERLY PORTFOLIO DISCLOSURE
The fund will file a complete schedule of portfolio holdings with the Securities and Exchange Commission (the Commission) for the first and third quarters of each fiscal year on Form N-Q. The fund’s Form N-Q is available on the EDGAR database on the Commission’s Internet Web site at http://www.sec.gov, and may be reviewed and copied at the:
Public Reference Room
Securities and Exchange Commission
100 F Street, NE, Room 1580
Washington, D.C. 20549
Information on the operation of the Public Reference Room may be obtained by calling the Commission at 1-800-SEC-0330. Copies of the fund’s Form N-Q also may be obtained, upon payment of a duplicating fee, by electronic request at the following e-mail address: publicinfo@sec.gov or by writing the Public Reference Section at the above address.
FURTHER INFORMATION
From time to time, MFS may post important information about the fund or the MFS funds on the MFS web site (mfs.com). This information is available by visiting the “Market Commentary” and “Announcements” sub sections in the “Market Outlooks” section of mfs.com or by clicking on the fund’s name under “Variable Insurance Portfolios — VIT” in the “Products” section of mfs.com.
FEDERAL TAX INFORMATION (unaudited)
The following information is provided pursuant to provisions of the Internal Revenue Code.
The fund designates $81,289,000 as capital gain dividends paid during the fiscal year.
26
rev. 3/11
| | | | |
| FACTS | | WHAT DOES MFS DO WITH YOUR
PERSONAL INFORMATION? | |  |
| | |
| Why? | | Financial companies choose how they share your personal information. Federal law gives consumers the right to limit some but not all sharing. Federal law also requires us to tell you how we collect, share, and protect your personal information. Please read this notice carefully to understand what we do. |
| | |
| What? | | The types of personal information we collect and share depend on the product or service you have with us. This information can include: • Social Security number and account balances • Account transactions and transaction history • Checking account information and wire transfer instructions When you are no longer our customer, we continue to share your information as described in this notice. |
| | |
| How? | | All financial companies need to share customers’ personal information to run their everyday business. In the section below, we list the reasons financial companies can share their customers’ personal information; the reasons MFS chooses to share; and whether you can limit this sharing. |
| | | | |
Reasons we can share your
personal information | | Does MFS share? | | Can you limit this
sharing? |
For our everyday business purposes – such as to process your transactions, maintain your account(s), respond to court orders and legal investigations, or report to credit bureaus | | Yes | | No |
For our marketing purposes – to offer our products and services to you | | No | | We don’t share |
| For joint marketing with other financial companies | | No | | We don’t share |
For our affiliates’ everyday business purposes – information about your transactions and experiences | | No | | We don’t share |
For our affiliates’ everyday business purposes – information about your creditworthiness | | No | | We don’t share |
| For nonaffiliates to market to you | | No | | We don’t share |
| | |
| Questions? | | Call 800-225-2606 or go to mfs.com. |
27
| | |
| Who we are |
| Who is providing this notice? | | MFS Funds, MFS Investment Management, MFS Institutional Advisors, Inc., MFS Fund Distributors, Inc., MFS Heritage Trust Company, and MFS Service Center, Inc. |
| | |
| What we do |
| How does MFS protect my personal information? | | To protect your personal information from unauthorized access and use, we use security measures that comply with federal law. These measures include procedural, electronic, and physical safeguards for the protection of the personal information we collect about you. |
How does MFS
collect my personal information? | | We collect your personal information, for example, when you • open an account or provide account information • direct us to buy securities or direct us to sell your securities • make a wire transfer We also collect your personal information from others, such as credit bureaus, affiliates and other companies. |
| Why can’t I limit all sharing? | | Federal law gives you the right to limit only • sharing for affiliates’ everyday business purposes – information about your creditworthiness • affiliates from using your information to market to you • sharing for nonaffiliates to market to you State laws and individual companies may give you additional rights to limit sharing. |
| | |
| Definitions |
| Affiliates | | Companies related by common ownership or control. They can be financial and nonfinancial companies. •MFS does not share personal information with affiliates, except for everyday business purposes as described on page one of this notice. |
| Nonaffiliates | | Companies not related by common ownership or control. They can be financial and nonfinancial companies. •MFS does not share with nonaffiliates so they can market to you. |
| Joint Marketing | | A formal agreement between nonaffiliated financial companies that together market financial products or services to you. •MFS doesn’t jointly market. |
| | |
| Other important information |
| If you own an MFS product or receive an MFS service in the name of a third party such as a bank or broker-dealer, their privacy policy may apply to you instead of ours. |
28
ANNUAL REPORT
December 31, 2014

MFS® RESEARCH BOND SERIES
MFS® Variable Insurance Trust

VFB-ANN
MFS® RESEARCH BOND SERIES
CONTENTS
The report is prepared for the general information of contract owners. It is authorized for distribution to prospective investors only when preceded or accompanied by a current prospectus.
NOT FDIC INSURED Ÿ MAY LOSE VALUE Ÿ NO BANK OR CREDIT UNION GUARANTEE Ÿ NOT A DEPOSIT Ÿ NOT INSURED BY ANY FEDERAL GOVERNMENT AGENCY OR NCUA/NCUSIF
MFS Research Bond Series
LETTER FROM THE CHAIRMAN

Dear Contract Owners:
As 2015 begins, sharply lower oil prices are reshaping the global economy, adding to deflationary pressures in the eurozone and exacerbating challenges faced by oil exporters such as Russia. The U.S. economy stands on firmer ground, having expanded steadily over the past year. The U.S. labor market has regained momentum, consumer confidence is buoyant and gasoline prices have tumbled, boosting prospects for a stronger economic rebound in 2015.
Other regions are struggling. The eurozone economy is barely expanding, and the European Central Bank (ECB) has introduced large-scale asset purchases.
Despite Japan’s efforts to strengthen its economy, its sales tax increase last spring tipped the country into a recession, leading to additional monetary stimulus from the Bank of Japan. China’s economy is slowing as it transitions to a more sustainable basis, and its growth rate will likely continue to decline.
As always, active risk management is integral to how we at MFS® manage your investments. We use a collaborative process, sharing insights across asset classes, regions and economic sectors. Our global investment team uses a diversified, multidisciplined, long-term approach.
Applying proven principles, such as asset allocation and diversification, can best serve investors over the long term. We are confident that this approach can help you as you work with your financial advisors to reach your goals in the years ahead.
Respectfully,

Robert J. Manning
Chairman
MFS Investment Management
February 13, 2015
The opinions expressed in this letter are subject to change and may not be relied upon for investment advice. No forecasts can be guaranteed.
1
MFS Research Bond Series
PORTFOLIO COMPOSITION
Portfolio structure (i)
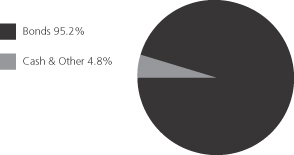
| | | | |
| Fixed income sectors (i) | | | | |
| Investment Grade Corporates | | | 35.4% | |
| Mortgage-Backed Securities | | | 19.0% | |
| U.S. Treasury Securities | | | 17.1% | |
| Commercial Mortgage-Backed Securities | | | 7.8% | |
| High Yield Corporates | | | 6.6% | |
| Asset-Backed Securities | | | 2.7% | |
| U.S. Government Agencies | | | 2.3% | |
| Emerging Markets Bonds | | | 2.0% | |
| Collateralized Debt Obligations | | | 1.5% | |
| Non-U.S. Government Bonds | | | 0.6% | |
| Residential Mortgage-Backed Securities | | | 0.1% | |
| Municipal Bonds | | | 0.1% | |
| | | | |
| Composition including fixed income credit quality (a)(i) | |
| AAA | | | 6.3% | |
| AA | | | 2.2% | |
| A | | | 12.2% | |
| BBB | | | 26.6% | |
| BB | | | 5.8% | |
| B | | | 3.7% | |
| CCC (o) | | | 0.0% | |
| C (o) | | | 0.0% | |
| D (o) | | | 0.0% | |
| U.S. Government | | | 20.1% | |
| Federal Agencies | | | 21.3% | |
| Not Rated | | | (3.0)% | |
| Cash & Other | | | 4.8% | |
| |
| Portfolio facts (i) | | | | |
| Average Duration (d) | | | 5.0 | |
| Average Effective Maturity (m) | | | 7.7 yrs. | |
| (a) | | For all securities other than those specifically described below, ratings are assigned to underlying securities utilizing ratings from Moody’s, Fitch, and Standard & Poor’s rating agencies and applying the following hierarchy: If all three agencies provide a rating, the middle rating (after dropping the highest and lowest ratings) is assigned; if two of the three agencies rate a security, the lower of the two is assigned. Ratings are shown in the S&P and Fitch scale (e.g., AAA). Securities rated BBB or higher are considered investment grade. All ratings are subject to change. U.S. Government includes securities issued by the U.S. Department of the Treasury. Federal Agencies includes rated and unrated U.S. Agency fixed-income securities, U.S. Agency mortgage-backed securities, and collateralized mortgage obligations of U.S. Agency mortgage-backed securities. Not Rated includes fixed income securities, including fixed income futures contracts, which have not been rated by any rating agency. The fund may not hold all of these instruments. The fund is not rated by these agencies. |
| (d) | | Duration is a measure of how much a bond’s price is likely to fluctuate with general changes in interest rates, e.g., if rates rise 1.00%, a bond with a 5-year duration is likely to lose about 5.00% of its value due to the interest rate move. |
| (i) | | For purposes of this presentation, the components include the value of securities, and reflect the impact of the equivalent exposure of derivative positions, if any. These amounts may be negative from time to time. Equivalent exposure is a calculated amount that translates the derivative position into a reasonable approximation of the amount of the underlying asset that the portfolio would have to hold at a given point in time to have the same price sensitivity that results from the portfolio’s ownership of the derivative contract. When dealing with derivatives, equivalent exposure is a more representative measure of the potential impact of a position on portfolio performance than value. The bond component will include any accrued interest amounts. |
| (m) | | In determining an instrument’s effective maturity for purposes of calculating the fund’s dollar-weighted average effective maturity, MFS uses the instrument’s stated maturity or, if applicable, an earlier date on which MFS believes it is probable that a maturity-shortening device (such as a put, pre-refunding or prepayment) will cause the instrument to be repaid. Such an earlier date can be substantially shorter than the instrument’s stated maturity. |
Where the fund holds convertible bonds, these are treated as part of the equity portion of the portfolio.
Cash & Other can include cash, other assets less liabilities, offsets to derivative positions, and short-term securities.
Percentages are based on net assets as of 12/31/14.
The portfolio is actively managed and current holdings may be different.
2
MFS Research Bond Series
MANAGEMENT REVIEW
Summary of Results
For the twelve months ended December 31, 2014, Initial Class shares of the MFS Research Bond Series (“fund”) provided a total return of 5.85%, while Service Class shares of the fund provided a total return of 5.62%. These compare with a return of 5.97% over the same period for the fund’s benchmark, the Barclays U.S. Aggregate Bond Index.
Market Environment
Early in the period, US equities suffered what proved to be a temporary setback due to concerns over emerging markets as well as what was perceived at the time to be a pause in US economic growth, partially caused by extreme weather events and a weak December 2013 labor market report. Markets soon recovered as the economic pause concluded and investors appeared to have become increasingly comfortable that newly-installed US Federal Reserve (“Fed”) Chair Janet Yellen would not make any substantial changes to the trajectory of Fed monetary policy.
A generally risk-friendly, carry trade environment persisted from February 2014 until mid-year. While geopolitical tensions flared in the Middle East and Russia/Ukraine, any market setbacks were short-lived as improving economic growth in the US, coupled with prospects for easier monetary policy in regions with slowing growth, such as Japan, Europe and China, supported risk assets. For example, the European Central Bank (“ECB”) cut policy interest rates into negative territory and, by the end of the period, expectations were for additional rate cuts and the announcement for non-conventional easing measures. Similarly, the Bank of Japan surprised markets late in the period with fresh stimulus measures given lackluster growth trends. The related decline in developed market government bond yields and credit spreads were also supportive for equity markets. At the end of the period, the US equity market was trading close to all-time highs and US Treasury yields were close to their lows for the period. However, credit markets did not fare as well in the second half of 2014, particularly US high yield and emerging market debt. The higher weightings of oil and gas credits in these asset classes resulted in widening spreads and increased volatility as oil prices began to decline in an accelerated fashion in the fourth quarter.
Detractors from Performance
The fund’s greater exposure to “BBB” rated (r) bonds and below was a primary detractor from performance relative to the Barclays U.S. Aggregate Bond Index as bonds in these credit quality segments underperformed over the reporting period.
Contributors to Performance
The fund’s greater exposure to the financial and industrials sectors benefited relative performance as these market segments posted strong returns over the reporting period.
The portion of the fund’s return derived from yield, which was greater than that of the benchmark, also benefited relative performance.
Respectfully,
| | | | |
| Joshua Marston | | Robert Persons | | Jeffrey Wakelin |
| Portfolio Manager | | Portfolio Manager | | Portfolio Manager |
| (r) | Bonds rated “BBB”, “Baa”, or higher are considered investment grade; bonds rated “BB”, “Ba”, or below are considered non-investment grade. The source for bond quality ratings is Moody’s Investors Service, Standard & Poor’s and Fitch, Inc. and are applied using the following hierarchy: If all three agencies provide a rating, the middle rating (after dropping the highest and lowest ratings) is assigned; if two of the three agencies rate a security, the lower of the two is assigned. Ratings are shown in the S&P and Fitch scale (e.g., AAA). For securities which are not rated by any of the three agencies, the security is considered Not Rated. |
The views expressed in this report are those of the portfolio managers only through the end of the period of the report as stated on the cover and do not necessarily reflect the views of MFS or any other person in the MFS organization. These views are subject to change at any time based on market or other conditions, and MFS disclaims any responsibility to update such views. These views may not be relied upon as investment advice or an indication of trading intent on behalf of any MFS portfolio. References to specific securities are not recommendations of such securities, and may not be representative of any MFS portfolio’s current or future investments.
3
MFS Research Bond Series
PERFORMANCE SUMMARY THROUGH 12/31/14
The following chart illustrates the historical performance of the fund in comparison to its benchmark(s). Benchmarks are unmanaged and may not be invested in directly. Benchmark returns do not reflect any fees or expenses. The performance of other share classes will be greater than or less than that of the class depicted below. (See Notes to Performance Summary.)
Performance data shown represents past performance and is no guarantee of future results. Investment return and principal value fluctuate so your units, when sold, may be worth more or less than the original cost; current performance may be lower or higher than quoted. The performance shown does not reflect the deduction of taxes, if any, that a contract holder would pay on fund distributions or the redemption of contract units. The returns for the fund shown also do not reflect the deduction of expenses associated with variable products, such as mortality and expense risk charges, separate account charges, and sales charges imposed by the insurance company separate accounts. Such expenses would reduce the overall returns shown.
Growth of a Hypothetical $10,000 Investment
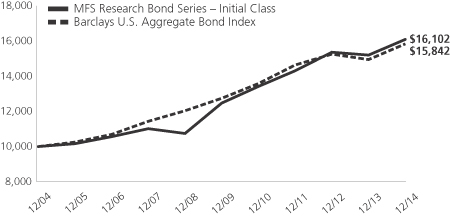
Total Returns through 12/31/14
Average annual total returns
| | | | | | | | | | | | |
| | | Share Class | | Class inception date | | 1-yr | | 5-yr | | 10-yr | | |
| | | Initial Class | | 10/24/95 | | 5.85% | | 5.22% | | 4.88% | | |
| | | Service Class | | 5/01/00 | | 5.62% | | 4.96% | | 4.61% | | |
| | | | |
| Comparative benchmark | | | | | | | | |
| | | Barclays U.S. Aggregate Bond Index (f) | | 5.97% | | 4.45% | | 4.71% | | |
| (f) | Source: FactSet Research Systems Inc. |
Benchmark Definition
Barclays U.S. Aggregate Bond Index – a market capitalization-weighted index that measures the performance of the U.S. investment-grade, fixed rate bond market, with index components for government and corporate securities, mortgage pass-through securities, and asset-backed securities with at least one year to final maturity.
It is not possible to invest directly in an index.
Notes to Performance Summary
Average annual total return represents the average annual change in value for each share class for the periods presented.
Performance results reflect any applicable expense subsidies and waivers in effect during the periods shown. Without such subsidies and waivers the fund’s performance results would be less favorable. Please see the prospectus and financial statements for complete details. All results are historical and assume the reinvestment of any dividends and capital gains distributions.
Performance results do not include adjustments made for financial reporting purposes in accordance with U.S. generally accepted accounting principles and may differ from amounts reported in the financial highlights.
From time to time the fund may receive proceeds from litigation settlements, without which performance would be lower.
4
MFS Research Bond Series
EXPENSE TABLE
Fund Expenses Borne by the Contract Holders During the Period,
July 1, 2014 through December 31, 2014
As a contract holder of the fund, you incur ongoing costs, including management fees; distribution and/or service (12b-1) fees; and other fund expenses. This example is intended to help you understand your ongoing costs (in dollars) of investing in the fund and to compare these costs with the ongoing costs of investing in other mutual funds.
The example is based on an investment of $1,000 invested at the beginning of the period and held for the entire period July 1, 2014 through December 31, 2014.
Actual Expenses
The first line for each share class in the following table provides information about actual account values and actual expenses. You may use the information in this line, together with the amount you invested, to estimate the expenses that you paid over the period. Simply divide your account value by $1,000 (for example, an $8,600 account value divided by $1,000 = 8.6), then multiply the result by the number in the first line under the heading entitled “Expenses Paid During Period” to estimate the expenses you paid on your account during this period.
Hypothetical Example for Comparison Purposes
The second line for each share class in the following table provides information about hypothetical account values and hypothetical expenses based on the fund’s actual expense ratio and an assumed rate of return of 5% per year before expenses, which is not the fund’s actual return. The hypothetical account values and expenses may not be used to estimate the actual ending account balance or expenses you paid for the period. You may use this information to compare the ongoing costs of investing in the fund and other funds. To do so, compare this 5% hypothetical example with the 5% hypothetical examples that appear in the shareholder reports of the other funds.
Please note that the expenses shown in the table are meant to highlight the fund’s ongoing costs only and do not take into account the fees and expenses imposed under the variable contracts through which your investment in the fund is made. Therefore, the second line for each share class in the table is useful in comparing ongoing costs associated with an investment in vehicles (such as the fund) which fund benefits under variable annuity and variable life insurance contracts and to qualified pension and retirement plans only, and will not help you determine the relative total costs of investing in the fund through variable annuity and variable life insurance contracts. If the fees and expenses imposed under the variable contracts were included, your costs would have been higher.
| | | | | | | | | | | | | | | | | | |
| Share Class | | | | Annualized
Expense Ratio | | | Beginning
Account Value
7/01/14 | | | Ending Account Value
12/31/14 | | | Expenses Paid
During Period (p)
7/01/14-12/31/14 | |
| Initial Class | | Actual | | | 0.52% | | | | $1,000.00 | | | | $1,012.20 | | | | $2.64 | |
| | Hypothetical (h) | | | 0.52% | | | | $1,000.00 | | | | $1,022.58 | | | | $2.65 | |
| Service Class | | Actual | | | 0.77% | | | | $1,000.00 | | | | $1,011.56 | | | | $3.90 | |
| | Hypothetical (h) | | | 0.77% | | | | $1,000.00 | | | | $1,021.32 | | | | $3.92 | |
| (h) | 5% class return per year before expenses. |
| (p) | “Expenses Paid During Period” are equal to each class’s annualized expense ratio, as shown above, multiplied by the average account value over the period, multiplied by 184/365 (to reflect the one-half year period). |
5
MFS Research Bond Series
PORTFOLIO OF INVESTMENTS – 12/31/14
The Portfolio of Investments is a complete list of all securities owned by your fund. It is categorized by broad-based asset classes.
| | | | | | | | |
| Issuer | | Shares/Par | | | Value ($) | |
| | | | | | | | |
| BONDS – 97.4% | | | | | |
| Aerospace – 0.1% | | | | | | | | |
| Bombardier, Inc., 7.75%, 3/15/20 (n) | | $ | 2,085,000 | | | $ | 2,262,225 | |
| | | | | | | | |
| Apparel Manufacturers – 0.1% | | | | | | | | |
| PVH Corp., 4.5%, 12/15/22 | | $ | 1,745,000 | | | $ | 1,723,188 | |
| | | | | | | | |
| Asset-Backed & Securitized – 12.1% | |
| AmeriCredit Automobile Receivables Trust, “A2”, 0.54%, 10/10/17 | | $ | 6,044,000 | | | $ | 6,040,271 | |
| Ameriquest Mortgage Securities, Inc., “M1”, FRN, 0.639%, 10/25/35 | | | 2,800,000 | | | | 2,714,186 | |
| ARI Fleet Lease Trust, “A”, FRN, 0.71%, 3/15/20 (n) | | | 370,652 | | | | 370,567 | |
| ARI Fleet Lease Trust, “A”, FRN, 0.46%, 1/15/21 (n) | | | 737,861 | | | | 737,582 | |
| Babson Ltd., CLO, FRN, 1.33%, 4/20/25 (z) | | | 7,294,218 | | | | 7,166,927 | |
| Banc of America Commercial Mortgage, Inc., 5.337%, 12/15/43 (n) | | | 2,801,036 | | | | 2,975,258 | |
| Banc of America Commercial Mortgage, Inc., FRN, 5.605%, 4/24/49 (n) | | | 637,169 | | | | 687,123 | |
| Banc of America Large Loan, Inc., FRN, 5.325%, 2/24/44 (n) | | | 8,700,365 | | | | 9,287,335 | |
| Bayview Commercial Asset Trust, FRN, 0%, 4/25/36 (i)(z) | | | 312,897 | | | | 252 | |
| Bayview Commercial Asset Trust, FRN, 0%, 7/25/36 (i)(z) | | | 226,003 | | | | 0 | |
| Bayview Commercial Asset Trust, FRN, 0%, 10/25/36 (i)(z) | | | 582,824 | | | | 0 | |
| Bayview Commercial Asset Trust, FRN, 0%, 12/25/36 (i)(z) | | | 291,400 | | | | 0 | |
| Bayview Commercial Asset Trust, FRN, 0%, 3/25/37 (i)(z) | | | 639,324 | | | | 0 | |
| Bayview Financial Acquisition Trust, FRN, 5.483%, 2/28/41 | | | 11,984 | | | | 12,269 | |
| Bayview Financial Revolving Mortgage Loan Trust, FRN, 1.769%, 12/28/40 (z) | | | 144,148 | | | | 86,034 | |
| Bear Stearns Commercial Mortgage Securities, Inc., “A3”, 5.793%, 9/11/42 | | | 414,446 | | | | 414,061 | |
| Bear Stearns Commercial Mortgage Securities, Inc., “A4”, FRN, 5.471%, 1/12/45 | | | 5,066,497 | | | | 5,428,285 | |
| Bear Stearns Commercial Mortgage Securities, Inc., “A4”, FRN, 5.742%, 9/11/42 | | | 2,810,000 | | | | 3,073,825 | |
| Bear Stearns Cos., Inc., “A2”, FRN, 0.619%, 12/25/42 | | | 1,402,601 | | | | 1,375,458 | |
| Capital Trust Realty Ltd., CDO, 5.267%, 6/25/35 (z) | | | 950,601 | | | | 949,175 | |
| Cent CDO XI Ltd., “A1”, FRN, 0.493%, 4/25/19 (n) | | | 3,506,756 | | | | 3,470,306 | |
| Chesapeake Funding LLC, “A”, FRN, 0.907%, 11/07/23 (n) | | | 725,683 | | | | 727,437 | |
| Chesapeake Funding LLC, “A”, FRN, 0.607%, 1/07/25 (n) | | | 10,251,415 | | | | 10,241,748 | |
| | | | | | | | |
| Issuer | | Shares/Par | | | Value ($) | |
| | | | | | | | |
| BONDS – continued | | | | | | | | |
| Asset-Backed & Securitized – continued | | | | | |
| Citigroup/Deutsche Bank Commercial Mortgage Trust, 5.322%, 12/11/49 | | $ | 16,789,455 | | | $ | 17,773,938 | |
| Citigroup/Deutsche Bank Commercial Mortgage Trust, FRN, 5.225%, 7/15/44 | | | 500,000 | | | | 513,286 | |
| Citigroup/Deutsche Bank Commercial Mortgage Trust, FRN, 5.366%, 12/11/49 | | | 10,410,000 | | | | 10,798,866 | |
| CNH Wholesale Master Note Trust, “A”, FRN, 0.76%, 8/15/19 (n) | | | 10,568,000 | | | | 10,591,546 | |
| Commercial Mortgage Acceptance Corp., FRN, 1.99%, 9/15/30 (i) | | | 32,893 | | | | 1,343 | |
| Commercial Mortgage Asset Trust, FRN, 0.494%, 1/17/32 (i)(z) | | | 533,967 | | | | 2,706 | |
| Commercial Mortgage Pass-Through Certificates, “A4”, 5.306%, 12/10/46 | | | 1,324,375 | | | | 1,402,800 | |
| Commercial Mortgage Trust, “A4”, 3.147%, 8/15/45 | | | 3,950,000 | | | | 4,046,491 | |
| Credit Acceptance Auto Loan Trust, “A”, 2.2%, 9/16/19 (n) | | | 23,471 | | | | 23,518 | |
| Credit Acceptance Auto Loan Trust, “A”, 1.52%, 3/16/20 (n) | | | 1,009,908 | | | | 1,012,006 | |
| Credit Suisse Commercial Mortgage Trust, “A4”, FRN, 5.898%, 9/15/39 | | | 10,428,286 | | | | 11,215,371 | |
| Credit Suisse Commercial Mortgage Trust, “AM”, FRN, 5.702%, 6/15/39 | | | 13,668,432 | | | | 14,299,695 | |
| Credit Suisse Commercial Mortgage Trust, “C4”, FRN, 5.898%, 9/15/39 | | | 6,667,307 | | | | 7,195,504 | |
| Credit Suisse Mortgage Capital Certificate, 5.311%, 12/15/39 | | | 2,221,374 | | | | 2,340,522 | |
| Credit Suisse Mortgage Capital Certificate, FRN, 5.694%, 9/15/40 | | | 276,949 | | | | 276,648 | |
| Credit-Based Asset Servicing & Securitization LLC, 5.303%, 12/25/35 | | | 27,588 | | | | 27,343 | |
| CWCapital Cobalt Ltd., “A4”, FRN, 5.765%, 5/15/46 | | | 2,030,193 | | | | 2,203,427 | |
| CWCapital LLC, 5.223%, 8/15/48 | | | 539,977 | | | | 568,976 | |
| Dryden Senior Loan Fund, CLO, “A”, FRN, 1.61%, 1/15/25 (z) | | | 7,548,370 | | | | 7,476,343 | |
| Falcon Franchise Loan LLC, FRN, 19.164%, 1/05/25 (i)(z) | | | 14,227 | | | | 3,592 | |
| First Union National Bank Commercial Mortgage Trust, FRN, 1.735%, 1/12/43 (i)(z) | | | 81,078 | | | | 136 | |
| Flatiron CLO Ltd. 2013-1A, “A1”, FRN, 1.628%, 1/17/26 (z) | | | 8,321,193 | | | | 8,253,317 | |
| Ford Credit Auto Owner Trust, 2014-1,“A”, 2.26%, 11/15/25 (n) | | | 4,559,000 | | | | 4,583,496 | |
| Ford Credit Auto Owner Trust, 2014-2,“A”, 2.31%, 4/15/26 (n) | | | 10,726,000 | | | | 10,753,759 | |
| GE Capital Commercial Mortgage Corp., “A”, 5.543%, 12/10/49 | | | 974,966 | | | | 1,036,379 | |
| GE Equipment Transportation LLC, 2013-2, “A2”, 0.61%, 6/24/16 | | | 792,710 | | | | 793,238 | |
6
MFS Research Bond Series
Portfolio of Investments – continued
| | | | | | | | |
| Issuer | | Shares/Par | | | Value ($) | |
| | | | | | | | |
| BONDS – continued | | | | | | | | |
| Asset-Backed & Securitized – continued | | | | | |
| GE Equipment Transportation LLC, 2014-1, “A2”, 0.55%, 12/23/16 | | $ | 5,033,997 | | | $ | 5,028,978 | |
| GMAC LLC, FRN, 8.072%, 4/15/34 (d)(n)(q) | | | 24,736 | | | | 12,894 | |
| Goldman Sachs Mortgage Securities Corp., FRN, 5.795%, 8/10/45 | | | 14,734,203 | | | | 15,955,094 | |
| Greenwich Capital Commercial Funding Corp., 5.475%, 3/10/39 | | | 11,128,879 | | | | 11,663,733 | |
| Hertz Fleet Lease Funding LP, 2013-3, “A”, FRN, 0.711%, 12/10/27 (n) | | | 6,563,000 | | | | 6,565,501 | |
| Hertz Fleet Lease Funding LP, 2014-1, FRN, 0.561%, 4/10/28 (z) | | | 7,424,000 | | | | 7,416,955 | |
| JPMorgan Chase Commercial Mortgage Securities Corp., 5.552%, 5/12/45 | | | 703,217 | | | | 734,693 | |
| JPMorgan Chase Commercial Mortgage Securities Corp., “A3”, 4.171%, 8/15/46 | | | 600,000 | | | | 648,205 | |
| JPMorgan Chase Commercial Mortgage Securities Corp., “A3”, FRN, 5.787%, 6/15/49 | | | 3,564,937 | | | | 3,611,060 | |
| JPMorgan Chase Commercial Mortgage Securities Corp., “A3”, FRN, 5.939%, 2/15/51 | | | 245,999 | | | | 246,356 | |
| JPMorgan Chase Commercial Mortgage Securities Corp., “A4”, FRN, 5.787%, 6/15/49 | | | 9,677,430 | | | | 10,391,992 | |
| JPMorgan Chase Commercial Mortgage Securities Corp., FRN, 5.458%, 7/15/42 (n) | | | 130,000 | | | | 28,444 | |
| JPMorgan Chase Commercial Mortgage Securities Corp., FRN, 5.697%, 2/12/49 | | | 763,398 | | | | 819,215 | |
| JPMorgan Chase Commercial Mortgage Trust, 2007-LD11, “AM”, FRN, 5.787%, 6/15/49 | | | 15,944,203 | | | | 16,526,246 | |
| JPMorgan Mortgage Trust, “A1”, FRN, 2.05%, 10/25/33 | | | 439,854 | | | | 438,698 | |
| Kingsland III Ltd., “A1”, CDO, FRN, 0.447%, 8/24/21 (n) | | | 2,193,567 | | | | 2,183,750 | |
| LB-UBS Commercial Mortgage Trust, “A4”, 5.372%, 9/15/39 | | | 2,900,000 | | | | 3,065,402 | |
| LB-UBS Commercial Mortgage Trust, “A4”, 5.156%, 2/15/31 | | | 1,953,442 | | | | 2,000,634 | |
| Lehman Brothers Commercial Conduit Mortgage Trust, FRN, 1.175%, 2/18/30 (i) | | | 34,024 | | | | 769 | |
| Merrill Lynch Mortgage Investors Inc., “A”, FRN, 2.12%, 5/25/36 | | | 978,106 | | | | 970,439 | |
| Merrill Lynch Mortgage Investors Inc., “A5”, FRN, 2.126%, 4/25/35 | | | 709,187 | | | | 671,293 | |
| Merrill Lynch Mortgage Trust, “A3”, FRN, 5.834%, 6/12/50 | | | 1,027,069 | | | | 1,027,694 | |
| Merrill Lynch/Countrywide Commercial Mortgage Trust, FRN, 5.743%, 6/12/50 | | | 14,690,646 | | | | 15,868,322 | |
| Morgan Stanley Bank of America/Merrill Lynch Trust, “A4”, 3.176%, 8/15/45 | | | 5,000,000 | | | | 5,119,205 | |
| | | | | | | | |
| Issuer | | Shares/Par | | | Value ($) | |
| | | | | | | | |
| BONDS – continued | | | | | | | | |
| Asset-Backed & Securitized – continued | | | | | |
| Morgan Stanley Capital I Trust, “A4”, FRN, 5.65%, 6/11/42 | | $ | 2,382,000 | | | $ | 2,593,495 | |
| Morgan Stanley Capital I Trust, “AM”, FRN, 5.683%, 4/15/49 | | | 14,764,000 | | | | 15,364,230 | |
| Morgan Stanley Capital I, Inc., FRN, 0.938%, 11/15/30 (i)(n) | | | 92,405 | | | | 2,156 | |
| Morgan Stanley Re-REMIC Trust, FRN, 5.795%, 8/15/45 (n) | | | 11,500,000 | | | | 12,378,554 | |
| Nissan Auto Lease Trust, 2013-B, “A3”, 0.75%, 6/15/16 | | | 7,531,000 | | | | 7,536,784 | |
| Preferred Term Securities XIX Ltd., CDO, FRN, 0.59%, 12/22/35 (z) | | | 336,780 | | | | 248,735 | |
| Race Point CLO Ltd., “A”, FRN, 1.481%, 2/20/25 (n) | | | 7,740,000 | | | | 7,641,222 | |
| Race Point CLO Ltd., “A1A”, FRN, 0.432%, 8/01/21 (n) | | | 7,885,736 | | | | 7,841,560 | |
| Residential Funding Mortgage Securities, Inc., FRN, 5.32%, 12/25/35 | | | 120,429 | | | | 97,912 | |
| Volkswagen Credit Auto Master Trust, 2014-1A, “A1”, FRN, 0.515%, 7/22/19 (n) | | | 6,106,000 | | | | 6,110,146 | |
| Wachovia Bank Commercial Mortgage Trust, “A4”, FRN, 5.941%, 2/15/51 | | | 7,088,526 | | | | 7,575,735 | |
| Wachovia Bank Commercial Mortgage Trust, FRN, 5.716%, 6/15/49 | | | 13,489,441 | | | | 14,483,060 | |
| | | | | | | | |
| | | | | | $ | 365,821,506 | |
| | | | | | | | |
| Automotive – 1.0% | | | | | | | | |
| Ford Motor Credit Co. LLC, 12%, 5/15/15 | | $ | 1,400,000 | | | $ | 1,455,170 | |
| Ford Motor Credit Co. LLC, 7%, 4/15/15 | | | 1,900,000 | | | | 1,932,779 | |
| Ford Motor Credit Co. LLC, 5.625%, 9/15/15 | | | 1,300,000 | | | | 1,341,542 | |
| General Motors Co., 4.875%, 10/02/23 | | | 4,291,000 | | | | 4,591,370 | |
| General Motors Co., 5.2%, 4/01/45 | | | 4,005,000 | | | | 4,225,275 | |
| Harley-Davidson Financial Services, 3.875%, 3/15/16 (n) | | | 6,870,000 | | | | 7,091,509 | |
| Lear Corp., 8.125%, 3/15/20 | | | 3,146,000 | | | | 3,311,165 | |
| TRW Automotive, Inc., 4.5%, 3/01/21 (n) | | | 5,653,000 | | | | 5,681,265 | |
| | | | | | | | |
| | | | | | $ | 29,630,075 | |
| | | | | | | | |
| Biotechnology – 0.5% | |
| Life Technologies Corp., 5%, 1/15/21 | | $ | 13,872,000 | | | $ | 15,331,265 | |
| | | | | | | | |
| Broadcasting – 0.7% | | | | | | | | |
| Discovery Communications, Inc., 4.95%, 5/15/42 | | $ | 3,823,000 | | | $ | 3,965,743 | |
| Grupo Televisa S.A.B., 5%, 5/13/45 | | | 4,412,000 | | | | 4,453,601 | |
| Omnicom Group, Inc., 3.65%, 11/01/24 | | | 1,872,000 | | | | 1,872,869 | |
| Scripps Networks Interactive, 2.75%, 11/15/19 | | | 1,669,000 | | | | 1,675,985 | |
| SES Global Americas Holdings GP, 5.3%, 3/25/44 (n) | | | 2,857,000 | | | | 3,198,472 | |
| SES S.A., 3.6%, 4/04/23 (n) | | | 2,386,000 | | | | 2,410,022 | |
| SES S.A., 5.3%, 4/04/43 (z) | | | 3,272,000 | | | | 3,634,325 | |
| | | | | | | | |
| | | | | | $ | 21,211,017 | |
| | | | | | | | |
7
MFS Research Bond Series
Portfolio of Investments – continued
| | | | | | | | |
| Issuer | | Shares/Par | | | Value ($) | |
| | | | | | | | |
| BONDS – continued | | | | | | | | |
| Brokerage & Asset Managers – 0.3% | | | | | |
| NYSE Euronext, 2%, 10/05/17 | | $ | 3,115,000 | | | $ | 3,141,773 | |
| TD Ameritrade Holding Corp., 5.6%, 12/01/19 | | | 3,959,000 | | | | 4,544,635 | |
| | | | | | | | |
| | | | | | $ | 7,686,408 | |
| | | | | | | | |
| Building – 0.8% | | | | | | | | |
| Building Materials Holding Corp., 6.75%, 5/01/21 (n) | | $ | 6,466,000 | | | $ | 6,837,795 | |
| CEMEX Finance LLC, 9.375%, 10/12/22 | | | 3,367,000 | | | | 3,754,205 | |
| Martin Marietta Materials, Inc., 4.25%, 7/02/24 | | | 6,742,000 | | | | 6,906,336 | |
| Mohawk Industries, Inc., 3.85%, 2/01/23 | | | 2,668,000 | | | | 2,669,073 | |
| Mohawk Industries, Inc., 6.125%, 1/15/16 | | | 3,371,000 | | | | 3,530,155 | |
| Owens Corning, Inc., 6.5%, 12/01/16 | | | 27,000 | | | | 29,426 | |
| | | | | | | | |
| | | | | | $ | 23,726,990 | |
| | | | | | | | |
| Business Services – 0.2% | | | | | | | | |
| Equinix, Inc., 4.875%, 4/01/20 | | $ | 4,055,000 | | | $ | 4,034,725 | |
| Tencent Holdings Ltd., 3.375%, 3/05/18 | | | 2,782,000 | | | | 2,848,187 | |
| | | | | | | | |
| | | | | | $ | 6,882,912 | |
| | | | | | | | |
| Cable TV – 0.9% | | | | | | | | |
| British Sky Broadcasting Group PLC, 2.625%, 9/16/19 (n) | | $ | 2,442,000 | | | $ | 2,442,906 | |
| CCO Holdings LLC/CCO Holdings Capital Corp., 6.5%, 4/30/21 | | | 2,690,000 | | | | 2,824,500 | |
| Comcast Corp. Co., 4.2%, 8/15/34 | | | 3,488,000 | | | | 3,647,213 | |
| NBCUniversal Enterprise, Inc., 1.974%, 4/15/19 (n) | | | 1,741,000 | | | | 1,723,862 | |
| SIRIUS XM Radio, Inc., 4.25%, 5/15/20 (n) | | | 7,895,000 | | | | 7,776,575 | |
| Time Warner Cable, Inc., 4.5%, 9/15/42 | | | 817,000 | | | | 839,829 | |
| Time Warner Entertainment Co. LP, 8.375%, 7/15/33 | | | 290,000 | | | | 435,213 | |
| Videotron Ltd., 5%, 7/15/22 | | | 8,605,000 | | | | 8,755,588 | |
| | | | | | | | |
| | | | | | $ | 28,445,686 | |
| | | | | | | | |
| Chemicals – 1.5% | | | | | | | | |
| Celanese U.S. Holdings LLC, 4.625%, 11/15/22 | | $ | 7,097,000 | | | $ | 7,026,030 | |
| CF Industries Holdings, Inc., 7.125%, 5/01/20 | | | 5,826,000 | | | | 6,940,892 | |
| CF Industries Holdings, Inc., 5.375%, 3/15/44 | | | 3,102,000 | | | | 3,346,732 | |
| Dow Chemical Co., 8.55%, 5/15/19 | | | 8,579,000 | | | | 10,665,807 | |
| INEOS Finance PLC, 7.5%, 5/01/20 (n) | | | 1,889,000 | | | | 1,983,450 | |
| LYB International Finance B.V., 4%, 7/15/23 | | | 2,752,000 | | | | 2,815,136 | |
| LyondellBasell Industries N.V., 5.75%, 4/15/24 | | | 6,275,000 | | | | 7,176,674 | |
| Tronox Finance LLC, 6.375%, 8/15/20 | | | 6,473,000 | | | | 6,489,183 | |
| | | | | | | | |
| | | | | | $ | 46,443,904 | |
| | | | | | | | |
| Computer Software – 0.1% | | | | | | | | |
| VeriSign, Inc., 4.625%, 5/01/23 | | $ | 4,405,000 | | | $ | 4,316,900 | |
| | | | | | | | |
| | | | | | | | |
| Issuer | | Shares/Par | | | Value ($) | |
| | | | | | | | |
| BONDS – continued | | | | | | | | |
| Computer Software – Systems – 0.0% | | | | | |
| Seagate HDD Cayman, 3.75%, 11/15/18 (n) | | $ | 938,000 | | | $ | 962,623 | |
| | | | | | | | |
| Consumer Products – 0.4% | | | | | | | | |
| Mattel, Inc., 5.45%, 11/01/41 | | $ | 4,191,000 | | | $ | 4,749,572 | |
| Reckitt Benckiser Treasury Services PLC, 3.625%, 9/21/23 (n) | | | 6,765,000 | | | | 7,089,964 | |
| | | | | | | | |
| | | | | | $ | 11,839,536 | |
| | | | | | | | |
| Consumer Services – 0.2% | | | | | | | | |
| ADT Corp., 6.25%, 10/15/21 | | $ | 5,215,000 | | | $ | 5,358,413 | |
| | | | | | | | |
| Containers – 0.2% | | | | | | | | |
| Crown American LLC, 4.5%, 1/15/23 | | $ | 7,693,000 | | | $ | 7,462,210 | |
| | | | | | | | |
| Defense Electronics – 0.0% | | | | | | | | |
| BAE Systems Holdings, Inc., 6.375%, 6/01/19 (n) | | $ | 500,000 | | | $ | 577,261 | |
| | | | | | | | |
| Emerging Market Quasi-Sovereign – 0.1% | |
| KazAgro National Management Holding, 4.625%, 5/24/23 (n) | | $ | 2,883,000 | | | $ | 2,407,305 | |
| Petroleos Mexicanos, 4.25%, 1/15/25 (n) | | | 10,000 | | | | 9,935 | |
| | | | | | | | |
| | | | | | $ | 2,417,240 | |
| | | | | | | | |
| Energy – Independent – 0.4% | | | | | | | | |
| Anadarko Petroleum Corp., 6.375%, 9/15/17 | | $ | 1,253,000 | | | $ | 1,393,182 | |
| Anadarko Petroleum Corp., 4.5%, 7/15/44 | | | 6,976,000 | | | | 6,770,034 | |
| ConocoPhillips, 6%, 1/15/20 | | | 740,000 | | | | 859,837 | |
| EQT Corp., 4.875%, 11/15/21 | | | 3,718,000 | | | | 4,016,581 | |
| | | | | | | | |
| | | | | | $ | 13,039,634 | |
| | | | | | | | |
| Energy – Integrated – 0.6% | | | | | | | | |
| BG Energy Capital PLC, 2.875%, 10/15/16 (n) | | $ | 1,855,000 | | | $ | 1,901,911 | |
| BP Capital Markets PLC, 2.237%, 5/10/19 | | | 6,940,000 | | | | 6,931,582 | |
| BP Capital Markets PLC, 2.521%, 1/15/20 | | | 1,460,000 | | | | 1,461,707 | |
| Chevron Corp., 1.104%, 12/05/17 | | | 1,560,000 | | | | 1,552,248 | |
| Pacific Rubiales Energy Corp., 5.125%, 3/28/23 (n) | | | 6,254,000 | | | | 4,925,025 | |
| | | | | | | | |
| | | | | | $ | 16,772,473 | |
| | | | | | | | |
| Entertainment – 0.5% | | | | | | | | |
| Carnival Corp., 3.95%, 10/15/20 | | $ | 9,416,000 | | | $ | 9,865,981 | |
| Six Flags Entertainment Corp., 5.25%, 1/15/21 (n) | | | 5,250,000 | | | | 5,250,000 | |
| | | | | | | | |
| | | | | | $ | 15,115,981 | |
| | | | | | | | |
| Financial Institutions – 1.7% | | | | | | | | |
| CIT Group, Inc., 5.5%, 2/15/19 (n) | | $ | 6,417,000 | | | $ | 6,769,935 | |
| General Electric Capital Corp., 6.375% to 11/15/17, FRN to 11/15/67 | | | 5,150,000 | | | | 5,523,375 | |
| General Electric Capital Corp., 4.65%, 10/17/21 | | | 1,733,000 | | | | 1,953,315 | |
8
MFS Research Bond Series
Portfolio of Investments – continued
| | | | | | | | |
| Issuer | | Shares/Par | | | Value ($) | |
| | | | | | | | |
| BONDS – continued | | | | | | | | |
| Financial Institutions – continued | | | | | |
| General Electric Capital Corp., 3.15%, 9/07/22 | | $ | 5,800,000 | | | $ | 5,907,393 | |
| General Electric Capital Corp., 7.5%, 8/21/35 | | | 4,000,000 | | | | 5,862,176 | |
| General Electric Capital Corp., 2.1%, 12/11/19 | | | 2,064,000 | | | | 2,060,512 | |
| International Lease Finance Corp., 7.125%, 9/01/18 (n) | | | 1,190,000 | | | | 1,332,800 | |
| Nationstar Mortgage LLC/Capital Corp., 6.5%, 7/01/21 | | | 8,810,000 | | | | 8,017,100 | |
| SLM Corp., 4.625%, 9/25/17 | | | 7,121,000 | | | | 7,227,815 | |
| SLM Corp., 8%, 3/25/20 | | | 5,448,000 | | | | 6,018,024 | |
| | | | | | | | |
| | | | | | $ | 50,672,445 | |
| | | | | | | | |
| Food & Beverages – 1.5% | | | | | | | | |
| BRF S.A., 3.95%, 5/22/23 (n) | | $ | 4,991,000 | | | $ | 4,614,180 | |
| Embotelladora Andina S.A., 5%, 10/01/23 (n) | | | 2,659,000 | | | | 2,777,964 | |
| Kraft Foods Group, Inc., 5%, 6/04/42 | | | 3,347,000 | | | | 3,684,388 | |
| Mead Johnson Nutrition Co., “A”, 4.9%, 11/01/19 | | | 903,000 | | | | 992,392 | |
| Smithfield Foods, Inc., 6.625%, 8/15/22 | | | 7,095,000 | | | | 7,414,275 | |
| Sysco Corp., 3.5%, 10/02/24 | | | 5,699,000 | | | | 5,873,817 | |
| Tyson Foods, Inc., 6.6%, 4/01/16 | | | 2,065,000 | | | | 2,201,715 | |
| Tyson Foods, Inc., 4.5%, 6/15/22 | | | 6,476,000 | | | | 7,011,475 | |
| Tyson Foods, Inc., 3.95%, 8/15/24 | | | 2,294,000 | | | | 2,371,356 | |
| Wm. Wrigley Jr. Co., 3.375%, 10/21/20 (n) | | | 7,334,000 | | | | 7,496,279 | |
| | | | | | | | |
| | | | | | $ | 44,437,841 | |
| | | | | | | | |
| Food & Drug Stores – 0.4% | | | | | | | | |
| Walgreens Boots Alliance, Inc., 3.3%, 11/18/21 | | $ | 3,548,000 | | | $ | 3,572,683 | |
| Walgreens Boots Alliance, Inc., 3.8%, 11/18/24 | | | 9,813,000 | | | | 10,008,279 | |
| | | | | | | | |
| | | | | | $ | 13,580,962 | |
| | | | | | | | |
| Forest & Paper Products – 0.5% | | | | | | | | |
| Georgia-Pacific LLC, 5.4%, 11/01/20 (n) | | $ | 3,608,000 | | | $ | 4,059,859 | |
| Georgia-Pacific LLC, 3.734%, 7/15/23 (n) | | | 7,576,000 | | | | 7,748,407 | |
| Packaging Corp. of America, 3.65%, 9/15/24 | | | 3,490,000 | | | | 3,435,521 | |
| | | | | | | | |
| | | | | | $ | 15,243,787 | |
| | | | | | | | |
| Gaming & Lodging – 0.2% | | | | | | | | |
| Wyndham Worldwide Corp., 4.25%, 3/01/22 | | $ | 4,662,000 | | | $ | 4,761,641 | |
| Wyndham Worldwide Corp., 5.625%, 3/01/21 | | | 1,732,000 | | | | 1,936,717 | |
| | | | | | | | |
| | | | | | $ | 6,698,358 | |
| | | | | | | | |
| Insurance – 1.5% | | | | | | | | |
| American International Group, Inc., 6.4%, 12/15/20 | | $ | 8,142,000 | | | $ | 9,709,091 | |
| American International Group, Inc., 4.125%, 2/15/24 | | | 3,681,000 | | | | 3,918,469 | |
| | | | | | | | |
| Issuer | | Shares/Par | | | Value ($) | |
| | | | | | | | |
| BONDS – continued | | | | | | | | |
| Insurance – continued | | | | | |
| American International Group, Inc., 4.5%, 7/16/44 | | $ | 4,114,000 | | | $ | 4,346,486 | |
| Five Corners Funding Trust, 4.419%, 11/15/23 (n) | | | 4,734,000 | | | | 5,005,831 | |
| Genworth Holdings, Inc., 4.9%, 8/15/23 | | | 2,848,000 | | | | 2,294,625 | |
| Metropolitan Life Global Funding I, 1.7%, 6/29/15 (z) | | | 5,295,000 | | | | 5,323,397 | |
| Pacific Lifecorp, 5.125%, 1/30/43 (n) | | | 5,527,000 | | | | 6,078,479 | |
| Unum Group, 7.125%, 9/30/16 | | | 2,028,000 | | | | 2,215,925 | |
| Unum Group, 4%, 3/15/24 | | | 6,546,000 | | | | 6,685,338 | |
| UnumProvident Corp., 6.85%, 11/15/15 (n) | | | 1,148,000 | | | | 1,202,469 | |
| | | | | | | | |
| | | | | | $ | 46,780,110 | |
| | | | | | | | |
| Insurance – Health – 0.3% | | | | | | | | |
| Humana, Inc., 7.2%, 6/15/18 | | $ | 6,739,000 | | | $ | 7,872,419 | |
| | | | | | | | |
| Insurance – Property & Casualty – 1.4% | |
| Allied World Assurance, 5.5%, 11/15/20 | | $ | 2,640,000 | | | $ | 2,944,704 | |
| CNA Financial Corp., 5.875%, 8/15/20 | | | 3,280,000 | | | | 3,744,238 | |
| Liberty Mutual Group, Inc., 4.25%, 6/15/23 (n) | | | 10,306,000 | | | | 10,620,117 | |
| Marsh & McLennan Cos., Inc., 4.8%, 7/15/21 | | | 7,863,000 | | | | 8,739,095 | |
| Marsh & McLennan Cos., Inc., 4.05%, 10/15/23 | | | 4,129,000 | | | | 4,362,528 | |
| Marsh & McLennan Cos., Inc., 3.5%, 6/03/24 | | | 4,291,000 | | | | 4,275,960 | |
| Swiss Re Ltd., 4.25%, 12/06/42 (n) | | | 926,000 | | | | 959,515 | |
| ZFS Finance USA Trust II, 6.45% to 6/15/16, FRN to 12/15/65 (n) | | | 1,842,000 | | | | 1,940,860 | |
| ZFS Finance USA Trust V, 6.5% to 5/09/17, FRN to 5/09/67 (n) | | | 4,852,000 | | | | 5,167,380 | |
| | | | | | | | |
| | | | | | $ | 42,754,397 | |
| | | | | | | | |
| International Market Quasi-Sovereign – 0.6% | |
| Israel Electric Corp. Ltd., 6.875%, 6/21/23 (n) | | $ | 6,997,000 | | | $ | 7,976,580 | |
| Statoil A.S.A., 2.45%, 1/17/23 | | | 2,114,000 | | | | 2,016,405 | |
| Statoil A.S.A., 3.7%, 3/01/24 | | | 8,492,000 | | | | 8,792,065 | |
| | | | | | | | |
| | | | | | $ | 18,785,050 | |
| | | | | | | | |
| Local Authorities – 0.4% | | | | | | | | |
| State of California (Build America Bonds), 7.625%, 3/01/40 | | $ | 860,000 | | | $ | 1,320,100 | |
| State of California (Build America Bonds), 7.6%, 11/01/40 | | | 7,175,000 | | | | 11,195,368 | |
| | | | | | | | |
| | | | | | $ | 12,515,468 | |
| | | | | | | | |
| Machinery & Tools – 0.2% | | | | | | | | |
| United Rentals North America, Inc., 7.375%, 5/15/20 | | $ | 5,655,000 | | | $ | 6,107,400 | |
| | | | | | | | |
| Major Banks – 7.3% | | | | | | | | |
| ABN AMRO Bank N.V., 4.25%, 2/02/17 (n) | | $ | 5,664,000 | | | $ | 5,967,930 | |
| Bank of America Corp., 5.625%, 7/01/20 | | | 8,555,000 | | | | 9,740,637 | |
9
MFS Research Bond Series
Portfolio of Investments – continued
| | | | | | | | |
| Issuer | | Shares/Par | | | Value ($) | |
| | | | | | | | |
| BONDS – continued | | | | | | | | |
| Major Banks – continued | | | | | |
| Bank of America Corp., 5.875%, 1/05/21 | | $ | 1,670,000 | | | $ | 1,936,320 | |
| Bank of America Corp., 6.1%, 6/15/17 | | | 1,725,000 | | | | 1,895,913 | |
| Bank of America Corp., 3.3%, 1/11/23 | | | 15,475,000 | | | | 15,476,192 | |
| Bank of America Corp., 4.125%, 1/22/24 | | | 10,960,000 | | | | 11,509,699 | |
| Bank of America Corp., FRN, 6.5%, 10/29/49 | | | 4,004,000 | | | | 4,075,672 | |
| Bank of New York Mellon Corp., 3.4%, 5/15/24 | | | 5,190,000 | | | | 5,283,596 | |
| Credit Suisse Group AG, 6.5%, 8/08/23 (n) | | | 5,150,000 | | | | 5,653,263 | |
| DBS Bank Ltd., 3.625% to 9/21/17, FRN to 9/21/22 (n) | | | 4,108,000 | | | | 4,231,137 | |
| Goldman Sachs Group, Inc., 5.625%, 1/15/17 | | | 2,636,000 | | | | 2,827,513 | |
| Goldman Sachs Group, Inc., 2.375%, 1/22/18 | | | 5,005,000 | | | | 5,055,546 | |
| Goldman Sachs Group, Inc., 3.625%, 1/22/23 | | | 11,855,000 | | | | 12,004,634 | |
| HSBC Holdings PLC, 4%, 3/30/22 | | | 5,466,000 | | | | 5,817,442 | |
| HSBC Holdings PLC, 5.25%, 3/14/44 | | | 2,057,000 | | | | 2,304,159 | |
| HSBC USA, Inc., 4.875%, 8/24/20 | | | 4,090,000 | | | | 4,514,493 | |
| ING Bank N.V., 3.75%, 3/07/17 (n) | | | 5,855,000 | | | | 6,127,615 | |
| ING Bank N.V., 2%, 9/25/15 (n) | | | 1,900,000 | | | | 1,914,822 | |
| ING Bank N.V., 5.8%, 9/25/23 (n) | | | 11,715,000 | | | | 12,995,203 | |
| JPMorgan Chase & Co., 4.25%, 10/15/20 | | | 2,800,000 | | | | 3,010,280 | |
| JPMorgan Chase & Co., 4.5%, 1/24/22 | | | 1,800,000 | | | | 1,965,154 | |
| JPMorgan Chase & Co., 3.25%, 9/23/22 | | | 1,376,000 | | | | 1,384,015 | |
| JPMorgan Chase & Co., 2%, 8/15/17 | | | 3,637,000 | | | | 3,671,839 | |
| JPMorgan Chase & Co., 3.2%, 1/25/23 | | | 12,685,000 | | | | 12,690,353 | |
| JPMorgan Chase & Co., 6.75% to 2/01/24, FRN to 1/29/49 | | | 4,061,000 | | | | 4,289,431 | |
| JPMorgan Chase Bank N.A., 5.875%, 6/13/16 | | | 250,000 | | | | 266,554 | |
| Merrill Lynch & Co., Inc., 6.05%, 5/16/16 | | | 4,869,000 | | | | 5,156,987 | |
| Morgan Stanley, 5.75%, 10/18/16 | | | 944,000 | | | | 1,013,857 | |
| Morgan Stanley, 5.5%, 7/24/20 | | | 1,600,000 | | | | 1,805,163 | |
| Morgan Stanley, 5.5%, 7/28/21 | | | 14,214,000 | | | | 16,131,199 | |
| Morgan Stanley, 5.95%, 12/28/17 | | | 400,000 | | | | 444,493 | |
| Morgan Stanley, 3.75%, 2/25/23 | | | 8,585,000 | | | | 8,806,673 | |
| Morgan Stanley, 3.7%, 10/23/24 | | | 2,879,000 | | | | 2,918,212 | |
| PNC Bank N.A., 3.8%, 7/25/23 | | | 13,950,000 | | | | 14,379,618 | |
| PNC Funding Corp., 5.625%, 2/01/17 | | | 6,173,000 | | | | 6,662,482 | |
| Regions Financial Corp., 2%, 5/15/18 | | | 2,524,000 | | | | 2,499,454 | |
| Royal Bank of Scotland PLC, 2.55%, 9/18/15 | | | 3,137,000 | | | | 3,168,364 | |
| Royal Bank of Scotland PLC, 6%, 12/19/23 | | | 7,121,000 | | | | 7,707,756 | |
| Wachovia Corp., 6.605%, 10/01/25 | | | 1,764,000 | | | | 2,175,252 | |
| | | | | | | | |
| | | | | | $ | 219,478,922 | |
| | | | | | | | |
| | | | | | | | |
| Issuer | | Shares/Par | | | Value ($) | |
| | | | | | | | |
| BONDS – continued | | | | | | | | |
| Medical & Health Technology & Services – 0.6% | |
| Becton, Dickinson and Co., 4.685%, 12/15/44 | | $ | 4,733,000 | | | $ | 5,097,256 | |
| Catholic Health Initiatives, 2.95%, 11/01/22 | | | 6,666,000 | | | | 6,531,487 | |
| Express Scripts Holding Co., 2.65%, 2/15/17 | | | 5,011,000 | | | | 5,123,998 | |
| McKesson Corp., 5.7%, 3/01/17 | | | 1,210,000 | | | | 1,314,116 | |
| | | | | | | | |
| | | | | | $ | 18,066,857 | |
| | | | | | | | |
| Medical Equipment – 0.3% | | | | | | | | |
| Medtronic, Inc., 4.625%, 3/15/45 (n) | | $ | 7,021,000 | | | $ | 7,610,694 | |
| | | | | | | | |
| Metals & Mining – 1.7% | | | | | | | | |
| Barrick International (Barbados) Corp., 5.75%, 10/15/16 (n) | | $ | 4,010,000 | | | $ | 4,262,638 | |
| Barrick North America Finance LLC, 5.75%, 5/01/43 | | | 6,000,000 | | | | 5,953,374 | |
| Freeport-McMoRan Copper & Gold, Inc., 3.875%, 3/15/23 | | | 4,000,000 | | | | 3,771,344 | |
| Freeport-McMoRan Copper & Gold, Inc., 5.4%, 11/14/34 | | | 4,000,000 | | | | 3,899,620 | |
| Kinross Gold Corp., 5.95%, 3/15/24 (n) | | | 6,437,000 | | | | 6,040,101 | |
| Plains Exploration & Production Co., 6.875%, 2/15/23 | | | 8,679,000 | | | | 9,655,388 | |
| Rio Tinto Finance (USA) PLC, 3.5%, 3/22/22 | | | 7,418,000 | | | | 7,415,923 | |
| Southern Copper Corp., 6.75%, 4/16/40 | | | 3,312,000 | | | | 3,474,288 | |
| Steel Dynamics, Inc., 5.125%, 10/01/21 (n) | | | 7,562,000 | | | | 7,703,788 | |
| | | | | | | | |
| | | | | | $ | 52,176,464 | |
| | | | | | | | |
| Midstream – 3.5% | | | | | | | | |
| APT Pipelines Ltd., 3.875%, 10/11/22 (n) | | $ | 8,640,000 | | | $ | 8,422,610 | |
| DCP Midstream LLC, 3.875%, 3/15/23 | | | 1,430,000 | | | | 1,368,418 | |
| El Paso Corp., 7.75%, 1/15/32 | | | 6,550,000 | | | | 8,056,500 | |
| El Paso Pipeline Partners Operating Co. LLC, 4.3%, 5/01/24 | | | 5,995,000 | | | | 6,006,606 | |
| Energy Transfer Partners LP, 4.65%, 6/01/21 | | | 6,198,000 | | | | 6,478,999 | |
| Energy Transfer Partners LP, 5.15%, 2/01/43 | | | 3,573,000 | | | | 3,535,937 | |
| Enterprise Products Operating LLC, 3.9%, 2/15/24 | | | 7,980,000 | | | | 8,127,534 | |
| Enterprise Products Operating LLC, 3.75%, 2/15/25 | | | 5,473,000 | | | | 5,493,841 | |
| Kinder Morgan Energy Partners LP, 7.4%, 3/15/31 | | | 103,000 | | | | 123,226 | |
| Kinder Morgan Energy Partners LP, 6.375%, 3/01/41 | | | 2,240,000 | | | | 2,494,699 | |
| Kinder Morgan Energy Partners LP, 5.4%, 9/01/44 | | | 6,378,000 | | | | 6,391,069 | |
| Kinder Morgan, Inc., 5.625%, 11/15/23 (n) | | | 3,000,000 | | | | 3,211,278 | |
| MarkWest Energy Partners LP/MarkWest Energy Finance Corp., 5.5%, 2/15/23 | | | 5,760,000 | | | | 5,832,000 | |
10
MFS Research Bond Series
Portfolio of Investments – continued
| | | | | | | | |
| Issuer | | Shares/Par | | | Value ($) | |
| | | | | | | | |
| BONDS – continued | | | | | | | | |
| Midstream – continued | |
| MarkWest Energy Partners LP/MarkWest Energy Finance Corp., 4.875%, 12/01/24 | | $ | 3,720,000 | | | $ | 3,636,300 | |
| ONEOK Partners LP, 6.2%, 9/15/43 | | | 7,222,000 | | | | 7,918,273 | |
| Plains All American Pipeline LP, 3.6%, 11/01/24 | | | 1,866,000 | | | | 1,831,882 | |
| Sabine Pass Liquefaction LLC, 5.625%, 2/01/21 | | | 8,270,000 | | | | 8,125,275 | |
| Spectra Energy Capital LLC, 8%, 10/01/19 | | | 613,000 | | | | 741,798 | |
| Sunoco Logistics Partners LP, 4.25%, 4/01/24 | | | 1,108,000 | | | | 1,120,466 | |
| Sunoco Logistics Partners LP, 5.35%, 5/15/45 | | | 6,508,000 | | | | 6,580,024 | |
| Williams Cos., Inc., 3.7%, 1/15/23 | | | 10,087,000 | | | | 9,058,993 | |
| | | | | | | | |
| | | | | | $ | 104,555,728 | |
| | | | | | | | |
| Mortgage-Backed – 19.0% | | | | | | | | |
| Fannie Mae, 4.86%, 1/01/15 | | $ | 77,398 | | | $ | 77,397 | |
| Fannie Mae, 4.85%, 2/01/15 | | | 153,530 | | | | 153,407 | |
| Fannie Mae, 4.56%, 3/01/15 | | | 48,033 | | | | 48,241 | |
| Fannie Mae, 4.89%, 3/01/15 - 10/01/15 | | | 85,013 | | | | 86,063 | |
| Fannie Mae, 4.74%, 4/01/15 | | | 43,368 | | | | 43,544 | |
| Fannie Mae, 4.869%, 4/01/15 | | | 26,226 | | | | 26,178 | |
| Fannie Mae, 4.815%, 6/01/15 | | | 49,375 | | | | 49,774 | |
| Fannie Mae, 5.1%, 6/01/15 | | | 275,000 | | | | 275,562 | |
| Fannie Mae, 3%, 7/01/15 - 4/01/27 | | | 11,408,120 | | | | 11,863,828 | |
| Fannie Mae, 4.53%, 8/01/15 | | | 92,294 | | | | 93,446 | |
| Fannie Mae, 4.6%, 8/01/15 - 9/01/19 | | | 781,635 | | | | 856,615 | |
| Fannie Mae, 4.78%, 8/01/15 | | | 92,211 | | | | 93,435 | |
| Fannie Mae, 4.94%, 8/01/15 | | | 120,000 | | | | 121,482 | |
| Fannie Mae, 5.444%, 11/01/15 | | | 574,099 | | | | 588,577 | |
| Fannie Mae, 2.82%, 1/01/16 | | | 584,433 | | | | 593,333 | |
| Fannie Mae, 5.08%, 2/01/16 | | | 320,228 | | | | 329,001 | |
| Fannie Mae, 5.09%, 2/01/16 | | | 107,808 | | | | 110,865 | |
| Fannie Mae, 5.138%, 2/01/16 | | | 2,212,603 | | | | 2,265,926 | |
| Fannie Mae, 5.432%, 2/01/16 | | | 913,138 | | | | 939,220 | |
| Fannie Mae, 5.732%, 7/01/16 | | | 1,422,068 | | | | 1,500,223 | |
| Fannie Mae, 5.395%, 12/01/16 | | | 121,075 | | | | 129,227 | |
| Fannie Mae, 5.003%, 1/01/17 | | | 32,660 | | | | 32,631 | |
| Fannie Mae, 5.05%, 1/01/17 | | | 241,696 | | | | 254,155 | |
| Fannie Mae, 5.28%, 3/01/17 | | | 131,063 | | | | 138,522 | |
| Fannie Mae, 5.54%, 4/01/17 | | | 99,924 | | | | 108,227 | |
| Fannie Mae, 5.478%, 6/01/17 | | | 735,937 | | | | 791,359 | |
| Fannie Mae, 5.65%, 6/01/17 | | | 150,048 | | | | 163,378 | |
| Fannie Mae, 1.18%, 9/01/17 | | | 2,387,984 | | | | 2,386,914 | |
| Fannie Mae, 2.71%, 11/01/17 | | | 367,991 | | | | 380,475 | |
| Fannie Mae, 5.5%, 11/01/17 - 4/01/40 | | | 21,396,780 | | | | 23,983,641 | |
| Fannie Mae, 3.22%, 12/01/17 | | | 496,271 | | | | 519,696 | |
| Fannie Mae, 3.306%, 12/01/17 | | | 1,314,429 | | | | 1,374,511 | |
| Fannie Mae, 3.84%, 3/01/18 | | | 662,486 | | | | 706,074 | |
| Fannie Mae, 3.99%, 4/01/18 | | | 600,000 | | | | 641,417 | |
| Fannie Mae, 3.743%, 6/01/18 | | | 2,663,698 | | | | 2,834,547 | |
| Fannie Mae, 5.361%, 6/01/18 | | | 448,649 | | | | 494,385 | |
| Fannie Mae, 2.578%, 9/25/18 | | | 4,500,000 | | | | 4,610,871 | |
| Fannie Mae, 5.18%, 3/01/19 | | | 124,002 | | | | 134,155 | |
| | | | | | | | |
| Issuer | | Shares/Par | | | Value ($) | |
| | | | | | | | |
| BONDS – continued | | | | | | | | |
| Mortgage-Backed – continued | |
| Fannie Mae, 5.51%, 3/01/19 | | $ | 185,997 | | | $ | 209,395 | |
| Fannie Mae, 1.99%, 10/01/19 | | | 2,691,690 | | | | 2,695,356 | |
| Fannie Mae, 4.45%, 10/01/19 | | | 512,048 | | | | 563,864 | |
| Fannie Mae, 1.97%, 11/01/19 | | | 1,058,674 | | | | 1,059,819 | |
| Fannie Mae, 2.03%, 11/01/19 | | | 1,321,418 | | | | 1,326,312 | |
| Fannie Mae, 4.88%, 3/01/20 | | | 23,011 | | | | 24,972 | |
| Fannie Mae, 5%, 6/01/20 - 7/01/40 | | | 18,003,283 | | | | 19,887,213 | |
| Fannie Mae, 5.19%, 9/01/20 | | | 171,065 | | | | 186,174 | |
| Fannie Mae, 3.416%, 10/01/20 | | | 1,599,434 | | | | 1,702,145 | |
| Fannie Mae, 2.14%, 5/01/21 | | | 971,378 | | | | 965,375 | |
| Fannie Mae, 3.89%, 7/01/21 | | | 1,191,979 | | | | 1,295,320 | |
| Fannie Mae, 2.56%, 10/01/21 | | | 847,515 | | | | 853,617 | |
| Fannie Mae, 2.64%, 11/01/21 | | | 1,280,512 | | | | 1,300,943 | |
| Fannie Mae, 2.75%, 3/01/22 | | | 1,204,098 | | | | 1,235,565 | |
| Fannie Mae, 6%, 8/01/22 - 3/01/39 | | | 6,522,676 | | | | 7,407,366 | |
| Fannie Mae, 2.525%, 10/01/22 | | | 1,922,603 | | | | 1,930,637 | |
| Fannie Mae, 2.68%, 3/01/23 | | | 1,843,878 | | | | 1,866,376 | |
| Fannie Mae, 2.41%, 5/01/23 | | | 2,147,129 | | | | 2,132,657 | |
| Fannie Mae, 2.55%, 5/01/23 | | | 1,102,876 | | | | 1,106,159 | |
| Fannie Mae, 4.5%, 5/01/24 - 4/01/44 | | | 15,588,748 | | | | 16,981,904 | |
| Fannie Mae, 4%, 3/01/25 - 4/01/41 | | | 13,142,152 | | | | 14,038,418 | |
| Fannie Mae, 4.5%, 5/01/25 | | | 187,132 | | | | 202,222 | |
| Fannie Mae, 3.5%, 9/01/25 - 1/01/42 | | | 7,043,150 | | | | 7,415,761 | |
| Fannie Mae, 6.5%, 7/01/32 - 1/01/33 | | | 11,672 | | | | 13,462 | |
| Fannie Mae, 3.5%, 4/01/43 - 9/01/43 | | | 9,951,179 | | | | 10,380,532 | |
| Fannie Mae, TBA, 4%, 2/01/45 | | | 81,162,000 | | | | 86,370,532 | |
| Fannie Mae, TBA, 3%, 1/01/30 | | | 2,960,000 | | | | 3,075,668 | |
| Fannie Mae, TBA, 4%, 1/01/45 | | | 5,793,000 | | | | 6,180,603 | |
| Fannie Mae, TBA, 4.5%, 2/01/45 | | | 22,222,000 | | | | 24,074,799 | |
| Federal Home Loan Bank, 5%, 7/01/35 | | | 5,242,257 | | | | 5,806,712 | |
| Federal Home Loan Bank, 3%, 5/01/43 | | | 2,450,090 | | | | 2,481,727 | |
| Freddie Mac, 3.034%, 10/25/20 | | | 2,606,000 | | | | 2,722,559 | |
| Freddie Mac, 3.5%, 7/01/42 | | | 6,101,838 | | | | 6,351,088 | |
| Freddie Mac, 1.655%, 11/25/16 | | | 1,696,158 | | | | 1,713,878 | |
| Freddie Mac, 1.426%, 8/25/17 | | | 9,701,000 | | | | 9,754,617 | |
| Freddie Mac, 3.882%, 11/25/17 | | | 1,936,000 | | | | 2,058,843 | |
| Freddie Mac, 3.154%, 2/25/18 | | | 935,000 | | | | 980,005 | |
| Freddie Mac, 5%, 7/01/18 - 4/01/40 | | | 1,610,648 | | | | 1,784,750 | |
| Freddie Mac, 2.412%, 8/25/18 | | | 2,300,000 | | | | 2,355,936 | |
| Freddie Mac, 2.303%, 9/25/18 | | | 8,971,000 | | | | 9,149,478 | |
| Freddie Mac, 2.323%, 10/25/18 | | | 1,194,000 | | | | 1,218,189 | |
| Freddie Mac, 2.22%, 12/25/18 | | | 1,200,000 | | | | 1,218,641 | |
| Freddie Mac, 2.13%, 1/25/19 | | | 6,184,000 | | | | 6,253,619 | |
| Freddie Mac, 2.086%, 3/25/19 | | | 7,200,000 | | | | 7,264,685 | |
| Freddie Mac, 1.883%, 5/25/19 | | | 8,450,000 | | | | 8,448,749 | |
| Freddie Mac, 5.5%, 6/01/19 - 1/01/38 | | | 1,111,309 | | | | 1,248,602 | |
| Freddie Mac, 4.186%, 8/25/19 | | | 1,110,000 | | | | 1,212,284 | |
| Freddie Mac, 1.869%, 11/25/19 | | | 6,121,000 | | | | 6,084,874 | |
| Freddie Mac, 4.251%, 1/25/20 | | | 807,000 | | | | 886,444 | |
| Freddie Mac, 2.757%, 5/25/20 | | | 928,759 | | | | 957,414 | |
| Freddie Mac, 3.32%, 7/25/20 - 2/25/23 | | | 5,980,914 | | | | 6,281,561 | |
| Freddie Mac, 2.856%, 1/25/21 | | | 5,331,000 | | | | 5,512,115 | |
| Freddie Mac, 2.682%, 10/25/22 | | | 3,049,000 | | | | 3,079,136 | |
| Freddie Mac, 3.3%, 4/25/23 | | | 6,099,972 | | | | 6,407,343 | |
| Freddie Mac, 3.06%, 7/25/23 | | | 4,230,000 | | | | 4,366,747 | |
| Freddie Mac, 3.531%, 7/25/23 | | | 2,401,000 | | | | 2,563,560 | |
11
MFS Research Bond Series
Portfolio of Investments – continued
| | | | | | | | |
| Issuer | | Shares/Par | | | Value ($) | |
| | | | | | | | |
| BONDS – continued | | | | | | | | |
| Mortgage-Backed – continued | |
| Freddie Mac, 3.458%, 8/25/23 | | $ | 14,256,000 | | | $ | 15,143,222 | |
| Freddie Mac, 4%, 7/01/25 - 11/01/43 | | | 22,670,767 | | | | 24,188,932 | |
| Freddie Mac, 4.5%, 7/01/25 - 6/01/41 | | | 1,356,646 | | | | 1,471,745 | |
| Freddie Mac, 3.5%, 8/01/26 - 3/01/43 | | | 20,017,237 | | | | 20,841,776 | |
| Freddie Mac, 6%, 8/01/34 - 7/01/38 | | | 297,440 | | | | 338,461 | |
| Freddie Mac, 3%, 4/01/43 - 5/01/43 | | | 3,515,821 | | | | 3,559,724 | |
| Freddie Mac, TBA, 4%, 1/01/45 - 2/01/45 | | | 39,956,758 | | | | 42,479,717 | |
| Ginnie Mae, 4.5%, 6/20/41 | | | 1,694,967 | | | | 1,857,871 | |
| Ginnie Mae, 5.5%, 5/15/33 - 1/20/42 | | | 4,886,615 | | | | 5,493,473 | |
| Ginnie Mae, 6%, 1/20/36 - 1/15/39 | | | 631,519 | | | | 719,078 | |
| Ginnie Mae, 4.5%, 4/15/39 - 10/20/43 | | | 40,840,632 | | | | 44,793,122 | |
| Ginnie Mae, 4%, 10/20/40 - 10/20/42 | | | 7,025,616 | | | | 7,549,739 | |
| Ginnie Mae, 3.5%, 11/15/40 - 7/20/43 | | | 15,980,623 | | | | 16,806,909 | |
| Ginnie Mae, TBA, 4%, 2/01/45 | | | 4,700,000 | | | | 5,028,336 | |
| | | | | | | | |
| | | | | | $ | 574,719,129 | |
| | | | | | | | |
| Municipals – 0.1% | | | | | | | | |
| Florida Hurricane Catastrophe Fund Finance Corp. Rev., “A”, 1.298%, 7/01/16 | | $ | 1,750,000 | | | $ | 1,759,450 | |
| | | | | | | | |
| Natural Gas – Distribution – 0.0% | |
| GNL Quintero S.A., 4.634%, 7/31/29 (n) | | $ | 764,000 | | | $ | 773,241 | |
| | | | | | | | |
| Network & Telecom – 0.9% | | | | | | | | |
| Empresa Nacional de Telecomunicaciones S.A., 4.875%, 10/30/24 (n) | | $ | 5,491,000 | | | $ | 5,579,553 | |
| Verizon Communications, Inc., 6.55%, 9/15/43 | | | 17,376,000 | | | | 22,261,245 | |
| | | | | | | | |
| | | | | | $ | 27,840,798 | |
| | | | | | | | |
| Oil Services – 0.5% | | | | | | | | |
| Odebrecht Offshore Drilling Finance Ltd., 6.75%, 10/01/22 (n) | | $ | 6,203,535 | | | $ | 5,676,235 | |
| Schlumberger Norge A.S., 1.25%, 8/01/17 (n) | | | 8,144,000 | | | | 8,123,852 | |
| | | | | | | | |
| | | | | | $ | 13,800,087 | |
| | | | | | | | |
| Other Banks & Diversified Financials – 2.3% | |
| Abbey National Treasury Services PLC, 3.05%, 8/23/18 | | $ | 2,885,000 | | | $ | 2,986,895 | |
| Bank of Tokyo-Mitsubishi UFJ Ltd., 2.7%, 9/09/18 (n) | | | 5,269,000 | | | | 5,360,296 | |
| BBVA Bancomer S.A. de C.V., 6.75%, 9/30/22 (n) | | | 2,570,000 | | | | 2,827,000 | |
| BPCE S.A., 4.5%, 3/15/25 (n) | | | 5,771,000 | | | | 5,639,000 | |
| Capital One Bank (USA) N.A., 3.375%, 2/15/23 | | | 10,111,000 | | | | 10,054,793 | |
| Capital One Financial Corp., 6.15%, 9/01/16 | | | 1,970,000 | | | | 2,117,567 | |
| Citigroup, Inc., 8.5%, 5/22/19 | | | 3,510,000 | | | | 4,373,695 | |
| Citigroup, Inc., 4.875%, 5/07/15 | | | 1,000,000 | | | | 1,013,320 | |
| Discover Bank, 7%, 4/15/20 | | | 7,009,000 | | | �� | 8,260,408 | |
| Groupe BPCE S.A., 12.5% to 9/30/19, FRN to 8/29/49 (n) | | | 7,880,000 | | | | 10,638,000 | |
| Intesa Sanpaolo S.p.A., 5.017%, 6/26/24 (n) | | | 3,180,000 | | | | 3,086,238 | |
| | | | | | | | |
| Issuer | | Shares/Par | | | Value ($) | |
| | | | | | | | |
| BONDS – continued | | | | | | | | |
| Other Banks & Diversified Financials – continued | |
| Macquarie Group Ltd., 6%, 1/14/20 (n) | | $ | 5,268,000 | | | $ | 5,966,927 | |
| Macquarie Group Ltd., 3%, 12/03/18 (n) | | | 1,320,000 | | | | 1,351,510 | |
| Rabobank Nederland N.V., 3.95%, 11/09/22 | | | 4,408,000 | | | | 4,490,117 | |
| Santander Holdings USA, Inc., 4.625%, 4/19/16 | | | 2,621,000 | | | | 2,730,841 | |
| | | | | | | | |
| | | | | | $ | 70,896,607 | |
| | | | | | | | |
| Pharmaceuticals – 1.9% | | | | | | | | |
| Bayer U.S. Finance LLC, 3.375%, 10/08/24 (n) | | $ | 2,779,000 | | | $ | 2,827,833 | |
| Celgene Corp., 2.45%, 10/15/15 | | | 4,949,000 | | | | 4,998,149 | |
| Celgene Corp., 1.9%, 8/15/17 | | | 5,062,000 | | | | 5,080,188 | |
| Forest Laboratories, Inc., 4.875%, 2/15/21 (n) | | | 21,349,000 | | | | 22,890,803 | |
| Gilead Sciences, Inc., 4.8%, 4/01/44 | | | 6,643,000 | | | | 7,368,774 | |
| Gilead Sciences, Inc., 2.35%, 2/01/20 | | | 817,000 | | | | 821,396 | |
| Teva Pharmaceutical Finance B.V., 2.95%, 12/18/22 | | | 9,309,000 | | | | 9,067,515 | |
| VPII Escrow Corp., 6.75%, 8/15/18 (z) | | | 3,795,000 | | | | 4,037,007 | |
| | | | | | | | |
| | | | | | $ | 57,091,665 | |
| | | | | | | | |
| Precious Metals & Minerals – 0.1% | |
| Teck Resources Ltd. Co., 5.4%, 2/01/43 | | $ | 1,868,000 | | | $ | 1,578,862 | |
| Teck Resources Ltd. Co., 6%, 8/15/40 | | | 826,000 | | | | 742,562 | |
| | | | | | | | |
| | | | | | $ | 2,321,424 | |
| | | | | | | | |
| Railroad & Shipping – 0.0% | | | | | | | | |
| Canadian Pacific Railway Co., 4.45%, 3/15/23 | | $ | 862,000 | | | $ | 945,986 | |
| | | | | | | | |
| Real Estate – Apartment – 0.1% | | | | | | | | |
| Mid-America Apartment Communities, Inc., REIT, 4.3%, 10/15/23 | | $ | 2,417,000 | | | $ | 2,543,160 | |
| | | | | | | | |
| Real Estate – Healthcare – 0.2% | | | | | | | | |
| HCP, Inc., REIT, 3.875%, 8/15/24 | | $ | 5,515,000 | | | $ | 5,602,231 | |
| HCP, Inc., REIT, 5.375%, 2/01/21 | | | 1,134,000 | | | | 1,266,345 | |
| | | | | | | | |
| | | | | | $ | 6,868,576 | |
| | | | | | | | |
| Real Estate – Office – 0.3% | | | | | | | | |
| Boston Properties LP, REIT, 3.7%, 11/15/18 | | $ | 5,395,000 | | | $ | 5,688,655 | |
| Boston Properties LP, REIT, 3.8%, 2/01/24 | | | 3,803,000 | | | | 3,908,225 | |
| | | | | | | | |
| | | | | | $ | 9,596,880 | |
| | | | | | | | |
| Real Estate – Other – 0.0% | | | | | | | | |
| Liberty Property LP, REIT, 5.5%, 12/15/16 | | $ | 1,013,000 | | | $ | 1,087,963 | |
| | | | | | | | |
| Real Estate – Retail – 0.5% | | | | | | | | |
| DDR Corp., REIT, 4.625%, 7/15/22 | | $ | 2,365,000 | | | $ | 2,524,656 | |
| DDR Corp., REIT, 3.375%, 5/15/23 | | | 5,368,000 | | | | 5,204,319 | |
| Kimco Realty Corp., REIT, 5.783%, 3/15/16 | | | 1,794,000 | | | | 1,889,687 | |
| Simon Property Group, Inc., REIT, 10.35%, 4/01/19 | | | 3,213,000 | | | | 4,202,565 | |
| | | | | | | | |
| | | | | | $ | 13,821,227 | |
| | | | | | | | |
12
MFS Research Bond Series
Portfolio of Investments – continued
| | | | | | | | |
| Issuer | | Shares/Par | | | Value ($) | |
| | | | | | | | |
| BONDS – continued | | | | | | | | |
| Restaurants – 0.2% | | | | | | | | |
| YUM! Brands, Inc., 5.35%, 11/01/43 | | $ | 6,259,000 | | | $ | 6,844,548 | |
| | | | | | | | |
| Retailers – 1.0% | | | | | | | | |
| Bed Bath & Beyond, Inc., 5.165%, 8/01/44 | | $ | 7,156,000 | | | $ | 7,464,388 | |
| Cencosud S.A., 5.5%, 1/20/21 | | | 3,126,000 | | | | 3,244,688 | |
| Gap, Inc., 5.95%, 4/12/21 | | | 7,230,000 | | | | 8,227,783 | |
| Home Depot, Inc., 5.95%, 4/01/41 | | | 2,318,000 | | | | 3,027,484 | |
| Kohl’s Corp., 3.25%, 2/01/23 | | | 2,462,000 | | | | 2,397,215 | |
| Target Corp., 3.5%, 7/01/24 | | | 6,246,000 | | | | 6,484,429 | |
| | | | | | | | |
| | | | | | $ | 30,845,987 | |
| | | | | | | | |
| Specialty Chemicals – 0.3% | | | | | | | | |
| Ecolab, Inc., 4.35%, 12/08/21 | | $ | 5,300,000 | | | $ | 5,774,822 | |
| Mexichem S.A.B. de C.V., 6.75%, 9/19/42 (n) | | | 3,236,000 | | | | 3,357,350 | |
| | | | | | | | |
| | | | | | $ | 9,132,172 | |
| | | | | | | | |
| Supermarkets – 0.1% | | | | | | | | |
| Delhaize Group, 4.125%, 4/10/19 | | $ | 718,000 | | | $ | 754,009 | |
| Kroger Co., 3.85%, 8/01/23 | | | 2,248,000 | | | | 2,330,895 | |
| | | | | | | | |
| | | | | | $ | 3,084,904 | |
| | | | | | | | |
| Telecommunications – Wireless – 1.0% | |
| American Tower Corp., REIT, 3.5%, 1/31/23 | | $ | 5,862,000 | | | $ | 5,663,911 | |
| American Tower Corp., REIT, 5%, 2/15/24 | | | 7,009,000 | | | | 7,432,813 | |
| Crown Castle Towers LLC, 6.113%, 1/15/20 (n) | | | 3,171,000 | | | | 3,642,344 | |
| Crown Castle Towers LLC, 4.883%, 8/15/20 (n) | | | 2,400,000 | | | | 2,638,142 | |
| MTS International Funding Ltd., 5%, 5/30/23 (n) | | | 4,798,000 | | | | 3,790,420 | |
| Rogers Communications, Inc., 5%, 3/15/44 | | | 3,525,000 | | | | 3,854,829 | |
| SBA Tower Trust, 2.898%, 10/15/19 (n) | | | 4,229,000 | | | | 4,240,143 | |
| | | | | | | | |
| | | | | | $ | 31,262,602 | |
| | | | | | | | |
| Tobacco – 0.7% | | | | | | | | |
| Altria Group, Inc., 2.85%, 8/09/22 | | $ | 7,089,000 | | | $ | 6,888,353 | |
| Altria Group, Inc., 2.95%, 5/02/23 | | | 2,030,000 | | | | 1,962,943 | |
| Lorillard Tobacco Co., 8.125%, 6/23/19 | | | 3,344,000 | | | | 4,054,021 | |
| Reynolds American, Inc., 6.75%, 6/15/17 | | | 7,300,000 | | | | 8,132,207 | |
| | | | | | | | |
| | | | | | $ | 21,037,524 | |
| | | | | | | | |
| Transportation – Services – 0.4% | | | | | |
| ERAC USA Finance Co., 7%, 10/15/37 (n) | | $ | 2,690,000 | | | $ | 3,625,079 | |
| ERAC USA Finance LLC, 3.85%, 11/15/24 (n) | | | 1,612,000 | | | | 1,634,807 | |
| Navios Maritime Holding, Inc., 7.375%, 1/15/22 (n) | | | 7,035,000 | | | | 6,507,375 | |
| | | | | | | | |
| | | | | | $ | 11,767,261 | |
| | | | | | | | |
| | | | | | | | |
| Issuer | | Shares/Par | | | Value ($) | |
| | | | | | | | |
| BONDS – continued | | | | | | | | |
| U.S. Government Agencies and Equivalents – 2.3% | |
| National Credit Union Administration Guaranteed Note, 2.9%, 10/29/20 | | $ | 980,000 | | | $ | 1,006,482 | |
| Small Business Administration, 4.93%, 1/01/24 | | | 33,624 | | | | 36,080 | |
| Small Business Administration, 4.34%, 3/01/24 | | | 49,544 | | | | 52,019 | |
| Small Business Administration, 4.99%, 9/01/24 | | | 38,073 | | | | 41,155 | |
| Small Business Administration, 4.86%, 1/01/25 | | | 97,375 | | | | 104,663 | |
| Small Business Administration, 4.625%, 2/01/25 | | | 94,905 | | | | 100,725 | |
| Small Business Administration, 5.11%, 4/01/25 | | | 67,465 | | | | 73,348 | |
| Small Business Administration, 4.43%, 5/01/29 | | | 749,612 | | | | 815,442 | |
| Small Business Administration, 3.25%, 11/01/30 | | | 675,065 | | | | 699,178 | |
| Small Business Administration, 2.85%, 9/01/31 | | | 1,536,172 | | | | 1,564,252 | |
| Small Business Administration, 2.37%, 8/01/32 | | | 1,296,939 | | | | 1,293,828 | |
| Small Business Administration, 3.21%, 9/01/30 | | | 7,294,785 | | | | 7,539,533 | |
| Small Business Administration, 2.13%, 1/01/33 | | | 4,583,230 | | | | 4,494,654 | |
| Small Business Administration, 2.21%, 2/01/33 | | | 1,148,672 | | | | 1,132,517 | |
| Small Business Administration, 2.22%, 3/01/33 | | | 4,208,718 | | | | 4,153,999 | |
| Small Business Administration, 2.08%, 4/01/33 | | | 6,264,011 | | | | 6,116,051 | |
| Small Business Administration, 2.45%, 6/01/33 | | | 7,500,864 | | | | 7,432,940 | |
| Small Business Administration, 3.15%, 7/01/33 | | | 10,428,811 | | | | 10,728,481 | |
| Small Business Administration, 3.16%, 8/01/33 | | | 10,552,098 | | | | 10,876,729 | |
| Small Business Administration, 3.62%, 9/01/33 | | | 9,594,938 | | | | 10,072,886 | |
| | | | | | | | |
| | | | | | $ | 68,334,962 | |
| | | | | | | | |
| U.S. Treasury Obligations – 20.0% | |
| U.S. Treasury Bonds, 3.375%, 11/15/19 | | $ | 1,800,000 | | | $ | 1,950,188 | |
| U.S. Treasury Bonds, 4.5%, 2/15/36 | | | 12,590,000 | | | | 16,807,650 | |
| U.S. Treasury Bonds, 4.75%, 2/15/37 | | | 22,300,000 | | | | 30,794,917 | |
| U.S. Treasury Bonds, 4.375%, 2/15/38 | | | 17,377,000 | | | | 22,758,448 | |
| U.S. Treasury Bonds, 4.5%, 8/15/39 | | | 60,341,600 | | | | 80,471,196 | |
| U.S. Treasury Bonds, 3.125%, 11/15/41 | | | 500,000 | | | | 540,156 | |
| U.S. Treasury Bonds, 3.125%, 2/15/42 | | | 1,300,000 | | | | 1,400,344 | |
| U.S. Treasury Notes, 2.125%, 5/31/15 (f) | | | 76,244,000 | | | | 76,869,430 | |
| U.S. Treasury Notes, 0.375%, 11/15/15 | | | 5,600,000 | | | | 5,605,253 | |
| U.S. Treasury Notes, 0.375%, 2/15/16 | | | 92,025,000 | | | | 92,046,534 | |
| U.S. Treasury Notes, 0.875%, 12/31/16 | | | 16,433,000 | | | | 16,490,778 | |
| U.S. Treasury Notes, 0.75%, 6/30/17 | | | 180,931,000 | | | | 180,196,058 | |
13
MFS Research Bond Series
Portfolio of Investments – continued
| | | | | | | | |
| Issuer | | Shares/Par | | | Value ($) | |
| | | | | | | | |
| BONDS – continued | | | | | | | | |
| U.S. Treasury Obligations – continued | | | | | |
| U.S. Treasury Notes, 2.875%, 3/31/18 | | $ | 2,000,000 | | | $ | 2,103,124 | |
| U.S. Treasury Notes, 2.625%, 4/30/18 | | | 1,600,000 | | | | 1,672,374 | |
| U.S. Treasury Notes, 1.5%, 8/31/18 | | | 13,955,000 | | | | 14,019,319 | |
| U.S. Treasury Notes, 1%, 6/30/19 | | | 49,082,000 | | | | 47,885,626 | |
| U.S. Treasury Notes, 1%, 8/31/19 | | | 5,600,000 | | | | 5,446,000 | |
| U.S. Treasury Notes, 3.625%, 2/15/20 | | | 4,200,000 | | | | 4,605,233 | |
| U.S. Treasury Notes, TIPS, 1.625%, 1/15/15 | | | 857,843 | | | | 855,966 | |
| U.S. Treasury Notes, TIPS, 2%, 1/15/16 | | | 1,471,154 | | | | 1,492,531 | |
| | | | | | | | |
| | | | | | $ | 604,011,125 | |
| | | | | | | | |
| Utilities – Electric Power – 2.7% | | | | | | | | |
| Berkshire Hathaway Energy Co., 5.15%, 11/15/43 | | $ | 6,436,000 | | | $ | 7,282,508 | |
| CMS Energy Corp., 6.25%, 2/01/20 | | | 1,925,000 | | | | 2,228,975 | |
| CMS Energy Corp., 5.05%, 3/15/22 | | | 5,272,000 | | | | 5,910,497 | |
| Constellation Energy Group, Inc., 5.15%, 12/01/20 | | | 2,487,000 | | | | 2,753,609 | |
| Dominion Resources, Inc., 3.625%, 12/01/24 | | | 8,424,000 | | | | 8,533,183 | |
| Duke Energy Corp., 3.75%, 4/15/24 | | | 2,859,000 | | | | 2,974,003 | |
| EDP Finance B.V., 5.25%, 1/14/21 (n) | | | 3,848,000 | | | | 4,049,096 | |
| EDP Finance B.V., 4.125%, 1/15/20 (n) | | | 1,754,000 | | | | 1,763,822 | |
| Empresa Nacional de Electricidad S.A., 4.25%, 4/15/24 | | | 5,095,000 | | | | 5,123,496 | |
| Enel Finance International S.A., 6%, 10/07/39 (n) | | | 3,700,000 | | | | 4,347,385 | |
| Enel Finance International S.A., 6.25%, 9/15/17 (n) | | | 3,623,000 | | | | 4,021,573 | |
| | | | | | | | |
| Issuer | | Shares/Par | | | Value ($) | |
| | | | | | | | |
| BONDS – continued | | | | | | | | |
| Utilities – Electric Power – continued | |
| Exelon Corp., 4.9%, 6/15/15 | | $ | 5,842,000 | | | $ | 5,946,443 | |
| Exelon Generation Co. LLC, 4.25%, 6/15/22 | | | 3,983,000 | | | | 4,139,054 | |
| Florida Power & Light Co., 4.05%, 10/01/44 | | | 4,535,000 | | | | 4,755,950 | |
| Pacific Gas & Electric Co., 3.25%, 6/15/23 | | | 2,431,000 | | | | 2,435,633 | |
| PPL Capital Funding, Inc., 5%, 3/15/44 | | | 3,429,000 | | | | 3,816,251 | |
| PPL Corp., 3.5%, 12/01/22 | | | 1,050,000 | | | | 1,063,468 | |
| PPL WEM Holdings PLC, 5.375%, 5/01/21 (n) | | | 8,842,000 | | | | 9,937,329 | |
| Waterford 3 Funding Corp., 8.09%, 1/02/17 | | | 39,491 | | | | 39,496 | |
| | | | | | | | |
| | | | | | $ | 81,121,771 | |
| | | | | | | | |
Total Bonds
(Identified Cost, $2,884,588,565) | | | | | | $ | 2,945,873,398 | |
| | | | | | | | |
| |
| MONEY MARKET FUNDS – 6.7% | | | | | |
| MFS Institutional Money Market Portfolio, 0.09%, at Cost and Net Asset Value (v) | | | 203,174,023 | | | $ | 203,174,023 | |
| | | | | | | | |
Total Investments
(Identified Cost, $3,087,762,588) | | | | | | $ | 3,149,047,421 | |
| | | | | | | | |
OTHER ASSETS, LESS
LIABILITIES – (4.1)% | | | | | | | (125,142,713 | ) |
| | | | | | | | |
| NET ASSETS – 100.0% | | | | | | $ | 3,023,904,708 | |
| | | | | | | | |
| (f) | | All or a portion of the security has been segregated as collateral for open futures contracts. |
| (i) | | Interest only security for which the fund receives interest on notional principal (Par amount). Par amount shown is the notional principal and does not reflect the cost of the security. |
| (n) | | Securities exempt from registration under Rule 144A of the Securities Act of 1933. These securities may be sold in the ordinary course of business in transactions exempt from registration, normally to qualified institutional buyers. At period end, the aggregate value of these securities was $444,945,100 representing 14.7% of net assets. |
| (q) | | Interest received was less than stated coupon rate. |
| (v) | | Underlying affiliated fund that is available only to investment companies managed by MFS. The rate quoted for the MFS Institutional Money Market Portfolio is the annualized seven-day yield of the fund at period end. |
| (z) | | Restricted securities are not registered under the Securities Act of 1933 and are subject to legal restrictions on resale. These securities generally may be resold in transactions exempt from registration or to the public if the securities are subsequently registered. Disposal of these securities may involve time-consuming negotiations and prompt sale at an acceptable price may be difficult. The fund holds the following restricted securities: |
| | | | | | | | | | |
| Restricted Securities | | Acquisition
Date | | Cost | | | Value | |
| Babson Ltd., CLO, FRN, 1.33%, 4/20/25 | | 3/12/14 | | | $7,201,463 | | | | $7,166,927 | |
| Bayview Commercial Asset Trust, FRN, 0%, 4/25/36 | | 2/28/06 | | | 27,198 | | | | 252 | |
| Bayview Commercial Asset Trust, FRN, 0%, 7/25/36 | | 5/16/06 | | | 17,106 | | | | 0 | |
| Bayview Commercial Asset Trust, FRN, 0%, 10/25/36 | | 9/11/06 | | | 55,301 | | | | 0 | |
| Bayview Commercial Asset Trust, FRN, 0%, 12/25/36 | | 10/25/06 | | | 34,086 | | | | 0 | |
| Bayview Commercial Asset Trust, FRN, 0%, 3/25/37 | | 1/26/07 | | | 12,084 | | | | 0 | |
| Bayview Financial Revolving Mortgage Loan Trust, FRN, 1.769%, 12/28/40 | | 3/01/06 | | | 144,148 | | | | 86,034 | |
| Capital Trust Realty Ltd., CDO, 5.267%, 6/25/35 | | 9/14/10-3/25/11 | | | 882,139 | | | | 949,175 | |
14
MFS Research Bond Series
Portfolio of Investments – continued
| | | | | | | | | | |
| Restricted Securities – continued | | Acquisition
Date | | Cost | | | Value | |
| Commercial Mortgage Asset Trust, FRN, 0.494%, 1/17/32 | | 4/09/12 | | | $2,675 | | | | $2,706 | |
| Dryden Senior Loan Fund, CLO, “A”, FRN, 1.61%, 1/15/25 | | 9/19/14 | | | 7,539,172 | | | | 7,476,343 | |
| Falcon Franchise Loan LLC, FRN, 19.164%, 1/05/25 | | 1/29/03 | | | 1,068 | | | | 3,592 | |
| First Union National Bank Commercial Mortgage Trust, FRN, 1.735%, 1/12/43 | | 4/09/12 | | | 3 | | | | 136 | |
| Flatiron CLO Ltd. 2013-1A, “A1”, FRN, 1.628%, 1/17/26 | | 7/24/14-9/09/14 | | | 8,317,740 | | | | 8,253,317 | |
| Hertz Fleet Lease Funding LP, 2014-1, FRN, 0.561%, 4/10/28 | | 3/25/14 | | | 7,424,000 | | | | 7,416,955 | |
| Metropolitan Life Global Funding I, 1.7%, 6/29/15 | | 10/25/12-10/26/12 | | | 5,316,490 | | | | 5,323,397 | |
| Preferred Term Securities XIX Ltd., CDO, FRN, 0.59%, 12/22/35 | | 3/28/11 | | | 228,121 | | | | 248,735 | |
| SES S.A., 5.3%, 4/04/43 | | 1/08/14 | | | 3,178,853 | | | | 3,634,325 | |
| VPII Escrow Corp., 6.75%, 8/15/18 | | 6/27/13 | | | 3,795,000 | | | | 4,037,007 | |
| Total Restricted Securities | | | | $44,598,901 | |
| % of Net assets | | | | 1.5% | |
The following abbreviations are used in this report and are defined:
| CDO | | Collateralized Debt Obligation |
| CLO | | Collateralized Loan Obligation |
| FRN | | Floating Rate Note. Interest rate resets periodically and may not be the rate reported at period end. |
| PLC | | Public Limited Company |
| REIT | | Real Estate Investment Trust |
| TIPS | | Treasury Inflation Protected Security |
Derivative Contracts at 12/31/14
Futures Contracts at 12/31/14
| | | | | | | | | | | | | | | | | | |
| Description | | Currency | | | Contracts | | | Value | | Expiration
Date | | | Unrealized
Appreciation
(Depreciation) | |
| Liability Derivatives | | | | | | | | | | | | | | | | | | |
| Interest Rate Futures | | | | | | | | | | | | | | | | | | |
| U.S. Treasury Note 10 yr (Short) | | | USD | | | | 385 | | | $48,816,797 | | | March - 2015 | | | | $(260,019 | ) |
| U.S. Treasury Bond 30 yr (Short) | | | USD | | | | 285 | | | 41,200,313 | | | March - 2015 | | | | (1,087,560 | ) |
| | | | | | | | | | | | | | | | | | |
| | | | | | | | | | | | | | | | | $(1,347,579 | ) |
| | | | | | | | | | | | | | | | | | |
At December 31, 2014, the fund had liquid securities with an aggregate value of $1,108,012 to cover any commitments for certain derivative contracts.
See Notes to Financial Statements
15
MFS Research Bond Series
FINANCIAL STATEMENTS | STATEMENT OF ASSETS AND LIABILITIES
This statement represents your fund’s balance sheet, which details the assets and liabilities comprising the total value of the fund.
| | | | | | | | |
At 12/31/14 | | | | | | | | |
Assets | | | | | | | | |
Investments – | | | | | | | | |
Non-affiliated issuers, at value (identified cost, $2,884,588,565) | | | $2,945,873,398 | | | | | |
Underlying affiliated funds, at cost and value | | | 203,174,023 | | | | | |
Total investments, at value (identified cost, $3,087,762,588) | | | $3,149,047,421 | | | | | |
Cash | | | 37,787 | | | | | |
Receivables for | | | | | | | | |
Fund shares sold | | | 20,409,720 | | | | | |
Interest | | | 22,272,559 | | | | | |
Other assets | | | 18,425 | | | | | |
Total assets | | | | | | | $3,191,785,912 | |
Liabilities | | | | | | | | |
Payables for | | | | | | | | |
Daily variation margin on open futures contracts | | | $164,375 | | | | | |
TBA purchase commitments | | | 166,839,419 | | | | | |
Fund shares reacquired | | | 584,102 | | | | | |
Payable to affiliates | | | | | | | | |
Investment adviser | | | 64,637 | | | | | |
Shareholder servicing costs | | | 476 | | | | | |
Distribution and/or service fees | | | 25,236 | | | | | |
Payable for independent Trustees’ compensation | | | 51 | | | | | |
Accrued expenses and other liabilities | | | 202,908 | | | | | |
Total liabilities | | | | | | | $167,881,204 | |
Net assets | | | | | | | $3,023,904,708 | |
Net assets consist of | | | | | | | | |
Paid-in capital | | | $2,899,828,131 | | | | | |
Unrealized appreciation (depreciation) on investments | | | 59,937,254 | | | | | |
Accumulated net realized gain (loss) on investments | | | (27,709,087 | ) | | | | |
Undistributed net investment income | | | 91,848,410 | | | | | |
Net assets | | | | | | | $3,023,904,708 | |
Shares of beneficial interest outstanding | | | | | | | 226,249,780 | |
| | | | | | | | | | | | |
| | | Net assets | | | Shares
outstanding | | | Net asset value
per share | |
Initial Class | | | $1,172,956,699 | | | | 86,869,084 | | | | $13.50 | |
Service Class | | | 1,850,948,009 | | | | 139,380,696 | | | | 13.28 | |
See Notes to Financial Statements
16
MFS Research Bond Series
FINANCIAL STATEMENTS | STATEMENT OF OPERATIONS
This statement describes how much your fund earned in investment income and accrued in expenses. It also describes any gains and/or losses generated by fund operations.
| | | | | | | | |
Year ended 12/31/14 | | | | | | | | |
Net investment income | | | | | | | | |
Income | | | | | | | | |
Interest | | | $98,491,913 | | | | | |
Dividends from underlying affiliated funds | | | 115,326 | | | | | |
Total investment income | | | | | | | $98,607,239 | |
Expenses | | | | | | | | |
Management fee | | | $15,144,722 | | | | | |
Distribution and/or service fees | | | 4,660,605 | | | | | |
Shareholder servicing costs | | | 89,836 | | | | | |
Administrative services fee | | | 416,215 | | | | | |
Independent Trustees’ compensation | | | 43,868 | | | | | |
Custodian fee | | | 164,923 | | | | | |
Shareholder communications | | | 116,532 | | | | | |
Audit and tax fees | | | 74,205 | | | | | |
Legal fees | | | 26,345 | | | | | |
Miscellaneous | | | 80,924 | | | | | |
Total expenses | | | | | | | $20,818,175 | |
Fees paid indirectly | | | (516 | ) | | | | |
Reduction of expenses by investment adviser | | | (409,129 | ) | | | | |
Net expenses | | | | | | | $20,408,530 | |
Net investment income | | | | | | | $78,198,709 | |
Realized and unrealized gain (loss) on investments | | | | | | | | |
Realized gain (loss) (identified cost basis) | | | | | | | | |
Investments | | | $18,784,458 | | | | | |
Futures contracts | | | (9,504,494 | ) | | | | |
Net realized gain (loss) on investments | | | | | | | $9,279,964 | |
Change in unrealized appreciation (depreciation) | | | | | | | | |
Investments | | | $86,614,254 | | | | | |
Futures contracts | | | (5,129,819 | ) | | | | |
Net unrealized gain (loss) on investments | | | | | | | $81,484,435 | |
Net realized and unrealized gain (loss) on investments | | | | | | | $90,764,399 | |
Change in net assets from operations | | | | | | | $168,963,108 | |
See Notes to Financial Statements
17
MFS Research Bond Series
FINANCIAL STATEMENTS | STATEMENTS OF CHANGES IN NET ASSETS
These statements describe the increases and/or decreases in net assets resulting from operations, any distributions, and any shareholder transactions.
| | | | | | | | |
For years ended 12/31 | | | 2014 | | | | 2013 | |
Change in net assets | | | | | | | | |
From operations | | | | | | | | |
Net investment income | | | $78,198,709 | | | | $66,697,671 | |
Net realized gain (loss) on investments | | | 9,279,964 | | | | (1,446,148 | ) |
Net unrealized gain (loss) on investments | | | 81,484,435 | | | | (88,361,181 | ) |
Change in net assets from operations | | | $168,963,108 | | | | $(23,109,658 | ) |
Distributions declared to shareholders | | | | | | | | |
From net investment income | | | $(82,917,411 | ) | | | $(31,426,373 | ) |
From net realized gain on investments | | | — | | | | (12,316,848 | ) |
Total distributions declared to shareholders | | | $(82,917,411 | ) | | | $(43,743,221 | ) |
Change in net assets from fund share transactions | | | $(106,862,454 | ) | | | $614,866,540 | |
Total change in net assets | | | $(20,816,757 | ) | | | $548,013,661 | |
Net assets | | | | | | | | |
At beginning of period | | | 3,044,721,465 | | | | 2,496,707,804 | |
At end of period (including undistributed net investment income of $91,848,410 and
$82,916,994, respectively) | | | $3,023,904,708 | | | | $3,044,721,465 | |
See Notes to Financial Statements
18
MFS Research Bond Series
FINANCIAL STATEMENTS | FINANCIAL HIGHLIGHTS
The financial highlights table is intended to help you understand the fund’s financial performance for the past 5 years. Certain information reflects financial results for a single fund share. The total returns in the table represent the rate by which an investor would have earned (or lost) on an investment in the fund share class (assuming reinvestment of all distributions) held for the entire period.
| | | | | | | | | | | | | | | | | | | | |
| Initial Class | | Years ended 12/31 | |
| | | 2014 | | | 2013 | | | 2012 | | | 2011 | | | 2010 | |
Net asset value, beginning of period | | | $13.13 | | | | $13.49 | | | | $13.01 | | | | $12.66 | | | | $12.20 | |
| Income (loss) from investment operations | | | | | | | | | | | | | | | | | | | | |
Net investment income (d) | | | $0.37 | | | | $0.35 | | | | $0.37 | | | | $0.44 | | | | $0.44 | |
Net realized and unrealized gain (loss) on investments | | | 0.40 | | | | (0.49 | ) | | | 0.57 | | | | 0.41 | | | | 0.45 | |
Total from investment operations | | | $0.77 | | | | $(0.14 | ) | | | $0.94 | | | | $0.85 | | | | $0.89 | |
| Less distributions declared to shareholders | | | | | | | | | | | | | | | | | | | | |
From net investment income | | | $(0.40 | ) | | | $(0.16 | ) | | | $(0.37 | ) | | | $(0.35 | ) | | | $(0.39 | ) |
From net realized gain on investments | | | — | | | | (0.06 | ) | | | (0.09 | ) | | | (0.15 | ) | | | (0.04 | ) |
Total distributions declared to shareholders | | | $(0.40 | ) | | | $(0.22 | ) | | | $(0.46 | ) | | | $(0.50 | ) | | | $(0.43 | ) |
Net asset value, end of period (x) | | | $13.50 | | | | $13.13 | | | | $13.49 | | | | $13.01 | | | | $12.66 | |
Total return (%) (k)(r)(s)(x) | | | 5.85 | | | | (1.03 | ) | | | 7.35 | | | | 6.75 | | | | 7.47 | |
Ratios (%) (to average net assets)
and Supplemental data: | | | | | | | | | | | | | | | | | | | | |
Expenses before expense reductions (f) | | | 0.53 | | | | 0.54 | | | | 0.56 | | | | 0.57 | | | | 0.59 | |
Expenses after expense reductions (f) | | | 0.52 | | | | 0.53 | | | | 0.56 | | | | 0.57 | | | | 0.59 | |
Net investment income | | | 2.74 | | | | 2.65 | | | | 2.76 | | | | 3.41 | | | | 3.51 | |
Portfolio turnover | | | 58 | | | | 68 | | | | 114 | | | | 60 | | | | 66 | |
Net assets at end of period (000 omitted) | | | $1,172,957 | | | | $1,208,132 | | | | $850,417 | | | | $367,398 | | | | $371,865 | |
See Notes to Financial Statements
19
MFS Research Bond Series
Financial Highlights – continued
| | | | | | | | | | | | | | | | | | | | |
| Service Class | | Years ended 12/31 | |
| | | 2014 | | | 2013 | | | 2012 | | | 2011 | | | 2010 | |
Net asset value, beginning of period | | | $12.92 | | | | $13.30 | | | | $12.85 | | | | $12.53 | | | | $12.10 | |
| Income (loss) from investment operations | | | | | | | | | | | | | | | | | | | | |
Net investment income (d) | | | $0.33 | | | | $0.31 | | | | $0.33 | | | | $0.40 | | | | $0.40 | |
Net realized and unrealized gain (loss) on investments | | | 0.39 | | | | (0.48 | ) | | | 0.57 | | | | 0.41 | | | | 0.45 | |
Total from investment operations | | | $0.72 | | | | $(0.17 | ) | | | $0.90 | | | | $0.81 | | | | $0.85 | |
| Less distributions declared to shareholders | | | | | | | | | | | | | | | | | | | | |
From net investment income | | | $(0.36 | ) | | | $(0.15 | ) | | | $(0.36 | ) | | | $(0.34 | ) | | | $(0.38 | ) |
From net realized gain on investments | | | — | | | | (0.06 | ) | | | (0.09 | ) | | | (0.15 | ) | | | (0.04 | ) |
Total distributions declared to shareholders | | | $(0.36 | ) | | | $(0.21 | ) | | | $(0.45 | ) | | | $(0.49 | ) | | | $(0.42 | ) |
Net asset value, end of period (x) | | | $13.28 | | | | $12.92 | | | | $13.30 | | | | $12.85 | | | | $12.53 | |
Total return (%) (k)(r)(s)(x) | | | 5.62 | | | | (1.29 | ) | | | 7.06 | | | | 6.48 | | | | 7.20 | |
Ratios (%) (to average net assets)
and Supplemental data: | | | | | | | | | | | | | | | | | | | | |
Expenses before expense reductions (f) | | | 0.78 | | | | 0.79 | | | | 0.81 | | | | 0.82 | | | | 0.84 | |
Expenses after expense reductions (f) | | | 0.77 | | | | 0.78 | | | | 0.81 | | | | 0.82 | | | | 0.84 | |
Net investment income | | | 2.48 | | | | 2.39 | | | | 2.48 | | | | 3.13 | | | | 3.20 | |
Portfolio turnover | | | 58 | | | | 68 | | | | 114 | | | | 60 | | | | 66 | |
Net assets at end of period (000 omitted) | | | $1,850,948 | | | | $1,836,589 | | | | $1,646,291 | | | | $406,273 | | | | $211,077 | |
| (d) | Per share data is based on average shares outstanding. |
| (f) | Ratios do not reflect reductions from fees paid indirectly, if applicable. |
| (k) | The total return does not reflect expenses that apply to separate accounts. Inclusion of these charges would reduce the total return figures for all periods shown. |
| (r) | Certain expenses have been reduced without which performance would have been lower. |
| (s) | From time to time the fund may receive proceeds from litigation settlements, without which performance would be lower. |
| (x) | The net asset values per share and total returns have been calculated on net assets which include adjustments made in accordance with U.S. generally accepted accounting principles required at period end for financial reporting purposes. |
See Notes to Financial Statements
20
MFS Research Bond Series
NOTES TO FINANCIAL STATEMENTS
| (1) | | Business and Organization |
MFS Research Bond Series (the fund) is a diversified series of MFS Variable Insurance Trust (the trust). The trust is organized as a Massachusetts business trust and is registered under the Investment Company Act of 1940, as amended, as an open-end management investment company. The shareholders of each series of the trust are separate accounts of insurance companies, which offer variable annuity and/or life insurance products, and qualified retirement and pension plans.
The fund is an investment company and accordingly follows the investment company accounting and reporting guidance of the Financial Accounting Standards Board (FASB) Accounting Standards Codification Topic 946 Financial Services – Investment Companies.
| (2) | | Significant Accounting Policies |
General – The preparation of financial statements in conformity with U.S. generally accepted accounting principles requires management to make estimates and assumptions that affect the reported amounts of assets and liabilities, and disclosure of contingent assets and liabilities at the date of the financial statements and the reported amounts of increases and decreases in net assets from operations during the reporting period. Actual results could differ from those estimates. In the preparation of these financial statements, management has evaluated subsequent events occurring after the date of the fund’s Statement of Assets and Liabilities through the date that the financial statements were issued. The fund invests in high-yield securities rated below investment grade. Investments in high-yield securities involve greater degrees of credit and market risk than investments in higher-rated securities and tend to be more sensitive to economic conditions. The fund invests in foreign securities. Investments in foreign securities are vulnerable to the effects of changes in the relative values of the local currency and the U.S. dollar and to the effects of changes in each country’s legal, political, and economic environment.
In June 2014, FASB issued Accounting Standards Update 2014-11, Transfers and Servicing (Topic 860) – Repurchase-to-Maturity Transactions, Repurchase Financings, and Disclosures (“ASU 2014-11”). ASU 2014-11 changes the accounting for repurchase-to-maturity transactions (i.e., repurchase agreements that settle at the same time as the maturity of the transferred financial asset) and enhances the required disclosures for repurchase agreements and other similar transactions. Although still evaluating the potential impacts of ASU 2014-11 to the fund, management expects that the impact of the fund’s adoption will be limited to additional financial statement disclosures which would first be effective for interim reporting periods beginning after March 15, 2015.
Balance Sheet Offsetting – The fund’s accounting policy with respect to balance sheet offsetting is that, absent an event of default by the counterparty or a termination of the agreement, the International Swaps and Derivatives Association (ISDA) Master Agreement does not result in an offset of reported amounts of financial assets and financial liabilities in the Statement of Assets and Liabilities across transactions between the fund and the applicable counterparty. The fund’s right to setoff may be restricted or prohibited by the bankruptcy or insolvency laws of the particular jurisdiction to which a specific master netting agreement counterparty is subject. Balance sheet offsetting disclosures, to the extent applicable to the fund, have been included in the fund’s Significant Accounting Policies note under the captions for each of the fund’s in-scope financial instruments and transactions.
Investment Valuations – Debt instruments and floating rate loans, including restricted debt instruments, are generally valued at an evaluated or composite bid as provided by a third-party pricing service. Short-term instruments with a maturity at issuance of 60 days or less may be valued at amortized cost, which approximates market value. Futures contracts are generally valued at last posted settlement price as provided by a third-party pricing service on the market on which they are primarily traded. Futures contracts for which there were no trades that day for a particular position are generally valued at the closing bid quotation as provided by a third-party pricing service on the market on which such futures contracts are primarily traded. Open-end investment companies are generally valued at net asset value per share. Securities and other assets generally valued on the basis of information from a third-party pricing service may also be valued at a broker/dealer bid quotation. Values obtained from third-party pricing services can utilize both transaction data and market information such as yield, quality, coupon rate, maturity, type of issue, trading characteristics, and other market data. The values of foreign securities and other assets and liabilities expressed in foreign currencies are converted to U.S. dollars using the mean of bid and asked prices for rates provided by a third-party pricing service.
The Board of Trustees has delegated primary responsibility for determining or causing to be determined the value of the fund’s investments (including any fair valuation) to the adviser pursuant to valuation policies and procedures approved by the Board. If the adviser determines that reliable market quotations are not readily available, investments are valued at fair value as determined in good faith by the adviser in accordance with such procedures under the oversight of the Board of Trustees. Under the fund’s valuation policies and procedures, market quotations are not considered to be readily available for most types of debt instruments and floating rate loans and many types of derivatives. These investments are generally valued at fair value based on information from third-party pricing services. In addition, investments may be valued at fair value if the adviser determines that an investment’s value has been materially affected by events occurring after the close of the exchange or market on which the investment is principally traded (such as foreign exchange or market) and prior to the determination of the fund’s net asset value, or after the halting of trading of a specific security where trading does not resume prior to the close of the exchange or market on which the security is
21
MFS Research Bond Series
Notes to Financial Statements – continued
principally traded. The adviser generally relies on third-party pricing services or other information (such as the correlation with price movements of similar securities in the same or other markets; the type, cost and investment characteristics of the security; the business and financial condition of the issuer; and trading and other market data) to assist in determining whether to fair value and at what value to fair value an investment. The value of an investment for purposes of calculating the fund’s net asset value can differ depending on the source and method used to determine value. When fair valuation is used, the value of an investment used to determine the fund’s net asset value may differ from quoted or published prices for the same investment. There can be no assurance that the fund could obtain the fair value assigned to an investment if it were to sell the investment at the same time at which the fund determines its net asset value per share.
Various inputs are used in determining the value of the fund’s assets or liabilities. These inputs are categorized into three broad levels. In certain cases, the inputs used to measure fair value may fall into different levels of the fair value hierarchy. In such cases, an investment’s level within the fair value hierarchy is based on the lowest level of input that is significant to the fair value measurement. The fund’s assessment of the significance of a particular input to the fair value measurement in its entirety requires judgment, and considers factors specific to the investment. Level 1 includes unadjusted quoted prices in active markets for identical assets or liabilities. Level 2 includes other significant observable market-based inputs (including quoted prices for similar securities, interest rates, prepayment speed, and credit risk). Level 3 includes unobservable inputs, which may include the adviser’s own assumptions in determining the fair value of investments. Other financial instruments are derivative instruments not reflected in total investments, such as futures contracts. The following is a summary of the levels used as of December 31, 2014 in valuing the fund’s assets or liabilities:
| | | | | | | | | | | | | | | | |
| Investments at Value | | Level 1 | | | Level 2 | | | Level 3 | | | Total | |
| U.S. Treasury Bonds & U.S. Government Agency & Equivalents | | | $— | | | | $672,346,087 | | | | $— | | | | $672,346,087 | |
| Non-U.S. Sovereign Debt | | | — | | | | 21,202,290 | | | | — | | | | 21,202,290 | |
| Municipal Bonds | | | — | | | | 1,759,450 | | | | — | | | | 1,759,450 | |
| U.S. Corporate Bonds | | | — | | | | 1,034,624,044 | | | | — | | | | 1,034,624,044 | |
| Residential Mortgage-Backed Securities | | | — | | | | 581,026,727 | | | | — | | | | 581,026,727 | |
| Commercial Mortgage-Backed Securities | | | — | | | | 235,663,007 | | | | — | | | | 235,663,007 | |
| Asset-Backed Securities (including CDOs) | | | — | | | | 123,850,901 | | | | — | | | | 123,850,901 | |
| Foreign Bonds | | | — | | | | 275,400,892 | | | | — | | | | 275,400,892 | |
| Mutual Funds | | | 203,174,023 | | | | — | | | | — | | | | 203,174,023 | |
| Total Investments | | | $203,174,023 | | | | $2,945,873,398 | | | | $— | | | | $3,149,047,421 | |
| | | | |
| Other Financial Instruments | | | | | | | | | | | | |
| Futures Contracts | | | $(1,347,579 | ) | | | $— | | | | $— | | | | $(1,347,579 | ) |
For further information regarding security characteristics, see the Portfolio of Investments.
Inflation-Adjusted Debt Securities – The fund invests in inflation-adjusted debt securities issued by the U.S. Treasury. The principal value of these debt securities is adjusted through income according to changes in the Consumer Price Index. These debt securities typically pay a fixed rate of interest, but this fixed rate is applied to the inflation-adjusted principal amount. The principal paid at maturity of the debt security is typically equal to the inflation-adjusted principal amount, or the security’s original par value, whichever is greater. Other types of inflation-adjusted securities may use other methods to adjust for other measures of inflation.
Derivatives – The fund uses derivatives for different purposes, primarily to increase or decrease exposure to a particular market or segment of the market, or security, to increase or decrease interest rate or currency exposure, or as alternatives to direct investments. Derivatives are used for hedging or non-hedging purposes. While hedging can reduce or eliminate losses, it can also reduce or eliminate gains. When the fund uses derivatives as an investment to increase market exposure, or for hedging purposes, gains and losses from derivative instruments may be substantially greater than the derivative’s original cost.
The derivative instruments used by the fund were futures contracts. The fund’s period end derivatives, as presented in the Portfolio of Investments and the associated Derivative Contract tables, generally are indicative of the volume of its derivative activity during the period.
The following table presents, by major type of derivative contract, the fair value, on a gross basis, of the asset and liability components of derivatives held by the fund at December 31, 2014 as reported in the Statement of Assets and Liabilities:
| | | | | | |
| | | | | Fair Value (a) | |
| Risk | | Derivative Contracts | | Liability Derivatives | |
| Interest Rate | | Interest Rate Futures | | | $(1,347,579 | ) |
| (a) | The value of futures contracts includes cumulative appreciation (depreciation) as reported in the fund’s Portfolio of Investments. Only the current day variation margin for futures contracts is separately reported within the fund’s Statement of Assets and Liabilities. |
22
MFS Research Bond Series
Notes to Financial Statements – continued
The following table presents, by major type of derivative contract, the realized gain (loss) on derivatives held by the fund for the year ended December 31, 2014 as reported in the Statement of Operations:
| | | | |
| Risk | | Futures Contracts | |
| Interest Rate | | | $(9,504,494 | ) |
The following table presents, by major type of derivative contract, the change in unrealized appreciation (depreciation) on derivatives held by the fund for the year ended December 31, 2014 as reported in the Statement of Operations:
| | | | |
| Risk | | Futures Contracts | |
| Interest Rate | | | $(5,129,819 | ) |
Derivative counterparty credit risk is managed through formal evaluation of the creditworthiness of all potential counterparties. On certain, but not all, over-the-counter derivatives, the fund attempts to reduce its exposure to counterparty credit risk whenever possible by entering into an ISDA Master Agreement on a bilateral basis with each of the counterparties with whom it undertakes a significant volume of transactions. The ISDA Master Agreement gives each party to the agreement the right to terminate all transactions traded under such agreement if there is a certain deterioration in the credit quality of the other party. Upon an event of default or a termination of the ISDA Master Agreement, the non-defaulting party has the right to close out all transactions traded under such agreement and to net amounts owed under each transaction to one net amount payable by one party to the other. This right to close out and net payments across all transactions traded under the ISDA Master Agreement could result in a reduction of the fund’s credit risk to such counterparty equal to any amounts payable by the fund under the applicable transactions, if any. The fund’s right to setoff may be restricted or prohibited by the bankruptcy or insolvency laws of the particular jurisdiction to which a specific ISDA counterparty is subject.
Collateral and margin requirements differ by type of derivative. Margin requirements are set by the broker or clearing house for cleared derivatives (i.e., futures contracts, cleared swaps, and exchange-traded options) while collateral terms are contract specific for over-the-counter traded derivatives (i.e., forward foreign currency exchange contracts, uncleared swap agreements, and over-the-counter options). For derivatives traded under an ISDA Master Agreement, the collateral requirements are netted across all transactions traded under such agreement and one amount is posted from one party to the other to collateralize such obligations. Cash that has been segregated to cover the fund’s collateral or margin obligations under derivative contracts, if any, will be reported separately in the Statement of Assets and Liabilities as “Restricted cash” or “Deposits with brokers.” Securities pledged as collateral or margin for the same purpose, if any, are noted in the Portfolio of Investments.
Futures Contracts – The fund entered into futures contracts which may be used to hedge against or obtain broad market exposure, interest rate exposure, currency exposure, or to manage duration. A futures contract represents a commitment for the future purchase or sale of an asset at a specified price on a specified date.
Upon entering into a futures contract, the fund is required to deposit with the broker, either in cash or securities, an initial margin in an amount equal to a certain percentage of the notional amount of the contract. Subsequent payments (variation margin) are made or received by the fund each day, depending on the daily fluctuations in the value of the contract, and are recorded for financial statement purposes as unrealized gain or loss by the fund until the contract is closed or expires at which point the gain or loss on futures contracts is realized.
The fund bears the risk of interest rates, exchange rates or securities prices moving unexpectedly, in which case, the fund may not achieve the anticipated benefits of the futures contracts and may realize a loss. While futures contracts may present less counterparty risk to the fund since the contracts are exchange traded and the exchange’s clearinghouse guarantees payments to the broker, there is still counterparty credit risk due to the insolvency of the broker. The fund’s maximum risk of loss due to counterparty credit risk is equal to the margin posted by the fund to the broker plus any gains or minus any losses on the outstanding futures contracts.
Dollar Roll Transactions – The fund enters into dollar roll transactions, with respect to mortgage-backed securities issued by Ginnie Mae, Fannie Mae, and Freddie Mac, in which the fund sells mortgage-backed securities to financial institutions and simultaneously agrees to purchase similar (same issuer, type and coupon) securities at a later date at an agreed-upon price. During the period between the sale and repurchase in a dollar roll transaction the fund will not be entitled to receive interest and principal payments on the securities sold but is compensated by interest earned on the proceeds of the initial sale and by a lower purchase price on the securities to be repurchased which enhances the fund’s total return. The fund accounts for dollar roll transactions as purchases and sales and realizes gains and losses on these transactions.
Indemnifications – Under the fund’s organizational documents, its officers and Trustees may be indemnified against certain liabilities and expenses arising out of the performance of their duties to the fund. Additionally, in the normal course of business, the fund enters into agreements with service providers that may contain indemnification clauses. The fund’s maximum exposure under these agreements is unknown as this would involve future claims that may be made against the fund that have not yet occurred.
23
MFS Research Bond Series
Notes to Financial Statements – continued
Investment Transactions and Income – Investment transactions are recorded on the trade date. Interest income is recorded on the accrual basis. All premium and discount is amortized or accreted for financial statement purposes in accordance with U.S. generally accepted accounting principles. Inflation-indexed bonds are fixed-income securities whose principal value is periodically adjusted upward or downward based on the rate of inflation. Interest is accrued based on the principal value, which is adjusted for inflation. Any increase or decrease in the principal amount of an inflation-indexed bond is generally recorded as an increase or decrease in interest income, respectively, even though the adjusted principal is not received until maturity. Interest payments received in additional securities are recorded on the ex-interest date in an amount equal to the value of the security on such date. Debt obligations may be placed on non-accrual status or set to accrue at a rate of interest less than the contractual coupon when the collection of all or a portion of interest has become doubtful. Interest income for those debt obligations may be further reduced by the write-off of the related interest receivables when deemed uncollectible.
The fund may receive proceeds from litigation settlements. Any proceeds received from litigation involving portfolio holdings are reflected in the Statement of Operations in realized gain/loss if the security has been disposed of by the fund or in unrealized gain/loss if the security is still held by the fund. Any other proceeds from litigation not related to portfolio holdings are reflected as other income in the Statement of Operations.
The fund invests a significant portion of its assets in asset-backed and/or mortgage-backed securities. The value of these securities may depend, in part, on the issuer’s or borrower’s credit quality or ability to pay principal and interest when due and may fall if an issuer or borrower defaults on its obligation to pay principal or interest or if the instrument’s credit rating is downgraded by a credit rating agency. U.S. Government securities not supported as to the payment of principal or interest by the U.S. Treasury, such as those issued by Fannie Mae, Freddie Mac, and the Federal Home Loan Banks, are subject to greater credit risk than are U.S. Government securities supported by the U.S. Treasury, such as those issued by Ginnie Mae.
The fund purchased or sold debt securities on a when-issued or delayed delivery basis, or in a “To Be Announced” (TBA) or “forward commitment” transaction with delivery or payment to occur at a later date beyond the normal settlement period. At the time a fund enters into a commitment to purchase or sell a security, the transaction is recorded and the value of the security acquired is reflected in the fund’s net asset value. The price of such security and the date that the security will be delivered and paid for are fixed at the time the transaction is negotiated. The value of the security may vary with market fluctuations. TBA securities resulting from these transactions are included in the Portfolio of Investments. TBA purchase commitments are held at carrying amount, which approximates fair value and are categorized as level 2 within the fair value hierarchy. No interest accrues to the fund until payment takes place. At the time that a fund enters into this type of transaction, the fund is required to have sufficient cash and/or liquid securities to cover its commitments. Losses may arise due to changes in the value of the underlying securities or if the counterparty does not perform under the contract’s terms, or if the issuer does not issue the securities due to political, economic or other factors. Additionally, losses may arise due to declines in the value of the securities prior to settlement date.
To mitigate this risk of loss on TBA securities and other types of forward settling mortgage-backed securities, the fund whenever possible enters into a Master Securities Forward Transaction Agreement (“MSFTA”) on a bilateral basis with each of the counterparties with whom it undertakes a significant volume of transactions. The MSFTA gives each party to the agreement the right to terminate all transactions traded under such agreement if there is a certain deterioration in the credit quality of the other party. Upon an event of default or a termination of the MSFTA, the non-defaulting party has the right to close out all transactions traded under such agreement and to net amounts owed under each transaction to one net amount payable by one party to the other. This right to close out and net payments across all transactions traded under the MSFTA could result in a reduction of the fund’s credit risk to such counterparty equal to any amounts payable by the fund under the applicable transactions, if any.
For mortgage-backed securities traded under a MSFTA, the collateral and margining requirements are contract specific. Collateral amounts across all transactions traded under such agreement are netted and one amount is posted from one party to the other to collateralize such obligations. Cash that has been pledged to cover the fund’s collateral or margin obligations under a MSFTA, if any, will be reported separately on the Statement of Assets and Liabilities as restricted cash. Securities pledged as collateral or margin for the same purpose, if any, are noted in the Portfolio of Investments.
Fees Paid Indirectly – The fund’s custody fee may be reduced according to an arrangement that measures the value of cash deposited with the custodian by the fund. This amount, for the year ended December 31, 2014, is shown as a reduction of total expenses in the Statement of Operations.
Tax Matters and Distributions – The fund intends to qualify as a regulated investment company, as defined under Subchapter M of the Internal Revenue Code, and to distribute all of its taxable income, including realized capital gains. As a result, no provision for federal income tax is required. The fund’s federal tax returns, when filed, will remain subject to examination by the Internal Revenue Service for a three year period. Management has analyzed the fund’s tax positions taken on federal and state tax returns for all open tax years and does not believe that there are any uncertain tax positions that require recognition of a tax liability. Foreign taxes, if any, have been accrued by the fund in the accompanying financial statements in accordance with the applicable foreign tax law.
24
MFS Research Bond Series
Notes to Financial Statements – continued
Foreign income taxes may be withheld by certain countries in which the fund invests. Additionally, capital gains realized by the fund on securities issued in or by certain foreign countries may be subject to capital gains tax imposed by those countries.
Distributions to shareholders are recorded on the ex-dividend date. Income and capital gain distributions are determined in accordance with income tax regulations, which may differ from U.S. generally accepted accounting principles. Certain capital accounts in the financial statements are periodically adjusted for permanent differences in order to reflect their tax character. These adjustments have no impact on net assets or net asset value per share. Temporary differences which arise from recognizing certain items of income, expense, gain or loss in different periods for financial statement and tax purposes will reverse at some time in the future. Distributions in excess of net investment income or net realized gains are temporary overdistributions for financial statement purposes resulting from differences in the recognition or classification of income or distributions for financial statement and tax purposes.
Book/tax differences primarily relate to amortization and accretion of debt securities, straddle loss deferrals, and derivative transactions.
The tax character of distributions declared to shareholders for the last two fiscal years is as follows:
| | | | | | | | |
| | | 12/31/14 | | | 12/31/13 | |
| Ordinary income (including any short-term capital gains) | | | $82,917,411 | | | | $40,367,445 | |
| Long-term capital gains | | | — | | | | 3,375,776 | |
| Total distributions | | | $82,917,411 | | | | $43,743,221 | |
The federal tax cost and the tax basis components of distributable earnings were as follows:
| | | | |
| As of 12/31/14 | | | | |
| Cost of investments | | | $3,107,173,662 | |
| Gross appreciation | | | 71,218,396 | |
| Gross depreciation | | | (29,344,637 | ) |
| Net unrealized appreciation (depreciation) | | | $41,873,759 | |
| Undistributed ordinary income | | | 91,851,764 | |
| Capital loss carryforwards | | | (7,342,063 | ) |
| Other temporary differences | | | (2,306,883 | ) |
As of December 31, 2014, the fund had capital loss carryforwards available to offset future realized gains. Such losses are characterized as follows:
Under the Regulated Investment Company Modernization Act of 2010 (the “Act”), the above net capital losses may be carried forward indefinitely, and their character is retained as short-term and/or long-term losses. Previously, net capital losses were carried forward for eight years and treated as short-term losses.
Multiple Classes of Shares of Beneficial Interest – The fund offers multiple classes of shares, which differ in their respective distribution and/or service fees. The fund’s income, realized and unrealized gain (loss), and common expenses are allocated to shareholders based on the daily net assets of each class. Dividends are declared separately for each class. Differences in per share dividend rates are generally due to differences in separate class expenses. The fund’s distributions declared to shareholders as reported in the Statements of Changes in Net Assets are presented by class as follows:
| | | | | | | | | | | | | | | | |
| | | From net investment
income | | | From net realized gain on
investments | |
| | | Year ended
12/31/14 | | | Year ended
12/31/13 | | | Year ended
12/31/14 | | | Year ended
12/31/13 | |
| Initial Class | | | $32,650,866 | | | | $12,125,352 | | | | $— | | | | $4,532,532 | |
| Service Class | | | 50,266,545 | | | | 19,301,021 | | | | — | | | | 7,784,316 | |
| Total | | | $82,917,411 | | | | $31,426,373 | | | | $— | | | | $12,316,848 | |
| (3) | | Transactions with Affiliates |
Investment Adviser – The fund has an investment advisory agreement with MFS to provide overall investment management and related administrative services and facilities to the fund. The management fee is computed daily and paid monthly at an annual rate of 0.50% of the fund’s average daily net assets.
The investment adviser had agreed in writing to reduce its management fee to 0.45% of the average daily net assets in excess of $2.5 billion. This written agreement terminated on July 31, 2014. For the period January 1, 2014 through July 31, 2014, this management fee reduction amounted to $160,266 which is included in the reduction of total expenses in the Statement of Operations. Effective August 1, 2014, the investment adviser has agreed in writing to reduce its management fee to 0.45% of
25
MFS Research Bond Series
Notes to Financial Statements – continued
average daily net assets in excess of $2.5 billion to $5 billion and 0.40% of average daily net assets in excess of $5 billion. This written agreement will continue until modified by the fund’s Board of Trustees, but such agreement will continue at least until April 30, 2016. For the period August 1, 2014 through December 31, 2014, this management fee reduction amounted to $104,206, which is included in the reduction of total expenses in the Statement of Operations. MFS has also agreed in writing to reduce its management fee by a specified amount if certain MFS mutual fund assets exceed thresholds agreed to by MFS and the fund’s Board of Trustees. For the year ended December 31, 2014, this management fee reduction amounted to $139,399, which is included in the reduction of total expenses in the Statement of Operations. The management fee incurred for the year ended December 31, 2014 was equivalent to an annual effective rate of 0.49% of the fund’s average daily net assets.
Distributor – MFS Fund Distributors, Inc. (MFD), a wholly-owned subsidiary of MFS, is the distributor of shares of the fund. The Trustees have adopted a distribution plan for the Service Class shares pursuant to Rule 12b-1 under the Investment Company Act of 1940.
The fund’s distribution plan provides that the fund will pay MFD distribution and/or service fees equal to 0.25% per annum of its average daily net assets attributable to Service Class shares as partial consideration for services performed and expenses incurred by MFD and financial intermediaries (including participating insurance companies that invest in the fund to fund variable annuity and variable life insurance contracts, sponsors of qualified retirement and pension plans that invest in the fund, and affiliates of these participating insurance companies and plan sponsors) in connection with the sale and distribution of the Service Class shares. MFD may subsequently pay all, or a portion, of the distribution and/or service fees to financial intermediaries.
Shareholder Servicing Agent – MFS Service Center, Inc. (MFSC), a wholly-owned subsidiary of MFS, receives a fee from the fund for its services as shareholder servicing agent. For the year ended December 31, 2014, the fee was $88,871, which equated to 0.0029% annually of the fund’s average daily net assets. MFSC also receives payment from the fund for out-of-pocket expenses paid by MFSC on behalf of the fund. For the year ended December 31, 2014, these costs amounted to $965.
Administrator – MFS provides certain financial, legal, shareholder communications, compliance, and other administrative services to the fund. Under an administrative services agreement, the fund partially reimburses MFS the costs incurred to provide these services. The fund is charged an annual fixed amount of $17,500 plus a fee based on average daily net assets. The administrative services fee incurred for the year ended December 31, 2014 was equivalent to an annual effective rate of 0.0137% of the fund’s average daily net assets.
Trustees’ and Officers’ Compensation – The fund pays compensation to independent Trustees in the form of a retainer, attendance fees, and additional compensation to Board and Committee chairpersons. The fund does not pay compensation directly to Trustees or officers of the fund who are also officers of the investment adviser, all of whom receive remuneration for their services to the fund from MFS. Certain officers and Trustees of the fund are officers or directors of MFS, MFD, and MFSC.
Other – Effective November 1, 2014, this fund and certain other funds managed by MFS (the funds) have entered into a service agreement (the ISO Agreement) which provides for payment of fees solely by the funds to Tarantino LLC in return for the provision of services of an Independent Senior Officer (ISO) for the funds. Frank L. Tarantino serves as the ISO and is an officer of the funds and the sole member of Tarantino LLC. The funds can terminate the ISO Agreement with Tarantino LLC at any time under the terms of the ISO Agreement. Prior to November 1, 2014, the funds had entered into services agreements (the Compliance Officer Agreements) which provided for payment of fees by the funds to Tarantino LLC and Griffin Compliance LLC in return for the provision of services of an Independent Chief Compliance Officer (ICCO) and Assistant ICCO, respectively, for the funds. Prior to November 1, 2014, Frank L. Tarantino served as the ICCO. Effective October 31, 2014, Mr. Tarantino resigned as ICCO and the Compliance Officer Agreement between the funds and Tarantino LLC was terminated. Prior to June 1, 2014, Robyn L. Griffin served as the Assistant ICCO and was an officer of the funds. Ms. Griffin is the sole member of Griffin Compliance LLC. Effective May 31, 2014, Ms. Griffin resigned as Assistant ICCO and the Compliance Officer Agreement between the funds and Griffin Compliance LLC was terminated. For the year ended December 31, 2014, the aggregate fees paid by the fund under these agreements were $15,105 and are included in “Miscellaneous” expense in the Statement of Operations. MFS had agreed to reimburse the fund for a portion of the payments made by the fund for the services under the Compliance Officer Agreements in the amount of $5,258, which is included in the reduction of total expenses in the Statement of Operations. Additionally, MFS has agreed to bear all expenses associated with office space, other administrative support, and supplies provided to the ICCO, Assistant ICCO, and ISO.
The fund invests in the MFS Institutional Money Market Portfolio which is managed by MFS and seeks current income consistent with preservation of capital and liquidity. Income earned on this investment is included in “Dividends from underlying affiliated funds” in the Statement of Operations. This money market fund does not pay a management fee to MFS.
26
MFS Research Bond Series
Notes to Financial Statements – continued
For the year ended December 31, 2014, purchases and sales of investments, other than short-term obligations, were as follows:
| | | | | | | | |
| | | Purchases | | | Sales | |
| U.S. Government securities | | | $1,093,496,197 | | | | $1,020,546,590 | |
| Investments (non-U.S. Government securities) | | | $613,247,514 | | | | $764,369,966 | |
| (5) | | Shares of Beneficial Interest |
The fund’s Declaration of Trust permits the Trustees to issue an unlimited number of full and fractional shares of beneficial interest. Transactions in fund shares were as follows:
| | | | | | | | | | | | | | | | |
| | | Year ended 12/31/14 | | | Year ended 12/31/13 | |
| | | Shares | | | Amount | | | Shares | | | Amount | |
| Shares sold | | | | | | | | | | | | | | | | |
Initial Class | | | 9,657,615 | | | | $130,060,729 | | | | 36,593,250 | | | | $479,696,004 | |
Service Class | | | 15,025,832 | | | | 199,320,298 | | | | 35,740,176 | | | | 465,305,792 | |
| | | 24,683,447 | | | | $329,381,027 | | | | 72,333,426 | | | | $945,001,796 | |
| Shares issued to shareholders in reinvestment of distributions | | | | | | | | | | | | | | | | |
Initial Class | | | 2,417,395 | | | | $32,441,442 | | | | 1,297,343 | | | | $16,657,884 | |
Service Class | | | 3,805,189 | | | | 50,266,545 | | | | 2,141,133 | | | | 27,085,337 | |
| | | 6,222,584 | | | | $82,707,987 | | | | 3,438,476 | | | | $43,743,221 | |
| Shares reacquired | | | | | | | | | | | | | | | | |
Initial Class | | | (17,230,831 | ) | | | $(232,232,093 | ) | | | (8,909,820 | ) | | | $(118,768,904 | ) |
Service Class | | | (21,597,878 | ) | | | (286,719,375 | ) | | | (19,515,497 | ) | | | (255,109,573 | ) |
| | | (38,828,709 | ) | | | $(518,951,468 | ) | | | (28,425,317 | ) | | | $(373,878,477 | ) |
| Net change | | | | | | | | | | | | | | | | |
Initial Class | | | (5,155,821 | ) | | | $(69,729,922 | ) | | | 28,980,773 | | | | $377,584,984 | |
Service Class | | | (2,766,857 | ) | | | (37,132,532 | ) | | | 18,365,812 | | | | 237,281,556 | |
| | | (7,922,678 | ) | | | $(106,862,454 | ) | | | 47,346,585 | | | | $614,866,540 | |
The fund is one of several mutual funds in which certain MFS funds may invest. The MFS funds do not invest in the underlying funds for the purpose of exercising management or control. At the end of the period, the MFS Moderate Allocation Portfolio, the MFS Conservative Allocation Portfolio, and the MFS Growth Allocation Portfolio were the owners of record of approximately 9%, 5%, and 1%, respectively, of the value of outstanding voting shares of the fund.
The fund and certain other funds managed by MFS participate in a $1.1 billion unsecured committed line of credit, subject to a $1 billion sublimit, provided by a syndication of banks under a credit agreement. Borrowings may be made for temporary financing needs. Interest is charged to each fund, based on its borrowings, generally at a rate equal to the higher of the Federal Reserve funds rate or one month LIBOR plus an agreed upon spread. A commitment fee, based on the average daily, unused portion of the committed line of credit, is allocated among the participating funds at the end of each calendar quarter. In addition, the fund and other funds managed by MFS have established unsecured uncommitted borrowing arrangements with certain banks for temporary financing needs. Interest is charged to each fund, based on its borrowings, at a rate equal to the Federal Reserve funds rate plus an agreed upon spread. For the year ended December 31, 2014, the fund’s commitment fee and interest expense were $11,306 and $0, respectively, and are included in “Miscellaneous” expense in the Statement of Operations.
| (7) | | Transactions in Underlying Affiliated Funds – Affiliated Issuers |
An affiliated issuer may be considered one in which the fund owns 5% or more of the outstanding voting securities, or a company which is under common control. For the purposes of this report, the fund assumes the following to be an affiliated issuer:
| | | | | | | | | | | | | | | | |
| Underlying Affiliated Fund | | Beginning
Shares/Par
Amount | | | Acquisitions
Shares/Par
Amount | | | Dispositions
Shares/Par
Amount | | | Ending Shares/Par Amount | |
| MFS Institutional Money Market Portfolio | | | 142,373,017 | | | | 936,102,914 | | | | (875,301,908 | ) | | | 203,174,023 | |
| | | | |
| Underlying Affiliated Fund | | Realized
Gain (Loss) | | | Capital Gain
Distributions | | | Dividend
Income | | | Ending Value | |
| MFS Institutional Money Market Portfolio | | | $— | | | | $— | | | | $115,326 | | | | $203,174,023 | |
27
MFS Research Bond Series
REPORT OF INDEPENDENT REGISTERED PUBLIC ACCOUNTING FIRM
To the Board of Trustees of MFS Variable Insurance Trust and the Shareholders of
MFS Research Bond Series:
We have audited the accompanying statement of assets and liabilities, including the portfolio of investments, of MFS Research Bond Series (one of the series of MFS Variable Insurance Trust) (the “Fund”) as of December 31, 2014, and the related statement of operations for the year then ended, the statements of changes in net assets for each of the two years in the period then ended, and the financial highlights for each of the five years in the period then ended. These financial statements and financial highlights are the responsibility of the Fund’s management. Our responsibility is to express an opinion on these financial statements and financial highlights based on our audits.
We conducted our audits in accordance with the standards of the Public Company Accounting Oversight Board (United States). Those standards require that we plan and perform the audit to obtain reasonable assurance about whether the financial statements and financial highlights are free of material misstatement. The Fund is not required to have, nor were we engaged to perform, an audit of its internal control over financial reporting. Our audits included consideration of internal control over financial reporting as a basis for designing audit procedures that are appropriate in the circumstances, but not for the purpose of expressing an opinion on the effectiveness of the Fund’s internal control over financial reporting. Accordingly, we express no such opinion. An audit also includes examining, on a test basis, evidence supporting the amounts and disclosures in the financial statements, assessing the accounting principles used and significant estimates made by management, as well as evaluating the overall financial statement presentation. Our procedures included confirmation of securities owned as of December 31, 2014, by correspondence with the custodian and brokers; where replies were not received from brokers, we performed other auditing procedures. We believe that our audits provide a reasonable basis for our opinion.
In our opinion, the financial statements and financial highlights referred to above present fairly, in all material respects, the financial position of MFS Research Bond Series as of December 31, 2014, the results of its operations for the year then ended, the changes in its net assets for each of the two years in the period then ended, and the financial highlights for each of the five years in the period then ended, in conformity with accounting principles generally accepted in the United States of America.
DELOITTE & TOUCHE LLP
Boston, Massachusetts
February 13, 2015
28
MFS Research Bond Series
TRUSTEES AND OFFICERS – IDENTIFICATION AND BACKGROUND
The Trustees and Officers of the Trust, as of February 1, 2015, are listed below, together with their principal occupations during the past five years. (Their titles may have varied during that period.) The address of each Trustee and Officer is 111 Huntington Avenue, Boston, Massachusetts 02199-7618.
| | | | | | | | |
Name, Age | | Position(s)
Held with Fund | | Trustee/Officer
Since (h) | | Principal Occupations
During the Past Five Years | | Other Directorships (j) |
| INTERESTED TRUSTEES |
Robert J. Manning (k) (age 51) | | Trustee | | February 2004 | | Massachusetts Financial Services Company, Chairman, Co-Chief Executive Officer and Director; President (until 2009); Chief Investment Officer (until 2010) | | N/A |
| | | | |
Robin A. Stelmach (k) (age 53) | | Trustee and President | | January 2014 | | Massachusetts Financial Services Company, Executive Vice President and Chief Operating Officer | | N/A |
| | | |
| INDEPENDENT TRUSTEES | | | | | | |
David H. Gunning (age 72) | | Trustee and Chair of Trustees | | January 2004 | | Private investor | | Lincoln Electric Holdings, Inc. (welding equipment manufacturer), Director; Development Alternatives, Inc. (consulting), Director/Non-Executive Chairman |
| | | | |
Steven E. Buller (age 63) | | Trustee | | February 2014 | | Chairman, Financial Accounting Standards Advisory Council; Standing Advisory Group, Public Company Accounting Oversight Board, Member (until 2014); BlackRock, Inc. (investment management), Managing Director (until 2014), BlackRock Finco UK (investment management), Director (until 2014) | | N/A |
| | | | |
Robert E. Butler (age 73) | | Trustee | | January 2006 | | Consultant – investment company industry regulatory and compliance matters | | N/A |
| | | | |
Maureen R. Goldfarb (age 59) | | Trustee | | January 2009 | | Private investor | | N/A |
| | | | |
William R. Gutow (age 73) | | Trustee | | December 1993 | | Private investor and real estate consultant; Capitol Entertainment Management Company (video franchise), Vice Chairman | | Texas Donuts (donut franchise), Vice Chairman (until 2010) |
| | | | |
Michael Hegarty (age 70) | | Trustee | | December 2004 | | Private investor | | Brookfield Office Properties, Inc. (real estate), Director; Rouse Properties Inc. (real estate), Director; Capmark Financial Group Inc. (real estate), Director |
| | | | |
John P. Kavanaugh (age 60) | | Trustee | | January 2009 | | Private investor | | N/A |
| | | | |
Maryanne L. Roepke (age 58) | | Trustee | | May 2014 | | American Century Investments (investment management), Senior Vice President and Chief Compliance Officer (until 2014) | | N/A |
| | | | |
Laurie J. Thomsen (age 57) | | Trustee | | March 2005 | | Private investor; New Profit, Inc. (venture philanthropy), Executive Partner (until 2010) | | The Travelers Companies (insurance), Director |
| | | | |
Robert W. Uek (age 73) | | Trustee | | January 2006 | | Consultant to investment company industry | | N/A |
| | | | |
| OFFICERS | | | | | | | | |
Christopher R. Bohane (k) (age 41) | | Assistant Secretary and Assistant Clerk | | July 2005 | | Massachusetts Financial Services Company, Vice President and Assistant General Counsel | | N/A |
| | | | |
Kino Clark (k) (age 46) | | Assistant Treasurer | | January 2012 | | Massachusetts Financial Services Company, Vice President | | N/A |
| | | | |
Thomas H. Connors (k) (age 55) | | Assistant Secretary and Assistant Clerk | | September 2012 | | Massachusetts Financial Services Company, Vice President and Senior Counsel; Deutsche Investment Management Americas Inc. (financial service provider), Director and Senior Counsel (until 2012) | | N/A |
29
MFS Research Bond Series
Trustees and Officers – continued
| | | | | | | | |
Name, Age | | Position(s)
Held with Fund | | Trustee/Officer
Since (h) | | Principal Occupations
During the Past Five Years | | Other Directorships (j) |
Ethan D. Corey (k) (age 51) | | Assistant
Secretary and Assistant Clerk | | July 2005 | | Massachusetts Financial Services Company, Senior Vice President and Associate General Counsel | | N/A |
| | | | |
David L. DiLorenzo (k) (age 46) | | Treasurer | | July 2005 | | Massachusetts Financial Services Company, Senior Vice President | | N/A |
| | | | |
Timothy M. Fagan (k) (age 46) | | Chief Compliance Officer | | November 2014 | | Massachusetts Financial Services Company, Chief Compliance Officer; Vice President and Senior Counsel (until 2012) | | N/A |
| | | | |
Brian E. Langenfeld (k) (age 41) | | Assistant
Secretary and Assistant Clerk | | June 2006 | | Massachusetts Financial Services Company, Vice President and Senior Counsel | | N/A |
| | | | |
Susan S. Newton (k) (age 64) | | Assistant
Secretary and Assistant Clerk | | May 2005 | | Massachusetts Financial Services Company, Senior Vice President and Associate General Counsel | | N/A |
| | | | |
Susan A. Pereira (k) (age 44) | | Assistant
Secretary and Assistant Clerk | | July 2005 | | Massachusetts Financial Services Company, Vice President and Senior Counsel | | N/A |
| | | | |
Kasey L. Phillips (k) (age 44) | | Assistant Treasurer | | September 2012 | | Massachusetts Financial Services Company, Vice President; Wells Fargo Funds Management, LLC, Senior Vice President, Fund Treasurer (until 2012) | | N/A |
| | | | |
Mark N. Polebaum (k) (age 62) | | Secretary and
Clerk | | January 2006 | | Massachusetts Financial Services Company, Executive Vice President, General Counsel and Secretary | | N/A |
| | | | |
Matthew A. Stowe (k) (age 40) | | Assistant Secretary and Assistant Clerk | | October 2014 | | Massachusetts Financial Services Company, Vice President and Senior Counsel | | N/A |
| | | | |
Frank L. Tarantino (age 70) | | Independent
Senior Officer | | June 2004 | | Tarantino LLC (provider of compliance services), Principal | | N/A |
| | | | |
Richard S. Weitzel (k) (age 44) | | Assistant Secretary and Assistant Clerk | | October 2007 | | Massachusetts Financial Services Company, Senior Vice President and Associate General Counsel | | N/A |
| | | | |
James O. Yost (k) (age 54) | | Deputy Treasurer | | September 1990 | | Massachusetts Financial Services Company, Senior Vice President | | N/A |
| (h) | Date first appointed to serve as Trustee/officer of an MFS Fund. Each Trustee has served continuously since appointment unless indicated otherwise. For the period from December 15, 2004 until February 22, 2005, Mr. Manning served as Advisory Trustee. Prior to January 2012, Messrs. DiLorenzo and Yost served as Assistant Treasurers of the Funds. Ms. Stelmach was appointed as President of the Funds as of October 1, 2014. |
| (j) | Directorships or trusteeships of companies required to report to the Securities and Exchange Commission (i.e., “public companies”). |
| (k) | “Interested person” of the Trust within the meaning of the Investment Company Act of 1940 (referred to as the 1940 Act), which is the principal federal law governing investment companies like the fund, as a result of a position with MFS. The address of MFS is 111 Huntington Avenue, Boston, Massachusetts 02199-7618. |
Each Trustee (except Ms. Stelmach, Mr. Buller and Ms. Roepke) has been elected by shareholders and each Trustee and officer holds office until his or her successor is chosen and qualified or until his or her earlier death, resignation, retirement or removal. The Trust does not hold annual meetings for the purpose of electing Trustees, and Trustees are not elected for fixed terms. Messrs. Butler, Kavanaugh, Uek and Mses. Thomsen and Roepke are members of the Trust’s Audit Committee.
Each of the Fund’s Trustees and officers holds comparable positions with certain other funds of which MFS or a subsidiary is the investment adviser or distributor, and, in the case of the officers, with certain affiliates of MFS. As of February 1, 2015, the Trustees served as board members of 135 funds within the MFS Family of Funds.
30
MFS Research Bond Series
Trustees and Officers – continued
The Statement of Additional Information for the Fund includes further information about the Trustees and is available without charge upon request by calling 1-800-225-2606.
| | |
Investment Adviser Massachusetts Financial Services Company 111 Huntington Avenue Boston, MA 02199-7618 | | Custodian State Street Bank and Trust Company 1 Lincoln Street Boston, MA 02111-2900 |
Distributor MFS Fund Distributors, Inc. 111 Huntington Avenue Boston, MA 02199-7618 | | Independent Registered Public Accounting Firm Deloitte & Touche LLP 200 Berkeley Street Boston, MA 02116 |
Portfolio Managers Joshua Marston Robert Persons Jeffrey Wakelin | | |
31
MFS Research Bond Series
BOARD REVIEW OF INVESTMENT ADVISORY AGREEMENT
The Investment Company Act of 1940 requires that both the full Board of Trustees and a majority of the non-interested (“independent”) Trustees, voting separately, annually approve the continuation of the Fund’s investment advisory agreement with MFS. The Trustees consider matters bearing on the Fund and its advisory arrangements at their meetings throughout the year, including a review of performance data at each regular meeting. In addition, the independent Trustees met several times over the course of three months beginning in May and ending in July, 2014 (“contract review meetings”) for the specific purpose of considering whether to approve the continuation of the investment advisory agreement for the Fund and the other investment companies that the Board oversees (the “MFS Funds”). The independent Trustees were assisted in their evaluation of the Fund’s investment advisory agreement by independent legal counsel, from whom they received separate legal advice and with whom they met separately from MFS during various contract review meetings. The independent Trustees were also assisted in this process by the MFS Funds’ Independent Chief Compliance Officer, a full-time senior officer appointed by and reporting to the independent Trustees.
In connection with their deliberations regarding the continuation of the investment advisory agreement, the Trustees, including the independent Trustees, considered such information and factors as they believed, in light of the legal advice furnished to them and their own business judgment, to be relevant. The investment advisory agreement for the Fund was considered separately, although the Trustees also took into account the common interests of all MFS Funds in their review. As described below, the Trustees considered the nature, quality, and extent of the various investment advisory, administrative, and shareholder services performed by MFS under the existing investment advisory agreement and other arrangements with the Fund.
In connection with their contract review meetings, the Trustees received and relied upon materials that included, among other items: (i) information provided by Lipper Inc., an independent third party, on the investment performance of the Fund for various time periods ended December 31, 2013 and the investment performance of a group of funds with substantially similar investment classifications/objectives (the “Lipper performance universe”), (ii) information provided by Lipper Inc. on the Fund’s advisory fees and other expenses and the advisory fees and other expenses of comparable funds identified by Lipper Inc. (the “Lipper expense group”), (iii) information provided by MFS on the advisory fees of comparable portfolios of other clients of MFS, including institutional separate accounts and other clients, (iv) information as to whether and to what extent applicable expense waivers, reimbursements or fee “breakpoints” are observed for the Fund, (v) information regarding MFS’ financial results and financial condition, including MFS’ and certain of its affiliates’ estimated profitability from services performed for the Fund and the MFS Funds as a whole, and compared to MFS’ institutional business, (vi) MFS’ views regarding the outlook for the mutual fund industry and the strategic business plans of MFS, (vii) descriptions of various functions performed by MFS for the Funds, such as compliance monitoring and portfolio trading practices, and (viii) information regarding the overall organization of MFS, including information about MFS’ senior management and other personnel providing investment advisory, administrative and other services to the Fund and the other MFS Funds. The comparative performance, fee and expense information prepared and provided by Lipper Inc. was not independently verified and the independent Trustees did not independently verify any information provided to them by MFS.
The Trustees’ conclusion as to the continuation of the investment advisory agreement was based on a comprehensive consideration of all information provided to the Trustees and not the result of any single factor. Some of the factors that figured particularly in the Trustees’ deliberations are described below, although individual Trustees may have evaluated the information presented differently from one another, giving different weights to various factors. It is also important to recognize that the fee arrangements for the Fund and other MFS Funds are the result of years of review and discussion between the independent Trustees and MFS, that certain aspects of such arrangements may receive greater scrutiny in some years than in others, and that the Trustees’ conclusions may be based, in part, on their consideration of these same arrangements during the course of the year and in prior years.
Based on information provided by Lipper Inc. and MFS, the Trustees reviewed the Fund’s total return investment performance as well as the performance of peer groups of funds over various time periods. The Trustees placed particular emphasis on the total return performance of the Fund’s Initial Class shares in comparison to the performance of funds in its Lipper performance universe over the three-year period ended December 31, 2013, which the Trustees believed was a long enough period to reflect differing market conditions. The total return performance of the Fund’s Initial Class shares was in the 1st quintile relative to the other funds in the universe for this three-year period (the 1st quintile being the best performers and the 5th quintile being the worst performers). The total return performance of the Fund’s Initial Class shares was in the 1st quintile for each of the one- and five-year periods ended December 31, 2013 relative to the Lipper performance universe. Because of the passage of time, these performance results may differ from the performance results for more recent periods, including those shown elsewhere in this report.
In the course of their deliberations, the Trustees took into account information provided by MFS in connection with the contract review meetings, as well as during investment review meetings conducted with portfolio management personnel during the course of the year regarding the Fund’s performance. After reviewing these and related factors, the Trustees concluded, within the context of their overall conclusions regarding the investment advisory agreement, that they were satisfied with MFS’ responses and efforts relating to investment performance.
32
MFS Research Bond Series
Board Review of Investment Advisory Agreement – continued
In assessing the reasonableness of the Fund’s advisory fee, the Trustees considered, among other information, the Fund’s advisory fee and the total expense ratio of the Fund’s Initial Class shares as a percentage of average daily net assets and the advisory fee and total expense ratios of peer groups of funds based on information provided by Lipper Inc. The Trustees considered that, according to the Lipper data (which takes into account any fee reductions or expense limitations that were in effect during the Fund’s last fiscal year), the Fund’s effective advisory fee rate was approximately at the Lipper expense group median and the Fund’s total expense ratio was lower than the Lipper expense group median.
The Trustees also considered the advisory fees charged by MFS to any comparable institutional accounts. In comparing these fees, the Trustees considered information provided by MFS as to the generally broader scope of services provided by MFS to the Fund in comparison to institutional accounts, the higher demands placed on MFS’ investment personnel and trading infrastructure as a result of the daily cash in-flows and out-flows of the Fund, and the impact on MFS and expenses associated with the more extensive regulatory regime to which the Fund is subject in comparison to institutional accounts.
The Trustees also considered whether the Fund may benefit from any economies of scale in the management of the Fund in the event of growth in assets of the Fund and/or growth in assets of the MFS Funds as a whole. They noted that MFS has agreed in writing to reduce its advisory fee rate on the Fund’s average daily net assets over $2.5 billion, and that MFS has agreed in writing to implement an additional breakpoint that reduces its advisory fee rate on the Fund’s average daily net assets over $5 billion, each of which may not be changed without the Trustees’ approval. The Trustees also noted that MFS has agreed in writing to waive a portion of the management fees of certain MFS Funds, including the Fund, if the total combined assets of certain funds within the MFS Funds’ complex increase above agreed upon thresholds (the “group fee waiver”), enabling the Fund’s shareholders to share in the benefits from any economies of scale at the complex level. The group fee waiver is reviewed and renewed annually between the Board and MFS. The Trustees concluded that the breakpoints and the group fee waiver were sufficient to allow the Fund to benefit from economies of scale as its assets and overall complex assets grow.
The Trustees also considered information prepared by MFS relating to MFS’ costs and profits with respect to the Fund, the MFS Funds considered as a group, and other investment companies and accounts advised by MFS, as well as MFS’ methodologies used to determine and allocate its costs to the MFS Funds, the Fund and other accounts and products for purposes of estimating profitability.
After reviewing these and other factors described herein, the Trustees concluded, within the context of their overall conclusions regarding the investment advisory agreement, that the advisory fees charged to the Fund represent reasonable compensation in light of the services being provided by MFS to the Fund.
In addition, the Trustees considered MFS’ resources and related efforts to continue to retain, attract and motivate capable personnel to serve the Fund. The Trustees also considered current and developing conditions in the financial services industry, including the presence of large and well-capitalized companies which are spending, and appear to be prepared to continue to spend, substantial sums to engage personnel and to provide services to competing investment companies. In this regard, the Trustees also considered the financial resources of MFS and its ultimate parent, Sun Life Financial Inc. The Trustees also considered the advantages and possible disadvantages to the Fund of having an adviser that also serves other investment companies as well as other accounts.
The Trustees also considered the nature, quality, cost, and extent of administrative, transfer agency, and distribution services provided to the Fund by MFS and its affiliates under agreements and plans other than the investment advisory agreement, including any 12b-1 fees the Fund pays to MFS Fund Distributors, Inc., an affiliate of MFS. The Trustees also considered the nature, extent and quality of certain other services MFS performs or arranges for on the Fund’s behalf, which may include securities lending programs, directed expense payment programs, class action recovery programs, and MFS’ interaction with third-party service providers, principally custodians and sub-custodians. The Trustees concluded that the various non-advisory services provided by MFS and its affiliates on behalf of the Fund were satisfactory.
The Trustees also considered benefits to MFS from the use of the Fund’s portfolio brokerage commissions, if applicable, to pay for investment research and various other factors. Additionally, the Trustees considered so-called “fall-out benefits” to MFS such as reputational value derived from serving as investment manager to the Fund.
Based on their evaluation of factors that they deemed to be material, including those factors described above, the Board of Trustees, including the independent Trustees, concluded that the Fund’s investment advisory agreement with MFS should be continued for an additional one-year period, commencing August 1, 2014.
33
MFS Research Bond Series
PROXY VOTING POLICIES AND INFORMATION
MFS votes proxies on behalf of the fund pursuant to proxy voting policies and procedures that are available without charge, upon request, by calling 1-800-225-2606, by visiting the Proxy Voting section of mfs.com or by visiting the SEC’s Web site at http://www.sec.gov.
Information regarding how the fund voted proxies relating to portfolio securities during the most recent twelve-month period ended June 30 is available without charge by visiting the Proxy Voting section of mfs.com or by visiting the SEC’s Web site at http://www.sec.gov.
QUARTERLY PORTFOLIO DISCLOSURE
The fund will file a complete schedule of portfolio holdings with the Securities and Exchange Commission (the Commission) for the first and third quarters of each fiscal year on Form N-Q. The fund’s Form N-Q is available on the EDGAR database on the Commission’s Internet Web site at http://www.sec.gov, and may be reviewed and copied at the:
Public Reference Room
Securities and Exchange Commission
100 F Street, NE, Room 1580
Washington, D.C. 20549
Information on the operation of the Public Reference Room may be obtained by calling the Commission at 1-800-SEC-0330. Copies of the fund’s Form N-Q also may be obtained, upon payment of a duplicating fee, by electronic request at the following e-mail address: publicinfo@sec.gov or by writing the Public Reference Section at the above address.
FURTHER INFORMATION
From time to time, MFS may post important information about the fund or the MFS funds on the MFS web site (mfs.com). This information is available by visiting the “Market Commentary” and “Announcements” sub sections in the “Market Outlooks” section of mfs.com or by clicking on the fund’s name under “Variable Insurance Portfolios — VIT” in the “Products” section of mfs.com.
34
rev. 3/11
| | | | |
| FACTS | | WHAT DOES MFS DO WITH YOUR
PERSONAL INFORMATION? | |  |
| | |
| Why? | | Financial companies choose how they share your personal information. Federal law gives consumers the right to limit some but not all sharing. Federal law also requires us to tell you how we collect, share, and protect your personal information. Please read this notice carefully to understand what we do. |
| | |
| What? | | The types of personal information we collect and share depend on the product or service you have with us. This information can include: • Social Security number and account balances • Account transactions and transaction history • Checking account information and wire transfer instructions When you are no longer our customer, we continue to share your information as described in this notice. |
| | |
| How? | | All financial companies need to share customers’ personal information to run their everyday business. In the section below, we list the reasons financial companies can share their customers’ personal information; the reasons MFS chooses to share; and whether you can limit this sharing. |
| | | | |
Reasons we can share your
personal information | | Does MFS share? | | Can you limit this
sharing? |
For our everyday business purposes – such as to process your transactions, maintain your account(s), respond to court orders and legal investigations, or report to credit bureaus | | Yes | | No |
For our marketing purposes – to offer our products and services to you | | No | | We don’t share |
| For joint marketing with other financial companies | | No | | We don’t share |
For our affiliates’ everyday business purposes – information about your transactions and experiences | | No | | We don’t share |
For our affiliates’ everyday business purposes – information about your creditworthiness | | No | | We don’t share |
| For nonaffiliates to market to you | | No | | We don’t share |
| | |
| Questions? | | Call 800-225-2606 or go to mfs.com. |
35
| | |
| Who we are |
| Who is providing this notice? | | MFS Funds, MFS Investment Management, MFS Institutional Advisors, Inc., MFS Fund Distributors, Inc., MFS Heritage Trust Company, and MFS Service Center, Inc. |
| | |
| What we do |
| How does MFS protect my personal information? | | To protect your personal information from unauthorized access and use, we use security measures that comply with federal law. These measures include procedural, electronic, and physical safeguards for the protection of the personal information we collect about you. |
How does MFS
collect my personal information? | | We collect your personal information, for example, when you • open an account or provide account information • direct us to buy securities or direct us to sell your securities • make a wire transfer We also collect your personal information from others, such as credit bureaus, affiliates and other companies. |
| Why can’t I limit all sharing? | | Federal law gives you the right to limit only • sharing for affiliates’ everyday business purposes – information about your creditworthiness • affiliates from using your information to market to you • sharing for nonaffiliates to market to you State laws and individual companies may give you additional rights to limit sharing. |
| | |
| Definitions |
| Affiliates | | Companies related by common ownership or control. They can be financial and nonfinancial companies. • MFS does not share personal information with affiliates, except for everyday business purposes as described on page one of this notice. |
| Nonaffiliates | | Companies not related by common ownership or control. They can be financial and nonfinancial companies. • MFS does not share with nonaffiliates so they can market to you. |
| Joint Marketing | | A formal agreement between nonaffiliated financial companies that together market financial products or services to you. • MFS doesn’t jointly market. |
| | |
| Other important information |
| If you own an MFS product or receive an MFS service in the name of a third party such as a bank or broker-dealer, their privacy policy may apply to you instead of ours. |
36
ANNUAL REPORT
December 31, 2014

MFS® RESEARCH INTERNATIONAL SERIES
MFS® Variable Insurance Trust

VRI-ANN
MFS® RESEARCH INTERNATIONAL SERIES
CONTENTS
The report is prepared for the general information of contract owners. It is authorized for distribution to prospective investors only when preceded or accompanied by a current prospectus.
NOT FDIC INSURED Ÿ MAY LOSE VALUE Ÿ NO BANK OR CREDIT UNION GUARANTEE Ÿ NOT A DEPOSIT Ÿ NOT INSURED BY ANY FEDERAL GOVERNMENT AGENCY OR NCUA/NCUSIF
MFS Research International Series
LETTER FROM THE CHAIRMAN

Dear Contract Owners:
As 2015 begins, sharply lower oil prices are reshaping the global economy, adding to deflationary pressures in the eurozone and exacerbating challenges faced by oil exporters such as Russia. The U.S. economy stands on firmer ground, having expanded steadily over the past year. The U.S. labor market has regained momentum, consumer confidence is buoyant and gasoline prices have tumbled, boosting prospects for a stronger economic rebound in 2015.
Other regions are struggling. The eurozone economy is barely expanding, and the European Central Bank (ECB) has introduced large-scale asset purchases.
Despite Japan’s efforts to strengthen its economy, its sales tax increase last spring tipped the country into a recession, leading to additional monetary stimulus from the Bank of Japan. China’s economy is slowing as it transitions to a more sustainable basis, and its growth rate will likely continue to decline.
As always, active risk management is integral to how we at MFS® manage your investments. We use a collaborative process, sharing insights across asset classes, regions and economic sectors. Our global investment team uses a diversified, multidisciplined, long-term approach.
Applying proven principles, such as asset allocation and diversification, can best serve investors over the long term. We are confident that this approach can help you as you work with your financial advisors to reach your goals in the years ahead.
Respectfully,

Robert J. Manning
Chairman
MFS Investment Management
February 13, 2015
The opinions expressed in this letter are subject to change and may not be relied upon for investment advice. No forecasts can be guaranteed.
1
MFS Research International Series
PORTFOLIO COMPOSITION
Portfolio structure

| | | | |
| Top ten holdings | | | | |
| Roche Holding AG | | | 3.3% | |
| Novartis AG | | | 3.1% | |
| Royal Dutch Shell PLC, “A” | | | 3.0% | |
| Nestle S.A. | | | 2.7% | |
| HSBC Holdings PLC | | | 2.3% | |
| Bayer AG | | | 2.2% | |
| Rio Tinto Ltd. | | | 2.0% | |
| DENSO Corp. | | | 2.0% | |
| KDDI Corp. | | | 1.9% | |
| Schneider Electric S.A. | | | 1.8% | |
| |
| Global equity sectors | | | | |
| Financial Services | | | 25.3% | |
| Capital Goods | | | 22.3% | |
| Health Care | | | 11.0% | |
| Energy | | | 9.5% | |
| Consumer Staples | | | 9.2% | |
| Consumer Cyclicals | | | 8.2% | |
| Technology | | | 7.8% | |
| Telecommunications/Cable Television | | | 5.2% | |
| | | | |
| Issuer country weightings (x) | | | | |
| United Kingdom | | | 18.3% | |
| Japan | | | 17.9% | |
| Switzerland | | | 14.4% | |
| France | | | 10.4% | |
| Germany | | | 8.0% | |
| United States | | | 5.0% | |
| Netherlands | | | 4.3% | |
| Hong Kong | | | 4.0% | |
| Australia | | | 3.5% | |
| Other Countries | | | 14.2% | |
| |
| Currency exposure weightings (y) | | | | |
| Euro | | | 26.0% | |
| British Pound Sterling | | | 18.3% | |
| Japanese Yen | | | 17.9% | |
| Swiss Franc | | | 14.4% | |
| United States Dollar | | | 5.0% | |
| Hong Kong Dollar | | | 4.5% | |
| Australian Dollar | | | 3.5% | |
| Swedish Krona | | | 2.9% | |
| Taiwan Dollar | | | 2.5% | |
| Other Currencies | | | 5.0% | |
| (x) | Represents the portfolio’s exposure to issuer countries as a percentage of a portfolio’s net assets. For purposes of this presentation, United States includes Cash & Other. |
| (y) | Represents the portfolio’s exposure to a particular currency as a percentage of a portfolio’s net assets. For purposes of this presentation, United States Dollar includes Cash & Other. |
Cash & Other can include cash, other assets less liabilities, offsets to derivative positions, and short-term securities.
Percentages are based on net assets as of 12/31/14.
The portfolio is actively managed and current holdings may be different.
2
MFS Research International Series
MANAGEMENT REVIEW
Summary of Results
For the twelve months ended December 31, 2014, Initial Class shares of the MFS Research International Series (“fund”) provided a total return of –6.87%, while Service Class shares of the fund provided a total return of –7.09%. These compare with a return of –4.48% over the same period for the fund’s benchmark, the MSCI EAFE Index.
Market Environment
Early in the period, US equities suffered what proved to be a temporary setback due to concerns over emerging markets as well as what was perceived at the time to be a pause in US economic growth, partially caused by extreme weather events and a weak December 2013 labor market report. Markets soon recovered as the economic pause concluded and investors appeared to have become increasingly comfortable that newly-installed US Federal Reserve (“Fed”) Chair Janet Yellen would not make any substantial changes to the trajectory of Fed monetary policy.
A generally risk-friendly, carry trade environment persisted from February 2014 until mid-year. While geopolitical tensions flared in the Middle East and Russia/Ukraine, any market setbacks were short-lived as improving economic growth in the US, coupled with prospects for easier monetary policy in regions with slowing growth, such as Japan, Europe and China, supported risk assets. For example, the European Central Bank (“ECB”) cut policy interest rates into negative territory and, by the end of the period, expectations were for additional rate cuts and the announcement for non-conventional easing measures. Similarly, the Bank of Japan surprised markets late in the period with fresh stimulus measures given lackluster growth trends. The related decline in developed market government bond yields and credit spreads were also supportive for equity markets. At the end of the period, the US equity market was trading close to all-time highs and US Treasury yields were close to their lows for the period. However, credit markets did not fare as well in the second half of 2014, particularly US high yield and emerging market debt. The higher weightings of oil and gas credits in these asset classes resulted in widening spreads and increased volatility as oil prices began to decline in an accelerated fashion in the fourth quarter.
Detractors from Performance
Weak stock selection in the capital goods sector detracted from performance relative to the MSCI EAFE Index. Overweight positions in global engineering company JGC Corp. (Japan), automotive manufacturer Honda Motor (Japan) and mining company Iluka Resources (Australia) held back relative results as all three stocks lagged the benchmark during the reporting period. Shares of JGC Corp. came under pressure on what appeared to have been concerns about possible cancellations of LNG plant construction projects, a major source of revenue for the company. Additionally, reductions in capital expenditures in the face of sharply declining oil prices negatively impacted the stock. The fund’s holdings of steel producer Gerdau (b) (Brazil) also dampened relative returns.
Weak stock selection within the consumer staples sector held back relative performance. However, there were no individual securities within this sector that were among the fund’s top relative detractors for the reporting period.
Elsewhere, the fund’s overweight positions in banking and financial services firm Sumitomo Mitsui Financial Group (Japan), financial services company Erste Group Bank (Austria), pharmaceutical and diagnostic company Roche Holding (Switzerland), casino and resort operator Sands China (Hong Kong) and real estate business Mitsubishi Estate Company (h) (Japan) detracted from relative returns. Shares of Roche Holding declined following two disappointing trial results for breast cancer drug Kadcyla and Alzheimer’s drug Gantenerumab. The fund’s holdings of commercial banking firm Sberbank of Russia (b) (Russia) also held back relative performance.
Contributors to Performance
Strong stock selection in the technology sector was a positive factor for relative performance. The fund’s position in semiconductor manufacturer Taiwan Semiconductor Manufacturing (b) (Taiwan) strengthened relative performance as the company’s shares rose on strong orders of Apple’s 20nm application processor and health inventory levels.
Positive stock selection in the telecommunications/cable television sector also aided relative performance. Most notably within this sector, an overweight position in telecommunications company KDDI Corp. (Japan) had a positive impact on relative results, as the company posted strong results that were in part attributable to strong fundamentals and continued robust profit growth. Additionally, it appeared that investors felt that competitive and regulatory concerns had been subsiding.
Elsewhere, the fund’s overweight positions in pharmaceutical companies Novartis (Switzerland) and Santen Pharmaceutical (Japan), hotel and restaurant operator Whitbread (United Kingdom) and financial services firm DBS Group Holdings (Singapore) benefited relative returns. Holdings of banking firms HDFC Bank (b) (India) and Kasikornbank (b) (Thailand), and automotive safety parts manufacturer Autoliv (b) (Sweden), were also top relative contributors. The fund’s avoidance of mining giant BHP Billiton (Australia), which turned in weak performance for the period driven by lower oil and iron-ore prices, also boosted relative performance.
3
MFS Research International Series
Management Review – continued
During the reporting period, the fund’s relative currency exposure, resulting primarily from differences between the fund’s and the benchmark’s exposure to holdings of securities denominated in foreign currencies, was another contributor to relative performance. All of MFS’ investment decisions are driven by the fundamentals of each individual opportunity and as such, it is common for our portfolios to have different currency exposure than the benchmark.
Respectfully,
| | |
| Jose Luis Garcia | | Thomas Melendez |
| Portfolio Manager | | Portfolio Manager |
| (b) | Security is not a benchmark constituent. |
| (h) | Security was not held in the portfolio at period end. |
The views expressed in this report are those of the portfolio managers only through the end of the period of the report as stated on the cover and do not necessarily reflect the views of MFS or any other person in the MFS organization. These views are subject to change at any time based on market or other conditions, and MFS disclaims any responsibility to update such views. These views may not be relied upon as investment advice or an indication of trading intent on behalf of any MFS portfolio. References to specific securities are not recommendations of such securities, and may not be representative of any MFS portfolio’s current or future investments.
4
MFS Research International Series
PERFORMANCE SUMMARY THROUGH 12/31/14
The following chart illustrates the historical performance of the fund in comparison to its benchmark(s). Benchmarks are unmanaged and may not be invested in directly. Benchmark returns do not reflect any fees or expenses. The performance of other share classes will be greater than or less than that of the class depicted below. (See Notes to Performance Summary.)
Performance data shown represents past performance and is no guarantee of future results. Investment return and principal value fluctuate so your units, when sold, may be worth more or less than the original cost; current performance may be lower or higher than quoted. The performance shown does not reflect the deduction of taxes, if any, that a contract holder would pay on fund distributions or the redemption of contract units. The returns for the fund shown also do not reflect the deduction of expenses associated with variable products, such as mortality and expense risk charges, separate account charges, and sales charges imposed by the insurance company separate accounts. Such expenses would reduce the overall returns shown.
Growth of a Hypothetical $10,000 Investment (t)
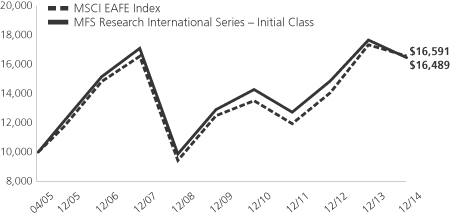
Total Returns through 12/31/14
Average annual total returns
| | | | | | | | | | | | |
| | | Share Class | | Class inception date | | 1-yr | | 5-yr | | Life (t) | | |
| | | Initial Class | | 4/29/05 | | (6.87)% | | 5.01% | | 5.30% | | |
| | | Service Class | | 4/29/05 | | (7.09)% | | 4.75% | | 5.04% | | |
| | | | |
| Comparative benchmark | | | | | | | | |
| | | MSCI EAFE Index (f) | | (4.48)% | | 5.81% | | 5.37% | | |
| (f) | Source: FactSet Research Systems Inc. |
| (t) | For the period from the class inception date through the stated period end. (See Notes to Performance Summary.) |
Benchmark Definition
MSCI EAFE (Europe, Australasia, Far East) Index – a market capitalization-weighted index that is designed to measure equity market performance in the developed markets, excluding the U.S. and Canada.
It is not possible to invest directly in an index.
Notes to Performance Summary
Average annual total return represents the average annual change in value for each share class for the periods presented. Life returns are presented where the share class has less than 10 years of performance history and represent the average annual total return from the class inception date to the stated period end date.
Performance results reflect any applicable expense subsidies and waivers in effect during the periods shown. Without such subsidies and waivers the fund’s performance results would be less favorable. Please see the prospectus and financial statements for complete details. All results are historical and assume the reinvestment of any dividends and capital gains distributions.
Performance results do not include adjustments made for financial reporting purposes in accordance with U.S. generally accepted accounting principles and may differ from amounts reported in the financial highlights.
From time to time the fund may receive proceeds from litigation settlements, without which performance would be lower.
5
MFS Research International Series
EXPENSE TABLE
Fund Expenses Borne by the Contract Holders During the Period,
July 1, 2014 through December 31, 2014
As a contract holder of the fund, you incur ongoing costs, including management fees; distribution and/or service (12b-1) fees; and other fund expenses. This example is intended to help you understand your ongoing costs (in dollars) of investing in the fund and to compare these costs with the ongoing costs of investing in other mutual funds.
The example is based on an investment of $1,000 invested at the beginning of the period and held for the entire period July 1, 2014 through December 31, 2014.
Actual Expenses
The first line for each share class in the following table provides information about actual account values and actual expenses. You may use the information in this line, together with the amount you invested, to estimate the expenses that you paid over the period. Simply divide your account value by $1,000 (for example, an $8,600 account value divided by $1,000 = 8.6), then multiply the result by the number in the first line under the heading entitled “Expenses Paid During Period” to estimate the expenses you paid on your account during this period.
Hypothetical Example for Comparison Purposes
The second line for each share class in the following table provides information about hypothetical account values and hypothetical expenses based on the fund’s actual expense ratio and an assumed rate of return of 5% per year before expenses, which is not the fund’s actual return. The hypothetical account values and expenses may not be used to estimate the actual ending account balance or expenses you paid for the period. You may use this information to compare the ongoing costs of investing in the fund and other funds. To do so, compare this 5% hypothetical example with the 5% hypothetical examples that appear in the shareholder reports of the other funds.
Please note that the expenses shown in the table are meant to highlight the fund’s ongoing costs only and do not take into account the fees and expenses imposed under the variable contracts through which your investment in the fund is made. Therefore, the second line for each share class in the table is useful in comparing ongoing costs associated with an investment in vehicles (such as the fund) which fund benefits under variable annuity and variable life insurance contracts and to qualified pension and retirement plans only, and will not help you determine the relative total costs of investing in the fund through variable annuity and variable life insurance contracts. If the fees and expenses imposed under the variable contracts were included, your costs would have been higher.
| | | | | | | | | | | | | | | | | | |
| Share Class | | | | Annualized
Expense Ratio | | | Beginning
Account Value
7/01/14 | | | Ending
Account Value
12/31/14 | | | Expenses Paid
During Period (p)
7/01/14-12/31/14 | |
| Initial Class | | Actual | | | 1.01% | | | | $1,000.00 | | | | $904.92 | | | | $4.85 | |
| | Hypothetical (h) | | | 1.01% | | | | $1,000.00 | | | | $1,020.11 | | | | $5.14 | |
| Service Class | | Actual | | | 1.27% | | | | $1,000.00 | | | | $903.86 | | | | $6.09 | |
| | Hypothetical (h) | | | 1.27% | | | | $1,000.00 | | | | $1,018.80 | | | | $6.46 | |
| (h) | 5% class return per year before expenses. |
| (p) | “Expenses Paid During Period” are equal to each class’s annualized expense ratio, as shown above, multiplied by the average account value over the period, multiplied by 184/365 (to reflect the one-half year period). |
Notes to Expense Table
Changes to the fund’s fee arrangements occurred during the six month period. Had these fee changes been in effect throughout the entire six month period, the annualized expense ratios, the actual expenses paid during the period and the hypothetical expenses paid during the period would have been approximately 1.00%, $4.80 and $5.09 for Initial Class and 1.25%, $6.00 and $6.36 for Service Class, respectively. For further information about the fund’s fee arrangements and changes to those fee arrangements, please see Note 3 in the Notes to Financial Statements.
6
MFS Research International Series
PORTFOLIO OF INVESTMENTS – 12/31/14
The Portfolio of Investments is a complete list of all securities owned by your fund. It is categorized by broad-based asset classes.
| | | | | | | | |
| Issuer | | Shares/Par | | | Value ($) | |
| | | | | | | | |
| COMMON STOCKS – 98.5% | | | | | |
| Alcoholic Beverages – 1.3% | | | | | | | | |
| Pernod Ricard S.A. | | | 15,969 | | | $ | 1,770,594 | |
| | | | | | | | |
| Apparel Manufacturers – 1.5% | | | | | | | | |
| Global Brands Group Holding Ltd. (a) | | | 1,700,000 | | | $ | 332,291 | |
| Li & Fung Ltd. | | | 270,000 | | | | 252,777 | |
| LVMH Moet Hennessy Louis Vuitton S.A. | | | 8,572 | | | | 1,355,525 | |
| | | | | | | | |
| | | | | | $ | 1,940,593 | |
| | | | | | | | |
| Automotive – 4.4% | | | | | |
| Autoliv, Inc. | | | 13,673 | | | $ | 1,450,979 | |
| DENSO Corp. | | | 56,300 | | | | 2,623,895 | |
| Honda Motor Co. Ltd. | | | 64,700 | | | | 1,881,456 | |
| | | | | | | | |
| | | | | | $ | 5,956,330 | |
| | | | | | | | |
| Broadcasting – 1.6% | | | | | |
| ProSiebenSat.1 Media AG | | | 13,749 | | | $ | 579,466 | |
| WPP PLC | | | 72,778 | | | | 1,509,867 | |
| | | | | | | | |
| | | | | | $ | 2,089,333 | |
| | | | | | | | |
| Brokerage & Asset Managers – 0.5% | | | | | |
| Computershare Ltd. | | | 69,779 | | | $ | 667,348 | |
| | | | | | | | |
| Business Services – 3.1% | | | | | | | | |
| Brenntag AG | | | 8,503 | | | $ | 478,544 | |
| Cognizant Technology Solutions Corp., “A” (a) | | | 24,456 | | | | 1,287,853 | |
| Compass Group PLC | | | 60,574 | | | | 1,032,443 | |
| Mitsubishi Corp. | | | 40,700 | | | | 746,433 | |
| Nomura Research, Inc. | | | 21,600 | | | | 663,248 | |
| | | | | | | | |
| | | | | | $ | 4,208,521 | |
| | | | | | | | |
| Computer Software – 0.5% | | | | | |
| Dassault Systems S.A. | | | 11,606 | | | $ | 706,323 | |
| | | | | | | | |
| Conglomerates – 0.8% | | | | | | | | |
| Hutchison Whampoa Ltd. | | | 98,000 | | | $ | 1,121,963 | |
| | | | | | | | |
| Consumer Products – 2.2% | | | | | | | | |
| L’Oreal S.A. | | | 8,468 | | | $ | 1,421,668 | |
| Reckitt Benckiser Group PLC | | | 18,109 | | | | 1,460,878 | |
| | | | | | | | |
| | | | | | $ | 2,882,546 | |
| | | | | | | | |
| Electrical Equipment – 3.8% | | | | | |
| Legrand S.A. | | | 8,173 | | | $ | 427,847 | |
| Schneider Electric S.A. | | | 33,787 | | | | 2,455,026 | |
| Siemens AG | | | 19,331 | | | | 2,192,951 | |
| | | | | | | | |
| | | | | | $ | 5,075,824 | |
| | | | | | | | |
| Electronics – 3.1% | | | | | |
| Infineon Technologies AG | | | 79,223 | | | $ | 849,353 | |
| MediaTek, Inc. | | | 117,000 | | | | 1,703,277 | |
| Taiwan Semiconductor Manufacturing Co. Ltd. | | | 364,174 | | | | 1,607,002 | |
| | | | | | | | |
| | | | | | $ | 4,159,632 | |
| | | | | | | | |
| Energy – Independent – 1.6% | | | | | |
| Cairn Energy PLC (a) | | | 66,250 | | | $ | 181,860 | |
| | | | | | | | |
| Issuer | | Shares/Par | | | Value ($) | |
| | | | | | | | |
| COMMON STOCKS – continued | | | | | |
| Energy – Independent – continued | | | | | | | | |
| Cenovus Energy, Inc. | | | 15,687 | | | $ | 323,651 | |
| Galp Energia SGPS S.A., “B” | | | 32,191 | | | | 325,674 | |
| INPEX Corp. | | | 51,300 | | | | 569,191 | |
| Oil Search Ltd. | | | 49,544 | | | | 320,095 | |
| Reliance Industries Ltd. | | | 32,701 | | | | 460,003 | |
| | | | | | | | |
| | | | | | $ | 2,180,474 | |
| | | | | | | | |
| Energy – Integrated – 3.8% | | | | | |
| BG Group PLC | | | 74,397 | | | $ | 990,279 | |
| Royal Dutch Shell PLC, “A” | | | 121,845 | | | | 4,038,735 | |
| | | | | | | | |
| | | | | | $ | 5,029,014 | |
| | | | | | | | |
| Engineering – Construction – 0.6% | | | | | |
| JGC Corp. | | | 39,000 | | | $ | 803,754 | |
| | | | | | | | |
| Food & Beverages – 4.7% | | | | | | | | |
| Danone S.A. | | | 32,616 | | | $ | 2,145,692 | |
| M. Dias Branco S.A. Industria e Comercio de Alimentos | | | 17,371 | | | | 594,673 | |
| Nestle S.A. | | | 48,751 | | | | 3,573,523 | |
| | | | | | | | |
| | | | | | $ | 6,313,888 | |
| | | | | | | | |
| Food & Drug Stores – 0.5% | | | | | |
| Sundrug Co. Ltd. | | | 17,100 | | | $ | 692,120 | |
| | | | | | | | |
| Gaming & Lodging – 0.5% | | | | | | | | |
| Sands China Ltd. | | | 138,000 | | | $ | 671,205 | |
| | | | | | | | |
| General Merchandise – 0.3% | | | | | | | | |
| Lojas Renner S.A. | | | 14,520 | | | $ | 414,150 | |
| | | | | | | | |
| Health Maintenance Organizations – 0.2% | |
| OdontoPrev S.A. | | | 83,859 | | | $ | 311,056 | |
| | | | | | | | |
| Insurance – 6.4% | | | | | | | | |
| AIA Group Ltd. | | | 412,200 | | | $ | 2,269,763 | |
| Hiscox Ltd. | | | 53,987 | | | | 606,259 | |
| ING Groep N.V. (a) | | | 151,649 | | | | 1,963,492 | |
| Prudential PLC | | | 52,539 | | | | 1,209,036 | |
| Sony Financial Holdings, Inc. | | | 31,400 | | | | 463,024 | |
| Zurich Insurance Group AG | | | 6,575 | | | | 2,058,914 | |
| | | | | | | | |
| | | | | | $ | 8,570,488 | |
| | | | | | | | |
| Machinery & Tools – 3.4% | | | | | |
| Atlas Copco AB, “A” | | | 77,201 | | | $ | 2,149,054 | |
| Joy Global, Inc. | | | 19,193 | | | | 892,858 | |
| Schindler Holding AG | | | 10,307 | | | | 1,487,227 | |
| | | | | | | | |
| | | | | | $ | 4,529,139 | |
| | | | | | | | |
| Major Banks – 10.0% | | | | | |
| BNP Paribas | | | 31,300 | | | $ | 1,839,322 | |
| BOC Hong Kong Holdings Ltd. | | | 118,500 | | | | 394,535 | |
| HSBC Holdings PLC | | | 320,859 | | | | 3,032,272 | |
| Mitsubishi UFJ Financial Group, Inc. | | | 308,600 | | | | 1,691,481 | |
| Royal Bank of Scotland Group PLC (a) | | | 267,094 | | | | 1,621,400 | |
| Standard Chartered PLC | | | 72,488 | | | | 1,087,996 | |
7
MFS Research International Series
Portfolio of Investments – continued
| | | | | | | | |
| Issuer | | Shares/Par | | | Value ($) | |
| | | | | | | | |
| COMMON STOCKS – continued | | | | | |
| Major Banks – continued | | | | | |
| Sumitomo Mitsui Financial Group, Inc. | | | 39,200 | | | $ | 1,416,394 | |
| Westpac Banking Corp. | | | 87,607 | | | | 2,355,202 | |
| | | | | | | | |
| | | | | | $ | 13,438,602 | |
| | | | | | | | |
| Medical Equipment – 0.8% | | | | | | | | |
| Sonova Holding AG | | | 2,528 | | | $ | 370,587 | |
| Terumo Corp. | | | 33,200 | | | | 756,120 | |
| | | | | | | | |
| | | | | | $ | 1,126,707 | |
| | | | | | | | |
| Metals & Mining – 2.7% | | | | | |
| Gerdau S.A., ADR | | | 91,874 | | | $ | 326,153 | |
| Iluka Resources Ltd. | | | 126,635 | | | | 608,756 | |
| Rio Tinto Ltd. | | | 57,759 | | | | 2,661,105 | |
| | | | | | | | |
| | | | | | $ | 3,596,014 | |
| | | | | | | | |
| Natural Gas – Distribution – 2.8% | | | | | |
| Centrica PLC | | | 159,610 | | | $ | 686,955 | |
| China Resources Gas Group Ltd. | | | 238,000 | | | | 615,649 | |
| GDF SUEZ | | | 56,911 | | | | 1,329,174 | |
| Tokyo Gas Co. Ltd. | | | 199,000 | | | | 1,073,836 | |
| | | | | | | | |
| | | | | | $ | 3,705,614 | |
| | | | | | | | |
| Natural Gas – Pipeline – 0.5% | | | | | |
| APA Group | | | 117,500 | | | $ | 714,656 | |
| | | | | | | | |
| Network & Telecom – 1.1% | | | | | |
| Ericsson, Inc., “B” | | | 116,174 | | | $ | 1,406,061 | |
| | | | | | | | |
| Oil Services – 0.3% | | | | | |
| Technip | | | 6,786 | | | $ | 405,766 | |
| | | | | | | | |
| Other Banks & Diversified Financials – 7.5% | | | | | |
| Aeon Credit Service Co. Ltd. | | | 28,500 | | | $ | 557,150 | |
| DBS Group Holdings Ltd. | | | 97,000 | | | | 1,497,916 | |
| Erste Group Bank AG | | | 32,217 | | | | 738,620 | |
| HDFC Bank Ltd., ADR | | | 10,332 | | | | 524,349 | |
| Julius Baer Group Ltd. | | | 23,221 | | | | 1,059,691 | |
| Kasikornbank PLC, NVDR | | | 74,700 | | | | 515,820 | |
| KBC Group N.V. (a) | | | 29,059 | | | | 1,612,790 | |
| Sberbank of Russia, ADR | | | 55,023 | | | | 221,098 | |
| UBS AG (a) | | | 134,594 | | | | 2,313,631 | |
| UniCredit S.p.A. | | | 149,411 | | | | 952,272 | |
| | | | | | | | |
| | | | | | $ | 9,993,337 | |
| | | | | | | | |
| Pharmaceuticals – 10.0% | | | | | |
| Bayer AG | | | 21,198 | | | $ | 2,898,523 | |
| Indivior PLC (a) | | | 16,011 | | | | 37,282 | |
| Novartis AG | | | 44,451 | | | | 4,088,047 | |
| Roche Holding AG | | | 16,120 | | | | 4,369,172 | |
| Santen Pharmaceutical Co. Ltd. | | | 36,700 | | | | 1,964,033 | |
| | | | | | | | |
| | | | | | $ | 13,357,057 | |
| | | | | | | | |
| Printing & Publishing – 0.9% | | | | | |
| Reed Elsevier N.V. | | | 48,353 | | | $ | 1,155,576 | |
| | | | | | | | |
| Real Estate – 0.9% | | | | | |
| Deutsche Wohnen AG | | | 27,079 | | | $ | 643,403 | |
| Intu Properties PLC, REIT | | | 112,678 | | | | 582,681 | |
| | | | | | | | |
| | | | | | $ | 1,226,084 | |
| | | | | | | | |
| | | | | | | | |
| Issuer | | Shares/Par | | | Value ($) | |
| | | | | | | | |
| COMMON STOCKS – continued | | | | | |
| Restaurants – 2.2% | | | | | | | | |
| Whitbread PLC | | | 23,693 | | | $ | 1,748,472 | |
| YUM! Brands, Inc. | | | 15,570 | | | | 1,134,275 | |
| | | | | | | | |
| | | | | | $ | 2,882,747 | |
| | | | | | | | |
| Specialty Chemicals – 5.0% | | | | | |
| Akzo Nobel N.V. | | | 30,128 | | | $ | 2,089,216 | |
| JSR Corp. | | | 95,600 | | | | 1,641,626 | |
| Linde AG | | | 11,538 | | | | 2,152,872 | |
| Symrise AG | | | 14,172 | | | | 859,671 | |
| | | | | | | | |
| | | | | | $ | 6,743,385 | |
| | | | | | | | |
| Specialty Stores – 0.8% | | | | | |
| Esprit Holdings Ltd. | | | 296,600 | | | $ | 354,942 | |
| Hennes & Mauritz AB, “B” | | | 7,098 | | | | 294,438 | |
| Ryohin Keikaku Co. Ltd. | | | 3,400 | | | | 420,116 | |
| | | | | | | | |
| | | | | | $ | 1,069,496 | |
| | | | | | | | |
| Telecommunications – Wireless – 3.4% | | | | | |
| KDDI Corp. | | | 41,200 | | | $ | 2,577,898 | |
| Mobile TeleSystems OJSC (a) | | | 56,977 | | | | 158,551 | |
| Philippine Long Distance Telephone Co. | | | 5,845 | | | | 379,714 | |
| Vodafone Group PLC | | | 423,181 | | | | 1,450,014 | |
| | | | | | | | |
| | | | | | $ | 4,566,177 | |
| | | | | | | | |
| Telephone Services – 1.8% | | | | | |
| BT Group PLC | | | 99,473 | | | $ | 617,485 | |
| Hellenic Telecommunications Organization S.A. (a) | | | 36,801 | | | | 405,233 | |
| Royal KPN N.V. | | | 184,341 | | | | 581,187 | |
| Telecom Italia S.p.A. – Savings Shares | | | 594,152 | | | | 496,613 | |
| Telefonica Brasil S.A., ADR | | | 15,975 | | | | 282,438 | |
| | | | | | | | |
| | | | | | $ | 2,382,956 | |
| | | | | | | | |
| Tobacco – 1.0% | | | | | |
| Japan Tobacco, Inc. | | | 50,000 | | | $ | 1,372,904 | |
| | | | | | | | |
| Trucking – 1.5% | | | | | |
| Yamato Holdings Co. Ltd. | | | 100,900 | | | $ | 1,986,763 | |
| | | | | | | | |
| Utilities – Electric Power – 0.5% | | | | | |
| Canadian Utilities Ltd. | | | 20,176 | | | $ | 710,449 | |
| | | | | | | | |
Total Common Stocks
(Identified Cost, $133,784,143) | | | | | | $ | 131,934,646 | |
| | | | | | | | |
| |
| MONEY MARKET FUNDS – 1.4% | | | | | |
| MFS Institutional Money Market Portfolio, 0.09%, at Cost and Net Asset Value (v) | | | 1,812,729 | | | $ | 1,812,729 | |
| | | | | | | | |
Total Investments
(Identified Cost, $135,596,872) | | | | | | $ | 133,747,375 | |
| | | | | | | | |
OTHER ASSETS, LESS
LIABILITIES – 0.1% | | | | | | | 161,251 | |
| | | | | | | | |
| NET ASSETS – 100.0% | | | | | | $ | 133,908,626 | |
| | | | | | | | |
8
MFS Research International Series
Portfolio of Investments – continued
| (a) | | Non-income producing security. |
| (v) | | Underlying affiliated fund that is available only to investment companies managed by MFS. The rate quoted for the MFS Institutional Money Market Portfolio is the annualized seven-day yield of the fund at period end. |
The following abbreviations are used in this report and are defined:
| ADR | | American Depositary Receipt |
| NVDR | | Non-Voting Depositary Receipt |
| PLC | | Public Limited Company |
| REIT | | Real Estate Investment Trust |
See Notes to Financial Statements
9
MFS Research International Series
FINANCIAL STATEMENTS | STATEMENT OF ASSETS AND LIABILITIES
This statement represents your fund’s balance sheet, which details the assets and liabilities comprising the total value of the fund.
| | | | | | | | |
At 12/31/14 | | | | | | | | |
Assets | | | | | | | | |
Investments – | | | | | | | | |
Non-affiliated issuers, at value (identified cost, $133,784,143) | | | $131,934,646 | | | | | |
Underlying affiliated funds, at cost and value | | | 1,812,729 | | | | | |
Total investments, at value (identified cost, $135,596,872) | | | $133,747,375 | | | | | |
Cash | | | 4,037 | | | | | |
Receivables for | | | | | | | | |
Investments sold | | | 6 | | | | | |
Fund shares sold | | | 61,052 | | | | | |
Interest and dividends | | | 252,005 | | | | | |
Other assets | | | 1,360 | | | | | |
Total assets | | | | | | | $134,065,835 | |
Liabilities | | | | | | | | |
Payable to custodian | | | $13,166 | | | | | |
Payables for | | | | | | | | |
Investments purchased | | | 3,912 | | | | | |
Fund shares reacquired | | | 42,856 | | | | | |
Payable to affiliates | | | | | | | | |
Investment adviser | | | 6,640 | | | | | |
Shareholder servicing costs | | | 138 | | | | | |
Distribution and/or service fees | | | 478 | | | | | |
Payable for independent Trustees’ compensation | | | 2 | | | | | |
Deferred country tax expense payable | | | 7,818 | | | | | |
Accrued expenses and other liabilities | | | 82,199 | | | | | |
Total liabilities | | | | | | | $157,209 | |
Net assets | | | | | | | $133,908,626 | |
Net assets consist of | | | | | | | | |
Paid-in capital | | | $145,124,254 | | | | | |
Unrealized appreciation (depreciation) on investments and translation of assets and liabilities in foreign currencies (net of $7,818 deferred country tax) | | | (1,871,321 | ) | | | | |
Accumulated net realized gain (loss) on investments and foreign currency | | | (12,445,364 | ) | | | | |
Undistributed net investment income | | | 3,101,057 | | | | | |
Net assets | | | | | | | $133,908,626 | |
Shares of beneficial interest outstanding | | | | | | | 10,139,129 | |
| | | | | | | | | | | | |
| | | Net assets | | | Shares outstanding | | | Net asset value per share | |
Initial Class | | | $99,346,084 | | | | 7,508,316 | | | | $13.23 | |
Service Class | | | 34,562,542 | | | | 2,630,813 | | | | 13.14 | |
See Notes to Financial Statements
10
MFS Research International Series
FINANCIAL STATEMENTS | STATEMENT OF OPERATIONS
This statement describes how much your fund earned in investment income and accrued in expenses. It also describes any gains and/or losses generated by fund operations.
| | | | | | | | |
Year ended 12/31/14 | | | | | | | | |
Net investment income | | | | | | | | |
Income | | | | | | | | |
Dividends | | | $5,110,275 | | | | | |
Interest | | | 49,529 | | | | | |
Dividends from underlying affiliated funds | | | 1,131 | | | | | |
Foreign taxes withheld | | | (336,954 | ) | | | | |
Total investment income | | | | | | | $4,823,981 | |
Expenses | | | | | | | | |
Management fee | | | $1,270,288 | | | | | |
Distribution and/or service fees | | | 101,553 | | | | | |
Shareholder servicing costs | | | 17,784 | | | | | |
Administrative services fee | | | 29,690 | | | | | |
Independent Trustees’ compensation | | | 4,506 | | | | | |
Custodian fee | | | 103,216 | | | | | |
Shareholder communications | | | 25,390 | | | | | |
Audit and tax fees | | | 60,470 | | | | | |
Legal fees | | | 1,208 | | | | | |
Miscellaneous | | | 11,253 | | | | | |
Total expenses | | | | | | | $1,625,358 | |
Fees paid indirectly | | | (6 | ) | | | | |
Reduction of expenses by investment adviser | | | (38,028 | ) | | | | |
Net expenses | | | | | | | $1,587,324 | |
Net investment income | | | | | | | $3,236,657 | |
Realized and unrealized gain (loss) on investments and foreign currency | | | | | | | | |
Realized gain (loss) (identified cost basis) | | | | | | | | |
Investments (net of $3,000 country tax) | | | $4,218,984 | | | | | |
Foreign currency | | | (34,027 | ) | | | | |
Net realized gain (loss) on investments and foreign currency | | | | | | | $4,184,957 | |
Change in unrealized appreciation (depreciation) | | | | | | | | |
Investments (net of $7,818 increase in deferred country tax) | | | $(17,521,654 | ) | | | | |
Translation of assets and liabilities in foreign currencies | | | (20,458 | ) | | | | |
Net unrealized gain (loss) on investments and foreign currency translation | | | | | | | $(17,542,112 | ) |
Net realized and unrealized gain (loss) on investments and foreign currency | | | | | | | $(13,357,155 | ) |
Change in net assets from operations | | | | | | | $(10,120,498 | ) |
See Notes to Financial Statements
11
MFS Research International Series
FINANCIAL STATEMENTS | STATEMENTS OF CHANGES IN NET ASSETS
These statements describe the increases and/or decreases in net assets resulting from operations, any distributions, and any shareholder transactions.
| | | | | | | | |
For years ended 12/31 | | | 2014 | | | | 2013 | |
Change in net assets | | | | | | | | |
From operations | | | | | | | | |
Net investment income | | | $3,236,657 | | | | $2,148,961 | |
Net realized gain (loss) on investments and foreign currency | | | 4,184,957 | | | | 9,816,677 | |
Net unrealized gain (loss) on investments and foreign currency translation | | | (17,542,112 | ) | | | 12,235,671 | |
Change in net assets from operations | | | $(10,120,498 | ) | | | $24,201,309 | |
Distributions declared to shareholders | | | | | | | | |
From net investment income | | | $(2,186,535 | ) | | | $(2,603,020 | ) |
Change in net assets from fund share transactions | | | $5,616,908 | | | | $(20,016,821 | ) |
Total change in net assets | | | $(6,690,125 | ) | | | $1,581,468 | |
Net assets | | | | | | | | |
At beginning of period | | | 140,598,751 | | | | 139,017,283 | |
At end of period (including undistributed net investment income of $3,101,057 and
$2,182,248, respectively) | | | $133,908,626 | | | | $140,598,751 | |
See Notes to Financial Statements
12
MFS Research International Series
FINANCIAL STATEMENTS | FINANCIAL HIGHLIGHTS
The financial highlights table is intended to help you understand the fund’s financial performance for the past 5 years. Certain information reflects financial results for a single fund share. The total returns in the table represent the rate by which an investor would have earned (or lost) on an investment in the fund share class (assuming reinvestment of all distributions) held for the entire period.
| | | | | | | | | | | | | | | | | | | | |
| Initial Class | | Years ended 12/31 | |
| | | 2014 | | | 2013 | | | 2012 | | | 2011 | | | 2010 | |
Net asset value, beginning of period | | | $14.43 | | | | $12.37 | | | | $10.86 | | | | $12.44 | | | | $11.40 | |
| Income (loss) from investment operations | | | | | | | | | | | | | | | | | | | | |
Net investment income (d) | | | $0.33 | | | | $0.22 | | | | $0.24 | | | | $0.25 | | | | $0.18 | |
Net realized and unrealized gain (loss) on investments
and foreign currency | | | (1.30 | ) | | | 2.10 | | | | 1.55 | | | | (1.59 | ) | | | 1.03 | |
Total from investment operations | | | $(0.97 | ) | | | $2.32 | | | | $1.79 | | | | $(1.34 | ) | | | $1.21 | |
| Less distributions declared to shareholders | | | | | | | | | | | | | | | | | | | | |
From net investment income | | | $(0.23 | ) | | | $(0.26 | ) | | | $(0.28 | ) | | | $(0.24 | ) | | | $(0.17 | ) |
Net asset value, end of period (x) | | | $13.23 | | | | $14.43 | | | | $12.37 | | | | $10.86 | | | | $12.44 | |
Total return (%) (k)(r)(s)(x) | | | (6.87 | ) | | | 18.95 | | | | 16.70 | | | | (10.88 | ) | | | 10.81 | |
Ratios (%) (to average net assets)
and Supplemental data: | | | | | | | | | | | | | | | | | | | | |
Expenses before expense reductions (f) | | | 1.08 | | | | 1.10 | | | | 1.10 | | | | 1.14 | | | | 1.15 | |
Expenses after expense reductions (f) | | | 1.05 | | | | 1.09 | | | | 1.10 | | | | 1.10 | | | | 1.10 | |
Net investment income | | | 2.31 | | | | 1.61 | | | | 2.08 | | | | 2.04 | | | | 1.60 | |
Portfolio turnover | | | 30 | | | | 35 | | | | 37 | | | | 47 | | | | 61 | |
Net assets at end of period (000 omitted) | | | $99,346 | | | | $96,396 | | | | $101,016 | | | | $95,151 | | | | $145,085 | |
| |
| Service Class | | Years ended 12/31 | |
| | | 2014 | | | 2013 | | | 2012 | | | 2011 | | | 2010 | |
Net asset value, beginning of period | | | $14.33 | | | | $12.29 | | | | $10.79 | | | | $12.35 | | | | $11.33 | |
| Income (loss) from investment operations | | | | | | | | | | | | | | | | | | | | |
Net investment income (d) | | | $0.32 | | | | $0.18 | | | | $0.20 | | | | $0.21 | | | | $0.14 | |
Net realized and unrealized gain (loss) on investments
and foreign currency | | | (1.32 | ) | | | 2.09 | | | | 1.55 | | | | (1.56 | ) | | | 1.03 | |
Total from investment operations | | | $(1.00 | ) | | | $2.27 | | | | $1.75 | | | | $(1.35 | ) | | | $1.17 | |
| Less distributions declared to shareholders | | | | | | | | | | | | | | | | | | | | |
From net investment income | | | $(0.19 | ) | | | $(0.23 | ) | | | $(0.25 | ) | | | $(0.21 | ) | | | $(0.15 | ) |
Net asset value, end of period (x) | | | $13.14 | | | | $14.33 | | | | $12.29 | | | | $10.79 | | | | $12.35 | |
Total return (%) (k)(r)(s)(x) | | | (7.09 | ) | | | 18.66 | | | | 16.41 | | | | (11.06 | ) | | | 10.48 | |
Ratios (%) (to average net assets)
and Supplemental data: | | | | | | | | | | | | | | | | | | | | |
Expenses before expense reductions (f) | | | 1.33 | | | | 1.35 | | | | 1.35 | | | | 1.39 | | | | 1.40 | |
Expenses after expense reductions (f) | | | 1.31 | | | | 1.34 | | | | 1.35 | | | | 1.35 | | | | 1.35 | |
Net investment income | | | 2.26 | | | | 1.34 | | | | 1.78 | | | | 1.72 | | | | 1.27 | |
Portfolio turnover | | | 30 | | | | 35 | | | | 37 | | | | 47 | | | | 61 | |
Net assets at end of period (000 omitted) | | | $34,563 | | | | $44,203 | | | | $38,001 | | | | $28,947 | | | | $42,482 | |
| (d) | Per share data is based on average shares outstanding. |
| (f) | Ratios do not reflect reductions from fees paid indirectly, if applicable. |
| (k) | The total return does not reflect expenses that apply to separate accounts. Inclusion of these charges would reduce the total return figures for all periods shown. |
| (r) | Certain expenses have been reduced without which performance would have been lower. |
| (s) | From time to time the fund may receive proceeds from litigation settlements, without which performance would be lower. |
| (x) | The net asset values per share and total returns have been calculated on net assets which include adjustments made in accordance with U.S. generally accepted accounting principles required at period end for financial reporting purposes. |
See Notes to Financial Statements
13
MFS Research International Series
NOTES TO FINANCIAL STATEMENTS
| (1) | | Business and Organization |
MFS Research International Series (the fund) is a diversified series of MFS Variable Insurance Trust (the trust). The trust is organized as a Massachusetts business trust and is registered under the Investment Company Act of 1940, as amended, as an open-end management investment company. The shareholders of each series of the trust are separate accounts of insurance companies, which offer variable annuity and/or life insurance products, and qualified retirement and pension plans.
The fund is an investment company and accordingly follows the investment company accounting and reporting guidance of the Financial Accounting Standards Board (FASB) Accounting Standards Codification Topic 946 Financial Services – Investment Companies.
| (2) | | Significant Accounting Policies |
General – The preparation of financial statements in conformity with U.S. generally accepted accounting principles requires management to make estimates and assumptions that affect the reported amounts of assets and liabilities, and disclosure of contingent assets and liabilities at the date of the financial statements and the reported amounts of increases and decreases in net assets from operations during the reporting period. Actual results could differ from those estimates. In the preparation of these financial statements, management has evaluated subsequent events occurring after the date of the fund’s Statement of Assets and Liabilities through the date that the financial statements were issued. The fund invests in foreign securities. Investments in foreign securities are vulnerable to the effects of changes in the relative values of the local currency and the U.S. dollar and to the effects of changes in each country’s legal, political, and economic environment.
In June 2014, FASB issued Accounting Standards Update 2014-11, Transfers and Servicing (Topic 860) – Repurchase-to-Maturity Transactions, Repurchase Financings, and Disclosures (“ASU 2014-11”). ASU 2014-11 changes the accounting for repurchase-to-maturity transactions (i.e., repurchase agreements that settle at the same time as the maturity of the transferred financial asset) and enhances the required disclosures for repurchase agreements and other similar transactions. Although still evaluating the potential impacts of ASU 2014-11 to the fund, management expects that the impact of the fund’s adoption will be limited to additional financial statement disclosures which would first be effective for interim reporting periods beginning after March 15, 2015.
Balance Sheet Offsetting – The fund’s accounting policy with respect to balance sheet offsetting is that, absent an event of default by the counterparty or a termination of the agreement, the International Swaps and Derivatives Association (ISDA) Master Agreement does not result in an offset of reported amounts of financial assets and financial liabilities in the Statement of Assets and Liabilities across transactions between the fund and the applicable counterparty. The fund’s right to setoff may be restricted or prohibited by the bankruptcy or insolvency laws of the particular jurisdiction to which a specific master netting agreement counterparty is subject. Balance sheet offsetting disclosures, to the extent applicable to the fund, have been included in the fund’s Significant Accounting Policies note under the captions for each of the fund’s in-scope financial instruments and transactions.
Investment Valuations – Equity securities, including restricted equity securities, are generally valued at the last sale or official closing price as provided by a third-party pricing service on the market or exchange on which they are primarily traded. Equity securities, for which there were no sales reported that day, are generally valued at the last quoted daily bid quotation as provided by a third-party pricing service on the market or exchange on which such securities are primarily traded. Short-term instruments with a maturity at issuance of 60 days or less may be valued at amortized cost, which approximates market value. Open-end investment companies are generally valued at net asset value per share. Securities and other assets generally valued on the basis of information from a third-party pricing service may also be valued at a broker/dealer bid quotation. Values obtained from third-party pricing services can utilize both transaction data and market information such as yield, quality, coupon rate, maturity, type of issue, trading characteristics, and other market data. The values of foreign securities and other assets and liabilities expressed in foreign currencies are converted to U.S. dollars using the mean of bid and asked prices for rates provided by a third-party pricing service.
The Board of Trustees has delegated primary responsibility for determining or causing to be determined the value of the fund’s investments (including any fair valuation) to the adviser pursuant to valuation policies and procedures approved by the Board. If the adviser determines that reliable market quotations are not readily available, investments are valued at fair value as determined in good faith by the adviser in accordance with such procedures under the oversight of the Board of Trustees. Under the fund’s valuation policies and procedures, market quotations are not considered to be readily available for most types of debt instruments and floating rate loans and many types of derivatives. These investments are generally valued at fair value based on information from third-party pricing services. In addition, investments may be valued at fair value if the adviser determines that an investment’s value has been materially affected by events occurring after the close of the exchange or market on which the investment is principally traded (such as foreign exchange or market) and prior to the determination of the fund’s net asset value, or after the halting of trading of a specific security where trading does not resume prior to the close of the exchange or market on which the security is principally traded. Events that occur on a frequent basis after foreign markets close (such as developments in foreign markets and significant movements in the U.S. markets) and prior to the determination of the fund’s net asset value may be deemed to have a material effect on the value of securities traded in foreign markets. Accordingly, the fund’s foreign equity securities may often be
14
MFS Research International Series
Notes to Financial Statements – continued
valued at fair value. The adviser generally relies on third-party pricing services or other information (such as the correlation with price movements of similar securities in the same or other markets; the type, cost and investment characteristics of the security; the business and financial condition of the issuer; and trading and other market data) to assist in determining whether to fair value and at what value to fair value an investment. The value of an investment for purposes of calculating the fund’s net asset value can differ depending on the source and method used to determine value. When fair valuation is used, the value of an investment used to determine the fund’s net asset value may differ from quoted or published prices for the same investment. There can be no assurance that the fund could obtain the fair value assigned to an investment if it were to sell the investment at the same time at which the fund determines its net asset value per share.
Various inputs are used in determining the value of the fund’s assets or liabilities. These inputs are categorized into three broad levels. In certain cases, the inputs used to measure fair value may fall into different levels of the fair value hierarchy. In such cases, an investment’s level within the fair value hierarchy is based on the lowest level of input that is significant to the fair value measurement. The fund’s assessment of the significance of a particular input to the fair value measurement in its entirety requires judgment, and considers factors specific to the investment. Level 1 includes unadjusted quoted prices in active markets for identical assets or liabilities. Level 2 includes other significant observable market-based inputs (including quoted prices for similar securities, interest rates, prepayment speed, and credit risk). Level 3 includes unobservable inputs, which may include the adviser’s own assumptions in determining the fair value of investments. The following is a summary of the levels used as of December 31, 2014 in valuing the fund’s assets or liabilities:
| | | | | | | | | | | | | | | | |
| Investments at Value | | Level 1 | | | Level 2 | | | Level 3 | | | Total | |
| Equity Securities: | | | | | | | | | | | | | | | | |
United Kingdom | | | $1,731,538 | | | | $22,823,482 | | | | $— | | | | $24,555,020 | |
Japan | | | — | | | | 23,901,437 | | | | — | | | | 23,901,437 | |
Switzerland | | | 2,313,631 | | | | 17,007,161 | | | | — | | | | 19,320,792 | |
France | | | 405,766 | | | | 13,451,172 | | | | — | | | | 13,856,938 | |
Germany | | | 9,162,027 | | | | 1,492,757 | | | | — | | | | 10,654,784 | |
Netherlands | | | — | | | | 5,789,471 | | | | — | | | | 5,789,471 | |
Hong Kong | | | 607,719 | | | | 4,789,757 | | | | — | | | | 5,397,476 | |
United States | | | 4,765,965 | | | | — | | | | — | | | | 4,765,965 | |
Australia | | | 714,656 | | | | 3,951,402 | | | | — | | | | 4,666,058 | |
Other Countries | | | 5,263,777 | | | | 13,762,928 | | | | — | | | | 19,026,705 | |
| Mutual Funds | | | 1,812,729 | | | | — | | | | — | | | | 1,812,729 | |
| Total Investments | | | $26,777,808 | | | | $106,969,567 | | | | $— | | | | $133,747,375 | |
For further information regarding security characteristics, see the Portfolio of Investments.
Of the level 2 investments presented above, equity investments amounting to $89,323,513 would have been considered level 1 investments at the beginning of the period. Of the level 1 investments presented above, equity investments amounting to $252,777 would have been considered level 2 investments at the beginning of the period. The primary reason for changes in the classifications between levels 1 and 2 occurs when foreign equity securities are fair valued using other observable market-based inputs in place of the closing exchange price due to events occurring after the close of the exchange or market on which the investment is principally traded. The fund’s foreign equity securities may often be valued at fair value. The fund’s policy is to recognize transfers between the levels as of the end of the period.
Foreign Currency Translation – Purchases and sales of foreign investments, income, and expenses are converted into U.S. dollars based upon currency exchange rates prevailing on the respective dates of such transactions or on the reporting date for foreign denominated receivables and payables. Gains and losses attributable to foreign currency exchange rates on sales of securities are recorded for financial statement purposes as net realized gains and losses on investments. Gains and losses attributable to foreign exchange rate movements on receivables, payables, income and expenses are recorded for financial statement purposes as foreign currency transaction gains and losses. That portion of both realized and unrealized gains and losses on investments that results from fluctuations in foreign currency exchange rates is not separately disclosed.
Security Loans – Under its Securities Lending Agency Agreement with the fund, State Street Bank and Trust Company (“State Street”), as lending agent, loans the securities of the fund to certain qualified institutions (the “Borrowers”) approved by the fund. The loans are collateralized by cash and/or U.S. Treasury and federal agency obligations in an amount typically at least equal to the market value of the securities loaned. On loans collateralized by cash, the cash collateral is invested in a money market fund. The market value of the loaned securities is determined at the close of business of the fund and any additional required collateral is delivered to the fund on the next business day. State Street provides the fund with indemnification against Borrower default. In the event of Borrower default, State Street will for the benefit of the fund either purchase securities identical to those loaned or, when such purchase is commercially impracticable, pay the fund the market value of the loaned securities. In return, State Street assumes the fund’s rights to the related collateral. If the collateral value is less than the cost to purchase identical securities, State Street is
15
MFS Research International Series
Notes to Financial Statements – continued
responsible for the shortfall, but only to the extent that such shortfall is not due to a decline in collateral value resulting from collateral reinvestment for which the fund bears the risk of loss. A portion of the income generated upon investment of the collateral is remitted to the Borrowers, and the remainder is allocated between the fund and the lending agent. On loans collateralized by U.S. Treasury and/or federal agency obligations, a fee is received from the Borrower, and is allocated between the fund and the lending agent. Income from securities lending is included in “Interest” income in the Statement of Operations. The dividend and interest income earned on the securities loaned is accounted for in the same manner as other dividend and interest income. At December 31, 2014, there were no securities on loan or collateral outstanding.
Indemnifications – Under the fund’s organizational documents, its officers and Trustees may be indemnified against certain liabilities and expenses arising out of the performance of their duties to the fund. Additionally, in the normal course of business, the fund enters into agreements with service providers that may contain indemnification clauses. The fund’s maximum exposure under these agreements is unknown as this would involve future claims that may be made against the fund that have not yet occurred.
Investment Transactions and Income – Investment transactions are recorded on the trade date. Interest income is recorded on the accrual basis. Dividends received in cash are recorded on the ex-dividend date. Certain dividends from foreign securities will be recorded when the fund is informed of the dividend if such information is obtained subsequent to the ex-dividend date. Dividend and interest payments received in additional securities are recorded on the ex-dividend or ex-interest date in an amount equal to the value of the security on such date.
The fund may receive proceeds from litigation settlements. Any proceeds received from litigation involving portfolio holdings are reflected in the Statement of Operations in realized gain/loss if the security has been disposed of by the fund or in unrealized gain/loss if the security is still held by the fund. Any other proceeds from litigation not related to portfolio holdings are reflected as other income in the Statement of Operations.
Fees Paid Indirectly – The fund’s custody fee may be reduced according to an arrangement that measures the value of cash deposited with the custodian by the fund. This amount, for the year ended December 31, 2014, is shown as a reduction of total expenses in the Statement of Operations.
Tax Matters and Distributions – The fund intends to qualify as a regulated investment company, as defined under Subchapter M of the Internal Revenue Code, and to distribute all of its taxable income, including realized capital gains. As a result, no provision for federal income tax is required. The fund’s federal tax returns, when filed, will remain subject to examination by the Internal Revenue Service for a three year period. Management has analyzed the fund’s tax positions taken on federal and state tax returns for all open tax years and does not believe that there are any uncertain tax positions that require recognition of a tax liability. Foreign taxes, if any, have been accrued by the fund in the accompanying financial statements in accordance with the applicable foreign tax law. Foreign income taxes may be withheld by certain countries in which the fund invests. Additionally, capital gains realized by the fund on securities issued in or by certain foreign countries may be subject to capital gains tax imposed by those countries.
Distributions to shareholders are recorded on the ex-dividend date. Income and capital gain distributions are determined in accordance with income tax regulations, which may differ from U.S. generally accepted accounting principles. Certain capital accounts in the financial statements are periodically adjusted for permanent differences in order to reflect their tax character. These adjustments have no impact on net assets or net asset value per share. Temporary differences which arise from recognizing certain items of income, expense, gain or loss in different periods for financial statement and tax purposes will reverse at some time in the future. Distributions in excess of net investment income or net realized gains are temporary overdistributions for financial statement purposes resulting from differences in the recognition or classification of income or distributions for financial statement and tax purposes.
Book/tax differences primarily relate to wash sale loss deferrals.
The tax character of distributions declared to shareholders for the last two fiscal years is as follows:
| | | | | | | | |
| | | 12/31/14 | | | 12/31/13 | |
| Ordinary income (including any short-term capital gains) | | | $2,186,535 | | | | $2,603,020 | |
The federal tax cost and the tax basis components of distributable earnings were as follows:
| | | | |
| As of 12/31/14 | | | | |
| Cost of investments | | | $136,192,805 | |
| Gross appreciation | | | 13,778,273 | |
| Gross depreciation | | | (16,223,703 | ) |
| Net unrealized appreciation (depreciation) | | | $(2,445,430 | ) |
| Undistributed ordinary income | | | 3,111,553 | |
| Capital loss carryforwards | | | (11,849,431 | ) |
| Other temporary differences | | | (32,320 | ) |
16
MFS Research International Series
Notes to Financial Statements – continued
Under the Regulated Investment Company Modernization Act of 2010 (the “Act”), net capital losses recognized for fund fiscal years beginning after December 31, 2010 may be carried forward indefinitely, and their character is retained as short-term and/or long-term losses (“post-enactment losses”). Previously, net capital losses were carried forward for eight years and treated as short-term losses (“pre-enactment losses”). As a transition rule, the Act requires that all post-enactment net capital losses be used before pre-enactment net capital losses.
As of December 31, 2014, the fund had capital loss carryforwards available to offset future realized gains. Such pre-enactment losses expire as follows:
| | | | |
| 12/31/16 | | | $(6,660,097 | ) |
| 12/31/17 | | | (3,004,405 | ) |
| 12/31/18 | | | (2,184,929 | ) |
| Total | | | $(11,849,431 | ) |
Multiple Classes of Shares of Beneficial Interest – The fund offers multiple classes of shares, which differ in their respective distribution and/or service fees. The fund’s income, realized and unrealized gain (loss), and common expenses are allocated to shareholders based on the daily net assets of each class. Dividends are declared separately for each class. Differences in per share dividend rates are generally due to differences in separate class expenses. The fund’s distributions declared to shareholders as reported in the Statements of Changes in Net Assets are presented by class as follows:
| | | | | | | | |
| | | From net investment
income | |
| | | Year ended
12/31/14 | | | Year ended
12/31/13 | |
| Initial Class | | | $1,670,793 | | | | $1,908,607 | |
| Service Class | | | 515,742 | | | | 694,413 | |
| Total | | | $2,186,535 | | | | $2,603,020 | |
| (3) | | Transactions with Affiliates |
Investment Adviser – The fund has an investment advisory agreement with MFS to provide overall investment management and related administrative services and facilities to the fund. The management fee is computed daily and paid monthly at an annual rate of 0.90% of the fund’s average daily net assets. MFS has agreed in writing to reduce its management fee by a specified amount if certain MFS mutual fund assets exceed thresholds agreed to by MFS and the fund’s Board of Trustees. For the year ended December 31, 2014, this management fee reduction amounted to $6,507, which is included in the reduction of total expenses in the Statement of Operations. The management fee incurred for the year ended December 31, 2014 was equivalent to an annual effective rate of 0.90% of the fund’s average daily net assets.
The investment adviser has agreed in writing to pay a portion of the fund’s total annual operating expenses, excluding interest, taxes, extraordinary expenses, brokerage and transaction costs, and investment-related expenses, such that total annual operating expenses do not exceed 1.10% of average daily net assets for the Initial Class shares and 1.35% of average daily net assets for the Service Class shares. This written agreement expired on July 31, 2014. For the period January 1, 2014 through July 31, 2014, the fund’s actual operating expenses did not exceed the limit and therefore, the investment adviser did not pay any portion of the fund’s expenses related to this agreement. Effective August 1, 2014, the investment adviser has agreed in writing to pay a portion of the fund’s total annual operating expenses, excluding interest, taxes, extraordinary expenses, brokerage and transaction costs, and investment-related expenses, such that total annual operating expenses do not exceed 1.00% of average daily net assets for the Initial Class shares and 1.25% of average daily net assets for the Service Class shares. This written agreement will continue until modified by the fund’s Board of Trustees, but such agreement will continue at least until April 30, 2016. For the period August 1, 2014 through December 31, 2014, this reduction amounted to $31,275, which is included in the reduction of total expenses in the Statement of Operations.
Distributor – MFS Fund Distributors, Inc. (MFD), a wholly-owned subsidiary of MFS, is the distributor of shares of the fund. The Trustees have adopted a distribution plan for the Service Class shares pursuant to Rule 12b-1 under the Investment Company Act of 1940.
The fund’s distribution plan provides that the fund will pay MFD distribution and/or service fees equal to 0.25% per annum of its average daily net assets attributable to Service Class shares as partial consideration for services performed and expenses incurred by MFD and financial intermediaries (including participating insurance companies that invest in the fund to fund variable annuity and variable life insurance contracts, sponsors of qualified retirement and pension plans that invest in the fund, and affiliates of these participating insurance companies and plan sponsors) in connection with the sale and distribution of the Service Class shares. MFD may subsequently pay all, or a portion, of the distribution and/or service fees to financial intermediaries.
17
MFS Research International Series
Notes to Financial Statements – continued
Shareholder Servicing Agent – MFS Service Center, Inc. (MFSC), a wholly-owned subsidiary of MFS, receives a fee from the fund for its services as shareholder servicing agent. For the year ended December 31, 2014, the fee was $16,848, which equated to 0.0119% annually of the fund’s average daily net assets. MFSC also receives payment from the fund for out-of-pocket expenses paid by MFSC on behalf of the fund. For the year ended December 31, 2014, these costs amounted to $936.
Administrator – MFS provides certain financial, legal, shareholder communications, compliance, and other administrative services to the fund. Under an administrative services agreement, the fund partially reimburses MFS the costs incurred to provide these services. The fund is charged an annual fixed amount of $17,500 plus a fee based on average daily net assets. The administrative services fee incurred for the year ended December 31, 2014 was equivalent to an annual effective rate of 0.0210% of the fund’s average daily net assets.
Trustees’ and Officers’ Compensation – The fund pays compensation to independent Trustees in the form of a retainer, attendance fees, and additional compensation to Board and Committee chairpersons. The fund does not pay compensation directly to Trustees or officers of the fund who are also officers of the investment adviser, all of whom receive remuneration for their services to the fund from MFS. Certain officers and Trustees of the fund are officers or directors of MFS, MFD, and MFSC.
Other – Effective November 1, 2014, this fund and certain other funds managed by MFS (the funds) have entered into a service agreement (the ISO Agreement) which provides for payment of fees solely by the funds to Tarantino LLC in return for the provision of services of an Independent Senior Officer (ISO) for the funds. Frank L. Tarantino serves as the ISO and is an officer of the funds and the sole member of Tarantino LLC. The funds can terminate the ISO Agreement with Tarantino LLC at any time under the terms of the ISO Agreement. Prior to November 1, 2014, the funds had entered into services agreements (the Compliance Officer Agreements) which provided for payment of fees by the funds to Tarantino LLC and Griffin Compliance LLC in return for the provision of services of an Independent Chief Compliance Officer (ICCO) and Assistant ICCO, respectively, for the funds. Prior to November 1, 2014, Frank L. Tarantino served as the ICCO. Effective October 31, 2014, Mr. Tarantino resigned as ICCO and the Compliance Officer Agreement between the funds and Tarantino LLC was terminated. Prior to June 1, 2014, Robyn L. Griffin served as the Assistant ICCO and was an officer of the funds. Ms. Griffin is the sole member of Griffin Compliance LLC. Effective May 31, 2014, Ms. Griffin resigned as Assistant ICCO and the Compliance Officer Agreement between the funds and Griffin Compliance LLC was terminated. For the year ended December 31, 2014, the aggregate fees paid by the fund under these agreements were $585 and are included in “Miscellaneous” expense in the Statement of Operations. MFS had agreed to reimburse the fund for a portion of the payments made by the fund for the services under the Compliance Officer Agreements in the amount of $246, which is included in the reduction of total expenses in the Statement of Operations. Additionally, MFS has agreed to bear all expenses associated with office space, other administrative support, and supplies provided to the ICCO, Assistant ICCO, and ISO.
The fund invests in the MFS Institutional Money Market Portfolio which is managed by MFS and seeks current income consistent with preservation of capital and liquidity. Income earned on this investment is included in “Dividends from underlying affiliated funds” in the Statement of Operations. This money market fund does not pay a management fee to MFS.
For the year ended December 31, 2014, purchases and sales of investments, other than short-term obligations, aggregated $46,397,283 and $41,843,948, respectively.
| (5) | | Shares of Beneficial Interest |
The fund’s Declaration of Trust permits the Trustees to issue an unlimited number of full and fractional shares of beneficial interest. Transactions in fund shares were as follows:
| | | | | | | | | | | | | | | | |
| | | Year ended 12/31/14 | | | Year ended 12/31/13 | |
| | | Shares | | | Amount | | | Shares | | | Amount | |
| Shares sold | | | | | | | | | | | | | | | | |
Initial Class | | | 1,613,292 | | | | $23,197,348 | | | | 964,575 | | | | $12,833,840 | |
Service Class | | | 455,802 | | | | 6,405,913 | | | | 788,219 | | | | 10,439,021 | |
| | | 2,069,094 | | | | $29,603,261 | | | | 1,752,794 | | | | $23,272,861 | |
| Shares issued to shareholders in reinvestment of distributions | | | | | | | | | | | | | | | | |
Initial Class | | | 115,706 | | | | $1,670,793 | | | | 143,504 | | | | $1,908,607 | |
Service Class | | | 35,940 | | | | 515,742 | | | | 52,527 | | | | 694,413 | |
| | | 151,646 | | | | $2,186,535 | | | | 196,031 | | | | $2,603,020 | |
| Shares reacquired | | | | | | | | | | | | | | | | |
Initial Class | | | (900,819 | ) | | | $(12,753,143 | ) | | | (2,593,234 | ) | | | $(34,645,046 | ) |
Service Class | | | (945,962 | ) | | | (13,419,745 | ) | | | (847,556 | ) | | | (11,247,656 | ) |
| | | (1,846,781 | ) | | | $(26,172,888 | ) | | | (3,440,790 | ) | | | $(45,892,702 | ) |
18
MFS Research International Series
Notes to Financial Statements – continued
| | | | | | | | | | | | | | | | |
| | | Year ended 12/31/14 | | | Year ended 12/31/13 | |
| | | Shares | | | Amount | | | Shares | | | Amount | |
| Net change | | | | | | | | | | | | | | | | |
Initial Class | | | 828,179 | | | | $12,114,998 | | | | (1,485,155 | ) | | | $(19,902,599 | ) |
Service Class | | | (454,220 | ) | | | (6,498,090 | ) | | | (6,810 | ) | | | (114,222 | ) |
| | | 373,959 | | | | $5,616,908 | | | | (1,491,965 | ) | | | $(20,016,821 | ) |
The fund and certain other funds managed by MFS participate in a $1.1 billion unsecured committed line of credit, subject to a $1 billion sublimit, provided by a syndication of banks under a credit agreement. Borrowings may be made for temporary financing needs. Interest is charged to each fund, based on its borrowings, generally at a rate equal to the higher of the Federal Reserve funds rate or one month LIBOR plus an agreed upon spread. A commitment fee, based on the average daily, unused portion of the committed line of credit, is allocated among the participating funds at the end of each calendar quarter. In addition, the fund and other funds managed by MFS have established unsecured uncommitted borrowing arrangements with certain banks for temporary financing needs. Interest is charged to each fund, based on its borrowings, at a rate equal to the Federal Reserve funds rate plus an agreed upon spread. For the year ended December 31, 2014, the fund’s commitment fee and interest expense were $513 and $0, respectively, and are included in “Miscellaneous” expense in the Statement of Operations.
| (7) | | Transactions in Underlying Affiliated Funds – Affiliated Issuers |
An affiliated issuer may be considered one in which the fund owns 5% or more of the outstanding voting securities, or a company which is under common control. For the purposes of this report, the fund assumes the following to be an affiliated issuer:
| | | | | | | | | | | | | | | | |
| Underlying Affiliated Fund | | Beginning
Shares/Par
Amount | | | Acquisitions
Shares/Par
Amount | | | Dispositions
Shares/Par
Amount | | | Ending
Shares/Par
Amount | |
| MFS Institutional Money Market Portfolio | | | 1,340,796 | | | | 28,602,542 | | | | (28,130,609 | ) | | | 1,812,729 | |
| | | | |
| Underlying Affiliated Fund | | Realized
Gain (Loss) | | | Capital Gain
Distributions | | | Dividend
Income | | | Ending
Value | |
| MFS Institutional Money Market Portfolio | | | $— | | | | $— | | | | $1,131 | | | | $1,812,729 | |
On December 2, 2014, the Board of Trustees of the fund approved a proposed Agreement and Plan of Reorganization, whereby MFS Research International Series, a series of MFS Variable Insurance Trust, would be reorganized into MFS Research International Portfolio, a portfolio of MFS Variable Insurance Trust II. The Agreement and Plan of Reorganization is subject to the approval of the shareholders of the MFS Research International Series. The proposed Agreement and Plan of Reorganization provides for the transfer of the assets of the MFS Research International Series to the MFS Research International Portfolio and the assumption by the MFS Research International Portfolio of the liabilities of the MFS Research International Series in exchange solely for shares of beneficial interest in the MFS Research International Portfolio. Immediately following the transfer, the MFS Research International Portfolio shares received by the MFS Research International Series will be distributed to shareholders, pro rata, and the MFS Research International Series will be liquidated and terminated. If approved by shareholders, it is expected that the reorganization will occur on or around March 27, 2015.
19
MFS Research International Series
REPORT OF INDEPENDENT REGISTERED PUBLIC ACCOUNTING FIRM
To the Board of Trustees of MFS Variable Insurance Trust and the Shareholders of
MFS Research International Series:
We have audited the accompanying statement of assets and liabilities, including the portfolio of investments, of MFS Research International Series (one of the series of MFS Variable Insurance Trust) (the “Fund”) as of December 31, 2014, and the related statement of operations for the year then ended, the statements of changes in net assets for each of the two years in the period then ended, and the financial highlights for each of the five years in the period then ended. These financial statements and financial highlights are the responsibility of the Fund’s management. Our responsibility is to express an opinion on these financial statements and financial highlights based on our audits.
We conducted our audits in accordance with the standards of the Public Company Accounting Oversight Board (United States). Those standards require that we plan and perform the audit to obtain reasonable assurance about whether the financial statements and financial highlights are free of material misstatement. The Fund is not required to have, nor were we engaged to perform, an audit of its internal control over financial reporting. Our audits included consideration of internal control over financial reporting as a basis for designing audit procedures that are appropriate in the circumstances, but not for the purpose of expressing an opinion on the effectiveness of the Fund’s internal control over financial reporting. Accordingly, we express no such opinion. An audit also includes examining, on a test basis, evidence supporting the amounts and disclosures in the financial statements, assessing the accounting principles used and significant estimates made by management, as well as evaluating the overall financial statement presentation. Our procedures included confirmation of securities owned as of December 31, 2014, by correspondence with the custodian and brokers; where replies were not received from brokers, we performed other auditing procedures. We believe that our audits provide a reasonable basis for our opinion.
In our opinion, the financial statements and financial highlights referred to above present fairly, in all material respects, the financial position of MFS Research International Series as of December 31, 2014, the results of its operations for the year then ended, the changes in its net assets for each of the two years in the period then ended, and the financial highlights for each of the five years in the period then ended, in conformity with accounting principles generally accepted in the United States of America.
DELOITTE & TOUCHE LLP
Boston, Massachusetts
February 13, 2015
20
MFS Research International Series
TRUSTEES AND OFFICERS – IDENTIFICATION AND BACKGROUND
The Trustees and Officers of the Trust, as of February 1, 2015, are listed below, together with their principal occupations during the past five years. (Their titles may have varied during that period.) The address of each Trustee and Officer is 111 Huntington Avenue, Boston, Massachusetts 02199-7618.
| | | | | | | | |
Name, Age | | Position(s)
Held with Fund | | Trustee/Officer
Since (h) | | Principal Occupations
During the Past Five Years | | Other Directorships (j) |
| INTERESTED TRUSTEES |
Robert J. Manning (k) (age 51) | | Trustee | | February 2004 | | Massachusetts Financial Services Company, Chairman, Co-Chief Executive Officer and Director; President (until 2009); Chief Investment Officer (until 2010) | | N/A |
| | | | |
Robin A. Stelmach (k) (age 53) | | Trustee and President | | January 2014 | | Massachusetts Financial Services Company, Executive Vice President and Chief Operating Officer | | N/A |
| | | |
| INDEPENDENT TRUSTEES | | | | | | |
David H. Gunning (age 72) | | Trustee and Chair of Trustees | | January 2004 | | Private investor | | Lincoln Electric Holdings, Inc. (welding equipment manufacturer), Director; Development Alternatives, Inc. (consulting), Director/Non-Executive Chairman |
| | | | |
Steven E. Buller (age 63) | | Trustee | | February 2014 | | Chairman, Financial Accounting Standards Advisory Council; Standing Advisory Group, Public Company Accounting Oversight Board, Member (until 2014); BlackRock, Inc. (investment management), Managing Director (until 2014), BlackRock Finco UK (investment management), Director (until 2014) | | N/A |
| | | | |
Robert E. Butler (age 73) | | Trustee | | January 2006 | | Consultant – investment company industry regulatory and compliance matters | | N/A |
| | | | |
Maureen R. Goldfarb (age 59) | | Trustee | | January 2009 | | Private investor | | N/A |
| | | | |
William R. Gutow (age 73) | | Trustee | | December 1993 | | Private investor and real estate consultant; Capitol Entertainment Management Company (video franchise), Vice Chairman | | Texas Donuts (donut franchise), Vice Chairman (until 2010) |
| | | | |
Michael Hegarty (age 70) | | Trustee | | December 2004 | | Private investor | | Brookfield Office Properties, Inc. (real estate), Director; Rouse Properties Inc. (real estate), Director; Capmark Financial Group Inc. (real estate), Director |
| | | | |
John P. Kavanaugh (age 60) | | Trustee | | January 2009 | | Private investor | | N/A |
| | | | |
Maryanne L. Roepke (age 58) | | Trustee | | May 2014 | | American Century Investments (investment management), Senior Vice President and Chief Compliance Officer (until 2014) | | N/A |
| | | | |
Laurie J. Thomsen (age 57) | | Trustee | | March 2005 | | Private investor; New Profit, Inc. (venture philanthropy), Executive Partner (until 2010) | | The Travelers Companies (insurance), Director |
| | | | |
Robert W. Uek (age 73) | | Trustee | | January 2006 | | Consultant to investment company industry | | N/A |
| | | | |
| OFFICERS | | | | | | | | |
Christopher R. Bohane (k) (age 41) | | Assistant Secretary and Assistant Clerk | | July 2005 | | Massachusetts Financial Services Company, Vice President and Assistant General Counsel | | N/A |
| | | | |
Kino Clark (k) (age 46) | | Assistant Treasurer | | January 2012 | | Massachusetts Financial Services Company, Vice President | | N/A |
| | | | |
Thomas H. Connors (k) (age 55) | | Assistant Secretary and Assistant Clerk | | September 2012 | | Massachusetts Financial Services Company, Vice President and Senior Counsel; Deutsche Investment Management Americas Inc. (financial service provider), Director and Senior Counsel (until 2012) | | N/A |
21
MFS Research International Series
Trustees and Officers – continued
| | | | | | | | |
Name, Age | | Position(s)
Held with Fund | | Trustee/Officer
Since (h) | | Principal Occupations
During the Past Five Years | | Other Directorships (j) |
Ethan D. Corey (k) (age 51) | | Assistant
Secretary and Assistant Clerk | | July 2005 | | Massachusetts Financial Services Company, Senior Vice President and Associate General Counsel | | N/A |
| | | | |
David L. DiLorenzo (k) (age 46) | | Treasurer | | July 2005 | | Massachusetts Financial Services Company, Senior Vice President | | N/A |
| | | | |
Timothy M. Fagan (k) (age 46) | | Chief Compliance Officer | | November 2014 | | Massachusetts Financial Services Company, Chief Compliance Officer; Vice President and Senior Counsel (until 2012) | | N/A |
| | | | |
Brian E. Langenfeld (k) (age 41) | | Assistant
Secretary and Assistant Clerk | | June 2006 | | Massachusetts Financial Services Company, Vice President and Senior Counsel | | N/A |
| | | | |
Susan S. Newton (k) (age 64) | | Assistant
Secretary and Assistant Clerk | | May 2005 | | Massachusetts Financial Services Company, Senior Vice President and Associate General Counsel | | N/A |
| | | | |
Susan A. Pereira (k) (age 44) | | Assistant
Secretary and Assistant Clerk | | July 2005 | | Massachusetts Financial Services Company, Vice President and Senior Counsel | | N/A |
| | | | |
Kasey L. Phillips (k) (age 44) | | Assistant Treasurer | | September 2012 | | Massachusetts Financial Services Company, Vice President; Wells Fargo Funds Management, LLC, Senior Vice President, Fund Treasurer (until 2012) | | N/A |
| | | | |
Mark N. Polebaum (k) (age 62) | | Secretary and
Clerk | | January 2006 | | Massachusetts Financial Services Company, Executive Vice President, General Counsel and Secretary | | N/A |
| | | | |
Matthew A. Stowe (k) (age 40) | | Assistant Secretary and Assistant Clerk | | October 2014 | | Massachusetts Financial Services Company, Vice President and Senior Counsel | | N/A |
| | | | |
Frank L. Tarantino (age 70) | | Independent
Senior Officer | | June 2004 | | Tarantino LLC (provider of compliance services), Principal | | N/A |
| | | | |
Richard S. Weitzel (k) (age 44) | | Assistant Secretary and Assistant Clerk | | October 2007 | | Massachusetts Financial Services Company, Senior Vice President and Associate General Counsel | | N/A |
| | | | |
James O. Yost (k) (age 54) | | Deputy Treasurer | | September 1990 | | Massachusetts Financial Services Company, Senior Vice President | | N/A |
| (h) | Date first appointed to serve as Trustee/officer of an MFS Fund. Each Trustee has served continuously since appointment unless indicated otherwise. For the period from December 15, 2004 until February 22, 2005, Mr. Manning served as Advisory Trustee. Prior to January 2012, Messrs. DiLorenzo and Yost served as Assistant Treasurers of the Funds. Ms. Stelmach was appointed as President of the Funds as of October 1, 2014. |
| (j) | Directorships or trusteeships of companies required to report to the Securities and Exchange Commission (i.e., “public companies”). |
| (k) | “Interested person” of the Trust within the meaning of the Investment Company Act of 1940 (referred to as the 1940 Act), which is the principal federal law governing investment companies like the fund, as a result of a position with MFS. The address of MFS is 111 Huntington Avenue, Boston, Massachusetts 02199-7618. |
Each Trustee (except Ms. Stelmach, Mr. Buller and Ms. Roepke) has been elected by shareholders and each Trustee and officer holds office until his or her successor is chosen and qualified or until his or her earlier death, resignation, retirement or removal. The Trust does not hold annual meetings for the purpose of electing Trustees, and Trustees are not elected for fixed terms. Messrs. Butler, Kavanaugh, Uek and Mses. Thomsen and Roepke are members of the Trust’s Audit Committee.
Each of the Fund’s Trustees and officers holds comparable positions with certain other funds of which MFS or a subsidiary is the investment adviser or distributor, and, in the case of the officers, with certain affiliates of MFS. As of February 1, 2015, the Trustees served as board members of 135 funds within the MFS Family of Funds.
22
MFS Research International Series
Trustees and Officers – continued
The Statement of Additional Information for the Fund includes further information about the Trustees and is available without charge upon request by calling 1-800-225-2606.
| | |
Investment Adviser Massachusetts Financial Services Company 111 Huntington Avenue Boston, MA 02199-7618 | | Custodian State Street Bank and Trust Company 1 Lincoln Street Boston, MA 02111-2900 |
Distributor MFS Fund Distributors, Inc. 111 Huntington Avenue Boston, MA 02199-7618 | | Independent Registered Public Accounting Firm Deloitte & Touche LLP 200 Berkeley Street Boston, MA 02116 |
Portfolio Managers Jose Luis Garcia Thomas Melendez | | |
23
MFS Research International Series
BOARD REVIEW OF INVESTMENT ADVISORY AGREEMENT
The Investment Company Act of 1940 requires that both the full Board of Trustees and a majority of the non-interested (“independent”) Trustees, voting separately, annually approve the continuation of the Fund’s investment advisory agreement with MFS. The Trustees consider matters bearing on the Fund and its advisory arrangements at their meetings throughout the year, including a review of performance data at each regular meeting. In addition, the independent Trustees met several times over the course of three months beginning in May and ending in July, 2014 (“contract review meetings”) for the specific purpose of considering whether to approve the continuation of the investment advisory agreement for the Fund and the other investment companies that the Board oversees (the “MFS Funds”). The independent Trustees were assisted in their evaluation of the Fund’s investment advisory agreement by independent legal counsel, from whom they received separate legal advice and with whom they met separately from MFS during various contract review meetings. The independent Trustees were also assisted in this process by the MFS Funds’ Independent Chief Compliance Officer, a full-time senior officer appointed by and reporting to the independent Trustees.
In connection with their deliberations regarding the continuation of the investment advisory agreement, the Trustees, including the independent Trustees, considered such information and factors as they believed, in light of the legal advice furnished to them and their own business judgment, to be relevant. The investment advisory agreement for the Fund was considered separately, although the Trustees also took into account the common interests of all MFS Funds in their review. As described below, the Trustees considered the nature, quality, and extent of the various investment advisory, administrative, and shareholder services performed by MFS under the existing investment advisory agreement and other arrangements with the Fund.
In connection with their contract review meetings, the Trustees received and relied upon materials that included, among other items: (i) information provided by Lipper Inc., an independent third party, on the investment performance of the Fund for various time periods ended December 31, 2013 and the investment performance of a group of funds with substantially similar investment classifications/objectives (the “Lipper performance universe”), (ii) information provided by Lipper Inc. on the Fund’s advisory fees and other expenses and the advisory fees and other expenses of comparable funds identified by Lipper Inc. (the “Lipper expense group”), (iii) information provided by MFS on the advisory fees of comparable portfolios of other clients of MFS, including institutional separate accounts and other clients, (iv) information as to whether and to what extent applicable expense waivers, reimbursements or fee “breakpoints” are observed for the Fund, (v) information regarding MFS’ financial results and financial condition, including MFS’ and certain of its affiliates’ estimated profitability from services performed for the Fund and the MFS Funds as a whole, and compared to MFS’ institutional business, (vi) MFS’ views regarding the outlook for the mutual fund industry and the strategic business plans of MFS, (vii) descriptions of various functions performed by MFS for the Funds, such as compliance monitoring and portfolio trading practices, and (viii) information regarding the overall organization of MFS, including information about MFS’ senior management and other personnel providing investment advisory, administrative and other services to the Fund and the other MFS Funds. The comparative performance, fee and expense information prepared and provided by Lipper Inc. was not independently verified and the independent Trustees did not independently verify any information provided to them by MFS.
The Trustees’ conclusion as to the continuation of the investment advisory agreement was based on a comprehensive consideration of all information provided to the Trustees and not the result of any single factor. Some of the factors that figured particularly in the Trustees’ deliberations are described below, although individual Trustees may have evaluated the information presented differently from one another, giving different weights to various factors. It is also important to recognize that the fee arrangements for the Fund and other MFS Funds are the result of years of review and discussion between the independent Trustees and MFS, that certain aspects of such arrangements may receive greater scrutiny in some years than in others, and that the Trustees’ conclusions may be based, in part, on their consideration of these same arrangements during the course of the year and in prior years.
Based on information provided by Lipper Inc. and MFS, the Trustees reviewed the Fund’s total return investment performance as well as the performance of peer groups of funds over various time periods. The Trustees placed particular emphasis on the total return performance of the Fund’s Initial Class shares in comparison to the performance of funds in its Lipper performance universe over the three-year period ended December 31, 2013, which the Trustees believed was a long enough period to reflect differing market conditions. The total return performance of the Fund’s Initial Class shares was in the 3rd quintile relative to the other funds in the universe for this three-year period (the 1st quintile being the best performers and the 5th quintile being the worst performers). The total return performance of the Fund’s Initial Class shares was in the 5th quintile for the one-year period and the 2nd quintile for the five-year period ended December 31, 2013 relative to the Lipper performance universe. Because of the passage of time, these performance results may differ from the performance results for more recent periods, including those shown elsewhere in this report.
In the course of their deliberations, the Trustees took into account information provided by MFS in connection with the contract review meetings, including more recent performance information, as well as during investment review meetings conducted with portfolio management personnel during the course of the year regarding the Fund’s performance. After reviewing these and related factors, the Trustees concluded, within the context of their overall conclusions regarding the investment advisory agreement, that they were satisfied with MFS’ responses and efforts relating to investment performance.
24
MFS Research International Series
Board Review of Investment Advisory Agreement – continued
In assessing the reasonableness of the Fund’s advisory fee, the Trustees considered, among other information, the Fund’s advisory fee and the total expense ratio of the Fund’s Initial Class shares as a percentage of average daily net assets and the advisory fee and total expense ratios of peer groups of funds based on information provided by Lipper Inc. The Trustees considered that MFS currently observes an expense limitation for the Fund, and that MFS has agreed to further reduce such expense limitation for the Fund, which may not be changed without the Trustees’ approval. The Trustees also considered that, according to the Lipper data (which takes into account any fee reductions or expense limitations that were in effect during the Fund’s last fiscal year), the Fund’s effective advisory fee rate and total expense ratio were each higher than the Lipper expense group median.
The Trustees also considered the advisory fees charged by MFS to any comparable institutional accounts. In comparing these fees, the Trustees considered information provided by MFS as to the generally broader scope of services provided by MFS to the Fund in comparison to institutional accounts, the higher demands placed on MFS’ investment personnel and trading infrastructure as a result of the daily cash in-flows and out-flows of the Fund, and the impact on MFS and expenses associated with the more extensive regulatory regime to which the Fund is subject in comparison to institutional accounts.
The Trustees also considered whether the Fund may benefit from any economies of scale in the management of the Fund in the event of growth in assets of the Fund and/or growth in assets of the MFS Funds as a whole. They noted that the Fund’s advisory fee rate schedule is not subject to any breakpoints. Taking into account the expense limitation noted above, the Trustees determined not to recommend any advisory fee breakpoints for the Fund at this time. The Trustees also noted that MFS has agreed in writing to waive a portion of the management fees of certain MFS Funds, including the Fund, if the total combined assets of certain funds within the MFS Funds’ complex increase above agreed upon thresholds (the “group fee waiver”), enabling the Fund’s shareholders to share in the benefits from any economies of scale at the complex level. The group fee waiver is reviewed and renewed annually between the Board and MFS. The Trustees concluded that the group fee waiver was sufficient to allow the Fund to benefit from economies of scale as its assets and overall complex assets grow.
The Trustees also considered information prepared by MFS relating to MFS’ costs and profits with respect to the Fund, the MFS Funds considered as a group, and other investment companies and accounts advised by MFS, as well as MFS’ methodologies used to determine and allocate its costs to the MFS Funds, the Fund and other accounts and products for purposes of estimating profitability.
After reviewing these and other factors described herein, the Trustees concluded, within the context of their overall conclusions regarding the investment advisory agreement, that the advisory fees charged to the Fund represent reasonable compensation in light of the services being provided by MFS to the Fund.
In addition, the Trustees considered MFS’ resources and related efforts to continue to retain, attract and motivate capable personnel to serve the Fund. The Trustees also considered current and developing conditions in the financial services industry, including the presence of large and well-capitalized companies which are spending, and appear to be prepared to continue to spend, substantial sums to engage personnel and to provide services to competing investment companies. In this regard, the Trustees also considered the financial resources of MFS and its ultimate parent, Sun Life Financial Inc. The Trustees also considered the advantages and possible disadvantages to the Fund of having an adviser that also serves other investment companies as well as other accounts.
The Trustees also considered the nature, quality, cost, and extent of administrative, transfer agency, and distribution services provided to the Fund by MFS and its affiliates under agreements and plans other than the investment advisory agreement, including any 12b-1 fees the Fund pays to MFS Fund Distributors, Inc., an affiliate of MFS. The Trustees also considered the nature, extent and quality of certain other services MFS performs or arranges for on the Fund’s behalf, which may include securities lending programs, directed expense payment programs, class action recovery programs, and MFS’ interaction with third-party service providers, principally custodians and sub-custodians. The Trustees concluded that the various non-advisory services provided by MFS and its affiliates on behalf of the Fund were satisfactory.
The Trustees also considered benefits to MFS from the use of the Fund’s portfolio brokerage commissions, if applicable, to pay for investment research and various other factors. Additionally, the Trustees considered so-called “fall-out benefits” to MFS such as reputational value derived from serving as investment manager to the Fund.
Based on their evaluation of factors that they deemed to be material, including those factors described above, the Board of Trustees, including the independent Trustees, concluded that the Fund’s investment advisory agreement with MFS should be continued for an additional one-year period, commencing August 1, 2014.
25
MFS Research International Series
PROXY VOTING POLICIES AND INFORMATION
MFS votes proxies on behalf of the fund pursuant to proxy voting policies and procedures that are available without charge, upon request, by calling 1-800-225-2606, by visiting the Proxy Voting section of mfs.com or by visiting the SEC’s Web site at http://www.sec.gov.
Information regarding how the fund voted proxies relating to portfolio securities during the most recent twelve-month period ended June 30 is available without charge by visiting the Proxy Voting section of mfs.com or by visiting the SEC’s Web site at http://www.sec.gov.
QUARTERLY PORTFOLIO DISCLOSURE
The fund will file a complete schedule of portfolio holdings with the Securities and Exchange Commission (the Commission) for the first and third quarters of each fiscal year on Form N-Q. The fund’s Form N-Q is available on the EDGAR database on the Commission’s Internet Web site at http://www.sec.gov, and may be reviewed and copied at the:
Public Reference Room
Securities and Exchange Commission
100 F Street, NE, Room 1580
Washington, D.C. 20549
Information on the operation of the Public Reference Room may be obtained by calling the Commission at 1-800-SEC-0330. Copies of the fund’s Form N-Q also may be obtained, upon payment of a duplicating fee, by electronic request at the following e-mail address: publicinfo@sec.gov or by writing the Public Reference Section at the above address.
FURTHER INFORMATION
From time to time, MFS may post important information about the fund or the MFS funds on the MFS web site (mfs.com). This information is available by visiting the “Market Commentary” and “Announcements” sub sections in the “Market Outlooks” section of mfs.com or by clicking on the fund’s name under “Variable Insurance Portfolios — VIT” in the “Products” section of mfs.com.
FEDERAL TAX INFORMATION (unaudited)
The following information is provided pursuant to provisions of the Internal Revenue Code.
Income derived from foreign sources was $3,777,621. The fund intends to pass through foreign tax credits of $256,034 for the fiscal year.
26
rev. 3/11
| | | | |
| FACTS | | WHAT DOES MFS DO WITH YOUR
PERSONAL INFORMATION? | |  |
| | |
| Why? | | Financial companies choose how they share your personal information. Federal law gives consumers the right to limit some but not all sharing. Federal law also requires us to tell you how we collect, share, and protect your personal information. Please read this notice carefully to understand what we do. |
| | |
| What? | | The types of personal information we collect and share depend on the product or service you have with us. This information can include: • Social Security number and account balances • Account transactions and transaction history • Checking account information and wire transfer instructions When you are no longer our customer, we continue to share your information as described in this notice. |
| | |
| How? | | All financial companies need to share customers’ personal information to run their everyday business. In the section below, we list the reasons financial companies can share their customers’ personal information; the reasons MFS chooses to share; and whether you can limit this sharing. |
| | | | |
Reasons we can share your
personal information | | Does MFS share? | | Can you limit this
sharing? |
For our everyday business purposes – such as to process your transactions, maintain your account(s), respond to court orders and legal investigations, or report to credit bureaus | | Yes | | No |
For our marketing purposes – to offer our products and services to you | | No | | We don’t share |
| For joint marketing with other financial companies | | No | | We don’t share |
For our affiliates’ everyday business purposes – information about your transactions and experiences | | No | | We don’t share |
For our affiliates’ everyday business purposes – information about your creditworthiness | | No | | We don’t share |
| For nonaffiliates to market to you | | No | | We don’t share |
| | |
| Questions? | | Call 800-225-2606 or go to mfs.com. |
27
| | |
| Who we are |
| Who is providing this notice? | | MFS Funds, MFS Investment Management, MFS Institutional Advisors, Inc., MFS Fund Distributors, Inc., MFS Heritage Trust Company, and MFS Service Center, Inc. |
| | |
| What we do |
| How does MFS protect my personal information? | | To protect your personal information from unauthorized access and use, we use security measures that comply with federal law. These measures include procedural, electronic, and physical safeguards for the protection of the personal information we collect about you. |
How does MFS
collect my personal information? | | We collect your personal information, for example, when you • open an account or provide account information • direct us to buy securities or direct us to sell your securities • make a wire transfer We also collect your personal information from others, such as credit bureaus, affiliates and other companies. |
| Why can’t I limit all sharing? | | Federal law gives you the right to limit only • sharing for affiliates’ everyday business purposes – information about your creditworthiness • affiliates from using your information to market to you • sharing for nonaffiliates to market to you State laws and individual companies may give you additional rights to limit sharing. |
| | |
| Definitions |
| Affiliates | | Companies related by common ownership or control. They can be financial and nonfinancial companies. •MFS does not share personal information with affiliates, except for everyday business purposes as described on page one of this notice. |
| Nonaffiliates | | Companies not related by common ownership or control. They can be financial and nonfinancial companies. •MFS does not share with nonaffiliates so they can market to you. |
| Joint Marketing | | A formal agreement between nonaffiliated financial companies that together market financial products or services to you. •MFS doesn’t jointly market. |
| | |
| Other important information |
| If you own an MFS product or receive an MFS service in the name of a third party such as a bank or broker-dealer, their privacy policy may apply to you instead of ours. |
28
ANNUAL REPORT
December 31, 2014

MFS® RESEARCH SERIES
MFS® Variable Insurance Trust

VFR-ANN
MFS® RESEARCH SERIES
CONTENTS
The report is prepared for the general information of contract owners. It is authorized for distribution to prospective investors only when preceded or accompanied by a current prospectus.
NOT FDIC INSURED Ÿ MAY LOSE VALUE Ÿ NO BANK OR CREDIT UNION GUARANTEE Ÿ NOT A DEPOSIT Ÿ NOT INSURED BY ANY FEDERAL GOVERNMENT AGENCY OR NCUA/NCUSIF
MFS Research Series
LETTER FROM THE CHAIRMAN

Dear Contract Owners:
As 2015 begins, sharply lower oil prices are reshaping the global economy, adding to deflationary pressures in the eurozone and exacerbating challenges faced by oil exporters such as Russia. The U.S. economy stands on firmer ground, having expanded steadily over the past year. The U.S. labor market has regained momentum, consumer confidence is buoyant and gasoline prices have tumbled, boosting prospects for a stronger economic rebound in 2015.
Other regions are struggling. The eurozone economy is barely expanding, and the European Central Bank (ECB) has introduced large-scale asset purchases.
Despite Japan’s efforts to strengthen its economy, its sales tax increase last spring tipped the country into a recession, leading to additional monetary stimulus from the Bank of Japan. China’s economy is slowing as it transitions to a more sustainable basis, and its growth rate will likely continue to decline.
As always, active risk management is integral to how we at MFS® manage your investments. We use a collaborative process, sharing insights across asset classes, regions and economic sectors. Our global investment team uses a diversified, multidisciplined, long-term approach.
Applying proven principles, such as asset allocation and diversification, can best serve investors over the long term. We are confident that this approach can help you as you work with your financial advisors to reach your goals in the years ahead.
Respectfully,

Robert J. Manning
Chairman
MFS Investment Management
February 13, 2015
The opinions expressed in this letter are subject to change and may not be relied upon for investment advice. No forecasts can be guaranteed.
1
MFS Research Series
PORTFOLIO COMPOSITION
Portfolio structure
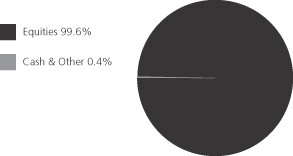
| | | | |
| Top ten holdings | | | | |
| Apple, Inc. | | | 3.1% | |
| Exxon Mobil Corp. | | | 2.5% | |
| Danaher Corp. | | | 2.1% | |
| Visa, Inc., “A” | | | 2.1% | |
| JPMorgan Chase & Co. | | �� | 1.8% | |
| Wells Fargo & Co. | | | 1.7% | |
| Google, Inc., “A” | | | 1.7% | |
| Union Pacific Corp. | | | 1.4% | |
| EMC Corp. | | | 1.4% | |
| Bank of America Corp. | | | 1.4% | |
| | | | |
| Global equity sectors | | | | |
| Technology | | | 18.2% | |
| Financial Services | | | 17.3% | |
| Capital Goods | | | 14.6% | |
| Health Care | | | 14.3% | |
| Consumer Cyclicals | | | 12.8% | |
| Energy | | | 11.1% | |
| Consumer Staples | | | 7.4% | |
| Telecommunications/Cable Television | | | 3.9% | |
Cash & Other can include cash, other assets less liabilities, offsets to derivative positions, and short-term securities.
Percentages are based on net assets as of 12/31/14.
The portfolio is actively managed and current holdings may be different.
2
MFS Research Series
MANAGEMENT REVIEW
Summary of Results
For the twelve months ended December 31, 2014, Initial Class shares of the MFS Research Series (“fund”) provided a total return of 10.20%, while Service Class shares of the fund provided a total return of 9.94%. These compare with a return of 13.69% over the same period for the fund’s benchmark, the Standard & Poor’s 500 Stock Index (S&P 500 Index).
Market Environment
Early in the period, US equities suffered what proved to be a temporary setback due to concerns over emerging markets as well as what was perceived at the time to be a pause in US economic growth, partially caused by extreme weather events and a weak December 2013 labor market report. Markets soon recovered as the economic pause concluded and investors appeared to have become increasingly comfortable that newly-installed US Federal Reserve (“Fed”) Chair Janet Yellen would not make any substantial changes to the trajectory of Fed monetary policy.
A generally risk-friendly, carry trade environment persisted from February 2014 until mid-year. While geopolitical tensions flared in the Middle East and Russia/Ukraine, any market setbacks were short-lived as improving economic growth in the US, coupled with prospects for easier monetary policy in regions with slowing growth, such as Japan, Europe and China, supported risk assets. For example, the European Central Bank (“ECB”) cut policy interest rates into negative territory and, by the end of the period, expectations were for additional rate cuts and the announcement for non-conventional easing measures. Similarly, the Bank of Japan surprised markets late in the period with fresh stimulus measures given lackluster growth trends. The related decline in developed market government bond yields and credit spreads were also supportive for equity markets. At the end of the period, the US equity market was trading close to all-time highs and US Treasury yields were close to their lows for the period. However, credit markets did not fare as well in the second half of 2014, particularly US high yield and emerging market debt. The higher weightings of oil and gas credits in these asset classes resulted in widening spreads and increased volatility as oil prices began to decline in an accelerated fashion in the fourth quarter.
Detractors from Performance
Stock selection in the energy sector was a primary factor that detracted from performance relative to the S&P 500 Index. Within this sector, the fund’s overweight positions in weak-performing energy companies Whiting Petroleum (b)(h), Cabot Oil & Gas, Noble Energy, and Halliburton hurt relative returns as oil sensitive companies suffered during the period due to a significant drop in the price of oil.
Stock selection in the financial services sector also negatively impacted relative results. However, there were no individual stocks within this sector that were among the fund’s largest relative detractors during the period.
Stock selection in the technology and consumer cyclicals sectors also dampened relative returns. Within the technology sector, the fund’s timing in the ownership of computer electronic components manufacturer Intel (h) and not holding computer and software provider Microsoft weighed on relative results as these stocks outperformed during the period. The fund’s overweight position in poor-performing internet search giant Google also hurt relative performance. The company missed analysts’ estimates for both revenue and income for the last four quarters. Also, the company continued to face headwinds from a maturing internet search market, challenges with monetizing mobile search, and regulatory anti-trust rulings in the EU. In the consumer cyclicals sector, the fund’s holdings of for-profit education company ITT Educational Services (b)(h) detracted from relative results as the stock price declined after the company announced the resignation of its CEO amid regulatory and financial challenges.
Stocks in other sectors that detracted from relative performance included the fund’s overweight positions in weak-performing aerospace and defense parts maker Precision Castparts and mining equipment manufacturer Joy Global.
Contributors to Performance
Factors that benefited relative performance included the fund’s avoidance of diversified electric company General Electric, energy company Chevron, and diversified technology products and services company International Business Machines (IBM), as all three stocks performed poorly during the period. Additionally, the fund’s overweight positions in computer products and services provider Hewlett-Packard, medical equipment manufacturer Covidien, railroad company Union Pacific, integrated specialty pharmaceutical company Actavis and women’s apparel holding company L Brands (h) boosted relative performance, as all five stocks delivered strong performance. Hewlett-Packard benefited from its enterprise services segment gaining share throughout the period and stabilization in computer sales growth allowing the firm to generate solid cash flow during the year. Shares of Covidien skyrocketed during the
3
MFS Research Series
Management Review – continued
middle of the period as the company announced that Medtronic had entered into an agreement to acquire the company at a significant premium. The fund’s holdings of strong-performing semi-conductor firm NXP Semiconductors (b) and apparel retailer Burlington Stores (b) also aided relative results.
Respectfully,
Joseph MacDougall
Portfolio Manager
| (b) | Security is not a benchmark constituent. |
| (h) | Security was not held in the fund at period end. |
The views expressed in this report are those of the portfolio manager only through the end of the period of the report as stated on the cover and do not necessarily reflect the views of MFS or any other person in the MFS organization. These views are subject to change at any time based on market or other conditions, and MFS disclaims any responsibility to update such views. These views may not be relied upon as investment advice or an indication of trading intent on behalf of any MFS portfolio. References to specific securities are not recommendations of such securities, and may not be representative of any MFS portfolio’s current or future investments.
4
MFS Research Series
PERFORMANCE SUMMARY THROUGH 12/31/14
The following chart illustrates the historical performance of the fund in comparison to its benchmark(s). Benchmarks are unmanaged and may not be invested in directly. Benchmark returns do not reflect any fees or expenses. The performance of other share classes will be greater than or less than that of the class depicted below. (See Notes to Performance Summary.)
Performance data shown represents past performance and is no guarantee of future results. Investment return and principal value fluctuate so your units, when sold, may be worth more or less than the original cost; current performance may be lower or higher than quoted. The performance shown does not reflect the deduction of taxes, if any, that a contract holder would pay on fund distributions or the redemption of contract units. The returns for the fund shown also do not reflect the deduction of expenses associated with variable products, such as mortality and expense risk charges, separate account charges, and sales charges imposed by the insurance company separate accounts. Such expenses would reduce the overall returns shown.
Growth of a Hypothetical $10,000 Investment
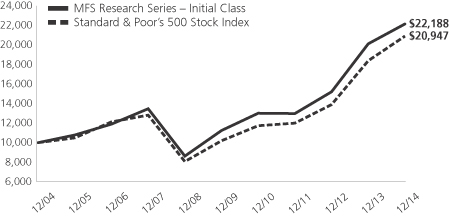
Total Returns through 12/31/14
Average annual total returns
| | | | | | | | | | | | |
| | | Share Class | | Class inception date | | 1-yr | | 5-yr | | 10-yr | | |
| | | Initial Class | | 7/26/95 | | 10.20% | | 14.55% | | 8.30% | | |
| | | Service Class | | 5/01/00 | | 9.94% | | 14.27% | | 8.03% | | |
| | | | |
| Comparative benchmark | | | | | | | | |
| | | Standard & Poor’s 500 Stock Index (f) | | 13.69% | | 15.45% | | 7.67% | | |
| (f) | Source: FactSet Research Systems Inc. |
Benchmark Definition
Standard & Poor’s 500 Stock Index – a market capitalization-weighted index of 500 widely held equity securities, designed to measure broad U.S. equity performance.
It is not possible to invest directly in an index.
Notes to Performance Summary
Average annual total return represents the average annual change in value for each share class for the periods presented.
Performance results reflect any applicable expense subsidies and waivers in effect during the periods shown. Without such subsidies and waivers the fund’s performance results would be less favorable. Please see the prospectus and financial statements for complete details. All results are historical and assume the reinvestment of any dividends and capital gains distributions.
Performance results do not include adjustments made for financial reporting purposes in accordance with U.S. generally accepted accounting principles and may differ from amounts reported in the financial highlights.
From time to time the fund may receive proceeds from litigation settlements, without which performance would be lower.
5
MFS Research Series
EXPENSE TABLE
Fund Expenses Borne by the Contract Holders During the Period,
July 1, 2014 through December 31, 2014
As a contract holder of the fund, you incur ongoing costs, including management fees; distribution and/or service (12b-1) fees; and other fund expenses. This example is intended to help you understand your ongoing costs (in dollars) of investing in the fund and to compare these costs with the ongoing costs of investing in other mutual funds.
The example is based on an investment of $1,000 invested at the beginning of the period and held for the entire period July 1, 2014 through December 31, 2014.
Actual Expenses
The first line for each share class in the following table provides information about actual account values and actual expenses. You may use the information in this line, together with the amount you invested, to estimate the expenses that you paid over the period. Simply divide your account value by $1,000 (for example, an $8,600 account value divided by $1,000 = 8.6), then multiply the result by the number in the first line under the heading entitled “Expenses Paid During Period” to estimate the expenses you paid on your account during this period.
Hypothetical Example for Comparison Purposes
The second line for each share class in the following table provides information about hypothetical account values and hypothetical expenses based on the fund’s actual expense ratio and an assumed rate of return of 5% per year before expenses, which is not the fund’s actual return. The hypothetical account values and expenses may not be used to estimate the actual ending account balance or expenses you paid for the period. You may use this information to compare the ongoing costs of investing in the fund and other funds. To do so, compare this 5% hypothetical example with the 5% hypothetical examples that appear in the shareholder reports of the other funds.
Please note that the expenses shown in the table are meant to highlight the fund’s ongoing costs only and do not take into account the fees and expenses imposed under the variable contracts through which your investment in the fund is made. Therefore, the second line for each share class in the table is useful in comparing ongoing costs associated with an investment in vehicles (such as the fund) which fund benefits under variable annuity and variable life insurance contracts and to qualified pension and retirement plans only, and will not help you determine the relative total costs of investing in the fund through variable annuity and variable life insurance contracts. If the fees and expenses imposed under the variable contracts were included, your costs would have been higher.
| | | | | | | | | | | | | | | | | | |
| Share Class | | | | Annualized
Expense Ratio | | | Beginning
Account Value
7/01/14 | | | Ending Account Value
12/31/14 | | | Expenses Paid
During Period (p)
7/01/14-12/31/14 | |
| Initial Class | | Actual | | | 0.80% | | | | $1,000.00 | | | | $1,047.70 | | | | $4.13 | |
| | Hypothetical (h) | | | 0.80% | | | | $1,000.00 | | | | $1,021.17 | | | | $4.08 | |
| Service Class | | Actual | | | 1.04% | | | | $1,000.00 | | | | $1,046.46 | | | | $5.36 | |
| | Hypothetical (h) | | | 1.04% | | | | $1,000.00 | | | | $1,019.96 | | | | $5.30 | |
| (h) | 5% class return per year before expenses. |
| (p) | “Expenses Paid During Period” are equal to each class’s annualized expense ratio, as shown above, multiplied by the average account value over the period, multiplied by 184/365 (to reflect the one-half year period). |
6
MFS Research Series
PORTFOLIO OF INVESTMENTS – 12/31/14
The Portfolio of Investments is a complete list of all securities owned by your fund. It is categorized by broad-based asset classes.
| | | | | | | | |
| Issuer | | Shares/Par | | | Value ($) | |
| | | | | | | | |
| COMMON STOCKS – 99.6% | |
| Aerospace – 3.1% | | | | | |
| Honeywell International, Inc. | | | 75,828 | | | $ | 7,576,734 | |
| Precision Castparts Corp. | | | 23,496 | | | | 5,659,716 | |
| United Technologies Corp. | | | 83,702 | | | | 9,625,728 | |
| | | | | | | | |
| | | | | | $ | 22,862,178 | |
| | | | | | | | |
| Alcoholic Beverages – 0.8% | | | | | |
| Constellation Brands, Inc., “A” (a) | | | 38,721 | | | $ | 3,801,241 | |
| Molson Coors Brewing Co. | | | 28,243 | | | | 2,104,668 | |
| | | | | | | | |
| | | | | | $ | 5,905,909 | |
| | | | | | | | |
| Apparel Manufacturers – 1.1% | | | | | |
| Global Brands Group Holding Ltd. (a) | | | 5,084,000 | | | $ | 993,745 | |
| Li & Fung Ltd. | | | 266,000 | | | | 249,033 | |
| NIKE, Inc., “B” | | | 20,662 | | | | 1,986,651 | |
| PVH Corp. | | | 37,082 | | | | 4,752,800 | |
| | | | | | | | |
| | | | | | $ | 7,982,229 | |
| | | | | | | | |
| Automotive – 1.1% | | | | | |
| Delphi Automotive PLC | | | 80,871 | | | $ | 5,880,939 | |
| Harley-Davidson, Inc. | | | 27,598 | | | | 1,818,984 | |
| | | | | | | | |
| | | | | | $ | 7,699,923 | |
| | | | | | | | |
| Biotechnology – 1.8% | | | | | |
| Alexion Pharmaceuticals, Inc. (a) | | | 33,250 | | | $ | 6,152,248 | |
| Biogen Idec, Inc. (a) | | | 21,109 | | | | 7,165,450 | |
| | | | | | | | |
| | | | | | $ | 13,317,698 | |
| | | | | | | | |
| Broadcasting – 2.6% | | | | | |
| Time Warner, Inc. | | | 80,959 | | | $ | 6,915,518 | |
| Twenty-First Century Fox, Inc. | | | 230,983 | | | | 8,870,902 | |
| Walt Disney Co. | | | 29,796 | | | | 2,806,485 | |
| | | | | | | | |
| | | | | | $ | 18,592,905 | |
| | | | | | | | |
| Brokerage & Asset Managers – 3.1% | | | | | |
| BlackRock, Inc. | | | 16,571 | | | $ | 5,925,127 | |
| Evercore Partners, Inc. | | | 66,601 | | | | 3,487,894 | |
| Franklin Resources, Inc. | | | 112,782 | | | | 6,244,739 | |
| Intercontinental Exchange, Inc. | | | 15,180 | | | | 3,328,822 | |
| NASDAQ OMX Group, Inc. | | | 68,407 | | | | 3,280,800 | |
| | | | | | | | |
| | | | | | $ | 22,267,382 | |
| | | | | | | | |
| Business Services – 2.3% | | | | | |
| Accenture PLC, “A” | | | 56,944 | | | $ | 5,085,669 | |
| Equifax, Inc. | | | 14,990 | | | | 1,212,241 | |
| Fidelity National Information Services, Inc. | | | 66,352 | | | | 4,127,094 | |
| FleetCor Technologies, Inc. (a) | | | 23,887 | | | | 3,552,236 | |
| Gartner, Inc. (a) | | | 20,011 | | | | 1,685,126 | |
| Global Payments, Inc. | | | 17,310 | | | | 1,397,436 | |
| | | | | | | | |
| | | | | | $ | 17,059,802 | |
| | | | | | | | |
| Cable TV – 2.0% | | | | | |
| Charter Communications, Inc., “A” (a) | | | 29,858 | | | $ | 4,974,940 | |
| Comcast Corp., “Special A” | | | 106,044 | | | | 6,104,423 | |
| Time Warner Cable, Inc. | | | 22,290 | | | | 3,389,417 | |
| | | | | | | | |
| | | $ | 14,468,780 | |
| | | | | | | | |
| | | | | | | | |
| Issuer | | Shares/Par | | | Value ($) | |
| | | | | | | | |
| COMMON STOCKS – continued | |
| Chemicals – 1.0% | | | | | |
| E.I. du Pont de Nemours & Co. | | | 79,097 | | | $ | 5,848,432 | |
| LyondellBasell Industries N.V., “A” | | | 14,088 | | | | 1,118,446 | |
| | | | | | | | |
| | | | | | $ | 6,966,878 | |
| | | | | | | | |
| Computer Software – 3.4% | | | | | |
| Adobe Systems, Inc. (a) | | | 50,422 | | | $ | 3,665,679 | |
| Citrix Systems, Inc. (a) | | | 61,617 | | | | 3,931,165 | |
| Oracle Corp. | | | 188,350 | | | | 8,470,100 | |
| Qlik Technologies, Inc. (a) | | | 81,285 | | | | 2,510,894 | |
| Salesforce.com, Inc. (a) | | | 102,713 | | | | 6,091,908 | |
| | | | | | | | |
| | | | | | $ | 24,669,746 | |
| | | | | | | | |
| Computer Software – Systems – 5.9% | | | | | |
| Apple, Inc. (s) | | | 204,840 | | | $ | 22,610,239 | |
| EMC Corp. | | | 338,451 | | | | 10,065,533 | |
| Hewlett-Packard Co. | | | 220,266 | | | | 8,839,275 | |
| NCR Corp. (a) | | | 46,784 | | | | 1,363,286 | |
| | | | | | | | |
| | | | | | $ | 42,878,333 | |
| | | | | | | | |
| Construction – 0.8% | | | | | |
| Sherwin-Williams Co. | | | 22,409 | | | $ | 5,894,463 | |
| | | | | | | | |
| Consumer Products – 2.8% | | | | | |
| Colgate-Palmolive Co. | | | 84,036 | | | $ | 5,814,451 | |
| Estee Lauder Cos., Inc., “A” | | | 45,653 | | | | 3,478,759 | |
| Newell Rubbermaid, Inc. | | | 130,656 | | | | 4,976,687 | |
| Procter & Gamble Co. | | | 69,993 | | | | 6,375,662 | |
| | | | | | | | |
| | | | | | $ | 20,645,559 | |
| | | | | | | | |
| Consumer Services – 0.6% | | | | | |
| Priceline Group, Inc. (a) | | | 3,990 | | | $ | 4,549,438 | |
| | | | | | | | |
| Containers – 0.7% | | | | | |
| Crown Holdings, Inc. (a) | | | 93,375 | | | $ | 4,752,788 | |
| | | | | | | | |
| Electrical Equipment – 2.8% | | | | | |
| Danaher Corp. | | | 179,592 | | | $ | 15,392,830 | |
| W.W. Grainger, Inc. | | | 20,322 | | | | 5,179,875 | |
| | | | | | | | |
| | | | | | $ | 20,572,705 | |
| | | | | | | | |
| Electronics – 1.7% | | | | | |
| Altera Corp. | | | 115,093 | | | $ | 4,251,535 | |
| Mellanox Technologies Ltd. (a) | | | 50,242 | | | | 2,146,841 | |
| Microchip Technology, Inc. | | | 72,759 | | | | 3,282,158 | |
| NXP Semiconductors N.V. (a) | | | 36,788 | | | | 2,810,603 | |
| | | | | | | | |
| | | | | | $ | 12,491,137 | |
| | | | | | | | |
| Energy – Independent – 4.1% | | | | | |
| Anadarko Petroleum Corp. | | | 68,685 | | | $ | 5,666,513 | |
| Cabot Oil & Gas Corp. | | | 117,127 | | | | 3,468,130 | |
| EOG Resources, Inc. | | | 47,285 | | | | 4,353,530 | |
| EQT Corp. | | | 31,878 | | | | 2,413,165 | |
| Marathon Petroleum Corp. | | | 41,673 | | | | 3,761,405 | |
| Memorial Resource Development Corp. (a) | | | 199,538 | | | | 3,597,670 | |
| Noble Energy, Inc. | | | 67,483 | | | | 3,200,719 | |
7
MFS Research Series
Portfolio of Investments – continued
| | | | | | | | |
| Issuer | | Shares/Par | | | Value ($) | |
| | | | | | | | |
| COMMON STOCKS – continued | |
| Energy – Independent – continued | | | | | |
| Pioneer Natural Resources Co. | | | 23,758 | | | $ | 3,536,378 | |
| | | | | | | | |
| | | | | | $ | 29,997,510 | |
| | | | | | | | |
| Energy – Integrated – 2.5% | | | | | |
| Exxon Mobil Corp. (s) | | | 198,075 | | | $ | 18,312,034 | |
| | | | | | | | |
| Engineering – Construction – 0.1% | | | | | |
| Fluor Corp. | | | 12,103 | | | $ | 733,805 | |
| | | | | | | | |
| Food & Beverages – 2.7% | | | | | |
| Coca-Cola Co. | | | 218,344 | | | $ | 9,218,484 | |
| General Mills, Inc. | | | 76,585 | | | | 4,084,278 | |
| Mondelez International, Inc. | | | 172,612 | | | | 6,270,131 | |
| | | | | | | | |
| | | $ | 19,572,893 | |
| | | | | | | | |
| Food & Drug Stores – 0.9% | | | | | |
| CVS Health Corp. | | | 65,378 | | | $ | 6,296,555 | |
| | | | | | | | |
| Gaming & Lodging – 0.4% | | | | | |
| Wynn Resorts Ltd. | | | 19,748 | | | $ | 2,937,712 | |
| | | | | | | | |
| General Merchandise – 1.4% | | | | | |
| Kohl’s Corp. | | | 73,920 | | | $ | 4,512,077 | |
| Target Corp. | | | 78,942 | | | | 5,992,487 | |
| | | | | | | | |
| | | $ | 10,504,564 | |
| | | | | | | | |
| Health Maintenance Organizations – 1.1% | | | | | |
| UnitedHealth Group, Inc. | | | 78,211 | | | $ | 7,906,350 | |
| | | | | | | | |
| Insurance – 2.5% | | | | | |
| ACE Ltd. | | | 37,213 | | | $ | 4,275,029 | |
| American International Group, Inc. | | | 105,283 | | | | 5,896,901 | |
| MetLife, Inc. | | | 144,911 | | | | 7,838,236 | |
| | | | | | | | |
| | | $ | 18,010,166 | |
| | | | | | | | |
| Internet – 4.9% | | | | | |
| eBay, Inc. (a) | | | 42,116 | | | $ | 2,363,550 | |
| Facebook, Inc., “A “ (a) | | | 102,945 | | | | 8,031,769 | |
| Google, Inc., “A” (a) | | | 23,290 | | | | 12,359,071 | |
| Google, Inc., “C” (a) | | | 13,599 | | | | 7,158,514 | |
| LinkedIn Corp., “A” (a) | | | 17,144 | | | | 3,938,148 | |
| Yelp, Inc. (a) | | | 31,192 | | | | 1,707,138 | |
| | | | | | | | |
| | | $ | 35,558,190 | |
| | | | | | | | |
| Machinery & Tools – 2.4% | | | | | |
| Eaton Corp. PLC | | | 65,557 | | | $ | 4,455,254 | |
| Joy Global, Inc. | | | 75,946 | | | | 3,533,008 | |
| Roper Industries, Inc. | | | 61,570 | | | | 9,626,470 | |
| | | | | | | | |
| | | $ | 17,614,732 | |
| | | | | | | | |
| Major Banks – 7.0% | | | | | |
| Bank of America Corp. | | | 562,239 | | | $ | 10,058,456 | |
| Goldman Sachs Group, Inc. | | | 26,589 | | | | 5,153,746 | |
| JPMorgan Chase & Co. (s) | | | 213,549 | | | | 13,363,896 | |
| Morgan Stanley | | | 122,572 | | | | 4,755,794 | |
| State Street Corp. | | | 63,363 | | | | 4,973,996 | |
| Wells Fargo & Co. | | | 229,805 | | | | 12,597,910 | |
| | | | | | | | |
| | | $ | 50,903,798 | |
| | | | | | | | |
| | | | | | | | |
| Issuer | | Shares/Par | | | Value ($) | |
| | | | | | | | |
| COMMON STOCKS – continued | |
| Medical & Health Technology & Services – 1.3% | |
| Express Scripts Holding Co. (a) | | | 56,938 | | | $ | 4,820,940 | |
| McKesson Corp. | | | 21,953 | | | | 4,557,004 | |
| | | | | | | | |
| | | $ | 9,377,944 | |
| | | | | | | | |
| Medical Equipment – 3.7% | | | | | |
| Abbott Laboratories | | | 182,802 | | | $ | 8,229,746 | |
| Covidien PLC | | | 16,579 | | | | 1,695,700 | |
| DENTSPLY International, Inc. | | | 53,252 | | | | 2,836,734 | |
| Stryker Corp. | | | 73,809 | | | | 6,962,403 | |
| Thermo Fisher Scientific, Inc. | | | 58,543 | | | | 7,334,852 | |
| | | | | | | | |
| | | $ | 27,059,435 | |
| | | | | | | | |
| Natural Gas – Distribution – 0.5% | | | | | |
| Sempra Energy | | | 33,166 | | | $ | 3,693,366 | |
| | | | | | | | |
| Natural Gas – Pipeline – 0.5% | | | | | |
| Williams Cos., Inc. | | | 80,706 | | | $ | 3,626,928 | |
| | | | | | | | |
| Oil Services – 0.9% | | | | | |
| Halliburton Co. | | | 54,335 | | | $ | 2,136,996 | |
| Schlumberger Ltd. | | | 52,998 | | | | 4,526,559 | |
| | | | | | | | |
| | | $ | 6,663,555 | |
| | | | | | | | |
| Other Banks & Diversified Financials – 4.8% | | | | | |
| American Express Co. | | | 90,316 | | | $ | 8,403,001 | |
| BB&T Corp. | | | 103,718 | | | | 4,033,593 | |
| Discover Financial Services | | | 66,120 | | | | 4,330,199 | |
| PrivateBancorp, Inc. | | | 88,888 | | | | 2,968,859 | |
| Visa, Inc., “A” | | | 58,160 | | | | 15,249,552 | |
| | | | | | | | |
| | | $ | 34,985,204 | |
| | | | | | | | |
| Pharmaceuticals – 6.4% | | | | | |
| AbbVie, Inc. | | | 118,741 | | | $ | 7,770,411 | |
| Actavis PLC (a) | | | 30,608 | | | | 7,878,805 | |
| Bristol-Myers Squibb Co. | | | 133,172 | | | | 7,861,143 | |
| Eli Lilly & Co. | | | 63,682 | | | | 4,393,421 | |
| Endo International PLC (a) | | | 54,241 | | | | 3,911,861 | |
| Merck & Co., Inc. | | | 164,368 | | | | 9,334,459 | |
| Valeant Pharmaceuticals International, Inc. (a) | | | 39,282 | | | | 5,621,647 | |
| | | | | | | | |
| | | $ | 46,771,747 | |
| | | | | | | | |
| Railroad & Shipping – 1.7% | | | | | |
| Canadian Pacific Railway Ltd. | | | 12,310 | | | $ | 2,372,014 | |
| Union Pacific Corp. | | | 85,111 | | | | 10,139,273 | |
| | | | | | | | |
| | | $ | 12,511,287 | |
| | | | | | | | |
| Restaurants – 1.4% | | | | | |
| McDonald’s Corp. | | | 39,078 | | | $ | 3,661,609 | |
| YUM! Brands, Inc. | | | 92,027 | | | | 6,704,167 | |
| | | | | | | | |
| | | $ | 10,365,776 | |
| | | | | | | | |
| Specialty Chemicals – 1.0% | | | | | |
| Albemarle Corp. | | | 55,961 | | | $ | 3,364,935 | |
| W.R. Grace & Co. (a) | | | 38,303 | | | | 3,653,723 | |
| | | | | | | | |
| | | $ | 7,018,658 | |
| | | | | | | | |
8
MFS Research Series
Portfolio of Investments – continued
| | | | | | | | |
| Issuer | | Shares/Par | | | Value ($) | |
| | | | | | | | |
| COMMON STOCKS – continued | |
| Specialty Stores – 4.4% | | | | | |
| Amazon.com, Inc. (a) | | | 11,834 | | | $ | 3,672,682 | |
| AutoZone, Inc. (a) | | | 7,645 | | | | 4,733,096 | |
| Bed Bath & Beyond, Inc. (a) | | | 51,762 | | | | 3,942,712 | |
| Burlington Stores, Inc. (a) | | | 77,418 | | | | 3,658,775 | |
| L Brands, Inc. | | | 51,904 | | | | 4,492,291 | |
| Ross Stores, Inc. | | | 42,868 | | | | 4,040,738 | |
| Sally Beauty Holdings, Inc. (a) | | | 94,188 | | | | 2,895,339 | |
| Urban Outfitters, Inc. (a) | | | 119,821 | | | | 4,209,312 | |
| | | | | | | | |
| | | $ | 31,644,945 | |
| | | | | | | | |
| Telecommunications – Wireless – 1.0% | | | | | |
| American Tower Corp., REIT | | | 53,812 | | | $ | 5,319,316 | |
| SBA Communications Corp. (a) | | | 15,534 | | | | 1,720,546 | |
| | | | | | | | |
| | | $ | 7,039,862 | |
| | | | | | | | |
| Telephone Services – 0.9% | | | | | |
| Verizon Communications, Inc. | | | 146,126 | | | $ | 6,835,774 | |
| | | | | | | | |
| Tobacco – 1.0% | | | | | |
| Philip Morris International, Inc. | | | 92,924 | | | $ | 7,568,660 | |
| | | | | | | | |
| Utilities – Electric Power – 2.5% | | | | | |
| American Electric Power Co., Inc. | | | 66,559 | | | $ | 4,041,462 | |
| CMS Energy Corp. | | | 155,227 | | | | 5,394,138 | |
| Northeast Utilities | | | 93,354 | | | | 4,996,306 | |
| NRG Energy, Inc. | | | 141,867 | | | | 3,823,316 | |
| | | | | | | | |
| | | $ | 18,255,222 | |
| | | | | | | | |
Total Common Stocks
(Identified Cost, $538,808,966) | | | $ | 725,344,525 | |
| | | | | | | | |
| | | | | | | | |
| Issuer | | Shares/Par | | | Value ($) | |
| | | | | | | | |
| MONEY MARKET FUNDS – 0.4% | | | | | |
| MFS Institutional Money Market Portfolio, 0.09%, at Cost and Net Asset Value (v) | | | 2,802,369 | | | $ | 2,802,369 | |
| | | | | | | | |
Total Investments
(Identified Cost, $541,611,335) | | | | | | $ | 728,146,894 | |
| | | | | | | | |
OTHER ASSETS, LESS
LIABILITIES – 0.0% | | | | 166,358 | |
| | | | | | | | |
| NET ASSETS – 100.0% | | | $ | 728,313,252 | |
| | | | | | | | |
| (a) | | Non-income producing security. |
| (s) | | Security or a portion of the security was pledged to cover collateral requirements for securities sold short. At December 31, 2014, the fund had no short sales outstanding. |
| (v) | | Underlying affiliated fund that is available only to investment companies managed by MFS. The rate quoted for the MFS Institutional Money Market Portfolio is the annualized seven-day yield of the fund at period end. |
At December 31, 2014, the fund had cash collateral of $15,690 and other liquid securities with an aggregate value of $589,901 to cover any commitments for securities sold short. Cash collateral is comprised of “Deposits with brokers” in the Statement of Assets and Liabilities. At December 31, 2014, the fund had no short sales outstanding.
The following abbreviations are used in this report and are defined:
| PLC | | Public Limited Company |
| REIT | | Real Estate Investment Trust |
See Notes to Financial Statements
9
MFS Research Series
FINANCIAL STATEMENTS | STATEMENT OF ASSETS AND LIABILITIES
This statement represents your fund’s balance sheet, which details the assets and liabilities comprising the total value of the fund.
| | | | | | | | |
At 12/31/14 | | | | | | | | |
Assets | | | | | | | | |
Investments – | | | | | | | | |
Non-affiliated issuers, at value (identified cost, $538,808,966) | | | $725,344,525 | | | | | |
Underlying affiliated funds, at cost and value | | | 2,802,369 | | | | | |
Total investments, at value (identified cost, $541,611,335) | | | $728,146,894 | | | | | |
Deposits with brokers | | | 15,690 | | | | | |
Receivables for | | | | | | | | |
Investments sold | | | 1,858,133 | | | | | |
Fund shares sold | | | 727,490 | | | | | |
Dividends | | | 680,658 | | | | | |
Other assets | | | 4,830 | | | | | |
Total assets | | | | | | | $731,433,695 | |
Liabilities | | | | | | | | |
Payables for | | | | | | | | |
Investments purchased | | | $1,950,808 | | | | | |
Fund shares reacquired | | | 1,030,814 | | | | | |
Payable to affiliates | | | | | | | | |
Investment adviser | | | 26,372 | | | | | |
Shareholder servicing costs | | | 391 | | | | | |
Distribution and/or service fees | | | 3,601 | | | | | |
Payable for independent Trustees’ compensation | | | 1 | | | | | |
Accrued expenses and other liabilities | | | 108,456 | | | | | |
Total liabilities | | | | | | | $3,120,443 | |
Net assets | | | | | | | $728,313,252 | |
Net assets consist of | | | | | | | | |
Paid-in capital | | | $486,876,625 | | | | | |
Unrealized appreciation (depreciation) on investments and translation of assets and liabilities in foreign currencies | | | 186,535,560 | | | | | |
Accumulated net realized gain (loss) on investments and foreign currency | | | 50,589,045 | | | | | |
Undistributed net investment income | | | 4,312,022 | | | | | |
Net assets | | | | | | | $728,313,252 | |
Shares of beneficial interest outstanding | | | | | | | 25,104,819 | |
| | | | | | | | | | | | |
| | | Net assets | | | Shares outstanding | | | Net asset value per share | |
Initial Class | | | $468,285,533 | | | | 16,087,621 | | | | $29.11 | |
Service Class | | | 260,027,719 | | | | 9,017,198 | | | | 28.84 | |
See Notes to Financial Statements
10
MFS Research Series
FINANCIAL STATEMENTS | STATEMENT OF OPERATIONS
This statement describes how much your fund earned in investment income and accrued in expenses. It also describes any gains and/or losses generated by fund operations.
| | | | | | | | |
Year ended 12/31/14 | | | | | | | | |
Net investment income | | | | | | | | |
Income | | | | | | | | |
Dividends | | | $10,943,015 | | | | | |
Interest | | | 1,793 | | | | | |
Dividends from underlying affiliated funds | | | 3,842 | | | | | |
Foreign taxes withheld | | | (1,828 | ) | | | | |
Total investment income | | | | | | | $10,946,822 | |
Expenses | | | | | | | | |
Management fee | | | $5,607,391 | | | | | |
Distribution and/or service fees | | | 667,300 | | | | | |
Shareholder servicing costs | | | 58,575 | | | | | |
Administrative services fee | | | 110,775 | | | | | |
Independent Trustees’ compensation | | | 15,912 | | | | | |
Custodian fee | | | 81,012 | | | | | |
Shareholder communications | | | 42,208 | | | | | |
Audit and tax fees | | | 54,996 | | | | | |
Legal fees | | | 6,528 | | | | | |
Miscellaneous | | | 25,671 | | | | | |
Total expenses | | | | | | | $6,670,368 | |
Fees paid indirectly | | | (6 | ) | | | | |
Reduction of expenses by investment adviser | | | (35,637 | ) | | | | |
Net expenses | | | | | | | $6,634,725 | |
Net investment income | | | | | | | $4,312,097 | |
Realized and unrealized gain (loss) on investments and foreign currency | | | | | | | | |
Realized gain (loss) (identified cost basis) | | | | | | | | |
Investments | | | $51,675,090 | | | | | |
Foreign currency | | | (75 | ) | | | | |
Net realized gain (loss) on investments and foreign currency | | | | | | | $51,675,015 | |
Change in unrealized appreciation (depreciation) | | | | | | | | |
Investments | | | $15,785,871 | | | | | |
Translation of assets and liabilities in foreign currencies | | | 1 | | | | | |
Net unrealized gain (loss) on investments and foreign currency translation | | | | | | | $15,785,872 | |
Net realized and unrealized gain (loss) on investments and foreign currency | | | | | | | $67,460,887 | |
Change in net assets from operations | | | | | | | $71,772,984 | |
See Notes to Financial Statements
11
MFS Research Series
FINANCIAL STATEMENTS | STATEMENTS OF CHANGES IN NET ASSETS
These statements describe the increases and/or decreases in net assets resulting from operations, any distributions, and any shareholder transactions.
| | | | | | | | |
For years ended 12/31 | | | 2014 | | | | 2013 | |
Change in net assets | | | | | | | | |
| From operations | | | | | | | | |
Net investment income | | | $4,312,097 | | | | $5,404,151 | |
Net realized gain (loss) on investments and foreign currency | | | 51,675,015 | | | | 72,739,040 | |
Net unrealized gain (loss) on investments and foreign currency translation | | | 15,785,872 | | | | 132,956,308 | |
Change in net assets from operations | | | $71,772,984 | | | | $211,099,499 | |
| Distributions declared to shareholders | | | | | | | | |
From net investment income | | | $(5,407,049 | ) | | | $(2,329,011 | ) |
From net realized gain on investments | | | (55,311,546 | ) | | | (1,807,468 | ) |
Total distributions declared to shareholders | | | $(60,718,595 | ) | | | $(4,136,479 | ) |
Change in net assets from fund share transactions | | | $(58,652,020 | ) | | | $(157,925,678 | ) |
Total change in net assets | | | $(47,597,631 | ) | | | $49,037,342 | |
| Net assets | | | | | | | | |
At beginning of period | | | 775,910,883 | | | | 726,873,541 | |
At end of period (including undistributed net investment income of $4,312,022 and
$5,407,761, respectively) | | | $728,313,252 | | | | $775,910,883 | |
See Notes to Financial Statements
12
MFS Research Series
FINANCIAL STATEMENTS | FINANCIAL HIGHLIGHTS
The financial highlights table is intended to help you understand the fund’s financial performance for the past 5 years. Certain information reflects financial results for a single fund share. The total returns in the table represent the rate by which an investor would have earned (or lost) on an investment in the fund share class (assuming reinvestment of all distributions) held for the entire period.
| | | | | | | | | | | | | | | | | | | | |
| Initial Class | | Years ended 12/31 | |
| | | 2014 | | | 2013 | | | 2012 | | | 2011 | | | 2010 | |
Net asset value, beginning of period | | | $28.74 | | | | $21.84 | | | | $18.78 | | | | $19.04 | | | | $16.57 | |
| Income (loss) from investment operations | | | | | | | | | | | | | | | | | | | | |
Net investment income (d) | | | $0.19 | | | | $0.20 | | | | $0.22 | | | | $0.15 | | | | $0.15 | |
Net realized and unrealized gain (loss) on investments
and foreign currency | | | 2.68 | | | | 6.84 | | | | 3.01 | | | | (0.24 | ) | | | 2.47 | |
Total from investment operations | | | $2.87 | | | | $7.04 | | | | $3.23 | | | | $(0.09 | ) | | | $2.62 | |
| Less distributions declared to shareholders | | | | | | | | | | | | | | | | | | | | |
From net investment income | | | $(0.25 | ) | | | $(0.08 | ) | | | $(0.17 | ) | | | $(0.17 | ) | | | $(0.15 | ) |
From net realized gain on investments | | | (2.25 | ) | | | (0.06 | ) | | | — | | | | — | | | | — | |
Total distributions declared to shareholders | | | $(2.50 | ) | | | $(0.14 | ) | | | $(0.17 | ) | | | $(0.17 | ) | | | $(0.15 | ) |
Net asset value, end of period (x) | | | $29.11 | | | | $28.74 | | | | $21.84 | | | | $18.78 | | | | $19.04 | |
Total return (%) (k)(r)(s)(x) | | | 10.20 | | | | 32.35 | | | | 17.22 | | | | (0.45 | ) | | | 15.90 | |
Ratios (%) (to average net assets)
and Supplemental data: | | | | | | | | | | | | | | | | | | | | |
Expenses before expense reductions (f) | | | 0.80 | | | | 0.81 | | | | 0.88 | | | | 0.88 | | | | 0.89 | |
Expenses after expense reductions (f) | | | 0.80 | | | | 0.81 | | | | 0.88 | | | | 0.88 | | | | 0.89 | |
Net investment income | | | 0.67 | | | | 0.80 | | | | 1.06 | | | | 0.79 | | | | 0.86 | |
Portfolio turnover | | | 34 | | | | 43 | | | | 83 | | | | 70 | | | | 71 | |
Net assets at end of period (000 omitted) | | | $468,286 | | | | $496,857 | | | | $460,834 | | | | $160,892 | | | | $182,895 | |
| Supplemental Ratios (%): | | | | | | | | | | | | | | | | | | | | |
Ratio of expenses to average net assets after expense reductions
excluding short sale dividend and interest expense (f) | | | N/A | | | | 0.80 | | | | 0.87 | | | | 0.86 | | | | 0.89 | |
See Notes to Financial Statements
13
MFS Research Series
Financial Highlights – continued
| | | | | | | | | | | | | | | | | | | | |
| Service Class | | Years ended 12/31 | |
| | | 2014 | | | 2013 | | | 2012 | | | 2011 | | | 2010 | |
Net asset value, beginning of period | | | $28.49 | | | | $21.70 | | | | $18.67 | | | | $18.93 | | | | $16.48 | |
| Income (loss) from investment operations | | | | | | | | | | | | | | | | | | | | |
Net investment income (d) | | | $0.12 | | | | $0.14 | | | | $0.18 | | | | $0.10 | | | | $0.10 | |
Net realized and unrealized gain (loss) on investments and foreign currency | | | 2.65 | | | | 6.78 | | | | 2.97 | | | | (0.24 | ) | | | 2.47 | |
Total from investment operations | | | $2.77 | | | | $6.92 | | | | $3.15 | | | | $(0.14 | ) | | | $2.57 | |
| Less distributions declared to shareholders | | | | | | | | | | | | | | | | | | | | |
From net investment income | | | $(0.17 | ) | | | $(0.07 | ) | | | $(0.12 | ) | | | $(0.12 | ) | | | $(0.12 | ) |
From net realized gain on investments | | | (2.25 | ) | | | (0.06 | ) | | | — | | | | — | | | | — | |
Total distributions declared to shareholders | | | $(2.42 | ) | | | $(0.13 | ) | | | $(0.12 | ) | | | $(0.12 | ) | | | $(0.12 | ) |
Net asset value, end of period (x) | | | $28.84 | | | | $28.49 | | | | $21.70 | | | | $18.67 | | | | $18.93 | |
Total return (%) (k)(r)(s)(x) | | | 9.94 | | | | 32.00 | | | | 16.90 | | | | (0.69 | ) | | | 15.64 | |
Ratios (%) (to average net assets)
and Supplemental data: | | | | | | | | | | | | | | | | | | | | |
Expenses before expense reductions (f) | | | 1.05 | | | | 1.06 | | | | 1.11 | | | | 1.13 | | | | 1.14 | |
Expenses after expense reductions (f) | | | 1.05 | | | | 1.05 | | | | 1.11 | | | | 1.13 | | | | 1.14 | |
Net investment income | | | 0.42 | | | | 0.56 | | | | 0.82 | | | | 0.55 | | | | 0.61 | |
Portfolio turnover | | | 34 | | | | 43 | | | | 83 | | | | 70 | | | | 71 | |
Net assets at end of period (000 omitted) | | | $260,028 | | | | $279,054 | | | | $266,040 | | | | $20,015 | | | | $19,825 | |
| Supplemental Ratios (%): | | | | | | | | | | | | | | | | | | | | |
Ratio of expenses to average net assets after expense reductions
excluding short sale dividend and interest expense (f) | | | N/A | | | | 1.05 | | | | 1.11 | | | | 1.11 | | | | 1.14 | |
| (d) | Per share data is based on average shares outstanding. |
| (f) | Ratios do not reflect reductions from fees paid indirectly, if applicable. |
| (k) | The total return does not reflect expenses that apply to separate accounts. Inclusion of these charges would reduce the total return figures for all periods shown. |
| (r) | Certain expenses have been reduced without which performance would have been lower. |
| (s) | From time to time the fund may receive proceeds from litigation settlements, without which performance would be lower. Excluding the effect of the proceeds received from a non-recurring litigation settlement against Tyco International Ltd., the Initial Class and Service Class total returns for the year ended December 31, 2010 would have each been lower by approximately 0.60%. |
| (x) | The net asset values per share and total returns have been calculated on net assets which include adjustments made in accordance with U.S. generally accepted accounting principles required at period end for financial reporting purposes. |
See Notes to Financial Statements
14
MFS Research Series
NOTES TO FINANCIAL STATEMENTS
| (1) | | Business and Organization |
MFS Research Series (the fund) is a diversified series of MFS Variable Insurance Trust (the trust). The trust is organized as a Massachusetts business trust and is registered under the Investment Company Act of 1940, as amended, as an open-end management investment company. The shareholders of each series of the trust are separate accounts of insurance companies, which offer variable annuity and/or life insurance products, and qualified retirement and pension plans.
The fund is an investment company and accordingly follows the investment company accounting and reporting guidance of the Financial Accounting Standards Board (FASB) Accounting Standards Codification Topic 946 Financial Services – Investment Companies.
| (2) | | Significant Accounting Policies |
General – The preparation of financial statements in conformity with U.S. generally accepted accounting principles requires management to make estimates and assumptions that affect the reported amounts of assets and liabilities, and disclosure of contingent assets and liabilities at the date of the financial statements and the reported amounts of increases and decreases in net assets from operations during the reporting period. Actual results could differ from those estimates. In the preparation of these financial statements, management has evaluated subsequent events occurring after the date of the fund’s Statement of Assets and Liabilities through the date that the financial statements were issued.
In June 2014, FASB issued Accounting Standards Update 2014-11, Transfers and Servicing (Topic 860) – Repurchase-to-Maturity Transactions, Repurchase Financings, and Disclosures (“ASU 2014-11”). ASU 2014-11 changes the accounting for repurchase-to-maturity transactions (i.e., repurchase agreements that settle at the same time as the maturity of the transferred financial asset) and enhances the required disclosures for repurchase agreements and other similar transactions. Although still evaluating the potential impacts of ASU 2014-11 to the fund, management expects that the impact of the fund’s adoption will be limited to additional financial statement disclosures which would first be effective for interim reporting periods beginning after March 15, 2015.
Balance Sheet Offsetting – The fund’s accounting policy with respect to balance sheet offsetting is that, absent an event of default by the counterparty or a termination of the agreement, the International Swaps and Derivatives Association (ISDA) Master Agreement does not result in an offset of reported amounts of financial assets and financial liabilities in the Statement of Assets and Liabilities across transactions between the fund and the applicable counterparty. The fund’s right to setoff may be restricted or prohibited by the bankruptcy or insolvency laws of the particular jurisdiction to which a specific master netting agreement counterparty is subject. Balance sheet offsetting disclosures, to the extent applicable to the fund, have been included in the fund’s Significant Accounting Policies note under the captions for each of the fund’s in-scope financial instruments and transactions.
Investment Valuations – Equity securities, including restricted equity securities, are generally valued at the last sale or official closing price as provided by a third-party pricing service on the market or exchange on which they are primarily traded. Equity securities, for which there were no sales reported that day, are generally valued at the last quoted daily bid quotation as provided by a third-party pricing service on the market or exchange on which such securities are primarily traded. Short-term instruments with a maturity at issuance of 60 days or less may be valued at amortized cost, which approximates market value. Exchange-traded options are generally valued at the last sale or official closing price as provided by a third-party pricing service on the exchange on which such options are primarily traded. Exchange-traded options for which there were no sales reported that day are generally valued at the last daily bid quotation as provided by a third-party pricing service on the exchange on which such options are primarily traded. Options not traded on an exchange are generally valued at a broker/dealer bid quotation. Foreign currency options are generally valued at valuations provided by a third-party pricing service. Open-end investment companies are generally valued at net asset value per share. Securities and other assets generally valued on the basis of information from a third-party pricing service may also be valued at a broker/dealer bid quotation. Values obtained from third-party pricing services can utilize both transaction data and market information such as yield, quality, coupon rate, maturity, type of issue, trading characteristics, and other market data. The values of foreign securities and other assets and liabilities expressed in foreign currencies are converted to U.S. dollars using the mean of bid and asked prices for rates provided by a third-party pricing service.
The Board of Trustees has delegated primary responsibility for determining or causing to be determined the value of the fund’s investments (including any fair valuation) to the adviser pursuant to valuation policies and procedures approved by the Board. If the adviser determines that reliable market quotations are not readily available, investments are valued at fair value as determined in good faith by the adviser in accordance with such procedures under the oversight of the Board of Trustees. Under the fund’s valuation policies and procedures, market quotations are not considered to be readily available for most types of debt instruments and floating rate loans and many types of derivatives. These investments are generally valued at fair value based on information from third-party pricing services. In addition, investments may be valued at fair value if the adviser determines that an investment’s value has been materially affected by events occurring after the close of the exchange or market on which the investment is principally traded (such as foreign exchange or market) and prior to the determination of the fund’s net asset value, or after the halting of trading of a specific security where trading does not resume prior to the close of the exchange or market on which the security is
15
MFS Research Series
Notes to Financial Statements – continued
principally traded. Events that occur on a frequent basis after foreign markets close (such as developments in foreign markets and significant movements in the U.S. markets) and prior to the determination of the fund’s net asset value may be deemed to have a material effect on the value of securities traded in foreign markets. Accordingly, the fund’s foreign equity securities may often be valued at fair value. The adviser generally relies on third-party pricing services or other information (such as the correlation with price movements of similar securities in the same or other markets; the type, cost and investment characteristics of the security; the business and financial condition of the issuer; and trading and other market data) to assist in determining whether to fair value and at what value to fair value an investment. The value of an investment for purposes of calculating the fund’s net asset value can differ depending on the source and method used to determine value. When fair valuation is used, the value of an investment used to determine the fund’s net asset value may differ from quoted or published prices for the same investment. There can be no assurance that the fund could obtain the fair value assigned to an investment if it were to sell the investment at the same time at which the fund determines its net asset value per share.
Various inputs are used in determining the value of the fund’s assets or liabilities. These inputs are categorized into three broad levels. In certain cases, the inputs used to measure fair value may fall into different levels of the fair value hierarchy. In such cases, an investment’s level within the fair value hierarchy is based on the lowest level of input that is significant to the fair value measurement. The fund’s assessment of the significance of a particular input to the fair value measurement in its entirety requires judgment, and considers factors specific to the investment. Level 1 includes unadjusted quoted prices in active markets for identical assets or liabilities. Level 2 includes other significant observable market-based inputs (including quoted prices for similar securities, interest rates, prepayment speed, and credit risk). Level 3 includes unobservable inputs, which may include the adviser’s own assumptions in determining the fair value of investments. The following is a summary of the levels used as of December 31, 2014 in valuing the fund’s assets or liabilities:
| | | | | | | | | | | | | | | | |
| Investments at Value | | Level 1 | | | Level 2 | | | Level 3 | | | Total | |
| Equity Securities: | | | | | | | | | | | | | | | | |
United States | | | $713,297,483 | | | | $— | | | | $— | | | | $713,297,483 | |
Canada | | | 7,993,661 | | | | — | | | | — | | | | 7,993,661 | |
Netherlands | | | 2,810,603 | | | | — | | | | — | | | | 2,810,603 | |
Hong Kong | | | 249,033 | | | | 993,745 | | | | — | | | | 1,242,778 | |
| Mutual Funds | | | 2,802,369 | | | | — | | | | — | | | | 2,802,369 | |
| Total Investments | | | $727,153,149 | | | | $993,745 | | | | $— | | | | $728,146,894 | |
For further information regarding security characteristics, see the Portfolio of Investments.
Of the level 1 investments presented above, equity investments amounting to $249,033 would have been considered level 2 investments at the beginning of the period. The primary reason for changes in the classifications between levels 1 and 2 occurs when foreign equity securities are fair valued using other observable market-based inputs in place of the closing exchange price due to events occurring after the close of the exchange or market on which the investment is principally traded. The fund’s foreign equity securities may often be valued at fair value. The fund’s policy is to recognize transfers between the levels as of the end of the period.
Foreign Currency Translation – Purchases and sales of foreign investments, income, and expenses are converted into U.S. dollars based upon currency exchange rates prevailing on the respective dates of such transactions or on the reporting date for foreign denominated receivables and payables. Gains and losses attributable to foreign currency exchange rates on sales of securities are recorded for financial statement purposes as net realized gains and losses on investments. Gains and losses attributable to foreign exchange rate movements on receivables, payables, income and expenses are recorded for financial statement purposes as foreign currency transaction gains and losses. That portion of both realized and unrealized gains and losses on investments that results from fluctuations in foreign currency exchange rates is not separately disclosed.
Derivatives – The fund uses derivatives for different purposes, primarily to increase or decrease exposure to a particular market or segment of the market, or security, to increase or decrease interest rate or currency exposure, or as alternatives to direct investments. Derivatives are used for hedging or non-hedging purposes. While hedging can reduce or eliminate losses, it can also reduce or eliminate gains. When the fund uses derivatives as an investment to increase market exposure, or for hedging purposes, gains and losses from derivative instruments may be substantially greater than the derivative’s original cost.
The derivative instruments used by the fund were purchased options. At December 31, 2014, the fund did not have any outstanding derivative instruments.
The following table presents, by major type of derivative contract, the realized gain (loss) on derivatives held by the fund for the year ended December 31, 2014 as reported in the Statement of Operations:
| | | | |
| Risk | | Investments
(Purchased Options) | |
| Equity | | | $(4,319 | ) |
16
MFS Research Series
Notes to Financial Statements – continued
Derivative counterparty credit risk is managed through formal evaluation of the creditworthiness of all potential counterparties. On certain, but not all, over-the-counter derivatives, the fund attempts to reduce its exposure to counterparty credit risk whenever possible by entering into an ISDA Master Agreement on a bilateral basis with each of the counterparties with whom it undertakes a significant volume of transactions. The ISDA Master Agreement gives each party to the agreement the right to terminate all transactions traded under such agreement if there is a certain deterioration in the credit quality of the other party. Upon an event of default or a termination of the ISDA Master Agreement, the non-defaulting party has the right to close out all transactions traded under such agreement and to net amounts owed under each transaction to one net amount payable by one party to the other. This right to close out and net payments across all transactions traded under the ISDA Master Agreement could result in a reduction of the fund’s credit risk to such counterparty equal to any amounts payable by the fund under the applicable transactions, if any. The fund’s right to setoff may be restricted or prohibited by the bankruptcy or insolvency laws of the particular jurisdiction to which a specific ISDA counterparty is subject.
Collateral and margin requirements differ by type of derivative. Margin requirements are set by the broker or clearing house for cleared derivatives (i.e., futures contracts, cleared swaps, and exchange-traded options) while collateral terms are contract specific for over-the-counter traded derivatives (i.e., forward foreign currency exchange contracts, uncleared swap agreements, and over-the-counter options). For derivatives traded under an ISDA Master Agreement, the collateral requirements are netted across all transactions traded under such agreement and one amount is posted from one party to the other to collateralize such obligations. Cash that has been segregated to cover the fund’s collateral or margin obligations under derivative contracts, if any, will be reported separately in the Statement of Assets and Liabilities as “Restricted cash” or “Deposits with brokers.” Securities pledged as collateral or margin for the same purpose, if any, are noted in the Portfolio of Investments.
Purchased Options – The fund purchased put options for a premium. Purchased put options entitle the holder to sell a specified number of shares or units of a particular security, currency or index at a specified price at a specified date or within a specified period of time. Purchasing put options may hedge against an anticipated decline in the value of portfolio securities or currency or decrease the fund’s exposure to an underlying instrument.
The premium paid is initially recorded as an investment in the Statement of Assets and Liabilities. That investment is subsequently marked-to-market daily with the difference between the premium paid and the market value of the purchased option being recorded as unrealized appreciation or depreciation. Premiums paid for purchased put options which have expired are treated as realized losses on investments in the Statement of Operations. Upon the exercise or closing of a purchased put option, the premium paid is offset against the proceeds on the sale of the underlying security or financial instrument in order to determine the realized gain or loss on investments.
Whether or not the option is exercised, the fund’s maximum risk of loss from purchasing an option is the amount of premium paid. All option contracts involve credit risk if the counterparty to the option contract fails to perform. For over-the-counter options, this risk is mitigated in cases where there is an ISDA Master Agreement between the fund and the counterparty providing for netting as described above and for posting of collateral by the counterparty to the fund to cover the fund’s exposure to the counterparty under such ISDA Master Agreement.
Short Sales – The fund may enter into short sales whereby it sells a security it does not own in anticipation of a decline in the value of that security. The fund will realize a gain if the security price decreases and a loss if the security price increases between the date of the short sale and the date on which the fund replaces the borrowed security. Losses from short sales can exceed the proceeds of the security sold; and they can also exceed the potential loss from an ordinary buy and sell transaction. The amount of any premium, dividends, or interest the fund may be required to pay in connection with a short sale will be recognized as a fund expense. The fund segregates cash or marketable securities in an amount that, when combined with the amount of proceeds from the short sale deposited with the broker, at least equals the current market value of the security sold short. At December 31, 2014, the fund had no short sales outstanding.
Security Loans – Under its Securities Lending Agency Agreement with the fund, State Street Bank and Trust Company (“State Street”), as lending agent, loans the securities of the fund to certain qualified institutions (the “Borrowers”) approved by the fund. The loans are collateralized by cash and/or U.S. Treasury and federal agency obligations in an amount typically at least equal to the market value of the securities loaned. On loans collateralized by cash, the cash collateral is invested in a money market fund. The market value of the loaned securities is determined at the close of business of the fund and any additional required collateral is delivered to the fund on the next business day. State Street provides the fund with indemnification against Borrower default. In the event of Borrower default, State Street will for the benefit of the fund either purchase securities identical to those loaned or, when such purchase is commercially impracticable, pay the fund the market value of the loaned securities. In return, State Street assumes the fund’s rights to the related collateral. If the collateral value is less than the cost to purchase identical securities, State Street is responsible for the shortfall, but only to the extent that such shortfall is not due to a decline in collateral value resulting from collateral reinvestment for which the fund bears the risk of loss. A portion of the income generated upon investment of the collateral is remitted to the Borrowers, and the remainder is allocated between the fund and the lending agent. On loans collateralized by
17
MFS Research Series
Notes to Financial Statements – continued
U.S. Treasury and/or federal agency obligations, a fee is received from the Borrower, and is allocated between the fund and the lending agent. Income from securities lending is included in “Interest” income in the Statement of Operations. The dividend and interest income earned on the securities loaned is accounted for in the same manner as other dividend and interest income. At December 31, 2014, there were no securities on loan or collateral outstanding.
Indemnifications – Under the fund’s organizational documents, its officers and Trustees may be indemnified against certain liabilities and expenses arising out of the performance of their duties to the fund. Additionally, in the normal course of business, the fund enters into agreements with service providers that may contain indemnification clauses. The fund’s maximum exposure under these agreements is unknown as this would involve future claims that may be made against the fund that have not yet occurred.
Investment Transactions and Income – Investment transactions are recorded on the trade date. Interest income is recorded on the accrual basis. Dividends received in cash are recorded on the ex-dividend date. Certain dividends from foreign securities will be recorded when the fund is informed of the dividend if such information is obtained subsequent to the ex-dividend date. Dividend and interest payments received in additional securities are recorded on the ex-dividend or ex-interest date in an amount equal to the value of the security on such date.
The fund may receive proceeds from litigation settlements. Any proceeds received from litigation involving portfolio holdings are reflected in the Statement of Operations in realized gain/loss if the security has been disposed of by the fund or in unrealized gain/loss if the security is still held by the fund. Any other proceeds from litigation not related to portfolio holdings are reflected as other income in the Statement of Operations.
Fees Paid Indirectly – The fund’s custody fee may be reduced according to an arrangement that measures the value of cash deposited with the custodian by the fund. This amount, for the year ended December 31, 2014, is shown as a reduction of total expenses in the Statement of Operations.
Tax Matters and Distributions – The fund intends to qualify as a regulated investment company, as defined under Subchapter M of the Internal Revenue Code, and to distribute all of its taxable income, including realized capital gains. As a result, no provision for federal income tax is required. The fund’s federal tax returns, when filed, will remain subject to examination by the Internal Revenue Service for a three year period. Management has analyzed the fund’s tax positions taken on federal and state tax returns for all open tax years and does not believe that there are any uncertain tax positions that require recognition of a tax liability. Foreign taxes, if any, have been accrued by the fund in the accompanying financial statements in accordance with the applicable foreign tax law. Foreign income taxes may be withheld by certain countries in which the fund invests. Additionally, capital gains realized by the fund on securities issued in or by certain foreign countries may be subject to capital gains tax imposed by those countries.
Distributions to shareholders are recorded on the ex-dividend date. Income and capital gain distributions are determined in accordance with income tax regulations, which may differ from U.S. generally accepted accounting principles. Certain capital accounts in the financial statements are periodically adjusted for permanent differences in order to reflect their tax character. These adjustments have no impact on net assets or net asset value per share. Temporary differences which arise from recognizing certain items of income, expense, gain or loss in different periods for financial statement and tax purposes will reverse at some time in the future. Distributions in excess of net investment income or net realized gains are temporary overdistributions for financial statement purposes resulting from differences in the recognition or classification of income or distributions for financial statement and tax purposes.
Book/tax differences primarily relate to wash sale loss deferrals
The tax character of distributions declared to shareholders for the last two fiscal years is as follows:
| | | | | | | | |
| | | 12/31/14 | | | 12/31/13 | |
| Ordinary income (including any short-term capital gains) | | | $33,841,423 | | | | $2,782,538 | |
| Long-term capital gains | | | 26,877,172 | | | | 1,353,941 | |
| Total distributions | | | $60,718,595 | | | | $4,136,479 | |
The federal tax cost and the tax basis components of distributable earnings were as follows:
| | | | |
As of 12/31/14 | | | | |
| Cost of investments | | | $542,321,541 | |
| Gross appreciation | | | 189,449,006 | |
| Gross depreciation | | | (3,623,653 | ) |
| Net unrealized appreciation (depreciation) | | | $185,825,353 | |
| Undistributed ordinary income | | | 10,615,708 | |
| Undistributed long-term capital gain | | | 45,067,125 | |
| Other temporary differences | | | (71,559 | ) |
18
MFS Research Series
Notes to Financial Statements – continued
Multiple Classes of Shares of Beneficial Interest – The fund offers multiple classes of shares, which differ in their respective distribution and/or service fees. The fund’s income, realized and unrealized gain (loss), and common expenses are allocated to shareholders based on the daily net assets of each class. Dividends are declared separately for each class. Differences in per share dividend rates are generally due to differences in separate class expenses. The fund’s distributions declared to shareholders as reported in the Statements of Changes in Net Assets are presented by class as follows:
| | | | | | | | | | | | | | | | |
| | | From net investment
income | | | From net realized gain on
investments | |
| | | Year ended
12/31/14 | | | Year ended
12/31/13 | | | Year ended
12/31/14 | | | Year ended
12/31/13 | |
| Initial Class | | | $3,892,093 | | | | $1,533,253 | | | | $35,317,366 | | | | $1,142,549 | |
| Service Class | | | 1,514,956 | | | | 795,758 | | | | 19,994,180 | | | | 664,919 | |
| Total | | | $5,407,049 | | | | $2,329,011 | | | | $55,311,546 | | | | $1,807,468 | |
| (3) | | Transactions with Affiliates |
Investment Adviser – The fund has an investment advisory agreement with MFS to provide overall investment management and related administrative services and facilities to the fund. The management fee is computed daily and paid monthly at the following annual rates:
| | | | |
| First $1 billion of average daily net assets | | | 0.75% | |
| Average daily net assets in excess of $1 billion | | | 0.65% | |
MFS has agreed in writing to reduce its management fee by a specified amount if certain MFS mutual fund assets exceed thresholds agreed to by MFS and the fund’s Board of Trustees. For the year ended December 31, 2014, this management fee reduction amounted to $34,332, which is included in the reduction of total expenses in the Statement of Operations. The management fee incurred for the year ended December 31, 2014 was equivalent to an annual effective rate of 0.75% of the fund’s average daily net assets.
Distributor – MFS Fund Distributors, Inc. (MFD), a wholly-owned subsidiary of MFS, is the distributor of shares of the fund. The Trustees have adopted a distribution plan for the Service Class shares pursuant to Rule 12b-1 under the Investment Company Act of 1940.
The fund’s distribution plan provides that the fund will pay MFD distribution and/or service fees equal to 0.25% per annum of its average daily net assets attributable to Service Class shares as partial consideration for services performed and expenses incurred by MFD and financial intermediaries (including participating insurance companies that invest in the fund to fund variable annuity and variable life insurance contracts, sponsors of qualified retirement and pension plans that invest in the fund, and affiliates of these participating insurance companies and plan sponsors) in connection with the sale and distribution of the Service Class shares. MFD may subsequently pay all, or a portion, of the distribution and/or service fees to financial intermediaries.
Shareholder Servicing Agent – MFS Service Center, Inc. (MFSC), a wholly-owned subsidiary of MFS, receives a fee from the fund for its services as shareholder servicing agent. For the year ended December 31, 2014, the fee was $57,149, which equated to 0.0076% annually of the fund’s average daily net assets. MFSC also receives payment from the fund for out-of-pocket expenses paid by MFSC on behalf of the fund. For the year ended December 31, 2014, these costs amounted to $1,426.
Administrator – MFS provides certain financial, legal, shareholder communications, compliance, and other administrative services to the fund. Under an administrative services agreement, the fund partially reimburses MFS the costs incurred to provide these services. The fund is charged an annual fixed amount of $17,500 plus a fee based on average daily net assets. The administrative services fee incurred for the year ended December 31, 2014 was equivalent to an annual effective rate of 0.0148% of the fund’s average daily net assets.
Trustees’ and Officers’ Compensation – The fund pays compensation to independent Trustees in the form of a retainer, attendance fees, and additional compensation to Board and Committee chairpersons. The fund does not pay compensation directly to Trustees or officers of the fund who are also officers of the investment adviser, all of whom receive remuneration for their services to the fund from MFS. Certain officers and Trustees of the fund are officers or directors of MFS, MFD, and MFSC.
Other – Effective November 1, 2014, this fund and certain other funds managed by MFS (the funds) have entered into a service agreement (the ISO Agreement) which provides for payment of fees solely by the funds to Tarantino LLC in return for the provision of services of an Independent Senior Officer (ISO) for the funds. Frank L. Tarantino serves as the ISO and is an officer of the funds and the sole member of Tarantino LLC. The funds can terminate the ISO Agreement with Tarantino LLC at any time under the terms of the ISO Agreement. Prior to November 1, 2014, the funds had entered into services agreements (the Compliance Officer Agreements) which provided for payment of fees by the funds to Tarantino LLC and Griffin Compliance LLC in return for the provision of services of an Independent Chief Compliance Officer (ICCO) and Assistant ICCO, respectively, for the funds. Prior to November 1, 2014, Frank L. Tarantino served as the ICCO. Effective October 31, 2014, Mr. Tarantino resigned as ICCO and the
19
MFS Research Series
Notes to Financial Statements – continued
Compliance Officer Agreement between the funds and Tarantino LLC was terminated. Prior to June 1, 2014, Robyn L. Griffin served as the Assistant ICCO and was an officer of the funds. Ms. Griffin is the sole member of Griffin Compliance LLC. Effective May 31, 2014, Ms. Griffin resigned as Assistant ICCO and the Compliance Officer Agreement between the funds and Griffin Compliance LLC was terminated. For the year ended December 31, 2014, the aggregate fees paid by the fund under these agreements were $3,888 and are included in “Miscellaneous” expense in the Statement of Operations. MFS had agreed to reimburse the fund for a portion of the payments made by the fund for the services under the Compliance Officer Agreements in the amount of $1,305, which is included in the reduction of total expenses in the Statement of Operations. Additionally, MFS has agreed to bear all expenses associated with office space, other administrative support, and supplies provided to the ICCO, Assistant ICCO, and ISO.
The fund invests in the MFS Institutional Money Market Portfolio which is managed by MFS and seeks current income consistent with preservation of capital and liquidity. Income earned on this investment is included in “Dividends from underlying affiliated funds” in the Statement of Operations. This money market fund does not pay a management fee to MFS.
For the year ended December 31, 2014, purchases and sales of investments, other than purchased option transactions and short-term obligations, aggregated $253,906,604 and $366,157,371, respectively.
| (5) | | Shares of Beneficial Interest |
The fund’s Declaration of Trust permits the Trustees to issue an unlimited number of full and fractional shares of beneficial interest. Transactions in fund shares were as follows:
| | | | | | | | | | | | | | | | |
| | | Year ended 12/31/14 | | | Year ended 12/31/13 | |
| | | Shares | | | Amount | | | Shares | | | Amount | |
| Shares sold | | | | | | | | | | | | | | | | |
Initial Class | | | 543,408 | | | | $15,577,721 | | | | 831,878 | | | | $20,972,321 | |
Service Class | | | 422,906 | | | | 12,106,891 | | | | 518,954 | | | | 12,972,521 | |
| | | 966,314 | | | | $27,684,612 | | | | 1,350,832 | | | | $33,944,842 | |
| Shares issued to shareholders in reinvestment of distributions | | | | | | | | | | | | | | | | |
Initial Class | | | 1,381,587 | | | | $39,209,459 | | | | 104,279 | | | | $2,675,802 | |
Service Class | | | 764,362 | | | | 21,509,136 | | | | 57,371 | | | | 1,460,677 | |
| | | 2,145,949 | | | | $60,718,595 | | | | 161,650 | | | | $4,136,479 | |
| Shares reacquired | | | | | | | | | | | | | | | | |
Initial Class | | | (3,124,409 | ) | | | $(90,997,198 | ) | | | (4,745,222 | ) | | | $(119,670,066 | ) |
Service Class | | | (1,964,146 | ) | | | (56,058,029 | ) | | | (3,040,947 | ) | | | (76,336,933 | ) |
| | | (5,088,555 | ) | | | $(147,055,227 | ) | | | (7,786,169 | ) | | | $(196,006,999 | ) |
| Net change | | | | | | | | | | | | | | | | |
Initial Class | | | (1,199,414 | ) | | | $(36,210,018 | ) | | | (3,809,065 | ) | | | $(96,021,943 | ) |
Service Class | | | (776,878 | ) | | | (22,442,002 | ) | | | (2,464,622 | ) | | | (61,903,735 | ) |
| | | (1,976,292 | ) | | | $(58,652,020 | ) | | | (6,273,687 | ) | | | $(157,925,678 | ) |
The fund is one of several mutual funds in which certain MFS funds may invest. The MFS funds do not invest in the underlying funds for the purpose of exercising management or control. At the end of the period, the MFS Moderate Allocation Portfolio, the MFS Growth Allocation Portfolio, and the MFS Conservative Allocation Portfolio were the owners of record of approximately 23%, 7%, and 7%, respectively, of the value of outstanding voting shares of the fund.
The fund and certain other funds managed by MFS participate in a $1.1 billion unsecured committed line of credit, subject to a $1 billion sublimit, provided by a syndication of banks under a credit agreement. Borrowings may be made for temporary financing needs. Interest is charged to each fund, based on its borrowings, generally at a rate equal to the higher of the Federal Reserve funds rate or one month LIBOR plus an agreed upon spread. A commitment fee, based on the average daily, unused portion of the committed line of credit, is allocated among the participating funds at the end of each calendar quarter. In addition, the fund and other funds managed by MFS have established unsecured uncommitted borrowing arrangements with certain banks for temporary financing needs. Interest is charged to each fund, based on its borrowings, at a rate equal to the Federal Reserve funds rate plus an agreed upon spread. For the year ended December 31, 2014, the fund’s commitment fee and interest expense were $2,730 and $0, respectively, and are included in “Miscellaneous” expense in the Statement of Operations.
20
MFS Research Series
Notes to Financial Statements – continued
| (7) | | Transactions in Underlying Affiliated Funds – Affiliated Issuers |
An affiliated issuer may be considered one in which the fund owns 5% or more of the outstanding voting securities, or a company which is under common control. For the purposes of this report, the fund assumes the following to be an affiliated issuer:
| | | | | | | | | | | | | | | | |
| Underlying Affiliated Fund | | Beginning
Shares/Par
Amount | | | Acquisitions
Shares/Par
Amount | | | Dispositions
Shares/Par
Amount | | | Ending
Shares/Par
Amount | |
| MFS Institutional Money Market Portfolio | | | 575,033 | | | | 129,712,898 | | | | (127,485,562 | ) | | | 2,802,369 | |
| | | | |
| Underlying Affiliated Fund | | Realized
Gain (Loss) | | | Capital Gain
Distributions | | | Dividend
Income | | | Ending
Value | |
| MFS Institutional Money Market Portfolio | | | $— | | | | $— | | | | $3,842 | | | | $2,802,369 | |
21
MFS Research Series
REPORT OF INDEPENDENT REGISTERED PUBLIC ACCOUNTING FIRM
To the Board of Trustees of MFS Variable Insurance Trust and the Shareholders of
MFS Research Series:
We have audited the accompanying statement of assets and liabilities, including the portfolio of investments, of MFS Research Series (one of the series of MFS Variable Insurance Trust) (the “Fund”) as of December 31, 2014, and the related statement of operations for the year then ended, the statements of changes in net assets for each of the two years in the period then ended, and the financial highlights for each of the five years in the period then ended. These financial statements and financial highlights are the responsibility of the Fund’s management. Our responsibility is to express an opinion on these financial statements and financial highlights based on our audits.
We conducted our audits in accordance with the standards of the Public Company Accounting Oversight Board (United States). Those standards require that we plan and perform the audit to obtain reasonable assurance about whether the financial statements and financial highlights are free of material misstatement. The Fund is not required to have, nor were we engaged to perform, an audit of its internal control over financial reporting. Our audits included consideration of internal control over financial reporting as a basis for designing audit procedures that are appropriate in the circumstances, but not for the purpose of expressing an opinion on the effectiveness of the Fund’s internal control over financial reporting. Accordingly, we express no such opinion. An audit also includes examining, on a test basis, evidence supporting the amounts and disclosures in the financial statements, assessing the accounting principles used and significant estimates made by management, as well as evaluating the overall financial statement presentation. Our procedures included confirmation of securities owned as of December 31, 2014, by correspondence with the custodian and brokers; where replies were not received from brokers, we performed other auditing procedures. We believe that our audits provide a reasonable basis for our opinion.
In our opinion, the financial statements and financial highlights referred to above present fairly, in all material respects, the financial position of MFS Research Series as of December 31, 2014, the results of its operations for the year then ended, the changes in its net assets for each of the two years in the period then ended, and the financial highlights for each of the five years in the period then ended, in conformity with accounting principles generally accepted in the United States of America.
DELOITTE & TOUCHE LLP
Boston, Massachusetts
February 13, 2015
22
MFS Research Series
TRUSTEES AND OFFICERS – IDENTIFICATION AND BACKGROUND
The Trustees and Officers of the Trust, as of February 1, 2015, are listed below, together with their principal occupations during the past five years. (Their titles may have varied during that period.) The address of each Trustee and Officer is 111 Huntington Avenue, Boston, Massachusetts 02199-7618.
| | | | | | | | |
Name, Age | | Position(s)
Held with Fund | | Trustee/Officer
Since (h) | | Principal Occupations
During the Past Five Years | | Other Directorships (j) |
| INTERESTED TRUSTEES |
Robert J. Manning (k) (age 51) | | Trustee | | February 2004 | | Massachusetts Financial Services Company, Chairman, Co-Chief Executive Officer and Director; President (until 2009); Chief Investment Officer (until 2010) | | N/A |
| | | | |
Robin A. Stelmach (k) (age 53) | | Trustee and President | | January 2014 | | Massachusetts Financial Services Company, Executive Vice President and Chief Operating Officer | | N/A |
| | | |
| INDEPENDENT TRUSTEES | | | | | | |
David H. Gunning (age 72) | | Trustee and Chair of Trustees | | January 2004 | | Private investor | | Lincoln Electric Holdings, Inc. (welding equipment manufacturer), Director; Development Alternatives, Inc. (consulting), Director/Non-Executive Chairman |
| | | | |
Steven E. Buller (age 63) | | Trustee | | February 2014 | | Chairman, Financial Accounting Standards Advisory Council; Standing Advisory Group, Public Company Accounting Oversight Board, Member (until 2014); BlackRock, Inc. (investment management), Managing Director (until 2014), BlackRock Finco UK (investment management), Director (until 2014) | | N/A |
| | | | |
Robert E. Butler (age 73) | | Trustee | | January 2006 | | Consultant – investment company industry regulatory and compliance matters | | N/A |
| | | | |
Maureen R. Goldfarb (age 59) | | Trustee | | January 2009 | | Private investor | | N/A |
| | | | |
William R. Gutow (age 73) | | Trustee | | December 1993 | | Private investor and real estate consultant; Capitol Entertainment Management Company (video franchise), Vice Chairman | | Texas Donuts (donut franchise), Vice Chairman (until 2010) |
| | | | |
Michael Hegarty (age 70) | | Trustee | | December 2004 | | Private investor | | Brookfield Office Properties, Inc. (real estate), Director; Rouse Properties Inc. (real estate), Director; Capmark Financial Group Inc. (real estate), Director |
| | | | |
John P. Kavanaugh (age 60) | | Trustee | | January 2009 | | Private investor | | N/A |
| | | | |
Maryanne L. Roepke (age 58) | | Trustee | | May 2014 | | American Century Investments (investment management), Senior Vice President and Chief Compliance Officer (until 2014) | | N/A |
| | | | |
Laurie J. Thomsen (age 57) | | Trustee | | March 2005 | | Private investor; New Profit, Inc. (venture philanthropy), Executive Partner (until 2010) | | The Travelers Companies (insurance), Director |
| | | | |
Robert W. Uek (age 73) | | Trustee | | January 2006 | | Consultant to investment company industry | | N/A |
| | | | |
| OFFICERS | | | | | | | | |
Christopher R. Bohane (k) (age 41) | | Assistant Secretary and Assistant Clerk | | July 2005 | | Massachusetts Financial Services Company, Vice President and Assistant General Counsel | | N/A |
| | | | |
Kino Clark (k) (age 46) | | Assistant Treasurer | | January 2012 | | Massachusetts Financial Services Company, Vice President | | N/A |
| | | | |
Thomas H. Connors (k) (age 55) | | Assistant Secretary and Assistant Clerk | | September 2012 | | Massachusetts Financial Services Company, Vice President and Senior Counsel; Deutsche Investment Management Americas Inc. (financial service provider), Director and Senior Counsel (until 2012) | | N/A |
23
MFS Research Series
Trustees and Officers – continued
| | | | | | | | |
Name, Age | | Position(s)
Held with Fund | | Trustee/Officer
Since (h) | | Principal Occupations
During the Past Five Years | | Other Directorships (j) |
Ethan D. Corey (k) (age 51) | | Assistant
Secretary and Assistant Clerk | | July 2005 | | Massachusetts Financial Services Company, Senior Vice President and Associate General Counsel | | N/A |
| | | | |
David L. DiLorenzo (k) (age 46) | | Treasurer | | July 2005 | | Massachusetts Financial Services Company, Senior Vice President | | N/A |
| | | | |
Timothy M. Fagan (k) (age 46) | | Chief Compliance Officer | | November 2014 | | Massachusetts Financial Services Company, Chief Compliance Officer; Vice President and Senior Counsel (until 2012) | | N/A |
| | | | |
Brian E. Langenfeld (k) (age 41) | | Assistant
Secretary and Assistant Clerk | | June 2006 | | Massachusetts Financial Services Company, Vice President and Senior Counsel | | N/A |
| | | | |
Susan S. Newton (k) (age 64) | | Assistant
Secretary and Assistant Clerk | | May 2005 | | Massachusetts Financial Services Company, Senior Vice President and Associate General Counsel | | N/A |
| | | | |
Susan A. Pereira (k) (age 44) | | Assistant
Secretary and Assistant Clerk | | July 2005 | | Massachusetts Financial Services Company, Vice President and Senior Counsel | | N/A |
| | | | |
Kasey L. Phillips (k) (age 44) | | Assistant Treasurer | | September 2012 | | Massachusetts Financial Services Company, Vice President; Wells Fargo Funds Management, LLC, Senior Vice President, Fund Treasurer (until 2012) | | N/A |
| | | | |
Mark N. Polebaum (k) (age 62) | | Secretary and
Clerk | | January 2006 | | Massachusetts Financial Services Company, Executive Vice President, General Counsel and Secretary | | N/A |
| | | | |
Matthew A. Stowe (k) (age 40) | | Assistant Secretary and Assistant Clerk | | October 2014 | | Massachusetts Financial Services Company, Vice President and Senior Counsel | | N/A |
| | | | |
Frank L. Tarantino (age 70) | | Independent
Senior Officer | | June 2004 | | Tarantino LLC (provider of compliance services), Principal | | N/A |
| | | | |
Richard S. Weitzel (k) (age 44) | | Assistant Secretary and Assistant Clerk | | October 2007 | | Massachusetts Financial Services Company, Senior Vice President and Associate General Counsel | | N/A |
| | | | |
James O. Yost (k) (age 54) | | Deputy Treasurer | | September 1990 | | Massachusetts Financial Services Company, Senior Vice President | | N/A |
| (h) | Date first appointed to serve as Trustee/officer of an MFS Fund. Each Trustee has served continuously since appointment unless indicated otherwise. For the period from December 15, 2004 until February 22, 2005, Mr. Manning served as Advisory Trustee. Prior to January 2012, Messrs. DiLorenzo and Yost served as Assistant Treasurers of the Funds. Ms. Stelmach was appointed as President of the Funds as of October 1, 2014. |
| (j) | Directorships or trusteeships of companies required to report to the Securities and Exchange Commission (i.e., “public companies”). |
| (k) | “Interested person” of the Trust within the meaning of the Investment Company Act of 1940 (referred to as the 1940 Act), which is the principal federal law governing investment companies like the fund, as a result of a position with MFS. The address of MFS is 111 Huntington Avenue, Boston, Massachusetts 02199-7618. |
Each Trustee (except Ms. Stelmach, Mr. Buller and Ms. Roepke) has been elected by shareholders and each Trustee and officer holds office until his or her successor is chosen and qualified or until his or her earlier death, resignation, retirement or removal. The Trust does not hold annual meetings for the purpose of electing Trustees, and Trustees are not elected for fixed terms. Messrs. Butler, Kavanaugh, Uek and Mses. Thomsen and Roepke are members of the Trust’s Audit Committee.
Each of the Fund’s Trustees and officers holds comparable positions with certain other funds of which MFS or a subsidiary is the investment adviser or distributor, and, in the case of the officers, with certain affiliates of MFS. As of February 1, 2015, the Trustees served as board members of 135 funds within the MFS Family of Funds.
24
MFS Research Series
Trustees and Officers – continued
The Statement of Additional Information for the Fund includes further information about the Trustees and is available without charge upon request by calling 1-800-225-2606.
| | |
Investment Adviser Massachusetts Financial Services Company 111 Huntington Avenue Boston, MA 02199-7618 | | Custodian State Street Bank and Trust Company 1 Lincoln Street Boston, MA 02111-2900 |
Distributor MFS Fund Distributors, Inc. 111 Huntington Avenue Boston, MA 02199-7618 | | Independent Registered Public Accounting Firm Deloitte & Touche LLP 200 Berkeley Street Boston, MA 02116 |
Portfolio Manager Joseph MacDougall | | |
25
MFS Research Series
BOARD REVIEW OF INVESTMENT ADVISORY AGREEMENT
The Investment Company Act of 1940 requires that both the full Board of Trustees and a majority of the non-interested (“independent”) Trustees, voting separately, annually approve the continuation of the Fund’s investment advisory agreement with MFS. The Trustees consider matters bearing on the Fund and its advisory arrangements at their meetings throughout the year, including a review of performance data at each regular meeting. In addition, the independent Trustees met several times over the course of three months beginning in May and ending in July, 2014 (“contract review meetings”) for the specific purpose of considering whether to approve the continuation of the investment advisory agreement for the Fund and the other investment companies that the Board oversees (the “MFS Funds”). The independent Trustees were assisted in their evaluation of the Fund’s investment advisory agreement by independent legal counsel, from whom they received separate legal advice and with whom they met separately from MFS during various contract review meetings. The independent Trustees were also assisted in this process by the MFS Funds’ Independent Chief Compliance Officer, a full-time senior officer appointed by and reporting to the independent Trustees.
In connection with their deliberations regarding the continuation of the investment advisory agreement, the Trustees, including the independent Trustees, considered such information and factors as they believed, in light of the legal advice furnished to them and their own business judgment, to be relevant. The investment advisory agreement for the Fund was considered separately, although the Trustees also took into account the common interests of all MFS Funds in their review. As described below, the Trustees considered the nature, quality, and extent of the various investment advisory, administrative, and shareholder services performed by MFS under the existing investment advisory agreement and other arrangements with the Fund.
In connection with their contract review meetings, the Trustees received and relied upon materials that included, among other items: (i) information provided by Lipper Inc., an independent third party, on the investment performance of the Fund for various time periods ended December 31, 2013 and the investment performance of a group of funds with substantially similar investment classifications/objectives (the “Lipper performance universe”), (ii) information provided by Lipper Inc. on the Fund’s advisory fees and other expenses and the advisory fees and other expenses of comparable funds identified by Lipper Inc. (the “Lipper expense group”), (iii) information provided by MFS on the advisory fees of comparable portfolios of other clients of MFS, including institutional separate accounts and other clients, (iv) information as to whether and to what extent applicable expense waivers, reimbursements or fee “breakpoints” are observed for the Fund, (v) information regarding MFS’ financial results and financial condition, including MFS’ and certain of its affiliates’ estimated profitability from services performed for the Fund and the MFS Funds as a whole, and compared to MFS’ institutional business, (vi) MFS’ views regarding the outlook for the mutual fund industry and the strategic business plans of MFS, (vii) descriptions of various functions performed by MFS for the Funds, such as compliance monitoring and portfolio trading practices, and (viii) information regarding the overall organization of MFS, including information about MFS’ senior management and other personnel providing investment advisory, administrative and other services to the Fund and the other MFS Funds. The comparative performance, fee and expense information prepared and provided by Lipper Inc. was not independently verified and the independent Trustees did not independently verify any information provided to them by MFS.
The Trustees’ conclusion as to the continuation of the investment advisory agreement was based on a comprehensive consideration of all information provided to the Trustees and not the result of any single factor. Some of the factors that figured particularly in the Trustees’ deliberations are described below, although individual Trustees may have evaluated the information presented differently from one another, giving different weights to various factors. It is also important to recognize that the fee arrangements for the Fund and other MFS Funds are the result of years of review and discussion between the independent Trustees and MFS, that certain aspects of such arrangements may receive greater scrutiny in some years than in others, and that the Trustees’ conclusions may be based, in part, on their consideration of these same arrangements during the course of the year and in prior years.
Based on information provided by Lipper Inc. and MFS, the Trustees reviewed the Fund’s total return investment performance as well as the performance of peer groups of funds over various time periods. The Trustees placed particular emphasis on the total return performance of the Fund’s Initial Class shares in comparison to the performance of funds in its Lipper performance universe over the three-year period ended December 31, 2013, which the Trustees believed was a long enough period to reflect differing market conditions. The total return performance of the Fund’s Initial Class shares was in the 2nd quintile relative to the other funds in the universe for this three-year period (the 1st quintile being the best performers and the 5th quintile being the worst performers). The total return performance of the Fund’s Initial Class shares was in the 3rd quintile for the one-year period and the 1st quintile for the five-year period ended December 31, 2013 relative to the Lipper performance universe. Because of the passage of time, these performance results may differ from the performance results for more recent periods, including those shown elsewhere in this report.
In the course of their deliberations, the Trustees took into account information provided by MFS in connection with the contract review meetings, as well as during investment review meetings conducted with portfolio management personnel during the course of the year regarding the Fund’s performance. After reviewing these and related factors, the Trustees concluded, within the context of their overall conclusions regarding the investment advisory agreement, that they were satisfied with MFS’ responses and efforts relating to investment performance.
26
MFS Research Series
Board Review of Investment Advisory Agreement – continued
In assessing the reasonableness of the Fund’s advisory fee, the Trustees considered, among other information, the Fund’s advisory fee and the total expense ratio of the Fund’s Initial Class shares as a percentage of average daily net assets and the advisory fee and total expense ratios of peer groups of funds based on information provided by Lipper Inc. The Trustees considered that, according to the Lipper data (which takes into account any fee reductions or expense limitations that were in effect during the Fund’s last fiscal year), the Fund’s effective advisory fee rate and total expense ratio were each higher than the Lipper expense group median.
The Trustees also considered the advisory fees charged by MFS to any comparable institutional accounts. In comparing these fees, the Trustees considered information provided by MFS as to the generally broader scope of services provided by MFS to the Fund in comparison to institutional accounts, the higher demands placed on MFS’ investment personnel and trading infrastructure as a result of the daily cash in-flows and out-flows of the Fund, and the impact on MFS and expenses associated with the more extensive regulatory regime to which the Fund is subject in comparison to institutional accounts.
The Trustees also considered whether the Fund may benefit from any economies of scale in the management of the Fund in the event of growth in assets of the Fund and/or growth in assets of the MFS Funds as a whole. They noted that the Fund’s advisory fee rate schedule is subject to a contractual breakpoint that reduces the Fund’s advisory fee rate on average daily net assets over $1 billion. The Trustees also noted that MFS has agreed in writing to waive a portion of the management fees of certain MFS Funds, including the Fund, if the total combined assets of certain funds within the MFS Funds’ complex increase above agreed upon thresholds (the “group fee waiver”), enabling the Fund’s shareholders to share in the benefits from any economies of scale at the complex level. The group fee waiver is reviewed and renewed annually between the Board and MFS. The Trustees concluded that the breakpoint and the group fee waiver were sufficient to allow the Fund to benefit from economies of scale as its assets and overall complex assets grow.
The Trustees also considered information prepared by MFS relating to MFS’ costs and profits with respect to the Fund, the MFS Funds considered as a group, and other investment companies and accounts advised by MFS, as well as MFS’ methodologies used to determine and allocate its costs to the MFS Funds, the Fund and other accounts and products for purposes of estimating profitability.
After reviewing these and other factors described herein, the Trustees concluded, within the context of their overall conclusions regarding the investment advisory agreement, that the advisory fees charged to the Fund represent reasonable compensation in light of the services being provided by MFS to the Fund.
In addition, the Trustees considered MFS’ resources and related efforts to continue to retain, attract and motivate capable personnel to serve the Fund. The Trustees also considered current and developing conditions in the financial services industry, including the presence of large and well-capitalized companies which are spending, and appear to be prepared to continue to spend, substantial sums to engage personnel and to provide services to competing investment companies. In this regard, the Trustees also considered the financial resources of MFS and its ultimate parent, Sun Life Financial Inc. The Trustees also considered the advantages and possible disadvantages to the Fund of having an adviser that also serves other investment companies as well as other accounts.
The Trustees also considered the nature, quality, cost, and extent of administrative, transfer agency, and distribution services provided to the Fund by MFS and its affiliates under agreements and plans other than the investment advisory agreement, including any 12b-1 fees the Fund pays to MFS Fund Distributors, Inc., an affiliate of MFS. The Trustees also considered the nature, extent and quality of certain other services MFS performs or arranges for on the Fund’s behalf, which may include securities lending programs, directed expense payment programs, class action recovery programs, and MFS’ interaction with third-party service providers, principally custodians and sub-custodians. The Trustees concluded that the various non-advisory services provided by MFS and its affiliates on behalf of the Fund were satisfactory.
The Trustees also considered benefits to MFS from the use of the Fund’s portfolio brokerage commissions, if applicable, to pay for investment research and various other factors. Additionally, the Trustees considered so-called “fall-out benefits” to MFS such as reputational value derived from serving as investment manager to the Fund.
Based on their evaluation of factors that they deemed to be material, including those factors described above, the Board of Trustees, including the independent Trustees, concluded that the Fund’s investment advisory agreement with MFS should be continued for an additional one-year period, commencing August 1, 2014.
27
MFS Research Series
PROXY VOTING POLICIES AND INFORMATION
MFS votes proxies on behalf of the fund pursuant to proxy voting policies and procedures that are available without charge, upon request, by calling 1-800-225-2606, by visiting the Proxy Voting section of mfs.com or by visiting the SEC’s Web site at http://www.sec.gov.
Information regarding how the fund voted proxies relating to portfolio securities during the most recent twelve-month period ended June 30 is available without charge by visiting the Proxy Voting section of mfs.com or by visiting the SEC’s Web site at http://www.sec.gov.
QUARTERLY PORTFOLIO DISCLOSURE
The fund will file a complete schedule of portfolio holdings with the Securities and Exchange Commission (the Commission) for the first and third quarters of each fiscal year on Form N-Q. The fund’s Form N-Q is available on the EDGAR database on the Commission’s Internet Web site at http://www.sec.gov, and may be reviewed and copied at the:
Public Reference Room
Securities and Exchange Commission
100 F Street, NE, Room 1580
Washington, D.C. 20549
Information on the operation of the Public Reference Room may be obtained by calling the Commission at 1-800-SEC-0330. Copies of the fund’s Form N-Q also may be obtained, upon payment of a duplicating fee, by electronic request at the following e-mail address: publicinfo@sec.gov or by writing the Public Reference Section at the above address.
FURTHER INFORMATION
From time to time, MFS may post important information about the fund or the MFS funds on the MFS web site (mfs.com). This information is available by visiting the “Market Commentary” and “Announcements” sub sections in the “Market Outlooks” section of mfs.com or by clicking on the fund’s name under “Variable Insurance Portfolios — VIT” in the “Products” section of mfs.com.
FEDERAL TAX INFORMATION (unaudited)
The following information is provided pursuant to provisions of the Internal Revenue Code.
The fund designates $29,565,000 as capital gain dividends paid during the fiscal year.
For corporate shareholders, 33.16% of the ordinary income dividends paid during the fiscal year qualify for the corporate dividends received deduction.
28
rev. 3/11
| | | | |
| FACTS | | WHAT DOES MFS DO WITH YOUR
PERSONAL INFORMATION? | |  |
| | |
| Why? | | Financial companies choose how they share your personal information. Federal law gives consumers the right to limit some but not all sharing. Federal law also requires us to tell you how we collect, share, and protect your personal information. Please read this notice carefully to understand what we do. |
| | |
| What? | | The types of personal information we collect and share depend on the product or service you have with us. This information can include: • Social Security number and account balances • Account transactions and transaction history • Checking account information and wire transfer instructions When you are no longer our customer, we continue to share your information as described in this notice. |
| | |
| How? | | All financial companies need to share customers’ personal information to run their everyday business. In the section below, we list the reasons financial companies can share their customers’ personal information; the reasons MFS chooses to share; and whether you can limit this sharing. |
| | | | |
Reasons we can share your
personal information | | Does MFS share? | | Can you limit this
sharing? |
For our everyday business purposes – such as to process your transactions, maintain your account(s), respond to court orders and legal investigations, or report to credit bureaus | | Yes | | No |
For our marketing purposes – to offer our products and services to you | | No | | We don’t share |
| For joint marketing with other financial companies | | No | | We don’t share |
For our affiliates’ everyday business purposes – information about your transactions and experiences | | No | | We don’t share |
For our affiliates’ everyday business purposes – information about your creditworthiness | | No | | We don’t share |
| For nonaffiliates to market to you | | No | | We don’t share |
| | |
| Questions? | | Call 800-225-2606 or go to mfs.com. |
29
| | |
| Who we are |
| Who is providing this notice? | | MFS Funds, MFS Investment Management, MFS Institutional Advisors, Inc., MFS Fund Distributors, Inc., MFS Heritage Trust Company, and MFS Service Center, Inc. |
| | |
| What we do |
| How does MFS protect my personal information? | | To protect your personal information from unauthorized access and use, we use security measures that comply with federal law. These measures include procedural, electronic, and physical safeguards for the protection of the personal information we collect about you. |
How does MFS
collect my personal information? | | We collect your personal information, for example, when you • open an account or provide account information • direct us to buy securities or direct us to sell your securities • make a wire transfer We also collect your personal information from others, such as credit bureaus, affiliates and other companies. |
| Why can’t I limit all sharing? | | Federal law gives you the right to limit only • sharing for affiliates’ everyday business purposes – information about your creditworthiness • affiliates from using your information to market to you • sharing for nonaffiliates to market to you State laws and individual companies may give you additional rights to limit sharing. |
| | |
| Definitions |
| Affiliates | | Companies related by common ownership or control. They can be financial and nonfinancial companies. •MFS does not share personal information with affiliates, except for everyday business purposes as described on page one of this notice. |
| Nonaffiliates | | Companies not related by common ownership or control. They can be financial and nonfinancial companies. •MFS does not share with nonaffiliates so they can market to you. |
| Joint Marketing | | A formal agreement between nonaffiliated financial companies that together market financial products or services to you. •MFS doesn’t jointly market. |
| | |
| Other important information |
| If you own an MFS product or receive an MFS service in the name of a third party such as a bank or broker-dealer, their privacy policy may apply to you instead of ours. |
30
ANNUAL REPORT
December 31, 2014

MFS® TOTAL RETURN SERIES
MFS® Variable Insurance Trust

VTR-ANN
MFS® TOTAL RETURN SERIES
CONTENTS
The report is prepared for the general information of contract owners. It is authorized for distribution to prospective investors only when preceded or accompanied by a current prospectus.
NOT FDIC INSURED Ÿ MAY LOSE VALUE Ÿ NO BANK OR CREDIT UNION GUARANTEE Ÿ NOT A DEPOSIT Ÿ NOT INSURED BY ANY FEDERAL GOVERNMENT AGENCY OR NCUA/NCUSIF
MFS Total Return Series
LETTER FROM THE CHAIRMAN

Dear Contract Owners:
As 2015 begins, sharply lower oil prices are reshaping the global economy, adding to deflationary pressures in the eurozone and exacerbating challenges faced by oil exporters such as Russia. The U.S. economy stands on firmer ground, having expanded steadily over the past year. The U.S. labor market has regained momentum, consumer confidence is buoyant and gasoline prices have tumbled, boosting prospects for a stronger economic rebound in 2015.
Other regions are struggling. The eurozone economy is barely expanding, and the European Central Bank (ECB) has introduced large-scale asset purchases.
Despite Japan’s efforts to strengthen its economy, its sales tax increase last spring tipped the country into a recession, leading to additional monetary stimulus from the Bank of Japan. China’s economy is slowing as it transitions to a more sustainable basis, and its growth rate will likely continue to decline.
As always, active risk management is integral to how we at MFS® manage your investments. We use a collaborative process, sharing insights across asset classes, regions and economic sectors. Our global investment team uses a diversified, multidisciplined, long-term approach.
Applying proven principles, such as asset allocation and diversification, can best serve investors over the long term. We are confident that this approach can help you as you work with your financial advisors to reach your goals in the years ahead.
Respectfully,

Robert J. Manning
Chairman
MFS Investment Management
February 13, 2015
The opinions expressed in this letter are subject to change and may not be relied upon for investment advice. No forecasts can be guaranteed.
1
MFS Total Return Series
PORTFOLIO COMPOSITION
Portfolio structure (i)
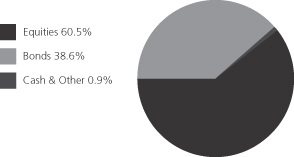
| | | | |
| Top ten holdings (i) | | | | |
| U.S. Treasury Notes, 0.875%, 12/31/16 | | | 3.2% | |
| U.S. Treasury Bonds, 4.5%, 8/15/39 | | | 2.7% | |
| JPMorgan Chase & Co. | | | 2.4% | |
| Fannie Mae, 4%, 30 Years | | | 1.8% | |
| Wells Fargo & Co. | | | 1.7% | |
| Philip Morris International, Inc. | | | 1.5% | |
| U.S. Treasury Notes, 3.125%, 5/15/21 | | | 1.5% | |
| Johnson & Johnson | | | 1.5% | |
| U.S. Treasury Notes, 3.125%, 5/15/19 | | | 1.2% | |
| CVS Health Corp. | | | 1.1% | |
|
| Composition including fixed income credit quality (a)(i) | |
| AAA | | | 1.7% | |
| AA | | | 1.4% | |
| A | | | 4.6% | |
| BBB | | | 6.2% | |
| BB | | | 0.4% | |
| CCC | | | 0.1% | |
| C | | | 0.1% | |
| U.S. Government | | | 11.4% | |
| Federal Agencies | | | 12.7% | |
| Not Rated (o) | | | 0.0% | |
| Non-Fixed Income | | | 60.5% | |
| Cash & Other | | | 0.9% | |
| | | | |
| Equity sectors | | | | |
| Financial Services | | | 14.3% | |
| Health Care | | | 7.9% | |
| Consumer Staples | | | 5.8% | |
| Industrial Goods & Services | | | 5.6% | |
| Technology | | | 4.9% | |
| Energy | | | 4.4% | |
| Leisure | | | 4.2% | |
| Utilities & Communications | | | 3.6% | |
| Retailing | | | 3.5% | |
| Basic Materials | | | 2.9% | |
| Autos & Housing | | | 1.5% | |
| Special Products & Services | | | 1.1% | |
| Transportation | | | 0.8% | |
| |
| Fixed income sectors (i) | | | | |
| Mortgage-Backed Securities | | | 12.5% | |
| U.S. Treasury Securities | | | 11.4% | |
| Investment Grade Corporates | | | 10.1% | |
| Commercial Mortgage-Backed Securities | | | 1.9% | |
| Emerging Markets Bonds | | | 1.0% | |
| Non-U.S. Government Bonds | | | 0.7% | |
| Collateralized Debt Obligations | | | 0.3% | |
| Asset-Backed Securities | | | 0.3% | |
| U.S. Government Agencies | | | 0.2% | |
| High Yield Corporates | | | 0.2% | |
| Residential Mortgage-Backed Securities (o) | | | 0.0% | |
| (a) | For all securities other than those specifically described below, ratings are assigned to underlying securities utilizing ratings from Moody’s, Fitch, and Standard & Poor’s rating agencies and applying the following hierarchy: If all three agencies provide a rating, the middle rating (after dropping the highest and lowest ratings) is assigned; if two of the three agencies rate a security, the lower of the two is assigned. Ratings are shown in the S&P and Fitch scale (e.g., AAA). Securities rated BBB or higher are considered investment grade. All ratings are subject to change. U.S. Government includes securities issued by the U.S. Department of the Treasury. Federal Agencies includes rated and unrated U.S. Agency fixed-income securities, U.S. Agency mortgage-backed securities, and collateralized mortgage obligations of U.S. Agency mortgage-backed securities. Not Rated includes fixed income securities, including fixed income futures contracts, which have not been rated by any rating agency. Non-Fixed Income includes equity securities (including convertible bonds and equity derivatives) and commodities. The fund may not hold all of these instruments. The fund is not rated by these agencies. |
| (i) | For purposes of this presentation, the components include the value of securities, and reflect the impact of the equivalent exposure of derivative positions, if any. These amounts may be negative from time to time. Equivalent exposure is a calculated amount that translates the derivative position into a reasonable approximation of the amount of the underlying asset that the portfolio would have to hold at a given point in time to have the same price sensitivity that results from the portfolio’s ownership of the derivative contract. When dealing with derivatives, equivalent exposure is a more representative measure of the potential impact of a position on portfolio performance than value. The bond component will include any accrued interest amounts. |
2
MFS Total Return Series
Portfolio Composition – continued
Where the fund holds convertible bonds, these are treated as part of the equity portion of the portfolio.
Cash & Other can include cash, other assets less liabilities, offsets to derivative positions, and short-term securities.
Percentages are based on net assets as of 12/31/14.
The portfolio is actively managed and current holdings may be different.
3
MFS Total Return Series
MANAGEMENT REVIEW
Summary of Results
For the twelve months ended December 31, 2014, Initial Class shares of the MFS Total Return Series (“fund”) provided a total return of 8.50%, while Service Class shares of the fund provided a total return of 8.24%. These compare with returns of 13.69% and 5.97% over the same period for the fund’s benchmarks, the Standard & Poor’s 500 Stock Index (“S&P 500 Index”) and the Barclays U.S. Aggregate Bond Index (“Barclays Index”), respectively. The fund’s other benchmark, the MFS Total Return Blended Index (“Blended Index”), generated a return of 10.62%. The Blended Index reflects the blended returns of the equity and fixed income market indices, with percentage allocations to each index designed to resemble the equity and fixed income allocations of the fund. The market indices and related percentage allocations used to compile the Blended Index are set forth in the Performance Summary.
Market Environment
Early in the period, US equities suffered what proved to be a temporary setback due to concerns over emerging markets as well as what was perceived at the time to be a pause in US economic growth, partially caused by extreme weather events and a weak December 2013 labor market report. Markets soon recovered as the economic pause concluded and investors appeared to have become increasingly comfortable that newly-installed US Federal Reserve (“Fed”) Chair Janet Yellen would not make any substantial changes to the trajectory of Fed monetary policy.
A generally risk-friendly, carry trade environment persisted from February 2014 until mid-year. While geopolitical tensions flared in the Middle East and Russia/Ukraine, any market setbacks were short-lived as improving economic growth in the US, coupled with prospects for easier monetary policy in regions with slowing growth, such as Japan, Europe and China, supported risk assets. For example, the European Central Bank (“ECB”) cut policy interest rates into negative territory and, by the end of the period, expectations were for additional rate cuts and the announcement for non-conventional easing measures. Similarly, the Bank of Japan surprised markets late in the period with fresh stimulus measures given lackluster growth trends. The related decline in developed market government bond yields and credit spreads were also supportive for equity markets. At the end of the period, the US equity market was trading close to all-time highs and US Treasury yields were close to their lows for the period. However, credit markets did not fare as well in the second half of 2014, particularly US high yield and emerging market debt. The higher weightings of oil and gas credits in these asset classes resulted in widening spreads and increased volatility as oil prices began to decline in an accelerated fashion in the fourth quarter.
Detractors from Performance
Within the equity segment of the fund, weak stock selection in the health care sector was a primary detractor from performance relative to the S&P 500 Index. There were no individual securities that were among the fund’s top relative detractors.
An underweight position and to a lesser extent, weak stock selection in the technology sector, was another detractor for relative performance. Most notably, the fund’s underweight positions in computer and personal electronics maker Apple, semiconductor manufacturers Intel and Microsoft held back relative results. Shares of Apple appreciated due to strong consumer demand for the company’s IPhone 6 and 6 Plus smartphones.
Elsewhere, the fund’s holdings of iron ore and pellets producer Vale (b) (Brazil), overweight positions in shares of tobacco producer Philip Morris International, off shore drilling company Ensco, holdings of alcoholic drink producer Diageo (b) (United Kingdom), and overweighting automotive manufacturer General Motors and oil and gas company Noble Energy dampened relative performance, as the stocks underperformed the S&P 500 Index during the reporting period. Not owning shares of insurance and investment firm Berkshire Hathaway further detracted from relative performance, after shares rose on positive earnings, resulted from increased insurance premiums and a stronger presence in the commercial businesses market.
Within the fixed income segment of the fund, a greater exposure to “BBB” and “CCC” rated (r) credit quality bonds was a primary detractor of relative performance. A greater exposure to Mexican issues also detracted from relative results.
Contributors to Performance
Within the equity segment of the fund, strong stock selection in the retailing sector was a positive factor for relative performance, led by the fund’s avoidance of online retailer Amazon.com. Overweight positions in retailer Kroger and drugstore retailer CVS Health also benefited relative results. CVS Health investors responded positively to better-than-expected quarterly earnings results, attributable from good performance from its retail pharmacy business and better Pharmacy Benefit management profitability. Later in the period, CVS also held an upbeat analyst meeting where the company increased its earnings growth expectations for 2015 and through 2018.
Strong stock selection in the industrial goods & services sector also bolstered relative performance. Within this sector, not owning shares of diversified industrial conglomerate General Electric and an overweight position in defense contractor Lockheed Martin were notable contributors to relative results. Despite reporting earnings that were in-line with expectations by General Electric, earnings
4
MFS Total Return Series
Management Review – continued
estimates began to decline towards the end of the period as global energy commodity weakness was expected to pressure its energy business and investors reacted unfavorably to a volatile global macroeconomic environment and the potential impact on the company’s bottom line.
Elsewhere, an underweight position in shares of internet search engine Google and overweight positions in tobacco producer Lorillard, communication services company Frontier Communications, computer and personal electronics maker Hewlett-Packard and medical devices and supply products manufacturer Covidien (Ireland) benefited relative performance.
Within the fixed income segment of the fund, strong bond selection and a greater exposure to the financial sector contributed to relative returns. The fund’s greater exposure to shifts in the long end (centered around maturities of 10 or more years) of the yield curve (y) was also an area of relative strength.
Respectfully,
| | | | | | |
| Nevin Chitkara | | William Douglas | | Steven Gorham | | Richard Hawkins |
| Portfolio Manager | | Portfolio Manager | | Portfolio Manager | | Portfolio Manager |
| | | |
| Joshua Marston | | Jonathan Sage | | Brooks Taylor | | |
| Portfolio Manager | | Portfolio Manager | | Portfolio Manager | | |
| (b) | Security is not a benchmark constituent. |
| (r) | Bonds rated “BBB”, “Baa”, or higher are considered investment grade; bonds rated “BB”, “Ba”, or below are considered non-investment grade. The source for bond quality ratings is Moody’s Investors Service, Standard & Poor’s and Fitch, Inc. and are applied using the following hierarchy: If all three agencies provide a rating, the middle rating (after dropping the highest and lowest ratings) is assigned; if two of the three agencies rate a security, the lower of the two is assigned. Ratings are shown in the S&P and Fitch scale (e.g., AAA). For securities which are not rated by any of the three agencies, the security is considered Not Rated. |
| (y) | A yield curve graphically depicts the yields of different maturity bonds of the same credit quality and type; a normal yield curve is upward sloping, with short-term rates lower than long-term rates. |
The views expressed in this report are those of the portfolio managers only through the end of the period of the report as stated on the cover and do not necessarily reflect the views of MFS or any other person in the MFS organization. These views are subject to change at any time based on market or other conditions, and MFS disclaims any responsibility to update such views. These views may not be relied upon as investment advice or an indication of trading intent on behalf of any MFS portfolio. References to specific securities are not recommendations of such securities, and may not be representative of any MFS portfolio’s current or future investments.
5
MFS Total Return Series
PERFORMANCE SUMMARY THROUGH 12/31/14
The following chart illustrates the historical performance of the fund in comparison to its benchmark(s). Benchmarks are unmanaged and may not be invested in directly. Benchmark returns do not reflect any fees or expenses. The performance of other share classes will be greater than or less than that of the class depicted below. (See Notes to Performance Summary.)
Performance data shown represents past performance and is no guarantee of future results. Investment return and principal value fluctuate so your units, when sold, may be worth more or less than the original cost; current performance may be lower or higher than quoted. The performance shown does not reflect the deduction of taxes, if any, that a contract holder would pay on fund distributions or the redemption of contract units. The returns for the fund shown also do not reflect the deduction of expenses associated with variable products, such as mortality and expense risk charges, separate account charges, and sales charges imposed by the insurance company separate accounts. Such expenses would reduce the overall returns shown.
Growth of a Hypothetical $10,000 Investment
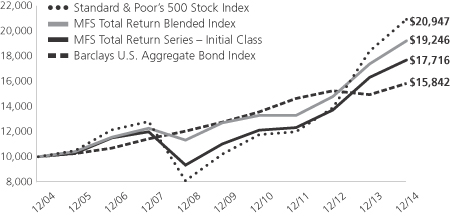
Total Returns through 12/31/14
Average annual total returns
| | | | | | | | | | | | |
| | | Share Class | | Class inception date | | 1-yr | | 5-yr | | 10-yr | | |
| | | Initial Class | | 1/03/95 | | 8.50% | | 9.96% | | 5.89% | | |
| | | Service Class | | 5/01/00 | | 8.24% | | 9.69% | | 5.62% | | |
| | | | |
| Comparative benchmarks | | | | | | | | |
| | | Standard & Poor’s 500 Stock Index (f) | | 13.69% | | 15.45% | | 7.67% | | |
| | | Barclays U.S. Aggregate Bond Index (f) | | 5.97% | | 4.45% | | 4.71% | | |
| | | MFS Total Return Blended Index (f)(w) | | 10.62% | | 11.18% | | 6.77% | | |
| (f) | | Source: FactSet Research Systems Inc. |
| (w) | | As of December 31, 2014, the MFS Total Return Blended Index was comprised of 60% Standard & Poor’s 500 Stock Index and 40% Barclays U.S. Aggregate Bond Index. |
Benchmark Definitions
Barclays U.S. Aggregate Bond Index – a market capitalization-weighted index that measures the performance of the U.S. investment-grade, fixed rate bond market, with index components for government and corporate securities, mortgage pass-through securities, and asset-backed securities with at least one year to final maturity.
Standard & Poor’s 500 Stock Index – a market capitalization-weighted index of 500 widely held equity securities, designed to measure broad U.S. equity performance.
It is not possible to invest directly in an index.
Notes to Performance Summary
Average annual total return represents the average annual change in value for each share class for the periods presented.
Performance results reflect any applicable expense subsidies and waivers in effect during the periods shown. Without such subsidies and waivers the fund’s performance results would be less favorable. Please see the prospectus and financial statements for complete details. All results are historical and assume the reinvestment of any dividends and capital gains distributions.
6
MFS Total Return Series
Performance Summary – continued
Performance results do not include adjustments made for financial reporting purposes in accordance with U.S. generally accepted accounting principles and may differ from amounts reported in the financial highlights.
From time to time the fund may receive proceeds from litigation settlements, without which performance would be lower.
7
MFS Total Return Series
EXPENSE TABLE
Fund Expenses Borne by the Contract Holders During the Period,
July 1, 2014 through December 31, 2014
As a contract holder of the fund, you incur ongoing costs, including management fees; distribution and/or service (12b-1) fees; and other fund expenses. This example is intended to help you understand your ongoing costs (in dollars) of investing in the fund and to compare these costs with the ongoing costs of investing in other mutual funds.
The example is based on an investment of $1,000 invested at the beginning of the period and held for the entire period July 1, 2014 through December 31, 2014.
Actual Expenses
The first line for each share class in the following table provides information about actual account values and actual expenses. You may use the information in this line, together with the amount you invested, to estimate the expenses that you paid over the period. Simply divide your account value by $1,000 (for example, an $8,600 account value divided by $1,000 = 8.6), then multiply the result by the number in the first line under the heading entitled “Expenses Paid During Period” to estimate the expenses you paid on your account during this period.
Hypothetical Example for Comparison Purposes
The second line for each share class in the following table provides information about hypothetical account values and hypothetical expenses based on the fund’s actual expense ratio and an assumed rate of return of 5% per year before expenses, which is not the fund’s actual return. The hypothetical account values and expenses may not be used to estimate the actual ending account balance or expenses you paid for the period. You may use this information to compare the ongoing costs of investing in the fund and other funds. To do so, compare this 5% hypothetical example with the 5% hypothetical examples that appear in the shareholder reports of the other funds.
Please note that the expenses shown in the table are meant to highlight the fund’s ongoing costs only and do not take into account the fees and expenses imposed under the variable contracts through which your investment in the fund is made. Therefore, the second line for each share class in the table is useful in comparing ongoing costs associated with an investment in vehicles (such as the fund) which fund benefits under variable annuity and variable life insurance contracts and to qualified pension and retirement plans only, and will not help you determine the relative total costs of investing in the fund through variable annuity and variable life insurance contracts. If the fees and expenses imposed under the variable contracts were included, your costs would have been higher.
| | | | | | | | | | | | | | | | | | |
| Share Class | | | | Annualized
Expense Ratio | | | Beginning
Account Value
7/01/14 | | | Ending Account Value
12/31/14 | | | Expenses Paid
During Period (p)
7/01/14-12/31/14 | |
| Initial Class | | Actual | | | 0.66% | | | | $1,000.00 | | | | $1,029.22 | | | | $3.38 | |
| | Hypothetical (h) | | | 0.66% | | | | $1,000.00 | | | | $1,021.88 | | | | $3.36 | |
| Service Class | | Actual | | | 0.91% | | | | $1,000.00 | | | | $1,027.69 | | | | $4.65 | |
| | Hypothetical (h) | | | 0.91% | | | | $1,000.00 | | | | $1,020.62 | | | | $4.63 | |
| (h) | 5% class return per year before expenses. |
| (p) | “Expenses Paid During Period” are equal to each class’s annualized expense ratio, as shown above, multiplied by the average account value over the period, multiplied by 184/365 (to reflect the one-half year period). |
Notes to Expense Table
Changes to the fund’s fee arrangements occurred during the six month period. Had these fee changes been in effect throughout the entire six month period, the annualized expense ratios, the actual expenses paid during the period and the hypothetical expenses paid during the period would have been approximately 0.65%, $3.32 and $3.31 for Initial Class and 0.90%, $4.60 and $4.58 for Service Class, respectively. For further information about the fund’s fee arrangements and changes to those fee arrangements, please see Note 3 in the Notes to Financial Statements.
8
MFS Total Return Series
PORTFOLIO OF INVESTMENTS 12/31/14
The Portfolio of Investments is a complete list of all securities owned by your fund. It is categorized by broad-based asset classes.
| | | | | | | | |
| Issuer | | Shares/Par | | | Value ($) | |
| | | | | | | | |
| COMMON STOCKS – 60.2% | |
| Aerospace – 3.1% | | | | | | | | |
| General Dynamics Corp. | | | 49,090 | | | $ | 6,755,760 | |
| Honeywell International, Inc. | | | 248,356 | | | | 24,815,732 | |
| Lockheed Martin Corp. | | | 127,683 | | | | 24,587,915 | |
| Northrop Grumman Corp. | | | 66,000 | | | | 9,727,740 | |
| Precision Castparts Corp. | | | 10,986 | | | | 2,646,308 | |
| United Technologies Corp. | | | 218,650 | | | | 25,144,750 | |
| | | | | | | | |
| | | | | | $ | 93,678,205 | |
| | | | | | | | |
| Airlines – 0.1% | | | | | | | | |
| Copa Holdings S.A., “A” | | | 19,444 | | | $ | 2,015,176 | |
| | | | | | | | |
| Alcoholic Beverages – 0.4% | | | | | | | | |
| Diageo PLC | | | 445,130 | | | $ | 12,766,840 | |
| | | | | | | | |
| Automotive – 1.3% | | | | | | | | |
| Delphi Automotive PLC | | | 173,304 | | | $ | 12,602,667 | |
| General Motors Co. | | | 119,300 | | | | 4,164,763 | |
| Johnson Controls, Inc. | | | 270,792 | | | | 13,090,085 | |
| Magna International, Inc. | | | 97,729 | | | | 10,589,692 | |
| | | | | | | | |
| | | | | | $ | 40,447,207 | |
| | | | | | | | |
| Broadcasting – 1.7% | | | | | | | | |
| Omnicom Group, Inc. | | | 140,952 | | | $ | 10,919,551 | |
| Time Warner, Inc. | | | 176,555 | | | | 15,081,328 | |
| Twenty-First Century Fox, Inc. | | | 136,386 | | | | 5,237,904 | |
| Viacom, Inc., “B” | | | 56,726 | | | | 4,268,632 | |
| Walt Disney Co. | | | 176,260 | | | | 16,601,929 | |
| | | | | | | | |
| | | | | | $ | 52,109,344 | |
| | | | | | | | |
| Brokerage & Asset Managers – 0.9% | | | | | |
| BlackRock, Inc. | | | 31,235 | | | $ | 11,168,387 | |
| Franklin Resources, Inc. | | | 229,595 | | | | 12,712,675 | |
| NASDAQ OMX Group, Inc. | | | 97,268 | | | | 4,664,973 | |
| | | | | | | | |
| | | | | | $ | 28,546,035 | |
| | | | | | | | |
| Business Services – 1.1% | | | | | | | | |
| Accenture PLC, “A” | | | 245,960 | | | $ | 21,966,688 | |
| Adecco S.A. | | | 44,159 | | | | 3,025,066 | |
| Equifax, Inc. | | | 12,659 | | | | 1,023,733 | |
| Fidelity National Information Services, Inc. | | | 50,223 | | | | 3,123,871 | |
| Fiserv, Inc. (a) | | | 61,233 | | | | 4,345,706 | |
| | | | | | | | |
| | | | | | $ | 33,485,064 | |
| | | | | | | | |
| Cable TV – 1.4% | | | | | | | | |
| Comcast Corp., “Special A” | | | 519,699 | | | $ | 29,916,473 | |
| Time Warner Cable, Inc. | | | 91,997 | | | | 13,989,064 | |
| | | | | | | | |
| | | | | | $ | 43,905,537 | |
| | | | | | | | |
| Chemicals – 2.1% | | | | | | | | |
| 3M Co. | | | 136,689 | | | $ | 22,460,736 | |
| Celanese Corp. | | | 62,619 | | | | 3,754,635 | |
| E.I. du Pont de Nemours & Co. | | | 62,775 | | | | 4,641,584 | |
| LyondellBasell Industries N.V., “A” | | | 164,596 | | | | 13,067,276 | |
| PPG Industries, Inc. | | | 83,809 | | | | 19,372,450 | |
| | | | | | | | |
| | | | | | $ | 63,296,681 | |
| | | | | | | | |
| | | | | | | | |
| Issuer | | Shares/Par | | | Value ($) | |
| | | | | | | | |
| COMMON STOCKS – continued | |
| Computer Software – 1.3% | | | | | | | | |
| Aspen Technology, Inc. (a) | | | 65,193 | | | $ | 2,283,059 | |
| CA, Inc. | | | 120,447 | | | | 3,667,611 | |
| Citrix Systems, Inc. (a) | | | 86,605 | | | | 5,525,399 | |
| Microsoft Corp. | | | 210,200 | | | | 9,763,790 | |
| Oracle Corp. | | | 281,268 | | | | 12,648,622 | |
| Symantec Corp. | | | 192,043 | | | | 4,926,863 | |
| | | | | | | | |
| | | | | | $ | 38,815,344 | |
| | | | | | | | |
| Computer Software – Systems – 1.1% | | | | | |
| Apple, Inc. | | | 65,133 | | | $ | 7,189,381 | |
| EMC Corp. | | | 111,093 | | | | 3,303,906 | |
| Hewlett-Packard Co. | | | 125,798 | | | | 5,048,274 | |
| International Business Machines Corp. | | | 102,282 | | | | 16,410,124 | |
| | | | | | | | |
| | | | | | $ | 31,951,685 | |
| | | | | | | | |
| Construction – 0.2% | | | | | | | | |
| Stanley Black & Decker, Inc. | | | 66,394 | | | $ | 6,379,136 | |
| | | | | | | | |
| Consumer Products – 0.7% | | | | | | | | |
| Procter & Gamble Co. | | | 194,698 | | | $ | 17,735,041 | |
| Reckitt Benckiser Group PLC | | | 40,590 | | | | 3,274,452 | |
| | | | | | | | |
| | | | | | $ | 21,009,493 | |
| | | | | | | | |
| Containers – 0.1% | | | | | | | | |
| Crown Holdings, Inc. (a) | | | 61,083 | | | $ | 3,109,125 | |
| | | | | | | | |
| Electrical Equipment – 1.5% | | | | | | | | |
| Danaher Corp. | | | 285,599 | | | $ | 24,478,690 | |
| Pentair PLC | | | 84,345 | | | | 5,602,195 | |
| Siemens AG | | | 36,614 | | | | 4,153,573 | |
| Tyco International PLC | | | 244,114 | | | | 10,706,840 | |
| | | | | | | | |
| | | | | | $ | 44,941,298 | |
| | | | | | | | |
| Electronics – 1.7% | | | | | | | | |
| Broadcom Corp., “A” | | | 330,212 | | | $ | 14,308,086 | |
| Hoya Corp. | | | 95,700 | | | | 3,204,129 | |
| Intel Corp. | | | 115,315 | | | | 4,184,781 | |
| Microchip Technology, Inc. | | | 299,602 | | | | 13,515,046 | |
| Taiwan Semiconductor Manufacturing Co. Ltd., ADR | | | 201,723 | | | | 4,514,561 | |
| Texas Instruments, Inc. | | | 214,155 | | | | 11,449,797 | |
| | | | | | | | |
| | | | | | $ | 51,176,400 | |
| | | | | | | | |
| Energy – Independent – 1.7% | | | | | | | | |
| Anadarko Petroleum Corp. | | | 87,736 | | | $ | 7,238,220 | |
| Apache Corp. | | | 73,038 | | | | 4,577,291 | |
| Canadian Natural Resources Ltd. | | | 77,069 | | | | 2,379,891 | |
| EOG Resources, Inc. | | | 38,990 | | | | 3,589,809 | |
| EQT Corp. | | | 48,053 | | | | 3,637,612 | |
| Marathon Petroleum Corp. | | | 47,950 | | | | 4,327,967 | |
| Noble Energy, Inc. | | | 131,671 | | | | 6,245,156 | |
| Occidental Petroleum Corp. | | | 136,452 | | | | 10,999,396 | |
| Valero Energy Corp. | | | 155,452 | | | | 7,694,874 | |
| | | | | | | | |
| | | | | | $ | 50,690,216 | |
| | | | | | | | |
9
MFS Total Return Series
Portfolio of Investments – continued
| | | | | | | | |
| Issuer | | Shares/Par | | | Value ($) | |
| | | | | | | | |
| COMMON STOCKS – continued | |
| Energy – Integrated – 2.2% | | | | | | | | |
| Chevron Corp. | | | 200,102 | | | $ | 22,447,442 | |
| Exxon Mobil Corp. | | | 363,647 | | | | 33,619,165 | |
| Petroleo Brasileiro S.A., ADR | | | 434,580 | | | | 3,294,116 | |
| Royal Dutch Shell PLC, “A” | | | 236,109 | | | | 7,826,186 | |
| | | | | | | | |
| | | | | | $ | 67,186,909 | |
| | | | | | | | |
| Food & Beverages – 1.9% | | | | | | | | |
| Coca-Cola Co. | | | 87,964 | | | $ | 3,713,840 | |
| Danone S.A. | | | 112,714 | | | | 7,415,059 | |
| Dr Pepper Snapple Group, Inc. | | | 16,975 | | | | 1,216,768 | |
| General Mills, Inc. | | | 350,272 | | | | 18,680,006 | |
| Ingredion, Inc. | | | 33,679 | | | | 2,857,326 | |
| Kellogg Co. | | | 27,336 | | | | 1,788,868 | |
| Mondelez International, Inc. | | | 96,950 | | | | 3,521,709 | |
| Nestle S.A. | | | 244,630 | | | | 17,931,756 | |
| | | | | | | | |
| | | | | | $ | 57,125,332 | |
| | | | | | | | |
| Food & Drug Stores – 1.6% | | | | | | | | |
| CVS Health Corp. | | | 358,089 | | | $ | 34,487,552 | |
| Kroger Co. | | | 229,582 | | | | 14,741,460 | |
| | | | | | | | |
| | | | | | $ | 49,229,012 | |
| | | | | | | | |
| Gaming & Lodging – 0.2% | | | | | | | | |
| Hilton Worldwide Holdings, Inc. (a) | | | 95,140 | | | $ | 2,482,203 | |
| Wynn Resorts Ltd. | | | 21,328 | | | | 3,172,753 | |
| | | | | | | | |
| | | | | | $ | 5,654,956 | |
| | | | | | | | |
| General Merchandise – 1.2% | | | | | | | | |
| Kohl’s Corp. | | | 293,621 | | | $ | 17,922,626 | |
| Target Corp. | | | 247,504 | | | | 18,788,029 | |
| | | | | | | | |
| | | | | | $ | 36,710,655 | |
| | | | | | | | |
| Health Maintenance Organizations – 0.1% | | | | | |
| Health Net, Inc. (a) | | | 49,573 | | | $ | 2,653,643 | |
| | | | | | | | |
| Insurance – 4.3% | | | | | | | | |
| ACE Ltd. | | | 161,208 | | | $ | 18,519,575 | |
| American International Group, Inc. | | | 46,115 | | | | 2,582,901 | |
| Aon PLC | | | 130,522 | | | | 12,377,401 | |
| Chubb Corp. | | | 46,333 | | | | 4,794,076 | |
| Delta Lloyd N.V. | | | 259,935 | | | | 5,712,784 | |
| Everest Re Group Ltd. | | | 28,304 | | | | 4,820,171 | |
| MetLife, Inc. | | | 575,408 | | | | 31,123,819 | |
| Prudential Financial, Inc. | | | 178,822 | | | | 16,176,238 | |
| Travelers Cos., Inc. | | | 175,584 | | | | 18,585,566 | |
| Validus Holdings Ltd. | | | 191,149 | | | | 7,944,152 | |
| Zurich Insurance Group AG | | | 23,655 | | | | 7,407,393 | |
| | | | | | | | |
| | | | | | $ | 130,044,076 | |
| | | | | | | | |
| Internet – 0.8% | | | | | | | | |
| Facebook, Inc., “A” (a) | | | 223,735 | | | $ | 17,455,805 | |
| Google, Inc., “A” (a) | | | 7,461 | | | | 3,959,254 | |
| Google, Inc., “C” (a) | | | 7,461 | | | | 3,927,470 | |
| | | | | | | | |
| | | | | | $ | 25,342,529 | |
| | | | | | | | |
| Leisure & Toys – 0.3% | | | | | | | | |
| Electronic Arts, Inc. (a) | | | 38,919 | | | $ | 1,829,777 | |
| Hasbro, Inc. | | | 98,367 | | | | 5,409,201 | |
| | | | | | | | |
| Issuer | | Shares/Par | | | Value ($) | |
| | | | | | | | |
| COMMON STOCKS – continued | |
| Leisure & Toys – continued | | | | | |
| Mattel, Inc. | | | 28,088 | | | $ | 869,183 | |
| | | | | | | | |
| | | | | | $ | 8,108,161 | |
| | | | | | | | |
| Machinery & Tools – 1.0% | | | | | |
| Caterpillar, Inc. | | | 23,384 | | | $ | 2,140,338 | |
| Cummins, Inc. | | | 66,630 | | | | 9,606,047 | |
| Eaton Corp. PLC | | | 141,229 | | | | 9,597,923 | |
| Illinois Tool Works, Inc. | | | 96,612 | | | | 9,149,156 | |
| | | | | | | | |
| | | | | | $ | 30,493,464 | |
| | | | | | | | |
| Major Banks – 7.0% | | | | | | | | |
| Bank of America Corp. | | | 475,371 | | | $ | 8,504,387 | |
| Bank of New York Mellon Corp. | | | 425,885 | | | | 17,278,154 | |
| BOC Hong Kong Holdings Ltd. | | | 594,000 | | | | 1,977,667 | |
| Goldman Sachs Group, Inc. | | | 113,913 | | | | 22,079,757 | |
| HSBC Holdings PLC | | | 338,283 | | | | 3,196,938 | |
| JPMorgan Chase & Co. | | | 1,170,776 | | | | 73,267,162 | |
| Morgan Stanley | | | 153,295 | | | | 5,947,846 | |
| PNC Financial Services Group, Inc. | | | 92,379 | | | | 8,427,736 | |
| State Street Corp. | | | 172,316 | | | | 13,526,806 | |
| Sumitomo Mitsui Financial Group, Inc. | | | 158,900 | | | | 5,741,455 | |
| Wells Fargo & Co. | | | 957,212 | | | | 52,474,362 | |
| | | | | | | | |
| | | | | | $ | 212,422,270 | |
| | | | | | | | |
| Medical & Health Technology & Services – 0.5% | |
| AmerisourceBergen Corp. | | | 38,166 | | | $ | 3,441,047 | |
| Express Scripts Holding Co. (a) | | | 133,031 | | | | 11,263,735 | |
| | | | | | | | |
| | | | | | $ | 14,704,782 | |
| | | | | | | | |
| Medical Equipment – 2.2% | | | | | | | | |
| Abbott Laboratories | | | 365,930 | | | $ | 16,474,169 | |
| Covidien PLC | | | 98,659 | | | | 10,090,843 | |
| Medtronic, Inc. | | | 170,320 | | | | 12,297,104 | |
| St. Jude Medical, Inc. | | | 156,288 | | | | 10,163,409 | |
| Thermo Fisher Scientific, Inc. | | | 137,756 | | | | 17,259,449 | |
| | | | | | | | |
| | | | | | $ | 66,284,974 | |
| | | | | | | | |
| Metals & Mining – 0.3% | | | | | | | | |
| Rio Tinto Ltd. | | | 136,054 | | | $ | 6,268,356 | |
| Vale S.A., ADR | | | 370,146 | | | | 3,027,794 | |
| | | | | | | | |
| | | | | | $ | 9,296,150 | |
| | | | | | | | |
| Natural Gas – Distribution – 0.2% | | | | | | | | |
| GDF SUEZ | | | 256,786 | | | $ | 5,997,314 | |
| | | | | | | | |
| Natural Gas – Pipeline – 0.2% | | | | | | | | |
| Williams Cos., Inc. | | | 142,562 | | | $ | 6,406,736 | |
| | | | | | | | |
| Oil Services – 0.5% | | | | | | | | |
| Baker Hughes, Inc. | | | 19,453 | | | $ | 1,090,730 | |
| Ensco PLC, “A” | | | 243,710 | | | | 7,299,115 | |
| Schlumberger Ltd. | | | 77,525 | | | | 6,621,410 | |
| | | | | | | | |
| | | | | | $ | 15,011,255 | |
| | | | | | | | |
| Other Banks & Diversified Financials – 1.6% | | | | | |
| American Express Co. | | | 47,903 | | | $ | 4,456,895 | |
| BB&T Corp. | | | 134,107 | | | | 5,215,421 | |
| Citigroup, Inc. | | | 103,929 | | | | 5,623,598 | |
10
MFS Total Return Series
Portfolio of Investments – continued
| | | | | | | | |
| Issuer | | Shares/Par | | | Value ($) | |
| | | | | | | | |
| COMMON STOCKS – continued | | | | | |
| Other Banks & Diversified Financials – continued | |
| Discover Financial Services | | | 124,551 | | | $ | 8,156,845 | |
| SunTrust Banks, Inc. | | | 68,056 | | | | 2,851,546 | |
| U.S. Bancorp | | | 271,537 | | | | 12,205,588 | |
| Visa, Inc., “A” | | | 35,128 | | | | 9,210,562 | |
| | | | | | | | |
| | | | | | $ | 47,720,455 | |
| | | | | | | | |
| Pharmaceuticals – 5.1% | | | | | |
| Actavis PLC (a) | | | 21,991 | | | $ | 5,660,703 | |
| Bayer AG | | | 28,126 | | | | 3,845,828 | |
| Bristol-Myers Squibb Co. | | | 298,015 | | | | 17,591,825 | |
| Eli Lilly & Co. | | | 214,777 | | | | 14,817,465 | |
| GlaxoSmithKline PLC | | | 211,844 | | | | 4,532,413 | |
| Indivior PLC (a) | | | 40,590 | | | | 94,516 | |
| Johnson & Johnson | | | 424,606 | | | | 44,401,049 | |
| Merck & Co., Inc. | | | 528,506 | | | | 30,013,856 | |
| Novartis AG | | | 21,413 | | | | 1,969,300 | |
| Pfizer, Inc. | | | 830,944 | | | | 25,883,906 | |
| Roche Holding AG | | | 6,144 | | | | 1,665,273 | |
| Valeant Pharmaceuticals International, Inc. (a) | | | 33,331 | | | | 4,769,999 | |
| | | | | | | | |
| | | | | | $ | 155,246,133 | |
| | | | | | | | |
| Printing & Publishing – 0.1% | | | | | | | | |
| McGraw-Hill Cos., Inc. | | | 30,272 | | | $ | 2,693,603 | |
| Time, Inc. | | | 6,873 | | | | 169,145 | |
| | | | | | | | |
| | | | | | $ | 2,862,748 | |
| | | | | | | | |
| Railroad & Shipping – 0.2% | | | | | | | | |
| Canadian National Railway Co. | | | 55,176 | | | $ | 3,802,178 | |
| Union Pacific Corp. | | | 31,409 | | | | 3,741,754 | |
| | | | | | | | |
| | | | | | $ | 7,543,932 | |
| | | | | | | | |
| Real Estate – 0.5% | | | | | | | | |
| Iron Mountain, Inc., REIT | | | 90,592 | | | $ | 3,502,287 | |
| Medical Properties Trust, Inc., REIT | | | 185,233 | | | | 2,552,511 | |
| Starwood Property Trust, Inc., REIT | | | 130,098 | | | | 3,023,478 | |
| Washington Prime Group, Inc., REIT | | | 339,603 | | | | 5,847,964 | |
| | | | | | | | |
| | | | | | $ | 14,926,240 | |
| | | | | | | | |
| Restaurants – 0.5% | | | | | | | | |
| McDonald’s Corp. | | | 92,427 | | | $ | 8,660,410 | |
| YUM! Brands, Inc. | | | 69,519 | | | | 5,064,459 | |
| | | | | | | | |
| | | | | | $ | 13,724,869 | |
| | | | | | | | |
| Specialty Chemicals – 0.3% | | | | | | | | |
| FMC Corp. | | | 31,825 | | | $ | 1,814,980 | |
| Marine Harvest | | | 331,019 | | | | 4,535,958 | |
| Praxair, Inc. | | | 22,278 | | | | 2,886,338 | |
| | | | | | | | |
| | | | | | $ | 9,237,276 | |
| | | | | | | | |
| Specialty Stores – 0.7% | | | | | |
| Advance Auto Parts, Inc. | | | 26,771 | | | $ | 4,264,085 | |
| Bed Bath & Beyond, Inc. (a) | | | 21,951 | | | | 1,672,008 | |
| Best Buy Co., Inc. | | | 167,536 | | | | 6,530,553 | |
| L Brands, Inc. | | | 66,346 | | | | 5,742,246 | |
| Staples, Inc. | | | 143,050 | | | | 2,592,066 | |
| | | | | | | | |
| | | | | | $ | 20,800,958 | |
| | | | | | | | |
| | | | | | | | |
| Issuer | | Shares/Par | | | Value ($) | |
| | | | | | | | |
| COMMON STOCKS – continued | | | | | |
| Telecommunications – Wireless – 0.1% | |
| Vodafone Group PLC | | | 1,014,837 | | | $ | 3,477,301 | |
| | | | | | | | |
| Telephone Services – 1.6% | | | | | |
| AT&T, Inc. | | | 140,064 | | | $ | 4,704,750 | |
| CenturyLink, Inc. | | | 132,714 | | | | 5,252,820 | |
| Frontier Communications Corp. | | | 1,403,778 | | | | 9,363,199 | |
| TDC A.S. | | | 488,658 | | | | 3,723,891 | |
| Telefonica Brasil S.A., ADR | | | 125,455 | | | | 2,218,044 | |
| Verizon Communications, Inc. | | | 506,801 | | | | 23,708,151 | |
| Windstream Holdings, Inc. | | | 185,064 | | | | 1,524,927 | |
| | | | | | | | |
| | | | | | $ | 50,495,782 | |
| | | | | | | | |
| Tobacco – 2.8% | | | | | | | | |
| Altria Group, Inc. | | | 247,625 | | | $ | 12,200,484 | |
| Imperial Tobacco Group PLC | | | 28,699 | | | | 1,256,820 | |
| Japan Tobacco, Inc. | | | 269,900 | | | | 7,410,937 | |
| Lorillard, Inc. | | | 259,517 | | | | 16,334,000 | |
| Philip Morris International, Inc. | | | 569,567 | | | | 46,391,232 | |
| | | | | | | | |
| | | | | | $ | 83,593,473 | |
| | | | | | | | |
| Trucking – 0.5% | | | | | | | | |
| United Parcel Service, Inc., “B” | | | 134,472 | | | $ | 14,949,252 | |
| | | | | | | | |
| Utilities – Electric Power – 1.3% | | | | | |
| American Electric Power Co., Inc. | | | 140,962 | | | $ | 8,559,213 | |
| Duke Energy Corp. | | | 52,905 | | | | 4,419,684 | |
| Edison International | | | 33,698 | | | | 2,206,545 | |
| NRG Energy, Inc. | | | 123,043 | | | | 3,316,009 | |
| PG&E Corp. | | | 87,495 | | | | 4,658,234 | |
| PPL Corp. | | | 347,570 | | | | 12,627,218 | |
| Public Service Enterprise Group, Inc. | | | 86,367 | | | | 3,576,457 | |
| | | | | | | | |
| | | | | | $ | 39,363,360 | |
| | | | | | | | |
Total Common Stocks
(Identified Cost, $1,361,000,122) | | | $ | 1,824,936,783 | |
| | | | | | | | |
| | |
| BONDS – 38.4% | | | | | | | | |
| Agency – Other – 0.1% | | | | | |
| Financing Corp., 9.65%, 11/02/18 | | $ | 1,275,000 | | | $ | 1,655,639 | |
| | | | | | | | |
| Asset-Backed & Securitized – 2.5% | | | | | |
| Bayview Financial Revolving Mortgage Loan Trust, FRN, 1.769%, 12/28/40 (z) | | $ | 2,945,801 | | | $ | 1,758,200 | |
| BlackRock Capital Finance LP, 7.75%, 9/25/26 (z) | | | 89,354 | | | | 5,071 | |
| Cent LP, 2013-17A, “A1”, CLO, FRN, 1.532%, 1/30/25 (z) | | | 2,547,000 | | | | 2,513,204 | |
| Citigroup Commercial Mortgage Trust, FRN, 5.71%, 12/10/49 | | | 3,050,000 | | | | 3,308,216 | |
| Citigroup/Deutsche Bank Commercial Mortgage Trust, 5.322%, 12/11/49 | | | 4,261,918 | | | | 4,511,824 | |
| Credit Suisse Mortgage Capital Certificate, FRN, 5.695%, 9/15/40 | | | 5,852,223 | | | | 6,313,940 | |
| Dryden Senior Loan Fund, 2013-26A, “A”, CLO, FRN, 1.33%, 7/15/25 (z) | | | 3,273,000 | | | | 3,205,020 | |
| Ford Credit Auto Owner Trust, 2014-1, “A”, 2.26%, 11/15/25 (n) | | | 1,735,000 | | | | 1,744,322 | |
11
MFS Total Return Series
Portfolio of Investments – continued
| | | | | | | | |
| Issuer | | Shares/Par | | | Value ($) | |
| | | | | | | | |
| BONDS – continued | | | | | | | | |
| Asset-Backed & Securitized – continued | | | | | |
| Ford Credit Auto Owner Trust, 2014-2, “A”, 2.31%, 4/15/26 (n) | | $ | 1,465,000 | | | $ | 1,468,791 | |
| GMAC Mortgage Corp. Loan Trust, FRN, 5.805%, 10/25/36 | | | 1,205,990 | | | | 1,149,161 | |
| Goldman Sachs Mortgage Securities Corp., FRN, 5.795%, 8/10/45 | | | 9,138,020 | | | | 9,895,205 | |
| Greenwich Capital Commercial Funding Corp., 5.475%, 3/10/39 | | | 5,978,000 | | | | 6,265,303 | |
| ING Investment Management Ltd., 2013-2A, “A1”, CLO, FRN, 1.383%, 4/25/25 (z) | | | 2,971,000 | | | | 2,918,425 | |
| JPMorgan Chase Commercial Mortgage Securities Corp., 4.78%, 7/15/42 | | | 4,257,000 | | | | 4,290,149 | |
| JPMorgan Chase Commercial Mortgage Securities Corp., 5.552%, 5/12/45 | | | 1,097,863 | | | | 1,147,003 | |
| JPMorgan Chase Commercial Mortgage Securities Corp., “A3”, FRN, 5.939%, 2/15/51 | | | 421,803 | | | | 422,416 | |
| JPMorgan Chase Commercial Mortgage Securities Corp., “A4”, FRN, 5.787%, 6/15/49 | | | 777,548 | | | | 834,961 | |
| JPMorgan Chase Commercial Mortgage Securities Corp., FRN, 4.948%, 9/12/37 | | | 2,548,000 | | | | 2,594,432 | |
| JPMorgan Chase Commercial Mortgage Securities Corp., FRN, 5.475%, 4/15/43 | | | 4,792,997 | | | | 4,938,877 | |
| Merrill Lynch Mortgage Trust, “A3”, FRN, 5.834%, 6/12/50 | | | 240,531 | | | | 240,677 | |
| Merrill Lynch/Countrywide Commercial Mortgage Trust, FRN, 5.743%, 6/12/50 | | | 7,062,966 | | | | 7,629,169 | |
| Morgan Stanley Capital I, Inc., FRN, 0.938%, 11/15/30 (i)(n) | | | 4,268,130 | | | | 99,563 | |
| Race Point CLO Ltd., “A1A”, FRN, 0.432%, 8/01/21 (n) | | | 1,804,629 | | | | 1,794,519 | |
| Residential Funding Mortgage Securities, Inc., FRN, 5.32%, 12/25/35 | | | 2,559,472 | | | | 2,080,915 | |
| Wachovia Bank Commercial Mortgage Trust, “A4”, FRN, 5.941%, 2/15/51 | | | 769,526 | | | | 822,418 | |
| Wachovia Bank Commercial Mortgage Trust, FRN, 5.716%, 6/15/49 | | | 4,011,472 | | | | 4,306,953 | |
| | | | | | | | |
| | | | | | $ | 76,258,734 | |
| | | | | | | | |
| Automotive – 0.3% | | | | | |
| Toyota Motor Credit Corp., 3.2%, 6/17/15 | | $ | 2,200,000 | | | $ | 2,227,586 | |
| Toyota Motor Credit Corp., 3.4%, 9/15/21 | | | 3,170,000 | | | | 3,334,089 | �� |
| Volkswagen International Finance N.V., 2.375%, 3/22/17 (n) | | | 3,032,000 | | | | 3,088,516 | |
| | | | | | | | |
| | | | | | $ | 8,650,191 | |
| | | | | | | | |
| Broadcasting – 0.2% | | | | | | | | |
| Discovery Communications, Inc., 4.875%, 4/01/43 | | $ | 2,180,000 | | | $ | 2,247,626 | |
| Grupo Televisa S.A.B., 5%, 5/13/45 | | | 1,122,000 | | | | 1,132,579 | |
| News America, Inc., 8.5%, 2/23/25 | | | 2,839,000 | | | | 3,847,813 | |
| | | | | | | | |
| | | | | | $ | 7,228,018 | |
| | | | | | | | |
| | | | | | | | |
| Issuer | | Shares/Par | | | Value ($) | |
| | | | | | | | |
| BONDS – continued | | | | | | | | |
| Cable TV – 0.3% | | | | | | | | |
| Comcast Corp., 2.85%, 1/15/23 | | $ | 3,520,000 | | | $ | 3,496,525 | |
| Time Warner Entertainment Co. LP, 8.375%, 7/15/33 | | | 2,855,000 | | | | 4,284,598 | |
| | | | | | | | |
| | | | | | $ | 7,781,123 | |
| | | | | | | | |
| Computer Software – Systems – 0.1% | | | | | |
| Apple, Inc., 3.85%, 5/04/43 | | $ | 1,303,000 | | | $ | 1,303,942 | |
| | | | | | | | |
| Conglomerates – 0.1% | | | | | | | | |
| ABB Finance (USA), Inc., 2.875%, 5/08/22 | | $ | 1,096,000 | | | $ | 1,101,479 | |
| General Electric Co., 2.7%, 10/09/22 | | | 2,780,000 | | | | 2,781,129 | |
| | | | | | | | |
| | | | | | $ | 3,882,608 | |
| | | | | | | | |
| Consumer Products – 0.1% | | | | | | | | |
| Reckitt Benckiser Treasury Services PLC, 3.625%, 9/21/23 (n) | | $ | 3,463,000 | | | $ | 3,629,349 | |
| | | | | | | | |
| Defense Electronics – 0.1% | | | | | | | | |
| BAE Systems Holdings, Inc., 5.2%, 8/15/15 (n) | | $ | 1,936,000 | | | $ | 1,986,961 | |
| | | | | | | | |
| Emerging Market Quasi-Sovereign – 0.5% | | | | | |
| CNOOC Finance (2012) Ltd., 3.875%, 5/02/22 (n) | | $ | 3,630,000 | | | $ | 3,692,708 | |
| Corporacion Nacional del Cobre de Chile, 3.75%, 11/04/20 (n) | | | 1,088,000 | | | | 1,113,374 | |
| Petroleos Mexicanos, 3.125%, 1/23/19 | | | 1,277,000 | | | | 1,280,193 | |
| Petroleos Mexicanos, 8%, 5/03/19 | | | 2,671,000 | | | | 3,158,458 | |
| Ras Laffan Liquefied Natural Gas Co. Ltd., 5.832%, 9/30/16 (n) | | | 1,457,255 | | | | 1,517,367 | |
| State Grid Overseas Investment (2014) Ltd., 2.75%, 5/07/19 (z) | | | 2,591,000 | | | | 2,601,885 | |
| | | | | | | | |
| | | | | | $ | 13,363,985 | |
| | | | | | | | |
| Emerging Market Sovereign – 0.1% | | | | | |
| Republic of Peru, 7.35%, 7/21/25 | | $ | 287,000 | | | $ | 380,993 | |
| United Mexican States, 4.75%, 3/08/44 | | | 2,089,000 | | | | 2,177,783 | |
| | | | | | | | |
| | | | | | $ | 2,558,776 | |
| | | | | | | | |
| Energy – Independent – 0.2% | | | | | | | | |
| Anadarko Petroleum Corp., 6.375%, 9/15/17 | | $ | 1,571,000 | | | $ | 1,746,759 | |
| Apache Corp., 3.25%, 4/15/22 | | | 1,493,000 | | | | 1,466,911 | |
| Apache Corp., 4.75%, 4/15/43 | | | 1,141,000 | | | | 1,070,024 | |
| EOG Resources, Inc., 2.625%, 3/15/23 | | | 1,069,000 | | | | 1,025,074 | |
| | | | | | | | |
| | | | | | $ | 5,308,768 | |
| | | | | | | | |
| Energy – Integrated – 0.6% | | | | | | | | |
| BP Capital Markets PLC, 4.5%, 10/01/20 | | $ | 1,054,000 | | | $ | 1,140,395 | |
| BP Capital Markets PLC, 4.742%, 3/11/21 | | | 3,027,000 | | | | 3,294,917 | |
| Chevron Corp., 0.402%, 11/15/17 | | | 5,248,000 | | | | 5,241,881 | |
| Petro-Canada, 6.05%, 5/15/18 | | | 1,942,000 | | | | 2,184,255 | |
| Total Capital International S.A., 1.55%, 6/28/17 | | | 3,169,000 | | | | 3,180,019 | |
12
MFS Total Return Series
Portfolio of Investments – continued
| | | | | | | | |
| Issuer | | Shares/Par | | | Value ($) | |
| | | | | | | | |
| BONDS – continued | | | | | | | | |
| Energy – Integrated – continued | | | | | |
| Total Capital International S.A., 3.75%, 4/10/24 | | $ | 3,360,000 | | | $ | 3,481,356 | |
| | | | | | | | |
| | | | | | $ | 18,522,823 | |
| | | | | | | | |
| Financial Institutions – 0.1% | | | | | | | | |
| General Electric Capital Corp., 2.3%, 1/14/19 | | $ | 2,330,000 | | | $ | 2,367,182 | |
| General Electric Capital Corp., 3.1%, 1/09/23 | | | 1,689,000 | | | | 1,710,104 | |
| | | | | | | | |
| | | | | | $ | 4,077,286 | |
| | | | | | | | |
| Food & Beverages – 0.4% | | | | | | | | |
| Anheuser-Busch InBev S.A., 8%, 11/15/39 | | $ | 3,600,000 | | | $ | 5,505,858 | |
| Conagra Foods, Inc., 3.2%, 1/25/23 | | | 1,321,000 | | | | 1,293,941 | |
| Diageo Capital PLC, 2.625%, 4/29/23 | | | 1,270,000 | | | | 1,234,789 | |
| Kraft Foods Group, Inc., 3.5%, 6/06/22 | | | 1,463,000 | | | | 1,499,154 | |
| Kraft Foods Group, Inc., 5%, 6/04/42 | | | 1,740,000 | | | | 1,915,397 | |
| Wm. Wrigley Jr. Co., 2.4%, 10/21/18 (n) | | | 756,000 | | | | 761,323 | |
| | | | | | | | |
| | | | | | $ | 12,210,462 | |
| | | | | | | | |
| Food & Drug Stores – 0.1% | | | | | | | | |
| Walgreens Boots Alliance, Inc., 3.3%, 11/18/21 | | $ | 2,550,000 | | | $ | 2,567,740 | |
| Walgreens Boots Alliance, Inc., 4.5%, 11/18/34 | | | 1,318,000 | | | | 1,372,567 | |
| | | | | | | | |
| | | | | | $ | 3,940,307 | |
| | | | | | | | |
| Insurance – 0.3% | | | | | | | | |
| American International Group, Inc., 4.875%, 6/01/22 | | $ | 5,088,000 | | | $ | 5,715,574 | |
| American International Group, Inc., 4.125%, 2/15/24 | | | 2,620,000 | | | | 2,789,021 | |
| | | | | | | | |
| | | | | | $ | 8,504,595 | |
| | | | | | | | |
| Insurance – Health – 0.1% | | | | | | | | |
| WellPoint, Inc., 3.3%, 1/15/23 | | $ | 2,122,000 | | | $ | 2,119,931 | |
| | | | | | | | |
| Insurance – Property & Casualty – 0.5% | | | | | |
| ACE Ltd., 2.7%, 3/13/23 | | $ | 3,560,000 | | | $ | 3,456,685 | |
| Allstate Corp., 5.75%, 8/15/53 | | | 1,025,000 | | | | 1,080,094 | |
| Chubb Corp., 6.375% to 4/15/17, FRN to 3/29/67 | | | 4,072,000 | | | | 4,365,388 | |
| Liberty Mutual Group, Inc., 4.25%, 6/15/23 (n) | | | 1,699,000 | | | | 1,750,784 | |
| Marsh & McLennan Cos., Inc., 4.8%, 7/15/21 | | | 3,270,000 | | | | 3,634,343 | |
| ZFS Finance USA Trust V, 6.5% to 5/09/17, FRN to 5/09/67 (n) | | | 1,514,000 | | | | 1,612,410 | |
| | | | | | | | |
| | | | | | $ | 15,899,704 | |
| | | | | | | | |
| International Market Quasi-Sovereign – 0.5% | | | | | |
| KFW International Finance, Inc., 4.875%, 6/17/19 | | $ | 4,560,000 | | | $ | 5,183,762 | |
| Statoil A.S.A., 3.7%, 3/01/24 | | | 2,818,000 | | | | 2,917,574 | |
| | | | | | | | |
| Issuer | | Shares/Par | | | Value ($) | |
| | | | | | | | |
| BONDS – continued | | | | | | | | |
| International Market Quasi-Sovereign – continued | |
| Temasek Financial I Ltd., 2.375%, 1/23/23 (n) | | $ | 6,400,000 | | | $ | 6,221,389 | |
| | | | | | | | |
| | | | | | $ | 14,322,725 | |
| | | | | | | | |
| International Market Sovereign – 0.1% | | | | | |
| Republic of Iceland, 4.875%, 6/16/16 (n) | | $ | 3,440,000 | | | $ | 3,599,461 | |
| | | | | | | | |
| Internet – 0.1% | | | | | | | | |
| Baidu, Inc., 3.5%, 11/28/22 | | $ | 3,950,000 | | | $ | 3,905,803 | |
| | | | | | | | |
| Local Authorities – 0.2% | | | | | | | | |
| New Jersey Turnpike Authority Rev. (Build America Bonds), “F”, 7.414%, 1/01/40 | | $ | 3,685,000 | | | $ | 5,537,597 | |
| | | | | | | | |
| Machinery & Tools – 0.1% | | | | | | | | |
| Atlas Copco AB, 5.6%, 5/22/17 (n) | | $ | 2,786,000 | | | $ | 3,039,585 | |
| | | | | | | | |
| Major Banks – 1.9% | | | | | | | | |
| Banco Santander U.S. Debt S.A.U., 3.781%, 10/07/15 (n) | | $ | 1,800,000 | | | $ | 1,838,104 | |
| Bank of America Corp., 5.49%, 3/15/19 | | | 2,989,000 | | | | 3,307,373 | |
| Bank of America Corp., 7.625%, 6/01/19 | | | 2,480,000 | | | | 2,997,358 | |
| Bank of America Corp., 4.1%, 7/24/23 | | | 3,870,000 | | | | 4,075,691 | |
| Bank of America Corp., 4.125%, 1/22/24 | | | 5,102,000 | | | | 5,357,891 | |
| BNP Paribas, 7.195% to 6/25/37, FRN to 6/29/49 (n) | | | 1,842,000 | | | | 2,134,418 | |
| Credit Suisse Group AG, 6.5%, 8/08/23 (n) | | | 3,520,000 | | | | 3,863,978 | |
| Goldman Sachs Group, Inc., 5.625%, 1/15/17 | | | 4,227,000 | | | | 4,534,104 | |
| HSBC Holdings PLC, 5.1%, 4/05/21 | | | 2,410,000 | | | | 2,724,259 | |
| ING Bank N.V., 5.8%, 9/25/23 (n) | | | 3,438,000 | | | | 3,813,701 | |
| JPMorgan Chase & Co., 6.3%, 4/23/19 | | | 3,410,000 | | | | 3,960,971 | |
| JPMorgan Chase & Co., 3.25%, 9/23/22 | | | 1,120,000 | | | | 1,126,524 | |
| JPMorgan Chase & Co., 3.2%, 1/25/23 | | | 3,871,000 | | | | 3,872,634 | |
| Morgan Stanley, 3.875%, 4/29/24 | | | 3,188,000 | | | | 3,271,003 | |
| Morgan Stanley, 6.625%, 4/01/18 | | | 4,287,000 | | | | 4,883,043 | |
| PNC Funding Corp., 5.625%, 2/01/17 | | | 3,348,000 | | | | 3,613,476 | |
| Royal Bank of Scotland PLC, 2.55%, 9/18/15 | | | 875,000 | | | | 883,748 | |
| Wells Fargo & Co., 5.9% to 6/15/24, FRN to 12/29/49 | | | 1,743,000 | | | | 1,756,073 | |
| | | | | | | | |
| | | | | | $ | 58,014,349 | |
| | | | | | | | |
| Medical & Health Technology & Services – 0.3% | | | | | |
| Becton, Dickinson and Co., 2.675%, 12/15/19 | | $ | 1,842,000 | | | $ | 1,866,224 | |
| CareFusion Corp., 6.375%, 8/01/19 | | | 3,950,000 | | | | 4,570,142 | |
| Express Scripts Holding Co., 2.65%, 2/15/17 | | | 3,087,000 | | | | 3,156,612 | |
| | | | | | | | |
| | | | | | $ | 9,592,978 | |
| | | | | | | | |
| Medical Equipment – 0.1% | | | | | | | | |
| Medtronic, Inc., 4.375%, 3/15/35 (n) | | $ | 3,083,000 | | | $ | 3,270,619 | |
| | | | | | | | |
13
MFS Total Return Series
Portfolio of Investments – continued
| | | | | | | | |
| Issuer | | Shares/Par | | | Value ($) | |
| | | | | | | | |
| BONDS – continued | | | | | | | | |
| Metals & Mining – 0.2% | | | | | | | | |
| Freeport-McMoRan Copper & Gold, Inc., 3.875%, 3/15/23 | | $ | 3,570,000 | | | $ | 3,365,925 | |
| Rio Tinto Finance (USA) PLC, 3.5%, 3/22/22 | | | 3,220,000 | | | | 3,219,098 | |
| | | | | | | | |
| | | | | | $ | 6,585,023 | |
| | | | | | | | |
| Midstream – 0.5% | | | | | | | | |
| Energy Transfer Partners LP, 3.6%, 2/01/23 | | $ | 1,975,000 | | | $ | 1,911,144 | |
| Energy Transfer Partners LP, 4.9%, 2/01/24 | | | 1,270,000 | | | | 1,330,795 | |
| Enterprise Products Operating LP, 6.5%, 1/31/19 | | | 2,995,000 | | | | 3,432,746 | |
| Kinder Morgan Energy Partners LP, 4.15%, 2/01/24 | | | 1,369,000 | | | | 1,365,498 | |
| Kinder Morgan Energy Partners LP, 7.4%, 3/15/31 | | | 1,023,000 | | | | 1,223,883 | |
| Kinder Morgan Energy Partners LP, 7.75%, 3/15/32 | | | 1,661,000 | | | | 2,046,379 | |
| Spectra Energy Capital LLC, 8%, 10/01/19 | | | 2,734,000 | | | | 3,308,443 | |
| | | | | | | | |
| | | | | | $ | 14,618,888 | |
| | | | | | | | |
| Mortgage-Backed – 12.4% | | | | | | | | |
| Fannie Mae, 3.5%, 7/01/43 | | $ | 2,431,554 | | | $ | 2,536,466 | |
| Fannie Mae, 4.56%, 3/01/15 | | | 303,595 | | | | 304,908 | |
| Fannie Mae, 4.869%, 4/01/15 | | | 21,438 | | | | 21,399 | |
| Fannie Mae, 5.1%, 6/01/15 | | | 480,000 | | | | 480,981 | |
| Fannie Mae, 4.78%, 8/01/15 | | | 420,816 | | | | 426,401 | |
| Fannie Mae, 4.856%, 8/01/15 | | | 277,459 | | | | 281,082 | |
| Fannie Mae, 5.036%, 8/01/15 | | | 30,105 | | | | 30,214 | |
| Fannie Mae, 5.19%, 11/01/15 | | | 382,805 | | | | 389,701 | |
| Fannie Mae, 5.662%, 2/01/16 | | | 681,476 | | | | 702,545 | |
| Fannie Mae, 5.5%, 7/01/16 - 4/01/40 | | | 28,957,054 | | | | 32,438,632 | |
| Fannie Mae, 5.732%, 7/01/16 | | | 894,803 | | | | 943,980 | |
| Fannie Mae, 5.09%, 12/01/16 | | | 486,785 | | | | 517,786 | |
| Fannie Mae, 5.27%, 12/01/16 | | | 1,580,039 | | | | 1,684,221 | |
| Fannie Mae, 5.003%, 1/01/17 | | | 17,190 | | | | 17,174 | |
| Fannie Mae, 5.05%, 1/01/17 | | | 463,871 | | | | 487,783 | |
| Fannie Mae, 6%, 1/01/17 - 7/01/37 | | | 15,672,038 | | | | 17,640,678 | |
| Fannie Mae, 3.8%, 2/01/18 | | | 317,612 | | | | 337,828 | |
| Fannie Mae, 3.91%, 2/01/18 | | | 463,797 | | | | 492,187 | |
| Fannie Mae, 5%, 2/01/18 - 3/01/41 | | | 13,187,805 | | | | 14,482,190 | |
| Fannie Mae, 4.5%, 4/01/18 - 4/01/44 | | | 21,889,921 | | | | 23,806,266 | |
| Fannie Mae, 2.578%, 9/25/18 | | | 2,388,000 | | | | 2,446,836 | |
| Fannie Mae, 4.6%, 9/01/19 | | | 487,825 | | | | 537,563 | |
| Fannie Mae, 4.88%, 3/01/20 | | | 637,659 | | | | 692,008 | |
| Fannie Mae, 2.59%, 5/01/23 | | | 490,026 | | | | 492,733 | |
| Fannie Mae, 3%, 3/01/27 - 4/01/27 | | | 2,488,024 | | | | 2,592,205 | |
| Fannie Mae, 2.5%, 2/01/28 - 5/01/28 | | | 2,377,688 | | | | 2,424,940 | |
| Fannie Mae, 6.5%, 6/01/31 - 7/01/37 | | | 4,528,715 | | | | 5,199,609 | |
| Fannie Mae, 4%, 2/01/41 | | | 849,789 | | | | 907,711 | |
| Fannie Mae, 3.5%, 11/01/41 - 6/01/43 | | | 6,802,982 | | | | 7,109,320 | |
| Fannie Mae, 3.5%, 4/01/43 - 9/01/43 | | | 12,566,574 | | | | 13,108,770 | |
| Fannie Mae, TBA, 4%, 2/01/45 | | | 44,420,000 | | | | 47,270,632 | |
| Fannie Mae, TBA, 3%, 1/01/30 | | | 9,700,000 | | | | 10,079,047 | |
| | | | | | | | |
| Issuer | | Shares/Par | | | Value ($) | |
| | | | | | | | |
| BONDS – continued | | | | | | | | |
| Mortgage-Backed – continued | | | | | | | | |
| Fannie Mae, TBA, 3.5%, 1/01/45-2/01/45 | | $ | 5,771,000 | | | $ | 6,001,463 | |
| Fannie Mae, TBA, 4%, 1/01/45 | | | 5,488,000 | | | | 5,855,196 | |
| Fannie Mae, TBA, 4.5%, 2/01/45 | | | 3,460,000 | | | | 3,748,484 | |
| Freddie Mac, 3.034%, 10/25/20 | | | 558,000 | | | | 582,958 | |
| Freddie Mac, 6%, 4/01/16 - 6/01/37 | | | 7,074,645 | | | | 8,023,932 | |
| Freddie Mac, 3.882%, 11/25/17 | | | 1,246,615 | | | | 1,325,715 | |
| Freddie Mac, 5%, 12/01/17 - 7/01/39 | | | 7,631,171 | | | | 8,413,824 | |
| Freddie Mac, 3.154%, 2/25/18 | | | 430,000 | | | | 450,698 | |
| Freddie Mac, 4.5%, 5/01/18 - 10/01/39 | | | 6,015,035 | | | | 6,465,026 | |
| Freddie Mac, 2.412%, 8/25/18 | | | 1,820,000 | | | | 1,864,262 | |
| Freddie Mac, 2.303%, 9/25/18 | | | 617,765 | | | | 630,055 | |
| Freddie Mac, 5.5%, 1/01/19 - 2/01/37 | | | 6,278,657 | | | | 7,003,821 | |
| Freddie Mac, 5.085%, 3/25/19 | | | 4,316,000 | | | | 4,845,539 | |
| Freddie Mac, 2.456%, 8/25/19 | | | 500,000 | | | | 510,649 | |
| Freddie Mac, 1.869%, 11/25/19 | | | 1,266,000 | | | | 1,258,528 | |
| Freddie Mac, 3.808%, 8/25/20 | | | 3,705,000 | | | | 4,009,673 | |
| Freddie Mac, 3.32%, 2/25/23 | | | 618,000 | | | | 650,496 | |
| Freddie Mac, 3.458%, 8/25/23 | | | 2,553,000 | | | | 2,711,886 | |
| Freddie Mac, 6.5%, 5/01/34 - 2/01/38 | | | 2,726,010 | | | | 3,114,782 | |
| Freddie Mac, 4%, 11/01/40 - 11/01/43 | | | 16,222,166 | | | | 17,309,405 | |
| Freddie Mac, 3.5%, 2/01/42 - 8/01/43 | | | 18,104,848 | | | | 18,877,705 | |
| Freddie Mac, 3%, 3/01/43 - 5/01/43 | | | 15,834,194 | | | | 16,026,931 | |
| Freddie Mac, TBA, 4%, 1/01/45 | | | 9,063,000 | | | | 9,657,579 | |
| Ginnie Mae, 4%, 2/20/42 | | | 207,081 | | | | 222,203 | |
| Ginnie Mae, 3%, 2/15/43 - 6/20/43 | | | 7,411,601 | | | | 7,591,117 | |
| Ginnie Mae, 6%, 9/15/32 - 1/15/38 | | | 4,693,007 | | | | 5,422,457 | |
| Ginnie Mae, 5.5%, 5/15/33 - 10/15/35 | | | 3,103,511 | | | | 3,484,107 | |
| Ginnie Mae, 4.5%, 7/20/33 - 10/20/43 | | | 11,518,177 | | | | 12,647,875 | |
| Ginnie Mae, 5%, 7/20/33 - 12/15/34 | | | 1,049,419 | | | | 1,162,461 | |
| Ginnie Mae, 4%, 1/20/41 - 4/20/41 | | | 9,282,018 | | | | 9,984,545 | |
| Ginnie Mae, 3.5%, 12/15/41 - 7/20/43 | | | 14,611,356 | | | | 15,362,691 | |
| Ginnie Mae, 3%, 7/20/43 | | | 823,042 | | | | 842,239 | |
| | | | | | | | |
| | | | | | $ | 376,942,098 | |
| | | | | | | | |
| Network & Telecom – 0.4% | | | | | | | | |
| Verizon Communications, Inc., 6.4%, 9/15/33 | | $ | 4,093,000 | | | $ | 5,041,688 | |
| Verizon Communications, Inc., 6.55%, 9/15/43 | | | 5,160,000 | | | | 6,610,729 | |
| | | | | | | | |
| | | | | | $ | 11,652,417 | |
| | | | | | | | |
| Oil Services – 0.1% | | | | | | | | |
| Transocean, Inc., 3.8%, 10/15/22 | | $ | 1,785,000 | | | $ | 1,446,430 | |
| | | | | | | | |
| Other Banks & Diversified Financials – 0.8% | | | | | |
| Banco Bradesco S.A., 6.75%, 9/29/19 (n) | | $ | 2,072,000 | | | $ | 2,299,920 | |
| Banco de Credito del Peru, 5.375%, 9/16/20 | | | 2,967,000 | | | | 3,204,360 | |
| BBVA Bancomer S.A. de C.V., 6.75%, 9/30/22 (n) | | | 2,890,000 | | | | 3,179,000 | |
| Capital One Financial Corp., 6.15%, 9/01/16 | | | 4,542,000 | | | | 4,882,228 | |
| Citigroup, Inc., 2.5%, 9/26/18 | | | 2,450,000 | | | | 2,478,626 | |
| Discover Bank, 4.2%, 8/08/23 | | | 1,540,000 | | | | 1,615,968 | |
14
MFS Total Return Series
Portfolio of Investments – continued
| | | | | | | | |
| Issuer | | Shares/Par | | | Value ($) | |
| | | | | | | | |
| BONDS – continued | | | | | | | | |
| Other Banks & Diversified Financials – continued | |
| Groupe BPCE S.A., 12.5% to 9/30/19, FRN to 8/29/49 (n) | | $ | 3,106,000 | | | $ | 4,193,100 | |
| Swedbank AB, 2.125%, 9/29/17 (n) | | | 821,000 | | | | 830,522 | |
| U.S. Bancorp, 3.7%, 1/30/24 | | | 2,301,000 | | | | 2,418,857 | |
| | | | | | | | |
| | | | | | $ | 25,102,581 | |
| | | | | | | | |
| Pharmaceuticals – 0.3% | | | | | | | | |
| AbbVie, Inc., 1.2%, 11/06/15 | | $ | 2,310,000 | | | $ | 2,316,771 | |
| Gilead Sciences, Inc., 3.7%, 4/01/24 | | | 915,000 | | | | 959,680 | |
| Gilead Sciences, Inc., 3.5%, 2/01/25 | | | 2,039,000 | | | | 2,092,830 | |
| Roche Holdings, Inc., 6%, 3/01/19 (n) | | | 912,000 | | | | 1,053,347 | |
| Teva Pharmaceutical Finance IV LLC, 3.65%, 11/10/21 | | | 3,146,000 | | | | 3,223,766 | |
| | | | | | | | |
| | | | | | $ | 9,646,394 | |
| | | | | | | | |
| Real Estate – Apartment – 0.1% | | | | | | | | |
| ERP Operating LP, REIT, 4.625%, 12/15/21 | | $ | 3,238,000 | | | $ | 3,542,404 | |
| | | | | | | | |
| Real Estate – Healthcare – 0.1% | | | | | | | | |
| HCP, Inc., REIT, 5.375%, 2/01/21 | | $ | 2,622,000 | | | $ | 2,928,003 | |
| | | | | | | | |
| Retailers – 0.4% | | | | | | | | |
| Gap, Inc., 5.95%, 4/12/21 | | $ | 2,180,000 | | | $ | 2,480,853 | |
| Home Depot, Inc., 3.75%, 2/15/24 | | | 1,900,000 | | | | 2,029,382 | |
| Home Depot, Inc., 5.95%, 4/01/41 | | | 989,000 | | | | 1,291,709 | |
| Wal-Mart Stores, Inc., 5.25%, 9/01/35 | | | 5,931,000 | | | | 7,134,157 | |
| | | | | | | | |
| | | | | | $ | 12,936,101 | |
| | | | | | | | |
| Supranational – 0.1% | | | | | | | | |
| Asian Development Bank, 1.125%, 3/15/17 | | $ | 2,069,000 | | | $ | 2,079,653 | |
| | | | | | | | |
| Telecommunications – Wireless – 0.5% | | | | | |
| American Tower Trust I, REIT, 3.07%, 3/15/23 (n) | | $ | 3,560,000 | | | $ | 3,539,103 | |
| Crown Castle Towers LLC, 6.113%, 1/15/20 (n) | | | 2,493,000 | | | | 2,863,565 | |
| Crown Castle Towers LLC, 4.883%, 8/15/20 (n) | | | 1,270,000 | | | | 1,396,017 | |
| Rogers Communications, Inc., 6.8%, 8/15/18 | | | 5,026,000 | | | | 5,800,718 | |
| | | | | | | | |
| | | | | | $ | 13,599,403 | |
| | | | | | | | |
| Tobacco – 0.2% | | | | | | | | |
| Altria Group, Inc., 2.85%, 8/09/22 | | $ | 3,640,000 | | | $ | 3,536,973 | |
| B.A.T. International Finance PLC, 3.25%, 6/07/22 (n) | | | 3,636,000 | | | | 3,656,325 | |
| | | | | | | | |
| | | | | | $ | 7,193,298 | |
| | | | | | | | |
| Transportation – Services – 0.1% | |
| ERAC USA Finance Co., 7%, 10/15/37 (n) | | $ | 2,696,000 | | | $ | 3,633,165 | |
| | | | | | | | |
| U.S. Government Agencies and Equivalents – 0.2% | |
| Aid-Egypt, 4.45%, 9/15/15 | | $ | 152,000 | | | $ | 156,363 | |
| Small Business Administration, 4.35%, 7/01/23 | | | 9,295 | | | | 9,798 | |
| | | | | | | | |
| Issuer | | Shares/Par | | | Value ($) | |
| | | | | | | | |
| BONDS – continued | | | | | | | | |
| U.S. Government Agencies and Equivalents – continued | |
| Small Business Administration, 4.77%, 4/01/24 | | $ | 468,875 | | | $ | 497,469 | |
| Small Business Administration, 5.18%, 5/01/24 | | | 850,434 | | | | 919,130 | |
| Small Business Administration, 5.52%, 6/01/24 | | | 44,044 | | | | 48,533 | |
| Small Business Administration, 4.99%, 9/01/24 | | | 807,369 | | | | 872,734 | |
| Small Business Administration, 4.95%, 3/01/25 | | | 29,051 | | | | 31,513 | |
| Small Business Administration, 5.11%, 8/01/25 | | | 3,096,817 | | | | 3,353,023 | |
| | | | | | | | |
| | | | | | $ | 5,888,563 | |
| | | | | | | | |
| U.S. Treasury Obligations – 11.3% | |
| U.S. Treasury Bonds, 8.5%, 2/15/20 | | $ | 5,808,000 | | | $ | 7,760,487 | |
| U.S. Treasury Bonds, 8%, 11/15/21 | | | 723,000 | | | | 1,005,422 | |
| U.S. Treasury Bonds, 6%, 2/15/26 | | | 777,000 | | | | 1,064,732 | |
| U.S. Treasury Bonds, 6.75%, 8/15/26 | | | 2,569,000 | | | | 3,748,330 | |
| U.S. Treasury Bonds, 5.375%, 2/15/31 | | | 574,000 | | | | 800,551 | |
| U.S. Treasury Bonds, 4.5%, 2/15/36 | | | 1,203,000 | | | | 1,606,005 | |
| U.S. Treasury Bonds, 5%, 5/15/37 | | | 1,609,000 | | | | 2,297,350 | |
| U.S. Treasury Bonds, 4.5%, 8/15/39 | | | 59,936,600 | | | | 79,931,090 | |
| U.S. Treasury Bonds, 2.875%, 5/15/43 | | | 6,500,000 | | | | 6,653,361 | |
| U.S. Treasury Notes, 5.125%, 5/15/16 | | | 488,000 | | | | 519,110 | |
| U.S. Treasury Notes, 0.875%, 12/31/16 | | | 95,868,000 | | | | 96,205,072 | |
| U.S. Treasury Notes, 0.75%, 6/30/17 | | | 6,500,000 | | | | 6,473,597 | |
| U.S. Treasury Notes, 4.75%, 8/15/17 | | | 1,507,000 | | | | 1,654,403 | |
| U.S. Treasury Notes, 3.75%, 11/15/18 | | | 17,568,000 | | | | 19,138,140 | |
| U.S. Treasury Notes, 2.75%, 2/15/19 | | | 6,407,000 | | | | 6,739,863 | |
| U.S. Treasury Notes, 3.125%, 5/15/19 | | | 33,754,000 | | | | 35,982,304 | |
| U.S. Treasury Notes, 3.5%, 5/15/20 | | | 25,260,000 | | | | 27,549,188 | |
| U.S. Treasury Notes, 3.125%, 5/15/21 | | | 41,622,000 | | | | 44,652,581 | |
| | | | | | | | |
| | | | | | $ | 343,781,586 | |
| | | | | | | | |
| Utilities – Electric Power – 0.7% | |
| Berkshire Hathaway Energy Co., 3.75%, 11/15/23 | | $ | 1,930,000 | | | $ | 2,012,191 | |
| MidAmerican Funding LLC, 6.927%, 3/01/29 | | | 903,000 | | | | 1,198,798 | |
| Oncor Electric Delivery Co., 7%, 9/01/22 | | | 2,810,000 | | | | 3,559,292 | |
| Pacific Gas & Electric Co., 4.6%, 6/15/43 | | | 2,940,000 | | | | 3,136,339 | |
| PPL Capital Funding, Inc., 5%, 3/15/44 | | | 870,000 | | | | 968,253 | |
| PPL Corp., 3.4%, 6/01/23 | | | 2,940,000 | | | | 2,945,521 | |
| Progress Energy, Inc., 3.15%, 4/01/22 | | | 3,893,000 | | | | 3,943,582 | |
| PSEG Power LLC, 5.32%, 9/15/16 | | | 2,617,000 | | | | 2,796,665 | |
| Waterford 3 Funding Corp., 8.09%, 1/02/17 | | | 1,108,530 | | | | 1,108,687 | |
| | | | | | | | |
| | | | | | $ | 21,669,328 | |
| | | | | | | | |
Total Bonds
(Identified Cost, $1,110,252,829) | | | $ | 1,163,411,654 | |
| | | | | | | | |
15
MFS Total Return Series
Portfolio of Investments – continued
| | | | | | | | |
| Issuer | | Shares/Par | | | Value ($) | |
| | | | | | | | |
| PREFERRED STOCKS – 0.3% | |
| Metals & Mining – 0.1% | | | | | |
| Vale S.A. | | | 563,300 | | | $ | 4,087,476 | |
| | | | | | | | |
| Telephone Services – 0.1% | |
| Telecom Italia S.p.A. | | | 2,708,786 | | | $ | 2,264,098 | |
| | | | | | | | |
| Utilities – Electric Power – 0.1% | | | | | |
| Companhia Energetica de Minas Gerais | | | 553,287 | | | $ | 2,702,855 | |
| | | | | | | | |
Total Preferred Stocks
(Identified Cost, $11,874,987) | | | | | | $ | 9,054,429 | |
| | | | | | | | |
|
| CONVERTIBLE PREFERRED STOCKS – 0.0% | |
| Aerospace – 0.0% | | | | | | | | |
| United Technologies Corp., 7.5% (Identified Cost, $848,429) | | | 16,840 | | | $ | 1,032,797 | |
| | | | | | | | |
| | | | | | | | |
| Issuer | | Shares/Par | | | Value ($) | |
| | | | | | | | |
| MONEY MARKET FUNDS – 3.4% | | | | | |
| MFS Institutional Money Market Portfolio, 0.09%, at Cost and Net Asset Value (v) | | | 103,202,623 | | | $ | 103,202,623 | |
| | | | | | | | |
Total Investments
(Identified Cost, $2,587,178,990) | | | | | | $ | 3,101,638,286 | |
| | | | | | | | |
OTHER ASSETS, LESS
LIABILITIES – (2.3)% | | | | (68,681,545 | ) |
| | | | | | | | |
| NET ASSETS – 100.0% | | | | | | $ | 3,032,956,741 | |
| | | | | | | | |
| (a) | | Non-income producing security. |
| (i) | | Interest only security for which the fund receives interest on notional principal (Par amount). Par amount shown is the notional principal and does not reflect the cost of the security. |
| (n) | | Securities exempt from registration under Rule 144A of the Securities Act of 1933. These securities may be sold in the ordinary course of business in transactions exempt from registration, normally to qualified institutional buyers. At period end, the aggregate value of these securities was $78,685,306, representing 2.6% of net assets. |
| (v) | | Underlying affiliated fund that is available only to investment companies managed by MFS. The rate quoted for the MFS Institutional Money Market Portfolio is the annualized seven-day yield of the fund at period end. |
| (z) | | Restricted securities are not registered under the Securities Act of 1933 and are subject to legal restrictions on resale. These securities generally may be resold in transactions exempt from registration or to the public if the securities are subsequently registered. Disposal of these securities may involve time-consuming negotiations and prompt sale at an acceptable price may be difficult. The fund holds the following restricted securities: |
| | | | | | | | | | |
| Restricted Securities | | Acquisition
Date | | Cost | | | Value | |
| Bayview Financial Revolving Mortgage Loan Trust, FRN, 1.769%, 12/28/40 | | 3/01/06 | | | $2,945,801 | | | | $1,758,200 | |
| BlackRock Capital Finance LP, 7.75%, 9/25/26 | | 8/16/13 | | | 87,297 | | | | 5,071 | |
| Cent LP, 2013-17A, “A1”, CLO, FRN, 1.532%, 1/30/25 | | 9/26/14 | | | 2,531,451 | | | | 2,513,204 | |
| Dryden Senior Loan Fund, 2013-26A, “A”, CLO, FRN, 1.33%, 7/15/25 | | 9/26/14 | | | 3,225,955 | | | | 3,205,020 | |
| ING Investment Management Ltd., 2013-2A, “A1”, CLO, FRN, 1.383%, 4/25/25 | | 9/26/14 | | | 2,936,156 | | | | 2,918,425 | |
| State Grid Overseas Investment (2014) Ltd., 2.75%, 5/07/19 | | 4/28/14 | | | 2,570,012 | | | | 2,601,885 | |
| Total Restricted Securities | | | | | | | | | $13,001,805 | |
| % of Net assets | | | | | | | | | 0.4% | |
The following abbreviations are used in this report and are defined:
| ADR | | American Depositary Receipt |
| CLO | | Collateralized Loan Obligation |
| FRN | | Floating Rate Note. Interest rate resets periodically and may not be the rate reported at period end. |
| PLC | | Public Limited Company |
| REIT | | Real Estate Investment Trust |
See Notes to Financial Statements
16
MFS Total Return Series
FINANCIAL STATEMENTS | STATEMENT OF ASSETS AND LIABILITIES
This statement represents your fund’s balance sheet, which details the assets and liabilities comprising the total value of the fund.
| | | | | | | | |
At 12/31/14 | | | | | | | | |
Assets | | | | | | | | |
Investments – | | | | | | | | |
Non-affiliated issuers, at value (identified cost, $2,483,976,367) | | | $2,998,435,663 | | | | | |
Underlying affiliated funds, at cost and value | | | 103,202,623 | | | | | |
Total investments, at value (identified cost, $2,587,178,990) | | | $3,101,638,286 | | | | | |
Cash | | | 61,067 | | | | | |
Foreign currency, at value (identified cost, $1,376,185) | | | 1,371,940 | | | | | |
Receivables for | | | | | | | | |
Investments sold | | | 3,234,205 | | | | | |
Fund shares sold | | | 4,795,878 | | | | | |
Interest and dividends | | | 10,830,316 | | | | | |
Other assets | | | 18,204 | | | | | |
Total assets | | | | | | | $3,121,949,896 | |
Liabilities | | | | | | | | |
Payables for | | | | | | | | |
Investments purchased | | | $4,698,351 | | | | | |
TBA purchase commitments | | | 82,351,852 | | | | | |
Fund shares reacquired | | | 1,615,872 | | | | | |
Payable to affiliates | | | | | | | | |
Investment adviser | | | 5,947 | | | | | |
Shareholder servicing costs | | | 856 | | | | | |
Distribution and/or service fees | | | 18,835 | | | | | |
Payable for independent Trustees’ compensation | | | 43 | | | | | |
Accrued expenses and other liabilities | | | 301,399 | | | | | |
Total liabilities | | | | | | | $88,993,155 | |
Net assets | | | | | | | $3,032,956,741 | |
Net assets consist of | | | | | | | | |
| Paid-in capital | | | $2,360,046,382 | | | | | |
| Unrealized appreciation (depreciation) on investments and translation of assets and liabilities in foreign currencies | | | 514,426,810 | | | | | |
| Accumulated net realized gain (loss) on investments and foreign currency | | | 88,090,590 | | | | | |
Undistributed net investment income | | | 70,392,959 | | | | | |
Net assets | | | | | | | $3,032,956,741 | |
Shares of beneficial interest outstanding | | | | | | | 125,616,191 | |
| | | | | | | | | | | | |
| | | Net assets | | | Shares
outstanding | | | Net asset value
per share | |
Initial Class | | | $1,662,709,008 | | | | 68,404,062 | | | | $24.31 | |
Service Class | | | 1,370,247,733 | | | | 57,212,129 | | | | 23.95 | |
See Notes to Financial Statements
17
MFS Total Return Series
FINANCIAL STATEMENTS | STATEMENT OF OPERATIONS
This statement describes how much your fund earned in investment income and accrued in expenses. It also describes any gains and/or losses generated by fund operations.
| | | | | | | | |
Year ended 12/31/14 | | | | | | | | |
Net investment income | | | | | | | | |
Income | | | | | | | | |
Dividends | | | $52,032,327 | | | | | |
Interest | | | 39,157,145 | | | | | |
Dividends from underlying affiliated funds | | | 87,292 | | | | | |
Foreign taxes withheld | | | (842,503 | ) | | | | |
Total investment income | | | | | | | $90,434,261 | |
Expenses | | | | | | | | |
Management fee | | | $23,214,538 | | | | | |
Distribution and/or service fees | | | 3,424,897 | | | | | |
Shareholder servicing costs | | | 125,480 | | | | | |
Administrative services fee | | | 426,444 | | | | | |
Independent Trustees’ compensation | | | 44,070 | | | | | |
Custodian fee | | | 205,037 | | | | | |
Shareholder communications | | | 212,139 | | | | | |
Audit and tax fees | | | 71,843 | | | | | |
Legal fees | | | 28,051 | | | | | |
Miscellaneous | | | 81,394 | | | | | |
Total expenses | | | | | | | $27,833,893 | |
Fees paid indirectly | | | (182 | ) | | | | |
Reduction of expenses by investment adviser | | | (3,479,376 | ) | | | | |
Net expenses | | | | | | | $24,354,335 | |
Net investment income | | | | | | | $66,079,926 | |
Realized and unrealized gain (loss) on investments and foreign currency | | | | | | | | |
Realized gain (loss) (identified cost basis) | | | | | | | | |
Investments | | | $110,135,311 | | | | | |
Foreign currency | | | (70,416 | ) | | | | |
Net realized gain (loss) on investments and foreign currency | | | | | | | $110,064,895 | |
Change in unrealized appreciation (depreciation) | | | | | | | | |
Investments | | | $73,449,227 | | | | | |
Translation of assets and liabilities in foreign currencies | | | (48,536 | ) | | | | |
Net unrealized gain (loss) on investments and foreign currency translation | | | | | | | $73,400,691 | |
Net realized and unrealized gain (loss) on investments and foreign currency | | | | | | | $183,465,586 | |
Change in net assets from operations | | | | | | | $249,545,512 | |
See Notes to Financial Statements
18
MFS Total Return Series
FINANCIAL STATEMENTS | STATEMENTS OF CHANGES IN NET ASSETS
These statements describe the increases and/or decreases in net assets resulting from operations, any distributions, and any shareholder transactions.
| | | | | | | | |
For years ended 12/31 | | | 2014 | | | | 2013 | |
Change in net assets | | | | | | | | |
From operations | | | | | | | | |
Net investment income | | | $66,079,926 | | | | $50,920,462 | |
Net realized gain (loss) on investments and foreign currency | | | 110,064,895 | | | | 296,876,293 | |
Net unrealized gain (loss) on investments and foreign currency translation | | | 73,400,691 | | | | 127,710,171 | |
Change in net assets from operations | | | $249,545,512 | | | | $475,506,926 | |
Distributions declared to shareholders | | | | | | | | |
From net investment income | | | $(55,137,325 | ) | | | $(55,748,612 | ) |
From net realized gain on investments | | | (80,306,738 | ) | | | — | |
Total distributions declared to shareholders | | | $(135,444,063 | ) | | | $(55,748,612 | ) |
Change in net assets from fund share transactions | | | $(300,150,149 | ) | | | $485,983,043 | |
Total change in net assets | | | $(186,048,700 | ) | | | $905,741,357 | |
| Net assets | | | | | | | | |
At beginning of period | | | 3,219,005,441 | | | | 2,313,264,084 | |
At end of period (including undistributed net investment income of $70,392,959 and
$55,051,696, respectively) | | | $3,032,956,741 | | | | $3,219,005,441 | |
See Notes to Financial Statements
19
MFS Total Return Series
FINANCIAL STATEMENTS | FINANCIAL HIGHLIGHTS
The financial highlights table is intended to help you understand the fund’s financial performance for the past 5 years. Certain information reflects financial results for a single fund share. The total returns in the table represent the rate by which an investor would have earned (or lost) on an investment in the fund share class (assuming reinvestment of all distributions) held for the entire period.
| | | | | | | | | | | | | | | | | | | | |
| Initial Class | | Years ended 12/31 | |
| | | 2014 | | | 2013 | | | 2012 | | | 2011 | | | 2010 | |
Net asset value, beginning of period | | | $23.44 | | | | $20.05 | | | | $18.53 | | | | $18.71 | | | | $17.48 | |
| Income (loss) from investment operations | | | | | | | | | | | | | | | | | | | | |
Net investment income (d) | | | $0.54 | | | | $0.45 | | | | $0.44 | | | | $0.44 | | | | $0.41 | |
Net realized and unrealized gain (loss) on investments
and foreign currency | | | 1.43 | | | | 3.34 | | | | 1.63 | | | | (0.12 | ) | | | 1.31 | |
Total from investment operations | | | $1.97 | | | | $3.79 | | | | $2.07 | | | | $0.32 | | | | $1.72 | |
| Less distributions declared to shareholders | | | | | | | | | | | | | | | | | | | | |
From net investment income | | | $(0.46 | ) | | | $(0.40 | ) | | | $(0.55 | ) | | | $(0.50 | ) | | | $(0.49 | ) |
From net realized gain on investments | | | (0.64 | ) | | | — | | | | — | | | | — | | | | — | |
Total distributions declared to shareholders | | | $(1.10 | ) | | | $(0.40 | ) | | | $(0.55 | ) | | | $(0.50 | ) | | | $(0.49 | ) |
Net asset value, end of period (x) | | | $24.31 | | | | $23.44 | | | | $20.05 | | | | $18.53 | | | | $18.71 | |
Total return (%) (k)(r)(s)(x) | | | 8.50 | | | | 19.05 | | | | 11.26 | | | | 1.77 | | | | 9.93 | |
Ratios (%) (to average net assets)
and Supplemental data: | | | | | | | | | | | | | | | | | | | | |
Expenses before expense reductions (f) | | | 0.78 | | | | 0.79 | | | | 0.80 | | | | 0.81 | | | | 0.81 | |
Expenses after expense reductions (f) | | | 0.67 | | | | 0.73 | | | | 0.77 | | | | 0.78 | | | | 0.81 | |
Net investment income | | | 2.24 | | | | 2.05 | | | | 2.26 | | | | 2.36 | | | | 2.30 | |
Portfolio turnover | | | 32 | | | | 53 | | | | 22 | | | | 19 | | | | 30 | |
Net assets at end of period (000 omitted) | | | $1,662,709 | | | | $1,826,378 | | | | $1,440,525 | | | | $1,574,503 | | | | $1,860,233 | |
See Notes to Financial Statements
20
MFS Total Return Series
Financial Highlights – continued
| | | | | | | | | | | | | | | | | | | | |
| Service Class | | Years ended 12/31 | |
| | | 2014 | | | 2013 | | | 2012 | | | 2011 | | | 2010 | |
Net asset value, beginning of period | | | $23.12 | | | | $19.80 | | | | $18.31 | | | | $18.48 | | | | $17.28 | |
| Income (loss) from investment operations | | | | | | | | | | | | | | | | | | | | |
Net investment income (d) | | | $0.47 | | | | $0.39 | | | | $0.39 | | | | $0.39 | | | | $0.36 | |
Net realized and unrealized gain (loss) on investments
and foreign currency | | | 1.41 | | | | 3.29 | | | | 1.60 | | | | (0.11 | ) | | | 1.29 | |
Total from investment operations | | | $1.88 | | | | $3.68 | | | | $1.99 | | | | $0.28 | | | | $1.65 | |
| Less distributions declared to shareholders | | | | | | | | | | | | | | | | | | | | |
From net investment income | | | $(0.41 | ) | | | $(0.36 | ) | | | $(0.50 | ) | | | $(0.45 | ) | | | $(0.45 | ) |
From net realized gain on investments | | | (0.64 | ) | | | — | | | | — | | | | — | | | | — | |
Total distributions declared to shareholders | | | $(1.05 | ) | | | $(0.36 | ) | | | $(0.50 | ) | | | $(0.45 | ) | | | $(0.45 | ) |
Net asset value, end of period (x) | | | $23.95 | | | | $23.12 | | | | $19.80 | | | | $18.31 | | | | $18.48 | |
Total return (%) (k)(r)(s)(x) | | | 8.24 | | | | 18.74 | | | | 10.93 | | | | 1.58 | | | | 9.63 | |
Ratios (%) (to average net assets)
and Supplemental data: | | | | | | | | | | | | | | | | | | | | |
Expenses before expense reductions (f) | | | 1.03 | | | | 1.04 | | | | 1.05 | | | | 1.06 | | | | 1.06 | |
Expenses after expense reductions (f) | | | 0.92 | | | | 0.98 | | | | 1.02 | | | | 1.03 | | | | 1.06 | |
Net investment income | | | 1.98 | | | | 1.80 | | | | 2.02 | | | | 2.11 | | | | 2.05 | |
Portfolio turnover | | | 32 | | | | 53 | | | | 22 | | | | 19 | | | | 30 | |
Net assets at end of period (000 omitted) | | | $1,370,248 | | | | $1,392,627 | | | | $872,739 | | | | $859,243 | | | | $925,027 | |
| (d) | Per share data is based on average shares outstanding. |
| (f) | Ratios do not reflect reductions from fees paid indirectly, if applicable. |
| (k) | The total return does not reflect expenses that apply to separate accounts. Inclusion of these charges would reduce the total return figures for all periods shown. |
| (r) | Certain expenses have been reduced without which performance would have been lower. |
| (s) | From time to time the fund may receive proceeds from litigation settlements, without which performance would be lower. |
| (x) | The net asset values per share and total returns have been calculated on net assets which include adjustments made in accordance with U.S. generally accepted accounting principles required at period end for financial reporting purposes. |
See Notes to Financial Statements
21
MFS Total Return Series
NOTES TO FINANCIAL STATEMENTS
| (1) | | Business and Organization |
MFS Total Return Series (the fund) is a diversified series of MFS Variable Insurance Trust (the trust). The trust is organized as a Massachusetts business trust and is registered under the Investment Company Act of 1940, as amended, as an open-end management investment company. The shareholders of each series of the trust are separate accounts of insurance companies, which offer variable annuity and/or life insurance products, and qualified retirement and pension plans.
The fund is an investment company and accordingly follows the investment company accounting and reporting guidance of the Financial Accounting Standards Board (FASB) Accounting Standards Codification Topic 946 Financial Services – Investment Companies.
| (2) | | Significant Accounting Policies |
General – The preparation of financial statements in conformity with U.S. generally accepted accounting principles requires management to make estimates and assumptions that affect the reported amounts of assets and liabilities, and disclosure of contingent assets and liabilities at the date of the financial statements and the reported amounts of increases and decreases in net assets from operations during the reporting period. Actual results could differ from those estimates. In the preparation of these financial statements, management has evaluated subsequent events occurring after the date of the fund’s Statement of Assets and Liabilities through the date that the financial statements were issued.
In June 2014, FASB issued Accounting Standards Update 2014-11, Transfers and Servicing (Topic 860) – Repurchase-to-Maturity Transactions, Repurchase Financings, and Disclosures (“ASU 2014-11”). ASU 2014-11 changes the accounting for repurchase-to-maturity transactions (i.e., repurchase agreements that settle at the same time as the maturity of the transferred financial asset) and enhances the required disclosures for repurchase agreements and other similar transactions. Although still evaluating the potential impacts of ASU 2014-11 to the fund, management expects that the impact of the fund’s adoption will be limited to additional financial statement disclosures which would first be effective for interim reporting periods beginning after March 15, 2015.
Balance Sheet Offsetting – The fund’s accounting policy with respect to balance sheet offsetting is that, absent an event of default by the counterparty or a termination of the agreement, the International Swaps and Derivatives Association (ISDA) Master Agreement does not result in an offset of reported amounts of financial assets and financial liabilities in the Statement of Assets and Liabilities across transactions between the fund and the applicable counterparty. The fund’s right to setoff may be restricted or prohibited by the bankruptcy or insolvency laws of the particular jurisdiction to which a specific master netting agreement counterparty is subject. Balance sheet offsetting disclosures, to the extent applicable to the fund, have been included in the fund’s Significant Accounting Policies note under the captions for each of the fund’s in-scope financial instruments and transactions.
Investment Valuations – Equity securities, including restricted equity securities, are generally valued at the last sale or official closing price as provided by a third-party pricing service on the market or exchange on which they are primarily traded. Equity securities, for which there were no sales reported that day, are generally valued at the last quoted daily bid quotation as provided by a third-party pricing service on the market or exchange on which such securities are primarily traded. Debt instruments and floating rate loans, including restricted debt instruments, are generally valued at an evaluated or composite bid as provided by a third-party pricing service. Short-term instruments with a maturity at issuance of 60 days or less may be valued at amortized cost, which approximates market value. Open-end investment companies are generally valued at net asset value per share. Securities and other assets generally valued on the basis of information from a third-party pricing service may also be valued at a broker/dealer bid quotation. Values obtained from third-party pricing services can utilize both transaction data and market information such as yield, quality, coupon rate, maturity, type of issue, trading characteristics, and other market data. The values of foreign securities and other assets and liabilities expressed in foreign currencies are converted to U.S. dollars using the mean of bid and asked prices for rates provided by a third-party pricing service.
The Board of Trustees has delegated primary responsibility for determining or causing to be determined the value of the fund’s investments (including any fair valuation) to the adviser pursuant to valuation policies and procedures approved by the Board. If the adviser determines that reliable market quotations are not readily available, investments are valued at fair value as determined in good faith by the adviser in accordance with such procedures under the oversight of the Board of Trustees. Under the fund’s valuation policies and procedures, market quotations are not considered to be readily available for most types of debt instruments and floating rate loans and many types of derivatives. These investments are generally valued at fair value based on information from third-party pricing services. In addition, investments may be valued at fair value if the adviser determines that an investment’s value has been materially affected by events occurring after the close of the exchange or market on which the investment is principally traded (such as foreign exchange or market) and prior to the determination of the fund’s net asset value, or after the halting of trading of a specific security where trading does not resume prior to the close of the exchange or market on which the security is principally traded. Events that occur on a frequent basis after foreign markets close (such as developments in foreign markets and significant movements in the U.S. markets) and prior to the determination of the fund’s net asset value may be deemed to have a material effect on the value of securities traded in foreign markets. Accordingly, the fund’s foreign equity securities may often be
22
MFS Total Return Series
Notes to Financial Statements – continued
valued at fair value. The adviser generally relies on third-party pricing services or other information (such as the correlation with price movements of similar securities in the same or other markets; the type, cost and investment characteristics of the security; the business and financial condition of the issuer; and trading and other market data) to assist in determining whether to fair value and at what value to fair value an investment. The value of an investment for purposes of calculating the fund’s net asset value can differ depending on the source and method used to determine value. When fair valuation is used, the value of an investment used to determine the fund’s net asset value may differ from quoted or published prices for the same investment. There can be no assurance that the fund could obtain the fair value assigned to an investment if it were to sell the investment at the same time at which the fund determines its net asset value per share.
Various inputs are used in determining the value of the fund’s assets or liabilities. These inputs are categorized into three broad levels. In certain cases, the inputs used to measure fair value may fall into different levels of the fair value hierarchy. In such cases, an investment’s level within the fair value hierarchy is based on the lowest level of input that is significant to the fair value measurement. The fund’s assessment of the significance of a particular input to the fair value measurement in its entirety requires judgment, and considers factors specific to the investment. Level 1 includes unadjusted quoted prices in active markets for identical assets or liabilities. Level 2 includes other significant observable market-based inputs (including quoted prices for similar securities, interest rates, prepayment speed, and credit risk). Level 3 includes unobservable inputs, which may include the adviser’s own assumptions in determining the fair value of investments. The following is a summary of the levels used as of December 31, 2014 in valuing the fund’s assets or liabilities:
| | | | | | | | | | | | | | | | |
| Investments at Value | | Level 1 | | | Level 2 | | | Level 3 | | | Total | |
| Equity Securities: | | | | | | | | | | | | | | | | |
United States | | | $1,660,946,924 | | | | $— | | | | $— | | | | $1,660,946,924 | |
United Kingdom | | | 94,516 | | | | 42,599,305 | | | | — | | | | 42,693,821 | |
Switzerland | | | — | | | | 31,998,788 | | | | — | | | | 31,998,788 | |
Canada | | | 21,541,760 | | | | — | | | | — | | | | 21,541,760 | |
Japan | | | — | | | | 16,356,521 | | | | — | | | | 16,356,521 | |
Brazil | | | 8,539,955 | | | | 6,790,332 | | | | | | | | 15,330,287 | |
France | | | — | | | | 13,412,373 | | | | — | | | | 13,412,373 | |
Germany | | | 7,999,400 | | | | — | | | | — | | | | 7,999,400 | |
Netherlands | | | — | | | | 5,712,784 | | | | — | | | | 5,712,784 | |
Other Countries | | | 6,529,737 | | | | 12,501,614 | | | | — | | | | 19,031,351 | |
| U.S. Treasury Bonds & U.S. Government Agency & Equivalents | | | — | | | | 351,325,788 | | | | — | | | | 351,325,788 | |
| Non-U.S. Soverign Debt | | | — | | | | 35,924,599 | | | | — | | | | 35,924,599 | |
| U.S. Corporate Bonds | | | — | | | | 237,467,984 | | | | — | | | | 237,467,984 | |
| Residential Mortgage-Backed Securities | | | — | | | | 380,177,243 | | | | — | | | | 380,177,243 | |
| Comercial Mortgage-Backed Securities | | | — | | | | 57,621,105 | | | | — | | | | 57,621,105 | |
| Asset-Backed Securities (including CDOs) | | | — | | | | 15,402,482 | | | | — | | | | 15,402,482 | |
| Foreign Bonds | | | — | | | | 85,492,453 | | | | — | | | | 85,492,453 | |
| Mutual Funds | | | 103,202,623 | | | | — | | | | — | | | | 103,202,623 | |
| Total Investments | | | $1,808,854,915 | | | | $1,292,783,371 | | | | $— | | | | $3,101,638,286 | |
For further information regarding security characteristics, see the Portfolio of Investments.
Of the level 2 investments presented above, equity investments amounting to $109,243,836 were considered level 1 investments at the beginning of the period. The primary reason for changes in the classifications between levels 1 and 2 occurs when foreign equity securities are fair valued using other observable market-based inputs in place of the closing exchange price due to events occurring after the close of the exchange or market on which the investment is principally traded. The fund’s foreign equity securities may often be valued at fair value. The fund’s policy is to recognize transfers between the levels as of the end of the period.
Foreign Currency Translation – Purchases and sales of foreign investments, income, and expenses are converted into U.S. dollars based upon currency exchange rates prevailing on the respective dates of such transactions or on the reporting date for foreign denominated receivables and payables. Gains and losses attributable to foreign currency exchange rates on sales of securities are recorded for financial statement purposes as net realized gains and losses on investments. Gains and losses attributable to foreign exchange rate movements on receivables, payables, income and expenses are recorded for financial statement purposes as foreign currency transaction gains and losses. That portion of both realized and unrealized gains and losses on investments that results from fluctuations in foreign currency exchange rates is not separately disclosed.
Security Loans – Under its Securities Lending Agency Agreement with the fund, State Street Bank and Trust Company (“State Street”), as lending agent, loans the securities of the fund to certain qualified institutions (the “Borrowers”) approved by the fund. The loans are collateralized by cash and/or U.S. Treasury and federal agency obligations in an amount typically at least equal to
23
MFS Total Return Series
Notes to Financial Statements – continued
the market value of the securities loaned. On loans collateralized by cash, the cash collateral is invested in a money market fund. The market value of the loaned securities is determined at the close of business of the fund and any additional required collateral is delivered to the fund on the next business day. State Street provides the fund with indemnification against Borrower default. In the event of Borrower default, State Street will for the benefit of the fund either purchase securities identical to those loaned or, when such purchase is commercially impracticable, pay the fund the market value of the loaned securities. In return, State Street assumes the fund’s rights to the related collateral. If the collateral value is less than the cost to purchase identical securities, State Street is responsible for the shortfall, but only to the extent that such shortfall is not due to a decline in collateral value resulting from collateral reinvestment for which the fund bears the risk of loss. A portion of the income generated upon investment of the collateral is remitted to the Borrowers, and the remainder is allocated between the fund and the lending agent. On loans collateralized by U.S. Treasury and/or federal agency obligations, a fee is received from the Borrower, and is allocated between the fund and the lending agent. Income from securities lending is included in “Interest” income in the Statement of Operations. The dividend and interest income earned on the securities loaned is accounted for in the same manner as other dividend and interest income. At December 31, 2014, there were no securities on loan or collateral outstanding.
Indemnifications – Under the fund’s organizational documents, its officers and Trustees may be indemnified against certain liabilities and expenses arising out of the performance of their duties to the fund. Additionally, in the normal course of business, the fund enters into agreements with service providers that may contain indemnification clauses. The fund’s maximum exposure under these agreements is unknown as this would involve future claims that may be made against the fund that have not yet occurred.
Investment Transactions and Income – Investment transactions are recorded on the trade date. Interest income is recorded on the accrual basis. All premium and discount is amortized or accreted for financial statement purposes in accordance with U.S. generally accepted accounting principles. Dividends received in cash are recorded on the ex-dividend date. Certain dividends from foreign securities will be recorded when the fund is informed of the dividend if such information is obtained subsequent to the ex-dividend date. Dividend and interest payments received in additional securities are recorded on the ex-dividend or ex-interest date in an amount equal to the value of the security on such date.
The fund may receive proceeds from litigation settlements. Any proceeds received from litigation involving portfolio holdings are reflected in the Statement of Operations in realized gain/loss if the security has been disposed of by the fund or in unrealized gain/loss if the security is still held by the fund. Any other proceeds from litigation not related to portfolio holdings are reflected as other income in the Statement of Operations.
The fund invests a significant portion of its assets in asset-backed and/or mortgage-backed securities. The value of these securities may depend, in part, on the issuer’s or borrower’s credit quality or ability to pay principal and interest when due and may fall if an issuer or borrower defaults on its obligation to pay principal or interest or if the instrument’s credit rating is downgraded by a credit rating agency. U.S. Government securities not supported as to the payment of principal or interest by the U.S. Treasury, such as those issued by Fannie Mae, Freddie Mac, and the Federal Home Loan Banks, are subject to greater credit risk than are U.S. Government securities supported by the U.S. Treasury, such as those issued by Ginnie Mae.
The fund purchased or sold debt securities on a when-issued or delayed delivery basis, or in a “To Be Announced” (TBA) or “forward commitment” transaction with delivery or payment to occur at a later date beyond the normal settlement period. At the time a fund enters into a commitment to purchase or sell a security, the transaction is recorded and the value of the security acquired is reflected in the fund’s net asset value. The price of such security and the date that the security will be delivered and paid for are fixed at the time the transaction is negotiated. The value of the security may vary with market fluctuations. TBA securities resulting from these transactions are included in the Portfolio of Investments. TBA purchase commitments are held at carrying amount, which approximates fair value and are categorized as level 2 within the fair value hierarchy. No interest accrues to the fund until payment takes place. At the time that a fund enters into this type of transaction, the fund is required to have sufficient cash and/or liquid securities to cover its commitments. Losses may arise due to changes in the value of the underlying securities or if the counterparty does not perform under the contract’s terms, or if the issuer does not issue the securities due to political, economic or other factors. Additionally, losses may arise due to declines in the value of the securities prior to settlement date.
To mitigate this risk of loss on TBA securities and other types of forward settling mortgage-backed securities, the fund whenever possible enters into a Master Securities Forward Transaction Agreement (“MSFTA”) on a bilateral basis with each of the counterparties with whom it undertakes a significant volume of transactions. The MSFTA gives each party to the agreement the right to terminate all transactions traded under such agreement if there is a certain deterioration in the credit quality of the other party. Upon an event of default or a termination of the MSFTA, the non-defaulting party has the right to close out all transactions traded under such agreement and to net amounts owed under each transaction to one net amount payable by one party to the other. This right to close out and net payments across all transactions traded under the MSFTA could result in a reduction of the fund’s credit risk to such counterparty equal to any amounts payable by the fund under the applicable transactions, if any.
For mortgage-backed securities traded under a MSFTA, the collateral and margining requirements are contract specific. Collateral amounts across all transactions traded under such agreement are netted and one amount is posted from one party to the other to
24
MFS Total Return Series
Notes to Financial Statements – continued
collateralize such obligations. Cash that has been pledged to cover the fund’s collateral or margin obligations under a MSFTA, if any, will be reported separately on the Statement of Assets and Liabilities as restricted cash. Securities pledged as collateral or margin for the same purpose, if any, are noted in the Portfolio of Investments.
Fees Paid Indirectly – The fund’s custody fee may be reduced according to an arrangement that measures the value of cash deposited with the custodian by the fund. For the year ended December 31, 2014, is shown as a reduction of total expenses in the Statement of Operations.
Tax Matters and Distributions – The fund intends to qualify as a regulated investment company, as defined under Subchapter M of the Internal Revenue Code, and to distribute all of its taxable income, including realized capital gains. As a result, no provision for federal income tax is required. The fund’s federal tax returns, when filed, will remain subject to examination by the Internal Revenue Service for a three year period. Management has analyzed the fund’s tax positions taken on federal and state tax returns for all open tax years and does not believe that there are any uncertain tax positions that require recognition of a tax liability. Foreign taxes, if any, have been accrued by the fund in the accompanying financial statements in accordance with the applicable foreign tax law. Foreign income taxes may be withheld by certain countries in which the fund invests. Additionally, capital gains realized by the fund on securities issued in or by certain foreign countries may be subject to capital gains tax imposed by those countries.
Distributions to shareholders are recorded on the ex-dividend date. Income and capital gain distributions are determined in accordance with income tax regulations, which may differ from U.S. generally accepted accounting principles. Certain capital accounts in the financial statements are periodically adjusted for permanent differences in order to reflect their tax character. These adjustments have no impact on net assets or net asset value per share. Temporary differences which arise from recognizing certain items of income, expense, gain or loss in different periods for financial statement and tax purposes will reverse at some time in the future. Distributions in excess of net investment income or net realized gains are temporary overdistributions for financial statement purposes resulting from differences in the recognition or classification of income or distributions for financial statement and tax purposes.
Book/tax differences primarily relate to amortization and accretion of debt securities and wash sale loss deferrals.
The tax character of distributions declared to shareholders for the last two fiscal years is as follows:
| | | | | | | | |
| | | 12/31/14 | | | 12/31/13 | |
| Ordinary income (including any short-term capital gains) | | | $55,137,325 | | | | $55,748,612 | |
| Long-term capital gains | | | 80,306,738 | | | | — | |
| Total distributions | | | $135,444,063 | | | | $55,748,612 | |
The federal tax cost and the tax basis components of distributable earnings were as follows:
| | | | |
| As of 12/31/14 | | | | |
| Cost of investments | | | $2,603,955,336 | |
| Gross appreciation | | | 540,584,675 | |
| Gross depreciation | | | (42,901,725 | ) |
| Net unrealized appreciation (depreciation) | | | $497,682,950 | |
| Undistributed ordinary income | | | 91,347,074 | |
| Undistributed long-term capital gain | | | 83,912,821 | |
| Other temporary differences | | | (32,486 | ) |
Multiple Classes of Shares of Beneficial Interest – The fund offers multiple classes of shares, which differ in their respective distribution and/or service fees. The fund’s income, realized and unrealized gain (loss), and common expenses are allocated to shareholders based on the daily net assets of each class. Dividends are declared separately for each class. Differences in per share dividend rates are generally due to differences in separate class expenses. The fund’s distributions declared to shareholders as reported in the Statements of Changes in Net Assets are presented by class as follows:
| | | | | | | | | | | | | | | | |
| | | From net investment
income | | | From net realized gain on
investments | |
| | | Year ended
12/31/14 | | | Year ended
12/31/13 | | | Year ended
12/31/14 | | | Year ended
12/31/13 | |
| Initial Class | | | $32,030,776 | | | | $33,599,103 | | | | $44,581,217 | | | | $— | |
| Service Class | | | 23,106,549 | | | | 22,149,509 | | | | 35,725,521 | | | | — | |
| Total | | | $55,137,325 | | | | $55,748,612 | | | | $80,306,738 | | | | $— | |
25
MFS Total Return Series
Notes to Financial Statements – continued
| (3) | | Transactions with Affiliates |
Investment Adviser – The fund has an investment advisory agreement with MFS to provide overall investment management and related administrative services and facilities to the fund. The management fee is computed daily and paid monthly at the following annual rates:
| | | | |
| First $3 billion of average daily net assets | | | 0.75% | |
| Next $2 billion of average daily net assets | | | 0.65% | |
| Average daily net assets in excess of $5 billion | | | 0.50% | |
The investment adviser agreed in writing to reduce its management fee to 0.70% of average daily net assets for the first $1 billion, 0.65% of average daily net assets in excess of $1 billion up to $2.5 billion, and 0.60% of average daily net assets in excess of $2.5 billion up to $5 billion. This written agreement will continue until modified by the fund’s Board of Trustees, but such agreement will continue at least until August 31, 2016. For the year ended December 31, 2014, this management fee reduction amounted to $2,803,269, which is included in the reduction of total expenses in the Statement of Operations. MFS has also agreed in writing to reduce its management fee by a specified amount if certain MFS mutual fund assets exceed thresholds agreed to by MFS and the fund’s Board of Trustees. For the year ended December 31, 2014, this management fee reduction amounted to $142,784, which is included in the reduction of total expenses in the Statement of Operations. The management fee incurred for the year ended December 31, 2014 was equivalent to an annual effective rate of 0.65% of the fund’s average daily net assets.
Effective August 1, 2014, the investment adviser has agreed in writing to pay a portion of the fund’s total annual operating expenses, excluding interest, taxes, extraordinary expenses, brokerage and transaction costs, and investment-related expenses, such that total annual operating expenses do not exceed 0.65% of average daily net assets for the Initial Class shares and 0.90% of average daily net assets for the Service Class shares. This written agreement will continue until modified by the fund’s Board of Trustees, but such agreement will continue at least until April 30, 2016. For the period August 1, 2014 to December 31, 2014, this reduction amounted to $527,887 and is included in the reduction of total expenses in the Statement of Operations.
Distributor – MFS Fund Distributors, Inc. (MFD), a wholly-owned subsidiary of MFS, is the distributor of shares of the fund. The Trustees have adopted a distribution plan for the Service Class shares pursuant to Rule 12b-1 under the Investment Company Act of 1940.
The fund’s distribution plan provides that the fund will pay MFD distribution and/or service fees equal to 0.25% per annum of its average daily net assets attributable to Service Class shares as partial consideration for services performed and expenses incurred by MFD and financial intermediaries (including participating insurance companies that invest in the fund to fund variable annuity and variable life insurance contracts, sponsors of qualified retirement and pension plans that invest in the fund, and affiliates of these participating insurance companies and plan sponsors) in connection with the sale and distribution of the Service Class shares. MFD may subsequently pay all, or a portion, of the distribution and/or service fees to financial intermediaries.
Shareholder Servicing Agent – MFS Service Center, Inc. (MFSC), a wholly-owned subsidiary of MFS, receives a fee from the fund for its services as shareholder servicing agent. For the year ended December 31, 2014, the fee was $122,909, which equated to 0.0040% annually of the fund’s average daily net assets. MFSC also receives payment from the fund for out-of-pocket expenses paid by MFSC on behalf of the fund. For the year ended December 31, 2014, these costs amounted to $2,571.
Administrator – MFS provides certain financial, legal, shareholder communications, compliance, and other administrative services to the fund. Under an administrative services agreement, the fund partially reimburses MFS the costs incurred to provide these services. The fund is charged an annual fixed amount of $17,500 plus a fee based on average daily net assets. The administrative services fee incurred for the year ended December 31, 2014 was equivalent to an annual effective rate of 0.0137% of the fund’s average daily net assets.
Trustees’ and Officers’ Compensation – The fund pays compensation to independent Trustees in the form of a retainer, attendance fees, and additional compensation to Board and Committee chairpersons. The fund does not pay compensation directly to Trustees or officers of the fund who are also officers of the investment adviser, all of whom receive remuneration for their services to the fund from MFS. Certain officers and Trustees of the fund are officers or directors of MFS, MFD, and MFSC.
Other – Effective November 1, 2014, this fund and certain other funds managed by MFS (the funds) have entered into a service agreement (the ISO Agreement) which provides for payment of fees solely by the funds to Tarantino LLC in return for the provision of services of an Independent Senior Officer (ISO) for the funds. Frank L. Tarantino serves as the ISO and is an officer of the funds and the sole member of Tarantino LLC. The funds can terminate the ISO Agreement with Tarantino LLC at any time under the terms of the ISO Agreement. Prior to November 1, 2014, the funds had entered into services agreements (the Compliance Officer Agreements) which provided for payment of fees by the funds to Tarantino LLC and Griffin Compliance LLC in return for the provision of services of an Independent Chief Compliance Officer (ICCO) and Assistant ICCO, respectively, for the funds. Prior to November 1, 2014, Frank L. Tarantino served as the ICCO. Effective October 31, 2014, Mr. Tarantino resigned as ICCO and the Compliance Officer Agreement between the funds and Tarantino LLC was terminated. Prior to June 1, 2014, Robyn L. Griffin served
26
MFS Total Return Series
Notes to Financial Statements – continued
as the Assistant ICCO and was an officer of the funds. Ms. Griffin is the sole member of Griffin Compliance LLC. Effective May 31, 2014, Ms. Griffin resigned as Assistant ICCO and the Compliance Officer Agreement between the funds and Griffin Compliance LLC was terminated. For the year ended December 31, 2014, the aggregate fees paid by the fund under these agreements were $13,274 and are included in “Miscellaneous” expense in the Statement of Operations. MFS had agreed to reimburse the fund for a portion of the payments made by the fund for the services under the Compliance Officer Agreements in the amount of $5,436, which is included in the reduction of total expenses in the Statement of Operations. Additionally, MFS has agreed to bear all expenses associated with office space, other administrative support, and supplies provided to the ICCO, Assistant ICCO, and ISO.
The fund invests in the MFS Institutional Money Market Portfolio which is managed by MFS and seeks current income consistent with preservation of capital and liquidity. Income earned on this investment is included in “Dividends from underlying affiliated funds” in the Statement of Operations. This money market fund does not pay a management fee to MFS.
For the year ended December 31, 2014, purchases and sales of investments, other than short-term obligations, were as follows:
| | | | | | | | |
| | | Purchases | | | Sales | |
| U.S. Government securities | | | $533,083,040 | | | | $595,365,726 | |
| Investments (non-U.S. Government securities) | | | $417,785,517 | | | | $723,430,392 | |
| (5) | | Shares of Beneficial Interest |
The fund’s Declaration of Trust permits the Trustees to issue an unlimited number of full and fractional shares of beneficial interest. Transactions in fund shares were as follows:
| | | | | | | | | | | | | | | | |
| | | Year ended 12/31/14 | | | Year ended 12/31/13 | |
| | | Shares | | | Amount | | | Shares | | | Amount | |
| Shares sold | | | | | | | | | | | | | | | | |
Initial Class | | | 1,190,232 | | | | $28,455,634 | | | | 1,757,742 | | | | $38,664,999 | |
Service Class | | | 6,310,222 | | | | 148,779,076 | | | | 8,546,966 | | | | 184,837,068 | |
| | | 7,500,454 | | | | $177,234,710 | | | | 10,304,708 | | | | $223,502,067 | |
| Shares issued in connection with acquisition of MFS Total Return Portfolio | | | | | | | | | | | | | | | | |
Initial Class | | | | | | | | | | | 26,252,347 | | | | $581,489,496 | |
Service Class | | | | | | | | | | | 30,104,614 | | | | 657,484,756 | |
| | | | | | | | | | | 56,356,961 | | | | $1,238,974,252 | |
| Shares issued to shareholders in reinvestment of distributions | | | | | | | | | | | | | | | | |
Initial Class | | | 3,209,551 | | | | $76,611,993 | | | | 1,551,205 | | | | $33,599,103 | |
Service Class | | | 2,499,238 | | | | 58,832,070 | | | | 1,035,508 | | | | 22,149,509 | |
| | | 5,708,789 | | | | $135,444,063 | | | | 2,586,713 | | | | $55,748,612 | |
| Shares reacquired | | | | | | | | | | | | | | | | |
Initial Class | | | (13,912,606 | ) | | | $(333,482,406 | ) | | | (23,492,766 | ) | | | $(516,609,515 | ) |
Service Class | | | (11,819,400 | ) | | | (279,346,516 | ) | | | (23,538,335 | ) | | | (515,632,373 | ) |
| | | (25,732,006 | ) | | | $(612,828,922 | ) | | | (47,031,101 | ) | | | $(1,032,241,888 | ) |
| Net change | | | | | | | | | | | | | | | | |
Initial Class | | | (9,512,823 | ) | | | $(228,414,779 | ) | | | 6,068,528 | | | | $137,144,083 | |
Service Class | | | (3,009,940 | ) | | | (71,735,370 | ) | | | 16,148,753 | | | | 348,838,960 | |
| | | (12,522,763 | ) | | | $(300,150,149 | ) | | | 22,217,281 | | | | $485,983,043 | |
The fund and certain other funds managed by MFS participate in a $1.1 billion unsecured committed line of credit, subject to a $1 billion sublimit, provided by a syndication of banks under a credit agreement. Borrowings may be made for temporary financing needs. Interest is charged to each fund, based on its borrowings, generally at a rate equal to the higher of the Federal Reserve funds rate or one month LIBOR plus an agreed upon spread. A commitment fee, based on the average daily, unused portion of the committed line of credit, is allocated among the participating funds at the end of each calendar quarter. In addition, the fund and other funds managed by MFS have established unsecured uncommitted borrowing arrangements with certain banks for temporary financing needs. Interest is charged to each fund, based on its borrowings, at a rate equal to the Federal Reserve funds rate plus an agreed upon spread. For the year ended December 31, 2014, the fund’s commitment fee and interest expense were $11,913 and $0, respectively, and are included in “Miscellaneous” expense in the Statement of Operations.
27
MFS Total Return Series
Notes to Financial Statements – continued
| (7) | | Transactions in Underlying Affiliated Funds – Affiliated Issuers |
An affiliated issuer may be considered one in which the fund owns 5% or more of the outstanding voting securities, or a company which is under common control. For the purposes of this report, the fund assumes the following to be an affiliated issuer:
| | | | | | | | | | | | | | | | |
| Underlying Affiliated Fund | | Beginning Shares/Par Amount | | | Acquisitions Shares/Par Amount | | | Dispositions Shares/Par Amount | | | Ending Shares/Par Amount | |
| MFS Institutional Money Market Portfolio | | | 88,330,222 | | | | 438,595,433 | | | | (423,723,032 | ) | | | 103,202,623 | |
| | | | |
| Underlying Affiliated Fund | | Realized Gain (Loss) | | | Capital Gain Distributions | | | Dividend Income | | | Ending Value | |
| MFS Institutional Money Market Portfolio | | | $— | | | | $— | | | | $87,292 | | | | $103,202,623 | |
At close of business on August 16, 2013, the fund with net assets of approximately $1,992,261,990, acquired all of the assets and liabilities of MFS Total Return Portfolio, a series of MFS Variable Insurance Trust II. The purpose of the transaction was to provide shareholders of MFS Total Return Portfolio the opportunity to participate in a larger combined portfolio with an identical investment objective and similar investment policies and strategies. The acquisition was accomplished by a tax-free exchange of approximately 56,356,961 shares of the fund (valued at approximately $1,238,974,252) for all of the assets and liabilities of MFS Total Return Portfolio. MFS Total Return Portfolio then distributed the shares of the fund that MFS Total Return Portfolio received from the fund to its shareholders. MFS Total Return Portfolio’s investments on that date were valued at approximately $1,273,129,488 with a cost basis of approximately $1,155,404,640. For financial reporting purposes, assets received and shares issued by the fund were recorded at fair value; however, the cost basis of the investments received from MFS Total Return Portfolio were carried forward to align ongoing reporting of the fund’s realized and unrealized gains and losses with amounts distributable to shareholders for tax purposes.
28
MFS Total Return Series
REPORT OF INDEPENDENT REGISTERED PUBLIC ACCOUNTING FIRM
To the Board of Trustees of MFS Variable Insurance Trust and the Shareholders of
MFS Total Return Series:
We have audited the accompanying statement of assets and liabilities, including the portfolio of investments, of MFS Total Return Series (one of the series of MFS Variable Insurance Trust) (the “Fund”) as of December 31, 2014, and the related statement of operations for the year then ended, the statements of changes in net assets for each of the two years in the period then ended, and the financial highlights for each of the five years in the period then ended. These financial statements and financial highlights are the responsibility of the Fund’s management. Our responsibility is to express an opinion on these financial statements and financial highlights based on our audits.
We conducted our audits in accordance with the standards of the Public Company Accounting Oversight Board (United States). Those standards require that we plan and perform the audit to obtain reasonable assurance about whether the financial statements and financial highlights are free of material misstatement. The Fund is not required to have, nor were we engaged to perform, an audit of its internal control over financial reporting. Our audits included consideration of internal control over financial reporting as a basis for designing audit procedures that are appropriate in the circumstances, but not for the purpose of expressing an opinion on the effectiveness of the Fund’s internal control over financial reporting. Accordingly, we express no such opinion. An audit also includes examining, on a test basis, evidence supporting the amounts and disclosures in the financial statements, assessing the accounting principles used and significant estimates made by management, as well as evaluating the overall financial statement presentation. Our procedures included confirmation of securities owned as of December 31, 2014, by correspondence with the custodian and brokers; where replies were not received from brokers, we performed other auditing procedures. We believe that our audits provide a reasonable basis for our opinion.
In our opinion, the financial statements and financial highlights referred to above present fairly, in all material respects, the financial position of MFS Total Return Series as of December 31, 2014, the results of its operations for the year then ended, the changes in its net assets for each of the two years in the period then ended, and the financial highlights for each of the five years in the period then ended, in conformity with accounting principles generally accepted in the United States of America.
DELOITTE & TOUCHE LLP
Boston, Massachusetts
February 13, 2015
29
MFS Total Return Series
TRUSTEES AND OFFICERS – IDENTIFICATION AND BACKGROUND
The Trustees and Officers of the Trust, as of February 1, 2015, are listed below, together with their principal occupations during the past five years. (Their titles may have varied during that period.) The address of each Trustee and Officer is 111 Huntington Avenue, Boston, Massachusetts 02199-7618.
| | | | | | | | |
Name, Age | | Position(s)
Held with Fund | | Trustee/Officer
Since (h) | | Principal Occupations
During the Past Five Years | | Other Directorships (j) |
| INTERESTED TRUSTEES |
Robert J. Manning (k) (age 51) | | Trustee | | February 2004 | | Massachusetts Financial Services Company, Chairman, Co-Chief Executive Officer and Director; President (until 2009); Chief Investment Officer (until 2010) | | N/A |
| | | | |
Robin A. Stelmach (k) (age 53) | | Trustee and President | | January 2014 | | Massachusetts Financial Services Company, Executive Vice President and Chief Operating Officer | | N/A |
| | | |
| INDEPENDENT TRUSTEES | | | | | | |
David H. Gunning (age 72) | | Trustee and Chair of Trustees | | January 2004 | | Private investor | | Lincoln Electric Holdings, Inc. (welding equipment manufacturer), Director; Development Alternatives, Inc. (consulting), Director/Non-Executive Chairman |
| | | | |
Steven E. Buller (age 63) | | Trustee | | February 2014 | | Chairman, Financial Accounting Standards Advisory Council; Standing Advisory Group, Public Company Accounting Oversight Board, Member (until 2014); BlackRock, Inc. (investment management), Managing Director (until 2014), BlackRock Finco UK (investment management), Director (until 2014) | | N/A |
| | | | |
Robert E. Butler (age 73) | | Trustee | | January 2006 | | Consultant – investment company industry regulatory and compliance matters | | N/A |
| | | | |
Maureen R. Goldfarb (age 59) | | Trustee | | January 2009 | | Private investor | | N/A |
| | | | |
William R. Gutow (age 73) | | Trustee | | December 1993 | | Private investor and real estate consultant; Capitol Entertainment Management Company (video franchise), Vice Chairman | | Texas Donuts (donut franchise), Vice Chairman (until 2010) |
| | | | |
Michael Hegarty (age 70) | | Trustee | | December 2004 | | Private investor | | Brookfield Office Properties, Inc. (real estate), Director; Rouse Properties Inc. (real estate), Director; Capmark Financial Group Inc. (real estate), Director |
| | | | |
John P. Kavanaugh (age 60) | | Trustee | | January 2009 | | Private investor | | N/A |
| | | | |
Maryanne L. Roepke (age 58) | | Trustee | | May 2014 | | American Century Investments (investment management), Senior Vice President and Chief Compliance Officer (until 2014) | | N/A |
| | | | |
Laurie J. Thomsen (age 57) | | Trustee | | March 2005 | | Private investor; New Profit, Inc. (venture philanthropy), Executive Partner (until 2010) | | The Travelers Companies (insurance), Director |
| | | | |
Robert W. Uek (age 73) | | Trustee | | January 2006 | | Consultant to investment company industry | | N/A |
| | | | |
| OFFICERS | | | | | | | | |
Christopher R. Bohane (k) (age 41) | | Assistant Secretary and Assistant Clerk | | July 2005 | | Massachusetts Financial Services Company, Vice President and Assistant General Counsel | | N/A |
| | | | |
Kino Clark (k) (age 46) | | Assistant Treasurer | | January 2012 | | Massachusetts Financial Services Company, Vice President | | N/A |
| | | | |
Thomas H. Connors (k) (age 55) | | Assistant Secretary and Assistant Clerk | | September 2012 | | Massachusetts Financial Services Company, Vice President and Senior Counsel; Deutsche Investment Management Americas Inc. (financial service provider), Director and Senior Counsel (until 2012) | | N/A |
30
MFS Total Return Series
Trustees and Officers – continued
| | | | | | | | |
Name, Age | | Position(s)
Held with Fund | | Trustee/Officer
Since (h) | | Principal Occupations
During the Past Five Years | | Other Directorships (j) |
Ethan D. Corey (k) (age 51) | | Assistant
Secretary and Assistant Clerk | | July 2005 | | Massachusetts Financial Services Company, Senior Vice President and Associate General Counsel | | N/A |
| | | | |
David L. DiLorenzo (k) (age 46) | | Treasurer | | July 2005 | | Massachusetts Financial Services Company, Senior Vice President | | N/A |
| | | | |
Timothy M. Fagan (k) (age 46) | | Chief Compliance Officer | | November 2014 | | Massachusetts Financial Services Company, Chief Compliance Officer; Vice President and Senior Counsel (until 2012) | | N/A |
| | | | |
Brian E. Langenfeld (k) (age 41) | | Assistant
Secretary and Assistant Clerk | | June 2006 | | Massachusetts Financial Services Company, Vice President and Senior Counsel | | N/A |
| | | | |
Susan S. Newton (k) (age 64) | | Assistant
Secretary and Assistant Clerk | | May 2005 | | Massachusetts Financial Services Company, Senior Vice President and Associate General Counsel | | N/A |
| | | | |
Susan A. Pereira (k) (age 44) | | Assistant
Secretary and Assistant Clerk | | July 2005 | | Massachusetts Financial Services Company, Vice President and Senior Counsel | | N/A |
| | | | |
Kasey L. Phillips (k) (age 44) | | Assistant Treasurer | | September 2012 | | Massachusetts Financial Services Company, Vice President; Wells Fargo Funds Management, LLC, Senior Vice President, Fund Treasurer (until 2012) | | N/A |
| | | | |
Mark N. Polebaum (k) (age 62) | | Secretary and
Clerk | | January 2006 | | Massachusetts Financial Services Company, Executive Vice President, General Counsel and Secretary | | N/A |
| | | | |
Matthew A. Stowe (k) (age 40) | | Assistant Secretary and Assistant Clerk | | October 2014 | | Massachusetts Financial Services Company, Vice President and Senior Counsel | | N/A |
| | | | |
Frank L. Tarantino (age 70) | | Independent
Senior Officer | | June 2004 | | Tarantino LLC (provider of compliance services), Principal | | N/A |
| | | | |
Richard S. Weitzel (k) (age 44) | | Assistant Secretary and Assistant Clerk | | October 2007 | | Massachusetts Financial Services Company, Senior Vice President and Associate General Counsel | | N/A |
| | | | |
James O. Yost (k) (age 54) | | Deputy Treasurer | | September 1990 | | Massachusetts Financial Services Company, Senior Vice President | | N/A |
| (h) | Date first appointed to serve as Trustee/officer of an MFS Fund. Each Trustee has served continuously since appointment unless indicated otherwise. For the period from December 15, 2004 until February 22, 2005, Mr. Manning served as Advisory Trustee. Prior to January 2012, Messrs. DiLorenzo and Yost served as Assistant Treasurers of the Funds. Ms. Stelmach was appointed as President of the Funds as of October 1, 2014. |
| (j) | Directorships or trusteeships of companies required to report to the Securities and Exchange Commission (i.e., “public companies”). |
| (k) | “Interested person” of the Trust within the meaning of the Investment Company Act of 1940 (referred to as the 1940 Act), which is the principal federal law governing investment companies like the fund, as a result of a position with MFS. The address of MFS is 111 Huntington Avenue, Boston, Massachusetts 02199-7618. |
Each Trustee (except Ms. Stelmach, Mr. Buller and Ms. Roepke) has been elected by shareholders and each Trustee and officer holds office until his or her successor is chosen and qualified or until his or her earlier death, resignation, retirement or removal. The Trust does not hold annual meetings for the purpose of electing Trustees, and Trustees are not elected for fixed terms. Messrs. Butler, Kavanaugh, Uek and Mses. Thomsen and Roepke are members of the Trust’s Audit Committee.
Each of the Fund’s Trustees and officers holds comparable positions with certain other funds of which MFS or a subsidiary is the investment adviser or distributor, and, in the case of the officers, with certain affiliates of MFS. As of February 1, 2015, the Trustees served as board members of 135 funds within the MFS Family of Funds.
31
MFS Total Return Series
Trustees and Officers – continued
The Statement of Additional Information for the Fund includes further information about the Trustees and is available without charge upon request by calling 1-800-225-2606.
| | |
Investment Adviser Massachusetts Financial Services Company 111 Huntington Avenue Boston, MA 02199-7618 | | Custodian State Street Bank and Trust Company 1 Lincoln Street Boston, MA 02111-2900 |
Distributor MFS Fund Distributors, Inc. 111 Huntington Avenue Boston, MA 02199-7618 | | Independent Registered Public Accounting Firm Deloitte & Touche LLP 200 Berkeley Street Boston, MA 02116 |
Portfolio Managers Nevin Chitkara William Douglas Steven Gorham Richard Hawkins Joshua Marston Jonathan Sage Brooks Taylor | | |
32
MFS Total Return Series
BOARD REVIEW OF INVESTMENT ADVISORY AGREEMENT
The Investment Company Act of 1940 requires that both the full Board of Trustees and a majority of the non-interested (“independent”) Trustees, voting separately, annually approve the continuation of the Fund’s investment advisory agreement with MFS. The Trustees consider matters bearing on the Fund and its advisory arrangements at their meetings throughout the year, including a review of performance data at each regular meeting. In addition, the independent Trustees met several times over the course of three months beginning in May and ending in July, 2014 (“contract review meetings”) for the specific purpose of considering whether to approve the continuation of the investment advisory agreement for the Fund and the other investment companies that the Board oversees (the “MFS Funds”). The independent Trustees were assisted in their evaluation of the Fund’s investment advisory agreement by independent legal counsel, from whom they received separate legal advice and with whom they met separately from MFS during various contract review meetings. The independent Trustees were also assisted in this process by the MFS Funds’ Independent Chief Compliance Officer, a full-time senior officer appointed by and reporting to the independent Trustees.
In connection with their deliberations regarding the continuation of the investment advisory agreement, the Trustees, including the independent Trustees, considered such information and factors as they believed, in light of the legal advice furnished to them and their own business judgment, to be relevant. The investment advisory agreement for the Fund was considered separately, although the Trustees also took into account the common interests of all MFS Funds in their review. As described below, the Trustees considered the nature, quality, and extent of the various investment advisory, administrative, and shareholder services performed by MFS under the existing investment advisory agreement and other arrangements with the Fund.
In connection with their contract review meetings, the Trustees received and relied upon materials that included, among other items: (i) information provided by Lipper Inc., an independent third party, on the investment performance of the Fund for various time periods ended December 31, 2013 and the investment performance of a group of funds with substantially similar investment classifications/objectives (the “Lipper performance universe”), (ii) information provided by Lipper Inc. on the Fund’s advisory fees and other expenses and the advisory fees and other expenses of comparable funds identified by Lipper Inc. (the “Lipper expense group”), (iii) information provided by MFS on the advisory fees of comparable portfolios of other clients of MFS, including institutional separate accounts and other clients, (iv) information as to whether and to what extent applicable expense waivers, reimbursements or fee “breakpoints” are observed for the Fund, (v) information regarding MFS’ financial results and financial condition, including MFS’ and certain of its affiliates’ estimated profitability from services performed for the Fund and the MFS Funds as a whole, and compared to MFS’ institutional business, (vi) MFS’ views regarding the outlook for the mutual fund industry and the strategic business plans of MFS, (vii) descriptions of various functions performed by MFS for the Funds, such as compliance monitoring and portfolio trading practices, and (viii) information regarding the overall organization of MFS, including information about MFS’ senior management and other personnel providing investment advisory, administrative and other services to the Fund and the other MFS Funds. The comparative performance, fee and expense information prepared and provided by Lipper Inc. was not independently verified and the independent Trustees did not independently verify any information provided to them by MFS.
The Trustees’ conclusion as to the continuation of the investment advisory agreement was based on a comprehensive consideration of all information provided to the Trustees and not the result of any single factor. Some of the factors that figured particularly in the Trustees’ deliberations are described below, although individual Trustees may have evaluated the information presented differently from one another, giving different weights to various factors. It is also important to recognize that the fee arrangements for the Fund and other MFS Funds are the result of years of review and discussion between the independent Trustees and MFS, that certain aspects of such arrangements may receive greater scrutiny in some years than in others, and that the Trustees’ conclusions may be based, in part, on their consideration of these same arrangements during the course of the year and in prior years.
Based on information provided by Lipper Inc. and MFS, the Trustees reviewed the Fund’s total return investment performance as well as the performance of peer groups of funds over various time periods. The Trustees placed particular emphasis on the total return performance of the Fund’s Initial Class shares in comparison to the performance of funds in its Lipper performance universe over the three-year period ended December 31, 2013, which the Trustees believed was a long enough period to reflect differing market conditions. The total return performance of the Fund’s Initial Class shares was in the 1st quintile relative to the other funds in the universe for this three-year period (the 1st quintile being the best performers and the 5th quintile being the worst performers). The total return performance of the Fund’s Initial Class shares was in the 1st quintile for the one-year period and the 3rd quintile for the five-year period ended December 31, 2013 relative to the Lipper performance universe. Because of the passage of time, these performance results may differ from the performance results for more recent periods, including those shown elsewhere in this report.
In the course of their deliberations, the Trustees took into account information provided by MFS in connection with the contract review meetings, as well as during investment review meetings conducted with portfolio management personnel during the course of the year regarding the Fund’s performance. After reviewing these and related factors, the Trustees concluded, within the context of their overall conclusions regarding the investment advisory agreement, that they were satisfied with MFS’ responses and efforts relating to investment performance.
33
MFS Total Return Series
Board Review of Investment Advisory Agreement – continued
In assessing the reasonableness of the Fund’s advisory fee, the Trustees considered, among other information, the Fund’s advisory fee and the total expense ratio of the Fund’s Initial Class shares as a percentage of average daily net assets and the advisory fee and total expense ratios of peer groups of funds based on information provided by Lipper Inc. The Trustees considered that MFS has agreed in writing to reduce its advisory fee, and that MFS has agreed to implement an expense limitation for the Fund, each of which may not be changed without the Trustees’ approval. The Trustees also considered that, according to the Lipper data (which takes into account any fee reductions or expense limitations that were in effect during the Fund’s last fiscal year), the Fund’s effective advisory fee rate and total expense ratio were each higher than the Lipper expense group median.
The Trustees also considered the advisory fees charged by MFS to any comparable institutional accounts. In comparing these fees, the Trustees considered information provided by MFS as to the generally broader scope of services provided by MFS to the Fund in comparison to institutional accounts, the higher demands placed on MFS’ investment personnel and trading infrastructure as a result of the daily cash in-flows and out-flows of the Fund, and the impact on MFS and expenses associated with the more extensive regulatory regime to which the Fund is subject in comparison to institutional accounts.
The Trustees also considered whether the Fund may benefit from any economies of scale in the management of the Fund in the event of growth in assets of the Fund and/or growth in assets of the MFS Funds as a whole. They noted that the Fund’s advisory fee rate schedule is subject to contractual breakpoints that reduce the Fund’s advisory fee rate on average daily net assets over $3 billion and $5 billion, and that MFS has agreed in writing to further reduce its advisory fee rate on the Fund’s average daily net assets over $1 billion and in excess of $2.5 billion to $5 billion, which may not be changed without the Trustees’ approval. The Trustees also noted that MFS has agreed in writing to waive a portion of the management fees of certain MFS Funds, including the Fund, if the total combined assets of certain funds within the MFS Funds’ complex increase above agreed upon thresholds (the “group fee waiver”), enabling the Fund’s shareholders to share in the benefits from any economies of scale at the complex level. The group fee waiver is reviewed and renewed annually between the Board and MFS. The Trustees concluded that the breakpoints and the group fee waiver were sufficient to allow the Fund to benefit from economies of scale as its assets and overall complex assets grow.
The Trustees also considered information prepared by MFS relating to MFS’ costs and profits with respect to the Fund, the MFS Funds considered as a group, and other investment companies and accounts advised by MFS, as well as MFS’ methodologies used to determine and allocate its costs to the MFS Funds, the Fund and other accounts and products for purposes of estimating profitability.
After reviewing these and other factors described herein, the Trustees concluded, within the context of their overall conclusions regarding the investment advisory agreement, that the advisory fees charged to the Fund represent reasonable compensation in light of the services being provided by MFS to the Fund.
In addition, the Trustees considered MFS’ resources and related efforts to continue to retain, attract and motivate capable personnel to serve the Fund. The Trustees also considered current and developing conditions in the financial services industry, including the presence of large and well-capitalized companies which are spending, and appear to be prepared to continue to spend, substantial sums to engage personnel and to provide services to competing investment companies. In this regard, the Trustees also considered the financial resources of MFS and its ultimate parent, Sun Life Financial Inc. The Trustees also considered the advantages and possible disadvantages to the Fund of having an adviser that also serves other investment companies as well as other accounts.
The Trustees also considered the nature, quality, cost, and extent of administrative, transfer agency, and distribution services provided to the Fund by MFS and its affiliates under agreements and plans other than the investment advisory agreement, including any 12b-1 fees the Fund pays to MFS Fund Distributors, Inc., an affiliate of MFS. The Trustees also considered the nature, extent and quality of certain other services MFS performs or arranges for on the Fund’s behalf, which may include securities lending programs, directed expense payment programs, class action recovery programs, and MFS’ interaction with third-party service providers, principally custodians and sub-custodians. The Trustees concluded that the various non-advisory services provided by MFS and its affiliates on behalf of the Fund were satisfactory.
The Trustees also considered benefits to MFS from the use of the Fund’s portfolio brokerage commissions, if applicable, to pay for investment research and various other factors. Additionally, the Trustees considered so-called “fall-out benefits” to MFS such as reputational value derived from serving as investment manager to the Fund.
Based on their evaluation of factors that they deemed to be material, including those factors described above, the Board of Trustees, including the independent Trustees, concluded that the Fund’s investment advisory agreement with MFS should be continued for an additional one-year period, commencing August 1, 2014.
34
MFS Total Return Series
PROXY VOTING POLICIES AND INFORMATION
MFS votes proxies on behalf of the fund pursuant to proxy voting policies and procedures that are available without charge, upon request, by calling 1-800-225-2606, by visiting the Proxy Voting section of mfs.com or by visiting the SEC’s Web site at http://www.sec.gov.
Information regarding how the fund voted proxies relating to portfolio securities during the most recent twelve-month period ended June 30 is available without charge by visiting the Proxy Voting section of mfs.com or by visiting the SEC’s Web site at http://www.sec.gov.
QUARTERLY PORTFOLIO DISCLOSURE
The fund will file a complete schedule of portfolio holdings with the Securities and Exchange Commission (the Commission) for the first and third quarters of each fiscal year on Form N-Q. The fund’s Form N-Q is available on the EDGAR database on the Commission’s Internet Web site at http://www.sec.gov, and may be reviewed and copied at the:
Public Reference Room
Securities and Exchange Commission
100 F Street, NE, Room 1580
Washington, D.C. 20549
Information on the operation of the Public Reference Room may be obtained by calling the Commission at 1-800-SEC-0330. Copies of the fund’s Form N-Q also may be obtained, upon payment of a duplicating fee, by electronic request at the following e-mail address: publicinfo@sec.gov or by writing the Public Reference Section at the above address.
FURTHER INFORMATION
From time to time, MFS may post important information about the fund or the MFS funds on the MFS web site (mfs.com). This information is available by visiting the “Market Commentary” and “Announcements” sub sections in the “Market Outlooks” section of mfs.com or by clicking on the fund’s name under “Variable Insurance Portfolios — VIT” in the “Products” section of mfs.com.
FEDERAL TAX INFORMATION (unaudited)
The following information is provided pursuant to provisions of the Internal Revenue Code.
The fund designates $88,338,000 as capital gain dividends paid during the fiscal year.
For corporate shareholders, 58.19% of the ordinary income dividends paid during the fiscal year qualify for the corporate dividends received deduction.
35
rev. 3/11
| | | | |
| FACTS | | WHAT DOES MFS DO WITH YOUR
PERSONAL INFORMATION? | |  |
| | |
| Why? | | Financial companies choose how they share your personal information. Federal law gives consumers the right to limit some but not all sharing. Federal law also requires us to tell you how we collect, share, and protect your personal information. Please read this notice carefully to understand what we do. |
| | |
| What? | | The types of personal information we collect and share depend on the product or service you have with us. This information can include: • Social Security number and account balances • Account transactions and transaction history • Checking account information and wire transfer instructions When you are no longer our customer, we continue to share your information as described in this notice. |
| | |
| How? | | All financial companies need to share customers’ personal information to run their everyday business. In the section below, we list the reasons financial companies can share their customers’ personal information; the reasons MFS chooses to share; and whether you can limit this sharing. |
| | | | |
Reasons we can share your
personal information | | Does MFS share? | | Can you limit this
sharing? |
For our everyday business purposes – such as to process your transactions, maintain your account(s), respond to court orders and legal investigations, or report to credit bureaus | | Yes | | No |
For our marketing purposes – to offer our products and services to you | | No | | We don’t share |
| For joint marketing with other financial companies | | No | | We don’t share |
For our affiliates’ everyday business purposes – information about your transactions and experiences | | No | | We don’t share |
For our affiliates’ everyday business purposes – information about your creditworthiness | | No | | We don’t share |
| For nonaffiliates to market to you | | No | | We don’t share |
| | |
| Questions? | | Call 800-225-2606 or go to mfs.com. |
36
| | |
| Who we are |
| Who is providing this notice? | | MFS Funds, MFS Investment Management, MFS Institutional Advisors, Inc., MFS Fund Distributors, Inc., MFS Heritage Trust Company, and MFS Service Center, Inc. |
| | |
| What we do |
| How does MFS protect my personal information? | | To protect your personal information from unauthorized access and use, we use security measures that comply with federal law. These measures include procedural, electronic, and physical safeguards for the protection of the personal information we collect about you. |
How does MFS
collect my personal information? | | We collect your personal information, for example, when you • open an account or provide account information • direct us to buy securities or direct us to sell your securities • make a wire transfer We also collect your personal information from others, such as credit bureaus, affiliates and other companies. |
| Why can’t I limit all sharing? | | Federal law gives you the right to limit only • sharing for affiliates’ everyday business purposes – information about your creditworthiness • affiliates from using your information to market to you • sharing for nonaffiliates to market to you State laws and individual companies may give you additional rights to limit sharing. |
| | |
| Definitions |
| Affiliates | | Companies related by common ownership or control. They can be financial and nonfinancial companies. •MFS does not share personal information with affiliates, except for everyday business purposes as described on page one of this notice. |
| Nonaffiliates | | Companies not related by common ownership or control. They can be financial and nonfinancial companies. •MFS does not share with nonaffiliates so they can market to you. |
| Joint Marketing | | A formal agreement between nonaffiliated financial companies that together market financial products or services to you. •MFS doesn’t jointly market. |
| | |
| Other important information |
| If you own an MFS product or receive an MFS service in the name of a third party such as a bank or broker-dealer, their privacy policy may apply to you instead of ours. |
37
ANNUAL REPORT
December 31, 2014

MFS® UTILITIES SERIES
MFS® Variable Insurance Trust

VUF-ANN
MFS® UTILITIES SERIES
CONTENTS
The report is prepared for the general information of contract owners. It is authorized for distribution to prospective investors only when preceded or accompanied by a current prospectus.
NOT FDIC INSURED Ÿ MAY LOSE VALUE Ÿ NO BANK OR CREDIT UNION GUARANTEE Ÿ NOT A DEPOSIT Ÿ NOT INSURED BY ANY FEDERAL GOVERNMENT AGENCY OR NCUA/NCUSIF
MFS Utilities Series
LETTER FROM THE CHAIRMAN

Dear Contract Owners:
As 2015 begins, sharply lower oil prices are reshaping the global economy, adding to deflationary pressures in the eurozone and exacerbating challenges faced by oil exporters such as Russia. The U.S. economy stands on firmer ground, having expanded steadily over the past year. The U.S. labor market has regained momentum, consumer confidence is buoyant and gasoline prices have tumbled, boosting prospects for a stronger economic rebound in 2015.
Other regions are struggling. The eurozone economy is barely expanding, and the European Central Bank (ECB) has introduced large-scale asset purchases.
Despite Japan’s efforts to strengthen its economy, its sales tax increase last spring tipped the country into a recession, leading to additional monetary stimulus from the Bank of Japan. China’s economy is slowing as it transitions to a more sustainable basis, and its growth rate will likely continue to decline.
As always, active risk management is integral to how we at MFS® manage your investments. We use a collaborative process, sharing insights across asset classes, regions and economic sectors. Our global investment team uses a diversified, multidisciplined, long-term approach.
Applying proven principles, such as asset allocation and diversification, can best serve investors over the long term. We are confident that this approach can help you as you work with your financial advisors to reach your goals in the years ahead.
Respectfully,

Robert J. Manning
Chairman
MFS Investment Management
February 13, 2015
The opinions expressed in this letter are subject to change and may not be relied upon for investment advice. No forecasts can be guaranteed.
1
MFS Utilities Series
PORTFOLIO COMPOSITION
Portfolio structure (i)
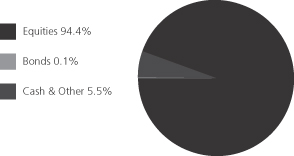
| | | | |
| Top ten holdings (i) | | | | |
| PPL Corp. | | | 3.6% | |
| NextEra Energy, Inc. | | | 3.6% | |
| Comcast Corp., “Special A” | | | 3.0% | |
| NRG Energy, Inc. | | | 2.7% | |
| Exelon Corp. | | | 2.6% | |
| Williams Cos., Inc. | | | 2.5% | |
| Sempra Energy | | | 2.4% | |
| Kinder Morgan, Inc. | | | 2.4% | |
| Public Service Enterprise Group, Inc. | | | 2.2% | |
| Calpine Corp. | | | 2.0% | |
| | | | |
| Top five industries (i) | | | | |
| Utilities-Electric Power | | | 46.1% | |
| Natural Gas-Pipeline | | | 13.1% | |
| Telephone Services | | | 8.4% | |
| Cable TV | | | 8.4% | |
| Telecommunications-Wireless | | | 6.9% | |
| |
| Issuer country weightings (i)(x) | | | | |
| United States | | | 71.0% | |
| Portugal | | | 3.6% | |
| United Kingdom | | | 3.5% | |
| Italy | | | 2.9% | |
| Spain | | | 2.7% | |
| Brazil | | | 2.6% | |
| Canada | | | 2.1% | |
| Denmark | | | 1.2% | |
| France | | | 1.1% | |
| Other Countries | | | 9.3% | |
| (i) | For purposes of this presentation, the components include the value of securities, and reflect the impact of the equivalent exposure of derivative positions, if any. These amounts may be negative from time to time. Equivalent exposure is a calculated amount that translates the derivative position into a reasonable approximation of the amount of the underlying asset that the portfolio would have to hold at a given point in time to have the same price sensitivity that results from the portfolio’s ownership of the derivative contract. When dealing with derivatives, equivalent exposure is a more representative measure of the potential impact of a position on portfolio performance than value. The bond component will include any accrued interest amounts. |
| (x) | Represents the portfolio’s exposure to issuer countries as a percentage of a portfolio’s net assets. For purposes of this presentation, United States includes Cash & Other. |
Where the fund holds convertible bonds, these are treated as part of the equity portion of the portfolio.
Cash & Other can include cash, other assets less liabilities, offsets to derivative positions, and short-term securities.
Percentages are based on net assets as of 12/31/14.
The portfolio is actively managed and current holdings may be different.
2
MFS Utilities Series
MANAGEMENT REVIEW
Summary of Results
For the twelve months ended December 31, 2014, Initial Class shares of the MFS Utilities Series (“fund”) provided a total return of 12.73%, while Service Class shares of the fund provided a total return of 12.47%. These compare with a return of 13.69% over the same period for the fund’s benchmark, the Standard & Poor’s 500 Stock Index, and a return of 28.98% for the fund’s other benchmark, the Standard & Poor’s 500 Utilities Index (“S&P Utilities Index”).
Market Environment
Early in the period, US equities suffered what proved to be a temporary setback due to concerns over emerging markets as well what was perceived at the time to be a pause in US economic growth, partially caused by extreme weather events and a weak December 2013 labor market report. Markets soon recovered as the economic pause concluded and investors appeared to have become increasingly comfortable that newly-installed US Federal Reserve (“Fed”) Chair Janet Yellen would not make any substantial changes to the trajectory of Fed monetary policy.
A generally risk-friendly, carry trade environment persisted from February 2014 until mid-year. While geopolitical tensions flared in the Middle East and Russia/Ukraine, any market setbacks were short-lived as improving economic growth in the US, coupled with prospects for easier monetary policy in regions with slowing growth, such as Japan, Europe and China, supported risk assets. For example, the European Central Bank (“ECB”) cut policy interest rates into negative territory and, by the end of the period, expectations were for additional rate cuts and the announcement for non-conventional easing measures. Similarly, the Bank of Japan surprised markets late in the period with fresh stimulus measures given lackluster growth trends. The related decline in developed market government bond yields and credit spreads were also supportive for equity markets. At the end of the period, the US equity market was trading close to all-time highs and US Treasury yields were close to their lows for the period. However, credit markets did not fare as well in the second half of 2014, particularly US high yield and emerging market debt. The higher weightings of oil and gas credits in these asset classes resulted in widening spreads and increased volatility as oil prices began to decline in an accelerated fashion in the fourth quarter.
Detractors from Performance
Security selection in the electric power industry detracted from performance relative to the S&P Utilities Index during the reporting period. The timing of the fund’s ownership in shares of utilities services provider Exelon and holdings of poor-performing power station operator Drax (b) (United Kingdom), held back relative performance. Shares of Drax plummeted late in the reporting period due to an unexpected change in the regulatory environment and a decline in energy prices.
The fund’s exposure to the wireless communications industry, which is not represented in the benchmark, was another detractor from relative results. Holdings of Russian telecommunications services companies Mobile TeleSystems (b) and MegaFon OAO (b), and voice and data communications services company Vodafone Group (b) (United Kingdom), weighed on relative performance. Shares of Vodafone depreciated during the reporting period due to a weak pricing environment.
Elsewhere, holdings of Brazilian telecommunications company Oi SA (b), cable services provider Comcast (b), and integrated energy company EQT (b) dampened relative results. The timing of the fund’s ownership in shares of diversified natural gas company ONEOK also held back relative returns.
The fund’s cash and/or cash equivalents position during the period was another detractor from relative performance. Under normal market conditions, the fund strives to be fully invested and generally holds cash to buy new holdings and to provide liquidity. In a period when equity markets rose, as measured by the fund’s benchmark, holding cash hurt performance versus the benchmark, which has no cash position.
During the reporting period, the fund’s relative currency exposure, resulting primarily from differences between the fund’s and the benchmark’s exposures to holdings of securities denominated in foreign currencies, detracted from relative performance. All of MFS’ investment decisions are driven by the fundamentals of each individual opportunity and as such, it is common for our portfolios to have different currency exposure than the benchmark.
Contributors to Performance
Individual stocks that contributed to relative performance included the fund’s holdings of Luxembourg-based telecommunications company Altice (b), natural gas company Cheniere Energy (b), German internet company Rocket Internet (b) and communications company CenturyLink (b)(h). Shares of Cheniere Energy appreciated steadily as the stock benefited from increased growth and strong liquefied natural gas prices. Underweight positions in energy delivery company CenterPoint Energy (h), integrated gas and electric
3
MFS Utilities Series
Management Review – continued
company Dominion and power and natural gas distributor Duke Energy (h) also supported relative performance. Not holding shares of poor-performing retail electric services provider Southern Company, power provider FirstEnergy and diversified energy company Consolidated Edison were also among the fund’s top relative contributors.
Respectfully,
| | |
| Claud Davis | | Maura Shaughnessy |
| Portfolio Manager | | Portfolio Manager |
Note to Contract Owners: Effective April 30, 2014, Claud Davis is also a Portfolio Manager of the Fund.
| (b) | Security is not a benchmark constituent. |
| (h) | Security was not held in the portfolio at period end. |
The views expressed in this report are those of the portfolio managers only through the end of the period of the report as stated on the cover and do not necessarily reflect the views of MFS or any other person in the MFS organization. These views are subject to change at any time based on market or other conditions, and MFS disclaims any responsibility to update such views. These views may not be relied upon as investment advice or an indication of trading intent on behalf of any MFS portfolio. References to specific securities are not recommendations of such securities, and may not be representative of any MFS portfolio’s current or future investments.
4
MFS Utilities Series
PERFORMANCE SUMMARY THROUGH 12/31/14
The following chart illustrates the historical performance of the fund in comparison to its benchmark(s). Benchmarks are unmanaged and may not be invested in directly. Benchmark returns do not reflect any fees or expenses. The performance of other share classes will be greater than or less than that of the class depicted below. (See Notes to Performance Summary.)
Performance data shown represents past performance and is no guarantee of future results. Investment return and principal value fluctuate so your units, when sold, may be worth more or less than the original cost; current performance may be lower or higher than quoted. The performance shown does not reflect the deduction of taxes, if any, that a contract holder would pay on fund distributions or the redemption of contract units. The returns for the fund shown also do not reflect the deduction of expenses associated with variable products, such as mortality and expense risk charges, separate account charges, and sales charges imposed by the insurance company separate accounts. Such expenses would reduce the overall returns shown.
Growth of a Hypothetical $10,000 Investment
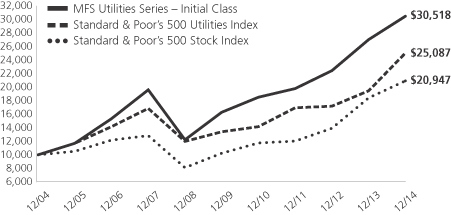
Total Returns through 12/31/14
Average annual total returns
| | | | | | | | | | | | |
| | | Share Class | | Class inception date | | 1-yr | | 5-yr | | 10-yr | | |
| | | Initial Class | | 1/03/95 | | 12.73% | | 13.38% | | 11.80% | | |
| | | Service Class | | 5/01/00 | | 12.47% | | 13.10% | | 11.53% | | |
| | | | |
| Comparative benchmarks | | | | | | | | |
| | | Standard & Poor’s 500 Stock Index (f) | | 13.69% | | 15.45% | | 7.67% | | |
| | | Standard & Poor’s 500 Utilities Index (f) | | 28.98% | | 13.34% | | 9.63% | | |
| (f) | Source: FactSet Research Systems Inc. |
Benchmark Definitions
Standard & Poor’s 500 Stock Index – a market capitalization-weighted index of 500 widely held equity securities, designed to measure broad U.S. equity performance.
Standard & Poor’s 500 Utilities Index – a market capitalization-weighted index designed to measure the utilities sector, including those companies considered electric, gas or water utilities, or companies that operate as independent producers and/or distributors of power.
It is not possible to invest directly in an index.
Notes to Performance Summary
Average annual total return represents the average annual change in value for each share class for the periods presented.
Performance results reflect any applicable expense subsidies and waivers in effect during the periods shown. Without such subsidies and waivers the fund’s performance results would be less favorable. Please see the prospectus and financial statements for complete details. All results are historical and assume the reinvestment of any dividends and capital gains distributions.
Performance results do not include adjustments made for financial reporting purposes in accordance with U.S. generally accepted accounting principles and may differ from amounts reported in the financial highlights.
From time to time the fund may receive proceeds from litigation settlements, without which performance would be lower.
5
MFS Utilities Series
EXPENSE TABLE
Fund Expenses Borne by the Contract Holders During the Period,
July 1, 2014 through December 31, 2014
As a contract holder of the fund, you incur ongoing costs, including management fees; distribution and/or service (12b-1) fees; and other fund expenses. This example is intended to help you understand your ongoing costs (in dollars) of investing in the fund and to compare these costs with the ongoing costs of investing in other mutual funds.
The example is based on an investment of $1,000 invested at the beginning of the period and held for the entire period July 1, 2014 through December 31, 2014.
Actual Expenses
The first line for each share class in the following table provides information about actual account values and actual expenses. You may use the information in this line, together with the amount you invested, to estimate the expenses that you paid over the period. Simply divide your account value by $1,000 (for example, an $8,600 account value divided by $1,000 = 8.6), then multiply the result by the number in the first line under the heading entitled “Expenses Paid During Period” to estimate the expenses you paid on your account during this period.
Hypothetical Example for Comparison Purposes
The second line for each share class in the following table provides information about hypothetical account values and hypothetical expenses based on the fund’s actual expense ratio and an assumed rate of return of 5% per year before expenses, which is not the fund’s actual return. The hypothetical account values and expenses may not be used to estimate the actual ending account balance or expenses you paid for the period. You may use this information to compare the ongoing costs of investing in the fund and other funds. To do so, compare this 5% hypothetical example with the 5% hypothetical examples that appear in the shareholder reports of the other funds.
Please note that the expenses shown in the table are meant to highlight the fund’s ongoing costs only and do not take into account the fees and expenses imposed under the variable contracts through which your investment in the fund is made. Therefore, the second line for each share class in the table is useful in comparing ongoing costs associated with an investment in vehicles (such as the fund) which fund benefits under variable annuity and variable life insurance contracts and to qualified pension and retirement plans only, and will not help you determine the relative total costs of investing in the fund through variable annuity and variable life insurance contracts. If the fees and expenses imposed under the variable contracts were included, your costs would have been higher.
| | | | | | | | | | | | | | | | | | |
| Share Class | | | | Annualized Expense Ratio | | | Beginning Account Value
7/01/14 | | | Ending Account Value 12/31/14 | | | Expenses Paid During Period (p) 7/01/14-12/31/14 | |
| Initial Class | | Actual | | | 0.78% | | | | $1,000.00 | | | | $963.00 | | | | $3.86 | |
| | Hypothetical (h) | | | 0.78% | | | | $1,000.00 | | | | $1,021.27 | | | | $3.97 | |
| Service Class | | Actual | | | 1.03% | | | | $1,000.00 | | | | $962.03 | | | | $5.09 | |
| | Hypothetical (h) | | | 1.03% | | | | $1,000.00 | | | | $1,020.01 | | | | $5.24 | |
| (h) | 5% class return per year before expenses. |
| (p) | “Expenses Paid During Period” are equal to each class’s annualized expense ratio, as shown above, multiplied by the average account value over the period, multiplied by 184/365 (to reflect the one-half year period). |
6
MFS Utilities Series
PORTFOLIO OF INVESTMENTS – 12/31/14
The Portfolio of Investments is a complete list of all securities owned by your fund. It is categorized by broad-based asset classes.
| | | | | | | | |
| Issuer | | Shares/Par | | | Value ($) | |
| | | | | | | | |
| COMMON STOCKS – 86.6% | | | | | |
| Cable TV – 8.3% | | | | | |
| Astro Malaysia Holdings Berhad | | | 9,692,000 | | | $ | 8,398,902 | |
| Charter Communications, Inc., “A” (a) | | | 120,544 | | | | 20,085,041 | |
| Comcast Corp., “Special A” | | | 1,055,761 | | | | 60,774,882 | |
| Liberty Global PLC, “A” (a) | | | 141,744 | | | | 7,116,258 | |
| Liberty Global PLC, “C” (a) | | | 828,713 | | | | 40,035,125 | |
| Time Warner Cable, Inc. | | | 205,484 | | | | 31,245,897 | |
| | | | | | | | |
| | | | | | $ | 167,656,105 | |
| | | | | | | | |
| Energy – Independent – 4.4% | | | | | |
| Access Midstream Partners LP | | | 192,183 | | | $ | 10,416,319 | |
| Anadarko Petroleum Corp. | | | 185,149 | | | | 15,274,792 | |
| Enable Midstream Partners LP | | | 157,096 | | | | 3,046,091 | |
| Energen Corp. | | | 220,462 | | | | 14,056,657 | |
| EQT Corp. | | | 201,421 | | | | 15,247,570 | |
| Markwest Energy Partners LP | | | 139,563 | | | | 9,377,238 | |
| Noble Energy, Inc. | | | 142,424 | | | | 6,755,170 | |
| Targa Resources Corp. | | | 33,229 | | | | 3,523,935 | |
| Western Gas Equity Partners LP | | | 189,620 | | | | 11,420,813 | |
| | | | | | | | |
| | | | | | $ | 89,118,585 | |
| | | | | | | | |
| Entertainment – 0.1% | | | | | |
| Vivendi S.A. | | | 40,797 | | | $ | 1,017,688 | |
| | | | | | | | |
| Internet – 0.4% | | | | | |
| Rocket Internet AG (a) | | | 125,946 | | | $ | 7,831,886 | |
| | | | | | | | |
| Natural Gas – Distribution – 6.8% | | | | | |
| AGL Energy Ltd. | | | 470,712 | | | $ | 5,117,125 | |
| China Resources Gas Group Ltd. | | | 5,132,000 | | | | 13,275,257 | |
| Gas Natural SDG S.A. | | | 371,486 | | | | 9,345,415 | |
| GDF SUEZ | | | 879,268 | | | | 20,535,569 | |
| Infraestructura Energetica Nova, S.A. de C.V | | | 725,294 | | | | 3,628,006 | |
| NiSource, Inc. | | | 146,819 | | | | 6,228,062 | |
| NorthWestern Corp. | | | 170,050 | | | | 9,621,429 | |
| Sempra Energy | | | 427,292 | | | | 47,583,237 | |
| Snam Rete Gas S.p.A. | | | 3,328,694 | | | | 16,420,865 | |
| Spectra Energy Corp. | | | 109,212 | | | | 3,964,396 | |
| | | | | | | | |
| | | | | | $ | 135,719,361 | |
| | | | | | | | |
| Natural Gas – Pipeline – 13.1% | | | | | |
| Antero Midstream Partners LP (a) | | | 71,990 | | | $ | 1,979,725 | |
| APA Group | | | 944,635 | | | | 5,745,439 | |
| Cheniere Energy, Inc. (a) | | | 122,449 | | | | 8,620,410 | |
| Cone Midstream Partners LP (a) | | | 123,560 | | | | 2,980,267 | |
| Enagas S.A. | | | 625,460 | | | | 19,797,569 | |
| Enbridge, Inc. | | | 421,254 | | | | 21,660,969 | |
| Energy Transfer Equity LP | | | 357,709 | | | | 20,525,342 | |
| Enterprise Products Partners LP | | | 28,313 | | | | 1,022,666 | |
| JP Energy Partners LP (a) | | | 280,006 | | | | 3,424,473 | |
| Kinder Morgan, Inc. | | | 1,121,034 | | | | 47,430,949 | |
| ONEOK Partners LP | | | 141,867 | | | | 5,622,189 | |
| ONEOK, Inc. | | | 306,270 | | | | 15,249,183 | |
| Plains All American Pipeline LP | | | 93,022 | | | | 4,773,889 | |
| | | | | | | | |
| Issuer | | Shares/Par | | | Value ($) | |
| | | | | | | | |
| COMMON STOCKS – continued | | | | | |
| Natural Gas – Pipeline – continued | | | | | |
| Plains GP Holdings LP | | | 1,217,751 | | | $ | 31,271,846 | |
| SemGroup Corp., “A” | | | 152,287 | | | | 10,414,908 | |
| Williams Cos., Inc. | | | 1,122,606 | | | | 50,449,914 | |
| Williams Partners LP | | | 260,700 | | | | 11,666,325 | |
| | | | | | | | |
| | | | | | $ | 262,636,063 | |
| | | | | | | | |
| Telecommunications – Wireless – 6.2% | | | | | |
| Advanced Info Service PLC | | | 95,500 | | | $ | 728,587 | |
| American Tower Corp., REIT | | | 256,072 | | | | 25,312,717 | |
| Cellcom Israel Ltd. (a) | | | 541,118 | | | | 4,680,671 | �� |
| Idea Cellular Ltd. | | | 870,190 | | | | 2,107,756 | |
| KDDI Corp. | | | 191,700 | | | | 11,994,712 | |
| MegaFon OAO, GDR | | | 339,892 | | | | 4,661,066 | |
| Mobile TeleSystems OJSC, ADR | | | 1,147,692 | | | | 8,240,429 | |
| MTN Group Ltd. | | | 52,524 | | | | 996,737 | |
| Philippine Long Distance Telephone Co. | | | 28,755 | | | | 1,868,038 | |
| SBA Communications Corp. (a) | | | 213,929 | | | | 23,694,776 | |
| T-Mobile U.S., Inc. (a) | | | 78,158 | | | | 2,105,577 | |
| TIM Participacoes S.A., ADR | | | 185,246 | | | | 4,114,314 | |
| Turkcell Iletisim Hizmetleri A.S. (a) | | | 1,880,409 | | | | 11,483,245 | |
| Vodafone Group PLC | | | 6,322,647 | | | | 21,664,315 | |
| | | | | | | | |
| | | | | | $ | 123,652,940 | |
| | | | | | | | |
| Telephone Services – 7.2% | | | | | |
| Altice S.A. (a) | | | 277,696 | | | $ | 21,929,063 | |
| Bezeq – The Israel Telecommunication Corp. Ltd. | | | 8,543,045 | | | | 15,188,491 | |
| BT Group PLC | | | 521,740 | | | | 3,238,735 | |
| Com Hem Holding AB (a) | | | 2,222,948 | | | | 17,849,621 | |
| Drillisch AG | | | 59,339 | | | | 2,123,938 | |
| France Telecom S.A. | | | 36,001 | | | | 612,243 | |
| Hellenic Telecommunications Organization S.A. (a) | | | 1,264,277 | | | | 13,921,532 | |
| Numericable-SFR (a) | | | 10,537 | | | | 519,582 | |
| Oi S.A. (a) | | | 441,535 | | | | 1,492,681 | |
| PT XL Axiata Tbk | | | 15,611,500 | | | | 6,086,409 | |
| Quebecor, Inc., “B” | | | 439,982 | | | | 12,095,907 | |
| TDC A.S. | | | 3,185,765 | | | | 24,277,596 | |
| Telecom Italia S.p.A. (a) | | | 950,833 | | | | 1,008,378 | |
| Telus Corp. | | | 237,833 | | | | 8,575,335 | |
| Verizon Communications, Inc. | | | 354,600 | | | | 16,588,188 | |
| | | | | | | | |
| | | | | | $ | 145,507,699 | |
| | | | | | | | |
| Utilities – Electric Power – 40.1% | | | | | |
| Abengoa Yield PLC | | | 472,193 | | | $ | 12,900,313 | |
| AES Corp. | | | 2,418,265 | | | | 33,299,509 | |
| Aksa Enerji Uretim A.S. (a) | | | 2,287,831 | | | | 2,849,784 | |
| ALLETE, Inc. | | | 273,867 | | | | 15,101,026 | |
| Ameren Corp. | | | 263,415 | | | | 12,151,334 | |
| American Electric Power Co., Inc. | | | 546,460 | | | | 33,181,051 | |
| Calpine Corp. (a) | | | 1,848,513 | | | | 40,907,593 | |
| Cheung Kong Infrastructure Holdings Ltd. | | | 1,227,000 | | | | 9,042,486 | |
| China Longyuan Power Group | | | 6,147,000 | | | | 6,332,326 | |
7
MFS Utilities Series
Portfolio of Investments – continued
| | | | | | | | |
| Issuer | | Shares/Par | | | Value ($) | |
| | | | | | | | |
| COMMON STOCKS – continued | | | | | |
| Utilities – Electric Power – continued | | | | | |
| CMS Energy Corp. | | | 562,552 | | | $ | 19,548,682 | |
| Companhia Paranaense de Energia, ADR (l) | | | 227,038 | | | | 2,990,090 | |
| CPFL Energia S.A. | | | 1,309,805 | | | | 8,893,322 | |
| Dominion Resources, Inc. | | | 102,147 | | | | 7,855,104 | |
| Drax Group | | | 1,374,018 | | | | 9,768,111 | |
| DTE Energy Co. | | | 124,619 | | | | 10,763,343 | |
| Dynegy, Inc. (a) | | | 1,311,270 | | | | 39,797,044 | |
| Edison International | | | 92,267 | | | | 6,041,643 | |
| EDP Renovaveis S.A. | | | 5,652,530 | | | | 36,749,140 | |
| ENEL Green Power International B.V. | | | 1,713,378 | | | | 3,559,841 | |
| Enel S.p.A. | | | 3,984,897 | | | | 17,821,836 | |
| Energias de Portugal S.A. | | | 9,089,539 | | | | 35,153,139 | |
| Energias do Brasil S.A. | | | 3,744,059 | | | | 12,542,733 | |
| Equatorial Energia S.A. | | | 471,671 | | | | 4,915,088 | |
| Exelon Corp. | | | 1,412,095 | | | | 52,360,483 | |
| Iberdrola S.A. | | | 1,025,741 | | | | 6,901,363 | |
| Infinis Energy PLC | | | 1,130,200 | | | | 3,875,368 | |
| Light S.A. | | | 713,334 | | | | 4,525,377 | |
| NextEra Energy Partners LP | | | 83,387 | | | | 2,814,311 | |
| NextEra Energy, Inc. | | | 674,606 | | | | 71,703,872 | |
| Northeast Utilities | | | 91,221 | | | | 4,882,148 | |
| NRG Energy, Inc. | | | 2,006,890 | | | | 54,085,685 | |
| NRG Yield, Inc. | | | 138,185 | | | | 6,514,041 | |
| OGE Energy Corp. | | | 1,049,515 | | | | 37,236,792 | |
| PG&E Corp. | | | 251,729 | | | | 13,402,052 | |
| Pinnacle West Capital Corp. | | | 203,580 | | | | 13,906,550 | |
| PPL Corp. | | | 1,990,277 | | | | 72,306,763 | |
| Public Service Enterprise Group, Inc. | | | 1,067,064 | | | | 44,187,120 | |
| Red Electrica de Espana | | | 205,744 | | | | 18,061,655 | |
| SSE PLC | | | 631,339 | | | | 15,849,550 | |
| | | | | | | | |
| | | $ | 804,777,668 | |
| | | | | | | | |
Total Common Stocks
(Identified Cost, $1,480,536,226) | | | $ | 1,737,917,995 | |
| | | | | | | | |
|
| CONVERTIBLE PREFERRED STOCKS – 6.2% | |
| Telecommunications – Wireless – 0.7% | |
| T Mobile U.S., Inc. 5.5% (a) | | | 278,862 | | | $ | 14,776,897 | |
| | | | | | | | |
| Utilities – Electric Power – 5.5% | | | | | |
| Dominion Resources, Inc., “A”, 6.125% | | | 194,209 | | | $ | 11,654,482 | |
| Dominion Resources, Inc., “B”, 6% | | | 232,796 | | | | 13,995,696 | |
| Dominion Resources, Inc., 6.375% | | | 239,737 | | | | 12,468,721 | |
| Dynegy, Inc., 5.375% (a) | | | 214,113 | | | | 21,839,526 | |
| | | | | | | | |
| Issuer | | Shares/Par | | | Value ($) | |
| | | | | | | | |
| CONVERTIBLE PREFERRED STOCKS – continued | |
| Utilities – Electric Power – continued | | | | | |
| Exelon Corp., 6.5% | | | 524,644 | | | $ | 27,543,810 | |
| NextEra Energy, Inc., 5.799% | | | 86,458 | | | | 4,987,762 | |
| NextEra Energy, Inc., 5.889% | | | 258,590 | | | | 17,310,015 | |
| | | | | | | | |
| | | $ | 109,800,012 | |
| | | | | | | | |
Total Convertible Preferred Stocks
(Identified Cost, $113,385,802) | | | $ | 124,576,909 | |
| | | | | | | | |
| |
| PREFERRED STOCKS – 1.6% | | | | | |
| Telephone Services – 1.2% | | | | | |
| Oi S.A. (a) | | | 1,578,558 | | | $ | 5,048,932 | |
| Telecom Italia S.p.A. | | | 22,589,186 | | | | 18,880,830 | |
| | | | | | | | |
| | | | | | $ | 23,929,762 | |
| | | | | | | | |
| Utilities – Electric Power – 0.4% | | | | | |
| Companhia Paranaense de Energia | | | 649,200 | | | $ | 8,549,491 | |
| | | | | | | | |
Total Preferred Stocks
(Identified Cost, $41,722,887) | | | | | | $ | 32,479,253 | |
| | | | | | | | |
| |
| BONDS – 0.1% | | | | | |
| Asset-Backed & Securitized – 0.0% | | | | | |
| Falcon Franchise Loan LLC, FRN, 4.206%, 1/05/23 (i)(z) | | $ | 92,915 | | | $ | 7,405 | |
| | | | | | | | |
| Utilities – Electric Power – 0.1% | | | | | |
| Viridian Group FundCo II, Ltd., 11.125%, 4/01/17 (n) | | $ | 2,170,000 | | | $ | 2,321,900 | |
| | | | | | | | |
Total Bonds
(Identified Cost, $2,136,621) | | | | | | $ | 2,329,305 | |
| | | | | | | | |
| |
| MONEY MARKET FUNDS – 4.5% | | | | | |
| MFS Institutional Money Market Portfolio, 0.09%, at Cost and Net Asset Value (v) | | | 88,762,069 | | | $ | 88,762,069 | |
| | | | | | | | |
|
| COLLATERAL FOR SECURITIES LOANED – 0.1% | |
| Navigator Securities Lending Prime Portfolio, 0.16%, at Cost and Net Asset Value (j) | | | 2,278,884 | | | $ | 2,278,884 | |
| | | | | | | | |
Total Investments
(Identified Cost, $1,728,822,489) | | | $ | 1,988,344,415 | |
| | | | | | | | |
OTHER ASSETS, LESS
LIABILITIES – 0.9% | | | | | | | 18,909,439 | |
| | | | | | | | |
| NET ASSETS – 100.0% | | | | | | $ | 2,007,253,854 | |
| | | | | | | | |
| (a) | | Non-income producing security. |
| (i) | | Interest only security for which the fund receives interest on notional principal (Par amount). Par amount shown is the notional principal and does not reflect the cost of the security. |
| (j) | | The rate quoted is the annualized seven-day yield of the fund at period end. |
| (l) | | A portion of this security is on loan. |
| (n) | | Securities exempt from registration under Rule 144A of the Securities Act of 1933. These securities may be sold in the ordinary course of business in transactions exempt from registration, normally to qualified institutional buyers. At period end, the aggregate value of these securities was $2,321,900, representing 0.1% of net assets. |
| (v) | | Underlying affiliated fund that is available only to investment companies managed by MFS. The rate quoted for the MFS Institutional Money Market Portfolio is the annualized seven-day yield of the fund at period end. |
8
MFS Utilities Series
Portfolio of Investments – continued
| (z) | | Restricted securities are not registered under the Securities Act of 1933 and are subject to legal restrictions on resale. These securities generally may be resold in transactions exempt from registration or to the public if the securities are subsequently registered. Disposal of these securities may involve time-consuming negotiations and prompt sale at an acceptable price may be difficult. The fund holds the following restricted securities: |
| | | | | | | | | | |
| Restricted Securities | | Acquisition
Date | |
Cost | | | Value | |
| Falcon Franchise Loan LLC, FRN, 4.206%, 1/05/23 | | 1/18/02 | | | $3,275 | | | | $7,405 | |
| % of Net assets | | | | 0.0% | |
The following abbreviations are used in this report and are defined:
| ADR | | American Depositary Receipt |
| FRN | | Floating Rate Note. Interest rate resets periodically and may not be the rate reported at period end. |
| GDR | | Global Depositary Receipt |
| PLC | | Public Limited Company |
| REIT | | Real Estate Investment Trust |
Abbreviations indicate amounts shown in currencies other than the U.S. dollar. All amounts are stated in U.S. dollars unless otherwise indicated. A list of abbreviations is shown below:
Derivative Contracts at 12/31/14
Forward Foreign Currency Exchange Contracts at 12/31/14
| | | | | | | | | | | | | | | | | | | | | | | | |
| | | Type | | Currency | | | Counterparty | | Contracts to
Deliver/Receive | | Settlement Date
Range | | In Exchange For | | | Contracts
at Value | | | Net Unrealized
Appreciation
(Depreciation) | |
| | Asset Derivatives | | | | | | | | | | | | | | | | |
| | SELL | | | EUR | | | Barclays Bank PLC | | 727,269 | | 1/09/15 | | $ | 907,469 | | | $ | 880,069 | | | $ | 27,400 | |
| | SELL | | | EUR | | | Citibank N.A. | | 5,784,848 | | 1/09/15 | | | 7,317,630 | | | | 7,000,255 | | | | 317,375 | |
| | SELL | | | EUR | | | Credit Suisse Group | | 6,070,570 | | 1/09/15 | | | 7,599,293 | | | | 7,346,008 | | | | 253,285 | |
| | SELL | | | EUR | | | Deutsche Bank AG | | 89,934,812 | | 1/09/15-3/18/15 | | | 112,921,348 | | | | 108,870,314 | | | | 4,051,034 | |
| | SELL | | | EUR | | | Goldman Sachs International | | 11,612,306 | | 1/09/15 | | | 14,722,064 | | | | 14,052,072 | | | | 669,992 | |
| | SELL | | | EUR | | | JPMorgan Chase Bank N.A. | | 6,382,972 | | 1/09/15 | | | 8,038,794 | | | | 7,724,046 | | | | 314,748 | |
| | SELL | | | EUR | | | Merrill Lynch International | | 4,976,343 | | 1/09/15 | | | 6,248,292 | | | | 6,021,881 | | | | 226,411 | |
| | SELL | | | EUR | | | Morgan Stanley Capital Services, Inc. | | 1,943,521 | | 1/09/15 | | | 2,463,412 | | | | 2,351,858 | | | | 111,554 | |
| | SELL | | | EUR | | | UBS AG | | 13,860,700 | | 1/09/15 | | | 17,526,751 | | | | 16,772,858 | | | | 753,893 | |
| | BUY | | | GBP | | | Barclays Bank PLC | | 15,882 | | 1/09/15 | | | 24,651 | | | | 24,753 | | | | 102 | |
| | BUY | | | GBP | | | Deutsche Bank AG | | 1,593 | | 1/09/15 | | | 2,482 | | | | 2,483 | | | | 1 | |
| | SELL | | | GBP | | | Barclays Bank PLC | | 1,824,062 | | 1/09/15 | | | 2,908,020 | | | | 2,842,896 | | | | 65,124 | |
| | SELL | | | GBP | | | Credit Suisse Group | | 9,250,921 | | 1/09/15 | | | 14,791,939 | | | | 14,418,042 | | | | 373,897 | |
| | SELL | | | GBP | | | Deutsche Bank AG | | 394,864 | | 1/09/15 | | | 635,005 | | | | 615,416 | | | | 19,589 | |
| | SELL | | | GBP | | | Merrill Lynch International | | 9,218,705 | | 1/09/15 | | | 14,762,955 | | | | 14,367,831 | | | | 395,124 | |
| | SELL | | | GBP | | | Morgan Stanley Capital Services, Inc. | | 4,180,211 | | 1/09/15 | | | 6,725,034 | | | | 6,515,077 | | | | 209,957 | |
| | | | | | | | | | | | | | | | | | | | | | | | |
| | | | | | | | | | | | | | | | | | | | | | $ | 7,789,486 | |
| | | | | | | | | | | | | | | | | | | | | | | | |
| | Liability Derivatives | | | | | | | | | | | | |
| | BUY | | | EUR | | | Barclays Bank PLC | | 354,610 | | 1/09/15 | | $ | 433,510 | | | $ | 429,114 | | | $ | (4,396 | ) |
| | BUY | | | EUR | | | Citibank N.A. | | 345,067 | | 1/09/15 | | | 438,558 | | | | 417,566 | | | | (20,992 | ) |
| | BUY | | | EUR | | | Credit Suisse Group | | 2,563,875 | | 1/09/15 | | | 3,240,763 | | | | 3,102,549 | | | | (138,214 | ) |
| | BUY | | | EUR | | | Deutsche Bank AG | | 1,277,333 | | 1/09/15 | | | 1,592,334 | | | | 1,545,703 | | | | (46,631 | ) |
| | BUY | | | EUR | | | Goldman Sachs International | | 2,691,789 | | 1/09/15 | | | 3,355,789 | | | | 3,257,339 | | | | (98,450 | ) |
| | BUY | | | EUR | | | JPMorgan Chase Bank N.A. | | 164,382 | | 1/09/15 | | | 201,214 | | | | 198,918 | | | | (2,296 | ) |
| | BUY | | | EUR | | | Merrill Lynch International | | 699,599 | | 1/09/15 | | | 850,575 | | | | 846,585 | | | | (3,990 | ) |
| | BUY | | | GBP | | | Barclays Bank PLC | | 944,840 | | 1/09/15 | | | 1,480,569 | | | | 1,472,582 | | | | (7,987 | ) |
| | BUY | | | GBP | | | Credit Suisse Group | | 561,745 | | 1/09/15 | | | 900,693 | | | | 875,508 | | | | (25,185 | ) |
| | BUY | | | GBP | | | Goldman Sachs International | | 5,689 | | 1/09/15 | | | 8,890 | | | | 8,866 | | | | (24 | ) |
| | BUY | | | GBP | | | JPMorgan Chase Bank N.A. | | 750,082 | | 1/09/15 | | | 1,170,780 | | | | 1,169,042 | | | | (1,738 | ) |
9
MFS Utilities Series
Portfolio of Investments – continued
Forward Foreign Currency Exchange Contracts at 12/31/14 – continued
| | | | | | | | | | | | | | | | | | | | | | | | |
| | | Type | | Currency | | | Counterparty | | Contracts to
Deliver/Receive | | Settlement Date
Range | | In Exchange For | | | Contracts
at Value | | | Net Unrealized
Appreciation
(Depreciation) | |
| | Liability Derivatives – continued | | | | | | | | | | | | | | | | |
| | BUY | | | GBP | | | Merrill Lynch International | | 43,616 | | 1/09/15 | | $ | 68,684 | | | $ | 67,978 | | | $ | (706 | ) |
| | BUY | | | GBP | | | Morgan Stanley Capital Services, Inc. | | 82,158 | | 1/09/15 | | | 128,123 | | | | 128,048 | | | | (75 | ) |
| | | | | | | | | | | | | | | | | | | | | | | | |
| | | | | | | | | | | | | | | | | | | | | | $ | (350,684 | ) |
| | | | | | | | | | | | | | | | | | | | | | | | |
See Notes to Financial Statements
10
MFS Utilities Series
FINANCIAL STATEMENTS | STATEMENT OF ASSETS AND LIABILITIES
This statement represents your fund’s balance sheet, which details the assets and liabilities comprising the total value of the fund.
| | | | | | | | |
At 12/31/14 | | | | | | | | |
Assets | | | | | | | | |
Investments – | | | | | | | | |
Non-affiliated issuers, at value (identified cost, $1,640,060,420) | | | $1,899,582,346 | | | | | |
Underlying affiliated funds, at cost and value | | | 88,762,069 | | | | | |
Total investments, at value, including $2,182,756 of securities on loan (identified cost, $1,728,822,489) | | | $1,988,344,415 | | | | | |
Cash | | | 301,303 | | | | | |
Foreign currency, at value (identified cost, $4) | | | 4 | | | | | |
Receivables for | | | | | | | | |
Forward foreign currency exchange contracts | | | 7,789,486 | | | | | |
Investments sold | | | 23,189,314 | | | | | |
Fund shares sold | | | 880,352 | | | | | |
Interest and dividends | | | 3,135,192 | | | | | |
Other assets | | | 13,366 | | | | | |
Total assets | | | | | | | $2,023,653,432 | |
Liabilities | | | | | | | | |
Payables for | | | | | | | | |
Forward foreign currency exchange contracts | | | $350,684 | | | | | |
Investments purchased | | | 11,730,579 | | | | | |
Fund shares reacquired | | | 1,563,637 | | | | | |
Collateral for securities loaned, at value | | | 2,278,884 | | | | | |
Payable to affiliates | | | | | | | | |
Investment adviser | | | 89,326 | | | | | |
Shareholder servicing costs | | | 735 | | | | | |
Distribution and/or service fees | | | 17,430 | | | | | |
Payable for independent Trustees’ compensation | | | 12 | | | | | |
| Deferred country tax expense payable | | | 19,158 | | | | | |
Accrued expenses and other liabilities | | | 349,133 | | | | | |
Total liabilities | | | | | | | $16,399,578 | |
Net assets | | | | | | | $2,007,253,854 | |
Net assets consist of | | | | | | | | |
Paid-in capital | | | $1,560,015,429 | | | | | |
Unrealized appreciation (depreciation) on investments and translation of assets and liabilities in foreign currencies (net of $19,158 deferred country tax) | | | 266,924,499 | | | | | |
Accumulated net realized gain (loss) on investments and foreign currency | | | 118,015,109 | | | | | |
Undistributed net investment income | | | 62,298,817 | | | | | |
Net assets | | | | | | | $2,007,253,854 | |
Shares of beneficial interest outstanding | | | | | | | 59,630,362 | |
| | | | | | | | | | | | |
| | | Net assets | | | Shares
outstanding | | | Net asset value
per share | |
Initial Class | | | $754,927,101 | | | | 22,225,878 | | | | $33.97 | |
Service Class | | | 1,252,326,753 | | | | 37,404,484 | | | | 33.48 | |
See Notes to Financial Statements
11
MFS Utilities Series
FINANCIAL STATEMENTS | STATEMENT OF OPERATIONS
This statement describes how much your fund earned in investment income and accrued in expenses. It also describes any gains and/or losses generated by fund operations.
| | | | | | | | |
Year ended 12/31/14 | | | | | | | | |
Net investment income | | | | | | | | |
Income | | | | | | | | |
Dividends | | | $67,808,520 | | | | | |
Interest | | | 3,661 | | | | | |
Dividends from underlying affiliated funds | | | 38,868 | | | | | |
Foreign taxes withheld | | | (1,858,344 | ) | | | | |
Total investment income | | | | | | | $65,992,705 | |
Expenses | | | | | | | | |
Management fee | | | $12,941,118 | | | | | |
Distribution and/or service fees | | | 2,825,669 | | | | | |
Shareholder servicing costs | | | 104,728 | | | | | |
Administrative services fee | | | 253,142 | | | | | |
Independent Trustees’ compensation | | | 33,421 | | | | | |
Custodian fee | | | 363,083 | | | | | |
Shareholder communications | | | 194,537 | | | | | |
Audit and tax fees | | | 58,591 | | | | | |
Legal fees | | | 21,519 | | | | | |
Miscellaneous | | | 38,504 | | | | | |
Total expenses | | | | | | | $16,834,312 | |
Fees paid indirectly | | | (205 | ) | | | | |
Reduction of expenses by investment adviser | | | (87,107 | ) | | | | |
Net expenses | | | | | | | $16,747,000 | |
Net investment income | | | | | | | $49,245,705 | |
Realized and unrealized gain (loss) on investments and foreign currency | | | | | | | | |
Realized gain (loss) (identified cost basis) | | | | | | | | |
Investments | | | $130,605,353 | | | | | |
Foreign currency | | | 13,188,319 | | | | | |
Net realized gain (loss) on investments and foreign currency | | | | | | | $143,793,672 | |
Change in unrealized appreciation (depreciation) | | | | | | | | |
Investments (net of $19,158 increase in deferred country tax) | | | $(7,641,303 | ) | | | | |
Translation of assets and liabilities in foreign currencies | | | 8,136,947 | | | | | |
Net unrealized gain (loss) on investments and foreign currency translation | | | | | | | $495,644 | |
Net realized and unrealized gain (loss) on investments and foreign currency | | | | | | | $144,289,316 | |
Change in net assets from operations | | | | | | | $193,535,021 | |
See Notes to Financial Statements
12
MFS Utilities Series
FINANCIAL STATEMENTS | STATEMENTS OF CHANGES IN NET ASSETS
These statements describe the increases and/or decreases in net assets resulting from operations, any distributions, and any shareholder transactions.
| | | | | | | | |
For years ended 12/31 | | | 2014 | | | | 2013 | |
Change in net assets | | | | | | | | |
From operations | | | | | | | | |
Net investment income | | | $49,245,705 | | | | $41,935,192 | |
Net realized gain (loss) on investments and foreign currency | | | 143,793,672 | | | | 61,786,663 | |
Net unrealized gain (loss) on investments and foreign currency translation | | | 495,644 | | | | 158,392,287 | |
Change in net assets from operations | | | $193,535,021 | | | | $262,114,142 | |
Distributions declared to shareholders | | | | | | | | |
From net investment income | | | $(39,350,382 | ) | | | $(31,581,445 | ) |
From net realized gain on investments | | | (73,072,176 | ) | | | (27,011,737 | ) |
Total distributions declared to shareholders | | | $(112,422,558 | ) | | | $(58,593,182 | ) |
Change in net assets from fund share transactions | | | $422,023,434 | | | | $(13,283,774 | ) |
Total change in net assets | | | $503,135,897 | | | | $190,237,186 | |
Net assets | | | | | | | | |
At beginning of period | | | 1,504,117,957 | | | | 1,313,880,771 | |
At end of period (including undistributed net investment income of $62,298,817 and
$39,771,266, respectively) | | | $2,007,253,854 | | | | $1,504,117,957 | |
See Notes to Financial Statements
13
MFS Utilities Series
FINANCIAL STATEMENTS | FINANCIAL HIGHLIGHTS
The financial highlights table is intended to help you understand the fund’s financial performance for the past 5 years. Certain information reflects financial results for a single fund share. The total returns in the table represent the rate by which an investor would have earned (or lost) on an investment in the fund share class (assuming reinvestment of all distributions) held for the entire period.
| | | | | | | | | | | | | | | | | | | | |
| Initial Class | | Years ended 12/31 | |
| | | 2014 | | | 2013 | | | 2012 | | | 2011 | | | 2010 | |
Net asset value, beginning of period | | | $31.88 | | | | $27.61 | | | | $26.08 | | | | $25.27 | | | | $22.92 | |
| Income (loss) from investment operations | | | | | | | | | | | | | | | | | | | | |
Net investment income (d) | | | $0.99 | | | | $0.94 | | | | $0.84 | | | | $0.97 | | | | $0.79 | |
Net realized and unrealized gain (loss) on investments
and foreign currency | | | 3.13 | | | | 4.64 | | | | 2.57 | | | | 0.70 | | | | 2.29 | |
Total from investment operations | | | $4.12 | | | | $5.58 | | | | $3.41 | | | | $1.67 | | | | $3.08 | |
| Less distributions declared to shareholders | | | | | | | | | | | | | | | | | | | | |
From net investment income | | | $(0.74 | ) | | | $(0.73 | ) | | | $(1.88 | ) | | | $(0.86 | ) | | | $(0.73 | ) |
From net realized gain on investments | | | (1.29 | ) | | | (0.58 | ) | | | — | | | | — | | | | — | |
Total distributions declared to shareholders | | | $(2.03 | ) | | | $(1.31 | ) | | | $(1.88 | ) | | | $(0.86 | ) | | | $(0.73 | ) |
Net asset value, end of period (x) | | | $33.97 | | | | $31.88 | | | | $27.61 | | | | $26.08 | | | | $25.27 | |
Total return (%) (k)(r)(s)(x) | | | 12.77 | | | | 20.60 | | | | 13.40 | | | | 6.78 | | | | 13.81 | |
Ratios (%) (to average net assets)
and Supplemental data: | | | | | | | | | | | | | | | | | | | | |
Expenses before expense reductions (f) | | | 0.79 | | | | 0.80 | | | | 0.82 | | | | 0.80 | | | | 0.81 | |
Expenses after expense reductions (f) | | | 0.78 | | | | 0.80 | | | | 0.82 | | | | 0.80 | | | | 0.81 | |
Net investment income | | | 2.87 | | | | 3.07 | | | | 3.11 | | | | 3.71 | | | | 3.47 | |
Portfolio turnover | | | 53 | | | | 50 | | | | 51 | | | | 53 | | | | 56 | |
Net assets at end of period (000 omitted) | | | $754,927 | | | | $525,386 | | | | $476,685 | | | | $532,447 | | | | $541,653 | |
See Notes to Financial Statements
14
MFS Utilities Series
Financial Highlights – continued
| | | | | | | | | | | | | | | | | | | | |
| Service Class | | Years ended 12/31 | |
| | | 2014 | | | 2013 | | | 2012 | | | 2011 | | | 2010 | |
Net asset value, beginning of period | | | $31.47 | | | | $27.27 | | | | $25.73 | | | | $24.95 | | | | $22.65 | |
| Income (loss) from investment operations | | | | | | | | | | | | | | | | | | | | |
Net investment income (d) | | | $0.92 | | | | $0.85 | | | | $0.71 | | | | $0.89 | | | | $0.73 | |
Net realized and unrealized gain (loss) on investments
and foreign currency | | | 3.05 | | | | 4.58 | | | | 2.59 | | | | 0.70 | | | | 2.25 | |
Total from investment operations | | | $3.97 | | | | $5.43 | | | | $3.30 | | | | $1.59 | | | | $2.98 | |
| Less distributions declared to shareholders | | | | | | | | | | | | | | | | | | | | |
From net investment income | | | $(0.67 | ) | | | $(0.65 | ) | | | $(1.76 | ) | | | $(0.81 | ) | | | $(0.68 | ) |
From net realized gain on investments | | | (1.29 | ) | | | (0.58 | ) | | | — | | | | — | | | | — | |
Total distributions declared to shareholders | | | $(1.96 | ) | | | $(1.23 | ) | | | $(1.76 | ) | | | $(0.81 | ) | | | $(0.68 | ) |
Net asset value, end of period (x) | | | $33.48 | | | | $31.47 | | | | $27.27 | | | | $25.73 | | | | $24.95 | |
Total return (%) (k)(r)(s)(x) | | | 12.47 | | | | 20.30 | | | | 13.13 | | | | 6.51 | | | | 13.51 | |
Ratios (%) (to average net assets)
and Supplemental data: | | | | | | | | | | | | | | | | | | | | |
Expenses before expense reductions (f) | | | 1.04 | | | | 1.05 | | | | 1.07 | | | | 1.05 | | | | 1.06 | |
Expenses after expense reductions (f) | | | 1.03 | | | | 1.05 | | | | 1.07 | | | | 1.05 | | | | 1.06 | |
Net investment income | | | 2.71 | | | | 2.82 | | | | 2.66 | | | | 3.45 | | | | 3.23 | |
Portfolio turnover | | | 53 | | | | 50 | | | | 51 | | | | 53 | | | | 56 | |
Net assets at end of period (000 omitted) | | | $1,252,327 | | | | $978,732 | | | | $837,196 | | | | $1,458,257 | | | | $1,335,305 | |
| (d) | Per share data is based on average shares outstanding. |
| (f) | Ratios do not reflect reductions from fees paid indirectly, if applicable. |
| (k) | The total return does not reflect expenses that apply to separate accounts. Inclusion of these charges would reduce the total return figures for all periods shown. |
| (r) | Certain expenses have been reduced without which performance would have been lower. |
| (s) | From time to time the fund may receive proceeds from litigation settlements, without which performance would be lower. |
| (x) | The net asset values per share and total returns have been calculated on net assets which include adjustments made in accordance with U.S. generally accepted accounting principles required at period end for financial reporting purposes. |
See Notes to Financial Statements
15
MFS Utilities Series
NOTES TO FINANCIAL STATEMENTS
| (1) | | Business and Organization |
MFS Utilities Series (the fund) is a diversified series of MFS Variable Insurance Trust (the trust). The trust is organized as a Massachusetts business trust and is registered under the Investment Company Act of 1940, as amended, as an open-end management investment company. The shareholders of each series of the trust are separate accounts of insurance companies, which offer variable annuity and/or life insurance products, and qualified retirement and pension plans.
The fund is an investment company and accordingly follows the investment company accounting and reporting guidance of the Financial Accounting Standards Board (FASB) Accounting Standards Codification Topic 946 Financial Services – Investment Companies.
| (2) | | Significant Accounting Policies |
General – The preparation of financial statements in conformity with U.S. generally accepted accounting principles requires management to make estimates and assumptions that affect the reported amounts of assets and liabilities, and disclosure of contingent assets and liabilities at the date of the financial statements and the reported amounts of increases and decreases in net assets from operations during the reporting period. Actual results could differ from those estimates. In the preparation of these financial statements, management has evaluated subsequent events occurring after the date of the fund’s Statement of Assets and Liabilities through the date that the financial statements were issued. The fund invests primarily in securities of issuers in the utility industry. Issuers in a single industry can react similarly to market, economic, political and regulatory conditions and developments. The fund invests in foreign securities. Investments in foreign securities are vulnerable to the effects of changes in the relative values of the local currency and the U.S. dollar and to the effects of changes in each country’s legal, political, and economic environment.
In June 2014, FASB issued Accounting Standards Update 2014-11, Transfers and Servicing (Topic 860) – Repurchase-to-Maturity Transactions, Repurchase Financings, and Disclosures (“ASU 2014-11”). ASU 2014-11 changes the accounting for repurchase-to-maturity transactions (i.e., repurchase agreements that settle at the same time as the maturity of the transferred financial asset) and enhances the required disclosures for repurchase agreements and other similar transactions. Although still evaluating the potential impacts of ASU 2014-11 to the fund, management expects that the impact of the fund’s adoption will be limited to additional financial statement disclosures which would first be effective for interim reporting periods beginning after March 15, 2015.
Balance Sheet Offsetting – The fund’s accounting policy with respect to balance sheet offsetting is that, absent an event of default by the counterparty or a termination of the agreement, the International Swaps and Derivatives Association (ISDA) Master Agreement does not result in an offset of reported amounts of financial assets and financial liabilities in the Statement of Assets and Liabilities across transactions between the fund and the applicable counterparty. The fund’s right to setoff may be restricted or prohibited by the bankruptcy or insolvency laws of the particular jurisdiction to which a specific master netting agreement counterparty is subject. Balance sheet offsetting disclosures, to the extent applicable to the fund, have been included in the fund’s Significant Accounting Policies note under the captions for each of the fund’s in-scope financial instruments and transactions.
Investment Valuations – Equity securities, including restricted equity securities, are generally valued at the last sale or official closing price as provided by a third-party pricing service on the market or exchange on which they are primarily traded. Equity securities, for which there were no sales reported that day, are generally valued at the last quoted daily bid quotation as provided by a third-party pricing service on the market or exchange on which such securities are primarily traded. Debt instruments and floating rate loans, including restricted debt instruments, are generally valued at an evaluated or composite bid as provided by a third-party pricing service. Short-term instruments with a maturity at issuance of 60 days or less may be valued at amortized cost, which approximates market value. Forward foreign currency exchange contracts are generally valued at the mean of bid and asked prices for the time period interpolated from rates provided by a third-party pricing service for proximate time periods. Open-end investment companies are generally valued at net asset value per share. Securities and other assets generally valued on the basis of information from a third-party pricing service may also be valued at a broker/dealer bid quotation. Values obtained from third-party pricing services can utilize both transaction data and market information such as yield, quality, coupon rate, maturity, type of issue, trading characteristics, and other market data. The values of foreign securities and other assets and liabilities expressed in foreign currencies are converted to U.S. dollars using the mean of bid and asked prices for rates provided by a third-party pricing service.
The Board of Trustees has delegated primary responsibility for determining or causing to be determined the value of the fund’s investments (including any fair valuation) to the adviser pursuant to valuation policies and procedures approved by the Board. If the adviser determines that reliable market quotations are not readily available, investments are valued at fair value as determined in good faith by the adviser in accordance with such procedures under the oversight of the Board of Trustees. Under the fund’s valuation policies and procedures, market quotations are not considered to be readily available for most types of debt instruments and floating rate loans and many types of derivatives. These investments are generally valued at fair value based on information from third-party pricing services. In addition, investments may be valued at fair value if the adviser determines that an investment’s value has been materially affected by events occurring after the close of the exchange or market on which the investment is principally traded (such as foreign exchange or market) and prior to the determination of the fund’s net asset value, or after the halting of
16
MFS Utilities Series
Notes to Financial Statements – continued
trading of a specific security where trading does not resume prior to the close of the exchange or market on which the security is principally traded. Events that occur on a frequent basis after foreign markets close (such as developments in foreign markets and significant movements in the U.S. markets) and prior to the determination of the fund’s net asset value may be deemed to have a material effect on the value of securities traded in foreign markets. Accordingly, the fund’s foreign equity securities may often be valued at fair value. The adviser generally relies on third-party pricing services or other information (such as the correlation with price movements of similar securities in the same or other markets; the type, cost and investment characteristics of the security; the business and financial condition of the issuer; and trading and other market data) to assist in determining whether to fair value and at what value to fair value an investment. The value of an investment for purposes of calculating the fund’s net asset value can differ depending on the source and method used to determine value. When fair valuation is used, the value of an investment used to determine the fund’s net asset value may differ from quoted or published prices for the same investment. There can be no assurance that the fund could obtain the fair value assigned to an investment if it were to sell the investment at the same time at which the fund determines its net asset value per share.
Various inputs are used in determining the value of the fund’s assets or liabilities. These inputs are categorized into three broad levels. In certain cases, the inputs used to measure fair value may fall into different levels of the fair value hierarchy. In such cases, an investment’s level within the fair value hierarchy is based on the lowest level of input that is significant to the fair value measurement. The fund’s assessment of the significance of a particular input to the fair value measurement in its entirety requires judgment, and considers factors specific to the investment. Level 1 includes unadjusted quoted prices in active markets for identical assets or liabilities. Level 2 includes other significant observable market-based inputs (including quoted prices for similar securities, interest rates, prepayment speed, and credit risk). Level 3 includes unobservable inputs, which may include the adviser’s own assumptions in determining the fair value of investments. Other financial instruments are derivative instruments not reflected in total investments, such as forward foreign currency exchange contracts. The following is a summary of the levels used as of December 31, 2014 in valuing the fund’s assets or liabilities:
| | | | | | | | | | | | | | | | |
| Investments at Value | | Level 1 | | | Level 2 | | | Level 3 | | | Total | |
| Equity Securities: | | | | | | | | | | | | | | | | |
United States | | | $1,315,529,311 | | | | $— | | | | $— | | | | $1,315,529,311 | |
Portugal | | | — | | | | 71,902,278 | | | | — | | | | 71,902,278 | |
United Kingdom | | | 16,775,681 | | | | 50,520,711 | | | | — | | | | 67,296,392 | |
Italy | | | 17,821,836 | | | | 39,869,915 | | | | — | | | | 57,691,751 | |
Spain | | | — | | | | 54,106,002 | | | | — | | | | 54,106,002 | |
Brazil | | | 12,019,492 | | | | 41,052,535 | | | | — | | | | 53,072,027 | |
Canada | | | 42,332,212 | | | | — | | | | — | | | | 42,332,212 | |
Denmark | | | — | | | | 24,277,596 | | | | — | | | | 24,277,596 | |
France | | | — | | | | 22,685,082 | | | | — | | | | 22,685,082 | |
Other Countries | | | 78,367,904 | | | | 107,713,602 | | | | — | | | | 186,081,506 | |
| Commercial Mortgage-Backed Securities | | | — | | | | 7,405 | | | | — | | | | 7,405 | |
| Foreign Bonds | | | — | | | | 2,321,900 | | | | | | | | 2,321,900 | |
| Mutual Funds | | | 91,040,953 | | | | — | | | | — | | | | 91,040,953 | |
| Total Investments | | | $1,573,887,389 | | | | $414,457,026 | | | | $— | | | | $1,988,344,415 | |
| | | | |
| Other Financial Instruments | | | | | | | | | | | | |
| Forward Foreign Currency Exchange Contracts | | | $— | | | | $7,438,802 | | | | $— | | | | $7,438,802 | |
For further information regarding security characteristics, see the Portfolio of Investments.
Of the level 2 investments presented above, equity investments amounting to $345,543,467 would have been considered level 1 investments at the beginning of the period. The primary reason for changes in the classifications between levels 1 and 2 occurs when foreign equity securities are fair valued using other observable market-based inputs in place of the closing exchange price due to events occurring after the close of the exchange or market on which the investment is principally traded. The fund’s foreign equity securities may often be valued at fair value. The fund’s policy is to recognize transfers between the levels as of the end of the period.
Foreign Currency Translation – Purchases and sales of foreign investments, income, and expenses are converted into U.S. dollars based upon currency exchange rates prevailing on the respective dates of such transactions or on the reporting date for foreign denominated receivables and payables. Gains and losses attributable to foreign currency exchange rates on sales of securities are recorded for financial statement purposes as net realized gains and losses on investments. Gains and losses attributable to foreign exchange rate movements on receivables, payables, income and expenses are recorded for financial statement purposes as foreign currency transaction gains and losses. That portion of both realized and unrealized gains and losses on investments that results from fluctuations in foreign currency exchange rates is not separately disclosed.
Derivatives – The fund uses derivatives for different purposes, primarily to increase or decrease exposure to a particular market or segment of the market, or security, to increase or decrease interest rate or currency exposure, or as alternatives to direct investments.
17
MFS Utilities Series
Notes to Financial Statements – continued
Derivatives are used for hedging or non-hedging purposes. While hedging can reduce or eliminate losses, it can also reduce or eliminate gains. When the fund uses derivatives as an investment to increase market exposure, or for hedging purposes, gains and losses from derivative instruments may be substantially greater than the derivative’s original cost.
The derivative instruments used by the fund were forward foreign currency exchange contracts. The fund’s period end derivatives, as presented in the Portfolio of Investments and the associated Derivative Contract tables, generally are indicative of the volume of its derivative activity during the period.
The following table presents, by major type of derivative contract, the fair value, on a gross basis, of the asset and liability components of derivatives held by the fund at December 31, 2014 as reported in the Statement of Assets and Liabilities:
| | | | | | | | | | |
| | | | | Fair Value | |
| Risk | | Derivative Contracts | | Asset Derivatives | | | Liability Derivatives | |
| Foreign Exchange | | Forward Foreign Currency Exchange | | | $7,789,486 | | | | $(350,684 | ) |
The following table presents, by major type of derivative contract, the realized gain (loss) on derivatives held by the fund for the year ended December 31, 2014 as reported in the Statement of Operations:
| | | | |
| Risk | | Foreign Currency | |
| Foreign Exchange | | | $13,790,150 | |
The following table presents, by major type of derivative contract, the change in unrealized appreciation (depreciation) on derivatives held by the fund for the year ended December 31, 2014 as reported in the Statement of Operations:
| | | | |
| Risk | | Translation of Assets and Liabilities in Foreign Currencies | |
| Foreign Exchange | | | $8,179,497 | |
Derivative counterparty credit risk is managed through formal evaluation of the creditworthiness of all potential counterparties. On certain, but not all, over-the-counter derivatives, the fund attempts to reduce its exposure to counterparty credit risk whenever possible by entering into an ISDA Master Agreement on a bilateral basis with each of the counterparties with whom it undertakes a significant volume of transactions. The ISDA Master Agreement gives each party to the agreement the right to terminate all transactions traded under such agreement if there is a certain deterioration in the credit quality of the other party. Upon an event of default or a termination of the ISDA Master Agreement, the non-defaulting party has the right to close out all transactions traded under such agreement and to net amounts owed under each transaction to one net amount payable by one party to the other. This right to close out and net payments across all transactions traded under the ISDA Master Agreement could result in a reduction of the fund’s credit risk to such counterparty equal to any amounts payable by the fund under the applicable transactions, if any. The fund’s right to setoff may be restricted or prohibited by the bankruptcy or insolvency laws of the particular jurisdiction to which a specific ISDA counterparty is subject.
Collateral and margin requirements differ by type of derivative. Margin requirements are set by the broker or clearing house for cleared derivatives (i.e., futures contracts, cleared swaps, and exchange-traded options) while collateral terms are contract specific for over-the-counter traded derivatives (i.e., forward foreign currency exchange contracts, uncleared swap agreements, and over-the-counter options). For derivatives traded under an ISDA Master Agreement, the collateral requirements are netted across all transactions traded under such agreement and one amount is posted from one party to the other to collateralize such obligations. Cash that has been segregated to cover the fund’s collateral or margin obligations under derivative contracts, if any, will be reported separately in the Statement of Assets and Liabilities as “Restricted cash” or “Deposits with brokers.” Securities pledged as collateral or margin for the same purpose, if any, are noted in the Portfolio of Investments.
Forward Foreign Currency Exchange Contracts – The fund entered into forward foreign currency exchange contracts for the purchase or sale of a specific foreign currency at a fixed price on a future date. These contracts may be used to hedge the fund’s currency risk or for non-hedging purposes. For hedging purposes, the fund may enter into contracts to deliver or receive foreign currency that the fund will receive from or use in its normal investment activities. The fund may also use contracts to hedge against declines in the value of foreign currency denominated securities due to unfavorable exchange rate movements. For non-hedging purposes, the fund may enter into contracts with the intent of changing the relative exposure of the fund’s portfolio of securities to different currencies to take advantage of anticipated exchange rate changes.
Forward foreign currency exchange contracts are adjusted by the daily exchange rate of the underlying currency and any unrealized gains or losses are recorded as a receivable or payable for forward foreign currency exchange contracts until the contract settlement date. On contract settlement date, any gain or loss on the contract is recorded as realized gains or losses on foreign currency.
18
MFS Utilities Series
Notes to Financial Statements – continued
Risks may arise upon entering into these contracts from unanticipated movements in the value of the contract and from the potential inability of counterparties to meet the terms of their contracts. Generally, the fund’s maximum risk due to counterparty credit risk is the unrealized gain on the contract due to the use of Continuous Linked Settlement, an industry accepted settlement system. This risk is mitigated in cases where there is an ISDA Master Agreement between the fund and the counterparty providing for netting as described above and for posting of collateral by the counterparty to the fund to cover the fund’s exposure to the counterparty under such ISDA Master Agreement.
Security Loans – Under its Securities Lending Agency Agreement with the fund, State Street Bank and Trust Company (“State Street”), as lending agent, loans the securities of the fund to certain qualified institutions (the “Borrowers”) approved by the fund. The loans are collateralized by cash and/or U.S. Treasury and federal agency obligations in an amount typically at least equal to the market value of the securities loaned. On loans collateralized by cash, the cash collateral is invested in a money market fund. The market value of the loaned securities is determined at the close of business of the fund and any additional required collateral is delivered to the fund on the next business day. State Street provides the fund with indemnification against Borrower default. In the event of Borrower default, State Street will for the benefit of the fund either purchase securities identical to those loaned or, when such purchase is commercially impracticable, pay the fund the market value of the loaned securities. In return, State Street assumes the fund’s rights to the related collateral. If the collateral value is less than the cost to purchase identical securities, State Street is responsible for the shortfall, but only to the extent that such shortfall is not due to a decline in collateral value resulting from collateral reinvestment for which the fund bears the risk of loss. At period end, the fund had investment securities on loan with a fair value of $2,182,756 and a related liability of $2,278,884 for cash collateral received on securities loaned, both of which are presented gross in the Statement of Assets and Liabilities. The collateral received on securities loaned exceeded the value of securities on loan at period end. The liability for cash collateral for securities loaned is carried at fair value, which is categorized as level 2 within the fair value hierarchy. A portion of the income generated upon investment of the collateral is remitted to the Borrowers, and the remainder is allocated between the fund and the lending agent. On loans collateralized by U.S. Treasury and/or federal agency obligations, a fee is received from the Borrower, and is allocated between the fund and the lending agent. Income from securities lending is included in “Interest” income in the Statement of Operations. The dividend and interest income earned on the securities loaned is accounted for in the same manner as other dividend and interest income.
Indemnifications – Under the fund’s organizational documents, its officers and Trustees may be indemnified against certain liabilities and expenses arising out of the performance of their duties to the fund. Additionally, in the normal course of business, the fund enters into agreements with service providers that may contain indemnification clauses. The fund’s maximum exposure under these agreements is unknown as this would involve future claims that may be made against the fund that have not yet occurred.
Investment Transactions and Income – Investment transactions are recorded on the trade date. Interest income is recorded on the accrual basis. All premium and discount is amortized or accreted for financial statement purposes in accordance with U.S. generally accepted accounting principles. Dividends received in cash are recorded on the ex-dividend date. Certain dividends from foreign securities will be recorded when the fund is informed of the dividend if such information is obtained subsequent to the ex-dividend date. Dividend and interest payments received in additional securities are recorded on the ex-dividend or ex-interest date in an amount equal to the value of the security on such date.
The fund may receive proceeds from litigation settlements. Any proceeds received from litigation involving portfolio holdings are reflected in the Statement of Operations in realized gain/loss if the security has been disposed of by the fund or in unrealized gain/loss if the security is still held by the fund. Any other proceeds from litigation not related to portfolio holdings are reflected as other income in the Statement of Operations.
Fees Paid Indirectly – The fund’s custody fee may be reduced according to an arrangement that measures the value of cash deposited with the custodian by the fund. This amount, for the year ended December 31, 2014, is shown as a reduction of total expenses in the Statement of Operations.
Tax Matters and Distributions – The fund intends to qualify as a regulated investment company, as defined under Subchapter M of the Internal Revenue Code, and to distribute all of its taxable income, including realized capital gains. As a result, no provision for federal income tax is required. The fund’s federal tax returns, when filed, will remain subject to examination by the Internal Revenue Service for a three year period. Management has analyzed the fund’s tax positions taken on federal and state tax returns for all open tax years and does not believe that there are any uncertain tax positions that require recognition of a tax liability. Foreign taxes, if any, have been accrued by the fund in the accompanying financial statements in accordance with the applicable foreign tax law. Foreign income taxes may be withheld by certain countries in which the fund invests. Additionally, capital gains realized by the fund on securities issued in or by certain foreign countries may be subject to capital gains tax imposed by those countries.
Distributions to shareholders are recorded on the ex-dividend date. Income and capital gain distributions are determined in accordance with income tax regulations, which may differ from U.S. generally accepted accounting principles. Certain capital accounts in the financial statements are periodically adjusted for permanent differences in order to reflect their tax character. These adjustments have no impact on net assets or net asset value per share. Temporary differences which arise from recognizing certain
19
MFS Utilities Series
Notes to Financial Statements – continued
items of income, expense, gain or loss in different periods for financial statement and tax purposes will reverse at some time in the future. Distributions in excess of net investment income or net realized gains are temporary overdistributions for financial statement purposes resulting from differences in the recognition or classification of income or distributions for financial statement and tax purposes.
Book/tax differences primarily relate to amortization and accretion of debt securities, wash sale loss deferrals, derivative transactions, and partnership adjustments.
The tax character of distributions declared to shareholders for the last two fiscal years is as follows:
| | | | | | | | |
| | | 12/31/14 | | | 12/31/13 | |
| Ordinary income (including any short-term capital gains) | | | $69,599,950 | | | | $31,581,445 | |
| Long-term capital gains | | | 42,822,608 | | | | 27,011,737 | |
| Total distributions | | | $112,422,558 | | | | $58,593,182 | |
The federal tax cost and the tax basis components of distributable earnings were as follows:
| | | | |
| As of 12/31/14 | | | | |
| Cost of investments | | | $1,738,341,520 | |
| Gross appreciation | | | 346,445,575 | |
| Gross depreciation | | | (96,442,680 | ) |
| Net unrealized appreciation (depreciation) | | | $250,002,895 | |
| Undistributed ordinary income | | | 100,470,131 | |
| Undistributed long-term capital gain | | | 98,328,222 | |
| Other temporary differences | | | (1,562,823 | ) |
Multiple Classes of Shares of Beneficial Interest – The fund offers multiple classes of shares, which differ in their respective distribution and/or service fees. The fund’s income, realized and unrealized gain (loss), and common expenses are allocated to shareholders based on the daily net assets of each class. Dividends are declared separately for each class. Differences in per share dividend rates are generally due to differences in separate class expenses. The fund’s distributions declared to shareholders as reported in the Statements of Changes in Net Assets are presented by class as follows:
| | | | | | | | | | | | | | | | |
| | | From net investment
income | | | From net realized gain on
investments | |
| | | Year ended
12/31/14 | | | Year ended
12/31/13 | | | Year ended
12/31/14 | | | Year ended
12/31/13 | |
| Initial Class | | | $15,974,531 | | | | $11,928,524 | | | | $28,015,023 | | | | $9,523,396 | |
| Service Class | | | 23,375,851 | | | | 19,652,921 | | | | 45,057,153 | | | | 17,488,341 | |
| Total | | | $39,350,382 | | | | $31,581,445 | | | | $73,072,176 | | | | $27,011,737 | |
| (3) | | Transactions with Affiliates |
Investment Adviser – The fund has an investment advisory agreement with MFS to provide overall investment management and related administrative services and facilities to the fund. The management fee is computed daily and paid monthly at the following annual rates:
| | | | |
| First $1 billion of average daily net assets | | | 0.75% | |
| Average daily net assets in excess of $1 billion | | | 0.70% | |
MFS has agreed in writing to reduce its management fee by a specified amount if certain MFS mutual fund assets exceed thresholds agreed to by MFS and the fund’s Board of Trustees. For the year ended December 31, 2014, this management fee reduction amounted to $84,173, which is included in the reduction of total expenses in the Statement of Operations. The management fee incurred for the year ended December 31, 2014 was equivalent to an annual effective rate of 0.72% of the fund’s average daily net assets.
Distributor – MFS Fund Distributors, Inc. (MFD), a wholly-owned subsidiary of MFS, is the distributor of shares of the fund. The Trustees have adopted a distribution plan for the Service Class shares pursuant to Rule 12b-1 under the Investment Company Act of 1940.
The fund’s distribution plan provides that the fund will pay MFD distribution and/or service fees equal to 0.25% per annum of its average daily net assets attributable to Service Class shares as partial consideration for services performed and expenses incurred by MFD and financial intermediaries (including participating insurance companies that invest in the fund to fund variable annuity and variable life insurance contracts, sponsors of qualified retirement and pension plans that invest in the fund, and affiliates of these participating insurance companies and plan sponsors) in connection with the sale and distribution of the Service Class shares. MFD may subsequently pay all, or a portion, of the distribution and/or service fees to financial intermediaries.
20
MFS Utilities Series
Notes to Financial Statements – continued
Shareholder Servicing Agent – MFS Service Center, Inc. (MFSC), a wholly-owned subsidiary of MFS, receives a fee from the fund for its services as shareholder servicing agent. For the year ended December 31, 2014, the fee was $101,688 which equated to 0.0057% annually of the fund’s average daily net assets. MFSC also receives payment from the fund for out-of-pocket expenses paid by MFSC on behalf of the fund. For the year ended December 31, 2014, these costs amounted to $3,040.
Administrator – MFS provides certain financial, legal, shareholder communications, compliance, and other administrative services to the fund. Under an administrative services agreement, the fund partially reimburses MFS the costs incurred to provide these services. The fund is charged an annual fixed amount of $17,500 plus a fee based on average daily net assets. The administrative services fee incurred for the year ended December 31, 2014 was equivalent to an annual effective rate of 0.0142% of the fund’s average daily net assets.
Trustees’ and Officers’ Compensation – The fund pays compensation to independent Trustees in the form of a retainer, attendance fees, and additional compensation to Board and Committee chairpersons. The fund does not pay compensation directly to Trustees or officers of the fund who are also officers of the investment adviser, all of whom receive remuneration for their services to the fund from MFS. Certain officers and Trustees of the fund are officers or directors of MFS, MFD, and MFSC.
Other – Effective November 1, 2014, this fund and certain other funds managed by MFS (the funds) have entered into a service agreement (the ISO Agreement) which provides for payment of fees solely by the funds to Tarantino LLC in return for the provision of services of an Independent Senior Officer (ISO) for the funds. Frank L. Tarantino serves as the ISO and is an officer of the funds and the sole member of Tarantino LLC. The funds can terminate the ISO Agreement with Tarantino LLC at any time under the terms of the ISO Agreement. Prior to November 1, 2014, the funds had entered into services agreements (the Compliance Officer Agreements) which provided for payment of fees by the funds to Tarantino LLC and Griffin Compliance LLC in return for the provision of services of an Independent Chief Compliance Officer (ICCO) and Assistant ICCO, respectively, for the funds. Prior to November 1, 2014, Frank L. Tarantino served as the ICCO. Effective October 31, 2014, Mr. Tarantino resigned as ICCO and the Compliance Officer Agreement between the funds and Tarantino LLC was terminated. Prior to June 1, 2014, Robyn L. Griffin served as the Assistant ICCO and was an officer of the funds. Ms. Griffin is the sole member of Griffin Compliance LLC. Effective May 31, 2014, Ms. Griffin resigned as Assistant ICCO and the Compliance Officer Agreement between the funds and Griffin Compliance LLC was terminated. For the year ended December 31, 2014, the aggregate fees paid by the fund under these agreements were $7,217 and are included in “Miscellaneous” expense in the Statement of Operations. MFS had agreed to reimburse the fund for a portion of the payments made by the fund for the services under the Compliance Officer Agreements in the amount of $2,934, which is included in the reduction of total expenses in the Statement of Operations. Additionally, MFS has agreed to bear all expenses associated with office space, other administrative support, and supplies provided to the ICCO, Assistant ICCO, and ISO.
The fund invests in the MFS Institutional Money Market Portfolio which is managed by MFS and seeks current income consistent with preservation of capital and liquidity. Income earned on this investment is included in “Dividends from underlying affiliated funds” in the Statement of Operations. This money market fund does not pay a management fee to MFS.
For the year ended December 31, 2014, purchases and sales of investments, other than short-term obligations, aggregated $906,967,377 and $894,565,810, respectively. Purchases exclude the value of securities acquired in connection with the MFS Utilities Portfolio merger. (See Note 8.)
| (5) | | Shares of Beneficial Interest |
The fund’s Declaration of Trust permits the Trustees to issue an unlimited number of full and fractional shares of beneficial interest. Transactions in fund shares were as follows:
| | | | | | | | | | | | | | | | |
| | | Year ended 12/31/14 | | | Year ended 12/31/13 | |
| | | Shares | | | Amount | | | Shares | | | Amount | |
| Shares sold | | | | | | | | | | | | | | | | |
Initial Class | | | 1,464,376 | | | | $50,703,687 | | | | 1,196,740 | | | | $36,397,677 | |
Service Class | | | 5,940,410 | | | | 201,152,012 | | | | 4,758,466 | | | | 143,245,859 | |
| | | 7,404,786 | | | | $251,855,699 | | | | 5,955,206 | | | | $179,643,536 | |
| Shares issued in connection with acquisition of MFS Utilities Portfolio | | | | | | | | | | | | | | | | |
Initial Class | | | 5,353,453 | | | | $189,030,408 | | | | | | | | | |
Service Class | | | 3,363,246 | | | | 117,040,963 | | | | | | | | | |
| | | 8,716,699 | | | | $306,071,371 | | | | | | | | | |
| Shares issued to shareholders in reinvestment of distributions | | | | | | | | | | | | | | | | |
Initial Class | | | 1,262,979 | | | | $43,989,554 | | | | 731,399 | | | | $21,451,920 | |
Service Class | | | 1,991,648 | | | | 68,433,004 | | | | 1,281,617 | | | | 37,141,262 | |
| | | 3,254,627 | | | | $112,422,558 | | | | 2,013,016 | | | | $58,593,182 | |
21
MFS Utilities Series
Notes to Financial Statements – continued
| | | | | | | | | | | | | | | | |
| | | Year ended 12/31/14 | | | Year ended 12/31/13 | |
| | | Shares | | | Amount | | | Shares | | | Amount | |
| Shares reacquired | | | | | | | | | | | | | | | | |
Initial Class | | | (2,336,474 | ) | | | $(79,950,659 | ) | | | (2,710,242 | ) | | | $(82,329,568 | ) |
Service Class | | | (4,994,588 | ) | | | (168,375,535 | ) | | | (5,635,990 | ) | | | (169,190,924 | ) |
| | | (7,331,062 | ) | | | $(248,326,194 | ) | | | (8,346,232 | ) | | | $(251,520,492 | ) |
| Net change | | | | | | | | | | | | | | | | |
Initial Class | | | 5,744,334 | | | | $203,772,990 | | | | (782,103 | ) | | | $(24,479,971 | ) |
Service Class | | | 6,300,716 | | | | 218,250,444 | | | | 404,093 | | | | 11,196,197 | |
| | | 12,045,050 | | | | $422,023,434 | | | | (378,010 | ) | | | $(13,283,774 | ) |
The fund and certain other funds managed by MFS participate in a $1.1 billion unsecured committed line of credit, subject to a $1 billion sublimit, provided by a syndication of banks under a credit agreement. Borrowings may be made for temporary financing needs. Interest is charged to each fund, based on its borrowings, generally at a rate equal to the higher of the Federal Reserve funds rate or one month LIBOR plus an agreed upon spread. A commitment fee, based on the average daily, unused portion of the committed line of credit, is allocated among the participating funds at the end of each calendar quarter. In addition, the fund and other funds managed by MFS have established unsecured uncommitted borrowing arrangements with certain banks for temporary financing needs. Interest is charged to each fund, based on its borrowings, at a rate equal to the Federal Reserve funds rate plus an agreed upon spread. For the year ended December 31, 2014, the fund’s commitment fee and interest expense were $6,785 and $0, respectively, and are included in “Miscellaneous” expense in the Statement of Operations.
| (7) | | Transactions in Underlying Affiliated Funds – Affiliated Issuers |
An affiliated issuer may be considered one in which the fund owns 5% or more of the outstanding voting securities, or a company which is under common control. For the purposes of this report, the fund assumes the following to be an affiliated issuer:
| | | | | | | | | | | | | | | | |
| Underlying Affiliated Fund | | Beginning Shares/Par Amount | | | Acquisitions Shares/Par Amount | | | Dispositions Shares/Par Amount | | | Ending Shares/Par Amount | |
| MFS Institutional Money Market Portfolio | | | $43,687,395 | | | | $440,213,591 | | | | $(395,138,917 | ) | | | 88,762,069 | |
| | | | |
| Underlying Affiliated Fund | | Realized Gain (Loss) | | | Capital Gain Distributions | | | Dividend Income | | | Ending Value | |
| MFS Institutional Money Market Portfolio | | | $— | | | | $— | | | | $38,868 | | | | $88,762,069 | |
At close of business on August 8, 2014, the fund with net assets of approximately $1,675,061,220, acquired all of the assets and liabilities of MFS Utilities Portfolio, a series of MFS Variable Insurance Trust II. The purpose of the transaction was to provide shareholders of MFS Utilities Portfolio the opportunity to participate in a larger combined portfolio with an identical investment objective and similar investment policies and strategies. The acquisition was accomplished by a tax-free exchange of approximately 8,716,699 shares of the fund (valued at approximately $306,071,371) for all of the assets and liabilities of MFS Utilities Portfolio. MFS Utilities Portfolio then distributed the shares of the fund that MFS Utilities Portfolio received from the fund to its shareholders. MFS Utilities Portfolio’s investments on that date were valued at approximately $295,873,296 with a cost basis of approximately $242,380,563. For financial reporting purposes, assets received and shares issued by the fund were recorded at fair value; however, the cost basis of the investments received from MFS Utilities Portfolio were carried forward to align ongoing reporting of the fund’s realized and unrealized gains and losses with amounts distributable to shareholders for tax purposes. Because the combined investment portfolios have been managed as a single integrated portfolio since the acquisition was completed, it is not practicable to separate the amounts of revenue and earnings of MFS Utilities Portfolio that have been included in the fund’s Statement of Operations since August 8, 2014.
Assuming the acquisition had been completed on January 1, 2014, the fund’s pro forma results of operations for the year ended December 31, 2014 are as follows:
| | | | |
| Net investment income | | | $56,865,630 | |
| Net realized and unrealized gain (loss) on investments and foreign currency | | | 169,043,953 | |
| Change in net assets from operations | | | $225,909,583 | |
22
MFS Utilities Series
REPORT OF INDEPENDENT REGISTERED PUBLIC ACCOUNTING FIRM
To the Board of Trustees of MFS Variable Insurance Trust and the Shareholders of
MFS Utilities Series:
We have audited the accompanying statement of assets and liabilities, including the portfolio of investments, of MFS Utilities Series (one of the series of MFS Variable Insurance Trust) (the “Fund”) as of December 31, 2014, and the related statement of operations for the year then ended, the statements of changes in net assets for each of the two years in the period then ended, and the financial highlights for each of the five years in the period then ended. These financial statements and financial highlights are the responsibility of the Fund’s management. Our responsibility is to express an opinion on these financial statements and financial highlights based on our audits.
We conducted our audits in accordance with the standards of the Public Company Accounting Oversight Board (United States). Those standards require that we plan and perform the audit to obtain reasonable assurance about whether the financial statements and financial highlights are free of material misstatement. The Fund is not required to have, nor were we engaged to perform, an audit of its internal control over financial reporting. Our audits included consideration of internal control over financial reporting as a basis for designing audit procedures that are appropriate in the circumstances, but not for the purpose of expressing an opinion on the effectiveness of the Fund’s internal control over financial reporting. Accordingly, we express no such opinion. An audit also includes examining, on a test basis, evidence supporting the amounts and disclosures in the financial statements, assessing the accounting principles used and significant estimates made by management, as well as evaluating the overall financial statement presentation. Our procedures included confirmation of securities owned as of December 31, 2014, by correspondence with the custodian and brokers; where replies were not received from brokers, we performed other auditing procedures. We believe that our audits provide a reasonable basis for our opinion.
In our opinion, the financial statements and financial highlights referred to above present fairly, in all material respects, the financial position of MFS Utilities Series as of December 31, 2014, the results of its operations for the year then ended, the changes in its net assets for each of the two years in the period then ended, and the financial highlights for each of the five years in the period then ended, in conformity with accounting principles generally accepted in the United States of America.
DELOITTE & TOUCHE LLP
Boston, Massachusetts
February 13, 2015
23
MFS Utilities Series
TRUSTEES AND OFFICERS – IDENTIFICATION AND BACKGROUND
The Trustees and Officers of the Trust, as of February 1, 2015, are listed below, together with their principal occupations during the past five years. (Their titles may have varied during that period.) The address of each Trustee and Officer is 111 Huntington Avenue, Boston, Massachusetts 02199-7618.
| | | | | | | | |
Name, Age | | Position(s)
Held with Fund | | Trustee/Officer
Since (h) | | Principal Occupations
During the Past Five Years | | Other Directorships (j) |
| INTERESTED TRUSTEES |
Robert J. Manning (k) (age 51) | | Trustee | | February 2004 | | Massachusetts Financial Services Company, Chairman, Co-Chief Executive Officer and Director; President (until 2009); Chief Investment Officer (until 2010) | | N/A |
| | | | |
Robin A. Stelmach (k) (age 53) | | Trustee and President | | January 2014 | | Massachusetts Financial Services Company, Executive Vice President and Chief Operating Officer | | N/A |
| | | |
| INDEPENDENT TRUSTEES | | | | | | |
David H. Gunning (age 72) | | Trustee and Chair of Trustees | | January 2004 | | Private investor | | Lincoln Electric Holdings, Inc. (welding equipment manufacturer), Director; Development Alternatives, Inc. (consulting), Director/Non-Executive Chairman |
| | | | |
Steven E. Buller (age 63) | | Trustee | | February 2014 | | Chairman, Financial Accounting Standards Advisory Council; Standing Advisory Group, Public Company Accounting Oversight Board, Member (until 2014); BlackRock, Inc. (investment management), Managing Director (until 2014), BlackRock Finco UK (investment management), Director (until 2014) | | N/A |
| | | | |
Robert E. Butler (age 73) | | Trustee | | January 2006 | | Consultant – investment company industry regulatory and compliance matters | | N/A |
| | | | |
Maureen R. Goldfarb (age 59) | | Trustee | | January 2009 | | Private investor | | N/A |
| | | | |
William R. Gutow (age 73) | | Trustee | | December 1993 | | Private investor and real estate consultant; Capitol Entertainment Management Company (video franchise), Vice Chairman | | Texas Donuts (donut franchise), Vice Chairman (until 2010) |
| | | | |
Michael Hegarty (age 70) | | Trustee | | December 2004 | | Private investor | | Brookfield Office Properties, Inc. (real estate), Director; Rouse Properties Inc. (real estate), Director; Capmark Financial Group Inc. (real estate), Director |
| | | | |
John P. Kavanaugh (age 60) | | Trustee | | January 2009 | | Private investor | | N/A |
| | | | |
Maryanne L. Roepke (age 58) | | Trustee | | May 2014 | | American Century Investments (investment management), Senior Vice President and Chief Compliance Officer (until 2014) | | N/A |
| | | | |
Laurie J. Thomsen (age 57) | | Trustee | | March 2005 | | Private investor; New Profit, Inc. (venture philanthropy), Executive Partner (until 2010) | | The Travelers Companies (insurance), Director |
| | | | |
Robert W. Uek (age 73) | | Trustee | | January 2006 | | Consultant to investment company industry | | N/A |
| | | | |
| OFFICERS | | | | | | | | |
Christopher R. Bohane (k) (age 41) | | Assistant Secretary and Assistant Clerk | | July 2005 | | Massachusetts Financial Services Company, Vice President and Assistant General Counsel | | N/A |
| | | | |
Kino Clark (k) (age 46) | | Assistant Treasurer | | January 2012 | | Massachusetts Financial Services Company, Vice President | | N/A |
| | | | |
Thomas H. Connors (k) (age 55) | | Assistant Secretary and Assistant Clerk | | September 2012 | | Massachusetts Financial Services Company, Vice President and Senior Counsel; Deutsche Investment Management Americas Inc. (financial service provider), Director and Senior Counsel (until 2012) | | N/A |
24
MFS Utilities Series
Trustees and Officers – continued
| | | | | | | | |
Name, Age | | Position(s)
Held with Fund | | Trustee/Officer
Since (h) | | Principal Occupations
During the Past Five Years | | Other Directorships (j) |
Ethan D. Corey (k) (age 51) | | Assistant
Secretary and Assistant Clerk | | July 2005 | | Massachusetts Financial Services Company, Senior Vice President and Associate General Counsel | | N/A |
| | | | |
David L. DiLorenzo (k) (age 46) | | Treasurer | | July 2005 | | Massachusetts Financial Services Company, Senior Vice President | | N/A |
| | | | |
Timothy M. Fagan (k) (age 46) | | Chief Compliance Officer | | November 2014 | | Massachusetts Financial Services Company, Chief Compliance Officer; Vice President and Senior Counsel (until 2012) | | N/A |
| | | | |
Brian E. Langenfeld (k) (age 41) | | Assistant
Secretary and Assistant Clerk | | June 2006 | | Massachusetts Financial Services Company, Vice President and Senior Counsel | | N/A |
| | | | |
Susan S. Newton (k) (age 64) | | Assistant
Secretary and Assistant Clerk | | May 2005 | | Massachusetts Financial Services Company, Senior Vice President and Associate General Counsel | | N/A |
| | | | |
Susan A. Pereira (k) (age 44) | | Assistant
Secretary and Assistant Clerk | | July 2005 | | Massachusetts Financial Services Company, Vice President and Senior Counsel | | N/A |
| | | | |
Kasey L. Phillips (k) (age 44) | | Assistant Treasurer | | September 2012 | | Massachusetts Financial Services Company, Vice President; Wells Fargo Funds Management, LLC, Senior Vice President, Fund Treasurer (until 2012) | | N/A |
| | | | |
Mark N. Polebaum (k) (age 62) | | Secretary and
Clerk | | January 2006 | | Massachusetts Financial Services Company, Executive Vice President, General Counsel and Secretary | | N/A |
| | | | |
Matthew A. Stowe (k) (age 40) | | Assistant Secretary and Assistant Clerk | | October 2014 | | Massachusetts Financial Services Company, Vice President and Senior Counsel | | N/A |
| | | | |
Frank L. Tarantino (age 70) | | Independent
Senior Officer | | June 2004 | | Tarantino LLC (provider of compliance services), Principal | | N/A |
| | | | |
Richard S. Weitzel (k) (age 44) | | Assistant Secretary and Assistant Clerk | | October 2007 | | Massachusetts Financial Services Company, Senior Vice President and Associate General Counsel | | N/A |
| | | | |
James O. Yost (k) (age 54) | | Deputy Treasurer | | September 1990 | | Massachusetts Financial Services Company, Senior Vice President | | N/A |
| (h) | Date first appointed to serve as Trustee/officer of an MFS Fund. Each Trustee has served continuously since appointment unless indicated otherwise. For the period from December 15, 2004 until February 22, 2005, Mr. Manning served as Advisory Trustee. Prior to January 2012, Messrs. DiLorenzo and Yost served as Assistant Treasurers of the Funds. Ms. Stelmach was appointed as President of the Funds as of October 1, 2014. |
| (j) | Directorships or trusteeships of companies required to report to the Securities and Exchange Commission (i.e., “public companies”). |
| (k) | “Interested person” of the Trust within the meaning of the Investment Company Act of 1940 (referred to as the 1940 Act), which is the principal federal law governing investment companies like the fund, as a result of a position with MFS. The address of MFS is 111 Huntington Avenue, Boston, Massachusetts 02199-7618. |
Each Trustee (except Ms. Stelmach, Mr. Buller and Ms. Roepke) has been elected by shareholders and each Trustee and officer holds office until his or her successor is chosen and qualified or until his or her earlier death, resignation, retirement or removal. The Trust does not hold annual meetings for the purpose of electing Trustees, and Trustees are not elected for fixed terms. Messrs. Butler, Kavanaugh, Uek and Mses. Thomsen and Roepke are members of the Trust’s Audit Committee.
Each of the Fund’s Trustees and officers holds comparable positions with certain other funds of which MFS or a subsidiary is the investment adviser or distributor, and, in the case of the officers, with certain affiliates of MFS. As of February 1, 2015, the Trustees served as board members of 135 funds within the MFS Family of Funds.
25
MFS Utilities Series
Trustees and Officers – continued
The Statement of Additional Information for the Fund includes further information about the Trustees and is available without charge upon request by calling 1-800-225-2606.
| | |
Investment Adviser Massachusetts Financial Services Company 111 Huntington Avenue Boston, MA 02199-7618 | | Custodian State Street Bank and Trust Company 1 Lincoln Street Boston, MA 02111-2900 |
Distributor MFS Fund Distributors, Inc. 111 Huntington Avenue Boston, MA 02199-7618 | | Independent Registered Public Accounting Firm Deloitte & Touche LLP 200 Berkeley Street Boston, MA 02116 |
Portfolio Managers Claud Davis Maura Shaughnessy | | |
26
MFS Utilities Series
BOARD REVIEW OF INVESTMENT ADVISORY AGREEMENT
The Investment Company Act of 1940 requires that both the full Board of Trustees and a majority of the non-interested (“independent”) Trustees, voting separately, annually approve the continuation of the Fund’s investment advisory agreement with MFS. The Trustees consider matters bearing on the Fund and its advisory arrangements at their meetings throughout the year, including a review of performance data at each regular meeting. In addition, the independent Trustees met several times over the course of three months beginning in May and ending in July, 2014 (“contract review meetings”) for the specific purpose of considering whether to approve the continuation of the investment advisory agreement for the Fund and the other investment companies that the Board oversees (the “MFS Funds”). The independent Trustees were assisted in their evaluation of the Fund’s investment advisory agreement by independent legal counsel, from whom they received separate legal advice and with whom they met separately from MFS during various contract review meetings. The independent Trustees were also assisted in this process by the MFS Funds’ Independent Chief Compliance Officer, a full-time senior officer appointed by and reporting to the independent Trustees.
In connection with their deliberations regarding the continuation of the investment advisory agreement, the Trustees, including the independent Trustees, considered such information and factors as they believed, in light of the legal advice furnished to them and their own business judgment, to be relevant. The investment advisory agreement for the Fund was considered separately, although the Trustees also took into account the common interests of all MFS Funds in their review. As described below, the Trustees considered the nature, quality, and extent of the various investment advisory, administrative, and shareholder services performed by MFS under the existing investment advisory agreement and other arrangements with the Fund.
In connection with their contract review meetings, the Trustees received and relied upon materials that included, among other items: (i) information provided by Lipper Inc., an independent third party, on the investment performance of the Fund for various time periods ended December 31, 2013 and the investment performance of a group of funds with substantially similar investment classifications/objectives (the “Lipper performance universe”), (ii) information provided by Lipper Inc. on the Fund’s advisory fees and other expenses and the advisory fees and other expenses of comparable funds identified by Lipper Inc. (the “Lipper expense group”), (iii) information provided by MFS on the advisory fees of comparable portfolios of other clients of MFS, including institutional separate accounts and other clients, (iv) information as to whether and to what extent applicable expense waivers, reimbursements or fee “breakpoints” are observed for the Fund, (v) information regarding MFS’ financial results and financial condition, including MFS’ and certain of its affiliates’ estimated profitability from services performed for the Fund and the MFS Funds as a whole, and compared to MFS’ institutional business, (vi) MFS’ views regarding the outlook for the mutual fund industry and the strategic business plans of MFS, (vii) descriptions of various functions performed by MFS for the Funds, such as compliance monitoring and portfolio trading practices, and (viii) information regarding the overall organization of MFS, including information about MFS’ senior management and other personnel providing investment advisory, administrative and other services to the Fund and the other MFS Funds. The comparative performance, fee and expense information prepared and provided by Lipper Inc. was not independently verified and the independent Trustees did not independently verify any information provided to them by MFS.
The Trustees’ conclusion as to the continuation of the investment advisory agreement was based on a comprehensive consideration of all information provided to the Trustees and not the result of any single factor. Some of the factors that figured particularly in the Trustees’ deliberations are described below, although individual Trustees may have evaluated the information presented differently from one another, giving different weights to various factors. It is also important to recognize that the fee arrangements for the Fund and other MFS Funds are the result of years of review and discussion between the independent Trustees and MFS, that certain aspects of such arrangements may receive greater scrutiny in some years than in others, and that the Trustees’ conclusions may be based, in part, on their consideration of these same arrangements during the course of the year and in prior years.
Based on information provided by Lipper Inc. and MFS, the Trustees reviewed the Fund’s total return investment performance as well as the performance of peer groups of funds over various time periods. The Trustees placed particular emphasis on the total return performance of the Fund’s Initial Class shares in comparison to the performance of funds in its Lipper performance universe over the three-year period ended December 31, 2013, which the Trustees believed was a long enough period to reflect differing market conditions. The total return performance of the Fund’s Initial Class shares was in the 2nd quintile relative to the other funds in the universe for this three-year period (the 1st quintile being the best performers and the 5th quintile being the worst performers). The total return performance of the Fund’s Initial Class shares was in the 2nd quintile for the one-year period and the 1st quintile for the five-year period ended December 31, 2013 relative to the Lipper performance universe. Because of the passage of time, these performance results may differ from the performance results for more recent periods, including those shown elsewhere in this report.
In the course of their deliberations, the Trustees took into account information provided by MFS in connection with the contract review meetings, as well as during investment review meetings conducted with portfolio management personnel during the course of the year regarding the Fund’s performance. After reviewing these and related factors, the Trustees concluded, within the context of their overall conclusions regarding the investment advisory agreement, that they were satisfied with MFS’ responses and efforts relating to investment performance.
27
MFS Utilities Series
Board Review of Investment Advisory Agreement – continued
In assessing the reasonableness of the Fund’s advisory fee, the Trustees considered, among other information, the Fund’s advisory fee and the total expense ratio of the Fund’s Initial Class shares as a percentage of average daily net assets and the advisory fee and total expense ratios of peer groups of funds based on information provided by Lipper Inc. The Trustees considered that, according to the Lipper data (which takes into account any fee reductions or expense limitations that were in effect during the Fund’s last fiscal year), the Fund’s effective advisory fee rate and total expense ratio were each approximately at the Lipper expense group median.
The Trustees also considered the advisory fees charged by MFS to any comparable institutional accounts. In comparing these fees, the Trustees considered information provided by MFS as to the generally broader scope of services provided by MFS to the Fund in comparison to institutional accounts, the higher demands placed on MFS’ investment personnel and trading infrastructure as a result of the daily cash in-flows and out-flows of the Fund, and the impact on MFS and expenses associated with the more extensive regulatory regime to which the Fund is subject in comparison to institutional accounts.
The Trustees also considered whether the Fund may benefit from any economies of scale in the management of the Fund in the event of growth in assets of the Fund and/or growth in assets of the MFS Funds as a whole. They noted that the Fund’s advisory fee rate schedule is subject to a contractual breakpoint that reduces the Fund’s advisory fee rate on average daily net assets over $1 billion. The Trustees also noted that MFS has agreed in writing to waive a portion of the management fees of certain MFS Funds, including the Fund, if the total combined assets of certain funds within the MFS Funds’ complex increase above agreed upon thresholds (the “group fee waiver”), enabling the Fund’s shareholders to share in the benefits from any economies of scale at the complex level. The group fee waiver is reviewed and renewed annually between the Board and MFS. The Trustees concluded that the breakpoint and the group fee waiver were sufficient to allow the Fund to benefit from economies of scale as its assets and overall complex assets grow.
The Trustees also considered information prepared by MFS relating to MFS’ costs and profits with respect to the Fund, the MFS Funds considered as a group, and other investment companies and accounts advised by MFS, as well as MFS’ methodologies used to determine and allocate its costs to the MFS Funds, the Fund and other accounts and products for purposes of estimating profitability.
After reviewing these and other factors described herein, the Trustees concluded, within the context of their overall conclusions regarding the investment advisory agreement, that the advisory fees charged to the Fund represent reasonable compensation in light of the services being provided by MFS to the Fund.
In addition, the Trustees considered MFS’ resources and related efforts to continue to retain, attract and motivate capable personnel to serve the Fund. The Trustees also considered current and developing conditions in the financial services industry, including the presence of large and well-capitalized companies which are spending, and appear to be prepared to continue to spend, substantial sums to engage personnel and to provide services to competing investment companies. In this regard, the Trustees also considered the financial resources of MFS and its ultimate parent, Sun Life Financial Inc. The Trustees also considered the advantages and possible disadvantages to the Fund of having an adviser that also serves other investment companies as well as other accounts.
The Trustees also considered the nature, quality, cost, and extent of administrative, transfer agency, and distribution services provided to the Fund by MFS and its affiliates under agreements and plans other than the investment advisory agreement, including any 12b-1 fees the Fund pays to MFS Fund Distributors, Inc., an affiliate of MFS. The Trustees also considered the nature, extent and quality of certain other services MFS performs or arranges for on the Fund’s behalf, which may include securities lending programs, directed expense payment programs, class action recovery programs, and MFS’ interaction with third-party service providers, principally custodians and sub-custodians. The Trustees concluded that the various non-advisory services provided by MFS and its affiliates on behalf of the Fund were satisfactory.
The Trustees also considered benefits to MFS from the use of the Fund’s portfolio brokerage commissions, if applicable, to pay for investment research and various other factors. Additionally, the Trustees considered so-called “fall-out benefits” to MFS such as reputational value derived from serving as investment manager to the Fund.
Based on their evaluation of factors that they deemed to be material, including those factors described above, the Board of Trustees, including the independent Trustees, concluded that the Fund’s investment advisory agreement with MFS should be continued for an additional one-year period, commencing August 1, 2014.
28
MFS Utilities Series
PROXY VOTING POLICIES AND INFORMATION
MFS votes proxies on behalf of the fund pursuant to proxy voting policies and procedures that are available without charge, upon request, by calling 1-800-225-2606, by visiting the Proxy Voting section of mfs.com or by visiting the SEC’s Web site at http://www.sec.gov.
Information regarding how the fund voted proxies relating to portfolio securities during the most recent twelve-month period ended June 30 is available without charge by visiting the Proxy Voting section of mfs.com or by visiting the SEC’s Web site at http://www.sec.gov.
QUARTERLY PORTFOLIO DISCLOSURE
The fund will file a complete schedule of portfolio holdings with the Securities and Exchange Commission (the Commission) for the first and third quarters of each fiscal year on Form N-Q. The fund’s Form N-Q is available on the EDGAR database on the Commission’s Internet Web site at http://www.sec.gov, and may be reviewed and copied at the:
Public Reference Room
Securities and Exchange Commission
100 F Street, NE, Room 1580
Washington, D.C. 20549
Information on the operation of the Public Reference Room may be obtained by calling the Commission at 1-800-SEC-0330. Copies of the fund’s Form N-Q also may be obtained, upon payment of a duplicating fee, by electronic request at the following e-mail address: publicinfo@sec.gov or by writing the Public Reference Section at the above address.
FURTHER INFORMATION
From time to time, MFS may post important information about the fund or the MFS funds on the MFS web site (mfs.com). This information is available by visiting the “Market Commentary” and “Announcements” sub sections in the “Market Outlooks” section of mfs.com or by clicking on the fund’s name under “Variable Insurance Portfolios — VIT” in the “Products” section of mfs.com.
FEDERAL TAX INFORMATION (unaudited)
The following information is provided pursuant to provisions of the Internal Revenue Code.
The fund designates $47,105,000 as capital gain dividends paid during the fiscal year.
For corporate shareholders, 36.99% of the ordinary income dividends paid during the fiscal year qualify for the corporate dividends received deduction.
29
rev. 3/11
| | | | |
| FACTS | | WHAT DOES MFS DO WITH YOUR
PERSONAL INFORMATION? | |  |
| | |
| Why? | | Financial companies choose how they share your personal information. Federal law gives consumers the right to limit some but not all sharing. Federal law also requires us to tell you how we collect, share, and protect your personal information. Please read this notice carefully to understand what we do. |
| | |
| What? | | The types of personal information we collect and share depend on the product or service you have with us. This information can include: • Social Security number and account balances • Account transactions and transaction history • Checking account information and wire transfer instructions When you are no longer our customer, we continue to share your information as described in this notice. |
| | |
| How? | | All financial companies need to share customers’ personal information to run their everyday business. In the section below, we list the reasons financial companies can share their customers’ personal information; the reasons MFS chooses to share; and whether you can limit this sharing. |
| | | | |
Reasons we can share your
personal information | | Does MFS share? | | Can you limit this
sharing? |
For our everyday business purposes – such as to process your transactions, maintain your account(s), respond to court orders and legal investigations, or report to credit bureaus | | Yes | | No |
For our marketing purposes – to offer our products and services to you | | No | | We don’t share |
| For joint marketing with other financial companies | | No | | We don’t share |
For our affiliates’ everyday business purposes – information about your transactions and experiences | | No | | We don’t share |
For our affiliates’ everyday business purposes – information about your creditworthiness | | No | | We don’t share |
| For nonaffiliates to market to you | | No | | We don’t share |
| | |
| Questions? | | Call 800-225-2606 or go to mfs.com. |
30
| | |
| Who we are |
| Who is providing this notice? | | MFS Funds, MFS Investment Management, MFS Institutional Advisors, Inc., MFS Fund Distributors, Inc., MFS Heritage Trust Company, and MFS Service Center, Inc. |
| | |
| What we do |
| How does MFS protect my personal information? | | To protect your personal information from unauthorized access and use, we use security measures that comply with federal law. These measures include procedural, electronic, and physical safeguards for the protection of the personal information we collect about you. |
How does MFS
collect my personal information? | | We collect your personal information, for example, when you • open an account or provide account information • direct us to buy securities or direct us to sell your securities • make a wire transfer We also collect your personal information from others, such as credit bureaus, affiliates and other companies. |
| Why can’t I limit all sharing? | | Federal law gives you the right to limit only • sharing for affiliates’ everyday business purposes – information about your creditworthiness • affiliates from using your information to market to you • sharing for nonaffiliates to market to you State laws and individual companies may give you additional rights to limit sharing. |
| | |
| Definitions |
| Affiliates | | Companies related by common ownership or control. They can be financial and nonfinancial companies. •MFS does not share personal information with affiliates, except for everyday business purposes as described on page one of this notice. |
| Nonaffiliates | | Companies not related by common ownership or control. They can be financial and nonfinancial companies. •MFS does not share with nonaffiliates so they can market to you. |
| Joint Marketing | | A formal agreement between nonaffiliated financial companies that together market financial products or services to you. •MFS doesn’t jointly market. |
| | |
| Other important information |
| If you own an MFS product or receive an MFS service in the name of a third party such as a bank or broker-dealer, their privacy policy may apply to you instead of ours. |
31
ANNUAL REPORT
December 31, 2014

MFS® VALUE SERIES
MFS® Variable Insurance Trust

VLU-ANN
MFS® VALUE SERIES
CONTENTS
The report is prepared for the general information of contract owners. It is authorized for distribution to prospective investors only when preceded or accompanied by a current prospectus.
NOT FDIC INSURED Ÿ MAY LOSE VALUE Ÿ NO BANK OR CREDIT UNION GUARANTEE Ÿ NOT A DEPOSIT Ÿ NOT INSURED BY ANY FEDERAL GOVERNMENT AGENCY OR NCUA/NCUSIF
MFS Value Series
LETTER FROM THE CHAIRMAN

Dear Contract Owners:
As 2015 begins, sharply lower oil prices are reshaping the global economy, adding to deflationary pressures in the eurozone and exacerbating challenges faced by oil exporters such as Russia. The U.S. economy stands on firmer ground, having expanded steadily over the past year. The U.S. labor market has regained momentum, consumer confidence is buoyant and gasoline prices have tumbled, boosting prospects for a stronger economic rebound in 2015.
Other regions are struggling. The eurozone economy is barely expanding, and the European Central Bank (ECB) has introduced large-scale asset purchases.
Despite Japan’s efforts to strengthen its economy, its sales tax increase last spring tipped the country into a recession, leading to additional monetary stimulus from the Bank of Japan. China’s economy is slowing as it transitions to a more sustainable basis, and its growth rate will likely continue to decline.
As always, active risk management is integral to how we at MFS® manage your investments. We use a collaborative process, sharing insights across asset classes, regions and economic sectors. Our global investment team uses a diversified, multidisciplined, long-term approach.
Applying proven principles, such as asset allocation and diversification, can best serve investors over the long term. We are confident that this approach can help you as you work with your financial advisors to reach your goals in the years ahead.
Respectfully,

Robert J. Manning
Chairman
MFS Investment Management
February 13, 2015
The opinions expressed in this letter are subject to change and may not be relied upon for investment advice. No forecasts can be guaranteed.
1
MFS Value Series
PORTFOLIO COMPOSITION
Portfolio structure

| | | | |
| Top ten holdings | | | | |
| JPMorgan Chase & Co. | | | 4.3% | |
| Johnson & Johnson | | | 3.5% | |
| Philip Morris International, Inc. | | | 3.3% | |
| Wells Fargo & Co. | | | 3.3% | |
| Pfizer, Inc. | | | 2.8% | |
| Accenture PLC, “A” | | | 2.2% | |
| Honeywell International, Inc. | | | 2.2% | |
| United Technologies Corp. | | | 2.1% | |
| 3M Co. | | | 2.1% | |
| Lockheed Martin Corp. | | | 2.0% | |
| | | | |
| Equity sectors | | | | |
| Financial Services | | | 25.7% | |
| Health Care | | | 14.4% | |
| Industrial Goods & Services | | | 11.4% | |
| Consumer Staples | | | 11.2% | |
| Leisure | | | 6.9% | |
| Energy | | | 5.9% | |
| Retailing | | | 4.7% | |
| Basic Materials | | | 4.3% | |
| Special Products & Services | | | 3.6% | |
| Technology | | | 3.5% | |
| Utilities & Communications | | | 2.8% | |
| Autos & Housing | | | 2.3% | |
| Transportation | | | 2.2% | |
Cash & Other can include cash, other assets less liabilities, offsets to derivative positions, and short-term securities.
Percentages are based on net assets as of 12/31/14.
The portfolio is actively managed and current holdings may be different.
2
MFS Value Series
MANAGEMENT REVIEW
Summary of Results
For the twelve months ended December 31, 2014, Initial Class shares of the MFS Value Series (“fund”) provided a total return of 10.51%, while Service Class shares of the fund provided a total return of 10.20%. These compare with a return of 13.45% for the fund’s benchmark, the Russell 1000 Value Index.
Market Environment
Early in the period, US equities suffered what proved to be a temporary setback due to concerns over emerging markets as well as what was perceived at the time to be a pause in US economic growth, partially caused by extreme weather events and a weak December 2013 labor market report. Markets soon recovered as the economic pause concluded and investors appeared to have become increasingly comfortable that newly-installed US Federal Reserve (“Fed”) Chair Janet Yellen would not make any substantial changes to the trajectory of Fed monetary policy.
A generally risk-friendly, carry trade environment persisted from February 2014 until mid-year. While geopolitical tensions flared in the Middle East and Russia/Ukraine, any market setbacks were short-lived as improving economic growth in the US, coupled with prospects for easier monetary policy in regions with slowing growth, such as Japan, Europe and China, supported risk assets. For example, the European Central Bank (“ECB”) cut policy interest rates into negative territory and, by the end of the period, expectations were for additional rate cuts and the announcement for non-conventional easing measures. Similarly, the Bank of Japan surprised markets late in the period with fresh stimulus measures given lackluster growth trends. The related decline in developed market government bond yields and credit spreads were also supportive for equity markets. At the end of the period, the US equity market was trading close to all-time highs and US Treasury yields were close to their lows for the period. However, credit markets did not fare as well in the second half of 2014, particularly US high yield and emerging market debt. The higher weightings of oil and gas credits in these asset classes resulted in widening spreads and increased volatility as oil prices began to decline in an accelerated fashion in the fourth quarter.
Detractors from Performance
The combination of weak stock selection and an underweight position in the technology sector detracted from performance relative to the Russell 1000 Value Index. Within this sector, holdings of poor-performing diversified technology products and services company International Business Machines (IBM) (b) and an underweight position at the beginning of the period and not owning shares of semiconductor firm Intel for the balance of the period weakened relative results. Shares of IBM declined after the tech giant reported sharply lower third-quarter earnings as sales declined across most of its segments.
Stock selection within the consumer staples sector also weighed on relative performance. Here, the fund’s overweight position in tobacco company Phillip Morris, and holdings of spirits maker Diageo (b) (United Kingdom) and global food company Nestle (Switzerland), held back relative performance. Philip Morris’s shares fell as the company experienced substantial headwinds from its foreign currency exposure and weaker volume trends in the Philippines, Japan and Russia. In addition, the company slowed the pace of its share repurchase program, which had previously been an offset to these weaker near-term trends.
Stock selection and, to a lesser extent, an underweight position in the utilities & communications sector dampened relative results. The fund’s holdings of telecommunications company Verizon Communications (b) weighed on relative results as the stock underperformed the benchmark.
Other top relative detractors during the period included not holding shares of strong-performing investment firm Berkshire Hathaway and diversified health care company UnitedHealth. Berkshire Hathaway reported strong earnings during the reporting period as a result of increased insurance premiums and a stronger presence in the commercial businesses market. Holdings of media company Viacom (b), and an overweight position in investment management firm Franklin Resources, also hurt relative returns.
During the reporting period, the fund’s relative currency exposure, resulting primarily from differences between the fund’s and the benchmark’s exposure to holdings of securities denominated in foreign currencies, was another detractor from relative performance. All of MFS’ investment decisions are driven by the fundamentals of each individual opportunity and as such, it is common for our portfolios to have different currency exposure than the benchmark.
Contributors to Performance
An underweight allocation to the energy sector was a positive factor for relative performance. Within this sector, an underweight position in integrated oil and gas company Exxon Mobil supported relative returns as the stock underperformed the benchmark. The stock fell throughout the period as global oil prices declined. Additionally, the company missed earnings expectations due to weaker-than-expected production growth.
Stock selection in the industrial goods & services sector also benefited relative returns. Not holding weak-performing diversified industrial conglomerate General Electric, and the fund’s holdings of defense contractor Lockheed Martin (b), bolstered relative results.
3
MFS Value Series
Management Review – continued
Shares of General Electric traded lower after earnings estimates began to decline towards the end of the period as global energy commodity weakness was expected to pressure its energy business. Investors also appeared to have reacted unfavorably to a volatile global macroeconomic environment and the potential impact on the company’s bottom line. Lockheed Martin outpaced the benchmark during the reporting period due to earnings results that exceeded expectations on higher-than-anticipated operating margins. Additionally, the company benefited from management’s decision to freeze its defined benefit plan.
Stocks in other sectors that contributed to relative results included an overweight position in retail pharmacy chain CVS Health, and not holding shares of poor-performing precious metals company Freeport McMoRan. Holdings of tobacco company Lorillard (b), auto parts retailer Advance Auto Parts (b) and soft drinks manufacturer Dr Pepper Snapple Group (b) were also among the fund’s top relative contributors. Underweight positions in telecommunications company AT&T and financial services firm Citigroup also helped.
Respectfully,
| | |
| Nevin Chitkara | | Steven Gorham |
| Portfolio Manager | | Portfolio Manager |
| (b) | Security is not a benchmark constituent. |
The views expressed in this report are those of the portfolio managers only through the end of the period of the report as stated on the cover and do not necessarily reflect the views of MFS or any other person in the MFS organization. These views are subject to change at any time based on market or other conditions, and MFS disclaims any responsibility to update such views. These views may not be relied upon as investment advice or an indication of trading intent on behalf of any MFS portfolio. References to specific securities are not recommendations of such securities, and may not be representative of any MFS portfolio’s current or future investments.
4
MFS Value Series
PERFORMANCE SUMMARY THROUGH 12/31/14
The following chart illustrates the historical performance of the fund in comparison to its benchmark(s). Benchmarks are unmanaged and may not be invested in directly. Benchmark returns do not reflect any fees or expenses. The performance of other share classes will be greater than or less than that of the class depicted below. (See Notes to Performance Summary.)
Performance data shown represents past performance and is no guarantee of future results. Investment return and principal value fluctuate so your units, when sold, may be worth more or less than the original cost; current performance may be lower or higher than quoted. The performance shown does not reflect the deduction of taxes, if any, that a contract holder would pay on fund distributions or the redemption of contract units. The returns for the fund shown also do not reflect the deduction of expenses associated with variable products, such as mortality and expense risk charges, separate account charges, and sales charges imposed by the insurance company separate accounts. Such expenses would reduce the overall returns shown.
Growth of a Hypothetical $10,000 Investment
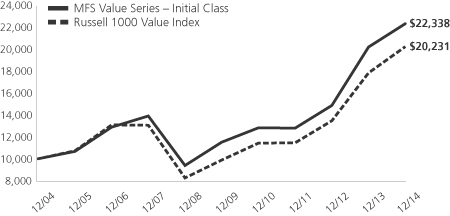
Total Returns through 12/31/14
Average annual total returns
| | | | | | | | | | | | |
| | | Share Class | | Class inception date | | 1-yr | | 5-yr | | 10-yr | | |
| | | Initial Class | | 1/02/02 | | 10.51% | | 14.19% | | 8.37% | | |
| | | Service Class | | 1/02/02 | | 10.20% | | 13.90% | | 8.10% | | |
| | | | |
| Comparative benchmark | | | | | | | | |
| | | Russell 1000 Value Index (f) | | 13.45% | | 15.42% | | 7.30% | | |
| (f) | Source: FactSet Research Systems Inc. |
Benchmark Definition
Russell 1000 Value Index – constructed to provide a comprehensive barometer for the value securities in the large-cap segment of the U.S. equity universe. Companies in this index generally have lower price-to-book ratios and lower forecasted growth values.
It is not possible to invest directly in an index.
Notes to Performance Summary
Average annual total return represents the average annual change in value for each share class for the periods presented.
Performance results reflect any applicable expense subsidies and waivers in effect during the periods shown. Without such subsidies and waivers the fund’s performance results would be less favorable. Please see the prospectus and financial statements for complete details. All results are historical and assume the reinvestment of any dividends and capital gains distributions.
Performance results do not include adjustments made for financial reporting purposes in accordance with U.S. generally accepted accounting principles and may differ from amounts reported in the financial highlights.
From time to time the fund may receive proceeds from litigation settlements, without which performance would be lower.
5
MFS Value Series
EXPENSE TABLE
Fund Expenses Borne by the Contract Holders During the Period,
July 1, 2014 through December 31, 2014
As a contract holder of the fund, you incur ongoing costs, including management fees; distribution and/or service (12b-1) fees; and other fund expenses. This example is intended to help you understand your ongoing costs (in dollars) of investing in the fund and to compare these costs with the ongoing costs of investing in other mutual funds.
The example is based on an investment of $1,000 invested at the beginning of the period and held for the entire period July 1, 2014 through December 31, 2014.
Actual Expenses
The first line for each share class in the following table provides information about actual account values and actual expenses. You may use the information in this line, together with the amount you invested, to estimate the expenses that you paid over the period. Simply divide your account value by $1,000 (for example, an $8,600 account value divided by $1,000 = 8.6), then multiply the result by the number in the first line under the heading entitled “Expenses Paid During Period” to estimate the expenses you paid on your account during this period.
Hypothetical Example for Comparison Purposes
The second line for each share class in the following table provides information about hypothetical account values and hypothetical expenses based on the fund’s actual expense ratio and an assumed rate of return of 5% per year before expenses, which is not the fund’s actual return. The hypothetical account values and expenses may not be used to estimate the actual ending account balance or expenses you paid for the period. You may use this information to compare the ongoing costs of investing in the fund and other funds. To do so, compare this 5% hypothetical example with the 5% hypothetical examples that appear in the shareholder reports of the other funds.
Please note that the expenses shown in the table are meant to highlight the fund’s ongoing costs only and do not take into account the fees and expenses imposed under the variable contracts through which your investment in the fund is made. Therefore, the second line for each share class in the table is useful in comparing ongoing costs associated with an investment in vehicles (such as the fund) which fund benefits under variable annuity and variable life insurance contracts and to qualified pension and retirement plans only, and will not help you determine the relative total costs of investing in the fund through variable annuity and variable life insurance contracts. If the fees and expenses imposed under the variable contracts were included, your costs would have been higher.
| | | | | | | | | | | | | | | | | | |
| Share Class | | | | Annualized
Expense Ratio | | | Beginning
Account Value
7/01/14 | | | Ending Account Value
12/31/14 | | | Expenses Paid
During Period (p)
7/01/14-12/31/14 | |
| Initial Class | | Actual | | | 0.72% | | | | $1,000.00 | | | | $1,054.77 | | | | $3.73 | |
| | Hypothetical (h) | | | 0.72% | | | | $1,000.00 | | | | $1,021.58 | | | | $3.67 | |
| Service Class | | Actual | | | 0.97% | | | | $1,000.00 | | | | $1,053.31 | | | | $5.02 | |
| | Hypothetical (h) | | | 0.97% | | | | $1,000.00 | | | | $1,020.32 | | | | $4.94 | |
| (h) | 5% class return per year before expenses. |
| (p) | “Expenses Paid During Period” are equal to each class’s annualized expense ratio, as shown above, multiplied by the average account value over the period, multiplied by 184/365 (to reflect the one-half year period). |
6
MFS Value Series
PORTFOLIO OF INVESTMENTS – 12/31/14
The Portfolio of Investments is a complete list of all securities owned by your fund. It is categorized by broad-based asset classes.
| | | | | | | | |
| Issuer | | Shares/Par | | | Value ($) | |
| | | | | | | | |
| COMMON STOCKS – 98.8% | | | | | |
| Aerospace – 7.1% | | | | | |
| Honeywell International, Inc. | | | 562,476 | | | $ | 56,202,603 | |
| Lockheed Martin Corp. | | | 274,711 | | | | 52,901,097 | |
| Northrop Grumman Corp. | | | 142,365 | | | | 20,983,177 | |
| United Technologies Corp. | | | 473,462 | | | | 54,448,130 | |
| | | | | | | | |
| | | | | | $ | 184,535,007 | |
| | | | | | | | |
| Alcoholic Beverages – 1.3% | | | | | |
| Diageo PLC | | | 1,208,618 | | | $ | 34,664,553 | |
| | | | | | | | |
| Automotive – 1.7% | | | | | |
| Delphi Automotive PLC | | | 257,845 | | | $ | 18,750,488 | |
| Johnson Controls, Inc. | | | 517,060 | | | | 24,994,680 | |
| | | | | | | | |
| | | | | | $ | 43,745,168 | |
| | | | | | | | |
| Broadcasting – 3.7% | | | | | |
| Omnicom Group, Inc. | | | 397,571 | | | $ | 30,799,825 | |
| Time Warner, Inc. | | | 262,377 | | | | 22,412,243 | |
| Viacom, Inc., “B” | | | 236,196 | | | | 17,773,749 | |
| Walt Disney Co. | | | 275,799 | | | | 25,977,508 | |
| | | | | | | | |
| | | | | | $ | 96,963,325 | |
| | | | | | | | |
| Brokerage & Asset Managers – 3.0% | | | | | |
| BlackRock, Inc. | | | 71,617 | | | $ | 25,607,375 | |
| Franklin Resources, Inc. | | | 591,329 | | | | 32,741,887 | |
| NASDAQ OMX Group, Inc. | | | 405,813 | | | | 19,462,791 | |
| | | | | | | | |
| | | | | | $ | 77,812,053 | |
| | | | | | | | |
| Business Services – 3.6% | | | | | |
| Accenture PLC, “A” | | | 650,889 | | | $ | 58,130,897 | |
| Equifax, Inc. | | | 53,862 | | | | 4,355,820 | |
| Fidelity National Information Services, Inc. | | | 209,962 | | | | 13,059,636 | |
| Fiserv, Inc. (a) | | | 255,998 | | | | 18,168,178 | |
| | | | | | | | |
| | | | | | $ | 93,714,531 | |
| | | | | | | | |
| Cable TV – 1.2% | | | | | |
| Comcast Corp., “Special A” | | | 527,625 | | | $ | 30,372,733 | |
| | | | | | | | |
| Chemicals – 3.8% | | | | | |
| 3M Co. | | | 325,405 | | | $ | 53,470,550 | |
| E.I. du Pont de Nemours & Co. | | | 86,274 | | | | 6,379,100 | |
| PPG Industries, Inc. | | | 166,932 | | | | 38,586,332 | |
| | | | | | | | |
| | | | | | $ | 98,435,982 | |
| | | | | | | | |
| Computer Software – 1.0% | | | | | |
| Oracle Corp. | | | 592,128 | | | $ | 26,627,996 | |
| | | | | | | | |
| Computer Software – Systems – 1.4% | | | | | |
| International Business Machines Corp. | | | 220,408 | | | $ | 35,362,260 | |
| | | | | | | | |
| Construction – 0.6% | | | | | |
| Stanley Black & Decker, Inc. | | | 160,414 | | | $ | 15,412,577 | |
| | | | | | | | |
| Consumer Products – 0.6% | | | | | |
| Procter & Gamble Co. | | | 157,703 | | | $ | 14,365,166 | |
| | | | | | | | |
| Containers – 0.5% | | | | | |
| Crown Holdings, Inc. (a) | | | 255,696 | | | $ | 13,014,926 | |
| | | | | | | | |
| | | | | | | | |
| Issuer | | Shares/Par | | | Value ($) | |
| | | | | | | | |
| COMMON STOCKS – continued | | | | | |
| Electrical Equipment – 2.9% | | | | | |
| Danaher Corp. | | | 397,309 | | | $ | 34,053,354 | |
| Pentair PLC | | | 155,415 | | | | 10,322,664 | |
| Tyco International PLC | | | 690,059 | | | | 30,265,988 | |
| | | | | | | | |
| | | | | | $ | 74,642,006 | |
| | | | | | | | |
| Electronics – 1.2% | | | | | |
| Texas Instruments, Inc. | | | 573,064 | | | $ | 30,638,867 | |
| | | | | | | | |
| Energy – Independent – 1.7% | | | | | |
| EOG Resources, Inc. | | | 163,068 | | | $ | 15,013,671 | |
| Occidental Petroleum Corp. | | | 347,640 | | | | 28,023,260 | |
| | | | | | | | |
| | | | | | $ | 43,036,931 | |
| | | | | | | | |
| Energy – Integrated – 3.4% | | | | | |
| Chevron Corp. | | | 342,625 | | | $ | 38,435,673 | |
| Exxon Mobil Corp. | | | 538,014 | | | | 49,739,394 | |
| | | | | | | | |
| | | | | | $ | 88,175,067 | |
| | | | | | | | |
| Food & Beverages – 4.3% | | | | | |
| Danone S.A. | | | 278,273 | | | $ | 18,306,604 | |
| Dr Pepper Snapple Group, Inc. | | | 71,025 | | | | 5,091,072 | |
| General Mills, Inc. | | | 709,919 | | | | 37,859,980 | |
| Kellogg Co. | | | 114,478 | | | | 7,491,440 | |
| Nestle S.A. | | | 576,263 | | | | 42,240,966 | |
| | | | | | | | |
| | | | | | $ | 110,990,062 | |
| | | | | | | | |
| Food & Drug Stores – 1.8% | | | | | |
| CVS Health Corp. | | | 499,805 | | | $ | 48,136,220 | |
| | | | | | | | |
| General Merchandise – 1.9% | | | | | |
| Kohl’s Corp. | | | 110,808 | | | $ | 6,763,720 | |
| Target Corp. | | | 562,565 | | | | 42,704,309 | |
| | | | | | | | |
| | | | | | $ | 49,468,029 | |
| | | | | | | | |
| Insurance – 7.8% | | | | | |
| ACE Ltd. | | | 257,443 | | | $ | 29,575,052 | |
| Aon PLC | | | 320,713 | | | | 30,413,214 | |
| Chubb Corp. | | | 194,864 | | | | 20,162,578 | |
| MetLife, Inc. | | | 897,271 | | | | 48,533,388 | |
| Prudential Financial, Inc. | | | 291,359 | | | | 26,356,335 | |
| Travelers Cos., Inc. | | | 460,128 | | | | 48,704,549 | |
| | | | | | | | |
| | | | | | $ | 203,745,116 | |
| | | | | | | | |
| Leisure & Toys – 0.6% | | | | | |
| Hasbro, Inc. | | | 212,482 | | | $ | 11,684,385 | |
| Mattel, Inc. | | | 115,624 | | | | 3,577,985 | |
| | | | | | | | |
| | | | | | $ | 15,262,370 | |
| | | | | | | | |
| Machinery & Tools – 1.3% | | | | | |
| Eaton Corp. PLC | | | 325,239 | | | $ | 22,103,242 | |
| Illinois Tool Works, Inc. | | | 126,122 | | | | 11,943,753 | |
| | | | | | | | |
| | | | | | $ | 34,046,995 | |
| | | | | | | | |
7
MFS Value Series
Portfolio of Investments – continued
| | | | | | | | |
| Issuer | | Shares/Par | | | Value ($) | |
| | | | | | | | |
| COMMON STOCKS – continued | | | | | |
| Major Banks – 12.6% | | | | | |
| Bank of New York Mellon Corp. | | | 792,893 | | | $ | 32,167,669 | |
| Goldman Sachs Group, Inc. | | | 261,831 | | | | 50,750,703 | |
| JPMorgan Chase & Co. | | | 1,786,410 | | | | 111,793,538 | |
| PNC Financial Services Group, Inc. | | | 233,396 | | | | 21,292,717 | |
| State Street Corp. | | | 317,381 | | | | 24,914,409 | |
| Wells Fargo & Co. | | | 1,568,916 | | | | 86,007,975 | |
| | | | | | | | |
| | | | | | $ | 326,927,011 | |
| | | | | | | | |
| Medical & Health Technology & Services – 1.1% | |
| Express Scripts Holding Co. (a) | | | 324,165 | | | $ | 27,447,051 | |
| | | | | | | | |
| Medical Equipment – 5.1% | | | | | |
| Abbott Laboratories | | | 703,637 | | | $ | 31,677,738 | |
| Covidien PLC | | | 209,613 | | | | 21,439,218 | |
| Medtronic, Inc. | | | 470,600 | | | | 33,977,320 | |
| St. Jude Medical, Inc. | | | 270,359 | | | | 17,581,446 | |
| Thermo Fisher Scientific, Inc. | | | 220,952 | | | | 27,683,076 | |
| | | | | | | | |
| | | | | | $ | 132,358,798 | |
| | | | | | | | |
| Oil Services – 0.8% | | | | | |
| Baker Hughes, Inc. | | | 81,984 | | | $ | 4,596,843 | |
| Schlumberger Ltd. | | | 196,241 | | | | 16,760,944 | |
| | | | | | | | |
| | | | | | $ | 21,357,787 | |
| | | | | | | | |
| Other Banks & Diversified Financials – 2.3% | | | | | |
| Citigroup, Inc. | | | 173,403 | | | $ | 9,382,836 | |
| U.S. Bancorp | | | 1,135,617 | | | | 51,045,984 | |
| | | | | | | | |
| | | | | | $ | 60,428,820 | |
| | | | | | | | |
| Pharmaceuticals – 8.2% | | | | | |
| Johnson & Johnson | | | 877,701 | | | $ | 91,781,194 | |
| Merck & Co., Inc. | | | 612,604 | | | | 34,789,781 | |
| Novartis AG | | | 93,712 | | | | 8,618,457 | |
| Pfizer, Inc. | | | 2,314,764 | | | | 72,104,899 | |
| Roche Holding AG | | | 26,639 | | | | 7,220,247 | |
| | | | | | | | |
| | | | | | $ | 214,514,578 | |
| | | | | | | | |
| Printing & Publishing – 0.5% | | | | | |
| McGraw-Hill Cos., Inc. | | | 127,598 | | | $ | 11,353,670 | |
| Time, Inc. | | | 28,318 | | | | 696,906 | |
| | | | | | | | |
| | | | | | $ | 12,050,576 | |
| | | | | | | | |
| Railroad & Shipping – 0.6% | | | | | |
| Canadian National Railway Co. | | | 227,052 | | | $ | 15,646,153 | |
| | | | | | | | |
| Restaurants – 0.9% | | | | | |
| McDonald’s Corp. | | | 261,701 | | | $ | 24,521,384 | |
| | | | | | | | |
| Specialty Stores – 0.9% | | | | | |
| Advance Auto Parts, Inc. | | | 110,172 | | | $ | 17,548,196 | |
| Bed Bath & Beyond, Inc. (a) | | | 92,271 | | | | 7,028,282 | |
| | | | | | | | |
| | | | | | $ | 24,576,478 | |
| | | | | | | | |
| Telecommunications – Wireless – 0.6% | | | | | |
| Vodafone Group PLC | | | 4,447,573 | | | $ | 15,239,444 | |
| | | | | | | | |
| Telephone Services – 1.9% | | | | | |
| AT&T, Inc. | | | 212,625 | | | $ | 7,142,074 | |
| Verizon Communications, Inc. | | | 925,550 | | | | 43,297,229 | |
| | | | | | | | |
| | | | | | $ | 50,439,303 | |
| | | | | | | | |
| | | | | | | | |
| Issuer | | Shares/Par | | | Value ($) | |
| | | | | | | | |
| COMMON STOCKS – continued | | | | | |
| Tobacco – 5.1% | | | | | |
| Altria Group, Inc. | | | 288,472 | | | $ | 14,213,015 | |
| Imperial Tobacco Group PLC | | | 125,838 | | | | 5,510,842 | |
| Lorillard, Inc. | | | 425,164 | | | | 26,759,822 | |
| Philip Morris International, Inc. | | | 1,056,315 | | | | 86,036,857 | |
| | | | | | | | |
| | | | | | $ | 132,520,536 | |
| | | | | | | | |
| Trucking – 1.6% | | | | | |
| United Parcel Service, Inc., “B” | | | 382,858 | | | $ | 42,562,324 | |
| | | | | | | | |
| Utilities – Electric Power – 0.2% | | | | | |
| Duke Energy Corp. | | | 76,702 | | | $ | 6,407,685 | |
| | | | | | | | |
Total Common Stocks
(Identified Cost, $1,629,977,657) | | | $ | 2,570,165,868 | |
| | | | | | | | |
|
| CONVERTIBLE PREFERRED STOCKS – 0.1% | |
| Aerospace – 0.1% | | | | | |
| United Technologies Corp., 7.5% (Identified Cost, $1,982,947) | | | 38,603 | | | $ | 2,367,522 | |
| | | | | | | | |
| |
| MONEY MARKET FUNDS – 0.0% | | | | | |
| MFS Institutional Money Market Portfolio, 0.09%, at Cost and Net Asset Value (v) | | | 1,800 | | | $ | 1,800 | |
| | | | | | | | |
Total Investments
(Identified Cost, $1,631,962,404) | | | $ | 2,572,535,190 | |
| | | | | | | | |
OTHER ASSETS, LESS
LIABILITIES – 1.1% | | | | 27,993,789 | |
| | | | | | | | |
| NET ASSETS – 100.0% | | | | | | $ | 2,600,528,979 | |
| | | | | | | | |
| (a) | Non-income producing security. |
| (v) | Underlying affiliated fund that is available only to investment companies managed by MFS. The rate quoted for the MFS Institutional Money Market Portfolio is the annualized seven-day yield of the fund at period end. |
The following abbreviations are used in this report and are defined:
| PLC | | Public Limited Company |
See Notes to Financial Statements
8
MFS Value Series
FINANCIAL STATEMENTS | STATEMENT OF ASSETS AND LIABILITIES
This statement represents your fund’s balance sheet, which details the assets and liabilities comprising the total value of the fund.
| | | | | | | | |
At 12/31/14 | | | | | | | | |
Assets | | | | | | | | |
Investments – | | | | | | | | |
Non-affiliated issuers, at value (identified cost, $1,631,960,604) | | | $2,572,533,390 | | | | | |
Underlying affiliated funds, at cost and value | | | 1,800 | | | | | |
Total investments, at value (identified cost, $1,631,962,404) | | | $2,572,535,190 | | | | | |
Foreign currency, at value (identified cost, $127) | | | 126 | | | | | |
Receivables for | | | | | | | | |
Investments sold | | | 34,294,863 | | | | | |
Fund shares sold | | | 596,142 | | | | | |
Interest and dividends | | | 4,897,588 | | | | | |
Other assets | | | 15,705 | | | | | |
Total assets | | | | | | | $2,612,339,614 | |
Liabilities | | | | | | | | |
Payable to custodian | | | $6,007,752 | | | | | |
Payables for | | | | | | | | |
Investments purchased | | | 261,209 | | | | | |
Fund shares reacquired | | | 5,214,357 | | | | | |
Payable to affiliates | | | | | | | | |
Investment adviser | | | 95,195 | | | | | |
Shareholder servicing costs | | | 501 | | | | | |
Distribution and/or service fees | | | 20,554 | | | | | |
Payable for independent Trustees’ compensation | | | 6 | | | | | |
Accrued expenses and other liabilities | | | 211,061 | | | | | |
Total liabilities | | | | | | | $11,810,635 | |
Net assets | | | | | | | $2,600,528,979 | |
Net assets consist of | | | | | | | | |
Paid-in capital | | | $1,479,348,956 | | | | | |
Unrealized appreciation (depreciation) on investments and translation of assets and liabilities in foreign currencies | | | 940,513,497 | | | | | |
Accumulated net realized gain (loss) on investments and foreign currency | | | 129,172,996 | | | | | |
Undistributed net investment income | | | 51,493,530 | | | | | |
Net assets | | | | | | | $2,600,528,979 | |
Shares of beneficial interest outstanding | | | | | | | 128,910,035 | |
| | | | | | | | | | | | |
| | | Net assets | | | Shares outstanding | | | Net asset value per share | |
Initial Class | | | $1,118,647,376 | | | | 55,001,452 | | | | $20.34 | |
Service Class | | | 1,481,881,603 | | | | 73,908,583 | | | | 20.05 | |
See Notes to Financial Statements
9
MFS Value Series
FINANCIAL STATEMENTS | STATEMENT OF OPERATIONS
This statement describes how much your fund earned in investment income and accrued in expenses. It also describes any gains and/or losses generated by fund operations.
| | | | | | | | |
Year ended 12/31/14 | | | | | | | | |
Net investment income | | | | | | | | |
Income | | | | | | | | |
Dividends | | | $72,997,039 | | | | | |
Interest | | | 43,891 | | | | | |
Dividends from underlying affiliated funds | | | 16,631 | | | | | |
Foreign taxes withheld | | | (391,795 | ) | | | | |
Total investment income | | | | | | | $72,665,766 | |
Expenses | | | | | | | | |
Management fee | | | $16,929,299 | | | | | |
Distribution and/or service fees | | | 3,424,852 | | | | | |
Shareholder servicing costs | | | 85,511 | | | | | |
Administrative services fee | | | 341,543 | | | | | |
Independent Trustees’ compensation | | | 42,261 | | | | | |
Custodian fee | | | 159,880 | | | | | |
Shareholder communications | | | 156,022 | | | | | |
Audit and tax fees | | | 56,725 | | | | | |
Legal fees | | | 29,612 | | | | | |
Miscellaneous | | | 59,402 | | | | | |
Total expenses | | | | | | | $21,285,107 | |
Fees paid indirectly | | | (15 | ) | | | | |
Reduction of expenses by investment adviser | | | (117,807 | ) | | | | |
Net expenses | | | | | | | $21,167,285 | |
Net investment income | | | | | | | $51,498,481 | |
Realized and unrealized gain (loss) on investments and foreign currency | | | | | | | | |
Realized gain (loss) (identified cost basis) | | | | | | | | |
Investments | | | $201,225,901 | | | | | |
Foreign currency | | | (13,532 | ) | | | | |
Net realized gain (loss) on investments and foreign currency | | | | | | | $201,212,369 | |
Change in unrealized appreciation (depreciation) | | | | | | | | |
Investments | | | $(8,786,852 | ) | | | | |
Translation of assets and liabilities in foreign currencies | | | (81,890 | ) | | | | |
Net unrealized gain (loss) on investments and foreign currency translation | | | | | | | $(8,868,742 | ) |
Net realized and unrealized gain (loss) on investments and foreign currency | | | | | | | $192,343,627 | |
Change in net assets from operations | | | | | | | $243,842,108 | |
See Notes to Financial Statements
10
MFS Value Series
FINANCIAL STATEMENTS | STATEMENTS OF CHANGES IN NET ASSETS
These statements describe the increases and/or decreases in net assets resulting from operations, any distributions, and any shareholder transactions.
| | | | | | | | |
For years ended 12/31 | | | 2014 | | | | 2013 | |
Change in net assets | | | | | | | | |
| From operations | | | | | | | | |
Net investment income | | | $51,498,481 | | | | $36,767,152 | |
Net realized gain (loss) on investments and foreign currency | | | 201,212,369 | | | | 81,105,549 | |
Net unrealized gain (loss) on investments and foreign currency translation | | | (8,868,742 | ) | | | 573,023,259 | |
Change in net assets from operations | | | $243,842,108 | | | | $690,895,960 | |
| Distributions declared to shareholders | | | | | | | | |
From net investment income | | | $(36,745,114 | ) | | | $(24,530,172 | ) |
From net realized gain on investments | | | (80,580,203 | ) | | | (6,945,411 | ) |
Total distributions declared to shareholders | | | $(117,325,317 | ) | | | $(31,475,583 | ) |
Change in net assets from fund share transactions | | | $(20,388,062 | ) | | | $(176,337,066 | ) |
Total change in net assets | | | $106,128,729 | | | | $483,083,311 | |
| Net assets | | | | | | | | |
At beginning of period | | | 2,494,400,250 | | | | 2,011,316,939 | |
At end of period (including undistributed net investment income of $51,493,530 and
$36,744,827, respectively) | | | $2,600,528,979 | | | | $2,494,400,250 | |
See Notes to Financial Statements
11
MFS Value Series
FINANCIAL STATEMENTS | FINANCIAL HIGHLIGHTS
The financial highlights table is intended to help you understand the fund’s financial performance for the past 5 years. Certain information reflects financial results for a single fund share. The total returns in the table represent the rate by which an investor would have earned (or lost) on an investment in the fund share class (assuming reinvestment of all distributions) held for the entire period.
| | | | | | | | | | | | | | | | | | | | |
| Initial Class | | Years ended 12/31 | |
| | | 2014 | | | 2013 | | | 2012 | | | 2011 | | | 2010 | |
Net asset value, beginning of period | | | $19.28 | | | | $14.40 | | | | $12.68 | | | | $12.98 | | | | $11.80 | |
| Income (loss) from investment operations | | | | | | | | | | | | | | | | | | | | |
Net investment income (d) | | | $0.44 | | | | $0.30 | | | | $0.28 | | | | $0.24 | | | | $0.19 | |
Net realized and unrealized gain (loss) on investments
and foreign currency | | | 1.55 | | | | 4.83 | | | | 1.77 | | | | (0.30 | ) | | | 1.16 | |
Total from investment operations | | | $1.99 | | | | $5.13 | | | | $2.05 | | | | $(0.06 | ) | | | $1.35 | |
| Less distributions declared to shareholders | | | | | | | | | | | | | | | | | | | | |
From net investment income | | | $(0.31 | ) | | | $(0.20 | ) | | | $(0.23 | ) | | | $(0.19 | ) | | | $(0.17 | ) |
From net realized gain on investments | | | (0.62 | ) | | | (0.05 | ) | | | (0.10 | ) | | | (0.05 | ) | | | — | |
Total distributions declared to shareholders | | | $(0.93 | ) | | | $(0.25 | ) | | | $(0.33 | ) | | | $(0.24 | ) | | | $(0.17 | ) |
Net asset value, end of period (x) | | | $20.34 | | | | $19.28 | | | | $14.40 | | | | $12.68 | | | | $12.98 | |
Total return (%) (k)(r)(s)(x) | | | 10.51 | | | | 35.89 | | | | 16.26 | | | | (0.30 | ) | | | 11.53 | |
Ratios (%) (to average net assets)
and Supplemental data: | | | | | | | | | | | | | | | | | | | | |
Expenses before expense reductions (f) | | | 0.73 | | | | 0.73 | | | | 0.78 | | | | 0.79 | | | | 0.83 | |
Expenses after expense reductions (f) | | | 0.72 | | | | 0.73 | | | | 0.78 | | | | 0.79 | | | | 0.83 | |
Net investment income | | | 2.23 | | | | 1.74 | | | | 2.02 | | | | 1.81 | | | | 1.60 | |
Portfolio turnover | | | 13 | | | | 15 | | | | 16 | | | | 18 | | | | 28 | |
Net assets at end of period (000 omitted) | | | $1,118,647 | | | | $1,090,381 | | | | $988,594 | | | | $352,752 | | | | $389,052 | |
See Notes to Financial Statements
12
MFS Value Series
Financial Highlights – continued
| | | | | | | | | | | | | | | | | | | | |
| Service Class | | Years ended 12/31 | |
| | | 2014 | | | 2013 | | | 2012 | | | 2011 | | | 2010 | |
Net asset value, beginning of period | | | $19.03 | | | | $14.22 | | | | $12.54 | | | | $12.83 | | | | $11.68 | |
| Income (loss) from investment operations | | | | | | | | | | | | | | | | | | | | |
Net investment income (d) | | | $0.38 | | | | $0.25 | | | | $0.24 | | | | $0.20 | | | | $0.16 | |
Net realized and unrealized gain (loss) on investments
and foreign currency | | | 1.52 | | | | 4.78 | | | | 1.74 | | | | (0.27 | ) | | | 1.15 | |
Total from investment operations | | | $1.90 | | | | $5.03 | | | | $1.98 | | | | $(0.07 | ) | | | $1.31 | |
| Less distributions declared to shareholders | | | | | | | | | | | | | | | | | | | | |
From net investment income | | | $(0.26 | ) | | | $(0.17 | ) | | | $(0.20 | ) | | | $(0.17 | ) | | | $(0.16 | ) |
From net realized gain on investments | | | (0.62 | ) | | | (0.05 | ) | | | (0.10 | ) | | | (0.05 | ) | | | — | |
Total distributions declared to shareholders | | | $(0.88 | ) | | | $(0.22 | ) | | | $(0.30 | ) | | | $(0.22 | ) | | | $(0.16 | ) |
Net asset value, end of period (x) | | | $20.05 | | | | $19.03 | | | | $14.22 | | | | $12.54 | | | | $12.83 | |
Total return (%) (k)(r)(s)(x) | | | 10.20 | | | | 35.59 | | | | 15.88 | | | | (0.47 | ) | | | 11.22 | |
Ratios (%) (to average net assets)
and Supplemental data: | | | | | | | | | | | | | | | | | | | | |
Expenses before expense reductions (f) | | | 0.98 | | | | 0.98 | | | | 1.03 | | | | 1.04 | | | | 1.08 | |
Expenses after expense reductions (f) | | | 0.97 | | | | 0.98 | | | | 1.03 | | | | 1.04 | | | | 1.08 | |
Net investment income | | | 1.99 | | | | 1.49 | | | | 1.76 | | | | 1.58 | | | | 1.35 | |
Portfolio turnover | | | 13 | | | | 15 | | | | 16 | | | | 18 | | | | 28 | |
Net assets at end of period (000 omitted) | | | $1,481,882 | | | | $1,404,019 | | | | $1,022,722 | | | | $831,481 | | | | $750,049 | |
| (d) | Per share data is based on average shares outstanding. |
| (f) | Ratios do not reflect reductions from fees paid indirectly, if applicable. |
| (k) | The total return does not reflect expenses that apply to separate accounts. Inclusion of these charges would reduce the total return figures for all periods shown. |
| (r) | Certain expenses have been reduced without which performance would have been lower. |
| (s) | From time to time the fund may receive proceeds from litigation settlements, without which performance would be lower. |
| (x) | The net asset values per share and total returns have been calculated on net assets which include adjustments made in accordance with U.S. generally accepted accounting principles required at period end for financial reporting purposes. |
See Notes to Financial Statements
13
MFS Value Series
NOTES TO FINANCIAL STATEMENTS
| (1) | | Business and Organization |
MFS Value Series (the fund) is a diversified series of MFS Variable Insurance Trust (the trust). The trust is organized as a Massachusetts business trust and is registered under the Investment Company Act of 1940, as amended, as an open-end management investment company. The shareholders of each series of the trust are separate accounts of insurance companies, which offer variable annuity and/or life insurance products, and qualified retirement and pension plans.
The fund is an investment company and accordingly follows the investment company accounting and reporting guidance of the Financial Accounting Standards Board (FASB) Accounting Standards Codification Topic 946 Financial Services – Investment Companies.
| (2) | | Significant Accounting Policies |
General – The preparation of financial statements in conformity with U.S. generally accepted accounting principles requires management to make estimates and assumptions that affect the reported amounts of assets and liabilities, and disclosure of contingent assets and liabilities at the date of the financial statements and the reported amounts of increases and decreases in net assets from operations during the reporting period. Actual results could differ from those estimates. In the preparation of these financial statements, management has evaluated subsequent events occurring after the date of the fund’s Statement of Assets and Liabilities through the date that the financial statements were issued.
In June 2014, FASB issued Accounting Standards Update 2014-11, Transfers and Servicing (Topic 860) – Repurchase-to-Maturity Transactions, Repurchase Financings, and Disclosures (“ASU 2014-11”). ASU 2014-11 changes the accounting for repurchase-to-maturity transactions (i.e., repurchase agreements that settle at the same time as the maturity of the transferred financial asset) and enhances the required disclosures for repurchase agreements and other similar transactions. Although still evaluating the potential impacts of ASU 2014-11 to the fund, management expects that the impact of the fund’s adoption will be limited to additional financial statement disclosures which would first be effective for interim reporting periods beginning after March 15, 2015.
Balance Sheet Offsetting – The fund’s accounting policy with respect to balance sheet offsetting is that, absent an event of default by the counterparty or a termination of the agreement, the International Swaps and Derivatives Association (ISDA) Master Agreement does not result in an offset of reported amounts of financial assets and financial liabilities in the Statement of Assets and Liabilities across transactions between the fund and the applicable counterparty. The fund’s right to setoff may be restricted or prohibited by the bankruptcy or insolvency laws of the particular jurisdiction to which a specific master netting agreement counterparty is subject. Balance sheet offsetting disclosures, to the extent applicable to the fund, have been included in the fund’s Significant Accounting Policies note under the captions for each of the fund’s in-scope financial instruments and transactions.
Investment Valuations – Equity securities, including restricted equity securities, are generally valued at the last sale or official closing price as provided by a third-party pricing service on the market or exchange on which they are primarily traded. Equity securities, for which there were no sales reported that day, are generally valued at the last quoted daily bid quotation as provided by a third-party pricing service on the market or exchange on which such securities are primarily traded. Short-term instruments with a maturity at issuance of 60 days or less may be valued at amortized cost, which approximates market value. Open-end investment companies are generally valued at net asset value per share. Securities and other assets generally valued on the basis of information from a third-party pricing service may also be valued at a broker/dealer bid quotation. Values obtained from third-party pricing services can utilize both transaction data and market information such as yield, quality, coupon rate, maturity, type of issue, trading characteristics, and other market data. The values of foreign securities and other assets and liabilities expressed in foreign currencies are converted to U.S. dollars using the mean of bid and asked prices for rates provided by a third-party pricing service.
The Board of Trustees has delegated primary responsibility for determining or causing to be determined the value of the fund’s investments (including any fair valuation) to the adviser pursuant to valuation policies and procedures approved by the Board. If the adviser determines that reliable market quotations are not readily available, investments are valued at fair value as determined in good faith by the adviser in accordance with such procedures under the oversight of the Board of Trustees. Under the fund’s valuation policies and procedures, market quotations are not considered to be readily available for most types of debt instruments and floating rate loans and many types of derivatives. These investments are generally valued at fair value based on information from third-party pricing services. In addition, investments may be valued at fair value if the adviser determines that an investment’s value has been materially affected by events occurring after the close of the exchange or market on which the investment is principally traded (such as foreign exchange or market) and prior to the determination of the fund’s net asset value, or after the halting of trading of a specific security where trading does not resume prior to the close of the exchange or market on which the security is principally traded. Events that occur on a frequent basis after foreign markets close (such as developments in foreign markets and significant movements in the U.S. markets) and prior to the determination of the fund’s net asset value may be deemed to have a material effect on the value of securities traded in foreign markets. Accordingly, the fund’s foreign equity securities may often be valued at fair value. The adviser generally relies on third-party pricing services or other information (such as the correlation with price
14
MFS Value Series
Notes to Financial Statements – continued
movements of similar securities in the same or other markets; the type, cost and investment characteristics of the security; the business and financial condition of the issuer; and trading and other market data) to assist in determining whether to fair value and at what value to fair value an investment. The value of an investment for purposes of calculating the fund’s net asset value can differ depending on the source and method used to determine value. When fair valuation is used, the value of an investment used to determine the fund’s net asset value may differ from quoted or published prices for the same investment. There can be no assurance that the fund could obtain the fair value assigned to an investment if it were to sell the investment at the same time at which the fund determines its net asset value per share.
Various inputs are used in determining the value of the fund’s assets or liabilities. These inputs are categorized into three broad levels. In certain cases, the inputs used to measure fair value may fall into different levels of the fair value hierarchy. In such cases, an investment’s level within the fair value hierarchy is based on the lowest level of input that is significant to the fair value measurement. The fund’s assessment of the significance of a particular input to the fair value measurement in its entirety requires judgment, and considers factors specific to the investment. Level 1 includes unadjusted quoted prices in active markets for identical assets or liabilities. Level 2 includes other significant observable market-based inputs (including quoted prices for similar securities, interest rates, prepayment speed, and credit risk). Level 3 includes unobservable inputs, which may include the adviser’s own assumptions in determining the fair value of investments. The following is a summary of the levels used as of December 31, 2014 in valuing the fund’s assets or liabilities:
| | | | | | | | | | | | | | | | |
| Investments at Value | | Level 1 | | | Level 2 | | | Level 3 | | | Total | |
| Equity Securities: | | | | | | | | | | | | | | | | |
United States | | | $2,425,086,124 | | | | $— | | | | $— | | | | $2,425,086,124 | |
Switzerland | | | — | | | | 58,079,670 | | | | — | | | | 58,079,670 | |
United Kingdom | | | — | | | | 55,414,839 | | | | — | | | | 55,414,839 | |
France | | | — | | | | 18,306,604 | | | | — | | | | 18,306,604 | |
Canada | | | 15,646,153 | | | | — | | | | — | | | | 15,646,153 | |
| Mutual Funds | | | 1,800 | | | | — | | | | — | | | | 1,800 | �� |
| Total Investments | | | $2,440,734,077 | | | | $131,801,113 | | | | $— | | | | $2,572,535,190 | |
For further information regarding security characteristics, see the Portfolio of Investments.
Of the level 2 investments presented above, equity investments amounting to $123,182,657 were considered level 1 investments at the beginning of the period. The primary reason for changes in the classifications between levels 1 and 2 occurs when foreign equity securities are fair valued using other observable market-based inputs in place of the closing exchange price due to events occurring after the close of the exchange or market on which the investment is principally traded. The fund’s foreign equity securities may often be valued at fair value. The fund’s policy is to recognize transfers between the levels as of the end of the period.
Foreign Currency Translation – Purchases and sales of foreign investments, income, and expenses are converted into U.S. dollars based upon currency exchange rates prevailing on the respective dates of such transactions or on the reporting date for foreign denominated receivables and payables. Gains and losses attributable to foreign currency exchange rates on sales of securities are recorded for financial statement purposes as net realized gains and losses on investments. Gains and losses attributable to foreign exchange rate movements on receivables, payables, income and expenses are recorded for financial statement purposes as foreign currency transaction gains and losses. That portion of both realized and unrealized gains and losses on investments that results from fluctuations in foreign currency exchange rates is not separately disclosed.
Security Loans – Under its Securities Lending Agency Agreement with the fund, State Street Bank and Trust Company (“State Street”), as lending agent, loans the securities of the fund to certain qualified institutions (the “Borrowers”) approved by the fund. The loans are collateralized by cash and/or U.S. Treasury and federal agency obligations in an amount typically at least equal to the market value of the securities loaned. On loans collateralized by cash, the cash collateral is invested in a money market fund. The market value of the loaned securities is determined at the close of business of the fund and any additional required collateral is delivered to the fund on the next business day. State Street provides the fund with indemnification against Borrower default. In the event of Borrower default, State Street will for the benefit of the fund either purchase securities identical to those loaned or, when such purchase is commercially impracticable, pay the fund the market value of the loaned securities. In return, State Street assumes the fund’s rights to the related collateral. If the collateral value is less than the cost to purchase identical securities, State Street is responsible for the shortfall, but only to the extent that such shortfall is not due to a decline in collateral value resulting from collateral reinvestment for which the fund bears the risk of loss. A portion of the income generated upon investment of the collateral is remitted to the Borrowers, and the remainder is allocated between the fund and the lending agent. On loans collateralized by U.S. Treasury and/or federal agency obligations, a fee is received from the Borrower, and is allocated between the fund and the lending agent. Income from securities lending is included in “Interest” income, in the Statement of Operations. The dividend and interest income earned on the securities loaned is accounted for in the same manner as other dividend and interest income. At December 31, 2014, there were no securities on loan or collateral outstanding.
15
MFS Value Series
Notes to Financial Statements – continued
Indemnifications – Under the fund’s organizational documents, its officers and Trustees may be indemnified against certain liabilities and expenses arising out of the performance of their duties to the fund. Additionally, in the normal course of business, the fund enters into agreements with service providers that may contain indemnification clauses. The fund’s maximum exposure under these agreements is unknown as this would involve future claims that may be made against the fund that have not yet occurred.
Investment Transactions and Income – Investment transactions are recorded on the trade date. Interest income is recorded on the accrual basis. Dividends received in cash are recorded on the ex-dividend date. Certain dividends from foreign securities will be recorded when the fund is informed of the dividend if such information is obtained subsequent to the ex-dividend date. Dividend payments received in additional securities are recorded on the ex-dividend date in an amount equal to the value of the security on such date.
The fund may receive proceeds from litigation settlements. Any proceeds received from litigation involving portfolio holdings are reflected in the Statement of Operations in realized gain/loss if the security has been disposed of by the fund or in unrealized gain/loss if the security is still held by the fund. Any other proceeds from litigation not related to portfolio holdings are reflected as other income in the Statement of Operations.
Fees Paid Indirectly – The fund’s custody fee may be reduced according to an arrangement that measures the value of cash deposited with the custodian by the fund. This amount, for the year ended December 31, 2014, is shown as a reduction of total expenses in the Statement of Operations.
Tax Matters and Distributions – The fund intends to qualify as a regulated investment company, as defined under Subchapter M of the Internal Revenue Code, and to distribute all of its taxable income, including realized capital gains. As a result, no provision for federal income tax is required. The fund’s federal tax returns, when filed, will remain subject to examination by the Internal Revenue Service for a three year period. Management has analyzed the fund’s tax positions taken on federal and state tax returns for all open tax years and does not believe that there are any uncertain tax positions that require recognition of a tax liability. Foreign taxes, if any, have been accrued by the fund in the accompanying financial statements in accordance with the applicable foreign tax law. Foreign income taxes may be withheld by certain countries in which the fund invests. Additionally, capital gains realized by the fund on securities issued in or by certain foreign countries may be subject to capital gains tax imposed by those countries.
Distributions to shareholders are recorded on the ex-dividend date. Income and capital gain distributions are determined in accordance with income tax regulations, which may differ from U.S. generally accepted accounting principles. Certain capital accounts in the financial statements are periodically adjusted for permanent differences in order to reflect their tax character. These adjustments have no impact on net assets or net asset value per share. Temporary differences which arise from recognizing certain items of income, expense, gain or loss in different periods for financial statement and tax purposes will reverse at some time in the future. Distributions in excess of net investment income or net realized gains are temporary overdistributions for financial statement purposes resulting from differences in the recognition or classification of income or distributions for financial statement and tax purposes.
Book/tax differences primarily relate to wash sale loss deferrals and redemptions in-kind.
The tax character of distributions declared to shareholders for the last two fiscal years is as follows:
| | | | | | | | |
| | | 12/31/14 | | | 12/31/13 | |
| Ordinary income (including any short-term capital gains) | | | $83,022,402 | | | | $30,725,336 | |
| Long-term capital gains | | | 34,302,915 | | | | 750,247 | |
| Total distributions | | | $117,325,317 | | | | $31,475,583 | |
The federal tax cost and the tax basis components of distributable earnings were as follows:
| | | | |
| As of 12/31/14 | | | | |
| Cost of investments | | | $1,640,507,823 | |
| Gross appreciation | | | 938,671,720 | |
| Gross depreciation | | | (6,644,353 | ) |
| Net unrealized appreciation (depreciation) | | | $932,027,367 | |
| Undistributed ordinary income | | | 57,139,410 | |
| Undistributed long-term capital gain | | | 132,191,502 | |
| Capital loss carryforwards | | | (114,669 | ) |
| Other temporary differences | | | (63,587 | ) |
Under the Regulated Investment Company Modernization Act of 2010 (the “Act”), net capital losses recognized for fund fiscal years beginning after December 31, 2011 may be carried forward indefinitely, and their character is retained as short-term and/or
16
MFS Value Series
Notes to Financial Statements – continued
long-term losses (“post-enactment losses”). Previously, net capital losses were carried forward for eight years and treated as short-term losses (“pre-enactment losses”). As a transition rule, the Act requires that all post-enactment net capital losses be used before pre-enactment net capital losses.
As of December 31, 2014, the fund had capital loss carryforwards available to offset future realized gains. Such pre-enactment losses expire as follows:
Multiple Classes of Shares of Beneficial Interest – The fund offers multiple classes of shares, which differ in their respective distribution and/or service fees. The fund’s income, realized and unrealized gain (loss), and common expenses are allocated to shareholders based on the daily net assets of each class. Dividends are declared separately for each class. Differences in per share dividend rates are generally due to differences in separate class expenses. The fund’s distributions declared to shareholders as reported in the Statements of Changes in Net Assets are presented by class as follows:
| | | | | | | | | | | | | | | | |
| | | From net investment
income | | | From net realized gain on
investments | |
| | | Year ended
12/31/14 | | | Year ended
12/31/13 | | | Year ended
12/31/14 | | | Year ended
12/31/13 | |
| Initial Class | | | $17,440,139 | | | | $12,074,098 | | | | $35,286,353 | | | | $3,123,247 | |
| Service Class | | | 19,304,975 | | | | 12,456,074 | | | | 45,293,850 | | | | 3,822,164 | |
| Total | | | $36,745,114 | | | | $24,530,172 | | | | $80,580,203 | | | | $6,945,411 | |
| (3) | | Transactions with Affiliates |
Investment Adviser – The fund has an investment advisory agreement with MFS to provide overall investment management and related administrative services and facilities to the fund. The management fee is computed daily and paid monthly at the following annual rates:
| | | | |
| First $1 billion of average daily net assets | | | 0.75% | |
| Average daily net assets in excess of $1 billion | | | 0.65% | |
The investment adviser has agreed in writing to reduce its management fee to 0.60% of average daily net assets in excess of $2.5 billion. This written agreement will continue until modified by the fund’s Board of Trustees, but such agreement will continue at least until July 31, 2016. For the year ended December 31, 2014, the fund’s average daily net assets did not exceed $2.5 billion and therefore, the management fee was not reduced in accordance with this agreement. MFS has also agreed in writing to reduce its management fee by a specified amount if certain MFS mutual fund assets exceed thresholds agreed to by MFS and the fund’s Board of Trustees. For the year ended December 31, 2014, this management fee reduction amounted to $113,604, which is included in the reduction of total expenses in the Statement of Operations. The management fee incurred for the year ended December 31, 2014 was equivalent to an annual effective rate of 0.69% of the fund’s average daily net assets.
The investment adviser has agreed in writing to pay a portion of the fund’s total annual operating expenses, excluding interest, taxes, extraordinary expenses, brokerage and transaction costs, and investment-related expenses, such that total annual operating expenses do not exceed 0.90% of average daily net assets for the Initial Class shares and 1.15% of average daily net assets for the Service Class shares. This written agreement will continue until modified by the fund’s Board of Trustees, but such agreement will continue at least until April 30, 2016. For the year ended December 31, 2014, the fund’s actual operating expenses did not exceed the limit and therefore, the investment adviser did not pay any portion of the fund’s expenses related to this agreement.
Distributor – MFS Fund Distributors, Inc. (MFD), a wholly-owned subsidiary of MFS, is the distributor of shares of the fund. The Trustees have adopted a distribution plan for the Service Class shares pursuant to Rule 12b-1 under the Investment Company Act of 1940.
The fund’s distribution plan provides that the fund will pay MFD distribution and/or service fees equal to 0.25% per annum of its average daily net assets attributable to Service Class shares as partial consideration for services performed and expenses incurred by MFD and financial intermediaries (including participating insurance companies that invest in the fund to fund variable annuity and variable life insurance contracts, sponsors of qualified retirement and pension plans that invest in the fund, and affiliates of these participating insurance companies and plan sponsors) in connection with the sale and distribution of the Service Class shares. MFD may subsequently pay all, or a portion, of the distribution and/or service fees to financial intermediaries.
Shareholder Servicing Agent – MFS Service Center, Inc. (MFSC), a wholly-owned subsidiary of MFS, receives a fee from the fund for its services as shareholder servicing agent. For the year ended December 31, 2014, the fee was $84,214, which equated to 0.0034% annually of the fund’s average daily net assets. MFSC also receives payment from the fund for out-of-pocket expenses paid by MFSC on behalf of the fund. For the year ended December 31, 2014, these costs amounted to $1,297.
Administrator – MFS provides certain financial, legal, shareholder communications, compliance, and other administrative services to the fund. Under an administrative services agreement, the fund partially reimburses MFS the costs incurred to provide these services.
17
MFS Value Series
Notes to Financial Statements – continued
The fund is charged an annual fixed amount of $17,500 plus a fee based on average daily net assets. The administrative services fee incurred for the year ended December 31, 2014 was equivalent to an annual effective rate of 0.0139% of the fund’s average daily net assets.
Trustees’ and Officers’ Compensation – The fund pays compensation to independent Trustees in the form of a retainer, attendance fees, and additional compensation to Board and Committee chairpersons. The fund does not pay compensation directly to Trustees or officers of the fund who are also officers of the investment adviser, all of whom receive remuneration for their services to the fund from MFS. Certain officers and Trustees of the fund are officers or directors of MFS, MFD, and MFSC.
Other – Effective November 1, 2014, this fund and certain other funds managed by MFS (the funds) have entered into a service agreement (the ISO Agreement) which provides for payment of fees solely by the funds to Tarantino LLC in return for the provision of services of an Independent Senior Officer (ISO) for the funds. Frank L. Tarantino serves as the ISO and is an officer of the funds and the sole member of Tarantino LLC. The funds can terminate the ISO Agreement with Tarantino LLC at any time under the terms of the ISO Agreement. Prior to November 1, 2014, the funds had entered into services agreements (the Compliance Officer Agreements) which provided for payment of fees by the funds to Tarantino LLC and Griffin Compliance LLC in return for the provision of services of an Independent Chief Compliance Officer (ICCO) and Assistant ICCO, respectively, for the funds. Prior to November 1, 2014, Frank L. Tarantino served as the ICCO. Effective October 31, 2014, Mr. Tarantino resigned as ICCO and the Compliance Officer Agreement between the funds and Tarantino LLC was terminated. Prior to June 1, 2014, Robyn L. Griffin served as the Assistant ICCO and was an officer of the funds. Ms. Griffin is the sole member of Griffin Compliance LLC. Effective May 31, 2014, Ms. Griffin resigned as Assistant ICCO and the Compliance Officer Agreement between the funds and Griffin Compliance LLC was terminated. For the year ended December 31, 2014, the aggregate fees paid by the fund under these agreements were $11,527 and are included in “Miscellaneous” expense in the Statement of Operations. MFS had agreed to reimburse the fund for a portion of the payments made by the fund for the services under the Compliance Officer Agreements in the amount of $4,203, which is included in the reduction of total expenses in the Statement of Operations. Additionally, MFS has agreed to bear all expenses associated with office space, other administrative support, and supplies provided to the ICCO, Assistant ICCO, and ISO.
The fund invests in the MFS Institutional Money Market Portfolio which is managed by MFS and seeks current income consistent with preservation of capital and liquidity. Income earned on this investment is included in “Dividends from underlying affiliated funds” in the Statement of Operations. This money market fund does not pay a management fee to MFS.
For the year ended December 31, 2014, purchases and sales of investments, other than in-kind transactions and short-term obligations, aggregated $318,408,470 and $612,418,325, respectively. Purchases exclude the value of securities acquired in connection with the MFS Value Portfolio merger. (See Note 9)
| (5) | | Shares of Beneficial Interest |
The fund’s Declaration of Trust permits the Trustees to issue an unlimited number of full and fractional shares of beneficial interest. Transactions in fund shares were as follows:
| | | | | | | | | | | | | | | | |
| | | Year ended 12/31/14 | | | Year ended 12/31/13 | |
| | | Shares | | | Amount | | | Shares | | | Amount | |
| Shares sold | | | | | | | | | | | | | | | | |
Initial Class | | | 1,907,102 | | | | $36,814,672 | | | | 3,103,945 | | | | $53,050,210 | |
Service Class | | | 11,164,519 | | | | 216,843,288 | | | | 12,444,915 | | | | 206,112,163 | |
| | | 13,071,621 | | | | $253,657,960 | | | | 15,548,860 | | | | $259,162,373 | |
| Shares issued in connection with acquisition of MFS Value Portfolio | | | | | | | | | | | | | | | | |
Initial Class | | | 7,020,532 | | | | $138,866,125 | | | | | | | | | |
Service Class | | | 9,696,511 | | | | 188,984,993 | | | | | | | | | |
| | | 16,717,043 | | | | $327,851,118 | | | | | | | | | |
| Shares issued to shareholders in reinvestment of distributions | | | | | | | | | | | | | | | | |
Initial Class | | | 2,709,480 | | | | $52,726,492 | | | | 887,695 | | | | $15,197,345 | |
Service Class | | | 3,364,522 | | | | 64,598,825 | | | | 962,640 | | | | 16,278,238 | |
| | | 6,074,002 | | | | $117,325,317 | | | | 1,850,335 | | | | $31,475,583 | |
| Shares reacquired | | | | | | | | | | | | | | | | |
Initial Class | | | (13,190,894 | ) | | | $(259,093,870 | ) | | | (16,107,655 | ) | | | $(273,027,465 | ) |
Service Class | | | (24,112,024 | ) | | | (460,128,587 | ) | | | (11,542,581 | ) | | | (193,947,557 | ) |
| | | (37,302,918 | ) | | | $(719,222,457 | ) | | | (27,650,236 | ) | | | $(466,975,022 | ) |
18
MFS Value Series
Notes to Financial Statements – continued
| | | | | | | | | | | | | | | | |
| | | Year ended 12/31/14 | | | Year ended 12/31/13 | |
| | | Shares | | | Amount | | | Shares | | | Amount | |
| Net change | | | | | | | | | | | | | | | | |
Initial Class | | | (1,553,780 | ) | | | $(30,686,581 | ) | | | (12,116,015 | ) | | | $(204,779,910 | ) |
Service Class | | | 113,528 | | | | 10,298,519 | | | | 1,864,974 | | | | 28,442,844 | |
| | | (1,440,252 | ) | | | $(20,388,062 | ) | | | (10,251,041 | ) | | | $(176,337,066 | ) |
The fund is one of several mutual funds in which certain MFS funds may invest. The MFS funds do not invest in the underlying funds for the purpose of exercising management or control. At the end of the period, the MFS Moderate Allocation Portfolio, the MFS Growth Allocation Portfolio, and the MFS Conservative Allocation Portfolio, were the owners of record of approximately 7%, 2%, and 2%, respectively, of the value of outstanding voting shares of the fund.
The fund and certain other funds managed by MFS participate in a $1.1 billion unsecured committed line of credit, subject to a $1 billion sublimit, provided by a syndication of banks under a credit agreement. Borrowings may be made for temporary financing needs. Interest is charged to each fund, based on its borrowings, generally at a rate equal to the higher of the Federal Reserve funds rate or one month LIBOR plus an agreed upon spread. A commitment fee, based on the average daily, unused portion of the committed line of credit, is allocated among the participating funds at the end of each calendar quarter. In addition, the fund and other funds managed by MFS have established unsecured uncommitted borrowing arrangements with certain banks for temporary financing needs. Interest is charged to each fund, based on its borrowings, at a rate equal to the Federal Reserve funds rate plus an agreed upon spread. For the year ended December 31, 2014, the fund’s commitment fee and interest expense were $9,399 and $0, respectively, and are included in “Miscellaneous” expense in the Statement of Operations.
| (7) | | Transactions in Underlying Affiliated Funds – Affiliated Issuers |
An affiliated issuer may be considered one in which the fund owns 5% or more of the outstanding voting securities, or a company which is under common control. For the purposes of this report, the fund assumes the following to be an affiliated issuer:
| | | | | | | | | | | | | | | | |
| Underlying Affiliated Fund | | Beginning
Shares/Par
Amount | | | Acquisitions
Shares/Par
Amount | | | Dispositions
Shares/Par
Amount | | | Ending
Shares/Par
Amount | |
| MFS Institutional Money Market Portfolio | | | 883 | | | | 369,437,767 | | | | (369,436,850 | ) | | | 1,800 | |
| | | | |
| Underlying Affiliated Fund | | Realized Gain (Loss) | | | Capital Gain
Distributions | | | Dividend
Income | | | Ending
Value | |
| MFS Institutional Money Market Portfolio | | | $— | | | | $— | | | | $16,631 | | | | $1,800 | |
On May 1, 2014, the fund recorded redemption proceeds for a distribution in-kind of portfolio securities and cash that were valued at $140,669,019. The redeeming shareholder generally receives a pro rata share of the securities held by the fund. The distribution of such securities generated a realized gain of $61,559,212 for the fund.
At close of business on August 8, 2014, the fund with net assets of approximately $2,239,425,210, acquired all of the assets and liabilities of MFS Value Portfolio, a series of Variable Insurance Trust II. The purpose of the transaction was to provide shareholders of MFS Value Portfolio the opportunity to participate in a larger combined portfolio with an identical investment objective and similar investment policies and strategies. The acquisition was accomplished by a tax-free exchange of approximately 16,717,043 shares of the fund (valued at approximately $327,851,118) for all of the assets and liabilities of MFS Value Portfolio. MFS Value Portfolio then distributed the shares of the fund that MFS Value Portfolio received from the fund to its shareholders. MFS Value Portfolio’s investments on that date were valued at approximately $328,251,524 with a cost basis of approximately $209,873,974. For financial reporting purposes, assets received and shares issued by the fund were recorded at fair value; however, the cost basis of the investments received from MFS Value Portfolio were carried forward to align ongoing reporting of the fund’s realized and unrealized gains and losses with amounts distributable to shareholders for tax purposes. Because the combined investment portfolios have been managed as a single integrated portfolio since the acquisition was completed, it is not practicable to separate the amounts of revenue and earnings of MFS Value Portfolio that have been included in the fund’s Statement of Operations since August 8, 2014.
Assuming the acquisition had been completed on January 1, 2014, the fund’s pro forma results of operations for the year ended December 31, 2014 are as follows:
| | | | |
| Net investment income | | | $56,799,885 | |
| Net realized and unrealized gain (loss) on investments and foreign currency | | | 195,583,530 | |
| Change in net assets from operations | | | $252,383,415 | |
19
MFS Value Series
REPORT OF INDEPENDENT REGISTERED PUBLIC ACCOUNTING FIRM
To the Board of Trustees of MFS Variable Insurance Trust and the Shareholders of
MFS Value Series:
We have audited the accompanying statement of assets and liabilities, including the portfolio of investments, of MFS Value Series (one of the series of MFS Variable Insurance Trust) (the “Fund”) as of December 31, 2014, and the related statement of operations for the year then ended, the statements of changes in net assets for each of the two years in the period then ended, and the financial highlights for each of the five years in the period then ended. These financial statements and financial highlights are the responsibility of the Fund’s management. Our responsibility is to express an opinion on these financial statements and financial highlights based on our audits.
We conducted our audits in accordance with the standards of the Public Company Accounting Oversight Board (United States). Those standards require that we plan and perform the audit to obtain reasonable assurance about whether the financial statements and financial highlights are free of material misstatement. The Fund is not required to have, nor were we engaged to perform, an audit of its internal control over financial reporting. Our audits included consideration of internal control over financial reporting as a basis for designing audit procedures that are appropriate in the circumstances, but not for the purpose of expressing an opinion on the effectiveness of the Fund’s internal control over financial reporting. Accordingly, we express no such opinion. An audit also includes examining, on a test basis, evidence supporting the amounts and disclosures in the financial statements, assessing the accounting principles used and significant estimates made by management, as well as evaluating the overall financial statement presentation. Our procedures included confirmation of securities owned as of December 31, 2014, by correspondence with the custodian and brokers; where replies were not received from brokers, we performed other auditing procedures. We believe that our audits provide a reasonable basis for our opinion.
In our opinion, the financial statements and financial highlights referred to above present fairly, in all material respects, the financial position of MFS Value Series as of December 31, 2014, the results of its operations for the year then ended, the changes in its net assets for each of the two years in the period then ended, and the financial highlights for each of the five years in the period then ended, in conformity with accounting principles generally accepted in the United States of America.
DELOITTE & TOUCHE LLP
Boston, Massachusetts
February 13, 2015
20
MFS Value Series
TRUSTEES AND OFFICERS – IDENTIFICATION AND BACKGROUND
The Trustees and Officers of the Trust, as of February 1, 2015, are listed below, together with their principal occupations during the past five years. (Their titles may have varied during that period.) The address of each Trustee and Officer is 111 Huntington Avenue, Boston, Massachusetts 02199-7618.
| | | | | | | | |
Name, Age | | Position(s)
Held with Fund | | Trustee/Officer
Since (h) | | Principal Occupations
During the Past Five Years | | Other Directorships (j) |
| INTERESTED TRUSTEES |
Robert J. Manning (k) (age 51) | | Trustee | | February 2004 | | Massachusetts Financial Services Company, Chairman, Co-Chief Executive Officer and Director; President (until 2009); Chief Investment Officer (until 2010) | | N/A |
| | | | |
Robin A. Stelmach (k) (age 53) | | Trustee and President | | January 2014 | | Massachusetts Financial Services Company, Executive Vice President and Chief Operating Officer | | N/A |
| | | |
| INDEPENDENT TRUSTEES | | | | | | |
David H. Gunning (age 72) | | Trustee and Chair of Trustees | | January 2004 | | Private investor | | Lincoln Electric Holdings, Inc. (welding equipment manufacturer), Director; Development Alternatives, Inc. (consulting), Director/Non-Executive Chairman |
| | | | |
Steven E. Buller (age 63) | | Trustee | | February 2014 | | Chairman, Financial Accounting Standards Advisory Council; Standing Advisory Group, Public Company Accounting Oversight Board, Member (until 2014); BlackRock, Inc. (investment management), Managing Director (until 2014), BlackRock Finco UK (investment management), Director (until 2014) | | N/A |
| | | | |
Robert E. Butler (age 73) | | Trustee | | January 2006 | | Consultant – investment company industry regulatory and compliance matters | | N/A |
| | | | |
Maureen R. Goldfarb (age 59) | | Trustee | | January 2009 | | Private investor | | N/A |
| | | | |
William R. Gutow (age 73) | | Trustee | | December 1993 | | Private investor and real estate consultant; Capitol Entertainment Management Company (video franchise), Vice Chairman | | Texas Donuts (donut franchise), Vice Chairman (until 2010) |
| | | | |
Michael Hegarty (age 70) | | Trustee | | December 2004 | | Private investor | | Brookfield Office Properties, Inc. (real estate), Director; Rouse Properties Inc. (real estate), Director; Capmark Financial Group Inc. (real estate), Director |
| | | | |
John P. Kavanaugh (age 60) | | Trustee | | January 2009 | | Private investor | | N/A |
| | | | |
Maryanne L. Roepke (age 58) | | Trustee | | May 2014 | | American Century Investments (investment management), Senior Vice President and Chief Compliance Officer (until 2014) | | N/A |
| | | | |
Laurie J. Thomsen (age 57) | | Trustee | | March 2005 | | Private investor; New Profit, Inc. (venture philanthropy), Executive Partner (until 2010) | | The Travelers Companies (insurance), Director |
| | | | |
Robert W. Uek (age 73) | | Trustee | | January 2006 | | Consultant to investment company industry | | N/A |
| | | | |
| OFFICERS | | | | | | | | |
Christopher R. Bohane (k) (age 41) | | Assistant Secretary and Assistant Clerk | | July 2005 | | Massachusetts Financial Services Company, Vice President and Assistant General Counsel | | N/A |
| | | | |
Kino Clark (k) (age 46) | | Assistant Treasurer | | January 2012 | | Massachusetts Financial Services Company, Vice President | | N/A |
| | | | |
Thomas H. Connors (k) (age 55) | | Assistant Secretary and Assistant Clerk | | September 2012 | | Massachusetts Financial Services Company, Vice President and Senior Counsel; Deutsche Investment Management Americas Inc. (financial service provider), Director and Senior Counsel (until 2012) | | N/A |
21
MFS Value Series
Trustees and Officers – continued
| | | | | | | | |
Name, Age | | Position(s)
Held with Fund | | Trustee/Officer
Since (h) | | Principal Occupations
During the Past Five Years | | Other Directorships (j) |
Ethan D. Corey (k) (age 51) | | Assistant
Secretary and Assistant Clerk | | July 2005 | | Massachusetts Financial Services Company, Senior Vice President and Associate General Counsel | | N/A |
| | | | |
David L. DiLorenzo (k) (age 46) | | Treasurer | | July 2005 | | Massachusetts Financial Services Company, Senior Vice President | | N/A |
| | | | |
Timothy M. Fagan (k) (age 46) | | Chief Compliance Officer | | November 2014 | | Massachusetts Financial Services Company, Chief Compliance Officer; Vice President and Senior Counsel (until 2012) | | N/A |
| | | | |
Brian E. Langenfeld (k) (age 41) | | Assistant
Secretary and Assistant Clerk | | June 2006 | | Massachusetts Financial Services Company, Vice President and Senior Counsel | | N/A |
| | | | |
Susan S. Newton (k) (age 64) | | Assistant
Secretary and Assistant Clerk | | May 2005 | | Massachusetts Financial Services Company, Senior Vice President and Associate General Counsel | | N/A |
| | | | |
Susan A. Pereira (k) (age 44) | | Assistant
Secretary and Assistant Clerk | | July 2005 | | Massachusetts Financial Services Company, Vice President and Senior Counsel | | N/A |
| | | | |
Kasey L. Phillips (k) (age 44) | | Assistant Treasurer | | September 2012 | | Massachusetts Financial Services Company, Vice President; Wells Fargo Funds Management, LLC, Senior Vice President, Fund Treasurer (until 2012) | | N/A |
| | | | |
Mark N. Polebaum (k) (age 62) | | Secretary and
Clerk | | January 2006 | | Massachusetts Financial Services Company, Executive Vice President, General Counsel and Secretary | | N/A |
| | | | |
Matthew A. Stowe (k) (age 40) | | Assistant Secretary and Assistant Clerk | | October 2014 | | Massachusetts Financial Services Company, Vice President and Senior Counsel | | N/A |
| | | | |
Frank L. Tarantino (age 70) | | Independent
Senior Officer | | June 2004 | | Tarantino LLC (provider of compliance services), Principal | | N/A |
| | | | |
Richard S. Weitzel (k) (age 44) | | Assistant Secretary and Assistant Clerk | | October 2007 | | Massachusetts Financial Services Company, Senior Vice President and Associate General Counsel | | N/A |
| | | | |
James O. Yost (k) (age 54) | | Deputy Treasurer | | September 1990 | | Massachusetts Financial Services Company, Senior Vice President | | N/A |
| (h) | Date first appointed to serve as Trustee/officer of an MFS Fund. Each Trustee has served continuously since appointment unless indicated otherwise. For the period from December 15, 2004 until February 22, 2005, Mr. Manning served as Advisory Trustee. Prior to January 2012, Messrs. DiLorenzo and Yost served as Assistant Treasurers of the Funds. Ms. Stelmach was appointed as President of the Funds as of October 1, 2014. |
| (j) | Directorships or trusteeships of companies required to report to the Securities and Exchange Commission (i.e., “public companies”). |
| (k) | “Interested person” of the Trust within the meaning of the Investment Company Act of 1940 (referred to as the 1940 Act), which is the principal federal law governing investment companies like the fund, as a result of a position with MFS. The address of MFS is 111 Huntington Avenue, Boston, Massachusetts 02199-7618. |
Each Trustee (except Ms. Stelmach, Mr. Buller and Ms. Roepke) has been elected by shareholders and each Trustee and officer holds office until his or her successor is chosen and qualified or until his or her earlier death, resignation, retirement or removal. The Trust does not hold annual meetings for the purpose of electing Trustees, and Trustees are not elected for fixed terms. Messrs. Butler, Kavanaugh, Uek and Mses. Thomsen and Roepke are members of the Trust’s Audit Committee.
Each of the Fund’s Trustees and officers holds comparable positions with certain other funds of which MFS or a subsidiary is the investment adviser or distributor, and, in the case of the officers, with certain affiliates of MFS. As of February 1, 2015, the Trustees served as board members of 135 funds within the MFS Family of Funds.
22
MFS Value Series
Trustees and Officers – continued
The Statement of Additional Information for the Fund includes further information about the Trustees and is available without charge upon request by calling 1-800-225-2606.
| | |
Investment Adviser Massachusetts Financial Services Company 111 Huntington Avenue Boston, MA 02199-7618 | | Custodian State Street Bank and Trust Company 1 Lincoln Street Boston, MA 02111-2900 |
Distributor MFS Fund Distributors, Inc. 111 Huntington Avenue Boston, MA 02199-7618 | | Independent Registered Public Accounting Firm Deloitte & Touche LLP 200 Berkeley Street Boston, MA 02116 |
Portfolio Managers Nevin Chitkara Steven Gorham | | |
23
MFS Value Series
BOARD REVIEW OF INVESTMENT ADVISORY AGREEMENT
The Investment Company Act of 1940 requires that both the full Board of Trustees and a majority of the non-interested (“independent”) Trustees, voting separately, annually approve the continuation of the Fund’s investment advisory agreement with MFS. The Trustees consider matters bearing on the Fund and its advisory arrangements at their meetings throughout the year, including a review of performance data at each regular meeting. In addition, the independent Trustees met several times over the course of three months beginning in May and ending in July, 2014 (“contract review meetings”) for the specific purpose of considering whether to approve the continuation of the investment advisory agreement for the Fund and the other investment companies that the Board oversees (the “MFS Funds”). The independent Trustees were assisted in their evaluation of the Fund’s investment advisory agreement by independent legal counsel, from whom they received separate legal advice and with whom they met separately from MFS during various contract review meetings. The independent Trustees were also assisted in this process by the MFS Funds’ Independent Chief Compliance Officer, a full-time senior officer appointed by and reporting to the independent Trustees.
In connection with their deliberations regarding the continuation of the investment advisory agreement, the Trustees, including the independent Trustees, considered such information and factors as they believed, in light of the legal advice furnished to them and their own business judgment, to be relevant. The investment advisory agreement for the Fund was considered separately, although the Trustees also took into account the common interests of all MFS Funds in their review. As described below, the Trustees considered the nature, quality, and extent of the various investment advisory, administrative, and shareholder services performed by MFS under the existing investment advisory agreement and other arrangements with the Fund.
In connection with their contract review meetings, the Trustees received and relied upon materials that included, among other items: (i) information provided by Lipper Inc., an independent third party, on the investment performance of the Fund for various time periods ended December 31, 2013 and the investment performance of a group of funds with substantially similar investment classifications/objectives (the “Lipper performance universe”), (ii) information provided by Lipper Inc. on the Fund’s advisory fees and other expenses and the advisory fees and other expenses of comparable funds identified by Lipper Inc. (the “Lipper expense group”), (iii) information provided by MFS on the advisory fees of comparable portfolios of other clients of MFS, including institutional separate accounts and other clients, (iv) information as to whether and to what extent applicable expense waivers, reimbursements or fee “breakpoints” are observed for the Fund, (v) information regarding MFS’ financial results and financial condition, including MFS’ and certain of its affiliates’ estimated profitability from services performed for the Fund and the MFS Funds as a whole, and compared to MFS’ institutional business, (vi) MFS’ views regarding the outlook for the mutual fund industry and the strategic business plans of MFS, (vii) descriptions of various functions performed by MFS for the Funds, such as compliance monitoring and portfolio trading practices, and (viii) information regarding the overall organization of MFS, including information about MFS’ senior management and other personnel providing investment advisory, administrative and other services to the Fund and the other MFS Funds. The comparative performance, fee and expense information prepared and provided by Lipper Inc. was not independently verified and the independent Trustees did not independently verify any information provided to them by MFS.
The Trustees’ conclusion as to the continuation of the investment advisory agreement was based on a comprehensive consideration of all information provided to the Trustees and not the result of any single factor. Some of the factors that figured particularly in the Trustees’ deliberations are described below, although individual Trustees may have evaluated the information presented differently from one another, giving different weights to various factors. It is also important to recognize that the fee arrangements for the Fund and other MFS Funds are the result of years of review and discussion between the independent Trustees and MFS, that certain aspects of such arrangements may receive greater scrutiny in some years than in others, and that the Trustees’ conclusions may be based, in part, on their consideration of these same arrangements during the course of the year and in prior years.
Based on information provided by Lipper Inc. and MFS, the Trustees reviewed the Fund’s total return investment performance as well as the performance of peer groups of funds over various time periods. The Trustees placed particular emphasis on the total return performance of the Fund’s Initial Class shares in comparison to the performance of funds in its Lipper performance universe over the three-year period ended December 31, 2013, which the Trustees believed was a long enough period to reflect differing market conditions. The total return performance of the Fund’s Initial Class shares was in the 1st quintile relative to the other funds in the universe for this three-year period (the 1st quintile being the best performers and the 5th quintile being the worst performers). The total return performance of the Fund’s Initial Class shares was in the 1st quintile for the one-year period and the 3rd quintile for the five-year period ended December 31, 2013 relative to the Lipper performance universe. Because of the passage of time, these performance results may differ from the performance results for more recent periods, including those shown elsewhere in this report.
In the course of their deliberations, the Trustees took into account information provided by MFS in connection with the contract review meetings, as well as during investment review meetings conducted with portfolio management personnel during the course of the year regarding the Fund’s performance. After reviewing these and related factors, the Trustees concluded, within the context of their overall conclusions regarding the investment advisory agreement, that they were satisfied with MFS’ responses and efforts relating to investment performance.
24
MFS Value Series
Board Review of Investment Advisory Agreement – continued
In assessing the reasonableness of the Fund’s advisory fee, the Trustees considered, among other information, the Fund’s advisory fee and the total expense ratio of the Fund’s Initial Class shares as a percentage of average daily net assets and the advisory fee and total expense ratios of peer groups of funds based on information provided by Lipper Inc. The Trustees considered that MFS currently observes an expense limitation for the Fund, which may not be changed without the Trustees’ approval. The Trustees also considered that, according to the Lipper data (which takes into account any fee reductions or expense limitations that were in effect during the Fund’s last fiscal year), the Fund’s effective advisory fee rate and total expense ratio were each approximately at the Lipper expense group median.
The Trustees also considered the advisory fees charged by MFS to any comparable institutional accounts. In comparing these fees, the Trustees considered information provided by MFS as to the generally broader scope of services provided by MFS to the Fund in comparison to institutional accounts, the higher demands placed on MFS’ investment personnel and trading infrastructure as a result of the daily cash in-flows and out-flows of the Fund, and the impact on MFS and expenses associated with the more extensive regulatory regime to which the Fund is subject in comparison to institutional accounts.
The Trustees also considered whether the Fund may benefit from any economies of scale in the management of the Fund in the event of growth in assets of the Fund and/or growth in assets of the MFS Funds as a whole. They noted that the Fund’s advisory fee rate schedule is subject to a contractual breakpoint that reduces the Fund’s advisory fee rate on average daily net assets over $1 billion, and that MFS has agreed in writing to further reduce its advisory fee rate on the Fund’s average daily net assets over $2.5 billion, which may not be changed without the Trustees’ approval. The Trustees also noted that MFS has agreed in writing to waive a portion of the management fees of certain MFS Funds, including the Fund, if the total combined assets of certain funds within the MFS Funds’ complex increase above agreed upon thresholds (the “group fee waiver”), enabling the Fund’s shareholders to share in the benefits from any economies of scale at the complex level. The group fee waiver is reviewed and renewed annually between the Board and MFS. The Trustees concluded that the breakpoints and the group fee waiver were sufficient to allow the Fund to benefit from economies of scale as its assets and overall complex assets grow.
The Trustees also considered information prepared by MFS relating to MFS’ costs and profits with respect to the Fund, the MFS Funds considered as a group, and other investment companies and accounts advised by MFS, as well as MFS’ methodologies used to determine and allocate its costs to the MFS Funds, the Fund and other accounts and products for purposes of estimating profitability.
After reviewing these and other factors described herein, the Trustees concluded, within the context of their overall conclusions regarding the investment advisory agreement, that the advisory fees charged to the Fund represent reasonable compensation in light of the services being provided by MFS to the Fund.
In addition, the Trustees considered MFS’ resources and related efforts to continue to retain, attract and motivate capable personnel to serve the Fund. The Trustees also considered current and developing conditions in the financial services industry, including the presence of large and well-capitalized companies which are spending, and appear to be prepared to continue to spend, substantial sums to engage personnel and to provide services to competing investment companies. In this regard, the Trustees also considered the financial resources of MFS and its ultimate parent, Sun Life Financial Inc. The Trustees also considered the advantages and possible disadvantages to the Fund of having an adviser that also serves other investment companies as well as other accounts.
The Trustees also considered the nature, quality, cost, and extent of administrative, transfer agency, and distribution services provided to the Fund by MFS and its affiliates under agreements and plans other than the investment advisory agreement, including any 12b-1 fees the Fund pays to MFS Fund Distributors, Inc., an affiliate of MFS. The Trustees also considered the nature, extent and quality of certain other services MFS performs or arranges for on the Fund’s behalf, which may include securities lending programs, directed expense payment programs, class action recovery programs, and MFS’ interaction with third-party service providers, principally custodians and sub-custodians. The Trustees concluded that the various non-advisory services provided by MFS and its affiliates on behalf of the Fund were satisfactory.
The Trustees also considered benefits to MFS from the use of the Fund’s portfolio brokerage commissions, if applicable, to pay for investment research and various other factors. Additionally, the Trustees considered so-called “fall-out benefits” to MFS such as reputational value derived from serving as investment manager to the Fund.
Based on their evaluation of factors that they deemed to be material, including those factors described above, the Board of Trustees, including the independent Trustees, concluded that the Fund’s investment advisory agreement with MFS should be continued for an additional one-year period, commencing August 1, 2014.
25
MFS Value Series
PROXY VOTING POLICIES AND INFORMATION
MFS votes proxies on behalf of the fund pursuant to proxy voting policies and procedures that are available without charge, upon request, by calling 1-800-225-2606, by visiting the Proxy Voting section of mfs.com or by visiting the SEC’s Web site at http://www.sec.gov.
Information regarding how the fund voted proxies relating to portfolio securities during the most recent twelve-month period ended June 30 is available without charge by visiting the Proxy Voting section of mfs.com or by visiting the SEC’s Web site at http://www.sec.gov.
QUARTERLY PORTFOLIO DISCLOSURE
The fund will file a complete schedule of portfolio holdings with the Securities and Exchange Commission (the Commission) for the first and third quarters of each fiscal year on Form N-Q. The fund’s Form N-Q is available on the EDGAR database on the Commission’s Internet Web site at http://www.sec.gov, and may be reviewed and copied at the:
Public Reference Room
Securities and Exchange Commission
100 F Street, NE, Room 1580
Washington, D.C. 20549
Information on the operation of the Public Reference Room may be obtained by calling the Commission at 1-800-SEC-0330. Copies of the fund’s Form N-Q also may be obtained, upon payment of a duplicating fee, by electronic request at the following e-mail address: publicinfo@sec.gov or by writing the Public Reference Section at the above address.
FURTHER INFORMATION
From time to time, MFS may post important information about the fund or the MFS funds on the MFS web site (mfs.com). This information is available by visiting the “Market Commentary” and “Announcements” sub sections in the “Market Outlooks” section of mfs.com or by clicking on the fund’s name under “Variable Insurance Portfolios — VIT” in the “Products” section of mfs.com.
FEDERAL TAX INFORMATION (unaudited)
The following information is provided pursuant to provisions of the Internal Revenue Code.
The fund designates $37,734,000 as capital gain dividends paid during the fiscal year.
For corporate shareholders, 59% of the ordinary income dividends paid during the fiscal year qualify for the corporate dividends received deduction.
26
rev. 3/11
| | | | |
| FACTS | | WHAT DOES MFS DO WITH YOUR
PERSONAL INFORMATION? | |  |
| | |
| Why? | | Financial companies choose how they share your personal information. Federal law gives consumers the right to limit some but not all sharing. Federal law also requires us to tell you how we collect, share, and protect your personal information. Please read this notice carefully to understand what we do. |
| | |
| What? | | The types of personal information we collect and share depend on the product or service you have with us. This information can include: • Social Security number and account balances • Account transactions and transaction history • Checking account information and wire transfer instructions When you are no longer our customer, we continue to share your information as described in this notice. |
| | |
| How? | | All financial companies need to share customers’ personal information to run their everyday business. In the section below, we list the reasons financial companies can share their customers’ personal information; the reasons MFS chooses to share; and whether you can limit this sharing. |
| | | | |
Reasons we can share your
personal information | | Does MFS share? | | Can you limit this
sharing? |
For our everyday business purposes – such as to process your transactions, maintain your account(s), respond to court orders and legal investigations, or report to credit bureaus | | Yes | | No |
For our marketing purposes – to offer our products and services to you | | No | | We don’t share |
| For joint marketing with other financial companies | | No | | We don’t share |
For our affiliates’ everyday business purposes – information about your transactions and experiences | | No | | We don’t share |
For our affiliates’ everyday business purposes – information about your creditworthiness | | No | | We don’t share |
| For nonaffiliates to market to you | | No | | We don’t share |
| | |
| Questions? | | Call 800-225-2606 or go to mfs.com. |
27
| | |
| Who we are |
| Who is providing this notice? | | MFS Funds, MFS Investment Management, MFS Institutional Advisors, Inc., MFS Fund Distributors, Inc., MFS Heritage Trust Company, and MFS Service Center, Inc. |
| | |
| What we do |
| How does MFS protect my personal information? | | To protect your personal information from unauthorized access and use, we use security measures that comply with federal law. These measures include procedural, electronic, and physical safeguards for the protection of the personal information we collect about you. |
How does MFS
collect my personal information? | | We collect your personal information, for example, when you • open an account or provide account information • direct us to buy securities or direct us to sell your securities • make a wire transfer We also collect your personal information from others, such as credit bureaus, affiliates and other companies. |
| Why can’t I limit all sharing? | | Federal law gives you the right to limit only • sharing for affiliates’ everyday business purposes – information about your creditworthiness • affiliates from using your information to market to you • sharing for nonaffiliates to market to you State laws and individual companies may give you additional rights to limit sharing. |
| | |
| Definitions |
| Affiliates | | Companies related by common ownership or control. They can be financial and nonfinancial companies. •MFS does not share personal information with affiliates, except for everyday business purposes as described on page one of this notice. |
| Nonaffiliates | | Companies not related by common ownership or control. They can be financial and nonfinancial companies. •MFS does not share with nonaffiliates so they can market to you. |
| Joint Marketing | | A formal agreement between nonaffiliated financial companies that together market financial products or services to you. •MFS doesn’t jointly market. |
| | |
| Other important information |
| If you own an MFS product or receive an MFS service in the name of a third party such as a bank or broker-dealer, their privacy policy may apply to you instead of ours. |
28
The Registrant has adopted a Code of Ethics pursuant to Section 406 of the Sarbanes-Oxley Act and as defined in Form N-CSR that applies to the Registrant’s principal executive officer and principal financial and accounting officer. During the period covered by this report, the Registrant has not amended any provision in its Code of Ethics (the “Code”) that relates to an element of the Code’s definitions enumerated in paragraph (b) of Item 2 of this Form N-CSR. During the period covered by this report, the Registrant did not grant a waiver, including an implicit waiver, from any provision of the Code.
A copy of the Code of Ethics is filed as an exhibit to this Form N-CSR.
| ITEM 3. | AUDIT COMMITTEE FINANCIAL EXPERT. |
Messrs. Robert E. Butler, John P. Kavanaugh and Robert W. Uek and Mses. Maryanne L. Roepke and Laurie J. Thomsen, members of the Audit Committee, have been determined by the Board of Trustees in their reasonable business judgment to meet the definition of “audit committee financial expert” as such term is defined in Form N-CSR. In addition, Messrs. Butler, Kavanaugh and Uek and Mses. Roepke and Thomsen are “independent” members of the Audit Committee (as such term has been defined by the Securities and Exchange Commission in regulations implementing Section 407 of the Sarbanes-Oxley Act of 2002). The Securities and Exchange Commission has stated that the designation of a person as an audit committee financial expert pursuant to this Item 3 on the Form N-CSR does not impose on such a person any duties, obligations or liability that are greater than the duties, obligations or liability imposed on such person as a member of the Audit Committee and the Board of Trustees in the absence of such designation or identification.
| ITEM 4. | PRINCIPAL ACCOUNTANT FEES AND SERVICES. |
Items 4(a) through 4(d) and 4(g):
The Board of Trustees has appointed Deloitte & Touche LLP (“Deloitte”) to serve as independent accountants to each series of the Registrant (each a “Fund” and collectively the “Funds”). The tables below set forth the audit fees billed to the Funds as well as fees for non-audit services provided to the Funds and/or to the Funds’ investment adviser, Massachusetts Financial Services Company (“MFS”) and to various entities either controlling, controlled by, or under common control with MFS that provide ongoing services to the Funds (“MFS Related Entities”).
For the fiscal years ended December 31, 2014 and 2013, audit fees billed to each Fund by Deloitte were as follows:
| | | | | | | | |
| | | Audit Fees | |
| | | 2014 | | | 2013 | |
Fees billed by Deloitte: | | | | | | | | |
MFS Core Equity Series | | | 44,083 | | | | 43,541 | |
MFS Growth Series | | | 44,083 | | | | 43,541 | |
MFS Global Equity Series | | | 43,306 | | | | 42,774 | |
MFS High Income Series+ | | | N/A | | | | 0 | |
MFS Investors Growth Stock Series | | | 43,306 | | | | 42,774 | |
MFS Investors Trust Series | | | 43,306 | | | | 42,774 | |
MFS Mid Cap Growth Series | | | 43,306 | | | | 42,774 | |
MFS New Discovery Series | | | 43,306 | | | | 42,774 | |
MFS Research Bond Series | | | 61,946 | | | | 61,192 | |
MFS Research International Series | | | 43,297 | | | | 42,765 | |
MFS Research Series | | | 44,083 | | | | 43,541 | |
MFS Strategic Income Series+ | | | N/A | | | | 0 | |
MFS Total Return Series | | | 61,113 | | | | 60,369 | |
MFS Utilities Series | | | 43,306 | | | | 42,774 | |
MFS Value Series | | | 44,083 | | | | 43,541 | |
| | | | | | | | |
Total | | | 602,524 | | | | 595,134 | |
For the fiscal years ended December 31, 2014 and 2013, fees billed by Deloitte for audit-related, tax and other services provided to each Fund and for audit-related, tax and other services provided to MFS and MFS Related Entities were as follows:
| | | | | | | | | | | | | | | | | | | | | | | | |
| | | Audit-Related Fees1 | | | Tax Fees2 | | | All Other Fees3 | |
| | | 2014 | | | 2013 | | | 2014 | | | 20134 | | | 2014 | | | 2013 | |
Fees billed by Deloitte: | | | | | | | | | | | | | | | | | | | | | | | | |
To MFS Core Equity Series | | | 4,900 | | | | 2,400 | | | | 5,057 | | | | 4,997 | | | | 1,005 | | | | 1,188 | |
To MFS Growth Series | | | 2,400 | | | | 2,400 | | | | 5,057 | | | | 4,997 | | | | 1,119 | | | | 1,343 | |
To MFS Global Equity Series | | | 2,400 | | | | 2,400 | | | | 5,057 | | | | 4,997 | | | | 1,005 | | | | 1,186 | |
To MFS High Income Series+ | | | N/A | | | | 3,700 | | | | N/A | | | | 7,567 | | | | 16 | | | | 1,227 | |
To MFS Investors Growth Stock Series | | | 4,900 | | | | 2,400 | | | | 5,057 | | | | 4,997 | | | | 1,033 | | | | 1,236 | |
To MFS Investors Trust Series | | | 2,400 | | | | 2,400 | | | | 5,057 | | | | 4,997 | | | | 1,054 | | | | 1,274 | |
To MFS Mid Cap Growth Series | | | 2,400 | | | | 2,400 | | | | 5,057 | | | | 4,997 | | | | 1,039 | | | | 1,231 | |
To MFS New Discovery Series | | | 4,900 | | | | 2,400 | | | | 5,057 | | | | 4,997 | | | | 1,076 | | | | 1,309 | |
To MFS Research Bond Series | | | 2,400 | | | | 2,400 | | | | 5,057 | | | | 4,997 | | | | 1,237 | | | | 1,492 | |
To MFS Research International Series | | | 4,900 | | | | 2,400 | | | | 5,057 | | | | 4,997 | | | | 1,012 | | | | 1,200 | |
To MFS Research Series | | | 2,400 | | | | 2,400 | | | | 5,057 | | | | 4,997 | | | | 1,063 | | | | 1,263 | |
To MFS Strategic Income Series+ | | | N/A | | | | 3,700 | | | | N/A | | | | 7,997 | | | | 2 | | | | 1,183 | |
To MFS Total Return Series | | | 2,400 | | | | 4,900 | | | | 5,057 | | | | 4,997 | | | | 1,234 | | | | 1,571 | |
To MFS Utilities Series | | | 4,900 | | | | 2,400 | | | | 5,057 | | | | 4,997 | | | | 1,139 | | | | 1,400 | |
To MFS Value Series | | | 4,900 | | | | 2,400 | | | | 5,057 | | | | 4,997 | | | | 1,204 | | | | 1,475 | |
| | | | | | | | | | | | | | | | | | | | | | | | |
Total fees billed by Deloitte To above Funds: | | | 46,200 | | | | 41,100 | | | | 65,471 | | | | 80,525 | | | | 14,238 | | | | 19,578 | |
| | | | | | | | | | | | | | | | | | | | | | | | |
| | | Audit-Related Fees1 | | | Tax Fees2 | | | All Other Fees3 | |
| | | 2014 | | | 2013 | | | 2014 | | | 2013 | | | 2014 | | | 2013 | |
Fees billed by Deloitte: | | | | | | | | | | | | | | | | | | | | | | | | |
To MFS and MFS Related Entities of MFS Core Equity Series* | | | 1,686,271 | | | | 1,589,808 | | | | 0 | | | | 0 | | | | 0 | | | | 0 | |
To MFS and MFS Related Entities of MFS Growth Series* | | | 1,686,271 | | | | 1,589,808 | | | | 0 | | | | 0 | | | | 0 | | | | 0 | |
To MFS and MFS Related Entities of MFS Global Equity Series* | | | 1,686,271 | | | | 1,589,808 | | | | 0 | | | | 0 | | | | 0 | | | | 0 | |
To MFS and MFS Related Entities of MFS High Income Series+* | | | N/A | | | | 1,589,808 | | | | 0 | | | | 0 | | | | 0 | | | | 0 | |
To MFS and MFS Related Entities of MFS Investors Growth Stock Series* | | | 1,686,271 | | | | 1,589,808 | | | | 0 | | | | 0 | | | | 0 | | | | 0 | |
To MFS and MFS Related Entities of MFS Investors Trust Series* | | | 1,686,271 | | | | 1,589,808 | | | | 0 | | | | 0 | | | | 0 | | | | 0 | |
To MFS and MFS Related Entities of MFS Mid Cap Growth Series* | | | 1,686,271 | | | | 1,589,808 | | | | 0 | | | | 0 | | | | 0 | | | | 0 | |
To MFS and MFS Related Entities of MFS New Discovery Series* | | | 1,686,271 | | | | 1,589,808 | | | | 0 | | | | 0 | | | | 0 | | | | 0 | |
To MFS and MFS Related Entities of MFS Research Bond Series* | | | 1,686,271 | | | | 1,589,808 | | | | 0 | | | | 0 | | | | 0 | | | | 0 | |
To MFS and MFS Related Entities of MFS Research International Series* | | | 1,686,271 | | | | 1,589,808 | | | | 0 | | | | 0 | | | | 0 | | | | 0 | |
To MFS and MFS Related Entities of MFS Research Series* | | | 1,686,271 | | | | 1,589,808 | | | | 0 | | | | 0 | | | | 0 | | | | 0 | |
To MFS and MFS Related Entities of MFS Strategic Income Series+* | | | N/A | | | | 1,589,808 | | | | 0 | | | | 0 | | | | 0 | | | | 0 | |
To MFS and MFS Related Entities of MFS Total Return Series* | | | 1,686,271 | | | | 1,589,808 | | | | 0 | | | | 0 | | | | 0 | | | | 0 | |
To MFS and MFS Related Entities of MFS Utilities Series* | | | 1,686,271 | | | | 1,589,808 | | | | 0 | | | | 0 | | | | 0 | | | | 0 | |
To MFS and MFS Related Entities of MFS Value Series* | | | 1,686,271 | | | | 1,589,808 | | | | 0 | | | | 0 | | | | 0 | | | | 0 | |
| | | | | | | | |
| | | Aggregate fees for non-audit
services: | |
| | | 2014 | | | 2013 | |
Fees billed by Deloitte: | | | | | | | | |
To MFS Core Equity Series, MFS and MFS Related Entities# | | | 1,700,571 | | | | 1,613,213 | |
To MFS Growth Series, MFS and MFS Related Entities# | | | 1,698,185 | | | | 1,613,368 | |
To MFS Global Equity Series, MFS and MFS Related Entities# | | | 1,698,071 | | | | 1,613,211 | |
To MFS High Income Series, MFS and MFS Related Entities+# | | | N/A | | | | 1,617,122 | |
To MFS Investors Growth Stock Series, MFS and MFS Related Entities# | | | 1,700,599 | | | | 1,613,261 | |
To MFS Investors Trust Series, MFS and MFS Related Entities# | | | 1,698,120 | | | | 1,613,299 | |
To MFS Mid Cap Growth Series, MFS and MFS Related Entities# | | | 1,698,105 | | | | 1,613,256 | |
To MFS New Discovery Series, MFS and MFS Related Entities# | | | 1,700,642 | | | | 1,613,334 | |
To MFS Research Bond Series, MFS and MFS Related Entities# | | | 1,698,303 | | | | 1,613,517 | |
To MFS Research International Series, MFS and MFS Related Entities# | | | 1,700,578 | | | | 1,613,225 | |
To MFS Research Series, MFS and MFS Related Entities# | | | 1,698,129 | | | | 1,613,288 | |
To MFS Strategic Income Series, MFS and MFS Related Entities+# | | | N/A | | | | 1,617,508 | |
To MFS Total Return Series, MFS and MFS Related Entities# | | | 1,698,300 | | | | 1,616,096 | |
To MFS Utilities Series, MFS and MFS Related Entities# | | | 1,700,705 | | | | 1,613,425 | |
To MFS Value Series, MFS and MFS Related Entities# | | | 1,700,770 | | | | 1,613,500 | |
| + | MFS High Income Series and MFS Strategic Income Series were reorganized into the MFS High Yield Portfolio and MFS Strategic Income Portfolio, respectively, each a series of MFS Variable Insurance Trust II, as of August 16, 2013. Effective September 11, 2013, MFS High Income Series and MFS Strategic Income Series were each terminated as a series of the Registrant. |
| * | This amount reflects the fees billed to MFS and MFS Related Entities for non-audit services relating directly to the operations and financial reporting of the Funds (portions of which services also related to the operations and financial reporting of other funds within the MFS Funds complex). |
| # | This amount reflects the aggregate fees billed by Deloitte for non-audit services rendered to the Funds and for non-audit services rendered to MFS and the MFS Related Entities. |
| 1 | The fees included under “Audit-Related Fees” are fees related to assurance and related services that are reasonably related to the performance of the audit or review of financial statements, but not reported under ‘‘Audit Fees,’’ including accounting consultations, agreed-upon procedure reports, attestation reports, comfort letters and internal control reviews. |
| 2 | The fees included under “Tax Fees” are fees associated with tax compliance, tax advice and tax planning, including services relating to the filing or amendment of federal, state or local income tax returns, regulated investment company qualification reviews and tax distribution and analysis. |
| 3 | The fees included under “All Other Fees” are fees for products and services provided by Deloitte other than those reported under “Audit Fees,” “Audit-Related Fees” and “Tax Fees,” including fees for services related to review of internal controls and review of Rule 38a-1 compliance program. |
Item 4(e)(1):
Set forth below are the policies and procedures established by the Audit Committee of the Board of Trustees relating to the pre-approval of audit and non-audit related services:
To the extent required by applicable law, pre-approval by the Audit Committee of the Board is needed for all audit and permissible non-audit services rendered to the Funds and all permissible non-audit services rendered to MFS or MFS Related Entities if the services relate directly to the operations and financial reporting of the Registrant. Pre-approval is currently on an engagement-by-engagement basis. In the event pre-approval of such services is necessary between regular meetings of the Audit Committee and it is not practical to wait to seek pre-approval at the next regular meeting of the Audit Committee, pre-approval of such services may be referred to the Chair of the Audit Committee for approval; provided that the Chair may not pre-approve any individual engagement for such services exceeding $50,000 or multiple engagements for such services in the aggregate exceeding $100,000 in each period between regular meetings of the Audit Committee. Any engagement pre-approved by the Chair between regular meetings of the Audit Committee shall be presented for ratification by the entire Audit Committee at its next regularly scheduled meeting.
Item 4(e)(2):
None, or 0%, of the services relating to the Audit-Related Fees, Tax Fees and All Other Fees paid by the Fund and MFS and MFS Related Entities relating directly to the operations and financial reporting of the Registrant disclosed above were approved by the audit committee pursuant to paragraphs (c)(7)(i)(C) of Rule 2-01 of Regulation S-X (which permits audit committee approval after the start of the engagement with respect to services other than audit, review or attest services, if certain conditions are satisfied).
Item 4(f): Not applicable.
Item 4(h): The Registrant’s Audit Committee has considered whether the provision by a Registrant’s independent registered public accounting firm of non-audit services to MFS and MFS Related Entities that were not pre-approved by the Committee (because such services did not relate directly to the operations and financial reporting of the Registrant) was compatible with maintaining the independence of the independent registered public accounting firm as the Registrant’s principal auditors.
| ITEM 5. | AUDIT COMMITTEE OF LISTED REGISTRANTS. |
Not applicable to the Registrant.
A schedule of investments of the Registrant is included as part of the report to shareholders of such series under Item 1 of this Form N-CSR.
| ITEM 7. | DISCLOSURE OF PROXY VOTING POLICIES AND PROCEDURES FOR CLOSED-END MANAGEMENT INVESTMENT COMPANIES. |
Not applicable to the Registrant.
| ITEM 8. | PORTFOLIO MANAGERS OF CLOSED-END MANAGEMENT INVESTMENT COMPANIES. |
Not applicable to the Registrant.
| ITEM 9. | PURCHASES OF EQUITY SECURITIES BY CLOSED-END MANAGEMENT INVESTMENT COMPANY AND AFFILIATED PURCHASERS. |
Not applicable to the Registrant.
| ITEM 10. | SUBMISSION OF MATTERS TO A VOTE OF SECURITY HOLDERS. |
There were no material changes to the procedures by which shareholders may send recommendations to the Board for nominees to the Registrant’s Board since the Registrant last provided disclosure as to such procedures in response to the requirements of Item 407 (c)(2)(iv) of Regulation S-K or this Item.
| ITEM 11. | CONTROLS AND PROCEDURES. |
| (a) | Based upon their evaluation of the effectiveness of the registrant’s disclosure controls and procedures (as defined in Rule 30a-3(c) under the Investment Company Act of 1940 (the “Act”)) as conducted within 90 days of the filing date of this report on Form N-CSR, the registrant’s principal financial officer and principal executive officer have concluded that those disclosure controls and procedures provide reasonable assurance that the material information required to be disclosed by the registrant on this report is recorded, processed, summarized and reported within the time periods specified in the Securities and Exchange Commission’s rules and forms. |
| (b) | There were no changes in the registrant’s internal controls over financial reporting (as defined in Rule 30a-3(d) under the Act) that occurred during the second fiscal quarter of the period covered by the report that have materially affected, or are reasonably likely to materially affect, the registrant’s internal control over financial reporting. |
| (a) | File the exhibits listed below as part of this form. Letter or number the exhibits in the sequence indicated. |
| | (1) | Any code of ethics, or amendment thereto, that is the subject of the disclosure required by Item 2, to the extent that the registrant intends to satisfy the Item 2 requirements through filing of an exhibit: Code of Ethics attached hereto. |
| | (2) | A separate certification for each principal executive officer and principal financial officer of the registrant as required by Rule 30a-2(a) under the Act (17 CFR 270.30a-2): Attached hereto. |
| (b) | If the report is filed under Section 13(a) or 15(d) of the Exchange Act, provide the certifications required by Rule 30a-2(b) under the Act (17 CFR 270.30a-2(b)), Rule 13a-14(b) or Rule 15d-14(b) under the Exchange Act (17 CFR 240.13a-14(b) or 240.15d-14(b)) and Section 1350 of Chapter 63 of Title 18 of the United States Code (18 U.S.C. 1350) as an exhibit. A certification furnished pursuant to this paragraph will not be deemed “filed” for the purposes of Section 18 of the Exchange Act (15 U.S.C. 78r), or otherwise subject to the liability of that section. Such certification will not be deemed to be incorporated by reference into any filing under the Securities Act of 1933 or the Exchange Act, except to the extent that the registrant specifically incorporates it by reference: Attached hereto. |
Notice
A copy of the Amended and Restated Declaration of Trust, as amended, of the Registrant is on file with the Secretary of State of The Commonwealth of Massachusetts and notice is hereby given that this instrument is executed on behalf of the Registrant by an officer of the Registrant as an officer and not individually and the obligations of or arising out of this instrument are not binding upon any of the Trustees or shareholders individually, but are binding only upon the assets and property of the respective constituent series of the Registrant.
SIGNATURES
Pursuant to the requirements of the Securities Exchange Act of 1934 and the Investment Company Act of 1940, the registrant has duly caused this report to be signed on its behalf by the undersigned, thereunto duly authorized.
(Registrant) MFS VARIABLE INSURANCE TRUST
| | |
| By (Signature and Title)* | | ROBIN A. STELMACH |
| | Robin A. Stelmach, President |
Date: February 13, 2015
Pursuant to the requirements of the Securities Exchange Act of 1934 and the Investment Company Act of 1940, this report has been signed below by the following persons on behalf of the registrant and in the capacities and on the dates indicated.
| | |
| By (Signature and Title)* | | ROBIN A. STELMACH |
| | Robin A. Stelmach, President (Principal Executive Officer) |
Date: February 13, 2015
| | |
| By (Signature and Title)* | | DAVID L. DILORENZO |
| | David L. DiLorenzo, Treasurer (Principal Financial Officer and Accounting Officer) |
Date: February 13, 2015
| * | Print name and title of each signing officer under his or her signature. |