UNITED STATES
SECURITIES AND EXCHANGE COMMISSION
Washington, D.C. 20549
FORM N-CSR
CERTIFIED SHAREHOLDER REPORT OF
REGISTERED MANAGEMENT INVESTMENT COMPANIES
Investment Company Act file number 811-08326
MFS VARIABLE INSURANCE TRUST
(Exact name of registrant as specified in charter)
111 Huntington Avenue, Boston, Massachusetts 02199
(Address of principal executive offices) (Zip code)
Kristin V. Collins
Massachusetts Financial Services Company
111 Huntington Avenue
Boston, Massachusetts 02199
(Name and address of agents for service)
Registrant’s telephone number, including area code: (617) 954-5000
Date of fiscal year end: December 31
Date of reporting period: December 31, 2015*
| * | Effective March 27, 2015, MFS Core Equity Series, a series of the Registrant, was reorganized into MFS Core Equity Portfolio, a series of MFS Variable Insurance Trust II; MFS Investors Growth Stock Series, a series of the Registrant, was reorganized into MFS Massachusetts Investors Growth Stock Portfolio, a series of MFS Variable Insurance Trust II; and MFS Research International Series, a series of the Registrant, was reorganized into MFS Research International Portfolio, a series of MFS Variable Insurance Trust II. Effective June 19, 2015, MFS Core Equity Series was terminated as a series of the Registrant, and effective April 27, 2015, MFS Research International Series and MFS Investors Growth Stock Series were each terminated as series of the Registrant. Effective April 30, 2015, the series of the Registrant designated as MFS Research Bond Series was redesignated as MFS Total Return Bond Series. |
| ITEM 1. | REPORTS TO STOCKHOLDERS. |
ANNUAL REPORT
December 31, 2015

MFS® GLOBAL EQUITY SERIES
MFS® Variable Insurance Trust

VGE-ANN
MFS® GLOBAL EQUITY SERIES
CONTENTS
The report is prepared for the general information of contract owners. It is authorized for distribution to prospective investors only when preceded or accompanied by a current prospectus.
NOT FDIC INSURED • MAY LOSE VALUE • NO BANK OR CREDIT UNION GUARANTEE • NOT A DEPOSIT • NOT INSURED BY ANY FEDERAL GOVERNMENT AGENCY OR NCUA/NCUSIF
MFS Global Equity Series
LETTER FROM THE CHAIRMAN

Dear Contract Owners:
Central bank policies remain center stage as the U.S. Federal Reserve made good on its pledge to raise policy rates for the first time in over nine years at its December meeting. The Fed’s actions stand in stark contrast to those of the European Central Bank and Bank of Japan, which modestly extended their quantitative easing programs in December.
In the United States, auto sales remain a source of economic strength, but housing demand has slowed of late. The U.S. economic expansion remains moderate but uneven, with a strong dollar crimping demand for U.S. goods abroad. China’s shift to a consumer-led economy continues to weigh on its manufacturing and exports, as does weak global demand. Slackening demand from China continues to undermine commodity markets, with oil particularly impacted amid a global supply glut.
As markets have become more focused on short-term trends in recent years, we believe it’s important for investors to lengthen their investment time horizon. At MFS®, we don’t trade on headlines or trends; we invest for the long term.
We believe that this approach, coupled with the professional guidance of a financial advisor, will help you reach your investment goals.
Respectfully,

Robert J. Manning
Chairman
MFS Investment Management
February 16, 2016
The opinions expressed in this letter are subject to change and may not be relied upon for investment advice. No forecasts can be guaranteed.
1
MFS Global Equity Series
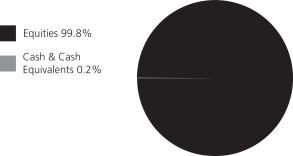
PORTFOLIO COMPOSITION
Portfolio structure
| | | | |
| Top ten holdings | | | | |
| Thermo Fisher Scientific, Inc. | | | 2.8% | |
| Nestle S.A. | | | 2.7% | |
| Honeywell International, Inc. | | | 2.6% | |
| Accenture PLC, “A” | | | 2.5% | |
| Walt Disney Co. | | | 2.5% | |
| Reckitt Benckiser Group PLC | | | 2.5% | |
| Time Warner, Inc. | | | 2.3% | |
| Visa, Inc., “A” | | | 2.2% | |
| Bayer AG | | | 2.1% | |
| State Street Corp. | | | 2.1% | |
| |
| Equity sectors | | | | |
| Consumer Staples | | | 18.3% | |
| Health Care | | | 17.1% | |
| Financial Services | | | 15.1% | |
| Leisure | | | 11.0% | |
| Industrial Goods & Services | | | 8.4% | |
| Basic Materials | | | 6.4% | |
| Retailing | | | 5.9% | |
| Special Products & Services | | | 5.7% | |
| Technology | | | 5.4% | |
| Transportation | | | 4.1% | |
| Energy | | | 1.5% | |
| Autos & Housing | | | 0.9% | |
| | | | |
| Issuer country weightings (x) | | | | |
| United States | | | 55.9% | |
| United Kingdom | | | 10.1% | |
| Switzerland | | | 8.6% | |
| France | | | 7.5% | |
| Germany | | | 6.1% | |
| Netherlands | | | 2.3% | |
| Canada | | | 1.7% | |
| Sweden | | | 1.7% | |
| Japan | | | 1.5% | |
| Other Countries | | | 4.6% | |
| |
| Currency exposure weightings (y) | | | | |
| United States Dollar | | | 58.2% | |
| Euro | | | 16.8% | |
| British Pound Sterling | | | 10.1% | |
| Swiss Franc | | | 8.6% | |
| Swedish Krona | | | 1.7% | |
| Japanese Yen | | | 1.5% | |
| Danish Krone | | | 0.9% | |
| Brazilian Real | | | 0.7% | |
| South Korean Won | | | 0.6% | |
| Other Currencies | | | 0.9% | |
| (x) | Represents the portfolio’s exposure to issuer countries as a percentage of a portfolio’s net assets. For purposes of this presentation, United States includes Cash & Cash Equivalents. |
| (y) | Represents the portfolio’s exposure to a particular currency as a percentage of a portfolio’s net assets. For purposes of this presentation, United States Dollar includes Cash & Cash Equivalents. |
Cash & Cash Equivalents includes any cash, investments in money market funds, short-term securities, and other assets less liabilities. Please see the Statement of Assets and Liabilities for additional information related to the fund’s cash position and other assets and liabilities.
Percentages are based on net assets as of 12/31/15.
The portfolio is actively managed and current holdings may be different.
2
MFS Global Equity Series
MANAGEMENT REVIEW
Summary of Results
For the twelve months ended December 31, 2015, Initial Class shares of the MFS Global Equity Series (“fund”) provided a total return of –1.41%, while Service Class shares of the fund provided a total return of –1.67%. These compare with a return of –0.32% over the same period for the fund’s benchmark, the MSCI World Index.
Market Environment
Sluggish global growth weighed on both developed and emerging market (“EM”) economies during the reporting period. EM economies have been particularly lackluster. While the US Federal Reserve began its anticipated monetary policy tightening cycle at the end of the period, other large developed economies continued to embrace accommodative monetary policies, particularly the European Central Bank and the Bank of Japan. Focus remained on China after policy missteps by the Chinese government roiled global markets over the summer, beginning with the uncoordinated response to the stock market’s boom and bust and then the confusing decision to devalue the renminbi in August. China subsequently ramped up a wide range of monetary and fiscal measures to stimulate the economy and bolster sentiment. Its economy appeared to stabilize late in the period. Also at the end of the period, the Chinese renminbi was granted reserve currency status by the International Monetary Fund (“IMF”), which announced its inclusion in the IMF’s Special Drawing Rights currency basket effective October 1, 2016.
During the second half of the reporting period, the US faced an earnings recession caused primarily by the sharp decline in the prices of oil and other commodities. Earnings contractions were concentrated primarily in the energy, materials and industrial sectors. An additional headwind for earnings was the sharp rise in the US dollar over the period. Exports were crimped by the dollar’s strength and falling demand in emerging markets. Consumer spending held up well during the second half of the period amid a modest increase in real wages and a tailwind from falling gasoline prices. Demand for autos reached near-record territory late in the period. In emerging markets, two key factors weighed on economies and asset prices: 1) weaker Chinese growth, which drove the decline in commodity prices and 2) prospects for higher US interest rates. Structural factors like floating exchange rates and fiscal buffers partially offset these cyclical headwinds.
Detractors from Performance
Stock selection in the retailing sector detracted from performance relative to the MSCI World Index. Within this sector, not holding internet retailer Amazon.com held back relative results. The stock outperformed the benchmark during the reporting period as investors reacted favorably to strong earnings results led by the cloud computing division and healthy online sales trends.
Security selection in the transportation sector also weighed on relative performance. An overweight position in railroad company Canadian National Railway (Canada) hindered relative returns as shares lagged the index as concerns regarding the company’s weaker carload volumes for coal, metals and crude appeared to have weighed on the stock.
Elsewhere, the portfolio’s overweight positions in media firm Time Warner, investment management firm Franklin Resources, financial services company American Express, custody bank State Street, industrial gas supplier Linde (Germany), enterprise software products maker Oracle and building systems and aerospace products and services provider United Technologies weakened relative results. Not holding shares of internet search company Alphabet (formerly Google) also hurt relative performance.
During the reporting period, the fund’s relative currency exposure, resulting primarily from differences between the fund’s and the benchmark’s exposures to holdings of securities denominated in foreign currencies, was a detractor from relative performance. All of MFS’ investment decisions are driven by the fundamentals of each individual opportunity and as such, it is common for our funds to have different currency exposure than the benchmark.
Contributors to Performance
A combination of the fund’s overweight position and security selection in the consumer staples sector benefited relative results. Within this sector, overweight positions in Swedish paper manufacturer and consumer goods company Svenska Cellulosa, household products manufacturer Reckitt Benckiser (United Kingdom), brewer Heineken (Netherlands) and food manufacturing company Kellogg all boosted relative returns. Investors appeared to have reacted favorably to strategic acquisitions, strong organic sales and an improvement in margins which drove shares of Svenska Cellulosa to outpace the benchmark during the reporting period.
An underweight position in the energy sector and avoiding the utilities & communications sector further aided relative performance. However, there were no individual stocks within either sector that were among the fund’s largest relative contributors during the period.
3
MFS Global Equity Series
Management Review – continued
Stocks in other sectors that bolstered relative performance included overweight positions in management consulting firm Accenture, media conglomerate Walt Disney, global payments technology company Visa, life sciences supply company Thermo Fisher Scientific, automotive replacement parts distributor AutoZone and video, high-speed data and voice services provider Time Warner Cable.
Respectfully,
| | |
| David Mannheim | | Roger Morley |
| Portfolio Manager | | Portfolio Manager |
The views expressed in this report are those of the portfolio managers only through the end of the period of the report as stated on the cover and do not necessarily reflect the views of MFS or any other person in the MFS organization. These views are subject to change at any time based on market or other conditions, and MFS disclaims any responsibility to update such views. These views may not be relied upon as investment advice or an indication of trading intent on behalf of any MFS portfolio. References to specific securities are not recommendations of such securities, and may not be representative of any MFS portfolio’s current or future investments.
4
MFS Global Equity Series
PERFORMANCE SUMMARY THROUGH 12/31/15
The following chart illustrates the historical performance of the fund in comparison to its benchmark(s). Benchmarks are unmanaged and may not be invested in directly. Benchmark returns do not reflect any fees or expenses. The performance of other share classes will be greater than or less than that of the class depicted below. (See Notes to Performance Summary.)
Performance data shown represents past performance and is no guarantee of future results. Investment return and principal value fluctuate so your units, when sold, may be worth more or less than the original cost; current performance may be lower or higher than quoted. The performance shown does not reflect the deduction of taxes, if any, that a contract holder would pay on fund distributions or the redemption of contract units. The returns for the fund shown also do not reflect the deduction of expenses associated with variable products, such as mortality and expense risk charges, separate account charges, and sales charges imposed by the insurance company separate accounts. Such expenses would reduce the overall returns shown.
Growth of a Hypothetical $10,000 Investment

Total Returns through 12/31/15
Average annual total returns
| | | | | | | | | | | | |
| | | Share Class | | Class Inception Date | | 1-yr | | 5-yr | | 10-yr | | |
| | | Initial Class | | 5/03/99 | | (1.41)% | | 9.08% | | 7.50% | | |
| | | Service Class | | 5/01/00 | | (1.67)% | | 8.82% | | 7.23% | | |
| | | | |
| Comparative benchmark | | | | | | | | |
| | | MSCI World Index (f) | | (0.32)% | | 8.19% | | 5.56% | | |
| (f) | Source: FactSet Research Systems Inc. |
Benchmark Definition
MSCI World Index – a market capitalization-weighted index that is designed to measure equity market performance in the global developed markets.
It is not possible to invest directly in an index.
Notes to Performance Summary
Average annual total return represents the average annual change in value for each share class for the periods presented.
Performance results reflect any applicable expense subsidies and waivers in effect during the periods shown. Without such subsidies and waivers the fund’s performance results would be less favorable. Please see the prospectus and financial statements for complete details. All results are historical and assume the reinvestment of any dividends and capital gains distributions.
Performance results do not include adjustments made for financial reporting purposes in accordance with U.S. generally accepted accounting principles and may differ from amounts reported in the financial highlights.
From time to time the fund may receive proceeds from litigation settlements, without which performance would be lower.
5
MFS Global Equity Series
EXPENSE TABLE
Fund Expenses Borne by the Contract Holders during the Period,
July 1, 2015 through December 31, 2015
As a contract holder of the fund, you incur ongoing costs, including management fees; distribution and/or service (12b-1) fees; and other fund expenses. This example is intended to help you understand your ongoing costs (in dollars) of investing in the fund and to compare these costs with the ongoing costs of investing in other mutual funds.
The example is based on an investment of $1,000 invested at the beginning of the period and held for the entire period July 1, 2015 through December 31, 2015.
Actual Expenses
The first line for each share class in the following table provides information about actual account values and actual expenses. You may use the information in this line, together with the amount you invested, to estimate the expenses that you paid over the period. Simply divide your account value by $1,000 (for example, an $8,600 account value divided by $1,000 = 8.6), then multiply the result by the number in the first line under the heading entitled “Expenses Paid During Period” to estimate the expenses you paid on your account during this period.
Hypothetical Example for Comparison Purposes
The second line for each share class in the following table provides information about hypothetical account values and hypothetical expenses based on the fund’s actual expense ratio and an assumed rate of return of 5% per year before expenses, which is not the fund’s actual return. The hypothetical account values and expenses may not be used to estimate the actual ending account balance or expenses you paid for the period. You may use this information to compare the ongoing costs of investing in the fund and other funds. To do so, compare this 5% hypothetical example with the 5% hypothetical examples that appear in the shareholder reports of the other funds.
Please note that the expenses shown in the table are meant to highlight the fund’s ongoing costs only and do not take into account the fees and expenses imposed under the variable contracts through which your investment in the fund is made. Therefore, the second line for each share class in the table is useful in comparing ongoing costs associated with an investment in vehicles (such as the fund) which fund benefits under variable annuity and variable life insurance contracts and to qualified pension and retirement plans only, and will not help you determine the relative total costs of investing in the fund through variable annuity and variable life insurance contracts. If the fees and expenses imposed under the variable contracts were included, your costs would have been higher.
| | | | | | | | | | | | | | | | | | |
| Share Class | | | | Annualized
Expense Ratio | | | Beginning
Account Value
7/01/15 | | | Ending Account Value
12/31/15 | | | Expenses Paid
During Period (p)
7/01/15-12/31/15 | |
| Initial Class | | Actual | | | 1.00% | | | | $1,000.00 | | | | $958.95 | | | | $4.94 | |
| | Hypothetical (h) | | | 1.00% | | | | $1,000.00 | | | | $1,020.16 | | | | $5.09 | |
| Service Class | | Actual | | | 1.25% | | | | $1,000.00 | | | | $957.74 | | | | $6.17 | |
| | Hypothetical (h) | | | 1.25% | | | | $1,000.00 | | | | $1,018.90 | | | | $6.36 | |
| (h) | 5% class return per year before expenses. |
| (p) | “Expenses Paid During Period” are equal to each class’s annualized expense ratio, as shown above, multiplied by the average account value over the period, multiplied by 184/365 (to reflect the one-half year period). |
6
MFS Global Equity Series
PORTFOLIO OF INVESTMENTS – 12/31/15
The Portfolio of Investments is a complete list of all securities owned by your fund. It is categorized by broad-based asset classes.
| | | | | | | | |
| Issuer | | Shares/Par | | | Value ($) | |
| | | | | | | | |
| COMMON STOCKS – 99.8% | | | | | | | | |
| Aerospace – 4.8% | | | | | | | | |
| Honeywell International, Inc. | | | 13,243 | | | $ | 1,371,578 | |
| MTU Aero Engines Holding AG | | | 4,024 | | | | 392,260 | |
| United Technologies Corp. | | | 8,192 | | | | 787,005 | |
| | | | | | | | |
| | | $ | 2,550,843 | |
| | | | | | | | |
| Airlines – 0.4% | | | | | | | | |
| Aena S.A. (a) | | | 1,787 | | | $ | 203,598 | |
| | | | | | | | |
| Alcoholic Beverages – 5.9% | | | | | | | | |
| AmBev S.A. | | | 49,468 | | | $ | 221,505 | |
| Carlsberg A.S., “B” | | | 5,325 | | | | 470,810 | |
| Diageo PLC | | | 38,760 | | | | 1,057,004 | |
| Heineken N.V. | | | 6,678 | | | | 569,957 | |
| Pernod Ricard S.A. | | | 7,036 | | | | 799,930 | |
| | | | | | | | |
| | | $ | 3,119,206 | |
| | | | | | | | |
| Apparel Manufacturers – 3.2% | | | | | | | | |
| Burberry Group PLC | | | 17,252 | | | $ | 303,923 | |
| Compagnie Financiere Richemont S.A. | | | 6,828 | | | | 490,478 | |
| LVMH Moet Hennessy Louis Vuitton S.A. | | | 5,711 | | | | 892,782 | |
| | | | | | | | |
| | | $ | 1,687,183 | |
| | | | | | | | |
| Automotive – 0.9% | | | | | | | | |
| Delphi Automotive PLC | | | 4,901 | | | $ | 420,163 | |
| Harley-Davidson, Inc. | | | 1,710 | | | | 77,617 | |
| | | | | | | | |
| | | $ | 497,780 | |
| | | | | | | | |
| Broadcasting – 7.6% | | | | | | | | |
| Omnicom Group, Inc. | | | 7,129 | | | $ | 539,380 | |
| Time Warner, Inc. | | | 19,153 | | | | 1,238,625 | |
| Viacom, Inc., “B” | | | 2,408 | | | | 99,113 | |
| Walt Disney Co. | | | 12,511 | | | | 1,314,656 | |
| WPP PLC | | | 36,303 | | | | 835,612 | |
| | | | | | | | |
| | | $ | 4,027,386 | |
| | | | | | | | |
| Brokerage & Asset Managers – 1.5% | | | | | | | | |
| Deutsche Boerse AG | | | 3,453 | | | $ | 305,420 | |
| Franklin Resources, Inc. | | | 13,671 | | | | 503,366 | |
| | | | | | | | |
| | | $ | 808,786 | |
| | | | | | | | |
| Business Services – 5.7% | | | | | | | | |
| Accenture PLC, “A” | | | 12,727 | | | $ | 1,329,972 | |
| Adecco S.A. | | | 6,643 | | | | 456,972 | |
| Brenntag AG | | | 4,197 | | | | 219,051 | |
| Compass Group PLC | | | 39,105 | | | | 677,371 | |
| NOW, Inc. (a)(l) | | | 3,150 | | | | 49,833 | |
| PayPal Holdings, Inc. (a) | | | 7,272 | | | | 263,246 | |
| | | | | | | | |
| | | $ | 2,996,445 | |
| | | | | | | | |
| Cable TV – 2.2% | | | | | | | | |
| British Sky Broadcasting Group PLC | | | 32,857 | | | $ | 537,571 | |
| Time Warner Cable, Inc. | | | 3,256 | | | | 604,281 | |
| | | | | | | | |
| | | $ | 1,141,852 | |
| | | | | | | | |
| | | | | | | | |
| Issuer | | Shares/Par | | | Value ($) | |
| | | | | | | | |
| COMMON STOCKS – continued | |
| Chemicals – 2.5% | | | | | | | | |
| 3M Co. | | | 5,763 | | | $ | 868,138 | |
| Monsanto Co. | | | 4,861 | | | | 478,906 | |
| | | | | | | | |
| | | $ | 1,347,044 | |
| | | | | | | | |
| Computer Software – 2.2% | | | | | | | | |
| Check Point Software Technologies Ltd. (a) | | | 3,268 | | | $ | 265,950 | |
| Oracle Corp. | | | 24,405 | | | | 891,515 | |
| | | | | | | | |
| | | $ | 1,157,465 | |
| | | | | | | | |
| Consumer Products – 6.3% | | | | | | | | |
| Colgate-Palmolive Co. | | | 10,633 | | | $ | 708,370 | |
| International Flavors & Fragrances, Inc. | | | 3,683 | | | | 440,634 | |
| Reckitt Benckiser Group PLC | | | 14,081 | | | | 1,296,141 | |
| Svenska Cellulosa Aktiebolaget | | | 30,276 | | | | 879,243 | |
| | | | | | | | |
| | | $ | 3,324,388 | |
| | | | | | | | |
| Electrical Equipment – 3.6% | | | | | | | | |
| Amphenol Corp., “A” | | | 6,996 | | | $ | 365,401 | |
| Legrand S.A. | | | 8,545 | | | | 482,287 | |
| Rockwell Automation, Inc. | | | 1,178 | | | | 120,875 | |
| Schneider Electric S.A. | | | 9,497 | | | | 540,720 | |
| W.W. Grainger, Inc. | | | 1,916 | | | | 388,162 | |
| | | | | | | | |
| | | $ | 1,897,445 | |
| | | | | | | | |
| Electronics – 2.0% | | | | | | | | |
| Hoya Corp. | | | 9,400 | | | $ | 383,226 | |
| Microchip Technology, Inc. | | | 8,092 | | | | 376,602 | |
| Samsung Electronics Co. Ltd. | | | 291 | | | | 310,739 | |
| | | | | | | | |
| | | $ | 1,070,567 | |
| | | | | | | | |
| Energy – Independent – 0.3% | | | | | | | | |
| INPEX Corp. | | | 18,000 | | | $ | 177,537 | |
| | | | | | | | |
| Food & Beverages – 6.1% | | | | | | | | |
| Danone S.A. | | | 13,608 | | | $ | 918,368 | |
| Kellogg Co. | | | 12,402 | | | | 896,293 | |
| Nestle S.A. | | | 18,961 | | | | 1,405,459 | |
| | | | | | | | |
| | | $ | 3,220,120 | |
| | | | | | | | |
| Food & Drug Stores – 0.4% | | | | | | | | |
| Lawson, Inc. | | | 2,600 | | | $ | 210,852 | |
| | | | | | | | |
| Gaming & Lodging – 0.7% | | | | | | | | |
| Sands China Ltd. | | | 27,600 | | | $ | 93,350 | |
| William Hill PLC | | | 29,875 | | | | 174,405 | |
| Wynn Resorts Ltd. (l) | | | 1,135 | | | | 78,531 | |
| | | | | | | | |
| | | $ | 346,286 | |
| | | | | | | | |
| Insurance – 0.4% | | | | | | | | |
| Swiss Re Ltd. | | | 2,332 | | | $ | 226,853 | |
| | | | | | | | |
| Internet – 0.5% | | | | | | | | |
| eBay, Inc. (a) | | | 9,422 | | | $ | 258,917 | |
| | | | | | | | |
7
MFS Global Equity Series
Portfolio of Investments – continued
| | | | | | | | |
| Issuer | | Shares/Par | | | Value ($) | |
| | | | | | | | |
| COMMON STOCKS – continued | |
| Major Banks – 5.6% | | | | | | | | |
| Bank of New York Mellon Corp. | | | 23,331 | | | $ | 961,704 | |
| Goldman Sachs Group, Inc. | | | 3,485 | | | | 628,102 | |
| Standard Chartered PLC | | | 33,849 | | | | 281,287 | |
| State Street Corp. | | | 16,434 | | | | 1,090,560 | |
| | | | | | | | |
| | | $ | 2,961,653 | |
| | | | | | | | |
| Medical Equipment – 12.3% | | | | | | | | |
| Cooper Cos., Inc. | | | 3,010 | | | $ | 403,942 | |
| DENTSPLY International, Inc. | | | 5,855 | | | | 356,277 | |
| Medtronic PLC | | | 12,492 | | | | 960,885 | |
| Sonova Holding AG | | | 2,382 | | | | 302,744 | |
| St. Jude Medical, Inc. | | | 13,058 | | | | 806,593 | |
| Stryker Corp. | | | 8,628 | | | | 801,886 | |
| Thermo Fisher Scientific, Inc. | | | 10,556 | | | | 1,497,369 | |
| Waters Corp. (a) | | | 4,250 | | | | 571,965 | |
| Zimmer Biomet Holdings, Inc. | | | 7,942 | | | | 814,770 | |
| | | | | | | | |
| | | $ | 6,516,431 | |
| | | | | | | | |
| Network & Telecom – 0.7% | | | | | | | | |
| Cisco Systems, Inc. | | | 13,409 | | | $ | 364,121 | |
| | | | | | | | |
| Oil Services – 1.2% | | | | | | | | |
| National Oilwell Varco, Inc. | | | 5,306 | | | $ | 177,698 | |
| Schlumberger Ltd. | | | 6,595 | | | | 460,001 | |
| | | | | | | | |
| | | $ | 637,699 | |
| | | | | | | | |
| Other Banks & Diversified Financials – 7.5% | | | | | |
| American Express Co. | | | 10,798 | | | $ | 751,001 | |
| Credicorp Ltd. | | | 790 | | | | 76,883 | |
| Erste Group Bank AG (a) | | | 8,024 | | | | 250,775 | |
| Grupo Financiero Banorte S.A. de C.V. | | | 36,456 | | | | 200,932 | |
| Itau Unibanco Holding S.A., ADR | | | 21,039 | | | | 136,964 | |
| Julius Baer Group Ltd. | | | 6,991 | | | | 335,174 | |
| Kasikornbank Co. Ltd. | | | 25,000 | | | | 103,355 | |
| Komercni Banka A.S. | | | 498 | | | | 98,680 | |
| UBS AG | | | 42,863 | | | | 824,851 | |
| Visa, Inc., “A” | | | 15,239 | | | | 1,181,784 | |
| | | | | | | | |
| | | $ | 3,960,399 | |
| | | | | | | | |
| Pharmaceuticals – 4.8% | | | | | | | | |
| Bayer AG | | | 9,038 | | | $ | 1,133,919 | |
| Johnson & Johnson | | | 3,714 | | | | 381,502 | |
| Merck KGaA | | | 4,763 | | | | 462,642 | |
| Roche Holding AG | | | 1,934 | | | | 532,987 | |
| | | | | | | | |
| | | $ | 2,511,050 | |
| | | | | | | | |
| Railroad & Shipping – 2.2% | | | | | | | | |
| Canadian National Railway Co. | | | 15,931 | | | $ | 890,224 | |
| Union Pacific Corp. | | | 3,464 | | | | 270,885 | |
| | | | | | | | |
| | | $ | 1,161,109 | |
| | | | | | | | |
| Restaurants – 0.6% | | | | | | | | |
| McDonald’s Corp. | | | 1,149 | | | $ | 135,743 | |
| Whitbread PLC | | | 2,702 | | | | 174,615 | |
| | | | | | | | |
| | | $ | 310,358 | |
| | | | | | | | |
| | | | | | | | |
| Issuer | | Shares/Par | | | Value ($) | |
| | | | | | | | |
| COMMON STOCKS – continued | |
| Specialty Chemicals – 3.9% | | | | | | | | |
| Akzo Nobel N.V. | | | 9,497 | | | $ | 634,338 | |
| L’Air Liquide S.A. | | | 2,150 | | | | 241,475 | |
| Linde AG | | | 5,052 | | | | 733,315 | |
| Praxair, Inc. | | | 4,371 | | | | 447,590 | |
| | | | | | | | |
| | | $ | 2,056,718 | |
| | | | | | | | |
| Specialty Stores – 2.3% | | | | | | | | |
| AutoZone, Inc. (a) | | | 598 | | | $ | 443,662 | |
| Hermes International | | | 277 | | | | 93,394 | |
| Sally Beauty Holdings, Inc. (a) | | | 13,323 | | | | 371,578 | |
| Urban Outfitters, Inc. (a) | | | 12,478 | | | | 283,873 | |
| | | | | | | | |
| | | $ | 1,192,507 | |
| | | | | | | | |
| Trucking – 1.5% | | | | | | | | |
| United Parcel Service, Inc., “B” | | | 8,283 | | | $ | 797,073 | |
| | | | | | | | |
Total Common Stocks
(Identified Cost, $35,591,186) | | | $ | 52,739,671 | |
| | | | | | | | |
| |
| MONEY MARKET FUNDS – 0.6% | | | | | |
| MFS Institutional Money Market Portfolio, 0.19%, at Cost and Net Asset Value (v) | | | 284,710 | | | $ | 284,710 | |
| | | | | | | | |
| |
| COLLATERAL FOR SECURITIES LOANED – 0.2% | | | | | |
| Navigator Securities Lending Prime Portfolio, 0.32%, at Cost and Net Asset Value (j) | | | 115,848 | | | $ | 115,848 | |
| | | | | | | | |
Total Investments
(Identified Cost, $35,991,744) | | | $ | 53,140,229 | |
| | | | | | | | |
OTHER ASSETS, LESS
LIABILITIES – (0.6)% | | | | (301,627 | ) |
| | | | | | | | |
| NET ASSETS – 100.0% | | | $ | 52,838,602 | |
| | | | | | | | |
| (a) | | Non-income producing security. |
| (j) | | The rate quoted is the annualized seven-day yield of the fund at period end. |
| (l) | | A portion of this security is on loan. |
| (v) | | Underlying affiliated fund that is available only to investment companies managed by MFS. The rate quoted for the MFS Institutional Money Market Portfolio is the annualized seven-day yield of the fund at period end. |
The following abbreviations are used in this report and are defined:
| ADR | | American Depositary Receipt |
| PLC | | Public Limited Company |
See Notes to Financial Statements
8
MFS Global Equity Series
FINANCIAL STATEMENTS | STATEMENT OF ASSETS AND LIABILITIES
This statement represents your fund’s balance sheet, which details the assets and liabilities comprising the total value of the fund.
| | | | | | | | |
At 12/31/15 | | | | | | | | |
Assets | | | | | | | | |
Investments | | | | | | | | |
Non-affiliated issuers, at value (identified cost, $35,707,034) | | | $52,855,519 | | | | | |
Underlying affiliated funds, at cost and value | | | 284,710 | | | | | |
Total investments, at value, including $112,905 of securities on loan (identified cost, $35,991,744) | | | $53,140,229 | | | | | |
Cash | | | 3,199 | | | | | |
Foreign currency, at value (identified cost, $1,705) | | | 1,667 | | | | | |
Receivables for | | | | | | | | |
Investments sold | | | 2,322 | | | | | |
Fund shares sold | | | 21,790 | | | | | |
Interest and dividends | | | 103,030 | | | | | |
Receivable from investment adviser | | | 2,255 | | | | | |
Other assets | | | 672 | | | | | |
Total assets | | | | | | | $53,275,164 | |
Liabilities | | | | | | | | |
Payable for fund shares reacquired | | | $273,638 | | | | | |
Collateral for securities loaned, at value | | | 115,848 | | | | | |
Payable to affiliates | | | | | | | | |
Shareholder servicing costs | | | 98 | | | | | |
Distribution and/or service fees | | | 96 | | | | | |
Payable for independent Trustees’ compensation | | | 13 | | | | | |
Accrued expenses and other liabilities | | | 46,869 | | | | | |
Total liabilities | | | | | | | $436,562 | |
Net assets | | | | | | | $52,838,602 | |
Net assets consist of | | | | | | | | |
Paid-in capital | | | $32,785,790 | | | | | |
Unrealized appreciation (depreciation) on investments and translation of assets and liabilities in foreign currencies | | | 17,144,403 | | | | | |
Accumulated net realized gain (loss) on investments and foreign currency | | | 2,394,586 | | | | | |
Undistributed net investment income | | | 513,823 | | | | | |
Net assets | | | | | | | $52,838,602 | |
Shares of beneficial interest outstanding | | | | | | | 2,874,951 | |
| | | | | | | | | | | | |
| | | Net assets | | | Shares
outstanding | | | Net asset value
per share | |
Initial Class | | | $45,945,788 | | | | 2,498,254 | | | | $18.39 | |
Service Class | | | 6,892,814 | | | | 376,697 | | | | 18.30 | |
See Notes to Financial Statements
9
MFS Global Equity Series
FINANCIAL STATEMENTS | STATEMENT OF OPERATIONS
This statement describes how much your fund earned in investment income and accrued in expenses. It also describes any gains and/or losses generated by fund operations.
| | | | | | | | |
Year ended 12/31/15 | | | | | | | | |
Net investment income | | | | | | | | |
Income | | | | | | | | |
Dividends | | | $1,142,626 | | | | | |
Interest | | | 6,400 | | | | | |
Dividends from underlying affiliated funds | | | 381 | | | | | |
Foreign taxes withheld | | | (52,190 | ) | | | | |
Total investment income | | | | | | | $1,097,217 | |
Expenses | | | | | | | | |
Management fee | | | $575,437 | | | | | |
Distribution and/or service fees | | | 17,975 | | | | | |
Shareholder servicing costs | | | 12,285 | | | | | |
Administrative services fee | | | 18,680 | | | | | |
Independent Trustees’ compensation | | | 2,808 | | | | | |
Custodian fee | | | 32,678 | | | | | |
Shareholder communications | | | 10,941 | | | | | |
Audit and tax fees | | | 58,602 | | | | | |
Legal fees | | | 442 | | | | | |
Miscellaneous | | | 11,324 | | | | | |
Total expenses | | | | | | | $741,172 | |
Fees paid indirectly | | | (2 | ) | | | | |
Reduction of expenses by investment adviser | | | (147,810 | ) | | | | |
Net expenses | | | | | | | $593,360 | |
Net investment income | | | | | | | $503,857 | |
Realized and unrealized gain (loss) on investments and foreign currency | | | | | | | | |
Realized gain (loss) (identified cost basis) | | | | | | | | |
Investments (net of $1,123 country tax) | | | $2,792,061 | | | | | |
Foreign currency | | | (904 | ) | | | | |
Net realized gain (loss) on investments and foreign currency | | | | | | | $2,791,157 | |
Change in unrealized appreciation (depreciation) | | | | | | | | |
Investments (net of $9,125 decrease in deferred country tax) | | | $(4,117,285 | ) | | | | |
Translation of assets and liabilities in foreign currencies | | | (703 | ) | | | | |
Net unrealized gain (loss) on investments and foreign currency translation | | | | | | | $(4,117,988 | ) |
Net realized and unrealized gain (loss) on investments and foreign currency | | | | | | | $(1,326,831 | ) |
Change in net assets from operations | | | | | | | $(822,974 | ) |
See Notes to Financial Statements
10
MFS Global Equity Series
FINANCIAL STATEMENTS | STATEMENTS OF CHANGES IN NET ASSETS
These statements describe the increases and/or decreases in net assets resulting from operations, any distributions, and any shareholder transactions.
| | | | | | | | |
For years ended 12/31 | | | 2015 | | | | 2014 | |
Change in net assets | | | | | | | | |
From operations | | | | | | | | |
Net investment income | | | $503,857 | | | | $618,571 | |
Net realized gain (loss) on investments and foreign currency | | | 2,791,157 | | | | 1,918,060 | |
Net unrealized gain (loss) on investments and foreign currency translation | | | (4,117,988 | ) | | | (288,274 | ) |
Change in net assets from operations | | | $(822,974 | ) | | | $2,248,357 | |
Distributions declared to shareholders | | | | | | | | |
From net investment income | | | $(594,700 | )�� | | | $(423,888 | ) |
From net realized gain on investments | | | (1,953,509 | ) | | | (597,485 | ) |
Total distributions declared to shareholders | | | $(2,548,209 | ) | | | $(1,021,373 | ) |
Change in net assets from fund share transactions | | | $(1,958,038 | ) | | | $(4,151,496 | ) |
Total change in net assets | | | $(5,329,221 | ) | | | $(2,924,512 | ) |
Net assets | | | | | | | | |
At beginning of period | | | 58,167,823 | | | | 61,092,335 | |
At end of period (including undistributed net investment income of $513,823 and
$606,695, respectively) | | | $52,838,602 | | | | $58,167,823 | |
See Notes to Financial Statements
11
MFS Global Equity Series
FINANCIAL STATEMENTS | FINANCIAL HIGHLIGHTS
The financial highlights table is intended to help you understand the fund’s financial performance for the past 5 years. Certain information reflects financial results for a single fund share. The total returns in the table represent the rate by which an investor would have earned (or lost) on an investment in the fund share class (assuming reinvestment of all distributions) held for the entire period.
| | | | | | | | | | | | | | | | | | | | |
| Initial Class | | Years ended 12/31 | |
| | | 2015 | | | 2014 | | | 2013 | | | 2012 | | | 2011 | |
Net asset value, beginning of period | | | $19.59 | | | | $19.18 | | | | $15.14 | | | | $12.71 | | | | $13.40 | |
| Income (loss) from investment operations | | | | | | | | | | | | | | | | | | | | |
Net investment income (d) | | | $0.18 | | | | $0.20 | | | | $0.14 | | | | $0.16 | | | | $0.14 | |
Net realized and unrealized gain (loss) on investments
and foreign currency | | | (0.49 | ) | | | 0.54 | | | | 4.05 | | | | 2.76 | | | | (0.72 | ) |
Total from investment operations | | | $(0.31 | ) | | | $0.74 | | | | $4.19 | | | | $2.92 | | | | $(0.58 | ) |
| Less distributions declared to shareholders | | | | | | | | | | | | | | | | | | | | |
From net investment income | | | $(0.21 | ) | | | $(0.14 | ) | | | $(0.15 | ) | | | $(0.16 | ) | | | $(0.11 | ) |
From net realized gain on investments | | | (0.68 | ) | | | (0.19 | ) | | | — | | | | (0.33 | ) | | | — | |
Total distributions declared to shareholders | | | $(0.89 | ) | | | $(0.33 | ) | | | $(0.15 | ) | | | $(0.49 | ) | | | $(0.11 | ) |
Net asset value, end of period (x) | | | $18.39 | | | | $19.59 | | | | $19.18 | | | | $15.14 | | | | $12.71 | |
Total return (%) (k)(r)(s)(x) | | | (1.41 | ) | | | 3.87 | | | | 27.81 | | | | 23.34 | | | | (4.32 | ) |
Ratios (%) (to average net assets)
and Supplemental data: | | | | | | | | | | | | | | | | | | | | |
Expenses before expense reductions (f) | | | 1.26 | | | | 1.28 | | | | 1.31 | | | | 1.30 | | | | 1.40 | |
Expenses after expense reductions (f) | | | 1.00 | | | | 1.09 | | | | 1.15 | | | | 1.15 | | | | 1.15 | |
Net investment income | | | 0.91 | | | | 1.06 | | | | 0.82 | | | | 1.15 | | | | 1.08 | |
Portfolio turnover | | | 12 | | | | 15 | | | | 25 | | | | 21 | | | | 15 | |
Net assets at end of period (000 omitted) | | | $45,946 | | | | $51,635 | | | | $54,075 | | | | $41,297 | | | | $35,426 | |
See Notes to Financial Statements
12
MFS Global Equity Series
Financial Highlights – continued
| | | | | | | | | | | | | | | | | | | | |
| Service Class | | Years ended 12/31 | |
| | | 2015 | | | 2014 | | | 2013 | | | 2012 | | | 2011 | |
Net asset value, beginning of period | | | $19.50 | | | | $19.10 | | | | $15.09 | | | | $12.68 | | | | $13.37 | |
| Income (loss) from investment operations | | | | | | | | | | | | | | | | | | | | |
Net investment income (d) | | | $0.13 | | | | $0.15 | | | | $0.09 | | | | $0.12 | | | | $0.11 | |
Net realized and unrealized gain (loss) on investments
and foreign currency | | | (0.48 | ) | | | 0.54 | | | | 4.05 | | | | 2.75 | | | | (0.71 | ) |
Total from investment operations | | | $(0.35 | ) | | | $0.69 | | | | $4.14 | | | | $2.87 | | | | $(0.60 | ) |
| Less distributions declared to shareholders | | | | | | | | | | | | | | | | | | | | |
From net investment income | | | $(0.17 | ) | | | $(0.10 | ) | | | $(0.13 | ) | | | $(0.13 | ) | | | $(0.09 | ) |
From net realized gain on investments | | | (0.68 | ) | | | (0.19 | ) | | | — | | | | (0.33 | ) | | | — | |
Total distributions declared to shareholders | | | $(0.85 | ) | | | $(0.29 | ) | | | $(0.13 | ) | | | $(0.46 | ) | | | $(0.09 | ) |
Net asset value, end of period (x) | | | $18.30 | | | | $19.50 | | | | $19.10 | | | | $15.09 | | | | $12.68 | |
Total return (%) (k)(r)(s)(x) | | | (1.67 | ) | | | 3.63 | | | | 27.52 | | | | 22.98 | | | | (4.53 | ) |
Ratios (%) (to average net assets)
and Supplemental data: | | | | | | | | | | | | | | | | | | | | |
Expenses before expense reductions (f) | | | 1.51 | | | | 1.53 | | | | 1.56 | | | | 1.54 | | | | 1.65 | |
Expenses after expense reductions (f) | | | 1.25 | | | | 1.34 | | | | 1.40 | | | | 1.40 | | | | 1.40 | |
Net investment income | | | 0.67 | | | | 0.80 | | | | 0.54 | | | | 0.87 | | | | 0.83 | |
Portfolio turnover | | | 12 | | | | 15 | | | | 25 | | | | 21 | | | | 15 | |
Net assets at end of period (000 omitted) | | | $6,893 | | | | $6,533 | | | | $7,018 | | | | $4,127 | | | | $2,640 | |
| (d) | Per share data is based on average shares outstanding. |
| (f) | Ratios do not reflect reductions from fees paid indirectly, if applicable. |
| (k) | The total return does not reflect expenses that apply to separate accounts. Inclusion of these charges would reduce the total return figures for all periods shown. |
| (r) | Certain expenses have been reduced without which performance would have been lower. |
| (s) | From time to time the fund may receive proceeds from litigation settlements, without which performance would be lower. |
| (x) | The net asset values and total returns have been calculated on net assets which include adjustments made in accordance with U.S. generally accepted accounting principles required at period end for financial reporting purposes. |
See Notes to Financial Statements
13
MFS Global Equity Series
NOTES TO FINANCIAL STATEMENTS
| (1) | | Business and Organization |
MFS Global Equity Series (the fund) is a diversified series of MFS Variable Insurance Trust (the trust). The trust is organized as a Massachusetts business trust and is registered under the Investment Company Act of 1940, as amended, as an open-end management investment company. The shareholders of each series of the trust are separate accounts of insurance companies, which offer variable annuity and/or life insurance products, and qualified retirement and pension plans.
The fund is an investment company and accordingly follows the investment company accounting and reporting guidance of the Financial Accounting Standards Board (FASB) Accounting Standards Codification Topic 946 Financial Services – Investment Companies.
| (2) | | Significant Accounting Policies |
General – The preparation of financial statements in conformity with U.S. generally accepted accounting principles requires management to make estimates and assumptions that affect the reported amounts of assets and liabilities, and disclosure of contingent assets and liabilities at the date of the financial statements and the reported amounts of increases and decreases in net assets from operations during the reporting period. Actual results could differ from those estimates. In the preparation of these financial statements, management has evaluated subsequent events occurring after the date of the fund’s Statement of Assets and Liabilities through the date that the financial statements were issued. The fund invests in foreign securities. Investments in foreign securities are vulnerable to the effects of changes in the relative values of the local currency and the U.S. dollar and to the effects of changes in each country’s legal, political, and economic environment.
In January 2016, FASB issued Accounting Standards Update 2016-01, Financial Instruments – Overall (Subtopic 825-10) – Recognition and Measurement of Financial Assets and Financial Liabilities (“ASU 2016-01”) which would first be effective for annual reporting periods beginning after December 15, 2017, and interim periods therein. ASU 2016-01, which changes the accounting for equity investments and for certain financial liabilities, also modifies the presentation and disclosure requirements for financial instruments. Investment companies are specifically exempted from ASU 2016-01’s equity investment accounting provisions and will continue to follow the industry specific guidance for investment accounting under ASC 946. Although still evaluating the potential impacts of ASU 2016-01 to the fund, management expects that the impact of the fund’s adoption will be limited to additional financial statement disclosures.
Balance Sheet Offsetting – The fund’s accounting policy with respect to balance sheet offsetting is that, absent an event of default by the counterparty or a termination of the agreement, the International Swaps and Derivatives Association (ISDA) Master Agreement does not result in an offset of reported amounts of financial assets and financial liabilities in the Statement of Assets and Liabilities across transactions between the fund and the applicable counterparty. The fund’s right to setoff may be restricted or prohibited by the bankruptcy or insolvency laws of the particular jurisdiction to which a specific master netting agreement counterparty is subject. Balance sheet offsetting disclosures, to the extent applicable to the fund, have been included in the fund’s Significant Accounting Policies note under the captions for each of the fund’s in-scope financial instruments and transactions.
Investment Valuations – Equity securities, including restricted equity securities, are generally valued at the last sale or official closing price on their primary market or exchange as provided by a third-party pricing service. Equity securities, for which there were no sales reported that day, are generally valued at the last quoted daily bid quotation on their primary market or exchange as provided by a third-party pricing service. Short-term instruments with a maturity at issuance of 60 days or less may be valued at amortized cost, which approximates market value. Open-end investment companies are generally valued at net asset value per share. Securities and other assets generally valued on the basis of information from a third-party pricing service may also be valued at a broker/dealer bid quotation. Values obtained from third-party pricing services can utilize both transaction data and market information such as yield, quality, coupon rate, maturity, type of issue, trading characteristics, and other market data. The values of foreign securities and other assets and liabilities expressed in foreign currencies are converted to U.S. dollars using the mean of bid and asked prices for rates provided by a third-party pricing service.
The Board of Trustees has delegated primary responsibility for determining or causing to be determined the value of the fund’s investments (including any fair valuation) to the adviser pursuant to valuation policies and procedures approved by the Board. If the adviser determines that reliable market quotations are not readily available, investments are valued at fair value as determined in good faith by the adviser in accordance with such procedures under the oversight of the Board of Trustees. Under the fund’s valuation policies and procedures, market quotations are not considered to be readily available for most types of debt instruments and floating rate loans and many types of derivatives. These investments are generally valued at fair value based on information from third-party pricing services. In addition, investments may be valued at fair value if the adviser determines that an investment’s value has been materially affected by events occurring after the close of the exchange or market on which the investment is principally traded (such as foreign exchange or market) and prior to the determination of the fund’s net asset value, or after the halting of trading of a specific security where trading does not resume prior to the close of the exchange or market on which the security is principally traded. Events that occur on a frequent basis after foreign markets close (such as developments in foreign markets and
14
MFS Global Equity Series
Notes to Financial Statements – continued
significant movements in the U.S. markets) and prior to the determination of the fund’s net asset value may be deemed to have a material effect on the value of securities traded in foreign markets. Accordingly, the fund’s foreign equity securities may often be valued at fair value. The adviser generally relies on third-party pricing services or other information (such as the correlation with price movements of similar securities in the same or other markets; the type, cost and investment characteristics of the security; the business and financial condition of the issuer; and trading and other market data) to assist in determining whether to fair value and at what value to fair value an investment. The value of an investment for purposes of calculating the fund’s net asset value can differ depending on the source and method used to determine value. When fair valuation is used, the value of an investment used to determine the fund’s net asset value may differ from quoted or published prices for the same investment. There can be no assurance that the fund could obtain the fair value assigned to an investment if it were to sell the investment at the same time at which the fund determines its net asset value per share.
Various inputs are used in determining the value of the fund’s assets or liabilities. These inputs are categorized into three broad levels. In certain cases, the inputs used to measure fair value may fall into different levels of the fair value hierarchy. In such cases, an investment’s level within the fair value hierarchy is based on the lowest level of input that is significant to the fair value measurement. The fund’s assessment of the significance of a particular input to the fair value measurement in its entirety requires judgment, and considers factors specific to the investment. Level 1 includes unadjusted quoted prices in active markets for identical assets or liabilities. Level 2 includes other significant observable market-based inputs (including quoted prices for similar securities, interest rates, prepayment speed, and credit risk). Level 3 includes unobservable inputs, which may include the adviser’s own assumptions in determining the fair value of investments. The following is a summary of the levels used as of December 31, 2015 in valuing the fund’s assets or liabilities:
| | | | | | | | | | | | | | | | |
| Investments at Value | | Level 1 | | | Level 2 | | | Level 3 | | | Total | |
| Equity Securities: | | | | | | | | | | | | | | | | |
United States | | | $29,431,743 | | | | $— | | | | $— | | | | $29,431,743 | |
United Kingdom | | | 1,436,986 | | | | 3,900,944 | | | | — | | | | 5,337,930 | |
Switzerland | | | 759,716 | | | | 3,815,803 | | | | — | | | | 4,575,519 | |
France | | | — | | | | 3,968,955 | | | | — | | | | 3,968,955 | |
Germany | | | 305,420 | | | | 2,941,188 | | | | — | | | | 3,246,608 | |
Netherlands | | | — | | | | 1,204,295 | | | | — | | | | 1,204,295 | |
Canada | | | 890,224 | | | | — | | | | — | | | | 890,224 | |
Sweden | | | — | | | | 879,243 | | | | — | | | | 879,243 | |
Japan | | | 177,537 | | | | 594,077 | | | | — | | | | 771,614 | |
Other Countries | | | 680,728 | | | | 1,752,812 | | | | — | | | | 2,433,540 | |
| Mutual Funds | | | 400,558 | | | | — | | | | — | | | | 400,558 | |
| Total Investments | | | $34,082,912 | | | | $19,057,317 | | | | $— | | | | $53,140,229 | |
For further information regarding security characteristics, see the Portfolio of Investments.
Of the level 2 investments presented above, equity investments amounting to $3,859,433 would have been considered level 1 investments at the beginning of the period. Of the level 1 investments presented above, equity investments amounting to $2,092,952 would have been considered level 2 investments at the beginning of the period. The primary reason for changes in the classifications between levels 1 and 2 occurs when foreign equity securities are fair valued using other observable market-based inputs in place of the closing exchange price due to events occurring after the close of the exchange or market on which the investment is principally traded. The fund’s foreign equity securities may often be valued at fair value. The fund’s policy is to recognize transfers between the levels as of the end of the period.
Foreign Currency Translation – Purchases and sales of foreign investments, income, and expenses are converted into U.S. dollars based upon currency exchange rates prevailing on the respective dates of such transactions or on the reporting date for foreign denominated receivables and payables. Gains and losses attributable to foreign currency exchange rates on sales of securities are recorded for financial statement purposes as net realized gains and losses on investments. Gains and losses attributable to foreign exchange rate movements on receivables, payables, income and expenses are recorded for financial statement purposes as foreign currency transaction gains and losses. That portion of both realized and unrealized gains and losses on investments that results from fluctuations in foreign currency exchange rates is not separately disclosed.
Security Loans – Under its Securities Lending Agency Agreement with the fund, State Street Bank and Trust Company (“State Street”), as lending agent, loans the securities of the fund to certain qualified institutions (the “Borrowers”) approved by the fund. Security loans can be terminated at the discretion of either the lending agent or the fund and the related securities must be returned within the earlier of the standard trade settlement period for such securities or within three business days. The loans are collateralized by cash and/or U.S. Treasury and federal agency obligations in an amount typically at least equal to the market value of the securities loaned. On loans collateralized by cash, the cash collateral is invested in a money market fund. The market value of the loaned securities is determined at the close of business of the fund and any additional required collateral is delivered to the fund on
15
MFS Global Equity Series
Notes to Financial Statements – continued
the next business day. State Street provides the fund with indemnification against Borrower default. In the event of Borrower default, State Street will, for the benefit of the fund, either purchase securities identical to those loaned or, when such purchase is commercially impracticable, pay the fund the market value of the loaned securities. In return, State Street assumes the fund’s rights to the related collateral. If the collateral value is less than the cost to purchase identical securities, State Street is responsible for the shortfall, but only to the extent that such shortfall is not due to a decline in collateral value resulting from collateral reinvestment for which the fund bears the risk of loss. At period end, the fund had investment securities on loan, all of which were classified as equity securities in the fund’s Portfolio of Investments, with a fair value of $112,905. The fair value of the fund’s investment securities on loan and a related liability of $115,848 for cash collateral received on securities loaned are both presented gross in the Statement of Assets and Liabilities. The collateral received on securities loaned exceeded the value of securities on loan at period end. The liability for cash collateral for securities loaned is carried at fair value, which is categorized as level 2 within the fair value hierarchy. A portion of the income generated upon investment of the collateral is remitted to the Borrowers, and the remainder is allocated between the fund and the lending agent. On loans collateralized by U.S. Treasury and/or federal agency obligations, a fee is received from the Borrower, and is allocated between the fund and the lending agent. Income from securities lending is included in “Interest” income in the Statement of Operations. The dividend and interest income earned on the securities loaned is accounted for in the same manner as other dividend and interest income.
Indemnifications – Under the fund’s organizational documents, its officers and Trustees may be indemnified against certain liabilities and expenses arising out of the performance of their duties to the fund. Additionally, in the normal course of business, the fund enters into agreements with service providers that may contain indemnification clauses. The fund’s maximum exposure under these agreements is unknown as this would involve future claims that may be made against the fund that have not yet occurred.
Investment Transactions and Income – Investment transactions are recorded on the trade date. Interest income is recorded on the accrual basis. Dividends received in cash are recorded on the ex-dividend date. Certain dividends from foreign securities will be recorded when the fund is informed of the dividend if such information is obtained subsequent to the ex-dividend date. Dividend and interest payments received in additional securities are recorded on the ex-dividend or ex-interest date in an amount equal to the value of the security on such date.
The fund may receive proceeds from litigation settlements. Any proceeds received from litigation involving portfolio holdings are reflected in the Statement of Operations in realized gain/loss if the security has been disposed of by the fund or in unrealized gain/loss if the security is still held by the fund. Any other proceeds from litigation not related to portfolio holdings are reflected as other income in the Statement of Operations.
Fees Paid Indirectly – Prior to October 1, 2015, the fund’s custody fee could be reduced by a credit earned under an arrangement that measured the value of U.S. dollars deposited with the custodian by the fund. The amount of the credit, for the year ended December 31, 2015, is shown as a reduction of total expenses in the Statement of Operations.
Tax Matters and Distributions – The fund intends to qualify as a regulated investment company, as defined under Subchapter M of the Internal Revenue Code, and to distribute all of its taxable income, including realized capital gains. As a result, no provision for federal income tax is required. The fund’s federal tax returns, when filed, will remain subject to examination by the Internal Revenue Service for a three year period. Management has analyzed the fund’s tax positions taken on federal and state tax returns for all open tax years and does not believe that there are any uncertain tax positions that require recognition of a tax liability. Foreign taxes, if any, have been accrued by the fund in the accompanying financial statements in accordance with the applicable foreign tax law. Foreign income taxes may be withheld by certain countries in which the fund invests. Additionally, capital gains realized by the fund on securities issued in or by certain foreign countries may be subject to capital gains tax imposed by those countries.
Distributions to shareholders are recorded on the ex-dividend date. Income and capital gain distributions are determined in accordance with income tax regulations, which may differ from U.S. generally accepted accounting principles. Certain capital accounts in the financial statements are periodically adjusted for permanent differences in order to reflect their tax character. These adjustments have no impact on net assets or net asset value per share. Temporary differences which arise from recognizing certain items of income, expense, gain or loss in different periods for financial statement and tax purposes will reverse at some time in the future. Distributions in excess of net investment income or net realized gains are temporary overdistributions for financial statement purposes resulting from differences in the recognition or classification of income or distributions for financial statement and tax purposes.
Book/tax differences primarily relate to wash sale loss deferrals.
The tax character of distributions declared to shareholders for the last two fiscal years is as follows:
| | | | | | | | |
| | | 12/31/15 | | | 12/31/14 | |
| Ordinary income (including any short-term capital gains) | | | $825,655 | | | | $674,837 | |
| Long-term capital gains | | | 1,722,554 | | | | 346,536 | |
| Total distributions | | | $2,548,209 | | | | $1,021,373 | |
16
MFS Global Equity Series
Notes to Financial Statements – continued
The federal tax cost and the tax basis components of distributable earnings were as follows:
| | | | |
| As of 12/31/15 | | | | |
| Cost of investments | | | $36,396,820 | |
| Gross appreciation | | | 18,278,657 | |
| Gross depreciation | | | (1,535,248 | ) |
| Net unrealized appreciation (depreciation) | | | $16,743,409 | |
| Undistributed ordinary income | | | 513,823 | |
| Undistributed long-term capital gain | | | 2,799,662 | |
| Other temporary differences | | | (4,082 | ) |
Multiple Classes of Shares of Beneficial Interest – The fund offers multiple classes of shares, which differ in their respective distribution and/or service fees. The fund’s income, realized and unrealized gain (loss), and common expenses are allocated to shareholders based on the daily net assets of each class. Dividends are declared separately for each class. Differences in per share dividend rates are generally due to differences in separate class expenses. The fund’s distributions declared to shareholders as reported in the Statements of Changes in Net Assets are presented by class as follows:
| | | | | | | | | | | | | | | | |
| | | From net investment
income | | | From net realized gain on
investments | |
| | | Year ended
12/31/15 | | | Year ended
12/31/14 | | | Year ended
12/31/15 | | | Year ended
12/31/14 | |
| Initial Class | | | $532,654 | | | | $386,822 | | | | $1,699,129 | | | | $527,323 | |
| Service Class | | | 62,046 | | | | 37,066 | | | | 254,380 | | | | 70,162 | |
| Total | | | $594,700 | | | | $423,888 | | | | $1,953,509 | | | | $597,485 | |
| (3) | | Transactions with Affiliates |
Investment Adviser – The fund has an investment advisory agreement with MFS to provide overall investment management and related administrative services and facilities to the fund. The management fee is computed daily and paid monthly at the following annual rates:
| | | | |
| First $1 billion of average daily net assets | | | 1.00% | |
| Average daily net assets in excess of $1 billion | | | 0.90% | |
The investment adviser has agreed in writing to reduce its management fee to 0.90% of average daily net assets. This written agreement will terminate on April 28, 2016. For the year ended December 31, 2015, this management fee reduction amounted to $57,549, which is included in the reduction of total expenses in the Statement of Operations. MFS has also agreed in writing to reduce its management fee by a specified amount if certain MFS mutual fund assets exceed thresholds agreed to by MFS and the fund’s Board of Trustees. For the year ended December 31, 2015, this management fee reduction amounted to $3,998, which is included in the reduction of total expenses in the Statement of Operations. The management fee incurred for the year ended December 31, 2015 was equivalent to an annual effective rate of 0.89% of the fund’s average daily net assets. Effective April 29, 2016, the management fee will be computed daily and paid monthly at an annual rate of 0.90% of average daily net assets up to $1 billion, 0.75% of average daily net assets in excess of $1 billion up to $2.5 billion, and 0.65% of average daily net assets in excess of $2.5 billion.
The investment adviser has agreed in writing to pay a portion of the fund’s total annual operating expenses, excluding interest, taxes, extraordinary expenses, brokerage and transaction costs, and investment-related expenses, such that total annual operating expenses do not exceed 1.00% of average daily net assets for the Initial Class shares and 1.25% of average daily net assets for the Service Class shares. This written agreement will continue until modified by the fund’s Board of Trustees, but such agreement will continue at least until April 30, 2017. For the year ended December 31, 2015, this reduction amounted to $86,263, which is included in the reduction of total expenses in the Statement of Operations.
Distributor – MFS Fund Distributors, Inc. (MFD), a wholly-owned subsidiary of MFS, is the distributor of shares of the fund. The Trustees have adopted a distribution plan for the Service Class shares pursuant to Rule 12b-1 under the Investment Company Act of 1940.
The fund’s distribution plan provides that the fund will pay MFD distribution and/or service fees equal to 0.25% per annum of its average daily net assets attributable to Service Class shares as partial consideration for services performed and expenses incurred by MFD and financial intermediaries (including participating insurance companies that invest in the fund to fund variable annuity and variable life insurance contracts, sponsors of qualified retirement and pension plans that invest in the fund, and affiliates of these participating insurance companies and plan sponsors) in connection with the sale and distribution of the Service Class shares. MFD may subsequently pay all, or a portion, of the distribution and/or service fees to financial intermediaries.
17
MFS Global Equity Series
Notes to Financial Statements – continued
Shareholder Servicing Agent – MFS Service Center, Inc. (MFSC), a wholly-owned subsidiary of MFS, receives a fee from the fund for its services as shareholder servicing agent. For the year ended December 31, 2015, the fee was $11,951, which equated to 0.0208% annually of the fund’s average daily net assets. MFSC also receives payment from the fund for out-of-pocket expenses paid by MFSC on behalf of the fund. For the year ended December 31, 2015, these costs amounted to $334.
Administrator – MFS provides certain financial, legal, shareholder communications, compliance, and other administrative services to the fund. Under an administrative services agreement, the fund reimburses MFS the costs incurred to provide these services. The fund is charged an annual fixed amount of $17,500 plus a fee based on average daily net assets. The administrative services fee incurred for the year ended December 31, 2015 was equivalent to an annual effective rate of 0.0325% of the fund’s average daily net assets.
Trustees’ and Officers’ Compensation – The fund pays compensation to independent Trustees in the form of a retainer, attendance fees, and additional compensation to Board and Committee chairpersons. The fund does not pay compensation directly to Trustees or officers of the fund who are also officers of the investment adviser, all of whom receive remuneration for their services to the fund from MFS. Certain officers and Trustees of the fund are officers or directors of MFS, MFD, and MFSC.
Other – This fund and certain other funds managed by MFS (the funds) have entered into a service agreement (the ISO Agreement) which provides for payment of fees solely by the funds to Tarantino LLC in return for the provision of services of an Independent Senior Officer (ISO) for the funds. Frank L. Tarantino serves as the ISO and is an officer of the funds and the sole member of Tarantino LLC. The funds can terminate the ISO Agreement with Tarantino LLC at any time under the terms of the ISO Agreement. For the year ended December 31, 2015, the fee paid by the fund under this agreement was $185 and is included in “Miscellaneous” expense in the Statement of Operations. MFS has agreed to bear all expenses associated with office space, other administrative support, and supplies provided to the ISO.
The fund invests in the MFS Institutional Money Market Portfolio which is managed by MFS and seeks current income consistent with preservation of capital and liquidity. Income earned on this investment is included in “Dividends from underlying affiliated funds” in the Statement of Operations. This money market fund does not pay a management fee to MFS.
For the year ended December 31, 2015, purchases and sales of investments, other than short-term obligations, aggregated $6,581,101 and $10,271,419, respectively.
| (5) | | Shares of Beneficial Interest |
The fund’s Declaration of Trust permits the Trustees to issue an unlimited number of full and fractional shares of beneficial interest. Transactions in fund shares were as follows:
| | | | | | | | | | | | | | | | |
| | | Year ended 12/31/15 | | | Year ended 12/31/14 | |
| | | Shares | | | Amount | | | Shares | | | Amount | |
| Shares sold | | | | | | | | | | | | | | | | |
Initial Class | | | 294,841 | | | | $5,861,870 | | | | 441,453 | | | | $8,518,356 | |
Service Class | | | 165,914 | | | | 3,259,672 | | | | 152,649 | | | | 2,923,655 | |
| | | 460,755 | | | | $9,121,542 | | | | 594,102 | | | | $11,442,011 | |
| Shares issued to shareholders in reinvestment of distributions | | | | | | | | | | | | | | | | |
Initial Class | | | 126,018 | | | | $2,231,783 | | | | 46,759 | | | | $914,145 | |
Service Class | | | 17,948 | | | | 316,426 | | | | 5,507 | | | | 107,228 | |
| | | 143,966 | | | | $2,548,209 | | | | 52,266 | | | | $1,021,373 | |
| Shares reacquired | | | | | | | | | | | | | | | | |
Initial Class | | | (557,747 | ) | | | $(10,884,525 | ) | | | (671,843 | ) | | | $(12,966,190 | ) |
Service Class | | | (142,184 | ) | | | (2,743,264 | ) | | | (190,527 | ) | | | (3,648,690 | ) |
| | | (699,931 | ) | | | $(13,627,789 | ) | | | (862,370 | ) | | | $(16,614,880 | ) |
| Net change | | | | | | | | | | | | | | | | |
Initial Class | | | (136,888 | ) | | | $(2,790,872 | ) | | | (183,631 | ) | | | $(3,533,689 | ) |
Service Class | | | 41,678 | | | | 832,834 | | | | (32,371 | ) | | | (617,807 | ) |
| | | (95,210 | ) | | | $(1,958,038 | ) | | | (216,002 | ) | | | $(4,151,496 | ) |
The fund and certain other funds managed by MFS participate in a $1.25 billion unsecured committed line of credit, subject to a $1 billion sublimit, provided by a syndication of banks under a credit agreement. Borrowings may be made for temporary financing needs. Interest is charged to each fund, based on its borrowings, generally at a rate equal to the higher of the Overnight Federal Reserve funds rate or daily one month LIBOR plus an agreed upon spread. A commitment fee, based on the average daily, unused portion of the committed line of credit, is allocated among the participating funds at the end of each calendar quarter. In addition,
18
MFS Global Equity Series
Notes to Financial Statements – continued
the fund and other funds managed by MFS have established unsecured uncommitted borrowing arrangements with certain banks for temporary financing needs. Interest is charged to each fund, based on its borrowings, at a rate equal to the Overnight Federal Reserve funds rate plus an agreed upon spread. For the year ended December 31, 2015, the fund’s commitment fee and interest expense were $191 and $0, respectively, and are included in “Miscellaneous” expense in the Statement of Operations.
| (7) | | Transactions in Underlying Affiliated Funds – Affiliated Issuers |
An affiliated issuer may be considered one in which the fund owns 5% or more of the outstanding voting securities, or a company which is under common control. For the purposes of this report, the fund assumes the following to be an affiliated issuer:
| | | | | | | | | | | | | | | | |
| Underlying Affiliated Fund | | Beginning Shares/Par
Amount | | | Acquisitions Shares/Par Amount | | | Dispositions Shares/Par Amount | | | Ending Shares/Par
Amount | |
| MFS Institutional Money Market Portfolio | | | 390,900 | | | | 9,463,990 | | | | (9,570,180 | ) | | | 284,710 | |
| | | | |
| Underlying Affiliated Fund | | Realized Gain (Loss) | | | Capital Gain Distributions | | | Dividend Income | | | Ending Value | |
| MFS Institutional Money Market Portfolio | | | $— | | | | $— | | | | $381 | | | | $284,710 | |
19
MFS Global Equity Series
REPORT OF INDEPENDENT REGISTERED PUBLIC ACCOUNTING FIRM
To the Board of Trustees of MFS Variable Insurance Trust and the Shareholders of MFS Global Equity Series:
We have audited the accompanying statement of assets and liabilities, including the portfolio of investments, of MFS Global Equity Series (one of the series of MFS Variable Insurance Trust) (the “Fund”) as of December 31, 2015, and the related statement of operations for the year then ended, the statements of changes in net assets for each of the two years in the period then ended, and the financial highlights for each of the five years in the period then ended. These financial statements and financial highlights are the responsibility of the Fund’s management. Our responsibility is to express an opinion on these financial statements and financial highlights based on our audits.
We conducted our audits in accordance with the standards of the Public Company Accounting Oversight Board (United States). Those standards require that we plan and perform the audit to obtain reasonable assurance about whether the financial statements and financial highlights are free of material misstatement. The Fund is not required to have, nor were we engaged to perform, an audit of its internal control over financial reporting. Our audits included consideration of internal control over financial reporting as a basis for designing audit procedures that are appropriate in the circumstances, but not for the purpose of expressing an opinion on the effectiveness of the Fund’s internal control over financial reporting. Accordingly, we express no such opinion. An audit also includes examining, on a test basis, evidence supporting the amounts and disclosures in the financial statements, assessing the accounting principles used and significant estimates made by management, as well as evaluating the overall financial statement presentation. Our procedures included confirmation of securities owned as of December 31, 2015, by correspondence with the custodian. We believe that our audits provide a reasonable basis for our opinion.
In our opinion, such financial statements and financial highlights referred to above present fairly, in all material respects, the financial position of MFS Global Equity Series as of December 31, 2015, the results of its operations for the year then ended, the changes in its net assets for each of the two years in the period then ended, and the financial highlights for each of the five years in the period then ended, in conformity with accounting principles generally accepted in the United States of America.
DELOITTE & TOUCHE LLP
Boston, Massachusetts
February 16, 2016
20
MFS Global Equity Series
TRUSTEES AND OFFICERS – IDENTIFICATION AND BACKGROUND
The Trustees and Officers of the Trust, as of February 1, 2016, are listed below, together with their principal occupations during the past five years. (Their titles may have varied during that period.) The address of each Trustee and Officer is 111 Huntington Avenue, Boston, Massachusetts 02199-7618.
| | | | | | | | |
Name, Age | | Position(s)
Held with Fund | | Trustee/Officer
Since (h) | | Principal Occupations
During the Past Five Years | | Other Directorships (j) |
| INTERESTED TRUSTEES |
Robert J. Manning (k)
(age 52) | | Trustee | | February 2004 | | Massachusetts Financial Services Company, Chairman, Co-Chief Executive Officer and Director | | N/A |
| | | | |
Robin A. Stelmach (k) (age 54) | | Trustee and President | | January 2014 | | Massachusetts Financial Services Company, Executive Vice President and Chief Operating Officer | | N/A |
| | |
| INDEPENDENT TRUSTEES | | | | |
David H. Gunning
(age 73) | | Trustee and Chair of Trustees | | January 2004 | | Private investor | | Lincoln Electric Holdings, Inc., Director; Development Alternatives, Inc., Director/Non-Executive Chairman |
| | | | |
Steven E. Buller (age 64) | | Trustee | | February 2014 | | Chairman, Financial Accounting Standards Advisory Council; Standing Advisory Group, Public Company Accounting Oversight Board, Member (until 2014); BlackRock, Inc. (investment management), Managing Director (until 2014), BlackRock Finco UK (investment management), Director (until 2014) | | N/A |
| | | | |
Robert E. Butler
(age 74) | | Trustee | | January 2006 | | Consultant – investment company industry regulatory and compliance matters | | N/A |
| | | | |
Maureen R. Goldfarb (age 60) | | Trustee | | January 2009 | | Private investor | | N/A |
| | | | |
William R. Gutow
(age 74) | | Trustee | | December 1993 | | Private investor and real estate consultant; Capitol Entertainment Management Company (video franchise), Vice Chairman | | Texas Donuts, Vice Chairman (until 2010) |
| | | | |
Michael Hegarty
(age 71) | | Trustee | | December 2004 | | Private investor | | Rouse Properties Inc., Director; Capmark Financial Group Inc., Director |
| | | | |
John P. Kavanaugh (age 61) | | Trustee | | January 2009 | | Private investor | | N/A |
| | | | |
Maryanne L. Roepke (age 59) | | Trustee | | May 2014 | | American Century Investments (investment management), Senior Vice President and Chief Compliance Officer (until 2014) | | N/A |
| | | | |
Laurie J. Thomsen
(age 58) | | Trustee | | March 2005 | | Private investor | | The Travelers Companies, Director; Dycom Industries, Inc., Director |
| | | | |
Robert W. Uek
(age 74) | | Trustee | | January 2006 | | Consultant to investment company industry | | N/A |
| | | | |
| OFFICERS | | | | | | | | |
Christopher R. Bohane (k)
(age 42) | | Assistant Secretary and Assistant Clerk | | July 2005 | | Massachusetts Financial Services Company, Vice President and Assistant General Counsel | | N/A |
| | | | |
Kino Clark (k) (age 47) | | Assistant Treasurer | | January 2012 | | Massachusetts Financial Services Company, Vice President | | N/A |
| | | | |
Kristin V. Collins (k) (age 42) | | Assistant Secretary and Assistant Clerk | | September 2015 | | Massachusetts Financial Services Company, Vice President and Assistant General Counsel | | N/A |
| | | | |
Thomas H. Connors (k) (age 56) | | Assistant Secretary and Assistant Clerk | | September 2012 | | Massachusetts Financial Services Company, Vice President and Senior Counsel; Deutsche Investment Management Americas Inc. (financial service provider), Director and Senior Counsel (until 2012) | | N/A |
21
MFS Global Equity Series
Trustees and Officers – continued
| | | | | | | | |
Name, Age | | Position(s)
Held with Fund | | Trustee/Officer
Since (h) | | Principal Occupations
During the Past Five Years | | Other Directorships (j) |
Ethan D. Corey (k)
(age 52) | | Assistant Secretary and Assistant Clerk | | July 2005 | | Massachusetts Financial Services Company, Senior Vice President and Associate General Counsel | | N/A |
| | | | |
David L. DiLorenzo (k)
(age 47) | | Treasurer | | July 2005 | | Massachusetts Financial Services Company, Senior Vice President | | N/A |
| | | | |
Brian E. Langenfeld (k) (age 42) | | Assistant Secretary and Assistant Clerk | | June 2006 | | Massachusetts Financial Services Company, Vice President and Senior Counsel | | N/A |
| | | | |
Kenneth Paek (k) (age 41) | | Assistant Treasurer | | February 2015 | | Massachusetts Financial Services Company, Vice President; Cohen & Steers, Vice President/Head of Fund Administration (until 2014) | | N/A |
| | | | |
Susan A. Pereira (k)
(age 45) | | Assistant Secretary and Assistant Clerk | | July 2005 | | Massachusetts Financial Services Company, Vice President and Senior Counsel | | N/A |
| | | | |
Kasey L. Phillips (k) (age 45) | | Assistant Treasurer | | September 2012 | | Massachusetts Financial Services Company, Vice President; Wells Fargo Funds Management, LLC, Senior Vice President, Fund Treasurer (until 2012) | | N/A |
| | | | |
Mark N. Polebaum (k)
(age 63) | | Secretary and Clerk | | January 2006 | | Massachusetts Financial Services Company, Executive Vice President, General Counsel and Secretary | | N/A |
| | | | |
Matthew A. Stowe (k) (age 41) | | Assistant Secretary and Assistant Clerk | | October 2014 | | Massachusetts Financial Services Company, Vice President and Assistant General Counsel | | N/A |
| | | | |
Frank L. Tarantino
(age 71) | | Independent Senior Officer | | June 2004 | | Tarantino LLC (provider of compliance services), Principal | | N/A |
| | | | |
Richard S. Weitzel (k)
(age 45) | | Assistant Secretary and Assistant Clerk | | October 2007 | | Massachusetts Financial Services Company, Senior Vice President and Associate General Counsel | | N/A |
| | | | |
Martin J. Wolin (k) (age 48) | | Chief Compliance Officer | | July 2015 | | Massachusetts Financial Services Company, Senior Vice President and Chief Compliance Officer (since July 2015); Mercer (financial service provider), Chief Risk and Compliance Officer, North America and Latin America (until June 2015) | | N/A |
| | | | |
James O. Yost (k)
(age 55) | | Deputy Treasurer | | September 1990 | | Massachusetts Financial Services Company, Senior Vice President | | N/A |
| (h) | Date first appointed to serve as Trustee/officer of an MFS Fund. Each Trustee has served continuously since appointment unless indicated otherwise. For the period from December 15, 2004 until February 22, 2005, Mr. Manning served as Advisory Trustee. Prior to January 2012, Messrs. DiLorenzo and Yost served as Assistant Treasurers of the Funds. Ms. Stelmach was appointed as President of the Funds as of October 1, 2014. |
| (j) | Directorships or trusteeships of companies required to report to the Securities and Exchange Commission (i.e., “public companies”). |
| (k) | “Interested person” of the Trust within the meaning of the Investment Company Act of 1940 (referred to as the 1940 Act), which is the principal federal law governing investment companies like the fund, as a result of a position with MFS. The address of MFS is 111 Huntington Avenue, Boston, Massachusetts 02199-7618. |
Each Trustee (except Ms. Stelmach, Mr. Buller and Ms. Roepke) has been elected by shareholders and each Trustee and officer holds office until his or her successor is chosen and qualified or until his or her earlier death, resignation, retirement or removal. The Trust does not hold annual meetings for the purpose of electing Trustees, and Trustees are not elected for fixed terms. Messrs. Buller, Butler, Kavanaugh, Uek and Ms. Roepke are members of the Trust’s Audit Committee.
Each of the Fund’s Trustees and officers holds comparable positions with certain other funds of which MFS or a subsidiary is the investment adviser or distributor, and, in the case of the officers, with certain affiliates of MFS. As of February 1, 2016, the Trustees served as board members of 137 funds within the MFS Family of Funds.
22
MFS Global Equity Series
Trustees and Officers – continued
The Statement of Additional Information for a Fund includes further information about the Trustees and is available without charge upon request by calling 1-800-225-2606.
| | |
Investment Adviser Massachusetts Financial Services Company 111 Huntington Avenue Boston, MA 02199-7618 | | Custodian State Street Bank and Trust Company 1 Lincoln Street Boston, MA 02111-2900 |
Distributor MFS Fund Distributors, Inc. 111 Huntington Avenue Boston, MA 02199-7618 | | Independent Registered Public Accounting Firm Deloitte & Touche LLP 200 Berkeley Street Boston, MA 02116 |
Portfolio Managers David Mannheim Roger Morley | | |
23
MFS Global Equity Series
BOARD REVIEW OF INVESTMENT ADVISORY AGREEMENT
The Investment Company Act of 1940 requires that both the full Board of Trustees and a majority of the non-interested (“independent”) Trustees, voting separately, annually approve the continuation of the Fund’s investment advisory agreement with MFS. The Trustees consider matters bearing on the Fund and its advisory arrangements at their meetings throughout the year, including a review of performance data at each regular meeting. In addition, the independent Trustees met several times over the course of three months beginning in May and ending in July, 2015 (“contract review meetings”) for the specific purpose of considering whether to approve the continuation of the investment advisory agreement for the Fund and the other investment companies that the Board oversees (the “MFS Funds”). The independent Trustees were assisted in their evaluation of the Fund’s investment advisory agreement by independent legal counsel, from whom they received separate legal advice and with whom they met separately from MFS during various contract review meetings. The independent Trustees were also assisted in this process by the MFS Funds’ Independent Senior Officer, a senior officer appointed by and reporting to the independent Trustees.
In connection with their deliberations regarding the continuation of the investment advisory agreement, the Trustees, including the independent Trustees, considered such information and factors as they believed, in light of the legal advice furnished to them and their own business judgment, to be relevant. The investment advisory agreement for the Fund was considered separately, although the Trustees also took into account the common interests of all MFS Funds in their review. As described below, the Trustees considered the nature, quality, and extent of the various investment advisory, administrative, and shareholder services performed by MFS under the existing investment advisory agreement and other arrangements with the Fund.
In connection with their contract review meetings, the Trustees received and relied upon materials that included, among other items: (i) information provided by Lipper Inc., an independent third party, on the investment performance of the Fund for various time periods ended December 31, 2014 and the investment performance of a group of funds with substantially similar investment classifications/objectives (the “Lipper performance universe”), (ii) information provided by Lipper Inc. on the Fund’s advisory fees and other expenses and the advisory fees and other expenses of comparable funds identified by Lipper Inc. (the “Lipper expense group”), (iii) information provided by MFS on the advisory fees of comparable portfolios of other clients of MFS, including institutional separate accounts and other clients, (iv) information as to whether and to what extent applicable expense waivers, reimbursements or fee “breakpoints” are observed for the Fund, (v) information regarding MFS’ financial results and financial condition, including MFS’ and certain of its affiliates’ estimated profitability from services performed for the Fund and the MFS Funds as a whole, and compared to MFS’ institutional business, (vi) MFS’ views regarding the outlook for the mutual fund industry and the strategic business plans of MFS, (vii) descriptions of various functions performed by MFS for the Funds, such as compliance monitoring and portfolio trading practices, and (viii) information regarding the overall organization of MFS, including information about MFS’ senior management and other personnel providing investment advisory, administrative and other services to the Fund and the other MFS Funds. The comparative performance, fee and expense information prepared and provided by Lipper Inc. was not independently verified and the independent Trustees did not independently verify any information provided to them by MFS.
The Trustees’ conclusion as to the continuation of the investment advisory agreement was based on a comprehensive consideration of all information provided to the Trustees and not the result of any single factor. Some of the factors that figured particularly in the Trustees’ deliberations are described below, although individual Trustees may have evaluated the information presented differently from one another, giving different weights to various factors. It is also important to recognize that the fee arrangements for the Fund and other MFS Funds are the result of years of review and discussion between the independent Trustees and MFS, that certain aspects of such arrangements may receive greater scrutiny in some years than in others, and that the Trustees’ conclusions may be based, in part, on their consideration of these same arrangements during the course of the year and in prior years.
Based on information provided by Lipper Inc. and MFS, the Trustees reviewed the Fund’s total return investment performance as well as the performance of peer groups of funds over various time periods. The Trustees placed particular emphasis on the total return performance of the Fund’s Initial Class shares in comparison to the performance of funds in its Lipper performance universe over the three-year period ended December 31, 2014, which the Trustees believed was a long enough period to reflect differing market conditions. The total return performance of the Fund’s Initial Class shares was in the 2nd quintile relative to the other funds in the universe for this three-year period (the 1st quintile being the best performers and the 5th quintile being the worst performers). The total return performance of the Fund’s Initial Class shares was in the 3rd quintile for each of the one- and five-year periods ended December 31, 2014 relative to the Lipper performance universe. Because of the passage of time, these performance results may differ from the performance results for more recent periods, including those shown elsewhere in this report.
In the course of their deliberations, the Trustees took into account information provided by MFS in connection with the contract review meetings, as well as during investment review meetings conducted with portfolio management personnel during the course of the year regarding the Fund’s performance. After reviewing these and related factors, the Trustees concluded, within the context of their overall conclusions regarding the investment advisory agreement, that they were satisfied with MFS’ responses and efforts relating to investment performance.
In assessing the reasonableness of the Fund’s advisory fee, the Trustees considered, among other information, the Fund’s advisory fee and the total expense ratio of the Fund’s Initial Class shares as a percentage of average daily net assets and the advisory fee and
24
MFS Global Equity Series
Board Review of Investment Advisory Agreement – continued
total expense ratios of peer groups of funds based on information provided by Lipper Inc. The Trustees considered that MFS has agreed in writing to reduce its advisory fee, and that MFS currently observes an expense limitation for the Fund, each of which may not be changed without the Trustees’ approval. The Trustees also considered that, according to the Lipper data (which takes into account any fee reductions or expense limitations that were in effect during the Fund’s last fiscal year), the Fund’s effective advisory fee rate was approximately at the Lipper expense group median and the Fund’s total expense ratio was higher than the Lipper expense group median.
The Trustees also considered the advisory fees charged by MFS to any institutional separate accounts advised by MFS (“separate accounts”) and unaffiliated investment companies for which MFS serves as subadviser (“subadvised funds”) that have comparable investment strategies to the Fund. In comparing these fees, the Trustees considered information provided by MFS as to the generally broader scope of services provided by MFS to the Fund, as well as the more extensive regulatory burdens imposed on MFS in managing the Fund, in comparison to separate accounts and subadvised funds. The Trustees also considered the higher demands placed on MFS’ investment personnel and trading infrastructure as a result of the daily cash in-flows and out-flows of the Fund in comparison to separate accounts.
The Trustees also considered whether the Fund may benefit from any economies of scale in the management of the Fund in the event of growth in assets of the Fund and/or growth in assets of the MFS Funds as a whole. They noted that the Fund’s advisory fee rate schedule is subject to a contractual breakpoint that reduces the Fund’s advisory fee rate on average daily net assets over $1 billion. The Trustees also noted that MFS has agreed in writing to waive a portion of the management fees of certain MFS Funds, including the Fund, if the total combined assets of certain funds within the MFS Funds’ complex increase above agreed upon thresholds (the “group fee waiver”), enabling the Fund’s shareholders to share in the benefits from any economies of scale at the complex level. The group fee waiver is reviewed and renewed annually between the Board and MFS. The Trustees concluded that the breakpoint and the group fee waiver were sufficient to allow the Fund to benefit from economies of scale as its assets and overall complex assets grow.
The Trustees also considered information prepared by MFS relating to MFS’ costs and profits with respect to the Fund, the MFS Funds considered as a group, and other investment companies and accounts advised by MFS, as well as MFS’ methodologies used to determine and allocate its costs to the MFS Funds, the Fund and other accounts and products for purposes of estimating profitability.
After reviewing these and other factors described herein, the Trustees concluded, within the context of their overall conclusions regarding the investment advisory agreement, that the advisory fees charged to the Fund represent reasonable compensation in light of the services being provided by MFS to the Fund.
In addition, the Trustees considered MFS’ resources and related efforts to continue to retain, attract and motivate capable personnel to serve the Fund. The Trustees also considered current and developing conditions in the financial services industry, including the presence of large and well-capitalized companies which are spending, and appear to be prepared to continue to spend, substantial sums to engage personnel and to provide services to competing investment companies. In this regard, the Trustees also considered the financial resources of MFS and its ultimate parent, Sun Life Financial Inc. The Trustees also considered the advantages and possible disadvantages to the Fund of having an adviser that also serves other investment companies as well as other accounts.
The Trustees also considered the nature, quality, cost, and extent of administrative, transfer agency, and distribution services provided to the Fund by MFS and its affiliates under agreements and plans other than the investment advisory agreement, including any 12b-1 fees the Fund pays to MFS Fund Distributors, Inc., an affiliate of MFS. The Trustees also considered the nature, extent and quality of certain other services MFS performs or arranges for on the Fund’s behalf, which may include securities lending programs, directed expense payment programs, class action recovery programs, and MFS’ interaction with third-party service providers, principally custodians and sub-custodians. The Trustees concluded that the various non-advisory services provided by MFS and its affiliates on behalf of the Fund were satisfactory.
The Trustees also considered benefits to MFS from the use of the Fund’s portfolio brokerage commissions, if applicable, to pay for investment research and various other factors. Additionally, the Trustees considered so-called “fall-out benefits” to MFS such as reputational value derived from serving as investment manager to the Fund.
Based on their evaluation of factors that they deemed to be material, including those factors described above, the Board of Trustees, including the independent Trustees, concluded that the Fund’s investment advisory agreement with MFS should be continued for an additional one-year period, commencing August 1, 2015.
25
MFS Global Equity Series
PROXY VOTING POLICIES AND INFORMATION
MFS votes proxies on behalf of the fund pursuant to proxy voting policies and procedures that are available without charge, upon request, by calling 1-800-225-2606, by visiting the Proxy Voting section of mfs.com or by visiting the SEC’s Web site at http://www.sec.gov.
Information regarding how the fund voted proxies relating to portfolio securities during the most recent twelve-month period ended June 30 is available without charge by visiting the Proxy Voting section of mfs.com or by visiting the SEC’s Web site at http://www.sec.gov.
QUARTERLY PORTFOLIO DISCLOSURE
The fund will file a complete schedule of portfolio holdings with the Securities and Exchange Commission (the Commission) for the first and third quarters of each fiscal year on Form N-Q. The fund’s Form N-Q is available on the EDGAR database on the Commission’s Internet Web site at http://www.sec.gov, and may be reviewed and copied at the:
Public Reference Room
Securities and Exchange Commission
100 F Street, NE, Room 1580
Washington, D.C. 20549
Information on the operation of the Public Reference Room may be obtained by calling the Commission at 1-800-SEC-0330. Copies of the fund’s Form N-Q also may be obtained, upon payment of a duplicating fee, by electronic request at the following e-mail address: publicinfo@sec.gov or by writing the Public Reference Section at the above address.
FURTHER INFORMATION
From time to time, MFS may post important information about the fund or the MFS funds on the MFS web site (mfs.com). This information is available by visiting the “Market Commentary” and “Announcements” sub sections in the “Market Outlooks” section of mfs.com or by clicking on the fund’s name under “Variable Insurance Portfolios — VIT” in the “Products” section of mfs.com.
FEDERAL TAX INFORMATION (unaudited)
The following information is provided pursuant to provisions of the Internal Revenue Code.
The fund designates $1,895,000 as capital gain dividends paid during the fiscal year.
For corporate shareholders, 52.38% of the ordinary income dividends paid during the fiscal year qualify for the corporate dividends received deduction.
26
rev. 3/11
| | | | |
| FACTS | | WHAT DOES MFS DO WITH YOUR
PERSONAL INFORMATION? | |  |
| | |
| Why? | | Financial companies choose how they share your personal information. Federal law gives consumers the right to limit some but not all sharing. Federal law also requires us to tell you how we collect, share, and protect your personal information. Please read this notice carefully to understand what we do. |
| | |
| What? | | The types of personal information we collect and share depend on the product or service you have with us. This information can include: • Social Security number and account balances • Account transactions and transaction history • Checking account information and wire transfer instructions When you are no longer our customer, we continue to share your information as described in this notice. |
| | |
| How? | | All financial companies need to share customers’ personal information to run their everyday business. In the section below, we list the reasons financial companies can share their customers’ personal information; the reasons MFS chooses to share; and whether you can limit this sharing. |
| | | | |
Reasons we can share your
personal information | | Does MFS share? | | Can you limit this
sharing? |
For our everyday business purposes – such as to process your transactions, maintain your account(s), respond to court orders and legal investigations, or report to credit bureaus | | Yes | | No |
For our marketing purposes – to offer our products and services to you | | No | | We don’t share |
| For joint marketing with other financial companies | | No | | We don’t share |
For our affiliates’ everyday business purposes – information about your transactions and experiences | | No | | We don’t share |
For our affiliates’ everyday business purposes – information about your creditworthiness | | No | | We don’t share |
| For nonaffiliates to market to you | | No | | We don’t share |
| | |
| Questions? | | Call 800-225-2606 or go to mfs.com. |
27
| | |
| Who we are |
| Who is providing this notice? | | MFS Funds, MFS Investment Management, MFS Institutional Advisors, Inc., MFS Fund Distributors, Inc., MFS Heritage Trust Company, and MFS Service Center, Inc. |
| | |
| What we do |
| How does MFS protect my personal information? | | To protect your personal information from unauthorized access and use, we use security measures that comply with federal law. These measures include procedural, electronic, and physical safeguards for the protection of the personal information we collect about you. |
How does MFS
collect my personal information? | | We collect your personal information, for example, when you • open an account or provide account information • direct us to buy securities or direct us to sell your securities • make a wire transfer We also collect your personal information from others, such as credit bureaus, affiliates and other companies. |
| Why can’t I limit all sharing? | | Federal law gives you the right to limit only • sharing for affiliates’ everyday business purposes – information about your creditworthiness • affiliates from using your information to market to you • sharing for nonaffiliates to market to you State laws and individual companies may give you additional rights to limit sharing. |
| | |
| Definitions |
| Affiliates | | Companies related by common ownership or control. They can be financial and nonfinancial companies. • MFS does not share personal information with affiliates, except for everyday business purposes as described on page one of this notice. |
| Nonaffiliates | | Companies not related by common ownership or control. They can be financial and nonfinancial companies. • MFS does not share with nonaffiliates so they can market to you. |
| Joint Marketing | | A formal agreement between nonaffiliated financial companies that together market financial products or services to you. • MFS doesn’t jointly market. |
| | |
| Other important information |
| If you own an MFS product or receive an MFS service in the name of a third party such as a bank or broker-dealer, their privacy policy may apply to you instead of ours. |
28
ANNUAL REPORT
December 31, 2015

MFS® GROWTH SERIES
MFS® Variable Insurance Trust

VEG-ANN
MFS® GROWTH SERIES
CONTENTS
The report is prepared for the general information of contract owners. It is authorized for distribution to prospective investors only when preceded or accompanied by a current prospectus.
NOT FDIC INSURED • MAY LOSE VALUE • NO BANK OR CREDIT UNION GUARANTEE • NOT A DEPOSIT • NOT INSURED BY ANY FEDERAL GOVERNMENT AGENCY OR NCUA/NCUSIF
MFS Growth Series
LETTER FROM THE CHAIRMAN

Dear Contract Owners:
Central bank policies remain center stage as the U.S. Federal Reserve made good on its pledge to raise policy rates for the first time in over nine years at its December meeting. The Fed’s actions stand in stark contrast to those of the European Central Bank and Bank of Japan, which modestly extended their quantitative easing programs in December.
In the United States, auto sales remain a source of economic strength, but housing demand has slowed of late. The U.S. economic expansion remains moderate but uneven, with a strong dollar crimping demand for U.S. goods abroad. China’s shift to a consumer-led economy continues to weigh on its manufacturing and exports, as does weak global demand. Slackening demand from China continues to undermine commodity markets, with oil particularly impacted amid a global supply glut.
As markets have become more focused on short-term trends in recent years, we believe it’s important for investors to lengthen their investment time horizon. At MFS®, we don’t trade on headlines or trends; we invest for the long term.
We believe that this approach, coupled with the professional guidance of a financial advisor, will help you reach your investment goals.
Respectfully,

Robert J. Manning
Chairman
MFS Investment Management
February 16, 2016
The opinions expressed in this letter are subject to change and may not be relied upon for investment advice. No forecasts can be guaranteed.
1
MFS Growth Series
PORTFOLIO COMPOSITION
Portfolio structure

| | | | |
| Top ten holdings | | | | |
| Visa, Inc., “A” | | | 4.0% | |
| Amazon.com, Inc. | | | 4.0% | |
| Alphabet, Inc., “A” | | | 3.8% | |
| Facebook, Inc., “A” | | | 3.4% | |
| Alphabet, Inc., “C” | | | 3.2% | |
| MasterCard, Inc., “A” | | | 2.9% | |
| Thermo Fisher Scientific, Inc. | | | 2.6% | |
| Danaher Corp. | | | 2.6% | |
| Adobe Systems, Inc. | | | 2.4% | |
| Apple, Inc. | | | 2.3% | |
| | | | |
| Equity sectors | | | | |
| Technology | | | 22.7% | |
| Health Care | | | 17.8% | |
| Retailing | | | 17.0% | |
| Financial Services | | | 10.6% | |
| Leisure | | | 6.7% | |
| Special Products & Services | | | 6.4% | |
| Consumer Staples | | | 5.7% | |
| Industrial Goods & Services | | | 5.2% | |
| Autos & Housing | | | 2.3% | |
| Utilities & Communications | | | 2.2% | |
| Basic Materials | | | 1.4% | |
| Transportation | | | 1.0% | |
| Energy | | | 0.3% | |
Cash & Cash Equivalents includes any cash, investments in money market funds, short-term securities, and other assets less liabilities. Please see the Statement of Assets and Liabilities for additional information related to the fund’s cash position and other assets and liabilities.
Percentages are based on net assets as of 12/31/15.
The portfolio is actively managed and current holdings may be different.
2
MFS Growth Series
MANAGEMENT REVIEW
Summary of Results
For the twelve months ended December 31, 2015, Initial Class shares of the MFS Growth Series (“fund”) provided a total return of 7.56%, while Service Class shares of the fund provided a total return of 7.30%. These compare with a return of 5.67% over the same period for the fund’s benchmark, the Russell 1000 Growth Index.
Market Environment
Sluggish global growth weighed on both developed and emerging market (“EM”) economies during the reporting period. EM economies have been particularly lackluster. While the US Federal Reserve began its anticipated monetary policy tightening cycle at the end of the period, other large developed economies continued to embrace accommodative monetary policies, particularly the European Central Bank and the Bank of Japan. Focus remained on China after policy missteps by the Chinese government roiled global markets over the summer, beginning with the uncoordinated response to the stock market’s boom and bust and then the confusing decision to devalue the renminbi in August. China subsequently ramped up a wide range of monetary and fiscal measures to stimulate the economy and bolster sentiment. Its economy appeared to stabilize late in the period. Also at the end of the period, the Chinese renminbi was granted reserve currency status by the International Monetary Fund (“IMF”), which announced its inclusion in the IMF’s Special Drawing Rights currency basket effective October 1, 2016.
During the second half of the reporting period, the US faced an earnings recession caused primarily by the sharp decline in the prices of oil and other commodities. Earnings contractions were concentrated primarily in the energy, materials and industrial sectors. An additional headwind for earnings was the sharp rise in the US dollar over the period. Exports were crimped by the dollar’s strength and falling demand in emerging markets. Consumer spending held up well during the second half of the period amid a modest increase in real wages and a tailwind from falling gasoline prices. Demand for autos reached near-record territory late in the period. In emerging markets, two key factors weighed on economies and asset prices: 1) weaker Chinese growth, which drove the decline in commodity prices and 2) prospects for higher US interest rates. Structural factors like floating exchange rates and fiscal buffers partially offset these cyclical headwinds.
Contributors to Performance
Stock selection in the technology sector contributed to performance relative to the Russell 1000 Growth Index. The fund’s overweight positions in strong-performing internet search company Alphabet (formerly Google), software company Adobe Systems, social networking service provider Facebook and cloud computing company Salesforce.com supported relative returns. Shares of Alphabet rose after the company posted strong earnings results during the period. Both the YouTube and mobile search segments were among key top-line growth drivers, while tight expense discipline also aided results. An underweight position in computer and personal electronics maker Apple also benefited relative performance.
Stock selection in the industrial goods & services sector and an underweight position in the basic materials sector further contributed to relative performance. However, there were no stocks within either sector that were among the fund’s top relative contributors over the reporting period.
Stock selection in the financial services sector further aided relative performance. An overweight position in global payments technology company Visa aided relative results. Shares of Visa climbed during the period as strong revenue growth that outpaced forecasts and the announced acquisition of Visa Europe benefited results.
Elsewhere, overweight positions in on-demand Internet streaming media provider Netflix, producer and marketer of beer, wine and spirits Constellation Brands, internet retailer Amazon.com and coffeehouse chain Starbucks bolstered relative returns. Shares of Netflix rose following high levels of growth in both the United States and international markets.
Detractors from Performance
An underweight position in the consumer staples sector detracted from relative performance. However, there were no stocks within this sector that were among the fund’s top relative detractors over the reporting period.
Security selection in the transportation sector also hurt relative performance. The fund’s holdings of Canadian railway and transportation company Canadian Pacific Railway (b) and an overweight position in low-fare airline company Spirit Airlines (h) were among the fund’s top relative detractors over the reporting period. Shares of Canadian Pacific Railway fell despite reporting earnings results that were in line with consensus expectations during the period, it appeared that investor concerns surrounding weaker carload volumes for coal, metals and crude weighed on the company’s share price.
Individual stocks that detracted from relative performance included overweight positions in media firm 21st Century Fox, information technology company EMC Corp (h), biotechnology company Biogen and apparel and footwear company VF Corporation. Shares of 21st Century Fox fell following negative market sentiment towards the company’s lower-than-expected full year guidance for 2015 and 2016.
3
MFS Growth Series
Management Review – continued
Not holding shares of home improvement and building materials retailer Home Depot and fast food restaurant McDonalds, and an underweight position in software giant Microsoft, weighed on relative performance. The fund’s position in biotechnology company Valeant Pharmaceuticals (b)(h) also hampered relative results.
Respectfully,
| | |
| Eric Fischman | | Matthew Sabel |
| Portfolio Manager | | Portfolio Manager |
| (b) | Security is not a benchmark constituent. |
| (h) | Security was not held in the portfolio at period end. |
The views expressed in this report are those of the portfolio managers only through the end of the period of the report as stated on the cover and do not necessarily reflect the views of MFS or any other person in the MFS organization. These views are subject to change at any time based on market or other conditions, and MFS disclaims any responsibility to update such views. These views may not be relied upon as investment advice or an indication of trading intent on behalf of any MFS portfolio. References to specific securities are not recommendations of such securities, and may not be representative of any MFS portfolio’s current or future investments.
4
MFS Growth Series
PERFORMANCE SUMMARY THROUGH 12/31/15
The following chart illustrates the historical performance of the fund in comparison to its benchmark(s). Benchmarks are unmanaged and may not be invested in directly. Benchmark returns do not reflect any fees or expenses. The performance of other share classes will be greater than or less than that of the class depicted below. (See Notes to Performance Summary.)
Performance data shown represents past performance and is no guarantee of future results. Investment return and principal value fluctuate so your units, when sold, may be worth more or less than the original cost; current performance may be lower or higher than quoted. The performance shown does not reflect the deduction of taxes, if any, that a contract holder would pay on fund distributions or the redemption of contract units. The returns for the fund shown also do not reflect the deduction of expenses associated with variable products, such as mortality and expense risk charges, separate account charges, and sales charges imposed by the insurance company separate accounts. Such expenses would reduce the overall returns shown.
Growth of a Hypothetical $10,000 Investment
Total Returns through 12/31/15
Average annual total returns
| | | | | | | | | | | | |
| | | Share Class | | Class Inception Date | | 1-yr | | 5-yr | | 10-yr | | |
| | | Initial Class | | 7/24/95 | | 7.56% | | 13.41% | | 9.32% | | |
| | | Service Class | | 5/01/00 | | 7.30% | | 13.13% | | 9.05% | | |
| | | | |
| Comparative benchmark | | | | | | | | |
| | | Russell 1000 Growth Index (f) | | 5.67% | | 13.53% | | 8.53% | | |
| (f) | Source: FactSet Research Systems Inc. |
Benchmark Definition
Russell 1000 Growth Index – constructed to provide a comprehensive barometer for growth securities in the large-cap segment of the U.S. equity universe. Companies in this index generally have higher price-to-book ratios and higher forecasted growth values.
It is not possible to invest directly in an index.
Notes to Performance Summary
Average annual total return represents the average annual change in value for each share class for the periods presented.
Performance results reflect any applicable expense subsidies and waivers in effect during the periods shown. Without such subsidies and waivers the fund’s performance results would be less favorable. Please see the prospectus and financial statements for complete details. All results are historical and assume the reinvestment of any dividends and capital gains distributions.
Performance results do not include adjustments made for financial reporting purposes in accordance with U.S. generally accepted accounting principles and may differ from amounts reported in the financial highlights.
From time to time the fund may receive proceeds from litigation settlements, without which performance would be lower.
5
MFS Growth Series
EXPENSE TABLE
Fund Expenses Borne by the Contract Holders during the Period,
July 1, 2015 through December 31, 2015
As a contract holder of the fund, you incur ongoing costs, including management fees; distribution and/or service (12b-1) fees; and other fund expenses. This example is intended to help you understand your ongoing costs (in dollars) of investing in the fund and to compare these costs with the ongoing costs of investing in other mutual funds.
The example is based on an investment of $1,000 invested at the beginning of the period and held for the entire period July 1, 2015 through December 31, 2015.
Actual Expenses
The first line for each share class in the following table provides information about actual account values and actual expenses. You may use the information in this line, together with the amount you invested, to estimate the expenses that you paid over the period. Simply divide your account value by $1,000 (for example, an $8,600 account value divided by $1,000 = 8.6), then multiply the result by the number in the first line under the heading entitled “Expenses Paid During Period” to estimate the expenses you paid on your account during this period.
Hypothetical Example for Comparison Purposes
The second line for each share class in the following table provides information about hypothetical account values and hypothetical expenses based on the fund’s actual expense ratio and an assumed rate of return of 5% per year before expenses, which is not the fund’s actual return. The hypothetical account values and expenses may not be used to estimate the actual ending account balance or expenses you paid for the period. You may use this information to compare the ongoing costs of investing in the fund and other funds. To do so, compare this 5% hypothetical example with the 5% hypothetical examples that appear in the shareholder reports of the other funds.
Please note that the expenses shown in the table are meant to highlight the fund’s ongoing costs only and do not take into account the fees and expenses imposed under the variable contracts through which your investment in the fund is made. Therefore, the second line for each share class in the table is useful in comparing ongoing costs associated with an investment in vehicles (such as the fund) which fund benefits under variable annuity and variable life insurance contracts and to qualified pension and retirement plans only, and will not help you determine the relative total costs of investing in the fund through variable annuity and variable life insurance contracts. If the fees and expenses imposed under the variable contracts were included, your costs would have been higher.
| | | | | | | | | | | | | | | | | | |
| Share Class | | | | Annualized
Expense Ratio | | | Beginning
Account Value
7/01/15 | | | Ending
Account Value
12/31/15 | | | Expenses Paid
During Period (p)
7/01/15-12/31/15 | |
| Initial Class | | Actual | | | 0.76% | | | | $1,000.00 | | | | $1,036.73 | | | | $3.90 | |
| | Hypothetical (h) | | | 0.76% | | | | $1,000.00 | | | | $1,021.37 | | | | $3.87 | |
| Service Class | | Actual | | | 1.01% | | | | $1,000.00 | | | | $1,035.36 | | | | $5.18 | |
| | Hypothetical (h) | | | 1.01% | | | | $1,000.00 | | | | $1,020.11 | | | | $5.14 | |
| (h) | 5% class return per year before expenses. |
| (p) | “Expenses Paid During Period” are equal to each class’s annualized expense ratio, as shown above, multiplied by the average account value over the period, multiplied by 184/365 (to reflect the one-half year period). |
6
MFS Growth Series
PORTFOLIO OF INVESTMENTS – 12/31/15
The Portfolio of Investments is a complete list of all securities owned by your fund. It is categorized by broad-based asset classes.
| | | | | | | | |
| Issuer | | Shares/Par | | | Value ($) | |
| | | | | | | | |
| COMMON STOCKS – 99.3% | | | | | |
| Aerospace – 0.6% | | | | | | | | |
| Honeywell International, Inc. | | | 59,217 | | | $ | 6,133,100 | |
| Rockwell Collins, Inc. | | | 28,390 | | | | 2,620,397 | |
| | | | | | | | |
| | | | | | $ | 8,753,497 | |
| | | | | | | | |
| Alcoholic Beverages – 1.7% | | | | | | | | |
| Constellation Brands, Inc., “A” | | | 146,757 | | | $ | 20,904,067 | |
| Pernod Ricard S.A. | | | 36,540 | | | | 4,154,269 | |
| | | | | | | | |
| | | | | | $ | 25,058,336 | |
| | | | | | | | |
| Apparel Manufacturers – 1.5% | | | | | |
| LVMH Moet Hennessy Louis Vuitton S.A. | | | 18,777 | | | $ | 2,935,346 | |
| NIKE, Inc., “B” | | | 211,878 | | | | 13,242,375 | |
| VF Corp. | | | 97,394 | | | | 6,062,777 | |
| | | | | | | | |
| | | | | | $ | 22,240,498 | |
| | | | | | | | |
| Biotechnology – 5.4% | | | | | | | | |
| Alexion Pharmaceuticals, Inc. (a) | | | 111,100 | | | $ | 21,192,325 | |
| Biogen, Inc. (a) | | | 24,837 | | | | 7,608,815 | |
| Celgene Corp. (a) | | | 199,289 | | | | 23,866,851 | |
| Gilead Sciences, Inc. | | | 51,732 | | | | 5,234,761 | |
| Regeneron Pharmaceuticals, Inc. (a) | | | 31,761 | | | | 17,242,094 | |
| Vertex Pharmaceuticals, Inc. (a) | | | 42,015 | | | | 5,286,747 | |
| | | | | | | | |
| | | | | | $ | 80,431,593 | |
| | | | | | | | |
| Broadcasting – 0.3% | | | | | | | | |
| Twenty-First Century Fox, Inc. | | | 164,890 | | | $ | 4,478,412 | |
| | | | | | | | |
| Brokerage & Asset Managers – 3.6% | | | | | |
| Affiliated Managers Group, Inc. (a) | | | 13,696 | | | $ | 2,188,073 | |
| BlackRock, Inc. | | | 29,720 | | | | 10,120,254 | |
| Charles Schwab Corp. | | | 405,640 | | | | 13,357,725 | |
| Intercontinental Exchange, Inc. | | | 111,218 | | | | 28,500,725 | |
| | | | | | | | |
| | | | | | $ | 54,166,777 | |
| | | | | | | | |
| Business Services – 4.8% | | | | | | | | |
| Cognizant Technology Solutions Corp., “A” (a) | | | 281,583 | | | $ | 16,900,612 | |
| Equifax, Inc. | | | 88,269 | | | | 9,830,519 | |
| Fiserv, Inc. (a) | | | 218,311 | | | | 19,966,724 | |
| FleetCor Technologies, Inc. (a) | | | 84,254 | | | | 12,042,424 | |
| Realogy Holdings Corp. (a) | | | 107,497 | | | | 3,941,915 | |
| Verisk Analytics, Inc., “A” (a) | | | 115,278 | | | | 8,862,573 | |
| | | | | | | | |
| | | | | | $ | 71,544,767 | |
| | | | | | | | |
| Cable TV – 1.3% | | | | | | | | |
| Comcast Corp., “A” | | | 337,814 | | | $ | 19,062,844 | |
| | | | | | | | |
| Chemicals – 0.8% | | | | | | | | |
| Monsanto Co. | | | 121,825 | | | $ | 12,002,199 | |
| | | | | | | | |
| Computer Software – 7.1% | | | | | | | | |
| Adobe Systems, Inc. (a) | | | 385,480 | | | $ | 36,211,991 | |
| Akamai Technologies, Inc. (a) | | | 27,297 | | | | 1,436,641 | |
| Intuit, Inc. | | | 153,563 | | | | 14,818,830 | |
| Microsoft Corp. | | | 473,847 | | | | 26,289,032 | |
| | | | | | | | |
| Issuer | | Shares/Par | | | Value ($) | |
| | | | | | | | |
| COMMON STOCKS – continued | | | | | |
| Computer Software – continued | | | | | |
| Salesforce.com, Inc. (a) | | | 343,391 | | | $ | 26,921,854 | |
| | | | | | | | |
| | | | | | $ | 105,678,348 | |
| | | | | | | | |
| Computer Software – Systems – 2.8% | | | | | |
| Apple, Inc. | | | 322,336 | | | $ | 33,929,087 | |
| IMS Health Holdings, Inc. (a) | | | 96,526 | | | | 2,458,517 | |
| Sabre Corp. | | | 205,096 | | | | 5,736,535 | |
| | | | | | | | |
| | | | | | $ | 42,124,139 | |
| | | | | | | | |
| Construction – 2.2% | | | | | | | | |
| Sherwin-Williams Co. | | | 77,725 | | | $ | 20,177,410 | |
| Vulcan Materials Co. | | | 142,961 | | | | 13,577,006 | |
| | | | | | | | |
| | | | | | $ | 33,754,416 | |
| | | | | | | | |
| Consumer Products – 2.0% | | | | | | | | |
| Colgate-Palmolive Co. | | | 208,675 | | | $ | 13,901,929 | |
| Estee Lauder Cos., Inc., “A” | | | 178,638 | | | | 15,730,862 | |
| | | | | | | | |
| | | | | | $ | 29,632,791 | |
| | | | | | | | |
| Consumer Services – 1.7% | | | | | | | | |
| Priceline Group, Inc. (a) | | | 19,518 | | | $ | 24,884,474 | |
| | | | | | | | |
| Electrical Equipment – 3.6% | | | | | | | | |
| AMETEK, Inc. | | | 262,351 | | | $ | 14,059,390 | |
| Danaher Corp. | | | 423,717 | | | | 39,354,835 | |
| | | | | | | | |
| | | | | | $ | 53,414,225 | |
| | | | | | | | |
| Electronics – 1.3% | | | | | | | | |
| Avago Technologies Ltd. | | | 94,392 | | | $ | 13,700,999 | |
| NVIDIA Corp. | | | 123,671 | | | | 4,076,196 | |
| NXP Semiconductors N.V. (a) | | | 18,988 | | | | 1,599,739 | |
| | | | | | | | |
| | | | | | $ | 19,376,934 | |
| | | | | | | | |
| Energy – Independent – 0.1% | | | | | | | | |
| Anadarko Petroleum Corp. | | | 22,146 | | | $ | 1,075,853 | |
| | | | | | | | |
| Entertainment – 1.4% | | | | | | | | |
| Netflix, Inc. (a) | | | 187,575 | | | $ | 21,454,829 | |
| | | | | | | | |
| Food & Beverages – 2.0% | | | | | | | | |
| Danone S.A. | | | 107,985 | | | $ | 7,287,625 | |
| Mead Johnson Nutrition Co., “A” | | | 105,860 | | | | 8,357,647 | |
| Mondelez International, Inc. | | | 336,134 | | | | 15,072,249 | |
| | | | | | | | |
| | | | | | $ | 30,717,521 | |
| | | | | | | | |
| Food & Drug Stores – 1.9% | | | | | | | | |
| CVS Health Corp. | | | 219,712 | | | $ | 21,481,242 | |
| Walgreens Boots Alliance, Inc. | | | 84,154 | | | | 7,166,134 | |
| | | | | | | | |
| | | | | | $ | 28,647,376 | |
| | | | | | | | |
| Gaming & Lodging – 0.6% | | | | | | | | |
| Marriott International, Inc., “A” | | | 128,823 | | | $ | 8,636,294 | |
| | | | | | | | |
| General Merchandise – 3.8% | | | | | | | | |
| Costco Wholesale Corp. | | | 155,105 | | | $ | 25,049,458 | |
| Dollar General Corp. | | | 179,144 | | | | 12,875,079 | |
7
MFS Growth Series
Portfolio of Investments – continued
| | | | | | | | |
| Issuer | | Shares/Par | | | Value ($) | |
| | | | | | | | |
| COMMON STOCKS – continued | | | | | |
| General Merchandise – continued | | | | | |
| Dollar Tree, Inc. (a) | | | 253,774 | | | $ | 19,596,428 | |
| | | | | | | | |
| | | | | | $ | 57,520,965 | |
| | | | | | | | |
| Internet – 11.5% | | | | | | | | |
| Alphabet, Inc., “A” (a) | | | 72,986 | | | $ | 56,783,838 | |
| Alphabet, Inc., “C” (a) | | | 62,292 | | | | 47,272,153 | |
| Facebook, Inc., “A“ (a) | | | 486,663 | | | | 50,934,150 | |
| LinkedIn Corp., “A” (a) | | | 79,364 | | | | 17,863,249 | |
| | | | | | | | |
| | | | | | $ | 172,853,390 | |
| | | | | | | | |
| Machinery & Tools – 1.1% | | | | | | | | |
| Roper Technologies, Inc. | | | 83,863 | | | $ | 15,916,359 | |
| | | | | | | | |
| Medical & Health Technology & Services – 1.0% | |
| McKesson Corp. | | | 73,658 | | | $ | 14,527,567 | |
| | | | | | | | |
| Medical Equipment – 6.3% | | | | | | | | |
| Abbott Laboratories | | | 340,726 | | | $ | 15,302,005 | |
| C.R. Bard, Inc. | | | 42,539 | | | | 8,058,588 | |
| Cooper Cos., Inc. | | | 36,376 | | | | 4,881,659 | |
| Medtronic PLC | | | 251,250 | | | | 19,326,150 | |
| Stryker Corp. | | | 51,744 | | | | 4,809,087 | |
| Thermo Fisher Scientific, Inc. | | | 278,650 | | | | 39,526,503 | |
| VWR Corp. (a) | | | 99,920 | | | | 2,828,735 | |
| | | | | | | | |
| | | | | | $ | 94,732,727 | |
| | | | | | | | |
| Oil Services – 0.2% | | | | | | | | |
| Schlumberger Ltd. | | | 37,330 | | | $ | 2,603,768 | |
| | | | | | | | |
| Other Banks & Diversified Financials – 6.9% | |
| MasterCard, Inc., “A” | | | 447,260 | | | $ | 43,545,234 | |
| Visa, Inc., “A” | | | 780,819 | | | | 60,552,513 | |
| | | | | | | | |
| | | | | | $ | 104,097,747 | |
| | | | | | | | |
| Pharmaceuticals – 5.1% | | | | | | | | |
| Allergan PLC (a) | | | 96,193 | | | $ | 30,060,313 | |
| Bristol-Myers Squibb Co. | | | 396,605 | | | | 27,282,458 | |
| Eli Lilly & Co. | | | 177,779 | | | | 14,979,659 | |
| Zoetis, Inc. | | | 97,677 | | | | 4,680,682 | |
| | | | | | | | |
| | | | | | $ | 77,003,112 | |
| | | | | | | | |
| Printing & Publishing – 0.3% | | | | | | | | |
| Moody’s Corp. | | | 38,974 | | | $ | 3,910,651 | |
| | | | | | | | |
| Railroad & Shipping – 0.8% | | | | | | | | |
| Canadian Pacific Railway Ltd. | | | 68,937 | | | $ | 8,796,361 | |
| Union Pacific Corp. | | | 47,018 | | | | 3,676,808 | |
| | | | | | | | |
| | | | | | $ | 12,473,169 | |
| | | | | | | | |
| Restaurants – 2.9% | | | | | | | | |
| Aramark | | | 536,599 | | | $ | 17,305,318 | |
| Starbucks Corp. | | | 435,878 | | | | 26,165,756 | |
| | | | | | | | |
| | | | | | $ | 43,471,074 | |
| | | | | | | | |
| Specialty Chemicals – 0.6% | | | | | | | | |
| Ecolab, Inc. | | | 78,703 | | | $ | 9,002,049 | |
| | | | | | | | |
| Specialty Stores – 9.7% | | | | | | | | |
| Amazon.com, Inc. (a) | | | 87,720 | | | $ | 59,289,071 | |
| AutoZone, Inc. (a) | | | 25,214 | | | | 18,706,519 | |
| | | | | | | | |
| Issuer | | Shares/Par | | | Value ($) | |
| | | | | | | | |
| COMMON STOCKS – continued | | | | | |
| Specialty Stores – continued | | | | | |
| Burlington Stores, Inc. (a) | | | 95,511 | | | $ | 4,097,422 | |
| Ross Stores, Inc. | | | 607,614 | | | | 32,695,709 | |
| TJX Cos., Inc. | | | 335,388 | | | | 23,782,363 | |
| Tractor Supply Co. | | | 84,014 | | | | 7,183,197 | |
| | | | | | | | |
| | | | | | $ | 145,754,281 | |
| | | | | | | | |
| Telecommunications – Wireless – 2.2% | | | | | |
| American Tower Corp., REIT | | | 338,813 | | | $ | 32,847,920 | |
| | | | | | | | |
| Trucking – 0.2% | | | | | | | | |
| FedEx Corp. | | | 20,234 | | | $ | 3,014,664 | |
| | | | | | | | |
Total Common Stocks
(Identified Cost, $961,956,215) | | | | | | $ | 1,486,865,566 | |
| | | | | | | | |
| |
| MONEY MARKET FUNDS – 0.9% | | | | | |
| MFS Institutional Money Market Portfolio, 0.19%, at Cost and Net Asset Value (v) | | | 13,301,115 | | | $ | 13,301,115 | |
| | | | | | | | |
Total Investments
(Identified Cost, $975,257,330) | | | | | | $ | 1,500,166,681 | |
| | | | | | | | |
OTHER ASSETS, LESS
LIABILITIES – (0.2)% | | | | (2,269,197 | ) |
| | | | | | | | |
| NET ASSETS – 100.0% | | | | | | $ | 1,497,897,484 | |
| | | | | | | | |
| (a) | | Non-income producing security. |
| (v) | | Underlying affiliated fund that is available only to investment companies managed by MFS. The rate quoted for the MFS Institutional Money Market Portfolio is the annualized seven-day yield of the fund at period end. |
The following abbreviations are used in this report and are defined:
| PLC | | Public Limited Company |
| REIT | | Real Estate Investment Trust |
See Notes to Financial Statements
8
MFS Growth Series
FINANCIAL STATEMENTS | STATEMENT OF ASSETS AND LIABILITIES
This statement represents your fund’s balance sheet, which details the assets and liabilities comprising the total value of the fund.
| | | | | | | | |
At 12/31/15 | | | | | | | | |
Assets | | | | | | | | |
Investments | | | | | | | | |
Non-affiliated issuers, at value (identified cost, $961,956,215) | | | $1,486,865,566 | | | | | |
Underlying affiliated funds, at cost and value | | | 13,301,115 | | | | | |
Total investments, at value (identified cost, $975,257,330) | | | $1,500,166,681 | | | | | |
Receivables for | | | | | | | | |
Investments sold | | | 2,332,056 | | | | | |
Fund shares sold | | | 1,436,304 | | | | | |
Interest and dividends | | | 786,426 | | | | | |
Other assets | | | 8,912 | | | | | |
Total assets | | | | | | | $1,504,730,379 | |
Liabilities | | | | | | | | |
Payables for | | | | | | | | |
Investments purchased | | | $4,163,404 | | | | | |
Fund shares reacquired | | | 2,426,343 | | | | | |
Payable to affiliates | | | | | | | | |
Investment adviser | | | 60,136 | | | | | |
Shareholder servicing costs | | | 561 | | | | | |
Distribution and/or service fees | | | 3,119 | | | | | |
Payable for independent Trustees’ compensation | | | 14 | | | | | |
Accrued expenses and other liabilities | | | 179,318 | | | | | |
Total liabilities | | | | | | | $6,832,895 | |
Net assets | | | | | | | $1,497,897,484 | |
Net assets consist of | | | | | | | | |
Paid-in capital | | | $886,074,444 | | | | | |
Unrealized appreciation (depreciation) on investments and translation of assets and liabilities in foreign currencies | | | 524,909,360 | | | | | |
Accumulated net realized gain (loss) on investments and foreign currency | | | 86,142,371 | | | | | |
Undistributed net investment income | | | 771,309 | | | | | |
Net assets | | | | | | | $1,497,897,484 | |
Shares of beneficial interest outstanding | | | | | | | 37,442,803 | |
| | | | | | | | | | | | |
| | | Net assets | | | Shares
outstanding | | | Net asset value
per share | |
Initial Class | | | $1,273,203,939 | | | | 31,694,388 | | | | $40.17 | |
Service Class | | | 224,693,545 | | | | 5,748,415 | | | | 39.09 | |
See Notes to Financial Statements
9
MFS Growth Series
FINANCIAL STATEMENTS | STATEMENT OF OPERATIONS
This statement describes how much your fund earned in investment income and accrued in expenses. It also describes any gains and/or losses generated by fund operations.
| | | | | | | | |
Year ended 12/31/15 | | | | | | | | |
Net investment income | | | | | | | | |
Income | | | | | | | | |
Dividends | | | $13,069,134 | | | | | |
Interest | | | 21,688 | | | | | |
Dividends from underlying affiliated funds | | | 28,439 | | | | | |
Foreign taxes withheld | | | (78,031 | ) | | | | |
Total investment income | | | | | | | $13,041,230 | |
Expenses | | | | | | | | |
Management fee | | | $11,101,502 | | | | | |
Distribution and/or service fees | | | 650,568 | | | | | |
Shareholder servicing costs | | | 66,684 | | | | | |
Administrative services fee | | | 252,433 | | | | | |
Independent Trustees’ compensation | | | 34,277 | | | | | |
Custodian fee | | | 131,227 | | | | | |
Shareholder communications | | | 133,606 | | | | | |
Audit and tax fees | | | 56,703 | | | | | |
Legal fees | | | 12,121 | | | | | |
Miscellaneous | | | 43,374 | | | | | |
Total expenses | | | | | | | $12,482,495 | |
Fees paid indirectly | | | (26 | ) | | | | |
Reduction of expenses by investment adviser | | | (108,025 | ) | | | | |
Net expenses | | | | | | | $12,374,444 | |
Net investment income | | | | | | | $666,786 | |
Realized and unrealized gain (loss) on investments and foreign currency | | | | | | | | |
Realized gain (loss) (identified cost basis) | | | | | | | | |
Investments | | | $88,418,585 | | | | | |
Foreign currency | | | 872 | | | | | |
Net realized gain (loss) on investments and foreign currency | | | | | | | $88,419,457 | |
Change in unrealized appreciation (depreciation) | | | | | | | | |
Investments | | | $22,006,215 | | | | | |
Translation of assets and liabilities in foreign currencies | | | (2,794 | ) | | | | |
Net unrealized gain (loss) on investments and foreign currency translation | | | | | | | $22,003,421 | |
Net realized and unrealized gain (loss) on investments and foreign currency | | | | | | | $110,422,878 | |
Change in net assets from operations | | | | | | | $111,089,664 | |
See Notes to Financial Statements
10
MFS Growth Series
FINANCIAL STATEMENTS | STATEMENTS OF CHANGES IN NET ASSETS
These statements describe the increases and/or decreases in net assets resulting from operations, any distributions, and any shareholder transactions.
| | | | | | | | |
For years ended 12/31 | | | 2015 | | | | 2014 | |
Change in net assets | | | | | | | | |
From operations | | | | | | | | |
Net investment income | | | $666,786 | | | | $2,104,826 | |
Net realized gain (loss) on investments and foreign currency | | | 88,419,457 | | | | 93,277,069 | |
Net unrealized gain (loss) on investments and foreign currency translation | | | 22,003,421 | | | | 34,228,741 | |
Change in net assets from operations | | | $111,089,664 | | | | $129,610,636 | |
| Distributions declared to shareholders | | | | | | | | |
From net investment income | | | $(1,996,599 | ) | | | $(1,315,037 | ) |
From net realized gain on investments | | | (84,334,297 | ) | | | (101,856,096 | ) |
Total distributions declared to shareholders | | | $(86,330,896 | ) | | | $(103,171,133 | ) |
Change in net assets from fund share transactions | | | $(69,859,094 | ) | | | $(34,019,063 | ) |
Total change in net assets | | | $(45,100,326 | ) | | | $(7,579,560 | ) |
Net assets | | | | | | | | |
At beginning of period | | | 1,542,997,810 | | | | 1,550,577,370 | |
At end of period (including undistributed net investment income of $771,309 and
$2,100,452, respectively) | | | $1,497,897,484 | | | | $1,542,997,810 | |
See Notes to Financial Statements
11
MFS Growth Series
FINANCIAL STATEMENTS | FINANCIAL HIGHLIGHTS
The financial highlights table is intended to help you understand the fund’s financial performance for the past 5 years. Certain information reflects financial results for a single fund share. The total returns in the table represent the rate by which an investor would have earned (or lost) on an investment in the fund share class (assuming reinvestment of all distributions) held for the entire period.
| | | | | | | | | | | | | | | | | | | | |
| Initial Class | | Years ended 12/31 | |
| | | 2015 | | | 2014 | | | 2013 | | | 2012 | | | 2011 | |
Net asset value, beginning of period | | | $39.75 | | | | $39.07 | | | | $28.83 | | | | $24.56 | | | | $24.69 | |
| Income (loss) from investment operations | | | | | | | | | | | | | | | | | | | | |
Net investment income (loss) (d) | | | $0.03 | | | | $0.07 | | | | $0.04 | | | | $0.13 | | | | $(0.00 | )(w) |
Net realized and unrealized gain (loss) on investments
and foreign currency | | | 2.73 | | | | 3.33 | | | | 10.53 | | | | 4.14 | | | | (0.08 | ) |
Total from investment operations | | | $2.76 | | | | $3.40 | | | | $10.57 | | | | $4.27 | | | | $(0.08 | ) |
| Less distributions declared to shareholders | | | | | | | | | | | | | | | | | | | | |
From net investment income | | | $(0.07 | ) | | | $(0.04 | ) | | | $(0.08 | ) | | | $— | | | | $(0.05 | ) |
From net realized gain on investments | | | (2.27 | ) | | | (2.68 | ) | | | (0.25 | ) | | | — | | | | — | |
Total distributions declared to shareholders | | | $(2.34 | ) | | | $(2.72 | ) | | | $(0.33 | ) | | | $— | | | | $(0.05 | ) |
Net asset value, end of period (x) | | | $40.17 | | | | $39.75 | | | | $39.07 | | | | $28.83 | | | | $24.56 | |
Total return (%) (k)(r)(s)(x) | | | 7.56 | | | | 8.94 | | | | 36.85 | | | | 17.39 | | | | (0.32 | ) |
Ratios (%) (to average net assets)
and Supplemental data: | | | | | | | | | | | | | | | | | | | | |
Expenses before expense reductions (f) | | | 0.76 | | | | 0.76 | | | | 0.77 | | | | 0.82 | | | | 0.84 | |
Expenses after expense reductions (f) | | | 0.75 | | | | 0.76 | | | | 0.77 | | | | 0.82 | | | | 0.84 | |
Net investment income (loss) | | | 0.08 | | | | 0.18 | | | | 0.13 | | | | 0.45 | | | | (0.00 | )(w) |
Portfolio turnover | | | 31 | | | | 36 | | | | 43 | | | | 52 | | | | 75 | |
Net assets at end of period (000 omitted) | | | $1,273,204 | | | | $1,263,935 | | | | $1,308,361 | | | | $1,007,422 | | | | $461,382 | |
See Notes to Financial Statements
12
MFS Growth Series
Financial Highlights – continued
| | | | | | | | | | | | | | | | | | | | |
| Service Class | | Years ended 12/31 | |
| | | 2015 | | | 2014 | | | 2013 | | | 2012 | | | 2011 | |
Net asset value, beginning of period | | | $38.77 | | | | $38.22 | | | | $28.25 | | | | $24.13 | | | | $24.27 | |
| Income (loss) from investment operations | | | | | | | | | | | | | | | | | | | | |
Net investment income (loss) (d) | | | $(0.07 | ) | | | $(0.02 | ) | | | $(0.04 | ) | | | $0.07 | | | | $(0.06 | ) |
Net realized and unrealized gain (loss) on investments
and foreign currency | | | 2.66 | | | | 3.25 | | | | 10.30 | | | | 4.05 | | | | (0.08 | ) |
Total from investment operations | | | $2.59 | | | | $3.23 | | | | $10.26 | | | | $4.12 | | | | $(0.14 | ) |
| Less distributions declared to shareholders | | | | | | | | | | | | | | | | | | | | |
From net investment income | | | $— | | | | $— | | | | $(0.04 | ) | | | $— | | | | $(0.00 | )(w) |
From net realized gain on investments | | | (2.27 | ) | | | (2.68 | ) | | | (0.25 | ) | | | — | | | | — | |
Total distributions declared to shareholders | | | $(2.27 | ) | | | $(2.68 | ) | | | $(0.29 | ) | | | $— | | | | $(0.00 | )(w) |
Net asset value, end of period (x) | | | $39.09 | | | | $38.77 | | | | $38.22 | | | | $28.25 | | | | $24.13 | |
Total return (%) (k)(r)(s)(x) | | | 7.30 | | | | 8.68 | | | | 36.49 | | | | 17.07 | | | | (0.56 | ) |
Ratios (%) (to average net assets)
and Supplemental data: | | | | | | | | | | | | | | | | | | | | |
Expenses before expense reductions (f) | | | 1.01 | | | | 1.01 | | | | 1.02 | | | | 1.07 | | | | 1.09 | |
Expenses after expense reductions (f) | | | 1.00 | | | | 1.01 | | | | 1.02 | | | | 1.07 | | | | 1.09 | |
Net investment income (loss) | | | (0.16 | ) | | | (0.06 | ) | | | (0.12 | ) | | | 0.26 | | | | (0.25 | ) |
Portfolio turnover | | | 31 | | | | 36 | | | | 43 | | | | 52 | | | | 75 | |
Net assets at end of period (000 omitted) | | | $224,694 | | | | $279,063 | | | | $242,216 | | | | $134,247 | | | | $56,810 | |
| (d) | | Per share data is based on average shares outstanding. |
| (f) | | Ratios do not reflect reductions from fees paid indirectly, if applicable. |
| (k) | | The total return does not reflect expenses that apply to separate accounts. Inclusion of these charges would reduce the total return figures for all periods shown. |
| (r) | | Certain expenses have been reduced without which performance would have been lower. |
| (s) | | From time to time the fund may receive proceeds from litigation settlements, without which performance would be lower. |
| (w) | | Per share amount was less than $0.01 or ratio was less than 0.01%. |
| (x) | | The net asset values and total returns have been calculated on net assets which include adjustments made in accordance with U.S. generally accepted accounting principles required at period end for financial reporting purposes. |
See Notes to Financial Statements
13
MFS Growth Series
NOTES TO FINANCIAL STATEMENTS
| (1) | | Business and Organization |
MFS Growth Series (the fund) is a diversified series of MFS Variable Insurance Trust (the trust). The trust is organized as a Massachusetts business trust and is registered under the Investment Company Act of 1940, as amended, as an open-end management investment company. The shareholders of each series of the trust are separate accounts of insurance companies, which offer variable annuity and/or life insurance products, and qualified retirement and pension plans.
The fund is an investment company and accordingly follows the investment company accounting and reporting guidance of the Financial Accounting Standards Board (FASB) Accounting Standards Codification Topic 946 Financial Services – Investment Companies.
| (2) | | Significant Accounting Policies |
General – The preparation of financial statements in conformity with U.S. generally accepted accounting principles requires management to make estimates and assumptions that affect the reported amounts of assets and liabilities, and disclosure of contingent assets and liabilities at the date of the financial statements and the reported amounts of increases and decreases in net assets from operations during the reporting period. Actual results could differ from those estimates. In the preparation of these financial statements, management has evaluated subsequent events occurring after the date of the fund’s Statement of Assets and Liabilities through the date that the financial statements were issued.
In January 2016, FASB issued Accounting Standards Update 2016-01, Financial Instruments – Overall (Subtopic 825-10) – Recognition and Measurement of Financial Assets and Financial Liabilities (“ASU 2016-01”) which would first be effective for annual reporting periods beginning after December 15, 2017, and interim periods therein. ASU 2016-01, which changes the accounting for equity investments and for certain financial liabilities, also modifies the presentation and disclosure requirements for financial instruments. Investment companies are specifically exempted from ASU 2016-01’s equity investment accounting provisions and will continue to follow the industry specific guidance for investment accounting under ASC 946. Although still evaluating the potential impacts of ASU 2016-01 to the fund, management expects that the impact of the fund’s adoption will be limited to additional financial statement disclosures.
Balance Sheet Offsetting – The fund’s accounting policy with respect to balance sheet offsetting is that, absent an event of default by the counterparty or a termination of the agreement, the International Swaps and Derivatives Association (ISDA) Master Agreement does not result in an offset of reported amounts of financial assets and financial liabilities in the Statement of Assets and Liabilities across transactions between the fund and the applicable counterparty. The fund’s right to setoff may be restricted or prohibited by the bankruptcy or insolvency laws of the particular jurisdiction to which a specific master netting agreement counterparty is subject. Balance sheet offsetting disclosures, to the extent applicable to the fund, have been included in the fund’s Significant Accounting Policies note under the captions for each of the fund’s in-scope financial instruments and transactions.
Investment Valuations – Equity securities, including restricted equity securities, are generally valued at the last sale or official closing price on their primary market or exchange as provided by a third-party pricing service. Equity securities, for which there were no sales reported that day, are generally valued at the last quoted daily bid quotation on their primary market or exchange as provided by a third-party pricing service. Short-term instruments with a maturity at issuance of 60 days or less may be valued at amortized cost, which approximates market value. Open-end investment companies are generally valued at net asset value per share. Securities and other assets generally valued on the basis of information from a third-party pricing service may also be valued at a broker/dealer bid quotation. Values obtained from third-party pricing services can utilize both transaction data and market information such as yield, quality, coupon rate, maturity, type of issue, trading characteristics, and other market data. The values of foreign securities and other assets and liabilities expressed in foreign currencies are converted to U.S. dollars using the mean of bid and asked prices for rates provided by a third-party pricing service.
The Board of Trustees has delegated primary responsibility for determining or causing to be determined the value of the fund’s investments (including any fair valuation) to the adviser pursuant to valuation policies and procedures approved by the Board. If the adviser determines that reliable market quotations are not readily available, investments are valued at fair value as determined in good faith by the adviser in accordance with such procedures under the oversight of the Board of Trustees. Under the fund’s valuation policies and procedures, market quotations are not considered to be readily available for most types of debt instruments and floating rate loans and many types of derivatives. These investments are generally valued at fair value based on information from third-party pricing services. In addition, investments may be valued at fair value if the adviser determines that an investment’s value has been materially affected by events occurring after the close of the exchange or market on which the investment is principally traded (such as foreign exchange or market) and prior to the determination of the fund’s net asset value, or after the halting of trading of a specific security where trading does not resume prior to the close of the exchange or market on which the security is principally traded. Events that occur on a frequent basis after foreign markets close (such as developments in foreign markets and significant movements in the U.S. markets) and prior to the determination of the fund’s net asset value may be deemed to have a material effect on the value of securities traded in foreign markets. Accordingly, the fund’s foreign equity securities may often be valued at fair value. The adviser generally relies on third-party pricing services or other information (such as the correlation with price
14
MFS Growth Series
Notes to Financial Statements – continued
movements of similar securities in the same or other markets; the type, cost and investment characteristics of the security; the business and financial condition of the issuer; and trading and other market data) to assist in determining whether to fair value and at what value to fair value an investment. The value of an investment for purposes of calculating the fund’s net asset value can differ depending on the source and method used to determine value. When fair valuation is used, the value of an investment used to determine the fund’s net asset value may differ from quoted or published prices for the same investment. There can be no assurance that the fund could obtain the fair value assigned to an investment if it were to sell the investment at the same time at which the fund determines its net asset value per share.
Various inputs are used in determining the value of the fund’s assets or liabilities. These inputs are categorized into three broad levels. In certain cases, the inputs used to measure fair value may fall into different levels of the fair value hierarchy. In such cases, an investment’s level within the fair value hierarchy is based on the lowest level of input that is significant to the fair value measurement. The fund’s assessment of the significance of a particular input to the fair value measurement in its entirety requires judgment, and considers factors specific to the investment. Level 1 includes unadjusted quoted prices in active markets for identical assets or liabilities. Level 2 includes other significant observable market-based inputs (including quoted prices for similar securities, interest rates, prepayment speed, and credit risk). Level 3 includes unobservable inputs, which may include the adviser’s own assumptions in determining the fair value of investments. The following is a summary of the levels used as of December 31, 2015 in valuing the fund’s assets or liabilities:
| | | | | | | | | | | | | | | | |
| Investments at Value | | Level 1 | | | Level 2 | | | Level 3 | | | Total | |
| Equity Securities: | | | | | | | | | | | | | | | | |
United States | | | $1,462,092,227 | | | | $— | | | | $— | | | | $1,462,092,227 | |
France | | | — | | | | 14,377,239 | | | | — | | | | 14,377,239 | |
Canada | | | 8,796,361 | | | | — | | | | — | | | | 8,796,361 | |
Netherlands | | | 1,599,739 | | | | — | | | | — | | | | 1,599,739 | |
| Mutual Funds | | | 13,301,115 | | | | — | | | | — | | | | 13,301,115 | |
| Total Investments | | | $1,485,789,442 | | | | $14,377,239 | | | | $— | | | | $1,500,166,681 | |
For further information regarding security characteristics, see the Portfolio of Investments.
Foreign Currency Translation – Purchases and sales of foreign investments, income, and expenses are converted into U.S. dollars based upon currency exchange rates prevailing on the respective dates of such transactions or on the reporting date for foreign denominated receivables and payables. Gains and losses attributable to foreign currency exchange rates on sales of securities are recorded for financial statement purposes as net realized gains and losses on investments. Gains and losses attributable to foreign exchange rate movements on receivables, payables, income and expenses are recorded for financial statement purposes as foreign currency transaction gains and losses. That portion of both realized and unrealized gains and losses on investments that results from fluctuations in foreign currency exchange rates is not separately disclosed.
Security Loans – Under its Securities Lending Agency Agreement with the fund, State Street Bank and Trust Company (“State Street”), as lending agent, loans the securities of the fund to certain qualified institutions (the “Borrowers”) approved by the fund. Security loans can be terminated at the discretion of either the lending agent or the fund and the related securities must be returned within the earlier of the standard trade settlement period for such securities or within three business days. The loans are collateralized by cash and/or U.S. Treasury and federal agency obligations in an amount typically at least equal to the market value of the securities loaned. On loans collateralized by cash, the cash collateral is invested in a money market fund. The market value of the loaned securities is determined at the close of business of the fund and any additional required collateral is delivered to the fund on the next business day. State Street provides the fund with indemnification against Borrower default. In the event of Borrower default, State Street will, for the benefit of the fund, either purchase securities identical to those loaned or, when such purchase is commercially impracticable, pay the fund the market value of the loaned securities. In return, State Street assumes the fund’s rights to the related collateral. If the collateral value is less than the cost to purchase identical securities, State Street is responsible for the shortfall, but only to the extent that such shortfall is not due to a decline in collateral value resulting from collateral reinvestment for which the fund bears the risk of loss. A portion of the income generated upon investment of the collateral is remitted to the Borrowers, and the remainder is allocated between the fund and the lending agent. On loans collateralized by U.S. Treasury and/or federal agency obligations, a fee is received from the Borrower, and is allocated between the fund and the lending agent. Income from securities lending is included in “Interest” income in the Statement of Operations. The dividend and interest income earned on the securities loaned is accounted for in the same manner as other dividend and interest income. At December 31,2015, there were no securities on loan or collateral outstanding.
Indemnifications – Under the fund’s organizational documents, its officers and Trustees may be indemnified against certain liabilities and expenses arising out of the performance of their duties to the fund. Additionally, in the normal course of business, the fund enters into agreements with service providers that may contain indemnification clauses. The fund’s maximum exposure under these agreements is unknown as this would involve future claims that may be made against the fund that have not yet occurred.
15
MFS Growth Series
Notes to Financial Statements – continued
Investment Transactions and Income – Investment transactions are recorded on the trade date. Interest income is recorded on the accrual basis. Dividends received in cash are recorded on the ex-dividend date. Certain dividends from foreign securities will be recorded when the fund is informed of the dividend if such information is obtained subsequent to the ex-dividend date. Dividend and interest payments received in additional securities are recorded on the ex-dividend or ex-interest date in an amount equal to the value of the security on such date.
The fund may receive proceeds from litigation settlements. Any proceeds received from litigation involving portfolio holdings are reflected in the Statement of Operations in realized gain/loss if the security has been disposed of by the fund or in unrealized gain/loss if the security is still held by the fund. Any other proceeds from litigation not related to portfolio holdings are reflected as other income in the Statement of Operations.
Fees Paid Indirectly – Prior to October 1, 2015, the fund’s custody fee could be reduced by a credit earned under an arrangement that measured the value of U.S. dollars deposited with the custodian by the fund. The amount of the credit, for the year ended December 31, 2015, is shown as a reduction of total expenses in the Statement of Operations.
Tax Matters and Distributions – The fund intends to qualify as a regulated investment company, as defined under Subchapter M of the Internal Revenue Code, and to distribute all of its taxable income, including realized capital gains. As a result, no provision for federal income tax is required. The fund’s federal tax returns, when filed, will remain subject to examination by the Internal Revenue Service for a three year period. Management has analyzed the fund’s tax positions taken on federal and state tax returns for all open tax years and does not believe that there are any uncertain tax positions that require recognition of a tax liability. Foreign taxes, if any, have been accrued by the fund in the accompanying financial statements in accordance with the applicable foreign tax law. Foreign income taxes may be withheld by certain countries in which the fund invests. Additionally, capital gains realized by the fund on securities issued in or by certain foreign countries may be subject to capital gains tax imposed by those countries.
Distributions to shareholders are recorded on the ex-dividend date. Income and capital gain distributions are determined in accordance with income tax regulations, which may differ from U.S. generally accepted accounting principles. Certain capital accounts in the financial statements are periodically adjusted for permanent differences in order to reflect their tax character. These adjustments have no impact on net assets or net asset value per share. Temporary differences which arise from recognizing certain items of income, expense, gain or loss in different periods for financial statement and tax purposes will reverse at some time in the future. Distributions in excess of net investment income or net realized gains are temporary overdistributions for financial statement purposes resulting from differences in the recognition or classification of income or distributions for financial statement and tax purposes.
Book/tax differences primarily relate to wash sale loss deferrals.
The tax character of distributions declared to shareholders for the last two fiscal years is as follows:
| | | | | | | | |
| | | 12/31/15 | | | 12/31/14 | |
| Ordinary income (including any short-term capital gains) | | | $3,791,361 | | | | $28,519,200 | |
| Long-term capital gains | | | 82,539,535 | | | | 74,651,933 | |
| Total distributions | | | $86,330,896 | | | | $103,171,133 | |
The federal tax cost and the tax basis components of distributable earnings were as follows:
| | | | |
| As of 12/31/15 | | | | |
| Cost of investments | | | $976,506,848 | |
| Gross appreciation | | | 531,996,982 | |
| Gross depreciation | | | (8,337,149 | ) |
| Net unrealized appreciation (depreciation) | | | $523,659,833 | |
| Undistributed ordinary income | | | 771,309 | |
| Undistributed long-term capital gain | | | 87,391,889 | |
| Other temporary differences | | | 9 | |
Multiple Classes of Shares of Beneficial Interest – The fund offers multiple classes of shares, which differ in their respective distribution and/or service fees. The fund’s income, realized and unrealized gain (loss), and common expenses are allocated to shareholders based on the daily net assets of each class. Dividends are declared separately for each class. Differences in per share
16
MFS Growth Series
Notes to Financial Statements – continued
dividend rates are generally due to differences in separate class expenses. The fund’s distributions declared to shareholders as reported in the Statements of Changes in Net Assets are presented by class as follows:
| | | | | | | | | | | | | | | | |
| | | From net investment
income | | | From net realized gain on
investments | |
| | | Year ended
12/31/15 | | | Year ended
12/31/14 | | | Year ended
12/31/15 | | | Year ended
12/31/14 | |
| Initial Class | | | $1,996,599 | | | | $1,315,037 | | | | $69,480,678 | | | | $83,920,326 | |
| Service Class | | | — | | | | — | | | | 14,853,619 | | | | 17,935,770 | |
| Total | | | $1,996,599 | | | | $1,315,037 | | | | $84,334,297 | | | | $101,856,096 | |
| (3) | | Transactions with Affiliates |
Investment Adviser – The fund has an investment advisory agreement with MFS to provide overall investment management and related administrative services and facilities to the fund. The management fee is computed daily and paid monthly at the following annual rates:
| | | | |
| First $1 billion of average daily net assets | | | 0.75% | |
| Average daily net assets in excess of $1 billion | | | 0.65% | |
MFS has agreed in writing to reduce its management fee by a specified amount if certain MFS mutual fund assets exceed thresholds agreed to by MFS and the fund’s Board of Trustees. For the year ended December 31, 2015, this management fee reduction amounted to $108,025, which is included in the reduction of total expenses in the Statement of Operations. The management fee incurred for the year ended December 31, 2015 was equivalent to an annual effective rate of 0.71% of the fund’s average daily net assets.
Distributor – MFS Fund Distributors, Inc. (MFD), a wholly-owned subsidiary of MFS, is the distributor of shares of the fund. The Trustees have adopted a distribution plan for the Service Class shares pursuant to Rule 12b-1 under the Investment Company Act of 1940.
The fund’s distribution plan provides that the fund will pay MFD distribution and/or service fees equal to 0.25% per annum of its average daily net assets attributable to Service Class shares as partial consideration for services performed and expenses incurred by MFD and financial intermediaries (including participating insurance companies that invest in the fund to fund variable annuity and variable life insurance contracts, sponsors of qualified retirement and pension plans that invest in the fund, and affiliates of these participating insurance companies and plan sponsors) in connection with the sale and distribution of the Service Class shares. MFD may subsequently pay all, or a portion, of the distribution and/or service fees to financial intermediaries.
Shareholder Servicing Agent – MFS Service Center, Inc. (MFSC), a wholly-owned subsidiary of MFS, receives a fee from the fund for its services as shareholder servicing agent. For the year ended December 31, 2015, the fee was $63,822, which equated to 0.0041% annually of the fund’s average daily net assets. MFSC also receives payment from the fund for out-of-pocket expenses paid by MFSC on behalf of the fund. For the year ended December 31, 2015, these costs amounted to $2,862.
Administrator – MFS provides certain financial, legal, shareholder communications, compliance, and other administrative services to the fund. Under an administrative services agreement, the fund reimburses MFS the costs incurred to provide these services. The fund is charged an annual fixed amount of $17,500 plus a fee based on average daily net assets. The administrative services fee incurred for the year ended December 31, 2015 was equivalent to an annual effective rate of 0.0162% of the fund’s average daily net assets.
Trustees’ and Officers’ Compensation – The fund pays compensation to independent Trustees in the form of a retainer, attendance fees, and additional compensation to Board and Committee chairpersons. The fund does not pay compensation directly to Trustees or officers of the fund who are also officers of the investment adviser, all of whom receive remuneration for their services to the fund from MFS. Certain officers and Trustees of the fund are officers or directors of MFS, MFD, and MFSC.
Other – This fund and certain other funds managed by MFS (the funds) have entered into a service agreement (the ISO Agreement) which provides for payment of fees solely by the funds to Tarantino LLC in return for the provision of services of an Independent Senior Officer (ISO) for the funds. Frank L. Tarantino serves as the ISO and is an officer of the funds and the sole member of Tarantino LLC. The funds can terminate the ISO Agreement with Tarantino LLC at any time under the terms of the ISO Agreement. For the year ended December 31, 2015, the fee paid by the fund under this agreement was $4,926 and is included in “Miscellaneous” expense in the Statement of Operations. MFS has agreed to bear all expenses associated with office space, other administrative support, and supplies provided to the ISO.
The fund invests in the MFS Institutional Money Market Portfolio which is managed by MFS and seeks current income consistent with preservation of capital and liquidity. Income earned on this investment is included in “Dividends from underlying affiliated funds” in the Statement of Operations. This money market fund does not pay a management fee to MFS.
17
MFS Growth Series
Notes to Financial Statements – continued
For the year ended December 31, 2015, purchases and sales of investments, other than short-term obligations, aggregated $475,138,468 and $620,796,457, respectively.
| (5) | | Shares of Beneficial Interest |
The fund’s Declaration of Trust permits the Trustees to issue an unlimited number of full and fractional shares of beneficial interest. Transactions in fund shares were as follows:
| | | | | | | | | | | | | | | | |
| | | Year ended 12/31/15 | | | Year ended 12/31/14 | |
| | | Shares | | | Amount | | | Shares | | | Amount | |
| Shares sold | | | | | | | | | | | | | | | | |
Initial Class | | | 3,388,519 | | | | $136,302,423 | | | | 1,933,212 | | | | $75,547,700 | |
Service Class | | | 1,353,238 | | | | 53,496,981 | | | | 2,525,829 | | | | 96,644,801 | |
| | | 4,741,757 | | | | $189,799,404 | | | | 4,459,041 | | | | $172,192,501 | |
| Shares issued to shareholders in reinvestment of distributions | | | | | | | | | | | | | | | | |
Initial Class | | | 1,948,915 | | | | $70,687,159 | | | | 2,206,955 | | | | $84,945,696 | |
Service Class | | | 420,544 | | | | 14,853,619 | | | | 477,396 | | | | 17,935,770 | |
| | | 2,369,459 | | | | $85,540,778 | | | | 2,684,351 | | | | $102,881,466 | |
| Shares reacquired | | | | | | | | | | | | | | | | |
Initial Class | | | (5,437,902 | ) | | | $(221,523,026 | ) | | | (5,836,614 | ) | | | $(229,260,814 | ) |
Service Class | | | (3,222,658 | ) | | | (123,676,250 | ) | | | (2,143,317 | ) | | | (79,832,216 | ) |
| | | (8,660,560 | ) | | | $(345,199,276 | ) | | | (7,979,931 | ) | | | $(309,093,030 | ) |
| Net change | | | | | | | | | | | | | | | | |
Initial Class | | | (100,468 | ) | | | $(14,533,444 | ) | | | (1,696,447 | ) | | | $(68,767,418 | ) |
Service Class | | | (1,448,876 | ) | | | (55,325,650 | ) | | | 859,908 | | | | 34,748,355 | |
| | | (1,549,344 | ) | | | $(69,859,094 | ) | | | (836,539 | ) | | | $(34,019,063 | ) |
The fund is one of several mutual funds in which certain MFS funds may invest. The MFS funds do not invest in the underlying funds for the purpose of exercising management or control. At the end of the period, the MFS Moderate Allocation Portfolio, the MFS Growth Allocation Portfolio, and the MFS Conservative Allocation Portfolio were the owners of record of approximately 11%, 3%, and 3%, respectively, of the value of outstanding voting shares of the fund.
The fund and certain other funds managed by MFS participate in a $1.25 billion unsecured committed line of credit, subject to a $1 billion sublimit, provided by a syndication of banks under a credit agreement. Borrowings may be made for temporary financing needs. Interest is charged to each fund, based on its borrowings, generally at a rate equal to the higher of the Overnight Federal Reserve funds rate or daily one month LIBOR plus an agreed upon spread. A commitment fee, based on the average daily, unused portion of the committed line of credit, is allocated among the participating funds at the end of each calendar quarter. In addition, the fund and other funds managed by MFS have established unsecured uncommitted borrowing arrangements with certain banks for temporary financing needs. Interest is charged to each fund, based on its borrowings, at a rate equal to the Overnight Federal Reserve funds rate plus an agreed upon spread. For the year ended December 31, 2015, the fund’s commitment fee and interest expense were $5,222 and $0, respectively, and are included in “Miscellaneous” expense in the Statement of Operations.
| (7) | | Transactions in Underlying Affiliated Funds – Affiliated Issuers |
An affiliated issuer may be considered one in which the fund owns 5% or more of the outstanding voting securities, or a company which is under common control. For the purposes of this report, the fund assumes the following to be an affiliated issuer:
| | | | | | | | | | | | | | | | |
| Underlying Affiliated Fund | | Beginning
Shares/Par
Amount | | | Acquisitions
Shares/Par
Amount | | | Dispositions
Shares/Par
Amount | | | Ending
Shares/Par
Amount | |
| MFS Institutional Money Market Portfolio | | | 19,395,311 | | | | 255,327,315 | | | | (261,421,511 | ) | | | 13,301,115 | |
| | | | |
| Underlying Affiliated Fund | | Realized
Gain (Loss) | | | Capital Gain
Distributions | | | Dividend
Income | | | Ending
Value | |
| MFS Institutional Money Market Portfolio | | | $— | | | | $— | | | | $28,439 | | | | $13,301,115 | |
18
MFS Growth Series
REPORT OF INDEPENDENT REGISTERED PUBLIC ACCOUNTING FIRM
To the Board of Trustees of MFS Variable Insurance Trust and the Shareholders of
MFS Growth Series:
We have audited the accompanying statement of assets and liabilities, including the portfolio of investments, of MFS Growth Series (one of the series of MFS Variable Insurance Trust) (the “Fund”) as of December 31, 2015, and the related statement of operations for the year then ended, the statements of changes in net assets for each of the two years in the period then ended, and the financial highlights for each of the five years in the period then ended. These financial statements and financial highlights are the responsibility of the Fund’s management. Our responsibility is to express an opinion on these financial statements and financial highlights based on our audits.
We conducted our audits in accordance with the standards of the Public Company Accounting Oversight Board (United States). Those standards require that we plan and perform the audit to obtain reasonable assurance about whether the financial statements and financial highlights are free of material misstatement. The Fund is not required to have, nor were we engaged to perform, an audit of its internal control over financial reporting. Our audits included consideration of internal control over financial reporting as a basis for designing audit procedures that are appropriate in the circumstances, but not for the purpose of expressing an opinion on the effectiveness of the Fund’s internal control over financial reporting. Accordingly, we express no such opinion. An audit also includes examining, on a test basis, evidence supporting the amounts and disclosures in the financial statements, assessing the accounting principles used and significant estimates made by management, as well as evaluating the overall financial statement presentation. Our procedures included confirmation of securities owned as of December 31, 2015, by correspondence with the custodian and brokers; when replies were not received from brokers, we performed other auditing procedures. We believe that our audits provide a reasonable basis for our opinion.
In our opinion, such financial statements and financial highlights referred to above present fairly, in all material respects, the financial position of MFS Growth Series as of December 31, 2015, the results of its operations for the year then ended, the changes in its net assets for each of the two years in the period then ended, and the financial highlights for each of the five years in the period then ended, in conformity with accounting principles generally accepted in the United States of America.
DELOITTE & TOUCHE LLP
Boston, Massachusetts
February 16, 2016
19
MFS Growth Series
TRUSTEES AND OFFICERS – IDENTIFICATION AND BACKGROUND
The Trustees and Officers of the Trust, as of February 1, 2016, are listed below, together with their principal occupations during the past five years. (Their titles may have varied during that period.) The address of each Trustee and Officer is 111 Huntington Avenue, Boston, Massachusetts 02199-7618.
| | | | | | | | |
Name, Age | | Position(s)
Held with Fund | | Trustee/Officer
Since (h) | | Principal Occupations
During the Past Five Years | | Other Directorships (j) |
| INTERESTED TRUSTEES |
Robert J. Manning (k)
(age 52) | | Trustee | | February 2004 | | Massachusetts Financial Services Company, Chairman, Co-Chief Executive Officer and Director | | N/A |
| | | | |
Robin A. Stelmach (k) (age 54) | | Trustee and President | | January 2014 | | Massachusetts Financial Services Company, Executive Vice President and Chief Operating Officer | | N/A |
| | |
| INDEPENDENT TRUSTEES | | | | |
David H. Gunning
(age 73) | | Trustee and Chair of Trustees | | January 2004 | | Private investor | | Lincoln Electric Holdings, Inc., Director; Development Alternatives, Inc., Director/Non-Executive Chairman |
| | | | |
Steven E. Buller (age 64) | | Trustee | | February 2014 | | Chairman, Financial Accounting Standards Advisory Council; Standing Advisory Group, Public Company Accounting Oversight Board, Member (until 2014); BlackRock, Inc. (investment management), Managing Director (until 2014), BlackRock Finco UK (investment management), Director (until 2014) | | N/A |
| | | | |
Robert E. Butler
(age 74) | | Trustee | | January 2006 | | Consultant – investment company industry regulatory and compliance matters | | N/A |
| | | | |
Maureen R. Goldfarb (age 60) | | Trustee | | January 2009 | | Private investor | | N/A |
| | | | |
William R. Gutow
(age 74) | | Trustee | | December 1993 | | Private investor and real estate consultant; Capitol Entertainment Management Company (video franchise), Vice Chairman | | Texas Donuts, Vice Chairman (until 2010) |
| | | | |
Michael Hegarty
(age 71) | | Trustee | | December 2004 | | Private investor | | Rouse Properties Inc., Director; Capmark Financial Group Inc., Director |
| | | | |
John P. Kavanaugh (age 61) | | Trustee | | January 2009 | | Private investor | | N/A |
| | | | |
Maryanne L. Roepke (age 59) | | Trustee | | May 2014 | | American Century Investments (investment management), Senior Vice President and Chief Compliance Officer (until 2014) | | N/A |
| | | | |
Laurie J. Thomsen
(age 58) | | Trustee | | March 2005 | | Private investor | | The Travelers Companies, Director; Dycom Industries, Inc., Director |
| | | | |
Robert W. Uek
(age 74) | | Trustee | | January 2006 | | Consultant to investment company industry | | N/A |
| | | | |
| OFFICERS | | | | | | | | |
Christopher R. Bohane (k)
(age 42) | | Assistant Secretary and Assistant Clerk | | July 2005 | | Massachusetts Financial Services Company, Vice President and Assistant General Counsel | | N/A |
| | | | |
Kino Clark (k) (age 47) | | Assistant Treasurer | | January 2012 | | Massachusetts Financial Services Company, Vice President | | N/A |
| | | | |
Kristin V. Collins (k) (age 42) | | Assistant Secretary and Assistant Clerk | | September 2015 | | Massachusetts Financial Services Company, Vice President and Assistant General Counsel | | N/A |
| | | | |
Thomas H. Connors (k) (age 56) | | Assistant Secretary and Assistant Clerk | | September 2012 | | Massachusetts Financial Services Company, Vice President and Senior Counsel; Deutsche Investment Management Americas Inc. (financial service provider), Director and Senior Counsel (until 2012) | | N/A |
20
MFS Growth Series
Trustees and Officers – continued
| | | | | | | | |
Name, Age | | Position(s)
Held with Fund | | Trustee/Officer
Since (h) | | Principal Occupations
During the Past Five Years | | Other Directorships (j) |
Ethan D. Corey (k)
(age 52) | | Assistant Secretary and Assistant Clerk | | July 2005 | | Massachusetts Financial Services Company, Senior Vice President and Associate General Counsel | | N/A |
| | | | |
David L. DiLorenzo (k)
(age 47) | | Treasurer | | July 2005 | | Massachusetts Financial Services Company, Senior Vice President | | N/A |
| | | | |
Brian E. Langenfeld (k) (age 42) | | Assistant Secretary and Assistant Clerk | | June 2006 | | Massachusetts Financial Services Company, Vice President and Senior Counsel | | N/A |
| | | | |
Kenneth Paek (k) (age 41) | | Assistant Treasurer | | February 2015 | | Massachusetts Financial Services Company, Vice President; Cohen & Steers, Vice President/Head of Fund Administration (until 2014) | | N/A |
| | | | |
Susan A. Pereira (k)
(age 45) | | Assistant Secretary and Assistant Clerk | | July 2005 | | Massachusetts Financial Services Company, Vice President and Senior Counsel | | N/A |
| | | | |
Kasey L. Phillips (k) (age 45) | | Assistant Treasurer | | September 2012 | | Massachusetts Financial Services Company, Vice President; Wells Fargo Funds Management, LLC, Senior Vice President, Fund Treasurer (until 2012) | | N/A |
| | | | |
Mark N. Polebaum (k)
(age 63) | | Secretary and Clerk | | January 2006 | | Massachusetts Financial Services Company, Executive Vice President, General Counsel and Secretary | | N/A |
| | | | |
Matthew A. Stowe (k) (age 41) | | Assistant Secretary and Assistant Clerk | | October 2014 | | Massachusetts Financial Services Company, Vice President and Assistant General Counsel | | N/A |
| | | | |
Frank L. Tarantino
(age 71) | | Independent Senior Officer | | June 2004 | | Tarantino LLC (provider of compliance services), Principal | | N/A |
| | | | |
Richard S. Weitzel (k)
(age 45) | | Assistant Secretary and Assistant Clerk | | October 2007 | | Massachusetts Financial Services Company, Senior Vice President and Associate General Counsel | | N/A |
| | | | |
Martin J. Wolin (k) (age 48) | | Chief Compliance Officer | | July 2015 | | Massachusetts Financial Services Company, Senior Vice President and Chief Compliance Officer (since July 2015); Mercer (financial service provider), Chief Risk and Compliance Officer, North America and Latin America (until June 2015) | | N/A |
| | | | |
James O. Yost (k)
(age 55) | | Deputy Treasurer | | September 1990 | | Massachusetts Financial Services Company, Senior Vice President | | N/A |
| (h) | Date first appointed to serve as Trustee/officer of an MFS Fund. Each Trustee has served continuously since appointment unless indicated otherwise. For the period from December 15, 2004 until February 22, 2005, Mr. Manning served as Advisory Trustee. Prior to January 2012, Messrs. DiLorenzo and Yost served as Assistant Treasurers of the Funds. Ms. Stelmach was appointed as President of the Funds as of October 1, 2014. |
| (j) | Directorships or trusteeships of companies required to report to the Securities and Exchange Commission (i.e., “public companies”). |
| (k) | “Interested person” of the Trust within the meaning of the Investment Company Act of 1940 (referred to as the 1940 Act), which is the principal federal law governing investment companies like the fund, as a result of a position with MFS. The address of MFS is 111 Huntington Avenue, Boston, Massachusetts 02199-7618. |
Each Trustee (except Ms. Stelmach, Mr. Buller and Ms. Roepke) has been elected by shareholders and each Trustee and officer holds office until his or her successor is chosen and qualified or until his or her earlier death, resignation, retirement or removal. The Trust does not hold annual meetings for the purpose of electing Trustees, and Trustees are not elected for fixed terms. Messrs. Buller, Butler, Kavanaugh, Uek and Ms. Roepke are members of the Trust’s Audit Committee.
Each of the Fund’s Trustees and officers holds comparable positions with certain other funds of which MFS or a subsidiary is the investment adviser or distributor, and, in the case of the officers, with certain affiliates of MFS. As of February 1, 2016, the Trustees served as board members of 137 funds within the MFS Family of Funds.
21
MFS Growth Series
Trustees and Officers – continued
The Statement of Additional Information for a Fund includes further information about the Trustees and is available without charge upon request by calling 1-800-225-2606.
| | |
Investment Adviser Massachusetts Financial Services Company 111 Huntington Avenue Boston, MA 02199-7618 | | Custodian State Street Bank and Trust Company 1 Lincoln Street Boston, MA 02111-2900 |
Distributor MFS Fund Distributors, Inc. 111 Huntington Avenue Boston, MA 02199-7618 | | Independent Registered Public Accounting Firm Deloitte & Touche LLP 200 Berkeley Street Boston, MA 02116 |
Portfolio Managers Eric Fischman Matthew Sabel | | |
22
MFS Growth Series
BOARD REVIEW OF INVESTMENT ADVISORY AGREEMENT
The Investment Company Act of 1940 requires that both the full Board of Trustees and a majority of the non-interested (“independent”) Trustees, voting separately, annually approve the continuation of the Fund’s investment advisory agreement with MFS. The Trustees consider matters bearing on the Fund and its advisory arrangements at their meetings throughout the year, including a review of performance data at each regular meeting. In addition, the independent Trustees met several times over the course of three months beginning in May and ending in July, 2015 (“contract review meetings”) for the specific purpose of considering whether to approve the continuation of the investment advisory agreement for the Fund and the other investment companies that the Board oversees (the “MFS Funds”). The independent Trustees were assisted in their evaluation of the Fund’s investment advisory agreement by independent legal counsel, from whom they received separate legal advice and with whom they met separately from MFS during various contract review meetings. The independent Trustees were also assisted in this process by the MFS Funds’ Independent Senior Officer, a senior officer appointed by and reporting to the independent Trustees.
In connection with their deliberations regarding the continuation of the investment advisory agreement, the Trustees, including the independent Trustees, considered such information and factors as they believed, in light of the legal advice furnished to them and their own business judgment, to be relevant. The investment advisory agreement for the Fund was considered separately, although the Trustees also took into account the common interests of all MFS Funds in their review. As described below, the Trustees considered the nature, quality, and extent of the various investment advisory, administrative, and shareholder services performed by MFS under the existing investment advisory agreement and other arrangements with the Fund.
In connection with their contract review meetings, the Trustees received and relied upon materials that included, among other items: (i) information provided by Lipper Inc., an independent third party, on the investment performance of the Fund for various time periods ended December 31, 2014 and the investment performance of a group of funds with substantially similar investment classifications/objectives (the “Lipper performance universe”), (ii) information provided by Lipper Inc. on the Fund’s advisory fees and other expenses and the advisory fees and other expenses of comparable funds identified by Lipper Inc. (the “Lipper expense group”), (iii) information provided by MFS on the advisory fees of comparable portfolios of other clients of MFS, including institutional separate accounts and other clients, (iv) information as to whether and to what extent applicable expense waivers, reimbursements or fee “breakpoints” are observed for the Fund, (v) information regarding MFS’ financial results and financial condition, including MFS’ and certain of its affiliates’ estimated profitability from services performed for the Fund and the MFS Funds as a whole, and compared to MFS’ institutional business, (vi) MFS’ views regarding the outlook for the mutual fund industry and the strategic business plans of MFS, (vii) descriptions of various functions performed by MFS for the Funds, such as compliance monitoring and portfolio trading practices, and (viii) information regarding the overall organization of MFS, including information about MFS’ senior management and other personnel providing investment advisory, administrative and other services to the Fund and the other MFS Funds. The comparative performance, fee and expense information prepared and provided by Lipper Inc. was not independently verified and the independent Trustees did not independently verify any information provided to them by MFS.
The Trustees’ conclusion as to the continuation of the investment advisory agreement was based on a comprehensive consideration of all information provided to the Trustees and not the result of any single factor. Some of the factors that figured particularly in the Trustees’ deliberations are described below, although individual Trustees may have evaluated the information presented differently from one another, giving different weights to various factors. It is also important to recognize that the fee arrangements for the Fund and other MFS Funds are the result of years of review and discussion between the independent Trustees and MFS, that certain aspects of such arrangements may receive greater scrutiny in some years than in others, and that the Trustees’ conclusions may be based, in part, on their consideration of these same arrangements during the course of the year and in prior years.
Based on information provided by Lipper Inc. and MFS, the Trustees reviewed the Fund’s total return investment performance as well as the performance of peer groups of funds over various time periods. The Trustees placed particular emphasis on the total return performance of the Fund’s Initial Class shares in comparison to the performance of funds in its Lipper performance universe over the three-year period ended December 31, 2014, which the Trustees believed was a long enough period to reflect differing market conditions. The total return performance of the Fund’s Initial Class shares was in the 2nd quintile relative to the other funds in the universe for this three-year period (the 1st quintile being the best performers and the 5th quintile being the worst performers). The total return performance of the Fund’s Initial Class shares was in the 3rd quintile for the one-year period and the 2nd quintile for the five-year period ended December 31, 2014 relative to the Lipper performance universe. Because of the passage of time, these performance results may differ from the performance results for more recent periods, including those shown elsewhere in this report.
In the course of their deliberations, the Trustees took into account information provided by MFS in connection with the contract review meetings, as well as during investment review meetings conducted with portfolio management personnel during the course of the year regarding the Fund’s performance. After reviewing these and related factors, the Trustees concluded, within the context of their overall conclusions regarding the investment advisory agreement, that they were satisfied with MFS’ responses and efforts relating to investment performance.
23
MFS Growth Series
Board Review of Investment Advisory Agreement – continued
In assessing the reasonableness of the Fund’s advisory fee, the Trustees considered, among other information, the Fund’s advisory fee and the total expense ratio of the Fund’s Initial Class shares as a percentage of average daily net assets and the advisory fee and total expense ratios of peer groups of funds based on information provided by Lipper Inc. The Trustees considered that, according to the Lipper data (which takes into account any fee reductions or expense limitations that were in effect during the Fund’s last fiscal year), the Fund’s effective advisory fee rate and total expense ratio were each higher than the Lipper expense group median.
The Trustees also considered the advisory fees charged by MFS to any institutional separate accounts advised by MFS (“separate accounts”) and unaffiliated investment companies for which MFS serves as subadviser (“subadvised funds”) that have comparable investment strategies to the Fund. In comparing these fees, the Trustees considered information provided by MFS as to the generally broader scope of services provided by MFS to the Fund, as well as the more extensive regulatory burdens imposed on MFS in managing the Fund, in comparison to separate accounts and subadvised funds. The Trustees also considered the higher demands placed on MFS’ investment personnel and trading infrastructure as a result of the daily cash in-flows and out-flows of the Fund in comparison to separate accounts.
The Trustees also considered whether the Fund may benefit from any economies of scale in the management of the Fund in the event of growth in assets of the Fund and/or growth in assets of the MFS Funds as a whole. They noted that the Fund’s advisory fee rate schedule is subject to a contractual breakpoint that reduces the Fund’s advisory fee rate on average daily net assets over $1 billion. The Trustees also noted that MFS has agreed in writing to waive a portion of the management fees of certain MFS Funds, including the Fund, if the total combined assets of certain funds within the MFS Funds’ complex increase above agreed upon thresholds (the “group fee waiver”), enabling the Fund’s shareholders to share in the benefits from any economies of scale at the complex level. The group fee waiver is reviewed and renewed annually between the Board and MFS. The Trustees concluded that the breakpoint and the group fee waiver were sufficient to allow the Fund to benefit from economies of scale as its assets and overall complex assets grow.
The Trustees also considered information prepared by MFS relating to MFS’ costs and profits with respect to the Fund, the MFS Funds considered as a group, and other investment companies and accounts advised by MFS, as well as MFS’ methodologies used to determine and allocate its costs to the MFS Funds, the Fund and other accounts and products for purposes of estimating profitability.
After reviewing these and other factors described herein, the Trustees concluded, within the context of their overall conclusions regarding the investment advisory agreement, that the advisory fees charged to the Fund represent reasonable compensation in light of the services being provided by MFS to the Fund.
In addition, the Trustees considered MFS’ resources and related efforts to continue to retain, attract and motivate capable personnel to serve the Fund. The Trustees also considered current and developing conditions in the financial services industry, including the presence of large and well-capitalized companies which are spending, and appear to be prepared to continue to spend, substantial sums to engage personnel and to provide services to competing investment companies. In this regard, the Trustees also considered the financial resources of MFS and its ultimate parent, Sun Life Financial Inc. The Trustees also considered the advantages and possible disadvantages to the Fund of having an adviser that also serves other investment companies as well as other accounts.
The Trustees also considered the nature, quality, cost, and extent of administrative, transfer agency, and distribution services provided to the Fund by MFS and its affiliates under agreements and plans other than the investment advisory agreement, including any 12b-1 fees the Fund pays to MFS Fund Distributors, Inc., an affiliate of MFS. The Trustees also considered the nature, extent and quality of certain other services MFS performs or arranges for on the Fund’s behalf, which may include securities lending programs, directed expense payment programs, class action recovery programs, and MFS’ interaction with third-party service providers, principally custodians and sub-custodians. The Trustees concluded that the various non-advisory services provided by MFS and its affiliates on behalf of the Fund were satisfactory.
The Trustees also considered benefits to MFS from the use of the Fund’s portfolio brokerage commissions, if applicable, to pay for investment research and various other factors. Additionally, the Trustees considered so-called “fall-out benefits” to MFS such as reputational value derived from serving as investment manager to the Fund.
Based on their evaluation of factors that they deemed to be material, including those factors described above, the Board of Trustees, including the independent Trustees, concluded that the Fund’s investment advisory agreement with MFS should be continued for an additional one-year period, commencing August 1, 2015.
24
MFS Growth Series
PROXY VOTING POLICIES AND INFORMATION
MFS votes proxies on behalf of the fund pursuant to proxy voting policies and procedures that are available without charge, upon request, by calling 1-800-225-2606, by visiting the Proxy Voting section of mfs.com or by visiting the SEC’s Web site at http://www.sec.gov.
Information regarding how the fund voted proxies relating to portfolio securities during the most recent twelve-month period ended June 30 is available without charge by visiting the Proxy Voting section of mfs.com or by visiting the SEC’s Web site at http://www.sec.gov.
QUARTERLY PORTFOLIO DISCLOSURE
The fund will file a complete schedule of portfolio holdings with the Securities and Exchange Commission (the Commission) for the first and third quarters of each fiscal year on Form N-Q. The fund’s Form N-Q is available on the EDGAR database on the Commission’s Internet Web site at http://www.sec.gov, and may be reviewed and copied at the:
Public Reference Room
Securities and Exchange Commission
100 F Street, NE, Room 1580
Washington, D.C. 20549
Information on the operation of the Public Reference Room may be obtained by calling the Commission at 1-800-SEC-0330. Copies of the fund’s Form N-Q also may be obtained, upon payment of a duplicating fee, by electronic request at the following e-mail address: publicinfo@sec.gov or by writing the Public Reference Section at the above address.
FURTHER INFORMATION
From time to time, MFS may post important information about the fund or the MFS funds on the MFS web site (mfs.com). This information is available by visiting the “Market Commentary” and “Announcements” sub sections in the “Market Outlooks” section of mfs.com or by clicking on the fund’s name under “Variable Insurance Portfolios — VIT” in the “Products” section of mfs.com.
FEDERAL TAX INFORMATION (unaudited)
The following information is provided pursuant to provisions of the Internal Revenue Code.
The fund designates $90,794,000 as capital gain dividends paid during the fiscal year.
For corporate shareholders, 100% of the ordinary income dividends paid during the fiscal year qualify for the corporate dividends received deduction.
25
rev. 3/11
| | | | |
| FACTS | | WHAT DOES MFS DO WITH YOUR
PERSONAL INFORMATION? | |  |
| | |
| Why? | | Financial companies choose how they share your personal information. Federal law gives consumers the right to limit some but not all sharing. Federal law also requires us to tell you how we collect, share, and protect your personal information. Please read this notice carefully to understand what we do. |
| | |
| What? | | The types of personal information we collect and share depend on the product or service you have with us. This information can include: • Social Security number and account balances • Account transactions and transaction history • Checking account information and wire transfer instructions When you are no longer our customer, we continue to share your information as described in this notice. |
| | |
| How? | | All financial companies need to share customers’ personal information to run their everyday business. In the section below, we list the reasons financial companies can share their customers’ personal information; the reasons MFS chooses to share; and whether you can limit this sharing. |
| | | | |
Reasons we can share your
personal information | | Does MFS share? | | Can you limit this
sharing? |
For our everyday business purposes – such as to process your transactions, maintain your account(s), respond to court orders and legal investigations, or report to credit bureaus | | Yes | | No |
For our marketing purposes – to offer our products and services to you | | No | | We don’t share |
| For joint marketing with other financial companies | | No | | We don’t share |
For our affiliates’ everyday business purposes – information about your transactions and experiences | | No | | We don’t share |
For our affiliates’ everyday business purposes – information about your creditworthiness | | No | | We don’t share |
| For nonaffiliates to market to you | | No | | We don’t share |
| | |
| Questions? | | Call 800-225-2606 or go to mfs.com. |
26
| | |
| Who we are |
| Who is providing this notice? | | MFS Funds, MFS Investment Management, MFS Institutional Advisors, Inc., MFS Fund Distributors, Inc., MFS Heritage Trust Company, and MFS Service Center, Inc. |
| | |
| What we do |
| How does MFS protect my personal information? | | To protect your personal information from unauthorized access and use, we use security measures that comply with federal law. These measures include procedural, electronic, and physical safeguards for the protection of the personal information we collect about you. |
How does MFS
collect my personal information? | | We collect your personal information, for example, when you • open an account or provide account information • direct us to buy securities or direct us to sell your securities • make a wire transfer We also collect your personal information from others, such as credit bureaus, affiliates and other companies. |
| Why can’t I limit all sharing? | | Federal law gives you the right to limit only • sharing for affiliates’ everyday business purposes – information about your creditworthiness • affiliates from using your information to market to you • sharing for nonaffiliates to market to you State laws and individual companies may give you additional rights to limit sharing. |
| | |
| Definitions |
| Affiliates | | Companies related by common ownership or control. They can be financial and nonfinancial companies. • MFS does not share personal information with affiliates, except for everyday business purposes as described on page one of this notice. |
| Nonaffiliates | | Companies not related by common ownership or control. They can be financial and nonfinancial companies. • MFS does not share with nonaffiliates so they can market to you. |
| Joint Marketing | | A formal agreement between nonaffiliated financial companies that together market financial products or services to you. • MFS doesn’t jointly market. |
| | |
| Other important information |
| If you own an MFS product or receive an MFS service in the name of a third party such as a bank or broker-dealer, their privacy policy may apply to you instead of ours. |
27
ANNUAL REPORT
December 31, 2015

MFS® INVESTORS TRUST SERIES
MFS® Variable Insurance Trust

VGI-ANN
MFS® INVESTORS TRUST SERIES
CONTENTS
The report is prepared for the general information of contract owners. It is authorized for distribution to prospective investors only when preceded or accompanied by a current prospectus.
NOT FDIC INSURED • MAY LOSE VALUE • NO BANK OR CREDIT UNION GUARANTEE • NOT A DEPOSIT • NOT INSURED BY ANY FEDERAL GOVERNMENT AGENCY OR NCUA/NCUSIF
MFS Investors Trust Series
LETTER FROM THE CHAIRMAN

Dear Contract Owners:
Central bank policies remain center stage as the U.S. Federal Reserve made good on its pledge to raise policy rates for the first time in over nine years at its December meeting. The Fed’s actions stand in stark contrast to those of the European Central Bank and Bank of Japan, which modestly extended their quantitative easing programs in December.
In the United States, auto sales remain a source of economic strength, but housing demand has slowed of late. The U.S. economic expansion remains moderate but uneven, with a strong dollar crimping demand for U.S. goods abroad. China’s shift to a consumer-led economy continues to weigh on its manufacturing and exports, as does weak global demand. Slackening demand from China continues to undermine commodity markets, with oil particularly impacted amid a global supply glut.
As markets have become more focused on short-term trends in recent years, we believe it’s important for investors to lengthen their investment time horizon. At MFS®, we don’t trade on headlines or trends; we invest for the long term.
We believe that this approach, coupled with the professional guidance of a financial advisor, will help you reach your investment goals.
Respectfully,

Robert J. Manning
Chairman
MFS Investment Management
February 16, 2016
The opinions expressed in this letter are subject to change and may not be relied upon for investment advice. No forecasts can be guaranteed.
1
MFS Investors Trust Series
PORTFOLIO COMPOSITION
Portfolio structure

| | | | |
| Top ten holdings | | | | |
| JPMorgan Chase & Co. | | | 3.3% | |
| Danaher Corp. | | | 2.9% | |
| Visa, Inc., “A” | | | 2.8% | |
| Alphabet, Inc., “A” | | | 2.4% | |
| Thermo Fisher Scientific, Inc. | | | 2.3% | |
| Bank of America Corp. | | | 2.1% | |
| Johnson & Johnson | | | 2.1% | |
| Wells Fargo & Co. | | | 2.1% | |
| American Tower Corp., REIT | | | 1.9% | |
| Alphabet, Inc., “C” | | | 1.9% | |
| | | | |
| Equity sectors | | | | |
| Financial Services | | | 21.8% | |
| Health Care | �� | | 14.8% | |
| Technology | | | 10.2% | |
| Consumer Staples | | | 10.2% | |
| Industrial Goods & Services | | | 8.2% | |
| Retailing | | | 7.6% | |
| Special Products & Services | | | 5.9% | |
| Leisure | | | 5.5% | |
| Energy | | | 4.7% | |
| Basic Materials | | | 4.2% | |
| Utilities & Communications | | | 3.5% | |
| Transportation | | | 1.4% | |
| Autos & Housing | | | 1.1% | |
Cash & Cash Equivalents includes any cash, investments in money market funds, short-term securities, and other assets less liabilities. Please see the Statement of Assets and Liabilities for additional information related to the fund’s cash position and other assets and liabilities.
Percentages are based on net assets as of 12/31/15.
The portfolio is actively managed and current holdings may be different.
2
MFS Investors Trust Series
MANAGEMENT REVIEW
Summary of Results
For the twelve months ended December 31, 2015, Initial Class shares of the MFS Investors Trust Series (“fund”) provided a total return of 0.22%, while Service Class shares of the fund provided a total return of –0.05%. These compare with a return of 1.38% over the same period for the fund’s benchmark, the Standard & Poor’s 500 Stock Index (“S&P 500 Index”).
Market Environment
Sluggish global growth weighed on both developed and emerging market (“EM”) economies during the reporting period. EM economies have been particularly lackluster. While the US Federal Reserve began its anticipated monetary policy tightening cycle at the end of the period, other large developed economies continued to embrace accommodative monetary policies, particularly the European Central Bank and the Bank of Japan. Focus remained on China after policy missteps by the Chinese government roiled global markets over the summer, beginning with the uncoordinated response to the stock market’s boom and bust and then the confusing decision to devalue the renminbi in August. China subsequently ramped up a wide range of monetary and fiscal measures to stimulate the economy and bolster sentiment. Its economy appeared to stabilize late in the period. Also at the end of the period, the Chinese renminbi was granted reserve currency status by the International Monetary Fund (“IMF”), which announced its inclusion in the IMF’s Special Drawing Rights currency basket effective October 1, 2016.
During the second half of the reporting period, the US faced an earnings recession caused primarily by the sharp decline in the prices of oil and other commodities. Earnings contractions were concentrated primarily in the energy, materials and industrial sectors. An additional headwind for earnings was the sharp rise in the US dollar over the period. Exports were crimped by the dollar’s strength and falling demand in emerging markets. Consumer spending held up well during the second half of the period amid a modest increase in real wages and a tailwind from falling gasoline prices. Demand for autos reached near-record territory late in the period. In emerging markets, two key factors weighed on economies and asset prices: 1) weaker Chinese growth, which drove the decline in commodity prices and 2) prospects for higher US interest rates. Structural factors like floating exchange rates and fiscal buffers partially offset these cyclical headwinds.
Detractors from Performance
Stock selection within the retailing sector and leisure sectors detracted from the fund’s performance relative to the S&P 500 Index. Within retailing, not owning shares of internet retailer Amazon.com weakened relative results as the company’s shares appreciated during the reporting period. Shares of Amazon.com appreciated after the company reported strong quarterly results, driven by improving growth in its core retail segment and remote computing segment (Amazon Web Services). Within the leisure sector, the fund’s overweight positions in media firms Timer Warner and Twenty-First Century Fox held back relative returns. While Time Warner exceeded consensus’ earnings expectations, it appeared that investor sentiment was weighed by management’s lowered 2016 earnings guidance.
Elsewhere, not owning software giant Microsoft, diversified industrial conglomerate General Electric and social networking service provider Facebook dampened relative performance as the shares of all three companies outpaced the fund’s benchmark. The fund’s overweight positions in financial services company American Express, energy exploration and production companies EOG Resources and Noble Energy also detracted from relative results. Shares of railroad company Canadian National Railway (b) further dampened relative returns. Shares of Canadian National Railway fell as it appeared that investor concern regarding weaker carload volumes for coal, metals and crude weighed on its share price.
During the reporting period, the fund’s relative currency exposure, resulting primarily from differences between the fund’s and the benchmark’s exposures to holdings of securities denominated in foreign currencies, detracted from relative performance. All of MFS’ investment decisions are driven by the fundamentals of each individual opportunity and, as such, it is common for our portfolios to have different currency exposure than the benchmark.
Contributors to Performance
Stock selection in the technology sector benefited relative performance. The fund’s overweight position in internet search giant Alphabet (formerly Google) was a notable contributor to relative returns. Shares of Alphabet benefited from strength in mobile search and video ads on YouTube which were notable contributors to the company’s above-consensus results. Management also announced that it had authorized a stock buyback program which further supported the stock. Not owning shares of wireless communications software company QUALCOMM also aided relative results. Shares of QUALCOMM declined after in-line fourth-quarter earnings were accompanied by a weak outlook from management. Chip operating margins declined and new license agreements in China have been slow to progress, which further weighed on the company’s shares.
Stock selection and an underweight position in the utilities & communications sector also boosted relative performance. Not owning shares of natural gas pipelines operator Kinder Morgan supported relative results as the company underperformed the fund’s benchmark. Shares of Kinder Morgan depreciated significantly after challenging business trends forced the company to cut its annual dividend by 75% during the period to preserve cash.
3
MFS Investors Trust Series
Management Review – continued
In other sectors, the fund’s overweight positions in global payments technology company Visa, snack food and beverage producer Mondelez International, management consulting firm Accenture, commercial products manufacturer Newell Rubbermaid and financial clearing house Nasdaq strengthened relative results. Visa’s outperformance appeared to be driven by expectations of growth from their core businesses, the announced acquisition of Visa Europe and capital return. Not owning shares of integrated oil and gas company Exxon Mobil and retail giant Wal-Mart also bolstered relative performance.
Respectfully,
| | |
| T. Kevin Beatty | | Ted Maloney |
| Portfolio Manager | | Portfolio Manager |
| (b) | Security is not a benchmark constituent. |
The views expressed in this report are those of the portfolio managers only through the end of the period of the report as stated on the cover and do not necessarily reflect the views of MFS or any other person in the MFS organization. These views are subject to change at any time based on market or other conditions, and MFS disclaims any responsibility to update such views. These views may not be relied upon as investment advice or an indication of trading intent on behalf of any MFS portfolio. References to specific securities are not recommendations of such securities, and may not be representative of any MFS portfolio’s current or future investments.
4
MFS Investors Trust Series
PERFORMANCE SUMMARY THROUGH 12/31/15
The following chart illustrates the historical performance of the fund in comparison to its benchmark(s). Benchmarks are unmanaged and may not be invested in directly. Benchmark returns do not reflect any fees or expenses. The performance of other share classes will be greater than or less than that of the class depicted below. (See Notes to Performance Summary.)
Performance data shown represents past performance and is no guarantee of future results. Investment return and principal value fluctuate so your units, when sold, may be worth more or less than the original cost; current performance may be lower or higher than quoted. The performance shown does not reflect the deduction of taxes, if any, that a contract holder would pay on fund distributions or the redemption of contract units. The returns for the fund shown also do not reflect the deduction of expenses associated with variable products, such as mortality and expense risk charges, separate account charges, and sales charges imposed by the insurance company separate accounts. Such expenses would reduce the overall returns shown.
Growth of a Hypothetical $10,000 Investment
Total Returns through 12/31/15
Average annual total returns
| | | | | | | | | | | | |
| | | Share Class | | Class Inception Date | | 1-yr | | 5-yr | | 10-yr | | |
| | | Initial Class | | 10/09/95 | | 0.22% | | 11.36% | | 7.25% | | |
| | | Service Class | | 5/01/00 | | (0.05)% | | 11.07% | | 6.98% | | |
| | | | |
| Comparative benchmark | | | | | | | | |
| | | Standard & Poor’s 500 Stock Index (f) | | 1.38% | | 12.57% | | 7.31% | | |
| (f) | Source: FactSet Research Systems Inc. |
Benchmark Definition
Standard & Poor’s 500 Stock Index – a market capitalization-weighted index of 500 widely held equity securities, designed to measure broad U.S. equity performance.
It is not possible to invest directly in an index.
Notes to Performance Summary
Average annual total return represents the average annual change in value for each share class for the periods presented.
Performance results reflect any applicable expense subsidies and waivers in effect during the periods shown. Without such subsidies and waivers the fund’s performance results would be less favorable. Please see the prospectus and financial statements for complete details. All results are historical and assume the reinvestment of any dividends and capital gains distributions.
Performance results do not include adjustments made for financial reporting purposes in accordance with U.S. generally accepted accounting principles and may differ from amounts reported in the financial highlights.
From time to time the fund may receive proceeds from litigation settlements, without which performance would be lower.
5
MFS Investors Trust Series
EXPENSE TABLE
Fund Expenses Borne by the Contract Holders during the Period,
July 1, 2015 through December 31, 2015
As a contract holder of the fund, you incur ongoing costs, including management fees; distribution and/or service (12b-1) fees; and other fund expenses. This example is intended to help you understand your ongoing costs (in dollars) of investing in the fund and to compare these costs with the ongoing costs of investing in other mutual funds.
The example is based on an investment of $1,000 invested at the beginning of the period and held for the entire period July 1, 2015 through December 31, 2015.
Actual Expenses
The first line for each share class in the following table provides information about actual account values and actual expenses. You may use the information in this line, together with the amount you invested, to estimate the expenses that you paid over the period. Simply divide your account value by $1,000 (for example, an $8,600 account value divided by $1,000 = 8.6), then multiply the result by the number in the first line under the heading entitled “Expenses Paid During Period” to estimate the expenses you paid on your account during this period.
Hypothetical Example for Comparison Purposes
The second line for each share class in the following table provides information about hypothetical account values and hypothetical expenses based on the fund’s actual expense ratio and an assumed rate of return of 5% per year before expenses, which is not the fund’s actual return. The hypothetical account values and expenses may not be used to estimate the actual ending account balance or expenses you paid for the period. You may use this information to compare the ongoing costs of investing in the fund and other funds. To do so, compare this 5% hypothetical example with the 5% hypothetical examples that appear in the shareholder reports of the other funds.
Please note that the expenses shown in the table are meant to highlight the fund’s ongoing costs only and do not take into account the fees and expenses imposed under the variable contracts through which your investment in the fund is made. Therefore, the second line for each share class in the table is useful in comparing ongoing costs associated with an investment in vehicles (such as the fund) which fund benefits under variable annuity and variable life insurance contracts and to qualified pension and retirement plans only, and will not help you determine the relative total costs of investing in the fund through variable annuity and variable life insurance contracts. If the fees and expenses imposed under the variable contracts were included, your costs would have been higher.
| | | | | | | | | | | | | | | | | | |
| Share Class | | | | Annualized
Expense Ratio | | | Beginning
Account Value
7/01/15 | | | Ending Account Value
12/31/15 | | | Expenses Paid
During Period (p)
7/01/15-12/31/15 | |
| Initial Class | | Actual | | | 0.82% | | | | $1,000.00 | | | | $985.96 | | | | $4.10 | |
| | Hypothetical (h) | | | 0.82% | | | | $1,000.00 | | | | $1,021.07 | | | | $4.18 | |
| Service Class | | Actual | | | 1.07% | | | | $1,000.00 | | | | $984.51 | | | | $5.35 | |
| | Hypothetical (h) | | | 1.07% | | | | $1,000.00 | | | | $1,019.81 | | | | $5.45 | |
| (h) | 5% class return per year before expenses. |
| (p) | “Expenses Paid During Period” are equal to each class’s annualized expense ratio, as shown above, multiplied by the average account value over the period, multiplied by 184/365 (to reflect the one-half year period). |
6
MFS Investors Trust Series
PORTFOLIO OF INVESTMENTS – 12/31/15
The Portfolio of Investments is a complete list of all securities owned by your fund. It is categorized by broad-based asset classes.
| | | | | | | | |
| Issuer | | Shares/Par | | | Value ($) | |
| | | | | | | | |
| COMMON STOCKS – 98.8% | | | | | |
| Aerospace – 3.5% | | | | | |
| Honeywell International, Inc. | | | 82,345 | | | $ | 8,528,467 | |
| Precision Castparts Corp. | | | 7,898 | | | | 1,832,415 | |
| United Technologies Corp. | | | 68,797 | | | | 6,609,328 | |
| | | | | | | | |
| | | $ | 16,970,210 | |
| | | | | | | | |
| Alcoholic Beverages – 1.8% | | | | | |
| Diageo PLC | | | 124,400 | | | $ | 3,392,449 | |
| Pernod Ricard S.A. | | | 47,283 | | | | 5,375,651 | |
| | | | | | | | |
| | | $ | 8,768,100 | |
| | | | | | | | |
| Apparel Manufacturers – 2.4% | | | | | |
| LVMH Moet Hennessy Louis Vuitton S.A. | | | 34,247 | | | $ | 5,353,719 | |
| NIKE, Inc., “B” | | | 34,748 | | | | 2,171,750 | |
| VF Corp. | | | 65,389 | | | | 4,070,465 | |
| | | | | | | | |
| | | $ | 11,595,934 | |
| | | | | | | | |
| Broadcasting – 3.9% | | | | | |
| Time Warner, Inc. | | | 104,313 | | | $ | 6,745,922 | |
| Twenty-First Century Fox, Inc. | | | 201,624 | | | | 5,476,108 | |
| Walt Disney Co. | | | 62,301 | | | | 6,546,589 | |
| | | | | | | | |
| | | $ | 18,768,619 | |
| | | | | | | | |
| Brokerage & Asset Managers – 3.2% | | | | | |
| BlackRock, Inc. | | | 21,347 | | | $ | 7,269,080 | �� |
| Blackstone Group LP | | | 79,811 | | | | 2,333,674 | |
| NASDAQ, Inc. | | | 104,438 | | | | 6,075,158 | |
| | | | | | | | |
| | | $ | 15,677,912 | |
| | | | | | | | |
| Business Services – 5.9% | | | | | |
| Accenture PLC, “A” | | | 87,239 | | | $ | 9,116,476 | |
| Cognizant Technology Solutions Corp., “A” (a) | | | 145,087 | | | | 8,708,122 | |
| Fidelity National Information Services, Inc. | | | 121,837 | | | | 7,383,322 | |
| Gartner, Inc. (a) | | | 36,101 | | | | 3,274,361 | |
| | | | | | | | |
| | | $ | 28,482,281 | |
| | | | | | | | |
| Cable TV – 1.7% | | | | | |
| Comcast Corp., “A” | | | 143,492 | | | $ | 8,097,254 | |
| | | | | | | | |
| Chemicals – 1.4% | | | | | |
| Monsanto Co. | | | 69,726 | | | $ | 6,869,406 | |
| | | | | | | | |
| Computer Software – 0.7% | | | | | |
| Adobe Systems, Inc. (a) | | | 37,535 | | | $ | 3,526,038 | |
| | | | | | | | |
| Computer Software – Systems – 2.9% | | | | | |
| Apple, Inc. | | | 48,016 | | | $ | 5,054,164 | |
| EMC Corp. | | | 278,698 | | | | 7,156,965 | |
| Hewlett Packard Enterprise | | | 125,817 | | | | 1,912,418 | |
| | | | | | | | |
| | | $ | 14,123,547 | |
| | | | | | | | |
| Construction – 1.1% | | | | | |
| Sherwin-Williams Co. | | | 19,728 | | | $ | 5,121,389 | |
| | | | | | | | |
| Consumer Products – 4.5% | | | | | |
| Colgate-Palmolive Co. | | | 71,574 | | | $ | 4,768,260 | |
| Estee Lauder Cos., Inc., “A” | | | 23,185 | | | | 2,041,671 | |
| | | | | | | | |
| Issuer | | Shares/Par | | | Value ($) | |
| | | | | | | | |
| COMMON STOCKS – continued | | | | | |
| Consumer Products – continued | | | | | |
| Kimberly-Clark Corp. | | | 20,959 | | | $ | 2,668,081 | |
| Newell Rubbermaid, Inc. | | | 193,597 | | | | 8,533,756 | |
| Procter & Gamble Co. | | | 50,336 | | | | 3,997,182 | |
| | | | | | | | |
| | | $ | 22,008,950 | |
| | | | | | | | |
| Containers – 1.2% | | | | | |
| Crown Holdings, Inc. (a) | | | 115,062 | | | $ | 5,833,643 | |
| | | | | | | | |
| Electrical Equipment – 4.0% | | | | | | | | |
| Danaher Corp. | | | 153,308 | | | $ | 14,239,247 | |
| W.W. Grainger, Inc. | | | 25,391 | | | | 5,143,963 | |
| | | | | | | | |
| | | $ | 19,383,210 | |
| | | | | | | | |
| Electronics – 2.2% | | | | | |
| Avago Technologies Ltd. | | | 59,904 | | | $ | 8,695,066 | |
| Microchip Technology, Inc. | | | 43,825 | | | | 2,039,616 | |
| | | | | | | | |
| | | $ | 10,734,682 | |
| | | | | | | | |
| Energy – Independent – 2.4% | | | | | |
| EOG Resources, Inc. | | | 90,734 | | | $ | 6,423,060 | |
| Noble Energy, Inc. | | | 101,452 | | | | 3,340,814 | |
| Occidental Petroleum Corp. | | | 25,328 | | | | 1,712,426 | |
| | | | | | | | |
| | | $ | 11,476,300 | |
| | | | | | | | |
| Engineering – Construction – 0.7% | | | | | |
| Fluor Corp. | | | 76,008 | | | $ | 3,589,098 | |
| | | | | | | | |
| Food & Beverages – 3.8% | | | | | |
| Danone S.A. | | | 87,479 | | | $ | 5,903,728 | |
| General Mills, Inc. | | | 37,590 | | | | 2,167,439 | |
| Mead Johnson Nutrition Co., “A” | | | 32,950 | | | | 2,601,403 | |
| Mondelez International, Inc. | | | 175,691 | | | | 7,877,984 | |
| | | | | | | | |
| | | $ | 18,550,554 | |
| | | | | | | | |
| General Merchandise – 2.0% | | | | | |
| Costco Wholesale Corp. | | | 28,578 | | | $ | 4,615,347 | |
| Kohl’s Corp. | | | 15,830 | | | | 753,983 | |
| Target Corp. | | | 62,695 | | | | 4,552,284 | |
| | | | | | | | |
| | | $ | 9,921,614 | |
| | | | | | | | |
| Insurance – 1.0% | | | | | |
| ACE Ltd. | | | 42,837 | | | $ | 5,005,503 | |
| | | | | | | | |
| Internet – 4.3% | | | | | |
| Alphabet, Inc., “A” (a) | | | 15,175 | | | $ | 11,806,302 | |
| Alphabet, Inc., “C” (a) | | | 12,183 | | | | 9,245,435 | |
| | | | | | | | |
| | | $ | 21,051,737 | |
| | | | | | | | |
| Major Banks – 10.6% | | | | | |
| Bank of America Corp. | | | 615,132 | | | $ | 10,352,672 | |
| Goldman Sachs Group, Inc. | | | 48,725 | | | | 8,781,707 | |
| JPMorgan Chase & Co. | | | 243,234 | | | | 16,060,741 | |
| Morgan Stanley | | | 122,525 | | | | 3,897,520 | |
| State Street Corp. | | | 39,732 | | | | 2,636,616 | |
| Wells Fargo & Co. | | | 184,116 | | | | 10,008,546 | |
| | | | | | | | |
| | | $ | 51,737,802 | |
| | | | | | | | |
7
MFS Investors Trust Series
Portfolio of Investments – continued
| | | | | | | | |
| Issuer | | Shares/Par | | | Value ($) | |
| | | | | | | | |
| COMMON STOCKS – continued | | | | | |
| Medical & Health Technology & Services – 1.1% | | | | | |
| McKesson Corp. | | | 27,576 | | | $ | 5,438,814 | |
| | | | | | | | |
| Medical Equipment – 5.6% | | | | | |
| Abbott Laboratories | | | 59,981 | | | $ | 2,693,747 | |
| Medtronic PLC | | | 61,255 | | | | 4,711,735 | |
| St. Jude Medical, Inc. | | | 55,236 | | | | 3,411,928 | |
| Stryker Corp. | | | 52,338 | | | | 4,864,294 | |
| Thermo Fisher Scientific, Inc. | | | 80,182 | | | | 11,373,817 | |
| | | | | | | | |
| | | $ | 27,055,521 | |
| | | | | | | | |
| Oil Services – 2.4% | | | | | |
| Cameron International Corp. (a) | | | 66,292 | | | $ | 4,189,654 | |
| National Oilwell Varco, Inc. | | | 53,744 | | | | 1,799,887 | |
| Schlumberger Ltd. | | | 79,147 | | | | 5,520,503 | |
| | | | | | | | |
| | | $ | 11,510,044 | |
| | | | | | | | |
| Other Banks & Diversified Financials – 6.9% | | | | | |
| American Express Co. | | | 126,919 | | | $ | 8,827,216 | |
| BB&T Corp. | | | 79,375 | | | | 3,001,169 | |
| MasterCard, Inc., “A” | | | 85,143 | | | | 8,289,522 | |
| Visa, Inc., “A” | | | 175,470 | | | | 13,607,699 | |
| | | | | | | | |
| | | $ | 33,725,606 | |
| | | | | | | | |
| Pharmaceuticals – 8.2% | | | | | |
| Allergan PLC (a) | | | 21,552 | | | $ | 6,735,000 | |
| Bristol-Myers Squibb Co. | | | 104,482 | | | | 7,187,317 | |
| Eli Lilly & Co. | | | 75,233 | | | | 6,339,133 | |
| Endo International PLC (a) | | | 77,230 | | | | 4,728,021 | |
| Johnson & Johnson | | | 97,641 | | | | 10,029,684 | |
| Valeant Pharmaceuticals International, Inc. (a) | | | 45,464 | | | | 4,621,416 | |
| | | | | | | | |
| | | $ | 39,640,571 | |
| | | | | | | | |
| Railroad & Shipping – 1.4% | | | | | |
| Canadian National Railway Co. | | | 124,237 | | | $ | 6,942,364 | |
| | | | | | | | |
| Specialty Chemicals – 1.6% | | | | | |
| Praxair, Inc. | | | 31,272 | | | $ | 3,202,253 | |
| W.R. Grace & Co. (a) | | | 43,672 | | | | 4,349,294 | |
| | | | | | | | |
| | | $ | 7,551,547 | |
| | | | | | | | |
| Specialty Stores – 3.2% | | | | | |
| AutoZone, Inc. (a) | | | 8,257 | | | $ | 6,125,951 | |
| L Brands, Inc. | | | 27,960 | | | | 2,679,127 | |
| Ross Stores, Inc. | | | 124,551 | | | | 6,702,089 | |
| | | | | | | | |
| | | $ | 15,507,167 | |
| | | | | | | | |
| Telecommunications – Wireless – 1.9% | | | | | |
| American Tower Corp., REIT | | | 97,075 | | | $ | 9,411,421 | |
| | | | | | | | |
| Utilities – Electric Power – 1.3% | | | | | |
| American Electric Power Co., Inc. | | | 57,434 | | | $ | 3,346,679 | |
| CMS Energy Corp. | | | 83,970 | | | | 3,029,638 | |
| | | | | | | | |
| | | $ | 6,376,317 | |
| | | | | | | | |
Total Common Stocks
(Identified Cost, $325,098,248) | | | $ | 480,453,155 | |
| | | | | | | | |
| | | | | | | | |
| Issuer | | Shares/Par | | | Value ($) | |
| | | | | | | | |
| CONVERTIBLE PREFERRED STOCKS – 0.3% | |
| Utilities – Electric Power – 0.3% | | | | | | | | |
| Exelon Corp., 6.5% (Identified Cost, $1,672,245) | | | 33,054 | | | $ | 1,337,695 | |
| | | | | | | | |
| |
| MONEY MARKET FUNDS – 0.9% | | | | | |
| MFS Institutional Money Market Portfolio, 0.19%, at Cost and Net Asset Value (v) | | | 4,635,935 | | | $ | 4,635,935 | |
| | | | | | | | |
Total Investments
(Identified Cost, $331,406,428) | | | | | | $ | 486,426,785 | |
| | | | | | | | |
OTHER ASSETS, LESS
LIABILITIES – (0.0)% | | | | (107,321 | ) |
| | | | | | | | |
| Net Assets – 100.0% | | | $ | 486,319,464 | |
| | | | | | | | |
| (a) | | Non-income producing security. |
| (v) | | Underlying affiliated fund that is available only to investment companies managed by MFS. The rate quoted for the MFS Institutional Money Market Portfolio is the annualized seven-day yield of the fund at period end. |
The following abbreviations are used in this report and are defined:
| PLC | | Public Limited Company |
| REIT | | Real Estate Investment Trust |
See Notes to Financial Statements
8
MFS Investors Trust Series
FINANCIAL STATEMENTS | STATEMENT OF ASSETS AND LIABILITIES
This statement represents your fund’s balance sheet, which details the assets and liabilities comprising the total value of the fund.
| | | | | | | | |
At 12/31/15 | | | | | | | | |
Assets | | | | | | | | |
Investments | | | | | | | | |
Non-affiliated issuers, at value (identified cost, $326,770,493) | | | $481,790,850 | | | | | |
Underlying affiliated funds, at cost and value | | | 4,635,935 | | | | | |
Total investments, at value (identified cost, $331,406,428) | | | $486,426,785 | | | | | |
Foreign currency, at value (identified cost, $28) | | | 28 | | | | | |
Receivables for | | | | | | | | |
Fund shares sold | | | 143,813 | | | | | |
Interest and dividends | | | 457,234 | | | | | |
Other assets | | | 3,166 | | | | | |
Total assets | | | | | | | $487,031,026 | |
Liabilities | | | | | | | | |
Payable to custodian | | | $9,485 | | | | | |
Payable for fund shares reacquired | | | 568,724 | | | | | |
Payable to affiliates | | | | | | | | |
Investment adviser | | | 20,462 | | | | | |
Shareholder servicing costs | | | 283 | | | | | |
Distribution and/or service fees | | | 2,681 | | | | | |
Payable for independent Trustees’ compensation | | | 16 | | | | | |
Accrued expenses and other liabilities | | | 109,911 | | | | | |
Total liabilities | | | | | | | $711,562 | |
Net assets | | | | | | | $486,319,464 | |
Net assets consist of | | | | | | | | |
Paid-in capital | | | $276,128,044 | | | | | |
Unrealized appreciation (depreciation) on investments and translation of assets and liabilities in foreign currencies | | | 155,020,357 | | | | | |
Accumulated net realized gain (loss) on investments and foreign currency | | | 51,576,912 | | | | | |
Undistributed net investment income | | | 3,594,151 | | | | | |
Net assets | | | | | | | $486,319,464 | |
Shares of beneficial interest outstanding | | | | | | | 18,374,664 | |
| | | | | | | | | | | | |
| | | Net assets | | | Shares
outstanding | | | Net asset value
per share | |
Initial Class | | | $293,202,981 | | | | 11,032,106 | | | | $26.58 | |
Service Class | | | 193,116,483 | | | | 7,342,558 | | | | 26.30 | |
See Notes to Financial Statements
9
MFS Investors Trust Series
FINANCIAL STATEMENTS | STATEMENT OF OPERATIONS
This statement describes how much your fund earned in investment income and accrued in expenses. It also describes any gains and/or losses generated by fund operations.
| | | | | | | | |
Year ended 12/31/15 | | | | | | | | |
Net investment income | | | | | | | | |
Income | | | | | | | | |
Dividends | | | $8,870,753 | | | | | |
Interest | | | 25,365 | | | | | |
Dividends from underlying affiliated funds | | | 5,083 | | | | | |
Foreign taxes withheld | | | (75,545 | ) | | | | |
Total investment income | | | | | | | $8,825,656 | |
Expenses | | | | | | | | |
Management fee | | | $4,304,534 | | | | | |
Distribution and/or service fees | | | 627,249 | | | | | |
Shareholder servicing costs | | | 45,861 | | | | | |
Administrative services fee | | | 99,411 | | | | | |
Independent Trustees’ compensation | | | 16,223 | | | | | |
Custodian fee | | | 62,024 | | | | | |
Shareholder communications | | | 96,575 | | | | | |
Audit and tax fees | | | 53,357 | | | | | |
Legal fees | | | 4,006 | | | | | |
Miscellaneous | | | 20,178 | | | | | |
Total expenses | | | | | | | $5,329,418 | |
Reduction of expenses by investment adviser | | | (39,729 | ) | | | | |
Net expenses | | | | | | | $5,289,689 | |
Net investment income | | | | | | | $3,535,967 | |
Realized and unrealized gain (loss) on investments and foreign currency | | | | | | | | |
Realized gain (loss) (identified cost basis) | | | | | | | | |
Investments | | | $53,233,615 | | | | | |
Foreign currency | | | (3,576 | ) | | | | |
Net realized gain (loss) on investments and foreign currency | | | | | | | $53,230,039 | |
Change in unrealized appreciation (depreciation) | | | | | | | | |
Investments | | | $(58,300,297 | ) | | | | |
Translation of assets and liabilities in foreign currencies | | | (1,041 | ) | | | | |
Net unrealized gain (loss) on investments and foreign currency translation | | | | | | | $(58,301,338 | ) |
Net realized and unrealized gain (loss) on investments and foreign currency | | | | | | | $(5,071,299 | ) |
Change in net assets from operations | | | | | | | $(1,535,332 | ) |
See Notes to Financial Statements
10
MFS Investors Trust Series
FINANCIAL STATEMENTS | STATEMENTS OF CHANGES IN NET ASSETS
These statements describe the increases and/or decreases in net assets resulting from operations, any distributions, and any shareholder transactions.
| | | | | | | | |
For years ended 12/31 | | | 2015 | | | | 2014 | |
Change in net assets | | | | | | | | |
From operations | | | | | | | | |
Net investment income | | | $3,535,967 | | | | $4,793,724 | |
Net realized gain (loss) on investments and foreign currency | | | 53,230,039 | | | | 62,248,482 | |
Net unrealized gain (loss) on investments and foreign currency translation | | | (58,301,338 | ) | | | (5,856,182 | ) |
Change in net assets from operations | | | $(1,535,332 | ) | | | $61,186,024 | |
Distributions declared to shareholders | | | | | | | | |
From net investment income | | | $(4,730,839 | ) | | | $(5,376,758 | ) |
From net realized gain on investments | | | (62,960,208 | ) | | | (47,877,196 | ) |
Total distributions declared to shareholders | | | $(67,691,047 | ) | | | $(53,253,954 | ) |
Change in net assets from fund share transactions | | | $(84,170,611 | ) | | | $(8,620,643 | ) |
Total change in net assets | | | $(153,396,990 | ) | | | $(688,573 | ) |
Net assets | | | | | | | | |
At beginning of period | | | 639,716,454 | | | | 640,405,027 | |
At end of period (including undistributed net investment income of $3,594,151 and
$4,792,600, respectively) | | | $486,319,464 | | | | $639,716,454 | |
See Notes to Financial Statements
11
MFS Investors Trust Series
FINANCIAL STATEMENTS | FINANCIAL HIGHLIGHTS
The financial highlights table is intended to help you understand the fund’s financial performance for the past 5 years. Certain information reflects financial results for a single fund share. The total returns in the table represent the rate by which an investor would have earned (or lost) on an investment in the fund share class (assuming reinvestment of all distributions) held for the entire period.
| | | | | | | | | | | | | | | | | | | | |
| Initial Class | | Years ended 12/31 | |
| | | 2015 | | | 2014 | | | 2013 | | | 2012 | | | 2011 | |
Net asset value, beginning of period | | | $30.41 | | | | $29.95 | | | | $22.93 | | | | $19.41 | | | | $20.04 | |
| Income (loss) from investment operations | | | | | | | | | | | | | | | | | | | | |
Net investment income (d) | | | $0.21 | | | | $0.26 | | | | $0.24 | | | | $0.25 | | | | $0.17 | |
Net realized and unrealized gain (loss) on investments
and foreign currency | | | (0.42 | ) | | | 2.92 | | | | 7.07 | | | | 3.46 | | | | (0.61 | ) |
Total from investment operations | | | $(0.21 | ) | | | $3.18 | | | | $7.31 | | | | $3.71 | | | | $(0.44 | ) |
| Less distributions declared to shareholders | | | | | | | | | | | | | | | | | | | | |
From net investment income | | | $(0.28 | ) | | | $(0.30 | ) | | | $(0.29 | ) | | | $(0.19 | ) | | | $(0.19 | ) |
From net realized gain on investments | | | (3.34 | ) | | | (2.42 | ) | | | — | | | | — | | | | — | |
Total distributions declared to shareholders | | | $(3.62 | ) | | | $(2.72 | ) | | | $(0.29 | ) | | | $(0.19 | ) | | | $(0.19 | ) |
Net asset value, end of period (x) | | | $26.58 | | | | $30.41 | | | | $29.95 | | | | $22.93 | | | | $19.41 | |
Total return (%) (k)(r)(s)(x) | | | 0.22 | | | | 11.01 | | | | 32.05 | | | | 19.18 | | | | (2.18 | ) |
Ratios (%) (to average net assets)
and Supplemental data: | | | | | | | | | | | | | | | | | | | | |
Expenses before expense reductions (f) | | | 0.82 | | | | 0.81 | | | | 0.81 | | | | 0.82 | | | | 0.82 | |
Expenses after expense reductions (f) | | | 0.81 | | | | 0.81 | | | | 0.81 | | | | 0.82 | | | | 0.82 | |
Net investment income | | | 0.73 | | | | 0.87 | | | | 0.93 | | | | 1.15 | | | | 0.84 | |
Portfolio turnover | | | 17 | | | | 25 | | | | 19 | | | | 28 | | | | 22 | |
Net assets at end of period (000 omitted) | | | $293,203 | | | | $356,389 | | | | $405,682 | | | | $455,295 | | | | $486,500 | |
See Notes to Financial Statements
12
MFS Investors Trust Series
Financial Highlights – continued
| | | | | | | | | | | | | | | | | | | | |
| Service Class | | Years ended 12/31 | |
| | | 2015 | | | 2014 | | | 2013 | | | 2012 | | | 2011 | |
Net asset value, beginning of period | | | $30.13 | | | | $29.72 | | | | $22.78 | | | | $19.31 | | | | $19.95 | |
| Income (loss) from investment operations | | | | | | | | | | | | | | | | | | | | |
Net investment income (d) | | | $0.14 | | | | $0.19 | | | | $0.18 | | | | $0.20 | | | | $0.12 | |
Net realized and unrealized gain (loss) on investments
and foreign currency | | | (0.42 | ) | | | 2.88 | | | | 7.02 | | | | 3.43 | | | | (0.61 | ) |
Total from investment operations | | | $(0.28 | ) | | | $3.07 | | | | $7.20 | | | | $3.63 | | | | $(0.49 | ) |
| Less distributions declared to shareholders | | | | | | | | | | | | | | | | | | | | |
From net investment income | | | $(0.21 | ) | | | $(0.24 | ) | | | $(0.26 | ) | | | $(0.16 | ) | | | $(0.15 | ) |
From net realized gain on investments | | | (3.34 | ) | | | (2.42 | ) | | | — | | | | — | | | | — | |
Total distributions declared to shareholders | | | $(3.55 | ) | | | $(2.66 | ) | | | $(0.26 | ) | | | $(0.16 | ) | | | $(0.15 | ) |
Net asset value, end of period (x) | | | $26.30 | | | | $30.13 | | | | $29.72 | | | | $22.78 | | | | $19.31 | |
Total return (%) (k)(r)(s)(x) | | | (0.05 | ) | | | 10.71 | | | | 31.74 | | | | 18.83 | | | | (2.42 | ) |
Ratios (%) (to average net assets)
and Supplemental data: | | | | | | | | | | | | | | | | | | | | |
Expenses before expense reductions (f) | | | 1.07 | | | | 1.06 | | | | 1.06 | | | | 1.07 | | | | 1.07 | |
Expenses after expense reductions (f) | | | 1.06 | | | | 1.06 | | | | 1.06 | | | | 1.07 | | | | 1.07 | |
Net investment income | | | 0.47 | | | | 0.63 | | | | 0.67 | | | | 0.93 | | | | 0.60 | |
Portfolio turnover | | | 17 | | | | 25 | | | | 19 | | | | 28 | | | | 22 | |
Net assets at end of period (000 omitted) | | | $193,116 | | | | $283,328 | | | | $234,723 | | | | $141,806 | | | | $78,392 | |
| (d) | Per share data is based on average shares outstanding. |
| (f) | Ratios do not reflect reductions from fees paid indirectly, if applicable. |
| (k) | The total return does not reflect expenses that apply to separate accounts. Inclusion of these charges would reduce the total return figures for all periods shown. |
| (r) | Certain expenses have been reduced without which performance would have been lower. |
| (s) | From time to time the fund may receive proceeds from litigation settlements, without which performance would be lower. |
| (x) | The net asset values and total returns have been calculated on net assets which include adjustments made in accordance with U.S. generally accepted accounting principles required at period end for financial reporting purposes. |
See Notes to Financial Statements
13
MFS Investors Trust Series
NOTES TO FINANCIAL STATEMENTS
| (1) | | Business and Organization |
MFS Investors Trust Series (the fund) is a diversified series of MFS Variable Insurance Trust (the trust). The trust is organized as a Massachusetts business trust and is registered under the Investment Company Act of 1940, as amended, as an open-end management investment company. The shareholders of each series of the trust are separate accounts of insurance companies, which offer variable annuity and/or life insurance products, and qualified retirement and pension plans.
The fund is an investment company and accordingly follows the investment company accounting and reporting guidance of the Financial Accounting Standards Board (FASB) Accounting Standards Codification Topic 946 Financial Services – Investment Companies.
| (2) | | Significant Accounting Policies |
General – The preparation of financial statements in conformity with U.S. generally accepted accounting principles requires management to make estimates and assumptions that affect the reported amounts of assets and liabilities, and disclosure of contingent assets and liabilities at the date of the financial statements and the reported amounts of increases and decreases in net assets from operations during the reporting period. Actual results could differ from those estimates. In the preparation of these financial statements, management has evaluated subsequent events occurring after the date of the fund’s Statement of Assets and Liabilities through the date that the financial statements were issued.
In January 2016, FASB issued Accounting Standards Update 2016-01, Financial Instruments – Overall (Subtopic 825-10) – Recognition and Measurement of Financial Assets and Financial Liabilities (“ASU 2016-01”) which would first be effective for annual reporting periods beginning after December 15, 2017, and interim periods therein. ASU 2016-01, which changes the accounting for equity investments and for certain financial liabilities, also modifies the presentation and disclosure requirements for financial instruments. Investment companies are specifically exempted from ASU 2016-01’s equity investment accounting provisions and will continue to follow the industry specific guidance for investment accounting under ASC 946. Although still evaluating the potential impacts of ASU 2016-01 to the fund, management expects that the impact of the fund’s adoption will be limited to additional financial statement disclosures.
Balance Sheet Offsetting – The fund’s accounting policy with respect to balance sheet offsetting is that, absent an event of default by the counterparty or a termination of the agreement, the International Swaps and Derivatives Association (ISDA) Master Agreement does not result in an offset of reported amounts of financial assets and financial liabilities in the Statement of Assets and Liabilities across transactions between the fund and the applicable counterparty. The fund’s right to setoff may be restricted or prohibited by the bankruptcy or insolvency laws of the particular jurisdiction to which a specific master netting agreement counterparty is subject. Balance sheet offsetting disclosures, to the extent applicable to the fund, have been included in the fund’s Significant Accounting Policies note under the captions for each of the fund’s in-scope financial instruments and transactions.
Investment Valuations – Equity securities, including restricted equity securities, are generally valued at the last sale or official closing price on their primary market or exchange as provided by a third-party pricing service. Equity securities, for which there were no sales reported that day, are generally valued at the last quoted daily bid quotation on their primary market or exchange as provided by a third-party pricing service. Short-term instruments with a maturity at issuance of 60 days or less may be valued at amortized cost, which approximates market value. Open-end investment companies are generally valued at net asset value per share. Securities and other assets generally valued on the basis of information from a third-party pricing service may also be valued at a broker/dealer bid quotation. Values obtained from third-party pricing services can utilize both transaction data and market information such as yield, quality, coupon rate, maturity, type of issue, trading characteristics, and other market data. The values of foreign securities and other assets and liabilities expressed in foreign currencies are converted to U.S. dollars using the mean of bid and asked prices for rates provided by a third-party pricing service.
The Board of Trustees has delegated primary responsibility for determining or causing to be determined the value of the fund’s investments (including any fair valuation) to the adviser pursuant to valuation policies and procedures approved by the Board. If the adviser determines that reliable market quotations are not readily available, investments are valued at fair value as determined in good faith by the adviser in accordance with such procedures under the oversight of the Board of Trustees. Under the fund’s valuation policies and procedures, market quotations are not considered to be readily available for most types of debt instruments and floating rate loans and many types of derivatives. These investments are generally valued at fair value based on information from third-party pricing services. In addition, investments may be valued at fair value if the adviser determines that an investment’s value has been materially affected by events occurring after the close of the exchange or market on which the investment is principally traded (such as foreign exchange or market) and prior to the determination of the fund’s net asset value, or after the halting of trading of a specific security where trading does not resume prior to the close of the exchange or market on which the security is principally traded. Events that occur on a frequent basis after foreign markets close (such as developments in foreign markets and significant movements in the U.S. markets) and prior to the determination of the fund’s net asset value may be deemed to have a material effect on the value of securities traded in foreign markets. Accordingly, the fund’s foreign equity securities may often be valued at fair value. The adviser generally relies on third-party pricing services or other information (such as the correlation with price
14
MFS Investors Trust Series
Notes to Financial Statements – continued
movements of similar securities in the same or other markets; the type, cost and investment characteristics of the security; the business and financial condition of the issuer; and trading and other market data) to assist in determining whether to fair value and at what value to fair value an investment. The value of an investment for purposes of calculating the fund’s net asset value can differ depending on the source and method used to determine value. When fair valuation is used, the value of an investment used to determine the fund’s net asset value may differ from quoted or published prices for the same investment. There can be no assurance that the fund could obtain the fair value assigned to an investment if it were to sell the investment at the same time at which the fund determines its net asset value per share.
Various inputs are used in determining the value of the fund’s assets or liabilities. These inputs are categorized into three broad levels. In certain cases, the inputs used to measure fair value may fall into different levels of the fair value hierarchy. In such cases, an investment’s level within the fair value hierarchy is based on the lowest level of input that is significant to the fair value measurement. The fund’s assessment of the significance of a particular input to the fair value measurement in its entirety requires judgment, and considers factors specific to the investment. Level 1 includes unadjusted quoted prices in active markets for identical assets or liabilities. Level 2 includes other significant observable market-based inputs (including quoted prices for similar securities, interest rates, prepayment speed, and credit risk). Level 3 includes unobservable inputs, which may include the adviser’s own assumptions in determining the fair value of investments. The following is a summary of the levels used as of December 31, 2015 in valuing the fund’s assets or liabilities:
| | | | | | | | | | | | | | | | |
| Investments at Value | | Level 1 | | | Level 2 | | | Level 3 | | | Total | |
| Equity Securities: | | | | | | | | | | | | | | | | |
United States | | | $450,201,523 | | | | $— | | | | $— | | | | $450,201,523 | |
France | | | — | | | | 16,633,099 | | | | — | | | | 16,633,099 | |
Canada | | | 11,563,779 | | | | — | | | | — | | | | 11,563,779 | |
United Kingdom | | | — | | | | 3,392,449 | | | | — | | | | 3,392,449 | |
| Mutual Funds | | | 4,635,935 | | | | — | | | | — | | | | 4,635,935 | |
| Total Investments | | | $466,401,237 | | | | $20,025,548 | | | | $— | | | | $486,426,785 | |
For further information regarding security characteristics, see the Portfolio of Investments.
Foreign Currency Translation – Purchases and sales of foreign investments, income, and expenses are converted into U.S. dollars based upon currency exchange rates prevailing on the respective dates of such transactions or on the reporting date for foreign denominated receivables and payables. Gains and losses attributable to foreign currency exchange rates on sales of securities are recorded for financial statement purposes as net realized gains and losses on investments. Gains and losses attributable to foreign exchange rate movements on receivables, payables, income and expenses are recorded for financial statement purposes as foreign currency transaction gains and losses. That portion of both realized and unrealized gains and losses on investments that results from fluctuations in foreign currency exchange rates is not separately disclosed.
Security Loans – Under its Securities Lending Agency Agreement with the fund, State Street Bank and Trust Company (“State Street”), as lending agent, loans the securities of the fund to certain qualified institutions (the “Borrowers”) approved by the fund. Security loans can be terminated at the discretion of either the lending agent or the fund and the related securities must be returned within the earlier of the standard trade settlement period for such securities or within three business days. The loans are collateralized by cash and/or U.S. Treasury and federal agency obligations in an amount typically at least equal to the market value of the securities loaned. On loans collateralized by cash, the cash collateral is invested in a money market fund. The market value of the loaned securities is determined at the close of business of the fund and any additional required collateral is delivered to the fund on the next business day. State Street provides the fund with indemnification against Borrower default. In the event of Borrower default, State Street will, for the benefit of the fund, either purchase securities identical to those loaned or, when such purchase is commercially impracticable, pay the fund the market value of the loaned securities. In return, State Street assumes the fund’s rights to the related collateral. If the collateral value is less than the cost to purchase identical securities, State Street is responsible for the shortfall, but only to the extent that such shortfall is not due to a decline in collateral value resulting from collateral reinvestment for which the fund bears the risk of loss. A portion of the income generated upon investment of the collateral is remitted to the Borrowers, and the remainder is allocated between the fund and the lending agent. On loans collateralized by U.S. Treasury and/or federal agency obligations, a fee is received from the Borrower, and is allocated between the fund and the lending agent. Income from securities lending is included in “Interest” income, in the Statement of Operations. The dividend and interest income earned on the securities loaned is accounted for in the same manner as other dividend and interest income. At December 31, 2015, there were no securities on loan or collateral outstanding.
Indemnifications – Under the fund’s organizational documents, its officers and Trustees may be indemnified against certain liabilities and expenses arising out of the performance of their duties to the fund. Additionally, in the normal course of business, the fund enters into agreements with service providers that may contain indemnification clauses. The fund’s maximum exposure under these agreements is unknown as this would involve future claims that may be made against the fund that have not yet occurred.
15
MFS Investors Trust Series
Notes to Financial Statements – continued
Investment Transactions and Income – Investment transactions are recorded on the trade date. Interest income is recorded on the accrual basis. Dividends received in cash are recorded on the ex-dividend date. Certain dividends from foreign securities will be recorded when the fund is informed of the dividend if such information is obtained subsequent to the ex-dividend date. Dividend payments received in additional securities are recorded on the ex-dividend date in an amount equal to the value of the security on such date.
The fund may receive proceeds from litigation settlements. Any proceeds received from litigation involving portfolio holdings are reflected in the Statement of Operations in realized gain/loss if the security has been disposed of by the fund or in unrealized gain/loss if the security is still held by the fund. Any other proceeds from litigation not related to portfolio holdings are reflected as other income in the Statement of Operations.
Fees Paid Indirectly – Prior to October 1, 2015, the fund’s custody fee could be reduced by a credit earned under an arrangement that measured the value of U.S. dollars deposited with the custodian by the fund. For the year ended December 31, 2015, custody fees were not reduced.
Tax Matters and Distributions – The fund intends to qualify as a regulated investment company, as defined under Subchapter M of the Internal Revenue Code, and to distribute all of its taxable income, including realized capital gains. As a result, no provision for federal income tax is required. The fund’s federal tax returns, when filed, will remain subject to examination by the Internal Revenue Service for a three year period. Management has analyzed the fund’s tax positions taken on federal and state tax returns for all open tax years and does not believe that there are any uncertain tax positions that require recognition of a tax liability. Foreign taxes, if any, have been accrued by the fund in the accompanying financial statements in accordance with the applicable foreign tax law. Foreign income taxes may be withheld by certain countries in which the fund invests. Additionally, capital gains realized by the fund on securities issued in or by certain foreign countries may be subject to capital gains tax imposed by those countries.
Distributions to shareholders are recorded on the ex-dividend date. Income and capital gain distributions are determined in accordance with income tax regulations, which may differ from U.S. generally accepted accounting principles. Certain capital accounts in the financial statements are periodically adjusted for permanent differences in order to reflect their tax character. These adjustments have no impact on net assets or net asset value per share. Temporary differences which arise from recognizing certain items of income, expense, gain or loss in different periods for financial statement and tax purposes will reverse at some time in the future. Distributions in excess of net investment income or net realized gains are temporary overdistributions for financial statement purposes resulting from differences in the recognition or classification of income or distributions for financial statement and tax purposes.
Book/tax differences primarily relate to wash sale loss deferrals.
The tax character of distributions declared to shareholders for the last two fiscal years is as follows:
| | | | | | | | |
| | | 12/31/15 | | | 12/31/14 | |
| Ordinary income (including any short-term capital gains) | | | $10,112,585 | | | | $10,197,233 | |
| Long-term capital gains | | | 57,578,462 | | | | 43,056,721 | |
| Total distributions | | | $67,691,047 | | | | $53,253,954 | |
The federal tax cost and the tax basis components of distributable earnings were as follows:
| | | | |
| As of 12/31/15 | | | | |
| Cost of investments | | | $332,766,337 | |
| Gross appreciation | | | 161,063,399 | |
| Gross depreciation | | | (7,402,951 | ) |
| Net unrealized appreciation (depreciation) | | | $153,660,448 | |
| Undistributed ordinary income | | | 4,860,138 | |
| Undistributed long-term capital gain | | | 51,670,834 | |
Multiple Classes of Shares of Beneficial Interest – The fund offers multiple classes of shares, which differ in their respective distribution and/or service fees. The fund’s income, realized and unrealized gain (loss), and common expenses are allocated to shareholders based on the daily net assets of each class. Dividends are declared separately for each class. Differences in per share dividend rates are generally due to differences in separate class expenses. The fund’s distributions declared to shareholders as reported in the Statements of Changes in Net Assets are presented by class as follows:
| | | | | | | | | | | | | | | | |
| | | From net investment
income | | | From net realized gain on
investments | |
| | | Year ended
12/31/15 | | | Year ended
12/31/14 | | | Year ended
12/31/15 | | | Year ended
12/31/14 | |
| Initial Class | | | $2,881,791 | | | | $3,396,452 | | | | $33,890,351 | | | | $27,760,205 | |
| Service Class | | | 1,849,048 | | | | 1,980,306 | | | | 29,069,857 | | | | 20,116,991 | |
| Total | | | $4,730,839 | | | | $5,376,758 | | | | $62,960,208 | | | | $47,877,196 | |
16
MFS Investors Trust Series
Notes to Financial Statements – continued
| (3) | | Transactions with Affiliates |
Investment Adviser – The fund has an investment advisory agreement with MFS to provide overall investment management and related administrative services and facilities to the fund. The management fee is computed daily and paid monthly at the following annual rates:
| | | | |
| First $1 billion of average daily net assets | | | 0.75% | |
| Average daily net assets in excess of $1 billion | | | 0.65% | |
The investment adviser has agreed in writing to reduce its management fee to 0.60% of the average daily net assets in excess of $2.5 billion. This written agreement will continue until modified by the fund’s Board of Trustees, but such agreement will continue at least until April 30, 2017. For the year ended December 31, 2015, the fund’s average daily net assets did not exceed $2.5 billion and therefore, the management fee was not reduced in accordance with this agreement. MFS has also agreed in writing to reduce its management fee by a specified amount if certain MFS mutual fund assets exceed thresholds agreed to by MFS and the fund’s Board of Trustees. For the year ended December 31, 2015, this management fee reduction amounted to $39,729 which is included in the reduction of total expenses in the Statement of Operations. The management fee incurred for the year ended December 31, 2015 was equivalent to an annual effective rate of 0.74% of the fund’s average daily net assets.
Distributor – MFS Fund Distributors, Inc. (MFD), a wholly-owned subsidiary of MFS, is the distributor of shares of the fund. The Trustees have adopted a distribution plan for the Service Class shares pursuant to Rule 12b-1 under the Investment Company Act of 1940.
The fund’s distribution plan provides that the fund will pay MFD distribution and/or service fees equal to 0.25% per annum of its average daily net assets attributable to Service Class shares as partial consideration for services performed and expenses incurred by MFD and financial intermediaries (including participating insurance companies that invest in the fund to fund variable annuity and variable life insurance contracts, sponsors of qualified retirement and pension plans that invest in the fund, and affiliates of these participating insurance companies and plan sponsors) in connection with the sale and distribution of the Service Class shares. MFD may subsequently pay all, or a portion, of the distribution and/or service fees to financial intermediaries.
Shareholder Servicing Agent – MFS Service Center, Inc. (MFSC), a wholly-owned subsidiary of MFS, receives a fee from the fund for its services as shareholder servicing agent. For the year ended December 31, 2015, the fee was $44,343, which equated to 0.0077% annually of the fund’s average daily net assets. MFSC also receives payment from the fund for out-of-pocket expenses paid by MFSC on behalf of the fund. For the year ended December 31, 2015, these costs amounted to $1,518.
Administrator – MFS provides certain financial, legal, shareholder communications, compliance, and other administrative services to the fund. Under an administrative services agreement, the fund reimburses MFS the costs incurred to provide these services. The fund is charged an annual fixed amount of $17,500 plus a fee based on average daily net assets. The administrative services fee incurred for the year ended December 31, 2015 was equivalent to an annual effective rate of 0.0173% of the fund’s average daily net assets.
Trustees’ and Officers’ Compensation – The fund pays compensation to independent Trustees in the form of a retainer, attendance fees, and additional compensation to Board and Committee chairpersons. The fund does not pay compensation directly to Trustees or officers of the fund who are also officers of the investment adviser, all of whom receive remuneration for their services to the fund from MFS. Certain officers and Trustees of the fund are officers or directors of MFS, MFD, and MFSC.
Other – This fund and certain other funds managed by MFS (the funds) have entered into a service agreement (the ISO Agreement) which provides for payment of fees solely by the funds to Tarantino LLC in return for the provision of services of an Independent Senior Officer (ISO) for the funds. Frank L. Tarantino serves as the ISO and is an officer of the funds and the sole member of Tarantino LLC. The funds can terminate the ISO Agreement with Tarantino LLC at any time under the terms of the ISO Agreement. For the year ended December 31, 2015, the fee paid by the fund under this agreement was $1,826 and is included in “Miscellaneous” expense in the Statement of Operations. MFS has agreed to bear all expenses associated with office space, other administrative support, and supplies provided to the ISO.
The fund invests in the MFS Institutional Money Market Portfolio which is managed by MFS and seeks current income consistent with preservation of capital and liquidity. Income earned on this investment is included in “Dividends from underlying affiliated funds” in the Statement of Operations. This money market fund does not pay a management fee to MFS.
For the year ended December 31, 2015, purchases and sales of investments, other than short-term obligations, aggregated $93,826,080 and $234,347,547, respectively.
17
MFS Investors Trust Series
Notes to Financial Statements – continued
| (5) | | Shares of Beneficial Interest |
The fund’s Declaration of Trust permits the Trustees to issue an unlimited number of full and fractional shares of beneficial interest. Transactions in fund shares were as follows:
| | | | | | | | | | | | | | | | |
| | | Year ended 12/31/15 | | | Year ended 12/31/14 | |
| | | Shares | | | Amount | | | Shares | | | Amount | |
| Shares sold | | | | | | | | | | | | | | | | |
Initial Class | | | 299,869 | | | | $8,738,742 | | | | 216,623 | | | | $6,487,891 | |
Service Class | | | 1,948,065 | | | | 56,638,016 | | | | 3,399,102 | | | | 100,586,085 | |
| | | 2,247,934 | | | | $65,376,758 | | | | 3,615,725 | | | | $107,073,976 | |
| Shares issued to shareholders in reinvestment of distributions | | | | | | | | | | | | | | | | |
Initial Class | | | 1,486,344 | | | | $36,772,142 | | | | 1,070,308 | | | | $31,156,657 | |
Service Class | | | 1,261,996 | | | | 30,918,905 | | | | 765,407 | | | | 22,097,297 | |
| | | 2,748,340 | | | | $67,691,047 | | | | 1,835,715 | | | | $53,253,954 | |
| Shares reacquired | | | | | | | | | | | | | | | | |
Initial Class | | | (2,471,922 | ) | | | $(73,166,193 | ) | | | (3,114,178 | ) | | | $(93,629,876 | ) |
Service Class | | | (5,269,524 | ) | | | (144,072,223 | ) | | | (2,661,329 | ) | | | (75,318,697 | ) |
| | | (7,741,446 | ) | | | $(217,238,416 | ) | | | (5,775,507 | ) | | | $(168,948,573 | ) |
| Net change | | | | | | | | | | | | | | | | |
Initial Class | | | (685,709 | ) | | | $(27,655,309 | ) | | | (1,827,247 | ) | | | $(55,985,328 | ) |
Service Class | | | (2,059,463 | ) | | | (56,515,302 | ) | | | 1,503,180 | | | | 47,364,685 | |
| | | (2,745,172 | ) | | | $(84,170,611 | ) | | | (324,067 | ) | | | $(8,620,643 | ) |
The fund and certain other funds managed by MFS participate in a $1.25 billion unsecured committed line of credit, subject to a $1 billion sublimit, provided by a syndication of banks under a credit agreement. Borrowings may be made for temporary financing needs. Interest is charged to each fund, based on its borrowings, generally at a rate equal to the higher of the Overnight Federal Reserve funds rate or daily one month LIBOR plus an agreed upon spread. A commitment fee, based on the average daily, unused portion of the committed line of credit, is allocated among the participating funds at the end of each calendar quarter. In addition, the fund and other funds managed by MFS have established unsecured uncommitted borrowing arrangements with certain banks for temporary financing needs. Interest is charged to each fund, based on its borrowings, at a rate equal to the Overnight Federal Reserve funds rate plus an agreed upon spread. For the year ended December 31, 2015, the fund’s commitment fee and interest expense were $1,976 and $0, respectively, and are included in “Miscellaneous” expense in the Statement of Operations.
| (7) | | Transactions in Underlying Affiliated Funds – Affiliated Issuers |
An affiliated issuer may be considered one in which the fund owns 5% or more of the outstanding voting securities, or a company which is under common control. For the purposes of this report, the fund assumes the following to be an affiliated issuer:
| | | | | | | | | | | | | | | | |
| Underlying Affiliated Fund | | Beginning Shares/Par Amount | | | Acquisitions Shares/Par Amount | | | Dispositions Shares/Par Amount | | | Ending Shares/Par Amount | |
| MFS Institutional Money Market Portfolio | | | 9,693,997 | | | | 69,667,780 | | | | (74,725,842 | ) | | | 4,635,935 | |
| | | | |
| Underlying Affiliated Fund | | Realized
Gain (Loss) | | | Capital Gain Distributions | | | Dividend Income | | | Ending Value | |
| MFS Institutional Money Market Portfolio | | | $— | | | | $— | | | | $5,083 | | | | $4,635,935 | |
18
MFS Investors Trust Series
REPORT OF INDEPENDENT REGISTERED PUBLIC ACCOUNTING FIRM
To the Board of Trustees of MFS Variable Insurance Trust and the Shareholders of MFS Investors Trust Series:
We have audited the accompanying statement of assets and liabilities, including the portfolio of investments, of MFS Investors Trust Series (one of the series of MFS Variable Insurance Trust) (the “Fund”) as of December 31, 2015, and the related statement of operations for the year then ended, the statements of changes in net assets for each of the two years in the period then ended, and the financial highlights for each of the five years in the period then ended. These financial statements and financial highlights are the responsibility of the Fund’s management. Our responsibility is to express an opinion on these financial statements and financial highlights based on our audits.
We conducted our audits in accordance with the standards of the Public Company Accounting Oversight Board (United States). Those standards require that we plan and perform the audit to obtain reasonable assurance about whether the financial statements and financial highlights are free of material misstatement. The Fund is not required to have, nor were we engaged to perform, an audit of its internal control over financial reporting. Our audits included consideration of internal control over financial reporting as a basis for designing audit procedures that are appropriate in the circumstances, but not for the purpose of expressing an opinion on the effectiveness of the Fund’s internal control over financial reporting. Accordingly, we express no such opinion. An audit also includes examining, on a test basis, evidence supporting the amounts and disclosures in the financial statements, assessing the accounting principles used and significant estimates made by management, as well as evaluating the overall financial statement presentation. Our procedures included confirmation of securities owned as of December 31, 2015, by correspondence with the custodian. We believe that our audits provide a reasonable basis for our opinion.
In our opinion, such financial statements and financial highlights referred to above present fairly, in all material respects, the financial position of MFS Investors Trust Series as of December 31, 2015, the results of its operations for the year then ended, the changes in its net assets for each of the two years in the period then ended, and the financial highlights for each of the five years in the period then ended, in conformity with accounting principles generally accepted in the United States of America.
DELOITTE & TOUCHE LLP
Boston, Massachusetts
February 16, 2016
19
MFS Investors Trust Series
TRUSTEES AND OFFICERS – IDENTIFICATION AND BACKGROUND
The Trustees and Officers of the Trust, as of February 1, 2016, are listed below, together with their principal occupations during the past five years. (Their titles may have varied during that period.) The address of each Trustee and Officer is 111 Huntington Avenue, Boston, Massachusetts 02199-7618.
| | | | | | | | |
Name, Age | | Position(s)
Held with Fund | | Trustee/Officer
Since (h) | | Principal Occupations
During the Past Five Years | | Other Directorships (j) |
| INTERESTED TRUSTEES |
Robert J. Manning (k)
(age 52) | | Trustee | | February 2004 | | Massachusetts Financial Services Company, Chairman, Co-Chief Executive Officer and Director | | N/A |
| | | | |
Robin A. Stelmach (k) (age 54) | | Trustee and President | | January 2014 | | Massachusetts Financial Services Company, Executive Vice President and Chief Operating Officer | | N/A |
| | |
| INDEPENDENT TRUSTEES | | | | |
David H. Gunning
(age 73) | | Trustee and Chair of Trustees | | January 2004 | | Private investor | | Lincoln Electric Holdings, Inc., Director; Development Alternatives, Inc., Director/Non-Executive Chairman |
| | | | |
Steven E. Buller (age 64) | | Trustee | | February 2014 | | Chairman, Financial Accounting Standards Advisory Council; Standing Advisory Group, Public Company Accounting Oversight Board, Member (until 2014); BlackRock, Inc. (investment management), Managing Director (until 2014), BlackRock Finco UK (investment management), Director (until 2014) | | N/A |
| | | | |
Robert E. Butler
(age 74) | | Trustee | | January 2006 | | Consultant – investment company industry regulatory and compliance matters | | N/A |
| | | | |
Maureen R. Goldfarb (age 60) | | Trustee | | January 2009 | | Private investor | | N/A |
| | | | |
William R. Gutow
(age 74) | | Trustee | | December 1993 | | Private investor and real estate consultant; Capitol Entertainment Management Company (video franchise), Vice Chairman | | Texas Donuts, Vice Chairman (until 2010) |
| | | | |
Michael Hegarty
(age 71) | | Trustee | | December 2004 | | Private investor | | Rouse Properties Inc., Director; Capmark Financial Group Inc., Director |
| | | | |
John P. Kavanaugh (age 61) | | Trustee | | January 2009 | | Private investor | | N/A |
| | | | |
Maryanne L. Roepke (age 59) | | Trustee | | May 2014 | | American Century Investments (investment management), Senior Vice President and Chief Compliance Officer (until 2014) | | N/A |
| | | | |
Laurie J. Thomsen
(age 58) | | Trustee | | March 2005 | | Private investor | | The Travelers Companies, Director; Dycom Industries, Inc., Director |
| | | | |
Robert W. Uek
(age 74) | | Trustee | | January 2006 | | Consultant to investment company industry | | N/A |
| | | | |
| OFFICERS | | | | | | | | |
Christopher R. Bohane (k)
(age 42) | | Assistant Secretary and Assistant Clerk | | July 2005 | | Massachusetts Financial Services Company, Vice President and Assistant General Counsel | | N/A |
| | | | |
Kino Clark (k) (age 47) | | Assistant Treasurer | | January 2012 | | Massachusetts Financial Services Company, Vice President | | N/A |
| | | | |
Kristin V. Collins (k) (age 42) | | Assistant Secretary and Assistant Clerk | | September 2015 | | Massachusetts Financial Services Company, Vice President and Assistant General Counsel | | N/A |
| | | | |
Thomas H. Connors (k) (age 56) | | Assistant Secretary and Assistant Clerk | | September 2012 | | Massachusetts Financial Services Company, Vice President and Senior Counsel; Deutsche Investment Management Americas Inc. (financial service provider), Director and Senior Counsel (until 2012) | | N/A |
20
MFS Investors Trust Series
Trustees and Officers – continued
| | | | | | | | |
Name, Age | | Position(s)
Held with Fund | | Trustee/Officer
Since (h) | | Principal Occupations
During the Past Five Years | | Other Directorships (j) |
Ethan D. Corey (k)
(age 52) | | Assistant Secretary and Assistant Clerk | | July 2005 | | Massachusetts Financial Services Company, Senior Vice President and Associate General Counsel | | N/A |
| | | | |
David L. DiLorenzo (k)
(age 47) | | Treasurer | | July 2005 | | Massachusetts Financial Services Company, Senior Vice President | | N/A |
| | | | |
Brian E. Langenfeld (k) (age 42) | | Assistant Secretary and Assistant Clerk | | June 2006 | | Massachusetts Financial Services Company, Vice President and Senior Counsel | | N/A |
| | | | |
Kenneth Paek (k) (age 41) | | Assistant Treasurer | | February 2015 | | Massachusetts Financial Services Company, Vice President; Cohen & Steers, Vice President/Head of Fund Administration (until 2014) | | N/A |
| | | | |
Susan A. Pereira (k)
(age 45) | | Assistant Secretary and Assistant Clerk | | July 2005 | | Massachusetts Financial Services Company, Vice President and Senior Counsel | | N/A |
| | | | |
Kasey L. Phillips (k) (age 45) | | Assistant Treasurer | | September 2012 | | Massachusetts Financial Services Company, Vice President; Wells Fargo Funds Management, LLC, Senior Vice President, Fund Treasurer (until 2012) | | N/A |
| | | | |
Mark N. Polebaum (k)
(age 63) | | Secretary and Clerk | | January 2006 | | Massachusetts Financial Services Company, Executive Vice President, General Counsel and Secretary | | N/A |
| | | | |
Matthew A. Stowe (k) (age 41) | | Assistant Secretary and Assistant Clerk | | October 2014 | | Massachusetts Financial Services Company, Vice President and Assistant General Counsel | | N/A |
| | | | |
Frank L. Tarantino
(age 71) | | Independent Senior Officer | | June 2004 | | Tarantino LLC (provider of compliance services), Principal | | N/A |
| | | | |
Richard S. Weitzel (k)
(age 45) | | Assistant Secretary and Assistant Clerk | | October 2007 | | Massachusetts Financial Services Company, Senior Vice President and Associate General Counsel | | N/A |
| | | | |
Martin J. Wolin (k) (age 48) | | Chief Compliance Officer | | July 2015 | | Massachusetts Financial Services Company, Senior Vice President and Chief Compliance Officer (since July 2015); Mercer (financial service provider), Chief Risk and Compliance Officer, North America and Latin America (until June 2015) | | N/A |
| | | | |
James O. Yost (k)
(age 55) | | Deputy Treasurer | | September 1990 | | Massachusetts Financial Services Company, Senior Vice President | | N/A |
| (h) | Date first appointed to serve as Trustee/officer of an MFS Fund. Each Trustee has served continuously since appointment unless indicated otherwise. For the period from December 15, 2004 until February 22, 2005, Mr. Manning served as Advisory Trustee. Prior to January 2012, Messrs. DiLorenzo and Yost served as Assistant Treasurers of the Funds. Ms. Stelmach was appointed as President of the Funds as of October 1, 2014. |
| (j) | Directorships or trusteeships of companies required to report to the Securities and Exchange Commission (i.e., “public companies”). |
| (k) | “Interested person” of the Trust within the meaning of the Investment Company Act of 1940 (referred to as the 1940 Act), which is the principal federal law governing investment companies like the fund, as a result of a position with MFS. The address of MFS is 111 Huntington Avenue, Boston, Massachusetts 02199-7618. |
Each Trustee (except Ms. Stelmach, Mr. Buller and Ms. Roepke) has been elected by shareholders and each Trustee and officer holds office until his or her successor is chosen and qualified or until his or her earlier death, resignation, retirement or removal. The Trust does not hold annual meetings for the purpose of electing Trustees, and Trustees are not elected for fixed terms. Messrs. Buller, Butler, Kavanaugh, Uek and Ms. Roepke are members of the Trust’s Audit Committee.
Each of the Fund’s Trustees and officers holds comparable positions with certain other funds of which MFS or a subsidiary is the investment adviser or distributor, and, in the case of the officers, with certain affiliates of MFS. As of February 1, 2016, the Trustees served as board members of 137 funds within the MFS Family of Funds.
21
MFS Investors Trust Series
Trustees and Officers – continued
The Statement of Additional Information for a Fund includes further information about the Trustees and is available without charge upon request by calling 1-800-225-2606.
| | |
Investment Adviser Massachusetts Financial Services Company 111 Huntington Avenue Boston, MA 02199-7618 | | Custodian State Street Bank and Trust Company 1 Lincoln Street Boston, MA 02111-2900 |
Distributor MFS Fund Distributors, Inc. 111 Huntington Avenue Boston, MA 02199-7618 | | Independent Registered Public Accounting Firm Deloitte & Touche LLP 200 Berkeley Street Boston, MA 02116 |
Portfolio Managers T. Kevin Beatty Ted Maloney | | |
22
MFS Investors Trust Series
BOARD REVIEW OF INVESTMENT ADVISORY AGREEMENT
The Investment Company Act of 1940 requires that both the full Board of Trustees and a majority of the non-interested (“independent”) Trustees, voting separately, annually approve the continuation of the Fund’s investment advisory agreement with MFS. The Trustees consider matters bearing on the Fund and its advisory arrangements at their meetings throughout the year, including a review of performance data at each regular meeting. In addition, the independent Trustees met several times over the course of three months beginning in May and ending in July, 2015 (“contract review meetings”) for the specific purpose of considering whether to approve the continuation of the investment advisory agreement for the Fund and the other investment companies that the Board oversees (the “MFS Funds”). The independent Trustees were assisted in their evaluation of the Fund’s investment advisory agreement by independent legal counsel, from whom they received separate legal advice and with whom they met separately from MFS during various contract review meetings. The independent Trustees were also assisted in this process by the MFS Funds’ Independent Senior Officer, a senior officer appointed by and reporting to the independent Trustees.
In connection with their deliberations regarding the continuation of the investment advisory agreement, the Trustees, including the independent Trustees, considered such information and factors as they believed, in light of the legal advice furnished to them and their own business judgment, to be relevant. The investment advisory agreement for the Fund was considered separately, although the Trustees also took into account the common interests of all MFS Funds in their review. As described below, the Trustees considered the nature, quality, and extent of the various investment advisory, administrative, and shareholder services performed by MFS under the existing investment advisory agreement and other arrangements with the Fund.
In connection with their contract review meetings, the Trustees received and relied upon materials that included, among other items: (i) information provided by Lipper Inc., an independent third party, on the investment performance of the Fund for various time periods ended December 31, 2014 and the investment performance of a group of funds with substantially similar investment classifications/objectives (the “Lipper performance universe”), (ii) information provided by Lipper Inc. on the Fund’s advisory fees and other expenses and the advisory fees and other expenses of comparable funds identified by Lipper Inc. (the “Lipper expense group”), (iii) information provided by MFS on the advisory fees of comparable portfolios of other clients of MFS, including institutional separate accounts and other clients, (iv) information as to whether and to what extent applicable expense waivers, reimbursements or fee “breakpoints” are observed for the Fund, (v) information regarding MFS’ financial results and financial condition, including MFS’ and certain of its affiliates’ estimated profitability from services performed for the Fund and the MFS Funds as a whole, and compared to MFS’ institutional business, (vi) MFS’ views regarding the outlook for the mutual fund industry and the strategic business plans of MFS, (vii) descriptions of various functions performed by MFS for the Funds, such as compliance monitoring and portfolio trading practices, and (viii) information regarding the overall organization of MFS, including information about MFS’ senior management and other personnel providing investment advisory, administrative and other services to the Fund and the other MFS Funds. The comparative performance, fee and expense information prepared and provided by Lipper Inc. was not independently verified and the independent Trustees did not independently verify any information provided to them by MFS.
The Trustees’ conclusion as to the continuation of the investment advisory agreement was based on a comprehensive consideration of all information provided to the Trustees and not the result of any single factor. Some of the factors that figured particularly in the Trustees’ deliberations are described below, although individual Trustees may have evaluated the information presented differently from one another, giving different weights to various factors. It is also important to recognize that the fee arrangements for the Fund and other MFS Funds are the result of years of review and discussion between the independent Trustees and MFS, that certain aspects of such arrangements may receive greater scrutiny in some years than in others, and that the Trustees’ conclusions may be based, in part, on their consideration of these same arrangements during the course of the year and in prior years.
Based on information provided by Lipper Inc. and MFS, the Trustees reviewed the Fund’s total return investment performance as well as the performance of peer groups of funds over various time periods. The Trustees placed particular emphasis on the total return performance of the Fund’s Initial Class shares in comparison to the performance of funds in its Lipper performance universe over the three-year period ended December 31, 2014, which the Trustees believed was a long enough period to reflect differing market conditions. The total return performance of the Fund’s Initial Class shares was in the 2nd quintile relative to the other funds in the universe for this three-year period (the 1st quintile being the best performers and the 5th quintile being the worst performers). The total return performance of the Fund’s Initial Class shares was in the 3rd quintile for each of the one- and five-year periods ended December 31, 2014 relative to the Lipper performance universe. Because of the passage of time, these performance results may differ from the performance results for more recent periods, including those shown elsewhere in this report.
In the course of their deliberations, the Trustees took into account information provided by MFS in connection with the contract review meetings, as well as during investment review meetings conducted with portfolio management personnel during the course of the year regarding the Fund’s performance. After reviewing these and related factors, the Trustees concluded, within the context of their overall conclusions regarding the investment advisory agreement, that they were satisfied with MFS’ responses and efforts relating to investment performance.
In assessing the reasonableness of the Fund’s advisory fee, the Trustees considered, among other information, the Fund’s advisory fee and the total expense ratio of the Fund’s Initial Class shares as a percentage of average daily net assets and the advisory fee and
23
MFS Investors Trust Series
Board Review of Investment Advisory Agreement – continued
total expense ratios of peer groups of funds based on information provided by Lipper Inc. The Trustees considered that, according to the Lipper data (which takes into account any fee reductions or expense limitations that were in effect during the Fund’s last fiscal year), the Fund’s effective advisory fee rate and total expense ratio were each higher than the Lipper expense group median.
The Trustees also considered the advisory fees charged by MFS to any institutional separate accounts advised by MFS (“separate accounts”) and unaffiliated investment companies for which MFS serves as subadviser (“subadvised funds”) that have comparable investment strategies to the Fund. In comparing these fees, the Trustees considered information provided by MFS as to the generally broader scope of services provided by MFS to the Fund, as well as the more extensive regulatory burdens imposed on MFS in managing the Fund, in comparison to separate accounts and subadvised funds. The Trustees also considered the higher demands placed on MFS’ investment personnel and trading infrastructure as a result of the daily cash in-flows and out-flows of the Fund in comparison to separate accounts.
The Trustees also considered whether the Fund may benefit from any economies of scale in the management of the Fund in the event of growth in assets of the Fund and/or growth in assets of the MFS Funds as a whole. They noted that the Fund’s advisory fee rate schedule is subject to a contractual breakpoint that reduces the Fund’s advisory fee rate on average daily net assets over $1 billion, and that MFS has agreed in writing to further reduce its advisory fee rate on the Fund’s average daily net assets over $2.5 billion, which may not be changed without the Trustees’ approval. The Trustees also noted that MFS has agreed in writing to waive a portion of the management fees of certain MFS Funds, including the Fund, if the total combined assets of certain funds within the MFS Funds’ complex increase above agreed upon thresholds (the “group fee waiver”), enabling the Fund’s shareholders to share in the benefits from any economies of scale at the complex level. The group fee waiver is reviewed and renewed annually between the Board and MFS. The Trustees concluded that the breakpoints and the group fee waiver were sufficient to allow the Fund to benefit from economies of scale as its assets and overall complex assets grow.
The Trustees also considered information prepared by MFS relating to MFS’ costs and profits with respect to the Fund, the MFS Funds considered as a group, and other investment companies and accounts advised by MFS, as well as MFS’ methodologies used to determine and allocate its costs to the MFS Funds, the Fund and other accounts and products for purposes of estimating profitability.
After reviewing these and other factors described herein, the Trustees concluded, within the context of their overall conclusions regarding the investment advisory agreement, that the advisory fees charged to the Fund represent reasonable compensation in light of the services being provided by MFS to the Fund.
In addition, the Trustees considered MFS’ resources and related efforts to continue to retain, attract and motivate capable personnel to serve the Fund. The Trustees also considered current and developing conditions in the financial services industry, including the presence of large and well-capitalized companies which are spending, and appear to be prepared to continue to spend, substantial sums to engage personnel and to provide services to competing investment companies. In this regard, the Trustees also considered the financial resources of MFS and its ultimate parent, Sun Life Financial Inc. The Trustees also considered the advantages and possible disadvantages to the Fund of having an adviser that also serves other investment companies as well as other accounts.
The Trustees also considered the nature, quality, cost, and extent of administrative, transfer agency, and distribution services provided to the Fund by MFS and its affiliates under agreements and plans other than the investment advisory agreement, including any 12b-1 fees the Fund pays to MFS Fund Distributors, Inc., an affiliate of MFS. The Trustees also considered the nature, extent and quality of certain other services MFS performs or arranges for on the Fund’s behalf, which may include securities lending programs, directed expense payment programs, class action recovery programs, and MFS’ interaction with third-party service providers, principally custodians and sub-custodians. The Trustees concluded that the various non-advisory services provided by MFS and its affiliates on behalf of the Fund were satisfactory.
The Trustees also considered benefits to MFS from the use of the Fund’s portfolio brokerage commissions, if applicable, to pay for investment research and various other factors. Additionally, the Trustees considered so-called “fall-out benefits” to MFS such as reputational value derived from serving as investment manager to the Fund.
Based on their evaluation of factors that they deemed to be material, including those factors described above, the Board of Trustees, including the independent Trustees, concluded that the Fund’s investment advisory agreement with MFS should be continued for an additional one-year period, commencing August 1, 2015.
24
MFS Investors Trust Series
PROXY VOTING POLICIES AND INFORMATION
MFS votes proxies on behalf of the fund pursuant to proxy voting policies and procedures that are available without charge, upon request, by calling 1-800-225-2606, by visiting the Proxy Voting section of mfs.com or by visiting the SEC’s Web site at http://www.sec.gov.
Information regarding how the fund voted proxies relating to portfolio securities during the most recent twelve-month period ended June 30 is available without charge by visiting the Proxy Voting section of mfs.com or by visiting the SEC’s Web site at http://www.sec.gov.
QUARTERLY PORTFOLIO DISCLOSURE
The fund will file a complete schedule of portfolio holdings with the Securities and Exchange Commission (the Commission) for the first and third quarters of each fiscal year on Form N-Q. The fund’s Form N-Q is available on the EDGAR database on the Commission’s Internet Web site at http://www.sec.gov, and may be reviewed and copied at the:
Public Reference Room
Securities and Exchange Commission
100 F Street, NE, Room 1580
Washington, D.C. 20549
Information on the operation of the Public Reference Room may be obtained by calling the Commission at 1-800-SEC-0330. Copies of the fund’s Form N-Q also may be obtained, upon payment of a duplicating fee, by electronic request at the following e-mail address: publicinfo@sec.gov or by writing the Public Reference Section at the above address.
FURTHER INFORMATION
From time to time, MFS may post important information about the fund or the MFS funds on the MFS web site (mfs.com). This information is available by visiting the “Market Commentary” and “Announcements” sub sections in the “Market Outlooks” section of mfs.com or by clicking on the fund’s name under “Variable Insurance Portfolios — VIT” in the “Products” section of mfs.com.
FEDERAL TAX INFORMATION (unaudited)
The following information is provided pursuant to provisions of the Internal Revenue Code.
The fund designates $63,337,000 as capital gain dividends paid during the fiscal year.
For corporate shareholders, 80.60% of the ordinary income dividends paid during the fiscal year qualify for the corporate dividends received deduction.
25
rev. 3/11
| | | | |
| FACTS | | WHAT DOES MFS DO WITH YOUR
PERSONAL INFORMATION? | |  |
| | |
| Why? | | Financial companies choose how they share your personal information. Federal law gives consumers the right to limit some but not all sharing. Federal law also requires us to tell you how we collect, share, and protect your personal information. Please read this notice carefully to understand what we do. |
| | |
| What? | | The types of personal information we collect and share depend on the product or service you have with us. This information can include: • Social Security number and account balances • Account transactions and transaction history • Checking account information and wire transfer instructions When you are no longer our customer, we continue to share your information as described in this notice. |
| | |
| How? | | All financial companies need to share customers’ personal information to run their everyday business. In the section below, we list the reasons financial companies can share their customers’ personal information; the reasons MFS chooses to share; and whether you can limit this sharing. |
| | | | |
Reasons we can share your
personal information | | Does MFS share? | | Can you limit this
sharing? |
For our everyday business purposes – such as to process your transactions, maintain your account(s), respond to court orders and legal investigations, or report to credit bureaus | | Yes | | No |
For our marketing purposes – to offer our products and services to you | | No | | We don’t share |
| For joint marketing with other financial companies | | No | | We don’t share |
For our affiliates’ everyday business purposes – information about your transactions and experiences | | No | | We don’t share |
For our affiliates’ everyday business purposes – information about your creditworthiness | | No | | We don’t share |
| For nonaffiliates to market to you | | No | | We don’t share |
| | |
| Questions? | | Call 800-225-2606 or go to mfs.com. |
26
| | |
| Who we are |
| Who is providing this notice? | | MFS Funds, MFS Investment Management, MFS Institutional Advisors, Inc., MFS Fund Distributors, Inc., MFS Heritage Trust Company, and MFS Service Center, Inc. |
| | |
| What we do |
| How does MFS protect my personal information? | | To protect your personal information from unauthorized access and use, we use security measures that comply with federal law. These measures include procedural, electronic, and physical safeguards for the protection of the personal information we collect about you. |
How does MFS
collect my personal information? | | We collect your personal information, for example, when you • open an account or provide account information • direct us to buy securities or direct us to sell your securities • make a wire transfer We also collect your personal information from others, such as credit bureaus, affiliates and other companies. |
| Why can’t I limit all sharing? | | Federal law gives you the right to limit only • sharing for affiliates’ everyday business purposes – information about your creditworthiness • affiliates from using your information to market to you • sharing for nonaffiliates to market to you State laws and individual companies may give you additional rights to limit sharing. |
| | |
| Definitions |
| Affiliates | | Companies related by common ownership or control. They can be financial and nonfinancial companies. • MFS does not share personal information with affiliates, except for everyday business purposes as described on page one of this notice. |
| Nonaffiliates | | Companies not related by common ownership or control. They can be financial and nonfinancial companies. • MFS does not share with nonaffiliates so they can market to you. |
| Joint Marketing | | A formal agreement between nonaffiliated financial companies that together market financial products or services to you. • MFS doesn’t jointly market. |
| | |
| Other important information |
| If you own an MFS product or receive an MFS service in the name of a third party such as a bank or broker-dealer, their privacy policy may apply to you instead of ours. |
27
ANNUAL REPORT
December 31, 2015

MFS® MID CAP GROWTH SERIES
MFS® Variable Insurance Trust

VMG-ANN
MFS® MID CAP GROWTH SERIES
CONTENTS
The report is prepared for the general information of contract owners. It is authorized for distribution to prospective investors only when preceded or accompanied by a current prospectus.
NOT FDIC INSURED • MAY LOSE VALUE • NO BANK OR CREDIT UNION GUARANTEE • NOT A DEPOSIT • NOT INSURED BY ANY FEDERAL GOVERNMENT AGENCY OR NCUA/NCUSIF
MFS Mid Cap Growth Series
LETTER FROM THE CHAIRMAN

Dear Contract Owners:
Central bank policies remain center stage as the U.S. Federal Reserve made good on its pledge to raise policy rates for the first time in over nine years at its December meeting. The Fed’s actions stand in stark contrast to those of the European Central Bank and Bank of Japan, which modestly extended their quantitative easing programs in December.
In the United States, auto sales remain a source of economic strength, but housing demand has slowed of late. The U.S. economic expansion remains moderate but uneven, with a strong dollar crimping demand for U.S. goods abroad. China’s shift to a consumer-led economy continues to weigh on its manufacturing and exports, as does weak global demand. Slackening demand from China continues to undermine commodity markets, with oil particularly impacted amid a global supply glut.
As markets have become more focused on short-term trends in recent years, we believe it’s important for investors to lengthen their investment time horizon. At MFS®, we don’t trade on headlines or trends; we invest for the long term.
We believe that this approach, coupled with the professional guidance of a financial advisor, will help you reach your investment goals.
Respectfully,

Robert J. Manning
Chairman
MFS Investment Management
February 16, 2016
The opinions expressed in this letter are subject to change and may not be relied upon for investment advice. No forecasts can be guaranteed.
1
MFS Mid Cap Growth Series
PORTFOLIO COMPOSITION
Portfolio structure

| | | | |
| Top ten holdings | | | | |
| Bright Horizons Family Solutions, Inc. | | | 2.4% | |
| Ross Stores, Inc. | | | 2.4% | |
| Gartner, Inc. | | | 2.3% | |
| Roper Technologies, Inc. | | | 2.3% | |
| Henry Schein, Inc. | | | 2.2% | |
| Allergan PLC | | | 2.1% | |
| SS&C Technologies Holdings, Inc. | | | 1.9% | |
| AMETEK, Inc. | | | 1.9% | |
| Aramark | | | 1.9% | |
| Constellation Brands, Inc., “A” | | | 1.8% | |
| | | | |
| Equity sectors | | | | |
| Special Products & Services | | | 16.8% | |
| Health Care | | | 14.1% | |
| Industrial Goods & Services | | | 12.9% | |
| Retailing | | | 10.5% | |
| Technology | | | 9.7% | |
| Leisure | | | 8.1% | |
| Consumer Staples | | | 7.5% | |
| Financial Services | | | 7.1% | |
| Autos & Housing | | | 6.9% | |
| Utilities & Communications | | | 1.8% | |
| Basic Materials | | | 1.1% | |
| Transportation | | | 0.8% | |
| Energy | | | 0.8% | |
Cash & Cash Equivalents includes any cash, investments in money market funds, short-term securities, and other assets less liabilities. Please see the Statement of Assets and Liabilities for additional information related to the fund’s cash position and other assets and liabilities.
Percentages are based on net assets as of 12/31/15.
The portfolio is actively managed and current holdings may be different.
2
MFS Mid Cap Growth Series
MANAGEMENT REVIEW
Summary of Results
For the twelve months ended December 31, 2015, Initial Class shares of the MFS Mid Cap Growth Series (“fund”) provided a total return of 4.61%, while Service Class shares of the fund provided a total return of 4.43%. These compare with a return of –0.20% over the same period for the fund’s benchmark, the Russell Midcap Growth Index.
Market Environment
Sluggish global growth weighed on both developed and emerging market (“EM”) economies during the reporting period. EM economies have been particularly lackluster. While the US Federal Reserve began its anticipated monetary policy tightening cycle at the end of the period, other large developed economies continued to embrace accommodative monetary policies, particularly the European Central Bank and the Bank of Japan. Focus remained on China after policy missteps by the Chinese government roiled global markets over the summer, beginning with the uncoordinated response to the stock market’s boom and bust and then the confusing decision to devalue the renminbi in August. China subsequently ramped up a wide range of monetary and fiscal measures to stimulate the economy and bolster sentiment. Its economy appeared to stabilize late in the period. Also at the end of the period, the Chinese renminbi was granted reserve currency status by the International Monetary Fund (“IMF”), which announced its inclusion in the IMF’s Special Drawing Rights currency basket effective October 1, 2016.
During the second half of the reporting period, the US faced an earnings recession caused primarily by the sharp decline in the prices of oil and other commodities. Earnings contractions were concentrated primarily in the energy, materials and industrial sectors. An additional headwind for earnings was the sharp rise in the US dollar over the period. Exports were crimped by the dollar’s strength and falling demand in emerging markets. Consumer spending held up well during the second half of the period amid a modest increase in real wages and a tailwind from falling gasoline prices. Demand for autos reached near-record territory late in the period. In emerging markets, two key factors weighed on economies and asset prices: 1) weaker Chinese growth, which drove the decline in commodity prices and 2) prospects for higher US interest rates. Structural factors like floating exchange rates and fiscal buffers partially offset these cyclical headwinds.
Contributors to Performance
Strong stock selection in the technology sector positively impacted relative performance. Within this sector, overweighting computer graphics processors maker NVIDIA added to relative returns as the company’s diversification efforts into the high-end gaming market and automotive segment drove better than expected results.
A combination of security selection and an overweight allocation to the special products & services sector further aided relative results. Holding child care and early education provider Bright Horizons (b) and overweight positions in electronic payment services company Global Payments and residential and commercial services provider ServiceMaster Global Holdings lifted relative performance.
Elsewhere, the fund’s overweight positions in internet TV show and movie subscription services provider Netflix and engineered products and solutions provider Roper Technologies supported relative results. Additionally, holding natural ingredients solutions provider Chr. Hansen Holdings (b) (Denmark), eye care and skin care products company Allergan (b) and biopharmaceutical company Regeneron Pharmaceuticals (b) all benefited relative performance.
The fund’s cash and/or cash equivalents position during the period was also a contributor to relative performance. Under normal market conditions, the fund strives to be fully invested and generally holds cash to buy new holdings and to provide liquidity. In a period when equity markets decline, as measured by the fund’s benchmark, holding cash benefits performance versus the benchmark, which has no cash position.
Detractors from Performance
Weak security selection in the transportation and health care sectors weighed on relative returns. Within the transportation sector, overweight positions in discount air travel provider Spirit Airlines and railroad company Kansas City Southern hurt relative performance. Shares of Spirit Airlines fell on declining revenue per available seat mile (RASM) metrics. Within the health care sector, holding emergency rooms operator Adeptus Health (b), an overweight position in medical device company Cooper Companies and not holding small molecule drug developer Pharmacyclics all dampened relative results.
3
MFS Mid Cap Growth Series
Management Review – continued
Securities in other sectors that weighed on relative performance included overweight positions in apparel retailer PVH and asset management company Affiliated Managers and holdings of pet food manufacturer Freshpet (b), apparel retailer Five Below (b) and digital imagery marketplace provider Shutterstock (b)(h).
Respectfully,
| | | | |
| Eric Fischman | | Paul Gordon | | Matthew Sabel |
| Portfolio Manager | | Portfolio Manager | | Portfolio Manager |
| (b) | Security is not a benchmark constituent. |
| (h) | Security was not held in the portfolio at period end. |
The views expressed in this report are those of the portfolio managers only through the end of the period of the report as stated on the cover and do not necessarily reflect the views of MFS or any other person in the MFS organization. These views are subject to change at any time based on market or other conditions, and MFS disclaims any responsibility to update such views. These views may not be relied upon as investment advice or an indication of trading intent on behalf of any MFS portfolio. References to specific securities are not recommendations of such securities, and may not be representative of any MFS portfolio’s current or future investments.
4
MFS Mid Cap Growth Series
PERFORMANCE SUMMARY THROUGH 12/31/15
The following chart illustrates the historical performance of the fund in comparison to its benchmark(s). Benchmarks are unmanaged and may not be invested in directly. Benchmark returns do not reflect any fees or expenses. The performance of other share classes will be greater than or less than that of the class depicted below. (See Notes to Performance Summary.)
Performance data shown represents past performance and is no guarantee of future results. Investment return and principal value fluctuate so your units, when sold, may be worth more or less than the original cost; current performance may be lower or higher than quoted. The performance shown does not reflect the deduction of taxes, if any, that a contract holder would pay on fund distributions or the redemption of contract units. The returns for the fund shown also do not reflect the deduction of expenses associated with variable products, such as mortality and expense risk charges, separate account charges, and sales charges imposed by the insurance company separate accounts. Such expenses would reduce the overall returns shown.
Growth of a Hypothetical $10,000 Investment
Total Returns through 12/31/15
Average annual total returns
| | | | | | | | | | | | |
| | | Share Class | | Class Inception Date | | 1-yr | | 5-yr | | 10-yr | | |
| | | Initial Class | | 4/28/00 | | 4.61% | | 11.43% | | 5.59% | | |
| | | Service Class | | 5/01/00 | | 4.43% | | 11.19% | | 5.34% | | |
| | | | |
| Comparative benchmark | | | | | | | | |
| | | Russell Midcap Growth Index (f) | | (0.20)% | | 11.54% | | 8.16% | | |
| (f) | Source: FactSet Research Systems Inc. |
Benchmark Definition
Russell Midcap Growth Index – constructed to provide a comprehensive barometer for growth securities in the mid-cap segment of the U.S. equity universe. Companies in this index generally have higher price-to-book ratios and higher forecasted growth values.
It is not possible to invest directly in an index.
Notes to Performance Summary
Average annual total return represents the average annual change in value for each share class for the periods presented.
Performance results reflect any applicable expense subsidies and waivers in effect during the periods shown. Without such subsidies and waivers the fund’s performance results would be less favorable. Please see the prospectus and financial statements for complete details. All results are historical and assume the reinvestment of any dividends and capital gains distributions.
Performance results do not include adjustments made for financial reporting purposes in accordance with U.S. generally accepted accounting principles and may differ from amounts reported in the financial highlights.
From time to time the fund may receive proceeds from litigation settlements, without which performance would be lower.
5
MFS Mid Cap Growth Series
EXPENSE TABLE
Fund Expenses Borne by the Contract Holders during the Period,
July 1, 2015 through December 31, 2015
As a contract holder of the fund, you incur ongoing costs, including management fees; distribution and/or service (12b-1) fees; and other fund expenses. This example is intended to help you understand your ongoing costs (in dollars) of investing in the fund and to compare these costs with the ongoing costs of investing in other mutual funds.
The example is based on an investment of $1,000 invested at the beginning of the period and held for the entire period July 1, 2015 through December 31, 2015.
Actual Expenses
The first line for each share class in the following table provides information about actual account values and actual expenses. You may use the information in this line, together with the amount you invested, to estimate the expenses that you paid over the period. Simply divide your account value by $1,000 (for example, an $8,600 account value divided by $1,000 = 8.6), then multiply the result by the number in the first line under the heading entitled “Expenses Paid During Period” to estimate the expenses you paid on your account during this period.
Hypothetical Example for Comparison Purposes
The second line for each share class in the following table provides information about hypothetical account values and hypothetical expenses based on the fund’s actual expense ratio and an assumed rate of return of 5% per year before expenses, which is not the fund’s actual return. The hypothetical account values and expenses may not be used to estimate the actual ending account balance or expenses you paid for the period. You may use this information to compare the ongoing costs of investing in the fund and other funds. To do so, compare this 5% hypothetical example with the 5% hypothetical examples that appear in the shareholder reports of the other funds.
Please note that the expenses shown in the table are meant to highlight the fund’s ongoing costs only and do not take into account the fees and expenses imposed under the variable contracts through which your investment in the fund is made. Therefore, the second line for each share class in the table is useful in comparing ongoing costs associated with an investment in vehicles (such as the fund) which fund benefits under variable annuity and variable life insurance contracts and to qualified pension and retirement plans only, and will not help you determine the relative total costs of investing in the fund through variable annuity and variable life insurance contracts. If the fees and expenses imposed under the variable contracts were included, your costs would have been higher.
| | | | | | | | | | | | | | | | | | |
| Share Class | | | | Annualized
Expense Ratio | | | Beginning
Account Value
7/01/15 | | | Ending Account Value
12/31/15 | | | Expenses Paid
During Period (p)
7/01/15-12/31/15 | |
| Initial Class | | Actual | | | 0.80% | | | | $1,000.00 | | | | $980.11 | | | | $3.99 | |
| | Hypothetical (h) | | | 0.80% | | | | $1,000.00 | | | | $1,021.17 | | | | $4.08 | |
| Service Class | | Actual | | | 1.05% | | | | $1,000.00 | | | | $979.27 | | | | $5.24 | |
| | Hypothetical (h) | | | 1.05% | | | | $1,000.00 | | | | $1,019.91 | | | | $5.35 | |
| (h) | 5% class return per year before expenses. |
| (p) | “Expenses Paid During Period” are equal to each class’s annualized expense ratio, as shown above, multiplied by the average account value over the period, multiplied by 184/365 (to reflect the one-half year period). |
6
MFS Mid Cap Growth Series
PORTFOLIO OF INVESTMENTS – 12/31/15
The Portfolio of Investments is a complete list of all securities owned by your fund. It is categorized by broad-based asset classes.
| | | | | | | | |
| Issuer | | Shares/Par | | | Value ($) | |
| | | | | | | | |
| COMMON STOCKS – 98.1% | | | | | | | | |
| Aerospace – 2.4% | | | | | | | | |
| Rockwell Collins, Inc. | | | 19,925 | | | $ | 1,839,078 | |
| Textron, Inc. | | | 54,972 | | | | 2,309,374 | |
| TransDigm Group, Inc. (a) | | | 25,906 | | | | 5,918,226 | |
| | | | | | | | |
| | | | | | $ | 10,066,678 | |
| | | | | | | | |
| Airlines – 0.3% | | | | | | | | |
| Spirit Airlines, Inc. (a) | | | 33,183 | | | $ | 1,322,343 | |
| | | | | | | | |
| Alcoholic Beverages – 1.8% | | | | | | | | |
| Constellation Brands, Inc., “A” | | | 51,106 | | | $ | 7,279,539 | |
| | | | | | | | |
| Apparel Manufacturers – 1.4% | |
| Hanesbrands, Inc. | | | 142,090 | | | $ | 4,181,709 | |
| PVH Corp. | | | 21,581 | | | | 1,589,441 | |
| | | | | | | | |
| | | | | | $ | 5,771,150 | |
| | | | | | | | |
| Automotive – 1.6% | | | | | | | | |
| LKQ Corp. (a) | | | 197,443 | | | $ | 5,850,236 | |
| Mobileye N.V. (a) | | | 17,550 | | | | 742,014 | |
| | | | | | | | |
| | | | | | $ | 6,592,250 | |
| | | | | | | | |
| Biotechnology – 3.0% | | | | | | | | |
| Alexion Pharmaceuticals, Inc. (a) | | | 32,997 | | | $ | 6,294,178 | |
| Regeneron Pharmaceuticals, Inc. (a) | | | 10,847 | | | | 5,888,511 | |
| | | | | | | | |
| | | | | | $ | 12,182,689 | |
| | | | | | | | |
| Brokerage & Asset Managers – 3.4% | |
| Affiliated Managers Group, Inc. (a) | | | 31,448 | | | $ | 5,024,132 | |
| Intercontinental Exchange, Inc. | | | 21,397 | | | | 5,483,195 | |
| NASDAQ, Inc. | | | 63,155 | | | | 3,673,726 | |
| | | | | | | | |
| | | | | | $ | 14,181,053 | |
| | | | | | | | |
| Business Services – 14.3% | | | | | | | | |
| Bright Horizons Family Solutions, Inc. (a) | | | 148,135 | | | $ | 9,895,418 | |
| Cognizant Technology Solutions Corp., “A” (a) | | | 45,818 | | | | 2,749,996 | |
| CoStar Group, Inc. (a) | | | 6,232 | | | | 1,288,092 | |
| Equifax, Inc. | | | 33,109 | | | | 3,687,349 | |
| Fiserv, Inc. (a) | | | 58,233 | | | | 5,325,990 | |
| FleetCor Technologies, Inc. (a) | | | 47,617 | | | | 6,805,898 | |
| Gartner, Inc. (a) | | | 106,078 | | | | 9,621,275 | |
| Global Payments, Inc. | | | 101,896 | | | | 6,573,311 | |
| IHS, Inc., “A” (a) | | | 23,678 | | | | 2,804,186 | |
| Jones Lang LaSalle, Inc. | | | 37,971 | | | | 6,070,044 | |
| Realogy Holdings Corp. (a) | | | 73,370 | | | | 2,690,478 | |
| Univar, Inc. (a) | | | 86,259 | | | | 1,467,266 | |
| | | | | | | | |
| | | | | | $ | 58,979,303 | |
| | | | | | | | |
| Cable TV – 1.1% | | | | | | | | |
| Charter Communications, Inc., “A” (a)(l) | | | 25,946 | | | $ | 4,750,713 | |
| | | | | | | | |
| Computer Software – 1.9% | |
| Autodesk, Inc. (a) | | | 38,258 | | | $ | 2,331,060 | |
| Cadence Design Systems, Inc. (a) | | | 47,879 | | | | 996,362 | |
| Cornerstone OnDemand, Inc. (a) | | | 47,976 | | | | 1,656,611 | |
| | | | | | | | |
| Issuer | | Shares/Par | | | Value ($) | |
| | | | | | | | |
| COMMON STOCKS – continued | |
| Computer Software – continued | |
| Qlik Technologies, Inc. (a) | | | 92,181 | | | $ | 2,918,450 | |
| | | | | | | | |
| | | | | | $ | 7,902,483 | |
| | | | | | | | |
| Computer Software – Systems – 6.0% | | | | | |
| Atlassian Corp. PLC, “A” (a) | | | 36,609 | | | $ | 1,101,199 | |
| Guidewire Software, Inc. (a) | | | 36,240 | | | | 2,180,198 | |
| IMS Health Holdings, Inc. (a) | | | 130,157 | | | | 3,315,099 | |
| Sabre Corp. | | | 138,513 | | | | 3,874,209 | |
| ServiceNow, Inc. (a) | | | 11,446 | | | | 990,766 | |
| SS&C Technologies Holdings, Inc. | | | 117,106 | | | | 7,994,827 | |
| Vantiv, Inc., “A” (a) | | | 65,244 | | | | 3,093,870 | |
| Workday, Inc. (a) | | | 25,848 | | | | 2,059,569 | |
| | | | | | | | |
| | | | | | $ | 24,609,737 | |
| | | | | | | | |
| Construction – 5.3% | | | | | | | | |
| Fortune Brands Home & Security, Inc. | | | 103,421 | | | $ | 5,739,866 | |
| Lennox International, Inc. | | | 32,344 | | | | 4,039,766 | |
| Masco Corp. | | | 63,978 | | | | 1,810,577 | |
| Pool Corp. | | | 64,317 | | | | 5,195,527 | |
| Vulcan Materials Co. | | | 55,299 | | | | 5,251,746 | |
| | | | | | | | |
| | | | | | $ | 22,037,482 | |
| | | | | | | | |
| Consumer Products – 1.6% | | | | | | | | |
| Newell Rubbermaid, Inc. | | | 152,014 | | | $ | 6,700,777 | |
| | | | | | | | |
| Consumer Services – 2.5% | | | | | | | | |
| Nord Anglia Education, Inc. (a) | | | 132,739 | | | $ | 2,691,947 | |
| Priceline Group, Inc. (a) | | | 1,802 | | | | 2,297,460 | |
| Servicemaster Global Holdings, Inc. (a) | | | 131,154 | | | | 5,146,483 | |
| | | | | | | | |
| | | | | | $ | 10,135,890 | |
| | | | | | | | |
| Containers – 0.5% | | | | | | | | |
| Crown Holdings, Inc. (a) | | | 39,267 | | | $ | 1,990,837 | |
| | | | | | | | |
| Electrical Equipment – 4.8% | | | | | | | | |
| Advanced Drainage Systems, Inc. | | | 110,365 | | | $ | 2,652,071 | |
| AMETEK, Inc. | | | 146,020 | | | | 7,825,212 | |
| Amphenol Corp., “A” | | | 126,939 | | | | 6,630,024 | |
| Mettler-Toledo International, Inc. (a) | | | 7,995 | | | | 2,711,344 | |
| | | | | | | | |
| | | | | | $ | 19,818,651 | |
| | | | | | | | |
| Electronics – 1.1% | | | | | | | | |
| Monolithic Power Systems, Inc. | | | 20,313 | | | $ | 1,294,141 | |
| NVIDIA Corp. | | | 100,500 | | | | 3,312,480 | |
| | | | | | | | |
| | | | | | $ | 4,606,621 | |
| | | | | | | | |
| Energy – Independent – 0.6% | |
| Concho Resources, Inc. (a) | | | 13,375 | | | $ | 1,242,003 | |
| Memorial Resource Development Corp. (a) | | | 76,760 | | | | 1,239,674 | |
| | | | | | | | |
| | | | | | $ | 2,481,677 | |
| | | | | | | | |
| Entertainment – 1.5% | | | | | | | | |
| Netflix, Inc. (a) | | | 54,899 | | | $ | 6,279,348 | |
| | | | | | | | |
| Food & Beverages – 4.1% | |
| Blue Buffalo Pet Products, Inc. (a)(l) | | | 102,851 | | | $ | 1,924,342 | |
| Chr. Hansen Holding A.S. | | | 99,779 | | | | 6,240,974 | |
7
MFS Mid Cap Growth Series
Portfolio of Investments – continued
| | | | | | | | |
| Issuer | | Shares/Par | | | Value ($) | |
| | | | | | | | |
| COMMON STOCKS – continued | |
| Food & Beverages – continued | |
| Freshpet, Inc. (a)(l) | | | 103,247 | | | $ | 876,567 | |
| J.M. Smucker Co. | | | 11,686 | | | | 1,441,351 | |
| Mead Johnson Nutrition Co., “A” | | | 31,024 | | | | 2,449,345 | |
| WhiteWave Foods Co., “A” (a) | | | 100,757 | | | | 3,920,455 | |
| | | | | | | | |
| | | | | | $ | 16,853,034 | |
| | | | | | | | |
| Gaming & Lodging – 1.6% | | | | | | | | |
| MGM Mirage (a) | | | 95,625 | | | $ | 2,172,600 | |
| Norwegian Cruise Line Holdings Ltd. (a) | | | 76,464 | | | | 4,480,790 | |
| | | | | | | | |
| | | | | | $ | 6,653,390 | |
| | | | | | | | |
| General Merchandise – 1.7% | |
| Dollar Tree, Inc. (a) | | | 55,366 | | | $ | 4,275,363 | |
| Five Below, Inc. (a) | | | 87,851 | | | | 2,820,017 | |
| | | | | | | | |
| | | | | | $ | 7,095,380 | |
| | | | | | | | |
| Insurance – 0.4% | | | | | | | | |
| Lincoln National Corp. | | | 32,636 | | | $ | 1,640,285 | |
| | | | | | | | |
| Internet – 0.7% | | | | | | | | |
| LinkedIn Corp., “A” (a) | | | 12,418 | | | $ | 2,795,043 | |
| | | | | | | | |
| Leisure & Toys – 0.6% | | | | | | | | |
| Brunswick Corp. | | | 53,477 | | | $ | 2,701,123 | |
| | | | | | | | |
| Machinery & Tools – 4.2% | | | | | | | | |
| Flowserve Corp. | | | 61,543 | | | $ | 2,589,729 | |
| Roper Technologies, Inc. | | | 50,600 | | | | 9,603,374 | |
| WABCO Holdings, Inc. (a) | | | 48,816 | | | | 4,991,924 | |
| | | | | | | | |
| | | | | | $ | 17,185,027 | |
| | | | | | | | |
| Medical & Health Technology & Services – 2.8% | |
| Adeptus Health, Inc., “A” (a)(l) | | | 18,866 | | | $ | 1,028,574 | |
| Henry Schein, Inc. (a) | | | 56,295 | | | | 8,905,306 | |
| IDEXX Laboratories, Inc. (a) | | | 22,690 | | | | 1,654,555 | |
| | | | | | | | |
| | | | | | $ | 11,588,435 | |
| | | | | | | | |
| Medical Equipment – 6.3% | |
| C.R. Bard, Inc. | | | 29,073 | | | $ | 5,507,589 | |
| Cooper Cos., Inc. | | | 35,246 | | | | 4,730,013 | |
| DexCom, Inc. (a) | | | 24,377 | | | | 1,996,476 | |
| PerkinElmer, Inc. | | | 118,204 | | | | 6,332,188 | |
| Steris PLC | | | 48,280 | | | | 3,637,415 | |
| VWR Corp. (a) | | | 132,589 | | | | 3,753,595 | |
| | | | | | | | |
| | | | | | $ | 25,957,276 | |
| | | | | | | | |
| Oil Services – 0.2% | | | | | | | | |
| FMC Technologies, Inc. (a) | | | 25,750 | | | $ | 747,008 | |
| | | | | | | | |
| Other Banks & Diversified Financials – 2.1% | |
| First Republic Bank | | | 25,066 | | | $ | 1,655,860 | |
| MasterCard, Inc., “A” | | | 61,698 | | | | 6,006,917 | |
| Signature Bank (a) | | | 5,533 | | | | 848,596 | |
| | | | | | | | |
| | | | | | $ | 8,511,373 | |
| | | | | | | | |
| Pharmaceuticals – 2.1% | | | | | | | | |
| Allergan PLC (a) | | | 27,238 | | | $ | 8,511,875 | |
| | | | | | | | |
| Pollution Control – 1.5% | | | | | | | | |
| Stericycle, Inc. (a) | | | 50,596 | | | $ | 6,101,878 | |
| | | | | | | | |
| | | | | | | | |
| Issuer | | Shares/Par | | | Value ($) | |
| | | | | | | | |
| COMMON STOCKS – continued | |
| Railroad & Shipping – 0.5% | | | | | | | | |
| Kansas City Southern Co. | | | 25,880 | | | $ | 1,932,460 | |
| | | | | | | | |
| Real Estate – 1.2% | | | | | | | | |
| Extra Space Storage, Inc., REIT | | | 57,832 | | | $ | 5,101,361 | |
| | | | | | | | |
| Restaurants – 3.2% | | | | | | | | |
| Aramark | | | 239,849 | | | $ | 7,735,130 | |
| Domino’s Pizza, Inc. | | | 13,251 | | | | 1,474,174 | |
| Dunkin Brands Group, Inc. | | | 88,915 | | | | 3,786,890 | |
| | | | | | | | |
| | | | | | $ | 12,996,194 | |
| | | | | | | | |
| Specialty Chemicals – 0.6% | | | | | | | | |
| Axalta Coating Systems Ltd. (a) | | | 92,157 | | | $ | 2,455,984 | |
| | | | | | | | |
| Specialty Stores – 7.4% | | | | | | | | |
| Burlington Stores, Inc. (a) | | | 71,361 | | | $ | 3,061,384 | |
| O’Reilly Automotive, Inc. (a) | | | 27,955 | | | | 7,084,356 | |
| Ross Stores, Inc. | | | 181,198 | | | | 9,750,264 | |
| Signet Jewelers Ltd. | | | 30,817 | | | | 3,811,755 | |
| Tiffany & Co. | | | 15,649 | | | | 1,193,862 | |
| Tractor Supply Co. | | | 63,781 | | | | 5,453,276 | |
| | | | | | | | |
| | | | | | $ | 30,354,897 | |
| | | | | | | | |
| Telecommunications – Wireless – 1.8% | |
| SBA Communications Corp. (a) | | | 69,022 | | | $ | 7,252,142 | |
| | | | | | | | |
Total Common Stocks
(Identified Cost, $292,418,662) | | | $ | 404,123,386 | |
| | | | | | | | |
|
| MONEY MARKET FUNDS – 2.3% | |
| MFS Institutional Money Market Portfolio, 0.19%, at Cost and Net Asset Value (v) | | | 9,278,652 | | | $ | 9,278,652 | |
| | | | | | | | |
|
| COLLATERAL FOR SECURITIES LOANED – 1.5% | |
| Navigator Securities Lending Prime Portfolio, 0.32%, at Cost and Net Asset Value (j) | | | 6,207,953 | | | $ | 6,207,953 | |
| | | | | | | | |
Total Investments
(Identified Cost, $307,905,267) | | | $ | 419,609,991 | |
| | | | | | | | |
OTHER ASSETS, LESS
LIABILITIES – (1.9)% | | | | (7,848,068 | ) |
| | | | | | | | |
| NET ASSETS – 100.0% | | | $ | 411,761,923 | |
| | | | | | | | |
| (a) | | Non-income producing security. |
| (j) | | The rate quoted is the annualized seven-day yield of the fund at period end. |
| (l) | | A portion of this security is on loan. |
| (v) | | Underlying affiliated fund that is available only to investment companies managed by MFS. The rate quoted for the MFS Institutional Money Market Portfolio is the annualized seven-day yield of the fund at period end. |
The following abbreviations are used in this report and are defined:
| PLC | | Public Limited Company |
| REIT | | Real Estate Investment Trust |
See Notes to Financial Statements
8
MFS Mid Cap Growth Series
FINANCIAL STATEMENTS | STATEMENT OF ASSETS AND LIABILITIES
This statement represents your fund’s balance sheet, which details the assets and liabilities comprising the total value of the fund.
| | | | | | | | |
At 12/31/15 | | | | | | | | |
Assets | | | | | | | | |
Investments | | | | | | | | |
Non-affiliated issuers, at value (identified cost, $298,626,615) | | | $410,331,339 | | | | | |
Underlying affiliated funds, at cost and value | | | 9,278,652 | | | | | |
Total investments, at value, including $6,646,741 of securities on loan (identified cost, $307,905,267) | | | $419,609,991 | | | | | |
Receivables for | | | | | | | | |
Investments sold | | | 806,973 | | | | | |
Fund shares sold | | | 14,544 | | | | | |
Interest and dividends | | | 108,436 | | | | | |
Other assets | | | 2,859 | | | | | |
Total assets | | | | | | | $420,542,803 | |
Liabilities | | | | | | | | |
Payables for | | | | | | | | |
Investments purchased | | | $940,643 | | | | | |
Fund shares reacquired | | | 1,550,123 | | | | | |
Collateral for securities loaned, at value (c) | | | 6,207,953 | | | | | |
Payable to affiliates | | | | | | | | |
Investment adviser | | | 17,316 | | | | | |
Shareholder servicing costs | | | 87 | | | | | |
Distribution and/or service fees | | | 1,207 | | | | | |
Payable for independent Trustees’ compensation | | | 16 | | | | | |
Accrued expenses and other liabilities | | | 63,535 | | | | | |
Total liabilities | | | | | | | $8,780,880 | |
Net assets | | | | | | | $411,761,923 | |
Net assets consist of | | | | | | | | |
Paid-in capital | | | $270,826,722 | | | | | |
Unrealized appreciation (depreciation) on investments and translation of assets and liabilities in foreign currencies | | | 111,704,863 | | | | | |
Accumulated net realized gain (loss) on investments and foreign currency | | | 29,230,338 | | | | | |
Net assets | | | | | | | $411,761,923 | |
Shares of beneficial interest outstanding | | | | | | | 50,627,697 | |
| | | | | | | | | | | | |
| | | Net assets | | | Shares
outstanding | | | Net asset value
per share | |
Initial Class | | | $324,753,798 | | | | 39,542,833 | | | | $8.21 | |
Service Class | | | 87,008,125 | | | | 11,084,864 | | | | 7.85 | |
| (c) | | Non-cash collateral is not included. |
See Notes to Financial Statements
9
MFS Mid Cap Growth Series
FINANCIAL STATEMENTS | STATEMENT OF OPERATIONS
This statement describes how much your fund earned in investment income and accrued in expenses. It also describes any gains and/or losses generated by fund operations.
| | | | | | | | |
Year ended 12/31/15 | | | | | | | | |
Net investment loss | | | | | | | | |
Income | | | | | | | | |
Dividends | | | $2,033,314 | | | | | |
Interest | | | 84,083 | | | | | |
Dividends from underlying affiliated issuers | | | 6,258 | | | | | |
Foreign taxes withheld | | | (34,536 | ) | | | | |
Total investment income | | | | | | | $2,089,119 | |
Expenses | | | | | | | | |
Management fee | | | $3,297,604 | | | | | |
Distribution and/or service fees | | | 224,704 | | | | | |
Shareholder servicing costs | | | 18,821 | | | | | |
Administrative services fee | | | 78,399 | | | | | |
Independent Trustees’ compensation | | | 9,897 | | | | | |
Custodian fee | | | 45,760 | | | | | |
Shareholder communications | | | 27,565 | | | | | |
Audit and tax fees | | | 54,792 | | | | | |
Legal fees | | | 3,440 | | | | | |
Miscellaneous | | | 17,155 | | | | | |
Total expenses | | | | | | | $3,778,137 | |
Fees paid indirectly | | | (2 | ) | | | | |
Reduction of expenses by investment adviser | | | (30,539 | ) | | | | |
Net expenses | | | | | | | $3,747,596 | |
Net investment loss | | | | | | | $(1,658,477 | ) |
Realized and unrealized gain (loss) on investments and foreign currency | | | | | | | | |
Realized gain (loss) (identified cost basis) | | | | | | | | |
Investments | | | $32,065,239 | | | | | |
Foreign currency | | | (6,086 | ) | | | | |
Net realized gain (loss) on investments and foreign currency | | | | | | | $32,059,153 | |
Change in unrealized appreciation (depreciation) | | | | | | | | |
Investments | | | $(8,820,028 | ) | | | | |
Translation of assets and liabilities in foreign currencies | | | 482 | | | | | |
Net unrealized gain (loss) on investments and foreign currency translation | | | | | | | $(8,819,546 | ) |
Net realized and unrealized gain (loss) on investments and foreign currency | | | | | | | $23,239,607 | |
Change in net assets from operations | | | | | | | $21,581,130 | |
See Notes to Financial Statements
10
MFS Mid Cap Growth Series
FINANCIAL STATEMENTS | STATEMENTS OF CHANGES IN NET ASSETS
These statements describe the increases and/or decreases in net assets resulting from operations, any distributions, and any shareholder transactions.
| | | | | | | | |
For years ended 12/31 | | | 2015 | | | | 2014 | |
Change in net assets | | | | | | | | |
From operations | | | | | | | | |
Net investment loss | | | $(1,658,477 | ) | | | $(1,830,236 | ) |
Net realized gain (loss) on investments and foreign currency | | | 32,059,153 | | | | 44,598,016 | |
Net unrealized gain (loss) on investments and foreign currency translation | | | (8,819,546 | ) | | | (3,396,884 | ) |
Change in net assets from operations | | | $21,581,130 | | | | $39,370,896 | |
Distributions declared to shareholders | | | | | | | | |
From net realized gain on investments | | | $(42,235,087 | ) | | | $(50,698,590 | ) |
Change in net assets from fund share transactions | | | $(20,270,732 | ) | | | $(20,051,143 | ) |
Total change in net assets | | | $(40,924,689 | ) | | | $(31,378,837 | ) |
Net assets | | | | | | | | |
At beginning of period | | | 452,686,612 | | | | 484,065,449 | |
At end of period | | | $411,761,923 | | | | $452,686,612 | |
See Notes to Financial Statements
11
MFS Mid Cap Growth Series
FINANCIAL STATEMENTS | FINANCIAL HIGHLIGHTS
The financial highlights table is intended to help you understand the fund’s financial performance for the past 5 years. Certain information reflects financial results for a single fund share. The total returns in the table represent the rate by which an investor would have earned (or lost) on an investment in the fund share class (assuming reinvestment of all distributions) held for the entire period.
| | | | | | | | | | | | | | | | | | | | |
| Initial Class | | Years ended 12/31 | |
| | | 2015 | | | 2014 | | | 2013 | | | 2012 | | | 2011 | |
Net asset value, beginning of period | | | $8.76 | | | | $9.00 | | | | $6.56 | | | | $5.63 | | | | $5.99 | |
| Income (loss) from investment operations | | | | | | | | | | | | | | | | | | | | |
Net investment loss (d) | | | $(0.03 | ) | | | $(0.03 | ) | | | $(0.02 | ) | | | $(0.01 | ) | | | $(0.03 | ) |
Net realized and unrealized gain (loss) on investments
and foreign currency | | | 0.39 | | | | 0.80 | | | | 2.49 | | | | 0.94 | | | | (0.33 | ) |
Total from investment operations | | | $0.36 | | | | $0.77 | | | | $2.47 | | | | $0.93 | | | | $(0.36 | ) |
| Less distributions declared to shareholders | | | | | | | | | | | | | | | | | | | | |
From net realized gain on investments | | | $(0.91 | ) | | | $(1.01 | ) | | | $(0.03 | ) | | | $— | | | | $— | |
Net asset value, end of period (x) | | | $8.21 | | | | $8.76 | | | | $9.00 | | | | $6.56 | | | | $5.63 | |
Total return (%) (k)(r)(s)(x) | | | 4.61 | | | | 8.86 | | | | 37.72 | | | | 16.52 | | | | (6.01 | ) |
Ratios (%) (to average net assets)
and Supplemental data: | | | | | | | | | | | | | | | | | | | | |
Expenses before expense reductions (f) | | | 0.81 | | | | 0.81 | | | | 0.81 | | | | 0.89 | | | | 0.88 | |
Expenses after expense reductions (f) | | | 0.80 | | | | 0.80 | | | | 0.81 | | | | 0.89 | | | | 0.88 | |
Net investment loss | | | (0.33 | ) | | | (0.34 | ) | | | (0.26 | ) | | | (0.10 | ) | | | (0.44 | ) |
Portfolio turnover | | | 37 | | | | 49 | | | | 62 | | | | 65 | | | | 71 | |
Net assets at end of period (000 omitted) | | | $324,754 | | | | $363,788 | | | | $393,212 | | | | $359,488 | | | | $84,387 | |
See Notes to Financial Statements
12
MFS Mid Cap Growth Series
Financial Highlights – continued
| | | | | | | | | | | | | | | | | | | | |
| Service Class | | Years ended 12/31 | |
| | | 2015 | | | 2014 | | | 2013 | | | 2012 | | | 2011 | |
Net asset value, beginning of period | | | $8.43 | | | | $8.72 | | | | $6.38 | | | | $5.48 | | | | $5.84 | |
| Income (loss) from investment operations | | | | | | | | | | | | | | | | | | | | |
Net investment loss (d) | | | $(0.05 | ) | | | $(0.05 | ) | | | $(0.04 | ) | | | $(0.02 | ) | | | $(0.04 | ) |
Net realized and unrealized gain (loss) on investments
and foreign currency | | | 0.38 | | | | 0.77 | | | | 2.41 | | | | 0.92 | | | | (0.32 | ) |
Total from investment operations | | | $0.33 | | | | $0.72 | | | | $2.37 | | | | $0.90 | | | | $(0.36 | ) |
| Less distributions declared to shareholders | | | | | | | | | | | | | | | | | | | | |
From net realized gain on investments | | | $(0.91 | ) | | | $(1.01 | ) | | | $(0.03 | ) | | | $— | | | | $— | |
Net asset value, end of period (x) | | | $7.85 | | | | $8.43 | | | | $8.72 | | | | $6.38 | | | | $5.48 | |
Total return (%) (k)(r)(s)(x) | | | 4.43 | | | | 8.56 | | | | 37.22 | | | | 16.42 | | | | (6.16 | ) |
Ratios (%) (to average net assets)
and Supplemental data: | | | | | | | | | | | | | | | | | | | | |
Expenses before expense reductions (f) | | | 1.06 | | | | 1.06 | | | | 1.06 | | | | 1.14 | | | | 1.13 | |
Expenses after expense reductions (f) | | | 1.05 | | | | 1.05 | | | | 1.06 | | | | 1.14 | | | | 1.13 | |
Net investment loss | | | (0.57 | ) | | | (0.59 | ) | | | (0.51 | ) | | | (0.35 | ) | | | (0.70 | ) |
Portfolio turnover | | | 37 | | | | 49 | | | | 62 | | | | 65 | | | | 71 | |
Net assets at end of period (000 omitted) | | | $87,008 | | | | $88,899 | | | | $90,854 | | | | $76,779 | | | | $30,142 | |
| (d) | Per share data is based on average shares outstanding. |
| (f) | Ratios do not reflect reductions from fees paid indirectly, if applicable. |
| (k) | The total return does not reflect expenses that apply to separate accounts. Inclusion of these charges would reduce the total return figures for all periods shown. |
| (r) | Certain expenses have been reduced without which performance would have been lower. |
| (s) | From time to time the fund may receive proceeds from litigation settlements, without which performance would be lower. |
| (x) | The net asset values and total returns have been calculated on net assets which include adjustments made in accordance with U.S. generally accepted accounting principles required at period end for financial reporting purposes. |
See Notes to Financial Statements
13
MFS Mid Cap Growth Series
NOTES TO FINANCIAL STATEMENTS
| (1) | | Business and Organization |
MFS Mid Cap Growth Series (the fund) is a diversified series of MFS Variable Insurance Trust (the trust). The trust is organized as a Massachusetts business trust and is registered under the Investment Company Act of 1940, as amended, as an open-end management investment company. The shareholders of each series of the trust are separate accounts of insurance companies, which offer variable annuity and/or life insurance products, and qualified retirement and pension plans.
The fund is an investment company and accordingly follows the investment company accounting and reporting guidance of the Financial Accounting Standards Board (FASB) Accounting Standards Codification Topic 946 Financial Services – Investment Companies.
| (2) | | Significant Accounting Policies |
General – The preparation of financial statements in conformity with U.S. generally accepted accounting principles requires management to make estimates and assumptions that affect the reported amounts of assets and liabilities, and disclosure of contingent assets and liabilities at the date of the financial statements and the reported amounts of increases and decreases in net assets from operations during the reporting period. Actual results could differ from those estimates. In the preparation of these financial statements, management has evaluated subsequent events occurring after the date of the fund’s Statement of Assets and Liabilities through the date that the financial statements were issued.
In January 2016, FASB issued Accounting Standards Update 2016-01, Financial Instruments – Overall (Subtopic 825-10) – Recognition and Measurement of Financial Assets and Financial Liabilities (“ASU 2016-01”) which would first be effective for annual reporting periods beginning after December 15, 2017, and interim periods therein. ASU 2016-01, which changes the accounting for equity investments and for certain financial liabilities, also modifies the presentation and disclosure requirements for financial instruments. Investment companies are specifically exempted from ASU 2016-01’s equity investment accounting provisions and will continue to follow the industry specific guidance for investment accounting under ASC 946. Although still evaluating the potential impacts of ASU 2016-01 to the fund, management expects that the impact of the fund’s adoption will be limited to additional financial statement disclosures.
Balance Sheet Offsetting – The fund’s accounting policy with respect to balance sheet offsetting is that, absent an event of default by the counterparty or a termination of the agreement, the International Swaps and Derivatives Association (ISDA) Master Agreement does not result in an offset of reported amounts of financial assets and financial liabilities in the Statement of Assets and Liabilities across transactions between the fund and the applicable counterparty. The fund’s right to setoff may be restricted or prohibited by the bankruptcy or insolvency laws of the particular jurisdiction to which a specific master netting agreement counterparty is subject. Balance sheet offsetting disclosures, to the extent applicable to the fund, have been included in the fund’s Significant Accounting Policies note under the captions for each of the fund’s in-scope financial instruments and transactions.
Investment Valuations – Equity securities, including restricted equity securities, are generally valued at the last sale or official closing price on their primary market or exchange as provided by a third-party pricing service. Equity securities, for which there were no sales reported that day, are generally valued at the last quoted daily bid quotation on their primary market or exchange as provided by a third-party pricing service. Short-term instruments with a maturity at issuance of 60 days or less may be valued at amortized cost, which approximates market value. Open-end investment companies are generally valued at net asset value per share. Securities and other assets generally valued on the basis of information from a third-party pricing service may also be valued at a broker/dealer bid quotation. Values obtained from third-party pricing services can utilize both transaction data and market information such as yield, quality, coupon rate, maturity, type of issue, trading characteristics, and other market data. The values of foreign securities and other assets and liabilities expressed in foreign currencies are converted to U.S. dollars using the mean of bid and asked prices for rates provided by a third-party pricing service.
The Board of Trustees has delegated primary responsibility for determining or causing to be determined the value of the fund’s investments (including any fair valuation) to the adviser pursuant to valuation policies and procedures approved by the Board. If the adviser determines that reliable market quotations are not readily available, investments are valued at fair value as determined in good faith by the adviser in accordance with such procedures under the oversight of the Board of Trustees. Under the fund’s valuation policies and procedures, market quotations are not considered to be readily available for most types of debt instruments and floating rate loans and many types of derivatives. These investments are generally valued at fair value based on information from third-party pricing services. In addition, investments may be valued at fair value if the adviser determines that an investment’s value has been materially affected by events occurring after the close of the exchange or market on which the investment is principally traded (such as foreign exchange or market) and prior to the determination of the fund’s net asset value, or after the halting of trading of a specific security where trading does not resume prior to the close of the exchange or market on which the security is principally traded. Events that occur on a frequent basis after foreign markets close (such as developments in foreign markets and significant movements in the U.S. markets) and prior to the determination of the fund’s net asset value may be deemed to have a material effect on the value of securities traded in foreign markets. Accordingly, the fund’s foreign equity securities may often be
14
MFS Mid Cap Growth Series
Notes to Financial Statements – continued
valued at fair value. The adviser generally relies on third-party pricing services or other information (such as the correlation with price movements of similar securities in the same or other markets; the type, cost and investment characteristics of the security; the business and financial condition of the issuer; and trading and other market data) to assist in determining whether to fair value and at what value to fair value an investment. The value of an investment for purposes of calculating the fund’s net asset value can differ depending on the source and method used to determine value. When fair valuation is used, the value of an investment used to determine the fund’s net asset value may differ from quoted or published prices for the same investment. There can be no assurance that the fund could obtain the fair value assigned to an investment if it were to sell the investment at the same time at which the fund determines its net asset value per share.
Various inputs are used in determining the value of the fund’s assets or liabilities. These inputs are categorized into three broad levels. In certain cases, the inputs used to measure fair value may fall into different levels of the fair value hierarchy. In such cases, an investment’s level within the fair value hierarchy is based on the lowest level of input that is significant to the fair value measurement. The fund’s assessment of the significance of a particular input to the fair value measurement in its entirety requires judgment, and considers factors specific to the investment. Level 1 includes unadjusted quoted prices in active markets for identical assets or liabilities. Level 2 includes other significant observable market-based inputs (including quoted prices for similar securities, interest rates, prepayment speed, and credit risk). Level 3 includes unobservable inputs, which may include the adviser’s own assumptions in determining the fair value of investments. The following is a summary of the levels used as of December 31, 2015 in valuing the fund’s assets or liabilities:
| | | | | | | | | | | | | | | | |
| Investments at Value | | Level 1 | | | Level 2 | | | Level 3 | | | Total | |
| Equity Securities: | | | | | | | | | | | | | | | | |
United States | | | $393,347,252 | | | | $— | | | | $— | | | | $393,347,252 | |
Denmark | | | — | | | | 6,240,974 | | | | — | | | | 6,240,974 | |
Hong Kong | | | 2,691,947 | | | | — | | | | — | | | | 2,691,947 | |
United Kingdom | | | 1,101,199 | | | | — | | | | — | | | | 1,101,199 | |
Israel | | | 742,014 | | | | �� | | | | — | | | | 742,014 | |
| Mutual Funds | | | 15,486,605 | | | | — | | | | — | | | | 15,486,605 | |
| Total Investments | | | $413,369,017 | | | | $6,240,974 | | | | $— | | | | $419,609,991 | |
For further information regarding security characteristics, see the Portfolio of Investments.
Foreign Currency Translation – Purchases and sales of foreign investments, income, and expenses are converted into U.S. dollars based upon currency exchange rates prevailing on the respective dates of such transactions or on the reporting date for foreign denominated receivables and payables. Gains and losses attributable to foreign currency exchange rates on sales of securities are recorded for financial statement purposes as net realized gains and losses on investments. Gains and losses attributable to foreign exchange rate movements on receivables, payables, income and expenses are recorded for financial statement purposes as foreign currency transaction gains and losses. That portion of both realized and unrealized gains and losses on investments that results from fluctuations in foreign currency exchange rates is not separately disclosed.
Security Loans – Under its Securities Lending Agency Agreement with the fund, State Street Bank and Trust Company (“State Street”), as lending agent, loans the securities of the fund to certain qualified institutions (the “Borrowers”) approved by the fund. Security loans can be terminated at the discretion of either the lending agent or the fund and the related securities must be returned within the earlier of the standard trade settlement period for such securities or within three business days. The loans are collateralized by cash and/or U.S. Treasury and federal agency obligations in an amount typically at least equal to the market value of the securities loaned. On loans collateralized by cash, the cash collateral is invested in a money market fund. The market value of the loaned securities is determined at the close of business of the fund and any additional required collateral is delivered to the fund on the next business day. State Street provides the fund with indemnification against Borrower default. In the event of Borrower default, State Street will, for the benefit of the fund, either purchase securities identical to those loaned or, when such purchase is commercially impracticable, pay the fund the market value of the loaned securities. In return, State Street assumes the fund’s rights to the related collateral. If the collateral value is less than the cost to purchase identical securities, State Street is responsible for the shortfall, but only to the extent that such shortfall is not due to a decline in collateral value resulting from collateral reinvestment for which the fund bears the risk of loss. At period end, the fund had investment securities on loan, all of which were classified as equity securities in the fund’s Portfolio of Investments, with a fair value of $6,646,741. The fair value of the fund’s investment securities on loan and a related liability of $6,207,953 for cash collateral received on securities loaned are both presented gross in the Statement of Assets and Liabilities. Additionally, these loans were collateralized by U.S. Treasury Obligations of $615,995. The collateral received on securities loaned exceeded the value of securities on loan at period end. The liability for cash collateral for securities loaned is carried at fair value, which is categorized as level 2 within the fair value hierarchy. A portion of the income generated upon investment of the collateral is remitted to the Borrowers, and the remainder is allocated between the fund and the lending agent. On loans collateralized by U.S. Treasury and/or federal agency obligations, a fee is received from the Borrower, and is allocated between
15
MFS Mid Cap Growth Series
Notes to Financial Statements – continued
the fund and the lending agent. Income from securities lending is included in “Interest” income in the Statement of Operations. The dividend and interest income earned on the securities loaned is accounted for in the same manner as other dividend and interest income.
Indemnifications – Under the fund’s organizational documents, its officers and Trustees may be indemnified against certain liabilities and expenses arising out of the performance of their duties to the fund. Additionally, in the normal course of business, the fund enters into agreements with service providers that may contain indemnification clauses. The fund’s maximum exposure under these agreements is unknown as this would involve future claims that may be made against the fund that have not yet occurred.
Investment Transactions and Income – Investment transactions are recorded on the trade date. Interest income is recorded on the accrual basis. Dividends received in cash are recorded on the ex-dividend date. Certain dividends from foreign securities will be recorded when the fund is informed of the dividend if such information is obtained subsequent to the ex-dividend date. Dividend and interest payments received in additional securities are recorded on the ex-dividend or ex-interest date in an amount equal to the value of the security on such date.
The fund may receive proceeds from litigation settlements. Any proceeds received from litigation involving portfolio holdings are reflected in the Statement of Operations in realized gain/loss if the security has been disposed of by the fund or in unrealized gain/loss if the security is still held by the fund. Any other proceeds from litigation not related to portfolio holdings are reflected as other income in the Statement of Operations.
Fees Paid Indirectly – Prior to October 1, 2015, the fund’s custody fee could be reduced by a credit earned under an arrangement that measured the value of U.S. dollars deposited with the custodian by the fund. The amount of the credit, for the year ended December 31, 2015, is shown as a reduction of total expenses in the Statement of Operations.
Tax Matters and Distributions – The fund intends to qualify as a regulated investment company, as defined under Subchapter M of the Internal Revenue Code, and to distribute all of its taxable income, including realized capital gains. As a result, no provision for federal income tax is required. The fund’s federal tax returns, when filed, will remain subject to examination by the Internal Revenue Service for a three year period. Management has analyzed the fund’s tax positions taken on federal and state tax returns for all open tax years and does not believe that there are any uncertain tax positions that require recognition of a tax liability. Foreign taxes, if any, have been accrued by the fund in the accompanying financial statements in accordance with the applicable foreign tax law. Foreign income taxes may be withheld by certain countries in which the fund invests. Additionally, capital gains realized by the fund on securities issued in or by certain foreign countries may be subject to capital gains tax imposed by those countries.
Distributions to shareholders are recorded on the ex-dividend date. Income and capital gain distributions are determined in accordance with income tax regulations, which may differ from U.S. generally accepted accounting principles. Certain capital accounts in the financial statements are periodically adjusted for permanent differences in order to reflect their tax character. These adjustments have no impact on net assets or net asset value per share. Temporary differences which arise from recognizing certain items of income, expense, gain or loss in different periods for financial statement and tax purposes will reverse at some time in the future. Distributions in excess of net investment income or net realized gains are temporary overdistributions for financial statement purposes resulting from differences in the recognition or classification of income or distributions for financial statement and tax purposes.
Book/tax differences primarily relate to net operating losses and wash sale loss deferrals.
The tax character of distributions declared to shareholders for the last two fiscal years is as follows:
| | | | | | | | |
| | | 12/31/15 | | | 12/31/14 | |
| Ordinary income (including any short-term capital gains) | | | $11,579,972 | | | | $27,850,486 | |
| Long-term capital gains | | | 30,655,115 | | | | 22,848,104 | |
| Total distributions | | | $42,235,087 | | | | $50,698,590 | |
The federal tax cost and the tax basis components of distributable earnings were as follows:
| | | | |
| As of 12/31/15 | | | | |
| Cost of investments | | | $308,488,312 | |
| Gross appreciation | | | 119,927,382 | |
| Gross depreciation | | | (8,805,703 | ) |
| Net unrealized appreciation (depreciation) | | | $111,121,679 | |
| Undistributed long-term capital gain | | | 30,751,706 | |
| Capital loss carryforwards | | | (938,323 | ) |
| Other temporary differences | | | 139 | |
16
MFS Mid Cap Growth Series
Notes to Financial Statements – continued
Under the Regulated Investment Company Modernization Act of 2010 (the “Act”), net capital losses recognized for fund fiscal years beginning after December 31, 2010 may be carried forward indefinitely, and their character is retained as short-term and/or long-term losses (“post-enactment losses”). Previously, net capital losses were carried forward for eight years and treated as short-term losses (“pre-enactment losses”). As a transition rule, the Act requires that all post-enactment net capital losses be used before pre-enactment net capital losses.
As of December 31, 2015, the fund had capital loss carryforwards available to offset future realized gains. Such pre-enactment losses expire as follows:
Multiple Classes of Shares of Beneficial Interest – The fund offers multiple classes of shares, which differ in their respective distribution and/or service fees. The fund’s income, realized and unrealized gain (loss), and common expenses are allocated to shareholders based on the daily net assets of each class. Dividends are declared separately for each class. Differences in per share dividend rates are generally due to differences in separate class expenses. The fund’s distributions declared to shareholders as reported in the Statements of Changes in Net Assets are presented by class as follows:
| | | | | | | | |
| | | From net realized gain on
investments | |
| | | Year ended
12/31/15 | | | Year ended
12/31/14 | |
| Initial Class | | | $33,110,175 | | | | $40,428,769 | |
| Service Class | | | 9,124,912 | | | | 10,269,821 | |
| Total | | | $42,235,087 | | | | $50,698,590 | |
| (3) | | Transactions with Affiliates |
Investment Adviser – The fund has an investment advisory agreement with MFS to provide overall investment management and related administrative services and facilities to the fund. The management fee is computed daily and paid monthly at the following annual rates:
| | | | |
| First $1 billion of average daily net assets | | | 0.75% | |
| Average daily net assets in excess of $1 billion | | | 0.70% | |
MFS has agreed in writing to reduce its management fee by a specified amount if certain MFS mutual fund assets exceed thresholds agreed to by MFS and the fund’s Board of Trustees. For the year ended December 31, 2015, this management fee reduction amounted to $30,539, which is included in the reduction of total expenses in the Statement of Operations. The management fee incurred for the year ended December 31, 2015 was equivalent to an annual effective rate of 0.74% of the fund’s average daily net assets.
Distributor – MFS Fund Distributors, Inc. (MFD), a wholly-owned subsidiary of MFS, is the distributor of shares of the fund. The Trustees have adopted a distribution plan for the Service Class shares pursuant to Rule 12b-1 under the Investment Company Act of 1940.
The fund’s distribution plan provides that the fund will pay MFD distribution and/or service fees equal to 0.25% per annum of its average daily net assets attributable to Service Class shares as partial consideration for services performed and expenses incurred by MFD and financial intermediaries (including participating insurance companies that invest in the fund to fund variable annuity and variable life insurance contracts, sponsors of qualified retirement and pension plans that invest in the fund, and affiliates of these participating insurance companies and plan sponsors) in connection with the sale and distribution of the Service Class shares. MFD may subsequently pay all, or a portion, of the distribution and/or service fees to financial intermediaries.
Shareholder Servicing Agent – MFS Service Center, Inc. (MFSC), a wholly-owned subsidiary of MFS, receives a fee from the fund for its services as shareholder servicing agent. For the year ended December 31, 2015, the fee was $18,224, which equated to 0.0041% annually of the fund’s average daily net assets. MFSC also receives payment from the fund for out-of-pocket expenses paid by MFSC on behalf of the fund. For the year ended December 31, 2015, these costs amounted to $597.
Administrator – MFS provides certain financial, legal, shareholder communications, compliance, and other administrative services to the fund. Under an administrative services agreement, the fund reimburses MFS the costs incurred to provide these services. The fund is charged an annual fixed amount of $17,500 plus a fee based on average daily net assets. The administrative services fee incurred for the year ended December 31, 2015 was equivalent to an annual effective rate of 0.0178% of the fund’s average daily net assets.
Trustees’ and Officers’ Compensation – The fund pays compensation to independent Trustees in the form of a retainer, attendance fees, and additional compensation to Board and Committee chairpersons. The fund does not pay compensation directly
17
MFS Mid Cap Growth Series
Notes to Financial Statements – continued
to Trustees or officers of the fund who are also officers of the investment adviser, all of whom receive remuneration for their services to the fund from MFS. Certain officers and Trustees of the fund are officers or directors of MFS, MFD, and MFSC.
Other – This fund and certain other funds managed by MFS (the funds) have entered into a service agreement (the ISO Agreement) which provides for payment of fees solely by the funds to Tarantino LLC in return for the provision of services of an Independent Senior Officer (ISO) for the funds. Frank L. Tarantino serves as the ISO and is an officer of the funds and the sole member of Tarantino LLC. The funds can terminate the ISO Agreement with Tarantino LLC at any time under the terms of the ISO Agreement. For the year ended December 31, 2015, the fee paid by the fund under this agreement was $1,398 and is included in “Miscellaneous” expense in the Statement of Operations. MFS has agreed to bear all expenses associated with office space, other administrative support, and supplies provided to the ISO.
The fund invests in the MFS Institutional Money Market Portfolio which is managed by MFS and seeks current income consistent with preservation of capital and liquidity. Income earned on this investment is included in “Dividends from underlying affiliated funds” in the Statement of Operations. This money market fund does not pay a management fee to MFS.
For the year ended December 31, 2015, purchases and sales of investments, other than short-term obligations, aggregated $159,734,891 and $230,414,397, respectively.
| (5) | | Shares of Beneficial Interest |
The fund’s Declaration of Trust permits the Trustees to issue an unlimited number of full and fractional shares of beneficial interest. Transactions in fund shares were as follows:
| | | | | | | | | | | | | | | | |
| | | Year ended 12/31/15 | | | Year ended 12/31/14 | |
| | | Shares | | | Amount | | | Shares | | | Amount | |
| Shares sold | | | | | | | | | | | | | | | | |
Initial Class | | | 2,314,642 | | | | $19,663,750 | | | | 1,604,650 | | | | $14,214,872 | |
Service Class | | | 1,902,483 | | | | 16,016,393 | | | | 1,466,651 | | | | 12,683,994 | |
| | | 4,217,125 | | | | $35,680,143 | | | | 3,071,301 | | | | $26,898,866 | |
| Shares issued to shareholders in reinvestment of distributions | | | | | | | | | | | | | | | | |
Initial Class | | | 4,234,038 | | | | $33,110,175 | | | | 4,756,326 | | | | $40,428,769 | |
Service Class | | | 1,219,908 | | | | 9,124,912 | | | | 1,253,946 | | | | 10,269,821 | |
| | | 5,453,946 | | | | $42,235,087 | | | | 6,010,272 | | | | $50,698,590 | |
| Shares reacquired | | | | | | | | | | | | | | | | |
Initial Class | | | (8,536,082 | ) | | | $(76,384,073 | ) | | | (8,510,344 | ) | | | $(75,620,122 | ) |
Service Class | | | (2,580,067 | ) | | | (21,801,889 | ) | | | (2,594,228 | ) | | | (22,028,477 | ) |
| | | (11,116,149 | ) | | | $(98,185,962 | ) | | | (11,104,572 | ) | | | $(97,648,599 | ) |
| Net change | | | | | | | | | | | | | | | | |
Initial Class | | | (1,987,402 | ) | | | $(23,610,148 | ) | | | (2,149,368 | ) | | | $(20,976,481 | ) |
Service Class | | | 542,324 | | | | 3,339,416 | | | | 126,369 | | | | 925,338 | |
| | | (1,445,078 | ) | | | $(20,270,732 | ) | | | (2,022,999 | ) | | | $(20,051,143 | ) |
The fund is one of several mutual funds in which certain MFS funds may invest. The MFS funds do not invest in the underlying funds for the purpose of exercising management or control. At the end of the period, the MFS Moderate Allocation Portfolio, the MFS Growth Allocation Portfolio, and the MFS Conservative Allocation Portfolio were the owners of record of approximately 31%, 10%, and 7%, respectively, of the value of outstanding voting shares of the fund.
The fund and certain other funds managed by MFS participate in a $1.25 billion unsecured committed line of credit, subject to a $1 billion sublimit, provided by a syndication of banks under a credit agreement. Borrowings may be made for temporary financing needs. Interest is charged to each fund, based on its borrowings, generally at a rate equal to the higher of the Overnight Federal Reserve funds rate or daily one month LIBOR plus an agreed upon spread. A commitment fee, based on the average daily, unused portion of the committed line of credit, is allocated among the participating funds at the end of each calendar quarter. In addition, the fund and other funds managed by MFS have established unsecured uncommitted borrowing arrangements with certain banks for temporary financing needs. Interest is charged to each fund, based on its borrowings, at a rate equal to the Overnight Federal Reserve funds rate plus an agreed upon spread. For the year ended December 31, 2015, the fund’s commitment fee and interest expense were $1,474 and $0, respectively, and are included in “Miscellaneous” expense in the Statement of Operations.
18
MFS Mid Cap Growth Series
Notes to Financial Statements – continued
| (7) | | Transactions in Underlying Affiliated Funds – Affiliated Issuers |
An affiliated issuer may be considered one in which the fund owns 5% or more of the outstanding voting securities, or a company which is under common control. For the purposes of this report, the fund assumes the following to be an affiliated issuer:
| | | | | | | | | | | | | | |
| Underlying Affiliated Fund | | Beginning
Shares/Par
Amount | | Acquisitions
Shares/Par
Amount | | | Dispositions
Shares/Par
Amount | | | Ending
Shares/Par
Amount | |
| MFS Institutional Money Market Portfolio | | 2,561,591 | | | 112,241,848 | | | | (105,524,787 | ) | | | 9,278,652 | |
| | | | |
| Underlying Affiliated Fund | | Realized
Gain (Loss) | | Capital Gain
Distributions | | | Dividend
Income | | | Ending
Value | |
| MFS Institutional Money Market Portfolio | | $— | | | $— | | | | $6,258 | | | | $9,278,652 | |
19
MFS Mid Cap Growth Series
REPORT OF INDEPENDENT REGISTERED PUBLIC ACCOUNTING FIRM
To the Board of Trustees of MFS Variable Insurance Trust and the Shareholders of MFS Mid Cap Growth Series:
We have audited the accompanying statement of assets and liabilities, including the portfolio of investments, of MFS Mid Cap Growth Series (one of the series of MFS Variable Insurance Trust) (the “Fund”) as of December 31, 2015, and the related statement of operations for the year then ended, the statements of changes in net assets for each of the two years in the period then ended, and the financial highlights for each of the five years in the period then ended. These financial statements and financial highlights are the responsibility of the Fund’s management. Our responsibility is to express an opinion on these financial statements and financial highlights based on our audits.
We conducted our audits in accordance with the standards of the Public Company Accounting Oversight Board (United States). Those standards require that we plan and perform the audit to obtain reasonable assurance about whether the financial statements and financial highlights are free of material misstatement. The Fund is not required to have, nor were we engaged to perform, an audit of its internal control over financial reporting. Our audits included consideration of internal control over financial reporting as a basis for designing audit procedures that are appropriate in the circumstances, but not for the purpose of expressing an opinion on the effectiveness of the Fund’s internal control over financial reporting. Accordingly, we express no such opinion. An audit also includes examining, on a test basis, evidence supporting the amounts and disclosures in the financial statements, assessing the accounting principles used and significant estimates made by management, as well as evaluating the overall financial statement presentation. Our procedures included confirmation of securities owned as of December 31, 2015, by correspondence with the custodian and brokers; when replies were not received from brokers, we performed other auditing procedures. We believe that our audits provide a reasonable basis for our opinion.
In our opinion, such financial statements and financial highlights referred to above present fairly, in all material respects, the financial position of MFS Mid Cap Growth Series as of December 31, 2015, the results of its operations for the year then ended, the changes in its net assets for each of the two years in the period then ended, and the financial highlights for each of the five years in the period then ended, in conformity with accounting principles generally accepted in the United States of America.
DELOITTE & TOUCHE LLP
Boston, Massachusetts
February 16, 2016
20
MFS Mid Cap Growth Series
TRUSTEES AND OFFICERS – IDENTIFICATION AND BACKGROUND
The Trustees and Officers of the Trust, as of February 1, 2016, are listed below, together with their principal occupations during the past five years. (Their titles may have varied during that period.) The address of each Trustee and Officer is 111 Huntington Avenue, Boston, Massachusetts 02199-7618.
| | | | | | | | |
Name, Age | | Position(s)
Held with Fund | | Trustee/Officer
Since (h) | | Principal Occupations
During the Past Five Years | | Other Directorships (j) |
| INTERESTED TRUSTEES |
Robert J. Manning (k)
(age 52) | | Trustee | | February 2004 | | Massachusetts Financial Services Company, Chairman, Co-Chief Executive Officer and Director | | N/A |
| | | | |
Robin A. Stelmach (k) (age 54) | | Trustee and President | | January 2014 | | Massachusetts Financial Services Company, Executive Vice President and Chief Operating Officer | | N/A |
| | |
| INDEPENDENT TRUSTEES | | | | |
David H. Gunning
(age 73) | | Trustee and Chair of Trustees | | January 2004 | | Private investor | | Lincoln Electric Holdings, Inc., Director; Development Alternatives, Inc., Director/Non-Executive Chairman |
| | | | |
Steven E. Buller (age 64) | | Trustee | | February 2014 | | Chairman, Financial Accounting Standards Advisory Council; Standing Advisory Group, Public Company Accounting Oversight Board, Member (until 2014); BlackRock, Inc. (investment management), Managing Director (until 2014), BlackRock Finco UK (investment management), Director (until 2014) | | N/A |
| | | | |
Robert E. Butler
(age 74) | | Trustee | | January 2006 | | Consultant – investment company industry regulatory and compliance matters | | N/A |
| | | | |
Maureen R. Goldfarb (age 60) | | Trustee | | January 2009 | | Private investor | | N/A |
| | | | |
William R. Gutow
(age 74) | | Trustee | | December 1993 | | Private investor and real estate consultant; Capitol Entertainment Management Company (video franchise), Vice Chairman | | Texas Donuts, Vice Chairman (until 2010) |
| | | | |
Michael Hegarty
(age 71) | | Trustee | | December 2004 | | Private investor | | Rouse Properties Inc., Director; Capmark Financial Group Inc., Director |
| | | | |
John P. Kavanaugh (age 61) | | Trustee | | January 2009 | | Private investor | | N/A |
| | | | |
Maryanne L. Roepke (age 59) | | Trustee | | May 2014 | | American Century Investments (investment management), Senior Vice President and Chief Compliance Officer (until 2014) | | N/A |
| | | | |
Laurie J. Thomsen
(age 58) | | Trustee | | March 2005 | | Private investor | | The Travelers Companies, Director; Dycom Industries, Inc., Director |
| | | | |
Robert W. Uek
(age 74) | | Trustee | | January 2006 | | Consultant to investment company industry | | N/A |
| | | | |
| OFFICERS | | | | | | | | |
Christopher R. Bohane (k)
(age 42) | | Assistant Secretary and Assistant Clerk | | July 2005 | | Massachusetts Financial Services Company, Vice President and Assistant General Counsel | | N/A |
| | | | |
Kino Clark (k) (age 47) | | Assistant Treasurer | | January 2012 | | Massachusetts Financial Services Company, Vice President | | N/A |
| | | | |
Kristin V. Collins (k) (age 42) | | Assistant Secretary and Assistant Clerk | | September 2015 | | Massachusetts Financial Services Company, Vice President and Assistant General Counsel | | N/A |
| | | | |
Thomas H. Connors (k) (age 56) | | Assistant Secretary and Assistant Clerk | | September 2012 | | Massachusetts Financial Services Company, Vice President and Senior Counsel; Deutsche Investment Management Americas Inc. (financial service provider), Director and Senior Counsel (until 2012) | | N/A |
21
MFS Mid Cap Growth Series
Trustees and Officers – continued
| | | | | | | | |
Name, Age | | Position(s)
Held with Fund | | Trustee/Officer
Since (h) | | Principal Occupations
During the Past Five Years | | Other Directorships (j) |
Ethan D. Corey (k)
(age 52) | | Assistant Secretary and Assistant Clerk | | July 2005 | | Massachusetts Financial Services Company, Senior Vice President and Associate General Counsel | | N/A |
| | | | |
David L. DiLorenzo (k)
(age 47) | | Treasurer | | July 2005 | | Massachusetts Financial Services Company, Senior Vice President | | N/A |
| | | | |
Brian E. Langenfeld (k) (age 42) | | Assistant Secretary and Assistant Clerk | | June 2006 | | Massachusetts Financial Services Company, Vice President and Senior Counsel | | N/A |
| | | | |
Kenneth Paek (k) (age 41) | | Assistant Treasurer | | February 2015 | | Massachusetts Financial Services Company, Vice President; Cohen & Steers, Vice President/Head of Fund Administration (until 2014) | | N/A |
| | | | |
Susan A. Pereira (k)
(age 45) | | Assistant Secretary and Assistant Clerk | | July 2005 | | Massachusetts Financial Services Company, Vice President and Senior Counsel | | N/A |
| | | | |
Kasey L. Phillips (k) (age 45) | | Assistant Treasurer | | September 2012 | | Massachusetts Financial Services Company, Vice President; Wells Fargo Funds Management, LLC, Senior Vice President, Fund Treasurer (until 2012) | | N/A |
| | | | |
Mark N. Polebaum (k)
(age 63) | | Secretary and Clerk | | January 2006 | | Massachusetts Financial Services Company, Executive Vice President, General Counsel and Secretary | | N/A |
| | | | |
Matthew A. Stowe (k) (age 41) | | Assistant Secretary and Assistant Clerk | | October 2014 | | Massachusetts Financial Services Company, Vice President and Assistant General Counsel | | N/A |
| | | | |
Frank L. Tarantino
(age 71) | | Independent Senior Officer | | June 2004 | | Tarantino LLC (provider of compliance services), Principal | | N/A |
| | | | |
Richard S. Weitzel (k)
(age 45) | | Assistant Secretary and Assistant Clerk | | October 2007 | | Massachusetts Financial Services Company, Senior Vice President and Associate General Counsel | | N/A |
| | | | |
Martin J. Wolin (k) (age 48) | | Chief Compliance Officer | | July 2015 | | Massachusetts Financial Services Company, Senior Vice President and Chief Compliance Officer (since July 2015); Mercer (financial service provider), Chief Risk and Compliance Officer, North America and Latin America (until June 2015) | | N/A |
| | | | |
James O. Yost (k)
(age 55) | | Deputy Treasurer | | September 1990 | | Massachusetts Financial Services Company, Senior Vice President | | N/A |
| (h) | Date first appointed to serve as Trustee/officer of an MFS Fund. Each Trustee has served continuously since appointment unless indicated otherwise. For the period from December 15, 2004 until February 22, 2005, Mr. Manning served as Advisory Trustee. Prior to January 2012, Messrs. DiLorenzo and Yost served as Assistant Treasurers of the Funds. Ms. Stelmach was appointed as President of the Funds as of October 1, 2014. |
| (j) | Directorships or trusteeships of companies required to report to the Securities and Exchange Commission (i.e., “public companies”). |
| (k) | “Interested person” of the Trust within the meaning of the Investment Company Act of 1940 (referred to as the 1940 Act), which is the principal federal law governing investment companies like the fund, as a result of a position with MFS. The address of MFS is 111 Huntington Avenue, Boston, Massachusetts 02199-7618. |
Each Trustee (except Ms. Stelmach, Mr. Buller and Ms. Roepke) has been elected by shareholders and each Trustee and officer holds office until his or her successor is chosen and qualified or until his or her earlier death, resignation, retirement or removal. The Trust does not hold annual meetings for the purpose of electing Trustees, and Trustees are not elected for fixed terms. Messrs. Buller, Butler, Kavanaugh, Uek and Ms. Roepke are members of the Trust’s Audit Committee.
Each of the Fund’s Trustees and officers holds comparable positions with certain other funds of which MFS or a subsidiary is the investment adviser or distributor, and, in the case of the officers, with certain affiliates of MFS. As of February 1, 2016, the Trustees served as board members of 137 funds within the MFS Family of Funds.
22
MFS Mid Cap Growth Series
Trustees and Officers – continued
The Statement of Additional Information for a Fund includes further information about the Trustees and is available without charge upon request by calling 1-800-225-2606.
| | |
Investment Adviser Massachusetts Financial Services Company 111 Huntington Avenue Boston, MA 02199-7618 | | Custodian State Street Bank and Trust Company 1 Lincoln Street Boston, MA 02111-2900 |
Distributor MFS Fund Distributors, Inc. 111 Huntington Avenue Boston, MA 02199-7618 | | Independent Registered Public Accounting Firm Deloitte & Touche LLP 200 Berkeley Street Boston, MA 02116 |
Portfolio Managers Eric Fischman Paul Gordon Matthew Sabel | | |
23
MFS Mid Cap Growth Series
BOARD REVIEW OF INVESTMENT ADVISORY AGREEMENT
The Investment Company Act of 1940 requires that both the full Board of Trustees and a majority of the non-interested (“independent”) Trustees, voting separately, annually approve the continuation of the Fund’s investment advisory agreement with MFS. The Trustees consider matters bearing on the Fund and its advisory arrangements at their meetings throughout the year, including a review of performance data at each regular meeting. In addition, the independent Trustees met several times over the course of three months beginning in May and ending in July, 2015 (“contract review meetings”) for the specific purpose of considering whether to approve the continuation of the investment advisory agreement for the Fund and the other investment companies that the Board oversees (the “MFS Funds”). The independent Trustees were assisted in their evaluation of the Fund’s investment advisory agreement by independent legal counsel, from whom they received separate legal advice and with whom they met separately from MFS during various contract review meetings. The independent Trustees were also assisted in this process by the MFS Funds’ Independent Senior Officer, a senior officer appointed by and reporting to the independent Trustees.
In connection with their deliberations regarding the continuation of the investment advisory agreement, the Trustees, including the independent Trustees, considered such information and factors as they believed, in light of the legal advice furnished to them and their own business judgment, to be relevant. The investment advisory agreement for the Fund was considered separately, although the Trustees also took into account the common interests of all MFS Funds in their review. As described below, the Trustees considered the nature, quality, and extent of the various investment advisory, administrative, and shareholder services performed by MFS under the existing investment advisory agreement and other arrangements with the Fund.
In connection with their contract review meetings, the Trustees received and relied upon materials that included, among other items: (i) information provided by Lipper Inc., an independent third party, on the investment performance of the Fund for various time periods ended December 31, 2014 and the investment performance of a group of funds with substantially similar investment classifications/objectives (the “Lipper performance universe”), (ii) information provided by Lipper Inc. on the Fund’s advisory fees and other expenses and the advisory fees and other expenses of comparable funds identified by Lipper Inc. (the “Lipper expense group”), (iii) information provided by MFS on the advisory fees of comparable portfolios of other clients of MFS, including institutional separate accounts and other clients, (iv) information as to whether and to what extent applicable expense waivers, reimbursements or fee “breakpoints” are observed for the Fund, (v) information regarding MFS’ financial results and financial condition, including MFS’ and certain of its affiliates’ estimated profitability from services performed for the Fund and the MFS Funds as a whole, and compared to MFS’ institutional business, (vi) MFS’ views regarding the outlook for the mutual fund industry and the strategic business plans of MFS, (vii) descriptions of various functions performed by MFS for the Funds, such as compliance monitoring and portfolio trading practices, and (viii) information regarding the overall organization of MFS, including information about MFS’ senior management and other personnel providing investment advisory, administrative and other services to the Fund and the other MFS Funds. The comparative performance, fee and expense information prepared and provided by Lipper Inc. was not independently verified and the independent Trustees did not independently verify any information provided to them by MFS.
The Trustees’ conclusion as to the continuation of the investment advisory agreement was based on a comprehensive consideration of all information provided to the Trustees and not the result of any single factor. Some of the factors that figured particularly in the Trustees’ deliberations are described below, although individual Trustees may have evaluated the information presented differently from one another, giving different weights to various factors. It is also important to recognize that the fee arrangements for the Fund and other MFS Funds are the result of years of review and discussion between the independent Trustees and MFS, that certain aspects of such arrangements may receive greater scrutiny in some years than in others, and that the Trustees’ conclusions may be based, in part, on their consideration of these same arrangements during the course of the year and in prior years.
Based on information provided by Lipper Inc. and MFS, the Trustees reviewed the Fund’s total return investment performance as well as the performance of peer groups of funds over various time periods. The Trustees placed particular emphasis on the total return performance of the Fund’s Initial Class shares in comparison to the performance of funds in its Lipper performance universe over the three-year period ended December 31, 2014, which the Trustees believed was a long enough period to reflect differing market conditions. The total return performance of the Fund’s Initial Class shares was in the 2nd quintile relative to the other funds in the universe for this three-year period (the 1st quintile being the best performers and the 5th quintile being the worst performers). The total return performance of the Fund’s Initial Class shares was in the 3rd quintile for the one-year period and the 2nd quintile for the five-year period ended December 31, 2014 relative to the Lipper performance universe. Because of the passage of time, these performance results may differ from the performance results for more recent periods, including those shown elsewhere in this report.
In the course of their deliberations, the Trustees took into account information provided by MFS in connection with the contract review meetings, as well as during investment review meetings conducted with portfolio management personnel during the course of the year regarding the Fund’s performance. After reviewing these and related factors, the Trustees concluded, within the context of their overall conclusions regarding the investment advisory agreement, that they were satisfied with MFS’ responses and efforts relating to investment performance.
24
MFS Mid Cap Growth Series
Board Review of Investment Advisory Agreement – continued
In assessing the reasonableness of the Fund’s advisory fee, the Trustees considered, among other information, the Fund’s advisory fee and the total expense ratio of the Fund’s Initial Class shares as a percentage of average daily net assets and the advisory fee and total expense ratios of peer groups of funds based on information provided by Lipper Inc. The Trustees considered that, according to the Lipper data (which takes into account any fee reductions or expense limitations that were in effect during the Fund’s last fiscal year), the Fund’s effective advisory fee rate and total expense ratio were each approximately at the Lipper expense group median.
The Trustees also considered the advisory fees charged by MFS to any institutional separate accounts advised by MFS (“separate accounts”) and unaffiliated investment companies for which MFS serves as subadviser (“subadvised funds”) that have comparable investment strategies to the Fund. In comparing these fees, the Trustees considered information provided by MFS as to the generally broader scope of services provided by MFS to the Fund, as well as the more extensive regulatory burdens imposed on MFS in managing the Fund, in comparison to separate accounts and subadvised funds. The Trustees also considered the higher demands placed on MFS’ investment personnel and trading infrastructure as a result of the daily cash in-flows and out-flows of the Fund in comparison to separate accounts.
The Trustees also considered whether the Fund may benefit from any economies of scale in the management of the Fund in the event of growth in assets of the Fund and/or growth in assets of the MFS Funds as a whole. They noted that the Fund’s advisory fee rate schedule is subject to a contractual breakpoint that reduces the Fund’s advisory fee rate on average daily net assets over $1 billion. The Trustees also noted that MFS has agreed in writing to waive a portion of the management fees of certain MFS Funds, including the Fund, if the total combined assets of certain funds within the MFS Funds’ complex increase above agreed upon thresholds (the “group fee waiver”), enabling the Fund’s shareholders to share in the benefits from any economies of scale at the complex level. The group fee waiver is reviewed and renewed annually between the Board and MFS. The Trustees concluded that the breakpoint and the group fee waiver were sufficient to allow the Fund to benefit from economies of scale as its assets and overall complex assets grow.
The Trustees also considered information prepared by MFS relating to MFS’ costs and profits with respect to the Fund, the MFS Funds considered as a group, and other investment companies and accounts advised by MFS, as well as MFS’ methodologies used to determine and allocate its costs to the MFS Funds, the Fund and other accounts and products for purposes of estimating profitability.
After reviewing these and other factors described herein, the Trustees concluded, within the context of their overall conclusions regarding the investment advisory agreement, that the advisory fees charged to the Fund represent reasonable compensation in light of the services being provided by MFS to the Fund.
In addition, the Trustees considered MFS’ resources and related efforts to continue to retain, attract and motivate capable personnel to serve the Fund. The Trustees also considered current and developing conditions in the financial services industry, including the presence of large and well-capitalized companies which are spending, and appear to be prepared to continue to spend, substantial sums to engage personnel and to provide services to competing investment companies. In this regard, the Trustees also considered the financial resources of MFS and its ultimate parent, Sun Life Financial Inc. The Trustees also considered the advantages and possible disadvantages to the Fund of having an adviser that also serves other investment companies as well as other accounts.
The Trustees also considered the nature, quality, cost, and extent of administrative, transfer agency, and distribution services provided to the Fund by MFS and its affiliates under agreements and plans other than the investment advisory agreement, including any 12b-1 fees the Fund pays to MFS Fund Distributors, Inc., an affiliate of MFS. The Trustees also considered the nature, extent and quality of certain other services MFS performs or arranges for on the Fund’s behalf, which may include securities lending programs, directed expense payment programs, class action recovery programs, and MFS’ interaction with third-party service providers, principally custodians and sub-custodians. The Trustees concluded that the various non-advisory services provided by MFS and its affiliates on behalf of the Fund were satisfactory.
The Trustees also considered benefits to MFS from the use of the Fund’s portfolio brokerage commissions, if applicable, to pay for investment research and various other factors. Additionally, the Trustees considered so-called “fall-out benefits” to MFS such as reputational value derived from serving as investment manager to the Fund.
Based on their evaluation of factors that they deemed to be material, including those factors described above, the Board of Trustees, including the independent Trustees, concluded that the Fund’s investment advisory agreement with MFS should be continued for an additional one-year period, commencing August 1, 2015.
25
MFS Mid Cap Growth Series
PROXY VOTING POLICIES AND INFORMATION
MFS votes proxies on behalf of the fund pursuant to proxy voting policies and procedures that are available without charge, upon request, by calling 1-800-225-2606, by visiting the Proxy Voting section of mfs.com or by visiting the SEC’s Web site at http://www.sec.gov.
Information regarding how the fund voted proxies relating to portfolio securities during the most recent twelve-month period ended June 30 is available without charge by visiting the Proxy Voting section of mfs.com or by visiting the SEC’s Web site at http://www.sec.gov.
QUARTERLY PORTFOLIO DISCLOSURE
The fund will file a complete schedule of portfolio holdings with the Securities and Exchange Commission (the Commission) for the first and third quarters of each fiscal year on Form N-Q. The fund’s Form N-Q is available on the EDGAR database on the Commission’s Internet Web site at http://www.sec.gov, and may be reviewed and copied at the:
Public Reference Room
Securities and Exchange Commission
100 F Street, NE, Room 1580
Washington, D.C. 20549
Information on the operation of the Public Reference Room may be obtained by calling the Commission at 1-800-SEC-0330. Copies of the fund’s Form N-Q also may be obtained, upon payment of a duplicating fee, by electronic request at the following e-mail address: publicinfo@sec.gov or by writing the Public Reference Section at the above address.
FURTHER INFORMATION
From time to time, MFS may post important information about the fund or the MFS funds on the MFS web site (mfs.com). This information is available by visiting the “Market Commentary” and “Announcements” sub sections in the “Market Outlooks” section of mfs.com or by clicking on the fund’s name under “Variable Insurance Portfolios — VIT” in the “Products” section of mfs.com.
FEDERAL TAX INFORMATION (unaudited)
The following information is provided pursuant to provisions of the Internal Revenue Code.
The fund designates $33,721,000 as capital gain dividends paid during the fiscal year.
For corporate shareholders, 15.68% of the ordinary income dividends paid during the fiscal year qualify for the corporate dividends received deduction.
26
rev. 3/11
| | | | |
| FACTS | | WHAT DOES MFS DO WITH YOUR
PERSONAL INFORMATION? | |  |
| | |
| Why? | | Financial companies choose how they share your personal information. Federal law gives consumers the right to limit some but not all sharing. Federal law also requires us to tell you how we collect, share, and protect your personal information. Please read this notice carefully to understand what we do. |
| | |
| What? | | The types of personal information we collect and share depend on the product or service you have with us. This information can include: • Social Security number and account balances • Account transactions and transaction history • Checking account information and wire transfer instructions When you are no longer our customer, we continue to share your information as described in this notice. |
| | |
| How? | | All financial companies need to share customers’ personal information to run their everyday business. In the section below, we list the reasons financial companies can share their customers’ personal information; the reasons MFS chooses to share; and whether you can limit this sharing. |
| | | | |
Reasons we can share your
personal information | | Does MFS share? | | Can you limit this
sharing? |
For our everyday business purposes – such as to process your transactions, maintain your account(s), respond to court orders and legal investigations, or report to credit bureaus | | Yes | | No |
For our marketing purposes – to offer our products and services to you | | No | | We don’t share |
| For joint marketing with other financial companies | | No | | We don’t share |
For our affiliates’ everyday business purposes – information about your transactions and experiences | | No | | We don’t share |
For our affiliates’ everyday business purposes – information about your creditworthiness | | No | | We don’t share |
| For nonaffiliates to market to you | | No | | We don’t share |
| | |
| Questions? | | Call 800-225-2606 or go to mfs.com. |
27
| | |
| Who we are |
| Who is providing this notice? | | MFS Funds, MFS Investment Management, MFS Institutional Advisors, Inc., MFS Fund Distributors, Inc., MFS Heritage Trust Company, and MFS Service Center, Inc. |
| | |
| What we do |
| How does MFS protect my personal information? | | To protect your personal information from unauthorized access and use, we use security measures that comply with federal law. These measures include procedural, electronic, and physical safeguards for the protection of the personal information we collect about you. |
How does MFS
collect my personal information? | | We collect your personal information, for example, when you • open an account or provide account information • direct us to buy securities or direct us to sell your securities • make a wire transfer We also collect your personal information from others, such as credit bureaus, affiliates and other companies. |
| Why can’t I limit all sharing? | | Federal law gives you the right to limit only • sharing for affiliates’ everyday business purposes – information about your creditworthiness • affiliates from using your information to market to you • sharing for nonaffiliates to market to you State laws and individual companies may give you additional rights to limit sharing. |
| | |
| Definitions |
| Affiliates | | Companies related by common ownership or control. They can be financial and nonfinancial companies. • MFS does not share personal information with affiliates, except for everyday business purposes as described on page one of this notice. |
| Nonaffiliates | | Companies not related by common ownership or control. They can be financial and nonfinancial companies. • MFS does not share with nonaffiliates so they can market to you. |
| Joint Marketing | | A formal agreement between nonaffiliated financial companies that together market financial products or services to you. • MFS doesn’t jointly market. |
| | |
| Other important information |
| If you own an MFS product or receive an MFS service in the name of a third party such as a bank or broker-dealer, their privacy policy may apply to you instead of ours. |
28
ANNUAL REPORT
December 31, 2015

MFS® NEW DISCOVERY SERIES
MFS® Variable Insurance Trust

VND-ANN
MFS® NEW DISCOVERY SERIES
CONTENTS
The report is prepared for the general information of contract owners. It is authorized for distribution to prospective investors only when preceded or accompanied by a current prospectus.
NOT FDIC INSURED • MAY LOSE VALUE • NO BANK OR CREDIT UNION GUARANTEE • NOT A DEPOSIT • NOT INSURED BY ANY FEDERAL GOVERNMENT AGENCY OR NCUA/NCUSIF
MFS New Discovery Series
LETTER FROM THE CHAIRMAN

Dear Contract Owners:
Central bank policies remain center stage as the U.S. Federal Reserve made good on its pledge to raise policy rates for the first time in over nine years at its December meeting. The Fed’s actions stand in stark contrast to those of the European Central Bank and Bank of Japan, which modestly extended their quantitative easing programs in December.
In the United States, auto sales remain a source of economic strength, but housing demand has slowed of late. The U.S. economic expansion remains moderate but uneven, with a strong dollar crimping demand for U.S. goods abroad. China’s shift to a consumer-led economy continues to weigh on its manufacturing and exports, as does weak global demand. Slackening demand from China continues to undermine commodity markets, with oil particularly impacted amid a global supply glut.
As markets have become more focused on short-term trends in recent years, we believe it’s important for investors to lengthen their investment time horizon. At MFS®, we don’t trade on headlines or trends; we invest for the long term.
We believe that this approach, coupled with the professional guidance of a financial advisor, will help you reach your investment goals.
Respectfully,

Robert J. Manning
Chairman
MFS Investment Management
February 16, 2016
The opinions expressed in this letter are subject to change and may not be relied upon for investment advice. No forecasts can be guaranteed.
1
MFS New Discovery Series
PORTFOLIO COMPOSITION
Portfolio structure

| | | | |
| Top ten holdings | | | | |
| Bright Horizons Family Solutions, Inc. | | | 3.1% | |
| Gartner, Inc. | | | 2.6% | |
| SS&C Technologies Holdings, Inc. | | | 2.1% | |
| Healthcare Services Group, Inc. | | | 2.0% | |
| AMETEK, Inc. | | | 1.8% | |
| Masimo Corp. | | | 1.8% | |
| Sabre Corp. | | | 1.7% | |
| Steris PLC | | | 1.7% | |
| Cvent, Inc. | | | 1.7% | |
| Live Nation, Inc. | | | 1.7% | |
| | | | |
| Equity sectors | | | | |
| Health Care | | | 26.1% | |
| Technology | | | 16.1% | |
| Special Products & Services | | | 14.0% | |
| Leisure | | | 7.1% | |
| Industrial Goods & Services | | | 6.9% | |
| Autos & Housing | | | 5.5% | |
| Retailing | | | 5.3% | |
| Financial Services | | | 4.5% | |
| Basic Materials | | | 3.8% | |
| Consumer Staples | | | 3.5% | |
| Transportation | | | 2.2% | |
| Energy | | | 1.8% | |
Cash & Cash Equivalents includes any cash, investments in money market funds, short-term securities, and other assets less liabilities. Please see the Statement of Assets and Liabilities for additional information related to the fund’s cash position and other assets and liabilities.
Percentages are based on net assets as of 12/31/15.
The portfolio is actively managed and current holdings may be different.
2
MFS New Discovery Series
MANAGEMENT REVIEW
Summary of Results
For the twelve months ended December 31, 2015, Initial Class shares of the MFS New Discovery Series (“fund”) provided a total return of –1.89%, while Service Class shares of the fund provided a total return of –2.15%. These compare with a return of –1.38% over the same period for the fund’s benchmark, the Russell 2000 Growth Index.
Market Environment
Sluggish global growth weighed on both developed and emerging market (“EM”) economies during the reporting period. EM economies have been particularly lackluster. While the US Federal Reserve began its anticipated monetary policy tightening cycle at the end of the period, other large developed economies continued to embrace accommodative monetary policies, particularly the European Central Bank and the Bank of Japan. Focus remained on China after policy missteps by the Chinese government roiled global markets over the summer, beginning with the uncoordinated response to the stock market’s boom and bust and then the confusing decision to devalue the renminbi in August. China subsequently ramped up a wide range of monetary and fiscal measures to stimulate the economy and bolster sentiment. Its economy appeared to stabilize late in the period. Also at the end of the period, the Chinese renminbi was granted reserve currency status by the International Monetary Fund (“IMF”), which announced its inclusion in the IMF’s Special Drawing Rights currency basket effective October 1, 2016.
During the second half of the reporting period, the US faced an earnings recession caused primarily by the sharp decline in the prices of oil and other commodities. Earnings contractions were concentrated primarily in the energy, materials and industrial sectors. An additional headwind for earnings was the sharp rise in the US dollar over the period. Exports were crimped by the dollar’s strength and falling demand in emerging markets. Consumer spending held up well during the second half of the period amid a modest increase in real wages and a tailwind from falling gasoline prices. Demand for autos reached near-record territory late in the period. In emerging markets, two key factors weighed on economies and asset prices: 1) weaker Chinese growth, which drove the decline in commodity prices and 2) prospects for higher US interest rates. Structural factors like floating exchange rates and fiscal buffers partially offset these cyclical headwinds.
Detractors from Performance
Stock selection in the transportation sector detracted from performance relative to the Russell 2000 Growth Index. Within this sector, an overweight position in truckload carrier company Swift Transport dampened relative results.
Security selection in the consumer staples sector also hurt relative results. The fund’s overweight position in pet food producer Freshpet detracted from relative performance after the company reported weaker-than-expected earnings and lowered guidance for 2015.
Stock selection in the retailing sector further weighed on relative returns. Within this sector, an overweight position in flooring company Lumber Liquidators (h) weighed on relative results. Shares of Lumber Liquidators fell after a negative story on 60 Minutes helped to impair the company’s brand. The piece alleged that an independent study found elevated levels of formaldehyde in its laminate wood flooring that came from China were well beyond the legal limits in the state of California.
Security selection in the health care sector was another detractor from relative performance. Most notably, the fund’s position in senior’s residences operator Brookdale Senior Living (b) held back relative performance. Shares of biopharmaceutical company Aratana Therapeutics and not holding biopharmaceutical company Dyax Corporation also weakened relative results.
Other top relative detractors during the period included holding shares of 3D printer manufacturer Stratasys (b)(h) and online forex trading broker FXCM (b)(h). Additionally, overweight positions in hotels operator and franchisor La Quinta and online marketing company Constant Contact (h) further detracted from relative performance.
Contributors to Performance
Strong stock selection in the technology sector benefited relative returns. Within this sector, the fund’s holdings of technology solutions provider Sabre (b) and an overweight position in fleet management solutions provider Fleetmatics Group bolstered relative results.
An overweight position and security selection in the special products & services sector also contributed to relative returns. Within this sector, an overweight position in child-care provider Bright Horizons and the fund’s holdings of residential and commercial services provider ServiceMaster (b) and payment solutions provider Global Payments (b) supported relative returns. Shares of Bright Horizons appreciated after cost management measures and the closing of underperforming locations boosted bottom-line results. Steady enrollment gains and new ramping centers also added value.
Stocks in other sectors that benefited relative results included overweight positions in medical technology company Masimo, pharmaceutical company TherapeuticsMD, clinical research company INC Research, restaurants operator Chuy’s and biopharmaceutical company Receptos (h). Shares of Masimo appreciated as the company reported solid earnings results during the period, driven by strong sales, product revenue growth, and controlled operating expenses.
3
MFS New Discovery Series
Management Review – continued
Respectfully,
| | |
| Paul Gordon | | Michael Grossman |
| Portfolio Manager | | Portfolio Manager |
| (b) | Security is not a benchmark constituent. |
| (h) | Security was not held in the portfolio at period end. |
The views expressed in this report are those of the portfolio managers only through the end of the period of the report as stated on the cover and do not necessarily reflect the views of MFS or any other person in the MFS organization. These views are subject to change at any time based on market or other conditions, and MFS disclaims any responsibility to update such views. These views may not be relied upon as investment advice or an indication of trading intent on behalf of any MFS portfolio. References to specific securities are not recommendations of such securities, and may not be representative of any MFS portfolio’s current or future investments.
4
MFS New Discovery Series
PERFORMANCE SUMMARY THROUGH 12/31/15
The following chart illustrates the historical performance of the fund in comparison to its benchmark(s). Benchmarks are unmanaged and may not be invested in directly. Benchmark returns do not reflect any fees or expenses. The performance of other share classes will be greater than or less than that of the class depicted below. (See Notes to Performance Summary.)
Performance data shown represents past performance and is no guarantee of future results. Investment return and principal value fluctuate so your units, when sold, may be worth more or less than the original cost; current performance may be lower or higher than quoted. The performance shown does not reflect the deduction of taxes, if any, that a contract holder would pay on fund distributions or the redemption of contract units. The returns for the fund shown also do not reflect the deduction of expenses associated with variable products, such as mortality and expense risk charges, separate account charges, and sales charges imposed by the insurance company separate accounts. Such expenses would reduce the overall returns shown.
Growth of a Hypothetical $10,000 Investment

Total Returns through 12/31/15
Average annual total returns
| | | | | | | | | | | | |
| | | Share Class | | Class Inception Date | | 1-yr | | 5-yr | | 10-yr | | |
| | | Initial Class | | 5/01/98 | | (1.89)% | | 6.97% | | 8.18% | | |
| | | Service Class | | 5/01/00 | | (2.15)% | | 6.70% | | 7.90% | | |
| | | | |
| Comparative benchmark | | | | | | | | |
| | | Russell 2000 Growth Index (f) | | (1.38)% | | 10.67% | | 7.95% | | |
| (f) | Source: FactSet Research Systems Inc. |
Benchmark Definition
Russell 2000 Growth Index – constructed to provide a comprehensive barometer for growth securities in the small-cap segment of the U.S. equity universe. Companies in this index generally have higher price-to-book ratios and higher forecasted growth values.
It is not possible to invest directly in an index.
Notes to Performance Summary
Average annual total return represents the average annual change in value for each share class for the periods presented.
Performance results reflect any applicable expense subsidies and waivers in effect during the periods shown. Without such subsidies and waivers the fund’s performance results would be less favorable. Please see the prospectus and financial statements for complete details. All results are historical and assume the reinvestment of any dividends and capital gains distributions.
Performance results do not include adjustments made for financial reporting purposes in accordance with U.S. generally accepted accounting principles and may differ from amounts reported in the financial highlights.
From time to time the fund may receive proceeds from litigation settlements, without which performance would be lower.
5
MFS New Discovery Series
EXPENSE TABLE
Fund Expenses Borne by the Contract Holders during the Period,
July 1, 2015 through December 31, 2015
As a contract holder of the fund, you incur ongoing costs, including management fees; distribution and/or service (12b-1) fees; and other fund expenses. This example is intended to help you understand your ongoing costs (in dollars) of investing in the fund and to compare these costs with the ongoing costs of investing in other mutual funds.
The example is based on an investment of $1,000 invested at the beginning of the period and held for the entire period July 1, 2015 through December 31, 2015.
Actual Expenses
The first line for each share class in the following table provides information about actual account values and actual expenses. You may use the information in this line, together with the amount you invested, to estimate the expenses that you paid over the period. Simply divide your account value by $1,000 (for example, an $8,600 account value divided by $1,000 = 8.6), then multiply the result by the number in the first line under the heading entitled “Expenses Paid During Period” to estimate the expenses you paid on your account during this period.
Hypothetical Example for Comparison Purposes
The second line for each share class in the following table provides information about hypothetical account values and hypothetical expenses based on the fund’s actual expense ratio and an assumed rate of return of 5% per year before expenses, which is not the fund’s actual return. The hypothetical account values and expenses may not be used to estimate the actual ending account balance or expenses you paid for the period. You may use this information to compare the ongoing costs of investing in the fund and other funds. To do so, compare this 5% hypothetical example with the 5% hypothetical examples that appear in the shareholder reports of the other funds.
Please note that the expenses shown in the table are meant to highlight the fund’s ongoing costs only and do not take into account the fees and expenses imposed under the variable contracts through which your investment in the fund is made. Therefore, the second line for each share class in the table is useful in comparing ongoing costs associated with an investment in vehicles (such as the fund) which fund benefits under variable annuity and variable life insurance contracts and to qualified pension and retirement plans only, and will not help you determine the relative total costs of investing in the fund through variable annuity and variable life insurance contracts. If the fees and expenses imposed under the variable contracts were included, your costs would have been higher.
| | | | | | | | | | | | | | | | | | |
| Share Class | | | | Annualized
Expense Ratio | | | Beginning
Account Value
7/01/15 | | | Ending Account Value
12/31/15 | | | Expenses Paid
During Period (p)
7/01/15-12/31/15 | |
| Initial Class | | Actual | | | 0.94% | | | | $1,000.00 | | | | $897.05 | | | | $4.49 | |
| | Hypothetical (h) | | | 0.94% | | | | $1,000.00 | | | | $1,020.47 | | | | $4.79 | |
| Service Class | | Actual | | | 1.19% | | | | $1,000.00 | | | | $895.98 | | | | $5.69 | |
| | Hypothetical (h) | | | 1.19% | | | | $1,000.00 | | | | $1,019.21 | | | | $6.06 | |
| (h) | 5% class return per year before expenses. |
| (p) | “Expenses Paid During Period” are equal to each class’s annualized expense ratio, as shown above, multiplied by the average account value over the period, multiplied by 184/365 (to reflect the one-half year period). |
6
MFS New Discovery Series
PORTFOLIO OF INVESTMENTS – 12/31/15
The Portfolio of Investments is a complete list of all securities owned by your fund. It is categorized by broad-based asset classes.
| | | | | | | | |
| Issuer | | Shares/Par | | | Value ($) | |
| | | | | | | | |
| COMMON STOCKS – 96.8% | | | | | |
| Automotive – 0.7% | | | | | | | | |
| Fenix Parts, Inc. (a) | | | 737,891 | | | $ | 5,010,277 | |
| | | | | | | | |
| Biotechnology – 4.4% | | | | | | | | |
| Aduro Biotech, Inc. (a)(l) | | | 53,859 | | | $ | 1,515,592 | |
| Alder Biopharmaceuticals, Inc. (a) | | | 50,953 | | | | 1,682,978 | |
| Alnylam Pharmaceuticals, Inc. (a) | | | 26,236 | | | | 2,469,857 | |
| AMAG Pharmaceuticals, Inc. (a) | | | 145,814 | | | | 4,402,125 | |
| Amicus Therapeutics, Inc. (a) | | | 238,560 | | | | 2,314,032 | |
| Chiasma, Inc. (a) | | | 84,875 | | | | 1,661,004 | |
| Esperion Therapeutics, Inc. (a)(l) | | | 45,379 | | | | 1,010,137 | |
| Exact Sciences Corp. (a)(l) | | | 185,797 | | | | 1,714,906 | |
| MiMedx Group, Inc. (a)(l) | | | 348,137 | | | | 3,262,044 | |
| NantKwest, Inc. (a)(l) | | | 62,219 | | | | 1,078,255 | |
| Novavax, Inc. (a) | | | 208,845 | | | | 1,752,210 | |
| Seres Therapeutics, Inc. (a)(l) | | | 46,807 | | | | 1,642,458 | |
| Tesaro, Inc. (a) | | | 94,598 | | | | 4,949,367 | |
| VTV Therapeutics, Inc. (a) | | | 154,412 | | | | 1,051,546 | |
| | | | | | | | |
| | | $ | 30,506,511 | |
| | | | | | | | |
| Broadcasting – 1.7% | | | | | | | | |
| Live Nation, Inc. (a) | | | 476,277 | | | $ | 11,702,126 | |
| | | | | | | | |
| Brokerage & Asset Managers – 1.3% | | | | | |
| NASDAQ, Inc. | | | 157,926 | | | $ | 9,186,555 | |
| | | | | | | | |
| Business Services – 10.7% | | | | | | | | |
| Bright Horizons Family Solutions, Inc. (a) | | | 322,422 | | | $ | 21,537,790 | |
| CoStar Group, Inc. (a) | | | 40,193 | | | | 8,307,491 | |
| Gartner, Inc. (a) | | | 201,023 | | | | 18,232,786 | |
| Global Payments, Inc. | | | 135,334 | | | | 8,730,396 | |
| Ultimate Software Group, Inc. (a) | | | 38,287 | | | | 7,485,491 | |
| Univar, Inc. (a) | | | 328,307 | | | | 5,584,502 | |
| WNS (Holdings) Ltd., ADR (a) | | | 164,662 | | | | 5,135,808 | |
| | | | | | | | |
| | | $ | 75,014,264 | |
| | | | | | | | |
| Computer Software – 1.1% | | | | | | | | |
| Cadence Design Systems, Inc. (a) | | | 223,967 | | | $ | 4,660,753 | |
| Cornerstone OnDemand, Inc. (a) | | | 91,822 | | | | 3,170,614 | |
| | | | | | | | |
| | | $ | 7,831,367 | |
| | | | | | | | |
| Computer Software – Systems – 11.9% | | | | | |
| 2U, Inc. (a)(l) | | | 208,784 | | | $ | 5,841,776 | |
| Cvent, Inc. (a) | | | 335,914 | | | | 11,726,758 | |
| Demandware, Inc. (a) | | | 87,037 | | | | 4,697,387 | |
| Fleetmatics Group PLC (a) | | | 94,539 | | | | 4,801,636 | |
| Model N, Inc. (a) | | | 652,658 | | | | 7,283,663 | |
| NICE Systems Ltd., ADR | | | 119,249 | | | | 6,835,353 | |
| Proofpoint, Inc. (a) | | | 55,902 | | | | 3,634,189 | |
| Pure Storage, Inc. (a)(l) | | | 99,703 | | | | 1,552,376 | |
| Rapid7, Inc. (a)(l) | | | 295,449 | | | | 4,470,143 | |
| Sabre Corp. | | | 432,025 | | | | 12,083,739 | |
| ServiceNow, Inc. (a) | | | 72,364 | | | | 6,263,828 | |
| SS&C Technologies Holdings, Inc. | | | 213,027 | | | | 14,543,353 | |
| | | | | | | | |
| | | $ | 83,734,201 | |
| | | | | | | | |
| | | | | | | | |
| Issuer | | Shares/Par | | | Value ($) | |
| | | | | | | | |
| COMMON STOCKS – continued | | | | | |
| Construction – 4.8% | | | | | | | | |
| Interface, Inc. | | | 432,778 | | | $ | 8,283,371 | |
| Lennox International, Inc. | | | 63,590 | | | | 7,942,391 | |
| Pool Corp. | | | 87,413 | | | | 7,061,222 | |
| Summit Materials, Inc., “A” (a) | | | 368,381 | | | | 7,382,356 | |
| Trex Co., Inc. (a) | | | 82,284 | | | | 3,130,083 | |
| | | | | | | | |
| | | $ | 33,799,423 | |
| | | | | | | | |
| Consumer Services – 2.4% | | | | | |
| Nord Anglia Education, Inc. (a) | | | 364,799 | | | $ | 7,398,124 | |
| Servicemaster Global Holdings, Inc. (a) | | | 240,626 | | | | 9,442,164 | |
| | | | | | | | |
| | | $ | 16,840,288 | |
| | | | | | | | |
| Containers – 0.7% | | | | | |
| Berry Plastics Group, Inc. (a) | | | 139,861 | | | $ | 5,060,171 | |
| | | | | | | | |
| Electrical Equipment – 3.0% | | | | | |
| Advanced Drainage Systems, Inc. | | | 208,951 | | | $ | 5,021,093 | |
| AMETEK, Inc. | | | 234,569 | | | | 12,570,553 | |
| MSC Industrial Direct Co., Inc., “A” | | | 58,437 | | | | 3,288,250 | |
| | | | | | | | |
| | | $ | 20,879,896 | |
| | | | | | | | |
| Electronics – 2.1% | | | | | |
| Iriso Electronics Co. Ltd. | | | 33,331 | | | $ | 1,869,408 | |
| Monolithic Power Systems, Inc. | | | 96,976 | | | | 6,178,341 | |
| Silicon Laboratories, Inc. (a) | | | 130,091 | | | | 6,314,617 | |
| | | | | | | | |
| | | $ | 14,362,366 | |
| | | | | | | | |
| Energy – Independent – 1.0% | | | | | |
| Memorial Resource Development Corp. (a) | | | 288,425 | | | $ | 4,658,064 | |
| PDC Energy, Inc. (a) | | | 47,447 | | | | 2,532,721 | |
| | | | | | | | |
| | | $ | 7,190,785 | |
| | | | | | | | |
| Engineering – Construction – 1.6% | | | | | |
| Stantec, Inc. | | | 233,675 | | | $ | 5,795,856 | |
| Team, Inc. (a) | | | 174,475 | | | | 5,576,221 | |
| | | | | | | | |
| | | $ | 11,372,077 | |
| | | | | | | | |
| Food & Beverages – 3.5% | | | | | |
| Amplify Snack Brands, Inc. (a)(l) | | | 206,160 | | | $ | 2,374,963 | |
| Blue Buffalo Pet Products, Inc. (a)(l) | | | 178,545 | | | | 3,340,577 | |
| Flex Pharma, Inc. (a) | | | 86,181 | | | | 1,072,953 | |
| Freshpet, Inc. (a)(l) | | | 725,040 | | | | 6,155,590 | |
| Performance Food Group Co. (a) | | | 181,373 | | | | 4,196,971 | |
| Snyders-Lance, Inc. | | | 209,684 | | | | 7,192,161 | |
| | | | | | | | |
| | | $ | 24,333,215 | |
| | | | | | | | |
| Gaming & Lodging – 2.0% | | | | | |
| Diamond Resorts International, Inc. (a) | | | 187,035 | | | $ | 4,771,263 | |
| La Quinta Holdings, Inc. (a) | | | 284,526 | | | | 3,872,399 | |
| Norwegian Cruise Line Holdings Ltd. (a) | | | 90,476 | | | | 5,301,894 | |
| | | | | | | | |
| | | $ | 13,945,556 | |
| | | | | | | | |
7
MFS New Discovery Series
Portfolio of Investments – continued
| | | | | | | | |
| Issuer | | Shares/Par | | | Value ($) | |
| | | | | | | | |
| COMMON STOCKS – continued | | | | | |
| General Merchandise – 2.2% | | | | | |
| Five Below, Inc. (a) | | | 254,117 | | | $ | 8,157,156 | |
| Ollie’s Bargain Outlet Holdings, Inc. (a)(l) | | | 419,342 | | | | 7,133,007 | |
| | | | | | | | |
| | | $ | 15,290,163 | |
| | | | | | | | |
| Healthcare – 1.0% | | | | | | | | |
| Ionis Pharmaceuticals, Inc. (a) | | | 111,911 | | | $ | 6,930,648 | |
| | | | | | | | |
| Internet – 1.0% | | | | | |
| Marketo, Inc. (a) | | | 247,380 | | | $ | 7,102,280 | |
| | | | | | | | |
| Machinery & Tools – 2.3% | | | | | |
| Allison Transmission Holdings, Inc. | | | 292,462 | | | $ | 7,571,841 | |
| IPG Photonics Corp. (a) | | | 55,872 | | | | 4,981,548 | |
| WABCO Holdings, Inc. (a) | | | 34,929 | | | | 3,571,840 | |
| | | | | | | | |
| | | $ | 16,125,229 | |
| | | | | | | | |
| Medical & Health Technology & Services – 6.1% | |
| Adeptus Health, Inc., “A” (a)(l) | | | 76,947 | | | $ | 4,195,150 | |
| Brookdale Senior Living, Inc. (a) | | | 260,661 | | | | 4,811,802 | |
| Capital Senior Living Corp. (a) | | | 235,530 | | | | 4,913,156 | |
| Healthcare Services Group, Inc. | | | 409,530 | | | | 14,280,311 | |
| IDEXX Laboratories, Inc. (a) | | | 51,977 | | | | 3,790,163 | |
| INC Research Holdings, Inc., “A” (a) | | | 114,777 | | | | 5,567,832 | |
| MEDNAX, Inc. (a) | | | 69,701 | | | | 4,994,774 | |
| | | | | | | | |
| | | $ | 42,553,188 | |
| | | | | | | | |
| Medical Equipment – 12.4% | | | | | |
| Align Technology, Inc. (a) | | | 59,558 | | | $ | 3,921,894 | |
| AtriCure, Inc. (a) | | | 73,335 | | | | 1,645,637 | |
| Cardiovascular Systems, Inc. (a) | | | 225,010 | | | | 3,402,151 | |
| Cepheid, Inc. (a) | | | 174,486 | | | | 6,373,974 | |
| DexCom, Inc. (a) | | | 60,944 | | | | 4,991,314 | |
| Hologic, Inc. (a) | | | 200,580 | | | | 7,760,440 | |
| Insulet Corp. (a) | | | 212,515 | | | | 8,035,192 | |
| Masimo Corp. (a) | | | 302,542 | | | | 12,558,518 | |
| NxStage Medical, Inc. (a) | | | 447,123 | | | | 9,796,465 | |
| PerkinElmer, Inc. | | | 164,068 | | | | 8,789,123 | |
| Steris PLC | | | 157,017 | | | | 11,829,661 | |
| VWR Corp. (a) | | | 188,312 | | | | 5,331,113 | |
| Zeltiq Aesthetics, Inc. (a)(l) | | | 92,063 | | | | 2,626,557 | |
| | | | | | | | |
| | | $ | 87,062,039 | |
| | | | | | | | |
| Oil Services – 0.8% | | | | | |
| Forum Energy Technologies, Inc. (a) | | | 258,575 | | | $ | 3,221,845 | |
| Patterson-UTI Energy, Inc. | | | 152,711 | | | | 2,302,882 | |
| | | | | | | | |
| | | $ | 5,524,727 | |
| | | | | | | | |
| Other Banks & Diversified Financials – 3.2% | | | | | |
| Air Lease Corp. | | | 112,430 | | | $ | 3,764,156 | |
| CAI International, Inc. (a) | | | 145,117 | | | | 1,462,779 | |
| First Republic Bank | | | 68,365 | | | | 4,516,192 | |
| PrivateBancorp, Inc. | | | 164,702 | | | | 6,756,076 | |
| Texas Capital Bancshares, Inc. (a) | | | 122,320 | | | | 6,045,054 | |
| | | | | | | | |
| | | $ | 22,544,257 | |
| | | | | | | | |
| | | | | | | | |
| Issuer | | Shares/Par | | | Value ($) | |
| | | | | | | | |
| COMMON STOCKS – continued | | | | | |
| Pharmaceuticals – 2.2% | | | | | |
| Aratana Therapeutics, Inc. (a) | | | 313,892 | | | $ | 1,751,517 | |
| Collegium Pharmaceutical, Inc. (a) | | | 117,116 | | | | 3,220,690 | |
| Intercept Pharmaceuticals, Inc. (a) | | | 21,823 | | | | 3,259,265 | |
| MediWound Ltd. (a) | | | 166,561 | | | | 1,422,431 | |
| TherapeuticsMD, Inc. (a) | | | 570,761 | | | | 5,918,792 | |
| | | | | | | | |
| | | $ | 15,572,695 | |
| | | | | | | | |
| Railroad & Shipping – 1.3% | | | | | |
| Diana Shipping, Inc. (a) | | | 807,145 | | | $ | 3,511,081 | |
| Genesee & Wyoming, Inc. (a) | | | 73,825 | | | | 3,963,664 | |
| StealthGas, Inc. (a) | | | 530,167 | | | | 1,818,473 | |
| | | | | | | | |
| | | $ | 9,293,218 | |
| | | | | | | | |
| Restaurants – 3.5% | | | | | |
| Chuy’s Holdings, Inc. (a) | | | 136,958 | | | $ | 4,292,264 | |
| Domino’s Pizza, Inc. | | | 29,513 | | | | 3,283,321 | |
| Dunkin Brands Group, Inc. | | | 139,709 | | | | 5,950,206 | |
| El Pollo Loco Holdings, Inc. (a)(l) | | | 323,922 | | | | 4,091,135 | |
| Wingstop, Inc. (a)(l) | | | 170,166 | | | | 3,881,486 | |
| Zoe’s Kitchen, Inc. (a)(l) | | | 101,061 | | | | 2,827,687 | |
| | | | | | | | |
| | | $ | 24,326,099 | |
| | | | | | | | |
| Special Products & Services – 0.9% | | | | | |
| Boyd Group Income Fund, IEU | | | 70,931 | | | $ | 3,388,407 | |
| WL Ross Holding Corp., EU (a) | | | 304,871 | | | | 3,137,123 | |
| | | | | | | | |
| | | $ | 6,525,530 | |
| | | | | | | | |
| Specialty Chemicals – 3.1% | | | | | |
| Albemarle Corp. | | | 136,064 | | | $ | 7,620,945 | |
| Axalta Coating Systems Ltd. (a) | | | 340,564 | | | | 9,076,031 | |
| Ferroglobe PLC | | | 431,642 | | | | 4,640,152 | |
| | | | | | | | |
| | | $ | 21,337,128 | |
| | | | | | | | |
| Specialty Stores – 3.1% | | | | | |
| Boot Barn Holdings, Inc. (a) | | | 158,901 | | | $ | 1,952,893 | |
| Burlington Stores, Inc. (a) | | | 122,649 | | | | 5,261,642 | |
| Cabela’s, Inc. (a) | | | 76,356 | | | | 3,568,116 | |
| Citi Trends, Inc. | | | 271,978 | | | | 5,779,533 | |
| Urban Outfitters, Inc. (a) | | | 238,542 | | | | 5,426,831 | |
| | | | | | | | |
| | | $ | 21,989,015 | |
| | | | | | | | |
| Trucking – 0.8% | | | | | |
| Swift Transportation Co. (a) | | | 421,648 | | | $ | 5,827,175 | |
| | | | | | | | |
Total Common Stocks
(Identified Cost, $618,989,476) | | | $ | 678,772,469 | |
| | | | | | | | |
| | |
| MONEY MARKET FUNDS – 3.3% | | | | | | | | |
| MFS Institutional Money Market Portfolio, 0.19%, at Cost and Net Asset Value (v) | | | 23,019,974 | | | $ | 23,019,974 | |
| | | | | | | | |
8
MFS New Discovery Series
Portfolio of Investments – continued
| | | | | | | | |
| Issuer | | Shares/Par | | | Value ($) | |
| | | | | | | | |
| COLLATERAL FOR SECURITIES LOANED – 4.1% | | | | | |
| Navigator Securities Lending Prime Portfolio, 0.32%, at Cost and Net Asset Value (j) | | | 28,477,383 | | | $ | 28,477,383 | |
| | | | | | | | |
Total Investments
(Identified Cost, $670,486,833) | | | $ | 730,269,826 | |
| | | | | | | | |
OTHER ASSETS, LESS
LIABILITIES – (4.2)% | | | | (29,152,248 | ) |
| | | | | | | | |
| NET ASSETS – 100.0% | | | $ | 701,117,578 | |
| | | | | | | | |
| (a) | | Non-income producing security. |
| (j) | | The rate quoted is the annualized seven-day yield of the fund at period end. |
| (l) | | A portion of this security is on loan. |
| (v) | | Underlying affiliated fund that is available only to investment companies managed by MFS. The rate quoted for the MFS Institutional Money Market Portfolio is the annualized seven-day yield of the fund at period end. |
The following abbreviations are used in this report and are defined:
| ADR | | American Depositary Receipt |
| IEU | | International Equity Unit |
| PLC | | Public Limited Company |
See Notes to Financial Statements
9
MFS New Discovery Series
FINANCIAL STATEMENTS | STATEMENT OF ASSETS AND LIABILITIES
This statement represents your fund’s balance sheet, which details the assets and liabilities comprising the total value of the fund.
| | | | | | | | |
At 12/31/15 | | | | | | | | |
Assets | | | | | | | | |
Investments | | | | | | | | |
Non-affiliated issuers, at value (identified cost, $647,466,859) | | | $707,249,852 | | | | | |
Underlying affiliated funds, at cost and value | | | 23,019,974 | | | | | |
Total investments, at value, including $27,448,946 of securities on loan (identified cost, $670,486,833) | | | $730,269,826 | | | | | |
Receivables for | | | | | | | | |
Fund shares sold | | | 146,569 | | | | | |
Interest and dividends | | | 162,738 | | | | | |
Other assets | | | 4,361 | | | | | |
Total assets | | | | | | | $730,583,494 | |
Liabilities | | | | | | | | |
Payable for fund shares reacquired | | | $812,167 | | | | | |
Collateral for securities loaned, at value | | | 28,477,383 | | | | | |
Payable to affiliates | | | | | | | | |
Investment adviser | | | 25,935 | | | | | |
Shareholder servicing costs | | | 498 | | | | | |
Distribution and/or service fees | | | 5,395 | | | | | |
Payable for independent Trustees’ compensation | | | 16 | | | | | |
Accrued expenses and other liabilities | | | 144,522 | | | | | |
Total liabilities | | | | | | | $29,465,916 | |
Net assets | | | | | | | $701,117,578 | |
Net assets consist of | | | | | | | | |
Paid-in capital | | | $617,129,567 | | | | | |
Unrealized appreciation (depreciation) on investments and translation of assets and liabilities in foreign currencies | | | 59,783,003 | | | | | |
Accumulated net realized gain (loss) on investments and foreign currency | | | 24,205,008 | | | | | |
Net assets | | | | | | | $701,117,578 | |
Shares of beneficial interest outstanding | | | | | | | 47,059,948 | |
| | | | | | | | | | | | |
| | | Net assets | | | Shares
outstanding | | | Net asset value
per share | |
Initial Class | | | $312,151,370 | | | | 20,149,126 | | | | $15.49 | |
Service Class | | | 388,966,208 | | | | 26,910,822 | | | | 14.45 | |
See Notes to Financial Statements
10
MFS New Discovery Series
FINANCIAL STATEMENTS | STATEMENT OF OPERATIONS
This statement describes how much your fund earned in investment income and accrued in expenses. It also describes any gains and/or losses generated by fund operations.
| | | | | | | | |
Year ended 12/31/15 | | | | | | | | |
Net Investment loss | | | | | | | | |
Income | | | | | | | | |
Dividends | | | $3,248,695 | | | | | |
Income on securities loaned | | | 575,198 | | | | | |
Dividends from underlying affiliated funds | | | 19,019 | | | | | |
Foreign taxes withheld | | | (27,523 | ) | | | | |
Total investment income | | | | | | | $3,815,389 | |
Expenses | | | | | | | | |
Management fee | | | $7,406,710 | | | | | |
Distribution and/or service fees | | | 1,163,559 | | | | | |
Shareholder servicing costs | | | 53,427 | | | | | |
Administrative services fee | | | 138,353 | | | | | |
Independent Trustees’ compensation | | | 16,849 | | | | | |
Custodian fee | | | 82,097 | | | | | |
Shareholder communications | | | 136,635 | | | | | |
Audit and tax fees | | | 57,380 | | | | | |
Legal fees | | | 5,934 | | | | | |
Miscellaneous | | | 26,199 | | | | | |
Total expenses | | | | | | | $9,087,143 | |
Fees paid indirectly | | | (146 | ) | | | | |
Reduction of expenses by investment adviser | | | (183,244 | ) | | | | |
Net expenses | | | | | | | $8,903,753 | |
Net investment loss | | | | | | | $(5,088,364 | ) |
Realized and unrealized gain (loss) on investments and foreign currency | | | | | | | | |
Realized gain (loss) (identified cost basis) | | | | | | | | |
Investments | | | $42,742,294 | | | | | |
Foreign currency | | | (1,790 | ) | | | | |
Net realized gain (loss) on investments and foreign currency | | | | | | | $42,740,504 | |
Change in unrealized appreciation (depreciation) | | | | | | | | |
Investments | | | $(47,368,888 | ) | | | | |
Translation of assets and liabilities in foreign currencies | | | 6 | | | | | |
Net unrealized gain (loss) on investments and foreign currency translation | | | | | | | $(47,368,882 | ) |
Net realized and unrealized gain (loss) on investments and foreign currency | | | | | | | $(4,628,378 | ) |
Change in net assets from operations | | | | | | | $(9,716,742 | ) |
See Notes to Financial Statements
11
MFS New Discovery Series
FINANCIAL STATEMENTS | STATEMENTS OF CHANGES IN NET ASSETS
These statements describe the increases and/or decreases in net assets resulting from operations, any distributions, and any shareholder transactions.
| | | | | | | | |
For years ended 12/31 | | | 2015 | | | | 2014 | |
Change in net assets | | | | | | | | |
From operations | | | | | | | | |
Net investment loss | | | $(5,088,364 | ) | | | $(5,297,753 | ) |
Net realized gain (loss) on investments and foreign currency | | | 42,740,504 | | | | 34,538,713 | |
Net unrealized gain (loss) on investments and foreign currency translation | | | (47,368,882 | ) | | | (102,822,029 | ) |
Change in net assets from operations | | | $(9,716,742 | ) | | | $(73,581,069 | ) |
Distributions declared to shareholders | | | | | | | | |
From net realized gain on investments | | | $(25,964,753 | ) | | | $(193,566,218 | ) |
Change in net assets from fund share transactions | | | $(123,920,193 | ) | | | $124,817,247 | |
Total change in net assets | | | $(159,601,688 | ) | | | $(142,330,040 | ) |
Net assets | | | | | | | | |
At beginning of period | | | 860,719,266 | | | | 1,003,049,306 | |
At end of period | | | $701,117,578 | | | | $860,719,266 | |
See Notes to Financial Statements
12
MFS New Discovery Series
FINANCIAL STATEMENTS | FINANCIAL HIGHLIGHTS
The financial highlights table is intended to help you understand the fund’s financial performance for the past 5 years. Certain information reflects financial results for a single fund share. The total returns in the table represent the rate by which an investor would have earned (or lost) on an investment in the fund share class (assuming reinvestment of all distributions) held for the entire period.
| | | | | | | | | | | | | | | | | | | | |
| Initial Class | | Years ended 12/31 | |
| | | 2015 | | | 2014 | | | 2013 | | | 2012 | | | 2011 | |
Net asset value, beginning of period | | | $16.32 | | | | $22.07 | | | | $15.72 | | | | $14.29 | | | | $18.31 | |
| Income (loss) from investment operations | | | | | | | | | | | | | | | | | | | | |
Net investment loss (d) | | | $(0.08 | ) | | | $(0.09 | ) | | | $(0.08 | ) | | | $(0.05 | ) | | | $(0.10 | ) |
Net realized and unrealized gain (loss) on investments
and foreign currency | | | (0.22 | ) | | | (1.42 | ) | | | 6.59 | | | | 3.00 | | | | (1.70 | ) |
Total from investment operations | | | $(0.30 | ) | | | $(1.51 | ) | | | $6.51 | | | | $2.95 | | | | $(1.80 | ) |
| Less distributions declared to shareholders | | | | | | | | | | | | | | | | | | | | |
From net realized gain on investments | | | $(0.53 | ) | | | $(4.24 | ) | | | $(0.16 | ) | | | $(1.52 | ) | | | $(2.22 | ) |
Net asset value, end of period (x) | | | $15.49 | | | | $16.32 | | | | $22.07 | | | | $15.72 | | | | $14.29 | |
Total return (%) (k)(r)(s)(x) | | | (1.89 | ) | | | (7.26 | ) | | | 41.52 | | | | 21.22 | | | | (10.27 | ) |
Ratios (%) (to average net assets)
and Supplemental data: | | | | | | | | | | | | | | | | | | | | |
Expenses before expense reductions (f) | | | 0.96 | | | | 0.96 | | | | 0.96 | | | | 0.97 | | | | 0.98 | |
Expenses after expense reductions (f) | | | 0.94 | | | | 0.95 | | | | 0.96 | | | | 0.97 | | | | 0.98 | |
Net investment loss | | | (0.48 | ) | | | (0.46 | ) | | | (0.44 | ) | | | (0.29 | ) | | | (0.56 | ) |
Portfolio turnover | | | 60 | | | | 96 | | | | 104 | | | | 122 | | | | 177 | |
Net assets at end of period (000 omitted) | | | $312,151 | | | | $391,474 | | | | $424,432 | | | | $395,107 | | | | $363,412 | |
See Notes to Financial Statements
13
MFS New Discovery Series
Financial Highlights – continued
| | | | | | | | | | | | | | | | | | | | |
| Service Class | | Years ended 12/31 | |
| | | 2015 | | | 2014 | | | 2013 | | | 2012 | | | 2011 | |
Net asset value, beginning of period | | | $15.30 | | | | $21.02 | | | | $15.01 | | | | $13.74 | | | | $17.74 | |
| Income (loss) from investment operations | | | | | | | | | | | | | | | | | | | | |
Net investment loss (d) | | | $(0.11 | ) | | | $(0.13 | ) | | | $(0.12 | ) | | | $(0.08 | ) | | | $(0.14 | ) |
Net realized and unrealized gain (loss) on investments
and foreign currency | | | (0.21 | ) | | | (1.35 | ) | | | 6.29 | | | | 2.87 | | | | (1.64 | ) |
Total from investment operations | | | $(0.32 | ) | | | $(1.48 | ) | | | $6.17 | | | | $2.79 | | | | $(1.78 | ) |
| Less distributions declared to shareholders | | | | | | | | | | | | | | | | | | | | |
From net realized gain on investments | | | $(0.53 | ) | | | $(4.24 | ) | | | $(0.16 | ) | | | $(1.52 | ) | | | $(2.22 | ) |
Net asset value, end of period (x) | | | $14.45 | | | | $15.30 | | | | $21.02 | | | | $15.01 | | | | $13.74 | |
Total return (%) (k)(r)(s)(x) | | | (2.15 | ) | | | (7.49 | ) | | | 41.22 | | | | 20.90 | | | | (10.49 | ) |
Ratios (%) (to average net assets)
and Supplemental data: | | | | | | | | | | | | | | | | | | | | |
Expenses before expense reductions (f) | | | 1.21 | | | | 1.21 | | | | 1.21 | | | | 1.22 | | | | 1.23 | |
Expenses after expense reductions (f) | | | 1.19 | | | | 1.20 | | | | 1.21 | | | | 1.22 | | | | 1.23 | |
Net investment loss | | | (0.73 | ) | | | (0.72 | ) | | | (0.69 | ) | | | (0.53 | ) | | | (0.80 | ) |
Portfolio turnover | | | 60 | | | | 96 | | | | 104 | | | | 122 | | | | 177 | |
Net assets at end of period (000 omitted) | | | $388,966 | | | | $469,245 | | | | $578,617 | | | | $393,224 | | | | $312,589 | |
| (d) | Per share data is based on average shares outstanding. |
| (f) | Ratios do not reflect reductions from fees paid indirectly, if applicable. |
| (k) | The total return does not reflect expenses that apply to separate accounts. Inclusion of these charges would reduce the total return figures for all periods shown. |
| (r) | Certain expenses have been reduced without which performance would have been lower. |
| (s) | From time to time the fund may receive proceeds from litigation settlements, without which performance would be lower. |
| (x) | The net asset values and total returns have been calculated on net assets which include adjustments made in accordance with U.S. generally accepted accounting principles required at period end for financial reporting purposes. |
See Notes to Financial Statements
14
MFS New Discovery Series
NOTES TO FINANCIAL STATEMENTS
| (1) | | Business and Organization |
MFS New Discovery Series (the fund) is a diversified series of MFS Variable Insurance Trust (the trust). The trust is organized as a Massachusetts business trust and is registered under the Investment Company Act of 1940, as amended, as an open-end management investment company. The shareholders of each series of the trust are separate accounts of insurance companies, which offer variable annuity and/or life insurance products, and qualified retirement and pension plans.
The fund is an investment company and accordingly follows the investment company accounting and reporting guidance of the Financial Accounting Standards Board (FASB) Accounting Standards Codification Topic 946 Financial Services – Investment Companies.
| (2) | | Significant Accounting Policies |
General – The preparation of financial statements in conformity with U.S. generally accepted accounting principles requires management to make estimates and assumptions that affect the reported amounts of assets and liabilities, and disclosure of contingent assets and liabilities at the date of the financial statements and the reported amounts of increases and decreases in net assets from operations during the reporting period. Actual results could differ from those estimates. In the preparation of these financial statements, management has evaluated subsequent events occurring after the date of the fund’s Statement of Assets and Liabilities through the date that the financial statements were issued.
In January 2016, FASB issued Accounting Standards Update 2016-01, Financial Instruments – Overall (Subtopic 825-10) – Recognition and Measurement of Financial Assets and Financial Liabilities (“ASU 2016-01”) which would first be effective for annual reporting periods beginning after December 15, 2017, and interim periods therein. ASU 2016-01, which changes the accounting for equity investments and for certain financial liabilities, also modifies the presentation and disclosure requirements for financial instruments. Investment companies are specifically exempted from ASU 2016-01’s equity investment accounting provisions and will continue to follow the industry specific guidance for investment accounting under ASC 946. Although still evaluating the potential impacts of ASU 2016-01 to the fund, management expects that the impact of the fund’s adoption will be limited to additional financial statement disclosures.
Balance Sheet Offsetting – The fund’s accounting policy with respect to balance sheet offsetting is that, absent an event of default by the counterparty or a termination of the agreement, the International Swaps and Derivatives Association (ISDA) Master Agreement does not result in an offset of reported amounts of financial assets and financial liabilities in the Statement of Assets and Liabilities across transactions between the fund and the applicable counterparty. The fund’s right to setoff may be restricted or prohibited by the bankruptcy or insolvency laws of the particular jurisdiction to which a specific master netting agreement counterparty is subject. Balance sheet offsetting disclosures, to the extent applicable to the fund, have been included in the fund’s Significant Accounting Policies note under the captions for each of the fund’s in-scope financial instruments and transactions.
Investment Valuations – Equity securities, including restricted equity securities, are generally valued at the last sale or official closing price on their primary market or exchange as provided by a third-party pricing service. Equity securities, for which there were no sales reported that day, are generally valued at the last quoted daily bid quotation on their primary market or exchange as provided by a third-party pricing service. Short-term instruments with a maturity at issuance of 60 days or less may be valued at amortized cost, which approximates market value. Open-end investment companies are generally valued at net asset value per share. Securities and other assets generally valued on the basis of information from a third-party pricing service may also be valued at a broker/dealer bid quotation. Values obtained from third-party pricing services can utilize both transaction data and market information such as yield, quality, coupon rate, maturity, type of issue, trading characteristics, and other market data. The values of foreign securities and other assets and liabilities expressed in foreign currencies are converted to U.S. dollars using the mean of bid and asked prices for rates provided by a third-party pricing service.
The Board of Trustees has delegated primary responsibility for determining or causing to be determined the value of the fund’s investments (including any fair valuation) to the adviser pursuant to valuation policies and procedures approved by the Board. If the adviser determines that reliable market quotations are not readily available, investments are valued at fair value as determined in good faith by the adviser in accordance with such procedures under the oversight of the Board of Trustees. Under the fund’s valuation policies and procedures, market quotations are not considered to be readily available for most types of debt instruments and floating rate loans and many types of derivatives. These investments are generally valued at fair value based on information from third-party pricing services. In addition, investments may be valued at fair value if the adviser determines that an investment’s value has been materially affected by events occurring after the close of the exchange or market on which the investment is principally traded (such as foreign exchange or market) and prior to the determination of the fund’s net asset value, or after the halting of trading of a specific security where trading does not resume prior to the close of the exchange or market on which the security is principally traded. Events that occur on a frequent basis after foreign markets close (such as developments in foreign markets and significant movements in the U.S. markets) and prior to the determination of the fund’s net asset value may be deemed to have a material effect on the value of securities traded in foreign markets. Accordingly, the fund’s foreign equity securities may often be valued at fair value. The adviser generally relies on third-party pricing services or other information (such as the correlation with price
15
MFS New Discovery Series
Notes to Financial Statements – continued
movements of similar securities in the same or other markets; the type, cost and investment characteristics of the security; the business and financial condition of the issuer; and trading and other market data) to assist in determining whether to fair value and at what value to fair value an investment. The value of an investment for purposes of calculating the fund’s net asset value can differ depending on the source and method used to determine value. When fair valuation is used, the value of an investment used to determine the fund’s net asset value may differ from quoted or published prices for the same investment. There can be no assurance that the fund could obtain the fair value assigned to an investment if it were to sell the investment at the same time at which the fund determines its net asset value per share.
Various inputs are used in determining the value of the fund’s assets or liabilities. These inputs are categorized into three broad levels. In certain cases, the inputs used to measure fair value may fall into different levels of the fair value hierarchy. In such cases, an investment’s level within the fair value hierarchy is based on the lowest level of input that is significant to the fair value measurement. The fund’s assessment of the significance of a particular input to the fair value measurement in its entirety requires judgment, and considers factors specific to the investment. Level 1 includes unadjusted quoted prices in active markets for identical assets or liabilities. Level 2 includes other significant observable market-based inputs (including quoted prices for similar securities, interest rates, prepayment speed, and credit risk). Level 3 includes unobservable inputs, which may include the adviser’s own assumptions in determining the fair value of investments. The following is a summary of the levels used as of December 31, 2015 in valuing the fund’s assets or liabilities:
| | | | | | | | | | | | | | | | |
| Investments at Value | | Level 1 | | | Level 2 | | | Level 3 | | | Total | |
| Equity Securities: | | | | | | | | | | | | | | | | |
United States | | | $641,597,529 | | | | $— | | | | $— | | | | $641,597,529 | |
Canada | | | 9,184,262 | | | | — | | | | — | | | | 9,184,262 | |
Israel | | | 8,257,784 | | | | — | | | | — | | | | 8,257,784 | |
Hong Kong | | | 7,398,124 | | | | — | | | | — | | | | 7,398,124 | |
Greece | | | 5,329,554 | | | | — | | | | — | | | | 5,329,554 | |
India | | | 5,135,808 | | | | — | | | | — | | | | 5,135,808 | |
Japan | | | — | | | | 1,869,408 | | | | — | | | | 1,869,408 | |
| Mutual Funds | | | 51,497,357 | | | | — | | | | — | | | | 51,497,357 | |
| Total Investments | | | $728,400,418 | | | | $1,869,408 | | | | $— | | | | $730,269,826 | |
For further information regarding security characteristics, see the Portfolio of Investments.
Foreign Currency Translation – Purchases and sales of foreign investments, income, and expenses are converted into U.S. dollars based upon currency exchange rates prevailing on the respective dates of such transactions or on the reporting date for foreign denominated receivables and payables. Gains and losses attributable to foreign currency exchange rates on sales of securities are recorded for financial statement purposes as net realized gains and losses on investments. Gains and losses attributable to foreign exchange rate movements on receivables, payables, income and expenses are recorded for financial statement purposes as foreign currency transaction gains and losses. That portion of both realized and unrealized gains and losses on investments that results from fluctuations in foreign currency exchange rates is not separately disclosed.
Security Loans – Under its Securities Lending Agency Agreement with the fund, State Street Bank and Trust Company (“State Street”), as lending agent, loans the securities of the fund to certain qualified institutions (the “Borrowers”) approved by the fund. Security loans can be terminated at the discretion of either the lending agent or the fund and the related securities must be returned within the earlier of the standard trade settlement period for such securities or within three business days. The loans are collateralized by cash and/or U.S. Treasury and federal agency obligations in an amount typically at least equal to the market value of the securities loaned. On loans collateralized by cash, the cash collateral is invested in a money market fund. The market value of the loaned securities is determined at the close of business of the fund and any additional required collateral is delivered to the fund on the next business day. State Street provides the fund with indemnification against Borrower default. In the event of Borrower default, State Street will, for the benefit of the fund, either purchase securities identical to those loaned or, when such purchase is commercially impracticable, pay the fund the market value of the loaned securities. In return, State Street assumes the fund’s rights to the related collateral. If the collateral value is less than the cost to purchase identical securities, State Street is responsible for the shortfall, but only to the extent that such shortfall is not due to a decline in collateral value resulting from collateral reinvestment for which the fund bears the risk of loss. At period end, the fund had investment securities on loan, all of which were classified as equity securities in the fund’s Portfolio of Investments, with a fair value of $27,448,946. The fair value of the fund’s investment securities on loan and a related liability of $28,477,383 for cash collateral received on securities loaned are both presented gross in the Statement of Assets and Liabilities. The collateral received on securities loaned exceeded the value of securities on loan at period end. The liability for cash collateral for securities loaned is carried at fair value, which is categorized as level 2 within the fair value hierarchy. A portion of the income generated upon investment of the collateral is remitted to the Borrowers, and the remainder is allocated between the fund and the lending agent. On loans collateralized by U.S. Treasury and/or federal agency obligations, a fee
16
MFS New Discovery Series
Notes to Financial Statements – continued
is received from the Borrower, and is allocated between the fund and the lending agent. Income from securities lending is separately reported in the Statement of Operations. The dividend and interest income earned on the securities loaned is accounted for in the same manner as other dividend and interest income.
Indemnifications – Under the fund’s organizational documents, its officers and Trustees may be indemnified against certain liabilities and expenses arising out of the performance of their duties to the fund. Additionally, in the normal course of business, the fund enters into agreements with service providers that may contain indemnification clauses. The fund’s maximum exposure under these agreements is unknown as this would involve future claims that may be made against the fund that have not yet occurred.
Investment Transactions and Income – Investment transactions are recorded on the trade date. Interest income is recorded on the accrual basis. Dividends received in cash are recorded on the ex-dividend date. Certain dividends from foreign securities will be recorded when the fund is informed of the dividend if such information is obtained subsequent to the ex-dividend date. Dividend and interest payments received in additional securities are recorded on the ex-dividend or ex-interest date in an amount equal to the value of the security on such date.
The fund may receive proceeds from litigation settlements. Any proceeds received from litigation involving portfolio holdings are reflected in the Statement of Operations in realized gain/loss if the security has been disposed of by the fund or in unrealized gain/loss if the security is still held by the fund. Any other proceeds from litigation not related to portfolio holdings are reflected as other income in the Statement of Operations.
Fees Paid Indirectly – Prior to October 1, 2015, the fund’s custody fee could be reduced by a credit earned under an arrangement that measured the value of U.S. dollars deposited with the custodian by the fund. The amount of the credit, for the year ended December 31, 2015, is shown as a reduction of total expenses in the Statement of Operations.
Tax Matters and Distributions – The fund intends to qualify as a regulated investment company, as defined under Subchapter M of the Internal Revenue Code, and to distribute all of its taxable income, including realized capital gains. As a result, no provision for federal income tax is required. The fund’s federal tax returns, when filed, will remain subject to examination by the Internal Revenue Service for a three year period. Management has analyzed the fund’s tax positions taken on federal and state tax returns for all open tax years and does not believe that there are any uncertain tax positions that require recognition of a tax liability. Foreign taxes, if any, have been accrued by the fund in the accompanying financial statements in accordance with the applicable foreign tax law. Foreign income taxes may be withheld by certain countries in which the fund invests. Additionally, capital gains realized by the fund on securities issued in or by certain foreign countries may be subject to capital gains tax imposed by those countries.
Distributions to shareholders are recorded on the ex-dividend date. Income and capital gain distributions are determined in accordance with income tax regulations, which may differ from U.S. generally accepted accounting principles. Certain capital accounts in the financial statements are periodically adjusted for permanent differences in order to reflect their tax character. These adjustments have no impact on net assets or net asset value per share. Temporary differences which arise from recognizing certain items of income, expense, gain or loss in different periods for financial statement and tax purposes will reverse at some time in the future. Distributions in excess of net investment income or net realized gains are temporary overdistributions for financial statement purposes resulting from differences in the recognition or classification of income or distributions for financial statement and tax purposes.
Book/tax differences primarily relate to wash sale loss deferrals.
The tax character of distributions declared to shareholders for the last two fiscal years is as follows:
| | | | | | | | |
| | | 12/31/15 | | | 12/31/14 | |
| Ordinary income (including any short-term capital gains) | | | $— | | | | $119,667,889 | |
| Long-term capital gains | | | 25,964,753 | | | | 73,898,329 | |
| Total distributions | | | $25,964,753 | | | | $193,566,218 | |
The federal tax cost and the tax basis components of distributable earnings were as follows:
| | | | |
| As of 12/31/15 | | | | |
| Cost of investments | | | $677,085,929 | |
| Gross appreciation | | | 117,563,129 | |
| Gross depreciation | | | (64,379,232 | ) |
| Net unrealized appreciation (depreciation) | | | $53,183,897 | |
| Undistributed ordinary income | | | 13,236,547 | |
| Undistributed long-term capital gain | | | 17,449,126 | |
| Other temporary differences | | | 118,441 | |
17
MFS New Discovery Series
Notes to Financial Statements – continued
Multiple Classes of Shares of Beneficial Interest – The fund offers multiple classes of shares, which differ in their respective distribution and/or service fees. The fund’s income, realized and unrealized gain (loss), and common expenses are allocated to shareholders based on the daily net assets of each class. Dividends are declared separately for each class. Differences in per share dividend rates are generally due to differences in separate class expenses. The fund’s distributions declared to shareholders as reported in the Statements of Changes in Net Assets are presented by class as follows:
| | | | | | | | |
| | | From net realized gain on
investments | |
| | | Year ended
12/31/15 | | | Year ended
12/31/14 | |
| Initial Class | | | $10,547,386 | | | | $85,766,668 | |
| Service Class | | | 15,417,367 | | | | 107,799,550 | |
| Total | | | $25,964,753 | | | | $193,566,218 | |
| (3) | | Transactions with Affiliates |
Investment Adviser – The fund has an investment advisory agreement with MFS to provide overall investment management and related administrative services and facilities to the fund. The management fee is computed daily and paid monthly at the following annual rates:
| | | | |
| First $1 billion of average daily net assets | | | 0.90% | |
| Average daily net assets in excess of $1 billion | | | 0.80% | |
MFS has agreed in writing to reduce its management fee by a specified amount if certain MFS mutual fund assets exceed thresholds agreed to by MFS and the fund’s Board of Trustees. For the year ended December 31, 2015, this management fee reduction amounted to $57,013, which is included in the reduction of total expenses in the Statement of Operations. The management fee incurred for the year ended December 31, 2015 was equivalent to an annual effective rate of 0.89% of the fund’s average daily net assets.
The investment adviser agreed in writing to pay a portion of the fund’s total annual operating expenses, excluding interest, taxes, extraordinary expenses, brokerage and transaction costs, and investment related expenses, such that total annual operating expenses do not exceed 0.94% of average daily net assets for the Initial Class shares and 1.19% of average daily net assets for the Service Class shares. This written agreement will continue until modified by the fund’s Board of Trustees, but such agreement will continue at least until April 30, 2017. For the year ended December 31, 2015, this reduction amounted to $126,231 and is included in the reduction of total expenses in the Statement of Operations.
Distributor – MFS Fund Distributors, Inc. (MFD), a wholly-owned subsidiary of MFS, is the distributor of shares of the fund. The Trustees have adopted a distribution plan for the Service Class shares pursuant to Rule 12b-1 under the Investment Company Act of 1940.
The fund’s distribution plan provides that the fund will pay MFD distribution and/or service fees equal to 0.25% per annum of its average daily net assets attributable to Service Class shares as partial consideration for services performed and expenses incurred by MFD and financial intermediaries (including participating insurance companies that invest in the fund to fund variable annuity and variable life insurance contracts, sponsors of qualified retirement and pension plans that invest in the fund, and affiliates of these participating insurance companies and plan sponsors) in connection with the sale and distribution of the Service Class shares. MFD may subsequently pay all, or a portion, of the distribution and/or service fees to financial intermediaries.
Shareholder Servicing Agent – MFS Service Center, Inc. (MFSC), a wholly-owned subsidiary of MFS, receives a fee from the fund for its services as shareholder servicing agent. For the year ended December 31, 2015, the fee was $50,359, which equated to 0.0061% annually of the fund’s average daily net assets. MFSC also receives payment from the fund for out-of-pocket expenses paid by MFSC on behalf of the fund. For the year ended December 31, 2015, these costs amounted to $3,068.
Administrator – MFS provides certain financial, legal, shareholder communications, compliance, and other administrative services to the fund. Under an administrative services agreement, the fund reimburses MFS the costs incurred to provide these services. The fund is charged an annual fixed amount of $17,500 plus a fee based on average daily net assets. The administrative services fee incurred for the year ended December 31, 2015 was equivalent to an annual effective rate of 0.0168% of the fund’s average daily net assets.
Trustees’ and Officers’ Compensation – The fund pays compensation to independent Trustees in the form of a retainer, attendance fees, and additional compensation to Board and Committee chairpersons. The fund does not pay compensation directly to Trustees or officers of the fund who are also officers of the investment adviser, all of whom receive remuneration for their services to the fund from MFS. Certain officers and Trustees of the fund are officers or directors of MFS, MFD, and MFSC.
Other – This fund and certain other funds managed by MFS (the funds) have entered into a service agreement (the ISO Agreement) which provides for payment of fees solely by the funds to Tarantino LLC in return for the provision of services of an Independent
18
MFS New Discovery Series
Notes to Financial Statements – continued
Senior Officer (ISO) for the funds. Frank L. Tarantino serves as the ISO and is an officer of the funds and the sole member of Tarantino LLC. The funds can terminate the ISO Agreement with Tarantino LLC at any time under the terms of the ISO Agreement. For the year ended December 31, 2015, the fee paid by the fund under this agreement was $2,594 and is included in “Miscellaneous” expense in the Statement of Operations. MFS has agreed to bear all expenses associated with office space, other administrative support, and supplies provided to the ISO.
The fund invests in the MFS Institutional Money Market Portfolio which is managed by MFS and seeks current income consistent with preservation of capital and liquidity. Income earned on this investment is included in “Dividends from underlying affiliated funds” in the Statement of Operations. This money market fund does not pay a management fee to MFS.
For the year ended December 31, 2015, purchases and sales of investments, other than short-term obligations, aggregated $479,910,962 and $639,336,841, respectively.
| (5) | | Shares of Beneficial Interest |
The fund’s Declaration of Trust permits the Trustees to issue an unlimited number of full and fractional shares of beneficial interest. Transactions in fund shares were as follows:
| | | | | | | | | | | | | | | | |
| | | Year ended 12/31/15 | | | Year ended 12/31/14 | |
| | | Shares | | | Amount | | | Shares | | | Amount | |
| Shares sold | | | | | | | | | | | | | | | | |
Initial Class | | | 1,819,811 | | | | $30,303,575 | | | | 2,213,527 | | | | $39,624,819 | |
Service Class | | | 7,789,496 | | | | 120,920,972 | | | | 10,949,098 | | | | 193,646,369 | |
| | | 9,609,307 | | | | $151,224,547 | | | | 13,162,625 | | | | $233,271,188 | |
| Shares issued in connection with acquisition of MFS New Discovery Portfolio | | | | | | | | | | | | | | | | |
Initial Class | | | | | | | | | | | 3,770,832 | | | | $76,019,967 | |
Service Class | | | | | | | | | | | 4,528,397 | | | | 86,809,366 | |
| | | | | | | | | | | 8,299,229 | | | | $162,829,333 | |
| Shares issued to shareholders in reinvestment of distributions | | | | | | | | | | | | | | | | |
Initial Class | | | 677,417 | | | | $10,547,386 | | | | 5,138,806 | | | | $85,766,668 | |
Service Class | | | 1,060,342 | | | | 15,417,367 | | | | 6,883,752 | | | | 107,799,550 | |
| | | 1,737,759 | | | | $25,964,753 | | | | 12,022,558 | | | | $193,566,218 | |
| Shares reacquired | | | | | | | | | | | | | | | | |
Initial Class | | | (6,328,466 | ) | | | $(106,724,000 | ) | | | (6,374,245 | ) | | | $(120,002,831 | ) |
Service Class | | | (12,599,958 | ) | | | (194,385,493 | ) | | | (19,229,005 | ) | | | (344,846,661 | ) |
| | | (18,928,424 | ) | | | $(301,109,493 | ) | | | (25,603,250 | ) | | | $(464,849,492 | ) |
| Net change | | | | | | | | | | | | | | | | |
Initial Class | | | (3,831,238 | ) | | | $(65,873,039 | ) | | | 4,748,920 | | | | $81,408,623 | |
Service Class | | | (3,750,120 | ) | | | (58,047,154 | ) | | | 3,132,242 | | | | 43,408,624 | |
| | | (7,581,358 | ) | | | $(123,920,193 | ) | | | 7,881,162 | | | | $124,817,247 | |
The fund is one of several mutual funds in which certain MFS funds may invest. The MFS funds do not invest in the underlying funds for the purpose of exercising management or control. At the end of the period, the MFS Moderate Allocation Portfolio, the MFS Conservative Allocation Portfolio, and the MFS Growth Allocation Portfolio were the owners of record of approximately 4%, 1%, and 1%, respectively, of the value of outstanding voting shares of the fund.
The fund and certain other funds managed by MFS participate in a $1.25 billion unsecured committed line of credit, subject to a $1 billion sublimit, provided by a syndication of banks under a credit agreement. Borrowings may be made for temporary financing needs. Interest is charged to each fund, based on its borrowings, generally at a rate equal to the higher of the Overnight Federal Reserve funds rate or daily one month LIBOR plus an agreed upon spread. A commitment fee, based on the average daily, unused portion of the committed line of credit, is allocated among the participating funds at the end of each calendar quarter. In addition, the fund and other funds managed by MFS have established unsecured uncommitted borrowing arrangements with certain banks for temporary financing needs. Interest is charged to each fund, based on its borrowings, at a rate equal to the Overnight Federal Reserve funds rate plus an agreed upon spread. For the year ended December 31, 2015, the fund’s commitment fee and interest expense were $2,558 and $0, respectively, and are included in “Miscellaneous” expense in the Statement of Operations.
19
MFS New Discovery Series
Notes to Financial Statements – continued
| (7) | | Transactions in Underlying Affiliated Funds – Affiliated Issuers |
An affiliated issuer may be considered one in which the fund owns 5% or more of the outstanding voting securities, or a company which is under common control. For the purposes of this report, the fund assumes the following to be an affiliated issuer:
| | | | | | | | | | | | | | | | |
| Underlying Affiliated Fund | | Beginning
Shares/Par
Amount | | | Acquisitions
Shares/Par
Amount | | | Dispositions
Shares/Par
Amount | | | Ending
Shares/Par
Amount | |
| MFS Institutional Money Market Portfolio | | | $12,092,040 | | | | $342,463,412 | | | | $(331,535,478 | ) | | | $23,019,974 | |
| | | | |
| Underlying Affiliated Fund | | Realized
Gain (Loss) | | | Capital Gain
Distributions | | | Dividend
Income | | | Ending
Value | |
| MFS Institutional Money Market Portfolio | | | $— | | | | $— | | | | $19,019 | | | | $23,019,974 | |
At close of business on August 8, 2014, the fund with net assets of approximately $744,555,881, acquired all of the assets and liabilities of MFS New Discovery Portfolio, a series of MFS Variable Insurance Trust II. The purpose of the transaction was to provide shareholders of MFS New Discovery Portfolio the opportunity to participate in a larger combined portfolio with an identical investment objective and similar investment policies and strategies. The acquisition was accomplished by a tax-free exchange of approximately 8,299,229 shares of the fund (valued at approximately $162,829,333) for all of the assets and liabilities of MFS New Discovery Portfolio. MFS New Discovery Portfolio then distributed the shares of the fund that MFS New Discovery Portfolio received from the fund to its shareholders. MFS New Discovery Portfolio’s investments on that date were valued at approximately $162,758,952 with a cost basis of approximately $153,890,742. For financial reporting purposes, assets received and shares issued by the fund were recorded at fair value; however, the cost basis of the investments received from MFS New Discovery Portfolio were carried forward to align ongoing reporting of the fund’s realized and unrealized gains and losses with amounts distributable to shareholders for tax purposes.
20
MFS New Discovery Series
REPORT OF INDEPENDENT REGISTERED PUBLIC ACCOUNTING FIRM
To the Board of Trustees of MFS Variable Insurance Trust and the Shareholders of
MFS New Discovery Series:
We have audited the accompanying statement of assets and liabilities, including the portfolio of investments, of MFS New Discovery Series (one of the series of MFS Variable Insurance Trust) (the “Fund”) as of December 31, 2015, and the related statement of operations for the year then ended, the statements of changes in net assets for each of the two years in the period then ended, and the financial highlights for each of the five years in the period then ended. These financial statements and financial highlights are the responsibility of the Fund’s management. Our responsibility is to express an opinion on these financial statements and financial highlights based on our audits.
We conducted our audits in accordance with the standards of the Public Company Accounting Oversight Board (United States). Those standards require that we plan and perform the audit to obtain reasonable assurance about whether the financial statements and financial highlights are free of material misstatement. The Fund is not required to have, nor were we engaged to perform, an audit of its internal control over financial reporting. Our audits included consideration of internal control over financial reporting as a basis for designing audit procedures that are appropriate in the circumstances, but not for the purpose of expressing an opinion on the effectiveness of the Fund’s internal control over financial reporting. Accordingly, we express no such opinion. An audit also includes examining, on a test basis, evidence supporting the amounts and disclosures in the financial statements, assessing the accounting principles used and significant estimates made by management, as well as evaluating the overall financial statement presentation. Our procedures included confirmation of securities owned as of December 31, 2015, by correspondence with the custodian. We believe that our audits provide a reasonable basis for our opinion.
In our opinion, such financial statements and financial highlights referred to above present fairly, in all material respects, the financial position of MFS New Discovery Series as of December 31, 2015, the results of its operations for the year then ended, the changes in its net assets for each of the two years in the period then ended, and the financial highlights for each of the five years in the period then ended, in conformity with accounting principles generally accepted in the United States of America.
DELOITTE & TOUCHE LLP
Boston, Massachusetts
February 16, 2016
21
MFS New Discovery Series
TRUSTEES AND OFFICERS – IDENTIFICATION AND BACKGROUND
The Trustees and Officers of the Trust, as of February 1, 2016, are listed below, together with their principal occupations during the past five years. (Their titles may have varied during that period.) The address of each Trustee and Officer is 111 Huntington Avenue, Boston, Massachusetts 02199-7618.
| | | | | | | | |
Name, Age | | Position(s)
Held with Fund | | Trustee/Officer
Since (h) | | Principal Occupations
During the Past Five Years | | Other Directorships (j) |
| INTERESTED TRUSTEES |
Robert J. Manning (k)
(age 52) | | Trustee | | February 2004 | | Massachusetts Financial Services Company, Chairman, Co-Chief Executive Officer and Director | | N/A |
| | | | |
Robin A. Stelmach (k) (age 54) | | Trustee and President | | January 2014 | | Massachusetts Financial Services Company, Executive Vice President and Chief Operating Officer | | N/A |
| | |
| INDEPENDENT TRUSTEES | | | | |
David H. Gunning
(age 73) | | Trustee and Chair of Trustees | | January 2004 | | Private investor | | Lincoln Electric Holdings, Inc., Director; Development Alternatives, Inc., Director/Non-Executive Chairman |
| | | | |
Steven E. Buller (age 64) | | Trustee | | February 2014 | | Chairman, Financial Accounting Standards Advisory Council; Standing Advisory Group, Public Company Accounting Oversight Board, Member (until 2014); BlackRock, Inc. (investment management), Managing Director (until 2014), BlackRock Finco UK (investment management), Director (until 2014) | | N/A |
| | | | |
Robert E. Butler
(age 74) | | Trustee | | January 2006 | | Consultant – investment company industry regulatory and compliance matters | | N/A |
| | | | |
Maureen R. Goldfarb (age 60) | | Trustee | | January 2009 | | Private investor | | N/A |
| | | | |
William R. Gutow
(age 74) | | Trustee | | December 1993 | | Private investor and real estate consultant; Capitol Entertainment Management Company (video franchise), Vice Chairman | | Texas Donuts, Vice Chairman (until 2010) |
| | | | |
Michael Hegarty
(age 71) | | Trustee | | December 2004 | | Private investor | | Rouse Properties Inc., Director; Capmark Financial Group Inc., Director |
| | | | |
John P. Kavanaugh (age 61) | | Trustee | | January 2009 | | Private investor | | N/A |
| | | | |
Maryanne L. Roepke (age 59) | | Trustee | | May 2014 | | American Century Investments (investment management), Senior Vice President and Chief Compliance Officer (until 2014) | | N/A |
| | | | |
Laurie J. Thomsen
(age 58) | | Trustee | | March 2005 | | Private investor | | The Travelers Companies, Director; Dycom Industries, Inc., Director |
| | | | |
Robert W. Uek
(age 74) | | Trustee | | January 2006 | | Consultant to investment company industry | | N/A |
| | | | |
| OFFICERS | | | | | | | | |
Christopher R. Bohane (k)
(age 42) | | Assistant Secretary and Assistant Clerk | | July 2005 | | Massachusetts Financial Services Company, Vice President and Assistant General Counsel | | N/A |
| | | | |
Kino Clark (k) (age 47) | | Assistant Treasurer | | January 2012 | | Massachusetts Financial Services Company, Vice President | | N/A |
| | | | |
Kristin V. Collins (k) (age 42) | | Assistant Secretary and Assistant Clerk | | September 2015 | | Massachusetts Financial Services Company, Vice President and Assistant General Counsel | | N/A |
| | | | |
Thomas H. Connors (k) (age 56) | | Assistant Secretary and Assistant Clerk | | September 2012 | | Massachusetts Financial Services Company, Vice President and Senior Counsel; Deutsche Investment Management Americas Inc. (financial service provider), Director and Senior Counsel (until 2012) | | N/A |
22
MFS New Discovery Series
Trustees and Officers – continued
| | | | | | | | |
Name, Age | | Position(s)
Held with Fund | | Trustee/Officer
Since (h) | | Principal Occupations
During the Past Five Years | | Other Directorships (j) |
Ethan D. Corey (k)
(age 52) | | Assistant Secretary and Assistant Clerk | | July 2005 | | Massachusetts Financial Services Company, Senior Vice President and Associate General Counsel | | N/A |
| | | | |
David L. DiLorenzo (k)
(age 47) | | Treasurer | | July 2005 | | Massachusetts Financial Services Company, Senior Vice President | | N/A |
| | | | |
Brian E. Langenfeld (k) (age 42) | | Assistant Secretary and Assistant Clerk | | June 2006 | | Massachusetts Financial Services Company, Vice President and Senior Counsel | | N/A |
| | | | |
Kenneth Paek (k) (age 41) | | Assistant Treasurer | | February 2015 | | Massachusetts Financial Services Company, Vice President; Cohen & Steers, Vice President/Head of Fund Administration (until 2014) | | N/A |
| | | | |
Susan A. Pereira (k)
(age 45) | | Assistant Secretary and Assistant Clerk | | July 2005 | | Massachusetts Financial Services Company, Vice President and Senior Counsel | | N/A |
| | | | |
Kasey L. Phillips (k) (age 45) | | Assistant Treasurer | | September 2012 | | Massachusetts Financial Services Company, Vice President; Wells Fargo Funds Management, LLC, Senior Vice President, Fund Treasurer (until 2012) | | N/A |
| | | | |
Mark N. Polebaum (k)
(age 63) | | Secretary and Clerk | | January 2006 | | Massachusetts Financial Services Company, Executive Vice President, General Counsel and Secretary | | N/A |
| | | | |
Matthew A. Stowe (k) (age 41) | | Assistant Secretary and Assistant Clerk | | October 2014 | | Massachusetts Financial Services Company, Vice President and Assistant General Counsel | | N/A |
| | | | |
Frank L. Tarantino
(age 71) | | Independent Senior Officer | | June 2004 | | Tarantino LLC (provider of compliance services), Principal | | N/A |
| | | | |
Richard S. Weitzel (k)
(age 45) | | Assistant Secretary and Assistant Clerk | | October 2007 | | Massachusetts Financial Services Company, Senior Vice President and Associate General Counsel | | N/A |
| | | | |
Martin J. Wolin (k) (age 48) | | Chief Compliance Officer | | July 2015 | | Massachusetts Financial Services Company, Senior Vice President and Chief Compliance Officer (since July 2015); Mercer (financial service provider), Chief Risk and Compliance Officer, North America and Latin America (until June 2015) | | N/A |
| | | | |
James O. Yost (k)
(age 55) | | Deputy Treasurer | | September 1990 | | Massachusetts Financial Services Company, Senior Vice President | | N/A |
| (h) | Date first appointed to serve as Trustee/officer of an MFS Fund. Each Trustee has served continuously since appointment unless indicated otherwise. For the period from December 15, 2004 until February 22, 2005, Mr. Manning served as Advisory Trustee. Prior to January 2012, Messrs. DiLorenzo and Yost served as Assistant Treasurers of the Funds. Ms. Stelmach was appointed as President of the Funds as of October 1, 2014. |
| (j) | Directorships or trusteeships of companies required to report to the Securities and Exchange Commission (i.e., “public companies”). |
| (k) | “Interested person” of the Trust within the meaning of the Investment Company Act of 1940 (referred to as the 1940 Act), which is the principal federal law governing investment companies like the fund, as a result of a position with MFS. The address of MFS is 111 Huntington Avenue, Boston, Massachusetts 02199-7618. |
Each Trustee (except Ms. Stelmach, Mr. Buller and Ms. Roepke) has been elected by shareholders and each Trustee and officer holds office until his or her successor is chosen and qualified or until his or her earlier death, resignation, retirement or removal. The Trust does not hold annual meetings for the purpose of electing Trustees, and Trustees are not elected for fixed terms. Messrs. Buller, Butler, Kavanaugh, Uek and Ms. Roepke are members of the Trust’s Audit Committee.
Each of the Fund’s Trustees and officers holds comparable positions with certain other funds of which MFS or a subsidiary is the investment adviser or distributor, and, in the case of the officers, with certain affiliates of MFS. As of February 1, 2016, the Trustees served as board members of 137 funds within the MFS Family of Funds.
23
MFS New Discovery Series
Trustees and Officers – continued
The Statement of Additional Information for a Fund includes further information about the Trustees and is available without charge upon request by calling 1-800-225-2606.
| | |
Investment Adviser Massachusetts Financial Services Company 111 Huntington Avenue Boston, MA 02199-7618 | | Custodian State Street Bank and Trust Company 1 Lincoln Street Boston, MA 02111-2900 |
Distributor MFS Fund Distributors, Inc. 111 Huntington Avenue Boston, MA 02199-7618 | | Independent Registered Public Accounting Firm Deloitte & Touche LLP 200 Berkeley Street Boston, MA 02116 |
Portfolio Managers Paul Gordon Michael Grossman | | |
24
MFS New Discovery Series
BOARD REVIEW OF INVESTMENT ADVISORY AGREEMENT
The Investment Company Act of 1940 requires that both the full Board of Trustees and a majority of the non-interested (“independent”) Trustees, voting separately, annually approve the continuation of the Fund’s investment advisory agreement with MFS. The Trustees consider matters bearing on the Fund and its advisory arrangements at their meetings throughout the year, including a review of performance data at each regular meeting. In addition, the independent Trustees met several times over the course of three months beginning in May and ending in July, 2015 (“contract review meetings”) for the specific purpose of considering whether to approve the continuation of the investment advisory agreement for the Fund and the other investment companies that the Board oversees (the “MFS Funds”). The independent Trustees were assisted in their evaluation of the Fund’s investment advisory agreement by independent legal counsel, from whom they received separate legal advice and with whom they met separately from MFS during various contract review meetings. The independent Trustees were also assisted in this process by the MFS Funds’ Independent Senior Officer, a senior officer appointed by and reporting to the independent Trustees.
In connection with their deliberations regarding the continuation of the investment advisory agreement, the Trustees, including the independent Trustees, considered such information and factors as they believed, in light of the legal advice furnished to them and their own business judgment, to be relevant. The investment advisory agreement for the Fund was considered separately, although the Trustees also took into account the common interests of all MFS Funds in their review. As described below, the Trustees considered the nature, quality, and extent of the various investment advisory, administrative, and shareholder services performed by MFS under the existing investment advisory agreement and other arrangements with the Fund.
In connection with their contract review meetings, the Trustees received and relied upon materials that included, among other items: (i) information provided by Lipper Inc., an independent third party, on the investment performance of the Fund for various time periods ended December 31, 2014 and the investment performance of a group of funds with substantially similar investment classifications/objectives (the “Lipper performance universe”), (ii) information provided by Lipper Inc. on the Fund’s advisory fees and other expenses and the advisory fees and other expenses of comparable funds identified by Lipper Inc. (the “Lipper expense group”), (iii) information provided by MFS on the advisory fees of comparable portfolios of other clients of MFS, including institutional separate accounts and other clients, (iv) information as to whether and to what extent applicable expense waivers, reimbursements or fee “breakpoints” are observed for the Fund, (v) information regarding MFS’ financial results and financial condition, including MFS’ and certain of its affiliates’ estimated profitability from services performed for the Fund and the MFS Funds as a whole, and compared to MFS’ institutional business, (vi) MFS’ views regarding the outlook for the mutual fund industry and the strategic business plans of MFS, (vii) descriptions of various functions performed by MFS for the Funds, such as compliance monitoring and portfolio trading practices, and (viii) information regarding the overall organization of MFS, including information about MFS’ senior management and other personnel providing investment advisory, administrative and other services to the Fund and the other MFS Funds. The comparative performance, fee and expense information prepared and provided by Lipper Inc. was not independently verified and the independent Trustees did not independently verify any information provided to them by MFS.
The Trustees’ conclusion as to the continuation of the investment advisory agreement was based on a comprehensive consideration of all information provided to the Trustees and not the result of any single factor. Some of the factors that figured particularly in the Trustees’ deliberations are described below, although individual Trustees may have evaluated the information presented differently from one another, giving different weights to various factors. It is also important to recognize that the fee arrangements for the Fund and other MFS Funds are the result of years of review and discussion between the independent Trustees and MFS, that certain aspects of such arrangements may receive greater scrutiny in some years than in others, and that the Trustees’ conclusions may be based, in part, on their consideration of these same arrangements during the course of the year and in prior years.
Based on information provided by Lipper Inc. and MFS, the Trustees reviewed the Fund’s total return investment performance as well as the performance of peer groups of funds over various time periods. The Trustees placed particular emphasis on the total return performance of the Fund’s Initial Class shares in comparison to the performance of funds in its Lipper performance universe over the three-year period ended December 31, 2014, which the Trustees believed was a long enough period to reflect differing market conditions. The total return performance of the Fund’s Initial Class shares was in the 4th quintile relative to the other funds in the universe for this three-year period (the 1st quintile being the best performers and the 5th quintile being the worst performers). The total return performance of the Fund’s Initial Class shares was in the 5th quintile for each of the one- and five-year periods ended December 31, 2014 relative to the Lipper performance universe. Because of the passage of time, these performance results may differ from the performance results for more recent periods, including those shown elsewhere in this report.
The Trustees expressed continued concern to MFS about the substandard investment performance of the Fund and its retail counterpart, MFS New Discovery Fund, which has substantially similar investment strategies and experienced substantially similar investment performance as the Fund. In the course of their deliberations, the Trustees took into account information provided by MFS in connection with the contract review meetings, as well as during investment review meetings conducted with portfolio management personnel during the course of the year as to MFS’ efforts to improve the performance of the Fund’s retail counterpart. In addition, the Trustees requested that they receive a separate update on the Fund’s retail counterpart at each of their regular meetings. After reviewing these and related factors, the Trustees concluded, within the context of their overall conclusions regarding
25
MFS New Discovery Series
Board Review of Investment Advisory Agreement – continued
the investment advisory agreement, that MFS’ responses and efforts and plans to improve investment performance were sufficient to support approval of the continuance of the investment advisory agreement for an additional one-year period, but that they would continue to closely monitor the performance of the Fund’s retail counterpart.
In assessing the reasonableness of the Fund’s advisory fee, the Trustees considered, among other information, the Fund’s advisory fee and the total expense ratio of the Fund’s Initial Class shares as a percentage of average daily net assets and the advisory fee and total expense ratios of peer groups of funds based on information provided by Lipper Inc. The Trustees considered that, MFS currently observes an expense limitation for the Fund, which may not be changed without the Trustees’ approval. The Trustees also considered that, according to the Lipper data (which takes into account any fee reductions or expense limitations that were in effect during the Fund’s last fiscal year), the Fund’s effective advisory fee rate was higher than the Lipper expense group median and the Fund’s total expense ratio was approximately at the Lipper expense group median.
The Trustees also considered the advisory fees charged by MFS to any institutional separate accounts advised by MFS (“separate accounts”) and unaffiliated investment companies for which MFS serves as subadviser (“subadvised funds”) that have comparable investment strategies to the Fund. In comparing these fees, the Trustees considered information provided by MFS as to the generally broader scope of services provided by MFS to the Fund, as well as the more extensive regulatory burdens imposed on MFS in managing the Fund, in comparison to separate accounts and subadvised funds. The Trustees also considered the higher demands placed on MFS’ investment personnel and trading infrastructure as a result of the daily cash in-flows and out-flows of the Fund in comparison to separate accounts.
The Trustees also considered whether the Fund may benefit from any economies of scale in the management of the Fund in the event of growth in assets of the Fund and/or growth in assets of the MFS Funds as a whole. They noted that the Fund’s advisory fee rate schedule is subject to a contractual breakpoint that reduces the Fund’s advisory fee rate on average daily net assets over $1 billion. The Trustees also noted that MFS has agreed in writing to waive a portion of the management fees of certain MFS Funds, including the Fund, if the total combined assets of certain funds within the MFS Funds’ complex increase above agreed upon thresholds (the “group fee waiver”), enabling the Fund’s shareholders to share in the benefits from any economies of scale at the complex level. The group fee waiver is reviewed and renewed annually between the Board and MFS. The Trustees concluded that the breakpoint and the group fee waiver were sufficient to allow the Fund to benefit from economies of scale as its assets and overall complex assets grow.
The Trustees also considered information prepared by MFS relating to MFS’ costs and profits with respect to the Fund, the MFS Funds considered as a group, and other investment companies and accounts advised by MFS, as well as MFS’ methodologies used to determine and allocate its costs to the MFS Funds, the Fund and other accounts and products for purposes of estimating profitability.
After reviewing these and other factors described herein, the Trustees concluded, within the context of their overall conclusions regarding the investment advisory agreement, that the advisory fees charged to the Fund represent reasonable compensation in light of the services being provided by MFS to the Fund.
In addition, the Trustees considered MFS’ resources and related efforts to continue to retain, attract and motivate capable personnel to serve the Fund. The Trustees also considered current and developing conditions in the financial services industry, including the presence of large and well-capitalized companies which are spending, and appear to be prepared to continue to spend, substantial sums to engage personnel and to provide services to competing investment companies. In this regard, the Trustees also considered the financial resources of MFS and its ultimate parent, Sun Life Financial Inc. The Trustees also considered the advantages and possible disadvantages to the Fund of having an adviser that also serves other investment companies as well as other accounts.
The Trustees also considered the nature, quality, cost, and extent of administrative, transfer agency, and distribution services provided to the Fund by MFS and its affiliates under agreements and plans other than the investment advisory agreement, including any 12b-1 fees the Fund pays to MFS Fund Distributors, Inc., an affiliate of MFS. The Trustees also considered the nature, extent and quality of certain other services MFS performs or arranges for on the Fund’s behalf, which may include securities lending programs, directed expense payment programs, class action recovery programs, and MFS’ interaction with third-party service providers, principally custodians and sub-custodians. The Trustees concluded that the various non-advisory services provided by MFS and its affiliates on behalf of the Fund were satisfactory.
The Trustees also considered benefits to MFS from the use of the Fund’s portfolio brokerage commissions, if applicable, to pay for investment research and various other factors. Additionally, the Trustees considered so-called “fall-out benefits” to MFS such as reputational value derived from serving as investment manager to the Fund.
Based on their evaluation of factors that they deemed to be material, including those factors described above, the Board of Trustees, including the independent Trustees, concluded that the Fund’s investment advisory agreement with MFS should be continued for an additional one-year period, commencing August 1, 2015.
26
MFS New Discovery Series
PROXY VOTING POLICIES AND INFORMATION
MFS votes proxies on behalf of the fund pursuant to proxy voting policies and procedures that are available without charge, upon request, by calling 1-800-225-2606, by visiting the Proxy Voting section of mfs.com or by visiting the SEC’s Web site at http://www.sec.gov.
Information regarding how the fund voted proxies relating to portfolio securities during the most recent twelve-month period ended June 30 is available without charge by visiting the Proxy Voting section of mfs.com or by visiting the SEC’s Web site at http://www.sec.gov.
QUARTERLY PORTFOLIO DISCLOSURE
The fund will file a complete schedule of portfolio holdings with the Securities and Exchange Commission (the Commission) for the first and third quarters of each fiscal year on Form N-Q. The fund’s Form N-Q is available on the EDGAR database on the Commission’s Internet Web site at http://www.sec.gov, and may be reviewed and copied at the:
Public Reference Room
Securities and Exchange Commission
100 F Street, NE, Room 1580
Washington, D.C. 20549
Information on the operation of the Public Reference Room may be obtained by calling the Commission at 1-800-SEC-0330. Copies of the fund’s Form N-Q also may be obtained, upon payment of a duplicating fee, by electronic request at the following e-mail address: publicinfo@sec.gov or by writing the Public Reference Section at the above address.
FURTHER INFORMATION
From time to time, MFS may post important information about the fund or the MFS funds on the MFS web site (mfs.com). This information is available by visiting the “Market Commentary” and “Announcements” sub sections in the “Market Outlooks” section of mfs.com or by clicking on the fund’s name under “Variable Insurance Portfolios — VIT” in the “Products” section of mfs.com.
FEDERAL TAX INFORMATION (unaudited)
The following information is provided pursuant to provisions of the Internal Revenue Code.
The fund designates $28,562,000 as capital gain dividends paid during the fiscal year.
27
rev. 3/11
| | | | |
| FACTS | | WHAT DOES MFS DO WITH YOUR
PERSONAL INFORMATION? | |  |
| | |
| Why? | | Financial companies choose how they share your personal information. Federal law gives consumers the right to limit some but not all sharing. Federal law also requires us to tell you how we collect, share, and protect your personal information. Please read this notice carefully to understand what we do. |
| | |
| What? | | The types of personal information we collect and share depend on the product or service you have with us. This information can include: • Social Security number and account balances • Account transactions and transaction history • Checking account information and wire transfer instructions When you are no longer our customer, we continue to share your information as described in this notice. |
| | |
| How? | | All financial companies need to share customers’ personal information to run their everyday business. In the section below, we list the reasons financial companies can share their customers’ personal information; the reasons MFS chooses to share; and whether you can limit this sharing. |
| | | | |
Reasons we can share your
personal information | | Does MFS share? | | Can you limit this
sharing? |
For our everyday business purposes – such as to process your transactions, maintain your account(s), respond to court orders and legal investigations, or report to credit bureaus | | Yes | | No |
For our marketing purposes – to offer our products and services to you | | No | | We don’t share |
| For joint marketing with other financial companies | | No | | We don’t share |
For our affiliates’ everyday business purposes – information about your transactions and experiences | | No | | We don’t share |
For our affiliates’ everyday business purposes – information about your creditworthiness | | No | | We don’t share |
| For nonaffiliates to market to you | | No | | We don’t share |
| | |
| Questions? | | Call 800-225-2606 or go to mfs.com. |
28
| | |
| Who we are |
| Who is providing this notice? | | MFS Funds, MFS Investment Management, MFS Institutional Advisors, Inc., MFS Fund Distributors, Inc., MFS Heritage Trust Company, and MFS Service Center, Inc. |
| | |
| What we do |
| How does MFS protect my personal information? | | To protect your personal information from unauthorized access and use, we use security measures that comply with federal law. These measures include procedural, electronic, and physical safeguards for the protection of the personal information we collect about you. |
How does MFS
collect my personal information? | | We collect your personal information, for example, when you • open an account or provide account information • direct us to buy securities or direct us to sell your securities • make a wire transfer We also collect your personal information from others, such as credit bureaus, affiliates and other companies. |
| Why can’t I limit all sharing? | | Federal law gives you the right to limit only • sharing for affiliates’ everyday business purposes – information about your creditworthiness • affiliates from using your information to market to you • sharing for nonaffiliates to market to you State laws and individual companies may give you additional rights to limit sharing. |
| | |
| Definitions |
| Affiliates | | Companies related by common ownership or control. They can be financial and nonfinancial companies. • MFS does not share personal information with affiliates, except for everyday business purposes as described on page one of this notice. |
| Nonaffiliates | | Companies not related by common ownership or control. They can be financial and nonfinancial companies. • MFS does not share with nonaffiliates so they can market to you. |
| Joint Marketing | | A formal agreement between nonaffiliated financial companies that together market financial products or services to you. • MFS doesn’t jointly market. |
| | |
| Other important information |
| If you own an MFS product or receive an MFS service in the name of a third party such as a bank or broker-dealer, their privacy policy may apply to you instead of ours. |
29
ANNUAL REPORT
December 31, 2015

MFS® TOTAL RETURN BOND SERIES
(formerly MFS® Research Bond Series)
MFS® Variable Insurance Trust

VFB-ANN
MFS® TOTAL RETURN BOND SERIES
(formerly MFS® Research Bond Series)
CONTENTS
The report is prepared for the general information of contract owners. It is authorized for distribution to prospective investors only when preceded or accompanied by a current prospectus.
NOT FDIC INSURED • MAY LOSE VALUE • NO BANK OR CREDIT UNION GUARANTEE • NOT A DEPOSIT • NOT INSURED BY ANY FEDERAL GOVERNMENT AGENCY OR NCUA/NCUSIF
MFS Total Return Bond Series
LETTER FROM THE CHAIRMAN

Dear Contract Owners:
Central bank policies remain center stage as the U.S. Federal Reserve made good on its pledge to raise policy rates for the first time in over nine years at its December meeting. The Fed’s actions stand in stark contrast to those of the European Central Bank and Bank of Japan, which modestly extended their quantitative easing programs in December.
In the United States, auto sales remain a source of economic strength, but housing demand has slowed of late. The U.S. economic expansion remains moderate but uneven, with a strong dollar crimping demand for U.S. goods abroad. China’s shift to a consumer-led economy continues to weigh on its manufacturing and exports, as does weak global demand. Slackening demand from China continues to undermine commodity markets, with oil particularly impacted amid a global supply glut.
As markets have become more focused on short-term trends in recent years, we believe it’s important for investors to lengthen their investment time horizon. At MFS®, we don’t trade on headlines or trends; we invest for the long term.
We believe that this approach, coupled with the professional guidance of a financial advisor, will help you reach your investment goals.
Respectfully,

Robert J. Manning
Chairman
MFS Investment Management
February 16, 2016
The opinions expressed in this letter are subject to change and may not be relied upon for investment advice. No forecasts can be guaranteed.
1
MFS Total Return Bond Series
PORTFOLIO COMPOSITION
Portfolio structure (i)
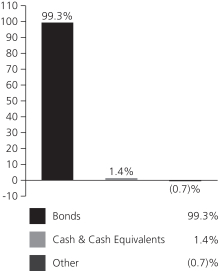
| | | | |
| Fixed income sectors (i) | | | | |
| Investment Grade Corporates | | | 38.7% | |
| Mortgage-Backed Securities | | | 20.3% | |
| U.S. Treasury Securities | | | 15.4% | |
| Commercial Mortgage-Backed Securities | | | 10.2% | |
| High Yield Corporates | | | 6.5% | |
| Asset-Backed Securities | | | 3.1% | |
| U.S. Government Agencies | | | 2.4% | |
| Collateralized Debt Obligations | | | 2.0% | |
| Emerging Markets Bonds | | | 0.5% | |
| Residential Mortgage-Backed Securities | | | 0.1% | |
| Municipal Bonds | | | 0.1% | |
| | | | |
Composition including fixed income
credit quality (a)(i) | | | | |
| AAA | | | 10.7% | |
| AA | | | 2.2% | |
| A | | | 10.7% | |
| BBB | | | 28.4% | |
| BB | | | 5.2% | |
| B | | | 3.7% | |
| CCC | | | 0.3% | |
| C (o) | | | 0.0% | |
| U.S. Government | | | 14.7% | |
| Federal Agencies | | | 22.7% | |
| Not Rated | | | 0.7% | |
| Cash & Cash Equivalents | | | 1.4% | |
| Other | | | (0.7)% | |
| |
| Portfolio facts (i) | | | | |
| Average Duration (d) | | | 5.4 | |
| Average Effective Maturity (m) | | | 7.4 yrs. | |
| (a) | | For all securities other than those specifically described below, ratings are assigned to underlying securities utilizing ratings from Moody’s, Fitch, and Standard & Poor’s rating agencies and applying the following hierarchy: If all three agencies provide a rating, the middle rating (after dropping the highest and lowest ratings) is assigned; if two of the three agencies rate a security, the lower of the two is assigned. Ratings are shown in the S&P and Fitch scale (e.g., AAA). Securities rated BBB or higher are considered investment grade. All ratings are subject to change. U.S. Government includes securities issued by the U.S. Department of the Treasury. Federal Agencies includes rated and unrated U.S. Agency fixed-income securities, U.S. Agency mortgage-backed securities, and collateralized mortgage obligations of U.S. Agency mortgage-backed securities. Not Rated includes fixed income securities, including fixed income futures contracts, which have not been rated by any rating agency. The fund may not hold all of these instruments. The fund is not rated by these agencies. |
| (d) | | Duration is a measure of how much a bond’s price is likely to fluctuate with general changes in interest rates, e.g., if rates rise 1.00%, a bond with a 5-year duration is likely to lose about 5.00% of its value due to the interest rate move. |
| (i) | | For purposes of this presentation, the components include the value of securities, and reflect the impact of the equivalent exposure of derivative positions, if any. These amounts may be negative from time to time. Equivalent exposure is a calculated amount that translates the derivative position into a reasonable approximation of the amount of the underlying asset that the portfolio would have to hold at a given point in time to have the same price sensitivity that results from the portfolio’s ownership of the derivative contract. When dealing with derivatives, equivalent exposure is a more representative measure of the potential impact of a position on portfolio performance than value. The bond component will include any accrued interest amounts. |
| (m) | | In determining an instrument’s effective maturity for purposes of calculating the fund’s dollar-weighted average effective maturity, MFS uses the instrument’s stated maturity or, if applicable, an earlier date on which MFS believes it is probable that a maturity-shortening device (such as a put, pre-refunding or prepayment) will cause the instrument to be repaid. Such an earlier date can be substantially shorter than the instrument’s stated maturity. |
From time to time Other may be negative due to equivalent exposure from currency derivatives and/or offsets to derivative positions.
Where the fund holds convertible bonds, these are treated as part of the equity portion of the portfolio.
2
MFS Total Return Bond Series
Portfolio Composition – continued
Cash & Cash Equivalents includes any cash, investments in money market funds, short-term securities, and other assets less liabilities. Please see the Statement of Assets and Liabilities for additional information related to the fund’s cash position and other assets and liabilities.
Other includes currency derivatives and/or any offsets to derivative positions.
Percentages are based on net assets as of 12/31/15.
The portfolio is actively managed and current holdings may be different.
3
MFS Total Return Bond Series
MANAGEMENT REVIEW
Summary of Results
For the twelve months ended December 31, 2015, Initial Class shares of the MFS Total Return Bond Series (“fund”) provided a total return of –0.30%, while Service Class shares of the fund provided a total return of –0.58%. These compare with a return of 0.55% over the same period for the fund’s benchmark, the Barclays U.S. Aggregate Bond Index.
Market Environment
Sluggish global growth weighed on both developed and emerging market (“EM”) economies during the reporting period. EM economies have been particularly lackluster. While the US Federal Reserve began its anticipated monetary policy tightening cycle at the end of the period, other large developed economies continued to embrace accommodative monetary policies, particularly the European Central Bank and the Bank of Japan. Focus remained on China after policy missteps by the Chinese government roiled global markets over the summer, beginning with the uncoordinated response to the stock market’s boom and bust and then the confusing decision to devalue the renminbi in August. China subsequently ramped up a wide range of monetary and fiscal measures to stimulate the economy and bolster sentiment. Its economy appeared to stabilize late in the period. Also at the end of the period, the Chinese renminbi was granted reserve currency status by the International Monetary Fund (“IMF”), which announced its inclusion in the IMF’s Special Drawing Rights currency basket effective October 1, 2016.
During the second half of the reporting period, the US faced an earnings recession caused primarily by the sharp decline in the prices of oil and other commodities. Earnings contractions were concentrated primarily in the energy, materials and industrial sectors. An additional headwind for earnings was the sharp rise in the US dollar over the period. Exports were crimped by the dollar’s strength and falling demand in emerging markets. Consumer spending held up well during the second half of the period amid a modest increase in real wages and a tailwind from falling gasoline prices. Demand for autos reached near-record territory late in the period. In emerging markets, two key factors weighed on economies and asset prices: 1) weaker Chinese growth, which drove the decline in commodity prices and 2) prospects for higher US interest rates. Structural factors like floating exchange rates and fiscal buffers partially offset these cyclical headwinds.
Detractors from Performance
The fund’s greater exposure to bonds rated (r) “BBB” and below was a primary detractor from performance relative to the Barclays U.S. Aggregate Bond Index as bonds in these credit quality segments underperformed over the reporting period.
Contributors to Performance
Positive bond selection was the primary contributor to relative performance, particularly in the agencies, banking and finance sectors.
The portion of the fund’s return derived from yield, which was greater than that of the benchmark, also benefited relative performance.
The fund’s greater-than-benchmark exposure to the finance sector was another positive factor to relative returns.
Respectfully,
| | | | |
| Joshua Marston | | Robert Persons | | Jeffrey Wakelin |
| Portfolio Manager | | Portfolio Manager | | Portfolio Manager |
| (r) | Bonds rated “BBB”, “Baa”, or higher are considered investment grade; bonds rated “BB”, “Ba”, or below are considered non-investment grade. The source for bond quality ratings is Moody’s Investors Service, Standard & Poor’s and Fitch, Inc. and are applied using the following hierarchy: If all three agencies provide a rating, the middle rating (after dropping the highest and lowest ratings) is assigned; if two of the three agencies rate a security, the lower of the two is assigned. Ratings are shown in the S&P and Fitch scale (e.g., AAA). For securities which are not rated by any of the three agencies, the security is considered Not Rated. |
Note to Shareholders: Effective April 30, 2015, the fund’s name changed from MFS Research Bond Series to MFS Total Return Bond Series. Effective December 31, 2015, Jeffrey Wakelin was no longer a Portfolio Manager of the Fund.
The views expressed in this report are those of the portfolio managers only through the end of the period of the report as stated on the cover and do not necessarily reflect the views of MFS or any other person in the MFS organization. These views are subject to change at any time based on market or other conditions, and MFS disclaims any responsibility to update such views. These views may not be relied upon as investment advice or an indication of trading intent on behalf of any MFS portfolio. References to specific securities are not recommendations of such securities, and may not be representative of any MFS portfolio’s current or future investments.
4
MFS Total Return Bond Series
PERFORMANCE SUMMARY THROUGH 12/31/15
The following chart illustrates the historical performance of the fund in comparison to its benchmark(s). Benchmarks are unmanaged and may not be invested in directly. Benchmark returns do not reflect any fees or expenses. The performance of other share classes will be greater than or less than that of the class depicted below. (See Notes to Performance Summary.)
Performance data shown represents past performance and is no guarantee of future results. Investment return and principal value fluctuate so your units, when sold, may be worth more or less than the original cost; current performance may be lower or higher than quoted. The performance shown does not reflect the deduction of taxes, if any, that a contract holder would pay on fund distributions or the redemption of contract units. The returns for the fund shown also do not reflect the deduction of expenses associated with variable products, such as mortality and expense risk charges, separate account charges, and sales charges imposed by the insurance company separate accounts. Such expenses would reduce the overall returns shown.
Growth of a Hypothetical $10,000 Investment

Total Returns through 12/31/15
Average annual total returns
| | | | | | | | | | | | |
| | | Share Class | | Class Inception Date | | 1-yr | | 5-yr | | 10-yr | | |
| | | Initial Class | | 10/24/95 | | (0.30)% | | 3.66% | | 4.69% | | |
| | | Service Class | | 5/01/00 | | (0.58)% | | 3.39% | | 4.42% | | |
| | | | |
| Comparative benchmark | | | | | | | | |
| | | Barclays U.S. Aggregate Bond Index (f) | | 0.55% | | 3.25% | | 4.51% | | |
| (f) | Source: FactSet Research Systems Inc. |
Benchmark Definition
Barclays U.S. Aggregate Bond Index – a market capitalization-weighted index that measures the performance of the U.S. investment-grade, fixed rate bond market, with index components for government and corporate securities, mortgage pass-through securities, and asset-backed securities with at least one year to final maturity.
It is not possible to invest directly in an index.
Notes to Performance Summary
Average annual total return represents the average annual change in value for each share class for the periods presented.
Performance results reflect any applicable expense subsidies and waivers in effect during the periods shown. Without such subsidies and waivers the fund’s performance results would be less favorable. Please see the prospectus and financial statements for complete details. All results are historical and assume the reinvestment of any dividends and capital gains distributions.
Performance results do not include adjustments made for financial reporting purposes in accordance with U.S. generally accepted accounting principles and may differ from amounts reported in the financial highlights.
From time to time the fund may receive proceeds from litigation settlements, without which performance would be lower.
5
MFS Total Return Bond Series
EXPENSE TABLE
Fund Expenses Borne by the Contract Holders during the Period,
July 1, 2015 through December 31, 2015
As a contract holder of the fund, you incur ongoing costs, including management fees; distribution and/or service (12b-1) fees; and other fund expenses. This example is intended to help you understand your ongoing costs (in dollars) of investing in the fund and to compare these costs with the ongoing costs of investing in other mutual funds.
The example is based on an investment of $1,000 invested at the beginning of the period and held for the entire period July 1, 2015 through December 31, 2015.
Actual Expenses
The first line for each share class in the following table provides information about actual account values and actual expenses. You may use the information in this line, together with the amount you invested, to estimate the expenses that you paid over the period. Simply divide your account value by $1,000 (for example, an $8,600 account value divided by $1,000 = 8.6), then multiply the result by the number in the first line under the heading entitled “Expenses Paid During Period” to estimate the expenses you paid on your account during this period.
Hypothetical Example for Comparison Purposes
The second line for each share class in the following table provides information about hypothetical account values and hypothetical expenses based on the fund’s actual expense ratio and an assumed rate of return of 5% per year before expenses, which is not the fund’s actual return. The hypothetical account values and expenses may not be used to estimate the actual ending account balance or expenses you paid for the period. You may use this information to compare the ongoing costs of investing in the fund and other funds. To do so, compare this 5% hypothetical example with the 5% hypothetical examples that appear in the shareholder reports of the other funds.
Please note that the expenses shown in the table are meant to highlight the fund’s ongoing costs only and do not take into account the fees and expenses imposed under the variable contracts through which your investment in the fund is made. Therefore, the second line for each share class in the table is useful in comparing ongoing costs associated with an investment in vehicles (such as the fund) which fund benefits under variable annuity and variable life insurance contracts and to qualified pension and retirement plans only, and will not help you determine the relative total costs of investing in the fund through variable annuity and variable life insurance contracts. If the fees and expenses imposed under the variable contracts were included, your costs would have been higher.
| | | | | | | | | | | | | | | | | | |
| Share Class | | | | Annualized
Expense Ratio | | | Beginning
Account Value
7/01/15 | | | Ending Account Value
12/31/15 | | | Expenses Paid
During Period (p)
7/01/15-12/31/15 | |
| Initial Class | | Actual | | | 0.53% | | | | $1,000.00 | | | | $996.24 | | | | $2.67 | |
| | Hypothetical (h) | | | 0.53% | | | | $1,000.00 | | | | $1,022.53 | | | | $2.70 | |
| Service Class | | Actual | | | 0.78% | | | | $1,000.00 | | | | $994.94 | | | | $3.92 | |
| | Hypothetical (h) | | | 0.78% | | | | $1,000.00 | | | | $1,021.27 | | | | $3.97 | |
| (h) | 5% class return per year before expenses. |
| (p) | “Expenses Paid During Period” are equal to each class’s annualized expense ratio, as shown above, multiplied by the average account value over the period, multiplied by 184/365 (to reflect the one-half year period). |
6
MFS Total Return Bond Series
PORTFOLIO OF INVESTMENTS – 12/31/15
The Portfolio of Investments is a complete list of all securities owned by your fund. It is categorized by broad-based asset classes.
| | | | | | | | |
| Issuer | | Shares/Par | | | Value ($) | |
| | | | | | | | |
| BONDS – 97.9% | | | | | | | | |
| Aerospace – 0.3% | | | | | | | | |
| Lockheed Martin Corp., 4.7%, 5/15/46 | | $ | 5,043,000 | | | $ | 5,189,333 | |
| TransDigm, Inc., 6.5%, 7/15/24 | | | 2,970,000 | | | | 2,953,665 | |
| | | | | | | | |
| | | $ | 8,142,998 | |
| | | | | | | | |
| Asset-Backed & Securitized – 15.4% | | | | | |
| Alm XIV Ltd., CLO, 2014-14A, “A1”, FRN, 1.753%, 7/28/26 (z) | | $ | 9,007,942 | | | $ | 8,919,287 | |
| AmeriCredit Automobile Receivables Trust, “A2”, 0.54%, 10/10/17 | | | 897,415 | | | | 896,867 | |
| Ameriquest Mortgage Securities, Inc., “M1”, FRN, 0.891%, 10/25/35 | | | 2,800,000 | | | | 2,723,052 | |
| ARI Fleet Lease Trust, “A”, FRN, 0.63%, 1/15/21 (n) | | | 326,083 | | | | 325,793 | |
| Babson Ltd., CLO, FRN, 1.417%, 4/20/25 (z) | | | 9,870,445 | | | | 9,667,538 | |
| Banc of America Commercial Mortgage, Inc., 5.337%, 12/15/43 (n) | | | 2,801,036 | | | | 2,890,292 | |
| Banc of America Commercial Mortgage, Inc., FRN, 5.613%, 4/24/49 (n) | | | 637,169 | | | | 651,684 | |
| Banc of America Large Loan, Inc., FRN, 5.325%, 2/24/44 (n) | | | 8,700,365 | | | | 8,935,976 | |
| Bayview Commercial Asset Trust, FRN, 0%, 4/25/36 (i)(z) | | | 262,787 | | | | 860 | |
| Bayview Commercial Asset Trust, FRN, 0%, 7/25/36 (i)(z) | | | 191,197 | | | | 0 | |
| Bayview Commercial Asset Trust, FRN, 0%, 10/25/36 (i)(z) | | | 495,382 | | | | 0 | |
| Bayview Commercial Asset Trust, FRN, 0%, 12/25/36 (i)(z) | | | 247,014 | | | | 0 | |
| Bayview Commercial Asset Trust, FRN, 0%, 3/25/37 (i)(z) | | | 542,154 | | | | 0 | |
| Bayview Financial Revolving Mortgage Loan Trust, FRN, 1.832%, 12/28/40 (z) | | | 132,470 | | | | 96,972 | |
| Bear Stearns Commercial Mortgage Securities, Inc., “A4”, FRN, 5.471%, 1/12/45 | | | 4,899,032 | | | | 5,042,172 | |
| Bear Stearns Cos., Inc., “A2”, FRN, 0.871%, 12/25/42 | | | 1,039,195 | | | | 1,029,793 | |
| Cent CDO XI Ltd., “A1”, FRN, 0.582%, 4/25/19 (n) | | | 2,807,354 | | | | 2,764,781 | |
| Cent CLO LP, 2014-16AR, “A1AR”, FRN, 1.578%, 8/01/24 (z) | | | 5,669,598 | | | | 5,649,902 | |
| Chesapeake Funding LLC, “A”, FRN, 0.718%, 1/07/25 (n) | | | 6,200,566 | | | | 6,197,881 | |
| Citigroup Commercial Mortgage Trust, 2014-GC25, “A4”, 3.635%, 10/10/47 | | | 3,128,793 | | | | 3,180,686 | |
| Citigroup Commercial Mortgage Trust, 2015-GC27, “A5”, 3.137%, 2/10/48 | | | 7,821,982 | | | | 7,633,686 | |
| Citigroup/Deutsche Bank Commercial Mortgage Trust, 5.322%, 12/11/49 | | | 14,991,431 | | | | 15,243,337 | |
| Citigroup/Deutsche Bank Commercial Mortgage Trust, FRN, 5.366%, 12/11/49 | | | 10,410,000 | | | | 10,624,822 | |
| | | | | | | | |
| Issuer | | Shares/Par | | | Value ($) | |
| | | | | | | | |
| BONDS – continued | | | | | | | | |
| Asset-Backed & Securitized – continued | | | | | |
| CNH Wholesale Master Note Trust, “A”, FRN, 0.93%, 8/15/19 (n) | | $ | 10,568,000 | | | $ | 10,554,764 | |
| Commercial Mortgage Acceptance Corp., FRN, 2.025%, 9/15/30 (i) | | | 24,747 | | | | 318 | |
| Commercial Mortgage Asset Trust, FRN, 0.486%, 1/17/32 (i)(z) | | | 493,703 | | | | 1,407 | |
| Commercial Mortgage Pass-Through Certificates, “A4”, 3.183%, 2/10/48 | | | 7,671,000 | | | | 7,521,633 | |
| Commercial Mortgage Pass-Through Certificates, “A4”, 5.306%, 12/10/46 | | | 1,258,517 | | | | 1,280,900 | |
| Commercial Mortgage Trust, “A4”, 3.147%, 8/15/45 | | | 3,950,000 | | | | 3,987,073 | |
| Commercial Mortgage Trust, 2014-CR19, “A5”, 3.796%, 8/10/47 | | | 8,605,908 | | | | 8,868,522 | |
| Commercial Mortgage Trust, 2014-UBS4, “A5”, 3.694%, 8/10/47 | | | 8,091,000 | | | | 8,219,998 | |
| Commercial Mortgage Trust, 2015-LC21, “A4”, 3.708%, 7/10/48 | | | 10,000,000 | | | | 10,163,463 | |
| Credit Suisse Commercial Mortgage Trust, “A4”, FRN, 5.948%, 9/15/39 | | | 8,642,799 | | | | 8,995,131 | |
| Credit Suisse Commercial Mortgage Trust, “AM”, FRN, 5.698%, 6/15/39 | | | 13,668,432 | | | | 13,961,594 | |
| Credit Suisse Commercial Mortgage Trust, “C4”, FRN, 5.948%, 9/15/39 | | | 6,667,307 | | | | 6,973,009 | |
| Credit Suisse Mortgage Capital Certificate, 5.311%, 12/15/39 | | | 2,116,622 | | | | 2,138,725 | |
| Credit-Based Asset Servicing & Securitization LLC, 4.122%, 12/25/35 | | | 22,338 | | | | 22,081 | |
| CSAIL Commercial Mortgage Trust, 2015-C2, “A4”, 3.504%, 6/15/57 | | | 2,695,346 | | | | 2,719,417 | |
| CWCapital Cobalt Ltd., “A4”, FRN, 5.766%, 5/15/46 | | | 1,953,132 | | | | 2,028,236 | |
| CWCapital LLC, 5.223%, 8/15/48 | | | 465,678 | | | | 473,090 | |
| Dryden Senior Loan Fund, CLO, “A”, FRN, 1.7%, 1/15/25 (z) | | | 7,548,370 | | | | 7,498,392 | |
| Falcon Franchise Loan LLC, FRN, 39.274%, 1/05/25 (i)(z) | | | 5,975 | | | | 1,445 | |
| First Union National Bank Commercial Mortgage Trust, FRN, 1.467%, 1/12/43 (i)(z) | | | 80,447 | | | | 252 | |
| Flatiron CLO Ltd. 2013-1A, “A1”, FRN, 1.715%, 1/17/26 (z) | | | 8,321,193 | | | | 8,238,688 | |
| Ford Credit Auto Owner Trust, 2014-1,“A”, 2.26%, 11/15/25 (n) | | | 4,559,000 | | | | 4,596,509 | |
| Ford Credit Auto Owner Trust, 2014-2,“A”, 2.31%, 4/15/26 (n) | | | 10,726,000 | | | | 10,710,405 | |
| GE Capital Commercial Mortgage Corp., “A”, 5.543%, 12/10/49 | | | 974,966 | | | | 1,002,846 | |
| Greenwich Capital Commercial Funding Corp., 5.475%, 3/10/39 | | | 11,128,879 | | | | 11,384,884 | |
| GS Mortgage Securities Trust, 2015-GC30, “A4”, 3.382%, 5/10/50 | | | 7,904,407 | | | | 7,862,717 | |
7
MFS Total Return Bond Series
Portfolio of Investments – continued
| | | | | | | | |
| Issuer | | Shares/Par | | | Value ($) | |
| | | | | | | | |
| BONDS – continued | | | | | | | | |
| Asset-Backed & Securitized – continued | | | | | |
| Harley-Davidson Motorcycle Trust, “A2”, FRN, 0.63%, 1/15/19 | | $ | 1,825,076 | | | $ | 1,824,868 | |
| Hertz Fleet Lease Funding LP, 2013-3, “A”, FRN, 0.843%, 12/10/27 (n) | | | 3,292,162 | | | | 3,285,516 | |
| Hertz Fleet Lease Funding LP, 2014-1, FRN, 0.693%, 4/10/28 (z) | | | 5,095,001 | | | | 5,082,445 | |
| JPMBB Commercial Mortgage Securities Trust, 2014-C26, 3.494%, 1/15/48 | | | 9,314,291 | | | | 9,349,080 | |
| JPMBB Commercial Mortgage Securities Trust, 2015-C28, “A4”, 3.227%, 10/15/48 | | | 3,308,428 | | | | 3,242,374 | |
| JPMorgan Chase Commercial Mortgage Securities Corp., 5.552%, 5/12/45 | | | 523,360 | | | | 529,494 | |
| JPMorgan Chase Commercial Mortgage Securities Corp., “A3”, 4.171%, 8/15/46 | | | 600,000 | | | | 638,956 | |
| JPMorgan Chase Commercial Mortgage Securities Corp., “A3”, FRN, 5.774%, 6/15/49 | | | 2,391,275 | | | | 2,396,788 | |
| JPMorgan Chase Commercial Mortgage Securities Corp., “A3”, FRN, 5.937%, 2/15/51 | | | 118,333 | | | | 118,190 | |
| JPMorgan Chase Commercial Mortgage Securities Corp., “A4”, FRN, 5.774%, 6/15/49 | | | 9,677,430 | | | | 9,868,618 | |
| JPMorgan Chase Commercial Mortgage Securities Corp., FRN, 5.555%, 7/15/42 (n) | | | 130,000 | | | | 31,169 | |
| JPMorgan Chase Commercial Mortgage Securities Corp., FRN, 5.694%, 2/12/49 | | | 735,205 | | | | 758,282 | |
| JPMorgan Chase Commercial Mortgage Trust, 2007-LD11, “AM”, FRN, 5.774%, 6/15/49 | | | 15,944,203 | | | | 16,216,559 | |
| JPMorgan Mortgage Trust, “A1”, FRN, 2.161%, 10/25/33 | | | 351,369 | | | | 336,997 | |
| Kingsland III Ltd., “A1”, CDO, FRN, 0.597%, 8/24/21 (n) | | | 1,298,280 | | | | 1,290,714 | |
| LB-UBS Commercial Mortgage Trust, “A4”, 5.372%, 9/15/39 | | | 2,867,994 | | | | 2,909,482 | |
| Lehman Brothers Commercial Conduit Mortgage Trust, FRN, 1.133%, 2/18/30 (i) | | | 20,109 | | | | 208 | |
| Merrill Lynch Mortgage Investors Inc., “A”, FRN, 2.218%, 5/25/36 | | | 819,272 | | | | 811,603 | |
| Merrill Lynch Mortgage Investors Inc., “A5”, FRN, 2.186%, 4/25/35 | | | 559,285 | | | | 530,022 | |
| Merrill Lynch Mortgage Trust, “A3”, FRN, 5.835%, 6/12/50 | | | 356,743 | | | | 356,462 | |
| Morgan Stanley Bank of America/Merrill Lynch Trust, “A4”, 3.176%, 8/15/45 | | | 5,000,000 | | | | 5,076,714 | |
| Morgan Stanley Capital I Trust, “AM”, FRN, 5.681%, 4/15/49 | | | 14,764,000 | | | | 15,012,310 | |
| Morgan Stanley Capital I, Inc., FRN, 0.943%, 11/15/30 (i)(n) | | | 81,831 | | | | 1,311 | |
| Morgan Stanley Re-REMIC Trust, FRN, 5.794%, 8/15/45 (n) | | | 11,500,000 | | | | 11,931,681 | |
| | | | | | | | |
| Issuer | | Shares/Par | | | Value ($) | |
| | | | | | | | |
| BONDS – continued | | | | | | | | |
| Asset-Backed & Securitized – continued | | | | | |
| Motor PLC, 2015-1A, “A1”, FRN, 1.021%, 6/25/22 (n) | | $ | 4,620,000 | | | $ | 4,605,498 | |
| Nextgear Floorplan Master Owner Trust, 2015-1A, “A”, 1.8%, 7/15/19 (n) | | | 6,772,000 | | | | 6,736,914 | |
| Nextgear Floorplan Master Owner Trust, 2015-2A, “A”, 2.38%, 10/15/20 (z) | | | 7,586,000 | | | | 7,514,729 | |
| Nissan Master Owner Trust Receivables 2015,“A-2”, 1.44%, 1/15/20 | | | 9,277,000 | | | | 9,209,048 | |
| Preferred Term Securities XIX Ltd., CDO, FRN, 0.862%, 12/22/35 (z) | | | 325,769 | | | | 228,615 | |
| Race Point CLO Ltd., “A”, FRN, 1.619%, 2/20/25 (n) | | | 7,740,000 | | | | 7,689,349 | |
| Residential Funding Mortgage Securities, Inc., 5.32%, 12/25/35 | | | 91,733 | | | | 75,311 | |
| Volkswagen Credit Auto Master Trust, 2014-1A, “A1”, FRN, 0.752%, 7/22/19 (n) | | | 6,106,000 | | | | 6,038,192 | |
| Wachovia Bank Commercial Mortgage Trust, “A4”, FRN, 5.952%, 2/15/51 | | | 6,696,524 | | | | 6,921,910 | |
| Wachovia Bank Commercial Mortgage Trust, FRN, 5.712%, 6/15/49 | | | 13,489,441 | | | | 13,816,924 | |
| Wells Fargo Commercial Mortgage Trust, 2015-C28, “A4”, 3.54%, 5/15/48 | | | 10,682,988 | | | | 10,730,263 | |
| | | | | | | | |
| | | $ | 396,847,476 | |
| | | | | | | | |
| Automotive – 0.8% | | | | | |
| General Motors Co., 4.875%, 10/02/23 | | $ | 4,291,000 | | | $ | 4,388,195 | |
| General Motors Co., 5.2%, 4/01/45 | | | 4,005,000 | | | | 3,770,431 | |
| General Motors Financial Co., Inc., 3.45%, 4/10/22 | | | 2,500,000 | | | | 2,399,558 | |
| Hyundai Capital America, 2.4%, 10/30/18 (n) | | | 1,576,000 | | | | 1,571,253 | |
| Hyundai Capital America, 2.6%, 3/19/20 (n) | | | 2,806,000 | | | | 2,757,139 | |
| Volkswagen Group America Finance LLC, 2.4%, 5/22/20 (n) | | | 6,214,000 | | | | 5,819,113 | |
| | | | | | | | |
| | | $ | 20,705,689 | |
| | | | | | | | |
| Biotechnology – 0.6% | | | | | |
| Life Technologies Corp., 5%, 1/15/21 | | $ | 13,872,000 | | | $ | 14,758,351 | |
| | | | | | | | |
| Broadcasting – 0.3% | | | | | | | | |
| Omnicom Group, Inc., 3.65%, 11/01/24 | | $ | 1,872,000 | | | $ | 1,854,467 | |
| SES Global Americas Holdings GP, 5.3%, 3/25/44 (n) | | | 2,857,000 | | | | 2,723,247 | |
| SES S.A., 5.3%, 4/04/43 (z) | | | 3,272,000 | | | | 3,143,047 | |
| | | | | | | | |
| | | $ | 7,720,761 | |
| | | | | | | | |
| Brokerage & Asset Managers – 0.7% | | | | | |
| CME Group, Inc., 3%, 3/15/25 | | $ | 2,197,000 | | | $ | 2,156,804 | |
| Intercontinental Exchange, Inc., 2.75%, 12/01/20 | | | 1,591,000 | | | | 1,591,269 | |
| Intercontinental Exchange, Inc., 3.75%, 12/01/25 | | | 4,711,000 | | | | 4,726,951 | |
| NYSE Euronext, 2%, 10/05/17 | | | 3,115,000 | | | | 3,119,981 | |
8
MFS Total Return Bond Series
Portfolio of Investments – continued
| | | | | | | | |
| Issuer | | Shares/Par | | | Value ($) | |
| | | | | | | | |
| BONDS – continued | | | | | | | | |
| Brokerage & Asset Managers – continued | | | | | |
| TD Ameritrade Holding Corp., 2.95%, 4/01/22 | | $ | 1,773,000 | | | $ | 1,757,401 | |
| TD Ameritrade Holding Corp., 5.6%, 12/01/19 | | | 3,959,000 | | | | 4,413,030 | |
| | | | | | | | |
| | | $ | 17,765,436 | |
| | | | | | | | |
| Building – 0.4% | | | | | |
| Martin Marietta Materials, Inc., 4.25%, 7/02/24 | | $ | 8,330,000 | | | $ | 8,179,452 | |
| Mohawk Industries, Inc., 3.85%, 2/01/23 | | | 2,668,000 | | | | 2,701,507 | |
| | | | | | | | |
| | | $ | 10,880,959 | |
| | | | | | | | |
| Business Services – 0.2% | | | | | |
| Equinix, Inc., 4.875%, 4/01/20 | | $ | 4,055,000 | | | $ | 4,215,173 | |
| | | | | | | | |
| Cable TV – 1.4% | | | | | |
| CCO Holdings LLC/CCO Holdings Capital Corp., 6.5%, 4/30/21 | | $ | 3,840,000 | | | $ | 3,993,600 | |
| CCO Holdings LLC/CCO Holdings Capital Corp., 5.75%, 1/15/24 | | | 3,865,000 | | | | 3,971,288 | |
| CCO Safari II LLC, 4.908%, 7/23/25 (n) | | | 7,676,000 | | | | 7,668,454 | |
| SIRIUS XM Radio, Inc., 4.25%, 5/15/20 (n) | | | 7,940,000 | | | | 8,019,400 | |
| Time Warner Cable, Inc., 4.5%, 9/15/42 | | | 3,721,000 | | | | 2,920,006 | |
| Time Warner Entertainment Co. LP, 8.375%, 7/15/33 | | | 290,000 | | | | 342,130 | |
| Videotron Ltd., 5%, 7/15/22 | | | 8,605,000 | | | | 8,605,000 | |
| | | | | | | | |
| | | $ | 35,519,878 | |
| | | | | | | | |
| Chemicals – 0.8% | | | | | |
| CF Industries Holdings, Inc., 5.375%, 3/15/44 | | $ | 3,102,000 | | | $ | 2,697,713 | |
| CF Industries Holdings, Inc., 7.125%, 5/01/20 | | | 5,826,000 | | | | 6,575,993 | |
| LyondellBasell Industries N.V., 5.75%, 4/15/24 | | | 6,275,000 | | | | 6,913,613 | |
| Tronox Finance LLC, 6.375%, 8/15/20 | | | 7,078,000 | | | | 4,259,540 | |
| | | | | | | | |
| | | $ | 20,446,859 | |
| | | | | | | | |
| Computer Software – 0.3% | | | | | |
| VeriSign, Inc., 4.625%, 5/01/23 | | $ | 6,600,000 | | | $ | 6,390,450 | |
| | | | | | | | |
| Computer Software – Systems – 0.2% | | | | | |
| Apple, Inc., 4.375%, 5/13/45 | | $ | 4,792,000 | | | $ | 4,834,936 | |
| | | | | | | | |
| Consumer Products – 0.4% | | | | | | | | |
| Mattel, Inc., 5.45%, 11/01/41 | | $ | 4,191,000 | | | $ | 4,134,686 | |
| Reckitt Benckiser Treasury Services PLC, 3.625%, 9/21/23 (n) | | | 6,765,000 | | | | 6,906,876 | |
| | | | | | | | |
| | | $ | 11,041,562 | |
| | | | | | | | |
| Consumer Services – 0.4% | | | | | |
| ADT Corp., 6.25%, 10/15/21 | | $ | 7,105,000 | | | $ | 7,421,528 | |
| Priceline Group, Inc., 3.65%, 3/15/25 | | | 3,610,000 | | | | 3,513,804 | |
| | | | | | | | |
| | | $ | 10,935,332 | |
| | | | | | | | |
| Containers – 0.6% | | | | | |
| Ball Corp., 5%, 3/15/22 | | $ | 1,385,000 | | | $ | 1,412,700 | |
| Ball Corp., 4%, 11/15/23 | | | 4,870,000 | | | | 4,644,763 | |
| | | | | | | | |
| Issuer | | Shares/Par | | | Value ($) | |
| | | | | | | | |
| BONDS – continued | | | | | | | | |
| Containers – continued | | | | | |
| Berry Plastics Corp., 5.125%, 7/15/23 | | $ | 2,905,000 | | | $ | 2,825,112 | |
| Sealed Air Corp., 5.125%, 12/01/24 (n) | | | 6,910,000 | | | | 6,910,000 | |
| | | | | | | | |
| | | $ | 15,792,575 | |
| | | | | | | | |
| Defense Electronics – 0.0% | | | | | |
| BAE Systems Holdings, Inc., 6.375%, 6/01/19 (n) | | $ | 500,000 | | | $ | 559,578 | |
| | | | | | | | |
| Energy – Independent – 0.2% | | | | | |
| Chesapeake Energy Corp., 5.75%, 3/15/23 | | $ | 7,390,000 | | | $ | 2,143,100 | |
| EQT Corp., 4.875%, 11/15/21 | | | 3,718,000 | | | | 3,540,819 | |
| | | | | | | | |
| | | $ | 5,683,919 | |
| | | | | | | | |
| Energy – Integrated – 0.5% | | | | | |
| BP Capital Markets PLC, 2.237%, 5/10/19 | | $ | 6,940,000 | | | $ | 6,949,341 | |
| Chevron Corp., 3.326%, 11/17/25 | | | 883,000 | | | | 889,366 | |
| Chevron Corp., 1.104%, 12/05/17 | | | 1,560,000 | | | | 1,549,358 | |
| Pacific Exploration and Production Corp., 5.125%, 3/28/23 (n) | | | 3,232,000 | | | | 614,080 | |
| Shell International Finance B.V., 2.125%, 5/11/20 | | | 3,229,000 | | | | 3,176,897 | |
| | | | | | | | |
| | | $ | 13,179,042 | |
| | | | | | | | |
| Entertainment – 0.5% | | | | | |
| Carnival Corp., 3.95%, 10/15/20 | | $ | 9,416,000 | | | $ | 9,835,888 | |
| Six Flags Entertainment Corp., 5.25%, 1/15/21 (n) | | | 3,710,000 | | | | 3,756,375 | |
| | | | | | | | |
| | | $ | 13,592,263 | |
| | | | | | | | |
| Financial Institutions – 1.3% | | | | | |
| General Electric Capital Corp., 6.375% to 11/15/17, FRN to 11/15/67 | | $ | 5,150,000 | | | $ | 5,378,145 | |
| General Electric Capital Corp., 7.5%, 8/21/35 | | | 4,000,000 | | | | 5,564,220 | |
| General Electric Capital Corp., 2.1%, 12/11/19 | | | 2,064,000 | | | | 2,064,557 | |
| International Lease Finance Corp., 7.125%, 9/01/18 (n) | | | 1,190,000 | | | | 1,304,538 | |
| Nationstar Mortgage LLC/Capital Corp., 6.5%, 7/01/21 | | | 8,810,000 | | | | 7,796,850 | |
| Navient Corp., 4.625%, 9/25/17 | | | 7,121,000 | | | | 7,014,185 | |
| Navient Corp., 8%, 3/25/20 | | | 5,448,000 | | | | 5,382,624 | |
| | | | | | | | |
| | | $ | 34,505,119 | |
| | | | | | | | |
| Food & Beverages – 1.5% | | | | | |
| Anheuser-Busch InBev Worldwide, Inc., 3.7%, 2/01/24 | | $ | 2,400,000 | | | $ | 2,449,697 | |
| J.M. Smucker Co., 3%, 3/15/22 | | | 1,105,000 | | | | 1,099,469 | |
| J.M. Smucker Co., 4.25%, 3/15/35 | | | 1,628,000 | | | | 1,590,291 | |
| Kraft Foods Group, Inc., 5%, 6/04/42 | | | 7,063,000 | | | | 7,111,466 | |
| Kraft Heinz Co., 5.2%, 7/15/45 (n) | | | 3,178,000 | | | | 3,318,445 | |
| SABMiller Holdings, Inc., 3.75%, 1/15/22 (n) | | | 4,992,000 | | | | 5,134,522 | |
| Tyson Foods, Inc., 3.95%, 8/15/24 | | | 2,294,000 | | | | 2,355,470 | |
| Tyson Foods, Inc., 6.6%, 4/01/16 | | | 2,065,000 | | | | 2,092,336 | |
9
MFS Total Return Bond Series
Portfolio of Investments – continued
| | | | | | | | |
| Issuer | | Shares/Par | | | Value ($) | |
| | | | | | | | |
| BONDS – continued | | | | | | | | |
| Food & Beverages – continued | | | | | |
| Tyson Foods, Inc., 4.5%, 6/15/22 | | $ | 6,476,000 | | | $ | 6,897,445 | |
| Wm. Wrigley Jr. Co., 3.375%, 10/21/20 (n) | | | 7,334,000 | | | | 7,479,873 | |
| | | | | | | | |
| | | $ | 39,529,014 | |
| | | | | | | | |
| Food & Drug Stores – 0.9% | | | | | |
| CVS Health Corp., 3.5%, 7/20/22 | | $ | 8,840,000 | | | $ | 8,999,659 | |
| CVS Health Corp., 5.125%, 7/20/45 | | | 5,294,000 | | | | 5,576,869 | |
| Walgreens Boots Alliance, Inc., 3.3%, 11/18/21 | | | 3,548,000 | | | | 3,481,138 | |
| Walgreens Boots Alliance, Inc., 3.8%, 11/18/24 | | | 5,813,000 | | | | 5,644,010 | |
| | | | | | | | |
| | | $ | 23,701,676 | |
| | | | | | | | |
| Forest & Paper Products – 0.6% | | | | | |
| Georgia-Pacific LLC, 5.4%, 11/01/20 (n) | | $ | 3,608,000 | | | $ | 3,981,103 | |
| Georgia-Pacific LLC, 3.734%, 7/15/23 (n) | | | 7,576,000 | | | | 7,667,064 | |
| Packaging Corp. of America, 3.65%, 9/15/24 | | | 3,490,000 | | | | 3,393,299 | |
| | | | | | | | |
| | | $ | 15,041,466 | |
| | | | | | | | |
| Gaming & Lodging – 0.4% | | | | | |
| GLP Capital LP/GLP Financing II, Inc., 5.375%, 11/01/23 | | $ | 2,905,000 | | | $ | 2,832,375 | |
| Wyndham Worldwide Corp., 5.625%, 3/01/21 | | | 1,732,000 | | | | 1,862,816 | |
| Wyndham Worldwide Corp., 5.1%, 10/01/25 | | | 1,155,000 | | | | 1,166,788 | |
| Wyndham Worldwide Corp., 4.25%, 3/01/22 | | | 4,662,000 | | | | 4,694,247 | |
| | | | | | | | |
| | | $ | 10,556,226 | |
| | | | | | | | |
| Industrial – 0.3% | | | | | |
| University of Notre Dame Du Lac, 3.438%, 2/15/45 | | $ | 7,651,000 | | | $ | 7,132,744 | |
| | | | | | | | |
| Insurance – 1.6% | | | | | |
| AIA Group Ltd., 3.2%, 3/11/25 (n) | | $ | 2,250,000 | | | $ | 2,171,727 | |
| American International Group, Inc., 3.75%, 7/10/25 | | | 12,804,000 | | | | 12,697,010 | |
| Five Corners Funding Trust, 4.419%, 11/15/23 (n) | | | 4,734,000 | | | | 4,942,755 | |
| Pacific Lifecorp, 5.125%, 1/30/43 (n) | | | 5,527,000 | | | | 5,627,326 | |
| Principal Financial Group, Inc., 3.4%, 5/15/25 | | | 8,266,000 | | | | 8,104,391 | |
| Unum Group, 4%, 3/15/24 | | | 6,546,000 | | | | 6,535,441 | |
| Unum Group, 7.125%, 9/30/16 | | | 2,028,000 | | | | 2,108,167 | |
| | | | | | | | |
| | | $ | 42,186,817 | |
| | | | | | | | |
| Insurance – Health – 0.6% | | | | | |
| Humana, Inc., 7.2%, 6/15/18 | | $ | 6,739,000 | | | $ | 7,541,655 | |
| UnitedHealth Group, Inc., 3.35%, 7/15/22 | | | 7,989,000 | | | | 8,172,443 | |
| | | | | | | | |
| | | $ | 15,714,098 | |
| | | | | | | | |
| Insurance – Property & Casualty – 1.7% | | | | | |
| Allied World Assurance, 5.5%, 11/15/20 | | $ | 2,640,000 | | | $ | 2,877,864 | |
| Allied World Assurance Co. Holdings Ltd., 4.35%, 10/29/25 | | | 6,835,000 | | | | 6,729,372 | |
| | | | | | | | |
| Issuer | | Shares/Par | | | Value ($) | |
| | | | | | | | |
| BONDS – continued | | | | | | | | |
| Insurance – Property & Casualty – continued | |
| CNA Financial Corp., 5.875%, 8/15/20 | | $ | 3,280,000 | | | $ | 3,636,037 | |
| Liberty Mutual Group, Inc., 4.25%, 6/15/23 (n) | | | 10,306,000 | | | | 10,479,203 | |
| Marsh & McLennan Cos., Inc., 4.8%, 7/15/21 | | | 7,863,000 | | | | 8,559,143 | |
| Marsh & McLennan Cos., Inc., 4.05%, 10/15/23 | | | 4,129,000 | | | | 4,268,655 | |
| Swiss Re Ltd., 4.25%, 12/06/42 (n) | | | 926,000 | | | | 873,920 | |
ZFS Finance USA Trust II,
6.45% to 6/15/16, FRN to 12/15/65 (n) | | | 1,842,000 | | | | 1,861,341 | |
| ZFS Finance USA Trust V, 6.5% to 5/09/17, FRN to 5/09/67 (n) | | | 4,852,000 | | | | 4,949,040 | |
| | | | | | | | |
| | | $ | 44,234,575 | |
| | | | | | | | |
| Local Authorities – 0.6% | | | | | |
| State of California (Build America Bonds), 7.625%, 3/01/40 | | $ | 860,000 | | | $ | 1,250,672 | |
| State of California (Build America Bonds), 7.6%, 11/01/40 | | | 7,175,000 | | | | 10,664,920 | |
| University of California Limited Project Rev., “J”, 4.131%, 5/15/45 | | | 2,260,000 | | | | 2,217,761 | |
| | | | | | | | |
| | | $ | 14,133,353 | |
| | | | | | | | |
| Major Banks – 7.8% | | | | | |
| ABN AMRO Bank N.V., 4.25%, 2/02/17 (n) | | $ | 5,664,000 | | | $ | 5,816,311 | |
| Bank of America Corp., 4.125%, 1/22/24 | | | 6,960,000 | | | | 7,192,283 | |
| Bank of America Corp., 3.95%, 4/21/25 | | | 1,569,000 | | | | 1,527,985 | |
| Bank of America Corp., 3.875%, 8/01/25 | | | 7,955,000 | | | | 8,076,115 | |
| Bank of America Corp., 5.625%, 7/01/20 | | | 8,555,000 | | | | 9,506,102 | |
| Bank of America Corp., 5.875%, 1/05/21 | | | 1,670,000 | | | | 1,890,699 | |
| Bank of America Corp., 6.1%, 6/15/17 | | | 1,725,000 | | | | 1,822,694 | |
| Bank of America Corp., FRN, 6.5%, 10/29/49 | | | 4,004,000 | | | | 4,219,215 | |
| Bank of America Corp., FRN, 6.1%, 12/29/49 | | | 5,000,000 | | | | 5,068,750 | |
| Credit Suisse Group AG, 6.5%, 8/08/23 (n) | | | 1,899,000 | | | | 2,046,173 | |
| Credit Suisse Group Fund Guernsey Ltd., 3.75%, 3/26/25 (z) | | | 3,355,000 | | | | 3,241,255 | |
| DBS Bank Ltd., 3.625% to 9/21/17, FRN to 9/21/22 (n) | | | 4,108,000 | | | | 4,179,418 | |
| Goldman Sachs Group, Inc., 5.15%, 5/22/45 | | | 4,868,000 | | | | 4,725,402 | |
| Goldman Sachs Group, Inc., 5.625%, 1/15/17 | | | 2,636,000 | | | | 2,737,913 | |
| Goldman Sachs Group, Inc., 2.375%, 1/22/18 | | | 5,005,000 | | | | 5,048,579 | |
| Goldman Sachs Group, Inc., 3.625%, 1/22/23 | | | 11,855,000 | | | | 11,994,130 | |
| Huntington National Bank, 2.4%, 4/01/20 | | | 1,087,000 | | | | 1,073,270 | |
| ING Bank N.V., 3.75%, 3/07/17 (n) | | | 5,855,000 | | | | 5,998,611 | |
| ING Bank N.V., 5.8%, 9/25/23 (n) | | | 11,715,000 | | | | 12,728,945 | |
| JPMorgan Chase & Co., 3.125%, 1/23/25 | | | 374,000 | | | | 363,862 | |
| JPMorgan Chase & Co., 4.25%, 10/15/20 | | | 1,385,000 | | | | 1,469,905 | |
10
MFS Total Return Bond Series
Portfolio of Investments – continued
| | | | | | | | |
| Issuer | | Shares/Par | | | Value ($) | |
| | | | | | | | |
| BONDS – continued | | | | | | | | |
| Major Banks – continued | | | | | |
| JPMorgan Chase & Co., 4.5%, 1/24/22 | | $ | 947,000 | | | $ | 1,021,449 | |
| JPMorgan Chase & Co., 2%, 8/15/17 | | | 3,637,000 | | | | 3,649,613 | |
| JPMorgan Chase & Co., 3.2%, 1/25/23 | | | 12,685,000 | | | | 12,650,535 | |
| Merrill Lynch & Co., Inc., 6.05%, 5/16/16 | | | 4,869,000 | | | | 4,949,241 | |
| Morgan Stanley, 3.7%, 10/23/24 | | | 2,879,000 | | | | 2,893,107 | |
| Morgan Stanley, 4.3%, 1/27/45 | | | 1,528,000 | | | | 1,456,911 | |
| Morgan Stanley, 5.75%, 10/18/16 | | | 944,000 | | | | 976,332 | |
| Morgan Stanley, 5.5%, 7/24/20 | | | 1,600,000 | | | | 1,780,362 | |
| Morgan Stanley, 5.5%, 7/28/21 | | | 14,214,000 | | | | 15,932,657 | |
| Morgan Stanley, 5.95%, 12/28/17 | | | 400,000 | | | | 430,120 | |
| Morgan Stanley, 3.75%, 2/25/23 | | | 8,585,000 | | | | 8,798,870 | |
| PNC Bank N.A., 3.8%, 7/25/23 | | | 13,950,000 | | | | 14,389,830 | |
| PNC Funding Corp., 5.625%, 2/01/17 | | | 6,173,000 | | | | 6,417,938 | |
| Regions Financial Corp., 2%, 5/15/18 | | | 2,524,000 | | | | 2,506,327 | |
| Royal Bank of Scotland Group PLC, 7.5% to 8/10/20, FRN to 12/29/49 | | | 5,177,000 | | | | 5,390,551 | |
| Royal Bank of Scotland Group PLC, 8% to 2025, FRN to 12/29/49 | | | 1,662,000 | | | | 1,757,565 | |
| Royal Bank of Scotland Group PLC, 6%, 12/19/23 | | | 7,121,000 | | | | 7,669,360 | |
| Wachovia Corp., 6.605%, 10/01/25 | | | 1,764,000 | | | | 2,093,536 | |
| Wells Fargo & Co., 5.875% to 6/15/25, FRN to 12/29/49 | | | 3,832,000 | | | | 4,033,180 | |
| | | | | | | | |
| | | $ | 199,525,101 | |
| | | | | | | | |
| Medical & Health Technology & Services – 0.8% | | | | | |
| Becton, Dickinson and Co., 4.685%, 12/15/44 | | $ | 4,733,000 | | | $ | 4,774,873 | |
| Catholic Health Initiatives, 2.95%, 11/01/22 | | | 6,666,000 | | | | 6,505,596 | |
| Express Scripts Holding Co., 2.65%, 2/15/17 | | | 5,011,000 | | | | 5,060,489 | |
| Laboratory Corp. of America Holdings, 4.7%, 2/01/45 | | | 2,518,000 | | | | 2,312,287 | |
| McKesson Corp., 5.7%, 3/01/17 | | | 1,210,000 | | | | 1,267,735 | |
| | | | | | | | |
| | | $ | 19,920,980 | |
| | | | | | | | |
| Medical Equipment – 0.6% | | | | | |
| Medtronic, Inc., 4.625%, 3/15/45 | | $ | 7,021,000 | | | $ | 7,238,840 | |
| Zimmer Holdings, Inc., 2.7%, 4/01/20 | | | 7,783,000 | | | | 7,687,977 | |
| | | | | | | | |
| | | $ | 14,926,817 | |
| | | | | | | | |
| Metals & Mining – 0.9% | | | | | |
| Barrick North America Finance LLC, 5.75%, 5/01/43 | | $ | 6,000,000 | | | $ | 4,339,494 | |
| Freeport-McMoRan Copper & Gold, Inc., 3.875%, 3/15/23 | | | 4,000,000 | | | | 2,280,000 | |
| Freeport-McMoRan Copper & Gold, Inc., 5.4%, 11/14/34 | | | 4,000,000 | | | | 2,120,000 | |
Freeport-McMoRan Oil & Gas LLC, 6.875%, 2/15/23 | | | 8,679,000 | | | | 5,467,770 | |
| Kinross Gold Corp., 5.95%, 3/15/24 | | | 6,437,000 | | | | 4,248,420 | |
| Steel Dynamics, Inc., 5.125%, 10/01/21 | | | 5,864,000 | | | | 5,424,200 | |
| | | | | | | | |
| | | $ | 23,879,884 | |
| | | | | | | | |
| | | | | | | | |
| Issuer | | Shares/Par | | | Value ($) | |
| | | | | | | | |
| BONDS – continued | | | | | | | | |
| Midstream – 1.4% | | | | | |
| Energy Transfer Partners LP, 5.15%, 3/15/45 | | $ | 2,596,000 | | | $ | 1,835,089 | |
| Energy Transfer Partners LP, 5.15%, 2/01/43 | | | 3,573,000 | | | | 2,554,241 | |
Kinder Morgan (Delaware), Inc., 7.75%, 1/15/32 | | | 6,550,000 | | | | 6,215,609 | |
Kinder Morgan Energy Partners LP, 4.3%, 5/01/24 | | | 5,995,000 | | | | 5,154,993 | |
| Kinder Morgan Energy Partners LP, 5.4%, 9/01/44 | | | 6,378,000 | | | | 4,819,893 | |
| Kinder Morgan Energy Partners LP, 7.4%, 3/15/31 | | | 103,000 | | | | 94,955 | |
| Kinder Morgan Energy Partners LP, 6.375%, 3/01/41 | | | 2,240,000 | | | | 1,868,357 | |
| Kinder Morgan, Inc., 5.625%, 11/15/23 (n) | | | 3,000,000 | | | | 2,744,166 | |
| Sabine Pass Liquefaction LLC, 5.625%, 2/01/21 | | | 8,270,000 | | | | 7,608,400 | |
| Spectra Energy Capital LLC, 8%, 10/01/19 | | | 613,000 | | | | 697,297 | |
| Sunoco Logistics Partners LP, 4.25%, 4/01/24 | | | 1,108,000 | | | | 958,821 | |
| Williams Cos., Inc., 5.75%, 6/24/44 | | | 3,409,000 | | | | 2,024,240 | |
| | | | | | | | |
| | | $ | 36,576,061 | |
| | | | | | | | |
| Mortgage-Backed – 20.2% | | | | | |
| Fannie Mae, 3%, 10/01/30 | | $ | 2,629,185 | | | $ | 2,710,480 | |
| Fannie Mae, 4%, 9/01/40 – 7/01/43 | | | 13,452,776 | | | | 14,259,917 | |
| Fannie Mae, 2.82%, 1/01/16 | | | 572,855 | | | | 572,285 | |
| Fannie Mae, 5.08%, 2/01/16 | | | 308,890 | | | | 309,170 | |
| Fannie Mae, 5.198%, 2/01/16 | | | 256,544 | | | | 256,421 | |
| Fannie Mae, 5.441%, 2/01/16 | | | 67,839 | | | | 67,741 | |
| Fannie Mae, 5.735%, 7/01/16 | | | 1,098,571 | | | | 1,101,447 | |
| Fannie Mae, 5.05%, 1/01/17 | | | 237,324 | | | | 242,429 | |
| Fannie Mae, 5.6%, 1/01/17 | | | 420 | | | | 420 | |
| Fannie Mae, 5.28%, 3/01/17 | | | 128,836 | | | | 132,412 | |
| Fannie Mae, 5.54%, 4/01/17 | | | 98,182 | | | | 101,486 | |
| Fannie Mae, 5.458%, 6/01/17 | | | 507,234 | | | | 525,315 | |
| Fannie Mae, 5.65%, 6/01/17 | | | 147,603 | | | | 154,588 | |
| Fannie Mae, 2.71%, 11/01/17 | | | 359,868 | | | | 367,237 | |
| Fannie Mae, 5.5%, 11/01/17 – 4/01/40 | | | 22,043,257 | | | | 24,725,965 | |
| Fannie Mae, 3.22%, 12/01/17 | | | 486,762 | | | | 500,453 | |
| Fannie Mae, 3.292%, 12/01/17 | | | 936,986 | | | | 965,624 | |
| Fannie Mae, 3.99%, 4/01/18 | | | 600,000 | | | | 627,924 | |
| Fannie Mae, 3.743%, 6/01/18 | | | 2,623,272 | | | | 2,720,622 | |
| Fannie Mae, 5.324%, 6/01/18 | | | 393,312 | | | | 420,621 | |
| Fannie Mae, 2.578%, 9/25/18 | | | 4,445,804 | | | | 4,528,624 | |
| Fannie Mae, 5.18%, 3/01/19 | | | 121,843 | | | | 130,318 | |
| Fannie Mae, 5.51%, 3/01/19 | | | 182,941 | | | | 202,076 | |
| Fannie Mae, 4.6%, 9/01/19 | | | 718,499 | | | | 775,583 | |
| Fannie Mae, 1.99%, 10/01/19 | | | 2,640,527 | | | | 2,666,503 | |
| Fannie Mae, 4.45%, 10/01/19 | | | 503,442 | | | | 543,062 | |
| Fannie Mae, 1.97%, 11/01/19 | | | 1,037,649 | | | | 1,035,309 | |
| Fannie Mae, 2.03%, 11/01/19 | | | 1,295,174 | | | | 1,294,994 | |
| Fannie Mae, 4.88%, 3/01/20 | | | 19,105 | | | | 20,398 | |
| Fannie Mae, 5%, 6/01/20 – 3/01/42 | | | 13,605,863 | | | | 15,002,857 | |
11
MFS Total Return Bond Series
Portfolio of Investments – continued
| | | | | | | | |
| Issuer | | Shares/Par | | | Value ($) | |
| | | | | | | | |
| BONDS – continued | | | | | | | | |
| Mortgage-Backed – continued | | | | | |
| Fannie Mae, 5.19%, 9/01/20 | | $ | 164,097 | | | $ | 177,385 | |
| Fannie Mae, 3.414%, 10/01/20 | | | 1,516,348 | | | | 1,603,313 | |
| Fannie Mae, 2.14%, 5/01/21 | | | 953,203 | | | | 946,537 | |
| Fannie Mae, 3.89%, 7/01/21 | | | 1,171,679 | | | | 1,255,613 | |
| Fannie Mae, 2.56%, 10/01/21 | | | 833,669 | | | | 832,113 | |
| Fannie Mae, 2.64%, 11/01/21 | | | 1,253,370 | | | | 1,268,728 | |
| Fannie Mae, 2.75%, 3/01/22 | | | 1,180,838 | | | | 1,197,014 | |
| Fannie Mae, 6%, 8/01/22 – 3/01/39 | | | 4,868,420 | | | | 5,512,162 | |
| Fannie Mae, 2.525%, 10/01/22 | | | 1,886,052 | | | | 1,886,223 | |
| Fannie Mae, 2.68%, 3/01/23 | | | 1,809,763 | | | | 1,820,688 | |
| Fannie Mae, 2.41%, 5/01/23 | | | 2,107,724 | | | | 2,086,430 | |
| Fannie Mae, 2.55%, 5/01/23 | | | 1,082,089 | | | | 1,080,557 | |
| Fannie Mae, 4.5%, 5/01/24 – 4/01/44 | | | 24,729,390 | | | | 26,790,185 | |
| Fannie Mae, 4%, 3/01/25 – 2/01/45 | | | 67,276,471 | | | | 71,274,229 | |
| Fannie Mae, 4.5%, 5/01/25 | | | 140,870 | | | | 151,835 | |
| Fannie Mae, 3.5%, 9/01/25 – 1/01/42 | | | 5,758,782 | | | | 6,004,996 | |
| Fannie Mae, 3%, 3/01/27 – 12/01/30 | | | 10,581,290 | | | | 10,951,985 | |
| Fannie Mae, 6.5%, 7/01/32 – 1/01/33 | | | 9,409 | | | | 10,797 | |
| Fannie Mae, 3.5%, 4/01/43 – 9/01/43 | | | 8,701,419 | | | | 8,984,096 | |
| Federal Home Loan Bank, 5%, 7/01/35 | | | 3,979,979 | | | | 4,391,904 | |
| Federal Home Loan Bank, 3%, 10/01/42 – 5/01/43 | | | 2,527,796 | | | | 2,529,155 | |
| Freddie Mac, 3.5%, 7/01/42 | | | 5,557,760 | | | | 5,726,402 | |
| Freddie Mac, 4%, 4/01/44 – 9/01/44 | | | 39,790,342 | | | | 42,058,866 | |
| Freddie Mac, 3.154%, 2/25/18 | | | 887,991 | | | | 915,121 | |
| Freddie Mac, 5%, 7/01/18 – 4/01/40 | | | 1,201,521 | | | | 1,323,227 | |
| Freddie Mac, 2.412%, 8/25/18 | | | 2,300,000 | | | | 2,339,784 | |
| Freddie Mac, 2.303%, 9/25/18 | | | 8,971,000 | | | | 9,101,968 | |
| Freddie Mac, 2.323%, 10/25/18 | | | 1,194,000 | | | | 1,211,379 | |
| Freddie Mac, 2.22%, 12/25/18 | | | 1,200,000 | | | | 1,210,268 | |
| Freddie Mac, 2.13%, 1/25/19 | | | 6,184,000 | | | | 6,236,957 | |
| Freddie Mac, 2.086%, 3/25/19 | | | 7,200,000 | | | | 7,247,639 | |
| Freddie Mac, 1.883%, 5/25/19 | | | 8,450,000 | | | | 8,448,119 | |
| Freddie Mac, 5.5%, 6/01/19 – 1/01/38 | | | 840,449 | | | | 934,738 | |
| Freddie Mac, 4.186%, 8/25/19 | | | 1,110,000 | | | | 1,191,485 | |
| Freddie Mac, 1.869%, 11/25/19 | | | 6,121,000 | | | | 6,088,316 | |
| Freddie Mac, 4.251%, 1/25/20 | | | 807,000 | | | | 869,244 | |
| Freddie Mac, 3.034%, 10/25/20 | | | 2,606,000 | | | | 2,689,337 | |
| Freddie Mac, 2.856%, 1/25/21 | | | 5,331,000 | | | | 5,452,905 | |
| Freddie Mac, 2.791%, 1/25/22 | | | 4,439,000 | | | | 4,500,730 | |
| Freddie Mac, 2.716%, 6/25/22 | | | 1,478,636 | | | | 1,487,583 | |
| Freddie Mac, 2.682%, 10/25/22 | | | 3,049,000 | | | | 3,059,109 | |
| Freddie Mac, 3.32%, 2/25/23 | | | 3,956,000 | | | | 4,114,547 | |
| Freddie Mac, 3.3%, 4/25/23 | | | 6,099,972 | | | | 6,323,824 | |
| Freddie Mac, 3.06%, 7/25/23 | | | 4,230,000 | | | | 4,313,956 | |
| Freddie Mac, 3.531%, 7/25/23 | | | 2,401,000 | | | | 2,522,327 | |
| Freddie Mac, 3.458%, 8/25/23 | | | 7,000,000 | | | | 7,314,700 | |
| Freddie Mac, 2.67%, 12/25/24 | | | 2,784,000 | | | | 2,717,969 | |
| Freddie Mac, 2.811%, 1/25/25 | | | 4,169,000 | | | | 4,104,812 | |
| Freddie Mac, 3.329%, 5/25/25 | | | 6,457,000 | | | | 6,612,964 | |
| Freddie Mac, 4%, 7/01/25 – 11/01/43 | | | 16,767,345 | | | | 17,728,848 | |
| Freddie Mac, 4.5%, 7/01/25 – 6/01/41 | | | 3,473,579 | | | | 3,742,312 | |
| Freddie Mac, 3.5%, 8/01/26 – 3/01/43 | | | 17,346,033 | | | | 17,882,222 | |
| Freddie Mac, 3%, 11/01/30 – 5/01/43 | | | 5,569,275 | | | | 5,637,990 | |
| Freddie Mac, 6%, 8/01/34 – 7/01/38 | | | 228,247 | | | | 257,975 | |
| | | | | | | | |
| Issuer | | Shares/Par | | | Value ($) | |
| | | | | | | | |
| BONDS – continued | | | | | | | | |
| Mortgage-Backed – continued | | | | | |
| Freddie Mac, TBA, 3.5%, 1/01/46 | | $ | 10,601,000 | | | $ | 10,909,086 | |
| Freddie Mac, TBA, 4%, 1/01/46 | | | 6,034,000 | | | | 6,372,674 | |
| Ginnie Mae, 5.5%, 5/15/33 – 1/20/42 | | | 3,800,541 | | | | 4,275,863 | |
| Ginnie Mae, 6%, 1/20/36 – 1/15/39 | | | 511,847 | | | | 581,066 | |
| Ginnie Mae, 4.5%, 4/15/39 – 9/20/41 | | | 21,296,933 | | | | 23,197,290 | |
| Ginnie Mae, 4%, 10/20/40 – 10/20/42 | | | 5,518,774 | | | | 5,903,175 | |
| Ginnie Mae, 3.5%, 11/15/40 – 7/20/43 | | | 13,069,925 | | | | 13,647,264 | |
| Ginnie Mae, TBA, 3.5%, 1/01/46 | | | 30,729,000 | | | | 32,023,140 | |
| | | | | | | | |
| | | $ | 519,995,407 | |
| | | | | | | | |
| Municipals – 0.2% | | | | | |
| California Educational Facilities Authority Rev. (Stanford University), 5.25%, 4/01/40 | | $ | 1,860,000 | | | $ | 2,541,988 | |
| Florida Hurricane Catastrophe Fund Finance Corp. Rev., “A”, 1.298%, 7/01/16 | | | 1,750,000 | | | | 1,754,602 | |
| | | | | | | | |
| | | $ | 4,296,590 | |
| | | | | | | | |
| Network & Telecom – 1.2% | | | | | |
| AT&T, Inc., 4.5%, 5/15/35 | | $ | 8,154,000 | | | $ | 7,542,091 | |
| Frontier Communications Corp., 11%, 9/15/25 (z) | | | 2,970,000 | | | | 2,940,300 | |
| Verizon Communications, Inc., 6.55%, 9/15/43 | | | 17,376,000 | | | | 20,628,388 | |
| | | | | | | | |
| | | $ | 31,110,779 | |
| | | | | | | | |
| Oil Services – 0.4% | | | | | |
| Odebrecht Offshore Drilling Finance Ltd., 6.75%, 10/01/22 (n) | | $ | 5,875,093 | | | $ | 1,351,271 | |
| Schlumberger Norge A.S., 1.25%, 8/01/17 (n) | | | 8,144,000 | | | | 8,067,308 | |
| | | | | | | | |
| | | $ | 9,418,579 | |
| | | | | | | | |
| Oils – 0.1% | | | | | |
| Valero Energy Corp., 4.9%, 3/15/45 | | $ | 2,309,000 | | | $ | 1,924,304 | |
| | | | | | | | |
| Other Banks & Diversified Financials – 3.0% | | | | | |
| Abbey National Treasury Services PLC, 3.05%, 8/23/18 | | $ | 2,885,000 | | | $ | 2,960,826 | |
| Bank of Tokyo-Mitsubishi UFJ Ltd., 2.7%, 9/09/18 (n) | | | 5,269,000 | | | | 5,326,364 | |
| BBVA Bancomer S.A. de C.V., 6.75%, 9/30/22 (n) | | | 2,570,000 | | | | 2,827,000 | |
| BPCE S.A., 4.5%, 3/15/25 (n) | | | 5,771,000 | | | | 5,538,954 | |
| Capital One Bank (USA) N.A., 3.375%, 2/15/23 | | | 10,111,000 | | | | 9,898,993 | |
Capital One Financial Corp.,
6.15%, 9/01/16 | | | 1,203,000 | | | | 1,239,576 | |
| Citigroup, Inc., 4.4%, 6/10/25 | | | 4,533,000 | | | | 4,580,506 | |
| Citizens Financial Group, Inc., 4.3%, 12/03/25 | | | 1,860,000 | | | | 1,871,283 | |
| Discover Bank, 7%, 4/15/20 | | | 7,009,000 | | | | 7,981,555 | |
| Groupe BPCE S.A., 12.5% to 9/30/19, FRN to 8/29/49 (n) | | | 7,880,000 | | | | 10,087,976 | |
| Macquarie Group Ltd., 3%, 12/03/18 (n) | | | 350,000 | | | | 353,261 | |
12
MFS Total Return Bond Series
Portfolio of Investments – continued
| | | | | | | | |
| Issuer | | Shares/Par | | | Value ($) | |
| | | | | | | | |
| BONDS – continued | | | | | | | | |
| Other Banks & Diversified Financials – continued | |
| Rabobank Nederland N.V., 3.95%, 11/09/22 | | $ | 4,408,000 | | | $ | 4,462,320 | |
| U.S. Bank NA Cincinnati, 2.8%, 1/27/25 | | | 2,136,000 | | | | 2,079,834 | |
| UBS Group Funding (Jersey) Ltd., 4.125%, 9/24/25 (z) | | | 4,836,000 | | | | 4,834,008 | |
| Visa, Inc., 2.8%, 12/14/22 | | | 13,000,000 | | | | 13,023,374 | |
| | | | | | | | |
| | | $ | 77,065,830 | |
| | | | | | | | |
| Pharmaceuticals – 3.1% | | | | | |
| AbbVie, Inc., 4.5%, 5/14/35 | | $ | 4,677,000 | | | $ | 4,579,181 | |
| Actavis Funding SCS, 3%, 3/12/20 | | | 4,494,000 | | | | 4,490,418 | |
| Actavis Funding SCS, 4.85%, 6/15/44 | | | 1,631,000 | | | | 1,614,401 | |
| Actavis Funding SCS, 4.55%, 3/15/35 | | | 2,232,000 | | | | 2,169,410 | |
| Bayer U.S. Finance LLC, 3.375%, 10/08/24 (n) | | | 2,779,000 | | | | 2,799,879 | |
| Biogen, Inc., 5.2%, 9/15/45 | | | 4,888,000 | | | | 4,889,398 | |
| Celgene Corp., 2.875%, 8/15/20 | | | 13,158,000 | | | | 13,063,933 | |
| Celgene Corp., 1.9%, 8/15/17 | | | 5,062,000 | | | | 5,081,150 | |
| Endo Finance LLC/Endo Finco, Inc., 6%, 7/15/23 (n) | | | 1,485,000 | | | | 1,477,575 | |
| Forest Laboratories, Inc., 4.875%, 2/15/21 (n) | | | 18,926,000 | | | | 20,501,627 | |
| Gilead Sciences, Inc., 4.8%, 4/01/44 | | | 6,643,000 | | | | 6,663,952 | |
| Gilead Sciences, Inc., 2.35%, 2/01/20 | | | 817,000 | | | | 817,706 | |
| Gilead Sciences, Inc., 4.75%, 3/01/46 | | | 3,545,000 | | | | 3,585,300 | |
| Valeant Pharmaceuticals International, Inc., 5.625%, 12/01/21 (n) | | | 4,050,000 | | | | 3,726,000 | |
| VPII Escrow Corp., 6.75%, 8/15/18 (z) | | | 3,795,000 | | | | 3,760,845 | |
| | | | | | | | |
| | | $ | 79,220,775 | |
| | | | | | | | |
| Precious Metals & Minerals – 0.1% | | | | | |
| Teck Resources Ltd., 6%, 8/15/40 | | $ | 826,000 | | | $ | 346,920 | |
| Teck Resources Ltd., 5.4%, 2/01/43 | | | 3,323,000 | | | | 1,395,660 | |
| | | | | | | | |
| | | $ | 1,742,580 | |
| | | | | | | | |
| Real Estate – Apartment – 0.1% | | | | | |
| Mid-America Apartment Communities, Inc., REIT, 4.3%, 10/15/23 | | $ | 2,417,000 | | | $ | 2,478,029 | |
| | | | | | | | |
| Real Estate – Healthcare – 0.3% | | | | | | | | |
| HCP, Inc., REIT, 3.875%, 8/15/24 | | $ | 5,515,000 | | | $ | 5,345,237 | |
| HCP, Inc., REIT, 5.375%, 2/01/21 | | | 1,134,000 | | | | 1,235,398 | |
| | | | | | | | |
| | | $ | 6,580,635 | |
| | | | | | | | |
| Real Estate – Office – 0.4% | | | | | |
| Boston Properties LP, REIT, 3.7%, 11/15/18 | | $ | 5,395,000 | | | $ | 5,589,468 | |
| Boston Properties LP, REIT, 3.8%, 2/01/24 | | | 3,803,000 | | | | 3,868,750 | |
| | | | | | | | |
| | | $ | 9,458,218 | |
| | | | | | | | |
| Real Estate – Other – 0.0% | | | | | |
| Liberty Property LP, REIT, 5.5%, 12/15/16 | | $ | 1,013,000 | | | $ | 1,046,290 | |
| | | | | | | | |
| Real Estate – Retail – 0.7% | | | | | | | | |
| Brixmor Operating Partnership LP, REIT, 3.875%, 8/15/22 | | $ | 4,811,000 | | | $ | 4,789,456 | |
| DDR Corp., REIT, 4.625%, 7/15/22 | | | 2,365,000 | | | | 2,444,880 | |
| | | | | | | | |
| Issuer | | Shares/Par | | | Value ($) | |
| | | | | | | | |
| BONDS – continued | | | | | | | | |
| Real Estate – Retail – continued | | | | | | | | |
| DDR Corp., REIT, 3.375%, 5/15/23 | | $ | 6,575,000 | | | $ | 6,213,572 | |
| Simon Property Group, Inc., REIT, 10.35%, 4/01/19 | | | 3,213,000 | | | | 3,942,929 | |
| | | | | | | | |
| | | $ | 17,390,837 | |
| | | | | | | | |
| Restaurants – 0.3% | | | | | |
| McDonald’s Corp., 3.7%, 1/30/26 | | $ | 3,642,000 | | | $ | 3,639,913 | |
| YUM! Brands, Inc., 5.35%, 11/01/43 | | | 3,864,000 | | | | 2,949,445 | |
| | | | | | | | |
| | | $ | 6,589,358 | |
| | | | | | | | |
| Retailers – 1.0% | | | | | |
| Bed Bath & Beyond, Inc., 5.165%, 8/01/44 | | $ | 7,156,000 | | | $ | 6,061,576 | |
| Dollar General Corp., 4.15%, 11/01/25 | | | 2,641,000 | | | | 2,625,342 | |
| Dollar General Corp., 3.25%, 4/15/23 | | | 3,635,000 | | | | 3,461,989 | |
| Gap, Inc., 5.95%, 4/12/21 | | | 7,230,000 | | | | 7,651,993 | |
| Home Depot, Inc., 2.625%, 6/01/22 | | | 4,732,000 | | | | 4,727,613 | |
| | | | | | | | |
| | | $ | 24,528,513 | |
| | | | | | | | |
| Supermarkets – 0.1% | | | | | |
| Kroger Co., 3.85%, 8/01/23 | | $ | 2,248,000 | | | $ | 2,317,866 | |
| | | | | | | | |
| Telecommunications – Wireless – 0.7% | | | | | |
| American Tower Corp., REIT, 5%, 2/15/24 | | $ | 7,009,000 | | | $ | 7,419,748 | |
| Crown Castle Towers LLC, 4.883%, 8/15/20 (n) | | | 952,000 | | | | 1,017,756 | |
| MTS International Funding Ltd., 5%, 5/30/23 (n) | | | 4,798,000 | | | | 4,426,155 | |
| Numericable Group S.A., 6%, 5/15/22 (n) | | | 1,185,000 | | | | 1,149,450 | |
| SBA Tower Trust, 2.898%, 10/15/44 (n) | | | 4,229,000 | | | | 4,133,381 | |
| | | | | | | | |
| | | $ | 18,146,490 | |
| | | | | | | | |
| Tobacco – 1.3% | | | | | |
| Imperial Tobacco Finance PLC, 3.75%, 7/21/22 (n) | | $ | 7,775,000 | | | $ | 7,807,010 | |
| Reynolds American, Inc., 8.125%, 6/23/19 | | | 3,344,000 | | | | 3,935,510 | |
| Reynolds American, Inc., 4%, 6/12/22 | | | 8,396,000 | | | | 8,733,981 | |
| Reynolds American, Inc., 4.45%, 6/12/25 | | | 4,148,000 | | | | 4,340,538 | |
| Reynolds American, Inc., 6.75%, 6/15/17 | | | 7,300,000 | | | | 7,793,100 | |
| | | | | | | | |
| | | $ | 32,610,139 | |
| | | | | | | | |
| Transportation – Services – 0.3% | | | | | |
| ERAC USA Finance LLC, 3.85%, 11/15/24 (n) | | $ | 1,612,000 | | | $ | 1,613,285 | |
| ERAC USA Finance LLC, 7%, 10/15/37 (n) | | | 2,690,000 | | | | 3,274,376 | |
| Navios Maritime Holding, Inc., 7.375%, 1/15/22 (n) | | | 7,405,000 | | | | 3,702,500 | |
| | | | | | | | |
| | | $ | 8,590,161 | |
| | | | | | | | |
| U.S. Government Agencies and Equivalents – 2.4% | |
| National Credit Union Administration Guaranteed Note, 2.9%, 10/29/20 | | $ | 552,322 | | | $ | 550,972 | |
| Small Business Administration, 4.93%, 1/01/24 | | | 23,754 | | | | 25,495 | |
| Small Business Administration, 4.34%, 3/01/24 | | | 39,333 | | | | 41,165 | |
13
MFS Total Return Bond Series
Portfolio of Investments – continued
| | | | | | | | |
| Issuer | | Shares/Par | | | Value ($) | |
| | | | | | | | |
| BONDS – continued | | | | | | | | |
| U.S. Government Agencies and Equivalents – continued | |
| Small Business Administration, 4.99%, 9/01/24 | | $ | 26,884 | | | $ | 28,895 | |
| Small Business Administration, 4.86%, 1/01/25 | | | 66,316 | | | | 70,522 | |
| Small Business Administration, 4.625%, 2/01/25 | | | 68,039 | | | | 72,019 | |
| Small Business Administration, 5.11%, 4/01/25 | | | 47,995 | | | | 51,930 | |
| Small Business Administration, 4.43%, 5/01/29 | | | 642,251 | | | | 691,480 | |
| Small Business Administration, 3.25%, 11/01/30 | | | 589,752 | | | | 610,866 | |
| Small Business Administration, 2.85%, 9/01/31 | | | 1,343,737 | | | | 1,371,447 | |
| Small Business Administration, 2.37%, 8/01/32 | | | 1,140,928 | | | | 1,133,139 | |
| Small Business Administration, 3.21%, 9/01/30 | | | 6,402,502 | | | | 6,627,214 | |
| Small Business Administration, 2.13%, 1/01/33 | | | 4,136,374 | �� | | | 4,059,469 | |
| Small Business Administration, 2.21%, 2/01/33 | | | 1,050,386 | | | | 1,034,187 | |
| Small Business Administration, 2.22%, 3/01/33 | | | 3,885,681 | | | | 3,834,230 | |
| Small Business Administration, 2.08%, 4/01/33 | | | 5,591,199 | | | | 5,467,820 | |
| Small Business Administration, 2.45%, 6/01/33 | | | 6,856,019 | | | | 6,839,142 | |
| Small Business Administration, 3.15%, 7/01/33 | | | 9,484,951 | | | | 9,768,838 | |
| Small Business Administration, 3.16%, 8/01/33 | | | 9,491,029 | | | | 9,779,453 | |
| Small Business Administration, 3.62%, 9/01/33 | | | 8,971,023 | | | | 9,536,078 | |
| | | | | | | | |
| | | $ | 61,594,361 | |
| | | | | | | | |
| U.S. Treasury Obligations – 14.6% | | | | | |
| U.S. Treasury Bonds, 4.5%, 2/15/36 | | $ | 12,590,000 | | | $ | 16,113,160 | |
| U.S. Treasury Bonds, 4.75%, 2/15/37 | | | 1,576,000 | | | | 2,085,806 | |
| U.S. Treasury Bonds, 4.375%, 2/15/38 | | | 17,377,000 | | | | 21,892,153 | |
| U.S. Treasury Bonds, 4.5%, 8/15/39 | | | 10,455,600 | | | | 13,357,019 | |
| U.S. Treasury Bonds, 3.125%, 11/15/41 | | | 500,000 | | | | 515,496 | |
| U.S. Treasury Bonds, 3.125%, 2/15/42 | | | 1,300,000 | | | | 1,339,530 | |
| U.S. Treasury Bonds, 2.875%, 5/15/43 | | | 23,973,600 | | | | 23,325,881 | |
| U.S. Treasury Notes, 0.875%, 12/31/16 | | | 16,433,000 | | | | 16,443,764 | |
| U.S. Treasury Notes, 0.75%, 6/30/17 (f) | | | 121,620,000 | | | | 121,244,681 | |
| U.S. Treasury Notes, 0.75%, 12/31/17 | | | 3,000,000 | | | | 2,979,975 | |
| U.S. Treasury Notes, 2.875%, 3/31/18 | | | 2,000,000 | | | | 2,076,722 | |
| | | | | | | | |
| Issuer | | Shares/Par | | | Value ($) | |
| | | | | | | | |
| BONDS – continued | | | | | | | | |
| U.S. Treasury Obligations – continued | | | | | |
| U.S. Treasury Notes, 2.625%, 4/30/18 | | $ | 1,600,000 | | | $ | 1,654,277 | |
| U.S. Treasury Notes, 1.5%, 8/31/18 | | | 13,955,000 | | | | 14,049,978 | |
| U.S. Treasury Notes, 1.625%, 6/30/19 | | | 119,619,000 | | | | 120,179,176 | |
| U.S. Treasury Notes, 1%, 8/31/19 | | | 5,600,000 | | | | 5,490,246 | |
| U.S. Treasury Notes, 3.375%, 11/15/19 | | | 1,800,000 | | | | 1,922,778 | |
| U.S. Treasury Notes, 3.625%, 2/15/20 | | | 4,200,000 | | | | 4,531,901 | |
| U.S. Treasury Notes, 3%, 11/15/45 | | | 5,000,000 | | | | 4,975,560 | |
| U.S. Treasury Notes, TIPS, 2%, 1/15/16 | | | 1,473,626 | | | | 1,473,322 | |
| | | | | | | | |
| | | $ | 375,651,425 | |
| | | | | | | | |
| Utilities – Electric Power – 2.4% | | | | | |
| Berkshire Hathaway Energy Co., 5.15%, 11/15/43 | | $ | 6,436,000 | | | $ | 6,791,473 | |
| CMS Energy Corp., 6.25%, 2/01/20 | | | 1,925,000 | | | | 2,183,633 | |
| CMS Energy Corp., 5.05%, 3/15/22 | | | 5,272,000 | | | | 5,737,011 | |
| Constellation Energy Group, Inc., 5.15%, 12/01/20 | | | 2,487,000 | | | | 2,701,369 | |
| Dominion Resources, Inc., 3.9%, 10/01/25 | | | 2,048,000 | | | | 2,051,492 | |
| Dominion Resources, Inc., 3.625%, 12/01/24 | | | 6,901,000 | | | | 6,837,428 | |
| EDP Finance B.V., 4.9%, 10/01/19 (n) | | | 3,647,000 | | | | 3,755,695 | |
| EDP Finance B.V., 5.25%, 1/14/21 (n) | | | 7,774,000 | | | | 8,033,325 | |
| Enel Finance International S.A., 6.25%, 9/15/17 (n) | | | 3,623,000 | | | | 3,860,622 | |
| Exelon Generation Co. LLC, 4.25%, 6/15/22 | | | 6,123,000 | | | | 6,204,056 | |
| PPL Capital Funding, Inc., 5%, 3/15/44 | | | 3,429,000 | | | | 3,535,186 | |
| PPL Corp., 3.5%, 12/01/22 | | | 1,050,000 | | | | 1,058,258 | |
| PPL WEM Holdings PLC, 5.375%, 5/01/21 (n) | | | 8,842,000 | | | | 9,648,001 | |
| Waterford 3 Funding Corp., 8.09%, 1/02/17 | | | 32,502 | | | | 32,424 | |
| | | | | | | | |
| | | $ | 62,429,973 | |
| | | | | | | | |
Total Bonds
(Identified Cost, $2,552,181,423) | | | $ | 2,514,764,307 | |
| | | | | | | | |
| |
| MONEY MARKET FUNDS – 3.3% | | | | | |
| MFS Institutional Money Market Portfolio, 0.19%, at Cost and Net Asset Value (v) | | | 86,235,675 | | | $ | 86,235,675 | |
| | | | | | | | |
Total Investments
(Identified Cost, $2,638,417,098) | | | $ | 2,600,999,982 | |
| | | | | | | | |
OTHER ASSETS, LESS
LIABILITIES – (1.2)% | | | | (31,242,924 | ) |
| | | | | | | | |
| NET ASSETS – 100.0% | | | $ | 2,569,757,058 | |
| | | | | | | | |
| (f) | | All or a portion of the security has been segregated as collateral for open futures contracts. |
| (i) | | Interest only security for which the fund receives interest on notional principal (Par amount). Par amount shown is the notional principal and does not reflect the cost of the security. |
| (n) | | Securities exempt from registration under Rule 144A of the Securities Act of 1933. These securities may be sold in the ordinary course of business in transactions exempt from registration, normally to qualified institutional buyers. At period end, the aggregate value of these securities was $344,327,196 representing 13.4% of net assets. |
14
MFS Total Return Bond Series
Portfolio of Investments – continued
| (v) | | Underlying affiliated fund that is available only to investment companies managed by MFS. The rate quoted for the MFS Institutional Money Market Portfolio is the annualized seven-day yield of the fund at period end. |
| (z) | | Restricted securities are not registered under the Securities Act of 1933 and are subject to legal restrictions on resale. These securities generally may be resold in transactions exempt from registration or to the public if the securities are subsequently registered. Disposal of these securities may involve time-consuming negotiations and prompt sale at an acceptable price may be difficult. The fund holds the following restricted securities: |
| | | | | | | | | | |
| Restricted Securities | | Acquisition
Date | |
Cost | | | Value | |
| Alm XIV Ltd., CLO, 2014-14A, “A1” , FRN, 1.753%, 7/28/26 | | 4/02/15 | | | $8,994,424 | | | | $8,919,287 | |
| Babson Ltd., CLO, FRN, 1.417%, 4/20/25 | | 3/12/14-5/04/15 | | | 9,765,840 | | | | 9,667,538 | |
| Bayview Commercial Asset Trust, FRN, 0%, 4/25/36 | | 2/28/06 | | | 22,999 | | | | 860 | |
| Bayview Commercial Asset Trust, FRN, 0%, 7/25/36 | | 5/16/06 | | | 14,623 | | | | 0 | |
| Bayview Commercial Asset Trust, FRN, 0%, 10/25/36 | | 9/11/06 | | | 47,005 | | | | 0 | |
| Bayview Commercial Asset Trust, FRN, 0%, 12/25/36 | | 10/25/06 | | | 106,562 | | | | 0 | |
| Bayview Commercial Asset Trust, FRN, 0%, 3/25/37 | | 1/26/07 | | | 10,299 | | | | 0 | |
| Bayview Financial Revolving Mortgage Loan Trust, FRN, 1.832%, 12/28/40 | | 3/01/06 | | | 132,470 | | | | 96,972 | |
| Cent CLO LP, 2014-16AR, “A1AR”, FRN, 1.578%, 8/01/24 | | 4/02/15 | | | 5,669,598 | | | | 5,649,902 | |
| Commercial Mortgage Asset Trust, FRN, 0.486%, 1/17/32 | | 4/09/12 | | | 1,700 | | | | 1,407 | |
| Credit Suisse Group Fund Guernsey Ltd., 3.75%, 3/26/25 | | 3/23/15 | | | 3,347,465 | | | | 3,241,255 | |
| Dryden Senior Loan Fund, CLO, “A”, FRN, 1.7%, 1/15/25 | | 9/19/14 | | | 7,540,057 | | | | 7,498,392 | |
| Falcon Franchise Loan LLC, FRN, 39.274%, 1/05/25 | | 1/29/03 | | | 491 | | | | 1,445 | |
| First Union National Bank Commercial Mortgage Trust, FRN, 1.467%, 1/12/43 | | 4/09/12 | | | 3 | | | | 252 | |
| Flatiron CLO Ltd. 2013-1A, “A1”, FRN, 1.715%, 1/17/26 | | 7/24/14-9/09/14 | | | 8,318,041 | | | | 8,238,688 | |
| Frontier Communications Corp., 11%, 9/15/25 | | 12/18/15 | | | 2,836,540 | | | | 2,940,300 | |
| Hertz Fleet Lease Funding LP, 2014-1, FRN, 0.693%, 4/10/28 | | 3/25/14 | | | 5,095,001 | | | | 5,082,445 | |
| Nextgear Floorplan Master Owner Trust, 2015-2A, “A”, 2.38%, 10/15/20 | | 10/23/15 | | | 7,585,347 | | | | 7,514,729 | |
| Preferred Term Securities XIX Ltd., CDO, FRN, 0.862%, 12/22/35 | | 3/28/11 | | | 224,476 | | | | 228,615 | |
| SES S.A., 5.3%, 4/04/43 | | 1/08/14 | | | 3,180,281 | | | | 3,143,047 | |
| UBS Group Funding (Jersey) Ltd., 4.125%, 9/24/25 | | 9/21/15 | | | 4,827,158 | | | | 4,834,008 | |
| VPII Escrow Corp., 6.75%, 8/15/18 | | 6/27/13 | | | 3,795,000 | | | | 3,760,845 | |
| Total Restricted Securities | | | | $70,819,987 | |
| % of Net assets | | | | 2.8% | |
The following abbreviations are used in this report and are defined:
| CDO | | Collateralized Debt Obligation |
| CLO | | Collateralized Loan Obligation |
| FRN | | Floating Rate Note. Interest rate resets periodically and the current rate may not be the rate reported at period end. |
| PLC | | Public Limited Company |
| REIT | | Real Estate Investment Trust |
| TIPS | | Treasury Inflation Protected Security |
15
MFS Total Return Bond Series
Portfolio of Investments – continued
Derivative Contracts at 12/31/15
Futures Contracts at 12/31/15
| | | | | | | | | | | | | | | | | | |
| Description | | Currency | | | Contracts | | | Value | | Expiration
Date | | | Unrealized
Appreciation
(Depreciation) | |
| Asset Derivatives | | | | | | | | | | | | | | | | | | |
| Interest Rate Futures | | | | | | | | | | | | | | | | | | |
| U.S. Treasury Note 10 yr (Short) | | | USD | | | | 175 | | | $22,033,594 | | | March - 2016 | | | | $89,364 | |
| U.S. Treasury Bond 30 yr (Long) | | | USD | | | | 140 | | | 21,525,000 | | | March - 2016 | | | | 11,277 | |
| U.S. Ultra Bond (Long) | | | USD | | | | 120 | | | 19,042,500 | | | March - 2016 | | | | 99,686 | |
| | | | | | | | | | | | | | | | | | |
| | | | | | | | | | | | | | | | | $200,327 | |
| | | | | | | | | | | | | | | | | | |
At December 31, 2015, the fund had liquid securities with an aggregate value of $909,182 to cover any commitments for certain derivative contracts.
See Notes to Financial Statements
16
MFS Total Return Bond Series
FINANCIAL STATEMENTS | STATEMENT OF ASSETS AND LIABILITIES
This statement represents your fund’s balance sheet, which details the assets and liabilities comprising the total value of the fund.
| | | | | | | | |
At 12/31/15 | | | | | | | | |
Assets | | | | | | | | |
Investments | | | | | | | | |
Non-affiliated issuers, at value (identified cost, $2,552,181,423) | | | $2,514,764,307 | | | | | |
Underlying affiliated funds, at cost and value | | | 86,235,675 | | | | | |
Total investments, at value (identified cost, $2,638,417,098) | | | $2,600,999,982 | | | | | |
Cash | | | 152,071 | | | | | |
Receivables for | | | | | | | | |
Daily variation margin on open futures contracts | | | 141,875 | | | | | |
Investments sold | | | 2,708,065 | | | | | |
Fund shares sold | | | 417,063 | | | | | |
Interest | | | 19,510,166 | | | | | |
Other assets | | | 14,873 | | | | | |
Total assets | | | | | | | $2,623,944,095 | |
Liabilities | | | | | | | | |
Payables for | | | | | | | | |
Investments purchased | | | $2,718,569 | | | | | |
TBA purchase commitments | | | 49,433,321 | | | | | |
Fund shares reacquired | | | 1,733,193 | | | | | |
Payable to affiliates | | | | | | | | |
Investment adviser | | | 70,959 | | | | | |
Shareholder servicing costs | | | 274 | | | | | |
Distribution and/or service fees | | | 21,060 | | | | | |
Payable for independent Trustees’ compensation | | | 16 | | | | | |
Accrued expenses and other liabilities | | | 209,645 | | | | | |
Total liabilities | | | | | | | $54,187,037 | |
Net assets | | | | | | | $2,569,757,058 | |
Net assets consist of | | | | | | | | |
Paid-in capital | | | $2,546,698,592 | | | | | |
Unrealized appreciation (depreciation) on investments | | | (37,216,789 | ) | | | | |
Accumulated net realized gain (loss) on investments | | | (22,863,784 | ) | | | | |
Undistributed net investment income | | | 83,139,039 | | | | | |
Net assets | | | | | | | $2,569,757,058 | |
Shares of beneficial interest outstanding | | | | | | | 199,669,627 | |
| | | | | | | | | | | | |
| | | Net assets | | | Shares outstanding | | | Net asset value per share | |
Initial Class | | | $1,030,562,659 | | | | 79,262,438 | | | | $13.00 | |
Service Class | | | 1,539,194,399 | | | | 120,407,189 | | | | 12.78 | |
See Notes to Financial Statements
17
MFS Total Return Bond Series
FINANCIAL STATEMENTS | STATEMENT OF OPERATIONS
This statement describes how much your fund earned in investment income and accrued in expenses. It also describes any gains and/or losses generated by fund operations.
| | | | | | | | |
Year ended 12/31/15 | | | | | | | | |
Net investment income | | | | | | | | |
Income | | | | | | | | |
Interest | | | $94,611,459 | | | | | |
Dividends from underlying affiliated funds | | | 106,558 | | | | | |
Total investment income | | | | | | | $94,718,017 | |
Expenses | | | | | | | | |
Management fee | | | $14,105,636 | | | | | |
Distribution and/or service fees | | | 4,295,533 | | | | | |
Shareholder servicing costs | | | 64,516 | | | | | |
Administrative services fee | | | 450,859 | | | | | |
Independent Trustees’ compensation | | | 44,957 | | | | | |
Custodian fee | | | 159,730 | | | | | |
Shareholder communications | | | 173,647 | | | | | |
Audit and tax fees | | | 76,000 | | | | | |
Legal fees | | | 22,610 | | | | | |
Miscellaneous | | | 78,204 | | | | | |
Total expenses | | | | | | | $19,471,692 | |
Fees paid indirectly | | | (713 | ) | | | | |
Reduction of expenses by investment adviser | | | (356,245 | ) | | | | |
Net expenses | | | | | | | $19,114,734 | |
Net investment income | | | | | | | $75,603,283 | |
Realized and unrealized gain (loss) on investments | | | | | | | | |
Realized gain (loss) (identified cost basis) | | | | | | | | |
Investments | | | $13,804,373 | | | | | |
Futures contracts | | | (1,628,385 | ) | | | | |
Swap agreements | | | 208,537 | | | | | |
Net realized gain (loss) on investments | | | | | | | $12,384,525 | |
Change in unrealized appreciation (depreciation) | | | | | | | | |
Investments | | | $(98,701,949 | ) | | | | |
Futures contracts | | | 1,547,906 | | | | | |
Net unrealized gain (loss) on investments | | | | | | | $(97,154,043 | ) |
Net realized and unrealized gain (loss) on investments | | | | | | | $(84,769,518 | ) |
Change in net assets from operations | | | | | | | $(9,166,235 | ) |
See Notes to Financial Statements
18
MFS Total Return Bond Series
FINANCIAL STATEMENTS | STATEMENTS OF CHANGES IN NET ASSETS
These statements describe the increases and/or decreases in net assets resulting from operations, any distributions, and any shareholder transactions.
| | | | | | | | |
For years ended 12/31 | | | 2015 | | | | 2014 | |
Change in net assets | | | | | | | | |
From operations | | | | | | | | |
Net investment income | | | $75,603,283 | | | | $78,198,709 | |
Net realized gain (loss) on investments | | | 12,384,525 | | | | 9,279,964 | |
Net unrealized gain (loss) on investments | | | (97,154,043 | ) | | | 81,484,435 | |
Change in net assets from operations | | | $(9,166,235 | ) | | | $168,963,108 | |
Distributions declared to shareholders | | | | | | | | |
From net investment income | | | $(91,851,876 | ) | | | $(82,917,411 | ) |
Change in net assets from fund share transactions | | | $(353,129,539 | ) | | | $(106,862,454 | ) |
Total change in net assets | | | $(454,147,650 | ) | | | $(20,816,757 | ) |
Net assets | | | | | | | | |
At beginning of period | | | 3,023,904,708 | | | | 3,044,721,465 | |
At end of period (including undistributed net investment income of $83,139,039 and
$91,848,410, respectively) | | | $2,569,757,058 | | | | $3,023,904,708 | |
See Notes to Financial Statements
19
MFS Total Return Bond Series
FINANCIAL STATEMENTS | FINANCIAL HIGHLIGHTS
The financial highlights table is intended to help you understand the fund’s financial performance for the past 5 years. Certain information reflects financial results for a single fund share. The total returns in the table represent the rate by which an investor would have earned (or lost) on an investment in the fund share class (assuming reinvestment of all distributions) held for the entire period.
| | | | | | | | | | | | | | | | | | | | |
| Initial Class | | Years ended 12/31 | |
| | | 2015 | | | 2014 | | | 2013 | | | 2012 | | | 2011 | |
Net asset value, beginning of period | | | $13.50 | | | | $13.13 | | | | $13.49 | | | | $13.01 | | | | $12.66 | |
| Income (loss) from investment operations | | | | | | | | | | | | | | | | | | | | |
Net investment income (d) | | | $0.38 | | | | $0.37 | | | | $0.35 | | | | $0.37 | | | | $0.44 | |
Net realized and unrealized gain (loss) on investments | | | (0.42 | ) | | | 0.40 | | | | (0.49 | ) | | | 0.57 | | | | 0.41 | |
Total from investment operations | | | $(0.04 | ) | | | $0.77 | | | | $(0.14 | ) | | | $0.94 | | | | $0.85 | |
| Less distributions declared to shareholders | | | | | | | | | | | | | | | | | | | | |
From net investment income | | | $(0.46 | ) | | | $(0.40 | ) | | | $(0.16 | ) | | | $(0.37 | ) | | | $(0.35 | ) |
From net realized gain on investments | | | — | | | | — | | | | (0.06 | ) | | | (0.09 | ) | | | (0.15 | ) |
Total distributions declared to shareholders | | | $(0.46 | ) | | | $(0.40 | ) | | | $(0.22 | ) | | | $(0.46 | ) | | | $(0.50 | ) |
Net asset value, end of period (x) | | | $13.00 | | | | $13.50 | | | | $13.13 | | | | $13.49 | | | | $13.01 | |
Total return (%) (k)(r)(s)(x) | | | (0.30 | ) | | | 5.85 | | | | (1.03 | ) | | | 7.35 | | | | 6.75 | |
Ratios (%) (to average net assets)
and Supplemental data: | | | | | | | | | | | | | | | | | | | | |
Expenses before expense reductions (f) | | | 0.54 | | | | 0.53 | | | | 0.54 | | | | 0.56 | | | | 0.57 | |
Expenses after expense reductions (f) | | | 0.53 | | | | 0.52 | | | | 0.53 | | | | 0.56 | | | | 0.57 | |
Net investment income | | | 2.83 | | | | 2.74 | | | | 2.65 | | | | 2.76 | | | | 3.41 | |
Portfolio turnover | | | 62 | | | | 58 | | | | 68 | | | | 114 | | | | 60 | |
Net assets at end of period (000 omitted) | | | $1,030,563 | | | | $1,172,957 | | | | $1,208,132 | | | | $850,417 | | | | $367,398 | |
See Notes to Financial Statements
20
MFS Total Return Bond Series
Financial Highlights – continued
| | | | | | | | | | | | | | | | | | | | |
| Service Class | | Years ended 12/31 | |
| | | 2015 | | | 2014 | | | 2013 | | | 2012 | | | 2011 | |
Net asset value, beginning of period | | | $13.28 | | | | $12.92 | | | | $13.30 | | | | $12.85 | | | | $12.53 | |
| Income (loss) from investment operations | | | | | | | | | | | | | | | | | | | | |
Net investment income (d) | | | $0.34 | | | | $0.33 | | | | $0.31 | | | | $0.33 | | | | $0.40 | |
Net realized and unrealized gain (loss) on investments | | | (0.41 | ) | | | 0.39 | | | | (0.48 | ) | | | 0.57 | | | | 0.41 | |
Total from investment operations | | | $(0.07 | ) | | | $0.72 | | | | $(0.17 | ) | | | $0.90 | | | | $0.81 | |
| Less distributions declared to shareholders | | | | | | | | | | | | | | | | | | | | |
From net investment income | | | $(0.43 | ) | | | $(0.36 | ) | | | $(0.15 | ) | | | $(0.36 | ) | | | $(0.34 | ) |
From net realized gain on investments | | | — | | | | — | | | | (0.06 | ) | | | (0.09 | ) | | | (0.15 | ) |
Total distributions declared to shareholders | | | $(0.43 | ) | | | $(0.36 | ) | | | $(0.21 | ) | | | $(0.45 | ) | | | $(0.49 | ) |
Net asset value, end of period (x) | | | $12.78 | | | | $13.28 | | | | $12.92 | | | | $13.30 | | | | $12.85 | |
Total return (%) (k)(r)(s)(x) | | | (0.58 | ) | | | 5.62 | | | | (1.29 | ) | | | 7.06 | | | | 6.48 | |
Ratios (%) (to average net assets)
and Supplemental data: | | | | | | | | | | | | | | | | | | | | |
Expenses before expense reductions (f) | | | 0.79 | | | | 0.78 | | | | 0.79 | | | | 0.81 | | | | 0.82 | |
Expenses after expense reductions (f) | | | 0.78 | | | | 0.77 | | | | 0.78 | | | | 0.81 | | | | 0.82 | |
Net investment income | | | 2.58 | | | | 2.48 | | | | 2.39 | | | | 2.48 | | | | 3.13 | |
Portfolio turnover | | | 62 | | | | 58 | | | | 68 | | | | 114 | | | | 60 | |
Net assets at end of period (000 omitted) | | | $1,539,194 | | | | $1,850,948 | | | | $1,836,589 | | | | $1,646,291 | | | | $406,273 | |
| (d) | Per share data is based on average shares outstanding. |
| (f) | Ratios do not reflect reductions from fees paid indirectly, if applicable. |
| (k) | The total return does not reflect expenses that apply to separate accounts. Inclusion of these charges would reduce the total return figures for all periods shown. |
| (r) | Certain expenses have been reduced without which performance would have been lower. |
| (s) | From time to time the fund may receive proceeds from litigation settlements, without which performance would be lower. |
| (x) | The net asset values and total returns have been calculated on net assets which include adjustments made in accordance with U.S. generally accepted accounting principles required at period end for financial reporting purposes. |
See Notes to Financial Statements
21
MFS Total Return Bond Series
NOTES TO FINANCIAL STATEMENTS
| (1) | | Business and Organization |
MFS Total Return Bond Series (formerly MFS Research Bond Series) (the fund) is a diversified series of MFS Variable Insurance Trust (the trust). The trust is organized as a Massachusetts business trust and is registered under the Investment Company Act of 1940, as amended, as an open-end management investment company. The shareholders of each series of the trust are separate accounts of insurance companies, which offer variable annuity and/or life insurance products, and qualified retirement and pension plans. Effective April 30, 2015, the fund’s name changed from MFS Research Bond Series to MFS Total Return Bond Series.
The fund is an investment company and accordingly follows the investment company accounting and reporting guidance of the Financial Accounting Standards Board (FASB) Accounting Standards Codification Topic 946 Financial Services – Investment Companies.
| (2) | | Significant Accounting Policies |
General – The preparation of financial statements in conformity with U.S. generally accepted accounting principles requires management to make estimates and assumptions that affect the reported amounts of assets and liabilities, and disclosure of contingent assets and liabilities at the date of the financial statements and the reported amounts of increases and decreases in net assets from operations during the reporting period. Actual results could differ from those estimates. In the preparation of these financial statements, management has evaluated subsequent events occurring after the date of the fund’s Statement of Assets and Liabilities through the date that the financial statements were issued. The fund invests in high-yield securities rated below investment grade. Investments in high-yield securities involve greater degrees of credit and market risk than investments in higher-rated securities and tend to be more sensitive to economic conditions.
In January 2016, FASB issued Accounting Standards Update 2016-01, Financial Instruments – Overall (Subtopic 825-10) – Recognition and Measurement of Financial Assets and Financial Liabilities (“ASU 2016-01”) which would first be effective for annual reporting periods beginning after December 15, 2017, and interim periods therein. ASU 2016-01, which changes the accounting for equity investments and for certain financial liabilities, also modifies the presentation and disclosure requirements for financial instruments. Investment companies are specifically exempted from ASU 2016-01’s equity investment accounting provisions and will continue to follow the industry specific guidance for investment accounting under ASC 946. Although still evaluating the potential impacts of ASU 2016-01 to the fund, management expects that the impact of the fund’s adoption will be limited to additional financial statement disclosures.
Balance Sheet Offsetting – The fund’s accounting policy with respect to balance sheet offsetting is that, absent an event of default by the counterparty or a termination of the agreement, the International Swaps and Derivatives Association (ISDA) Master Agreement does not result in an offset of reported amounts of financial assets and financial liabilities in the Statement of Assets and Liabilities across transactions between the fund and the applicable counterparty. The fund’s right to setoff may be restricted or prohibited by the bankruptcy or insolvency laws of the particular jurisdiction to which a specific master netting agreement counterparty is subject. Balance sheet offsetting disclosures, to the extent applicable to the fund, have been included in the fund’s Significant Accounting Policies note under the captions for each of the fund’s in-scope financial instruments and transactions.
Investment Valuations – Debt instruments and floating rate loans, including restricted debt instruments, are generally valued at an evaluated or composite bid as provided by a third-party pricing service. Short-term instruments with a maturity at issuance of 60 days or less may be valued at amortized cost, which approximates market value. Futures contracts are generally valued at last posted settlement price on their primary exchange as provided by a third-party pricing service. Futures contracts for which there were no trades that day for a particular position are generally valued at the closing bid quotation on their primary exchange as provided by a third-party pricing service. Swap agreements are generally valued at valuations provided by a third-party pricing service, which for cleared swaps includes an evaluation of any trading activity at the clearinghouses. Open-end investment companies are generally valued at net asset value per share. Securities and other assets generally valued on the basis of information from a third-party pricing service may also be valued at a broker/dealer bid quotation. Values obtained from third-party pricing services can utilize both transaction data and market information such as yield, quality, coupon rate, maturity, type of issue, trading characteristics, and other market data. The values of foreign securities and other assets and liabilities expressed in foreign currencies are converted to U.S. dollars using the mean of bid and asked prices for rates provided by a third-party pricing service.
The Board of Trustees has delegated primary responsibility for determining or causing to be determined the value of the fund’s investments (including any fair valuation) to the adviser pursuant to valuation policies and procedures approved by the Board. If the adviser determines that reliable market quotations are not readily available, investments are valued at fair value as determined in good faith by the adviser in accordance with such procedures under the oversight of the Board of Trustees. Under the fund’s valuation policies and procedures, market quotations are not considered to be readily available for most types of debt instruments and floating rate loans and many types of derivatives. These investments are generally valued at fair value based on information from third-party pricing services. In addition, investments may be valued at fair value if the adviser determines that an investment’s value has been materially affected by events occurring after the close of the exchange or market on which the investment is principally traded (such as foreign exchange or market) and prior to the determination of the fund’s net asset value, or after the halting of
22
MFS Total Return Bond Series
Notes to Financial Statements – continued
trading of a specific security where trading does not resume prior to the close of the exchange or market on which the security is principally traded. The adviser generally relies on third-party pricing services or other information (such as the correlation with price movements of similar securities in the same or other markets; the type, cost and investment characteristics of the security; the business and financial condition of the issuer; and trading and other market data) to assist in determining whether to fair value and at what value to fair value an investment. The value of an investment for purposes of calculating the fund’s net asset value can differ depending on the source and method used to determine value. When fair valuation is used, the value of an investment used to determine the fund’s net asset value may differ from quoted or published prices for the same investment. There can be no assurance that the fund could obtain the fair value assigned to an investment if it were to sell the investment at the same time at which the fund determines its net asset value per share.
Various inputs are used in determining the value of the fund’s assets or liabilities. These inputs are categorized into three broad levels. In certain cases, the inputs used to measure fair value may fall into different levels of the fair value hierarchy. In such cases, an investment’s level within the fair value hierarchy is based on the lowest level of input that is significant to the fair value measurement. The fund’s assessment of the significance of a particular input to the fair value measurement in its entirety requires judgment, and considers factors specific to the investment. Level 1 includes unadjusted quoted prices in active markets for identical assets or liabilities. Level 2 includes other significant observable market-based inputs (including quoted prices for similar securities, interest rates, prepayment speed, and credit risk). Level 3 includes unobservable inputs, which may include the adviser’s own assumptions in determining the fair value of investments. Other financial instruments are derivative instruments not reflected in total investments, such as futures contracts. The following is a summary of the levels used as of December 31, 2015 in valuing the fund’s assets or liabilities:
| | | | | | | | | | | | | | | | |
| Investments at Value | | Level 1 | | | Level 2 | | | Level 3 | | | Total | |
| U.S. Treasury Bonds & U.S. Government Agency & Equivalents | | | $— | | | | $437,245,786 | | | | $— | | | | $437,245,786 | |
| Municipal Bonds | | | — | | | | 2,541,988 | | | | — | | | | 2,541,988 | |
| U.S. Corporate Bonds | | | — | | | | 958,164,448 | | | | — | | | | 958,164,448 | |
| Residential Mortgage-Backed Securities | | | — | | | | 525,524,266 | | | | — | | | | 525,524,266 | |
| Commercial Mortgage-Backed Securities | | | — | | | | 261,694,950 | | | | — | | | | 261,694,950 | |
| Asset-Backed Securities (including CDOs) | | | — | | | | 129,623,667 | | | | — | | | | 129,623,667 | |
| Foreign Bonds | | | — | | | | 199,969,202 | | | | — | | | | 199,969,202 | |
| Mutual Funds | | | 86,235,675 | | | | — | | | | — | | | | 86,235,675 | |
| Total Investments | | | $86,235,675 | | | | $2,514,764,307 | | | | $— | | | | $2,600,999,982 | |
| | | | |
| Other Financial Instruments | | | | | | | | | | | | |
| Futures Contracts | | | $200,327 | | | | $— | | | | $— | | | | $200,327 | |
For further information regarding security characteristics, see the Portfolio of Investments.
Inflation-Adjusted Debt Securities – The fund invests in inflation-adjusted debt securities issued by the U.S. Treasury. The principal value of these debt securities is adjusted through income according to changes in the Consumer Price Index. These debt securities typically pay a fixed rate of interest, but this fixed rate is applied to the inflation-adjusted principal amount. The principal paid at maturity of the debt security is typically equal to the inflation-adjusted principal amount, or the security’s original par value, whichever is greater. Other types of inflation-adjusted securities may use other methods to adjust for other measures of inflation.
Derivatives – The fund uses derivatives for different purposes, primarily to increase or decrease exposure to a particular market or segment of the market, or security, to increase or decrease interest rate or currency exposure, or as alternatives to direct investments. Derivatives are used for hedging or non-hedging purposes. While hedging can reduce or eliminate losses, it can also reduce or eliminate gains. When the fund uses derivatives as an investment to increase market exposure, or for hedging purposes, gains and losses from derivative instruments may be substantially greater than the derivative’s original cost.
The derivative instruments used by the fund were futures contracts and swap agreements. The fund’s period end derivatives, as presented in the Portfolio of Investments and the associated Derivative Contract tables, generally are indicative of the volume of its derivative activity during the period.
The following table presents, by major type of derivative contract, the fair value, on a gross basis, of the asset and liability components of derivatives held by the fund at December 31, 2015 as reported in the Statement of Assets and Liabilities:
| | | | | | |
| | | | | Fair Value (a) | |
| Risk | | Derivative Contracts | | Asset Derivatives | |
| Interest Rate | | Interest Rate Futures | | | $200,327 | |
| (a) | The value of futures contracts includes cumulative appreciation (depreciation) as reported in the fund’s Portfolio of Investments. Only the current day net variation margin for futures contracts and cleared swap agreements is separately reported within the fund’s Statement of Assets and Liabilities. |
23
MFS Total Return Bond Series
Notes to Financial Statements – continued
The following table presents, by major type of derivative contract, the realized gain (loss) on derivatives held by the fund for the year ended December 31, 2015 as reported in the Statement of Operations:
| | | | | | | | |
| Risk | | Futures Contracts | | | Swap Agreements | |
| Interest Rate | | | $(1,628,385 | ) | | | $— | |
| Credit | | | — | | | | 208,537 | |
The following table presents, by major type of derivative contract, the change in unrealized appreciation (depreciation) on derivatives held by the fund for the year ended December 31, 2015 as reported in the Statement of Operations:
| | | | |
| Risk | | Futures Contracts | |
| Interest Rate | | | $1,547,906 | |
Derivative counterparty credit risk is managed through formal evaluation of the creditworthiness of all potential counterparties. On certain, but not all, uncleared derivatives, the fund attempts to reduce its exposure to counterparty credit risk whenever possible by entering into an ISDA Master Agreement on a bilateral basis. The ISDA Master Agreement gives each party to the agreement the right to terminate all transactions traded under such agreement if there is a certain deterioration in the credit quality of the other party. Upon an event of default or a termination of the ISDA Master Agreement, the non-defaulting party has the right to close out all transactions traded under such agreement and to net amounts owed under each transaction to one net amount payable by one party to the other. This right to close out and net payments across all transactions traded under the ISDA Master Agreement could result in a reduction of the fund’s credit risk to such counterparty equal to any amounts payable by the fund under the applicable transactions, if any.
Collateral and margin requirements differ by type of derivative. Margin requirements are set by the clearing broker and the clearing house for cleared derivatives (e.g., futures contracts, cleared swaps, and exchange-traded options) while collateral terms are contract specific for uncleared derivatives (e.g., forward foreign currency exchange contracts, uncleared swap agreements, and uncleared options). For derivatives traded under an ISDA Master Agreement, which contains a collateral support annex, the collateral requirements are netted across all transactions traded under such agreement and one amount is posted from one party to the other to collateralize such obligations. Cash that has been segregated to cover the fund’s collateral or margin obligations under derivative contracts, if any, will be reported separately in the Statement of Assets and Liabilities as “Restricted cash” or “Deposits with brokers.” Securities pledged as collateral or margin for the same purpose, if any, are noted in the Portfolio of Investments.
Futures Contracts – The fund entered into futures contracts which may be used to hedge against or obtain broad market exposure, interest rate exposure, currency exposure, or to manage duration. A futures contract represents a commitment for the future purchase or sale of an asset at a specified price on a specified date.
Upon entering into a futures contract, the fund is required to deposit with the broker, either in cash or securities, an initial margin in an amount equal to a certain percentage of the notional amount of the contract. Subsequent payments (variation margin) are made or received by the fund each day, depending on the daily fluctuations in the value of the contract, and are recorded for financial statement purposes as unrealized gain or loss by the fund until the contract is closed or expires at which point the gain or loss on futures contracts is realized.
The fund bears the risk of interest rates, exchange rates or securities prices moving unexpectedly, in which case, the fund may not achieve the anticipated benefits of the futures contracts and may realize a loss. While futures contracts may present less counterparty risk to the fund since the contracts are exchange traded and the exchange’s clearinghouse guarantees payments to the broker, there is still counterparty credit risk due to the insolvency of the broker. The fund’s maximum risk of loss due to counterparty credit risk is equal to the margin posted by the fund to the broker plus any gains or minus any losses on the outstanding futures contracts.
Swap Agreements – During the period the fund entered into swap agreements. Certain types of swaps (“cleared swaps”) are required to be centrally cleared under provisions of the Dodd-Frank Regulatory Reform Bill. In a cleared swap transaction, the ultimate counterparty to the transaction is a clearinghouse (the “clearinghouse”). The contract is transferred and accepted by the clearinghouse immediately following execution of the swap contract with an executing broker. Thereafter, throughout the term of the cleared swap, the fund interfaces indirectly with the clearinghouse through a clearing broker and has counterparty risk to the clearing broker as well.
A swap agreement is generally an exchange of cash payments, at specified intervals or upon the occurrence of specified events, between the fund and a counterparty. The net cash payments exchanged are recorded as a realized gain or loss on swap agreements in the Statement of Operations. The value of the swap agreement, which is adjusted daily and includes any related interest accruals to be paid or received by the fund, is recorded in the Statement of Assets and Liabilities, as “Swaps, at value” for uncleared swaps and is included in “Due from brokers” or “Due to brokers” for cleared swaps. The daily change in value, including any related interest accruals to be paid or received, is recorded as unrealized appreciation or depreciation on swap agreements in the Statement
24
MFS Total Return Bond Series
Notes to Financial Statements – continued
of Operations. The daily change in valuation of cleared swaps is recorded as a receivable or payable for variation margin in the Statement of Assets and Liabilities. Amounts paid or received at the inception of the swap agreement are reflected as premiums paid or received in the Statement of Assets and Liabilities and are amortized using the effective interest method over the term of the agreement. A liquidation payment received or made upon early termination is recorded as a realized gain or loss on swap agreements in the Statement of Operations. Collateral for uncleared swaps, in the form of cash or securities, is held in segregated accounts with the fund’s custodian in connection with these agreements. Collateral for cleared swaps, in the form of cash or securities, is posted by the fund directly with the clearing broker.
Risks related to swap agreements include the possible lack of a liquid market, unfavorable market and interest rate movements of the underlying instrument and the failure of the counterparty to perform under the terms of the agreements. The fund’s maximum risk of loss from counterparty credit risk is the discounted net value of the cash flows to be received from/paid to the counterparty over the contract’s remaining life, to the extent that the amount is positive. To address counterparty risk, uncleared swap agreements are limited to only highly-rated counterparties. Risk is further reduced by having an ISDA Master Agreement between the fund and the counterparty providing for netting as described above and, where applicable, by the posting of collateral by the counterparty to the fund to cover the fund’s exposure to the counterparty under such ISDA Master Agreement. The fund’s counterparty risk due to cleared swaps is mitigated by the fact that the clearinghouse is the true counterparty to the transaction and the regulatory requirement safeguards in the event of a clearing broker bankruptcy.
The fund entered into credit default swap agreements in order to manage its exposure to the market or certain sectors of the market, to reduce its credit risk exposure to defaults of corporate and sovereign issuers or to create exposure to corporate or sovereign issuers to which it is not otherwise exposed. In a credit default swap agreement, the protection buyer can make an upfront payment and will make a stream of payments to the protection seller based on a fixed percentage applied to the agreement notional amount in exchange for the right to receive a specified return upon the occurrence of a defined credit event on the reference obligation (which may be either a single security or a basket of securities issued by corporate or sovereign issuers) and, with respect to the cases where physical settlement applies, the delivery by the buyer to the seller of a defined deliverable obligation. Although agreement-specific, credit events generally consist of a combination of the following: bankruptcy, failure to pay, restructuring, obligation acceleration, obligation default, or repudiation/moratorium, each as defined in the 2003 ISDA Credit Derivatives Definitions as amended by the relevant agreement. Restructuring is generally not applicable when the reference obligation is issued by a North American corporation and obligation acceleration, obligation default, or repudiation/moratorium are generally only applicable when the reference obligation is issued by a sovereign entity or an entity in an emerging country. Upon determination of the final price for the deliverable obligation (or upon delivery of the deliverable obligation in the case of physical settlement), the difference between the value of the deliverable obligation and the swap agreement’s notional amount is recorded as realized gain or loss on swap agreements in the Statement of Operations.
Dollar Roll Transactions – The fund enters into dollar roll transactions, with respect to mortgage-backed securities issued by Ginnie Mae, Fannie Mae, and Freddie Mac, in which the fund sells mortgage-backed securities to financial institutions and simultaneously agrees to purchase similar (same issuer, type and coupon) securities at a later date at an agreed-upon price. During the period between the sale and repurchase in a dollar roll transaction the fund will not be entitled to receive interest and principal payments on the securities sold but is compensated by interest earned on the proceeds of the initial sale and by a lower purchase price on the securities to be repurchased which enhances the fund’s total return. The fund accounts for dollar roll transactions as purchases and sales and realizes gains and losses on these transactions.
Indemnifications – Under the fund’s organizational documents, its officers and Trustees may be indemnified against certain liabilities and expenses arising out of the performance of their duties to the fund. Additionally, in the normal course of business, the fund enters into agreements with service providers that may contain indemnification clauses. The fund’s maximum exposure under these agreements is unknown as this would involve future claims that may be made against the fund that have not yet occurred.
Investment Transactions and Income – Investment transactions are recorded on the trade date. Interest income is recorded on the accrual basis. All premium and discount is amortized or accreted for financial statement purposes in accordance with U.S. generally accepted accounting principles. Inflation-indexed bonds are fixed-income securities whose principal value is periodically adjusted upward or downward based on the rate of inflation. Interest is accrued based on the principal value, which is adjusted for inflation. Any increase or decrease in the principal amount of an inflation-indexed bond is generally recorded as an increase or decrease in interest income, respectively, even though the adjusted principal is not received until maturity. Interest payments received in additional securities are recorded on the ex-interest date in an amount equal to the value of the security on such date. Debt obligations may be placed on non-accrual status or set to accrue at a rate of interest less than the contractual coupon when the collection of all or a portion of interest has become doubtful. Interest income for those debt obligations may be further reduced by the write-off of the related interest receivables when deemed uncollectible.
25
MFS Total Return Bond Series
Notes to Financial Statements – continued
The fund may receive proceeds from litigation settlements. Any proceeds received from litigation involving portfolio holdings are reflected in the Statement of Operations in realized gain/loss if the security has been disposed of by the fund or in unrealized gain/loss if the security is still held by the fund. Any other proceeds from litigation not related to portfolio holdings are reflected as other income in the Statement of Operations.
The fund invests a significant portion of its assets in asset-backed and/or mortgage-backed securities. The value of these securities may depend, in part, on the issuer’s or borrower’s credit quality or ability to pay principal and interest when due and that value may fall if an issuer or borrower defaults on its obligation to pay principal or interest or if the instrument’s credit rating is downgraded by a credit rating agency. U.S. Government securities not supported as to the payment of principal or interest by the U.S. Treasury, such as those issued by Fannie Mae, Freddie Mac, and the Federal Home Loan Banks, are subject to greater credit risk than are U.S. Government securities supported by the U.S. Treasury, such as those issued by Ginnie Mae.
The fund purchased or sold debt securities on a when-issued or delayed delivery basis, or in a “To Be Announced” (TBA) or “forward commitment” transaction with delivery or payment to occur at a later date beyond the normal settlement period. At the time a fund enters into a commitment to purchase or sell a security, the transaction is recorded and the value of the security acquired is reflected in the fund’s net asset value. The price of such security and the date that the security will be delivered and paid for are fixed at the time the transaction is negotiated. The value of the security may vary with market fluctuations. TBA securities resulting from these transactions are included in the Portfolio of Investments. TBA purchase commitments are held at carrying amount, which approximates fair value and are categorized as level 2 within the fair value hierarchy. No interest accrues to the fund until payment takes place. At the time that a fund enters into this type of transaction, the fund is required to have sufficient cash and/or liquid securities to cover its commitments. Losses may arise due to changes in the value of the underlying securities or if the counterparty does not perform under the contract’s terms, or if the issuer does not issue the securities due to political, economic or other factors. Additionally, losses may arise due to declines in the value of the securities prior to settlement date.
To mitigate this risk of loss on TBA securities and other types of forward settling mortgage-backed securities, the fund whenever possible enters into a Master Securities Forward Transaction Agreement (“MSFTA”) on a bilateral basis with each of the counterparties with whom it undertakes a significant volume of transactions. The MSFTA gives each party to the agreement the right to terminate all transactions traded under such agreement if there is a certain deterioration in the credit quality of the other party. Upon an event of default or a termination of the MSFTA, the non-defaulting party has the right to close out all transactions traded under such agreement and to net amounts owed under each transaction to one net amount payable by one party to the other. This right to close out and net payments across all transactions traded under the MSFTA could result in a reduction of the fund’s credit risk to such counterparty equal to any amounts payable by the fund under the applicable transactions, if any.
For mortgage-backed securities traded under a MSFTA, the collateral and margining requirements are contract specific. Collateral amounts across all transactions traded under such agreement are netted and one amount is posted from one party to the other to collateralize such obligations. Cash that has been pledged to cover the fund’s collateral or margin obligations under a MSFTA, if any, will be reported separately on the Statement of Assets and Liabilities as restricted cash. Securities pledged as collateral or margin for the same purpose, if any, are noted in the Portfolio of Investments.
Fees Paid Indirectly – Prior to October 1, 2015, the fund’s custody fee could be reduced by a credit earned under an arrangement that measured the value of U.S. dollars deposited with the custodian by the fund. The amount of the credit, for the year ended December 31, 2015, is shown as a reduction of total expenses in the Statement of Operations.
Tax Matters and Distributions – The fund intends to qualify as a regulated investment company, as defined under Subchapter M of the Internal Revenue Code, and to distribute all of its taxable income, including realized capital gains. As a result, no provision for federal income tax is required. The fund’s federal tax returns, when filed, will remain subject to examination by the Internal Revenue Service for a three year period. Management has analyzed the fund’s tax positions taken on federal and state tax returns for all open tax years and does not believe that there are any uncertain tax positions that require recognition of a tax liability. Foreign taxes, if any, have been accrued by the fund in the accompanying financial statements in accordance with the applicable foreign tax law. Foreign income taxes may be withheld by certain countries in which the fund invests. Additionally, capital gains realized by the fund on securities issued in or by certain foreign countries may be subject to capital gains tax imposed by those countries.
Distributions to shareholders are recorded on the ex-dividend date. Income and capital gain distributions are determined in accordance with income tax regulations, which may differ from U.S. generally accepted accounting principles. Certain capital accounts in the financial statements are periodically adjusted for permanent differences in order to reflect their tax character. These adjustments have no impact on net assets or net asset value per share. Temporary differences which arise from recognizing certain items of income, expense, gain or loss in different periods for financial statement and tax purposes will reverse at some time in the future. Distributions in excess of net investment income or net realized gains are temporary overdistributions for financial statement purposes resulting from differences in the recognition or classification of income or distributions for financial statement and tax purposes.
26
MFS Total Return Bond Series
Notes to Financial Statements – continued
Book/tax differences primarily relate to amortization and accretion of debt securities and straddle loss deferrals.
The tax character of distributions declared to shareholders for the last two fiscal years is as follows:
| | | | | | | | |
| | | 12/31/15 | | | 12/31/14 | |
| Ordinary income (including any short-term capital gains) | | | $91,851,876 | | | | $82,917,411 | |
The federal tax cost and the tax basis components of distributable earnings were as follows:
| | | | |
| As of 12/31/15 | | | | |
| Cost of investments | | | $2,654,482,824 | |
| Gross appreciation | | | 28,801,522 | |
| Gross depreciation | | | (82,284,364 | ) |
| Net unrealized appreciation (depreciation) | | | $(53,482,842 | ) |
| Undistributed ordinary income | | | 83,142,553 | |
| Capital loss carryforwards | | | (4,698,182 | ) |
| Other temporary differences | | | (1,903,063 | ) |
As of December 31, 2015, the fund had capital loss carryforwards available to offset future realized gains. Such losses are characterized as follows:
Under the Regulated Investment Company Modernization Act of 2010 (the “Act”), the above net capital losses may be carried forward indefinitely, and their character is retained as short-term and/or long-term losses. Previously, net capital losses were carried forward for eight years and treated as short-term losses.
Multiple Classes of Shares of Beneficial Interest – The fund offers multiple classes of shares, which differ in their respective distribution and/or service fees. The fund’s income, realized and unrealized gain (loss), and common expenses are allocated to shareholders based on the daily net assets of each class. Dividends are declared separately for each class. Differences in per share dividend rates are generally due to differences in separate class expenses. The fund’s distributions declared to shareholders as reported in the Statements of Changes in Net Assets are presented by class as follows:
| | | | | | | | |
| | | From net investment
income | |
| | | Year ended
12/31/15 | | | Year ended
12/31/14 | |
| Initial Class | | | $36,954,369 | | | | $32,650,866 | |
| Service Class | | | 54,897,507 | | | | 50,266,545 | |
| Total | | | $91,851,876 | | | | $82,917,411 | |
| (3) | | Transactions with Affiliates |
Investment Adviser – The fund has an investment advisory agreement with MFS to provide overall investment management and related administrative services and facilities to the fund. The management fee is computed daily and paid monthly at an annual rate of 0.50% of the fund’s average daily net assets.
The investment adviser has agreed in writing to reduce its management fee to 0.45% of average daily net assets in excess of $2.5 billion to $5 billion and 0.40% of average daily net assets in excess of $5 billion. This written agreement will continue until modified by the fund’s Board of Trustees, but such agreement will continue at least until April 30, 2017. For the year ended December 31, 2015, this management fee reduction amounted to $160,563, which is included in the reduction of total expenses in the Statement of Operations. MFS has also agreed in writing to reduce its management fee by a specified amount if certain MFS mutual fund assets exceed thresholds agreed to by MFS and the fund’s Board of Trustees. For the year ended December 31, 2015, this management fee reduction amounted to $195,682, which is included in the reduction of total expenses in the Statement of Operations. The management fee incurred for the year ended December 31, 2015 was equivalent to an annual effective rate of 0.49% of the fund’s average daily net assets.
Distributor – MFS Fund Distributors, Inc. (MFD), a wholly-owned subsidiary of MFS, is the distributor of shares of the fund. The Trustees have adopted a distribution plan for the Service Class shares pursuant to Rule 12b-1 under the Investment Company Act of 1940.
The fund’s distribution plan provides that the fund will pay MFD distribution and/or service fees equal to 0.25% per annum of its average daily net assets attributable to Service Class shares as partial consideration for services performed and expenses incurred by MFD and financial intermediaries (including participating insurance companies that invest in the fund to fund variable annuity and variable life insurance contracts, sponsors of qualified retirement and pension plans that invest in the fund, and affiliates of these
27
MFS Total Return Bond Series
Notes to Financial Statements – continued
participating insurance companies and plan sponsors) in connection with the sale and distribution of the Service Class shares. MFD may subsequently pay all, or a portion, of the distribution and/or service fees to financial intermediaries.
Shareholder Servicing Agent – MFS Service Center, Inc. (MFSC), a wholly-owned subsidiary of MFS, receives a fee from the fund for its services as shareholder servicing agent. For the year ended December 31, 2015, the fee was $63,363, which equated to 0.0022% annually of the fund’s average daily net assets. MFSC also receives payment from the fund for out-of-pocket expenses paid by MFSC on behalf of the fund. For the year ended December 31, 2015, these costs amounted to $1,153.
Administrator – MFS provides certain financial, legal, shareholder communications, compliance, and other administrative services to the fund. Under an administrative services agreement, the fund reimburses MFS the costs incurred to provide these services. The fund is charged an annual fixed amount of $17,500 plus a fee based on average daily net assets. The administrative services fee incurred for the year ended December 31, 2015 was equivalent to an annual effective rate of 0.0160% of the fund’s average daily net assets.
Trustees’ and Officers’ Compensation – The fund pays compensation to independent Trustees in the form of a retainer, attendance fees, and additional compensation to Board and Committee chairpersons. The fund does not pay compensation directly to Trustees or officers of the fund who are also officers of the investment adviser, all of whom receive remuneration for their services to the fund from MFS. Certain officers and Trustees of the fund are officers or directors of MFS, MFD, and MFSC.
Other – This fund and certain other funds managed by MFS (the funds) have entered into a service agreement (the ISO Agreement) which provides for payment of fees solely by the funds to Tarantino LLC in return for the provision of services of an Independent Senior Officer (ISO) for the funds. Frank L. Tarantino serves as the ISO and is an officer of the funds and the sole member of Tarantino LLC. The funds can terminate the ISO Agreement with Tarantino LLC at any time under the terms of the ISO Agreement. For the year ended December 31, 2015, the fee paid by the fund under this agreement was $9,078 and is included in “Miscellaneous” expense in the Statement of Operations. MFS has agreed to bear all expenses associated with office space, other administrative support, and supplies provided to the ISO.
The fund invests in the MFS Institutional Money Market Portfolio which is managed by MFS and seeks current income consistent with preservation of capital and liquidity. Income earned on this investment is included in “Dividends from underlying affiliated funds” in the Statement of Operations. This money market fund does not pay a management fee to MFS.
For the year ended December 31, 2015, purchases and sales of investments, other than short-term obligations, were as follows:
| | | | | | | | |
| | | Purchases | | | Sales | |
| U.S. Government securities | | | $1,112,467,002 | | | | $1,385,604,359 | |
| Investments (non-U.S. Government securities) | | | $606,603,393 | | | | $673,029,544 | |
| (5) | | Shares of Beneficial Interest |
The fund’s Declaration of Trust permits the Trustees to issue an unlimited number of full and fractional shares of beneficial interest. Transactions in fund shares were as follows:
| | | | | | | | | | | | | | | | |
| | | Year ended 12/31/15 | | | Year ended 12/31/14 | |
| | | Shares | | | Amount | | | Shares | | | Amount | |
| Shares sold | | | | | | | | | | | | | | | | |
Initial Class | | | 5,588,697 | | | | $74,620,310 | | | | 9,657,615 | | | | $130,060,729 | |
Service Class | | | 7,064,169 | | | | 93,720,716 | | | | 15,025,832 | | | | 199,320,298 | |
| | | 12,652,866 | | | | $168,341,026 | | | | 24,683,447 | | | | $329,381,027 | |
| Shares issued to shareholders in reinvestment of distributions | | | | | | | | | | | | | | | | |
Initial Class | | | 2,774,684 | | | | $36,237,371 | | | | 2,417,395 | | | | $32,441,442 | |
Service Class | | | 4,272,180 | | | | 54,897,507 | | | | 3,805,189 | | | | 50,266,545 | |
| | | 7,046,864 | | | | $91,134,878 | | | | 6,222,584 | | | | $82,707,987 | |
| Shares reacquired | | | | | | | | | | | | | | | | |
Initial Class | | | (15,970,027 | ) | | | $(214,101,491 | ) | | | (17,230,831 | ) | | | $(232,232,093 | ) |
Service Class | | | (30,309,856 | ) | | | (398,503,952 | ) | | | (21,597,878 | ) | | | (286,719,375 | ) |
| | | (46,279,883 | ) | | | $(612,605,443 | ) | | | (38,828,709 | ) | | | $(518,951,468 | ) |
| Net change | | | | | | | | | | | | | | | | |
Initial Class | | | (7,606,646 | ) | | | $(103,243,810 | ) | | | (5,155,821 | ) | | | $(69,729,922 | ) |
Service Class | | | (18,973,507 | ) | | | (249,885,729 | ) | | | (2,766,857 | ) | | | (37,132,532 | ) |
| | | (26,580,153 | ) | | | $(353,129,539 | ) | | | (7,922,678 | ) | | | $(106,862,454 | ) |
The fund is one of several mutual funds in which certain MFS funds may invest. The MFS funds do not invest in the underlying funds for the purpose of exercising management or control. At the end of the period, the MFS Moderate Allocation Portfolio and the
28
MFS Total Return Bond Series
Notes to Financial Statements – continued
MFS Conservative Allocation Portfolio, were the owners of record of approximately 9% and 5%, respectively, of the value of outstanding voting shares of the fund. In addition, the MFS Growth Allocation Portfolio was the owner of record of less than 1% of the value of outstanding voting shares of the fund.
The fund and certain other funds managed by MFS participate in a $1.25 billion unsecured committed line of credit, subject to a $1 billion sublimit, provided by a syndication of banks under a credit agreement. Borrowings may be made for temporary financing needs. Interest is charged to each fund, based on its borrowings, generally at a rate equal to the higher of the Overnight Federal Reserve funds rate or daily one month LIBOR plus an agreed upon spread. A commitment fee, based on the average daily, unused portion of the committed line of credit, is allocated among the participating funds at the end of each calendar quarter. In addition, the fund and other funds managed by MFS have established unsecured uncommitted borrowing arrangements with certain banks for temporary financing needs. Interest is charged to each fund, based on its borrowings, at a rate equal to the Overnight Federal Reserve funds rate plus an agreed upon spread. For the year ended December 31, 2015, the fund’s commitment fee and interest expense were $9,626 and $0, respectively, and are included in “Miscellaneous” expense in the Statement of Operations.
| (7) | | Transactions in Underlying Affiliated Funds – Affiliated Issuers |
An affiliated issuer may be considered one in which the fund owns 5% or more of the outstanding voting securities, or a company which is under common control. For the purposes of this report, the fund assumes the following to be an affiliated issuer:
| | | | | | | | | | | | | | | | |
| Underlying Affiliated Fund | | Beginning
Shares/Par
Amount | | | Acquisitions
Shares/Par
Amount | | | Dispositions
Shares/Par
Amount | | | Ending
Shares/Par
Amount | |
| MFS Institutional Money Market Portfolio | | | 203,174,023 | | | | 664,931,629 | | | | (781,869,977 | ) | | | 86,235,675 | |
| | | | |
| Underlying Affiliated Fund | | Realized
Gain (Loss) | | | Capital Gain
Distributions | | | Dividend
Income | | | Ending
Value | |
| MFS Institutional Money Market Portfolio | | | $— | | | | $— | | | | $106,558 | | | | $86,235,675 | |
29
MFS Total Return Bond Series
REPORT OF INDEPENDENT REGISTERED PUBLIC ACCOUNTING FIRM
To the Board of Trustees of MFS Variable Insurance Trust and the Shareholders of
MFS Total Return Bond Series (formerly MFS Research Bond Series):
We have audited the accompanying statement of assets and liabilities, including the portfolio of investments, of MFS Total Return Bond Series (formerly MFS Research Bond Series) (one of the series of MFS Variable Insurance Trust) (the “Fund”) as of December 31, 2015, and the related statement of operations for the year then ended, the statements of changes in net assets for each of the two years in the period then ended, and the financial highlights for each of the five years in the period then ended. These financial statements and financial highlights are the responsibility of the Fund’s management. Our responsibility is to express an opinion on these financial statements and financial highlights based on our audits.
We conducted our audits in accordance with the standards of the Public Company Accounting Oversight Board (United States). Those standards require that we plan and perform the audit to obtain reasonable assurance about whether the financial statements and financial highlights are free of material misstatement. The Fund is not required to have, nor were we engaged to perform, an audit of its internal control over financial reporting. Our audits included consideration of internal control over financial reporting as a basis for designing audit procedures that are appropriate in the circumstances, but not for the purpose of expressing an opinion on the effectiveness of the Fund’s internal control over financial reporting. Accordingly, we express no such opinion. An audit also includes examining, on a test basis, evidence supporting the amounts and disclosures in the financial statements, assessing the accounting principles used and significant estimates made by management, as well as evaluating the overall financial statement presentation. Our procedures included confirmation of securities owned as of December 31, 2015, by correspondence with the custodian and brokers; when replies were not received from brokers, we performed other auditing procedures. We believe that our audits provide a reasonable basis for our opinion.
In our opinion, such financial statements and financial highlights referred to above present fairly, in all material respects, the financial position of MFS Total Return Bond Series as of December 31, 2015, the results of its operations for the year then ended, the changes in its net assets for each of the two years in the period then ended, and the financial highlights for each of the five years in the period then ended, in conformity with accounting principles generally accepted in the United States of America.
DELOITTE & TOUCHE LLP
Boston, Massachusetts
February 16, 2016
30
MFS Total Return Bond Series
TRUSTEES AND OFFICERS – IDENTIFICATION AND BACKGROUND
The Trustees and Officers of the Trust, as of February 1, 2016, are listed below, together with their principal occupations during the past five years. (Their titles may have varied during that period.) The address of each Trustee and Officer is 111 Huntington Avenue, Boston, Massachusetts 02199-7618.
| | | | | | | | |
Name, Age | | Position(s)
Held with Fund | | Trustee/Officer
Since (h) | | Principal Occupations
During the Past Five Years | | Other Directorships (j) |
| INTERESTED TRUSTEES |
Robert J. Manning (k)
(age 52) | | Trustee | | February 2004 | | Massachusetts Financial Services Company, Chairman, Co-Chief Executive Officer and Director | | N/A |
| | | | |
Robin A. Stelmach (k) (age 54) | | Trustee and President | | January 2014 | | Massachusetts Financial Services Company, Executive Vice President and Chief Operating Officer | | N/A |
| | |
| INDEPENDENT TRUSTEES | | | | |
David H. Gunning
(age 73) | | Trustee and Chair of Trustees | | January 2004 | | Private investor | | Lincoln Electric Holdings, Inc., Director; Development Alternatives, Inc., Director/Non-Executive Chairman |
| | | | |
Steven E. Buller (age 64) | | Trustee | | February 2014 | | Chairman, Financial Accounting Standards Advisory Council; Standing Advisory Group, Public Company Accounting Oversight Board, Member (until 2014); BlackRock, Inc. (investment management), Managing Director (until 2014), BlackRock Finco UK (investment management), Director (until 2014) | | N/A |
| | | | |
Robert E. Butler
(age 74) | | Trustee | | January 2006 | | Consultant – investment company industry regulatory and compliance matters | | N/A |
| | | | |
Maureen R. Goldfarb (age 60) | | Trustee | | January 2009 | | Private investor | | N/A |
| | | | |
William R. Gutow
(age 74) | | Trustee | | December 1993 | | Private investor and real estate consultant; Capitol Entertainment Management Company (video franchise), Vice Chairman | | Texas Donuts, Vice Chairman (until 2010) |
| | | | |
Michael Hegarty
(age 71) | | Trustee | | December 2004 | | Private investor | | Rouse Properties Inc., Director; Capmark Financial Group Inc., Director |
| | | | |
John P. Kavanaugh (age 61) | | Trustee | | January 2009 | | Private investor | | N/A |
| | | | |
Maryanne L. Roepke (age 59) | | Trustee | | May 2014 | | American Century Investments (investment management), Senior Vice President and Chief Compliance Officer (until 2014) | | N/A |
| | | | |
Laurie J. Thomsen
(age 58) | | Trustee | | March 2005 | | Private investor | | The Travelers Companies, Director; Dycom Industries, Inc., Director |
| | | | |
Robert W. Uek
(age 74) | | Trustee | | January 2006 | | Consultant to investment company industry | | N/A |
| | | | |
| OFFICERS | | | | | | | | |
Christopher R. Bohane (k)
(age 42) | | Assistant Secretary and Assistant Clerk | | July 2005 | | Massachusetts Financial Services Company, Vice President and Assistant General Counsel | | N/A |
| | | | |
Kino Clark (k) (age 47) | | Assistant Treasurer | | January 2012 | | Massachusetts Financial Services Company, Vice President | | N/A |
| | | | |
Kristin V. Collins (k) (age 42) | | Assistant Secretary and Assistant Clerk | | September 2015 | | Massachusetts Financial Services Company, Vice President and Assistant General Counsel | | N/A |
| | | | |
Thomas H. Connors (k) (age 56) | | Assistant Secretary and Assistant Clerk | | September 2012 | | Massachusetts Financial Services Company, Vice President and Senior Counsel; Deutsche Investment Management Americas Inc. (financial service provider), Director and Senior Counsel (until 2012) | | N/A |
31
MFS Total Return Bond Series
Trustees and Officers – continued
| | | | | | | | |
Name, Age | | Position(s)
Held with Fund | | Trustee/Officer
Since (h) | | Principal Occupations
During the Past Five Years | | Other Directorships (j) |
Ethan D. Corey (k)
(age 52) | | Assistant Secretary and Assistant Clerk | | July 2005 | | Massachusetts Financial Services Company, Senior Vice President and Associate General Counsel | | N/A |
| | | | |
David L. DiLorenzo (k)
(age 47) | | Treasurer | | July 2005 | | Massachusetts Financial Services Company, Senior Vice President | | N/A |
| | | | |
Brian E. Langenfeld (k) (age 42) | | Assistant Secretary and Assistant Clerk | | June 2006 | | Massachusetts Financial Services Company, Vice President and Senior Counsel | | N/A |
| | | | |
Kenneth Paek (k) (age 41) | | Assistant Treasurer | | February 2015 | | Massachusetts Financial Services Company, Vice President; Cohen & Steers, Vice President/Head of Fund Administration (until 2014) | | N/A |
| | | | |
Susan A. Pereira (k)
(age 45) | | Assistant Secretary and Assistant Clerk | | July 2005 | | Massachusetts Financial Services Company, Vice President and Senior Counsel | | N/A |
| | | | |
Kasey L. Phillips (k) (age 45) | | Assistant Treasurer | | September 2012 | | Massachusetts Financial Services Company, Vice President; Wells Fargo Funds Management, LLC, Senior Vice President, Fund Treasurer (until 2012) | | N/A |
| | | | |
Mark N. Polebaum (k)
(age 63) | | Secretary and Clerk | | January 2006 | | Massachusetts Financial Services Company, Executive Vice President, General Counsel and Secretary | | N/A |
| | | | |
Matthew A. Stowe (k) (age 41) | | Assistant Secretary and Assistant Clerk | | October 2014 | | Massachusetts Financial Services Company, Vice President and Assistant General Counsel | | N/A |
| | | | |
Frank L. Tarantino
(age 71) | | Independent Senior Officer | | June 2004 | | Tarantino LLC (provider of compliance services), Principal | | N/A |
| | | | |
Richard S. Weitzel (k)
(age 45) | | Assistant Secretary and Assistant Clerk | | October 2007 | | Massachusetts Financial Services Company, Senior Vice President and Associate General Counsel | | N/A |
| | | | |
Martin J. Wolin (k) (age 48) | | Chief Compliance Officer | | July 2015 | | Massachusetts Financial Services Company, Senior Vice President and Chief Compliance Officer (since July 2015); Mercer (financial service provider), Chief Risk and Compliance Officer, North America and Latin America (until June 2015) | | N/A |
| | | | |
James O. Yost (k)
(age 55) | | Deputy Treasurer | | September 1990 | | Massachusetts Financial Services Company, Senior Vice President | | N/A |
| (h) | Date first appointed to serve as Trustee/officer of an MFS Fund. Each Trustee has served continuously since appointment unless indicated otherwise. For the period from December 15, 2004 until February 22, 2005, Mr. Manning served as Advisory Trustee. Prior to January 2012, Messrs. DiLorenzo and Yost served as Assistant Treasurers of the Funds. Ms. Stelmach was appointed as President of the Funds as of October 1, 2014. |
| (j) | Directorships or trusteeships of companies required to report to the Securities and Exchange Commission (i.e., “public companies”). |
| (k) | “Interested person” of the Trust within the meaning of the Investment Company Act of 1940 (referred to as the 1940 Act), which is the principal federal law governing investment companies like the fund, as a result of a position with MFS. The address of MFS is 111 Huntington Avenue, Boston, Massachusetts 02199-7618. |
Each Trustee (except Ms. Stelmach, Mr. Buller and Ms. Roepke) has been elected by shareholders and each Trustee and officer holds office until his or her successor is chosen and qualified or until his or her earlier death, resignation, retirement or removal. The Trust does not hold annual meetings for the purpose of electing Trustees, and Trustees are not elected for fixed terms. Messrs. Buller, Butler, Kavanaugh, Uek and Ms. Roepke are members of the Trust’s Audit Committee.
Each of the Fund’s Trustees and officers holds comparable positions with certain other funds of which MFS or a subsidiary is the investment adviser or distributor, and, in the case of the officers, with certain affiliates of MFS. As of February 1, 2016, the Trustees served as board members of 137 funds within the MFS Family of Funds.
32
MFS Total Return Bond Series
Trustees and Officers – continued
The Statement of Additional Information for a Fund includes further information about the Trustees and is available without charge upon request by calling 1-800-225-2606.
| | |
Investment Adviser Massachusetts Financial Services Company 111 Huntington Avenue Boston, MA 02199-7618 | | Custodian State Street Bank and Trust Company 1 Lincoln Street Boston, MA 02111-2900 |
Distributor MFS Fund Distributors, Inc. 111 Huntington Avenue Boston, MA 02199-7618 | | Independent Registered Public Accounting Firm Deloitte & Touche LLP 200 Berkeley Street Boston, MA 02116 |
Portfolio Managers Joshua Marston Robert Persons Jeffrey Wakelin | | |
33
MFS Total Return Bond Series
BOARD REVIEW OF INVESTMENT ADVISORY AGREEMENT
The Investment Company Act of 1940 requires that both the full Board of Trustees and a majority of the non-interested (“independent”) Trustees, voting separately, annually approve the continuation of the Fund’s investment advisory agreement with MFS. The Trustees consider matters bearing on the Fund and its advisory arrangements at their meetings throughout the year, including a review of performance data at each regular meeting. In addition, the independent Trustees met several times over the course of three months beginning in May and ending in July, 2015 (“contract review meetings”) for the specific purpose of considering whether to approve the continuation of the investment advisory agreement for the Fund and the other investment companies that the Board oversees (the “MFS Funds”). The independent Trustees were assisted in their evaluation of the Fund’s investment advisory agreement by independent legal counsel, from whom they received separate legal advice and with whom they met separately from MFS during various contract review meetings. The independent Trustees were also assisted in this process by the MFS Funds’ Independent Senior Officer, a senior officer appointed by and reporting to the independent Trustees.
In connection with their deliberations regarding the continuation of the investment advisory agreement, the Trustees, including the independent Trustees, considered such information and factors as they believed, in light of the legal advice furnished to them and their own business judgment, to be relevant. The investment advisory agreement for the Fund was considered separately, although the Trustees also took into account the common interests of all MFS Funds in their review. As described below, the Trustees considered the nature, quality, and extent of the various investment advisory, administrative, and shareholder services performed by MFS under the existing investment advisory agreement and other arrangements with the Fund.
In connection with their contract review meetings, the Trustees received and relied upon materials that included, among other items: (i) information provided by Lipper Inc., an independent third party, on the investment performance of the Fund for various time periods ended December 31, 2014 and the investment performance of a group of funds with substantially similar investment classifications/objectives (the “Lipper performance universe”), (ii) information provided by Lipper Inc. on the Fund’s advisory fees and other expenses and the advisory fees and other expenses of comparable funds identified by Lipper Inc. (the “Lipper expense group”), (iii) information provided by MFS on the advisory fees of comparable portfolios of other clients of MFS, including institutional separate accounts and other clients, (iv) information as to whether and to what extent applicable expense waivers, reimbursements or fee “breakpoints” are observed for the Fund, (v) information regarding MFS’ financial results and financial condition, including MFS’ and certain of its affiliates’ estimated profitability from services performed for the Fund and the MFS Funds as a whole, and compared to MFS’ institutional business, (vi) MFS’ views regarding the outlook for the mutual fund industry and the strategic business plans of MFS, (vii) descriptions of various functions performed by MFS for the Funds, such as compliance monitoring and portfolio trading practices, and (viii) information regarding the overall organization of MFS, including information about MFS’ senior management and other personnel providing investment advisory, administrative and other services to the Fund and the other MFS Funds. The comparative performance, fee and expense information prepared and provided by Lipper Inc. was not independently verified and the independent Trustees did not independently verify any information provided to them by MFS.
The Trustees’ conclusion as to the continuation of the investment advisory agreement was based on a comprehensive consideration of all information provided to the Trustees and not the result of any single factor. Some of the factors that figured particularly in the Trustees’ deliberations are described below, although individual Trustees may have evaluated the information presented differently from one another, giving different weights to various factors. It is also important to recognize that the fee arrangements for the Fund and other MFS Funds are the result of years of review and discussion between the independent Trustees and MFS, that certain aspects of such arrangements may receive greater scrutiny in some years than in others, and that the Trustees’ conclusions may be based, in part, on their consideration of these same arrangements during the course of the year and in prior years.
Based on information provided by Lipper Inc. and MFS, the Trustees reviewed the Fund’s total return investment performance as well as the performance of peer groups of funds over various time periods. The Trustees placed particular emphasis on the total return performance of the Fund’s Initial Class shares in comparison to the performance of funds in its Lipper performance universe over the three-year period ended December 31, 2014, which the Trustees believed was a long enough period to reflect differing market conditions. The total return performance of the Fund’s Initial Class shares was in the 1st quintile relative to the other funds in the universe for this three-year period (the 1st quintile being the best performers and the 5th quintile being the worst performers). The total return performance of the Fund’s Initial Class shares was in the 2nd quintile for the one-year period and the 1st quintile for the five-year period ended December 31, 2014 relative to the Lipper performance universe. Because of the passage of time, these performance results may differ from the performance results for more recent periods, including those shown elsewhere in this report.
In the course of their deliberations, the Trustees took into account information provided by MFS in connection with the contract review meetings, as well as during investment review meetings conducted with portfolio management personnel during the course of the year regarding the Fund’s performance. After reviewing these and related factors, the Trustees concluded, within the context of their overall conclusions regarding the investment advisory agreement, that they were satisfied with MFS’ responses and efforts relating to investment performance.
34
MFS Total Return Bond Series
Board Review of Investment Advisory Agreement – continued
In assessing the reasonableness of the Fund’s advisory fee, the Trustees considered, among other information, the Fund’s advisory fee and the total expense ratio of the Fund’s Initial Class shares as a percentage of average daily net assets and the advisory fee and total expense ratios of peer groups of funds based on information provided by Lipper Inc. The Trustees considered that, according to the Lipper data (which takes into account any fee reductions or expense limitations that were in effect during the Fund’s last fiscal year), the Fund’s effective advisory fee rate and total expense ratio were each approximately at the Lipper expense group median.
The Trustees also considered the advisory fees charged by MFS to any institutional separate accounts advised by MFS (“separate accounts”) and unaffiliated investment companies for which MFS serves as subadviser (“subadvised funds”) that have comparable investment strategies to the Fund. In comparing these fees, the Trustees considered information provided by MFS as to the generally broader scope of services provided by MFS to the Fund, as well as the more extensive regulatory burdens imposed on MFS in managing the Fund, in comparison to separate accounts and subadvised funds. The Trustees also considered the higher demands placed on MFS’ investment personnel and trading infrastructure as a result of the daily cash in-flows and out-flows of the Fund in comparison to separate accounts.
The Trustees also considered whether the Fund may benefit from any economies of scale in the management of the Fund in the event of growth in assets of the Fund and/or growth in assets of the MFS Funds as a whole. They noted that MFS has agreed in writing to reduce its advisory fee rate on the Fund’s average daily net assets over $2.5 billion and $5 billion, which may not be changed without the Trustees’ approval. The Trustees also noted that MFS has agreed in writing to waive a portion of the management fees of certain MFS Funds, including the Fund, if the total combined assets of certain funds within the MFS Funds’ complex increase above agreed upon thresholds (the “group fee waiver”), enabling the Fund’s shareholders to share in the benefits from any economies of scale at the complex level. The group fee waiver is reviewed and renewed annually between the Board and MFS. The Trustees concluded that the breakpoints and the group fee waiver were sufficient to allow the Fund to benefit from economies of scale as its assets and overall complex assets grow.
The Trustees also considered information prepared by MFS relating to MFS’ costs and profits with respect to the Fund, the MFS Funds considered as a group, and other investment companies and accounts advised by MFS, as well as MFS’ methodologies used to determine and allocate its costs to the MFS Funds, the Fund and other accounts and products for purposes of estimating profitability.
After reviewing these and other factors described herein, the Trustees concluded, within the context of their overall conclusions regarding the investment advisory agreement, that the advisory fees charged to the Fund represent reasonable compensation in light of the services being provided by MFS to the Fund.
In addition, the Trustees considered MFS’ resources and related efforts to continue to retain, attract and motivate capable personnel to serve the Fund. The Trustees also considered current and developing conditions in the financial services industry, including the presence of large and well-capitalized companies which are spending, and appear to be prepared to continue to spend, substantial sums to engage personnel and to provide services to competing investment companies. In this regard, the Trustees also considered the financial resources of MFS and its ultimate parent, Sun Life Financial Inc. The Trustees also considered the advantages and possible disadvantages to the Fund of having an adviser that also serves other investment companies as well as other accounts.
The Trustees also considered the nature, quality, cost, and extent of administrative, transfer agency, and distribution services provided to the Fund by MFS and its affiliates under agreements and plans other than the investment advisory agreement, including any 12b-1 fees the Fund pays to MFS Fund Distributors, Inc., an affiliate of MFS. The Trustees also considered the nature, extent and quality of certain other services MFS performs or arranges for on the Fund’s behalf, which may include securities lending programs, directed expense payment programs, class action recovery programs, and MFS’ interaction with third-party service providers, principally custodians and sub-custodians. The Trustees concluded that the various non-advisory services provided by MFS and its affiliates on behalf of the Fund were satisfactory.
The Trustees also considered benefits to MFS from the use of the Fund’s portfolio brokerage commissions, if applicable, to pay for investment research and various other factors. Additionally, the Trustees considered so-called “fall-out benefits” to MFS such as reputational value derived from serving as investment manager to the Fund.
Based on their evaluation of factors that they deemed to be material, including those factors described above, the Board of Trustees, including the independent Trustees, concluded that the Fund’s investment advisory agreement with MFS should be continued for an additional one-year period, commencing August 1, 2015.
35
MFS Total Return Bond Series
PROXY VOTING POLICIES AND INFORMATION
MFS votes proxies on behalf of the fund pursuant to proxy voting policies and procedures that are available without charge, upon request, by calling 1-800-225-2606, by visiting the Proxy Voting section of mfs.com or by visiting the SEC’s Web site at http://www.sec.gov.
Information regarding how the fund voted proxies relating to portfolio securities during the most recent twelve-month period ended June 30 is available without charge by visiting the Proxy Voting section of mfs.com or by visiting the SEC’s Web site at http://www.sec.gov.
QUARTERLY PORTFOLIO DISCLOSURE
The fund will file a complete schedule of portfolio holdings with the Securities and Exchange Commission (the Commission) for the first and third quarters of each fiscal year on Form N-Q. The fund’s Form N-Q is available on the EDGAR database on the Commission’s Internet Web site at http://www.sec.gov, and may be reviewed and copied at the:
Public Reference Room
Securities and Exchange Commission
100 F Street, NE, Room 1580
Washington, D.C. 20549
Information on the operation of the Public Reference Room may be obtained by calling the Commission at 1-800-SEC-0330. Copies of the fund’s Form N-Q also may be obtained, upon payment of a duplicating fee, by electronic request at the following e-mail address: publicinfo@sec.gov or by writing the Public Reference Section at the above address.
FURTHER INFORMATION
From time to time, MFS may post important information about the fund or the MFS funds on the MFS web site (mfs.com). This information is available by visiting the “Market Commentary” and “Announcements” sub sections in the “Market Outlooks” section of mfs.com or by clicking on the fund’s name under “Variable Insurance Portfolios — VIT” in the “Products” section of mfs.com.
36
rev. 3/11
| | | | |
| FACTS | | WHAT DOES MFS DO WITH YOUR
PERSONAL INFORMATION? | |  |
| | |
| Why? | | Financial companies choose how they share your personal information. Federal law gives consumers the right to limit some but not all sharing. Federal law also requires us to tell you how we collect, share, and protect your personal information. Please read this notice carefully to understand what we do. |
| | |
| What? | | The types of personal information we collect and share depend on the product or service you have with us. This information can include: • Social Security number and account balances • Account transactions and transaction history • Checking account information and wire transfer instructions When you are no longer our customer, we continue to share your information as described in this notice. |
| | |
| How? | | All financial companies need to share customers’ personal information to run their everyday business. In the section below, we list the reasons financial companies can share their customers’ personal information; the reasons MFS chooses to share; and whether you can limit this sharing. |
| | | | |
Reasons we can share your
personal information | | Does MFS share? | | Can you limit this
sharing? |
For our everyday business purposes – such as to process your transactions, maintain your account(s), respond to court orders and legal investigations, or report to credit bureaus | | Yes | | No |
For our marketing purposes – to offer our products and services to you | | No | | We don’t share |
| For joint marketing with other financial companies | | No | | We don’t share |
For our affiliates’ everyday business purposes – information about your transactions and experiences | | No | | We don’t share |
For our affiliates’ everyday business purposes – information about your creditworthiness | | No | | We don’t share |
| For nonaffiliates to market to you | | No | | We don’t share |
| | |
| Questions? | | Call 800-225-2606 or go to mfs.com. |
37
| | |
| Who we are |
| Who is providing this notice? | | MFS Funds, MFS Investment Management, MFS Institutional Advisors, Inc., MFS Fund Distributors, Inc., MFS Heritage Trust Company, and MFS Service Center, Inc. |
| | |
| What we do |
| How does MFS protect my personal information? | | To protect your personal information from unauthorized access and use, we use security measures that comply with federal law. These measures include procedural, electronic, and physical safeguards for the protection of the personal information we collect about you. |
How does MFS
collect my personal information? | | We collect your personal information, for example, when you • open an account or provide account information • direct us to buy securities or direct us to sell your securities • make a wire transfer We also collect your personal information from others, such as credit bureaus, affiliates and other companies. |
| Why can’t I limit all sharing? | | Federal law gives you the right to limit only • sharing for affiliates’ everyday business purposes – information about your creditworthiness • affiliates from using your information to market to you • sharing for nonaffiliates to market to you State laws and individual companies may give you additional rights to limit sharing. |
| | |
| Definitions |
| Affiliates | | Companies related by common ownership or control. They can be financial and nonfinancial companies. • MFS does not share personal information with affiliates, except for everyday business purposes as described on page one of this notice. |
| Nonaffiliates | | Companies not related by common ownership or control. They can be financial and nonfinancial companies. • MFS does not share with nonaffiliates so they can market to you. |
| Joint Marketing | | A formal agreement between nonaffiliated financial companies that together market financial products or services to you. • MFS doesn’t jointly market. |
| | |
| Other important information |
| If you own an MFS product or receive an MFS service in the name of a third party such as a bank or broker-dealer, their privacy policy may apply to you instead of ours. |
38
ANNUAL REPORT
December 31, 2015

MFS® RESEARCH SERIES
MFS® Variable Insurance Trust

VFR-ANN
MFS® RESEARCH SERIES
CONTENTS
The report is prepared for the general information of contract owners. It is authorized for distribution to prospective investors only when preceded or accompanied by a current prospectus.
NOT FDIC INSURED • MAY LOSE VALUE • NO BANK OR CREDIT UNION GUARANTEE • NOT A DEPOSIT • NOT INSURED BY ANY FEDERAL GOVERNMENT AGENCY OR NCUA/NCUSIF
MFS Research Series
LETTER FROM THE CHAIRMAN

Dear Contract Owners:
Central bank policies remain center stage as the U.S. Federal Reserve made good on its pledge to raise policy rates for the first time in over nine years at its December meeting. The Fed’s actions stand in stark contrast to those of the European Central Bank and Bank of Japan, which modestly extended their quantitative easing programs in December.
In the United States, auto sales remain a source of economic strength, but housing demand has slowed of late. The U.S. economic expansion remains moderate but uneven, with a strong dollar crimping demand for U.S. goods abroad. China’s shift to a consumer-led economy continues to weigh on its manufacturing and exports, as does weak global demand. Slackening demand from China continues to undermine commodity markets, with oil particularly impacted amid a global supply glut.
As markets have become more focused on short-term trends in recent years, we believe it’s important for investors to lengthen their investment time horizon. At MFS®, we don’t trade on headlines or trends; we invest for the long term.
We believe that this approach, coupled with the professional guidance of a financial advisor, will help you reach your investment goals.
Respectfully,

Robert J. Manning
Chairman
MFS Investment Management
February 16, 2016
The opinions expressed in this letter are subject to change and may not be relied upon for investment advice. No forecasts can be guaranteed.
1
MFS Research Series
PORTFOLIO COMPOSITION
Portfolio structure

| | | | |
| Top ten holdings | | | | |
| Apple, Inc. | | | 2.9% | |
| Danaher Corp. | | | 2.5% | |
| Visa, Inc., “A” | | | 2.5% | |
| Alphabet, Inc., “A” | | | 2.4% | |
| JPMorgan Chase & Co. | | | 2.2% | |
| Wells Fargo & Co. | | | 2.2% | |
| Amazon.com, Inc. | | | 1.8% | |
| Facebook, Inc., “A” | | | 1.5% | |
| Medtronic PLC | | | 1.5% | |
| Allergan PLC | | | 1.5% | |
| | | | |
| Global equity sectors | | | | |
| Technology | | | 19.0% | |
| Financial Services | | | 16.8% | |
| Health Care | | | 14.6% | |
| Consumer Cyclicals | | | 13.8% | |
| Capital Goods | | | 13.7% | |
| Energy | | | 9.2% | |
| Consumer Staples | | | 8.0% | |
| Telecommunications/Cable Television (s) | | | 4.1% | |
| (s) | Includes securities sold short. |
Cash & Cash Equivalents includes any cash, investments in money market funds, short-term securities, and other assets less liabilities. Please see the Statement of Assets and Liabilities for additional information related to the fund’s cash position and other assets and liabilities.
Percentages are based on net assets as of 12/31/15.
The portfolio is actively managed and current holdings may be different.
2
MFS Research Series
MANAGEMENT REVIEW
Summary of Results
For the twelve months ended December 31, 2015, Initial Class shares of the MFS Research Series (“fund”) provided a total return of 0.80%, while Service Class shares of the fund provided a total return of 0.53%. These compare with a return of 1.38% over the same period for the fund’s benchmark, the Standard & Poor’s 500 Stock Index (S&P 500 Index).
Market Environment
Sluggish global growth weighed on both developed and emerging market (“EM”) economies during the reporting period. EM economies have been particularly lackluster. While the US Federal Reserve began its anticipated monetary policy tightening cycle at the end of the period, other large developed economies continued to embrace accommodative monetary policies, particularly the European Central Bank and the Bank of Japan. Focus remained on China after policy missteps by the Chinese government roiled global markets over the summer, beginning with the uncoordinated response to the stock market’s boom and bust and then the confusing decision to devalue the renminbi in August. China subsequently ramped up a wide range of monetary and fiscal measures to stimulate the economy and bolster sentiment. Its economy appeared to stabilize late in the period. Also at the end of the period, the Chinese renminbi was granted reserve currency status by the International Monetary Fund (“IMF”), which announced its inclusion in the IMF’s Special Drawing Rights currency basket effective October 1, 2016.
During the second half of the reporting period, the US faced an earnings recession caused primarily by the sharp decline in the prices of oil and other commodities. Earnings contractions were concentrated primarily in the energy, materials and industrial sectors. An additional headwind for earnings was the sharp rise in the US dollar over the period. Exports were crimped by the dollar’s strength and falling demand in emerging markets. Consumer spending held up well during the second half of the period amid a modest increase in real wages and a tailwind from falling gasoline prices. Demand for autos reached near-record territory late in the period. In emerging markets, two key factors weighed on economies and asset prices: 1) weaker Chinese growth, which drove the decline in commodity prices and 2) prospects for higher US interest rates. Structural factors like floating exchange rates and fiscal buffers partially offset these cyclical headwinds.
Detractors from Performance
Stock selection in the consumer cyclicals sector was a primary detractor from performance relative to the S&P 500 Index. The fund’s overweight positions in apparel retailer PVH and media company Twenty-First Century Fox weakened relative performance. Shares of apparel retailer PVH fell during the reporting period as foreign exchange headwinds were the main culprit that weighed on corporate margins and drove a third-quarter earnings miss. Not holding shares of home improvement and building materials retailer Home Depot hurt relative performance. Shares of Home Depot appreciated following continued strong results. Revenues and earnings came in better-than-expected as bigger ticket items and its professional segment were strong and its margins remained resilient.
In other sectors, not owning shares of software giant Microsoft and diversified industrial conglomerate General Electric dampened relative performance. Shares of Microsoft rose during the reporting period on solid results that beat market expectations. Strong growth in the company’s Cloud business, particularly from the Office 365 and Azure product lines, combined with a lower than expected effective tax rate, appeared to have buoyed investor sentiment. The fund’s overweight positions in railroad and freight transportation services provider Union Pacific, oil and gas exploration & production company Anadarko Petroleum, power generation company NRG (h), financial services company American Express and investment management firm Franklin Resources also detracted from relative results. American Express underperformed consensus earnings as foreign exchange and co-brand spending presented headwinds. The company also lowered guidance which further pressured the stock.
Contributors to Performance
Stock selection in the technology sector was a primary factor that contributed to performance relative to the S&P 500 Index. The fund’s overweight position in internet search giant Alphabet (formerly Google) was a notable contributor to relative returns. Strength in mobile search and video ads on YouTube were notable contributors to Alphabet’s above-consensus results. Management also announced that it had authorized a stock buyback program which further supported the stock. Not holding wireless communications software company QUALCOMM also benefited relative performance. Shares declined after in-line earnings were accompanied by a weak outlook from management. Chip operating margins declined and new license agreements in China had been slow to progress, which further weighed on the company’s shares.
Elsewhere, the fund’s overweight position in global payments technology company Visa, engineering products and solutions company Roper Technologies, alcoholic beverages producer Constellation Brands and pharmaceutical company Eli Lilly benefited relative performance. Visa’s outperformance was driven by expectations of growth from their core businesses, the announced acquisition of Visa Europe and capital return. Not owning shares of natural gas pipelines operator Kinder Morgan, retail giant Wal-Mart, insurance and investment firm Berkshire Hathaway and integrated energy company Chevron also bolstered relative returns. Shares of Kinder Morgan depreciated significantly after current challenging business trends forced the company to cut its annual dividend by 75% during the period to preserve cash.
3
MFS Research Series
Management Review – continued
Respectfully,
Joseph MacDougall
Portfolio Manager
| (h) | Security was not held in the fund at period end. |
The views expressed in this report are those of the portfolio manager only through the end of the period of the report as stated on the cover and do not necessarily reflect the views of MFS or any other person in the MFS organization. These views are subject to change at any time based on market or other conditions, and MFS disclaims any responsibility to update such views. These views may not be relied upon as investment advice or an indication of trading intent on behalf of any MFS portfolio. References to specific securities are not recommendations of such securities, and may not be representative of any MFS portfolio’s current or future investments.
4
MFS Research Series
PERFORMANCE SUMMARY THROUGH 12/31/15
The following chart illustrates the historical performance of the fund in comparison to its benchmark(s). Benchmarks are unmanaged and may not be invested in directly. Benchmark returns do not reflect any fees or expenses. The performance of other share classes will be greater than or less than that of the class depicted below. (See Notes to Performance Summary.)
Performance data shown represents past performance and is no guarantee of future results. Investment return and principal value fluctuate so your units, when sold, may be worth more or less than the original cost; current performance may be lower or higher than quoted. The performance shown does not reflect the deduction of taxes, if any, that a contract holder would pay on fund distributions or the redemption of contract units. The returns for the fund shown also do not reflect the deduction of expenses associated with variable products, such as mortality and expense risk charges, separate account charges, and sales charges imposed by the insurance company separate accounts. Such expenses would reduce the overall returns shown.
Growth of a Hypothetical $10,000 Investment

Total Returns through 12/31/15
Average annual total returns
| | | | | | | | | | | | |
| | | Share Class | | Class Inception Date | | 1-yr | | 5-yr | | 10-yr | | |
| | | Initial Class | | 7/26/95 | | 0.80% | | 11.40% | | 7.57% | | |
| | | Service Class | | 5/01/00 | | 0.53% | | 11.11% | | 7.30% | | |
| | | | |
| Comparative benchmark | | | | | | | | |
| | | Standard & Poor’s 500 Stock Index (f) | | 1.38% | | 12.57% | | 7.31% | | |
| (f) | Source: FactSet Research Systems Inc. |
Benchmark Definition
Standard & Poor’s 500 Stock Index – a market capitalization-weighted index of 500 widely held equity securities, designed to measure broad U.S. equity performance.
It is not possible to invest directly in an index.
Notes to Performance Summary
Average annual total return represents the average annual change in value for each share class for the periods presented.
Performance results reflect any applicable expense subsidies and waivers in effect during the periods shown. Without such subsidies and waivers the fund’s performance results would be less favorable. Please see the prospectus and financial statements for complete details. All results are historical and assume the reinvestment of any dividends and capital gains distributions.
Performance results do not include adjustments made for financial reporting purposes in accordance with U.S. generally accepted accounting principles and may differ from amounts reported in the financial highlights.
From time to time the fund may receive proceeds from litigation settlements, without which performance would be lower.
5
MFS Research Series
EXPENSE TABLE
Fund Expenses Borne by the Contract Holders during the Period,
July 1, 2015 through December 31, 2015
As a contract holder of the fund, you incur ongoing costs, including management fees; distribution and/or service (12b-1) fees; and other fund expenses. This example is intended to help you understand your ongoing costs (in dollars) of investing in the fund and to compare these costs with the ongoing costs of investing in other mutual funds.
The example is based on an investment of $1,000 invested at the beginning of the period and held for the entire period July 1, 2015 through December 31, 2015.
Actual Expenses
The first line for each share class in the following table provides information about actual account values and actual expenses. You may use the information in this line, together with the amount you invested, to estimate the expenses that you paid over the period. Simply divide your account value by $1,000 (for example, an $8,600 account value divided by $1,000 = 8.6), then multiply the result by the number in the first line under the heading entitled “Expenses Paid During Period” to estimate the expenses you paid on your account during this period.
Hypothetical Example for Comparison Purposes
The second line for each share class in the following table provides information about hypothetical account values and hypothetical expenses based on the fund’s actual expense ratio and an assumed rate of return of 5% per year before expenses, which is not the fund’s actual return. The hypothetical account values and expenses may not be used to estimate the actual ending account balance or expenses you paid for the period. You may use this information to compare the ongoing costs of investing in the fund and other funds. To do so, compare this 5% hypothetical example with the 5% hypothetical examples that appear in the shareholder reports of the other funds.
Please note that the expenses shown in the table are meant to highlight the fund’s ongoing costs only and do not take into account the fees and expenses imposed under the variable contracts through which your investment in the fund is made. Therefore, the second line for each share class in the table is useful in comparing ongoing costs associated with an investment in vehicles (such as the fund) which fund benefits under variable annuity and variable life insurance contracts and to qualified pension and retirement plans only, and will not help you determine the relative total costs of investing in the fund through variable annuity and variable life insurance contracts. If the fees and expenses imposed under the variable contracts were included, your costs would have been higher.
| | | | | | | | | | | | | | | | | | |
| Share Class | | | | Annualized
Expense Ratio | | | Beginning
Account Value
7/01/15 | | | Ending Account Value
12/31/15 | | | Expenses Paid
During Period (p)
7/01/15-12/31/15 | |
| Initial Class | | Actual | | | 0.81% | | | | $1,000.00 | | | | $984.37 | | | | $4.05 | |
| | Hypothetical (h) | | | 0.81% | | | | $1,000.00 | | | | $1,021.12 | | | | $4.13 | |
| Service Class | | Actual | | | 1.06% | | | | $1,000.00 | | | | $983.15 | | | | $5.30 | |
| | Hypothetical (h) | | | 1.06% | | | | $1,000.00 | | | | $1,019.86 | | | | $5.40 | |
| (h) | 5% class return per year before expenses. |
| (p) | “Expenses Paid During Period” are equal to each class’s annualized expense ratio, as shown above, multiplied by the average account value over the period, multiplied by 184/365 (to reflect the one-half year period). |
6
MFS Research Series
PORTFOLIO OF INVESTMENTS – 12/31/15
The Portfolio of Investments is a complete list of all securities owned by your fund. It is categorized by broad-based asset classes.
| | | | | | | | |
| Issuer | | Shares/Par | | | Value ($) | |
| | | | | | | | |
| COMMON STOCKS – 99.1% | | | | | | | | |
| Aerospace – 3.3% | | | | | | | | |
| Honeywell International, Inc. | | | 62,015 | | | $ | 6,422,892 | |
| Northrop Grumman Corp. | | | 31,213 | | | | 5,893,327 | |
| Rockwell Collins, Inc. | | | 30,817 | | | | 2,844,409 | |
| United Technologies Corp. | | | 60,479 | | | | 5,810,218 | |
| | | | | | | | |
| | | $ | 20,970,846 | |
| | | | | | | | |
| Alcoholic Beverages – 0.8% | | | | | |
| Constellation Brands, Inc., “A” | | | 36,042 | | | $ | 5,133,822 | |
| | | | | | | | |
| Apparel Manufacturers – 1.0% | | | | | |
| Global Brands Group Holding Ltd. (a) | | | 1,608,000 | | | $ | 303,739 | |
| Hanesbrands, Inc. | | | 118,623 | | | | 3,491,075 | |
| PVH Corp. | | | 36,092 | | | | 2,658,176 | |
| | | | | | | | |
| | | $ | 6,452,990 | |
| | | | | | | | |
| Automotive – 0.7% | | | | | | | | |
| Delphi Automotive PLC | | | 25,425 | | | $ | 2,179,685 | |
| Harley-Davidson, Inc. | | | 43,585 | | | | 1,978,323 | |
| | | | | | | | |
| | | $ | 4,158,008 | |
| | | | | | | | |
| Biotechnology – 1.9% | | | | | | | | |
| Alexion Pharmaceuticals, Inc. (a) | | | 31,797 | | | $ | 6,065,278 | |
| Celgene Corp. (a) | | | 51,966 | | | | 6,223,448 | |
| | | | | | | | |
| | | $ | 12,288,726 | |
| | | | | | | | |
| Broadcasting – 2.0% | | | | | | | | |
| Nielsen Holdings PLC | | | 74,286 | | | $ | 3,461,728 | |
| Time Warner, Inc. | | | 68,947 | | | | 4,458,802 | |
| Twenty-First Century Fox, Inc. | | | 176,937 | | | | 4,805,609 | |
| | | | | | | | |
| | | $ | 12,726,139 | |
| | | | | | | | |
| Brokerage & Asset Managers – 2.5% | | | | | |
| BlackRock, Inc. | | | 20,470 | | | $ | 6,970,444 | |
| Franklin Resources, Inc. | | | 84,334 | | | | 3,105,178 | |
| NASDAQ, Inc. | | | 97,804 | | | | 5,689,259 | |
| | | | | | | | |
| | | $ | 15,764,881 | |
| | | | | | | | |
| Business Services – 3.7% | | | | | | | | |
| Accenture PLC, “A” | | | 45,544 | | | $ | 4,759,348 | |
| Cognizant Technology Solutions Corp., “A” (a) | | | 56,495 | | | | 3,390,830 | |
| Equifax, Inc. | | | 22,540 | | | | 2,510,280 | |
| Fidelity National Information Services, Inc. | | | 67,110 | | | | 4,066,866 | |
| Fiserv, Inc. (a) | | | 31,030 | | | | 2,838,004 | |
| Gartner, Inc. (a) | | | 35,625 | | | | 3,231,188 | |
| Global Payments, Inc. | | | 43,773 | | | | 2,823,796 | |
| | | | | | | | |
| | | $ | 23,620,312 | |
| | | | | | | | |
| Cable TV – 2.0% | | | | | | | | |
| Charter Communications, Inc., “A” (a)(l) | | | 25,445 | | | $ | 4,658,980 | |
| Comcast Corp., “A” | | | 62,929 | | | | 3,551,083 | |
| Time Warner Cable, Inc. | | | 23,230 | | | | 4,311,256 | |
| | | | | | | | |
| | | $ | 12,521,319 | |
| | | | | | | | |
| | | | | | | | |
| Issuer | | Shares/Par | | | Value ($) | |
| | | | | | | | |
| COMMON STOCKS – continued | | | | | |
| Chemicals – 2.0% | |
| E.I. du Pont de Nemours & Co. | | | 59,181 | | | $ | 3,941,455 | |
| Monsanto Co. | | | 41,442 | | | | 4,082,866 | |
| PPG Industries, Inc. | | | 48,164 | | | | 4,759,566 | |
| | | | | | | | |
| | | $ | 12,783,887 | |
| | | | | | | | |
| Computer Software – 2.6% | | | | | | | | |
| Adobe Systems, Inc. (a) | | | 54,578 | | | $ | 5,127,057 | |
| Oracle Corp. | | | 84,669 | | | | 3,092,959 | |
| Qlik Technologies, Inc. (a) | | | 80,683 | | | | 2,554,424 | |
| Salesforce.com, Inc. (a) | | | 75,038 | | | | 5,882,979 | |
| | | | | | | | |
| | | $ | 16,657,419 | |
| | | | | | | | |
| Computer Software – Systems – 4.4% | | | | | |
| Apple, Inc. (s) | | | 174,447 | | | $ | 18,362,291 | |
| Hewlett Packard Enterprise | | | 310,576 | | | | 4,720,755 | |
| IMS Health Holdings, Inc. (a) | | | 53,619 | | | | 1,365,676 | |
| Sabre Corp. | | | 88,236 | | | | 2,467,961 | |
| SS&C Technologies Holdings, Inc. | | | 13,149 | | | | 897,682 | |
| | | | | | | | |
| | | $ | 27,814,365 | |
| | | | | | | | |
| Construction – 0.5% | | | | | | | | |
| Sherwin-Williams Co. | | | 13,192 | | | $ | 3,424,643 | |
| | | | | | | | |
| Consumer Products – 2.0% | | | | | | | | |
| Estee Lauder Cos., Inc., “A” | | | 33,791 | | | $ | 2,975,635 | |
| Kimberly-Clark Corp. | | | 34,118 | | | | 4,343,221 | |
| Newell Rubbermaid, Inc. | | | 76,395 | | | | 3,367,492 | |
| Sensient Technologies Corp. | | | 30,457 | | | | 1,913,309 | |
| | | | | | | | |
| | | $ | 12,599,657 | |
| | | | | | | | |
| Consumer Services – 0.6% | | | | | | | | |
| Priceline Group, Inc. (a) | | | 3,247 | | | $ | 4,139,763 | |
| | | | | | | | |
| Containers – 0.7% | | | | | | | | |
| Crown Holdings, Inc. (a) | | | 85,864 | | | $ | 4,353,305 | |
| | | | | | | | |
| Electrical Equipment – 3.1% | | | | | | | | |
| Danaher Corp. | | | 171,629 | | | $ | 15,940,902 | |
| W.W. Grainger, Inc. | | | 19,832 | | | | 4,017,765 | |
| | | | | | | | |
| | | $ | 19,958,667 | |
| | | | | | | | |
| Electronics – 1.2% | | | | | | | | |
| Avago Technologies Ltd. | | | 33,092 | | | $ | 4,803,304 | |
| NXP Semiconductors N.V. (a) | | | 31,329 | | | | 2,639,468 | |
| | | | | | | | |
| | | $ | 7,442,772 | |
| | | | | | | | |
| Energy – Independent – 3.8% | | | | | | | | |
| Anadarko Petroleum Corp. | | | 67,636 | | | $ | 3,285,757 | |
| EOG Resources, Inc. | | | 81,022 | | | | 5,735,547 | |
| EQT Corp. | | | 39,150 | | | | 2,040,890 | |
| Memorial Resource Development Corp. (a) | | | 243,223 | | | | 3,928,051 | |
| Noble Energy, Inc. | | | 51,012 | | | | 1,679,825 | |
| Pioneer Natural Resources Co. | | | 18,248 | | | | 2,287,934 | |
| Valero Energy Corp. | | | 70,857 | | | | 5,010,298 | |
| | | | | | | | |
| | | $ | 23,968,302 | |
| | | | | | | | |
7
MFS Research Series
Portfolio of Investments – continued
| | | | | | | | |
| Issuer | | Shares/Par | | | Value ($) | |
| | | | | | | | |
| COMMON STOCKS – continued | | | | | |
| Energy – Integrated – 1.4% | | | | | | | | |
| Exxon Mobil Corp. (s) | | | 116,816 | | | $ | 9,105,807 | |
| | | | | | | | |
| Food & Beverages – 3.4% | | | | | | | | |
| Blue Buffalo Pet Products, Inc. (a)(l) | | | 72,904 | | | $ | 1,364,034 | |
| Coca-Cola Co. | | | 177,843 | | | | 7,640,135 | |
| J.M. Smucker Co. | | | 25,310 | | | | 3,121,735 | |
| Mead Johnson Nutrition Co., “A” | | | 43,261 | | | | 3,415,456 | |
| Mondelez International, Inc. | | | 131,569 | | | | 5,899,554 | |
| | | | | | | | |
| | | $ | 21,440,914 | |
| | | | | | | | |
| Food & Drug Stores – 1.7% | | | | | | | | |
| CVS Health Corp. | | | 69,863 | | | $ | 6,830,506 | |
| Walgreens Boots Alliance, Inc. | | | 45,671 | | | | 3,889,114 | |
| | | | | | | | |
| | | $ | 10,719,620 | |
| | | | | | | | |
| General Merchandise – 2.4% | | | | | | | | |
| Costco Wholesale Corp. | | | 37,414 | | | $ | 6,042,361 | |
| Dollar Tree, Inc. (a) | | | 58,172 | | | | 4,492,042 | |
| Target Corp. | | | 63,636 | | | | 4,620,610 | |
| | | | | | | | |
| | | $ | 15,155,013 | |
| | | | | | | | |
| Health Maintenance Organizations – 1.2% | |
| UnitedHealth Group, Inc. | | | 66,605 | | | $ | 7,835,412 | |
| | | | | | | | |
| Insurance – 2.1% | | | | | | | | |
| ACE Ltd. | | | 44,911 | | | $ | 5,247,850 | |
| American International Group, Inc. | | | 126,840 | | | | 7,860,275 | |
| | | | | | | | |
| | | $ | 13,108,125 | |
| | | | | | | | |
| Internet – 5.9% | | | | | | | | |
| Alibaba Group Holding Ltd., ADR (a) | | | 29,817 | | | $ | 2,423,228 | |
| Alphabet, Inc., “A” (a) | | | 19,834 | | | | 15,431,050 | |
| Alphabet, Inc., “C” (a) | | | 8,891 | | | | 6,747,202 | |
| Facebook, Inc., “A” (a) | | | 93,033 | | | | 9,736,834 | |
| LinkedIn Corp., “A” (a) | | | 14,601 | | | | 3,286,393 | |
| | | | | | | | |
| | | $ | 37,624,707 | |
| | | | | | | | |
| Machinery & Tools – 1.3% | | | | | | | | |
| Roper Technologies, Inc. | | | 42,962 | | | $ | 8,153,758 | |
| | | | | | | | |
| Major Banks – 6.2% | | | | | | | | |
| Goldman Sachs Group, Inc. | | | 32,812 | | | $ | 5,913,707 | |
| JPMorgan Chase & Co. (s) | | | 212,834 | | | | 14,053,429 | |
| PNC Financial Services Group, Inc. | | | 60,849 | | | | 5,799,518 | |
| Wells Fargo & Co. | | | 253,875 | | | | 13,800,645 | |
| | | | | | | | |
| | | $ | 39,567,299 | |
| | | | | | | | |
| Medical & Health Technology & Services – 1.5% | |
| Henry Schein, Inc. (a) | | | 24,469 | | | $ | 3,870,751 | |
| McKesson Corp. | | | 28,697 | | | | 5,659,909 | |
| | | | | | | | |
| | | $ | 9,530,660 | |
| | | | | | | | |
| Medical Equipment – 3.9% | | | | | | | | |
| Cooper Cos., Inc. | | | 23,943 | | | $ | 3,213,151 | |
| Medtronic PLC | | | 122,455 | | | | 9,419,239 | |
| PerkinElmer, Inc. | | | 50,007 | | | | 2,678,875 | |
| Stryker Corp. | | | 69,297 | | | | 6,440,463 | |
| VWR Corp. (a) | | | 120,652 | | | | 3,415,658 | |
| | | | | | | | |
| | | $ | 25,167,386 | |
| | | | | | | | |
| | | | | | | | |
| Issuer | | Shares/Par | | | Value ($) | |
| | | | | | | | |
| COMMON STOCKS – continued | | | | | |
| Natural Gas – Distribution – 0.4% | | | | | | | | |
| Sempra Energy | | | 28,244 | | | $ | 2,655,218 | |
| | | | | | | | |
| Natural Gas – Pipeline – 0.4% | | | | | | | | |
| Enterprise Products Partners LP | | | 96,526 | | | $ | 2,469,135 | |
| | | | | | | | |
| Network & Telecom – 1.3% | | | | | | | | |
| Cisco Systems, Inc. | | | 300,402 | | | $ | 8,157,416 | |
| | | | | | | | |
| Oil Services – 0.9% | | | | | | | | |
| Halliburton Co. | | | 62,069 | | | $ | 2,112,829 | |
| Schlumberger Ltd. | | | 49,342 | | | | 3,441,605 | |
| | | | | | | | |
| | | $ | 5,554,434 | |
| | | | | | | | |
| Other Banks & Diversified Financials – 5.4% | |
| American Express Co. | | | 104,235 | | | $ | 7,249,544 | |
| Discover Financial Services | | | 73,353 | | | | 3,933,188 | |
| PrivateBancorp, Inc. | | | 98,572 | | | | 4,043,423 | |
| Visa, Inc., “A” | | | 201,863 | | | | 15,654,476 | |
| Wintrust Financial Corp. | | | 66,987 | | | | 3,250,209 | |
| | | | | | | | |
| | | $ | 34,130,840 | |
| | | | | | | | |
| Pharmaceuticals – 6.0% | | | | | | | | |
| Allergan PLC (a) | | | 29,928 | | | $ | 9,352,500 | |
| Bristol-Myers Squibb Co. | | | 109,504 | | | | 7,532,780 | |
| Eli Lilly & Co. | | | 103,684 | | | | 8,736,414 | |
| Merck & Co., Inc. | | | 153,389 | | | | 8,102,007 | |
| Valeant Pharmaceuticals International, Inc. (a) | | | 43,886 | | | | 4,461,012 | |
| | | | | | | | |
| | | $ | 38,184,713 | |
| | | | | | | | |
| Railroad & Shipping – 1.3% | | | | | | | | |
| Canadian Pacific Railway Ltd. | | | 15,593 | | | $ | 1,989,667 | |
| Union Pacific Corp. | | | 83,844 | | | | 6,556,601 | |
| | | | | | | | |
| | | $ | 8,546,268 | |
| | | | | | | | |
| Real Estate – 0.7% | | | | | | | | |
| Ventas, Inc., REIT | | | 81,231 | | | $ | 4,583,865 | |
| | | | | | | | |
| Restaurants – 1.3% | | | | | | | | |
| Aramark | | | 121,759 | | | $ | 3,926,728 | |
| YUM! Brands, Inc. | | | 62,871 | | | | 4,592,727 | |
| | | | | | | | |
| | | $ | 8,519,455 | |
| | | | | | | | |
| Specialty Chemicals – 0.8% | | | | | | | | |
| Albemarle Corp. | | | 47,656 | | | $ | 2,669,213 | |
| W.R. Grace & Co. (a) | | | 22,817 | | | | 2,272,345 | |
| | | | | | | | |
| | | $ | 4,941,558 | |
| | | | | | | | |
| Specialty Stores – 4.7% | | | | | | | | |
| Amazon.com, Inc. (a) | | | 17,135 | | | $ | 11,581,375 | |
| American Eagle Outfitters, Inc. | | | 130,807 | | | | 2,027,509 | |
| AutoZone, Inc. (a) | | | 6,681 | | | | 4,956,701 | |
| Gap, Inc. | | | 75,967 | | | | 1,876,385 | |
| Ross Stores, Inc. | | | 84,204 | | | | 4,531,017 | |
| Sally Beauty Holdings, Inc. (a) | | | 86,578 | | | | 2,414,660 | |
| Urban Outfitters, Inc. (a) | | | 124,193 | | | | 2,825,391 | |
| | | | | | | | |
| | | $ | 30,213,038 | |
| | | | | | | | |
| Telecommunications – Wireless – 0.8% | |
| American Tower Corp., REIT | | | 50,686 | | | $ | 4,914,008 | |
| | | | | | | | |
8
MFS Research Series
Portfolio of Investments – continued
| | | | | | | | |
| Issuer | | Shares/Par | | | Value ($) | |
| | | | | | | | |
| COMMON STOCKS – continued | | | | | |
| Telephone Services – 1.2% | | | | | | | | |
| Verizon Communications, Inc. | | | 161,724 | | | $ | 7,474,883 | |
| | | | | | | | |
| Tobacco – 1.8% | | | | | | | | |
| Philip Morris International, Inc. | | | 79,000 | | | $ | 6,944,890 | |
| Reynolds American, Inc. | | | 104,471 | | | | 4,821,337 | |
| | | | | | | | |
| | | | | | $ | 11,766,227 | |
| | | | | | | | |
| Utilities – Electric Power – 2.3% | | | | | |
| American Electric Power Co., Inc. | | | 62,462 | | | $ | 3,639,661 | |
| CMS Energy Corp. | | | 132,193 | | | | 4,769,523 | |
| NextEra Energy, Inc. | | | 44,454 | | | | 4,618,326 | |
| Xcel Energy, Inc. | | | 42,067 | | | | 1,510,626 | |
| | | | | | | | |
| | | | | | $ | 14,538,136 | |
| | | | | | | | |
Total Common Stocks
(Identified Cost, $503,373,355) | | | | | | $ | 630,837,718 | |
| | | | | | | | |
|
| CONVERTIBLE PREFERRED STOCKS – 0.3% | |
| Telephone Services – 0.3% | | | | | | | | |
| Frontier Communications Corp., 11.13% (Identified Cost, $2,350,824) | | | 23,254 | | | $ | 2,129,601 | |
| | | | | | | | |
| |
| MONEY MARKET FUNDS – 0.0% | | | | | |
| MFS Institutional Money Market Portfolio, 0.19%, at Cost and Net Asset Value (v) | | | 378,735 | | | $ | 378,735 | |
| | | | | | | | |
|
| COLLATERAL FOR SECURITIES LOANED – 0.8% | |
| Navigator Securities Lending Prime Portfolio, 0.32%, at Cost and Net Asset Value (j) | | | 4,933,637 | | | $ | 4,933,637 | |
| | | | | | | | |
Total Investments
(Identified Cost, $511,036,551) | | | | | | $ | 638,279,691 | |
| | | | | | | | |
| | | | | | | | |
| Issuer | | Shares/Par | | | Value ($) | |
| | | | | | | | |
| SECURITIES SOLD SHORT – (0.2)% | | | | | |
| Telecommunications – Wireless – (0.2)% | | | | | |
| Crown Castle International Corp., REIT (Proceeds Received, $1,070,031) | | | (13,028 | ) | | $ | (1,126,271 | ) |
| | | | | | | | |
OTHER ASSETS, LESS
LIABILITIES – (0.0)% | | | | | | | (270,862 | ) |
| | | | | | | | |
| NET ASSETS – 100.0% | | | | | | $ | 636,882,558 | |
| | | | | | | | |
| (a) | | Non-income producing security. |
| (j) | | The rate quoted is the annualized seven-day yield of the fund at period end. |
| (l) | | A portion of this security is on loan. |
| (s) | | Security or a portion of the security was pledged to cover collateral requirements for securities sold short. |
| (v) | | Underlying affiliated fund that is available only to investment companies managed by MFS. The rate quoted for the MFS Institutional Money Market Portfolio is the annualized seven-day yield of the fund at period end. |
At December 31, 2015, the fund had cash collateral of $17,541 and other liquid securities with an aggregate value of $2,182,942 to cover any commitments for securities sold short. Cash collateral is comprised of “Deposits with brokers” in the Statement of Assets and Liabilities.
The following abbreviations are used in this report and are defined:
| ADR | | American Depositary Receipt |
| PLC | | Public Limited Company |
| REIT | | Real Estate Investment Trust |
See Notes to Financial Statements
9
MFS Research Series
FINANCIAL STATEMENTS | STATEMENT OF ASSETS AND LIABILITIES
This statement represents your fund’s balance sheet, which details the assets and liabilities comprising the total value of the fund.
| | | | | | | | |
At 12/31/15 | | | | | | | | |
Assets | | | | | | | | |
Investments | | | | | | | | |
Non-affiliated issuers, at value (identified cost, $510,657,816) | | | $637,900,956 | | | | | |
Underlying affiliated funds, at cost and value | | | 378,735 | | | | | |
Total investments, at value, including $5,300,132 of securities on loan (identified cost, $511,036,551) | | | $638,279,691 | | | | | |
Deposits with brokers | | | 17,541 | | | | | |
Receivables for | | | | | | | | |
Investments sold | | | 5,726,629 | | | | | |
Fund shares sold | | | 45,641 | | | | | |
Interest and dividends | | | 593,586 | | | | | |
Other assets | | | 4,194 | | | | | |
Total assets | | | | | | | $644,667,282 | |
Liabilities | | | | | | | | |
Payables for | | | | | | | | |
Securities sold short, at value (proceeds received, $1,070,031) | | | $1,126,271 | | | | | |
Investments purchased | | | 545,868 | | | | | |
Fund shares reacquired | | | 1,032,031 | | | | | |
Collateral for securities loaned, at value (c) | | | 4,933,637 | | | | | |
Payable to affiliates | | | | | | | | |
Investment adviser | | | 26,764 | | | | | |
Shareholder servicing costs | | | 246 | | | | | |
Distribution and/or service fees | | | 3,145 | | | | | |
Payable for independent Trustees’ compensation | | | 15 | | | | | |
Accrued expenses and other liabilities | | | 116,747 | | | | | |
Total liabilities | | | | | | | $7,784,724 | |
Net assets | | | | | | | $636,882,558 | |
Net assets consist of | | | | | | | | |
Paid-in capital | | | $444,492,845 | | | | | |
Unrealized appreciation (depreciation) on investments and translation of assets and liabilities in foreign currencies | | | 127,186,905 | | | | | |
Accumulated net realized gain (loss) on investments and foreign currency | | | 60,823,669 | | | | | |
Undistributed net investment income | | | 4,379,139 | | | | | |
Net assets | | | | | | | $636,882,558 | |
Shares of beneficial interest outstanding | | | | | | | 23,953,934 | |
| | | | | | | | | | | | |
| | | Net assets | | | Shares
outstanding | | | Net asset value
per share | |
Initial Class | | | $410,178,419 | | | | 15,374,339 | | | | $26.68 | |
Service Class | | | 226,704,139 | | | | 8,579,595 | | | | 26.42 | |
| (c) | Non-cash collateral is not included. |
See Notes to Financial Statements
10
MFS Research Series
FINANCIAL STATEMENTS | STATEMENT OF OPERATIONS
This statement describes how much your fund earned in investment income and accrued in expenses. It also describes any gains and/or losses generated by fund operations.
| | | | | | | | |
Year ended 12/31/15 | | | | | | | | |
Net investment income | | | | | |
Income | | | | | | | | |
Dividends | | | $10,560,745 | | | | | |
Interest | | | 15,373 | | | | | |
Dividends from underlying affiliated funds | | | 4,803 | | | | | |
Foreign taxes withheld | | | (8,313 | ) | | | | |
Total investment income | | | | | | | $10,572,608 | |
Expenses | | | | | | | | |
Management fee | | | $5,174,172 | | | | | |
Distribution and/or service fees | | | 614,960 | | | | | |
Shareholder servicing costs | | | 40,754 | | | | | |
Administrative services fee | | | 117,512 | | | | | |
Independent Trustees’ compensation | | | 16,523 | | | | | |
Custodian fee | | | 67,496 | | | | | |
Shareholder communications | | | 80,093 | | | | | |
Audit and tax fees | | | 55,795 | | | | | |
Legal fees | | | 5,242 | | | | | |
Dividend and interest expense on securities sold short | | | 38,700 | | | | | |
Miscellaneous | | | 29,902 | | | | | |
Total expenses | | | | | | | $6,241,149 | |
Fees paid indirectly | | | (15 | ) | | | | |
Reduction of expenses by investment adviser | | | (47,896 | ) | | | | |
Net expenses | | | | | | | $6,193,238 | |
Net investment income | | | | | | | $4,379,370 | |
Realized and unrealized gain (loss) on investments and foreign currency | | | | | | | | |
Realized gain (loss) (identified cost basis) | | | | | | | | |
Investments | | | $61,606,144 | | | | | |
Foreign currency | | | (170 | ) | | | | |
Net realized gain (loss) on investments and foreign currency | | | | | | | $61,605,974 | |
Change in unrealized appreciation (depreciation) | | | | | | | | |
Investments | | | $(59,292,419 | ) | | | | |
Securities sold short | | | (56,240 | ) | | | | |
Translation of assets and liabilities in foreign currencies | | | 4 | | | | | |
Net unrealized gain (loss) on investments and foreign currency translation | | | | | | | $(59,348,655 | ) |
Net realized and unrealized gain (loss) on investments and foreign currency | | | | | | | $2,257,319 | |
Change in net assets from operations | | | | | | | $6,636,689 | |
See Notes to Financial Statements
11
MFS Research Series
FINANCIAL STATEMENTS | STATEMENTS OF CHANGES IN NET ASSETS
These statements describe the increases and/or decreases in net assets resulting from operations, any distributions, and any shareholder transactions.
| | | | | | | | |
For years ended 12/31 | | | 2015 | | | | 2014 | |
Change in net assets | | | | | | | | |
From operations | | | | | | | | |
Net investment income | | | $4,379,370 | | | | $4,312,097 | |
Net realized gain (loss) on investments and foreign currency | | | 61,605,974 | | | | 51,675,015 | |
Net unrealized gain (loss) on investments and foreign currency translation | | | (59,348,655 | ) | | | 15,785,872 | |
Change in net assets from operations | | | $6,636,689 | | | | $71,772,984 | |
Distributions declared to shareholders | | | | | | | | |
From net investment income | | | $(4,312,083 | ) | | | $(5,407,049 | ) |
From net realized gain on investments | | | (51,371,520 | ) | | | (55,311,546 | ) |
Total distributions declared to shareholders | | | $(55,683,603 | ) | | | $(60,718,595 | ) |
Change in net assets from fund share transactions | | | $(42,383,780 | ) | | | $(58,652,020 | ) |
Total change in net assets | | | $(91,430,694 | ) | | | $(47,597,631 | ) |
Net assets | | | | | | | | |
At beginning of period | | | 728,313,252 | | | | 775,910,883 | |
At end of period (including undistributed net investment income of $4,379,139 and
$4,312,022, respectively) | | | $636,882,558 | | | | $728,313,252 | |
See Notes to Financial Statements
12
MFS Research Series
FINANCIAL STATEMENTS | FINANCIAL HIGHLIGHTS
The financial highlights table is intended to help you understand the fund’s financial performance for the past 5 years. Certain information reflects financial results for a single fund share. The total returns in the table represent the rate by which an investor would have earned (or lost) on an investment in the fund share class (assuming reinvestment of all distributions) held for the entire period.
| | | | | | | | | | | | | | | | | | | | |
| Initial Class | | Years ended 12/31 | |
| | | 2015 | | | 2014 | | | 2013 | | | 2012 | | | 2011 | |
Net asset value, beginning of period | | | $29.11 | | | | $28.74 | | | | $21.84 | | | | $18.78 | | | | $19.04 | |
| Income (loss) from investment operations | | | | | | | | | | | | | | | | | | | | |
Net investment income (d) | | | $0.21 | | | | $0.19 | | | | $0.20 | | | | $0.22 | | | | $0.15 | |
Net realized and unrealized gain (loss) on investments
and foreign currency | | | (0.17 | )(g) | | | 2.68 | | | | 6.84 | | | | 3.01 | | | | (0.24 | ) |
Total from investment operations | | | $0.04 | | | | $2.87 | | | | $7.04 | | | | $3.23 | | | | $(0.09 | ) |
| Less distributions declared to shareholders | | | | | | | | | | | | | | | | | | | | |
From net investment income | | | $(0.22 | ) | | | $(0.25 | ) | | | $(0.08 | ) | | | $(0.17 | ) | | | $(0.17 | ) |
From net realized gain on investments | | | (2.25 | ) | | | (2.25 | ) | | | (0.06 | ) | | | — | | | | — | |
Total distributions declared to shareholders | | | $(2.47 | ) | | | $(2.50 | ) | | | $(0.14 | ) | | | $(0.17 | ) | | | $(0.17 | ) |
Net asset value, end of period (x) | | | $26.68 | | | | $29.11 | | | | $28.74 | | | | $21.84 | | | | $18.78 | |
Total return (%) (k)(r)(s)(x) | | | 0.80 | | | | 10.20 | | | | 32.35 | | | | 17.22 | | | | (0.45 | ) |
Ratios (%) (to average net assets)
and Supplemental data: | | | | | | | | | | | | | | | | | | | | |
Expenses before expense reductions (f) | | | 0.82 | | | | 0.80 | | | | 0.81 | | | | 0.88 | | | | 0.88 | |
Expenses after expense reductions (f) | | | 0.81 | | | | 0.80 | | | | 0.81 | | | | 0.88 | | | | 0.88 | |
Net investment income | | | 0.72 | | | | 0.67 | | | | 0.80 | | | | 1.06 | | | | 0.79 | |
Portfolio turnover | | | 43 | | | | 34 | | | | 43 | | | | 83 | | | | 70 | |
Net assets at end of period (000 omitted) | | | $410,178 | | | | $468,286 | | | | $496,857 | | | | $460,834 | | | | $160,892 | |
| Supplemental Ratios (%): | | | | | | | | | | | | | | | | | | | | |
Ratio of expenses to average net assets after expense reductions excluding short sale dividend and interest expense (f) | | | 0.80 | | | | N/A | | | | 0.80 | | | | 0.87 | | | | 0.86 | |
See Notes to Financial Statements
13
MFS Research Series
Financial Highlights – continued
| | | | | | | | | | | | | | | | | | | | |
| Service Class | | Years ended 12/31 | |
| | | 2015 | | | 2014 | | | 2013 | | | 2012 | | | 2011 | |
Net asset value, beginning of period | | | $28.84 | | | | $28.49 | | | | $21.70 | | | | $18.67 | | | | $18.93 | |
| Income (loss) from investment operations | | | | | | | | | | | | | | | | | | | | |
Net investment income (d) | | | $0.13 | | | | $0.12 | | | | $0.14 | | | | $0.18 | | | | $0.10 | |
Net realized and unrealized gain (loss) on investments
and foreign currency | | | (0.16 | )(g) | | | 2.65 | | | | 6.78 | | | | 2.97 | | | | (0.24 | ) |
Total from investment operations | | | $(0.03 | ) | | | $2.77 | | | | $6.92 | | | | $3.15 | | | | $(0.14 | ) |
| Less distributions declared to shareholders | | | | | | | | | | | | | | | | | | | | |
From net investment income | | | $(0.14 | ) | | | $(0.17 | ) | | | $(0.07 | ) | | | $(0.12 | ) | | | $(0.12 | ) |
From net realized gain on investments | | | (2.25 | ) | | | (2.25 | ) | | | (0.06 | ) | | | — | | | | — | |
Total distributions declared to shareholders | | | $(2.39 | ) | | | $(2.42 | ) | | | $(0.13 | ) | | | $(0.12 | ) | | | $(0.12 | ) |
Net asset value, end of period (x) | | | $26.42 | | | | $28.84 | | | | $28.49 | | | | $21.70 | | | | $18.67 | |
Total return (%) (k)(r)(s)(x) | | | 0.53 | | | | 9.94 | | | | 32.00 | | | | 16.90 | | | | (0.69 | ) |
Ratios (%) (to average net assets)
and Supplemental data: | | | | | | | | | | | | | | | | | | | | |
Expenses before expense reductions (f) | | | 1.07 | | | | 1.05 | | | | 1.06 | | | | 1.11 | | | | 1.13 | |
Expenses after expense reductions (f) | | | 1.06 | | | | 1.05 | | | | 1.05 | | | | 1.11 | | | | 1.13 | |
Net investment income | | | 0.47 | | | | 0.42 | | | | 0.56 | | | | 0.82 | | | | 0.55 | |
Portfolio turnover | | | 43 | �� | | | 34 | | | | 43 | | | | 83 | | | | 70 | |
Net assets at end of period (000 omitted) | | | $226,704 | | | | $260,028 | | | | $279,054 | | | | $266,040 | | | | $20,015 | |
| Supplemental Ratios (%): | | | | | | | | | | | | | | | | | | | | |
Ratio of expenses to average net assets after expense reductions excluding short sale dividend and interest expense (f) | | | 1.05 | | | | N/A | | | | 1.05 | | | | 1.11 | | | | 1.11 | |
| (d) | Per share data is based on average shares outstanding. |
| (f) | Ratios do not reflect reductions from fees paid indirectly, if applicable. |
| (g) | The per share amount varies from the net realized and unrealized gain/loss for the period because of the timing of sales of fund shares and the per share amount of realized and unrealized gains and losses at such time. |
| (k) | The total return does not reflect expenses that apply to separate accounts. Inclusion of these charges would reduce the total return figures for all periods shown. |
| (r) | Certain expenses have been reduced without which performance would have been lower. |
| (s) | From time to time the fund may receive proceeds from litigation settlements, without which performance would be lower. |
| (x) | The net asset values and total returns have been calculated on net assets which include adjustments made in accordance with U.S. generally accepted accounting principles required at period end for financial reporting purposes. |
See Notes to Financial Statements
14
MFS Research Series
NOTES TO FINANCIAL STATEMENTS
| (1) | | Business and Organization |
MFS Research Series (the fund) is a diversified series of MFS Variable Insurance Trust (the trust). The trust is organized as a Massachusetts business trust and is registered under the Investment Company Act of 1940, as amended, as an open-end management investment company. The shareholders of each series of the trust are separate accounts of insurance companies, which offer variable annuity and/or life insurance products, and qualified retirement and pension plans.
The fund is an investment company and accordingly follows the investment company accounting and reporting guidance of the Financial Accounting Standards Board (FASB) Accounting Standards Codification Topic 946 Financial Services – Investment Companies.
| (2) | | Significant Accounting Policies |
General – The preparation of financial statements in conformity with U.S. generally accepted accounting principles requires management to make estimates and assumptions that affect the reported amounts of assets and liabilities, and disclosure of contingent assets and liabilities at the date of the financial statements and the reported amounts of increases and decreases in net assets from operations during the reporting period. Actual results could differ from those estimates. In the preparation of these financial statements, management has evaluated subsequent events occurring after the date of the fund’s Statement of Assets and Liabilities through the date that the financial statements were issued.
In January 2016, FASB issued Accounting Standards Update 2016-01, Financial Instruments – Overall (Subtopic 825-10) – Recognition and Measurement of Financial Assets and Financial Liabilities (“ASU 2016-01”) which would first be effective for annual reporting periods beginning after December 15, 2017, and interim periods therein. ASU 2016-01, which changes the accounting for equity investments and for certain financial liabilities, also modifies the presentation and disclosure requirements for financial instruments. Investment companies are specifically exempted from ASU 2016-01’s equity investment accounting provisions and will continue to follow the industry specific guidance for investment accounting under ASC 946. Although still evaluating the potential impacts of ASU 2016-01 to the fund, management expects that the impact of the fund’s adoption will be limited to additional financial statement disclosures.
Balance Sheet Offsetting – The fund’s accounting policy with respect to balance sheet offsetting is that, absent an event of default by the counterparty or a termination of the agreement, the International Swaps and Derivatives Association (ISDA) Master Agreement does not result in an offset of reported amounts of financial assets and financial liabilities in the Statement of Assets and Liabilities across transactions between the fund and the applicable counterparty. The fund’s right to setoff may be restricted or prohibited by the bankruptcy or insolvency laws of the particular jurisdiction to which a specific master netting agreement counterparty is subject. Balance sheet offsetting disclosures, to the extent applicable to the fund, have been included in the fund’s Significant Accounting Policies note under the captions for each of the fund’s in-scope financial instruments and transactions.
Investment Valuations – Equity securities, including restricted equity securities, are generally valued at the last sale or official closing price on their primary market or exchange as provided by a third-party pricing service. Equity securities, for which there were no sales reported that day, are generally valued at the last quoted daily bid quotation on their primary market or exchange as provided by a third-party pricing service. Equity securities held short, for which there were no sales reported for that day, are generally valued at the last quoted daily ask quotation on their primary market or exchange as provided by a third-party pricing service. Short-term instruments with a maturity at issuance of 60 days or less may be valued at amortized cost, which approximates market value. Open-end investment companies are generally valued at net asset value per share. Securities and other assets generally valued on the basis of information from a third-party pricing service may also be valued at a broker/dealer bid quotation. Values obtained from third-party pricing services can utilize both transaction data and market information such as yield, quality, coupon rate, maturity, type of issue, trading characteristics, and other market data. The values of foreign securities and other assets and liabilities expressed in foreign currencies are converted to U.S. dollars using the mean of bid and asked prices for rates provided by a third-party pricing service.
The Board of Trustees has delegated primary responsibility for determining or causing to be determined the value of the fund’s investments (including any fair valuation) to the adviser pursuant to valuation policies and procedures approved by the Board. If the adviser determines that reliable market quotations are not readily available, investments are valued at fair value as determined in good faith by the adviser in accordance with such procedures under the oversight of the Board of Trustees. Under the fund’s valuation policies and procedures, market quotations are not considered to be readily available for most types of debt instruments and floating rate loans and many types of derivatives. These investments are generally valued at fair value based on information from third-party pricing services. In addition, investments may be valued at fair value if the adviser determines that an investment’s value has been materially affected by events occurring after the close of the exchange or market on which the investment is principally traded (such as foreign exchange or market) and prior to the determination of the fund’s net asset value, or after the halting of trading of a specific security where trading does not resume prior to the close of the exchange or market on which the security is principally traded. Events that occur on a frequent basis after foreign markets close (such as developments in foreign markets and
15
MFS Research Series
Notes to Financial Statements – continued
significant movements in the U.S. markets) and prior to the determination of the fund’s net asset value may be deemed to have a material effect on the value of securities traded in foreign markets. Accordingly, the fund’s foreign equity securities may often be valued at fair value. The adviser generally relies on third-party pricing services or other information (such as the correlation with price movements of similar securities in the same or other markets; the type, cost and investment characteristics of the security; the business and financial condition of the issuer; and trading and other market data) to assist in determining whether to fair value and at what value to fair value an investment. The value of an investment for purposes of calculating the fund’s net asset value can differ depending on the source and method used to determine value. When fair valuation is used, the value of an investment used to determine the fund’s net asset value may differ from quoted or published prices for the same investment. There can be no assurance that the fund could obtain the fair value assigned to an investment if it were to sell the investment at the same time at which the fund determines its net asset value per share.
Various inputs are used in determining the value of the fund’s assets or liabilities. These inputs are categorized into three broad levels. In certain cases, the inputs used to measure fair value may fall into different levels of the fair value hierarchy. In such cases, an investment’s level within the fair value hierarchy is based on the lowest level of input that is significant to the fair value measurement. The fund’s assessment of the significance of a particular input to the fair value measurement in its entirety requires judgment, and considers factors specific to the investment. Level 1 includes unadjusted quoted prices in active markets for identical assets or liabilities. Level 2 includes other significant observable market-based inputs (including quoted prices for similar securities, interest rates, prepayment speed, and credit risk). Level 3 includes unobservable inputs, which may include the adviser’s own assumptions in determining the fair value of investments. The following is a summary of the levels used as of December 31, 2015 in valuing the fund’s assets or liabilities:
| | | | | | | | | | | | | | | | |
| Investments at Value | | Level 1 | | | Level 2 | | | Level 3 | | | Total | |
| Equity Securities: | | | | | | | | | | | | | | | | |
United States | | | $621,150,205 | | | | $— | | | | $— | | | | $621,150,205 | |
Canada | | | 6,450,679 | | | | — | | | | — | | | | 6,450,679 | |
Netherlands | | | 2,639,468 | | | | — | | | | — | | | | 2,639,468 | |
China | | | 2,423,228 | | | | — | | | | — | | | | 2,423,228 | |
Hong Kong | | | — | | | | 303,739 | | | | — | | | | 303,739 | |
| Mutual Funds | | | 5,312,372 | | | | — | | | | — | | | | 5,312,372 | |
| Total Investments | | | $637,975,952 | | | | $303,739 | | | | $— | | | | $638,279,691 | |
| Short Sales | | | $(1,126,271 | ) | | | $— | | | | $— | | | | $(1,126,271 | ) |
For further information regarding security characteristics, see the Portfolio of Investments.
Foreign Currency Translation – Purchases and sales of foreign investments, income, and expenses are converted into U.S. dollars based upon currency exchange rates prevailing on the respective dates of such transactions or on the reporting date for foreign denominated receivables and payables. Gains and losses attributable to foreign currency exchange rates on sales of securities are recorded for financial statement purposes as net realized gains and losses on investments. Gains and losses attributable to foreign exchange rate movements on receivables, payables, income and expenses are recorded for financial statement purposes as foreign currency transaction gains and losses. That portion of both realized and unrealized gains and losses on investments that results from fluctuations in foreign currency exchange rates is not separately disclosed.
Short Sales – The fund entered into short sales whereby it sells a security it does not own in anticipation of a decline in the value of that security. The fund will realize a gain if the security price decreases and a loss if the security price increases between the date of the short sale and the date on which the fund replaces the borrowed security. Losses from short sales can exceed the proceeds of the security sold; and they can also exceed the potential loss from an ordinary buy and sell transaction. The amount of any premium, dividends, or interest the fund may be required to pay in connection with a short sale will be recognized as a fund expense. During the year ended December 31, 2015, this expense amounted to $38,700. The fund segregates cash or marketable securities in an amount that, when combined with the amount of proceeds from the short sale deposited with the broker, at least equals the current market value of the security sold short.
Security Loans – Under its Securities Lending Agency Agreement with the fund, State Street Bank and Trust Company (“State Street”), as lending agent, loans the securities of the fund to certain qualified institutions (the “Borrowers”) approved by the fund. Security loans can be terminated at the discretion of either the lending agent or the fund and the related securities must be returned within the earlier of the standard trade settlement period for such securities or within three business days. The loans are collateralized by cash and/or U.S. Treasury and federal agency obligations in an amount typically at least equal to the market value of the securities loaned. On loans collateralized by cash, the cash collateral is invested in a money market fund. The market value of the loaned securities is determined at the close of business of the fund and any additional required collateral is delivered to the fund on the next business day. State Street provides the fund with indemnification against Borrower default. In the event of Borrower default, State Street will, for the benefit of the fund, either purchase securities identical to those loaned or, when such purchase is
16
MFS Research Series
Notes to Financial Statements – continued
commercially impracticable, pay the fund the market value of the loaned securities. In return, State Street assumes the fund’s rights to the related collateral. If the collateral value is less than the cost to purchase identical securities, State Street is responsible for the shortfall, but only to the extent that such shortfall is not due to a decline in collateral value resulting from collateral reinvestment for which the fund bears the risk of loss. At period end, the fund had investment securities on loan, all of which were classified as equity securities in the fund’s Portfolio of Investments, with a fair value of $5,300,132. The fair value of the fund’s investment securities on loan and a related liability of $4,933,637 for cash collateral received on securities loaned are both presented gross in the Statement of Assets and Liabilities. Additionally, these loans were collateralized by U.S. Treasury Obligations of $494,600. The collateral received on securities loaned exceeded the value of securities on loan at period end. The liability for cash collateral for securities loaned is carried at fair value, which is categorized as level 2 within the fair value hierarchy. A portion of the income generated upon investment of the collateral is remitted to the Borrowers, and the remainder is allocated between the fund and the lending agent. On loans collateralized by U.S. Treasury and/or federal agency obligations, a fee is received from the Borrower, and is allocated between the fund and the lending agent. Income from securities lending is included in “Interest” income in the Statement of Operations. The dividend and interest income earned on the securities loaned is accounted for in the same manner as other dividend and interest income.
Indemnifications – Under the fund’s organizational documents, its officers and Trustees may be indemnified against certain liabilities and expenses arising out of the performance of their duties to the fund. Additionally, in the normal course of business, the fund enters into agreements with service providers that may contain indemnification clauses. The fund’s maximum exposure under these agreements is unknown as this would involve future claims that may be made against the fund that have not yet occurred.
Investment Transactions and Income – Investment transactions are recorded on the trade date. Interest income is recorded on the accrual basis. Dividends received in cash are recorded on the ex-dividend date. Certain dividends from foreign securities will be recorded when the fund is informed of the dividend if such information is obtained subsequent to the ex-dividend date. Dividend and interest payments received in additional securities are recorded on the ex-dividend or ex-interest date in an amount equal to the value of the security on such date.
The fund may receive proceeds from litigation settlements. Any proceeds received from litigation involving portfolio holdings are reflected in the Statement of Operations in realized gain/loss if the security has been disposed of by the fund or in unrealized gain/loss if the security is still held by the fund. Any other proceeds from litigation not related to portfolio holdings are reflected as other income in the Statement of Operations.
Fees Paid Indirectly – Prior to October 1, 2015, the fund’s custody fee could be reduced by a credit earned under an arrangement that measured the value of U.S. dollars deposited with the custodian by the fund. The amount of the credit, for the year ended December 31, 2015, is shown as a reduction of total expenses in the Statement of Operations.
Tax Matters and Distributions – The fund intends to qualify as a regulated investment company, as defined under Subchapter M of the Internal Revenue Code, and to distribute all of its taxable income, including realized capital gains. As a result, no provision for federal income tax is required. The fund’s federal tax returns, when filed, will remain subject to examination by the Internal Revenue Service for a three year period. Management has analyzed the fund’s tax positions taken on federal and state tax returns for all open tax years and does not believe that there are any uncertain tax positions that require recognition of a tax liability. Foreign taxes, if any, have been accrued by the fund in the accompanying financial statements in accordance with the applicable foreign tax law. Foreign income taxes may be withheld by certain countries in which the fund invests. Additionally, capital gains realized by the fund on securities issued in or by certain foreign countries may be subject to capital gains tax imposed by those countries.
Distributions to shareholders are recorded on the ex-dividend date. Income and capital gain distributions are determined in accordance with income tax regulations, which may differ from U.S. generally accepted accounting principles. Certain capital accounts in the financial statements are periodically adjusted for permanent differences in order to reflect their tax character. These adjustments have no impact on net assets or net asset value per share. Temporary differences which arise from recognizing certain items of income, expense, gain or loss in different periods for financial statement and tax purposes will reverse at some time in the future. Distributions in excess of net investment income or net realized gains are temporary overdistributions for financial statement purposes resulting from differences in the recognition or classification of income or distributions for financial statement and tax purposes.
Book/tax differences primarily relate to wash sale loss deferrals.
The tax character of distributions declared to shareholders for the last two fiscal years is as follows:
| | | | | | | | |
| | | 12/31/15 | | | 12/31/14 | |
| Ordinary income (including any short-term capital gains) | | | $10,616,411 | | | | $33,841,423 | |
| Long-term capital gains | | | 45,067,192 | | | | 26,877,172 | |
| Total distributions | | | $55,683,603 | | | | $60,718,595 | |
17
MFS Research Series
Notes to Financial Statements – continued
The federal tax cost and the tax basis components of distributable earnings were as follows:
| | | | |
| As of 12/31/15 | | | | |
| Cost of investments | | | $512,289,488 | |
| Gross appreciation | | | 144,538,197 | |
| Gross depreciation | | | (18,547,994 | ) |
| Net unrealized appreciation (depreciation) | | | $125,990,203 | |
| Undistributed ordinary income | | | 10,346,073 | |
| Undistributed long-term capital gain | | | 56,109,672 | |
| Other temporary differences | | | (56,235 | ) |
Multiple Classes of Shares of Beneficial Interest – The fund offers multiple classes of shares, which differ in their respective distribution and/or service fees. The fund’s income, realized and unrealized gain (loss), and common expenses are allocated to shareholders based on the daily net assets of each class. Dividends are declared separately for each class. Differences in per share dividend rates are generally due to differences in separate class expenses. The fund’s distributions declared to shareholders as reported in the Statements of Changes in Net Assets are presented by class as follows:
| | | | | | | | | | | | | | | | |
| | | From net investment
income | | | From net realized gain on
investments | |
| | | Year ended
12/31/15 | | | Year ended
12/31/14 | | | Year ended
12/31/15 | | | Year ended
12/31/14 | |
| Initial Class | | | $3,188,529 | | | | $3,892,093 | | | | $32,895,928 | | | | $35,317,366 | |
| Service Class | | | 1,123,554 | | | | 1,514,956 | | | | 18,475,592 | | | | 19,994,180 | |
| Total | | | $4,312,083 | | | | $5,407,049 | | | | $51,371,520 | | | | $55,311,546 | |
| (3) | | Transactions with Affiliates |
Investment Adviser – The fund has an investment advisory agreement with MFS to provide overall investment management and related administrative services and facilities to the fund. The management fee is computed daily and paid monthly at the following annual rates:
| | | | |
| First $1 billion of average daily net assets | | | 0.75% | |
| Average daily net assets in excess of $1 billion | | | 0.65% | |
MFS has agreed in writing to reduce its management fee by a specified amount if certain MFS mutual fund assets exceed thresholds agreed to by MFS and the fund’s Board of Trustees. For the year ended December 31, 2015, this management fee reduction amounted to $47,896, which is included in the reduction of total expenses in the Statement of Operations. The management fee incurred for the year ended December 31, 2015 was equivalent to an annual effective rate of 0.74% of the fund’s average daily net assets.
Distributor – MFS Fund Distributors, Inc. (MFD), a wholly-owned subsidiary of MFS, is the distributor of shares of the fund. The Trustees have adopted a distribution plan for the Service Class shares pursuant to Rule 12b-1 under the Investment Company Act of 1940.
The fund’s distribution plan provides that the fund will pay MFD distribution and/or service fees equal to 0.25% per annum of its average daily net assets attributable to Service Class shares as partial consideration for services performed and expenses incurred by MFD and financial intermediaries (including participating insurance companies that invest in the fund to fund variable annuity and variable life insurance contracts, sponsors of qualified retirement and pension plans that invest in the fund, and affiliates of these participating insurance companies and plan sponsors) in connection with the sale and distribution of the Service Class shares. MFD may subsequently pay all, or a portion, of the distribution and/or service fees to financial intermediaries.
Shareholder Servicing Agent – MFS Service Center, Inc. (MFSC), a wholly-owned subsidiary of MFS, receives a fee from the fund for its services as shareholder servicing agent. For the year ended December 31, 2015, the fee was $39,140, which equated to 0.0057% annually of the fund’s average daily net assets. MFSC also receives payment from the fund for out-of-pocket expenses paid by MFSC on behalf of the fund. For the year ended December 31, 2015, these costs amounted to $1,614.
Administrator – MFS provides certain financial, legal, shareholder communications, compliance, and other administrative services to the fund. Under an administrative services agreement, the fund reimburses MFS the costs incurred to provide these services. The fund is charged an annual fixed amount of $17,500 plus a fee based on average daily net assets. The administrative services fee incurred for the year ended December 31, 2015 was equivalent to an annual effective rate of 0.0170% of the fund’s average daily net assets.
18
MFS Research Series
Notes to Financial Statements – continued
Trustees’ and Officers’ Compensation – The fund pays compensation to independent Trustees in the form of a retainer, attendance fees, and additional compensation to Board and Committee chairpersons. The fund does not pay compensation directly to Trustees or officers of the fund who are also officers of the investment adviser, all of whom receive remuneration for their services to the fund from MFS. Certain officers and Trustees of the fund are officers or directors of MFS, MFD, and MFSC.
Other – This fund and certain other funds managed by MFS (the funds) have entered into a service agreement (the ISO Agreement) which provides for payment of fees solely by the funds to Tarantino LLC in return for the provision of services of an Independent Senior Officer (ISO) for the funds. Frank L. Tarantino serves as the ISO and is an officer of the funds and the sole member of Tarantino LLC. The funds can terminate the ISO Agreement with Tarantino LLC at any time under the terms of the ISO Agreement. For the year ended December 31, 2015, the fee paid by the fund under this agreement was $2,200 and is included in “Miscellaneous” expense in the Statement of Operations. MFS has agreed to bear all expenses associated with office space, other administrative support, and supplies provided to the ISO.
The fund invests in the MFS Institutional Money Market Portfolio which is managed by MFS and seeks current income consistent with preservation of capital and liquidity. Income earned on this investment is included in “Dividends from underlying affiliated funds” in the Statement of Operations. This money market fund does not pay a management fee to MFS.
For the year ended December 31, 2015, purchases and sales of investments, other than short sales and short-term obligations, aggregated $295,684,242 and $389,184,294, respectively.
| (5) | | Shares of Beneficial Interest |
The fund’s Declaration of Trust permits the Trustees to issue an unlimited number of full and fractional shares of beneficial interest. Transactions in fund shares were as follows:
| | | | | | | | | | | | | | | | |
| | | Year ended 12/31/15 | | | Year ended 12/31/14 | |
| | | Shares | | | Amount | | | Shares | | | Amount | |
| Shares sold | | | | | | | | | | | | | | | | |
Initial Class | | | 440,653 | | | | $12,346,887 | | | | 543,408 | | | | $15,577,721 | |
Service Class | | | 437,031 | | | | 12,245,344 | | | | 422,906 | | | | 12,106,891 | |
| | | 877,684 | | | | $24,592,231 | | | | 966,314 | | | | $27,684,612 | |
| Shares issued to shareholders in reinvestment of distributions | | | | | | | | | | | | | | | | |
Initial Class | | | 1,461,501 | | | | $36,084,457 | | | | 1,381,587 | | | | $39,209,459 | |
Service Class | | | 800,619 | | | | 19,599,146 | | | | 764,362 | | | | 21,509,136 | |
| | | 2,262,120 | | | | $55,683,603 | | | | 2,145,949 | | | | $60,718,595 | |
| Shares reacquired | | | | | | | | | | | | | | | | |
Initial Class | | | (2,615,436 | ) | | | $(75,387,067 | ) | | | (3,124,409 | ) | | | $(90,997,198 | ) |
Service Class | | | (1,675,253 | ) | | | (47,272,547 | ) | | | (1,964,146 | ) | | | (56,058,029 | ) |
| | | (4,290,689 | ) | | | $(122,659,614 | ) | | | (5,088,555 | ) | | | $(147,055,227 | ) |
| Net change | | | | | | | | | | | | | | | | |
Initial Class | | | (713,282 | ) | | | $(26,955,723 | ) | | | (1,199,414 | ) | | | $(36,210,018 | ) |
Service Class | | | (437,603 | ) | | | (15,428,057 | ) | | | (776,878 | ) | | | (22,442,002 | ) |
| | | (1,150,885 | ) | | | $(42,383,780 | ) | | | (1,976,292 | ) | | | $(58,652,020 | ) |
The fund is one of several mutual funds in which certain MFS funds may invest. The MFS funds do not invest in the underlying funds for the purpose of exercising management or control. At the end of the period, the MFS Moderate Allocation Portfolio, the MFS Growth Allocation Portfolio, and the MFS Conservative Allocation Portfolio were the owners of record of approximately 23%, 7%, and 7%, respectively, of the value of outstanding voting shares of the fund.
The fund and certain other funds managed by MFS participate in a $1.25 billion unsecured committed line of credit, subject to a $1 billion sublimit, provided by a syndication of banks under a credit agreement. Borrowings may be made for temporary financing needs. Interest is charged to each fund, based on its borrowings, generally at a rate equal to the higher of the Overnight Federal Reserve funds rate or daily one month LIBOR plus an agreed upon spread. A commitment fee, based on the average daily, unused portion of the committed line of credit, is allocated among the participating funds at the end of each calendar quarter. In addition, the fund and other funds managed by MFS have established unsecured uncommitted borrowing arrangements with certain banks for temporary financing needs. Interest is charged to each fund, based on its borrowings, at a rate equal to the Overnight Federal Reserve funds rate plus an agreed upon spread. For the year ended December 31, 2015, the fund’s commitment fee and interest expense were $2,317 and $0, respectively, and are included in “Miscellaneous” expense in the Statement of Operations.
19
MFS Research Series
Notes to Financial Statements – continued
| (7) | | Transactions in Underlying Affiliated Funds – Affiliated Issuers |
An affiliated issuer may be considered one in which the fund owns 5% or more of the outstanding voting securities, or a company which is under common control. For the purposes of this report, the fund assumes the following to be an affiliated issuer:
| | | | | | | | | | | | | | |
| Underlying Affiliated Fund | | Beginning
Shares/Par
Amount | | Acquisitions
Shares/Par
Amount | | | Dispositions
Shares/Par
Amount | | | Ending
Shares/Par
Amount | |
| MFS Institutional Money Market Portfolio | | 2,802,369 | | | 112,053,719 | | | | (114,477,353 | ) | | | 378,735 | |
| | | | |
| Underlying Affiliated Fund | | Realized
Gain (Loss) | | Capital Gain
Distributions | | | Dividend
Income | | | Ending
Value | |
| MFS Institutional Money Market Portfolio | | $— | | | $— | | | | $4,803 | | | | $378,735 | |
20
MFS Research Series
REPORT OF INDEPENDENT REGISTERED PUBLIC ACCOUNTING FIRM
To the Board of Trustees of MFS Variable Insurance Trust and the Shareholders of
MFS Research Series:
We have audited the accompanying statement of assets and liabilities, including the portfolio of investments, of MFS Research Series (one of the series of MFS Variable Insurance Trust) (the “Fund”) as of December 31, 2015, and the related statement of operations for the year then ended, the statements of changes in net assets for each of the two years in the period then ended, and the financial highlights for each of the five years in the period then ended. These financial statements and financial highlights are the responsibility of the Fund’s management. Our responsibility is to express an opinion on these financial statements and financial highlights based on our audits.
We conducted our audits in accordance with the standards of the Public Company Accounting Oversight Board (United States). Those standards require that we plan and perform the audit to obtain reasonable assurance about whether the financial statements and financial highlights are free of material misstatement. The Fund is not required to have, nor were we engaged to perform, an audit of its internal control over financial reporting. Our audits included consideration of internal control over financial reporting as a basis for designing audit procedures that are appropriate in the circumstances, but not for the purpose of expressing an opinion on the effectiveness of the Fund’s internal control over financial reporting. Accordingly, we express no such opinion. An audit also includes examining, on a test basis, evidence supporting the amounts and disclosures in the financial statements, assessing the accounting principles used and significant estimates made by management, as well as evaluating the overall financial statement presentation. Our procedures included confirmation of securities owned as of December 31, 2015, by correspondence with the custodian and brokers; when replies were not received from brokers, we performed other auditing procedures. We believe that our audits provide a reasonable basis for our opinion.
In our opinion, such financial statements and financial highlights referred to above present fairly, in all material respects, the financial position of MFS Research Series as of December 31, 2015, the results of its operations for the year then ended, the changes in its net assets for each of the two years in the period then ended, and the financial highlights for each of the five years in the period then ended, in conformity with accounting principles generally accepted in the United States of America.
DELOITTE & TOUCHE LLP
Boston, Massachusetts
February 16, 2016
21
MFS Research Series
TRUSTEES AND OFFICERS – IDENTIFICATION AND BACKGROUND
The Trustees and Officers of the Trust, as of February 1, 2016, are listed below, together with their principal occupations during the past five years. (Their titles may have varied during that period.) The address of each Trustee and Officer is 111 Huntington Avenue, Boston, Massachusetts 02199-7618.
| | | | | | | | |
Name, Age | | Position(s)
Held with Fund | | Trustee/Officer
Since (h) | | Principal Occupations
During the Past Five Years | | Other Directorships (j) |
| INTERESTED TRUSTEES |
Robert J. Manning (k)
(age 52) | | Trustee | | February 2004 | | Massachusetts Financial Services Company, Chairman, Co-Chief Executive Officer and Director | | N/A |
| | | | |
Robin A. Stelmach (k) (age 54) | | Trustee and President | | January 2014 | | Massachusetts Financial Services Company, Executive Vice President and Chief Operating Officer | | N/A |
| | |
| INDEPENDENT TRUSTEES | | | | |
David H. Gunning
(age 73) | | Trustee and Chair of Trustees | | January 2004 | | Private investor | | Lincoln Electric Holdings, Inc., Director; Development Alternatives, Inc., Director/Non-Executive Chairman |
| | | | |
Steven E. Buller (age 64) | | Trustee | | February 2014 | | Chairman, Financial Accounting Standards Advisory Council; Standing Advisory Group, Public Company Accounting Oversight Board, Member (until 2014); BlackRock, Inc. (investment management), Managing Director (until 2014), BlackRock Finco UK (investment management), Director (until 2014) | | N/A |
| | | | |
Robert E. Butler
(age 74) | | Trustee | | January 2006 | | Consultant – investment company industry regulatory and compliance matters | | N/A |
| | | | |
Maureen R. Goldfarb (age 60) | | Trustee | | January 2009 | | Private investor | | N/A |
| | | | |
William R. Gutow
(age 74) | | Trustee | | December 1993 | | Private investor and real estate consultant; Capitol Entertainment Management Company (video franchise), Vice Chairman | | Texas Donuts, Vice Chairman (until 2010) |
| | | | |
Michael Hegarty
(age 71) | | Trustee | | December 2004 | | Private investor | | Rouse Properties Inc., Director; Capmark Financial Group Inc., Director |
| | | | |
John P. Kavanaugh (age 61) | | Trustee | | January 2009 | | Private investor | | N/A |
| | | | |
Maryanne L. Roepke (age 59) | | Trustee | | May 2014 | | American Century Investments (investment management), Senior Vice President and Chief Compliance Officer (until 2014) | | N/A |
| | | | |
Laurie J. Thomsen
(age 58) | | Trustee | | March 2005 | | Private investor | | The Travelers Companies, Director; Dycom Industries, Inc., Director |
| | | | |
Robert W. Uek
(age 74) | | Trustee | | January 2006 | | Consultant to investment company industry | | N/A |
| | | | |
| OFFICERS | | | | | | | | |
Christopher R. Bohane (k)
(age 42) | | Assistant Secretary and Assistant Clerk | | July 2005 | | Massachusetts Financial Services Company, Vice President and Assistant General Counsel | | N/A |
| | | | |
Kino Clark (k) (age 47) | | Assistant Treasurer | | January 2012 | | Massachusetts Financial Services Company, Vice President | | N/A |
| | | | |
Kristin V. Collins (k) (age 42) | | Assistant Secretary and Assistant Clerk | | September 2015 | | Massachusetts Financial Services Company, Vice President and Assistant General Counsel | | N/A |
| | | | |
Thomas H. Connors (k) (age 56) | | Assistant Secretary and Assistant Clerk | | September 2012 | | Massachusetts Financial Services Company, Vice President and Senior Counsel; Deutsche Investment Management Americas Inc. (financial service provider), Director and Senior Counsel (until 2012) | | N/A |
22
MFS Research Series
Trustees and Officers – continued
| | | | | | | | |
Name, Age | | Position(s)
Held with Fund | | Trustee/Officer
Since (h) | | Principal Occupations
During the Past Five Years | | Other Directorships (j) |
Ethan D. Corey (k)
(age 52) | | Assistant Secretary and Assistant Clerk | | July 2005 | | Massachusetts Financial Services Company, Senior Vice President and Associate General Counsel | | N/A |
| | | | |
David L. DiLorenzo (k)
(age 47) | | Treasurer | | July 2005 | | Massachusetts Financial Services Company, Senior Vice President | | N/A |
| | | | |
Brian E. Langenfeld (k) (age 42) | | Assistant Secretary and Assistant Clerk | | June 2006 | | Massachusetts Financial Services Company, Vice President and Senior Counsel | | N/A |
| | | | |
Kenneth Paek (k) (age 41) | | Assistant Treasurer | | February 2015 | | Massachusetts Financial Services Company, Vice President; Cohen & Steers, Vice President/Head of Fund Administration (until 2014) | | N/A |
| | | | |
Susan A. Pereira (k)
(age 45) | | Assistant Secretary and Assistant Clerk | | July 2005 | | Massachusetts Financial Services Company, Vice President and Senior Counsel | | N/A |
| | | | |
Kasey L. Phillips (k) (age 45) | | Assistant Treasurer | | September 2012 | | Massachusetts Financial Services Company, Vice President; Wells Fargo Funds Management, LLC, Senior Vice President, Fund Treasurer (until 2012) | | N/A |
| | | | |
Mark N. Polebaum (k)
(age 63) | | Secretary and Clerk | | January 2006 | | Massachusetts Financial Services Company, Executive Vice President, General Counsel and Secretary | | N/A |
| | | | |
Matthew A. Stowe (k) (age 41) | | Assistant Secretary and Assistant Clerk | | October 2014 | | Massachusetts Financial Services Company, Vice President and Assistant General Counsel | | N/A |
| | | | |
Frank L. Tarantino
(age 71) | | Independent Senior Officer | | June 2004 | | Tarantino LLC (provider of compliance services), Principal | | N/A |
| | | | |
Richard S. Weitzel (k)
(age 45) | | Assistant Secretary and Assistant Clerk | | October 2007 | | Massachusetts Financial Services Company, Senior Vice President and Associate General Counsel | | N/A |
| | | | |
Martin J. Wolin (k) (age 48) | | Chief Compliance Officer | | July 2015 | | Massachusetts Financial Services Company, Senior Vice President and Chief Compliance Officer (since July 2015); Mercer (financial service provider), Chief Risk and Compliance Officer, North America and Latin America (until June 2015) | | N/A |
| | | | |
James O. Yost (k)
(age 55) | | Deputy Treasurer | | September 1990 | | Massachusetts Financial Services Company, Senior Vice President | | N/A |
| (h) | Date first appointed to serve as Trustee/officer of an MFS Fund. Each Trustee has served continuously since appointment unless indicated otherwise. For the period from December 15, 2004 until February 22, 2005, Mr. Manning served as Advisory Trustee. Prior to January 2012, Messrs. DiLorenzo and Yost served as Assistant Treasurers of the Funds. Ms. Stelmach was appointed as President of the Funds as of October 1, 2014. |
| (j) | Directorships or trusteeships of companies required to report to the Securities and Exchange Commission (i.e., “public companies”). |
| (k) | “Interested person” of the Trust within the meaning of the Investment Company Act of 1940 (referred to as the 1940 Act), which is the principal federal law governing investment companies like the fund, as a result of a position with MFS. The address of MFS is 111 Huntington Avenue, Boston, Massachusetts 02199-7618. |
Each Trustee (except Ms. Stelmach, Mr. Buller and Ms. Roepke) has been elected by shareholders and each Trustee and officer holds office until his or her successor is chosen and qualified or until his or her earlier death, resignation, retirement or removal. The Trust does not hold annual meetings for the purpose of electing Trustees, and Trustees are not elected for fixed terms. Messrs. Buller, Butler, Kavanaugh, Uek and Ms. Roepke are members of the Trust’s Audit Committee.
Each of the Fund’s Trustees and officers holds comparable positions with certain other funds of which MFS or a subsidiary is the investment adviser or distributor, and, in the case of the officers, with certain affiliates of MFS. As of February 1, 2016, the Trustees served as board members of 137 funds within the MFS Family of Funds.
23
MFS Research Series
Trustees and Officers – continued
The Statement of Additional Information for a Fund includes further information about the Trustees and is available without charge upon request by calling 1-800-225-2606.
| | |
Investment Adviser Massachusetts Financial Services Company 111 Huntington Avenue Boston, MA 02199-7618 | | Custodian State Street Bank and Trust Company 1 Lincoln Street Boston, MA 02111-2900 |
Distributor MFS Fund Distributors, Inc. 111 Huntington Avenue Boston, MA 02199-7618 | | Independent Registered Public Accounting Firm Deloitte & Touche LLP 200 Berkeley Street Boston, MA 02116 |
Portfolio Manager Joseph MacDougall | | |
24
MFS Research Series
BOARD REVIEW OF INVESTMENT ADVISORY AGREEMENT
The Investment Company Act of 1940 requires that both the full Board of Trustees and a majority of the non-interested (“independent”) Trustees, voting separately, annually approve the continuation of the Fund’s investment advisory agreement with MFS. The Trustees consider matters bearing on the Fund and its advisory arrangements at their meetings throughout the year, including a review of performance data at each regular meeting. In addition, the independent Trustees met several times over the course of three months beginning in May and ending in July, 2015 (“contract review meetings”) for the specific purpose of considering whether to approve the continuation of the investment advisory agreement for the Fund and the other investment companies that the Board oversees (the “MFS Funds”). The independent Trustees were assisted in their evaluation of the Fund’s investment advisory agreement by independent legal counsel, from whom they received separate legal advice and with whom they met separately from MFS during various contract review meetings. The independent Trustees were also assisted in this process by the MFS Funds’ Independent Senior Officer, senior officer appointed by and reporting to the independent Trustees.
In connection with their deliberations regarding the continuation of the investment advisory agreement, the Trustees, including the independent Trustees, considered such information and factors as they believed, in light of the legal advice furnished to them and their own business judgment, to be relevant. The investment advisory agreement for the Fund was considered separately, although the Trustees also took into account the common interests of all MFS Funds in their review. As described below, the Trustees considered the nature, quality, and extent of the various investment advisory, administrative, and shareholder services performed by MFS under the existing investment advisory agreement and other arrangements with the Fund.
In connection with their contract review meetings, the Trustees received and relied upon materials that included, among other items: (i) information provided by Lipper Inc., an independent third party, on the investment performance of the Fund for various time periods ended December 31, 2014 and the investment performance of a group of funds with substantially similar investment classifications/objectives (the “Lipper performance universe”), (ii) information provided by Lipper Inc. on the Fund’s advisory fees and other expenses and the advisory fees and other expenses of comparable funds identified by Lipper Inc. (the “Lipper expense group”), (iii) information provided by MFS on the advisory fees of comparable portfolios of other clients of MFS, including institutional separate accounts and other clients, (iv) information as to whether and to what extent applicable expense waivers, reimbursements or fee “breakpoints” are observed for the Fund, (v) information regarding MFS’ financial results and financial condition, including MFS’ and certain of its affiliates’ estimated profitability from services performed for the Fund and the MFS Funds as a whole, and compared to MFS’ institutional business, (vi) MFS’ views regarding the outlook for the mutual fund industry and the strategic business plans of MFS, (vii) descriptions of various functions performed by MFS for the Funds, such as compliance monitoring and portfolio trading practices, and (viii) information regarding the overall organization of MFS, including information about MFS’ senior management and other personnel providing investment advisory, administrative and other services to the Fund and the other MFS Funds. The comparative performance, fee and expense information prepared and provided by Lipper Inc. was not independently verified and the independent Trustees did not independently verify any information provided to them by MFS.
The Trustees’ conclusion as to the continuation of the investment advisory agreement was based on a comprehensive consideration of all information provided to the Trustees and not the result of any single factor. Some of the factors that figured particularly in the Trustees’ deliberations are described below, although individual Trustees may have evaluated the information presented differently from one another, giving different weights to various factors. It is also important to recognize that the fee arrangements for the Fund and other MFS Funds are the result of years of review and discussion between the independent Trustees and MFS, that certain aspects of such arrangements may receive greater scrutiny in some years than in others, and that the Trustees’ conclusions may be based, in part, on their consideration of these same arrangements during the course of the year and in prior years.
Based on information provided by Lipper Inc. and MFS, the Trustees reviewed the Fund’s total return investment performance as well as the performance of peer groups of funds over various time periods. The Trustees placed particular emphasis on the total return performance of the Fund’s Initial Class shares in comparison to the performance of funds in its Lipper performance universe over the three-year period ended December 31, 2014, which the Trustees believed was a long enough period to reflect differing market conditions. The total return performance of the Fund’s Initial Class shares was in the 3rd quintile relative to the other funds in the universe for this three-year period (the 1st quintile being the best performers and the 5th quintile being the worst performers). The total return performance of the Fund’s Initial Class shares was in the 4th quintile for the one-year period and the 2nd quintile for the five-year period ended December 31, 2014 relative to the Lipper performance universe. Because of the passage of time, these performance results may differ from the performance results for more recent periods, including those shown elsewhere in this report.
In the course of their deliberations, the Trustees took into account information provided by MFS in connection with the contract review meetings, as well as during investment review meetings conducted with portfolio management personnel during the course of the year regarding the Fund’s performance. After reviewing these and related factors, the Trustees concluded, within the context of their overall conclusions regarding the investment advisory agreement, that they were satisfied with MFS’ responses and efforts relating to investment performance.
25
MFS Research Series
Board Review of Investment Advisory Agreement – continued
In assessing the reasonableness of the Fund’s advisory fee, the Trustees considered, among other information, the Fund’s advisory fee and the total expense ratio of the Fund’s Initial Class shares as a percentage of average daily net assets and the advisory fee and total expense ratios of peer groups of funds based on information provided by Lipper Inc. The Trustees considered that, according to the Lipper data (which takes into account any fee reductions or expense limitations that were in effect during the Fund’s last fiscal year), the Fund’s effective advisory fee rate and total expense ratio were each higher than the Lipper expense group median.
The Trustees also considered the advisory fees charged by MFS to any institutional separate accounts advised by MFS (“separate accounts”) and unaffiliated investment companies for which MFS serves as subadviser (“subadvised funds”) that have comparable investment strategies to the Fund. In comparing these fees, the Trustees considered information provided by MFS as to the generally broader scope of services provided by MFS to the Fund, as well as the more extensive regulatory burdens imposed on MFS in managing the Fund, in comparison to separate accounts and subadvised funds. The Trustees also considered the higher demands placed on MFS’ investment personnel and trading infrastructure as a result of the daily cash in-flows and out-flows of the Fund in comparison to separate accounts.
The Trustees also considered whether the Fund may benefit from any economies of scale in the management of the Fund in the event of growth in assets of the Fund and/or growth in assets of the MFS Funds as a whole. They noted that the Fund’s advisory fee rate schedule is subject to a contractual breakpoint that reduces the Fund’s advisory fee rate on average daily net assets over $1 billion. The Trustees also noted that MFS has agreed in writing to waive a portion of the management fees of certain MFS Funds, including the Fund, if the total combined assets of certain funds within the MFS Funds’ complex increase above agreed upon thresholds (the “group fee waiver”), enabling the Fund’s shareholders to share in the benefits from any economies of scale at the complex level. The group fee waiver is reviewed and renewed annually between the Board and MFS. The Trustees concluded that the breakpoint and the group fee waiver were sufficient to allow the Fund to benefit from economies of scale as its assets and overall complex assets grow.
The Trustees also considered information prepared by MFS relating to MFS’ costs and profits with respect to the Fund, the MFS Funds considered as a group, and other investment companies and accounts advised by MFS, as well as MFS’ methodologies used to determine and allocate its costs to the MFS Funds, the Fund and other accounts and products for purposes of estimating profitability.
After reviewing these and other factors described herein, the Trustees concluded, within the context of their overall conclusions regarding the investment advisory agreement, that the advisory fees charged to the Fund represent reasonable compensation in light of the services being provided by MFS to the Fund.
In addition, the Trustees considered MFS’ resources and related efforts to continue to retain, attract and motivate capable personnel to serve the Fund. The Trustees also considered current and developing conditions in the financial services industry, including the presence of large and well-capitalized companies which are spending, and appear to be prepared to continue to spend, substantial sums to engage personnel and to provide services to competing investment companies. In this regard, the Trustees also considered the financial resources of MFS and its ultimate parent, Sun Life Financial Inc. The Trustees also considered the advantages and possible disadvantages to the Fund of having an adviser that also serves other investment companies as well as other accounts.
The Trustees also considered the nature, quality, cost, and extent of administrative, transfer agency, and distribution services provided to the Fund by MFS and its affiliates under agreements and plans other than the investment advisory agreement, including any 12b-1 fees the Fund pays to MFS Fund Distributors, Inc., an affiliate of MFS. The Trustees also considered the nature, extent and quality of certain other services MFS performs or arranges for on the Fund’s behalf, which may include securities lending programs, directed expense payment programs, class action recovery programs, and MFS’ interaction with third-party service providers, principally custodians and sub-custodians. The Trustees concluded that the various non-advisory services provided by MFS and its affiliates on behalf of the Fund were satisfactory.
The Trustees also considered benefits to MFS from the use of the Fund’s portfolio brokerage commissions, if applicable, to pay for investment research and various other factors. Additionally, the Trustees considered so-called “fall-out benefits” to MFS such as reputational value derived from serving as investment manager to the Fund.
Based on their evaluation of factors that they deemed to be material, including those factors described above, the Board of Trustees, including the independent Trustees, concluded that the Fund’s investment advisory agreement with MFS should be continued for an additional one-year period, commencing August 1, 2015.
26
MFS Research Series
PROXY VOTING POLICIES AND INFORMATION
MFS votes proxies on behalf of the fund pursuant to proxy voting policies and procedures that are available without charge, upon request, by calling 1-800-225-2606, by visiting the Proxy Voting section of mfs.com or by visiting the SEC’s Web site at http://www.sec.gov.
Information regarding how the fund voted proxies relating to portfolio securities during the most recent twelve-month period ended June 30 is available without charge by visiting the Proxy Voting section of mfs.com or by visiting the SEC’s Web site at http://www.sec.gov.
QUARTERLY PORTFOLIO DISCLOSURE
The fund will file a complete schedule of portfolio holdings with the Securities and Exchange Commission (the Commission) for the first and third quarters of each fiscal year on Form N-Q. The fund’s Form N-Q is available on the EDGAR database on the Commission’s Internet Web site at http://www.sec.gov, and may be reviewed and copied at the:
Public Reference Room
Securities and Exchange Commission
100 F Street, NE, Room 1580
Washington, D.C. 20549
Information on the operation of the Public Reference Room may be obtained by calling the Commission at 1-800-SEC-0330. Copies of the fund’s Form N-Q also may be obtained, upon payment of a duplicating fee, by electronic request at the following e-mail address: publicinfo@sec.gov or by writing the Public Reference Section at the above address.
FURTHER INFORMATION
From time to time, MFS may post important information about the fund or the MFS funds on the MFS web site (mfs.com). This information is available by visiting the “Market Commentary” and “Announcements” sub sections in the “Market Outlooks” section of mfs.com or by clicking on the fund’s name under “Variable Insurance Portfolios — VIT” in the “Products” section of mfs.com.
FEDERAL TAX INFORMATION (unaudited)
The following information is provided pursuant to provisions of the Internal Revenue Code.
The fund designates $49,574,000 as capital gain dividends paid during the fiscal year.
For corporate shareholders, 96.64% of the ordinary income dividends paid during the fiscal year qualify for the corporate dividends received deduction.
27
rev. 3/11
| | | | |
| FACTS | | WHAT DOES MFS DO WITH YOUR
PERSONAL INFORMATION? | |  |
| | |
| Why? | | Financial companies choose how they share your personal information. Federal law gives consumers the right to limit some but not all sharing. Federal law also requires us to tell you how we collect, share, and protect your personal information. Please read this notice carefully to understand what we do. |
| | |
| What? | | The types of personal information we collect and share depend on the product or service you have with us. This information can include: • Social Security number and account balances • Account transactions and transaction history • Checking account information and wire transfer instructions When you are no longer our customer, we continue to share your information as described in this notice. |
| | |
| How? | | All financial companies need to share customers’ personal information to run their everyday business. In the section below, we list the reasons financial companies can share their customers’ personal information; the reasons MFS chooses to share; and whether you can limit this sharing. |
| | | | |
Reasons we can share your
personal information | | Does MFS share? | | Can you limit this
sharing? |
For our everyday business purposes – such as to process your transactions, maintain your account(s), respond to court orders and legal investigations, or report to credit bureaus | | Yes | | No |
For our marketing purposes – to offer our products and services to you | | No | | We don’t share |
| For joint marketing with other financial companies | | No | | We don’t share |
For our affiliates’ everyday business purposes – information about your transactions and experiences | | No | | We don’t share |
For our affiliates’ everyday business purposes – information about your creditworthiness | | No | | We don’t share |
| For nonaffiliates to market to you | | No | | We don’t share |
| | |
| Questions? | | Call 800-225-2606 or go to mfs.com. |
28
| | |
| Who we are |
| Who is providing this notice? | | MFS Funds, MFS Investment Management, MFS Institutional Advisors, Inc., MFS Fund Distributors, Inc., MFS Heritage Trust Company, and MFS Service Center, Inc. |
| | |
| What we do |
| How does MFS protect my personal information? | | To protect your personal information from unauthorized access and use, we use security measures that comply with federal law. These measures include procedural, electronic, and physical safeguards for the protection of the personal information we collect about you. |
How does MFS
collect my personal information? | | We collect your personal information, for example, when you • open an account or provide account information • direct us to buy securities or direct us to sell your securities • make a wire transfer We also collect your personal information from others, such as credit bureaus, affiliates and other companies. |
| Why can’t I limit all sharing? | | Federal law gives you the right to limit only • sharing for affiliates’ everyday business purposes – information about your creditworthiness • affiliates from using your information to market to you • sharing for nonaffiliates to market to you State laws and individual companies may give you additional rights to limit sharing. |
| | |
| Definitions |
| Affiliates | | Companies related by common ownership or control. They can be financial and nonfinancial companies. • MFS does not share personal information with affiliates, except for everyday business purposes as described on page one of this notice. |
| Nonaffiliates | | Companies not related by common ownership or control. They can be financial and nonfinancial companies. • MFS does not share with nonaffiliates so they can market to you. |
| Joint Marketing | | A formal agreement between nonaffiliated financial companies that together market financial products or services to you. • MFS doesn’t jointly market. |
| | |
| Other important information |
| If you own an MFS product or receive an MFS service in the name of a third party such as a bank or broker-dealer, their privacy policy may apply to you instead of ours. |
29
ANNUAL REPORT
December 31, 2015

MFS® TOTAL RETURN SERIES
MFS® Variable Insurance Trust

VTR-ANN
MFS® TOTAL RETURN SERIES
CONTENTS
The report is prepared for the general information of contract owners. It is authorized for distribution to prospective investors only when preceded or accompanied by a current prospectus.
NOT FDIC INSURED • MAY LOSE VALUE • NO BANK OR CREDIT UNION GUARANTEE • NOT A DEPOSIT • NOT INSURED BY ANY FEDERAL GOVERNMENT AGENCY OR NCUA/NCUSIF
MFS Total Return Series
LETTER FROM THE CHAIRMAN

Dear Contract Owners:
Central bank policies remain center stage as the U.S. Federal Reserve made good on its pledge to raise policy rates for the first time in over nine years at its December meeting. The Fed’s actions stand in stark contrast to those of the European Central Bank and Bank of Japan, which modestly extended their quantitative easing programs in December.
In the United States, auto sales remain a source of economic strength, but housing demand has slowed of late. The U.S. economic expansion remains moderate but uneven, with a strong dollar crimping demand for U.S. goods abroad. China’s shift to a consumer-led economy continues to weigh on its manufacturing and exports, as does weak global demand. Slackening demand from China continues to undermine commodity markets, with oil particularly impacted amid a global supply glut.
As markets have become more focused on short-term trends in recent years, we believe it’s important for investors to lengthen their investment time horizon. At MFS®, we don’t trade on headlines or trends; we invest for the long term.
We believe that this approach, coupled with the professional guidance of a financial advisor, will help you reach your investment goals.
Respectfully,

Robert J. Manning
Chairman
MFS Investment Management
February 16, 2016
The opinions expressed in this letter are subject to change and may not be relied upon for investment advice. No forecasts can be guaranteed.
1
MFS Total Return Series
PORTFOLIO COMPOSITION
Portfolio structure (i)

| | | | |
| Top ten holdings (i) | | | | |
| JPMorgan Chase & Co. | | | 2.5% | |
| Wells Fargo & Co. | | | 1.7% | |
| Philip Morris International, Inc. | | | 1.6% | |
| U.S. Treasury Bonds, 4.5%, 8/15/39 | | | 1.5% | |
| U.S. Treasury Notes, 1%, 6/30/19 | | | 1.5% | |
| Fannie Mae, 4%, 30 Years | | | 1.5% | |
| U.S. Treasury Notes, 3.125%, 5/15/19 | | | 1.4% | |
| U.S. Treasury Bonds, 2.875%, 5/15/43 | | | 1.3% | |
| Freddie Mac, 4%, 30 Years | | | 1.2% | |
| U.S. Treasury Notes, 2.5%, 8/15/23 | | | 1.2% | |
|
| Composition including fixed income credit quality (a)(i) | |
| AAA | | | 2.3% | |
| AA | | | 0.9% | |
| A | | | 4.0% | |
| BBB | | | 7.6% | |
| BB | | | 0.2% | |
| B | | | 0.1% | |
| CCC (o) | | | 0.0% | |
| C | | | 0.1% | |
| U.S. Government | | | 12.4% | |
| Federal Agencies | | | 12.4% | |
| Not Rated (o) | | | 0.0% | |
| Non-Fixed Income | | | 58.9% | |
| Cash & Cash Equivalents | | | 1.1% | |
| | | | |
| Equity sectors | | | | |
| Financial Services | | | 14.2% | |
| Health Care | | | 8.1% | |
| Consumer Staples | | | 5.9% | |
| Industrial Goods & Services | | | 5.7% | |
| Technology | | | 4.5% | |
| Energy | | | 3.5% | |
| Utilities & Communications | | | 3.5% | |
| Leisure | | | 3.4% | |
| Retailing | | | 3.1% | |
| Basic Materials | | | 3.1% | |
| Autos & Housing | | | 2.1% | |
| Special Products & Services | | | 1.1% | |
| Transportation | | | 0.7% | |
| |
| Fixed income sectors (i) | | | | |
| U.S. Treasury Securities | | | 12.4% | |
| Mortgage-Backed Securities | | | 12.2% | |
| Investment Grade Corporates | | | 11.0% | |
| Commercial Mortgage-Backed Securities | | | 1.8% | |
| Emerging Markets Bonds | | | 1.0% | |
| Non-U.S. Government Bonds | | | 0.6% | |
| Collateralized Debt Obligations | | | 0.3% | |
| Asset-Backed Securities | | | 0.3% | |
| U.S. Government Agencies | | | 0.2% | |
| High Yield Corporates | | | 0.2% | |
| Residential Mortgage-Backed Securities (o) | | | 0.0% | |
| (a) | For all securities other than those specifically described below, ratings are assigned to underlying securities utilizing ratings from Moody’s, Fitch, and Standard & Poor’s rating agencies and applying the following hierarchy: If all three agencies provide a rating, the middle rating (after dropping the highest and lowest ratings) is assigned; if two of the three agencies rate a security, the lower of the two is assigned. Ratings are shown in the S&P and Fitch scale (e.g., AAA). Securities rated BBB or higher are considered investment grade. All ratings are subject to change. U.S. Government includes securities issued by the U.S. Department of the Treasury. Federal Agencies includes rated and unrated U.S. Agency fixed-income securities, U.S. Agency mortgage-backed securities, and collateralized mortgage obligations of U.S. Agency mortgage-backed securities. Not Rated includes fixed income securities, including fixed income futures contracts, which have not been rated by any rating agency. Non-Fixed Income includes any equity securities (including convertible bonds and equity derivatives) and/or commodity-linked derivatives. The fund may not hold all of these instruments. The fund is not rated by these agencies. |
| (i) | For purposes of this presentation, the components include the value of securities, and reflect the impact of the equivalent exposure of derivative positions, if any. These amounts may be negative from time to time. Equivalent exposure is a calculated amount that translates the derivative position into a reasonable approximation of the amount of the underlying asset that the portfolio would have to hold at a given point in time to have the same price sensitivity that results from the portfolio’s ownership of the derivative contract. When dealing with derivatives, equivalent exposure is a more representative measure of the potential impact of a position on portfolio performance than value. The bond component will include any accrued interest amounts. |
2
MFS Total Return Series
Portfolio Composition – continued
Where the fund holds convertible bonds, these are treated as part of the equity portion of the portfolio.
Cash & Cash Equivalents includes any cash, investments in money market funds, short-term securities, and other assets less liabilities. Please see the Statement of Assets and Liabilities for additional information related to the fund’s cash position and other assets and liabilities.
Percentages are based on net assets as of 12/31/15.
The portfolio is actively managed and current holdings may be different.
3
MFS Total Return Series
MANAGEMENT REVIEW
Summary of Results
For the twelve months ended December 31, 2015, Initial Class shares of the MFS Total Return Series (“fund”) provided a total return of –0.37%, while Service Class shares of the fund provided a total return of –0.58%. These compare with returns of 1.38% and 0.55% over the same period for the fund’s benchmarks, the Standard & Poor’s 500 Stock Index (“S&P 500 Index”) and the Barclays U.S. Aggregate Bond Index (“Barclays Index”), respectively. The fund’s other benchmark, the MFS Total Return Blended Index (“Blended Index”), generated a return of 1.28%. The Blended Index reflects the blended returns of the equity and fixed income market indices, with percentage allocations to each index designed to resemble the equity and fixed income allocations of the fund. The market indices and related percentage allocations used to compile the Blended Index are set forth in the Performance Summary.
Market Environment
Sluggish global growth weighed on both developed and emerging market (“EM”) economies during the reporting period. EM economies have been particularly lackluster. While the US Federal Reserve began its anticipated monetary policy tightening cycle at the end of the period, other large developed economies continued to embrace accommodative monetary policies, particularly the European Central Bank and the Bank of Japan. Focus remained on China after policy missteps by the Chinese government roiled global markets over the summer, beginning with the uncoordinated response to the stock market’s boom and bust and then the confusing decision to devalue the renminbi in August. China subsequently ramped up a wide range of monetary and fiscal measures to stimulate the economy and bolster sentiment. Its economy appeared to stabilize late in the period. Also at the end of the period, the Chinese renminbi was granted reserve currency status by the International Monetary Fund (“IMF”), which announced its inclusion in the IMF’s Special Drawing Rights currency basket effective October 1, 2016.
During the second half of the reporting period, the US faced an earnings recession caused primarily by the sharp decline in the prices of oil and other commodities. Earnings contractions were concentrated primarily in the energy, materials and industrial sectors. An additional headwind for earnings was the sharp rise in the US dollar over the period. Exports were crimped by the dollar’s strength and falling demand in emerging markets. Consumer spending held up well during the second half of the period amid a modest increase in real wages and a tailwind from falling gasoline prices. Demand for autos reached near-record territory late in the period. In emerging markets, two key factors weighed on economies and asset prices: 1) weaker Chinese growth, which drove the decline in commodity prices and 2) prospects for higher US interest rates. Structural factors like floating exchange rates and fiscal buffers partially offset these cyclical headwinds.
Detractors from Performance
Within the equity segment of the fund, weak stock selection in the retailing sector was a primary detractor from performance relative to the S&P 500 Index. An underweight position in internet retailer Amazon.com detracted from relative results. Shares of Amazon.com appreciated after the company reported strong quarterly results, driven by improved growth in its core retail segment and remote computing segment (Amazon Web Services). Not owning shares of home improvement and home hardware retailer Home Depot and an overweight position in discount department store Kohl’s also dampened relative performance.
Stock selection and an underweight position in the technology sector was another area of relative weakness. The fund’s underweight position in internet search giant Alphabet (formerly Google) dampened relative performance. Strength in mobile search and video ads on YouTube were notable contributors to Alphabet’s above-consensus results. Management also announced that it had authorized a stock buyback program which further supported the stock. Underweight positions in software giant Microsoft and social networking service provider Facebook also weighed on relative performance.
Elsewhere, not owning diversified industrial conglomerate General Electric hampered relative performance. Shares appreciated early in the period following news that activist investor Trian had made an investment in the industrial conglomerate. Its share price was also bolstered by solid earnings results and progress on a number of items to further simplify its business. Shares of insurance company Delta Lloyd (b)(h) (Netherlands) and non-urban hospital operator Community Health Systems (b) also hurt relative results. The fund’s overweight position in investment management firm Franklin Resources further weakened relative performance.
Within the fixed income segment of the fund, a greater exposure to corporate bonds, most notably in the “BBB” rated (r) credit quality segment, detracted from performance relative to the Barclays Index.
Contributors to Performance
Within the equity segment of the fund, strong stock selection and an overweight position in the consumer staples sector was a positive factor for relative performance. Most notably, the fund’s overweight position in tobacco producer Phillip Morris International aided relative results. Strong results in the face of FX headwinds that were driven by robust global pricing trends and moderating volume declines benefited shares of Philip Morris International. Management raised its guidance for 2016 which further supported results.
4
MFS Total Return Series
Management Review – continued
Stock selection and an underweight position in the poor-performing energy sector also boosted relative performance. The fund’s overweight position in independent oil refiner Valero Energy contributed to relative results. Share of Valero rose on strong earnings that were driven by higher-than-estimated refining gross margins, which benefitted from a 96% utilization rate and low natural gas costs. Valero also reported a 25% increase to its quarterly dividend.
In other sectors, not owning shares of natural gas pipelines operator Kinder Morgan, wireless communications software company QUALCOMM, retail giant Wal-Mart and insurance and investment firm Berkshire Hathaway benefited relative performance. Shares of Kinder Morgan depreciated significantly after challenging business trends forced the company to cut its annual dividend by 75% during the period to preserve cash. The fund’s overweight positions in global financial services firm JPMorgan Chase, management consulting firm Accenture, global security company Northrop Grumman and broadband communications and networking services provider Broadcom also bolstered relative returns.
Within the fixed income portion of the fund, bond selection in financial issues was a primary contributor to relative performance. A greater relative exposure to shifts in the long end (centered around maturities of 10 or more years) of the yield curve (y) also aided relative results.
The return derived from yield, which was greater than that of the Barclays Index, further contributed to relative performance.
Respectfully,
| | | | | | |
| Nevin Chitkara | | William Douglas | | Steven Gorham | | Richard Hawkins |
| Portfolio Manager | | Portfolio Manager | | Portfolio Manager | | Portfolio Manager |
| | | |
| Joshua Marston | | Jonathan Sage | | Brooks Taylor | | |
| Portfolio Manager | | Portfolio Manager | | Portfolio Manager | | |
| (b) | Security is not a benchmark constituent. |
| (h) | Security was not held in the portfolio at period end. |
| (r) | Bonds rated “BBB”, “Baa”, or higher are considered investment grade; bonds rated “BB”, “Ba”, or below are considered non-investment grade. The source for bond quality ratings is Moody’s Investors Service, Standard & Poor’s and Fitch, Inc. and are applied using the following hierarchy: If all three agencies provide a rating, the middle rating (after dropping the highest and lowest ratings) is assigned; if two of the three agencies rate a security, the lower of the two is assigned. Ratings are shown in the S&P and Fitch scale (e.g., AAA). For securities which are not rated by any of the three agencies, the security is considered Not Rated. |
| (y) | A yield curve graphically depicts the yields of different maturity bonds of the same credit quality and type; a normal yield curve is upward sloping, with short-term rates lower than long-term rates. |
The views expressed in this report are those of the portfolio managers only through the end of the period of the report as stated on the cover and do not necessarily reflect the views of MFS or any other person in the MFS organization. These views are subject to change at any time based on market or other conditions, and MFS disclaims any responsibility to update such views. These views may not be relied upon as investment advice or an indication of trading intent on behalf of any MFS portfolio. References to specific securities are not recommendations of such securities, and may not be representative of any MFS portfolio’s current or future investments.
5
MFS Total Return Series
PERFORMANCE SUMMARY THROUGH 12/31/15
The following chart illustrates the historical performance of the fund in comparison to its benchmark(s). Benchmarks are unmanaged and may not be invested in directly. Benchmark returns do not reflect any fees or expenses. The performance of other share classes will be greater than or less than that of the class depicted below. (See Notes to Performance Summary.)
Performance data shown represents past performance and is no guarantee of future results. Investment return and principal value fluctuate so your units, when sold, may be worth more or less than the original cost; current performance may be lower or higher than quoted. The performance shown does not reflect the deduction of taxes, if any, that a contract holder would pay on fund distributions or the redemption of contract units. The returns for the fund shown also do not reflect the deduction of expenses associated with variable products, such as mortality and expense risk charges, separate account charges, and sales charges imposed by the insurance company separate accounts. Such expenses would reduce the overall returns shown.
Growth of a Hypothetical $10,000 Investment

Total Returns through 12/31/15
Average annual total returns
| | | | | | | | | | | | |
| | | Share Class | | Class Inception Date | | 1-yr | | 5-yr | | 10-yr | | |
| | | Initial Class | | 1/03/95 | | (0.37)% | | 7.82% | | 5.55% | | |
| | | Service Class | | 5/01/00 | | (0.58)% | | 7.56% | | 5.29% | | |
| | | | |
| Comparative benchmarks | | | | | | | | |
| | | Standard & Poor’s 500 Stock Index (f) | | 1.38% | | 12.57% | | 7.31% | | |
| | | Barclays U.S. Aggregate Bond Index (f) | | 0.55% | | 3.25% | | 4.51% | | |
| | | MFS Total Return Blended Index (f)(w) | | 1.28% | | 8.95% | | 6.48% | | |
| (f) | | Source: FactSet Research Systems Inc. |
| (w) | | As of December 31, 2015, the MFS Total Return Blended Index was comprised of 60% Standard & Poor’s 500 Stock Index and 40% Barclays U.S. Aggregate Bond Index. |
Benchmark Definitions
Barclays U.S. Aggregate Bond Index – a market capitalization-weighted index that measures the performance of the U.S. investment-grade, fixed rate bond market, with index components for government and corporate securities, mortgage pass-through securities, and asset-backed securities with at least one year to final maturity.
Standard & Poor’s 500 Stock Index – a market capitalization-weighted index of 500 widely held equity securities, designed to measure broad U.S. equity performance.
It is not possible to invest directly in an index.
Notes to Performance Summary
Average annual total return represents the average annual change in value for each share class for the periods presented.
Performance results reflect any applicable expense subsidies and waivers in effect during the periods shown. Without such subsidies and waivers the fund’s performance results would be less favorable. Please see the prospectus and financial statements for complete details. All results are historical and assume the reinvestment of any dividends and capital gains distributions.
6
MFS Total Return Series
Performance Summary – continued
Performance results do not include adjustments made for financial reporting purposes in accordance with U.S. generally accepted accounting principles and may differ from amounts reported in the financial highlights.
From time to time the fund may receive proceeds from litigation settlements, without which performance would be lower.
7
MFS Total Return Series
EXPENSE TABLE
Fund Expenses Borne by the Contract Holders During the Period,
July 1, 2015 through December 31, 2015
As a contract holder of the fund, you incur ongoing costs, including management fees; distribution and/or service (12b-1) fees; and other fund expenses. This example is intended to help you understand your ongoing costs (in dollars) of investing in the fund and to compare these costs with the ongoing costs of investing in other mutual funds.
The example is based on an investment of $1,000 invested at the beginning of the period and held for the entire period July 1, 2015 through December 31, 2015.
Actual Expenses
The first line for each share class in the following table provides information about actual account values and actual expenses. You may use the information in this line, together with the amount you invested, to estimate the expenses that you paid over the period. Simply divide your account value by $1,000 (for example, an $8,600 account value divided by $1,000 = 8.6), then multiply the result by the number in the first line under the heading entitled “Expenses Paid During Period” to estimate the expenses you paid on your account during this period.
Hypothetical Example for Comparison Purposes
The second line for each share class in the following table provides information about hypothetical account values and hypothetical expenses based on the fund’s actual expense ratio and an assumed rate of return of 5% per year before expenses, which is not the fund’s actual return. The hypothetical account values and expenses may not be used to estimate the actual ending account balance or expenses you paid for the period. You may use this information to compare the ongoing costs of investing in the fund and other funds. To do so, compare this 5% hypothetical example with the 5% hypothetical examples that appear in the shareholder reports of the other funds.
Please note that the expenses shown in the table are meant to highlight the fund’s ongoing costs only and do not take into account the fees and expenses imposed under the variable contracts through which your investment in the fund is made. Therefore, the second line for each share class in the table is useful in comparing ongoing costs associated with an investment in vehicles (such as the fund) which fund benefits under variable annuity and variable life insurance contracts and to qualified pension and retirement plans only, and will not help you determine the relative total costs of investing in the fund through variable annuity and variable life insurance contracts. If the fees and expenses imposed under the variable contracts were included, your costs would have been higher.
| | | | | | | | | | | | | | | | | | |
| Share Class | | | | Annualized
Expense Ratio | | | Beginning
Account Value
7/01/15 | | | Ending Account Value
12/31/15 | | | Expenses Paid
During Period (p)
7/01/15-12/31/15 | |
| Initial Class | | Actual | | | 0.65% | | | | $1,000.00 | | | | $984.95 | | | | $3.25 | |
| | Hypothetical (h) | | | 0.65% | | | | $1,000.00 | | | | $1,021.93 | | | | $3.31 | |
| Service Class | | Actual | | | 0.90% | | | | $1,000.00 | | | | $983.94 | | | | $4.50 | |
| | Hypothetical (h) | | | 0.90% | | | | $1,000.00 | | | | $1,020.67 | | | | $4.58 | |
| (h) | 5% class return per year before expenses. |
| (p) | “Expenses Paid During Period” are equal to each class’s annualized expense ratio, as shown above, multiplied by the average account value over the period, multiplied by 184/365 (to reflect the one-half year period). |
8
MFS Total Return Series
PORTFOLIO OF INVESTMENTS – 12/31/15
The Portfolio of Investments is a complete list of all securities owned by your fund. It is categorized by broad-based asset classes.
| | | | | | | | |
| Issuer | | Shares/Par | | | Value ($) | |
| COMMON STOCKS – 58.2% | | | | | |
| Aerospace – 2.7% | | | | | |
| General Dynamics Corp. | | | 16,245 | | | $ | 2,231,404 | |
| Honeywell International, Inc. | | | 197,713 | | | | 20,477,135 | |
| Lockheed Martin Corp. | | | 68,876 | | | | 14,956,423 | |
| Northrop Grumman Corp. | | | 87,551 | | | | 16,530,504 | |
| United Technologies Corp. | | | 196,957 | | | | 18,921,659 | |
| | | | | | | | |
| | | | | | $ | 73,117,125 | |
| | | | | | | | |
| Alcoholic Beverages – 0.4% | | | | | |
| Diageo PLC | | | 376,967 | | | $ | 10,280,074 | |
| | | | | | | | |
| Automotive – 1.6% | | | | | |
| Delphi Automotive PLC | | | 93,873 | �� | | $ | 8,047,732 | |
| General Motors Co. | | | 70,965 | | | | 2,413,520 | |
| Harley-Davidson, Inc. | | | 50,349 | | | | 2,285,341 | |
| Hyundai Motor Co. Ltd. | | | 27,582 | | | | 3,475,481 | |
| Johnson Controls, Inc. | | | 230,227 | | | | 9,091,664 | |
| Kia Motors Corp. | | | 135,742 | | | | 6,046,747 | |
| LKQ Corp. (a) | | | 108,617 | | | | 3,218,322 | |
| Magna International, Inc. | | | 146,278 | | | | 5,932,732 | |
| | | | | | | | |
| | | | | | $ | 40,511,539 | |
| | | | | | | | |
| Broadcasting – 1.2% | | | | | |
| Omnicom Group, Inc. | | | 141,125 | | | $ | 10,677,518 | |
| Time Warner, Inc. | | | 158,870 | | | | 10,274,123 | |
| Twenty-First Century Fox, Inc. | | | 116,979 | | | | 3,177,150 | |
| Viacom, Inc., “B” | | | 47,712 | | | | 1,963,826 | |
| Walt Disney Co. | | | 37,527 | | | | 3,943,337 | |
| | | | | | | | |
| | | | | | $ | 30,035,954 | |
| | | | | | | | |
| Brokerage & Asset Managers – 0.9% | | | | | |
| BlackRock, Inc. | | | 26,506 | | | $ | 9,025,823 | |
| Blackstone Group LP | | | 71,108 | | | | 2,079,198 | |
| Franklin Resources, Inc. | | | 206,444 | | | | 7,601,268 | |
| NASDAQ, Inc. | | | 81,810 | | | | 4,758,888 | |
| | | | | | | | |
| | | | | | $ | 23,465,177 | |
| | | | | | | | |
| Business Services – 1.1% | | | | | |
| Accenture PLC, “A” | | | 206,402 | | | $ | 21,569,009 | |
| Equifax, Inc. | | | 10,135 | | | | 1,128,735 | |
| Fidelity National Information Services, Inc. | | | 68,676 | | | | 4,161,766 | |
| Fiserv, Inc. (a) | | | 27,512 | | | | 2,516,248 | |
| | | | | | | | |
| | | | | | $ | 29,375,758 | |
| | | | | | | | |
| Cable TV – 1.4% | | | | | |
| Comcast Corp., “A” | | | 444,374 | | | $ | 25,076,025 | |
| Time Warner Cable, Inc. | | | 62,073 | | | | 11,520,128 | |
| | | | | | | | |
| | | | | | $ | 36,596,153 | |
| | | | | | | | |
| Chemicals – 2.3% | | | | | |
| 3M Co. | | | 115,932 | | | $ | 17,463,996 | |
| Celanese Corp. | | | 53,710 | | | | 3,616,294 | |
| E.I. du Pont de Nemours & Co. | | | 102,806 | | | | 6,846,880 | |
| LyondellBasell Industries N.V., “A” | | | 141,818 | | | | 12,323,984 | |
| Monsanto Co. | | | 21,015 | | | | 2,070,398 | |
| | | | | | | | |
| Issuer | | Shares/Par | | | Value ($) | |
| COMMON STOCKS – continued | | | | | |
| Chemicals – continued | | | | | |
| PPG Industries, Inc. | | | 190,066 | | | $ | 18,782,322 | |
| | | | | | | | |
| | | | | | $ | 61,103,874 | |
| | | | | | | | |
| Computer Software – 1.0% | | | | | |
| Aspen Technology, Inc. (a) | | | 56,172 | | | $ | 2,121,055 | |
| CA, Inc. | | | 103,778 | | | | 2,963,900 | |
| Microsoft Corp. | | | 181,112 | | | | 10,048,094 | |
| Oracle Corp. | | | 238,849 | | | | 8,725,154 | |
| Symantec Corp. | | | 165,465 | | | | 3,474,765 | |
| | | | | | | | |
| | | | | | $ | 27,332,968 | |
| | | | | | | | |
| Computer Software – Systems – 1.3% | | | | | |
| Apple, Inc. | | | 56,120 | | | $ | 5,907,191 | |
| EMC Corp. | | | 95,285 | | | | 2,446,919 | |
| Hewlett Packard Enterprise | | | 137,413 | | | | 2,088,678 | |
| Ingram Micro, Inc., “A” | | | 122,574 | | | | 3,723,798 | |
| International Business Machines Corp. | | | 86,843 | | | | 11,951,334 | |
| Sabre Corp. | | | 155,003 | | | | 4,335,434 | |
| Seagate Technology PLC | | | 63,224 | | | | 2,317,792 | |
| | | | | | | | |
| | | | | | $ | 32,771,146 | |
| | | | | | | | |
| Construction – 0.5% | | | | | |
| Owens Corning | | | 179,510 | | | $ | 8,442,355 | |
| Stanley Black & Decker, Inc. | | | 49,007 | | | | 5,230,517 | |
| | | | | | | | |
| | | | | | $ | 13,672,872 | |
| | | | | | | | |
| Consumer Products – 0.4% | | | | | |
| Kimberly-Clark Corp. | | | 32,343 | | | $ | 4,117,264 | |
| Newell Rubbermaid, Inc. | | | 27,771 | | | | 1,224,146 | |
| Procter & Gamble Co. | | | 31,539 | | | | 2,504,512 | |
| Reckitt Benckiser Group PLC | | | 34,816 | | | | 3,204,776 | |
| | | | | | | | |
| | | | | | $ | 11,050,698 | |
| | | | | | | | |
| Containers – 0.1% | | | | | |
| Crown Holdings, Inc. (a) | | | 51,376 | | | $ | 2,604,763 | |
| | | | | | | | |
| Electrical Equipment – 1.5% | | | | | |
| Danaher Corp. | | | 290,902 | | | $ | 27,018,978 | |
| Pentair PLC | | | 81,473 | | | | 4,035,358 | |
| Tyco International PLC | | | 284,851 | | | | 9,083,898 | |
| | | | | | | | |
| | | | | | $ | 40,138,234 | |
| | | | | | | | |
| Electronics – 1.4% | | | | | |
| Analog Devices, Inc. | | | 19,118 | | | $ | 1,057,608 | |
| Broadcom Corp., “A” | | | 114,171 | | | | 6,601,367 | |
| Intel Corp. | | | 99,355 | | | | 3,422,780 | |
| Maxim Integrated Products, Inc. | | | 63,752 | | | | 2,422,576 | |
| Microchip Technology, Inc. | | | 95,602 | | | | 4,449,317 | |
| Taiwan Semiconductor Manufacturing Co. Ltd., ADR | | | 307,425 | | | | 6,993,919 | |
| Texas Instruments, Inc. | | | 189,188 | | | | 10,369,394 | |
| | | | | | | | |
| | | | | | $ | 35,316,961 | |
| | | | | | | | |
9
MFS Total Return Series
Portfolio of Investments – continued
| | | | | | | | |
| Issuer | | Shares/Par | | | Value ($) | |
| COMMON STOCKS – continued | | | | | |
| Energy – Independent – 1.8% | | | | | |
| Anadarko Petroleum Corp. | | | 85,282 | | | $ | 4,143,000 | |
| Canadian Natural Resources Ltd. | | | 66,102 | | | | 1,443,007 | |
| Crescent Point Energy Corp. (l) | | | 135,812 | | | | 1,582,199 | |
| EOG Resources, Inc. | | | 111,192 | | | | 7,871,282 | |
| EQT Corp. | | | 49,567 | | | | 2,583,928 | |
| Marathon Petroleum Corp. | | | 72,940 | | | | 3,781,210 | |
| Noble Energy, Inc. | | | 112,936 | | | | 3,718,982 | |
| Occidental Petroleum Corp. | | | 106,567 | | | | 7,204,995 | |
| Valero Energy Corp. | | | 196,329 | | | | 13,882,424 | |
| | | | | | | | |
| | | | | | $ | 46,211,027 | |
| | | | | | | | |
| Energy – Integrated – 1.3% | | | | | |
| Chevron Corp. | | | 152,438 | | | $ | 13,713,322 | |
| Exxon Mobil Corp. | | | 202,933 | | | | 15,818,627 | |
| Royal Dutch Shell PLC, “A” | | | 224,735 | | | | 5,049,011 | |
| | | | | | | | |
| | | | | | $ | 34,580,960 | |
| | | | | | | | |
| Food & Beverages – 2.3% | | | | | |
| Archer Daniels Midland Co. | | | 161,686 | | | $ | 5,930,642 | |
| Coca-Cola Co. | | | 75,447 | | | | 3,241,203 | |
| Danone S.A. | | | 97,845 | | | | 6,603,302 | |
| General Mills, Inc. | | | 289,127 | | | | 16,671,063 | |
| Ingredion, Inc. | | | 29,019 | | | | 2,781,181 | |
| Kellogg Co. | | | 62,324 | | | | 4,504,155 | |
| McCormick & Co., Inc. | | | 42,817 | | | | 3,663,423 | |
| Mondelez International, Inc. | | | 83,155 | | | | 3,728,670 | |
| Nestle S.A. | | | 173,871 | | | | 12,887,955 | |
| | | | | | | | |
| | | | | | $ | 60,011,594 | |
| | | | | | | | |
| Food & Drug Stores – 1.3% | | | | | |
| CVS Health Corp. | | | 296,541 | | | $ | 28,992,814 | |
| Kroger Co. | | | 93,142 | | | | 3,896,130 | |
| | | | | | | | |
| | | | | | $ | 32,888,944 | |
| | | | | | | | |
| Gaming & Lodging – 0.1% | | | | | |
| Hilton Worldwide Holdings, Inc. | | | 81,602 | | | $ | 1,746,283 | |
| | | | | | | | |
| General Merchandise – 1.0% | | | | | |
| Kohl’s Corp. | | | 70,705 | | | $ | 3,367,679 | |
| Target Corp. | | | 295,034 | | | | 21,422,419 | |
| | | | | | | | |
| | | | | | $ | 24,790,098 | |
| | | | | | | | |
| Insurance – 4.0% | | | | | |
| ACE Ltd. | | | 137,260 | | | $ | 16,038,831 | |
| Aon PLC | | | 116,270 | | | | 10,721,257 | |
| Chubb Corp. | | | 38,971 | | | | 5,169,113 | |
| MetLife, Inc. | | | 526,130 | | | | 25,364,727 | |
| Prudential Financial, Inc. | | | 178,112 | | | | 14,500,098 | |
| Suncorp-Metway Ltd. | | | 361,761 | | | | 3,167,409 | |
| Travelers Cos., Inc. | | | 139,222 | | | | 15,712,595 | |
| Validus Holdings Ltd. | | | 164,696 | | | | 7,623,778 | |
| Zurich Insurance Group AG | | | 20,382 | | | | 5,200,659 | |
| | | | | | | | |
| | | | | | $ | 103,498,467 | |
| | | | | | | | |
| Internet – 0.3% | | | | | |
| Alphabet, Inc., “A” (a) | | | 5,393 | | | $ | 4,195,808 | |
| Facebook, Inc., “A” (a) | | | 37,273 | | | | 3,900,992 | |
| | | | | | | | |
| | | | | | $ | 8,096,800 | |
| | | | | | | | |
| | | | | | | | |
| Issuer | | Shares/Par | | | Value ($) | |
| COMMON STOCKS – continued | | | | | |
| Leisure & Toys – 0.4% | | | | | |
| Activision Blizzard, Inc. | | | 140,182 | | | $ | 5,426,445 | |
| Electronic Arts, Inc. (a) | | | 77,241 | | | | 5,308,002 | |
| | | | | | | | |
| | | | | | $ | 10,734,447 | |
| | | | | | | | |
| Machinery & Tools – 1.3% | | | | | |
| Allison Transmission Holdings, Inc. | | | 230,103 | | | $ | 5,957,367 | |
| Caterpillar, Inc. | | | 42,278 | | | | 2,873,213 | |
| Cummins, Inc. | | | 46,925 | | | | 4,129,869 | |
| Deere & Co. | | | 58,357 | | | | 4,450,888 | |
| Eaton Corp. PLC | | | 129,715 | | | | 6,750,369 | |
| Illinois Tool Works, Inc. | | | 100,332 | | | | 9,298,770 | |
| Parker Hannifin Corp. | | | 12,083 | | | | 1,171,809 | |
| | | | | | | | |
| | | | | | $ | 34,632,285 | |
| | | | | | | | |
| Major Banks – 6.9% | | | | | |
| Bank of America Corp. | | | 407,730 | | | $ | 6,862,096 | |
| Bank of New York Mellon Corp. | | | 343,880 | | | | 14,174,734 | |
| BOC Hong Kong Holdings Ltd. | | | 511,500 | | | | 1,552,035 | |
| Goldman Sachs Group, Inc. | | | 96,655 | | | | 17,420,131 | |
| HSBC Holdings PLC | | | 436,880 | | | | 3,447,610 | |
| JPMorgan Chase & Co. | | | 993,977 | | | | 65,632,301 | |
| Morgan Stanley | | | 131,481 | | | | 4,182,411 | |
| PNC Financial Services Group, Inc. | | | 78,325 | | | | 7,465,156 | |
| State Street Corp. | | | 146,536 | | | | 9,724,129 | |
| Sumitomo Mitsui Financial Group, Inc. | | | 136,900 | | | | 5,164,182 | |
| Wells Fargo & Co. | | | 816,169 | | | | 44,366,947 | |
| | | | | | | | |
| | | | | | $ | 179,991,732 | |
| | | | | | | | |
| Medical & Health Technology & Services – 0.6% | |
| Community Health Systems, Inc. (a) | | | 140,265 | | | $ | 3,721,230 | |
| Express Scripts Holding Co. (a) | | | 101,565 | | | | 8,877,797 | |
| McKesson Corp. | | | 14,359 | | | | 2,832,026 | |
| | | | | | | | |
| | | | | | $ | 15,431,053 | |
| | | | | | | | |
| Medical Equipment – 2.5% | | | | | |
| Abbott Laboratories | | | 311,558 | | | $ | 13,992,070 | |
| Cooper Cos., Inc. | | | 33,410 | | | | 4,483,622 | |
| Medtronic PLC | | | 224,346 | | | | 17,256,694 | |
| St. Jude Medical, Inc. | | | 132,957 | | | | 8,212,754 | |
| Thermo Fisher Scientific, Inc. | | | 117,269 | | | | 16,634,608 | |
| Zimmer Biomet Holdings, Inc. | | | 39,992 | | | | 4,102,779 | |
| | | | | | | | |
| | | | | | $ | 64,682,527 | |
| | | | | | | | |
| Metals & Mining – 0.3% | | | | | |
| BHP Billiton PLC | | | 398,919 | | | $ | 4,469,457 | |
| Rio Tinto Ltd. | | | 104,002 | | | | 3,034,964 | |
| | | | | | | | |
| | | | | | $ | 7,504,421 | |
| | | | | | | | |
| Natural Gas – Distribution – 0.2% | | | | | |
| Engie | | | 221,248 | | | $ | 3,915,582 | |
| | | | | | | | |
| Natural Gas – Pipeline – 0.1% | | | | | |
| Williams Partners LP | | | 68,943 | | | $ | 1,920,063 | |
| | | | | | | | |
| Network & Telecom – 0.6% | | | | | |
| Cisco Systems, Inc. | | | 527,259 | | | $ | 14,317,718 | |
| | | | | | | | |
10
MFS Total Return Series
Portfolio of Investments – continued
| | | | | | | | |
| Issuer | | Shares/Par | | | Value ($) | |
| COMMON STOCKS – continued | | | | | |
| Oil Services – 0.4% | | | | | |
| Baker Hughes, Inc. | | | 7,791 | | | $ | 359,555 | |
| National Oilwell Varco, Inc. | | | 78,204 | | | | 2,619,052 | |
| Noble Corp. PLC (l) | | | 136,264 | | | | 1,437,585 | |
| Schlumberger Ltd. | | | 104,309 | | | | 7,275,553 | |
| | | | | | | | |
| | | | | | $ | 11,691,745 | |
| | | | | | | | |
| Other Banks & Diversified Financials – 2.0% | | | | | |
| American Express Co. | | | 139,258 | | | $ | 9,685,394 | |
| BB&T Corp. | | | 177,328 | | | | 6,704,772 | |
| Citigroup, Inc. | | | 118,482 | | | | 6,131,444 | |
| Discover Financial Services | | | 107,314 | | | | 5,754,177 | |
| SunTrust Banks, Inc. | | | 58,372 | | | | 2,500,656 | |
| U.S. Bancorp | | | 228,386 | | | | 9,745,231 | |
| UBS AG | | | 272,859 | | | | 5,250,872 | |
| Visa, Inc., “A” | | | 99,221 | | | | 7,694,589 | |
| | | | | | | | |
| | | | | | $ | 53,467,135 | |
| | | | | | | | |
| Pharmaceuticals – 4.9% | | | | | |
| Allergan PLC (a) | | | 15,652 | | | $ | 4,891,250 | |
| Bayer AG | | | 24,125 | | | | 3,026,754 | |
| Bristol-Myers Squibb Co. | | | 266,837 | | | | 18,355,717 | |
| Eli Lilly & Co. | | | 221,062 | | | | 18,626,684 | |
| Johnson & Johnson | | | 310,172 | | | | 31,860,868 | |
| Merck & Co., Inc. | | | 513,578 | | | | 27,127,190 | |
| Novartis AG | | | 18,010 | | | | 1,539,433 | |
| Pfizer, Inc. | | | 551,555 | | | | 17,804,195 | |
| Roche Holding AG | | | 5,169 | | | | 1,424,515 | |
| Teva Pharmaceutical Industries Ltd., ADR | | | 41,901 | | | | 2,750,382 | |
| Valeant Pharmaceuticals International, Inc. (a) | | | 13,113 | | | | 1,332,936 | |
| | | | | | | | |
| | | | | | $ | 128,739,924 | |
| | | | | | | | |
| Printing & Publishing – 0.0% | | | | | |
| McGraw-Hill Cos., Inc. | | | 10,246 | | | $ | 1,010,051 | |
| Time, Inc. | | | 5,781 | | | | 90,588 | |
| | | | | | | | |
| | | | | | $ | 1,100,639 | |
| | | | | | | | |
| Railroad & Shipping – 0.3% | | | | | |
| Canadian National Railway Co. | | | 46,407 | | | $ | 2,593,223 | |
| Union Pacific Corp. | | | 73,115 | | | | 5,717,593 | |
| | | | | | | | |
| | | | | | $ | 8,310,816 | |
| | | | | | | | |
| Real Estate – 0.4% | | | | | |
| Hospitality Properties Trust, REIT | | | 84,329 | | | $ | 2,205,203 | |
| Medical Properties Trust, Inc., REIT | | | 306,205 | | | | 3,524,420 | |
| Mid-America Apartment Communities, Inc., REIT | | | 29,508 | | | | 2,679,621 | |
| RMR Group, Inc., REIT (a) | | | 1,400 | | | | 20,174 | |
| Starwood Property Trust, Inc., REIT | | | 112,093 | | | | 2,304,632 | |
| | | | | | | | |
| | | | | | $ | 10,734,050 | |
| | | | | | | | |
| Restaurants – 0.3% | | | | | |
| Aramark | | | 111,389 | | | $ | 3,592,295 | |
| YUM! Brands, Inc. | | | 72,140 | | | | 5,269,827 | |
| | | | | | | | |
| | | | | | $ | 8,862,122 | |
| | | | | | | | |
| | | | | | | | |
| Issuer | | Shares/Par | | | Value ($) | |
| COMMON STOCKS – continued | | | | | |
| Specialty Chemicals – 0.3% | | | | | |
| Axalta Coating Systems Ltd. (a) | | | 143,963 | | | $ | 3,836,614 | |
| Marine Harvest | | | 232,950 | | | | 3,136,279 | |
| Praxair, Inc. | | | 19,107 | | | | 1,956,557 | |
| | | | | | | | |
| | | | | | $ | 8,929,450 | |
| | | | | | | | |
| Specialty Stores – 0.9% | | | | | |
| Advance Auto Parts, Inc. | | | 10,780 | | | $ | 1,622,498 | |
| Amazon.com, Inc. (a) | | | 17,162 | | | | 11,599,624 | |
| American Eagle Outfitters, Inc. | | | 630,045 | | | | 9,765,698 | |
| Bed Bath & Beyond, Inc. (a) | | | 18,725 | | | | 903,481 | |
| | | | | | | | |
| | | | | | $ | 23,891,301 | |
| | | | | | | | |
| Telecommunications – Wireless – 0.1% | | | | | |
| Vodafone Group PLC | | | 389,618 | | | $ | 1,260,229 | |
| | | | | | | | |
| Telephone Services – 1.4% | | | | | |
| AT&T, Inc. | | | 76,540 | | | $ | 2,633,741 | |
| Frontier Communications Corp. | | | 490,628 | | | | 2,291,233 | |
| TDC A.S. | | | 421,032 | | | | 2,088,607 | |
| Telefonica Brasil S.A., ADR | | | 286,677 | | | | 2,588,693 | |
| Verizon Communications, Inc. | | | 582,899 | | | | 26,941,592 | |
| | | | | | | | |
| | | | | | $ | 36,543,866 | |
| | | | | | | | |
| Tobacco – 2.5% | | | | | |
| Altria Group, Inc. | | | 262,332 | | | $ | 15,270,346 | |
| Japan Tobacco, Inc. | | | 207,800 | | | | 7,629,822 | |
| Philip Morris International, Inc. | | | 464,595 | | | | 40,842,546 | |
| Reynolds American, Inc. | | | 56,136 | | | | 2,590,676 | |
| | | | | | | | |
| | | | | | $ | 66,333,390 | |
| | | | | | | | |
| Trucking – 0.4% | | | | | |
| United Parcel Service, Inc., “B” | | | 109,539 | | | $ | 10,540,938 | |
| | | | | | | | |
| Utilities – Electric Power – 1.5% | | | | | |
| American Electric Power Co., Inc. | | | 177,618 | | | $ | 10,349,801 | |
| Duke Energy Corp. | | | 83,490 | | | | 5,960,351 | |
| Exelon Corp. | | | 311,491 | | | | 8,650,105 | |
| NRG Energy, Inc. | | | 105,535 | | | | 1,242,147 | |
| PPL Corp. | | | 298,948 | | | | 10,203,095 | |
| Public Service Enterprise Group, Inc. | | | 74,077 | | | | 2,866,039 | |
| Xcel Energy, Inc. | | | 29,449 | | | | 1,057,514 | |
| | | | | | | | |
| | | | | | $ | 40,329,052 | |
| | | | | | | | |
Total Common Stocks
(Identified Cost, $1,200,200,552) | | | $ | 1,523,061,954 | |
| | | | | | | | |
| |
| BONDS – 39.8% | | | | | |
| Agency – Other – 0.1% | | | | | |
| Financing Corp., 9.65%, 11/02/18 | | $ | 1,275,000 | | | $ | 1,560,015 | |
| | | | | | | | |
| Asset-Backed & Securitized – 2.5% | | | | | |
| Bayview Financial Revolving Mortgage Loan Trust, FRN, 1.832%, 12/28/40 (z) | | $ | 2,707,166 | | | $ | 1,981,709 | |
| BlackRock Capital Finance LP, 7.75%, 9/25/26 (z) | | | 59,004 | | | | 13,643 | |
| Cent LP, 2013-17A, “A1”, CLO, FRN, 1.621%, 1/30/25 (z) | | | 2,547,000 | | | | 2,522,786 | |
| Citigroup Commercial Mortgage Trust, FRN, 5.709%, 12/10/49 | | | 3,050,000 | | | | 3,151,652 | |
11
MFS Total Return Series
Portfolio of Investments – continued
| | | | | | | | |
| Issuer | | Shares/Par | | | Value ($) | |
| BONDS – continued | | | | | |
| Asset-Backed & Securitized – continued | | | | | |
| Citigroup/Deutsche Bank Commercial Mortgage Trust, 5.322%, 12/11/49 | | $ | 3,805,499 | | | $ | 3,869,444 | |
| Commercial Mortgage Trust, 2015-LC21, “A4”, 3.708%, 7/10/48 | | | 3,980,975 | | | | 4,046,049 | |
| Credit Suisse Mortgage Capital Certificate, 5.695%, 9/15/40 | | | 5,623,104 | | | | 5,809,296 | |
| CSAIL Commercial Mortgage Trust, 2015-C2, “A4”, 3.504%, 6/15/57 | | | 2,316,427 | | | | 2,337,114 | |
| Dryden Senior Loan Fund, 2013-26A, “A”, CLO, FRN, 1.42%, 7/15/25 (z) | | | 3,273,000 | | | | 3,210,129 | |
| Ford Credit Auto Owner Trust, 2014-1,“A”, 2.26%, 11/15/25 (n) | | | 1,735,000 | | | | 1,749,275 | |
| Ford Credit Auto Owner Trust, 2014-2,“A”, 2.31%, 4/15/26 (n) | | | 1,465,000 | | | | 1,462,870 | |
| GMAC Mortgage Corp. Loan Trust, 5.805%, 10/25/36 | | | 951,229 | | | | 924,785 | |
| Greenwich Capital Commercial Funding Corp., 5.475%, 3/10/39 | | | 5,978,000 | | | | 6,115,516 | |
| GS Mortgage Securities Trust, 2015-GC30, “A4”, 3.382%, 5/10/50 | | | 4,243,101 | | | | 4,220,722 | |
| ING Investment Management Ltd., 2013-2A, “A1”, CLO, FRN, 1.469%, 4/25/25 (z) | | | 2,971,000 | | | | 2,920,113 | |
| JPMBB Commercial Mortgage Securities Trust, 2014-C26, 3.494%, 1/15/48 | | | 4,880,000 | | | | 4,898,227 | |
| JPMorgan Chase Commercial Mortgage Securities Corp., 5.552%, 5/12/45 | | | 817,070 | | | | 826,646 | |
| JPMorgan Chase Commercial Mortgage Securities Corp., “A3”, FRN, 5.937%, 2/15/51 | | | 202,900 | | | | 202,655 | |
| JPMorgan Chase Commercial Mortgage Securities Corp., “A4”, FRN, 5.774%, 6/15/49 | | | 777,548 | | | | 792,909 | |
| JPMorgan Chase Commercial Mortgage Securities Corp., FRN, 5.475%, 4/15/43 | | | 982,421 | | | | 982,205 | |
| Merrill Lynch Mortgage Trust, “A3”, FRN, 5.835%, 6/12/50 | | | 83,546 | | | | 83,481 | |
| Morgan Stanley Capital I, Inc., FRN, 0.943%, 11/15/30 (i)(n) | | | 3,779,729 | | | | 60,555 | |
| Residential Funding Mortgage Securities, Inc., 5.32%, 12/25/35 | | | 1,949,582 | | | | 1,600,569 | |
| Wachovia Bank Commercial Mortgage Trust, “A4”, FRN, 5.952%, 2/15/51 | | | 726,971 | | | | 751,439 | |
| Wachovia Bank Commercial Mortgage Trust, FRN, 5.712%, 6/15/49 | | | 4,011,472 | | | | 4,108,859 | |
| Wells Fargo Commercial Mortgage Trust, 2015-C28, “A4”, 3.54%, 5/15/48 | | | 4,315,766 | | | | 4,334,865 | |
| | | | | | | | |
| | | | | | $ | 62,977,513 | |
| | | | | | | | |
| Automotive – 0.2% | | | | | |
| Toyota Motor Credit Corp., 3.4%, 9/15/21 | | $ | 3,170,000 | | | $ | 3,286,225 | |
| Volkswagen International Finance N.V., 2.375%, 3/22/17 (n) | | | 3,032,000 | | | | 3,016,731 | |
| | | | | | | | |
| | | | | | $ | 6,302,956 | |
| | | | | | | | |
| | | | | | | | |
| Issuer | | Shares/Par | | | Value ($) | |
| BONDS – continued | | | | | |
| Broadcasting – 0.2% | | | | | |
| 21st Century Fox America, Inc., 8.5%, 2/23/25 | | $ | 2,839,000 | | | $ | 3,648,016 | |
| Grupo Televisa S.A.B., 5%, 5/13/45 | | | 1,122,000 | | | | 963,994 | |
| | | | | | | | |
| | | | | | $ | 4,612,010 | |
| | | | | | | | |
| Brokerage & Asset Managers – 0.0% | | | | | |
| Intercontinental Exchange, Inc., 2.75%, 12/01/20 | | $ | 903,000 | | | $ | 903,153 | |
| | | | | | | | |
| Cable TV – 0.3% | | | | | |
| Comcast Corp., 2.85%, 1/15/23 | | $ | 3,520,000 | | | $ | 3,498,774 | |
| Time Warner Entertainment Co. LP, 8.375%, 7/15/33 | | | 2,855,000 | | | | 3,368,206 | |
| | | | | | | | |
| | | | | | $ | 6,866,980 | |
| | | | | | | | |
| Computer Software – Systems – 0.0% | | | | | |
| Apple, Inc., 3.85%, 5/04/43 | | $ | 1,303,000 | | | $ | 1,200,552 | |
| | | | | | | | |
| Conglomerates – 0.1% | | | | | |
| ABB Finance (USA), Inc., 2.875%, 5/08/22 | | $ | 1,096,000 | | | $ | 1,080,858 | |
| General Electric Co., 2.7%, 10/09/22 | | | 2,780,000 | | | | 2,770,142 | |
| | | | | | | | |
| | | | | | $ | 3,851,000 | |
| | | | | | | | |
| Consumer Products – 0.1% | | | | | |
| Reckitt Benckiser Treasury Services PLC, 3.625%, 9/21/23 (n) | | $ | 3,463,000 | | | $ | 3,535,626 | |
| | | | | | | | |
| Consumer Services – 0.1% | | | | | |
| Visa, Inc., 3.15%, 12/14/25 | | $ | 3,594,000 | | | $ | 3,601,594 | |
| | | | | | | | |
| Emerging Market Quasi-Sovereign – 0.4% | | | | | |
| CNOOC Finance (2012) Ltd., 3.875%, 5/02/22 (n) | | $ | 3,630,000 | | | $ | 3,666,801 | |
| Petroleos Mexicanos, 3.125%, 1/23/19 | | | 1,277,000 | | | | 1,235,357 | |
| Petroleos Mexicanos, 8%, 5/03/19 | | | 2,671,000 | | | | 2,940,424 | |
| Ras Laffan Liquefied Natural Gas Co. Ltd., 5.832%, 9/30/16 (n) | | | 827,444 | | | | 843,960 | |
| State Grid Overseas Investment (2014) Ltd., 2.75%, 5/07/19 (z) | | | 2,591,000 | | | | 2,618,055 | |
| | | | | | | | |
| | | | | | $ | 11,304,597 | |
| | | | | | | | |
| Emerging Market Sovereign – 0.1% | | | | | |
| Republic of Peru, 7.35%, 7/21/25 | | $ | 287,000 | | | $ | 359,826 | |
| United Mexican States, 4.75%, 3/08/44 | | | 2,089,000 | | | | 1,903,079 | |
| | | | | | | | |
| | | | | | $ | 2,262,905 | |
| | | | | | | | |
| Energy – Independent – 0.1% | | | | | |
| Anadarko Petroleum Corp., 6.375%, 9/15/17 | | $ | 1,638,000 | | | $ | 1,717,608 | |
| Apache Corp., 4.75%, 4/15/43 | | | 1,141,000 | | | | 980,200 | |
| | | | | | | | |
| | | | | | $ | 2,697,808 | |
| | | | | | | | |
| Energy – Integrated – 0.7% | | | | | |
| BP Capital Markets PLC, 4.5%, 10/01/20 | | $ | 1,054,000 | | | $ | 1,128,108 | |
| BP Capital Markets PLC, 4.742%, 3/11/21 | | | 3,027,000 | | | | 3,325,102 | |
| Chevron Corp., 0.531%, 11/15/17 | | | 5,248,000 | | | | 5,223,471 | |
| Petro-Canada, 6.05%, 5/15/18 | | | 1,942,000 | | | | 2,081,838 | |
12
MFS Total Return Series
Portfolio of Investments – continued
| | | | | | | | |
| Issuer | | Shares/Par | | | Value ($) | |
| BONDS – continued | | | | | |
| Energy – Integrated – continued | | | | | |
| Total Capital International S.A., 1.55%, 6/28/17 | | $ | 3,169,000 | | | $ | 3,177,233 | |
| Total Capital International S.A., 3.75%, 4/10/24 | | | 3,360,000 | | | | 3,414,519 | |
| | | | | | | | |
| | | | | | $ | 18,350,271 | |
| | | | | | | | |
| Financial Institutions – 0.2% | | | | | |
| GE Capital International Funding Co., 3.373%, 11/15/25 (n) | | $ | 1,258,000 | | | $ | 1,280,975 | |
| General Electric Capital Corp., 3.1%, 1/09/23 | | | 484,000 | | | | 491,265 | |
| General Electric Capital Corp., FRN, 0.938%, 1/09/20 | | | 3,877,000 | | | | 3,875,368 | |
| | | | | | | | |
| | | | | | $ | 5,647,608 | |
| | | | | | | | |
| Food & Beverages – 0.4% | | | | | |
| Anheuser-Busch InBev S.A., 8%, 11/15/39 | | $ | 3,600,000 | | | $ | 5,010,588 | |
| Diageo Capital PLC, 2.625%, 4/29/23 | | | 1,270,000 | | | | 1,227,821 | |
| J.M. Smucker Co., 3.5%, 3/15/25 | | | 1,794,000 | | | | 1,785,816 | |
| Kraft Foods Group, Inc., 3.5%, 6/06/22 | | | 1,463,000 | | | | 1,479,491 | |
| Wm. Wrigley Jr. Co., 2.4%, 10/21/18 (n) | | | 756,000 | | | | 758,084 | |
| | | | | | | | |
| | | | | | $ | 10,261,800 | |
| | | | | | | | |
| Food & Drug Stores – 0.3% | | | | | |
| CVS Health Corp., 3.875%, 7/20/25 | | $ | 3,759,000 | | | $ | 3,836,984 | |
| Walgreens Boots Alliance, Inc., 3.3%, 11/18/21 | | | 2,550,000 | | | | 2,501,945 | |
| Walgreens Boots Alliance, Inc., 4.5%, 11/18/34 | | | 1,318,000 | | | | 1,203,628 | |
| | | | | | | | |
| | | | | | $ | 7,542,557 | |
| | | | | | | | |
| Insurance – 0.3% | | | | | |
| American International Group, Inc., 4.875%, 6/01/22 | | $ | 5,088,000 | | | $ | 5,498,317 | |
| American International Group, Inc., 4.125%, 2/15/24 | | | 2,620,000 | | | | 2,692,621 | |
| | | | | | | | |
| | | | | | $ | 8,190,938 | |
| | | | | | | | |
| Insurance – Health – 0.2% | | | | | |
| Anthem, Inc., 3.3%, 1/15/23 | | $ | 2,122,000 | | | $ | 2,063,153 | |
| UnitedHealth Group, Inc., 3.75%, 7/15/25 | | | 3,987,000 | | | | 4,113,858 | |
| | | | | | | | |
| | | | | | $ | 6,177,011 | |
| | | | | | | | |
| Insurance – Property & Casualty – 0.4% | | | | | |
| ACE Ltd., 2.7%, 3/13/23 | | $ | 3,560,000 | | | $ | 3,480,010 | |
| Liberty Mutual Group, Inc., 4.25%, 6/15/23 (n) | | | 1,699,000 | | | | 1,727,553 | |
| Marsh & McLennan Cos., Inc., 4.8%, 7/15/21 | | | 3,270,000 | | | | 3,559,506 | |
| ZFS Finance USA Trust V, 6.5% to 5/09/17, FRN to 5/09/67 (n) | | | 1,514,000 | | | | 1,544,280 | |
| | | | | | | | |
| | | | | | $ | 10,311,349 | |
| | | | | | | | |
| | | | | | | | |
| Issuer | | Shares/Par | | | Value ($) | |
| BONDS – continued | | | | | |
| International Market Quasi-Sovereign – 0.4% | | | | | |
| KFW International Finance, Inc., 4.875%, 6/17/19 | | $ | 4,560,000 | | | $ | 5,052,567 | |
| Temasek Financial I Ltd., 2.375%, 1/23/23 (n) | | | 6,400,000 | | | | 6,257,082 | |
| | | | | | | | |
| | | | | | $ | 11,309,649 | |
| | | | | | | | |
| International Market Sovereign – 0.0% | | | | | |
| Republic of Iceland, 4.875%, 6/16/16 (n) | | $ | 1,108,000 | | | $ | 1,124,632 | |
| | | | | | | | |
| Internet – 0.2% | | | | | |
| Baidu, Inc., 3.5%, 11/28/22 | | $ | 3,950,000 | | | $ | 3,874,832 | |
| | | | | | | | |
| Local Authorities – 0.2% | | | | | |
| New Jersey Turnpike Authority Rev. (Build America Bonds), “F”, 7.414%, 1/01/40 | | $ | 3,685,000 | | | $ | 5,237,712 | |
| | | | | | | | |
| Machinery & Tools – 0.1% | | | | | |
| Atlas Copco AB, 5.6%, 5/22/17 (n) | | $ | 2,786,000 | | | $ | 2,915,970 | |
| | | | | | | | |
| Major Banks – 1.6% | | | | | |
| Bank of America Corp., 5.49%, 3/15/19 | | $ | 2,989,000 | | | $ | 3,223,971 | |
| Bank of America Corp., 4.1%, 7/24/23 | | | 3,870,000 | | | | 4,003,136 | |
| Bank of America Corp., 4.125%, 1/22/24 | | | 5,102,000 | | | | 5,272,274 | |
| BNP Paribas, 7.195% to 6/25/37, FRN to 6/29/49 (n) | | | 1,842,000 | | | | 2,104,485 | |
| Credit Suisse Group AG, 6.5%, 8/08/23 (n) | | | 1,300,000 | | | | 1,400,750 | |
| Goldman Sachs Group, Inc., 5.625%, 1/15/17 | | | 4,227,000 | | | | 4,390,424 | |
| ING Bank N.V., 5.8%, 9/25/23 (n) | | | 3,438,000 | | | | 3,735,562 | |
| JPMorgan Chase & Co., 6.3%, 4/23/19 | | | 3,410,000 | | | | 3,824,400 | |
| Morgan Stanley, 3.875%, 4/29/24 | | | 3,188,000 | | | | 3,250,054 | |
| Morgan Stanley, 6.625%, 4/01/18 | | | 4,287,000 | | | | 4,701,287 | |
| Morgan Stanley, 4%, 7/23/25 | | | 1,206,000 | | | | 1,242,945 | |
| PNC Funding Corp., 5.625%, 2/01/17 | | | 3,348,000 | | | | 3,480,845 | |
| Wells Fargo & Co., 5.9% to 6/15/24, FRN to 12/29/49 | | | 1,743,000 | | | | 1,758,251 | |
| | | | | | | | |
| | | | | | $ | 42,388,384 | |
| | | | | | | | |
| Medical & Health Technology & Services – 0.5% | | | | | |
| Becton, Dickinson and Co., 6.375%, 8/01/19 | | $ | 3,950,000 | | | $ | 4,460,119 | |
| Becton, Dickinson and Co., 2.675%, 12/15/19 | | | 1,842,000 | | | | 1,852,544 | |
| Express Scripts Holding Co., 2.65%, 2/15/17 | | | 3,087,000 | | | | 3,117,487 | |
| Laboratory Corp. of America Holdings, 3.2%, 2/01/22 | | | 2,640,000 | | | | 2,591,957 | |
| | | | | | | | |
| | | | | | $ | 12,022,107 | |
| | | | | | | | |
| Medical Equipment – 0.3% | | | | | |
| Medtronic, Inc., 4.375%, 3/15/35 | | $ | 3,083,000 | | | $ | 3,114,776 | |
| Zimmer Holdings, Inc., 3.55%, 4/01/25 | | | 3,762,000 | | | | 3,657,608 | |
| | | | | | | | |
| | | | | | $ | 6,772,384 | |
| | | | | | | | |
| Metals & Mining – 0.1% | | | | | |
| Freeport-McMoRan Copper & Gold, Inc., 3.875%, 3/15/23 | | $ | 3,570,000 | | | $ | 2,034,900 | |
| | | | | | | | |
13
MFS Total Return Series
Portfolio of Investments – continued
| | | | | | | | |
| Issuer | | Shares/Par | | | Value ($) | |
| BONDS – continued | | | | | |
| Midstream – 0.6% | | | | | |
| APT Pipelines Ltd., 4.2%, 3/23/25 (n) | | $ | 3,780,000 | | | $ | 3,551,919 | |
| Energy Transfer Partners LP, 3.6%, 2/01/23 | | | 1,975,000 | | | | 1,626,865 | |
| Energy Transfer Partners LP, 4.9%, 2/01/24 | | | 1,270,000 | | | | 1,132,360 | |
| Enterprise Products Operating LP, 6.5%, 1/31/19 | | | 2,995,000 | | | | 3,291,002 | |
| Kinder Morgan Energy Partners LP, 4.15%, 2/01/24 | | | 1,369,000 | | | | 1,181,856 | |
| Kinder Morgan Energy Partners LP, 7.4%, 3/15/31 | | | 1,023,000 | | | | 943,102 | |
| Kinder Morgan Energy Partners LP, 7.75%, 3/15/32 | | | 1,661,000 | | | | 1,593,989 | |
| Spectra Energy Capital LLC, 8%, 10/01/19 | | | 2,734,000 | | | | 3,109,969 | |
| | | | | | | | |
| | | | | | $ | 16,431,062 | |
| | | | | | | | |
| Mortgage-Backed – 12.2% | | | | | |
| Fannie Mae, 3%, 10/01/30 | | $ | 2,864,402 | | | $ | 2,952,971 | |
| Fannie Mae, 4%, 9/01/40 – 7/01/43 | | | 6,679,462 | | | | 7,080,302 | |
| Fannie Mae, 3.5%, 7/01/43 | | | 2,116,666 | | | | 2,185,851 | |
| Fannie Mae, 5.658%, 2/01/16 | | | 146,215 | | | | 145,796 | |
| Fannie Mae, 5.5%, 7/01/16 – 4/01/40 | | | 22,394,816 | | | | 25,049,819 | |
| Fannie Mae, 5.735%, 7/01/16 | | | 691,250 | | | | 693,059 | |
| Fannie Mae, 5.27%, 12/01/16 | | | 1,554,098 | | | | 1,589,076 | |
| Fannie Mae, 5.05%, 1/01/17 | | | 455,480 | | | | 465,278 | |
| Fannie Mae, 5.6%, 1/01/17 | | | 221 | | | | 221 | |
| Fannie Mae, 6%, 1/01/17 – 7/01/37 | | | 11,536,347 | | | | 13,062,594 | |
| Fannie Mae, 3.8%, 2/01/18 | | | 312,162 | | | | 324,282 | |
| Fannie Mae, 3.91%, 2/01/18 | | | 455,825 | | | | 474,026 | |
| Fannie Mae, 5%, 2/01/18 – 3/01/41 | | | 9,864,878 | | | | 10,839,634 | |
| Fannie Mae, 4.5%, 4/01/18 – 4/01/44 | | | 18,234,854 | | | | 19,744,501 | |
| Fannie Mae, 2.578%, 9/25/18 | | | 2,359,240 | | | | 2,403,190 | |
| Fannie Mae, 4.6%, 9/01/19 | | | 480,916 | | | | 519,123 | |
| Fannie Mae, 2.59%, 5/01/23 | | | 481,318 | | | | 481,741 | |
| Fannie Mae, 3%, 3/01/27 – 12/01/30 | | | 6,564,123 | | | | 6,778,526 | |
| Fannie Mae, 2.5%, 2/01/28 – 5/01/30 | | | 2,914,348 | | | | 2,953,371 | |
| Fannie Mae, 6.5%, 6/01/31 – 7/01/37 | | | 3,304,998 | | | | 3,808,148 | |
| Fannie Mae, 4%, 12/01/40 – 2/01/45 | | | 29,436,199 | | | | 31,185,291 | |
| Fannie Mae, 3.5%, 11/01/41 – 6/01/43 | | | 5,750,221 | | | | 5,946,224 | |
| Fannie Mae, 3.5%, 4/01/43 – 9/01/43 | | | 10,660,241 | | | | 11,006,021 | |
| Freddie Mac, 4%, 4/01/44 – 9/01/44 | | | 10,511,509 | | | | 11,110,528 | |
| Freddie Mac, 6%, 4/01/16 – 6/01/37 | | | 5,138,027 | | | | 5,776,881 | |
| Freddie Mac, 5%, 12/01/17 – 7/01/39 | | | 5,680,987 | | | | 6,204,228 | |
| Freddie Mac, 3.154%, 2/25/18 | | | 408,381 | | | | 420,858 | |
| Freddie Mac, 4.5%, 5/01/18 – 10/01/39 | | | 4,308,330 | | | | 4,599,673 | |
| Freddie Mac, 2.412%, 8/25/18 | | | 1,820,000 | | | | 1,851,481 | |
| Freddie Mac, 5.5%, 1/01/19 – 2/01/37 | | | 4,726,280 | | | | 5,237,530 | |
| Freddie Mac, 5.085%, 3/25/19 | | | 4,316,000 | | | | 4,696,374 | |
| Freddie Mac, 2.456%, 8/25/19 | | | 500,000 | | | | 508,053 | |
| Freddie Mac, 1.869%, 11/25/19 | | | 1,266,000 | | | | 1,259,240 | |
| Freddie Mac, 2.791%, 1/25/22 | | | 1,485,000 | | | | 1,505,651 | |
| Freddie Mac, 2.716%, 6/25/22 | | | 1,059,508 | | | | 1,065,919 | |
| Freddie Mac, 2.51%, 11/25/22 | | | 1,272,000 | | | | 1,262,304 | |
| Freddie Mac, 3.111%, 2/25/23 | | | 2,136,000 | | | | 2,194,821 | |
| Freddie Mac, 3.32%, 2/25/23 | | | 618,000 | | | | 642,768 | |
| | | | | | | | |
| Issuer | | Shares/Par | | | Value ($) | |
| BONDS – continued | | | | | |
| Mortgage-Backed – continued | | | | | |
| Freddie Mac, 3.25%, 4/25/23 | | $ | 2,474,000 | | | $ | 2,558,778 | |
| Freddie Mac, 3.458%, 8/25/23 | | | 2,553,000 | | | | 2,667,776 | |
| Freddie Mac, 3.171%, 10/25/24 | | | 1,304,000 | | | | 1,325,201 | |
| Freddie Mac, 2.67%, 12/25/24 | | | 1,561,000 | | | | 1,523,976 | |
| Freddie Mac, 3%, 11/01/30 – 5/01/43 | | | 18,527,903 | | | | 18,754,666 | |
| Freddie Mac, 6.5%, 5/01/34 – 2/01/38 | | | 2,205,096 | | | | 2,547,359 | |
| Freddie Mac, 4%, 11/01/40 – 11/01/43 | | | 11,386,248 | | | | 12,059,812 | |
| Freddie Mac, 3.5%, 2/01/42 – 11/01/45 | | | 20,129,350 | | | | 20,763,353 | |
| Freddie Mac, TBA, 3.5%, 1/01/46 | | | 4,770,000 | | | | 4,908,626 | |
| Freddie Mac, TBA, 4%, 1/01/46 | | | 8,513,000 | | | | 8,990,814 | |
| Ginnie Mae, 4%, 2/20/42 | | | 158,481 | | | | 169,377 | |
| Ginnie Mae, 3%, 2/15/43 – 6/20/43 | | | 5,054,298 | | | | 5,143,008 | |
| Ginnie Mae, 6%, 9/15/32 – 1/15/38 | | | 3,862,844 | | | | 4,436,149 | |
| Ginnie Mae, 5.5%, 5/15/33 – 10/15/35 | | | 2,535,327 | | | | 2,857,583 | |
| Ginnie Mae, 4.5%, 7/20/33 – 1/20/41 | | | 6,873,432 | | | | 7,484,567 | |
| Ginnie Mae, 5%, 7/20/33 – 12/15/34 | | | 856,774 | | | | 953,995 | |
| Ginnie Mae, 4%, 1/20/41 – 4/20/41 | | | 7,311,194 | | | | 7,829,870 | |
| Ginnie Mae, 3.5%, 12/15/41 – 7/20/43 | | | 10,607,100 | | | | 11,084,043 | |
| Ginnie Mae, 3%, 7/20/43 | | | 716,439 | | | | 728,712 | |
| Ginnie Mae, TBA, 3.5%, 1/01/46 | | | 3,562,000 | | | | 3,712,012 | |
| | | | | | | | |
| | | | | | $ | 318,525,031 | |
| | | | | | | | |
| Network & Telecom – 0.4% | | | | | |
| AT&T, Inc., 3%, 6/30/22 | | $ | 2,565,000 | | | $ | 2,495,158 | |
| AT&T, Inc., 3.4%, 5/15/25 | | | 2,565,000 | | | | 2,465,516 | |
| Verizon Communications, Inc., 6.4%, 9/15/33 | | | 4,093,000 | | | | 4,663,274 | |
| | | | | | | | |
| | | | | | $ | 9,623,948 | |
| | | | | | | | |
| Other Banks & Diversified Financials – 0.9% | | | | | |
| Banco de Credito del Peru, 5.375%, 9/16/20 | | $ | 2,967,000 | | | $ | 3,137,603 | |
| BBVA Bancomer S.A. de C.V., 6.75%, 9/30/22 (n) | | | 2,890,000 | | | | 3,179,000 | |
| Capital One Financial Corp., 6.15%, 9/01/16 | | | 4,542,000 | | | | 4,680,095 | |
| Citigroup, Inc., 2.5%, 9/26/18 | | | 2,450,000 | | | | 2,471,317 | |
| Discover Bank, 4.2%, 8/08/23 | | | 1,540,000 | | | | 1,573,375 | |
| Groupe BPCE S.A., 12.5% to 9/30/19, FRN to 8/29/49 (n) | | | 3,106,000 | | | | 3,976,301 | |
| Swedbank AB, 2.125%, 9/29/17 (n) | | | 821,000 | | | | 824,801 | |
| U.S. Bancorp, 3.7%, 1/30/24 | | | 2,301,000 | | | | 2,410,392 | |
| | | | | | | | |
| | | | | | $ | 22,252,884 | |
| | | | | | | | |
| Pharmaceuticals – 0.6% | | | | | |
| AbbVie, Inc., 3.6%, 5/14/25 | | $ | 1,783,000 | | | $ | 1,759,932 | |
| Actavis Funding SCS, 3.8%, 3/15/25 | | | 1,429,000 | | | | 1,421,834 | |
| Actavis Funding SCS, 4.85%, 6/15/44 | | | 1,653,000 | | | | 1,636,177 | |
| Celgene Corp., 2.875%, 8/15/20 | | | 1,545,000 | | | | 1,533,955 | |
| Gilead Sciences, Inc., 3.7%, 4/01/24 | | | 915,000 | | | | 937,329 | |
| Gilead Sciences, Inc., 3.5%, 2/01/25 | | | 5,767,000 | | | | 5,815,622 | |
| Roche Holdings, Inc., 6%, 3/01/19 (n) | | | 701,000 | | | | 783,403 | |
| Teva Pharmaceutical Finance IV LLC, 3.65%, 11/10/21 | | | 1,416,000 | | | | 1,436,808 | |
| | | | | | | | |
| | | | | | $ | 15,325,060 | |
| | | | | | | | |
14
MFS Total Return Series
Portfolio of Investments – continued
| | | | | | | | |
| Issuer | | Shares/Par | | | Value ($) | |
| BONDS – continued | | | | | |
| Real Estate – Healthcare – 0.1% | | | | | |
| HCP, Inc., REIT, 5.375%, 2/01/21 | | $ | 2,622,000 | | | $ | 2,856,449 | |
| | | | | | | | |
| Retailers – 0.2% | | | | | |
| Gap, Inc., 5.95%, 4/12/21 | | $ | 2,180,000 | | | $ | 2,307,240 | |
| Home Depot, Inc., 3.75%, 2/15/24 | | | 1,900,000 | | | | 2,024,144 | |
| Home Depot, Inc., 5.95%, 4/01/41 | | | 989,000 | | | | 1,230,402 | |
| | | | | | | | |
| | | | | | $ | 5,561,786 | |
| | | | | | | | |
| Supranational – 0.1% | | | | | |
| Asian Development Bank, 1.125%, 3/15/17 | | $ | 2,069,000 | | | $ | 2,071,936 | |
| | | | | | | | |
| Telecommunications – Wireless – 0.5% | | | | | |
| American Tower Trust I, REIT, 3.07%, 3/15/23 (n) | | $ | 3,560,000 | | | $ | 3,485,925 | |
| Crown Castle Towers LLC, 6.113%, 1/15/20 (n) | | | 2,493,000 | | | | 2,719,495 | |
| Crown Castle Towers LLC, 4.883%, 8/15/20 (n) | | | 1,270,000 | | | | 1,357,720 | |
| Rogers Communications, Inc., 6.8%, 8/15/18 | | | 5,026,000 | | | | 5,610,594 | |
| | | | | | | | |
| | | | | | $ | 13,173,734 | |
| | | | | | | | |
| Tobacco – 0.6% | | | | | |
| Altria Group, Inc., 2.85%, 8/09/22 | | $ | 3,640,000 | | | $ | 3,549,120 | |
| B.A.T. International Finance PLC, 3.25%, 6/07/22 (n) | | | 3,636,000 | | | | 3,643,505 | |
| Imperial Tobacco Finance PLC, 2.95%, 7/21/20 (z) | | | 2,518,000 | | | | 2,523,731 | |
| Reynolds American, Inc., 4.45%, 6/12/25 | | | 5,591,000 | | | | 5,850,517 | |
| | | | | | | | |
| | | | | | $ | 15,566,873 | |
| | | | | | | | |
| Transportation – Services – 0.1% | | | | | |
| ERAC USA Finance LLC, 7%, 10/15/37 (n) | | $ | 2,696,000 | | | $ | 3,281,679 | |
| | | | | | | | |
| U.S. Government Agencies and Equivalents – 0.2% | |
| Small Business Administration, 4.35%, 7/01/23 | | $ | 6,536 | | | $ | 6,861 | |
| Small Business Administration, 4.77%, 4/01/24 | | | 362,908 | | | | 385,495 | |
| Small Business Administration, 5.18%, 5/01/24 | | | 628,277 | | | | 675,166 | |
| Small Business Administration, 5.52%, 6/01/24 | | | 31,282 | | | | 34,108 | |
| Small Business Administration, 4.99%, 9/01/24 | | | 570,091 | | | | 612,755 | |
| Small Business Administration, 4.95%, 3/01/25 | | | 18,229 | | | | 19,551 | |
| Small Business Administration, 5.11%, 8/01/25 | | | 2,145,369 | | | | 2,313,161 | |
| | | | | | | | |
| | | | | | $ | 4,047,097 | |
| | | | | | | | |
| U.S. Treasury Obligations – 12.4% | | | | | |
| U.S. Treasury Bonds, 8.5%, 2/15/20 | | $ | 5,808,000 | | | $ | 7,400,066 | |
| U.S. Treasury Bonds, 8%, 11/15/21 | | | 723,000 | | | | 966,014 | |
| U.S. Treasury Bonds, 6%, 2/15/26 | | | 777,000 | | | | 1,037,638 | |
| U.S. Treasury Bonds, 6.75%, 8/15/26 | | | 2,569,000 | | | | 3,641,301 | |
| U.S. Treasury Bonds, 5.375%, 2/15/31 | | | 574,000 | | | | 778,243 | |
| | | | | | | | |
| Issuer | | Shares/Par | | | Value ($) | |
| BONDS – continued | | | | | |
| U.S. Treasury Obligations – continued | | | | | |
| U.S. Treasury Bonds, 4.5%, 2/15/36 | | $ | 1,203,000 | | | $ | 1,539,645 | |
| U.S. Treasury Bonds, 5%, 5/15/37 | | | 1,609,000 | | | | 2,201,698 | |
| U.S. Treasury Bonds, 4.5%, 8/15/39 | | | 30,517,600 | | | | 38,986,203 | |
| U.S. Treasury Bonds, 2.875%, 5/15/43 | | | 34,242,000 | | | | 33,316,850 | |
| U.S. Treasury Bonds, 2.5%, 2/15/45 | | | 10,673,000 | | | | 9,556,540 | |
| U.S. Treasury Notes, 5.125%, 5/15/16 | | | 488,000 | | | | 496,543 | |
| U.S. Treasury Notes, 0.875%, 12/31/16 | | | 12,366,000 | | | | 12,374,100 | |
| U.S. Treasury Notes, 0.75%, 6/30/17 | | | 31,760,000 | | | | 31,661,989 | |
| U.S. Treasury Notes, 4.75%, 8/15/17 | | | 1,507,000 | | | | 1,598,201 | |
| U.S. Treasury Notes, 3.75%, 11/15/18 | | | 17,568,000 | | | | 18,802,925 | |
| U.S. Treasury Notes, 2.75%, 2/15/19 | | | 6,407,000 | | | | 6,677,952 | |
| U.S. Treasury Notes, 3.125%, 5/15/19 | | | 33,754,000 | | | | 35,620,934 | |
| U.S. Treasury Notes, 1%, 6/30/19 | | | 39,559,000 | | | | 38,910,232 | |
| U.S. Treasury Notes, 3.5%, 5/15/20 | | | 25,260,000 | | | | 27,167,408 | |
| U.S. Treasury Notes, 3.125%, 5/15/21 | | | 17,180,000 | | | | 18,277,974 | |
| U.S. Treasury Notes, 2.5%, 8/15/23 | | | 31,120,000 | | | | 31,927,595 | |
| | | | | | | | |
| | | | | | $ | 322,940,051 | |
| | | | | | | | |
| Utilities – Electric Power – 0.8% | | | | | |
| Berkshire Hathaway Energy Co., 3.75%, 11/15/23 | | $ | 1,930,000 | | | $ | 1,980,742 | |
| MidAmerican Funding LLC, 6.927%, 3/01/29 | | | 903,000 | | | | 1,152,638 | |
| Oncor Electric Delivery Co., 7%, 9/01/22 | | | 2,810,000 | | | | 3,375,397 | |
| Pacific Gas & Electric Co., 4.6%, 6/15/43 | | | 2,940,000 | | | | 2,984,582 | |
| PPL Capital Funding, Inc., 5%, 3/15/44 | | | 870,000 | | | | 896,941 | |
| PPL Corp., 3.4%, 6/01/23 | | | 2,940,000 | | | | 2,930,633 | |
| Progress Energy, Inc., 3.15%, 4/01/22 | | | 3,893,000 | | | | 3,823,058 | |
| PSEG Power LLC, 5.32%, 9/15/16 | | | 2,617,000 | | | | 2,688,766 | |
| Waterford 3 Funding Corp., 8.09%, 1/02/17 | | | 912,343 | | | | 910,170 | |
| | | | | | | | |
| | | | | | $ | 20,742,927 | |
| | | | | | | | |
Total Bonds
(Identified Cost, $1,013,098,763) | | | $ | 1,038,239,330 | |
| | | | | | | | |
| |
| PREFERRED STOCKS – 0.1% | | | | | |
| Telephone Services – 0.1% | | | | | |
| Telecom Italia S.p.A. (Identified Cost, $1,591,071) | | | 2,333,912 | | | $ | 2,387,186 | |
| | | | | | | | |
|
| CONVERTIBLE PREFERRED STOCKS – 0.6% | |
| Food & Beverages – 0.3% | | | | | |
| Tyson Foods, Inc., 4.75% | | | 118,300 | | | $ | 7,178,444 | |
| | | | | | | | |
| Pharmaceuticals – 0.1% | | | | | |
| Allergan PLC, 5.5% | | | 2,491 | | | $ | 2,566,178 | |
| | | | | | | | |
| Telephone Services – 0.1% | | | | | |
| Frontier Communications Corp., 11.13% | | | 16,591 | | | $ | 1,519,404 | |
| | | | | | | | |
| Utilities – Electric Power – 0.1% | | | | | |
| Exelon Corp., 6.5% | | | 110,678 | | | $ | 4,479,139 | |
| | | | | | | | |
Total Convertible Preferred Stocks
(Identified Cost, $15,497,831) | | | $ | 15,743,165 | |
| | | | | | | | |
15
MFS Total Return Series
Portfolio of Investments – continued
| | | | | | | | |
| Issuer | | Shares/Par | | | Value ($) | |
| MONEY MARKET FUNDS – 1.6% | | | | | |
| MFS Institutional Money Market Portfolio, 0.19%, at Cost and Net Asset Value (v) | | | 42,384,515 | | | $ | 42,384,515 | |
| | | | | | | | |
|
| COLLATERAL FOR SECURITIES LOANED – 0.1% | |
| Navigator Securities Lending Prime Portfolio, 0.32%, at Cost and Net Asset Value (j) | | | 2,428,338 | | | $ | 2,428,338 | |
| | | | | | | | |
Total Investments
(Identified Cost, $2,275,201,070) | | | $ | 2,624,244,488 | |
| | | | | | | | |
OTHER ASSETS, LESS
LIABILITIES – (0.4)% | | | | (9,377,083 | ) |
| | | | | | | | |
| NET ASSETS – 100.0% | | | $ | 2,614,867,405 | |
| | | | | | | | |
| (a) | | Non-income producing security. |
| (i) | | Interest only security for which the fund receives interest on notional principal (Par amount). Par amount shown is the notional principal and does not reflect the cost of the security. |
| (j) | | The rate quoted is the annualized seven-day yield of the fund at period end. |
| (l) | | A portion of this security is on loan. |
| (n) | | Securities exempt from registration under Rule 144A of the Securities Act of 1933. These securities may be sold in the ordinary course of business in transactions exempt from registration, normally to qualified institutional buyers. At period end, the aggregate value of these securities was $63,988,939, representing 2.4% of net assets. |
| (v) | | Underlying affiliated fund that is available only to investment companies managed by MFS. The rate quoted for the MFS Institutional Money Market Portfolio is the annualized seven-day yield of the fund at period end. |
| (z) | | Restricted securities are not registered under the Securities Act of 1933 and are subject to legal restrictions on resale. These securities generally may be resold in transactions exempt from registration or to the public if the securities are subsequently registered. Disposal of these securities may involve time-consuming negotiations and prompt sale at an acceptable price may be difficult. The fund holds the following restricted securities: |
| | | | | | | | | | |
| Restricted Securities | | Acquisition
Date | | Cost | | | Value | |
| Bayview Financial Revolving Mortgage Loan Trust, FRN, 1.832%, 12/28/40 | | 3/01/06 | | | $2,707,166 | | | | $1,981,709 | |
| BlackRock Capital Finance LP, 7.75%, 9/25/26 | | 8/16/13 | | | 57,730 | | | | 13,643 | |
| Cent LP, 2013-17A, “A1”, CLO, FRN, 1.621%, 1/30/25 | | 9/26/14 | | | 2,532,938 | | | | 2,522,786 | |
| Dryden Senior Loan Fund, 2013-26A, “A”, CLO, FRN, 1.42%, 7/15/25 | | 9/26/14 | | | 3,230,245 | | | | 3,210,129 | |
| ING Investment Management Ltd., 2013-2A, “A1”, CLO, FRN, 1.469%, 4/25/25 | | 9/26/14 | | | 2,939,406 | | | | 2,920,113 | |
| Imperial Tobacco Finance PLC, 2.95%, 7/21/20 | | 7/15/15 | | | 2,492,991 | | | | 2,523,731 | |
| State Grid Overseas Investment (2014) Ltd., 2.75%, 5/07/19 | | 4/28/14 | | | 2,574,602 | | | | 2,618,055 | |
| Total Restricted Securities | | | | | | | | | $15,790,166 | |
| % of Net assets | | | | | | | | | 0.6% | |
The following abbreviations are used in this report and are defined:
| ADR | | American Depositary Receipt |
| CLO | | Collateralized Loan Obligation |
| FRN | | Floating Rate Note. Interest rate resets periodically and the current rate may not be the rate reported at period end. |
| PLC | | Public Limited Company |
| REIT | | Real Estate Investment Trust |
See Notes to Financial Statements
16
MFS Total Return Series
FINANCIAL STATEMENTS | STATEMENT OF ASSETS AND LIABILITIES
This statement represents your fund’s balance sheet, which details the assets and liabilities comprising the total value of the fund.
| | | | | | | | |
At 12/31/15 | | | | | | | | |
Assets | | | | | | | | |
Investments | | | | | | | | |
Non-affiliated issuers, at value (identified cost, $2,232,816,555) | | | $2,581,859,973 | | | | | |
Underlying affiliated funds, at cost and value | | | 42,384,515 | | | | | |
Total investments, at value, including $2,672,229 of securities on loan (identified cost, $2,275,201,070) | | | $2,624,244,488 | | | | | |
Cash | | | 19,133 | | | | | |
Receivables for | | | | | | | | |
Investments sold | | | 5,444,981 | | | | | |
Fund shares sold | | | 175,595 | | | | | |
Interest and dividends | | | 9,887,805 | | | | | |
Other assets | | | 15,369 | | | | | |
Total assets | | | | | | | $2,639,787,371 | |
Liabilities | | | | | | | | |
Payables for | | | | | | | | |
Investments purchased | | | $2,278,685 | | | | | |
TBA purchase commitments | | | 17,632,710 | | | | | |
Fund shares reacquired | | | 2,304,266 | | | | | |
Collateral for securities loaned, at value (c) | | | 2,428,338 | | | | | |
Payable to affiliates | | | | | | | | |
Investment adviser | | | 8,231 | | | | | |
Shareholder servicing costs | | | 784 | | | | | |
Distribution and/or service fees | | | 16,443 | | | | | |
Payable for independent Trustees’ compensation | | | 17 | | | | | |
Accrued expenses and other liabilities | | | 250,492 | | | | | |
Total liabilities | | | | | | | $24,919,966 | |
Net assets | | | | | | | $2,614,867,405 | |
Net assets consist of | | | | | | | | |
Paid-in capital | | | $2,126,207,345 | | | | | |
Unrealized appreciation (depreciation) on investments and translation of assets and liabilities in foreign currencies | | | 349,012,695 | | | | | |
Accumulated net realized gain (loss) on investments and foreign currency | | | 66,155,965 | | | | | |
Undistributed net investment income | | | 73,491,400 | | | | | |
Net assets | | | | | | | $2,614,867,405 | |
Shares of beneficial interest outstanding | | | | | | | 116,497,786 | |
| | | | | | | | | | | | |
| | | Net assets | | | Shares
outstanding | | | Net asset value
per share | |
Initial Class | | | $1,423,284,375 | | | | 62,964,174 | | | | $22.60 | |
Service Class | | | 1,191,583,030 | | | | 53,533,612 | | | | 22.26 | |
| (c) | Non-cash collateral is not included. |
See Notes to Financial Statements
17
MFS Total Return Series
FINANCIAL STATEMENTS | STATEMENT OF OPERATIONS
This statement describes how much your fund earned in investment income and accrued in expenses. It also describes any gains and/or losses generated by fund operations.
| | | | | | | | |
Year ended 12/31/15 | | | | | | | | |
Net investment income | | | | | |
Income | | | | | | | | |
Dividends | | | $56,172,061 | | | | | |
Interest | | | 36,242,094 | | | | | |
Dividends from underlying affiliated funds | | | 77,727 | | | | | |
Foreign taxes withheld | | | (461,820 | ) | | | | |
Total investment income | | | | | | | $92,030,062 | |
Expenses | | | | | | | | |
Management fee | | | $21,422,916 | | | | | |
Distribution and/or service fees | | | 3,254,496 | | | | | |
Shareholder servicing costs | | | 86,178 | | | | | |
Administrative services fee | | | 456,309 | | | | | |
Independent Trustees’ compensation | | | 45,049 | | | | | |
Custodian fee | | | 178,649 | | | | | |
Shareholder communications | | | 161,948 | | | | | |
Audit and tax fees | | | 72,571 | | | | | |
Legal fees | | | 21,960 | | | | | |
Miscellaneous | | | 70,524 | | | | | |
Total expenses | | | | | | | $25,770,600 | |
Fees paid indirectly | | | (192 | ) | | | | |
Reduction of expenses by investment adviser | | | (3,938,882 | ) | | | | |
Net expenses | | | | | | | $21,831,526 | |
Net investment income | | | | | | | $70,198,536 | |
Realized and unrealized gain (loss) on investments and foreign currency | | | | | | | | |
Realized gain (loss) (identified cost basis) | | | | | | | | |
Investments | | | $86,023,154 | | | | | |
Foreign currency | | | (157,744 | ) | | | | |
Net realized gain (loss) on investments and foreign currency | | | | | | | $85,865,410 | |
Change in unrealized appreciation (depreciation) | | | | | | | | |
Investments | | | $(165,415,878 | ) | | | | |
Foreign currency | | | 1,763 | | | | | |
Net unrealized gain (loss) on investments and foreign currency translation | | | | | | | $(165,414,115 | ) |
Net realized and unrealized gain (loss) on investments and foreign currency | | | | | | | $(79,548,705 | ) |
Change in net assets from operations | | | | | | | $(9,350,169 | ) |
See Notes to Financial Statements
18
MFS Total Return Series
FINANCIAL STATEMENTS | STATEMENTS OF CHANGES IN NET ASSETS
These statements describe the increases and/or decreases in net assets resulting from operations, any distributions, and any shareholder transactions.
| | | | | | | | |
For years ended 12/31 | | | 2015 | | | | 2014 | |
Change in net assets | | | | | | | | |
From operations | | | | | | | | |
Net investment income | | | $70,198,536 | | | | $66,079,926 | |
Net realized gain (loss) on investments and foreign currency | | | 85,865,410 | | | | 110,064,895 | |
Net unrealized gain (loss) on investments and foreign currency translation | | | (165,414,115 | ) | | | 73,400,691 | |
Change in net assets from operations | | | $(9,350,169 | ) | | | $249,545,512 | |
Distributions declared to shareholders | | | | | | | | |
From net investment income | | | $(70,334,733 | ) | | | $(55,137,325 | ) |
From net realized gain on investments | | | (104,926,629 | ) | | | (80,306,738 | ) |
Total distributions declared to shareholders | | | $(175,261,362 | ) | | | $(135,444,063 | ) |
Change in net assets from fund share transactions | | | $(233,477,805 | ) | | | $(300,150,149 | ) |
Total change in net assets | | | $(418,089,336 | ) | | | $(186,048,700 | ) |
Net assets | | | | | | | | |
At beginning of period | | | 3,032,956,741 | | | | 3,219,005,441 | |
At end of period (including undistributed net investment income of $73,491,400 and
$70,392,959, respectively) | | | $2,614,867,405 | | | | $3,032,956,741 | |
See Notes to Financial Statements
19
MFS Total Return Series
FINANCIAL STATEMENTS | FINANCIAL HIGHLIGHTS
The financial highlights table is intended to help you understand the fund’s financial performance for the past 5 years. Certain information reflects financial results for a single fund share. The total returns in the table represent the rate by which an investor would have earned (or lost) on an investment in the fund share class (assuming reinvestment of all distributions) held for the entire period.
| | | | | | | | | | | | | | | | | | | | |
| Initial Class | | Years ended 12/31 | |
| | | 2015 | | | 2014 | | | 2013 | | | 2012 | | | 2011 | |
Net asset value, beginning of period | | | $24.31 | | | | $23.44 | | | | $20.05 | | | | $18.53 | | | | $18.71 | |
| Income (loss) from investment operations | | | | | | | | | | | | | | | | | | | | |
Net investment income (d) | | | $0.62 | | | | $0.54 | | | | $0.45 | | | | $0.44 | | | | $0.44 | |
Net realized and unrealized gain (loss) on investments
and foreign currency | | | (0.77 | ) | | | 1.43 | | | | 3.34 | | | | 1.63 | | | | (0.12 | ) |
Total from investment operations | | | $(0.15 | ) | | | $1.97 | | | | $3.79 | | | | $2.07 | | | | $0.32 | |
| Less distributions declared to shareholders | | | | | | | | | | | | | | | | | | | | |
From net investment income | | | $(0.64 | ) | | | $(0.46 | ) | | | $(0.40 | ) | | | $(0.55 | ) | | | $(0.50 | ) |
From net realized gain on investments | | | (0.92 | ) | | | (0.64 | ) | | | — | | | | — | | | | — | |
Total distributions declared to shareholders | | | $(1.56 | ) | | | $(1.10 | ) | | | $(0.40 | ) | | | $(0.55 | ) | | | $(0.50 | ) |
Net asset value, end of period (x) | | | $22.60 | | | | $24.31 | | | | $23.44 | | | | $20.05 | | | | $18.53 | |
Total return (%) (k)(r)(s)(x) | | | (0.37 | ) | | | 8.50 | | | | 19.05 | | | | 11.26 | | | | 1.77 | |
Ratios (%) (to average net assets)
and Supplemental data: | | | | | | | | | | | | | | | | | | | | |
Expenses before expense reductions (f) | | | 0.79 | | | | 0.78 | | | | 0.79 | | | | 0.80 | | | | 0.81 | |
Expenses after expense reductions (f) | | | 0.65 | | | | 0.67 | | | | 0.73 | | | | 0.77 | | | | 0.78 | |
Net investment income | | | 2.57 | | | | 2.24 | | | | 2.05 | | | | 2.26 | | | | 2.36 | |
Portfolio turnover | | | 41 | | | | 32 | | | | 53 | | | | 22 | | | | 19 | |
Net assets at end of period (000 omitted) | | | $1,423,284 | | | | $1,662,709 | | | | $1,826,378 | | | | $1,440,525 | | | | $1,574,503 | |
See Notes to Financial Statements
20
MFS Total Return Series
Financial Highlights – continued
| | | | | | | | | | | | | | | | | | | | |
| Service Class | | Years ended 12/31 | |
| | | 2015 | | | 2014 | | | 2013 | | | 2012 | | | 2011 | |
Net asset value, beginning of period | | | $23.95 | | | | $23.12 | | | | $19.80 | | | | $18.31 | | | | $18.48 | |
| Income (loss) from investment operations | | | | | | | | | | | | | | | | | | | | |
Net investment income (d) | | | $0.55 | | | | $0.47 | | | | $0.39 | | | | $0.39 | | | | $0.39 | |
Net realized and unrealized gain (loss) on investments
and foreign currency | | | (0.74 | ) | | | 1.41 | | | | 3.29 | | | | 1.60 | | | | (0.11 | ) |
Total from investment operations | | | $(0.19 | ) | | | $1.88 | | | | $3.68 | | | | $1.99 | | | | $0.28 | |
| Less distributions declared to shareholders | | | | | | | | | | | | | | | | | | | | |
From net investment income | | | $(0.58 | ) | | | $(0.41 | ) | | | $(0.36 | ) | | | $(0.50 | ) | | | $(0.45 | ) |
From net realized gain on investments | | | (0.92 | ) | | | (0.64 | ) | | | — | | | | — | | | | — | |
Total distributions declared to shareholders | | | $(1.50 | ) | | | $(1.05 | ) | | | $(0.36 | ) | | | $(0.50 | ) | | | $(0.45 | ) |
Net asset value, end of period (x) | | | $22.26 | | | | $23.95 | | | | $23.12 | | | | $19.80 | | | | $18.31 | |
Total return (%) (k)(r)(s)(x) | | | (0.58 | ) | | | 8.24 | | | | 18.74 | | | | 10.93 | | | | 1.58 | |
Ratios (%) (to average net assets)
and Supplemental data: | | | | | | | | | | | | | | | | | | | | |
Expenses before expense reductions (f) | | | 1.04 | | | | 1.03 | | | | 1.04 | | | | 1.05 | | | | 1.06 | |
Expenses after expense reductions (f) | | | 0.90 | | | | 0.92 | | | | 0.98 | | | | 1.02 | | | | 1.03 | |
Net investment income | | | 2.32 | | | | 1.98 | | | | 1.80 | | | | 2.02 | | | | 2.11 | |
Portfolio turnover | | | 41 | | | | 32 | | | | 53 | | | | 22 | | | | 19 | |
Net assets at end of period (000 omitted) | | | $1,191,583 | | | | $1,370,248 | | | | $1,392,627 | | | | $872,739 | | | | $859,243 | |
| (d) | Per share data is based on average shares outstanding. |
| (f) | Ratios do not reflect reductions from fees paid indirectly, if applicable. |
| (k) | The total return does not reflect expenses that apply to separate accounts. Inclusion of these charges would reduce the total return figures for all periods shown. |
| (r) | Certain expenses have been reduced without which performance would have been lower. |
| (s) | From time to time the fund may receive proceeds from litigation settlements, without which performance would be lower. |
| (x) | The net asset values and total returns have been calculated on net assets which include adjustments made in accordance with U.S. generally accepted accounting principles required at period end for financial reporting purposes. |
See Notes to Financial Statements
21
MFS Total Return Series
NOTES TO FINANCIAL STATEMENTS
| (1) | | Business and Organization |
MFS Total Return Series (the fund) is a diversified series of MFS Variable Insurance Trust (the trust). The trust is organized as a Massachusetts business trust and is registered under the Investment Company Act of 1940, as amended, as an open-end management investment company. The shareholders of each series of the trust are separate accounts of insurance companies, which offer variable annuity and/or life insurance products, and qualified retirement and pension plans.
The fund is an investment company and accordingly follows the investment company accounting and reporting guidance of the Financial Accounting Standards Board (FASB) Accounting Standards Codification Topic 946 Financial Services – Investment Companies.
| (2) | | Significant Accounting Policies |
General – The preparation of financial statements in conformity with U.S. generally accepted accounting principles requires management to make estimates and assumptions that affect the reported amounts of assets and liabilities, and disclosure of contingent assets and liabilities at the date of the financial statements and the reported amounts of increases and decreases in net assets from operations during the reporting period. Actual results could differ from those estimates. In the preparation of these financial statements, management has evaluated subsequent events occurring after the date of the fund’s Statement of Assets and Liabilities through the date that the financial statements were issued.
In January 2016, FASB issued Accounting Standards Update 2016-01, Financial Instruments – Overall (Subtopic 825-10) – Recognition and Measurement of Financial Assets and Financial Liabilities (“ASU 2016-01”) which would first be effective for annual reporting periods beginning after December 15, 2017, and interim periods therein. ASU 2016-01, which changes the accounting for equity investments and for certain financial liabilities, also modifies the presentation and disclosure requirements for financial instruments. Investment companies are specifically exempted from ASU 2016-01’s equity investment accounting provisions and will continue to follow the industry specific guidance for investment accounting under ASC 946. Although still evaluating the potential impacts of ASU 2016-01 to the fund, management expects that the impact of the fund’s adoption will be limited to additional financial statement disclosures.
Balance Sheet Offsetting – The fund’s accounting policy with respect to balance sheet offsetting is that, absent an event of default by the counterparty or a termination of the agreement, the International Swaps and Derivatives Association (ISDA) Master Agreement does not result in an offset of reported amounts of financial assets and financial liabilities in the Statement of Assets and Liabilities across transactions between the fund and the applicable counterparty. The fund’s right to setoff may be restricted or prohibited by the bankruptcy or insolvency laws of the particular jurisdiction to which a specific master netting agreement counterparty is subject. Balance sheet offsetting disclosures, to the extent applicable to the fund, have been included in the fund’s Significant Accounting Policies note under the captions for each of the fund’s in-scope financial instruments and transactions.
Investment Valuations – Equity securities, including restricted equity securities, are generally valued at the last sale or official closing price on their primary market or exchange as provided by a third-party pricing service. Equity securities, for which there were no sales reported that day, are generally valued at the last quoted daily bid quotation on their primary market or exchange as provided by a third-party pricing service. Debt instruments and floating rate loans, including restricted debt instruments, are generally valued at an evaluated or composite bid as provided by a third-party pricing service. Short-term instruments with a maturity at issuance of 60 days or less may be valued at amortized cost, which approximates market value. Open-end investment companies are generally valued at net asset value per share. Securities and other assets generally valued on the basis of information from a third-party pricing service may also be valued at a broker/dealer bid quotation. Values obtained from third-party pricing services can utilize both transaction data and market information such as yield, quality, coupon rate, maturity, type of issue, trading characteristics, and other market data. The values of foreign securities and other assets and liabilities expressed in foreign currencies are converted to U.S. dollars using the mean of bid and asked prices for rates provided by a third-party pricing service.
The Board of Trustees has delegated primary responsibility for determining or causing to be determined the value of the fund’s investments (including any fair valuation) to the adviser pursuant to valuation policies and procedures approved by the Board. If the adviser determines that reliable market quotations are not readily available, investments are valued at fair value as determined in good faith by the adviser in accordance with such procedures under the oversight of the Board of Trustees. Under the fund’s valuation policies and procedures, market quotations are not considered to be readily available for most types of debt instruments and floating rate loans and many types of derivatives. These investments are generally valued at fair value based on information from third-party pricing services. In addition, investments may be valued at fair value if the adviser determines that an investment’s value has been materially affected by events occurring after the close of the exchange or market on which the investment is principally traded (such as foreign exchange or market) and prior to the determination of the fund’s net asset value, or after the halting of trading of a specific security where trading does not resume prior to the close of the exchange or market on which the security is principally traded. Events that occur on a frequent basis after foreign markets close (such as developments in foreign markets and significant movements in the U.S. markets) and prior to the determination of the fund’s net asset value may be deemed to have a
22
MFS Total Return Series
Notes to Financial Statements – continued
material effect on the value of securities traded in foreign markets. Accordingly, the fund’s foreign equity securities may often be valued at fair value. The adviser generally relies on third-party pricing services or other information (such as the correlation with price movements of similar securities in the same or other markets; the type, cost and investment characteristics of the security; the business and financial condition of the issuer; and trading and other market data) to assist in determining whether to fair value and at what value to fair value an investment. The value of an investment for purposes of calculating the fund’s net asset value can differ depending on the source and method used to determine value. When fair valuation is used, the value of an investment used to determine the fund’s net asset value may differ from quoted or published prices for the same investment. There can be no assurance that the fund could obtain the fair value assigned to an investment if it were to sell the investment at the same time at which the fund determines its net asset value per share.
Various inputs are used in determining the value of the fund’s assets or liabilities. These inputs are categorized into three broad levels. In certain cases, the inputs used to measure fair value may fall into different levels of the fair value hierarchy. In such cases, an investment’s level within the fair value hierarchy is based on the lowest level of input that is significant to the fair value measurement. The fund’s assessment of the significance of a particular input to the fair value measurement in its entirety requires judgment, and considers factors specific to the investment. Level 1 includes unadjusted quoted prices in active markets for identical assets or liabilities. Level 2 includes other significant observable market-based inputs (including quoted prices for similar securities, interest rates, prepayment speed, and credit risk). Level 3 includes unobservable inputs, which may include the adviser’s own assumptions in determining the fair value of investments. The following is a summary of the levels used as of December 31, 2015 in valuing the fund’s assets or liabilities:
| | | | | | | | | | | | | | | | |
| Investments at Value | | Level 1 | | | Level 2 | | | Level 3 | | | Total | |
| Equity Securities: | | | | | | | | | | | | | | | | |
United States | | | $1,410,732,270 | | | | $— | | | | $— | | | | $1,410,732,270 | |
United Kingdom | | | 7,504,421 | | | | 23,241,700 | | | | — | | | | 30,746,121 | |
Switzerland | | | — | | | | 26,303,435 | | | | — | | | | 26,303,435 | |
Canada | | | 12,884,098 | | | | — | | | | — | | | | 12,884,098 | |
Japan | | | — | | | | 12,794,004 | | | | — | | | | 12,794,004 | |
France | | | — | | | | 10,518,885 | | | | — | | | | 10,518,885 | |
South Korea | | | — | | | | 9,522,229 | | | | — | | | | 9,522,229 | |
Taiwan | | | 6,993,919 | | | | — | | | | — | | | | 6,993,919 | |
Australia | | | — | | | | 3,167,409 | | | | — | | | | 3,167,409 | |
| Other Countries | | | 5,339,075 | | | | 12,190,860 | | | | — | | | | 17,529,935 | |
| U.S. Treasury Bonds & U.S. Government Agency & Equivalents | | | — | | | | 328,547,163 | | | | — | | | | 328,547,163 | |
| Non-U.S. Soverign Debt | | | — | | | | 28,073,719 | | | | — | | | | 28,073,719 | |
| U.S. Corporate Bonds | | | — | | | | 229,634,306 | | | | — | | | | 229,634,306 | |
| Residential Mortgage-Backed Securities | | | — | | | | 321,064,031 | | | | — | | | | 321,064,031 | |
| Comercial Mortgage-Backed Securities | | | — | | | | 46,591,633 | | | | — | | | | 46,591,633 | |
| Asset-Backed Securities (including CDOs) | | | — | | | | 13,846,881 | | | | — | | | | 13,846,881 | |
| Foreign Bonds | | | — | | | | 70,481,597 | | | | — | | | | 70,481,597 | |
| Mutual Funds | | | 44,812,853 | | | | — | | | | — | | | | 44,812,853 | |
| Total Investments | | | $1,488,266,636 | | | | $1,135,977,852 | | | | $— | | | | $2,624,244,488 | |
For further information regarding security characteristics, see the Portfolio of Investments.
Of the level 2 investments presented above, equity investments amounting to $3,026,754 would have been considered level 1 investments at the beginning of the period. Of the level 1 investments presented above, equity investments amounting to $3,034,964 would have been considered level 2 investments at the beginning of the period. The primary reason for changes in the classifications between levels 1 and 2 occurs when foreign equity securities are fair valued using other observable market-based inputs in place of the closing exchange price due to events occurring after the close of the exchange or market on which the investment is principally traded. The fund’s foreign equity securities may often be valued at fair value.
Foreign Currency Translation – Purchases and sales of foreign investments, income, and expenses are converted into U.S. dollars based upon currency exchange rates prevailing on the respective dates of such transactions or on the reporting date for foreign denominated receivables and payables. Gains and losses attributable to foreign currency exchange rates on sales of securities are recorded for financial statement purposes as net realized gains and losses on investments. Gains and losses attributable to foreign exchange rate movements on receivables, payables, income and expenses are recorded for financial statement purposes as foreign currency transaction gains and losses. That portion of both realized and unrealized gains and losses on investments that results from fluctuations in foreign currency exchange rates is not separately disclosed.
23
MFS Total Return Series
Notes to Financial Statements – continued
Security Loans – Under its Securities Lending Agency Agreement with the fund, State Street Bank and Trust Company (“State Street”), as lending agent, loans the securities of the fund to certain qualified institutions (the “Borrowers”) approved by the fund. Security loans can be terminated at the discretion of either the lending agent or the fund and the related securities must be returned within the earlier of the standard trade settlement period for such securities or within three business days. The loans are collateralized by cash and/or U.S. Treasury and federal agency obligations in an amount typically at least equal to the market value of the securities loaned. On loans collateralized by cash, the cash collateral is invested in a money market fund. The market value of the loaned securities is determined at the close of business of the fund and any additional required collateral is delivered to the fund on the next business day. State Street provides the fund with indemnification against Borrower default. In the event of Borrower default, State Street will, for the benefit of the fund, either purchase securities identical to those loaned or, when such purchase is commercially impracticable, pay the fund the market value of the loaned securities. In return, State Street assumes the fund’s rights to the related collateral. If the collateral value is less than the cost to purchase identical securities, State Street is responsible for the shortfall, but only to the extent that such shortfall is not due to a decline in collateral value resulting from collateral reinvestment for which the fund bears the risk of loss. At period end, the fund had investment securities on loan, all of which were classified as equity securities in the fund’s Portfolio of Investments, with a fair value of $2,672,229. The fair value of the fund’s investment securities on loan and a related liability of $2,428,338 for cash collateral received on securities loaned are both presented gross in the Statement of Assets and Liabilities. Additionally, these loans were collateralized by U.S. Treasury Obligations of $346,298. The collateral received on securities loaned exceeded the value of securities on loan at period end. The liability for cash collateral for securities loaned is carried at fair value, which is categorized as level 2 within the fair value hierarchy. A portion of the income generated upon investment of the collateral is remitted to the Borrowers, and the remainder is allocated between the fund and the lending agent. On loans collateralized by U.S. Treasury and/or federal agency obligations, a fee is received from the Borrower, and is allocated between the fund and the lending agent. Income from securities lending is included in “Interest” income in the Statement of Operations. The dividend and interest income earned on the securities loaned is accounted for in the same manner as other dividend and interest income.
Dollar Roll Transactions – The fund enters into dollar roll transactions, with respect to mortgage-backed securities issued by Ginnie Mae, Fannie Mae, and Freddie Mac, in which the fund sells mortgage-backed securities to financial institutions and simultaneously agrees to purchase similar (same issuer, type and coupon) securities at a later date at an agreed-upon price. During the period between the sale and repurchase in a dollar roll transaction the fund will not be entitled to receive interest and principal payments on the securities sold but is compensated by interest earned on the proceeds of the initial sale and by a lower purchase price on the securities to be repurchased which enhances the fund’s total return. The fund accounts for dollar roll transactions as purchases and sales and realizes gains and losses on these transactions.
Indemnifications – Under the fund’s organizational documents, its officers and Trustees may be indemnified against certain liabilities and expenses arising out of the performance of their duties to the fund. Additionally, in the normal course of business, the fund enters into agreements with service providers that may contain indemnification clauses. The fund’s maximum exposure under these agreements is unknown as this would involve future claims that may be made against the fund that have not yet occurred.
Investment Transactions and Income – Investment transactions are recorded on the trade date. Interest income is recorded on the accrual basis. All premium and discount is amortized or accreted for financial statement purposes in accordance with U.S. generally accepted accounting principles. Dividends received in cash are recorded on the ex-dividend date. Certain dividends from foreign securities will be recorded when the fund is informed of the dividend if such information is obtained subsequent to the ex-dividend date. Dividend and interest payments received in additional securities are recorded on the ex-dividend or ex-interest date in an amount equal to the value of the security on such date.
The fund may receive proceeds from litigation settlements. Any proceeds received from litigation involving portfolio holdings are reflected in the Statement of Operations in realized gain/loss if the security has been disposed of by the fund or in unrealized gain/loss if the security is still held by the fund. Any other proceeds from litigation not related to portfolio holdings are reflected as other income in the Statement of Operations.
The fund invests a significant portion of its assets in asset-backed and/or mortgage-backed securities. The value of these securities may depend, in part, on the issuer’s or borrower’s credit quality or ability to pay principal and interest when due and that value may fall if an issuer or borrower defaults on its obligation to pay principal or interest or if the instrument’s credit rating is downgraded by a credit rating agency. U.S. Government securities not supported as to the payment of principal or interest by the U.S. Treasury, such as those issued by Fannie Mae, Freddie Mac, and the Federal Home Loan Banks, are subject to greater credit risk than are U.S. Government securities supported by the U.S. Treasury, such as those issued by Ginnie Mae.
The fund purchased or sold debt securities on a when-issued or delayed delivery basis, or in a “To Be Announced” (TBA) or “forward commitment” transaction with delivery or payment to occur at a later date beyond the normal settlement period. At the time a fund enters into a commitment to purchase or sell a security, the transaction is recorded and the value of the security acquired is reflected in the fund’s net asset value. The price of such security and the date that the security will be delivered and paid for are fixed at the
24
MFS Total Return Series
Notes to Financial Statements – continued
time the transaction is negotiated. The value of the security may vary with market fluctuations. TBA securities resulting from these transactions are included in the Portfolio of Investments. TBA purchase commitments are held at carrying amount, which approximates fair value and are categorized as level 2 within the fair value hierarchy. No interest accrues to the fund until payment takes place. At the time that a fund enters into this type of transaction, the fund is required to have sufficient cash and/or liquid securities to cover its commitments. Losses may arise due to changes in the value of the underlying securities or if the counterparty does not perform under the contract’s terms, or if the issuer does not issue the securities due to political, economic or other factors. Additionally, losses may arise due to declines in the value of the securities prior to settlement date.
To mitigate this risk of loss on TBA securities and other types of forward settling mortgage-backed securities, the fund whenever possible enters into a Master Securities Forward Transaction Agreement (“MSFTA”) on a bilateral basis with each of the counterparties with whom it undertakes a significant volume of transactions. The MSFTA gives each party to the agreement the right to terminate all transactions traded under such agreement if there is a certain deterioration in the credit quality of the other party. Upon an event of default or a termination of the MSFTA, the non-defaulting party has the right to close out all transactions traded under such agreement and to net amounts owed under each transaction to one net amount payable by one party to the other. This right to close out and net payments across all transactions traded under the MSFTA could result in a reduction of the fund’s credit risk to such counterparty equal to any amounts payable by the fund under the applicable transactions, if any.
For mortgage-backed securities traded under a MSFTA, the collateral and margining requirements are contract specific. Collateral amounts across all transactions traded under such agreement are netted and one amount is posted from one party to the other to collateralize such obligations. Cash that has been pledged to cover the fund’s collateral or margin obligations under a MSFTA, if any, will be reported separately on the Statement of Assets and Liabilities as restricted cash. Securities pledged as collateral or margin for the same purpose, if any, are noted in the Portfolio of Investments.
Fees Paid Indirectly – Prior to October 1, 2015, the fund’s custody fee could be reduced by a credit earned under an arrangement that measured the value of U.S. dollars deposited with the custodian by the fund. The amount of the credit, for the year ended December 31, 2015, is shown as a reduction of total expenses in the Statement of Operations.
Tax Matters and Distributions – The fund intends to qualify as a regulated investment company, as defined under Subchapter M of the Internal Revenue Code, and to distribute all of its taxable income, including realized capital gains. As a result, no provision for federal income tax is required. The fund’s federal tax returns, when filed, will remain subject to examination by the Internal Revenue Service for a three year period. Management has analyzed the fund’s tax positions taken on federal and state tax returns for all open tax years and does not believe that there are any uncertain tax positions that require recognition of a tax liability. Foreign taxes, if any, have been accrued by the fund in the accompanying financial statements in accordance with the applicable foreign tax law. Foreign income taxes may be withheld by certain countries in which the fund invests. Additionally, capital gains realized by the fund on securities issued in or by certain foreign countries may be subject to capital gains tax imposed by those countries.
Distributions to shareholders are recorded on the ex-dividend date. Income and capital gain distributions are determined in accordance with income tax regulations, which may differ from U.S. generally accepted accounting principles. Certain capital accounts in the financial statements are periodically adjusted for permanent differences in order to reflect their tax character. These adjustments have no impact on net assets or net asset value per share. Temporary differences which arise from recognizing certain items of income, expense, gain or loss in different periods for financial statement and tax purposes will reverse at some time in the future. Distributions in excess of net investment income or net realized gains are temporary overdistributions for financial statement purposes resulting from differences in the recognition or classification of income or distributions for financial statement and tax purposes.
Book/tax differences primarily relate to amortization and accretion of debt securities and wash sale loss deferrals.
The tax character of distributions declared to shareholders for the last two fiscal years is as follows:
| | | | | | | | |
| | | 12/31/15 | | | 12/31/14 | |
| Ordinary income (including any short-term capital gains) | | | $91,290,015 | | | | $55,137,325 | |
| Long-term capital gains | | | 83,971,347 | | | | 80,306,738 | |
| Total distributions | | | $175,261,362 | | | | $135,444,063 | |
25
MFS Total Return Series
Notes to Financial Statements – continued
The federal tax cost and the tax basis components of distributable earnings were as follows:
| | | | |
| As of 12/31/15 | | | | |
| Cost of investments | | | $2,294,607,190 | |
| Gross appreciation | | | 398,566,903 | |
| Gross depreciation | | | (68,929,605 | ) |
| Net unrealized appreciation (depreciation) | | | $329,637,298 | |
| Undistributed ordinary income | | | 73,491,400 | |
| Undistributed long-term capital gain | | | 85,562,085 | |
| Other temporary differences | | | (30,723 | ) |
Multiple Classes of Shares of Beneficial Interest – The fund offers multiple classes of shares, which differ in their respective distribution and/or service fees. The fund’s income, realized and unrealized gain (loss), and common expenses are allocated to shareholders based on the daily net assets of each class. Dividends are declared separately for each class. Differences in per share dividend rates are generally due to differences in separate class expenses. The fund’s distributions declared to shareholders as reported in the Statements of Changes in Net Assets are presented by class as follows:
| | | | | | | | | | | | | | | | |
| | | From net investment
income | | | From net realized gain on
investments | |
| | | Year ended
12/31/15 | | | Year ended
12/31/14 | | | Year ended
12/31/15 | | | Year ended
12/31/14 | |
| Initial Class | | | $39,788,464 | | | | $32,030,776 | | | | $56,600,918 | | | | $44,581,217 | |
| Service Class | | | 30,546,269 | | | | 23,106,549 | | | | 48,325,711 | | | | 35,725,521 | |
| Total | | | $70,334,733 | | | | $55,137,325 | | | | $104,926,629 | | | | $80,306,738 | |
| (3) | | Transactions with Affiliates |
Investment Adviser – The fund has an investment advisory agreement with MFS to provide overall investment management and related administrative services and facilities to the fund. The management fee is computed daily and paid monthly at the following annual rates:
| | | | |
| First $3 billion of average daily net assets | | | 0.75% | |
| Next $2 billion of average daily net assets | | | 0.65% | |
| Average daily net assets in excess of $5 billion | | | 0.50% | |
The investment adviser agreed in writing to reduce its management fee to 0.70% of average daily net assets for the first $1 billion, 0.65% of average daily net assets in excess of $1 billion up to $2.5 billion, and 0.60% of average daily net assets in excess of $2.5 billion up to $5 billion. This written agreement will terminate on April 28, 2016. For the year ended December 31, 2015, this management fee reduction amounted to $2,529,999 which is included in the reduction of total expenses in the Statement of Operations. MFS has also agreed in writing to reduce its management fee by a specified amount if certain MFS mutual fund assets exceed thresholds agreed to by MFS and the fund’s Board of Trustees. For the year ended December 31, 2015, this management fee reduction amounted to $198,250, which is included in the reduction of total expenses in the Statement of Operations. The management fee incurred for the year ended December 31, 2015 was equivalent to an annual effective rate of 0.65% of the fund’s average daily net assets.
Effective April 29, 2016, the management fee will be computed daily and paid monthly at the following annual rates:
| | | | |
| First $1 billion of average daily net assets | | | 0.70% | |
| Next $1.5 billion of average daily net assets | | | 0.65% | |
| Next $2.5 billion of average daily net assets | | | 0.60% | |
| Average daily net assets in excess of $5 billion | | | 0.50% | |
The investment adviser has agreed in writing to pay a portion of the fund’s total annual operating expenses, excluding interest, taxes, extraordinary expenses, brokerage and transaction costs, and investment-related expenses, such that total annual operating expenses do not exceed 0.65% of average daily net assets for the Initial Class shares and 0.90% of average daily net assets for the Service Class shares. This written agreement will continue until modified by the fund’s Board of Trustees, but such agreement will continue at least until April 30, 2017. For the year ended December 31, 2015, this reduction amounted to $1,210,633 and is included in the reduction of total expenses in the Statement of Operations.
Distributor – MFS Fund Distributors, Inc. (MFD), a wholly-owned subsidiary of MFS, is the distributor of shares of the fund. The Trustees have adopted a distribution plan for the Service Class shares pursuant to Rule 12b-1 under the Investment Company Act of 1940.
The fund’s distribution plan provides that the fund will pay MFD distribution and/or service fees equal to 0.25% per annum of its average daily net assets attributable to Service Class shares as partial consideration for services performed and expenses incurred by
26
MFS Total Return Series
Notes to Financial Statements – continued
MFD and financial intermediaries (including participating insurance companies that invest in the fund to fund variable annuity and variable life insurance contracts, sponsors of qualified retirement and pension plans that invest in the fund, and affiliates of these participating insurance companies and plan sponsors) in connection with the sale and distribution of the Service Class shares. MFD may subsequently pay all, or a portion, of the distribution and/or service fees to financial intermediaries.
Shareholder Servicing Agent – MFS Service Center, Inc. (MFSC), a wholly-owned subsidiary of MFS, receives a fee from the fund for its services as shareholder servicing agent. For the year ended December 31, 2015, the fee was $83,545, which equated to 0.0029% annually of the fund’s average daily net assets. MFSC also receives payment from the fund for out-of-pocket expenses paid by MFSC on behalf of the fund. For the year ended December 31, 2015, these costs amounted to $2,633.
Administrator – MFS provides certain financial, legal, shareholder communications, compliance, and other administrative services to the fund. Under an administrative services agreement, the fund reimburses MFS the costs incurred to provide these services. The fund is charged an annual fixed amount of $17,500 plus a fee based on average daily net assets. The administrative services fee incurred for the year ended December 31, 2015 was equivalent to an annual effective rate of 0.0160% of the fund’s average daily net assets.
Trustees’ and Officers’ Compensation – The fund pays compensation to independent Trustees in the form of a retainer, attendance fees, and additional compensation to Board and Committee chairpersons. The fund does not pay compensation directly to Trustees or officers of the fund who are also officers of the investment adviser, all of whom receive remuneration for their services to the fund from MFS. Certain officers and Trustees of the fund are officers or directors of MFS, MFD, and MFSC.
Other – This fund and certain other funds managed by MFS (the funds) have entered into a service agreement (the ISO Agreement) which provides for payment of fees solely by the funds to Tarantino LLC in return for the provision of services of an Independent Senior Officer (ISO) for the funds. Frank L. Tarantino serves as the ISO and is an officer of the funds and the sole member of Tarantino LLC. The funds can terminate the ISO Agreement with Tarantino LLC at any time under the terms of the ISO Agreement. For the year ended December 31, 2015, the fee paid by the fund under this agreement was $9,138 and is included in “Miscellaneous” expense in the Statement of Operations. MFS has agreed to bear all expenses associated with office space, other administrative support, and supplies provided to the ISO.
The fund invests in the MFS Institutional Money Market Portfolio which is managed by MFS and seeks current income consistent with preservation of capital and liquidity. Income earned on this investment is included in “Dividends from underlying affiliated funds” in the Statement of Operations. This money market fund does not pay a management fee to MFS.
For the year ended December 31, 2015, purchases and sales of investments, other than short-term obligations, were as follows:
| | | | | | | | |
| | | Purchases | | | Sales | |
| U.S. Government securities | | | $584,794,789 | | | | $653,163,865 | |
| Investments (non-U.S. Government securities) | | | $558,873,676 | | | | $823,617,251 | |
| (5) | | Shares of Beneficial Interest |
The fund’s Declaration of Trust permits the Trustees to issue an unlimited number of full and fractional shares of beneficial interest. Transactions in fund shares were as follows:
| | | | | | | | | | | | | | | | |
| | | Year ended 12/31/15 | | | Year ended 12/31/14 | |
| | | Shares | | | Amount | | | Shares | | | Amount | |
| Shares sold | | | | | | | | | | | | | | | | |
Initial Class | | | 1,367,391 | | | | $32,496,281 | | | | 1,190,232 | | | | $28,455,634 | |
Service Class | | | 4,224,400 | | | | 99,533,229 | | | | 6,310,222 | | | | 148,779,076 | |
| | | 5,591,791 | | | | $132,029,510 | | | | 7,500,454 | | | | $177,234,710 | |
| Shares issued to shareholders in reinvestment of distributions | | | | | | | | | | | | | | | | |
Initial Class | | | 4,433,734 | | | | $96,389,382 | | | | 3,209,551 | | | | $76,611,993 | |
Service Class | | | 3,680,447 | | | | 78,871,980 | | | | 2,499,238 | | | | 58,832,070 | |
| | | 8,114,181 | | | | $175,261,362 | | | | 5,708,789 | | | | $135,444,063 | |
| Shares reacquired | | | | | | | | | | | | | | | | |
Initial Class | | | (11,241,013 | ) | | | $(269,093,072 | ) | | | (13,912,606 | ) | | | $(333,482,406 | ) |
Service Class | | | (11,583,364 | ) | | | (271,675,605 | ) | | | (11,819,400 | ) | | | (279,346,516 | ) |
| | | (22,824,377 | ) | | | $(540,768,677 | ) | | | (25,732,006 | ) | | | $(612,828,922 | ) |
| Net change | | | | | | | | | | | | | | | | |
Initial Class | | | (5,439,888 | ) | | | $(140,207,409 | ) | | | (9,512,823 | ) | | | $(228,414,779 | ) |
Service Class | | | (3,678,517 | ) | | | (93,270,396 | ) | | | (3,009,940 | ) | | | (71,735,370 | ) |
| | | (9,118,405 | ) | | | $(233,477,805 | ) | | | (12,522,763 | ) | | | $(300,150,149 | ) |
27
MFS Total Return Series
Notes to Financial Statements – continued
The fund and certain other funds managed by MFS participate in a $1.25 billion unsecured committed line of credit, subject to a $1 billion sublimit, provided by a syndication of banks under a credit agreement. Borrowings may be made for temporary financing needs. Interest is charged to each fund, based on its borrowings, generally at a rate equal to the higher of the Overnight Federal Reserve funds rate or daily one month LIBOR plus an agreed upon spread. A commitment fee, based on the average daily, unused portion of the committed line of credit, is allocated among the participating funds at the end of each calendar quarter. In addition, the fund and other funds managed by MFS have established unsecured uncommitted borrowing arrangements with certain banks for temporary financing needs. Interest is charged to each fund, based on its borrowings, at a rate equal to the Overnight Federal Reserve funds rate plus an agreed upon spread. For the year ended December 31, 2015, the fund’s commitment fee and interest expense were $9,633 and $0, respectively, and are included in “Miscellaneous” expense in the Statement of Operations.
| (7) | | Transactions in Underlying Affiliated Funds – Affiliated Issuers |
An affiliated issuer may be considered one in which the fund owns 5% or more of the outstanding voting securities, or a company which is under common control. For the purposes of this report, the fund assumes the following to be an affiliated issuer:
| | | | | | | | | | | | | | | | |
| Underlying Affiliated Fund | | Beginning Shares/Par
Amount | | | Acquisitions Shares/Par
Amount | | | Dispositions Shares/Par
Amount | | | Ending Shares/Par
Amount | |
| MFS Institutional Money Market Portfolio | | | 103,202,623 | | | | 572,882,514 | | | | (633,700,622 | ) | | | 42,384,515 | |
| | | | |
| Underlying Affiliated Fund | | Realized
Gain (Loss) | | | Capital Gain
Distributions | | | Dividend
Income | | | Ending
Value | |
| MFS Institutional Money Market Portfolio | | | $— | | | | $— | | | | $77,727 | | | | $42,384,515 | |
28
MFS Total Return Series
REPORT OF INDEPENDENT REGISTERED PUBLIC ACCOUNTING FIRM
To the Board of Trustees of MFS Variable Insurance Trust and the Shareholders of
MFS Total Return Series:
We have audited the accompanying statement of assets and liabilities, including the portfolio of investments, of MFS Total Return Series (one of the series of MFS Variable Insurance Trust) (the “Fund”) as of December 31, 2015, and the related statement of operations for the year then ended, the statements of changes in net assets for each of the two years in the period then ended, and the financial highlights for each of the five years in the period then ended. These financial statements and financial highlights are the responsibility of the Fund’s management. Our responsibility is to express an opinion on these financial statements and financial highlights based on our audits.
We conducted our audits in accordance with the standards of the Public Company Accounting Oversight Board (United States). Those standards require that we plan and perform the audit to obtain reasonable assurance about whether the financial statements and financial highlights are free of material misstatement. The Fund is not required to have, nor were we engaged to perform, an audit of its internal control over financial reporting. Our audits included consideration of internal control over financial reporting as a basis for designing audit procedures that are appropriate in the circumstances, but not for the purpose of expressing an opinion on the effectiveness of the Fund’s internal control over financial reporting. Accordingly, we express no such opinion. An audit also includes examining, on a test basis, evidence supporting the amounts and disclosures in the financial statements, assessing the accounting principles used and significant estimates made by management, as well as evaluating the overall financial statement presentation. Our procedures included confirmation of securities owned as of December 31, 2015, by correspondence with the custodian and brokers; when replies were not received from brokers, we performed other auditing procedures. We believe that our audits provide a reasonable basis for our opinion.
In our opinion, such financial statements and financial highlights referred to above present fairly, in all material respects, the financial position of MFS Total Return Series as of December 31, 2015, the results of its operations for the year then ended, the changes in its net assets for each of the two years in the period then ended, and the financial highlights for each of the five years in the period then ended, in conformity with accounting principles generally accepted in the United States of America.
DELOITTE & TOUCHE LLP
Boston, Massachusetts
February 16, 2016
29
MFS Total Return Series
TRUSTEES AND OFFICERS – IDENTIFICATION AND BACKGROUND
The Trustees and Officers of the Trust, as of February 1, 2016, are listed below, together with their principal occupations during the past five years. (Their titles may have varied during that period.) The address of each Trustee and Officer is 111 Huntington Avenue, Boston, Massachusetts 02199-7618.
| | | | | | | | |
Name, Age | | Position(s)
Held with Fund | | Trustee/Officer
Since (h) | | Principal Occupations
During the Past Five Years | | Other Directorships (j) |
| INTERESTED TRUSTEES |
Robert J. Manning (k)
(age 52) | | Trustee | | February 2004 | | Massachusetts Financial Services Company, Chairman, Co-Chief Executive Officer and Director | | N/A |
| | | | |
Robin A. Stelmach (k) (age 54) | | Trustee and President | | January 2014 | | Massachusetts Financial Services Company, Executive Vice President and Chief Operating Officer | | N/A |
| | |
| INDEPENDENT TRUSTEES | | | | |
David H. Gunning
(age 73) | | Trustee and Chair of Trustees | | January 2004 | | Private investor | | Lincoln Electric Holdings, Inc., Director; Development Alternatives, Inc., Director/Non-Executive Chairman |
| | | | |
Steven E. Buller (age 64) | | Trustee | | February 2014 | | Chairman, Financial Accounting Standards Advisory Council; Standing Advisory Group, Public Company Accounting Oversight Board, Member (until 2014); BlackRock, Inc. (investment management), Managing Director (until 2014), BlackRock Finco UK (investment management), Director (until 2014) | | N/A |
| | | | |
Robert E. Butler
(age 74) | | Trustee | | January 2006 | | Consultant – investment company industry regulatory and compliance matters | | N/A |
| | | | |
Maureen R. Goldfarb (age 60) | | Trustee | | January 2009 | | Private investor | | N/A |
| | | | |
William R. Gutow
(age 74) | | Trustee | | December 1993 | | Private investor and real estate consultant; Capitol Entertainment Management Company (video franchise), Vice Chairman | | Texas Donuts, Vice Chairman (until 2010) |
| | | | |
Michael Hegarty
(age 71) | | Trustee | | December 2004 | | Private investor | | Rouse Properties Inc., Director; Capmark Financial Group Inc., Director |
| | | | |
John P. Kavanaugh (age 61) | | Trustee | | January 2009 | | Private investor | | N/A |
| | | | |
Maryanne L. Roepke (age 59) | | Trustee | | May 2014 | | American Century Investments (investment management), Senior Vice President and Chief Compliance Officer (until 2014) | | N/A |
| | | | |
Laurie J. Thomsen
(age 58) | | Trustee | | March 2005 | | Private investor | | The Travelers Companies, Director; Dycom Industries, Inc., Director |
| | | | |
Robert W. Uek
(age 74) | | Trustee | | January 2006 | | Consultant to investment company industry | | N/A |
| | | | |
| OFFICERS | | | | | | | | |
Christopher R. Bohane (k)
(age 42) | | Assistant Secretary and Assistant Clerk | | July 2005 | | Massachusetts Financial Services Company, Vice President and Assistant General Counsel | | N/A |
| | | | |
Kino Clark (k) (age 47) | | Assistant Treasurer | | January 2012 | | Massachusetts Financial Services Company, Vice President | | N/A |
| | | | |
Kristin V. Collins (k) (age 42) | | Assistant Secretary and Assistant Clerk | | September 2015 | | Massachusetts Financial Services Company, Vice President and Assistant General Counsel | | N/A |
| | | | |
Thomas H. Connors (k) (age 56) | | Assistant Secretary and Assistant Clerk | | September 2012 | | Massachusetts Financial Services Company, Vice President and Senior Counsel; Deutsche Investment Management Americas Inc. (financial service provider), Director and Senior Counsel (until 2012) | | N/A |
30
MFS Total Return Series
Trustees and Officers – continued
| | | | | | | | |
Name, Age | | Position(s)
Held with Fund | | Trustee/Officer
Since (h) | | Principal Occupations
During the Past Five Years | | Other Directorships (j) |
Ethan D. Corey (k)
(age 52) | | Assistant Secretary and Assistant Clerk | | July 2005 | | Massachusetts Financial Services Company, Senior Vice President and Associate General Counsel | | N/A |
| | | | |
David L. DiLorenzo (k)
(age 47) | | Treasurer | | July 2005 | | Massachusetts Financial Services Company, Senior Vice President | | N/A |
| | | | |
Brian E. Langenfeld (k) (age 42) | | Assistant Secretary and Assistant Clerk | | June 2006 | | Massachusetts Financial Services Company, Vice President and Senior Counsel | | N/A |
| | | | |
Kenneth Paek (k) (age 41) | | Assistant Treasurer | | February 2015 | | Massachusetts Financial Services Company, Vice President; Cohen & Steers, Vice President/Head of Fund Administration (until 2014) | | N/A |
| | | | |
Susan A. Pereira (k)
(age 45) | | Assistant Secretary and Assistant Clerk | | July 2005 | | Massachusetts Financial Services Company, Vice President and Senior Counsel | | N/A |
| | | | |
Kasey L. Phillips (k) (age 45) | | Assistant Treasurer | | September 2012 | | Massachusetts Financial Services Company, Vice President; Wells Fargo Funds Management, LLC, Senior Vice President, Fund Treasurer (until 2012) | | N/A |
| | | | |
Mark N. Polebaum (k)
(age 63) | | Secretary and Clerk | | January 2006 | | Massachusetts Financial Services Company, Executive Vice President, General Counsel and Secretary | | N/A |
| | | | |
Matthew A. Stowe (k) (age 41) | | Assistant Secretary and Assistant Clerk | | October 2014 | | Massachusetts Financial Services Company, Vice President and Assistant General Counsel | | N/A |
| | | | |
Frank L. Tarantino
(age 71) | | Independent Senior Officer | | June 2004 | | Tarantino LLC (provider of compliance services), Principal | | N/A |
| | | | |
Richard S. Weitzel (k)
(age 45) | | Assistant Secretary and Assistant Clerk | | October 2007 | | Massachusetts Financial Services Company, Senior Vice President and Associate General Counsel | | N/A |
| | | | |
Martin J. Wolin (k) (age 48) | | Chief Compliance Officer | | July 2015 | | Massachusetts Financial Services Company, Senior Vice President and Chief Compliance Officer (since July 2015); Mercer (financial service provider), Chief Risk and Compliance Officer, North America and Latin America (until June 2015) | | N/A |
| | | | |
James O. Yost (k)
(age 55) | | Deputy Treasurer | | September 1990 | | Massachusetts Financial Services Company, Senior Vice President | | N/A |
| (h) | Date first appointed to serve as Trustee/officer of an MFS Fund. Each Trustee has served continuously since appointment unless indicated otherwise. For the period from December 15, 2004 until February 22, 2005, Mr. Manning served as Advisory Trustee. Prior to January 2012, Messrs. DiLorenzo and Yost served as Assistant Treasurers of the Funds. Ms. Stelmach was appointed as President of the Funds as of October 1, 2014. |
| (j) | Directorships or trusteeships of companies required to report to the Securities and Exchange Commission (i.e., “public companies”). |
| (k) | “Interested person” of the Trust within the meaning of the Investment Company Act of 1940 (referred to as the 1940 Act), which is the principal federal law governing investment companies like the fund, as a result of a position with MFS. The address of MFS is 111 Huntington Avenue, Boston, Massachusetts 02199-7618. |
Each Trustee (except Ms. Stelmach, Mr. Buller and Ms. Roepke) has been elected by shareholders and each Trustee and officer holds office until his or her successor is chosen and qualified or until his or her earlier death, resignation, retirement or removal. The Trust does not hold annual meetings for the purpose of electing Trustees, and Trustees are not elected for fixed terms. Messrs. Buller, Butler, Kavanaugh, Uek and Ms. Roepke are members of the Trust’s Audit Committee.
Each of the Fund’s Trustees and officers holds comparable positions with certain other funds of which MFS or a subsidiary is the investment adviser or distributor, and, in the case of the officers, with certain affiliates of MFS. As of February 1, 2016, the Trustees served as board members of 137 funds within the MFS Family of Funds.
31
MFS Total Return Series
Trustees and Officers – continued
The Statement of Additional Information for a Fund includes further information about the Trustees and is available without charge upon request by calling 1-800-225-2606.
| | |
Investment Adviser Massachusetts Financial Services Company 111 Huntington Avenue Boston, MA 02199-7618 | | Custodian State Street Bank and Trust Company 1 Lincoln Street Boston, MA 02111-2900 |
Distributor MFS Fund Distributors, Inc. 111 Huntington Avenue Boston, MA 02199-7618 | | Independent Registered Public Accounting Firm Deloitte & Touche LLP 200 Berkeley Street Boston, MA 02116 |
Portfolio Managers Nevin Chitkara William Douglas Steven Gorham Richard Hawkins Joshua Marston Jonathan Sage Brooks Taylor | | |
32
MFS Total Return Series
BOARD REVIEW OF INVESTMENT ADVISORY AGREEMENT
The Investment Company Act of 1940 requires that both the full Board of Trustees and a majority of the non-interested (“independent”) Trustees, voting separately, annually approve the continuation of the Fund’s investment advisory agreement with MFS. The Trustees consider matters bearing on the Fund and its advisory arrangements at their meetings throughout the year, including a review of performance data at each regular meeting. In addition, the independent Trustees met several times over the course of three months beginning in May and ending in July, 2015 (“contract review meetings”) for the specific purpose of considering whether to approve the continuation of the investment advisory agreement for the Fund and the other investment companies that the Board oversees (the “MFS Funds”). The independent Trustees were assisted in their evaluation of the Fund’s investment advisory agreement by independent legal counsel, from whom they received separate legal advice and with whom they met separately from MFS during various contract review meetings. The independent Trustees were also assisted in this process by the MFS Funds’ Independent Senior Officer, a senior officer appointed by and reporting to the independent Trustees.
In connection with their deliberations regarding the continuation of the investment advisory agreement, the Trustees, including the independent Trustees, considered such information and factors as they believed, in light of the legal advice furnished to them and their own business judgment, to be relevant. The investment advisory agreement for the Fund was considered separately, although the Trustees also took into account the common interests of all MFS Funds in their review. As described below, the Trustees considered the nature, quality, and extent of the various investment advisory, administrative, and shareholder services performed by MFS under the existing investment advisory agreement and other arrangements with the Fund.
In connection with their contract review meetings, the Trustees received and relied upon materials that included, among other items: (i) information provided by Lipper Inc., an independent third party, on the investment performance of the Fund for various time periods ended December 31, 2014 and the investment performance of a group of funds with substantially similar investment classifications/objectives (the “Lipper performance universe”), (ii) information provided by Lipper Inc. on the Fund’s advisory fees and other expenses and the advisory fees and other expenses of comparable funds identified by Lipper Inc. (the “Lipper expense group”), (iii) information provided by MFS on the advisory fees of comparable portfolios of other clients of MFS, including institutional separate accounts and other clients, (iv) information as to whether and to what extent applicable expense waivers, reimbursements or fee “breakpoints” are observed for the Fund, (v) information regarding MFS’ financial results and financial condition, including MFS’ and certain of its affiliates’ estimated profitability from services performed for the Fund and the MFS Funds as a whole, and compared to MFS’ institutional business, (vi) MFS’ views regarding the outlook for the mutual fund industry and the strategic business plans of MFS, (vii) descriptions of various functions performed by MFS for the Funds, such as compliance monitoring and portfolio trading practices, and (viii) information regarding the overall organization of MFS, including information about MFS’ senior management and other personnel providing investment advisory, administrative and other services to the Fund and the other MFS Funds. The comparative performance, fee and expense information prepared and provided by Lipper Inc. was not independently verified and the independent Trustees did not independently verify any information provided to them by MFS.
The Trustees’ conclusion as to the continuation of the investment advisory agreement was based on a comprehensive consideration of all information provided to the Trustees and not the result of any single factor. Some of the factors that figured particularly in the Trustees’ deliberations are described below, although individual Trustees may have evaluated the information presented differently from one another, giving different weights to various factors. It is also important to recognize that the fee arrangements for the Fund and other MFS Funds are the result of years of review and discussion between the independent Trustees and MFS, that certain aspects of such arrangements may receive greater scrutiny in some years than in others, and that the Trustees’ conclusions may be based, in part, on their consideration of these same arrangements during the course of the year and in prior years.
Based on information provided by Lipper Inc. and MFS, the Trustees reviewed the Fund’s total return investment performance as well as the performance of peer groups of funds over various time periods. The Trustees placed particular emphasis on the total return performance of the Fund’s Initial Class shares in comparison to the performance of funds in its Lipper performance universe over the three-year period ended December 31, 2014, which the Trustees believed was a long enough period to reflect differing market conditions. The total return performance of the Fund’s Initial Class shares was in the 1st quintile relative to the other funds in the universe for this three-year period (the 1st quintile being the best performers and the 5th quintile being the worst performers). The total return performance of the Fund’s Initial Class shares was in the 1st quintile for the one-year period and the 2nd quintile for the five-year period ended December 31, 2014 relative to the Lipper performance universe. Because of the passage of time, these performance results may differ from the performance results for more recent periods, including those shown elsewhere in this report.
In the course of their deliberations, the Trustees took into account information provided by MFS in connection with the contract review meetings, as well as during investment review meetings conducted with portfolio management personnel during the course of the year regarding the Fund’s performance. After reviewing these and related factors, the Trustees concluded, within the context of their overall conclusions regarding the investment advisory agreement, that they were satisfied with MFS’ responses and efforts relating to investment performance.
33
MFS Total Return Series
Board Review of Investment Advisory Agreement – continued
In assessing the reasonableness of the Fund’s advisory fee, the Trustees considered, among other information, the Fund’s advisory fee and the total expense ratio of the Fund’s Initial Class shares as a percentage of average daily net assets and the advisory fee and total expense ratios of peer groups of funds based on information provided by Lipper Inc. The Trustees considered that MFS currently observes an expense limitation for the Fund, which may not be changed without the Trustees’ approval. The Trustees also considered that, according to the Lipper data (which takes into account any fee reductions or expense limitations that were in effect during the Fund’s last fiscal year), the Fund’s effective advisory fee rate and total expense ratio were each higher than the Lipper expense group median.
The Trustees also considered the advisory fees charged by MFS to any institutional separate accounts advised by MFS (“separate accounts”) and unaffiliated investment companies for which MFS serves as subadviser (“subadvised funds”) that have comparable investment strategies to the Fund. In comparing these fees, the Trustees considered information provided by MFS as to the generally broader scope of services provided by MFS to the Fund, as well as the more extensive regulatory burdens imposed on MFS in managing the Fund, in comparison to separate accounts and subadvised funds. The Trustees also considered the higher demands placed on MFS’ investment personnel and trading infrastructure as a result of the daily cash in-flows and out-flows of the Fund in comparison to separate accounts.
The Trustees also considered whether the Fund may benefit from any economies of scale in the management of the Fund in the event of growth in assets of the Fund and/or growth in assets of the MFS Funds as a whole. They noted that the Fund’s advisory fee rate schedule is subject to contractual breakpoints that reduce the Fund’s advisory fee rate on average daily net assets over $3 billion and $5 billion, and that MFS has agreed in writing to further reduce its advisory fee rate on the Fund’s average daily net assets up to $1 billion, over $1 billion and between $2.5 billion and $5 billion, which may not be changed without the Trustees’ approval. The Trustees also noted that MFS has agreed in writing to waive a portion of the management fees of certain MFS Funds, including the Fund, if the total combined assets of certain funds within the MFS Funds’ complex increase above agreed upon thresholds (the “group fee waiver”), enabling the Fund’s shareholders to share in the benefits from any economies of scale at the complex level. The group fee waiver is reviewed and renewed annually between the Board and MFS. The Trustees concluded that the breakpoints and the group fee waiver were sufficient to allow the Fund to benefit from economies of scale as its assets and overall complex assets grow.
The Trustees also considered information prepared by MFS relating to MFS’ costs and profits with respect to the Fund, the MFS Funds considered as a group, and other investment companies and accounts advised by MFS, as well as MFS’ methodologies used to determine and allocate its costs to the MFS Funds, the Fund and other accounts and products for purposes of estimating profitability.
After reviewing these and other factors described herein, the Trustees concluded, within the context of their overall conclusions regarding the investment advisory agreement, that the advisory fees charged to the Fund represent reasonable compensation in light of the services being provided by MFS to the Fund.
In addition, the Trustees considered MFS’ resources and related efforts to continue to retain, attract and motivate capable personnel to serve the Fund. The Trustees also considered current and developing conditions in the financial services industry, including the presence of large and well-capitalized companies which are spending, and appear to be prepared to continue to spend, substantial sums to engage personnel and to provide services to competing investment companies. In this regard, the Trustees also considered the financial resources of MFS and its ultimate parent, Sun Life Financial Inc. The Trustees also considered the advantages and possible disadvantages to the Fund of having an adviser that also serves other investment companies as well as other accounts.
The Trustees also considered the nature, quality, cost, and extent of administrative, transfer agency, and distribution services provided to the Fund by MFS and its affiliates under agreements and plans other than the investment advisory agreement, including any 12b-1 fees the Fund pays to MFS Fund Distributors, Inc., an affiliate of MFS. The Trustees also considered the nature, extent and quality of certain other services MFS performs or arranges for on the Fund’s behalf, which may include securities lending programs, directed expense payment programs, class action recovery programs, and MFS’ interaction with third-party service providers, principally custodians and sub-custodians. The Trustees concluded that the various non-advisory services provided by MFS and its affiliates on behalf of the Fund were satisfactory.
The Trustees also considered benefits to MFS from the use of the Fund’s portfolio brokerage commissions, if applicable, to pay for investment research and various other factors. Additionally, the Trustees considered so-called “fall-out benefits” to MFS such as reputational value derived from serving as investment manager to the Fund.
Based on their evaluation of factors that they deemed to be material, including those factors described above, the Board of Trustees, including the independent Trustees, concluded that the Fund’s investment advisory agreement with MFS should be continued for an additional one-year period, commencing August 1, 2015.
34
MFS Total Return Series
PROXY VOTING POLICIES AND INFORMATION
MFS votes proxies on behalf of the fund pursuant to proxy voting policies and procedures that are available without charge, upon request, by calling 1-800-225-2606, by visiting the Proxy Voting section of mfs.com or by visiting the SEC’s Web site at http://www.sec.gov.
Information regarding how the fund voted proxies relating to portfolio securities during the most recent twelve-month period ended June 30 is available without charge by visiting the Proxy Voting section of mfs.com or by visiting the SEC’s Web site at http://www.sec.gov.
QUARTERLY PORTFOLIO DISCLOSURE
The fund will file a complete schedule of portfolio holdings with the Securities and Exchange Commission (the Commission) for the first and third quarters of each fiscal year on Form N-Q. The fund’s Form N-Q is available on the EDGAR database on the Commission’s Internet Web site at http://www.sec.gov, and may be reviewed and copied at the:
Public Reference Room
Securities and Exchange Commission
100 F Street, NE, Room 1580
Washington, D.C. 20549
Information on the operation of the Public Reference Room may be obtained by calling the Commission at 1-800-SEC-0330. Copies of the fund’s Form N-Q also may be obtained, upon payment of a duplicating fee, by electronic request at the following e-mail address: publicinfo@sec.gov or by writing the Public Reference Section at the above address.
FURTHER INFORMATION
From time to time, MFS may post important information about the fund or the MFS funds on the MFS web site (mfs.com). This information is available by visiting the “Market Commentary” and “Announcements” sub sections in the “Market Outlooks” section of mfs.com or by clicking on the fund’s name under “Variable Insurance Portfolios — VIT” in the “Products” section of mfs.com.
FEDERAL TAX INFORMATION (unaudited)
The following information is provided pursuant to provisions of the Internal Revenue Code.
The fund designates $92,369,000 as capital gain dividends paid during the fiscal year.
For corporate shareholders, 39.32% of the ordinary income dividends paid during the fiscal year qualify for the corporate dividends received deduction.
35
rev. 3/11
| | | | |
| FACTS | | WHAT DOES MFS DO WITH YOUR
PERSONAL INFORMATION? | |  |
| | |
| Why? | | Financial companies choose how they share your personal information. Federal law gives consumers the right to limit some but not all sharing. Federal law also requires us to tell you how we collect, share, and protect your personal information. Please read this notice carefully to understand what we do. |
| | |
| What? | | The types of personal information we collect and share depend on the product or service you have with us. This information can include: • Social Security number and account balances • Account transactions and transaction history • Checking account information and wire transfer instructions When you are no longer our customer, we continue to share your information as described in this notice. |
| | |
| How? | | All financial companies need to share customers’ personal information to run their everyday business. In the section below, we list the reasons financial companies can share their customers’ personal information; the reasons MFS chooses to share; and whether you can limit this sharing. |
| | | | |
Reasons we can share your
personal information | | Does MFS share? | | Can you limit this
sharing? |
For our everyday business purposes – such as to process your transactions, maintain your account(s), respond to court orders and legal investigations, or report to credit bureaus | | Yes | | No |
For our marketing purposes – to offer our products and services to you | | No | | We don’t share |
| For joint marketing with other financial companies | | No | | We don’t share |
For our affiliates’ everyday business purposes – information about your transactions and experiences | | No | | We don’t share |
For our affiliates’ everyday business purposes – information about your creditworthiness | | No | | We don’t share |
| For nonaffiliates to market to you | | No | | We don’t share |
| | |
| Questions? | | Call 800-225-2606 or go to mfs.com. |
36
| | |
| Who we are |
| Who is providing this notice? | | MFS Funds, MFS Investment Management, MFS Institutional Advisors, Inc., MFS Fund Distributors, Inc., MFS Heritage Trust Company, and MFS Service Center, Inc. |
| | |
| What we do |
| How does MFS protect my personal information? | | To protect your personal information from unauthorized access and use, we use security measures that comply with federal law. These measures include procedural, electronic, and physical safeguards for the protection of the personal information we collect about you. |
How does MFS
collect my personal information? | | We collect your personal information, for example, when you • open an account or provide account information • direct us to buy securities or direct us to sell your securities • make a wire transfer We also collect your personal information from others, such as credit bureaus, affiliates and other companies. |
| Why can’t I limit all sharing? | | Federal law gives you the right to limit only • sharing for affiliates’ everyday business purposes – information about your creditworthiness • affiliates from using your information to market to you • sharing for nonaffiliates to market to you State laws and individual companies may give you additional rights to limit sharing. |
| | |
| Definitions |
| Affiliates | | Companies related by common ownership or control. They can be financial and nonfinancial companies. • MFS does not share personal information with affiliates, except for everyday business purposes as described on page one of this notice. |
| Nonaffiliates | | Companies not related by common ownership or control. They can be financial and nonfinancial companies. • MFS does not share with nonaffiliates so they can market to you. |
| Joint Marketing | | A formal agreement between nonaffiliated financial companies that together market financial products or services to you. • MFS doesn’t jointly market. |
| | |
| Other important information |
| If you own an MFS product or receive an MFS service in the name of a third party such as a bank or broker-dealer, their privacy policy may apply to you instead of ours. |
37
ANNUAL REPORT
December 31, 2015

MFS® UTILITIES SERIES
MFS® Variable Insurance Trust

VUF-ANN
MFS® UTILITIES SERIES
CONTENTS
The report is prepared for the general information of contract owners. It is authorized for distribution to prospective investors only when preceded or accompanied by a current prospectus.
NOT FDIC INSURED • MAY LOSE VALUE • NO BANK OR CREDIT UNION GUARANTEE • NOT A DEPOSIT • NOT INSURED BY ANY FEDERAL GOVERNMENT AGENCY OR NCUA/NCUSIF
MFS Utilities Series
LETTER FROM THE CHAIRMAN

Dear Contract Owners:
Central bank policies remain center stage as the U.S. Federal Reserve made good on its pledge to raise policy rates for the first time in over nine years at its December meeting. The Fed’s actions stand in stark contrast to those of the European Central Bank and Bank of Japan, which modestly extended their quantitative easing programs in December.
In the United States, auto sales remain a source of economic strength, but housing demand has slowed of late. The U.S. economic expansion remains moderate but uneven, with a strong dollar crimping demand for U.S. goods abroad. China’s shift to a consumer-led economy continues to weigh on its manufacturing and exports, as does weak global demand. Slackening demand from China continues to undermine commodity markets, with oil particularly impacted amid a global supply glut.
As markets have become more focused on short-term trends in recent years, we believe it’s important for investors to lengthen their investment time horizon. At MFS®, we don’t trade on headlines or trends; we invest for the long term.
We believe that this approach, coupled with the professional guidance of a financial advisor, will help you reach your investment goals.
Respectfully,

Robert J. Manning
Chairman
MFS Investment Management
February 16, 2016
The opinions expressed in this letter are subject to change and may not be relied upon for investment advice. No forecasts can be guaranteed.
1
MFS Utilities Series
PORTFOLIO COMPOSITION
Portfolio structure (i)

| | | | |
| Top ten holdings (i) | | | | |
| NextEra Energy, Inc. | | | 5.4% | |
| PPL Corp. | | | 4.7% | |
| Exelon Corp. | | | 4.0% | |
| Sempra Energy | | | 3.5% | |
| EDP Renovaveis S.A. | | | 2.9% | |
| American Electric Power Co., Inc. | | | 2.8% | |
| Calpine Corp. | | | 2.4% | |
| AES Corp. | | | 2.4% | |
| Time Warner Cable, Inc. | | | 2.3% | |
| Energias de Portugal S.A. | | | 2.3% | |
| | | | |
| Top five industries (i) | | | | |
| Utilities-Electric Power | | | 54.2% | |
| Natural Gas-Pipeline | | | 14.0% | |
| Telephone Services | | | 8.7% | |
| Natural Gas-Distribution | | | 6.8% | |
| Cable TV | | | 6.4% | |
| |
| Issuer country weightings (i)(x) | | | | |
| United States | | | 73.8% | |
| Portugal | | | 5.1% | |
| United Kingdom | | | 3.0% | |
| Italy | | | 2.8% | |
| Canada | | | 2.7% | |
| France | | | 1.7% | |
| China | | | 1.6% | |
| Sweden | | | 1.5% | |
| Brazil | | | 1.5% | |
| Other Countries | | | 6.3% | |
| (i) | For purposes of this presentation, the components include the value of securities, and reflect the impact of the equivalent exposure of derivative positions, if any. These amounts may be negative from time to time. Equivalent exposure is a calculated amount that translates the derivative position into a reasonable approximation of the amount of the underlying asset that the portfolio would have to hold at a given point in time to have the same price sensitivity that results from the portfolio’s ownership of the derivative contract. When dealing with derivatives, equivalent exposure is a more representative measure of the potential impact of a position on portfolio performance than value. The bond component will include any accrued interest amounts. |
| (x) | Represents the portfolio’s exposure to issuer countries as a percentage of a portfolio’s net assets. For purposes of this presentation, United States includes Cash & Cash Equivalents. |
Where the fund holds convertible bonds, these are treated as part of the equity portion of the portfolio.
Cash & Cash Equivalents includes any cash, investments in money market funds, short-term securities, and other assets less liabilities. Please see the Statement of Assets and Liabilities for additional information related to the fund’s cash position and other assets and liabilities.
Other includes currency derivatives and/or any offsets to derivative positions.
Percentages are based on net assets as of 12/31/15.
The portfolio is actively managed and current holdings may be different.
2
MFS Utilities Series
MANAGEMENT REVIEW
Summary of Results
For the twelve months ended December 31, 2015, Initial Class shares of the MFS Utilities Series (“fund”) provided a total return of –14.52%, while Service Class shares of the fund provided a total return of –14.76%. These compare with a return of 1.38% over the same period for the fund’s benchmark, the Standard & Poor’s 500 Stock Index, and a return of –4.85% for the fund’s other benchmark, the Standard & Poor’s 500 Utilities Index (“S&P Utilities Index”).
Market Environment
Sluggish global growth weighed on both developed and emerging market (“EM”) economies during the reporting period. EM economies have been particularly lackluster. While the US Federal Reserve began its anticipated monetary policy tightening cycle at the end of the period, other large developed economies continued to embrace accommodative monetary policies, particularly the European Central Bank and the Bank of Japan. Focus remained on China after policy missteps by the Chinese government roiled global markets over the summer, beginning with the uncoordinated response to the stock market’s boom and bust and then the confusing decision to devalue the renminbi in August. China subsequently ramped up a wide range of monetary and fiscal measures to stimulate the economy and bolster sentiment. Its economy appeared to stabilize late in the period. Also at the end of the period, the Chinese renminbi was granted reserve currency status by the International Monetary Fund (“IMF”), which announced its inclusion in the IMF’s Special Drawing Rights currency basket effective October 1, 2016.
During the second half of the reporting period, the US faced an earnings recession caused primarily by the sharp decline in the prices of oil and other commodities. Earnings contractions were concentrated primarily in the energy, materials and industrial sectors. An additional headwind for earnings was the sharp rise in the US dollar over the period. Exports were crimped by the dollar’s strength and falling demand in emerging markets. Consumer spending held up well during the second half of the period amid a modest increase in real wages and a tailwind from falling gasoline prices. Demand for autos reached near-record territory late in the period. In emerging markets, two key factors weighed on economies and asset prices: 1) weaker Chinese growth, which drove the decline in commodity prices and 2) prospects for higher US interest rates. Structural factors like floating exchange rates and fiscal buffers partially offset these cyclical headwinds.
Detractors from Performance
The fund’s allocation to the poor-performing natural gas pipeline industry was a primary detractor from performance relative to the S&P Utilities Index. Notable detractors of relative performance included natural gas pipeline operators Kinder Morgan (b), oil and gas transportation and storage companies Plains GP Holdings (b), Enbridge (b) (Canada), Energy Transfer Equity (b) and Columbia Pipeline Group (b). Shares of propane and natural gas company Energy Transfer Partners (b) also weakened relative results.
Stock selection in the electric power industry was another area of relative weakness. The fund’s positions in power generation companies Dynergy (b)(h) and low emissions and clean power plant operators Calpine (b) and TerraForm Power (b)(h), and an overweight position in NRG Energy, also dampened relative results as all four companies posted poor performance for the reporting period.
During the reporting period, the fund’s relative currency exposure, resulting primarily from differences between the fund’s and the benchmark’s exposures to holdings of securities denominated in foreign currencies, detracted from relative performance. All of MFS’ investment decisions are driven by the fundamentals of each individual opportunity and as such, it is common for our funds to have different currency exposure than the benchmark.
Contributors to Performance
The fund’s position in the cable TV industry and wireless communications industry were primary contributors to relative performance. Most notably, shares of video, high-speed data and voice services provider Time Warner Cable (b) within the cable TV sector aided relative results. Shares of telecommunications companies T-Mobile (b)(h) within the wireless communications sector also benefited relative returns.
Individual stocks that contributed to relative performance included an avoidance of power & natural gas distributor Duke Energy (h) and integrated electric power producer Entergy (h). Holdings of renewable energy company EDP Renovaveis (b) (Spain), telecommunication and internet services company Telecom Italia (b)(h) (Italy), telecommunications company Altice (b) (Netherlands) and Bezeq The Israel Telecommunication (b) (Israel) also contributed to relative results. An underweight position in diversified energy companies FirstEnergy further benefited relative results.
3
MFS Utilities Series
Management Review – continued
The fund’s cash and/or cash equivalents position during the period was also a contributor to relative performance. Under normal market conditions, the fund strives to be fully invested and generally holds cash to buy new holdings and to provide liquidity. In a period when equity markets declined, as measured by the S&P Utilities Index, holding cash benefited performance versus the benchmark, which has no cash position.
Respectfully,
| | |
| Claud Davis | | Maura Shaughnessy |
| Portfolio Manager | | Portfolio Manager |
| (b) | Security is not a benchmark constituent. |
| (h) | Security was not held in the portfolio at period end. |
The views expressed in this report are those of the portfolio managers only through the end of the period of the report as stated on the cover and do not necessarily reflect the views of MFS or any other person in the MFS organization. These views are subject to change at any time based on market or other conditions, and MFS disclaims any responsibility to update such views. These views may not be relied upon as investment advice or an indication of trading intent on behalf of any MFS portfolio. References to specific securities are not recommendations of such securities, and may not be representative of any MFS portfolio’s current or future investments.
4
MFS Utilities Series
PERFORMANCE SUMMARY THROUGH 12/31/15
The following chart illustrates the historical performance of the fund in comparison to its benchmark(s). Benchmarks are unmanaged and may not be invested in directly. Benchmark returns do not reflect any fees or expenses. The performance of other share classes will be greater than or less than that of the class depicted below. (See Notes to Performance Summary.)
Performance data shown represents past performance and is no guarantee of future results. Investment return and principal value fluctuate so your units, when sold, may be worth more or less than the original cost; current performance may be lower or higher than quoted. The performance shown does not reflect the deduction of taxes, if any, that a contract holder would pay on fund distributions or the redemption of contract units. The returns for the fund shown also do not reflect the deduction of expenses associated with variable products, such as mortality and expense risk charges, separate account charges, and sales charges imposed by the insurance company separate accounts. Such expenses would reduce the overall returns shown.
Growth of a Hypothetical $10,000 Investment

Total Returns through 12/31/15
Average annual total returns
| | | | | | | | | | | | |
| | | Share Class | | Class Inception Date | | 1-yr | | 5-yr | | 10-yr | | |
| | | Initial Class | | 1/03/95 | | (14.52)% | | 7.07% | | 8.36% | | |
| | | Service Class | | 5/01/00 | | (14.76)% | | 6.80% | | 8.09% | | |
| | | | |
| Comparative benchmarks | | | | | | | | |
| | | Standard & Poor’s 500 Stock Index (f) | | 1.38% | | 12.57% | | 7.31% | | |
| | | Standard & Poor’s 500 Utilities Index (f) | | (4.85)% | | 11.03% | | 7.41% | | |
| (f) | Source: FactSet Research Systems Inc. |
Benchmark Definitions
Standard & Poor’s 500 Stock Index – a market capitalization-weighted index of 500 widely held equity securities, designed to measure broad U.S. equity performance.
Standard & Poor’s 500 Utilities Index – a market capitalization-weighted index designed to measure the utilities sector, including those companies considered electric, gas or water utilities, or companies that operate as independent producers and/or distributors of power.
It is not possible to invest directly in an index.
Notes to Performance Summary
Average annual total return represents the average annual change in value for each share class for the periods presented.
Performance results reflect any applicable expense subsidies and waivers in effect during the periods shown. Without such subsidies and waivers the fund’s performance results would be less favorable. Please see the prospectus and financial statements for complete details. All results are historical and assume the reinvestment of any dividends and capital gains distributions.
Performance results do not include adjustments made for financial reporting purposes in accordance with U.S. generally accepted accounting principles and may differ from amounts reported in the financial highlights.
From time to time the fund may receive proceeds from litigation settlements, without which performance would be lower.
5
MFS Utilities Series
EXPENSE TABLE
Fund Expenses Borne by the Contract Holders during the Period,
July 1, 2015 through December 31, 2015
As a contract holder of the fund, you incur ongoing costs, including management fees; distribution and/or service (12b-1) fees; and other fund expenses. This example is intended to help you understand your ongoing costs (in dollars) of investing in the fund and to compare these costs with the ongoing costs of investing in other mutual funds.
The example is based on an investment of $1,000 invested at the beginning of the period and held for the entire period July 1, 2015 through December 31, 2015.
Actual Expenses
The first line for each share class in the following table provides information about actual account values and actual expenses. You may use the information in this line, together with the amount you invested, to estimate the expenses that you paid over the period. Simply divide your account value by $1,000 (for example, an $8,600 account value divided by $1,000 = 8.6), then multiply the result by the number in the first line under the heading entitled “Expenses Paid During Period” to estimate the expenses you paid on your account during this period.
Hypothetical Example for Comparison Purposes
The second line for each share class in the following table provides information about hypothetical account values and hypothetical expenses based on the fund’s actual expense ratio and an assumed rate of return of 5% per year before expenses, which is not the fund’s actual return. The hypothetical account values and expenses may not be used to estimate the actual ending account balance or expenses you paid for the period. You may use this information to compare the ongoing costs of investing in the fund and other funds. To do so, compare this 5% hypothetical example with the 5% hypothetical examples that appear in the shareholder reports of the other funds.
Please note that the expenses shown in the table are meant to highlight the fund’s ongoing costs only and do not take into account the fees and expenses imposed under the variable contracts through which your investment in the fund is made. Therefore, the second line for each share class in the table is useful in comparing ongoing costs associated with an investment in vehicles (such as the fund) which fund benefits under variable annuity and variable life insurance contracts and to qualified pension and retirement plans only, and will not help you determine the relative total costs of investing in the fund through variable annuity and variable life insurance contracts. If the fees and expenses imposed under the variable contracts were included, your costs would have been higher.
| | | | | | | | | | | | | | | | | | |
| Share Class | | | | Annualized
Expense Ratio | | | Beginning
Account Value
7/01/15 | | | Ending Account Value
12/31/15 | | | Expenses Paid During Period (p) 7/01/15-12/31/15 | |
| Initial Class | | Actual | | | 0.78% | | | | $1,000.00 | | | | $863.98 | | | | $3.66 | |
| | Hypothetical (h) | | | 0.78% | | | | $1,000.00 | | | | $1,021.27 | | | | $3.97 | |
| Service Class | | Actual | | | 1.03% | | | | $1,000.00 | | | | $862.74 | | | | $4.84 | |
| | Hypothetical (h) | | | 1.03% | | | | $1,000.00 | | | | $1,020.01 | | | | $5.24 | |
| (h) | 5% class return per year before expenses. |
| (p) | “Expenses Paid During Period” are equal to each class’s annualized expense ratio, as shown above, multiplied by the average account value over the period, multiplied by 184/365 (to reflect the one-half year period). |
6
MFS Utilities Series
PORTFOLIO OF INVESTMENTS – 12/31/15
The Portfolio of Investments is a complete list of all securities owned by your fund. It is categorized by broad-based asset classes.
| | | | | | | | |
| Issuer | | Shares/Par | | | Value ($) | |
| | | | | | | | |
| COMMON STOCKS – 88.2% | | | | | | | | |
| Cable TV – 6.4% | | | | | | | | |
| Charter Communications, Inc., “A” (a)(l) | | | 108,990 | | | $ | 19,956,072 | |
| Comcast Corp., “A” | | | 562,321 | | | | 31,731,774 | |
| Liberty Global PLC, “C” (a) | | | 250,326 | | | | 10,205,791 | |
| Time Warner Cable, Inc. | | | 190,100 | | | | 35,280,659 | |
| | | | | | | | |
| | | $ | 97,174,296 | |
| | | | | | | | |
| Energy – Independent – 0.7% | | | | | | | | |
| Enable Midstream Partners LP | | | 375,855 | | | $ | 3,457,866 | |
| Western Gas Equity Partners LP | | | 206,762 | | | | 7,503,393 | |
| | | | | | | | |
| | | $ | 10,961,259 | |
| | | | | | | | |
| Natural Gas – Distribution – 6.8% | | | | | |
| China Resources Gas Group Ltd. | | | 5,722,000 | | | $ | 17,026,595 | |
| Engie | | | 1,106,134 | | | | 19,576,035 | |
| NorthWestern Corp. | | | 112,731 | | | | 6,115,657 | |
| Sempra Energy | | | 563,701 | | | | 52,993,531 | |
| Snam Rete Gas S.p.A. | | | 1,626,736 | | | | 8,507,207 | |
| | | | | | | | |
| | | $ | 104,219,025 | |
| | | | | | | | |
| Natural Gas – Pipeline – 12.6% | | | | | |
| Columbia Pipeline Group, Inc. | | | 298,064 | | | $ | 5,961,280 | |
| Columbia Pipeline Partners LP | | | 617,232 | | | | 10,789,215 | |
| Enbridge, Inc. | | | 749,114 | | | | 24,903,696 | |
| Energy Transfer Equity LP | | | 782,002 | | | | 10,744,707 | |
| Energy Transfer Partners LP | | | 633,321 | | | | 21,361,917 | |
| Enterprise Products Partners LP | | | 771,979 | | | | 19,747,223 | |
| EQT GP Holdings LP | | | 84,060 | | | | 1,745,086 | |
| EQT Midstream Partners LP | | | 168,955 | | | | 12,749,344 | |
| JP Energy Partners LP | | | 242,021 | | | | 1,190,743 | |
| Kinder Morgan, Inc. | | | 1,161,080 | | | | 17,323,314 | |
| Plains All American Pipeline LP | | | 119,310 | | | | 2,756,061 | |
| Plains GP Holdings LP | | | 1,119,376 | | | | 10,578,103 | |
| SemGroup Corp., “A” | | | 183,888 | | | | 5,307,008 | |
| Sunoco Logistics Partners LP | | | 494,125 | | | | 12,699,013 | |
| Tallgrass Energy GP LP | | | 274,338 | | | | 4,381,178 | |
| Williams Cos., Inc. | | | 649,524 | | | | 16,692,767 | |
| Williams Partners LP | | | 510,752 | | | | 14,224,443 | |
| | | | | | | | |
| | | $ | 193,155,098 | |
| | | | | | | | |
| Telecommunications – Wireless – 5.6% | | | | | |
| Advanced Info Service PLC | | | 515,900 | | | $ | 2,179,152 | |
| American Tower Corp., REIT | | | 251,171 | | | | 24,351,028 | |
| Bharti Infratel Ltd. | | | 431,344 | | | | 2,779,341 | |
| Bharti Tele-Ventures Ltd. | | | 631,049 | | | | 3,233,440 | |
| KDDI Corp. | | | 464,400 | | | | 12,021,908 | |
| Mobile TeleSystems PJSC, ADR | | | 1,210,962 | | | | 7,483,745 | |
| SBA Communications Corp. (a) | | | 142,888 | | | | 15,013,242 | |
| Vodafone Group PLC | | | 5,735,636 | | | | 18,552,055 | |
| | | | | | | | |
| | | $ | 85,613,911 | |
| | | | | | | | |
| | | | | | | | |
| Issuer | | Shares/Par | | | Value ($) | |
| | | | | | | | |
| COMMON STOCKS – continued | | | | | |
| Telephone Services – 8.0% | | | | | |
| Altice N.V. (a) | | | 640,661 | | | $ | 9,161,318 | |
| Bezeq – The Israel Telecommunication Corp. Ltd. | | | 4,253,727 | | | | 9,368,913 | |
| BT Group PLC | | | 1,595,708 | | | | 11,028,271 | |
| Com Hem Holding AB | | | 2,517,689 | | | | 22,753,701 | |
| Hellenic Telecommunications Organization S.A. | | | 1,366,809 | | | | 13,697,374 | |
| Numericable-SFR | | | 164,577 | | | | 5,975,456 | |
| PT XL Axiata Tbk (a) | | | 23,990,000 | | | | 6,324,981 | |
| Quebecor, Inc., “B” | | | 422,607 | | | | 10,347,565 | |
| TDC A.S. | | | 2,355,104 | | | | 11,682,928 | |
| Telus Corp. | | | 231,599 | | | | 6,403,829 | |
| Verizon Communications, Inc. | | | 325,189 | | | | 15,030,236 | |
| | | | | | | | |
| | | | | | $ | 121,774,572 | |
| | | | | | | | |
| Utilities – Electric Power – 48.1% | | | | | |
| Abengoa Yield PLC (l) | | | 857,428 | | | $ | 16,539,786 | |
| AES Corp. | | | 3,759,876 | | | | 35,982,013 | |
| ALLETE, Inc. | | | 104,669 | | | | 5,320,325 | |
| Alliant Energy Corp. | | | 73,310 | | | | 4,578,210 | |
| Ameren Corp. | | | 490,969 | | | | 21,224,590 | |
| American Electric Power Co., Inc. | | | 728,748 | | | | 42,464,146 | |
| Calpine Corp. (a) | | | 2,497,659 | | | | 36,141,126 | |
| China Longyuan Power Group | | | 9,744,000 | | | | 7,308,433 | |
| CMS Energy Corp. | | | 106,468 | | | | 3,841,365 | |
| CPFL Energia S.A. (a) | | | 1,773,234 | | | | 6,585,450 | |
| Dominion Resources, Inc. | | | 204,623 | | | | 13,840,700 | |
| DTE Energy Co. | | | 217,154 | | | | 17,413,579 | |
| Dynegy, Inc. (a) | | | 1,862,410 | | | | 24,956,294 | |
| Edison International | | | 237,444 | | | | 14,059,059 | |
| EDP Renovaveis S.A. | | | 5,553,334 | | | | 43,703,083 | |
| ENEL Green Power International B.V. | | | 1,164,323 | | | | 2,359,498 | |
| Enel S.p.A. | | | 7,590,516 | | | | 31,749,445 | |
| Energias de Portugal S.A. | | | 9,670,053 | | | | 34,753,435 | |
| Energias do Brasil S.A. | | | 2,187,012 | | | | 6,614,178 | |
| Exelon Corp. | | | 2,203,140 | | | | 61,181,198 | |
| FirstEnergy Corp. | | | 394,640 | | | | 12,521,927 | |
| Iberdrola S.A. | | | 1,176,196 | | | | 8,338,429 | |
| NextEra Energy Partners LP | | | 460,499 | | | | 13,745,895 | |
| NextEra Energy, Inc. | | | 791,548 | | | | 82,233,922 | |
| NRG Energy, Inc. | | | 2,266,958 | | | | 26,682,096 | |
| NRG Yield, Inc., “A” (l) | | | 367,558 | | | | 5,112,732 | |
| NRG Yield, Inc., “C” (l) | | | 515,719 | | | | 7,612,012 | |
| PG&E Corp. | | | 477,155 | | | | 25,379,874 | |
| PPL Corp. | | | 2,115,695 | | | | 72,208,670 | |
| Public Service Enterprise Group, Inc. | | | 651,950 | | | | 25,223,946 | |
| Red Electrica de Espana | | | 129,116 | | | | 10,761,855 | |
| Tractebel Energia S.A. | | | 516,900 | | | | 4,343,906 | |
| Xcel Energy, Inc. | | | 307,538 | | | | 11,043,690 | |
| | | | | | | | |
| | | | | | $ | 735,824,867 | |
| | | | | | | | |
Total Common Stocks
(Identified Cost, $1,429,393,111) | | | $ | 1,348,723,028 | |
| | | | | | | | |
7
MFS Utilities Series
Portfolio of Investments – continued
| | | | | | | | |
| Issuer | | Shares/Par | | | Value ($) | |
| | | | | | | | |
| CONVERTIBLE PREFERRED STOCKS – 9.1% | |
| Energy – Independent – 0.5% | | | | | |
| Anadarko Petroleum Corp., 7.5% | | | 220,978 | | | $ | 7,502,203 | |
| | | | | | | | |
| Natural Gas – Pipeline – 1.4% | | | | | |
| Kinder Morgan, Inc., 9.75% | | | 515,804 | | | $ | 20,786,901 | |
| | | | | | | | |
| Telecommunications – Wireless – 0.7% | | | | | |
| American Tower Corp., 5.5% | | | 110,771 | | | $ | 11,187,871 | |
| | | | | | | | |
| Telephone Services – 0.7% | | | | | |
| Frontier Communications Corp., 11.125% | | | 119,293 | | | $ | 10,924,853 | |
| | | | | | | | |
| Utilities – Electric Power – 5.8% | | | | | |
| Dominion Resources, Inc., “A”, 6.125% | | | 208,842 | | | $ | 11,085,333 | |
| Dominion Resources, Inc., “B”, 6% | | | 250,075 | | | | 13,421,525 | |
| Dominion Resources, Inc., 6.375% | | | 242,692 | | | | 11,668,631 | |
| Dynegy, Inc., 5.375% | | | 182,737 | | | | 9,160,606 | |
| Exelon Corp., 6.5% | | | 752,666 | | | | 30,460,393 | |
| NextEra Energy, Inc., 5.799% | | | 90,378 | | | | 4,938,254 | |
| NextEra Energy, Inc., 6.371% | | | 136,864 | | | | 7,230,525 | |
| | | | | | | | |
| | | $ | 87,965,267 | |
| | | | | | | | |
Total Convertible Preferred Stocks
(Identified Cost, $159,581,320) | | | $ | 138,367,095 | |
| | | | | | | | |
| |
| PREFERRED STOCKS – 0.3% | | | | | |
| Utilities – Electric Power – 0.3% | | | | | | | | |
| Companhia Paranaense de Energia(Identified Cost, $9,811,159) | | | 795,600 | | | $ | 4,698,482 | |
| | | | | | | | |
| Issuer | | Shares/Par | | | Value ($) | |
| | | | | | | | |
| BONDS – 0.1% | | | | | | | | |
| Asset-Backed & Securitized – 0.0% | | | | | |
| Falcon Franchise Loan LLC, FRN, 6.616%, 1/05/23 (i)(z) | | $ | 54,673 | | | $ | 5,495 | |
| | | | | | | | |
| Cable TV – 0.1% | | | | | |
| Neptune Finco Corp., 10.125%, 1/15/23 (n) | | $ | 965,000 | | | $ | 1,006,013 | |
| | | | | | | | |
Total Bonds
(Identified Cost, $968,758) | | | $ | 1,011,508 | |
| | | | | | | | |
| |
| MONEY MARKET FUNDS – 2.0% | | | | | |
| MFS Institutional Money Market Portfolio, 0.19%, at Cost and Net Asset Value (v) | | | 31,228,978 | | | $ | 31,228,978 | |
| | | | | | | | |
|
| COLLATERAL FOR SECURITIES LOANED – 1.7% | |
| Navigator Securities Lending Prime Portfolio, 0.32%, at Cost and Net Asset Value (j) | | | 25,965,425 | | | $ | 25,965,425 | |
| | | | | | | | |
Total Investments
(Identified Cost, $1,656,948,751) | | | $ | 1,549,994,516 | |
| | | | | | | | |
OTHER ASSETS, LESS
LIABILITIES – (1.4)% | | | | (20,652,907 | ) |
| | | | | | | | |
| NET ASSETS – 100.0% | | | $ | 1,529,341,609 | |
| | | | | | | | |
| (a) | | Non-income producing security. |
| (i) | | Interest only security for which the fund receives interest on notional principal (Par amount). Par amount shown is the notional principal and does not reflect the cost of the security. |
| (j) | | The rate quoted is the annualized seven-day yield of the fund at period end. |
| (l) | | A portion of this security is on loan. |
| (n) | | Securities exempt from registration under Rule 144A of the Securities Act of 1933. These securities may be sold in the ordinary course of business in transactions exempt from registration, normally to qualified institutional buyers. At period end, the aggregate value of these securities was $1,006,013, representing 0.1% of net assets. |
| (v) | | Underlying affiliated fund that is available only to investment companies managed by MFS. The rate quoted for the MFS Institutional Money Market Portfolio is the annualized seven-day yield of the fund at period end. |
| (z) | | Restricted securities are not registered under the Securities Act of 1933 and are subject to legal restrictions on resale. These securities generally may be resold in transactions exempt from registration or to the public if the securities are subsequently registered. Disposal of these securities may involve time-consuming negotiations and prompt sale at an acceptable price may be difficult. The fund holds the following restricted securities: |
| | | | | | | | | | |
| Restricted Securities | | Acquisition
Date | |
Cost | | | Value | |
| Falcon Franchise Loan LLC, FRN, 6.616%, 1/05/23 | | 1/18/02 | | | $3,758 | | | | $5,495 | |
| % of Net assets | | | | 0.0% | |
The following abbreviations are used in this report and are defined:
| ADR | | American Depositary Receipt |
| FRN | | Floating Rate Note. Interest rate resets periodically and the current rate may not be the rate reported at period end. |
| PLC | | Public Limited Company |
| REIT | | Real Estate Investment Trust |
Abbreviations indicate amounts shown in currencies other than the U.S. dollar. All amounts are stated in U.S. dollars unless otherwise indicated. A list of abbreviations is shown below:
8
MFS Utilities Series
Portfolio of Investments – continued
Derivative Contracts at 12/31/15
Forward Foreign Currency Exchange Contracts at 12/31/15
| | | | | | | | | | | | | | | | | | | | | | | | |
| Type | | | | Currency | | | Counterparty | | Contracts to
Deliver/Receive | | Settlement Date
Range | | In Exchange For | | | Contracts
at Value | | | Net Unrealized
Appreciation
(Depreciation) | |
| Asset Derivatives | | | | | | | | | | | | | | |
| BUY | | | | | CAD | | | UBS AG | | 221,157 | | 1/15/16 | | $ | 158,530 | | | $ | 159,833 | | | $ | 1,303 | |
| SELL | | | | | CAD | | | Barclays Bank PLC | | 1,913,000 | | 1/15/16 | | | 1,469,643 | | | | 1,382,548 | | | | 87,095 | |
| SELL | | | | | CAD | | | BNP Paribas S.A. | | 1,912,000 | | 1/15/16 | | | 1,469,826 | | | | 1,381,826 | | | | 88,000 | |
| SELL | | | | | CAD | | | Citibank N.A. | | 1,530,000 | | 1/15/16 | | | 1,176,196 | | | | 1,105,750 | | | | 70,446 | |
| SELL | | | | | CAD | | | Deutsche Bank AG | | 22,948,000 | | 1/15/16 | | | 17,635,905 | | | | 16,584,799 | | | | 1,051,106 | |
| SELL | | | | | CAD | | | JPMorgan Chase Bank N.A. | | 7,253,000 | | 1/15/16 | | | 5,575,195 | | | | 5,241,832 | | | | 333,363 | |
| SELL | | | | | CAD | | | Merrill Lynch International | | 3,825,000 | | 1/15/16 | | | 2,937,170 | | | | 2,764,374 | | | | 172,796 | |
| SELL | | | | | CAD | | | Morgan Stanley Capital Services, Inc. | | 5,927,086 | | 1/15/16 | | | 4,484,909 | | | | 4,283,577 | | | | 201,332 | |
| BUY | | | | | EUR | | | Deutsche Bank AG | | 4,323,973 | | 1/15/16 | | | 4,640,761 | | | | 4,700,282 | | | | 59,521 | |
| BUY | | | | | EUR | | | HSBC Bank | | 1,461,109 | | 1/15/16 | | | 1,553,734 | | | | 1,588,268 | | | | 34,534 | |
| BUY | | | | | EUR | | | JPMorgan Chase Bank N.A. | | 430,015 | | 1/15/16 | | | 460,723 | | | | 467,439 | | | | 6,716 | |
| BUY | | | | | EUR | | | Morgan Stanley Capital Services, Inc. | | 54,930 | | 1/15/16 | | | 59,192 | | | | 59,710 | | | | 518 | |
| BUY | | | | | EUR | | | UBS AG | | 559,871 | | 1/15/16 | | | 596,777 | | | | 608,595 | | | | 11,818 | |
| SELL | | | | | EUR | | | BNP Paribas S.A | | 325,659 | | 1/15/16 | | | 354,015 | | | | 354,000 | | | | 15 | |
| SELL | | | | | EUR | | | Citibank N.A. | | 10,012,515 | | 1/15/16 | | | 11,209,010 | | | | 10,883,889 | | | | 325,121 | |
| SELL | | | | | EUR | | | Credit Suisse Group | | 2,559,070 | | 1/15/16 | | | 2,866,555 | | | | 2,781,782 | | | | 84,773 | |
| SELL | | | | | EUR | | | Deutsche Bank AG | | 80,181,493 | | 1/15/16-3/17/16 | | | 89,009,276 | | | | 87,250,595 | | | | 1,758,681 | |
| SELL | | | | | EUR | | | Goldman Sachs International | | 1,070,990 | | 1/15/16 | | | 1,195,724 | | | | 1,164,197 | | | | 31,527 | |
| SELL | | | | | EUR | | | JPMorgan Chase Bank N.A. | | 27,791,815 | | 1/15/16 | | | 31,083,689 | | | | 30,210,495 | | | | 873,194 | |
| SELL | | | | | EUR | | | Merrill Lynch International | | 3,276,782 | | 1/15/16 | | | 3,670,989 | | | | 3,561,956 | | | | 109,033 | |
| SELL | | | | | EUR | | | State Street Bank and Trust Corp. | | 192,525 | | 1/15/16 | | | 211,331 | | | | 209,280 | | | | 2,051 | |
| SELL | | | | | GBP | | | Barclays Bank PLC | | 162,201 | | 1/15/16 | | | 241,561 | | | | 239,124 | | | | 2,437 | |
| SELL | | | | | GBP | | | BNP Paribas S.A. | | 12,946,809 | | 1/15/16 | | | 19,700,797 | | | | 19,086,737 | | | | 614,060 | |
| SELL | | | | | GBP | | | Credit Suisse Group | | 162,725 | | 1/15/16 | | | 241,364 | | | | 239,896 | | | | 1,468 | |
| SELL | | | | | GBP | | | JPMorgan Chase Bank N.A. | | 400,955 | | 1/15/16 | | | 594,016 | | | | 591,105 | | | | 2,911 | |
| | | | | | | | | | | | | | | | | | | | | | | | |
| | | | | | | | | | | | | | | | | | | | | | $ | 5,923,819 | |
| | | | | | | | | | | | | | | | | | | | | | | | |
| | | | |
| Liability Derivatives | | | | | | | | | | | | | | |
| BUY | | | | | CAD | | | BNP Paribas S.A. | | 203,698 | | 1/15/16 | | $ | 154,643 | | | $ | 147,215 | | | $ | (7,428 | ) |
| BUY | | | | | CAD | | | Credit Suisse Group | | 89,731 | | 1/15/16 | | | 65,314 | | | | 64,849 | | | | (465 | ) |
| BUY | | | | | CAD | | | Deutsche Bank AG | | 386,090 | | 1/15/16 | | | 289,062 | | | | 279,032 | | | | (10,030 | ) |
| BUY | | | | | CAD | | | Goldman Sachs International | | 89,602 | | 1/15/16 | | | 67,104 | | | | 64,757 | | | | (2,347 | ) |
| BUY | | | | | CAD | | | JPMorgan Chase Bank N.A. | | 63,996 | | 1/15/16 | | | 47,927 | | | | 46,251 | | | | (1,676 | ) |
| BUY | | | | | CAD | | | Morgan Stanley Capital Services, Inc. | | 2,131,004 | | 1/15/16 | | | 1,601,300 | | | | 1,540,102 | | | | (61,198 | ) |
| BUY | | | | | EUR | | | Credit Suisse Group | | 576,932 | | 1/15/16 | | | 636,706 | | | | 627,141 | | | | (9,565 | ) |
| BUY | | | | | EUR | | | Deutsche Bank AG | | 1,340,313 | | 1/15/16 | | | 1,465,543 | | | | 1,456,958 | | | | (8,585 | ) |
| BUY | | | | | EUR | | | HSBC Bank | | 2,189,098 | | 1/15/16 | | | 2,421,910 | | | | 2,379,612 | | | | (42,298 | ) |
| BUY | | | | | EUR | | | JPMorgan Chase Bank N.A. | | 1,410,662 | | 1/15/16 | | | 1,542,903 | | | | 1,533,430 | | | | (9,473 | ) |
| BUY | | | | | EUR | | | Morgan Stanley Capital Services, Inc. | | 2,128,991 | | 1/15/16 | | | 2,341,964 | | | | 2,314,274 | | | | (27,690 | ) |
| BUY | | | | | EUR | | | State Street Bank and Trust Corp. | | 696,100 | | 1/15/16 | | | 764,095 | | | | 756,681 | | | | (7,414 | ) |
| BUY | | | | | EUR | | | UBS AG | | 216,344 | | 1/15/16 | | | 237,447 | | | | 235,173 | | | | (2,274 | ) |
| SELL | | | | | EUR | | | Deutsche Bank AG | | 158,299 | | 1/15/16 | | | 171,740 | | | | 172,076 | | | | (336 | ) |
| SELL | | | | | EUR | | | HSBC Bank | | 2,088,223 | | 1/15/16 | | | 2,258,872 | | | | 2,269,957 | | | | (11,085 | ) |
| SELL | | | | | EUR | | | Morgan Stanley Capital Services, Inc. | | 295,091 | | 1/15/16 | | | 314,624 | | | | 320,772 | | | | (6,148 | ) |
| BUY | | | | | GBP | | | JPMorgan Chase Bank N.A. | | 499,530 | | 1/15/16 | | | 770,246 | | | | 736,429 | | | | (33,817 | ) |
| | | | | | | | | | | | | | | | | | | | | | | | |
| | | | | | | | | | | | | | | | | | | | | | $ | (241,829 | ) |
| | | | | | | | | | | | | | | | | | | | | | | | |
See Notes to Financial Statements
9
MFS Utilities Series
FINANCIAL STATEMENTS | STATEMENT OF ASSETS AND LIABILITIES
This statement represents your fund’s balance sheet, which details the assets and liabilities comprising the total value of the fund.
| | | | | | | | |
At 12/31/15 | | | | | | | | |
Assets | | | | | | | | |
Investments | | | | | | | | |
Non-affiliated issuers, at value (identified cost, $1,625,719,773) | | | $1,518,765,538 | | | | | |
Underlying affiliated funds, at cost and value | | | 31,228,978 | | | | | |
Total investments, at value, including $27,166,081 of securities on loan (identified cost, $1,656,948,751) | | | $1,549,994,516 | | | | | |
Receivables for | | | | | | | | |
Forward foreign currency exchange contracts | | | 5,923,819 | | | | | |
Investments sold | | | 5,022,287 | | | | | |
Fund shares sold | | | 433,210 | | | | | |
Interest and dividends | | | 3,708,658 | | | | | |
Other assets | | | 9,303 | | | | | |
Total assets | | | | | | | $1,565,091,793 | |
Liabilities | | | | | | | | |
Payables for | | | | | | | | |
Forward foreign currency exchange contracts | | | $241,829 | | | | | |
Investments purchased | | | 8,012,670 | | | | | |
Fund shares reacquired | | | 1,183,869 | | | | | |
Collateral for securities loaned, at value (c) | | | 25,965,425 | | | | | |
Payable to affiliates | | | | | | | | |
Investment adviser | | | 61,856 | | | | | |
Shareholder servicing costs | | | 622 | | | | | |
Distribution and/or service fees | | | 13,243 | | | | | |
Payable for independent Trustees’ compensation | | | 15 | | | | | |
Accrued expenses and other liabilities | | | 270,655 | | | | | |
Total liabilities | | | | | | | $35,750,184 | |
Net assets | | | | | | | $1,529,341,609 | |
Net assets consist of | | | | | | | | |
Paid-in capital | | | $1,548,448,504 | | | | | |
Unrealized appreciation (depreciation) on investments and translation of assets and liabilities in foreign currencies | | | (101,332,520 | ) | | | | |
Accumulated net realized gain (loss) on investments and foreign currency | | | 23,586,562 | | | | | |
Undistributed net investment income | | | 58,639,063 | | | | | |
Net assets | | | | | | | $1,529,341,609 | |
Shares of beneficial interest outstanding | | | | | | | 60,444,526 | |
| | | | | | | | | | | | |
| | | Net assets | | | Shares
outstanding | | | Net asset value
per share | |
Initial Class | | | $561,517,131 | | | | 21,968,184 | | | | $25.56 | |
Service Class | | | 967,824,478 | | | | 38,476,342 | | | | 25.15 | |
| (c) | Non-cash collateral is not included. |
See Notes to Financial Statements
10
MFS Utilities Series
FINANCIAL STATEMENTS | STATEMENT OF OPERATIONS
This statement describes how much your fund earned in investment income and accrued in expenses. It also describes any gains and/or losses generated by fund operations.
| | | | | | | | |
Year ended 12/31/15 | | | | | | | | |
Net investment income | | | | | | | | |
Income | | | | | | | | |
Dividends | | | $60,229,576 | | | | | |
Interest | | | 3,251,517 | | | | | |
Dividends from underlying affiliated funds | | | 40,778 | | | | | |
Foreign taxes withheld | | | (2,135,187 | ) | | | | |
Total investment income | | | | | | | $61,386,684 | |
Expenses | | | | | | | | |
Management fee | | | $13,275,258 | | | | | |
Distribution and/or service fees | | | 2,856,822 | | | | | |
Shareholder servicing costs | | | 73,377 | | | | | |
Administrative services fee | | | 295,188 | | | | | |
Independent Trustees’ compensation | | | 42,488 | | | | | |
Custodian fee | | | 316,150 | | | | | |
Shareholder communications | | | 195,163 | | | | | |
Audit and tax fees | | | 63,001 | | | | | |
Legal fees | | | 15,158 | | | | | |
Miscellaneous | | | 44,726 | | | | | |
Total expenses | | | | | | | $17,177,331 | |
Fees paid indirectly | | | (146 | ) | | | | |
Reduction of expenses by investment adviser | | | (126,344 | ) | | | | |
Net expenses | | | | | | | $17,050,841 | |
Net investment income | | | | | | | $44,335,843 | |
Realized and unrealized gain (loss) on investments and foreign currency | | | | | | | | |
Realized gain (loss) (identified cost basis) | | | | | | | | |
Investments (net of $14,349 country tax) | | | $33,284,303 | | | | | |
Foreign currency | | | 22,241,384 | | | | | |
Net realized gain (loss) on investments and foreign currency | | | | | | | $55,525,687 | |
Change in unrealized appreciation (depreciation) | | | | | | | | |
Investments (net of $19,158 decrease in deferred country tax) | | | $(366,457,003 | ) | | | | |
Translation of assets and liabilities in foreign currencies | | | (1,800,016 | ) | | | | |
Net unrealized gain (loss) on investments and foreign currency translation | | | | | | | $(368,257,019 | ) |
Net realized and unrealized gain (loss) on investments and foreign currency | | | | | | | $(312,731,332 | ) |
Change in net assets from operations | | | | | | | $(268,395,489 | ) |
See Notes to Financial Statements
11
MFS Utilities Series
FINANCIAL STATEMENTS | STATEMENTS OF CHANGES IN NET ASSETS
These statements describe the increases and/or decreases in net assets resulting from operations, any distributions, and any shareholder transactions.
| | | | | | | | |
For years ended 12/31 | | | 2015 | | | | 2014 | |
Change in net assets | | | | | | | | |
From operations | | | | | | | | |
Net investment income | | | $44,335,843 | | | | $49,245,705 | |
Net realized gain (loss) on investments and foreign currency | | | 55,525,687 | | | | 143,793,672 | |
Net unrealized gain (loss) on investments and foreign currency translation | | | (368,257,019 | ) | | | 495,644 | |
Change in net assets from operations | | | $(268,395,489 | ) | | | $193,535,021 | |
Distributions declared to shareholders | | | | | | | | |
From net investment income | | | $(73,039,306 | ) | | | $(39,350,382 | ) |
From net realized gain on investments | | | (125,288,396 | ) | | | (73,072,176 | ) |
Total distributions declared to shareholders | | | $(198,327,702 | ) | | | $(112,422,558 | ) |
Change in net assets from fund share transactions | | | $(11,189,054 | ) | | | $422,023,434 | |
Total change in net assets | | | $(477,912,245 | ) | | | $503,135,897 | |
Net assets | | | | | | | | |
At beginning of period | | | 2,007,253,854 | | | | 1,504,117,957 | |
At end of period (including undistributed net investment income of $58,639,063 and
$62,298,817, respectively) | | | $1,529,341,609 | | | | $2,007,253,854 | |
See Notes to Financial Statements
12
MFS Utilities Series
FINANCIAL STATEMENTS | FINANCIAL HIGHLIGHTS
The financial highlights table is intended to help you understand the fund’s financial performance for the past 5 years. Certain information reflects financial results for a single fund share. The total returns in the table represent the rate by which an investor would have earned (or lost) on an investment in the fund share class (assuming reinvestment of all distributions) held for the entire period.
| | | | | | | | | | | | | | | | | | | | |
| Initial Class | | Years ended 12/31 | |
| | | 2015 | | | 2014 | | | 2013 | | | 2012 | | | 2011 | |
Net asset value, beginning of period | | | $33.97 | | | | $31.88 | | | | $27.61 | | | | $26.08 | | | | $25.27 | |
| Income (loss) from investment operations | | | | | | | | | | | | | | | | | | | | |
Net investment income (d) | | | $0.81 | | | | $0.99 | | | | $0.94 | | | | $0.84 | | | | $0.97 | |
Net realized and unrealized gain (loss) on investments
and foreign currency | | | (5.56 | ) | | | 3.13 | | | | 4.64 | | | | 2.57 | | | | 0.70 | |
Total from investment operations | | | $(4.75 | ) | | | $4.12 | | | | $5.58 | | | | $3.41 | | | | $1.67 | |
| Less distributions declared to shareholders | | | | | | | | | | | | | | | | | | | | |
From net investment income | | | $(1.38 | ) | | | $(0.74 | ) | | | $(0.73 | ) | | | $(1.88 | ) | | | $(0.86 | ) |
From net realized gain on investments | | | (2.28 | ) | | | (1.29 | ) | | | (0.58 | ) | | | — | | | | — | |
Total distributions declared to shareholders | | | $(3.66 | ) | | | $(2.03 | ) | | | $(1.31 | ) | | | $(1.88 | ) | | | $(0.86 | ) |
Net asset value, end of period (x) | | | $25.56 | | | | $33.97 | | | | $31.88 | | | | $27.61 | | | | $26.08 | |
Total return (%) (k)(r)(s)(x) | | | (14.54 | ) | | | 12.77 | | | | 20.60 | | | | 13.40 | | | | 6.78 | |
Ratios (%) (to average net assets)
and Supplemental data: | | | | | | | | | | | | | | | | | | | | |
Expenses before expense reductions (f) | | | 0.79 | | | | 0.79 | | | | 0.80 | | | | 0.82 | | | | 0.80 | |
Expenses after expense reductions (f) | | | 0.78 | | | | 0.78 | | | | 0.80 | | | | 0.82 | | | | 0.80 | |
Net investment income | | | 2.59 | | | | 2.87 | | | | 3.07 | | | | 3.11 | | | | 3.71 | |
Portfolio turnover | | | 42 | | | | 53 | | | | 50 | | | | 51 | | | | 53 | |
Net assets at end of period (000 omitted) | | | $561,517 | | | | $754,927 | | | | $525,386 | | | | $476,685 | | | | $532,447 | |
See Notes to Financial Statements
13
MFS Utilities Series
Financial Highlights – continued
| | | | | | | | | | | | | | | | | | | | |
| Service Class | | Years ended 12/31 | |
| | | 2015 | | | 2014 | | | 2013 | | | 2012 | | | 2011 | |
Net asset value, beginning of period | | | $33.48 | | | | $31.47 | | | | $27.27 | | | | $25.73 | | | | $24.95 | |
| Income (loss) from investment operations | | | | | | | | | | | | | | | | | | | | |
Net investment income (d) | | | $0.72 | | | | $0.92 | | | | $0.85 | | | | $0.71 | | | | $0.89 | |
Net realized and unrealized gain (loss) on investments
and foreign currency | | | (5.47 | ) | | | 3.05 | | | | 4.58 | | | | 2.59 | | | | 0.70 | |
Total from investment operations | | | $(4.75 | ) | | | $3.97 | | | | $5.43 | | | | $3.30 | | | | $1.59 | |
| Less distributions declared to shareholders | | | | | | | | | | | | | | | | | | | | |
From net investment income | | | $(1.30 | ) | | | $(0.67 | ) | | | $(0.65 | ) | | | $(1.76 | ) | | | $(0.81 | ) |
From net realized gain on investments | | | (2.28 | ) | | | (1.29 | ) | | | (0.58 | ) | | | — | | | | — | |
Total distributions declared to shareholders | | | $(3.58 | ) | | | $(1.96 | ) | | | $(1.23 | ) | | | $(1.76 | ) | | | $(0.81 | ) |
Net asset value, end of period (x) | | | $25.15 | | | | $33.48 | | | | $31.47 | | | | $27.27 | | | | $25.73 | |
Total return (%) (k)(r)(s)(x) | | | (14.76 | ) | | | 12.47 | | | | 20.30 | | | | 13.13 | | | | 6.51 | |
Ratios (%) (to average net assets)
and Supplemental data: | | | | | | | | | | | | | | | | | | | | |
Expenses before expense reductions (f) | | | 1.04 | | | | 1.04 | | | | 1.05 | | | | 1.07 | | | | 1.05 | |
Expenses after expense reductions (f) | | | 1.03 | | | | 1.03 | | | | 1.05 | | | | 1.07 | | | | 1.05 | |
Net investment income | | | 2.34 | | | | 2.71 | | | | 2.82 | | | | 2.66 | | | | 3.45 | |
Portfolio turnover | | | 42 | | | | 53 | | | | 50 | | | | 51 | | | | 53 | |
Net assets at end of period (000 omitted) | | | $967,824 | | | | $1,252,327 | | | | $978,732 | | | | $837,196 | | | | $1,458,257 | |
| (d) | Per share data is based on average shares outstanding. |
| (f) | Ratios do not reflect reductions from fees paid indirectly, if applicable. |
| (k) | The total return does not reflect expenses that apply to separate accounts. Inclusion of these charges would reduce the total return figures for all periods shown. |
| (r) | Certain expenses have been reduced without which performance would have been lower. |
| (s) | From time to time the fund may receive proceeds from litigation settlements, without which performance would be lower. |
| (x) | The net asset values and total returns have been calculated on net assets which include adjustments made in accordance with U.S. generally accepted accounting principles required at period end for financial reporting purposes. |
See Notes to Financial Statements
14
MFS Utilities Series
NOTES TO FINANCIAL STATEMENTS
| (1) | | Business and Organization |
MFS Utilities Series (the fund) is a diversified series of MFS Variable Insurance Trust (the trust). The trust is organized as a Massachusetts business trust and is registered under the Investment Company Act of 1940, as amended, as an open-end management investment company. The shareholders of each series of the trust are separate accounts of insurance companies, which offer variable annuity and/or life insurance products, and qualified retirement and pension plans.
The fund is an investment company and accordingly follows the investment company accounting and reporting guidance of the Financial Accounting Standards Board (FASB) Accounting Standards Codification Topic 946 Financial Services – Investment Companies.
| (2) | | Significant Accounting Policies |
General – The preparation of financial statements in conformity with U.S. generally accepted accounting principles requires management to make estimates and assumptions that affect the reported amounts of assets and liabilities, and disclosure of contingent assets and liabilities at the date of the financial statements and the reported amounts of increases and decreases in net assets from operations during the reporting period. Actual results could differ from those estimates. In the preparation of these financial statements, management has evaluated subsequent events occurring after the date of the fund’s Statement of Assets and Liabilities through the date that the financial statements were issued. The fund invests primarily in securities of issuers in the utility industry. Issuers in a single industry can react similarly to market, economic, political and regulatory conditions and developments. The fund invests in foreign securities, including securities of emerging market issuers. Investments in foreign securities are vulnerable to the effects of changes in the relative values of the local currency and the U.S. dollar and to the effects of changes in each country’s legal, political, and economic environment.
In January 2016, FASB issued Accounting Standards Update 2016-01, Financial Instruments – Overall (Subtopic 825-10) – Recognition and Measurement of Financial Assets and Financial Liabilities (“ASU 2016-01”) which would first be effective for annual reporting periods beginning after December 15, 2017, and interim periods therein. ASU 2016-01, which changes the accounting for equity investments and for certain financial liabilities, also modifies the presentation and disclosure requirements for financial instruments. Investment companies are specifically exempted from ASU 2016-01’s equity investment accounting provisions and will continue to follow the industry specific guidance for investment accounting under ASC 946. Although still evaluating the potential impacts of ASU 2016-01 to the fund, management expects that the impact of the fund’s adoption will be limited to additional financial statement disclosures.
Balance Sheet Offsetting – The fund’s accounting policy with respect to balance sheet offsetting is that, absent an event of default by the counterparty or a termination of the agreement, the International Swaps and Derivatives Association (ISDA) Master Agreement does not result in an offset of reported amounts of financial assets and financial liabilities in the Statement of Assets and Liabilities across transactions between the fund and the applicable counterparty. The fund’s right to setoff may be restricted or prohibited by the bankruptcy or insolvency laws of the particular jurisdiction to which a specific master netting agreement counterparty is subject. Balance sheet offsetting disclosures, to the extent applicable to the fund, have been included in the fund’s Significant Accounting Policies note under the captions for each of the fund’s in-scope financial instruments and transactions.
Investment Valuations – Equity securities, including restricted equity securities, are generally valued at the last sale or official closing price on their primary market or exchange as provided by a third-party pricing service. Equity securities, for which there were no sales reported that day, are generally valued at the last quoted daily bid quotation on their primary market or exchange as provided by a third-party pricing service. Debt instruments and floating rate loans, including restricted debt instruments, are generally valued at an evaluated or composite bid as provided by a third-party pricing service. Short-term instruments with a maturity at issuance of 60 days or less may be valued at amortized cost, which approximates market value. Forward foreign currency exchange contracts are generally valued at the mean of bid and asked prices for the time period interpolated from rates provided by a third-party pricing service for proximate time periods. Open-end investment companies are generally valued at net asset value per share. Securities and other assets generally valued on the basis of information from a third-party pricing service may also be valued at a broker/dealer bid quotation. Values obtained from third-party pricing services can utilize both transaction data and market information such as yield, quality, coupon rate, maturity, type of issue, trading characteristics, and other market data. The values of foreign securities and other assets and liabilities expressed in foreign currencies are converted to U.S. dollars using the mean of bid and asked prices for rates provided by a third-party pricing service.
The Board of Trustees has delegated primary responsibility for determining or causing to be determined the value of the fund’s investments (including any fair valuation) to the adviser pursuant to valuation policies and procedures approved by the Board. If the adviser determines that reliable market quotations are not readily available, investments are valued at fair value as determined in good faith by the adviser in accordance with such procedures under the oversight of the Board of Trustees. Under the fund’s valuation policies and procedures, market quotations are not considered to be readily available for most types of debt instruments and floating rate loans and many types of derivatives. These investments are generally valued at fair value based on information from third-party pricing services. In addition, investments may be valued at fair value if the adviser determines that an investment’s value
15
MFS Utilities Series
Notes to Financial Statements – continued
has been materially affected by events occurring after the close of the exchange or market on which the investment is principally traded (such as foreign exchange or market) and prior to the determination of the fund’s net asset value, or after the halting of trading of a specific security where trading does not resume prior to the close of the exchange or market on which the security is principally traded. Events that occur on a frequent basis after foreign markets close (such as developments in foreign markets and significant movements in the U.S. markets) and prior to the determination of the fund’s net asset value may be deemed to have a material effect on the value of securities traded in foreign markets. Accordingly, the fund’s foreign equity securities may often be valued at fair value. The adviser generally relies on third-party pricing services or other information (such as the correlation with price movements of similar securities in the same or other markets; the type, cost and investment characteristics of the security; the business and financial condition of the issuer; and trading and other market data) to assist in determining whether to fair value and at what value to fair value an investment. The value of an investment for purposes of calculating the fund’s net asset value can differ depending on the source and method used to determine value. When fair valuation is used, the value of an investment used to determine the fund’s net asset value may differ from quoted or published prices for the same investment. There can be no assurance that the fund could obtain the fair value assigned to an investment if it were to sell the investment at the same time at which the fund determines its net asset value per share.
Various inputs are used in determining the value of the fund’s assets or liabilities. These inputs are categorized into three broad levels. In certain cases, the inputs used to measure fair value may fall into different levels of the fair value hierarchy. In such cases, an investment’s level within the fair value hierarchy is based on the lowest level of input that is significant to the fair value measurement. The fund’s assessment of the significance of a particular input to the fair value measurement in its entirety requires judgment, and considers factors specific to the investment. Level 1 includes unadjusted quoted prices in active markets for identical assets or liabilities. Level 2 includes other significant observable market-based inputs (including quoted prices for similar securities, interest rates, prepayment speed, and credit risk). Level 3 includes unobservable inputs, which may include the adviser’s own assumptions in determining the fair value of investments. Other financial instruments are derivative instruments not reflected in total investments, such as forward foreign currency exchange contracts. The following is a summary of the levels used as of December 31, 2015 in valuing the fund’s assets or liabilities:
| | | | | | | | | | | | | | | | |
| Investments at Value | | Level 1 | | | Level 2 | | | Level 3 | | | Total | |
| Equity Securities: | | | | | | | | | | | | | | | | |
United States | | | $1,091,025,114 | | | | $— | | | | $— | | | | $1,091,025,114 | |
Portugal | | | — | | | | 78,456,519 | | | | — | | | | 78,456,519 | |
United Kingdom | | | 16,539,786 | | | | 29,580,327 | | | | — | | | | 46,120,113 | |
Italy | | | — | | | | 42,616,150 | | | | — | | | | 42,616,150 | |
Canada | | | 41,655,089 | | | | — | | | | — | | | | 41,655,089 | |
France | | | — | | | | 25,551,491 | | | | — | | | | 25,551,491 | |
China | | | — | | | | 24,335,028 | | | | — | | | | 24,335,028 | |
Sweden | | | — | | | | 22,753,701 | | | | — | | | | 22,753,701 | |
Brazil | | | — | | | | 22,242,016 | | | | — | | | | 22,242,016 | |
Other Countries | | | 16,852,658 | | | | 80,180,726 | | | | — | | | | 97,033,384 | |
| U.S. Corporate Bonds | | | — | | | | 1,006,013 | | | | — | | | | 1,006,013 | |
| Commercial Mortgage-Backed Securities | | | — | | | | 5,495 | | | | — | | | | 5,495 | |
| Mutual Funds | | | 57,194,403 | | | | — | | | | — | | | | 57,194,403 | |
| Total Investments | | | $1,223,267,050 | | | | $326,727,466 | | | | $— | | | | $1,549,994,516 | |
| | | | |
| Other Financial Instruments | | | | | | | | | | | | |
| Forward Foreign Currency Exchange Contracts | | | $— | | | | $5,681,990 | | | | $— | | | | $5,681,990 | |
For further information regarding security characteristics, see the Portfolio of Investments.
Of the level 2 investments presented above, equity investments amounting to $45,446,820 would have been considered level 1 investments at the beginning of the period. Of the level 1 investments presented above, equity investments amounting to $9,368,913 would have been considered level 2 investments at the beginning of the period. The primary reason for changes in the classifications between levels 1 and 2 occurs when foreign equity securities are fair valued using other observable market-based inputs in place of the closing exchange price due to events occurring after the close of the exchange or market on which the investment is principally traded. The fund’s foreign equity securities may often be valued at fair value. The fund’s policy is to recognize transfers between the levels as of the end of the period.
Foreign Currency Translation – Purchases and sales of foreign investments, income, and expenses are converted into U.S. dollars based upon currency exchange rates prevailing on the respective dates of such transactions or on the reporting date for foreign denominated receivables and payables. Gains and losses attributable to foreign currency exchange rates on sales of securities are recorded for financial statement purposes as net realized gains and losses on investments. Gains and losses attributable to foreign
16
MFS Utilities Series
Notes to Financial Statements – continued
exchange rate movements on receivables, payables, income and expenses are recorded for financial statement purposes as foreign currency transaction gains and losses. That portion of both realized and unrealized gains and losses on investments that results from fluctuations in foreign currency exchange rates is not separately disclosed.
Derivatives – The fund uses derivatives for different purposes, primarily to increase or decrease exposure to a particular market or segment of the market, or security, to increase or decrease interest rate or currency exposure, or as alternatives to direct investments. Derivatives are used for hedging or non-hedging purposes. While hedging can reduce or eliminate losses, it can also reduce or eliminate gains. When the fund uses derivatives as an investment to increase market exposure, or for hedging purposes, gains and losses from derivative instruments may be substantially greater than the derivative’s original cost.
The derivative instruments used by the fund were forward foreign currency exchange contracts. The fund’s period end derivatives, as presented in the Portfolio of Investments and the associated Derivative Contract tables, generally are indicative of the volume of its derivative activity during the period.
The following table presents, by major type of derivative contract, the fair value, on a gross basis, of the asset and liability components of derivatives held by the fund at December 31, 2015 as reported in the Statement of Assets and Liabilities:
| | | | | | | | | | |
| | | | | Fair Value | |
| Risk | | Derivative Contracts | | Asset Derivatives | | | Liability Derivatives | |
| Foreign Exchange | | Forward Foreign Currency Exchange | | | $5,923,819 | | | | $(241,829 | ) |
The following table presents, by major type of derivative contract, the realized gain (loss) on derivatives held by the fund for the year ended December 31, 2015 as reported in the Statement of Operations:
| | | | |
| Risk | | Foreign Currency | |
| Foreign Exchange | | | $22,680,588 | |
The following table presents, by major type of derivative contract, the change in unrealized appreciation (depreciation) on derivatives held by the fund for the year ended December 31, 2015 as reported in the Statement of Operations:
| | | | |
| Risk | | Translation of Assets and Liabilities in Foreign Currencies | |
| Foreign Exchange | | | $(1,756,812 | ) |
Derivative counterparty credit risk is managed through formal evaluation of the creditworthiness of all potential counterparties. On certain, but not all, uncleared derivatives, the fund attempts to reduce its exposure to counterparty credit risk whenever possible by entering into an ISDA Master Agreement on a bilateral basis. The ISDA Master Agreement gives each party to the agreement the right to terminate all transactions traded under such agreement if there is a certain deterioration in the credit quality of the other party. Upon an event of default or a termination of the ISDA Master Agreement, the non-defaulting party has the right to close out all transactions traded under such agreement and to net amounts owed under each transaction to one net amount payable by one party to the other. This right to close out and net payments across all transactions traded under the ISDA Master Agreement could result in a reduction of the fund’s credit risk to such counterparty equal to any amounts payable by the fund under the applicable transactions, if any.
Collateral and margin requirements differ by type of derivative. Margin requirements are set by the clearing broker and the clearing house for cleared derivatives (e.g., futures contracts, cleared swaps, and exchange-traded options) while collateral terms are contract specific for uncleared derivatives (e.g., forward foreign currency exchange contracts, uncleared swap agreements, and uncleared options). For derivatives traded under an ISDA Master Agreement, which contains a collateral support annex, the collateral requirements are netted across all transactions traded under such agreement and one amount is posted from one party to the other to collateralize such obligations. Cash that has been segregated to cover the fund’s collateral or margin obligations under derivative contracts, if any, will be reported separately in the Statement of Assets and Liabilities as “Restricted cash” or “Deposits with brokers.” Securities pledged as collateral or margin for the same purpose, if any, are noted in the Portfolio of Investments.
Forward Foreign Currency Exchange Contracts – The fund entered into forward foreign currency exchange contracts for the purchase or sale of a specific foreign currency at a fixed price on a future date. These contracts may be used to hedge the fund’s currency risk or for non-hedging purposes. For hedging purposes, the fund may enter into contracts to deliver or receive foreign currency that the fund will receive from or use in its normal investment activities. The fund may also use contracts to hedge against declines in the value of foreign currency denominated securities due to unfavorable exchange rate movements. For non-hedging purposes, the fund may enter into contracts with the intent of changing the relative exposure of the fund’s portfolio of securities to different currencies to take advantage of anticipated exchange rate changes.
17
MFS Utilities Series
Notes to Financial Statements – continued
Forward foreign currency exchange contracts are adjusted by the daily exchange rate of the underlying currency and any unrealized gains or losses are recorded as a receivable or payable for forward foreign currency exchange contracts until the contract settlement date. On contract settlement date, any gain or loss on the contract is recorded as realized gains or losses on foreign currency.
Risks may arise upon entering into these contracts from unanticipated movements in the value of the contract and from the potential inability of counterparties to meet the terms of their contracts. Generally, the fund’s maximum risk due to counterparty credit risk is the unrealized gain on the contract due to the use of Continuous Linked Settlement, an industry accepted settlement system. This risk is mitigated in cases where there is an ISDA Master Agreement between the fund and the counterparty providing for netting as described above and, where applicable, by the posting of collateral by the counterparty to the fund to cover the fund’s exposure to the counterparty under such ISDA Master Agreement.
Security Loans – Under its Securities Lending Agency Agreement with the fund, State Street Bank and Trust Company (“State Street”), as lending agent, loans the securities of the fund to certain qualified institutions (the “Borrowers”) approved by the fund. Security loans can be terminated at the discretion of either the lending agent or the fund and the related securities must be returned within the earlier of the standard trade settlement period for such securities or within three business days. The loans are collateralized by cash and/or U.S. Treasury and federal agency obligations in an amount typically at least equal to the market value of the securities loaned. On loans collateralized by cash, the cash collateral is invested in a money market fund. The market value of the loaned securities is determined at the close of business of the fund and any additional required collateral is delivered to the fund on the next business day. State Street provides the fund with indemnification against Borrower default. In the event of Borrower default, State Street will, for the benefit of the fund, either purchase securities identical to those loaned or, when such purchase is commercially impracticable, pay the fund the market value of the loaned securities. In return, State Street assumes the fund’s rights to the related collateral. If the collateral value is less than the cost to purchase identical securities, State Street is responsible for the shortfall, but only to the extent that such shortfall is not due to a decline in collateral value resulting from collateral reinvestment for which the fund bears the risk of loss. At period end, the fund had investment securities on loan, all of which were classified as equity securities in the fund’s Portfolio of Investments, with a fair value of $27,166,081. The fair value of the fund’s investment securities on loan and a related liability of $25,965,425 for cash collateral received on securities loaned are both presented gross in the Statement of Assets and Liabilities. Additionally, these loans were collateralized by U.S. Treasury Obligations of $1,835,395. The collateral received on securities loaned exceeded the value of securities on loan at period end. The liability for cash collateral for securities loaned is carried at fair value, which is categorized as level 2 within the fair value hierarchy. A portion of the income generated upon investment of the collateral is remitted to the Borrowers, and the remainder is allocated between the fund and the lending agent. On loans collateralized by U.S. Treasury and/or federal agency obligations, a fee is received from the Borrower, and is allocated between the fund and the lending agent. Income from securities lending is included in “Interest” income, in the Statement of Operations. The dividend and interest income earned on the securities loaned is accounted for in the same manner as other dividend and interest income.
Indemnifications – Under the fund’s organizational documents, its officers and Trustees may be indemnified against certain liabilities and expenses arising out of the performance of their duties to the fund. Additionally, in the normal course of business, the fund enters into agreements with service providers that may contain indemnification clauses. The fund’s maximum exposure under these agreements is unknown as this would involve future claims that may be made against the fund that have not yet occurred.
Investment Transactions and Income – Investment transactions are recorded on the trade date. Interest income is recorded on the accrual basis. All premium and discount is amortized or accreted for financial statement purposes in accordance with U.S. generally accepted accounting principles. Dividends received in cash are recorded on the ex-dividend date. Certain dividends from foreign securities will be recorded when the fund is informed of the dividend if such information is obtained subsequent to the ex-dividend date. Dividend and interest payments received in additional securities are recorded on the ex-dividend or ex-interest date in an amount equal to the value of the security on such date.
The fund may receive proceeds from litigation settlements. Any proceeds received from litigation involving portfolio holdings are reflected in the Statement of Operations in realized gain/loss if the security has been disposed of by the fund or in unrealized gain/loss if the security is still held by the fund. Any other proceeds from litigation not related to portfolio holdings are reflected as other income in the Statement of Operations.
Fees Paid Indirectly – Prior to October 1, 2015, the fund’s custody fee could be reduced by a credit earned under an arrangement that measured the value of U.S. dollars deposited with the custodian by the fund. The amount of the credit, for the year December 31, 2015, is shown as a reduction of total expenses in the Statement of Operations.
Tax Matters and Distributions – The fund intends to qualify as a regulated investment company, as defined under Subchapter M of the Internal Revenue Code, and to distribute all of its taxable income, including realized capital gains. As a result, no provision for federal income tax is required. The fund’s federal tax returns, when filed, will remain subject to examination by the Internal Revenue Service for a three year period. Management has analyzed the fund’s tax positions taken on federal and state tax returns for all open tax years and does not believe that there are any uncertain tax positions that require recognition of a tax liability. Foreign taxes, if
18
MFS Utilities Series
Notes to Financial Statements – continued
any, have been accrued by the fund in the accompanying financial statements in accordance with the applicable foreign tax law. Foreign income taxes may be withheld by certain countries in which the fund invests. Additionally, capital gains realized by the fund on securities issued in or by certain foreign countries may be subject to capital gains tax imposed by those countries.
Distributions to shareholders are recorded on the ex-dividend date. Income and capital gain distributions are determined in accordance with income tax regulations, which may differ from U.S. generally accepted accounting principles. Certain capital accounts in the financial statements are periodically adjusted for permanent differences in order to reflect their tax character. These adjustments have no impact on net assets or net asset value per share. Temporary differences which arise from recognizing certain items of income, expense, gain or loss in different periods for financial statement and tax purposes will reverse at some time in the future. Distributions in excess of net investment income or net realized gains are temporary overdistributions for financial statement purposes resulting from differences in the recognition or classification of income or distributions for financial statement and tax purposes.
Book/tax differences primarily relate to wash sale loss deferrals, derivative transactions, and partnership adjustments.
The tax character of distributions declared to shareholders for the last fiscal year is as follows:
| | | | | | | | |
| | | 12/31/15 | | | 12/31/14 | |
| Ordinary income (including any short-term capital gains) | | | $102,302,415 | | | | $69,599,950 | |
| Long-term capital gains | | | 96,025,287 | | | | 42,822,608 | |
| Total distributions | | | $198,327,702 | | | | $112,422,558 | |
The federal tax cost and the tax basis components of distributable earnings were as follows:
| | | | |
| As of 12/31/15 | | | | |
| Cost of investments | | | $1,670,769,017 | |
| Gross appreciation | | | 169,438,781 | |
| Gross depreciation | | | (290,213,282 | ) |
| Net unrealized appreciation (depreciation) | | | $(120,774,501 | ) |
| Undistributed ordinary income | | | 64,805,580 | |
| Undistributed long-term capital gain | | | 37,406,828 | |
| Other temporary differences | | | (544,802 | ) |
Multiple Classes of Shares of Beneficial Interest – The fund offers multiple classes of shares, which differ in their respective distribution and/or service fees. The fund’s income, realized and unrealized gain (loss), and common expenses are allocated to shareholders based on the daily net assets of each class. Dividends are declared separately for each class. Differences in per share dividend rates are generally due to differences in separate class expenses. The fund’s distributions declared to shareholders as reported in the Statements of Changes in Net Assets are presented by class as follows:
| | | | | | | | | | | | | | | | |
| | | From net investment
income | | | From net realized gain on
investments | |
| | | Year ended
12/31/15 | | | Year ended
12/31/14 | | | Year ended
12/31/15 | | | Year ended
12/31/14 | |
| Initial Class | | | $28,015,638 | | | | $15,974,531 | | | | $46,266,869 | | | | $28,015,023 | |
| Service Class | | | 45,023,668 | | | | 23,375,851 | | | | 79,021,527 | | | | 45,057,153 | |
| Total | | | $73,039,306 | | | | $39,350,382 | | | | $125,288,396 | | | | $73,072,176 | |
| (3) | | Transactions with Affiliates |
Investment Adviser – The fund has an investment advisory agreement with MFS to provide overall investment management and related administrative services and facilities to the fund. The management fee is computed daily and paid monthly at the following annual rates:
| | | | |
| First $1 billion of average daily net assets | | | 0.75% | |
| Average daily net assets in excess of $1 billion | | | 0.70% | |
MFS has agreed in writing to reduce its management fee by a specified amount if certain MFS mutual fund assets exceed thresholds agreed to by MFS and the fund’s Board of Trustees. For the year ended December 31, 2015, this management fee reduction amounted to $126,344, which is included in the reduction of total expenses in the Statement of Operations. The management fee incurred for the year ended December 31, 2015 was equivalent to an annual effective rate of 0.72% of the fund’s average daily net assets.
Distributor – MFS Fund Distributors, Inc. (MFD), a wholly-owned subsidiary of MFS, is the distributor of shares of the fund. The Trustees have adopted a distribution plan for the Service Class shares pursuant to Rule 12b-1 under the Investment Company Act of 1940.
19
MFS Utilities Series
Notes to Financial Statements – continued
The fund’s distribution plan provides that the fund will pay MFD distribution and/or service fees equal to 0.25% per annum of its average daily net assets attributable to Service Class shares as partial consideration for services performed and expenses incurred by MFD and financial intermediaries (including participating insurance companies that invest in the fund to fund variable annuity and variable life insurance contracts, sponsors of qualified retirement and pension plans that invest in the fund, and affiliates of these participating insurance companies and plan sponsors) in connection with the sale and distribution of the Service Class shares. MFD may subsequently pay all, or a portion, of the distribution and/or service fees to financial intermediaries.
Shareholder Servicing Agent – MFS Service Center, Inc. (MFSC), a wholly-owned subsidiary of MFS, receives a fee from the fund for its services as shareholder servicing agent. For the year ended December 31, 2015, the fee was $70,134, which equated to 0.0038% annually of the fund’s average daily net assets. MFSC also receives payment from the fund for out-of-pocket expenses paid by MFSC on behalf of the fund. For the year ended December 31, 2015, these costs amounted to $3,243.
Administrator – MFS provides certain financial, legal, shareholder communications, compliance, and other administrative services to the fund. Under an administrative services agreement, the fund reimburses MFS the costs incurred to provide these services. The fund is charged an annual fixed amount of $17,500 plus a fee based on average daily net assets. The administrative services fee incurred for the year ended December 31, 2015 was equivalent to an annual effective rate of 0.0162% of the fund’s average daily net assets.
Trustees’ and Officers’ Compensation – The fund pays compensation to independent Trustees in the form of a retainer, attendance fees, and additional compensation to Board and Committee chairpersons. The fund does not pay compensation directly to Trustees or officers of the fund who are also officers of the investment adviser, all of whom receive remuneration for their services to the fund from MFS. Certain officers and Trustees of the fund are officers or directors of MFS, MFD, and MFSC.
Other – This fund and certain other funds managed by MFS (the funds) have entered into a service agreement (the ISO Agreement) which provides for payment of fees solely by the funds to Tarantino LLC in return for the provision of services of an Independent Senior Officer (ISO) for the funds. Frank L. Tarantino serves as the ISO and is an officer of the funds and the sole member of Tarantino LLC. The funds can terminate the ISO Agreement with Tarantino LLC at any time under the terms of the ISO Agreement. For the year ended December 31, 2015, the fee paid by the fund under this agreement was $5,920 and is included in “Miscellaneous” expense in the Statement of Operations. MFS has agreed to bear all expenses associated with office space, other administrative support, and supplies provided to the ISO.
The fund invests in the MFS Institutional Money Market Portfolio which is managed by MFS and seeks current income consistent with preservation of capital and liquidity. Income earned on this investment is included in “Dividends from underlying affiliated funds” in the Statement of Operations. This money market fund does not pay a management fee to MFS.
For the year ended December 31, 2015, purchases and sales of investments, other than short-term obligations, aggregated $742,282,857 and $814,922,832, respectively.
| (5) | | Shares of Beneficial Interest |
The fund’s Declaration of Trust permits the Trustees to issue an unlimited number of full and fractional shares of beneficial interest. Transactions in fund shares were as follows:
| | | | | | | | | | | | | | | | |
| | | Year ended 12/31/15 | | | Year ended 12/31/14 | |
| | | Shares | | | Amount | | | Shares | | | Amount | |
| Shares sold | | | | | | | | | | | | | | | | |
Initial Class | | | 661,936 | | | | $20,487,219 | | | | 1,464,376 | | | | $50,703,687 | |
Service Class | | | 5,092,320 | | | | 157,180,531 | | | | 5,940,410 | | | | 201,152,012 | |
| | | 5,754,256 | | | | $177,667,750 | | | | 7,404,786 | | | | $251,855,699 | |
| Shares issued in connection with acquisition of MFS Utilities Portfolio | | | | | | | | | | | | | | | | |
Initial Class | | | | | | | | | | | 5,353,453 | | | | $189,030,408 | |
Service Class | | | | | | | | | | | 3,363,246 | | | | 117,040,963 | |
| | | | | | | | | | | 8,716,699 | | | | $306,071,371 | |
| Shares issued to shareholders in reinvestment of distributions | | | | | | | | | | | | | | | | |
Initial Class | | | 2,750,185 | | | | $74,282,507 | | | | 1,262,979 | | | | $43,989,554 | |
Service Class | | | 4,663,353 | | | | 124,045,195 | | | | 1,991,648 | | | | 68,433,004 | |
| | | 7,413,538 | | | | $198,327,702 | | | | 3,254,627 | | | | $112,422,558 | |
20
MFS Utilities Series
Notes to Financial Statements – continued
| | | | | | | | | | | | | | | | |
| | | Year ended 12/31/15 | | | Year ended 12/31/14 | |
| | | Shares | | | Amount | | | Shares | | | Amount | |
| Shares reacquired | | | | | | | | | | | | | | | | |
Initial Class | | | (3,669,815 | ) | | | $(115,152,159 | ) | | | (2,336,474 | ) | | | $(79,950,659 | ) |
Service Class | | | (8,683,815 | ) | | | (272,032,347 | ) | | | (4,994,588 | ) | | | (168,375,535 | ) |
| | | (12,353,630 | ) | | | $(387,184,506 | ) | | | (7,331,062 | ) | | | $(248,326,194 | ) |
| Net change | | | | | | | | | | | | | | | | |
Initial Class | | | (257,694 | ) | | | $(20,382,433 | ) | | | 5,744,334 | | | | $203,772,990 | |
Service Class | | | 1,071,858 | | | | 9,193,379 | | | | 6,300,716 | | | | 218,250,444 | |
| | | 814,164 | | | | $(11,189,054 | ) | | | 12,045,050 | | | | $422,023,434 | |
The fund and certain other funds managed by MFS participate in a $1.25 billion unsecured committed line of credit, subject to a $1 billion sublimit, provided by a syndication of banks under a credit agreement. Borrowings may be made for temporary financing needs. Interest is charged to each fund, based on its borrowings, generally at a rate equal to the higher of the Overnight Federal Reserve funds rate or daily one month LIBOR plus an agreed upon spread. A commitment fee, based on the average daily, unused portion of the committed line of credit, is allocated among the participating funds at the end of each calendar quarter. In addition, the fund and other funds managed by MFS have established unsecured uncommitted borrowing arrangements with certain banks for temporary financing needs. Interest is charged to each fund, based on its borrowings, at a rate equal to the Overnight Federal Reserve funds rate plus an agreed upon spread. For the year ended December 31, 2015, the fund’s commitment fee and interest expense were $5,858 and $0, respectively, and are included in “Miscellaneous” expense in the Statement of Operations.
| (7) | | Transactions in Underlying Affiliated Funds – Affiliated Issuers |
An affiliated issuer may be considered one in which the fund owns 5% or more of the outstanding voting securities, or a company which is under common control. For the purposes of this report, the fund assumes the following to be an affiliated issuer:
| | | | | | | | | | | | | | | | |
| Underlying Affiliated Fund | | Beginning
Shares/Par
Amount | | | Acquisitions
Shares/Par
Amount | | | Dispositions
Shares/Par
Amount | | | Ending
Shares/Par
Amount | |
| MFS Institutional Money Market Portfolio | | | 88,762,069 | | | | 383,507,206 | | | | (441,040,297 | ) | | | 31,228,978 | |
| | | | |
| Underlying Affiliated Fund | | Realized
Gain (Loss) | | | Capital Gain
Distributions | | | Dividend
Income | | | Ending
Value | |
| MFS Institutional Money Market Portfolio | | | $— | | | | $— | | | | $40,778 | | | | $31,228,978 | |
At close of business on August 8, 2014, the fund with net assets of approximately $1,675,061,220, acquired all of the assets and liabilities of MFS Utilities Portfolio, a series of MFS Variable Insurance Trust II. The purpose of the transaction was to provide shareholders of MFS Utilities Portfolio the opportunity to participate in a larger combined portfolio with an identical investment objective and similar investment policies and strategies. The acquisition was accomplished by a tax-free exchange of approximately 8,716,699 shares of the fund (valued at approximately $306,071,371) for all of the assets and liabilities of MFS Utilities Portfolio. MFS Utilities Portfolio then distributed the shares of the fund that MFS Utilities Portfolio received from the fund to its shareholders. MFS Utilities Portfolio’s investments on that date were valued at approximately $295,873,296 with a cost basis of approximately $242,380,563. For financial reporting purposes, assets received and shares issued by the fund were recorded at fair value; however, the cost basis of the investments received from MFS Utilities Portfolio were carried forward to align ongoing reporting of the fund’s realized and unrealized gains and losses with amounts distributable to shareholders for tax purposes.
21
MFS Utilities Series
REPORT OF INDEPENDENT REGISTERED PUBLIC ACCOUNTING FIRM
To the Board of Trustees of MFS Variable Insurance Trust and the Shareholders of MFS Utilities Series:
We have audited the accompanying statement of assets and liabilities, including the portfolio of investments, of MFS Utilities Series (one of the series of MFS Variable Insurance Trust) (the “Fund”) as of December 31, 2015, and the related statement of operations for the year then ended, the statements of changes in net assets for each of the two years in the period then ended, and the financial highlights for each of the five years in the period then ended. These financial statements and financial highlights are the responsibility of the Fund’s management. Our responsibility is to express an opinion on these financial statements and financial highlights based on our audits.
We conducted our audits in accordance with the standards of the Public Company Accounting Oversight Board (United States). Those standards require that we plan and perform the audit to obtain reasonable assurance about whether the financial statements and financial highlights are free of material misstatement. The Fund is not required to have, nor were we engaged to perform, an audit of its internal control over financial reporting. Our audits included consideration of internal control over financial reporting as a basis for designing audit procedures that are appropriate in the circumstances, but not for the purpose of expressing an opinion on the effectiveness of the Fund’s internal control over financial reporting. Accordingly, we express no such opinion. An audit also includes examining, on a test basis, evidence supporting the amounts and disclosures in the financial statements, assessing the accounting principles used and significant estimates made by management, as well as evaluating the overall financial statement presentation. Our procedures included confirmation of securities owned as of December 31, 2015, by correspondence with the custodian and brokers; when replies were not received from brokers, we performed other auditing procedures. We believe that our audits provide a reasonable basis for our opinion.
In our opinion, such financial statements and financial highlights referred to above present fairly, in all material respects, the financial position of MFS Utilities Series as of December 31, 2015, the results of its operations for the year then ended, the changes in its net assets for each of the two years in the period then ended, and the financial highlights for each of the five years in the period then ended, in conformity with accounting principles generally accepted in the United States of America.
DELOITTE & TOUCHE LLP
Boston, Massachusetts
February 16, 2016
22
MFS Utilities Series
TRUSTEES AND OFFICERS – IDENTIFICATION AND BACKGROUND
The Trustees and Officers of the Trust, as of February 1, 2016, are listed below, together with their principal occupations during the past five years. (Their titles may have varied during that period.) The address of each Trustee and Officer is 111 Huntington Avenue, Boston, Massachusetts 02199-7618.
| | | | | | | | |
Name, Age | | Position(s)
Held with Fund | | Trustee/Officer
Since (h) | | Principal Occupations
During the Past Five Years | | Other Directorships (j) |
| INTERESTED TRUSTEES |
Robert J. Manning (k)
(age 52) | | Trustee | | February 2004 | | Massachusetts Financial Services Company, Chairman, Co-Chief Executive Officer and Director | | N/A |
| | | | |
Robin A. Stelmach (k) (age 54) | | Trustee and President | | January 2014 | | Massachusetts Financial Services Company, Executive Vice President and Chief Operating Officer | | N/A |
| | |
| INDEPENDENT TRUSTEES | | | | |
David H. Gunning
(age 73) | | Trustee and Chair of Trustees | | January 2004 | | Private investor | | Lincoln Electric Holdings, Inc., Director; Development Alternatives, Inc., Director/Non-Executive Chairman |
| | | | |
Steven E. Buller (age 64) | | Trustee | | February 2014 | | Chairman, Financial Accounting Standards Advisory Council; Standing Advisory Group, Public Company Accounting Oversight Board, Member (until 2014); BlackRock, Inc. (investment management), Managing Director (until 2014), BlackRock Finco UK (investment management), Director (until 2014) | | N/A |
| | | | |
Robert E. Butler
(age 74) | | Trustee | | January 2006 | | Consultant – investment company industry regulatory and compliance matters | | N/A |
| | | | |
Maureen R. Goldfarb (age 60) | | Trustee | | January 2009 | | Private investor | | N/A |
| | | | |
William R. Gutow
(age 74) | | Trustee | | December 1993 | | Private investor and real estate consultant; Capitol Entertainment Management Company (video franchise), Vice Chairman | | Texas Donuts, Vice Chairman (until 2010) |
| | | | |
Michael Hegarty
(age 71) | | Trustee | | December 2004 | | Private investor | | Rouse Properties Inc., Director; Capmark Financial Group Inc., Director |
| | | | |
John P. Kavanaugh (age 61) | | Trustee | | January 2009 | | Private investor | | N/A |
| | | | |
Maryanne L. Roepke (age 59) | | Trustee | | May 2014 | | American Century Investments (investment management), Senior Vice President and Chief Compliance Officer (until 2014) | | N/A |
| | | | |
Laurie J. Thomsen
(age 58) | | Trustee | | March 2005 | | Private investor | | The Travelers Companies, Director; Dycom Industries, Inc., Director |
| | | | |
Robert W. Uek
(age 74) | | Trustee | | January 2006 | | Consultant to investment company industry | | N/A |
| | | | |
| OFFICERS | | | | | | | | |
Christopher R. Bohane (k)
(age 42) | | Assistant Secretary and Assistant Clerk | | July 2005 | | Massachusetts Financial Services Company, Vice President and Assistant General Counsel | | N/A |
| | | | |
Kino Clark (k) (age 47) | | Assistant Treasurer | | January 2012 | | Massachusetts Financial Services Company, Vice President | | N/A |
| | | | |
Kristin V. Collins (k) (age 42) | | Assistant Secretary and Assistant Clerk | | September 2015 | | Massachusetts Financial Services Company, Vice President and Assistant General Counsel | | N/A |
| | | | |
Thomas H. Connors (k) (age 56) | | Assistant Secretary and Assistant Clerk | | September 2012 | | Massachusetts Financial Services Company, Vice President and Senior Counsel; Deutsche Investment Management Americas Inc. (financial service provider), Director and Senior Counsel (until 2012) | | N/A |
23
MFS Utilities Series
Trustees and Officers – continued
| | | | | | | | |
Name, Age | | Position(s)
Held with Fund | | Trustee/Officer
Since (h) | | Principal Occupations
During the Past Five Years | | Other Directorships (j) |
Ethan D. Corey (k)
(age 52) | | Assistant Secretary and Assistant Clerk | | July 2005 | | Massachusetts Financial Services Company, Senior Vice President and Associate General Counsel | | N/A |
| | | | |
David L. DiLorenzo (k)
(age 47) | | Treasurer | | July 2005 | | Massachusetts Financial Services Company, Senior Vice President | | N/A |
| | | | |
Brian E. Langenfeld (k) (age 42) | | Assistant Secretary and Assistant Clerk | | June 2006 | | Massachusetts Financial Services Company, Vice President and Senior Counsel | | N/A |
| | | | |
Kenneth Paek (k) (age 41) | | Assistant Treasurer | | February 2015 | | Massachusetts Financial Services Company, Vice President; Cohen & Steers, Vice President/Head of Fund Administration (until 2014) | | N/A |
| | | | |
Susan A. Pereira (k)
(age 45) | | Assistant Secretary and Assistant Clerk | | July 2005 | | Massachusetts Financial Services Company, Vice President and Senior Counsel | | N/A |
| | | | |
Kasey L. Phillips (k) (age 45) | | Assistant Treasurer | | September 2012 | | Massachusetts Financial Services Company, Vice President; Wells Fargo Funds Management, LLC, Senior Vice President, Fund Treasurer (until 2012) | | N/A |
| | | | |
Mark N. Polebaum (k)
(age 63) | | Secretary and Clerk | | January 2006 | | Massachusetts Financial Services Company, Executive Vice President, General Counsel and Secretary | | N/A |
| | | | |
Matthew A. Stowe (k) (age 41) | | Assistant Secretary and Assistant Clerk | | October 2014 | | Massachusetts Financial Services Company, Vice President and Assistant General Counsel | | N/A |
| | | | |
Frank L. Tarantino
(age 71) | | Independent Senior Officer | | June 2004 | | Tarantino LLC (provider of compliance services), Principal | | N/A |
| | | | |
Richard S. Weitzel (k)
(age 45) | | Assistant Secretary and Assistant Clerk | | October 2007 | | Massachusetts Financial Services Company, Senior Vice President and Associate General Counsel | | N/A |
| | | | |
Martin J. Wolin (k) (age 48) | | Chief Compliance Officer | | July 2015 | | Massachusetts Financial Services Company, Senior Vice President and Chief Compliance Officer (since July 2015); Mercer (financial service provider), Chief Risk and Compliance Officer, North America and Latin America (until June 2015) | | N/A |
| | | | |
James O. Yost (k)
(age 55) | | Deputy Treasurer | | September 1990 | | Massachusetts Financial Services Company, Senior Vice President | | N/A |
| (h) | Date first appointed to serve as Trustee/officer of an MFS Fund. Each Trustee has served continuously since appointment unless indicated otherwise. For the period from December 15, 2004 until February 22, 2005, Mr. Manning served as Advisory Trustee. Prior to January 2012, Messrs. DiLorenzo and Yost served as Assistant Treasurers of the Funds. Ms. Stelmach was appointed as President of the Funds as of October 1, 2014. |
| (j) | Directorships or trusteeships of companies required to report to the Securities and Exchange Commission (i.e., “public companies”). |
| (k) | “Interested person” of the Trust within the meaning of the Investment Company Act of 1940 (referred to as the 1940 Act), which is the principal federal law governing investment companies like the fund, as a result of a position with MFS. The address of MFS is 111 Huntington Avenue, Boston, Massachusetts 02199-7618. |
Each Trustee (except Ms. Stelmach, Mr. Buller and Ms. Roepke) has been elected by shareholders and each Trustee and officer holds office until his or her successor is chosen and qualified or until his or her earlier death, resignation, retirement or removal. The Trust does not hold annual meetings for the purpose of electing Trustees, and Trustees are not elected for fixed terms. Messrs. Buller, Butler, Kavanaugh, Uek and Ms. Roepke are members of the Trust’s Audit Committee.
Each of the Fund’s Trustees and officers holds comparable positions with certain other funds of which MFS or a subsidiary is the investment adviser or distributor, and, in the case of the officers, with certain affiliates of MFS. As of February 1, 2016, the Trustees served as board members of 137 funds within the MFS Family of Funds.
24
MFS Utilities Series
Trustees and Officers – continued
The Statement of Additional Information for a Fund includes further information about the Trustees and is available without charge upon request by calling 1-800-225-2606.
| | |
Investment Adviser Massachusetts Financial Services Company 111 Huntington Avenue Boston, MA 02199-7618 | | Custodian State Street Bank and Trust Company 1 Lincoln Street Boston, MA 02111-2900 |
Distributor MFS Fund Distributors, Inc. 111 Huntington Avenue Boston, MA 02199-7618 | | Independent Registered Public Accounting Firm Deloitte & Touche LLP 200 Berkeley Street Boston, MA 02116 |
Portfolio Managers Claud Davis Maura Shaughnessy | | |
25
MFS Utilities Series
BOARD REVIEW OF INVESTMENT ADVISORY AGREEMENT
The Investment Company Act of 1940 requires that both the full Board of Trustees and a majority of the non-interested (“independent”) Trustees, voting separately, annually approve the continuation of the Fund’s investment advisory agreement with MFS. The Trustees consider matters bearing on the Fund and its advisory arrangements at their meetings throughout the year, including a review of performance data at each regular meeting. In addition, the independent Trustees met several times over the course of three months beginning in May and ending in July, 2015 (“contract review meetings”) for the specific purpose of considering whether to approve the continuation of the investment advisory agreement for the Fund and the other investment companies that the Board oversees (the “MFS Funds”). The independent Trustees were assisted in their evaluation of the Fund’s investment advisory agreement by independent legal counsel, from whom they received separate legal advice and with whom they met separately from MFS during various contract review meetings. The independent Trustees were also assisted in this process by the MFS Funds’ Independent Senior Officer, a senior officer appointed by and reporting to the independent Trustees.
In connection with their deliberations regarding the continuation of the investment advisory agreement, the Trustees, including the independent Trustees, considered such information and factors as they believed, in light of the legal advice furnished to them and their own business judgment, to be relevant. The investment advisory agreement for the Fund was considered separately, although the Trustees also took into account the common interests of all MFS Funds in their review. As described below, the Trustees considered the nature, quality, and extent of the various investment advisory, administrative, and shareholder services performed by MFS under the existing investment advisory agreement and other arrangements with the Fund.
In connection with their contract review meetings, the Trustees received and relied upon materials that included, among other items: (i) information provided by Lipper Inc., an independent third party, on the investment performance of the Fund for various time periods ended December 31, 2014 and the investment performance of a group of funds with substantially similar investment classifications/objectives (the “Lipper performance universe”), (ii) information provided by Lipper Inc. on the Fund’s advisory fees and other expenses and the advisory fees and other expenses of comparable funds identified by Lipper Inc. (the “Lipper expense group”), (iii) information provided by MFS on the advisory fees of comparable portfolios of other clients of MFS, including institutional separate accounts and other clients, (iv) information as to whether and to what extent applicable expense waivers, reimbursements or fee “breakpoints” are observed for the Fund, (v) information regarding MFS’ financial results and financial condition, including MFS’ and certain of its affiliates’ estimated profitability from services performed for the Fund and the MFS Funds as a whole, and compared to MFS’ institutional business, (vi) MFS’ views regarding the outlook for the mutual fund industry and the strategic business plans of MFS, (vii) descriptions of various functions performed by MFS for the Funds, such as compliance monitoring and portfolio trading practices, and (viii) information regarding the overall organization of MFS, including information about MFS’ senior management and other personnel providing investment advisory, administrative and other services to the Fund and the other MFS Funds. The comparative performance, fee and expense information prepared and provided by Lipper Inc. was not independently verified and the independent Trustees did not independently verify any information provided to them by MFS.
The Trustees’ conclusion as to the continuation of the investment advisory agreement was based on a comprehensive consideration of all information provided to the Trustees and not the result of any single factor. Some of the factors that figured particularly in the Trustees’ deliberations are described below, although individual Trustees may have evaluated the information presented differently from one another, giving different weights to various factors. It is also important to recognize that the fee arrangements for the Fund and other MFS Funds are the result of years of review and discussion between the independent Trustees and MFS, that certain aspects of such arrangements may receive greater scrutiny in some years than in others, and that the Trustees’ conclusions may be based, in part, on their consideration of these same arrangements during the course of the year and in prior years.
Based on information provided by Lipper Inc. and MFS, the Trustees reviewed the Fund’s total return investment performance as well as the performance of peer groups of funds over various time periods. The Trustees placed particular emphasis on the total return performance of the Fund’s Initial Class shares in comparison to the performance of funds in its Lipper performance universe over the three-year period ended December 31, 2014, which the Trustees believed was a long enough period to reflect differing market conditions. The total return performance of the Fund’s Initial Class shares was in the 2nd quintile relative to the other funds in the universe for this three-year period (the 1st quintile being the best performers and the 5th quintile being the worst performers). The total return performance of the Fund’s Initial Class shares was in the 2nd quintile for each of the one- and five-year periods ended December 31, 2014 relative to the Lipper performance universe. Because of the passage of time, these performance results may differ from the performance results for more recent periods, including those shown elsewhere in this report.
In the course of their deliberations, the Trustees took into account information provided by MFS in connection with the contract review meetings, as well as during investment review meetings conducted with portfolio management personnel during the course of the year regarding the Fund’s performance. After reviewing these and related factors, the Trustees concluded, within the context of their overall conclusions regarding the investment advisory agreement, that they were satisfied with MFS’ responses and efforts relating to investment performance.
In assessing the reasonableness of the Fund’s advisory fee, the Trustees considered, among other information, the Fund’s advisory fee and the total expense ratio of the Fund’s Initial Class shares as a percentage of average daily net assets and the advisory fee and
26
MFS Utilities Series
Board Review of Investment Advisory Agreement – continued
total expense ratios of peer groups of funds based on information provided by Lipper Inc. The Trustees considered that, according to the Lipper data (which takes into account any fee reductions or expense limitations that were in effect during the Fund’s last fiscal year), the Fund’s effective advisory fee rate and total expense ratio were each approximately at the Lipper expense group median.
The Trustees also considered the advisory fees charged by MFS to any institutional separate accounts advised by MFS (“separate accounts”) and unaffiliated investment companies for which MFS serves as subadviser (“subadvised funds”) that have comparable investment strategies to the Fund. In comparing these fees, the Trustees considered information provided by MFS as to the generally broader scope of services provided by MFS to the Fund, as well as the more extensive regulatory burdens imposed on MFS in managing the Fund, in comparison to separate accounts and subadvised funds. The Trustees also considered the higher demands placed on MFS’ investment personnel and trading infrastructure as a result of the daily cash in-flows and out-flows of the Fund in comparison to separate accounts.
The Trustees also considered whether the Fund may benefit from any economies of scale in the management of the Fund in the event of growth in assets of the Fund and/or growth in assets of the MFS Funds as a whole. They noted that the Fund’s advisory fee rate schedule is subject to a contractual breakpoint that reduces the Fund’s advisory fee rate on average daily net assets over $1 billion. The Trustees also noted that MFS has agreed in writing to waive a portion of the management fees of certain MFS Funds, including the Fund, if the total combined assets of certain funds within the MFS Funds’ complex increase above agreed upon thresholds (the “group fee waiver”), enabling the Fund’s shareholders to share in the benefits from any economies of scale at the complex level. The group fee waiver is reviewed and renewed annually between the Board and MFS. The Trustees concluded that the breakpoint and the group fee waiver were sufficient to allow the Fund to benefit from economies of scale as its assets and overall complex assets grow.
The Trustees also considered information prepared by MFS relating to MFS’ costs and profits with respect to the Fund, the MFS Funds considered as a group, and other investment companies and accounts advised by MFS, as well as MFS’ methodologies used to determine and allocate its costs to the MFS Funds, the Fund and other accounts and products for purposes of estimating profitability.
After reviewing these and other factors described herein, the Trustees concluded, within the context of their overall conclusions regarding the investment advisory agreement, that the advisory fees charged to the Fund represent reasonable compensation in light of the services being provided by MFS to the Fund.
In addition, the Trustees considered MFS’ resources and related efforts to continue to retain, attract and motivate capable personnel to serve the Fund. The Trustees also considered current and developing conditions in the financial services industry, including the presence of large and well-capitalized companies which are spending, and appear to be prepared to continue to spend, substantial sums to engage personnel and to provide services to competing investment companies. In this regard, the Trustees also considered the financial resources of MFS and its ultimate parent, Sun Life Financial Inc. The Trustees also considered the advantages and possible disadvantages to the Fund of having an adviser that also serves other investment companies as well as other accounts.
The Trustees also considered the nature, quality, cost, and extent of administrative, transfer agency, and distribution services provided to the Fund by MFS and its affiliates under agreements and plans other than the investment advisory agreement, including any 12b-1 fees the Fund pays to MFS Fund Distributors, Inc., an affiliate of MFS. The Trustees also considered the nature, extent and quality of certain other services MFS performs or arranges for on the Fund’s behalf, which may include securities lending programs, directed expense payment programs, class action recovery programs, and MFS’ interaction with third-party service providers, principally custodians and sub-custodians. The Trustees concluded that the various non-advisory services provided by MFS and its affiliates on behalf of the Fund were satisfactory.
The Trustees also considered benefits to MFS from the use of the Fund’s portfolio brokerage commissions, if applicable, to pay for investment research and various other factors. Additionally, the Trustees considered so-called “fall-out benefits” to MFS such as reputational value derived from serving as investment manager to the Fund.
Based on their evaluation of factors that they deemed to be material, including those factors described above, the Board of Trustees, including the independent Trustees, concluded that the Fund’s investment advisory agreement with MFS should be continued for an additional one-year period, commencing August 1, 2015.
27
MFS Utilities Series
PROXY VOTING POLICIES AND INFORMATION
MFS votes proxies on behalf of the fund pursuant to proxy voting policies and procedures that are available without charge, upon request, by calling 1-800-225-2606, by visiting the Proxy Voting section of mfs.com or by visiting the SEC’s Web site at http://www.sec.gov.
Information regarding how the fund voted proxies relating to portfolio securities during the most recent twelve-month period ended June 30 is available without charge by visiting the Proxy Voting section of mfs.com or by visiting the SEC’s Web site at http://www.sec.gov.
QUARTERLY PORTFOLIO DISCLOSURE
The fund will file a complete schedule of portfolio holdings with the Securities and Exchange Commission (the Commission) for the first and third quarters of each fiscal year on Form N-Q. The fund’s Form N-Q is available on the EDGAR database on the Commission’s Internet Web site at http://www.sec.gov, and may be reviewed and copied at the:
Public Reference Room
Securities and Exchange Commission
100 F Street, NE, Room 1580
Washington, D.C. 20549
Information on the operation of the Public Reference Room may be obtained by calling the Commission at 1-800-SEC-0330. Copies of the fund’s Form N-Q also may be obtained, upon payment of a duplicating fee, by electronic request at the following e-mail address: publicinfo@sec.gov or by writing the Public Reference Section at the above address.
FURTHER INFORMATION
From time to time, MFS may post important information about the fund or the MFS funds on the MFS web site (mfs.com). This information is available by visiting the “Market Commentary” and “Announcements” sub sections in the “Market Outlooks” section of mfs.com or by clicking on the fund’s name under “Variable Insurance Portfolios — VIT” in the “Products” section of mfs.com.
FEDERAL TAX INFORMATION (unaudited)
The following information is provided pursuant to provisions of the Internal Revenue Code.
The fund designates $105,628,000 as capital gain dividends paid during the fiscal year.
For corporate shareholders, 37.16% of the ordinary income dividends paid during the fiscal year qualify for the corporate dividends received deduction.
28
rev. 3/11
| | | | |
| FACTS | | WHAT DOES MFS DO WITH YOUR
PERSONAL INFORMATION? | |  |
| | |
| Why? | | Financial companies choose how they share your personal information. Federal law gives consumers the right to limit some but not all sharing. Federal law also requires us to tell you how we collect, share, and protect your personal information. Please read this notice carefully to understand what we do. |
| | |
| What? | | The types of personal information we collect and share depend on the product or service you have with us. This information can include: • Social Security number and account balances • Account transactions and transaction history • Checking account information and wire transfer instructions When you are no longer our customer, we continue to share your information as described in this notice. |
| | |
| How? | | All financial companies need to share customers’ personal information to run their everyday business. In the section below, we list the reasons financial companies can share their customers’ personal information; the reasons MFS chooses to share; and whether you can limit this sharing. |
| | | | |
Reasons we can share your
personal information | | Does MFS share? | | Can you limit this
sharing? |
For our everyday business purposes – such as to process your transactions, maintain your account(s), respond to court orders and legal investigations, or report to credit bureaus | | Yes | | No |
For our marketing purposes – to offer our products and services to you | | No | | We don’t share |
| For joint marketing with other financial companies | | No | | We don’t share |
For our affiliates’ everyday business purposes – information about your transactions and experiences | | No | | We don’t share |
For our affiliates’ everyday business purposes – information about your creditworthiness | | No | | We don’t share |
| For nonaffiliates to market to you | | No | | We don’t share |
| | |
| Questions? | | Call 800-225-2606 or go to mfs.com. |
29
| | |
| Who we are |
| Who is providing this notice? | | MFS Funds, MFS Investment Management, MFS Institutional Advisors, Inc., MFS Fund Distributors, Inc., MFS Heritage Trust Company, and MFS Service Center, Inc. |
| | |
| What we do |
| How does MFS protect my personal information? | | To protect your personal information from unauthorized access and use, we use security measures that comply with federal law. These measures include procedural, electronic, and physical safeguards for the protection of the personal information we collect about you. |
How does MFS
collect my personal information? | | We collect your personal information, for example, when you • open an account or provide account information • direct us to buy securities or direct us to sell your securities • make a wire transfer We also collect your personal information from others, such as credit bureaus, affiliates and other companies. |
| Why can’t I limit all sharing? | | Federal law gives you the right to limit only • sharing for affiliates’ everyday business purposes – information about your creditworthiness • affiliates from using your information to market to you • sharing for nonaffiliates to market to you State laws and individual companies may give you additional rights to limit sharing. |
| | |
| Definitions |
| Affiliates | | Companies related by common ownership or control. They can be financial and nonfinancial companies. • MFS does not share personal information with affiliates, except for everyday business purposes as described on page one of this notice. |
| Nonaffiliates | | Companies not related by common ownership or control. They can be financial and nonfinancial companies. • MFS does not share with nonaffiliates so they can market to you. |
| Joint Marketing | | A formal agreement between nonaffiliated financial companies that together market financial products or services to you. • MFS doesn’t jointly market. |
| | |
| Other important information |
| If you own an MFS product or receive an MFS service in the name of a third party such as a bank or broker-dealer, their privacy policy may apply to you instead of ours. |
30
ANNUAL REPORT
December 31, 2015

MFS® VALUE SERIES
MFS® Variable Insurance Trust

VLU-ANN
MFS® VALUE SERIES
CONTENTS
The report is prepared for the general information of contract owners. It is authorized for distribution to prospective investors only when preceded or accompanied by a current prospectus.
NOT FDIC INSURED • MAY LOSE VALUE • NO BANK OR CREDIT UNION GUARANTEE • NOT A DEPOSIT • NOT INSURED BY ANY FEDERAL GOVERNMENT AGENCY OR NCUA/NCUSIF
MFS Value Series
LETTER FROM THE CHAIRMAN

Dear Contract Owners:
Central bank policies remain center stage as the U.S. Federal Reserve made good on its pledge to raise policy rates for the first time in over nine years at its December meeting. The Fed’s actions stand in stark contrast to those of the European Central Bank and Bank of Japan, which modestly extended their quantitative easing programs in December.
In the United States, auto sales remain a source of economic strength, but housing demand has slowed of late. The U.S. economic expansion remains moderate but uneven, with a strong dollar crimping demand for U.S. goods abroad. China’s shift to a consumer-led economy continues to weigh on its manufacturing and exports, as does weak global demand. Slackening demand from China continues to undermine commodity markets, with oil particularly impacted amid a global supply glut.
As markets have become more focused on short-term trends in recent years, we believe it’s important for investors to lengthen their investment time horizon. At MFS®, we don’t trade on headlines or trends; we invest for the long term.
We believe that this approach, coupled with the professional guidance of a financial advisor, will help you reach your investment goals.
Respectfully,

Robert J. Manning
Chairman
MFS Investment Management
February 16, 2016
The opinions expressed in this letter are subject to change and may not be relied upon for investment advice. No forecasts can be guaranteed.
1
MFS Value Series
PORTFOLIO COMPOSITION
Portfolio structure

| | | | |
| Top ten holdings | | | | |
| JPMorgan Chase & Co. | | | 4.7% | |
| Johnson & Johnson | | | 3.5% | |
| Philip Morris International, Inc. | | | 3.4% | |
| Wells Fargo & Co. | | | 3.3% | |
| Accenture PLC, “A” | | | 2.6% | |
| Pfizer, Inc. | | | 2.5% | |
| Travelers Cos., Inc. | | | 2.1% | |
| PPG Industries, Inc. | | | 2.0% | |
| Medtronic PLC | | | 2.0% | |
| Honeywell International, Inc. | | | 2.0% | |
| | | | |
| Equity sectors | | | | |
| Financial Services | | | 27.7% | |
| Health Care | | | 14.2% | |
| Industrial Goods & Services | | | 12.1% | |
| Consumer Staples | | | 10.5% | |
| Energy | | | 6.2% | |
| Basic Materials | | | 5.7% | |
| Leisure | | | 4.3% | |
| Special Products & Services | | | 4.1% | |
| Technology | | | 3.5% | |
| Retailing | | | 3.2% | |
| Utilities & Communications | | | 2.9% | |
| Autos & Housing | | | 2.5% | |
| Transportation | | | 2.2% | |
Cash & Cash Equivalents includes any cash, investments in money market funds, short-term securities, and other assets less liabilities. Please see the Statement of Assets and Liabilities for additional information related to the fund’s cash position and other assets and liabilities.
Percentages are based on net assets as of 12/31/15.
The portfolio is actively managed and current holdings may be different.
2
MFS Value Series
MANAGEMENT REVIEW
Summary of Results
For the twelve months ended December 31, 2015, Initial Class shares of the MFS Value Series (“fund”) provided a total return of –0.74%, while Service Class shares of the fund provided a total return of –0.93%. These compare with a return of –3.83% for the fund’s benchmark, the Russell 1000 Value Index.
Market Environment
Sluggish global growth weighed on both developed and emerging market (“EM”) economies during the reporting period. EM economies have been particularly lackluster. While the US Federal Reserve began its anticipated monetary policy tightening cycle at the end of the period, other large developed economies continued to embrace accommodative monetary policies, particularly the European Central Bank and the Bank of Japan. Focus remained on China after policy missteps by the Chinese government roiled global markets over the summer, beginning with the uncoordinated response to the stock market’s boom and bust and then the confusing decision to devalue the renminbi in August. China subsequently ramped up a wide range of monetary and fiscal measures to stimulate the economy and bolster sentiment. Its economy appeared to stabilize late in the period. Also at the end of the period, the Chinese renminbi was granted reserve currency status by the International Monetary Fund (“IMF”), which announced its inclusion in the IMF’s Special Drawing Rights currency basket effective October 1, 2016.
During the second half of the reporting period, the US faced an earnings recession caused primarily by the sharp decline in the prices of oil and other commodities. Earnings contractions were concentrated primarily in the energy, materials and industrial sectors. An additional headwind for earnings was the sharp rise in the US dollar over the period. Exports were crimped by the dollar’s strength and falling demand in emerging markets. Consumer spending held up well during the second half of the period amid a modest increase in real wages and a tailwind from falling gasoline prices. Demand for autos reached near-record territory late in the period. In emerging markets, two key factors weighed on economies and asset prices: 1) weaker Chinese growth, which drove the decline in commodity prices and 2) prospects for higher US interest rates. Structural factors like floating exchange rates and fiscal buffers partially offset these cyclical headwinds.
Contributors to Performance
An underweight allocation to the energy sector contributed to performance relative to the Russell 1000 Value Index. However, there were no individual stocks within this sector that were among the fund’s largest relative contributors during the period.
Stock selection in both the consumer staples and special products & services sectors also benefited relative returns. Within the consumer staples sector, an overweight position in tobacco company Philip Morris International and holdings of food company General Mills (b) bolstered relative results. Despite FX headwinds, shares of Philip Morris International grew substantially during the period following strong global pricing trends and moderating volume declines. Management also raised its guidance for 2016 which further supported results. Within the special products & services sector, holdings of management consulting firm Accenture (b) and financial technology services provider Fiserv (b) also aided relative returns. The share price of Accenture rose as management posted strong results throughout the period driven primarily by robust revenue and higher operating margins, and raised its revenue growth guidance. The company’s consulting segment was an area of strength during the period and outweighed weaker results in outsourcing.
A combination of stock selection and an underweight position in the utilities & communications sector was another contributor to relative performance. Here, not holding shares of natural gas pipelines operator Kinder Morgan helped relative returns. Kinder Morgan’s share price depreciated during the period after challenging business trends forced the company to cut its annual dividend by 75% to preserve cash. More broadly, weak commodity prices resulted in poor equity share price performance for many energy infrastructure companies, including Kinder Morgan, calling into question their ability to rely on the equity capital markets to fund future growth.
Strong stock selection in the retailing sector was another positive factor for relative performance. Within this sector, not owning shares of retail giant Wal-Mart supported relative results.
Stocks in other sectors that benefited relative results included overweight positions in defense contractor Lockheed Martin and global financial services firm JPMorgan Chase. Shares of Lockheed appreciated in the second half of the year on the back of strong sales and better-than-expected margins. In addition, the company announced its intention to buy aircraft manufacturer Sikorsky and engage in a strategic review of its IT/Tech services business, both of which appeared to have been viewed positively by investors. Additionally, avoiding shares of poor-performing insurance and investment firm Berkshire Hathaway further supported relative performance.
The fund’s cash and/or cash equivalents position during the period also helped relative performance. Under normal market conditions, the fund strives to be fully invested and generally holds cash to buy new holdings and to provide liquidity. In a period when equity markets fell, as measured by the fund’s benchmark, holding cash aided performance versus the benchmark, which has no cash position.
3
MFS Value Series
Management Review – continued
Detractors from Performance
Weak stock selection in the health care sector detracted from relative performance. Within this sector, not owning shares of health insurance and Medicare/Medicaid provider UnitedHealth Group and pharmaceutical company Eli Lilly hurt relative results. Shares of UnitedHealth Group rose at the beginning of the reporting period as the company reported better-than-expected earnings due to strong growth in its Medicare, Medicaid and Optum businesses along with well-contained medical costs.
Stock selection in the industrial goods & services sector also weighed on relative returns. Here, not owning shares of diversified industrial conglomerate General Electric and an overweight position in manufacturing conglomerate Tyco International weakened relative performance. Shares of General Electric appreciated towards the end of the year following news that activist investor Trian had made an investment in the industrial conglomerate. The company’s share price was also bolstered by solid earnings results and progress on a number of items to further simplify its business.
Other top relative detractors during the period included not holding shares of strong-performing software giant Microsoft and snack food and beverage producer Mondelez International. Shares of Microsoft rose due to stronger-than-expected earnings owing to solid operating expense controls, improved gross margins and good trends within its consumer businesses. Strong growth in the Cloud business, particularly from the Office 365 and Azure product lines, combined with a lower than expected effective tax rate, buoyed investor sentiment.
An overweight position in weak-performing investment management firm Franklin Resources, an underweight position in shares of telecommunications company AT&T (h), and holdings of media company Viacom (b) and chemical company PPG Industries (b), also hurt relative returns. Shares of Franklin Resources depreciated during the period owing primarily to significant outflows in some of its largest funds, weaker equity fund performance and declines in global equity markets.
Respectfully,
| | |
| Nevin Chitkara | | Steven Gorham |
| Portfolio Manager | | Portfolio Manager |
| (b) | Security is not a benchmark constituent. |
| (h) | Security was not held in the portfolio at period end. |
The views expressed in this report are those of the portfolio managers only through the end of the period of the report as stated on the cover and do not necessarily reflect the views of MFS or any other person in the MFS organization. These views are subject to change at any time based on market or other conditions, and MFS disclaims any responsibility to update such views. These views may not be relied upon as investment advice or an indication of trading intent on behalf of any MFS portfolio. References to specific securities are not recommendations of such securities, and may not be representative of any MFS portfolio’s current or future investments.
4
MFS Value Series
PERFORMANCE SUMMARY THROUGH 12/31/15
The following chart illustrates the historical performance of the fund in comparison to its benchmark(s). Benchmarks are unmanaged and may not be invested in directly. Benchmark returns do not reflect any fees or expenses. The performance of other share classes will be greater than or less than that of the class depicted below. (See Notes to Performance Summary.)
Performance data shown represents past performance and is no guarantee of future results. Investment return and principal value fluctuate so your units, when sold, may be worth more or less than the original cost; current performance may be lower or higher than quoted. The performance shown does not reflect the deduction of taxes, if any, that a contract holder would pay on fund distributions or the redemption of contract units. The returns for the fund shown also do not reflect the deduction of expenses associated with variable products, such as mortality and expense risk charges, separate account charges, and sales charges imposed by the insurance company separate accounts. Such expenses would reduce the overall returns shown.
Growth of a Hypothetical $10,000 Investment

Total Returns through 12/31/15
Average annual total returns
| | | | | | | | | | | | |
| | | Share Class | | Class Inception Date | | 1-yr | | 5-yr | | 10-yr | | |
| | | Initial Class | | 1/02/02 | | (0.74)% | | 11.56% | | 7.59% | | |
| | | Service Class | | 1/02/02 | | (0.93)% | | 11.29% | | 7.33% | | |
| | | | |
| Comparative benchmark | | | | | | | | |
| | | Russell 1000 Value Index (f) | | (3.83)% | | 11.27% | | 6.16% | | |
| (f) | Source: FactSet Research Systems Inc. |
Benchmark Definition
Russell 1000 Value Index – constructed to provide a comprehensive barometer for the value securities in the large-cap segment of the U.S. equity universe. Companies in this index generally have lower price-to-book ratios and lower forecasted growth values.
It is not possible to invest directly in an index.
Notes to Performance Summary
Average annual total return represents the average annual change in value for each share class for the periods presented.
Performance results reflect any applicable expense subsidies and waivers in effect during the periods shown. Without such subsidies and waivers the fund’s performance results would be less favorable. Please see the prospectus and financial statements for complete details. All results are historical and assume the reinvestment of any dividends and capital gains distributions.
Performance results do not include adjustments made for financial reporting purposes in accordance with U.S. generally accepted accounting principles and may differ from amounts reported in the financial highlights.
From time to time the fund may receive proceeds from litigation settlements, without which performance would be lower.
5
MFS Value Series
EXPENSE TABLE
Fund Expenses Borne by the Contract Holders during the Period,
July 1, 2015 through December 31, 2015
As a contract holder of the fund, you incur ongoing costs, including management fees; distribution and/or service (12b-1) fees; and other fund expenses. This example is intended to help you understand your ongoing costs (in dollars) of investing in the fund and to compare these costs with the ongoing costs of investing in other mutual funds.
The example is based on an investment of $1,000 invested at the beginning of the period and held for the entire period July 1, 2015 through December 31, 2015.
Actual Expenses
The first line for each share class in the following table provides information about actual account values and actual expenses. You may use the information in this line, together with the amount you invested, to estimate the expenses that you paid over the period. Simply divide your account value by $1,000 (for example, an $8,600 account value divided by $1,000 = 8.6), then multiply the result by the number in the first line under the heading entitled “Expenses Paid During Period” to estimate the expenses you paid on your account during this period.
Hypothetical Example for Comparison Purposes
The second line for each share class in the following table provides information about hypothetical account values and hypothetical expenses based on the fund’s actual expense ratio and an assumed rate of return of 5% per year before expenses, which is not the fund’s actual return. The hypothetical account values and expenses may not be used to estimate the actual ending account balance or expenses you paid for the period. You may use this information to compare the ongoing costs of investing in the fund and other funds. To do so, compare this 5% hypothetical example with the 5% hypothetical examples that appear in the shareholder reports of the other funds.
Please note that the expenses shown in the table are meant to highlight the fund’s ongoing costs only and do not take into account the fees and expenses imposed under the variable contracts through which your investment in the fund is made. Therefore, the second line for each share class in the table is useful in comparing ongoing costs associated with an investment in vehicles (such as the fund) which fund benefits under variable annuity and variable life insurance contracts and to qualified pension and retirement plans only, and will not help you determine the relative total costs of investing in the fund through variable annuity and variable life insurance contracts. If the fees and expenses imposed under the variable contracts were included, your costs would have been higher.
| | | | | | | | | | | | | | | | | | |
| Share Class | | | | Annualized
Expense Ratio | | | Beginning
Account Value
7/01/15 | | | Ending Account Value
12/31/15 | | | Expenses Paid
During Period (p)
7/01/15-12/31/15 | |
| Initial Class | | Actual | | | 0.73% | | | | $1,000.00 | | | | $980.58 | | | | $3.64 | |
| | Hypothetical (h) | | | 0.73% | | | | $1,000.00 | | | | $1,021.53 | | | | $3.72 | |
| Service Class | | Actual | | | 0.98% | | | | $1,000.00 | | | | $979.91 | | | | $4.89 | |
| | Hypothetical (h) | | | 0.98% | | | | $1,000.00 | | | | $1,020.27 | | | | $4.99 | |
| (h) | 5% class return per year before expenses. |
| (p) | “Expenses Paid During Period” are equal to each class’s annualized expense ratio, as shown above, multiplied by the average account value over the period, multiplied by 184/365 (to reflect the one-half year period). |
6
MFS Value Series
PORTFOLIO OF INVESTMENTS – 12/31/15
The Portfolio of Investments is a complete list of all securities owned by your fund. It is categorized by broad-based asset classes.
| | | | | | | | |
| Issuer | | Shares/Par | | | Value ($) | |
| | | | | | | | |
| COMMON STOCKS – 99.1% | | | | | | | | |
| Aerospace – 6.7% | | | | | | | | |
| Honeywell International, Inc. | | | 409,718 | | | $ | 42,434,493 | |
| Lockheed Martin Corp. | | | 167,093 | | | | 36,284,245 | |
| Northrop Grumman Corp. | | | 118,831 | | | | 22,436,481 | |
| United Technologies Corp. | | | 432,251 | | | | 41,526,354 | |
| | | | | | | | |
| | | | | | $ | 142,681,573 | |
| | | | | | | | |
| Alcoholic Beverages – 1.3% | | | | | | | | |
| Diageo PLC | | | 1,008,816 | | | $ | 27,510,906 | |
| | | | | | | | |
| Automotive – 2.0% | | | | | | | | |
| Delphi Automotive PLC | | | 186,498 | | | $ | 15,988,474 | |
| Harley-Davidson, Inc. | | | 207,640 | | | | 9,424,780 | |
| Johnson Controls, Inc. | | | 431,582 | | | | 17,043,173 | |
| | | | | | | | |
| | | | | | $ | 42,456,427 | |
| | | | | | | | |
| Broadcasting – 2.9% | | | | | | | | |
| Omnicom Group, Inc. | | | 412,133 | | | $ | 31,181,983 | |
| Time Warner, Inc. | | | 251,251 | | | | 16,248,402 | |
| Viacom, Inc., “B” | | | 197,148 | | | | 8,114,612 | |
| Walt Disney Co. | | | 57,284 | | | | 6,019,403 | |
| | | | | | | | |
| | | | | | $ | 61,564,400 | |
| | | | | | | | |
| Brokerage & Asset Managers – 2.8% | | | | | |
| BlackRock, Inc. | | | 59,778 | | | $ | 20,355,605 | |
| Franklin Resources, Inc. | | | 535,600 | | | | 19,720,792 | |
| NASDAQ, Inc. | | | 338,726 | | | | 19,703,691 | |
| | | | | | | | |
| | | | | | $ | 59,780,088 | |
| | | | | | | | |
| Business Services – 4.1% | | | | | | | | |
| Accenture PLC, “A” | | | 530,195 | | | $ | 55,405,378 | |
| Equifax, Inc. | | | 41,290 | | | | 4,598,467 | |
| Fidelity National Information Services, Inc. | | | 283,294 | | | | 17,167,616 | |
| Fiserv, Inc. (a) | | | 113,529 | | | | 10,383,362 | |
| | | | | | | | |
| | | | | | $ | 87,554,823 | |
| | | | | | | | |
| Cable TV – 1.2% | | | | | | | | |
| Comcast Corp., “A” | | | 440,399 | | | $ | 24,851,716 | |
| | | | | | | | |
| Chemicals – 5.2% | | | | | | | | |
| 3M Co. | | | 271,609 | | | $ | 40,915,180 | |
| E.I. du Pont de Nemours & Co. | | | 272,684 | | | | 18,160,754 | |
| Monsanto Co. | | | 86,376 | | | | 8,509,764 | |
| PPG Industries, Inc. | | | 436,881 | | | | 43,172,580 | |
| | | | | | | | |
| | | | | | $ | 110,758,278 | |
| | | | | | | | |
| Computer Software – 0.8% | | | | | | | | |
| Oracle Corp. | | | 486,474 | | | $ | 17,770,895 | |
| | | | | | | | |
| Computer Software – Systems – 1.2% | | | | | |
| International Business Machines Corp. | | | 181,081 | | | $ | 24,920,367 | |
| | | | | | | | |
| Construction – 0.5% | | | | | | | | |
| Stanley Black & Decker, Inc. | | | 104,675 | | | $ | 11,171,963 | |
| | | | | | | | |
| Consumer Products – 0.7% | | | | | | | | |
| Newell Rubbermaid, Inc. | | | 114,149 | | | $ | 5,031,688 | |
| | | | | | | | |
| Issuer | | Shares/Par | | | Value ($) | |
| | | | | | | | |
| COMMON STOCKS – continued | | | | | |
| Consumer Products – continued | | | | | | | | |
| Procter & Gamble Co. | | | 131,632 | | | $ | 10,452,897 | |
| | | | | | | | |
| | | | | | $ | 15,484,585 | |
| | | | | | | | |
| Containers – 0.5% | | | | | | | | |
| Crown Holdings, Inc. (a) | | | 213,425 | | | $ | 10,820,648 | |
| | | | | | | | |
| Electrical Equipment – 2.9% | | | | | | | | |
| Danaher Corp. | | | 331,627 | | | $ | 30,801,516 | |
| Pentair PLC | | | 170,623 | | | | 8,450,957 | |
| Tyco International PLC | | | 737,759 | | | | 23,527,135 | |
| | | | | | | | |
| | | | | | $ | 62,779,608 | |
| | | | | | | | |
| Electronics – 1.5% | | | | | | | | |
| Analog Devices, Inc. | | | 79,768 | | | $ | 4,412,766 | |
| Texas Instruments, Inc. | | | 507,058 | | | | 27,791,849 | |
| | | | | | | | |
| | | | | | $ | 32,204,615 | |
| | | | | | | | |
| Energy – Independent – 1.7% | | | | | | | | |
| EOG Resources, Inc. | | | 246,713 | | | $ | 17,464,813 | |
| Occidental Petroleum Corp. | | | 290,170 | | | | 19,618,394 | |
| | | | | | | | |
| | | | | | $ | 37,083,207 | |
| | | | | | | | |
| Energy – Integrated – 2.9% | | | | | | | | |
| Chevron Corp. | | | 285,983 | | | $ | 25,727,031 | |
| Exxon Mobil Corp. | | | 449,072 | | | | 35,005,162 | |
| | | | | | | | |
| | | | | | $ | 60,732,193 | |
| | | | | | | | |
| Food & Beverages – 4.4% | | | | | | | | |
| Archer Daniels Midland Co. | | | 302,024 | | | $ | 11,078,240 | |
| Danone S.A. | | | 237,487 | | | | 16,027,375 | |
| General Mills, Inc. | | | 556,333 | | | | 32,078,161 | |
| Nestle S.A. | | | 465,657 | | | | 34,516,201 | |
| | | | | | | | |
| | | | | | $ | 93,699,977 | |
| | | | | | | | |
| Food & Drug Stores – 1.7% | | | | | | | | |
| CVS Health Corp. | | | 379,537 | | | $ | 37,107,332 | |
| | | | | | | | |
| General Merchandise – 0.9% | | | | | | | | |
| Target Corp. | | | 272,559 | | | $ | 19,790,509 | |
| | | | | | | | |
| Insurance – 8.2% | | | | | | | | |
| ACE Ltd. | | | 214,884 | | | $ | 25,109,195 | |
| Aon PLC | | | 294,058 | | | | 27,115,088 | |
| Chubb Corp. | | | 162,651 | | | | 21,574,029 | |
| MetLife, Inc. | | | 748,940 | | | | 36,106,397 | |
| Prudential Financial, Inc. | | | 239,372 | | | | 19,487,275 | |
| Travelers Cos., Inc. | | | 399,094 | | | | 45,041,749 | |
| | | | | | | | |
| | | | | | $ | 174,433,733 | |
| | | | | | | | |
| Machinery & Tools – 2.5% | | | | | | | | |
| Caterpillar, Inc. | | | 91,850 | | | $ | 6,242,126 | |
| Cummins, Inc. | | | 47,871 | | | | 4,213,127 | |
| Deere & Co. | | | 72,033 | | | | 5,493,957 | |
| Eaton Corp. PLC | | | 310,561 | | | | 16,161,594 | |
| Illinois Tool Works, Inc. | | | 178,461 | | | | 16,539,765 | |
7
MFS Value Series
Portfolio of Investments – continued
| | | | | | | | |
| Issuer | | Shares/Par | | | Value ($) | |
| | | | | | | | |
| COMMON STOCKS – continued | |
| Machinery & Tools – continued | |
| Parker Hannifin Corp. | | | 50,376 | | | $ | 4,885,464 | |
| | | | | | | | |
| | | | | | $ | 53,536,033 | |
| | | | | | | | |
| Major Banks – 12.8% | | | | | | | | |
| Bank of New York Mellon Corp. | | | 587,025 | | | $ | 24,197,171 | |
| Goldman Sachs Group, Inc. | | | 218,546 | | | | 39,388,546 | |
| JPMorgan Chase & Co. | | | 1,527,914 | | | | 100,888,161 | |
| PNC Financial Services Group, Inc. | | | 194,811 | | | | 18,567,436 | |
| State Street Corp. | | | 264,913 | | | | 17,579,627 | |
| Wells Fargo & Co. | | | 1,309,551 | | | | 71,187,192 | |
| | | | | | | | |
| | | | | | $ | 271,808,133 | |
| | | | | | | | |
| Medical & Health Technology & Services – 1.1% | |
| Express Scripts Holding Co. (a) | | | 270,576 | | | $ | 23,651,048 | |
| | | | | | | | |
| Medical Equipment – 5.0% | | | | | | | | |
| Abbott Laboratories | | | 539,248 | | | $ | 24,217,628 | |
| Medtronic PLC | | | 560,067 | | | | 43,080,354 | |
| St. Jude Medical, Inc. | | | 225,663 | | | | 13,939,204 | |
| Thermo Fisher Scientific, Inc. | | | 184,426 | | | | 26,160,828 | |
| | | | | | | | |
| | | | | | $ | 107,398,014 | |
| | | | | | | | |
| Oil Services – 1.6% | | | | | | | | |
| Baker Hughes, Inc. | | | 32,622 | | | $ | 1,505,505 | |
| National Oilwell Varco, Inc. | | | 323,566 | | | | 10,836,225 | |
| Schlumberger Ltd. | | | 323,586 | | | | 22,570,124 | |
| | | | | | | | |
| | | | | | $ | 34,911,854 | |
| | | | | | | | |
| Other Banks & Diversified Financials – 4.0% | | | | | |
| American Express Co. | | | 301,922 | | | $ | 20,998,675 | |
| BB&T Corp. | | | 256,940 | | | | 9,714,901 | |
| Citigroup, Inc. | | | 269,310 | | | | 13,936,793 | |
| U.S. Bancorp | | | 947,881 | | | | 40,446,082 | |
| | | | | | | | |
| | | | | | $ | 85,096,451 | |
| | | | | | | | |
| Pharmaceuticals – 8.1% | | | | | | | | |
| Johnson & Johnson | | | 732,606 | | | $ | 75,253,288 | |
| Merck & Co., Inc. | | | 575,563 | | | | 30,401,238 | |
| Novartis AG | | | 78,220 | | | | 6,685,979 | |
| Pfizer, Inc. | | | 1,668,531 | | | | 53,860,181 | |
| Roche Holding AG | | | 22,236 | | | | 6,127,978 | |
| | | | | | | | |
| | | | | | $ | 172,328,664 | |
| | | | | | | | |
| Printing & Publishing – 0.2% | | | | | | | | |
| McGraw-Hill Cos., Inc. | | | 41,486 | | | $ | 4,089,690 | |
| Time, Inc. | | | 23,635 | | | | 370,360 | |
| | | | | | | | |
| | | | | | $ | 4,460,050 | |
| | | | | | | | |
| Railroad & Shipping – 0.9% | | | | | | | | |
| Canadian National Railway Co. | | | 189,517 | | | $ | 10,590,210 | |
| Union Pacific Corp. | | | 100,623 | | | | 7,868,719 | |
| | | | | | | | |
| | | | | | $ | 18,458,929 | |
| | | | | | | | |
| Specialty Stores – 0.5% | | | | | | | | |
| Advance Auto Parts, Inc. | | | 43,434 | | | $ | 6,537,251 | |
| Bed Bath & Beyond, Inc. (a) | | | 77,017 | | | | 3,716,070 | |
| | | | | | | | |
| | | | | | $ | 10,253,321 | |
| | | | | | | | |
| | | | | | | | |
| Issuer | | Shares/Par | | | Value ($) | |
| | | | | | | | |
| COMMON STOCKS – continued | |
| Telecommunications – Wireless – 0.2% | | | | | |
| Vodafone Group PLC | | | 1,597,256 | | | $ | 5,166,364 | |
| | | | | | | | |
| Telephone Services – 1.7% | | | | | | | | |
| Verizon Communications, Inc. | | | 772,542 | | | $ | 35,706,891 | |
| | | | | | | | |
| Tobacco – 4.1% | | | | | | | | |
| Altria Group, Inc. | | | 237,000 | | | $ | 13,795,770 | |
| Philip Morris International, Inc. | | | 831,115 | | | | 73,063,320 | |
| | | | | | | | |
| | | | | | $ | 86,859,090 | |
| | | | | | | | |
| Trucking – 1.3% | | | | | | | | |
| United Parcel Service, Inc., “B” | | | 297,628 | | | $ | 28,640,742 | |
| | | | | | | | |
| Utilities – Electric Power – 1.0% | | | | | | | | |
| Duke Energy Corp. | | | 224,083 | | | $ | 15,997,285 | |
| Xcel Energy, Inc. | | | 122,254 | | | | 4,390,141 | |
| | | | | | | | |
| | | | | | $ | 20,387,426 | |
| | | | | | | | |
Total Common Stocks
(Identified Cost, $1,421,645,962) | | | | | | $ | 2,113,820,853 | |
| | | | | | | | |
|
| MONEY MARKET FUNDS – 0.8% | |
| MFS Institutional Money Market Portfolio, 0.19%, at Cost and Net Asset Value (v) | | | 16,597,492 | | | $ | 16,597,492 | |
| | | | | | | | |
Total Investments
(Identified Cost, $1,438,243,454) | | | $ | 2,130,418,345 | |
| | | | | | | | |
OTHER ASSETS, LESS
LIABILITIES – 0.1% | | | | 2,146,486 | |
| | | | | | | | |
| NET ASSETS – 100.0% | | | $ | 2,132,564,831 | |
| | | | | | | | |
| (a) | | Non-income producing security. |
| (v) | | Underlying affiliated fund that is available only to investment companies managed by MFS. The rate quoted for the MFS Institutional Money Market Portfolio is the annualized seven-day yield of the fund at period end. |
The following abbreviations are used in this report and are defined:
| PLC | | Public Limited Company |
See Notes to Financial Statements
8
MFS Value Series
FINANCIAL STATEMENTS | STATEMENT OF ASSETS AND LIABILITIES
This statement represents your fund’s balance sheet, which details the assets and liabilities comprising the total value of the fund.
| | | | | | | | |
At 12/31/15 | | | | | | | | |
Assets | | | | | | | | |
Investments | | | | | | | | |
Non-affiliated issuers, at value (identified cost, $1,421,645,962) | | | $2,113,820,853 | | | | | |
Underlying affiliated funds, at cost and value | | | 16,597,492 | | | | | |
Total investments, at value (identified cost, $1,438,243,454) | | | $2,130,418,345 | | | | | |
Cash | | | 38,222 | | | | | |
Foreign currency, at value (identified cost, $30) | | | 30 | | | | | |
Receivables for | | | | | | | | |
Fund shares sold | | | 229,479 | | | | | |
Interest and dividends | | | 4,344,894 | | | | | |
Other assets | | | 12,517 | | | | | |
Total assets | | | | | | | $2,135,043,487 | |
Liabilities | | | | | | | | |
Payable for fund shares reacquired | | | $2,181,441 | | | | | |
Payable to affiliates | | | | | | | | |
Investment adviser | | | 89,483 | | | | | |
Shareholder servicing costs | | | 241 | | | | | |
Distribution and/or service fees | | | 16,203 | | | | | |
Payable for independent Trustees’ compensation | | | 13 | | | | | |
Accrued expenses and other liabilities | | | 191,275 | | | | | |
Total liabilities | | | | | | | $2,478,656 | |
Net assets | | | | | | | $2,132,564,831 | |
Net assets consist of | | | | | | | | |
Paid-in capital | | | $1,224,656,701 | | | | | |
Unrealized appreciation (depreciation) on investments and translation of assets and liabilities in foreign currencies | | | 692,092,063 | | | | | |
Accumulated net realized gain (loss) on investments and foreign currency | | | 171,608,591 | | | | | |
Undistributed net investment income | | | 44,207,476 | | | | | |
Net assets | | | | | | | $2,132,564,831 | |
Shares of beneficial interest outstanding | | | | | | | 116,913,594 | |
| | | | | | | | | | | | |
| | | Net assets | | | Shares
outstanding | | | Net asset value
per share | |
Initial Class | | | $964,810,627 | | | | 52,453,416 | | | | $18.39 | |
Service Class | | | 1,167,754,204 | | | | 64,460,178 | | | | 18.12 | |
See Notes to Financial Statements
9
MFS Value Series
FINANCIAL STATEMENTS | STATEMENT OF OPERATIONS
This statement describes how much your fund earned in investment income and accrued in expenses. It also describes any gains and/or losses generated by fund operations.
| | | | | | | | |
Year ended 12/31/15 | | | | | | | | |
Net investment income | | | | | | | | |
Income | | | | | | | | |
Dividends | | | $65,222,070 | | | | | |
Interest | | | 23,255 | | | | | |
Dividends from underlying affiliated funds | | | 21,115 | | | | | |
Foreign taxes withheld | | | (349,256 | ) | | | | |
Total investment income | | | | | | | $64,917,184 | |
Expenses | | | | | | | | |
Management fee | | | $16,480,257 | | | | | |
Distribution and/or service fees | | | 3,332,624 | | | | | |
Shareholder servicing costs | | | 60,474 | | | | | |
Administrative services fee | | | 381,875 | | | | | |
Independent Trustees’ compensation | | | 43,875 | | | | | |
Custodian fee | | | 154,826 | | | | | |
Shareholder communications | | | 199,491 | | | | | |
Audit and tax fees | | | 54,985 | | | | | |
Legal fees | | | 18,790 | | | | | |
Miscellaneous | | | 52,928 | | | | | |
Total expenses | | | | | | | $20,780,125 | |
Fees paid indirectly | | | (56 | ) | | | | |
Reduction of expenses by investment adviser | | | (165,147 | ) | | | | |
Net expenses | | | | | | | $20,614,922 | |
Net investment income | | | | | | | $44,302,262 | |
Realized and unrealized gain (loss) on investments and foreign currency | | | | | | | | |
Realized gain (loss) (identified cost basis) | | | | | | | | |
Investments | | | $180,270,245 | | | | | |
Foreign currency | | | (90,055 | ) | | | | |
Net realized gain (loss) on investments and foreign currency | | | | | | | $180,180,190 | |
Change in unrealized appreciation (depreciation) | | | | | | | | |
Investments | | | $(248,397,895 | ) | | | | |
Translation of assets and liabilities in foreign currencies | | | (23,539 | ) | | | | |
Net unrealized gain (loss) on investments and foreign currency translation | | | | | | | $(248,421,434 | ) |
Net realized and unrealized gain (loss) on investments and foreign currency | | | | | | | $(68,241,244 | ) |
Change in net assets from operations | | | | | | | $(23,938,982 | ) |
See Notes to Financial Statements
10
MFS Value Series
FINANCIAL STATEMENTS | STATEMENTS OF CHANGES IN NET ASSETS
These statements describe the increases and/or decreases in net assets resulting from operations, any distributions, and any shareholder transactions.
| | | | | | | | |
For years ended 12/31 | | | 2015 | | | | 2014 | |
Change in net assets | | | | | | | | |
From operations | | | | | | | | |
Net investment income | | | $44,302,262 | | | | $51,498,481 | |
Net realized gain (loss) on investments and foreign currency | | | 180,180,190 | | | | 201,212,369 | |
Net unrealized gain (loss) on investments and foreign currency translation | | | (248,421,434 | ) | | | (8,868,742 | ) |
Change in net assets from operations | | | $(23,938,982 | ) | | | $243,842,108 | |
Distributions declared to shareholders | | | | | | | | |
From net investment income | | | $(51,498,261 | ) | | | $(36,745,114 | ) |
From net realized gain on investments | | | (137,834,650 | ) | | | (80,580,203 | ) |
Total distributions declared to shareholders | | | $(189,332,911 | ) | | | $(117,325,317 | ) |
Change in net assets from fund share transactions | | | $(254,692,255 | ) | | | $(20,388,062 | ) |
Total change in net assets | | | $(467,964,148 | ) | | | $106,128,729 | |
Net assets | | | | | | | | |
At beginning of period | | | 2,600,528,979 | | | | 2,494,400,250 | |
At end of period (including undistributed net investment income of $44,207,476 and
$51,493,530, respectively) | | | $2,132,564,831 | | | | $2,600,528,979 | |
See Notes to Financial Statements
11
MFS Value Series
FINANCIAL STATEMENTS | FINANCIAL HIGHLIGHTS
The financial highlights table is intended to help you understand the fund’s financial performance for the past 5 years. Certain information reflects financial results for a single fund share. The total returns in the table represent the rate by which an investor would have earned (or lost) on an investment in the fund share class (assuming reinvestment of all distributions) held for the entire period.
| | | | | | | | | | | | | | | | | | | | |
| Initial Class | | Years ended 12/31 | |
| | | 2015 | | | 2014 | | | 2013 | | | 2012 | | | 2011 | |
Net asset value, beginning of period | | | $20.34 | | | | $19.28 | | | | $14.40 | | | | $12.68 | | | | $12.98 | |
| Income (loss) from investment operations | | | | | | | | | | | | | | | | | | | | |
Net investment income (d) | | | $0.40 | | | | $0.44 | | | | $0.30 | | | | $0.28 | | | | $0.24 | |
Net realized and unrealized gain (loss) on investments
and foreign currency | | | (0.67 | ) | | | 1.55 | | | | 4.83 | | | | 1.77 | | | | (0.30 | ) |
Total from investment operations | | | $(0.27 | ) | | | $1.99 | | | | $5.13 | | | | $2.05 | | | | $(0.06 | ) |
| Less distributions declared to shareholders | | | | | | | | | | | | | | | | | | | | |
From net investment income | | | $(0.48 | ) | | | $(0.31 | ) | | | $(0.20 | ) | | | $(0.23 | ) | | | $(0.19 | ) |
From net realized gain on investments | | | (1.20 | ) | | | (0.62 | ) | | | (0.05 | ) | | | (0.10 | ) | | | (0.05 | ) |
Total distributions declared to shareholders | | | $(1.68 | ) | | | $(0.93 | ) | | | $(0.25 | ) | | | $(0.33 | ) | | | $(0.24 | ) |
Net asset value, end of period (x) | | | $18.39 | | | | $20.34 | | | | $19.28 | | | | $14.40 | | | | $12.68 | |
Total return (%) (k)(r)(s)(x) | | | (0.74 | ) | | | 10.51 | | | | 35.89 | | | | 16.26 | | | | (0.30 | ) |
Ratios (%) (to average net assets)
and Supplemental data: | | | | | | | | | | | | | | | | | | | | |
Expenses before expense reductions (f) | | | 0.73 | | | | 0.73 | | | | 0.73 | | | | 0.78 | | | | 0.79 | |
Expenses after expense reductions (f) | | | 0.73 | | | | 0.72 | | | | 0.73 | | | | 0.78 | | | | 0.79 | |
Net investment income | | | 2.00 | | | | 2.23 | | | | 1.74 | | | | 2.02 | | | | 1.81 | |
Portfolio turnover | | | 13 | | | | 13 | | | | 15 | | | | 16 | | | | 18 | |
Net assets at end of period (000 omitted) | | | $964,811 | | | | $1,118,647 | | | | $1,090,381 | | | | $988,594 | | | | $352,752 | |
See Notes to Financial Statements
12
MFS Value Series
Financial Highlights – continued
| | | | | | | | | | | | | | | | | | | | |
| Service Class | | Years ended 12/31 | |
| | | 2015 | | | 2014 | | | 2013 | | | 2012 | | | 2011 | |
Net asset value, beginning of period | | | $20.05 | | | | $19.03 | | | | $14.22 | | | | $12.54 | | | | $12.83 | |
| Income (loss) from investment operations | | | | | | | | | | | | | | | | | | | | |
Net investment income (d) | | | $0.34 | | | | $0.38 | | | | $0.25 | | | | $0.24 | | | | $0.20 | |
Net realized and unrealized gain (loss) on investments
and foreign currency | | | (0.65 | ) | | | 1.52 | | | | 4.78 | | | | 1.74 | | | | (0.27 | ) |
Total from investment operations | | | $(0.31 | ) | | | $1.90 | | | | $5.03 | | | | $1.98 | | | | $(0.07 | ) |
| Less distributions declared to shareholders | | | | | | | | | | | | | | | | | | | | |
From net investment income | | | $(0.42 | ) | | | $(0.26 | ) | | | $(0.17 | ) | | | $(0.20 | ) | | | $(0.17 | ) |
From net realized gain on investments | | | (1.20 | ) | | | (0.62 | ) | | | (0.05 | ) | | | (0.10 | ) | | | (0.05 | ) |
Total distributions declared to shareholders | | | $(1.62 | ) | | | $(0.88 | ) | | | $(0.22 | ) | | | $(0.30 | ) | | | $(0.22 | ) |
Net asset value, end of period (x) | | | $18.12 | | | | $20.05 | | | | $19.03 | | | | $14.22 | | | | $12.54 | |
Total return (%) (k)(r)(s)(x) | | | (0.93 | ) | | | 10.20 | | | | 35.59 | | | | 15.88 | | | | (0.47 | ) |
Ratios (%) (to average net assets)
and Supplemental data: | | | | | | | | | | | | | | | | | | | | |
Expenses before expense reductions (f) | | | 0.98 | | | | 0.98 | | | | 0.98 | | | | 1.03 | | | | 1.04 | |
Expenses after expense reductions (f) | | | 0.98 | | | | 0.97 | | | | 0.98 | | | | 1.03 | | | | 1.04 | |
Net investment income | | | 1.76 | | | | 1.99 | | | | 1.49 | | | | 1.76 | | | | 1.58 | |
Portfolio turnover | | | 13 | | | | 13 | | | | 15 | | | | 16 | | | | 18 | |
Net assets at end of period (000 omitted) | | | $1,167,754 | | | | $1,481,882 | | | | $1,404,019 | | | | $1,022,722 | | | | $831,481 | |
| (d) | Per share data is based on average shares outstanding. |
| (f) | Ratios do not reflect reductions from fees paid indirectly, if applicable. |
| (k) | The total return does not reflect expenses that apply to separate accounts. Inclusion of these charges would reduce the total return figures for all periods shown. |
| (r) | Certain expenses have been reduced without which performance would have been lower. |
| (s) | From time to time the fund may receive proceeds from litigation settlements, without which performance would be lower. |
| (x) | The net asset values and total returns have been calculated on net assets which include adjustments made in accordance with U.S. generally accepted accounting principles required at period end for financial reporting purposes. |
See Notes to Financial Statements
13
MFS Value Series
NOTES TO FINANCIAL STATEMENTS
| (1) | | Business and Organization |
MFS Value Series (the fund) is a diversified series of MFS Variable Insurance Trust (the trust). The trust is organized as a Massachusetts business trust and is registered under the Investment Company Act of 1940, as amended, as an open-end management investment company. The shareholders of each series of the trust are separate accounts of insurance companies, which offer variable annuity and/or life insurance products, and qualified retirement and pension plans.
The fund is an investment company and accordingly follows the investment company accounting and reporting guidance of the Financial Accounting Standards Board (FASB) Accounting Standards Codification Topic 946 Financial Services – Investment Companies.
| (2) | | Significant Accounting Policies |
General – The preparation of financial statements in conformity with U.S. generally accepted accounting principles requires management to make estimates and assumptions that affect the reported amounts of assets and liabilities, and disclosure of contingent assets and liabilities at the date of the financial statements and the reported amounts of increases and decreases in net assets from operations during the reporting period. Actual results could differ from those estimates. In the preparation of these financial statements, management has evaluated subsequent events occurring after the date of the fund’s Statement of Assets and Liabilities through the date that the financial statements were issued.
In January 2016, FASB issued Accounting Standards Update 2016-01, Financial Instruments – Overall (Subtopic 825-10) – Recognition and Measurement of Financial Assets and Financial Liabilities (“ASU 2016-01”) which would first be effective for annual reporting periods beginning after December 15, 2017, and interim periods therein. ASU 2016-01, which changes the accounting for equity investments and for certain financial liabilities, also modifies the presentation and disclosure requirements for financial instruments. Investment companies are specifically exempted from ASU 2016-01’s equity investment accounting provisions and will continue to follow the industry specific guidance for investment accounting under ASC 946. Although still evaluating the potential impacts of ASU 2016-01 to the fund, management expects that the impact of the fund’s adoption will be limited to additional financial statement disclosures.
Balance Sheet Offsetting – The fund’s accounting policy with respect to balance sheet offsetting is that, absent an event of default by the counterparty or a termination of the agreement, the International Swaps and Derivatives Association (ISDA) Master Agreement does not result in an offset of reported amounts of financial assets and financial liabilities in the Statement of Assets and Liabilities across transactions between the fund and the applicable counterparty. The fund’s right to setoff may be restricted or prohibited by the bankruptcy or insolvency laws of the particular jurisdiction to which a specific master netting agreement counterparty is subject. Balance sheet offsetting disclosures, to the extent applicable to the fund, have been included in the fund’s Significant Accounting Policies note under the captions for each of the fund’s in-scope financial instruments and transactions.
Investment Valuations – Equity securities, including restricted equity securities, are generally valued at the last sale or official closing price on their primary market or exchange as provided by a third-party pricing service. Equity securities, for which there were no sales reported that day, are generally valued at the last quoted daily bid quotation on their primary market or exchange as provided by a third-party pricing service. Short-term instruments with a maturity at issuance of 60 days or less may be valued at amortized cost, which approximates market value. Open-end investment companies are generally valued at net asset value per share. Securities and other assets generally valued on the basis of information from a third-party pricing service may also be valued at a broker/dealer bid quotation. Values obtained from third-party pricing services can utilize both transaction data and market information such as yield, quality, coupon rate, maturity, type of issue, trading characteristics, and other market data. The values of foreign securities and other assets and liabilities expressed in foreign currencies are converted to U.S. dollars using the mean of bid and asked prices for rates provided by a third-party pricing service.
The Board of Trustees has delegated primary responsibility for determining or causing to be determined the value of the fund’s investments (including any fair valuation) to the adviser pursuant to valuation policies and procedures approved by the Board. If the adviser determines that reliable market quotations are not readily available, investments are valued at fair value as determined in good faith by the adviser in accordance with such procedures under the oversight of the Board of Trustees. Under the fund’s valuation policies and procedures, market quotations are not considered to be readily available for most types of debt instruments and floating rate loans and many types of derivatives. These investments are generally valued at fair value based on information from third-party pricing services. In addition, investments may be valued at fair value if the adviser determines that an investment’s value has been materially affected by events occurring after the close of the exchange or market on which the investment is principally traded (such as foreign exchange or market) and prior to the determination of the fund’s net asset value, or after the halting of trading of a specific security where trading does not resume prior to the close of the exchange or market on which the security is principally traded. Events that occur on a frequent basis after foreign markets close (such as developments in foreign markets and significant movements in the U.S. markets) and prior to the determination of the fund’s net asset value may be deemed to have a material effect on the value of securities traded in foreign markets. Accordingly, the fund’s foreign equity securities may often be
14
MFS Value Series
Notes to Financial Statements – continued
valued at fair value. The adviser generally relies on third-party pricing services or other information (such as the correlation with price movements of similar securities in the same or other markets; the type, cost and investment characteristics of the security; the business and financial condition of the issuer; and trading and other market data) to assist in determining whether to fair value and at what value to fair value an investment. The value of an investment for purposes of calculating the fund’s net asset value can differ depending on the source and method used to determine value. When fair valuation is used, the value of an investment used to determine the fund’s net asset value may differ from quoted or published prices for the same investment. There can be no assurance that the fund could obtain the fair value assigned to an investment if it were to sell the investment at the same time at which the fund determines its net asset value per share.
Various inputs are used in determining the value of the fund’s assets or liabilities. These inputs are categorized into three broad levels. In certain cases, the inputs used to measure fair value may fall into different levels of the fair value hierarchy. In such cases, an investment’s level within the fair value hierarchy is based on the lowest level of input that is significant to the fair value measurement. The fund’s assessment of the significance of a particular input to the fair value measurement in its entirety requires judgment, and considers factors specific to the investment. Level 1 includes unadjusted quoted prices in active markets for identical assets or liabilities. Level 2 includes other significant observable market-based inputs (including quoted prices for similar securities, interest rates, prepayment speed, and credit risk). Level 3 includes unobservable inputs, which may include the adviser’s own assumptions in determining the fair value of investments. The following is a summary of the levels used as of December 31, 2015 in valuing the fund’s assets or liabilities:
| | | | | | | | | | | | | | | | |
| Investments at Value | | Level 1 | | | Level 2 | | | Level 3 | | | Total | |
| Equity Securities: | | | | | | | | | | | | | | | | |
United States | | | $2,007,195,840 | | | | $— | | | | $— | | | | $2,007,195,840 | |
Switzerland | | | — | | | | 47,330,158 | | | | — | | | | 47,330,158 | |
United Kingdom | | | — | | | | 32,677,270 | | | | — | | | | 32,677,270 | |
France | | | — | | | | 16,027,375 | | | | — | | | | 16,027,375 | |
Canada | | | 10,590,210 | | | | — | | | | — | | | | 10,590,210 | |
| Mutual Funds | | | 16,597,492 | | | | — | | | | — | | | | 16,597,492 | |
| Total Investments | | | $2,034,383,542 | | | | $96,034,803 | | | | $— | | | | $2,130,418,345 | |
For further information regarding security characteristics, see the Portfolio of Investments.
Foreign Currency Translation – Purchases and sales of foreign investments, income, and expenses are converted into U.S. dollars based upon currency exchange rates prevailing on the respective dates of such transactions or on the reporting date for foreign denominated receivables and payables. Gains and losses attributable to foreign currency exchange rates on sales of securities are recorded for financial statement purposes as net realized gains and losses on investments. Gains and losses attributable to foreign exchange rate movements on receivables, payables, income and expenses are recorded for financial statement purposes as foreign currency transaction gains and losses. That portion of both realized and unrealized gains and losses on investments that results from fluctuations in foreign currency exchange rates is not separately disclosed.
Security Loans – Under its Securities Lending Agency Agreement with the fund, State Street Bank and Trust Company (“State Street”), as lending agent, loans the securities of the fund to certain qualified institutions (the “Borrowers”) approved by the fund. Security loans can be terminated at the discretion of either the lending agent or the fund and the related securities must be returned within the earlier of the standard trade settlement period for such securities or within three business days. The loans are collateralized by cash and/or U.S. Treasury and federal agency obligations in an amount typically at least equal to the market value of the securities loaned. On loans collateralized by cash, the cash collateral is invested in a money market fund. The market value of the loaned securities is determined at the close of business of the fund and any additional required collateral is delivered to the fund on the next business day. State Street provides the fund with indemnification against Borrower default. In the event of Borrower default, State Street will, for the benefit of the fund, either purchase securities identical to those loaned or, when such purchase is commercially impracticable, pay the fund the market value of the loaned securities. In return, State Street assumes the fund’s rights to the related collateral. If the collateral value is less than the cost to purchase identical securities, State Street is responsible for the shortfall, but only to the extent that such shortfall is not due to a decline in collateral value resulting from collateral reinvestment for which the fund bears the risk of loss. A portion of the income generated upon investment of the collateral is remitted to the Borrowers, and the remainder is allocated between the fund and the lending agent. On loans collateralized by U.S. Treasury and/or federal agency obligations, a fee is received from the Borrower, and is allocated between the fund and the lending agent. Income from securities lending is included in “Interest” income in the Statement of Operations. The dividend and interest income earned on the securities loaned is accounted for in the same manner as other dividend and interest income. At December 31, 2015, there were no securities on loan or collateral outstanding.
Indemnifications – Under the fund’s organizational documents, its officers and Trustees may be indemnified against certain liabilities and expenses arising out of the performance of their duties to the fund. Additionally, in the normal course of business, the
15
MFS Value Series
Notes to Financial Statements – continued
fund enters into agreements with service providers that may contain indemnification clauses. The fund’s maximum exposure under these agreements is unknown as this would involve future claims that may be made against the fund that have not yet occurred.
Investment Transactions and Income – Investment transactions are recorded on the trade date. Interest income is recorded on the accrual basis. Dividends received in cash are recorded on the ex-dividend date. Certain dividends from foreign securities will be recorded when the fund is informed of the dividend if such information is obtained subsequent to the ex-dividend date. Dividend payments received in additional securities are recorded on the ex-dividend date in an amount equal to the value of the security on such date.
The fund may receive proceeds from litigation settlements. Any proceeds received from litigation involving portfolio holdings are reflected in the Statement of Operations in realized gain/loss if the security has been disposed of by the fund or in unrealized gain/loss if the security is still held by the fund. Any other proceeds from litigation not related to portfolio holdings are reflected as other income in the Statement of Operations.
Fees Paid Indirectly – Prior to October 1, 2015, the fund’s custody fee could be reduced by a credit earned under an arrangement that measured the value of U.S. dollars deposited with the custodian by the fund. The amount of the credit, for the year ended December 31, 2015, is shown as a reduction of total expenses in the Statement of Operations.
Tax Matters and Distributions – The fund intends to qualify as a regulated investment company, as defined under Subchapter M of the Internal Revenue Code, and to distribute all of its taxable income, including realized capital gains. As a result, no provision for federal income tax is required. The fund’s federal tax returns, when filed, will remain subject to examination by the Internal Revenue Service for a three year period. Management has analyzed the fund’s tax positions taken on federal and state tax returns for all open tax years and does not believe that there are any uncertain tax positions that require recognition of a tax liability. Foreign taxes, if any, have been accrued by the fund in the accompanying financial statements in accordance with the applicable foreign tax law. Foreign income taxes may be withheld by certain countries in which the fund invests. Additionally, capital gains realized by the fund on securities issued in or by certain foreign countries may be subject to capital gains tax imposed by those countries.
Distributions to shareholders are recorded on the ex-dividend date. Income and capital gain distributions are determined in accordance with income tax regulations, which may differ from U.S. generally accepted accounting principles. Certain capital accounts in the financial statements are periodically adjusted for permanent differences in order to reflect their tax character. These adjustments have no impact on net assets or net asset value per share. Temporary differences which arise from recognizing certain items of income, expense, gain or loss in different periods for financial statement and tax purposes will reverse at some time in the future. Distributions in excess of net investment income or net realized gains are temporary overdistributions for financial statement purposes resulting from differences in the recognition or classification of income or distributions for financial statement and tax purposes.
Book/tax differences primarily relate to wash sale loss deferrals.
The tax character of distributions declared to shareholders for the last two fiscal years is as follows:
| | | | | | | | |
| | | 12/31/15 | | | 12/31/14 | |
| Ordinary income (including any short-term capital gains) | | | $57,140,588 | | | | $83,022,402 | |
| Long-term capital gains | | | 132,192,323 | | | | 34,302,915 | |
| Total distributions | | | $189,332,911 | | | | $117,325,317 | |
The federal tax cost and the tax basis components of distributable earnings were as follows:
| | | | |
| As of 12/31/15 | | | | |
| Cost of investments | | | $1,447,849,221 | |
| Gross appreciation | | | 704,831,516 | |
| Gross depreciation | | | (22,262,392 | ) |
| Net unrealized appreciation (depreciation) | | | $682,569,124 | |
| Undistributed ordinary income | | | 46,253,835 | |
| Undistributed long-term capital gain | | | 179,167,999 | |
| Other temporary differences | | | (82,828 | ) |
Multiple Classes of Shares of Beneficial Interest – The fund offers multiple classes of shares, which differ in their respective distribution and/or service fees. The fund’s income, realized and unrealized gain (loss), and common expenses are allocated to shareholders based on the daily net assets of each class. Dividends are declared separately for each class. Differences in per share
16
MFS Value Series
Notes to Financial Statements – continued
dividend rates are generally due to differences in separate class expenses. The fund’s distributions declared to shareholders as reported in the Statements of Changes in Net Assets are presented by class as follows:
| | | | | | | | | | | | | | | | |
| | | From net investment
income | | | From net realized gain on
investments | |
| | | Year ended
12/31/15 | | | Year ended
12/31/14 | | | Year ended
12/31/15 | | | Year ended
12/31/14 | |
| Initial Class | | | $23,725,000 | | | | $17,440,139 | | | | $59,539,845 | | | | $35,286,353 | |
| Service Class | | | 27,773,261 | | | | 19,304,975 | | | | 78,294,805 | | | | 45,293,850 | |
| Total | | | $51,498,261 | | | | $36,745,114 | | | | $137,834,650 | | | | $80,580,203 | |
| (3) | | Transactions with Affiliates |
Investment Adviser – The fund has an investment advisory agreement with MFS to provide overall investment management and related administrative services and facilities to the fund. The management fee is computed daily and paid monthly at the following annual rates:
| | | | |
| First $1 billion of average daily net assets | | | 0.75% | |
| Average daily net assets in excess of $1 billion | | | 0.65% | |
The investment adviser has agreed in writing to reduce its management fee to 0.60% in excess of $2.5 billion. This written agreement will continue until modified by the fund’s Board of Trustees, but such agreement will continue at least until April 30, 2017. For the year ended December 31, 2015, the fund’s average daily net assets did not exceed $2.5 billion and therefore, the management fee was not reduced. MFS has agreed in writing to reduce its management fee by a specified amount if certain MFS mutual fund assets exceed thresholds agreed to by MFS and the fund’s Board of Trustees. For the year ended December 31, 2015, this management fee reduction amounted to $165,147, which is included in the reduction of total expenses in the Statement of Operations. The management fee incurred for the year ended December 31, 2015 was equivalent to an annual effective rate of 0.69% of the fund’s average daily net assets.
The investment adviser has agreed in writing to pay a portion of the fund’s total annual operating expenses, excluding interest, taxes, extraordinary expenses, brokerage and transaction costs, and investment-related expenses, such that total annual operating expenses do not exceed 0.90% of average daily net assets for the Initial Class shares and 1.15% of average daily net assets for the Service Class shares. This written agreement will continue until modified by the fund’s Board of Trustees, but such agreement will continue at least until April 30, 2017. For the year ended December 31, 2015, the fund’s actual operating expenses did not exceed the limit and therefore, the investment adviser did not pay any portion of the fund’s expenses related to this agreement.
Distributor – MFS Fund Distributors, Inc. (MFD), a wholly-owned subsidiary of MFS, is the distributor of shares of the fund. The Trustees have adopted a distribution plan for the Service Class shares pursuant to Rule 12b-1 under the Investment Company Act of 1940.
The fund’s distribution plan provides that the fund will pay MFD distribution and/or service fees equal to 0.25% per annum of its average daily net assets attributable to Service Class shares as partial consideration for services performed and expenses incurred by MFD and financial intermediaries (including participating insurance companies that invest in the fund to fund variable annuity and variable life insurance contracts, sponsors of qualified retirement and pension plans that invest in the fund, and affiliates of these participating insurance companies and plan sponsors) in connection with the sale and distribution of the Service Class shares. MFD may subsequently pay all, or a portion, of the distribution and/or service fees to financial intermediaries.
Shareholder Servicing Agent – MFS Service Center, Inc. (MFSC), a wholly-owned subsidiary of MFS, receives a fee from the fund for its services as shareholder servicing agent. For the year ended December 31, 2015, the fee was $58,965, which equated to 0.0025% annually of the fund’s average daily net assets. MFSC also receives payment from the fund for out-of-pocket expenses paid by MFSC on behalf of the fund. For the year ended December 31, 2015, these costs amounted to $1,509.
Administrator – MFS provides certain financial, legal, shareholder communications, compliance, and other administrative services to the fund. Under an administrative services agreement, the fund reimburses MFS the costs incurred to provide these services. The fund is charged an annual fixed amount of $17,500 plus a fee based on average daily net assets. The administrative services fee incurred for the year ended December 31, 2015 was equivalent to an annual effective rate of 0.0160% of the fund’s average daily net assets.
Trustees’ and Officers’ Compensation – The fund pays compensation to independent Trustees in the form of a retainer, attendance fees, and additional compensation to Board and Committee chairpersons. The fund does not pay compensation directly to Trustees or officers of the fund who are also officers of the investment adviser, all of whom receive remuneration for their services to the fund from MFS. Certain officers and Trustees of the fund are officers or directors of MFS, MFD, and MFSC.
Other – This fund and certain other funds managed by MFS (the funds) have entered into a service agreement (the ISO Agreement) which provides for payment of fees solely by the funds to Tarantino LLC in return for the provision of services of an Independent
17
MFS Value Series
Notes to Financial Statements – continued
Senior Officer (ISO) for the funds. Frank L. Tarantino serves as the ISO and is an officer of the funds and the sole member of Tarantino LLC. The funds can terminate the ISO Agreement with Tarantino LLC at any time under the terms of the ISO Agreement. For the year ended December 31, 2015, the fee paid by the fund under this agreement was $7,594 and is included in “Miscellaneous” expense in the Statement of Operations. MFS has agreed to bear all expenses associated with office space, other administrative support, and supplies provided to the ISO.
The fund invests in the MFS Institutional Money Market Portfolio which is managed by MFS and seeks current income consistent with preservation of capital and liquidity. Income earned on this investment is included in “Dividends from underlying affiliated funds” in the Statement of Operations. This money market fund does not pay a management fee to MFS.
For the year ended December 31, 2015, purchases and sales of investments, other than short-term obligations, aggregated $295,564,374 and $665,573,783, respectively.
| (5) | | Shares of Beneficial Interest |
The fund’s Declaration of Trust permits the Trustees to issue an unlimited number of full and fractional shares of beneficial interest. Transactions in fund shares were as follows:
| | | | | | | | | | | | | | | | |
| | | Year ended 12/31/15 | | | Year ended 12/31/14 | |
| | | Shares | | | Amount | | | Shares | | | Amount | |
| Shares sold | | | | | | | | | | | | | | | | |
Initial Class | | | 2,231,454 | | | | $42,370,134 | | | | 1,907,102 | | | | $36,814,672 | |
Service Class | | | 7,197,931 | | | | 136,498,386 | | | | 11,164,519 | | | | 216,843,288 | |
| | | 9,429,385 | | | | $178,868,520 | | | | 13,071,621 | | | | $253,657,960 | |
| Shares issued in connection with acquisition of MFS Value Portfolio | | | | | | | | | | | | | | | | |
Initial Class | | | | | | | | | | | 7,020,532 | | | | $138,866,125 | |
Service Class | | | | | | | | | | | 9,696,511 | | | | 188,984,993 | |
| | | | | | | | | | | 16,717,043 | | | | $327,851,118 | |
| Shares issued to shareholders in reinvestment of distributions | | | | | | | | | | | | | | | | |
Initial Class | | | 4,874,991 | | | | $83,264,845 | | | | 2,709,480 | | | | $52,726,492 | |
Service Class | | | 6,298,579 | | | | 106,068,066 | | | | 3,364,522 | | | | 64,598,825 | |
| | | 11,173,570 | | | | $189,332,911 | | | | 6,074,002 | | | | $117,325,317 | |
| Shares reacquired | | | | | | | | | | | | | | | | |
Initial Class | | | (9,654,481 | ) | | | $(191,553,797 | ) | | | (13,190,894 | ) | | | $(259,093,870 | ) |
Service Class | | | (22,944,915 | ) | | | (431,339,889 | ) | | | (24,112,024 | ) | | | (460,128,587 | ) |
| | | (32,599,396 | ) | | | $(622,893,686 | ) | | | (37,302,918 | ) | | | $(719,222,457 | ) |
| Net change | | | | | | | | | | | | | | | | |
Initial Class | | | (2,548,036 | ) | | | $(65,918,818 | ) | | | (1,553,780 | ) | | | $(30,686,581 | ) |
Service Class | | | (9,448,405 | ) | | | (188,773,437 | ) | | | 113,528 | | | | 10,298,519 | |
| | | (11,996,441 | ) | | | $(254,692,255 | ) | | | (1,440,252 | ) | | | $(20,388,062 | ) |
The fund is one of several mutual funds in which certain MFS funds may invest. The MFS funds do not invest in the underlying funds for the purpose of exercising management or control. At the end of the period, the MFS Moderate Allocation Portfolio, the MFS Growth Allocation Portfolio, and the MFS Conservative Allocation Portfolio were the owners of record of approximately 8%, 2%, and 2%, respectively, of the value of outstanding voting shares of the fund.
The fund and certain other funds managed by MFS participate in a $1.25 billion unsecured committed line of credit, subject to a $1 billion sublimit, provided by a syndication of banks under a credit agreement. Borrowings may be made for temporary financing needs. Interest is charged to each fund, based on its borrowings, generally at a rate equal to the higher of the Overnight Federal Reserve funds rate or daily one month LIBOR plus an agreed upon spread. A commitment fee, based on the average daily, unused portion of the committed line of credit, is allocated among the participating funds at the end of each calendar quarter. In addition, the fund and other funds managed by MFS have established unsecured uncommitted borrowing arrangements with certain banks for temporary financing needs. Interest is charged to each fund, based on its borrowings, at a rate equal to the Overnight Federal Reserve funds rate plus an agreed upon spread. For the year ended December 31, 2015, the fund’s commitment fee and interest expense were $7,660 and $0, respectively, and are included in “Miscellaneous” expense in the Statement of Operations.
18
MFS Value Series
Notes to Financial Statements – continued
| (7) | | Transactions in Underlying Affiliated Funds – Affiliated Issuers |
An affiliated issuer may be considered one in which the fund owns 5% or more of the outstanding voting securities, or a company which is under common control. For the purposes of this report, the fund assumes the following to be an affiliated issuer:
| | | | | | | | | | | | | | | | |
| Underlying Affiliated Fund | | Beginning
Shares/Par
Amount | | | Acquisitions
Shares/Par
Amount | | | Dispositions
Shares/Par
Amount | | | Ending
Shares/Par
Amount | |
| MFS Institutional Money Market Portfolio | | | 1,800 | | | | 454,807,816 | | | | (438,212,124 | ) | | | 16,597,492 | |
| | | | |
| Underlying Affiliated Fund | | Realized
Gain (Loss) | | | Capital Gain
Distributions | | | Dividend
Income | | | Ending
Value | |
| MFS Institutional Money Market Portfolio | | | $— | | | | $— | | | | $21,115 | | | | $16,597,492 | |
At close of business on August 8, 2014, the fund with net assets of approximately $2,239,425,210, acquired all of the assets and liabilities of MFS Value Portfolio, a series of Variable Insurance Trust II. The purpose of the transaction was to provide shareholders of MFS Value Portfolio the opportunity to participate in a larger combined portfolio with an identical investment objective and similar investment policies and strategies. The acquisition was accomplished by a tax-free exchange of approximately 16,717,043 shares of the fund (valued at approximately $327,851,118) for all of the assets and liabilities of MFS Value Portfolio. MFS Value Portfolio then distributed the shares of the fund that MFS Value Portfolio received from the fund to its shareholders. MFS Value Portfolio’s investments on that date were valued at approximately $328,251,524 with a cost basis of approximately $209,873,974. For financial reporting purposes, assets received and shares issued by the fund were recorded at fair value; however, the cost basis of the investments received from MFS Value Portfolio were carried forward to align ongoing reporting of the fund’s realized and unrealized gains and losses with amounts distributable to shareholders for tax purposes.
19
MFS Value Series
REPORT OF INDEPENDENT REGISTERED PUBLIC ACCOUNTING FIRM
To the Board of Trustees of MFS Variable Insurance Trust and the Shareholders of MFS Value Series:
We have audited the accompanying statement of assets and liabilities, including the portfolio of investments, of MFS Value Series (one of the series of MFS Variable Insurance Trust) (the “Fund”) as of December 31, 2015, and the related statement of operations for the year then ended, the statements of changes in net assets for each of the two years in the period then ended, and the financial highlights for each of the five years in the period then ended. These financial statements and financial highlights are the responsibility of the Fund’s management. Our responsibility is to express an opinion on these financial statements and financial highlights based on our audits.
We conducted our audits in accordance with the standards of the Public Company Accounting Oversight Board (United States). Those standards require that we plan and perform the audit to obtain reasonable assurance about whether the financial statements and financial highlights are free of material misstatement. The Fund is not required to have, nor were we engaged to perform, an audit of its internal control over financial reporting. Our audits included consideration of internal control over financial reporting as a basis for designing audit procedures that are appropriate in the circumstances, but not for the purpose of expressing an opinion on the effectiveness of the Fund’s internal control over financial reporting. Accordingly, we express no such opinion. An audit also includes examining, on a test basis, evidence supporting the amounts and disclosures in the financial statements, assessing the accounting principles used and significant estimates made by management, as well as evaluating the overall financial statement presentation. Our procedures included confirmation of securities owned as of December 31, 2015, by correspondence with the custodian. We believe that our audits provide a reasonable basis for our opinion.
In our opinion, such financial statements and financial highlights referred to above present fairly, in all material respects, the financial position of MFS Value Series as of December 31, 2015, the results of its operations for the year then ended, the changes in its net assets for each of the two years in the period then ended, and the financial highlights for each of the five years in the period then ended, in conformity with accounting principles generally accepted in the United States of America.
DELOITTE & TOUCHE LLP
Boston, Massachusetts
February 16, 2016
20
MFS Value Series
TRUSTEES AND OFFICERS – IDENTIFICATION AND BACKGROUND
The Trustees and Officers of the Trust, as of February 1, 2016, are listed below, together with their principal occupations during the past five years. (Their titles may have varied during that period.) The address of each Trustee and Officer is 111 Huntington Avenue, Boston, Massachusetts 02199-7618.
| | | | | | | | |
Name, Age | | Position(s)
Held with Fund | | Trustee/Officer
Since (h) | | Principal Occupations
During the Past Five Years | | Other Directorships (j) |
| INTERESTED TRUSTEES |
Robert J. Manning (k)
(age 52) | | Trustee | | February 2004 | | Massachusetts Financial Services Company, Chairman, Co-Chief Executive Officer and Director | | N/A |
| | | | |
Robin A. Stelmach (k) (age 54) | | Trustee and President | | January 2014 | | Massachusetts Financial Services Company, Executive Vice President and Chief Operating Officer | | N/A |
| | |
| INDEPENDENT TRUSTEES | | | | |
David H. Gunning
(age 73) | | Trustee and Chair of Trustees | | January 2004 | | Private investor | | Lincoln Electric Holdings, Inc., Director; Development Alternatives, Inc., Director/Non-Executive Chairman |
| | | | |
Steven E. Buller (age 64) | | Trustee | | February 2014 | | Chairman, Financial Accounting Standards Advisory Council; Standing Advisory Group, Public Company Accounting Oversight Board, Member (until 2014); BlackRock, Inc. (investment management), Managing Director (until 2014), BlackRock Finco UK (investment management), Director (until 2014) | | N/A |
| | | | |
Robert E. Butler
(age 74) | | Trustee | | January 2006 | | Consultant – investment company industry regulatory and compliance matters | | N/A |
| | | | |
Maureen R. Goldfarb (age 60) | | Trustee | | January 2009 | | Private investor | | N/A |
| | | | |
William R. Gutow
(age 74) | | Trustee | | December 1993 | | Private investor and real estate consultant; Capitol Entertainment Management Company (video franchise), Vice Chairman | | Texas Donuts, Vice Chairman (until 2010) |
| | | | |
Michael Hegarty
(age 71) | | Trustee | | December 2004 | | Private investor | | Rouse Properties Inc., Director; Capmark Financial Group Inc., Director |
| | | | |
John P. Kavanaugh (age 61) | | Trustee | | January 2009 | | Private investor | | N/A |
| | | | |
Maryanne L. Roepke (age 59) | | Trustee | | May 2014 | | American Century Investments (investment management), Senior Vice President and Chief Compliance Officer (until 2014) | | N/A |
| | | | |
Laurie J. Thomsen
(age 58) | | Trustee | | March 2005 | | Private investor | | The Travelers Companies, Director; Dycom Industries, Inc., Director |
| | | | |
Robert W. Uek
(age 74) | | Trustee | | January 2006 | | Consultant to investment company industry | | N/A |
| | | | |
| OFFICERS | | | | | | | | |
Christopher R. Bohane (k)
(age 42) | | Assistant Secretary and Assistant Clerk | | July 2005 | | Massachusetts Financial Services Company, Vice President and Assistant General Counsel | | N/A |
| | | | |
Kino Clark (k) (age 47) | | Assistant Treasurer | | January 2012 | | Massachusetts Financial Services Company, Vice President | | N/A |
| | | | |
Kristin V. Collins (k) (age 42) | | Assistant Secretary and Assistant Clerk | | September 2015 | | Massachusetts Financial Services Company, Vice President and Assistant General Counsel | | N/A |
| | | | |
Thomas H. Connors (k) (age 56) | | Assistant Secretary and Assistant Clerk | | September 2012 | | Massachusetts Financial Services Company, Vice President and Senior Counsel; Deutsche Investment Management Americas Inc. (financial service provider), Director and Senior Counsel (until 2012) | | N/A |
21
MFS Value Series
Trustees and Officers – continued
| | | | | | | | |
Name, Age | | Position(s)
Held with Fund | | Trustee/Officer
Since (h) | | Principal Occupations
During the Past Five Years | | Other Directorships (j) |
Ethan D. Corey (k)
(age 52) | | Assistant Secretary and Assistant Clerk | | July 2005 | | Massachusetts Financial Services Company, Senior Vice President and Associate General Counsel | | N/A |
| | | | |
David L. DiLorenzo (k)
(age 47) | | Treasurer | | July 2005 | | Massachusetts Financial Services Company, Senior Vice President | | N/A |
| | | | |
Brian E. Langenfeld (k) (age 42) | | Assistant Secretary and Assistant Clerk | | June 2006 | | Massachusetts Financial Services Company, Vice President and Senior Counsel | | N/A |
| | | | |
Kenneth Paek (k) (age 41) | | Assistant Treasurer | | February 2015 | | Massachusetts Financial Services Company, Vice President; Cohen & Steers, Vice President/Head of Fund Administration (until 2014) | | N/A |
| | | | |
Susan A. Pereira (k)
(age 45) | | Assistant Secretary and Assistant Clerk | | July 2005 | | Massachusetts Financial Services Company, Vice President and Senior Counsel | | N/A |
| | | | |
Kasey L. Phillips (k) (age 45) | | Assistant Treasurer | | September 2012 | | Massachusetts Financial Services Company, Vice President; Wells Fargo Funds Management, LLC, Senior Vice President, Fund Treasurer (until 2012) | | N/A |
| | | | |
Mark N. Polebaum (k)
(age 63) | | Secretary and Clerk | | January 2006 | | Massachusetts Financial Services Company, Executive Vice President, General Counsel and Secretary | | N/A |
| | | | |
Matthew A. Stowe (k) (age 41) | | Assistant Secretary and Assistant Clerk | | October 2014 | | Massachusetts Financial Services Company, Vice President and Assistant General Counsel | | N/A |
| | | | |
Frank L. Tarantino
(age 71) | | Independent Senior Officer | | June 2004 | | Tarantino LLC (provider of compliance services), Principal | | N/A |
| | | | |
Richard S. Weitzel (k)
(age 45) | | Assistant Secretary and Assistant Clerk | | October 2007 | | Massachusetts Financial Services Company, Senior Vice President and Associate General Counsel | | N/A |
| | | | |
Martin J. Wolin (k) (age 48) | | Chief Compliance Officer | | July 2015 | | Massachusetts Financial Services Company, Senior Vice President and Chief Compliance Officer (since July 2015); Mercer (financial service provider), Chief Risk and Compliance Officer, North America and Latin America (until June 2015) | | N/A |
| | | | |
James O. Yost (k)
(age 55) | | Deputy Treasurer | | September 1990 | | Massachusetts Financial Services Company, Senior Vice President | | N/A |
| (h) | Date first appointed to serve as Trustee/officer of an MFS Fund. Each Trustee has served continuously since appointment unless indicated otherwise. For the period from December 15, 2004 until February 22, 2005, Mr. Manning served as Advisory Trustee. Prior to January 2012, Messrs. DiLorenzo and Yost served as Assistant Treasurers of the Funds. Ms. Stelmach was appointed as President of the Funds as of October 1, 2014. |
| (j) | Directorships or trusteeships of companies required to report to the Securities and Exchange Commission (i.e., “public companies”). |
| (k) | “Interested person” of the Trust within the meaning of the Investment Company Act of 1940 (referred to as the 1940 Act), which is the principal federal law governing investment companies like the fund, as a result of a position with MFS. The address of MFS is 111 Huntington Avenue, Boston, Massachusetts 02199-7618. |
Each Trustee (except Ms. Stelmach, Mr. Buller and Ms. Roepke) has been elected by shareholders and each Trustee and officer holds office until his or her successor is chosen and qualified or until his or her earlier death, resignation, retirement or removal. The Trust does not hold annual meetings for the purpose of electing Trustees, and Trustees are not elected for fixed terms. Messrs. Buller, Butler, Kavanaugh, Uek and Ms. Roepke are members of the Trust’s Audit Committee.
Each of the Fund’s Trustees and officers holds comparable positions with certain other funds of which MFS or a subsidiary is the investment adviser or distributor, and, in the case of the officers, with certain affiliates of MFS. As of February 1, 2016, the Trustees served as board members of 137 funds within the MFS Family of Funds.
22
MFS Value Series
Trustees and Officers – continued
The Statement of Additional Information for a Fund includes further information about the Trustees and is available without charge upon request by calling 1-800-225-2606.
| | |
Investment Adviser Massachusetts Financial Services Company 111 Huntington Avenue Boston, MA 02199-7618 | | Custodian State Street Bank and Trust Company 1 Lincoln Street Boston, MA 02111-2900 |
Distributor MFS Fund Distributors, Inc. 111 Huntington Avenue Boston, MA 02199-7618 | | Independent Registered Public Accounting Firm Deloitte & Touche LLP 200 Berkeley Street Boston, MA 02116 |
Portfolio Managers Nevin Chitkara Steven Gorham | | |
23
MFS Value Series
BOARD REVIEW OF INVESTMENT ADVISORY AGREEMENT
The Investment Company Act of 1940 requires that both the full Board of Trustees and a majority of the non-interested (“independent”) Trustees, voting separately, annually approve the continuation of the Fund’s investment advisory agreement with MFS. The Trustees consider matters bearing on the Fund and its advisory arrangements at their meetings throughout the year, including a review of performance data at each regular meeting. In addition, the independent Trustees met several times over the course of three months beginning in May and ending in July, 2015 (“contract review meetings”) for the specific purpose of considering whether to approve the continuation of the investment advisory agreement for the Fund and the other investment companies that the Board oversees (the “MFS Funds”). The independent Trustees were assisted in their evaluation of the Fund’s investment advisory agreement by independent legal counsel, from whom they received separate legal advice and with whom they met separately from MFS during various contract review meetings. The independent Trustees were also assisted in this process by the MFS Funds’ Independent Senior Officer, a senior officer appointed by and reporting to the independent Trustees.
In connection with their deliberations regarding the continuation of the investment advisory agreement, the Trustees, including the independent Trustees, considered such information and factors as they believed, in light of the legal advice furnished to them and their own business judgment, to be relevant. The investment advisory agreement for the Fund was considered separately, although the Trustees also took into account the common interests of all MFS Funds in their review. As described below, the Trustees considered the nature, quality, and extent of the various investment advisory, administrative, and shareholder services performed by MFS under the existing investment advisory agreement and other arrangements with the Fund.
In connection with their contract review meetings, the Trustees received and relied upon materials that included, among other items: (i) information provided by Lipper Inc., an independent third party, on the investment performance of the Fund for various time periods ended December 31, 2014 and the investment performance of a group of funds with substantially similar investment classifications/objectives (the “Lipper performance universe”), (ii) information provided by Lipper Inc. on the Fund’s advisory fees and other expenses and the advisory fees and other expenses of comparable funds identified by Lipper Inc. (the “Lipper expense group”), (iii) information provided by MFS on the advisory fees of comparable portfolios of other clients of MFS, including institutional separate accounts and other clients, (iv) information as to whether and to what extent applicable expense waivers, reimbursements or fee “breakpoints” are observed for the Fund, (v) information regarding MFS’ financial results and financial condition, including MFS’ and certain of its affiliates’ estimated profitability from services performed for the Fund and the MFS Funds as a whole, and compared to MFS’ institutional business, (vi) MFS’ views regarding the outlook for the mutual fund industry and the strategic business plans of MFS, (vii) descriptions of various functions performed by MFS for the Funds, such as compliance monitoring and portfolio trading practices, and (viii) information regarding the overall organization of MFS, including information about MFS’ senior management and other personnel providing investment advisory, administrative and other services to the Fund and the other MFS Funds. The comparative performance, fee and expense information prepared and provided by Lipper Inc. was not independently verified and the independent Trustees did not independently verify any information provided to them by MFS.
The Trustees’ conclusion as to the continuation of the investment advisory agreement was based on a comprehensive consideration of all information provided to the Trustees and not the result of any single factor. Some of the factors that figured particularly in the Trustees’ deliberations are described below, although individual Trustees may have evaluated the information presented differently from one another, giving different weights to various factors. It is also important to recognize that the fee arrangements for the Fund and other MFS Funds are the result of years of review and discussion between the independent Trustees and MFS, that certain aspects of such arrangements may receive greater scrutiny in some years than in others, and that the Trustees’ conclusions may be based, in part, on their consideration of these same arrangements during the course of the year and in prior years.
Based on information provided by Lipper Inc. and MFS, the Trustees reviewed the Fund’s total return investment performance as well as the performance of peer groups of funds over various time periods. The Trustees placed particular emphasis on the total return performance of the Fund’s Initial Class shares in comparison to the performance of funds in its Lipper performance universe over the three-year period ended December 31, 2014, which the Trustees believed was a long enough period to reflect differing market conditions. The total return performance of the Fund’s Initial Class shares was in the 2nd quintile relative to the other funds in the universe for this three-year period (the 1st quintile being the best performers and the 5th quintile being the worst performers). The total return performance of the Fund’s Initial Class shares was in the 4th quintile for the one-year period and the 3rd quintile for the five-year period ended December 31, 2014 relative to the Lipper performance universe. Because of the passage of time, these performance results may differ from the performance results for more recent periods, including those shown elsewhere in this report.
In the course of their deliberations, the Trustees took into account information provided by MFS in connection with the contract review meetings, as well as during investment review meetings conducted with portfolio management personnel during the course of the year regarding the Fund’s performance. After reviewing these and related factors, the Trustees concluded, within the context of their overall conclusions regarding the investment advisory agreement, that they were satisfied with MFS’ responses and efforts relating to investment performance.
24
MFS Value Series
Board Review of Investment Advisory Agreement – continued
In assessing the reasonableness of the Fund’s advisory fee, the Trustees considered, among other information, the Fund’s advisory fee and the total expense ratio of the Fund’s Initial Class shares as a percentage of average daily net assets and the advisory fee and total expense ratios of peer groups of funds based on information provided by Lipper Inc. The Trustees considered that MFS currently observes an expense limitation for the Fund, which may not be changed without the Trustees’ approval. The Trustees also considered that, according to the Lipper data (which takes into account any fee reductions or expense limitations that were in effect during the Fund’s last fiscal year), the Fund’s effective advisory fee rate and total expense ratio were each approximately at the Lipper expense group median.
The Trustees also considered the advisory fees charged by MFS to any institutional separate accounts advised by MFS (“separate accounts”) and unaffiliated investment companies for which MFS serves as subadviser (“subadvised funds”) that have comparable investment strategies to the Fund. In comparing these fees, the Trustees considered information provided by MFS as to the generally broader scope of services provided by MFS to the Fund, as well as the more extensive regulatory burdens imposed on MFS in managing the Fund, in comparison to separate accounts and subadvised funds. The Trustees also considered the higher demands placed on MFS’ investment personnel and trading infrastructure as a result of the daily cash in-flows and out-flows of the Fund in comparison to separate accounts.
The Trustees also considered whether the Fund may benefit from any economies of scale in the management of the Fund in the event of growth in assets of the Fund and/or growth in assets of the MFS Funds as a whole. They noted that the Fund’s advisory fee rate schedule is subject to a contractual breakpoint that reduces the Fund’s advisory fee rate on average daily net assets over $1 billion, and that MFS has agreed in writing to further reduce its advisory fee rate on the Fund’s average daily net assets over $2.5 billion, which may not be changed without the Trustees’ approval. The Trustees also noted that MFS has agreed in writing to waive a portion of the management fees of certain MFS Funds, including the Fund, if the total combined assets of certain funds within the MFS Funds’ complex increase above agreed upon thresholds (the “group fee waiver”), enabling the Fund’s shareholders to share in the benefits from any economies of scale at the complex level. The group fee waiver is reviewed and renewed annually between the Board and MFS. The Trustees concluded that the breakpoints and the group fee waiver were sufficient to allow the Fund to benefit from economies of scale as its assets and overall complex assets grow.
The Trustees also considered information prepared by MFS relating to MFS’ costs and profits with respect to the Fund, the MFS Funds considered as a group, and other investment companies and accounts advised by MFS, as well as MFS’ methodologies used to determine and allocate its costs to the MFS Funds, the Fund and other accounts and products for purposes of estimating profitability.
After reviewing these and other factors described herein, the Trustees concluded, within the context of their overall conclusions regarding the investment advisory agreement, that the advisory fees charged to the Fund represent reasonable compensation in light of the services being provided by MFS to the Fund.
In addition, the Trustees considered MFS’ resources and related efforts to continue to retain, attract and motivate capable personnel to serve the Fund. The Trustees also considered current and developing conditions in the financial services industry, including the presence of large and well-capitalized companies which are spending, and appear to be prepared to continue to spend, substantial sums to engage personnel and to provide services to competing investment companies. In this regard, the Trustees also considered the financial resources of MFS and its ultimate parent, Sun Life Financial Inc. The Trustees also considered the advantages and possible disadvantages to the Fund of having an adviser that also serves other investment companies as well as other accounts.
The Trustees also considered the nature, quality, cost, and extent of administrative, transfer agency, and distribution services provided to the Fund by MFS and its affiliates under agreements and plans other than the investment advisory agreement, including any 12b-1 fees the Fund pays to MFS Fund Distributors, Inc., an affiliate of MFS. The Trustees also considered the nature, extent and quality of certain other services MFS performs or arranges for on the Fund’s behalf, which may include securities lending programs, directed expense payment programs, class action recovery programs, and MFS’ interaction with third-party service providers, principally custodians and sub-custodians. The Trustees concluded that the various non-advisory services provided by MFS and its affiliates on behalf of the Fund were satisfactory.
The Trustees also considered benefits to MFS from the use of the Fund’s portfolio brokerage commissions, if applicable, to pay for investment research and various other factors. Additionally, the Trustees considered so-called “fall-out benefits” to MFS such as reputational value derived from serving as investment manager to the Fund.
Based on their evaluation of factors that they deemed to be material, including those factors described above, the Board of Trustees, including the independent Trustees, concluded that the Fund’s investment advisory agreement with MFS should be continued for an additional one-year period, commencing August 1, 2015.
25
MFS Value Series
PROXY VOTING POLICIES AND INFORMATION
MFS votes proxies on behalf of the fund pursuant to proxy voting policies and procedures that are available without charge, upon request, by calling 1-800-225-2606, by visiting the Proxy Voting section of mfs.com or by visiting the SEC’s Web site at http://www.sec.gov.
Information regarding how the fund voted proxies relating to portfolio securities during the most recent twelve-month period ended June 30 is available without charge by visiting the Proxy Voting section of mfs.com or by visiting the SEC’s Web site at http://www.sec.gov.
QUARTERLY PORTFOLIO DISCLOSURE
The fund will file a complete schedule of portfolio holdings with the Securities and Exchange Commission (the Commission) for the first and third quarters of each fiscal year on Form N-Q. The fund’s Form N-Q is available on the EDGAR database on the Commission’s Internet Web site at http://www.sec.gov, and may be reviewed and copied at the:
Public Reference Room
Securities and Exchange Commission
100 F Street, NE, Room 1580
Washington, D.C. 20549
Information on the operation of the Public Reference Room may be obtained by calling the Commission at 1-800-SEC-0330. Copies of the fund’s Form N-Q also may be obtained, upon payment of a duplicating fee, by electronic request at the following e-mail address: publicinfo@sec.gov or by writing the Public Reference Section at the above address.
FURTHER INFORMATION
From time to time, MFS may post important information about the fund or the MFS funds on the MFS web site (mfs.com). This information is available by visiting the “Market Commentary” and “Announcements” sub sections in the “Market Outlooks” section of mfs.com or by clicking on the fund’s name under “Variable Insurance Portfolios — VIT” in the “Products” section of mfs.com.
FEDERAL TAX INFORMATION (unaudited)
The following information is provided pursuant to provisions of the Internal Revenue Code.
The fund designates $145,412,000 as capital gain dividends paid during the fiscal year.
For corporate shareholders, 89.13% of the ordinary income dividends paid during the fiscal year qualify for the corporate dividends received deduction.
26
rev. 3/11
| | | | |
| FACTS | | WHAT DOES MFS DO WITH YOUR
PERSONAL INFORMATION? | |  |
| | |
| Why? | | Financial companies choose how they share your personal information. Federal law gives consumers the right to limit some but not all sharing. Federal law also requires us to tell you how we collect, share, and protect your personal information. Please read this notice carefully to understand what we do. |
| | |
| What? | | The types of personal information we collect and share depend on the product or service you have with us. This information can include: • Social Security number and account balances • Account transactions and transaction history • Checking account information and wire transfer instructions When you are no longer our customer, we continue to share your information as described in this notice. |
| | |
| How? | | All financial companies need to share customers’ personal information to run their everyday business. In the section below, we list the reasons financial companies can share their customers’ personal information; the reasons MFS chooses to share; and whether you can limit this sharing. |
| | | | |
Reasons we can share your
personal information | | Does MFS share? | | Can you limit this
sharing? |
For our everyday business purposes – such as to process your transactions, maintain your account(s), respond to court orders and legal investigations, or report to credit bureaus | | Yes | | No |
For our marketing purposes – to offer our products and services to you | | No | | We don’t share |
| For joint marketing with other financial companies | | No | | We don’t share |
For our affiliates’ everyday business purposes – information about your transactions and experiences | | No | | We don’t share |
For our affiliates’ everyday business purposes – information about your creditworthiness | | No | | We don’t share |
| For nonaffiliates to market to you | | No | | We don’t share |
| | |
| Questions? | | Call 800-225-2606 or go to mfs.com. |
27
| | |
| Who we are |
| Who is providing this notice? | | MFS Funds, MFS Investment Management, MFS Institutional Advisors, Inc., MFS Fund Distributors, Inc., MFS Heritage Trust Company, and MFS Service Center, Inc. |
| | |
| What we do |
| How does MFS protect my personal information? | | To protect your personal information from unauthorized access and use, we use security measures that comply with federal law. These measures include procedural, electronic, and physical safeguards for the protection of the personal information we collect about you. |
How does MFS
collect my personal information? | | We collect your personal information, for example, when you • open an account or provide account information • direct us to buy securities or direct us to sell your securities • make a wire transfer We also collect your personal information from others, such as credit bureaus, affiliates and other companies. |
| Why can’t I limit all sharing? | | Federal law gives you the right to limit only • sharing for affiliates’ everyday business purposes – information about your creditworthiness • affiliates from using your information to market to you • sharing for nonaffiliates to market to you State laws and individual companies may give you additional rights to limit sharing. |
| | |
| Definitions |
| Affiliates | | Companies related by common ownership or control. They can be financial and nonfinancial companies. • MFS does not share personal information with affiliates, except for everyday business purposes as described on page one of this notice. |
| Nonaffiliates | | Companies not related by common ownership or control. They can be financial and nonfinancial companies. • MFS does not share with nonaffiliates so they can market to you. |
| Joint Marketing | | A formal agreement between nonaffiliated financial companies that together market financial products or services to you. • MFS doesn’t jointly market. |
| | |
| Other important information |
| If you own an MFS product or receive an MFS service in the name of a third party such as a bank or broker-dealer, their privacy policy may apply to you instead of ours. |
28
Each of the following series of the Registrant did not have shareholders as of period end: MFS Core Equity Series, MFS Investors Growth Stock Series, and MFS Research International Series. For further information, please see the introductory footnote.
The Registrant has adopted a Code of Ethics pursuant to Section 406 of the Sarbanes-Oxley Act and as defined in Form N-CSR that applies to the Registrant’s principal executive officer and principal financial and accounting officer. During the period covered by this report, the Registrant has not amended any provision in its Code of Ethics (the “Code”) that relates to an element of the Code’s definition enumerated in paragraph (b) of Item 2 of this Form N-CSR. During the period covered by this report, the Registrant did not grant a waiver, including an implicit waiver, from any provision of the Code.
A copy of the Code of Ethics is filed as an exhibit to this Form N-CSR.
| ITEM 3. | AUDIT COMMITTEE FINANCIAL EXPERT. |
Messrs. Robert E. Butler, John P. Kavanaugh and Robert W. Uek and Mses. Maryanne L. Roepke and Laurie J. Thomsen, members of the Audit Committee, have been determined by the Board of Trustees in their reasonable business judgment to meet the definition of “audit committee financial expert” as such term is defined in Form N-CSR. In addition, Messrs. Butler, Kavanaugh and Uek and Mses. Roepke and Thomsen are “independent” members of the Audit Committee (as such term has been defined by the Securities and Exchange Commission in regulations implementing Section 407 of the Sarbanes-Oxley Act of 2002). The Securities and Exchange Commission has stated that the designation of a person as an audit committee financial expert pursuant to this Item 3 on the Form N-CSR does not impose on such a person any duties, obligations or liability that are greater than the duties, obligations or liability imposed on such person as a member of the Audit Committee and the Board of Trustees in the absence of such designation or identification. Effective January 1, 2016, Mr. Steven E. Buller became a member of the Audit Committee and has been determined by the Board of Trustees in their reasonable business judgment to meet the definition of “audit committee financial expert” as such term is defined in Form N-CSR. In addition, Mr. Buller is an “independent” member of the Audit Committee (as such term has been defined by the Securities and Exchange Commission in regulations implementing Section 407 of the Sarbanes-Oxley Act of 2002). Effective January 1, 2016, Ms. Laurie J. Thomsen is no longer a member of the Audit Committee.
| ITEM 4. | PRINCIPAL ACCOUNTANT FEES AND SERVICES. |
Items 4(a) through 4(d) and 4(g):
The Board of Trustees has appointed Deloitte & Touche LLP (“Deloitte”) to serve as independent accountants to each series of the Registrant (each a “Fund” and collectively the “Funds”). The tables below set forth the audit fees billed to the Funds as well as fees for non-audit services provided to the Funds and/or to the Funds’ investment adviser, Massachusetts Financial Services Company (“MFS”) and to various entities either controlling, controlled by, or under common control with MFS that provide ongoing services to the Funds (“MFS Related Entities”).
For the fiscal years ended December 31, 2015 and 2014, audit fees billed to each Fund by Deloitte were as follows:
| | | | | | | | |
| | | Audit Fees | |
| | | 2015 | | | 2014 | |
Fees billed by Deloitte: | | | | | | | | |
MFS Core Equity Series+ | | | 0 | | | | 44,083 | |
MFS Global Equity Series | | | 44,069 | | | | 43,306 | |
MFS Growth Series | | | 44,860 | | | | 44,083 | |
MFS Investors Growth Stock Series+ | | | 0 | | | | 43,306 | |
MFS Investors Trust Series | | | 44,069 | | | | 43,306 | |
MFS Mid Cap Growth Series | | | 44,069 | | | | 43,306 | |
MFS New Discovery Series | | | 44,069 | | | | 43,306 | |
MFS Research International Series+ | | | 0 | | | | 43,297 | |
MFS Research Series | | | 44,960 | | | | 44,083 | |
MFS Total Return Bond Series | | | 63,126 | | | | 61,946 | |
MFS Total Return Series | | | 62,179 | | | | 61,113 | |
MFS Utilities Series | | | 44,169 | | | | 43,306 | |
MFS Value Series | | | 44,860 | | | | 44,083 | |
| | | | | | | | |
Total | | | 480,430 | | | | 602,524 | |
For the fiscal years ended December 31, 2015 and 2014, fees billed by Deloitte for audit-related, tax and other services provided to each Fund and for audit-related, tax and other services provided to MFS and MFS Related Entities were as follows:
| | | | | | | | | | | | | | | | | | | | | | | | |
| | | Audit-Related Fees1 | | | Tax Fees2 | | | All Other Fees3 | |
| | | 2015 | | | 2014 | | | 2015 | | | 2014 | | | 2015 | | | 2014 | |
Fees billed by Deloitte: | | | | | | | | | | | | | | | | | | | | | | | | |
To MFS Core Equity Series+ | | | 0 | | | | 4,900 | | | | 7,743 | | | | 5,057 | | | | 13 | | | | 1,005 | |
To MFS Growth Series | | | 2,400 | | | | 2,400 | | | | 5,143 | | | | 5,057 | | | | 294 | | | | 1,119 | |
To MFS Global Equity Series | | | 2,400 | | | | 2,400 | | | | 5,143 | | | | 5,057 | | | | 12 | | | | 1,005 | |
To MFS Investors Growth Stock Series+ | | | 0 | | | | 4,900 | | | | 7,743 | | | | 5,057 | | | | 76 | | | | 1,033 | |
To MFS Investors Trust Series | | | 2,400 | | | | 2,400 | | | | 5,143 | | | | 5,057 | | | | 119 | | | | 1,054 | |
To MFS Mid Cap Growth Series | | | 2,400 | | | | 2,400 | | | | 5,143 | | | | 5,057 | | | | 90 | | | | 1,039 | |
To MFS New Discovery Series | | | 2,400 | | | | 4,900 | | | | 5,143 | | | | 5,057 | | | | 169 | | | | 1,076 | |
To MFS Research International Series+ | | | 0 | | | | 4,900 | | | | 7,743 | | | | 5,057 | | | | 27 | | | | 1,012 | |
| | | | | | | | | | | | | | | | | | | | | | | | |
To MFS Research Series | | | 2,400 | | | | 2,400 | | | | 5,143 | | | | 5,057 | | | | 144 | | | | 1,063 | |
To MFS Total Return Bond Series | | | 2,400 | | | | 2,400 | | | | 5,143 | | | | 5,057 | | | | 583 | | | | 1,237 | |
To MFS Total Return Series | | | 2,400 | | | | 2,400 | | | | 5,143 | | | | 5,057 | | | | 598 | | | | 1,234 | |
To MFS Utilities Series | | | 2,400 | | | | 4,900 | | | | 5,143 | | | | 5,057 | | | | 342 | | | | 1,139 | |
To MFS Value Series | | | 2,400 | | | | 4,900 | | | | 5,143 | | | | 5,057 | | | | 472 | | | | 1,204 | |
Total fees billed by Deloitte To above Funds: | | | 24,000 | | | | 46,200 | | | | 74,659 | | | | 65,471 | | | | 2,939 | | | | 14,220 | |
| | | |
| | | Audit-Related Fees1 | | | Tax Fees2 | | | All Other Fees3 | |
| | | 2015 | | | 2014 | | | 2015 | | | 2014 | | | 2015 | | | 2014 | |
Fees billed by Deloitte: | | | | | | | | | | | | | | | | | | | | | | | | |
To MFS and MFS Related Entities of MFS Core Equity Series*+ | | | 186,019 | | | | 1,686,271 | | | | 0 | | | | 0 | | | | 5,000 | | | | 0 | |
To MFS and MFS Related Entities of MFS Growth Series* | | | 186,019 | | | | 1,686,271 | | | | 0 | | | | 0 | | | | 5,000 | | | | 0 | |
To MFS and MFS Related Entities of MFS Global Equity Series* | | | 186,019 | | | | 1,686,271 | | | | 0 | | | | 0 | | | | 5,000 | | | | 0 | |
To MFS and MFS Related Entities of MFS Investors Growth Stock Series*+ | | | 186,019 | | | | 1,686,271 | | | | 0 | | | | 0 | | | | 5,000 | | | | 0 | |
To MFS and MFS Related Entities of MFS Investors Trust Series* | | | 186,019 | | | | 1,686,271 | | | | 0 | | | | 0 | | | | 5,000 | | | | 0 | |
To MFS and MFS Related Entities of MFS Mid Cap Growth Series* | | | 186,019 | | | | 1,686,271 | | | | 0 | | | | 0 | | | | 5,000 | | | | 0 | |
To MFS and MFS Related Entities of MFS New Discovery Series* | | | 186,019 | | | | 1,686,271 | | | | 0 | | | | 0 | | | | 5,000 | | | | 0 | |
To MFS and MFS Related Entities of MFS Research International Series*+ | | | 186,019 | | | | 1,686,271 | | | | 0 | | | | 0 | | | | 5,000 | | | | 0 | |
To MFS and MFS Related Entities of MFS Research Series* | | | 186,019 | | | | 1,686,271 | | | | 0 | | | | 0 | | | | 5,000 | | | | 0 | |
To MFS and MFS Related Entities of MFS Total Return Bond Series* | | | 186,019 | | | | 1,686,271 | | | | 0 | | | | 0 | | | | 5,000 | | | | 0 | |
To MFS and MFS Related Entities of MFS Total Return Series* | | | 186,019 | | | | 1,686,271 | | | | 0 | | | | 0 | | | | 5,000 | | | | 0 | |
To MFS and MFS Related Entities of MFS Utilities Series* | | | 186,019 | | | | 1,686,271 | | | | 0 | | | | 0 | | | | 5,000 | | | | 0 | |
To MFS and MFS Related Entities of MFS Value Series* | | | 186,019 | | | | 1,686,271 | | | | 0 | | | | 0 | | | | 5,000 | | | | 0 | |
| | | | | | | | |
| | | Aggregate fees for non-audit
services: | |
| | | 2015 | | | 2014 | |
Fees billed by Deloitte: | | | | | | | | |
To MFS Core Equity Series, MFS and MFS Related Entities#+ | | | 198,775 | | | | 1,700,571 | |
To MFS Growth Series, MFS and MFS Related Entities# | | | 198,856 | | | | 1,698,185 | |
To MFS Global Equity Series, MFS and MFS Related Entities# | | | 198,574 | | | | 1,698,071 | |
To MFS Investors Growth Stock Series, MFS and MFS Related Entities#+ | | | 198,838 | | | | 1,700,599 | |
To MFS Investors Trust Series, MFS and MFS Related Entities# | | | 198,681 | | | | 1,698,120 | |
To MFS Mid Cap Growth Series, MFS and MFS Related Entities# | | | 198,652 | | | | 1,698,105 | |
To MFS New Discovery Series, MFS and MFS Related Entities# | | | 198,731 | | | | 1,700,642 | |
To MFS Research International Series, MFS and MFS Related Entities#+ | | | 198,789 | | | | 1,700,578 | |
To MFS Research Series, MFS and MFS Related Entities# | | | 198,706 | | | | 1,698,129 | |
To MFS Total Return Bond Series, MFS and MFS Related Entities# | | | 199,145 | | | | 1,698,303 | |
To MFS Total Return Series, MFS and MFS Related Entities# | | | 199,160 | | | | 1,698,300 | |
To MFS Utilities Series, MFS and MFS Related Entities# | | | 198,904 | | | | 1,700,705 | |
To MFS Value Series, MFS and MFS Related Entities# | | | 199,034 | | | | 1,700,770 | |
| + | The MFS Core Equity Series, MFS Investors Growth Stock Series, and MFS Research International Series were reorganized into the MFS Core Equity Portfolio, MFS Massachusetts Investors Growth Stock Portfolio, and MFS Research International Portfolio, respectively, all are a series of the MFS Variable Insurance Trust II, as of March 27, 2015. |
| * | This amount reflects the fees billed to MFS and MFS Related Entities for non-audit services relating directly to the operations and financial reporting of the Funds (portions of which services also related to the operations and financial reporting of other funds within the MFS Funds complex). |
| # | This amount reflects the aggregate fees billed by Deloitte for non-audit services rendered to the Funds and for non-audit services rendered to MFS and the MFS Related Entities. |
| 1 | The fees included under “Audit-Related Fees” are fees related to assurance and related services that are reasonably related to the performance of the audit or review of financial statements, but not reported under ‘‘Audit Fees,’’ including accounting consultations, agreed-upon procedure reports, attestation reports, comfort letters and internal control reviews. |
| 2 | The fees included under “Tax Fees” are fees associated with tax compliance, tax advice and tax planning, including services relating to the filing or amendment of federal, state or local income tax returns, regulated investment company qualification reviews and tax distribution and analysis. |
| 3 | The fees included under “All Other Fees” are fees for products and services provided by Deloitte other than those reported under “Audit Fees,” “Audit-Related Fees” and “Tax Fees,” including fees for services related to review of internal controls and review of Rule 38a-1 compliance program. |
Item 4(e)(1):
Set forth below are the policies and procedures established by the Audit Committee of the Board of Trustees relating to the pre-approval of audit and non-audit related services:
To the extent required by applicable law, pre-approval by the Audit Committee of the Board is needed for all audit and permissible non-audit services rendered to the Funds and all permissible non-audit services rendered to MFS or MFS Related Entities if the services relate directly to the operations and financial reporting of the Registrant. Pre-approval is currently on an engagement-by-engagement basis. In the event pre-approval of such services is necessary between regular meetings of the Audit Committee and it is not practical to wait to seek pre-approval at the next regular meeting of the Audit Committee, pre-approval of such services may be referred to the Chair of the Audit Committee for approval; provided that the Chair may not pre-approve any individual engagement for such services exceeding $50,000 or multiple engagements for such services in the aggregate exceeding $100,000 in each period between regular meetings of the Audit Committee. Any engagement pre-approved by the Chair between regular meetings of the Audit Committee shall be presented for ratification by the entire Audit Committee at its next regularly scheduled meeting.
Item 4(e)(2):
None, or 0%, of the services relating to the Audit-Related Fees, Tax Fees and All Other Fees paid by the Fund and MFS and MFS Related Entities relating directly to the operations and financial reporting of the Registrant disclosed above were approved by the audit committee pursuant to paragraphs (c)(7)(i)(C) of Rule 2-01 of Regulation S-X (which permits audit committee approval after the start of the engagement with respect to services other than audit, review or attest services, if certain conditions are satisfied).
Item 4(f): Not applicable.
Item 4(h): The Registrant’s Audit Committee has considered whether the provision by a Registrant’s independent registered public accounting firm of non-audit services to MFS and MFS Related Entities that were not pre-approved by the Committee (because such services did not relate directly to the operations and financial reporting of the Registrant) was compatible with maintaining the independence of the independent registered public accounting firm as the Registrant’s principal auditors.
| ITEM 5. | AUDIT COMMITTEE OF LISTED REGISTRANTS. |
Not applicable to the Registrant.
A schedule of investments of the Registrant is included as part of the report to shareholders of such series under Item 1 of this Form N-CSR.
| ITEM 7. | DISCLOSURE OF PROXY VOTING POLICIES AND PROCEDURES FOR CLOSED-END MANAGEMENT INVESTMENT COMPANIES. |
Not applicable to the Registrant.
| ITEM 8. | PORTFOLIO MANAGERS OF CLOSED-END MANAGEMENT INVESTMENT COMPANIES. |
Not applicable to the Registrant.
| ITEM 9. | PURCHASES OF EQUITY SECURITIES BY CLOSED-END MANAGEMENT INVESTMENT COMPANY AND AFFILIATED PURCHASERS. |
Not applicable to the Registrant.
| ITEM 10. | SUBMISSION OF MATTERS TO A VOTE OF SECURITY HOLDERS. |
There were no material changes to the procedures by which shareholders may send recommendations to the Board for nominees to the Registrant’s Board since the Registrant last provided disclosure as to such procedures in response to the requirements of Item 407 (c)(2)(iv) of Regulation S-K or this Item.
| ITEM 11. | CONTROLS AND PROCEDURES. |
| (a) | Based upon their evaluation of the effectiveness of the registrant’s disclosure controls and procedures (as defined in Rule 30a-3(c) under the Investment Company Act of 1940 (the “Act”)) as conducted within 90 days of the filing date of this report on Form N-CSR, the registrant’s principal financial officer and principal executive officer have concluded that those disclosure controls and procedures provide reasonable assurance that the material information required to be disclosed by the registrant on this report is recorded, processed, summarized and reported within the time periods specified in the Securities and Exchange Commission’s rules and forms. |
| (b) | There were no changes in the registrant’s internal controls over financial reporting (as defined in Rule 30a-3(d) under the Act) that occurred during the second fiscal quarter of the period covered by the report that have materially affected, or are reasonably likely to materially affect, the registrant’s internal control over financial reporting. |
| (a) | File the exhibits listed below as part of this form. Letter or number the exhibits in the sequence indicated. |
| | (1) | Any code of ethics, or amendment thereto, that is the subject of the disclosure required by Item 2, to the extent that the registrant intends to satisfy the Item 2 requirements through filing of an exhibit: Code of Ethics attached hereto. |
| | (2) | A separate certification for each principal executive officer and principal financial officer of the registrant as required by Rule 30a-2(a) under the Act (17 CFR 270.30a-2): Attached hereto. |
| (b) | If the report is filed under Section 13(a) or 15(d) of the Exchange Act, provide the certifications required by Rule 30a-2(b) under the Act (17 CFR 270.30a-2(b)), Rule 13a-14(b) or Rule 15d-14(b) under the Exchange Act (17 CFR 240.13a-14(b) or 240.15d-14(b)) and Section 1350 of Chapter 63 of Title 18 of the United States Code (18 U.S.C. 1350) as an exhibit. A certification furnished pursuant to this paragraph will not be deemed “filed” for the purposes of Section 18 of the Exchange Act (15 U.S.C. 78r), or otherwise subject to the liability of that section. Such certification will not be deemed to be incorporated by reference into any filing under the Securities Act of 1933 or the Exchange Act, except to the extent that the registrant specifically incorporates it by reference: Attached hereto. |
Notice
A copy of the Amended and Restated Declaration of Trust, as amended, of the Registrant is on file with the Secretary of State of The Commonwealth of Massachusetts and notice is hereby given that this instrument is executed on behalf of the Registrant by an officer of the Registrant as an officer and not individually and the obligations of or arising out of this instrument are not binding upon any of the Trustees or shareholders individually, but are binding only upon the assets and property of the respective constituent series of the Registrant.
SIGNATURES
Pursuant to the requirements of the Securities Exchange Act of 1934 and the Investment Company Act of 1940, the registrant has duly caused this report to be signed on its behalf by the undersigned, thereunto duly authorized.
(Registrant) MFS VARIABLE INSURANCE TRUST
| | |
| By (Signature and Title)* | | ROBIN A. STELMACH |
| | Robin A. Stelmach, President |
Date: February 16, 2016
Pursuant to the requirements of the Securities Exchange Act of 1934 and the Investment Company Act of 1940, this report has been signed below by the following persons on behalf of the registrant and in the capacities and on the dates indicated.
| | |
| By (Signature and Title)* | | ROBIN A. STELMACH |
| | Robin A. Stelmach, President (Principal Executive Officer) |
Date: February 16, 2016
| | |
| By (Signature and Title)* | | DAVID L. DILORENZO |
| | David L. DiLorenzo, Treasurer (Principal Financial Officer and Accounting Officer) |
Date: February 16, 2016
| * | Print name and title of each signing officer under his or her signature. |