UNITED STATES
SECURITIES AND EXCHANGE COMMISSION
Washington, D.C. 20549
FORM N-CSR
CERTIFIED SHAREHOLDER REPORT OF
REGISTERED MANAGEMENT INVESTMENT COMPANIES
Investment Company Act file number 811-8326
MFS VARIABLE INSURANCE TRUST
(Exact name of registrant as specified in charter)
111 Huntington Avenue, Boston, Massachusetts 02199
(Address of principal executive offices) (Zip code)
Christopher R. Bohane
Massachusetts Financial Services Company
111 Huntington Avenue
Boston, Massachusetts 02199
(Name and address of agents for service)
Registrant’s telephone number, including area code: (617) 954-5000
Date of fiscal year end: December 31
Date of reporting period: June 30, 2021
| ITEM 1. | REPORTS TO STOCKHOLDERS. |
Item 1(a):
Semiannual Report
June 30, 2021
MFS® Global Equity Series
MFS® Variable Insurance Trust
MFS® Global Equity Series
The report is prepared for the general information of contract owners. It is authorized for distribution to prospective investors only when preceded or accompanied by a current prospectus.
NOT FDIC INSURED • MAY LOSE VALUE • NO BANK OR CREDIT UNION GUARANTEE •
NOT A DEPOSIT • NOT INSURED BY ANY FEDERAL GOVERNMENT AGENCY OR NCUA/NCUSIF
Dear Contract Owners:
After experiencing dramatic swings in the early days of the coronavirus pandemic, global equity markets have performed strongly over the past year. Though the speedy development of vaccines brightened the economic and market outlook, uncertainty remains as new variants of the virus appear, and questions persist over how fast vaccines can be made widely available in the developing world.
Global central banks have taken aggressive steps to cushion the economic and market fallout related to the virus, and governments are deploying unprecedented levels of fiscal support. Having passed a $1.9 trillion stimulus package in March, the U.S. Congress could approve additional stimulus later this year, some of it focused on infrastructure. Along with extraordinary government expenditures, pent-up consumer demand fueled a surge in economic activity as coronavirus restrictions were eased, pushing up inflation, at least temporarily. Markets initially reacted by pushing up yields on global government bonds, though some of the rate rise has since been corrected.
A spirited debate is underway among investors over whether the current price pressures will persist or prove to be temporary, caused by pandemic-induced bottlenecks. The policy measures put in place to counteract the pandemic's effects have helped build a supportive environment and are encouraging economic recovery; however, if markets disconnect from fundamentals, they can sow the seeds of instability. As such, recent dramatic increases in speculative trading in cryptocurrencies, special purpose acquisition companies (SPACs), and the like bear watching.
In the aftermath of the crisis, we could see societal changes as households, businesses, and governments adjust to a new reality, and any such alterations could affect the investment landscape. For investors, events such as the COVID-19 outbreak demonstrate the importance of having a deep understanding of company fundamentals, and we have built our global research platform to do just that.
At MFS®, we put our clients’ assets to work responsibly by carefully navigating the increasing complexity of global markets and economies. Guided by our long-term philosophy and adhering to our commitment to sustainable investing, we tune out the noise and aim to uncover what we believe are the best, most durable investment opportunities in the market. Our unique global investment platform combines collective expertise, long-term discipline, and thoughtful risk management to create sustainable value for investors.
Respectfully,
Michael W. Roberge
Chief Executive Officer
MFS Investment Management
August 13, 2021
The opinions expressed in this letter are subject to change and may not be relied upon for investment advice. No forecasts can be guaranteed.
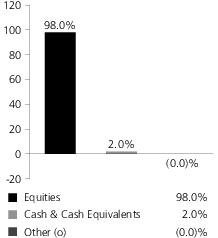
Portfolio structure
Top ten holdings
| Comcast Corp., “A” | 3.3% |
| Thermo Fisher Scientific, Inc. | 3.2% |
| Visa, Inc., “A” | 3.0% |
| Medtronic PLC | 2.8% |
| Schneider Electric SE | 2.7% |
| Roche Holding AG | 2.5% |
| LVMH Moet Hennessy Louis Vuitton SE | 2.4% |
| Accenture PLC, “A” | 2.4% |
| Nestle S.A. | 2.4% |
| Diageo PLC | 2.3% |
GICS equity sectors (g)
| Health Care | 19.4% |
| Industrials | 19.3% |
| Information Technology | 15.0% |
| Consumer Staples | 14.1% |
| Financials | 8.7% |
| Consumer Discretionary | 8.3% |
| Communication Services | 7.2% |
| Materials | 6.0% |
| Equity Warrants (o) | 0.0% |
Issuer country weightings (x)
| United States | 57.1% |
| France | 11.2% |
| Switzerland | 8.1% |
| United Kingdom | 6.7% |
| Germany | 3.8% |
| Netherlands | 3.1% |
| Canada | 2.6% |
| Japan | 2.0% |
| Sweden | 1.6% |
| Other Countries | 3.8% |
Currency exposure weightings (y)
| United States Dollar | 58.9% |
| Euro | 20.9% |
| Swiss Franc | 8.1% |
| British Pound Sterling | 6.7% |
| Japanese Yen | 2.0% |
| Swedish Krona | 1.6% |
| South Korean Won | 1.0% |
| Danish Krone | 0.6% |
| Mexican Peso | 0.2% |
| (g) | The Global Industry Classification Standard (GICS®) was developed by and/or is the exclusive property of MSCI, Inc. and S&P Global Market Intelligence Inc. (“S&P Global Market Intelligence”). GICS is a service mark of MSCI and S&P Global Market Intelligence and has been licensed for use by MFS. MFS has applied its own internal sector/industry classification methodology for equity securities and non-equity securities that are unclassified by GICS. |
| (x) | Represents the portfolio’s exposure to issuer countries as a percentage of a portfolio’s net assets. For purposes of this presentation, United States includes Cash & Cash Equivalents and Other. |
| (y) | Represents the portfolio’s exposure to a particular currency as a percentage of a portfolio's net assets. For purposes of this presentation, United States Dollar includes Cash & Cash Equivalents. |
Cash & Cash Equivalents includes any cash, investments in money market funds, short-term securities, and other assets less liabilities. Please see the Statement of Assets and Liabilities for additional information related to the fund’s cash position and other assets and liabilities.
Other includes equivalent exposure from currency derivatives and/or any offsets to derivative positions and may be negative.
Percentages are based on net assets as of June 30, 2021.
The portfolio is actively managed and current holdings may be different.
Expense Table
Fund Expenses Borne by the Contract Holders during the Period,
January 1, 2021 through June 30, 2021
As a contract holder of the fund, you incur ongoing costs, including management fees; distribution and/or service (12b-1) fees; and other fund expenses. This example is intended to help you understand your ongoing costs (in dollars) of investing in the fund and to compare these costs with the ongoing costs of investing in other mutual funds.
The example is based on an investment of $1,000 invested at the beginning of the period and held for the entire period January 1, 2021 through June 30, 2021.
Actual Expenses
The first line for each share class in the following table provides information about actual account values and actual expenses. You may use the information in this line, together with the amount you invested, to estimate the expenses that you paid over the period. Simply divide your account value by $1,000 (for example, an $8,600 account value divided by $1,000 = 8.6), then multiply the result by the number in the first line under the heading entitled “Expenses Paid During Period” to estimate the expenses you paid on your account during this period.
Hypothetical Example for Comparison Purposes
The second line for each share class in the following table provides information about hypothetical account values and hypothetical expenses based on the fund’s actual expense ratio and an assumed rate of return of 5% per year before expenses, which is not the fund’s actual return. The hypothetical account values and expenses may not be used to estimate the actual ending account balance or expenses you paid for the period. You may use this information to compare the ongoing costs of investing in the fund and other funds. To do so, compare this 5% hypothetical example with the 5% hypothetical examples that appear in the shareholder reports of the other funds.
Please note that the expenses shown in the table are meant to highlight the fund's ongoing costs only and do not take into account the fees and expenses imposed under the variable contracts through which your investment in the fund is made. Therefore, the second line for each share class in the table is useful in comparing ongoing costs associated with an investment in vehicles (such as the fund) which fund benefits under variable annuity and variable life insurance contracts and to qualified pension and retirement plans only, and will not help you determine the relative total costs of investing in the fund through variable annuity and variable life insurance contracts. If the fees and expenses imposed under the variable contracts were included, your costs would have been higher.
Share
Class | | Annualized
Expense
Ratio | Beginning
Account Value
1/01/21 | Ending
Account Value
6/30/21 | Expenses
Paid During
Period (p)
1/01/21-6/30/21 |
| Initial Class | Actual | 0.92% | $1,000.00 | $1,118.03 | $4.83 |
| Hypothetical (h) | 0.92% | $1,000.00 | $1,020.23 | $4.61 |
| Service Class | Actual | 1.17% | $1,000.00 | $1,116.54 | $6.14 |
| Hypothetical (h) | 1.17% | $1,000.00 | $1,018.99 | $5.86 |
| (h) | 5% class return per year before expenses. |
| (p) | “Expenses Paid During Period” are equal to each class's annualized expense ratio, as shown above, multiplied by the average account value over the period, multiplied by 181/365 (to reflect the one-half year period). |
Portfolio of Investments − 6/30/21 (unaudited)
The Portfolio of Investments is a complete list of all securities owned by your fund. It is categorized by broad-based asset classes.
| Issuer | | | Shares/Par | Value ($) |
| Common Stocks – 98.0% |
| Aerospace & Defense – 3.1% | |
| Honeywell International, Inc. | | 6,435 | $ 1,411,518 |
| MTU Aero Engines Holding AG | | 1,243 | 307,895 |
| Rolls-Royce Holdings PLC (a) | | 235,395 | 322,105 |
| | | | | $2,041,518 |
| Airlines – 0.8% | |
| Aena S.A. (a) | | 3,325 | $ 545,264 |
| Alcoholic Beverages – 6.0% | |
| Carlsberg A.S., “B” | | 1,984 | $ 369,830 |
| Diageo PLC | | 31,459 | 1,506,132 |
| Heineken N.V. | | 8,843 | 1,071,627 |
| Pernod Ricard S.A. | | 4,411 | 979,120 |
| | | | | $3,926,709 |
| Apparel Manufacturers – 4.3% | |
| Burberry Group PLC | | 14,292 | $ 408,451 |
| Compagnie Financiere Richemont S.A. | | 6,795 | 822,156 |
| LVMH Moet Hennessy Louis Vuitton SE | | 2,012 | 1,577,683 |
| | | | | $2,808,290 |
| Automotive – 0.5% | |
| Aptiv PLC (a) | | 2,224 | $ 349,902 |
| Broadcasting – 2.8% | |
| Omnicom Group, Inc. | | 2,020 | $ 161,580 |
| Walt Disney Co. (a) | | 6,722 | 1,181,526 |
| WPP Group PLC | | 35,773 | 482,081 |
| | | | | $1,825,187 |
| Brokerage & Asset Managers – 1.9% | |
| Charles Schwab Corp. | | 12,769 | $ 929,711 |
| Deutsche Boerse AG | | 1,751 | 305,624 |
| | | | | $1,235,335 |
| Business Services – 10.0% | |
| Accenture PLC, “A” | | 5,328 | $ 1,570,641 |
| Adecco S.A. | | 3,914 | 265,911 |
| Brenntag AG | | 3,648 | 339,215 |
| Cognizant Technology Solutions Corp., “A” | | 7,877 | 545,561 |
| Compass Group PLC (a) | | 20,193 | 425,140 |
| Equifax, Inc. | | 3,356 | 803,795 |
| Fidelity National Information Services, Inc. | | 6,127 | 868,012 |
| Fiserv, Inc. (a) | | 7,558 | 807,875 |
| PayPal Holdings, Inc. (a) | | 2,910 | 848,207 |
| | | | | $6,474,357 |
| Cable TV – 4.4% | |
| Comcast Corp., “A” | | 37,850 | $ 2,158,207 |
| Liberty Broadband Corp. (a) | | 4,041 | 701,760 |
| | | | | $2,859,967 |
| Chemicals – 2.6% | |
| 3M Co. | | 4,725 | $ 938,527 |
| PPG Industries, Inc. | | 4,374 | 742,574 |
| | | | | $1,681,101 |
| Issuer | | | Shares/Par | Value ($) |
| Common Stocks – continued |
| Computer Software – 2.5% | |
| Check Point Software Technologies Ltd. (a) | | 5,249 | $ 609,566 |
| Oracle Corp. | | 12,707 | 989,113 |
| | | | | $1,598,679 |
| Computer Software - Systems – 1.4% | |
| Cisco Systems, Inc. | | 4,811 | $ 254,983 |
| Samsung Electronics Co. Ltd. | | 8,782 | 629,319 |
| | | | | $884,302 |
| Construction – 0.5% | |
| Otis Worldwide Corp. | | 4,159 | $ 340,081 |
| Consumer Products – 4.5% | |
| Colgate-Palmolive Co. | | 6,953 | $ 565,626 |
| Essity AB | | 32,671 | 1,083,421 |
| International Flavors & Fragrances, Inc. | | 2,257 | 337,196 |
| Reckitt Benckiser Group PLC | | 10,816 | 957,105 |
| | | | | $2,943,348 |
| Electrical Equipment – 4.4% | |
| Amphenol Corp., “A” | | 5,228 | $ 357,647 |
| Legrand S.A. | | 7,017 | 742,680 |
| Schneider Electric SE | | 11,363 | 1,787,688 |
| | | | | $2,888,015 |
| Electronics – 1.1% | |
| Hoya Corp. | | 2,800 | $ 371,250 |
| Microchip Technology, Inc. | | 2,138 | 320,144 |
| | | | | $691,394 |
| Food & Beverages – 4.1% | |
| Danone S.A. | | 16,045 | $ 1,129,535 |
| Nestle S.A. | | 12,425 | 1,547,267 |
| | | | | $2,676,802 |
| Gaming & Lodging – 1.0% | |
| Marriott International, Inc., “A” (a) | | 2,507 | $ 342,255 |
| Whitbread PLC (a) | | 6,804 | 293,842 |
| | | | | $636,097 |
| Insurance – 1.6% | |
| Aon PLC | | 2,907 | $ 694,075 |
| Willis Towers Watson PLC | | 1,473 | 338,820 |
| | | | | $1,032,895 |
| Internet – 1.1% | |
| eBay, Inc. | | 9,827 | $ 689,954 |
| Machinery & Tools – 1.3% | |
| Carrier Global Corp. | | 3,437 | $ 167,038 |
| Kubota Corp. (l) | | 34,900 | 705,885 |
| | | | | $872,923 |
| Major Banks – 3.3% | |
| Bank of New York Mellon Corp. | | 3,303 | $ 169,213 |
| Erste Group Bank AG | | 4,930 | 180,867 |
| Goldman Sachs Group, Inc. | | 2,858 | 1,084,697 |
Portfolio of Investments (unaudited) – continued
| Issuer | | | Shares/Par | Value ($) |
| Common Stocks – continued |
| Major Banks – continued | |
| State Street Corp. | | 2,798 | $ 230,219 |
| UBS Group AG | | 33,062 | 505,980 |
| | | | | $2,170,976 |
| Medical Equipment – 14.4% | |
| Abbott Laboratories | | 7,863 | $ 911,557 |
| Boston Scientific Corp. (a) | | 20,280 | 867,173 |
| Cooper Cos., Inc. | | 1,559 | 617,785 |
| EssilorLuxottica | | 1,382 | 255,048 |
| Medtronic PLC | | 14,792 | 1,836,131 |
| Olympus Corp. | | 11,600 | 230,549 |
| Sonova Holding AG | | 577 | 217,018 |
| Stryker Corp. | | 4,290 | 1,114,242 |
| Thermo Fisher Scientific, Inc. | | 4,141 | 2,089,010 |
| Waters Corp. (a) | | 1,862 | 643,526 |
| Zimmer Biomet Holdings, Inc. | | 3,757 | 604,201 |
| | | | | $9,386,240 |
| Other Banks & Diversified Financials – 4.9% | |
| American Express Co. | | 5,019 | $ 829,289 |
| Grupo Financiero Banorte S.A. de C.V. | | 21,231 | 137,138 |
| Julius Baer Group Ltd. | | 4,243 | 276,890 |
| Visa, Inc., “A” | | 8,254 | 1,929,950 |
| | | | | $3,173,267 |
| Pharmaceuticals – 4.8% | |
| Bayer AG | | 11,407 | $ 692,659 |
| Merck KGaA | | 4,214 | 807,975 |
| Roche Holding AG | | 4,290 | 1,616,081 |
| | | | | $3,116,715 |
| Printing & Publishing – 0.2% | |
| Wolters Kluwer N.V. | | 960 | $ 96,439 |
| Railroad & Shipping – 4.7% | |
| Canadian National Railway Co. | | 10,295 | $ 1,086,328 |
| Canadian Pacific Railway Ltd. | | 7,453 | 573,210 |
| Kansas City Southern Co. | | 3,025 | 857,194 |
| Union Pacific Corp. | | 2,450 | 538,829 |
| | | | | ��� $3,055,561 |
| Issuer | | | Shares/Par | Value ($) |
| Common Stocks – continued |
| Specialty Chemicals – 4.4% | |
| Akzo Nobel N.V. | | 6,714 | $ 829,549 |
| L'Air Liquide S.A. | | 3,389 | 593,373 |
| Linde PLC | | 1,032 | 298,351 |
| Linde PLC | | 3,896 | 1,124,200 |
| | | | | $2,845,473 |
| Specialty Stores – 0.3% | |
| Hermes International | | 146 | $ 212,677 |
| Trucking – 1.1% | |
| United Parcel Service, Inc., “B” | | 3,431 | $ 713,545 |
| Total Common Stocks (Identified Cost, $27,604,716) | | $63,773,013 |
| | Strike
Price | First
Exercise | | |
| Warrants – 0.0% | | | | |
| Apparel Manufacturers – 0.0% | | | | |
| Compagnie Financiere Richemont S.A. (1 share for 2 warrants, Expiration 12/04/23) (a) (Identified Cost, $0) | CHF 67.00 | 11/20/23 | 14,904 | $ 9,987 |
| | | | | |
| Investment Companies (h) – 1.8% |
| Money Market Funds – 1.8% | |
| MFS Institutional Money Market Portfolio, 0.02% (v) (Identified Cost, $1,147,768) | | | 1,147,768 | $ 1,147,768 |
| Other Assets, Less Liabilities – 0.2% | | 134,772 |
| Net Assets – 100.0% | $65,065,540 |
| (a) | Non-income producing security. | | | |
| (h) | An affiliated issuer, which may be considered one in which the fund owns 5% or more of the outstanding voting securities, or a company which is under common control. At period end, the aggregate values of the fund's investments in affiliated issuers and in unaffiliated issuers were $1,147,768 and $63,783,000, respectively. | | | |
| (l) | A portion of this security is on loan. See Note 2 for additional information. | | | |
| (v) | Affiliated issuer that is available only to investment companies managed by MFS. The rate quoted for the MFS Institutional Money Market Portfolio is the annualized seven-day yield of the fund at period end. | | | |
| Abbreviations indicate amounts shown in currencies other than the U.S. dollar. All amounts are stated in U.S. dollars unless otherwise indicated. A list of abbreviations is shown below: |
| CHF | Swiss Franc |
See Notes to Financial Statements
| Financial Statements | Statement of Assets and Liabilities (unaudited) |
This statement represents your fund’s balance sheet, which details the assets and liabilities comprising the total value of the fund.
| At 6/30/21Assets | |
| Investments in unaffiliated issuers, at value, including $194,992 of securities on loan (identified cost, $27,604,716) | $63,783,000 |
| Investments in affiliated issuers, at value (identified cost, $1,147,768) | 1,147,768 |
| Receivables for | |
| Fund shares sold | 31,423 |
| Interest and dividends | 159,827 |
| Receivable from investment adviser | 8,794 |
| Other assets | 462 |
| Total assets | $65,131,274 |
| Liabilities | |
| Payable to custodian | $2,260 |
| Payables for | |
| Fund shares reacquired | 11,993 |
| Payable to affiliates | |
| Administrative services fee | 107 |
| Shareholder servicing costs | 100 |
| Distribution and/or service fees | 202 |
| Accrued expenses and other liabilities | 51,072 |
| Total liabilities | $65,734 |
| Net assets | $65,065,540 |
| Net assets consist of | |
| Paid-in capital | $21,596,772 |
| Total distributable earnings (loss) | 43,468,768 |
| Net assets | $65,065,540 |
| Shares of beneficial interest outstanding | 2,373,506 |
| | Net assets | Shares
outstanding | Net asset value
per share |
| Initial Class | $50,340,970 | 1,832,308 | $27.47 |
| Service Class | 14,724,570 | 541,198 | 27.21 |
See Notes to Financial Statements
| Financial Statements | Statement of Operations (unaudited) |
This statement describes how much your fund earned in investment income and accrued in expenses. It also describes any gains and/or losses generated by fund operations.
| Six months ended 6/30/21 | |
| Net investment income (loss) | |
| Income | |
| Dividends | $610,989 |
| Income on securities loaned | 603 |
| Dividends from affiliated issuers | 131 |
| Other | 17 |
| Foreign taxes withheld | (53,199) |
| Total investment income | $558,541 |
| Expenses | |
| Management fee | $277,549 |
| Distribution and/or service fees | 17,528 |
| Shareholder servicing costs | 5,134 |
| Administrative services fee | 9,454 |
| Independent Trustees' compensation | 1,555 |
| Custodian fee | 9,877 |
| Shareholder communications | 5,026 |
| Audit and tax fees | 29,671 |
| Legal fees | 239 |
| Miscellaneous | 11,453 |
| Total expenses | $367,486 |
| Reduction of expenses by investment adviser | (65,808) |
| Net expenses | $301,678 |
| Net investment income (loss) | $256,863 |
| Realized and unrealized gain (loss) | |
| Realized gain (loss) (identified cost basis) | |
| Unaffiliated issuers | $3,149,444 |
| Foreign currency | (1,265) |
| Net realized gain (loss) | $3,148,179 |
| Change in unrealized appreciation or depreciation | |
| Unaffiliated issuers | $3,515,394 |
| Translation of assets and liabilities in foreign currencies | (4,006) |
| Net unrealized gain (loss) | $3,511,388 |
| Net realized and unrealized gain (loss) | $6,659,567 |
| Change in net assets from operations | $6,916,430 |
See Notes to Financial Statements
| Financial Statements | Statements of Changes in Net Assets |
These statements describe the increases and/or decreases in net assets resulting from operations, any distributions, and any shareholder transactions.
| | Six months ended | Year ended |
| | 6/30/21
(unaudited) | 12/31/20 |
| Change in net assets | | |
| From operations | | |
| Net investment income (loss) | $256,863 | $386,667 |
| Net realized gain (loss) | 3,148,179 | 3,963,044 |
| Net unrealized gain (loss) | 3,511,388 | 2,750,961 |
| Change in net assets from operations | $6,916,430 | $7,100,672 |
| Total distributions to shareholders | $— | $(2,767,021) |
| Change in net assets from fund share transactions | $(2,198,760) | $(5,075,552) |
| Total change in net assets | $4,717,670 | $(741,901) |
| Net assets | | |
| At beginning of period | 60,347,870 | 61,089,771 |
| At end of period | $65,065,540 | $60,347,870 |
See Notes to Financial Statements
| Financial Statements | Financial Highlights |
The financial highlights table is intended to help you understand the fund's financial performance for the semiannual period and the past 5 fiscal years. Certain information reflects financial results for a single fund share. The total returns in the table represent the rate that an investor would have earned (or lost) on an investment in the fund share class (assuming reinvestment of all distributions) held for the entire period.
| Initial Class | Six months
ended | Year ended |
| | 6/30/21
(unaudited) | 12/31/20 | 12/31/19 | 12/31/18 | 12/31/17 | 12/31/16 |
| Net asset value, beginning of period | $24.57 | $22.79 | $18.82 | $22.00 | $18.59 | $18.39 |
| Income (loss) from investment operations | | | | | | |
| Net investment income (loss) (d) | $0.11 | $0.16 | $0.25 | $0.23 | $0.20 | $0.17 |
| Net realized and unrealized gain (loss) | 2.79 | 2.73 | 5.35 | (2.23) | 4.20 | 1.20 |
| Total from investment operations | $2.90 | $2.89 | $5.60 | $(2.00) | $4.40 | $1.37 |
| Less distributions declared to shareholders | | | | | | |
| From net investment income | $— | $(0.26) | $(0.25) | $(0.21) | $(0.18) | $(0.18) |
| From net realized gain | — | (0.85) | (1.38) | (0.97) | (0.81) | (0.99) |
| Total distributions declared to shareholders | $— | $(1.11) | $(1.63) | $(1.18) | $(0.99) | $(1.17) |
| Net asset value, end of period (x) | $27.47 | $24.57 | $22.79 | $18.82 | $22.00 | $18.59 |
| Total return (%) (k)(r)(s)(x) | 11.80(n) | 13.29 | 30.57 | (9.74) | 24.07 | 7.35 |
Ratios (%) (to average net assets)
and Supplemental data: | | | | | | |
| Expenses before expense reductions (f) | 1.13(a) | 1.16 | 1.16 | 1.13 | 1.16 | 1.19 |
| Expenses after expense reductions (f) | 0.92(a) | 0.92 | 0.95 | 0.97 | 0.97 | 0.99 |
| Net investment income (loss) | 0.89(a) | 0.75 | 1.16 | 1.07 | 0.95 | 0.93 |
| Portfolio turnover | 6(n) | 12 | 11 | 15 | 11 | 13 |
| Net assets at end of period (000 omitted) | $50,341 | $46,879 | $49,771 | $45,219 | $52,850 | $44,756 |
See Notes to Financial Statements
Financial Highlights - continued
| Service Class | Six months
ended | Year ended |
| | 6/30/21
(unaudited) | 12/31/20 | 12/31/19 | 12/31/18 | 12/31/17 | 12/31/16 |
| Net asset value, beginning of period | $24.37 | $22.62 | $18.70 | $21.86 | $18.49 | $18.30 |
| Income (loss) from investment operations | | | | | | |
| Net investment income (loss) (d) | $0.08 | $0.10 | $0.18 | $0.18 | $0.14 | $0.13 |
| Net realized and unrealized gain (loss) | 2.76 | 2.71 | 5.32 | (2.21) | 4.18 | 1.18 |
| Total from investment operations | $2.84 | $2.81 | $5.50 | $(2.03) | $4.32 | $1.31 |
| Less distributions declared to shareholders | | | | | | |
| From net investment income | $— | $(0.21) | $(0.20) | $(0.16) | $(0.14) | $(0.13) |
| From net realized gain | — | (0.85) | (1.38) | (0.97) | (0.81) | (0.99) |
| Total distributions declared to shareholders | $— | $(1.06) | $(1.58) | $(1.13) | $(0.95) | $(1.12) |
| Net asset value, end of period (x) | $27.21 | $24.37 | $22.62 | $18.70 | $21.86 | $18.49 |
| Total return (%) (k)(r)(s)(x) | 11.65(n) | 13.04 | 30.20 | (9.92) | 23.75 | 7.06 |
Ratios (%) (to average net assets)
and Supplemental data: | | | | | | |
| Expenses before expense reductions (f) | 1.38(a) | 1.41 | 1.41 | 1.38 | 1.42 | 1.44 |
| Expenses after expense reductions (f) | 1.17(a) | 1.17 | 1.20 | 1.22 | 1.22 | 1.24 |
| Net investment income (loss) | 0.64(a) | 0.48 | 0.85 | 0.86 | 0.68 | 0.70 |
| Portfolio turnover | 6(n) | 12 | 11 | 15 | 11 | 13 |
| Net assets at end of period (000 omitted) | $14,725 | $13,469 | $11,319 | $7,139 | $10,162 | $7,033 |
| (a) | Annualized. |
| (d) | Per share data is based on average shares outstanding. |
| (f) | Ratios do not reflect reductions from fees paid indirectly, if applicable. |
| (k) | The total return does not reflect expenses that apply to separate accounts. Inclusion of these charges would reduce the total return figures for all periods shown. |
| (n) | Not annualized. |
| (r) | Certain expenses have been reduced without which performance would have been lower. |
| (s) | From time to time the fund may receive proceeds from litigation settlements, without which performance would be lower. |
| (x) | The net asset values and total returns have been calculated on net assets which include adjustments made in accordance with U.S. generally accepted accounting principles required at period end for financial reporting purposes. |
See Notes to Financial Statements
Notes to Financial Statements (unaudited)
(1) Business and Organization
MFS Global Equity Series (the fund) is a diversified series of MFS Variable Insurance Trust (the trust). The trust is organized as a Massachusetts business trust and is registered under the Investment Company Act of 1940, as amended, as an open-end management investment company. The shareholders of each series of the trust are separate accounts of insurance companies, which offer variable annuity and/or life insurance products, and qualified retirement and pension plans.
The fund is an investment company and accordingly follows the investment company accounting and reporting guidance of the Financial Accounting Standards Board (FASB) Accounting Standards Codification Topic 946 Financial Services - Investment Companies.
(2) Significant Accounting Policies
General — The preparation of financial statements in conformity with U.S. generally accepted accounting principles requires management to make estimates and assumptions that affect the reported amounts of assets and liabilities, and disclosure of contingent assets and liabilities at the date of the financial statements and the reported amounts of increases and decreases in net assets from operations during the reporting period. Actual results could differ from those estimates. In the preparation of these financial statements, management has evaluated subsequent events occurring after the date of the fund’s Statement of Assets and Liabilities through the date that the financial statements were issued. The fund invests in foreign securities. Investments in foreign securities are vulnerable to the effects of changes in the relative values of the local currency and the U.S. dollar and to the effects of changes in each country’s market, economic, industrial, political, regulatory, geopolitical, environmental, public health, and other conditions.
Certain of the fund's investments, derivatives, debt and other contracts may be based on reference interest rates such as the London Interbank Offered Rate (“LIBOR”). In 2017, the regulatory authority that oversees financial services firms in the United Kingdom announced plans to transition away from LIBOR by the end of 2021. In March 2021, the administrator of LIBOR announced the extension of the publication of the more commonly used U.S. dollar LIBOR settings to the end of June 2023. Although the full impacts of the transition away from LIBOR are not fully known, the transition may result in, among other things, an increase in volatility or illiquidity of the markets for instruments that currently rely on LIBOR to determine interest rates and this could have an adverse impact on the fund's performance. With respect to the fund's accounting for investments, derivatives, debt and other contracts that undergo reference rate-related modifications as a result of the transition, management will rely upon the relief provided by FASB Codification Topic 848 – Reference Rate Reform (Topic 848). The guidance in Topic 848 permits the fund to disregard the GAAP accounting requirements around certain contract modifications resulting from the LIBOR transition such that for contracts considered in scope, the fund can account for those modified contracts as a continuation of the existing contracts.
Balance Sheet Offsetting — The fund's accounting policy with respect to balance sheet offsetting is that, absent an event of default by the counterparty or a termination of the agreement, the International Swaps and Derivatives Association (ISDA) Master Agreement, or similar agreement, does not result in an offset of reported amounts of financial assets and financial liabilities in the Statement of Assets and Liabilities across transactions between the fund and the applicable counterparty. The fund's right to setoff may be restricted or prohibited by the bankruptcy or insolvency laws of the particular jurisdiction to which a specific master netting agreement counterparty is subject. Balance sheet offsetting disclosures, to the extent applicable to the fund, have been included in the fund’s Significant Accounting Policies note under the captions for each of the fund’s in-scope financial instruments and transactions.
Investment Valuations — Equity securities, including restricted equity securities, are generally valued at the last sale or official closing price on their primary market or exchange as provided by a third-party pricing service. Equity securities, for which there were no sales reported that day, are generally valued at the last quoted daily bid quotation on their primary market or exchange as provided by a third-party pricing service. Short-term instruments with a maturity at issuance of 60 days or less may be valued at amortized cost, which approximates market value. Open-end investment companies are generally valued at net asset value per share.
Securities and other assets generally valued on the basis of information from a third-party pricing service may also be valued at a broker/dealer bid quotation. In determining values, third-party pricing services can utilize both transaction data and market information such as yield, quality, coupon rate, maturity, type of issue, trading characteristics, and other market data. The values of foreign securities and other assets and liabilities expressed in foreign currencies are converted to U.S. dollars using the mean of bid and asked prices for rates provided by a third-party pricing service.
The Board of Trustees has delegated primary responsibility for determining or causing to be determined the value of the fund’s investments (including any fair valuation) to the adviser pursuant to valuation policies and procedures approved by the Board. If the adviser determines that reliable market quotations are not readily available, investments are valued at fair value as determined in good faith by the adviser in accordance with such procedures under the oversight of the Board of Trustees. Under the fund’s valuation policies and procedures, market quotations are not considered to be readily available for most types of debt instruments
Notes to Financial Statements (unaudited) - continued
and floating rate loans and many types of derivatives. These investments are generally valued at fair value based on information from third-party pricing services. In addition, investments may be valued at fair value if the adviser determines that an investment’s value has been materially affected by events occurring after the close of the exchange or market on which the investment is principally traded (such as foreign exchange or market) and prior to the determination of the fund’s net asset value, or after the halt of trading of a specific security where trading does not resume prior to the close of the exchange or market on which the security is principally traded. Events that occur after foreign markets close (such as developments in foreign markets and significant movements in the U.S. markets) and prior to the determination of the fund’s net asset value may be deemed to have a material effect on the value of securities traded in foreign markets. Accordingly, the fund’s foreign equity securities may often be valued at fair value. The adviser generally relies on third-party pricing services or other information (such as the correlation with price movements of similar securities in the same or other markets; the type, cost and investment characteristics of the security; the business and financial condition of the issuer; and trading and other market data) to assist in determining whether to fair value and at what value to fair value an investment. The value of an investment for purposes of calculating the fund’s net asset value can differ depending on the source and method used to determine value. When fair valuation is used, the value of an investment used to determine the fund’s net asset value may differ from quoted or published prices for the same investment. There can be no assurance that the fund could obtain the fair value assigned to an investment if it were to sell the investment at the same time at which the fund determines its net asset value per share.
Various inputs are used in determining the value of the fund's assets or liabilities. These inputs are categorized into three broad levels. In certain cases, the inputs used to measure fair value may fall into different levels of the fair value hierarchy. In such cases, an investment's level within the fair value hierarchy is based on the lowest level of input that is significant to the fair value measurement. The fund's assessment of the significance of a particular input to the fair value measurement in its entirety requires judgment, and considers factors specific to the investment. Level 1 includes unadjusted quoted prices in active markets for identical assets or liabilities. Level 2 includes other significant observable market-based inputs (including quoted prices for similar securities, interest rates, prepayment speed, and credit risk). Level 3 includes unobservable inputs, which may include the adviser's own assumptions in determining the fair value of investments. The following is a summary of the levels used as of June 30, 2021 in valuing the fund's assets or liabilities:
| Financial Instruments | Level 1 | Level 2 | Level 3 | Total |
| Equity Securities | $63,783,000 | $— | $— | $63,783,000 |
| Mutual Funds | 1,147,768 | — | — | 1,147,768 |
| Total | $64,930,768 | $— | $— | $64,930,768 |
For further information regarding security characteristics, see the Portfolio of Investments.
Foreign Currency Translation — Purchases and sales of foreign investments, income, and expenses are converted into U.S. dollars based upon currency exchange rates prevailing on the respective dates of such transactions or on the reporting date for foreign denominated receivables and payables. Gains and losses attributable to foreign currency exchange rates on sales of securities are recorded for financial statement purposes as net realized gains and losses on investments. Gains and losses attributable to foreign exchange rate movements on receivables, payables, income and expenses are recorded for financial statement purposes as foreign currency transaction gains and losses. That portion of both realized and unrealized gains and losses on investments that results from fluctuations in foreign currency exchange rates is not separately disclosed.
Security Loans — Under its Securities Lending Agency Agreement with the fund, State Street Bank and Trust Company, as lending agent, loans the securities of the fund to certain qualified institutions (the “Borrowers”) approved by the fund. Security loans can be terminated at the discretion of either the lending agent or the fund and the related securities must be returned within the earlier of the standard trade settlement period for such securities or within three business days. The loans are collateralized by cash and/or U.S. Treasury and federal agency obligations in an amount typically at least equal to the market value of the securities loaned. On loans collateralized by cash, the cash collateral is invested in a money market fund. The market value of the loaned securities is determined at the close of business of the fund and any additional required collateral is delivered to the fund on the next business day. The lending agent provides the fund with indemnification against Borrower default. In the event of Borrower default, the lending agent will, for the benefit of the fund, either purchase securities identical to those loaned or, when such purchase is commercially impracticable, pay the fund the market value of the loaned securities. In return, the lending agent assumes the fund's rights to the related collateral. If the collateral value is less than the cost to purchase identical securities, the lending agent is responsible for the shortfall, but only to the extent that such shortfall is not due to a decline in collateral value resulting from collateral reinvestment for which the fund bears the risk of loss. At period end, the fund had investment securities on loan, all of which were classified as equity securities in the fund’s Portfolio of Investments, with a fair value of $194,992. The fair value of the fund’s investment securities on loan is presented gross in the Statement of Assets and Liabilities. These loans were collateralized by U.S. Treasury Obligations of $206,528 held by the lending agent. The collateral on securities loaned exceeded the value of securities on loan at period end. A portion of the income generated upon investment of the collateral is remitted to the Borrowers, and the
Notes to Financial Statements (unaudited) - continued
remainder is allocated between the fund and the lending agent. On loans collateralized by U.S. Treasury and/or federal agency obligations, a fee is received from the Borrower, and is allocated between the fund and the lending agent. Income from securities lending is separately reported in the Statement of Operations. The dividend and interest income earned on the securities loaned is accounted for in the same manner as other dividend and interest income.
Indemnifications — Under the fund's organizational documents, its officers and Trustees may be indemnified against certain liabilities and expenses arising out of the performance of their duties to the fund. Additionally, in the normal course of business, the fund enters into agreements with service providers that may contain indemnification clauses. The fund's maximum exposure under these agreements is unknown as this would involve future claims that may be made against the fund that have not yet occurred.
Investment Transactions and Income — Investment transactions are recorded on the trade date. Dividends received in cash are recorded on the ex-dividend date. Certain dividends from foreign securities will be recorded when the fund is informed of the dividend if such information is obtained subsequent to the ex-dividend date. Dividend payments received in additional securities are recorded on the ex-dividend date in an amount equal to the value of the security on such date.
The fund may receive proceeds from litigation settlements. Any proceeds received from litigation involving portfolio holdings are reflected in the Statement of Operations in realized gain/loss if the security has been disposed of by the fund or in unrealized gain/loss if the security is still held by the fund. Any other proceeds from litigation not related to portfolio holdings are reflected as other income in the Statement of Operations.
Tax Matters and Distributions — The fund intends to qualify as a regulated investment company, as defined under Subchapter M of the Internal Revenue Code, and to distribute all of its taxable income, including realized capital gains. As a result, no provision for federal income tax is required. The fund’s federal tax returns, when filed, will remain subject to examination by the Internal Revenue Service for a three year period. Management has analyzed the fund’s tax positions taken on federal and state tax returns for all open tax years and does not believe that there are any uncertain tax positions that require recognition of a tax liability. Foreign taxes, if any, have been accrued by the fund in the accompanying financial statements in accordance with the applicable foreign tax law. Foreign income taxes may be withheld by certain countries in which the fund invests. Additionally, capital gains realized by the fund on securities issued in or by certain foreign countries may be subject to capital gains tax imposed by those countries.
Distributions to shareholders are recorded on the ex-dividend date. Income and capital gain distributions are determined in accordance with income tax regulations, which may differ from U.S. generally accepted accounting principles. Certain capital accounts in the financial statements are periodically adjusted for permanent differences in order to reflect their tax character. These adjustments have no impact on net assets or net asset value per share. Temporary differences which arise from recognizing certain items of income, expense, gain or loss in different periods for financial statement and tax purposes will reverse at some time in the future.
Book/tax differences primarily relate to wash sale loss deferrals.
The tax character of distributions declared to shareholders for the last fiscal year is as follows:
| | Year ended
12/31/20 |
| Ordinary income (including any short-term capital gains) | $699,005 |
| Long-term capital gains | 2,068,016 |
| Total distributions | $2,767,021 |
The federal tax cost and the tax basis components of distributable earnings were as follows:
| As of 6/30/21 | |
| Cost of investments | $29,274,818 |
| Gross appreciation | 35,925,976 |
| Gross depreciation | (270,026) |
| Net unrealized appreciation (depreciation) | $35,655,950 |
| As of 12/31/20 | |
| Undistributed ordinary income | 463,083 |
| Undistributed long-term capital gain | 3,941,434 |
| Other temporary differences | 7,265 |
| Net unrealized appreciation (depreciation) | 32,140,556 |
The aggregate cost above includes prior fiscal year end tax adjustments, if applicable.
Notes to Financial Statements (unaudited) - continued
Multiple Classes of Shares of Beneficial Interest — The fund offers multiple classes of shares, which differ in their respective distribution and/or service fees. The fund's income, realized and unrealized gain (loss), and common expenses are allocated to shareholders based on the daily net assets of each class. Dividends are declared separately for each class. Differences in per share dividend rates are generally due to differences in separate class expenses. The fund’s distributions declared to shareholders as reported in the Statements of Changes in Net Assets are presented by class as follows:
| | Six months
ended
6/30/21 | | Year
ended
12/31/20 |
| Initial Class | $— | | $2,194,634 |
| Service Class | — | | 572,387 |
| Total | $— | | $2,767,021 |
(3) Transactions with Affiliates
Investment Adviser — The fund has an investment advisory agreement with MFS to provide overall investment management and related administrative services and facilities to the fund. The management fee is computed daily and paid monthly at the following annual rates based on the fund's average daily net assets:
| Up to $1 billion | 0.90% |
| In excess of $1 billion and up to $2.5 billion | 0.75% |
| In excess of $2.5 billion | 0.65% |
MFS has agreed in writing to reduce its management fee by a specified amount if certain MFS mutual fund assets exceed thresholds agreed to by MFS and the fund's Board of Trustees. For the six months ended June 30, 2021, this management fee reduction amounted to $3,695, which is included in the reduction of total expenses in the Statement of Operations. The management fee incurred for the six months ended June 30, 2021 was equivalent to an annual effective rate of 0.89% of the fund's average daily net assets.
The investment adviser has agreed in writing to pay a portion of the fund’s total annual operating expenses, excluding interest, taxes, extraordinary expenses, brokerage and transaction costs, and investment-related expenses, such that total annual operating expenses do not exceed 0.92% of average daily net assets for the Initial Class shares and 1.17% of average daily net assets for the Service Class shares. This written agreement will continue until modified by the fund’s Board of Trustees, but such agreement will continue at least until April 30, 2023. For the six months ended June 30, 2021, this reduction amounted to $62,113, which is included in the reduction of total expenses in the Statement of Operations.
Distributor — MFS Fund Distributors, Inc. (MFD), a wholly-owned subsidiary of MFS, is the distributor of shares of the fund. The Trustees have adopted a distribution plan for the Service Class shares pursuant to Rule 12b-1 under the Investment Company Act of 1940.
The fund's distribution plan provides that the fund will pay MFD distribution and/or service fees equal to 0.25% per annum of its average daily net assets attributable to Service Class shares as partial consideration for services performed and expenses incurred by MFD and financial intermediaries (including participating insurance companies that invest in the fund to fund variable annuity and variable life insurance contracts, sponsors of qualified retirement and pension plans that invest in the fund, and affiliates of these participating insurance companies and plan sponsors) in connection with the sale and distribution of the Service Class shares. MFD may subsequently pay all, or a portion, of the distribution and/or service fees to financial intermediaries.
Shareholder Servicing Agent — MFS Service Center, Inc. (MFSC), a wholly-owned subsidiary of MFS, receives a fee from the fund for its services as shareholder servicing agent. For the six months ended June 30, 2021, the fee was $4,998, which equated to 0.0162% annually of the fund's average daily net assets. MFSC also receives reimbursement from the fund for out-of-pocket expenses paid by MFSC on behalf of the fund. For the six months ended June 30, 2021, these costs amounted to $136.
Administrator — MFS provides certain financial, legal, shareholder communications, compliance, and other administrative services to the fund. Under an administrative services agreement, the fund reimburses MFS the costs incurred to provide these services. The fund is charged an annual fixed amount of $17,500 plus a fee based on average daily net assets. The administrative services fee incurred for the six months ended June 30, 2021 was equivalent to an annual effective rate of 0.0306% of the fund's average daily net assets.
Notes to Financial Statements (unaudited) - continued
Trustees’ and Officers’ Compensation — The fund pays compensation to independent Trustees in the form of a retainer, attendance fees, and additional compensation to Board and Committee chairpersons. The fund does not pay compensation directly to Trustees or officers of the fund who are also officers of the investment adviser, all of whom receive remuneration from MFS for their services to the fund. Certain officers and Trustees of the fund are officers or directors of MFS, MFD, and MFSC.
Other — The fund invests in the MFS Institutional Money Market Portfolio which is managed by MFS and seeks current income consistent with preservation of capital and liquidity. This money market fund does not pay a management fee to MFS but does incur investment and operating costs.
The fund is permitted to engage in purchase and sale transactions with funds and accounts for which MFS serves as investment adviser or sub-adviser (“cross-trades”) pursuant to a policy adopted by the Board of Trustees. This policy has been designed to ensure that cross-trades conducted by the fund comply with Rule 17a-7 under the Investment Company Act of 1940. During the six months ended June 30, 2021, the fund engaged in purchase and sale transactions pursuant to this policy, which amounted to $110,200 and $6,911, respectively. The sales transactions resulted in net realized gains (losses) of $2,229.
(4) Portfolio Securities
For the six months ended June 30, 2021, purchases and sales of investments, other than short-term obligations, aggregated $3,837,032 and $6,259,838, respectively.
(5) Shares of Beneficial Interest
The fund's Declaration of Trust permits the Trustees to issue an unlimited number of full and fractional shares of beneficial interest. Transactions in fund shares were as follows:
| | Six months ended
6/30/21 | | Year ended
12/31/20 |
| | Shares | Amount | | Shares | Amount |
| Shares sold | | | | | |
| Initial Class | 119,970 | $3,139,409 | | 374,120 | $7,560,367 |
| Service Class | 62,537 | 1,586,783 | | 195,660 | 4,034,412 |
| | 182,507 | $4,726,192 | | 569,780 | $11,594,779 |
Shares issued to shareholders
in reinvestment of distributions | | | | | |
| Initial Class | — | $— | | 100,487 | $2,194,634 |
| Service Class | — | — | | 26,402 | 572,387 |
| | — | $— | | 126,889 | $2,767,021 |
| Shares reacquired | | | | | |
| Initial Class | (195,311) | $(5,043,177) | | (750,977) | $(15,997,296) |
| Service Class | (74,099) | (1,881,775) | | (169,724) | (3,440,056) |
| | (269,410) | $(6,924,952) | | (920,701) | $(19,437,352) |
| Net change | | | | | |
| Initial Class | (75,341) | $(1,903,768) | | (276,370) | $(6,242,295) |
| Service Class | (11,562) | (294,992) | | 52,338 | 1,166,743 |
| | (86,903) | $(2,198,760) | | (224,032) | $(5,075,552) |
(6) Line of Credit
The fund and certain other funds managed by MFS participate in a $1.25 billion unsecured committed line of credit of which $1 billion is reserved for use by the fund and certain other MFS U.S. funds. The line of credit is provided by a syndicate of banks under a credit agreement. Borrowings may be made for temporary financing needs. Interest is charged to each fund, based on its borrowings, generally at a rate equal to the highest of one month LIBOR, the Federal Funds Effective Rate and the Overnight Bank Funding Rate, plus an agreed upon spread. A commitment fee, based on the average daily, unused portion of the committed line of credit, is allocated among the participating funds. In addition, the fund and other funds managed by MFS have established unsecured uncommitted borrowing arrangements with certain banks for temporary financing needs. Interest is charged to each fund, based on its borrowings, at rates equal to customary reference rates plus an agreed upon spread. For the six months ended June 30, 2021, the fund’s commitment fee and interest expense were $119 and $0, respectively, and are included in “Miscellaneous” expense in the Statement of Operations.
Notes to Financial Statements (unaudited) - continued
(7) Investments in Affiliated Issuers
An affiliated issuer may be considered one in which the fund owns 5% or more of the outstanding voting securities, or a company which is under common control. For the purposes of this report, the following were affiliated issuers:
| Affiliated Issuers | Beginning
Value | Purchases | Sales
Proceeds | Realized
Gain
(Loss) | Change in
Unrealized
Appreciation or
Depreciation | Ending
Value |
| MFS Institutional Money Market Portfolio | $651,977 | $5,781,502 | $5,285,711 | $— | $— | $1,147,768 |
| Affiliated Issuers | Dividend
Income | Capital Gain
Distributions |
| MFS Institutional Money Market Portfolio | $131 | $— |
(8) Impacts of COVID-19
The pandemic related to the global spread of novel coronavirus disease (COVID-19), which was first detected in December 2019, has resulted in significant disruptions to global business activity and the global economy, as well as the economies of individual countries, the financial performance of individual companies and sectors, and the securities and commodities markets in general. Multiple surges in cases globally, the availability and widespread adoption of vaccines, and the emergence of variant strains of the virus continue to create uncertainty as to the future and long-term impacts resulting from the pandemic including impacts to the prices and liquidity of the fund's investments and the fund's performance.
Statement Regarding Liquidity Risk Management Program
The fund has adopted and implemented a liquidity risk management program (the “Program”) as required by Rule 22e-4 under the Investment Company Act of 1940, as amended. The fund’s Board of Trustees (the “Board”) has designated MFS as the administrator of the Program. The Program is reasonably designed to assess and manage the liquidity risk of the fund. Liquidity risk is the risk that the fund could not meet requests to redeem shares issued by the fund without significant dilution of remaining investors' interests.
MFS provided a written report to the Board for consideration at its April 2021 meeting that addressed the operation of the Program and provided an assessment of the adequacy and effectiveness of the Program during the period from January 1, 2020 to December 31, 2020 (the “Covered Period”). The report concluded that during the Covered Period the Program had operated effectively and had adequately and effectively been implemented to assess and manage the fund’s liquidity risk. MFS also reported that there were no liquidity events that impacted the fund or its ability to timely meet redemptions without dilution to existing shareholders during the Covered Period.
There can be no assurance that the Program will achieve its objectives in the future. Further information on liquidity risk, and other principal risks to which an investment in the fund may be subject, can be found in the prospectus.
Proxy Voting Policies and Information
MFS votes proxies on behalf of the fund pursuant to proxy voting policies and procedures that are available without charge, upon request, by calling 1-800-225-2606, by visiting mfs.com/proxyvoting, or by visiting the SEC’s Web site at http://www.sec.gov.
Information regarding how the fund voted proxies relating to portfolio securities during the most recent twelve-month period ended June 30 is available by August 31 of each year without charge by visiting mfs.com/proxyvoting, or by visiting the SEC’s Web site at http://www.sec.gov.
Quarterly Portfolio Disclosure
The fund files a complete schedule of portfolio holdings with the SEC for the first and third quarters of each fiscal year as an exhibit to its reports on Form N-PORT. The fund’s Form N-PORT reports are available on the SEC’s Web site at http://www.sec.gov. A shareholder can obtain the portfolio holdings report for the first and third quarters of the fund's fiscal year at mfs.com/vit1 by choosing the fund's name and then scrolling to the “Resources” section and clicking on the “Prospectus and Reports” tab.
FURTHER INFORMATION
From time to time, MFS may post important information about the fund or the MFS Funds on the MFS Web site (mfs.com). This information is available at https://www.mfs.com/announcements or at mfs.com/vit1 by choosing the fund's name and then scrolling to the “Resources” section and clicking on the “Announcements” tab, if any.
Information About Fund Contracts and Legal Claims
The fund has entered into contractual arrangements with an investment adviser, administrator, distributor, shareholder servicing agent, 529 program manager (if applicable), and custodian who each provide services to the fund. Unless expressly stated otherwise, shareholders are not parties to, or intended beneficiaries of these contractual arrangements, and these contractual arrangements are not intended to create any shareholder right to enforce them against the service providers or to seek any remedy under them against the service providers, either directly or on behalf of the fund.
Under the Trust’s By-Laws and Declaration of Trust, any claims asserted against or on behalf of the MFS Funds, including claims against Trustees and Officers, must be brought in state and federal courts located within the Commonwealth of Massachusetts.
Semiannual Report
June 30, 2021
MFS® Variable Insurance Trust
The report is prepared for the general information of contract owners. It is authorized for distribution to prospective investors only when preceded or accompanied by a current prospectus.
NOT FDIC INSURED • MAY LOSE VALUE • NO BANK OR CREDIT UNION GUARANTEE •
NOT A DEPOSIT • NOT INSURED BY ANY FEDERAL GOVERNMENT AGENCY OR NCUA/NCUSIF
Dear Contract Owners:
After experiencing dramatic swings in the early days of the coronavirus pandemic, global equity markets have performed strongly over the past year. Though the speedy development of vaccines brightened the economic and market outlook, uncertainty remains as new variants of the virus appear, and questions persist over how fast vaccines can be made widely available in the developing world.
Global central banks have taken aggressive steps to cushion the economic and market fallout related to the virus, and governments are deploying unprecedented levels of fiscal support. Having passed a $1.9 trillion stimulus package in March, the U.S. Congress could approve additional stimulus later this year, some of it focused on infrastructure. Along with extraordinary government expenditures, pent-up consumer demand fueled a surge in economic activity as coronavirus restrictions were eased, pushing up inflation, at least temporarily. Markets initially reacted by pushing up yields on global government bonds, though some of the rate rise has since been corrected.
A spirited debate is underway among investors over whether the current price pressures will persist or prove to be temporary, caused by pandemic-induced bottlenecks. The policy measures put in place to counteract the pandemic's effects have helped build a supportive environment and are encouraging economic recovery; however, if markets disconnect from fundamentals, they can sow the seeds of instability. As such, recent dramatic increases in speculative trading in cryptocurrencies, special purpose acquisition companies (SPACs), and the like bear watching.
In the aftermath of the crisis, we could see societal changes as households, businesses, and governments adjust to a new reality, and any such alterations could affect the investment landscape. For investors, events such as the COVID-19 outbreak demonstrate the importance of having a deep understanding of company fundamentals, and we have built our global research platform to do just that.
At MFS®, we put our clients’ assets to work responsibly by carefully navigating the increasing complexity of global markets and economies. Guided by our long-term philosophy and adhering to our commitment to sustainable investing, we tune out the noise and aim to uncover what we believe are the best, most durable investment opportunities in the market. Our unique global investment platform combines collective expertise, long-term discipline, and thoughtful risk management to create sustainable value for investors.
Respectfully,
Michael W. Roberge
Chief Executive Officer
MFS Investment Management
August 13, 2021
The opinions expressed in this letter are subject to change and may not be relied upon for investment advice. No forecasts can be guaranteed.
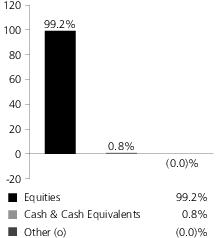
Portfolio structure
Top ten holdings
| Microsoft Corp. | 10.3% |
| Amazon.com, Inc. | 8.2% |
| Alphabet, Inc., “A” | 5.5% |
| Adobe Systems, Inc. | 4.1% |
| Facebook, Inc., “A” | 3.9% |
| Mastercard, Inc., “A” | 3.2% |
| PayPal Holdings, Inc. | 2.8% |
| Visa, Inc., “A” | 2.8% |
| Apple, Inc. | 2.4% |
| NVIDIA Corp. | 2.3% |
GICS equity sectors (g)
| Information Technology | 41.5% |
| Communication Services | 19.3% |
| Consumer Discretionary | 11.3% |
| Health Care | 10.3% |
| Industrials | 7.3% |
| Financials | 3.2% |
| Materials | 2.7% |
| Consumer Staples | 2.4% |
| Real Estate | 1.1% |
| (g) | The Global Industry Classification Standard (GICS®) was developed by and/or is the exclusive property of MSCI, Inc. and S&P Global Market Intelligence Inc. (“S&P Global Market Intelligence”). GICS is a service mark of MSCI and S&P Global Market Intelligence and has been licensed for use by MFS. MFS has applied its own internal sector/industry classification methodology for equity securities and non-equity securities that are unclassified by GICS. |
Cash & Cash Equivalents includes any cash, investments in money market funds, short-term securities, and other assets less liabilities. Please see the Statement of Assets and Liabilities for additional information related to the fund’s cash position and other assets and liabilities.
Percentages are based on net assets as of June 30, 2021.
The portfolio is actively managed and current holdings may be different.
Expense Table
Fund Expenses Borne by the Contract Holders during the Period,
January 1, 2021 through June 30, 2021
As a contract holder of the fund, you incur ongoing costs, including management fees; distribution and/or service (12b-1) fees; and other fund expenses. This example is intended to help you understand your ongoing costs (in dollars) of investing in the fund and to compare these costs with the ongoing costs of investing in other mutual funds.
The example is based on an investment of $1,000 invested at the beginning of the period and held for the entire period January 1, 2021 through June 30, 2021.
Actual Expenses
The first line for each share class in the following table provides information about actual account values and actual expenses. You may use the information in this line, together with the amount you invested, to estimate the expenses that you paid over the period. Simply divide your account value by $1,000 (for example, an $8,600 account value divided by $1,000 = 8.6), then multiply the result by the number in the first line under the heading entitled “Expenses Paid During Period” to estimate the expenses you paid on your account during this period.
Hypothetical Example for Comparison Purposes
The second line for each share class in the following table provides information about hypothetical account values and hypothetical expenses based on the fund’s actual expense ratio and an assumed rate of return of 5% per year before expenses, which is not the fund’s actual return. The hypothetical account values and expenses may not be used to estimate the actual ending account balance or expenses you paid for the period. You may use this information to compare the ongoing costs of investing in the fund and other funds. To do so, compare this 5% hypothetical example with the 5% hypothetical examples that appear in the shareholder reports of the other funds.
Please note that the expenses shown in the table are meant to highlight the fund's ongoing costs only and do not take into account the fees and expenses imposed under the variable contracts through which your investment in the fund is made. Therefore, the second line for each share class in the table is useful in comparing ongoing costs associated with an investment in vehicles (such as the fund) which fund benefits under variable annuity and variable life insurance contracts and to qualified pension and retirement plans only, and will not help you determine the relative total costs of investing in the fund through variable annuity and variable life insurance contracts. If the fees and expenses imposed under the variable contracts were included, your costs would have been higher.
Share
Class | | Annualized
Expense
Ratio | Beginning
Account Value
1/01/21 | Ending
Account Value
6/30/21 | Expenses
Paid During
Period (p)
1/01/21-6/30/21 |
| Initial Class | Actual | 0.72% | $1,000.00 | $1,128.98 | $3.80 |
| Hypothetical (h) | 0.72% | $1,000.00 | $1,021.22 | $3.61 |
| Service Class | Actual | 0.97% | $1,000.00 | $1,127.72 | $5.12 |
| Hypothetical (h) | 0.97% | $1,000.00 | $1,019.98 | $4.86 |
| (h) | 5% class return per year before expenses. |
| (p) | “Expenses Paid During Period” are equal to each class's annualized expense ratio, as shown above, multiplied by the average account value over the period, multiplied by 181/365 (to reflect the one-half year period). |
Portfolio of Investments − 6/30/21 (unaudited)
The Portfolio of Investments is a complete list of all securities owned by your fund. It is categorized by broad-based asset classes.
| Issuer | | | Shares/Par | Value ($) |
| Common Stocks – 99.1% |
| Apparel Manufacturers – 0.9% | |
| NIKE, Inc., “B” | | 136,236 | $ 21,047,100 |
| Biotechnology – 0.7% | |
| Alnylam Pharmaceuticals, Inc. (a) | | 26,613 | $ 4,511,436 |
| Vertex Pharmaceuticals, Inc. (a) | | 57,040 | 11,500,975 |
| | | | | $16,012,411 |
| Broadcasting – 1.4% | |
| Netflix, Inc. (a) | | 61,141 | $ 32,295,288 |
| Brokerage & Asset Managers – 0.9% | |
| Charles Schwab Corp. | | 287,009 | $ 20,897,125 |
| Business Services – 8.2% | |
| Clarivate PLC (a) | | 551,006 | $ 15,169,195 |
| CoStar Group, Inc. (a) | | 213,333 | 17,668,239 |
| Equifax, Inc. | | 56,211 | 13,463,097 |
| Global Payments, Inc. | | 53,630 | 10,057,770 |
| MSCI, Inc. | | 75,655 | 40,330,167 |
| PayPal Holdings, Inc. (a) | | 224,557 | 65,453,874 |
| Verisk Analytics, Inc., “A” | | 164,523 | 28,745,459 |
| | | | | $190,887,801 |
| Cable TV – 1.7% | |
| Charter Communications, Inc., “A” (a) | | 54,972 | $ 39,659,549 |
| Computer Software – 21.3% | |
| Adobe Systems, Inc. (a) | | 162,952 | $ 95,431,209 |
| Atlassian Corp. PLC, “A” (a) | | 38,068 | 9,778,147 |
| Autodesk, Inc. (a) | | 98,387 | 28,719,165 |
| Black Knight, Inc. (a) | | 73,062 | 5,697,375 |
| Bumble, Inc., “A” (a) | | 80,421 | 4,632,250 |
| Cadence Design Systems, Inc. (a) | | 108,065 | 14,785,453 |
| Intuit, Inc. | | 107,678 | 52,780,525 |
| Microsoft Corp. | | 882,549 | 239,082,524 |
| Qualtrics International, “A” (a) | | 26,428 | 1,010,871 |
| salesforce.com, inc. (a) | | 130,656 | 31,915,341 |
| Synopsys, Inc. (a) | | 42,587 | 11,745,069 |
| | | | | $495,577,929 |
| Computer Software - Systems – 5.6% | |
| Apple, Inc. | | 405,345 | $ 55,516,051 |
| ServiceNow, Inc. (a) | | 46,908 | 25,778,291 |
| Square, Inc., “A” (a) | | 110,590 | 26,961,842 |
| TransUnion | | 203,692 | 22,367,419 |
| | | | | $130,623,603 |
| Construction – 2.7% | |
| Sherwin-Williams Co. | | 124,418 | $ 33,897,684 |
| Vulcan Materials Co. | | 170,024 | 29,596,078 |
| | | | | $63,493,762 |
| Consumer Products – 2.4% | |
| Colgate-Palmolive Co. | | 252,169 | $ 20,513,948 |
| Estee Lauder Cos., Inc., “A” | | 111,496 | 35,464,648 |
| | | | | $55,978,596 |
| Issuer | | | Shares/Par | Value ($) |
| Common Stocks – continued |
| Consumer Services – 0.6% | |
| Airbnb, Inc., “A” (a) | | 3,378 | $ 517,307 |
| Uber Technologies, Inc. (a) | | 248,997 | 12,479,730 |
| | | | | $12,997,037 |
| Electrical Equipment – 1.3% | |
| AMETEK, Inc. | | 154,820 | $ 20,668,470 |
| Johnson Controls International PLC | | 132,726 | 9,108,985 |
| | | | | $29,777,455 |
| Electronics – 6.0% | |
| Applied Materials, Inc. | | 180,844 | $ 25,752,186 |
| ASML Holding N.V. | | 33,426 | 23,092,018 |
| Lam Research Corp. | | 57,520 | 37,428,264 |
| NVIDIA Corp. | | 67,893 | 54,321,189 |
| | | | | $140,593,657 |
| Entertainment – 0.2% | |
| Spotify Technology S.A. (a) | | 19,366 | $ 5,337,076 |
| Gaming & Lodging – 0.2% | |
| MGM Resorts International | | 102,735 | $ 4,381,648 |
| General Merchandise – 0.5% | |
| Dollar General Corp. | | 49,372 | $ 10,683,607 |
| Health Maintenance Organizations – 0.2% | |
| UnitedHealth Group, Inc. | | 9,783 | $ 3,917,505 |
| Insurance – 0.6% | |
| Aon PLC | | 53,753 | $ 12,834,066 |
| Internet – 13.2% | |
| Alphabet, Inc., “A” (a) | | 52,156 | $ 127,353,999 |
| Alphabet, Inc., “C” (a) | | 15,713 | 39,381,806 |
| Facebook, Inc., “A” (a) | | 260,927 | 90,726,927 |
| Match Group, Inc. (a) | | 160,400 | 25,864,500 |
| Pinterest, Inc. (a) | | 64,126 | 5,062,748 |
| Sea Ltd., ADR (a) | | 68,451 | 18,796,645 |
| | | | | $307,186,625 |
| Leisure & Toys – 2.6% | |
| Activision Blizzard, Inc. | | 190,853 | $ 18,215,010 |
| Electronic Arts, Inc. | | 154,955 | 22,287,178 |
| Roblox Corp., “A” (a) | | 88,906 | 7,999,762 |
| Take-Two Interactive Software, Inc. (a) | | 67,279 | 11,909,728 |
| | | | | $60,411,678 |
| Machinery & Tools – 0.6% | |
| Roper Technologies, Inc. | | 28,359 | $ 13,334,402 |
| Medical & Health Technology & Services – 0.8% | |
| ICON PLC (a) | | 84,910 | $ 17,551,746 |
| Medical Equipment – 7.5% | |
| Abbott Laboratories | | 272,488 | $ 31,589,534 |
| Becton, Dickinson and Co. | | 41,494 | 10,090,926 |
| Boston Scientific Corp. (a) | | 519,702 | 22,222,457 |
| Danaher Corp. | | 182,064 | 48,858,695 |
Portfolio of Investments (unaudited) – continued
| Issuer | | | Shares/Par | Value ($) |
| Common Stocks – continued |
| Medical Equipment – continued | |
| Edwards Lifesciences Corp. (a) | | 141,818 | $ 14,688,090 |
| STERIS PLC | | 30,757 | 6,345,169 |
| Thermo Fisher Scientific, Inc. | | 80,225 | 40,471,106 |
| | | | | $174,265,977 |
| Network & Telecom – 0.4% | |
| Equinix, Inc., REIT | | 12,864 | $ 10,324,646 |
| Other Banks & Diversified Financials – 5.9% | |
| Mastercard, Inc., “A” | | 200,972 | $ 73,372,868 |
| Visa, Inc., “A” | | 277,603 | 64,909,133 |
| | | | | $138,282,001 |
| Pharmaceuticals – 1.2% | |
| Zoetis, Inc. | | 153,972 | $ 28,694,222 |
| Railroad & Shipping – 0.7% | |
| Canadian Pacific Railway Ltd. | | 201,945 | $ 15,531,590 |
| Restaurants – 0.8% | |
| Chipotle Mexican Grill, Inc., “A” (a) | | 8,124 | $ 12,594,962 |
| Starbucks Corp. | | 54,128 | 6,052,052 |
| | | | | $18,647,014 |
| Issuer | | | Shares/Par | Value ($) |
| Common Stocks – continued |
| Specialty Stores – 9.4% | |
| Amazon.com, Inc. (a) | | 55,408 | $ 190,612,385 |
| Lululemon Athletica, Inc. (a) | | 25,352 | 9,252,719 |
| Ross Stores, Inc. | | 61,052 | 7,570,448 |
| Shopify, Inc. (a) | | 7,973 | 11,648,394 |
| | | | | $219,083,946 |
| Telecommunications - Wireless – 0.6% | |
| American Tower Corp., REIT | | 54,548 | $ 14,735,597 |
| Total Common Stocks (Identified Cost, $766,214,343) | | $ 2,305,044,659 |
| Investment Companies (h) – 0.0% |
| Money Market Funds – 0.0% | |
| MFS Institutional Money Market Portfolio, 0.02% (v) (Identified Cost, $202) | | | 202 | $ 202 |
| Other Assets, Less Liabilities – 0.9% | | 21,665,625 |
| Net Assets – 100.0% | $ 2,326,710,486 |
| (a) | Non-income producing security. | | | |
| (h) | An affiliated issuer, which may be considered one in which the fund owns 5% or more of the outstanding voting securities, or a company which is under common control. At period end, the aggregate values of the fund's investments in affiliated issuers and in unaffiliated issuers were $202 and $2,305,044,659, respectively. | | | |
| (v) | Affiliated issuer that is available only to investment companies managed by MFS. The rate quoted for the MFS Institutional Money Market Portfolio is the annualized seven-day yield of the fund at period end. | | | |
| The following abbreviations are used in this report and are defined: |
| ADR | American Depositary Receipt |
| REIT | Real Estate Investment Trust |
See Notes to Financial Statements
| Financial Statements | Statement of Assets and Liabilities (unaudited) |
This statement represents your fund’s balance sheet, which details the assets and liabilities comprising the total value of the fund.
| At 6/30/21Assets | |
| Investments in unaffiliated issuers, at value (identified cost, $766,214,343) | $2,305,044,659 |
| Investments in affiliated issuers, at value (identified cost, $202) | 202 |
| Receivables for | |
| Investments sold | 25,471,857 |
| Fund shares sold | 909,660 |
| Dividends | 321,303 |
| Other assets | 5,425 |
| Total assets | $2,331,753,106 |
| Liabilities | |
| Payable to custodian | $1,706,952 |
| Payables for | |
| Fund shares reacquired | 3,026,030 |
| Payable to affiliates | |
| Investment adviser | 87,057 |
| Administrative services fee | 1,725 |
| Shareholder servicing costs | 821 |
| Distribution and/or service fees | 7,558 |
| Accrued expenses and other liabilities | 212,477 |
| Total liabilities | $5,042,620 |
| Net assets | $2,326,710,486 |
| Net assets consist of | |
| Paid-in capital | $376,225,562 |
| Total distributable earnings (loss) | 1,950,484,924 |
| Net assets | $2,326,710,486 |
| Shares of beneficial interest outstanding | 28,267,019 |
| | Net assets | Shares
outstanding | Net asset value
per share |
| Initial Class | $1,776,455,677 | 21,318,994 | $83.33 |
| Service Class | 550,254,809 | 6,948,025 | 79.20 |
See Notes to Financial Statements
| Financial Statements | Statement of Operations (unaudited) |
This statement describes how much your fund earned in investment income and accrued in expenses. It also describes any gains and/or losses generated by fund operations.
| Six months ended 6/30/21 | |
| Net investment income (loss) | |
| Income | |
| Dividends | $4,496,107 |
| Other | 22,306 |
| Dividends from affiliated issuers | 3,519 |
| Foreign taxes withheld | (19,166) |
| Total investment income | $4,502,766 |
| Expenses | |
| Management fee | $7,655,046 |
| Distribution and/or service fees | 648,852 |
| Shareholder servicing costs | 32,412 |
| Administrative services fee | 146,101 |
| Independent Trustees' compensation | 16,646 |
| Custodian fee | 50,110 |
| Shareholder communications | 48,442 |
| Audit and tax fees | 30,661 |
| Legal fees | 7,731 |
| Miscellaneous | 24,915 |
| Total expenses | $8,660,916 |
| Reduction of expenses by investment adviser | (131,564) |
| Net expenses | $8,529,352 |
| Net investment income (loss) | $(4,026,586) |
| Realized and unrealized gain (loss) | |
| Realized gain (loss) (identified cost basis) | |
| Unaffiliated issuers | $100,806,502 |
| Foreign currency | 443 |
| Net realized gain (loss) | $100,806,945 |
| Change in unrealized appreciation or depreciation | |
| Unaffiliated issuers | $176,125,151 |
| Translation of assets and liabilities in foreign currencies | (187) |
| Net unrealized gain (loss) | $176,124,964 |
| Net realized and unrealized gain (loss) | $276,931,909 |
| Change in net assets from operations | $272,905,323 |
See Notes to Financial Statements
| Financial Statements | Statements of Changes in Net Assets |
These statements describe the increases and/or decreases in net assets resulting from operations, any distributions, and any shareholder transactions.
| | Six months ended | Year ended |
| | 6/30/21
(unaudited) | 12/31/20 |
| Change in net assets | | |
| From operations | | |
| Net investment income (loss) | $(4,026,586) | $(5,258,847) |
| Net realized gain (loss) | 100,806,945 | 321,361,876 |
| Net unrealized gain (loss) | 176,124,964 | 234,350,980 |
| Change in net assets from operations | $272,905,323 | $550,454,009 |
| Total distributions to shareholders | $— | $(127,591,165) |
| Change in net assets from fund share transactions | $(141,624,408) | $(95,720,771) |
| Total change in net assets | $131,280,915 | $327,142,073 |
| Net assets | | |
| At beginning of period | 2,195,429,571 | 1,868,287,498 |
| At end of period | $2,326,710,486 | $2,195,429,571 |
See Notes to Financial Statements
| Financial Statements | Financial Highlights |
The financial highlights table is intended to help you understand the fund's financial performance for the semiannual period and the past 5 fiscal years. Certain information reflects financial results for a single fund share. The total returns in the table represent the rate that an investor would have earned (or lost) on an investment in the fund share class (assuming reinvestment of all distributions) held for the entire period.
| Initial Class | Six months
ended | Year ended |
| | 6/30/21
(unaudited) | 12/31/20 | 12/31/19 | 12/31/18 | 12/31/17 | 12/31/16 |
| Net asset value, beginning of period | $73.81 | $59.40 | $47.01 | $48.90 | $38.76 | $40.17 |
| Income (loss) from investment operations | | | | | | |
| Net investment income (loss) (d) | $(0.12) | $(0.14) | $(0.04) | $0.00(w) | $0.06 | $0.05(c) |
| Net realized and unrealized gain (loss) | 9.64 | 18.88 | 17.53 | 1.81 | 11.95 | 1.01 |
| Total from investment operations | $9.52 | $18.74 | $17.49 | $1.81 | $12.01 | $1.06 |
| Less distributions declared to shareholders | | | | | | |
| From net investment income | $— | $— | $— | $(0.05) | $(0.05) | $(0.02) |
| From net realized gain | — | (4.33) | (5.10) | (3.65) | (1.82) | (2.45) |
| Total distributions declared to shareholders | $— | $(4.33) | $(5.10) | $(3.70) | $(1.87) | $(2.47) |
| Net asset value, end of period (x) | $83.33 | $73.81 | $59.40 | $47.01 | $48.90 | $38.76 |
| Total return (%) (k)(r)(s)(x) | 12.90(n) | 31.86 | 38.15 | 2.67 | 31.40 | 2.44(c) |
Ratios (%) (to average net assets)
and Supplemental data: | | | | | | |
| Expenses before expense reductions (f) | 0.73(a) | 0.74 | 0.74 | 0.75 | 0.76 | 0.75(c) |
| Expenses after expense reductions (f) | 0.72(a) | 0.72 | 0.73 | 0.74 | 0.75 | 0.74(c) |
| Net investment income (loss) | (0.31)(a) | (0.21) | (0.06) | 0.00(w) | 0.13 | 0.12(c) |
| Portfolio turnover | 7(n) | 29 | 11 | 15 | 14 | 24 |
| Net assets at end of period (000 omitted) | $1,776,456 | $1,681,327 | $1,467,280 | $1,226,217 | $1,332,128 | $1,179,822 |
See Notes to Financial Statements
Financial Highlights - continued
| Service Class | Six months
ended | Year ended |
| | 6/30/21
(unaudited) | 12/31/20 | 12/31/19 | 12/31/18 | 12/31/17 | 12/31/16 |
| Net asset value, beginning of period | $70.23 | $56.82 | $45.26 | $47.27 | $37.57 | $39.09 |
| Income (loss) from investment operations | | | | | | |
| Net investment income (loss) (d) | $(0.20) | $(0.29) | $(0.17) | $(0.13) | $(0.05) | $(0.05)(c) |
| Net realized and unrealized gain (loss) | 9.17 | 18.03 | 16.83 | 1.77 | 11.57 | 0.98 |
| Total from investment operations | $8.97 | $17.74 | $16.66 | $1.64 | $11.52 | $0.93 |
| Less distributions declared to shareholders | | | | | | |
| From net investment income | $— | $— | $— | $— | $— | $— |
| From net realized gain | — | (4.33) | (5.10) | (3.65) | (1.82) | (2.45) |
| Total distributions declared to shareholders | $— | $(4.33) | $(5.10) | $(3.65) | $(1.82) | $(2.45) |
| Net asset value, end of period (x) | $79.20 | $70.23 | $56.82 | $45.26 | $47.27 | $37.57 |
| Total return (%) (k)(r)(s)(x) | 12.77(n) | 31.54 | 37.78 | 2.41 | 31.08 | 2.18(c) |
Ratios (%) (to average net assets)
and Supplemental data: | | | | | | |
| Expenses before expense reductions (f) | 0.98(a) | 0.99 | 0.99 | 1.00 | 1.01 | 1.00(c) |
| Expenses after expense reductions (f) | 0.97(a) | 0.97 | 0.98 | 0.99 | 1.00 | 0.99(c) |
| Net investment income (loss) | (0.56)(a) | (0.46) | (0.31) | (0.25) | (0.12) | (0.13)(c) |
| Portfolio turnover | 7(n) | 29 | 11 | 15 | 14 | 24 |
| Net assets at end of period (000 omitted) | $550,255 | $514,102 | $401,008 | $287,412 | $289,733 | $235,869 |
| (a) | Annualized. |
| (c) | Amount reflects a one-time reimbursement of expenses by the custodian (or former custodian) without which net investment income and performance would be lower and expenses would be higher. |
| (d) | Per share data is based on average shares outstanding. |
| (f) | Ratios do not reflect reductions from fees paid indirectly, if applicable. |
| (k) | The total return does not reflect expenses that apply to separate accounts. Inclusion of these charges would reduce the total return figures for all periods shown. |
| (n) | Not annualized. |
| (r) | Certain expenses have been reduced without which performance would have been lower. |
| (s) | From time to time the fund may receive proceeds from litigation settlements, without which performance would be lower. |
| (w) | Per share amount was less than $0.01 and total return or ratio was less than 0.01%, as applicable. |
| (x) | The net asset values and total returns have been calculated on net assets which include adjustments made in accordance with U.S. generally accepted accounting principles required at period end for financial reporting purposes. |
See Notes to Financial Statements
Notes to Financial Statements (unaudited)
(1) Business and Organization
MFS Growth Series (the fund) is a diversified series of MFS Variable Insurance Trust (the trust). The trust is organized as a Massachusetts business trust and is registered under the Investment Company Act of 1940, as amended, as an open-end management investment company. The shareholders of each series of the trust are separate accounts of insurance companies, which offer variable annuity and/or life insurance products, and qualified retirement and pension plans.
The fund is an investment company and accordingly follows the investment company accounting and reporting guidance of the Financial Accounting Standards Board (FASB) Accounting Standards Codification Topic 946 Financial Services - Investment Companies.
(2) Significant Accounting Policies
General — The preparation of financial statements in conformity with U.S. generally accepted accounting principles requires management to make estimates and assumptions that affect the reported amounts of assets and liabilities, and disclosure of contingent assets and liabilities at the date of the financial statements and the reported amounts of increases and decreases in net assets from operations during the reporting period. Actual results could differ from those estimates. In the preparation of these financial statements, management has evaluated subsequent events occurring after the date of the fund’s Statement of Assets and Liabilities through the date that the financial statements were issued.
Certain of the fund's investments, derivatives, debt and other contracts may be based on reference interest rates such as the London Interbank Offered Rate (“LIBOR”). In 2017, the regulatory authority that oversees financial services firms in the United Kingdom announced plans to transition away from LIBOR by the end of 2021. In March 2021, the administrator of LIBOR announced the extension of the publication of the more commonly used U.S. dollar LIBOR settings to the end of June 2023. Although the full impacts of the transition away from LIBOR are not fully known, the transition may result in, among other things, an increase in volatility or illiquidity of the markets for instruments that currently rely on LIBOR to determine interest rates and this could have an adverse impact on the fund's performance. With respect to the fund's accounting for investments, derivatives, debt and other contracts that undergo reference rate-related modifications as a result of the transition, management will rely upon the relief provided by FASB Codification Topic 848 – Reference Rate Reform (Topic 848). The guidance in Topic 848 permits the fund to disregard the GAAP accounting requirements around certain contract modifications resulting from the LIBOR transition such that for contracts considered in scope, the fund can account for those modified contracts as a continuation of the existing contracts.
Balance Sheet Offsetting — The fund's accounting policy with respect to balance sheet offsetting is that, absent an event of default by the counterparty or a termination of the agreement, the International Swaps and Derivatives Association (ISDA) Master Agreement, or similar agreement, does not result in an offset of reported amounts of financial assets and financial liabilities in the Statement of Assets and Liabilities across transactions between the fund and the applicable counterparty. The fund's right to setoff may be restricted or prohibited by the bankruptcy or insolvency laws of the particular jurisdiction to which a specific master netting agreement counterparty is subject. Balance sheet offsetting disclosures, to the extent applicable to the fund, have been included in the fund’s Significant Accounting Policies note under the captions for each of the fund’s in-scope financial instruments and transactions.
Investment Valuations — Equity securities, including restricted equity securities, are generally valued at the last sale or official closing price on their primary market or exchange as provided by a third-party pricing service. Equity securities, for which there were no sales reported that day, are generally valued at the last quoted daily bid quotation on their primary market or exchange as provided by a third-party pricing service. Short-term instruments with a maturity at issuance of 60 days or less may be valued at amortized cost, which approximates market value. Open-end investment companies are generally valued at net asset value per share.
Securities and other assets generally valued on the basis of information from a third-party pricing service may also be valued at a broker/dealer bid quotation. In determining values, third-party pricing services can utilize both transaction data and market information such as yield, quality, coupon rate, maturity, type of issue, trading characteristics, and other market data. The values of foreign securities and other assets and liabilities expressed in foreign currencies are converted to U.S. dollars using the mean of bid and asked prices for rates provided by a third-party pricing service.
The Board of Trustees has delegated primary responsibility for determining or causing to be determined the value of the fund’s investments (including any fair valuation) to the adviser pursuant to valuation policies and procedures approved by the Board. If the adviser determines that reliable market quotations are not readily available, investments are valued at fair value as determined in good faith by the adviser in accordance with such procedures under the oversight of the Board of Trustees. Under the fund’s valuation policies and procedures, market quotations are not considered to be readily available for most types of debt instruments and floating rate loans and many types of derivatives. These investments are generally valued at fair value based on information from third-party pricing services. In addition, investments may be valued at fair value if the adviser determines that an investment’s value has been materially affected by events occurring after the close of the exchange or market on which the investment is principally
Notes to Financial Statements (unaudited) - continued
traded (such as foreign exchange or market) and prior to the determination of the fund’s net asset value, or after the halt of trading of a specific security where trading does not resume prior to the close of the exchange or market on which the security is principally traded. Events that occur after foreign markets close (such as developments in foreign markets and significant movements in the U.S. markets) and prior to the determination of the fund’s net asset value may be deemed to have a material effect on the value of securities traded in foreign markets. Accordingly, the fund’s foreign equity securities may often be valued at fair value. The adviser generally relies on third-party pricing services or other information (such as the correlation with price movements of similar securities in the same or other markets; the type, cost and investment characteristics of the security; the business and financial condition of the issuer; and trading and other market data) to assist in determining whether to fair value and at what value to fair value an investment. The value of an investment for purposes of calculating the fund’s net asset value can differ depending on the source and method used to determine value. When fair valuation is used, the value of an investment used to determine the fund’s net asset value may differ from quoted or published prices for the same investment. There can be no assurance that the fund could obtain the fair value assigned to an investment if it were to sell the investment at the same time at which the fund determines its net asset value per share.
Various inputs are used in determining the value of the fund's assets or liabilities. These inputs are categorized into three broad levels. In certain cases, the inputs used to measure fair value may fall into different levels of the fair value hierarchy. In such cases, an investment's level within the fair value hierarchy is based on the lowest level of input that is significant to the fair value measurement. The fund's assessment of the significance of a particular input to the fair value measurement in its entirety requires judgment, and considers factors specific to the investment. Level 1 includes unadjusted quoted prices in active markets for identical assets or liabilities. Level 2 includes other significant observable market-based inputs (including quoted prices for similar securities, interest rates, prepayment speed, and credit risk). Level 3 includes unobservable inputs, which may include the adviser's own assumptions in determining the fair value of investments. The following is a summary of the levels used as of June 30, 2021 in valuing the fund's assets or liabilities:
| Financial Instruments | Level 1 | Level 2 | Level 3 | Total |
| Equity Securities | $2,305,044,659 | $— | $— | $2,305,044,659 |
| Mutual Funds | 202 | — | — | 202 |
| Total | $2,305,044,861 | $— | $— | $2,305,044,861 |
For further information regarding security characteristics, see the Portfolio of Investments.
Foreign Currency Translation — Purchases and sales of foreign investments, income, and expenses are converted into U.S. dollars based upon currency exchange rates prevailing on the respective dates of such transactions or on the reporting date for foreign denominated receivables and payables. Gains and losses attributable to foreign currency exchange rates on sales of securities are recorded for financial statement purposes as net realized gains and losses on investments. Gains and losses attributable to foreign exchange rate movements on receivables, payables, income and expenses are recorded for financial statement purposes as foreign currency transaction gains and losses. That portion of both realized and unrealized gains and losses on investments that results from fluctuations in foreign currency exchange rates is not separately disclosed.
Indemnifications — Under the fund's organizational documents, its officers and Trustees may be indemnified against certain liabilities and expenses arising out of the performance of their duties to the fund. Additionally, in the normal course of business, the fund enters into agreements with service providers that may contain indemnification clauses. The fund's maximum exposure under these agreements is unknown as this would involve future claims that may be made against the fund that have not yet occurred.
Investment Transactions and Income — Investment transactions are recorded on the trade date. Interest income is recorded on the accrual basis. Dividends received in cash are recorded on the ex-dividend date. Certain dividends from foreign securities will be recorded when the fund is informed of the dividend if such information is obtained subsequent to the ex-dividend date. Dividend payments received in additional securities are recorded on the ex-dividend date in an amount equal to the value of the security on such date.
The fund may receive proceeds from litigation settlements. Any proceeds received from litigation involving portfolio holdings are reflected in the Statement of Operations in realized gain/loss if the security has been disposed of by the fund or in unrealized gain/loss if the security is still held by the fund. Any other proceeds from litigation not related to portfolio holdings are reflected as other income in the Statement of Operations.
Tax Matters and Distributions — The fund intends to qualify as a regulated investment company, as defined under Subchapter M of the Internal Revenue Code, and to distribute all of its taxable income, including realized capital gains. As a result, no provision for federal income tax is required. The fund’s federal tax returns, when filed, will remain subject to examination by the Internal Revenue Service for a three year period. Management has analyzed the fund’s tax positions taken on federal and state tax returns for all open tax years and does not believe that there are any uncertain tax positions that require recognition of a tax liability. Foreign taxes, if any,
Notes to Financial Statements (unaudited) - continued
have been accrued by the fund in the accompanying financial statements in accordance with the applicable foreign tax law. Foreign income taxes may be withheld by certain countries in which the fund invests. Additionally, capital gains realized by the fund on securities issued in or by certain foreign countries may be subject to capital gains tax imposed by those countries.
Distributions to shareholders are recorded on the ex-dividend date. Income and capital gain distributions are determined in accordance with income tax regulations, which may differ from U.S. generally accepted accounting principles. Certain capital accounts in the financial statements are periodically adjusted for permanent differences in order to reflect their tax character. These adjustments have no impact on net assets or net asset value per share. Temporary differences which arise from recognizing certain items of income, expense, gain or loss in different periods for financial statement and tax purposes will reverse at some time in the future.
Book/tax differences primarily relate to wash sale loss deferrals.
The tax character of distributions declared to shareholders for the last fiscal year is as follows:
| | Year ended
12/31/20 |
| Long-term capital gains | $127,591,165 |
The federal tax cost and the tax basis components of distributable earnings were as follows:
| As of 6/30/21 | |
| Cost of investments | $768,479,803 |
| Gross appreciation | 1,542,851,724 |
| Gross depreciation | (6,286,666) |
| Net unrealized appreciation (depreciation) | $1,536,565,058 |
| As of 12/31/20 | |
| Undistributed ordinary income | 1,658,165 |
| Undistributed long-term capital gain | 315,481,466 |
| Other temporary differences | 63 |
| Net unrealized appreciation (depreciation) | 1,360,439,907 |
The aggregate cost above includes prior fiscal year end tax adjustments, if applicable.
Multiple Classes of Shares of Beneficial Interest — The fund offers multiple classes of shares, which differ in their respective distribution and/or service fees. The fund's income, realized and unrealized gain (loss), and common expenses are allocated to shareholders based on the daily net assets of each class. Dividends are declared separately for each class. Differences in per share dividend rates are generally due to differences in separate class expenses. The fund’s distributions declared to shareholders as reported in the Statements of Changes in Net Assets are presented by class as follows:
| | Six months
ended
6/30/21 | | Year
ended
12/31/20 |
| Initial Class | $— | | $97,613,169 |
| Service Class | — | | 29,977,996 |
| Total | $— | | $127,591,165 |
(3) Transactions with Affiliates
Investment Adviser — The fund has an investment advisory agreement with MFS to provide overall investment management and related administrative services and facilities to the fund. The management fee is computed daily and paid monthly at the following annual rates based on the fund's average daily net assets:
| Up to $1 billion | 0.75% |
| In excess of $1 billion | 0.65% |
MFS has agreed in writing to reduce its management fee by a specified amount if certain MFS mutual fund assets exceed thresholds agreed to by MFS and the fund's Board of Trustees. For the six months ended June 30, 2021, this management fee reduction amounted to $131,564, which is included in the reduction of total expenses in the Statement of Operations. The management fee incurred for the six months ended June 30, 2021 was equivalent to an annual effective rate of 0.68% of the fund's average daily net assets.
Notes to Financial Statements (unaudited) - continued
Distributor — MFS Fund Distributors, Inc. (MFD), a wholly-owned subsidiary of MFS, is the distributor of shares of the fund. The Trustees have adopted a distribution plan for the Service Class shares pursuant to Rule 12b-1 under the Investment Company Act of 1940.
The fund's distribution plan provides that the fund will pay MFD distribution and/or service fees equal to 0.25% per annum of its average daily net assets attributable to Service Class shares as partial consideration for services performed and expenses incurred by MFD and financial intermediaries (including participating insurance companies that invest in the fund to fund variable annuity and variable life insurance contracts, sponsors of qualified retirement and pension plans that invest in the fund, and affiliates of these participating insurance companies and plan sponsors) in connection with the sale and distribution of the Service Class shares. MFD may subsequently pay all, or a portion, of the distribution and/or service fees to financial intermediaries.
Shareholder Servicing Agent — MFS Service Center, Inc. (MFSC), a wholly-owned subsidiary of MFS, receives a fee from the fund for its services as shareholder servicing agent. For the six months ended June 30, 2021, the fee was $31,011, which equated to 0.0028% annually of the fund's average daily net assets. MFSC also receives reimbursement from the fund for out-of-pocket expenses paid by MFSC on behalf of the fund. For the six months ended June 30, 2021, these costs amounted to $1,401.
Administrator — MFS provides certain financial, legal, shareholder communications, compliance, and other administrative services to the fund. Under an administrative services agreement, the fund reimburses MFS the costs incurred to provide these services. The fund is charged an annual fixed amount of $17,500 plus a fee based on average daily net assets. The administrative services fee incurred for the six months ended June 30, 2021 was equivalent to an annual effective rate of 0.0133% of the fund's average daily net assets.
Trustees’ and Officers’ Compensation — The fund pays compensation to independent Trustees in the form of a retainer, attendance fees, and additional compensation to Board and Committee chairpersons. The fund does not pay compensation directly to Trustees or officers of the fund who are also officers of the investment adviser, all of whom receive remuneration from MFS for their services to the fund. Certain officers and Trustees of the fund are officers or directors of MFS, MFD, and MFSC.
Other — The fund invests in the MFS Institutional Money Market Portfolio which is managed by MFS and seeks current income consistent with preservation of capital and liquidity. This money market fund does not pay a management fee to MFS but does incur investment and operating costs.
The fund is permitted to engage in purchase and sale transactions with funds and accounts for which MFS serves as investment adviser or sub-adviser (“cross-trades”) pursuant to a policy adopted by the Board of Trustees. This policy has been designed to ensure that cross-trades conducted by the fund comply with Rule 17a-7 under the Investment Company Act of 1940. During the six months ended June 30, 2021, the fund engaged in purchase transactions pursuant to this policy, which amounted to $50,656.
The adviser has voluntarily undertaken to reimburse the fund from its own resources on a quarterly basis for the cost of investment research embedded in the cost of the fund’s securities trades. This agreement may be rescinded at any time. For the six months ended June 30, 2021, this reimbursement amounted to $22,051, which is included in “Other” income in the Statement of Operations.
(4) Portfolio Securities
For the six months ended June 30, 2021, purchases and sales of investments, other than short-term obligations, aggregated $162,292,087 and $315,400,310, respectively.
(5) Shares of Beneficial Interest
The fund's Declaration of Trust permits the Trustees to issue an unlimited number of full and fractional shares of beneficial interest. Transactions in fund shares were as follows:
| | Six months ended
6/30/21 | | Year ended
12/31/20 |
| | Shares | Amount | | Shares | Amount |
| Shares sold | | | | | |
| Initial Class | 623,940 | $46,751,381 | | 1,476,731 | $92,793,470 |
| Service Class | 475,426 | 34,067,226 | | 1,452,278 | 89,443,781 |
| | 1,099,366 | $80,818,607 | | 2,929,009 | $182,237,251 |
Notes to Financial Statements (unaudited) - continued
| | Six months ended
6/30/21 | | Year ended
12/31/20 |
| | Shares | Amount | | Shares | Amount |
Shares issued to shareholders
in reinvestment of distributions | | | | | |
| Initial Class | — | $— | | 1,364,516 | $96,648,663 |
| Service Class | — | — | | 444,382 | 29,977,996 |
| | — | $— | | 1,808,898 | $126,626,659 |
| Shares reacquired | | | | | |
| Initial Class | (2,085,335) | $(160,570,194) | | (4,764,482) | $(305,550,308) |
| Service Class | (847,326) | (61,872,821) | | (1,633,664) | (99,034,373) |
| | (2,932,661) | $(222,443,015) | | (6,398,146) | $(404,584,681) |
| Net change | | | | | |
| Initial Class | (1,461,395) | $(113,818,813) | | (1,923,235) | $(116,108,175) |
| Service Class | (371,900) | (27,805,595) | | 262,996 | 20,387,404 |
| | (1,833,295) | $(141,624,408) | | (1,660,239) | $(95,720,771) |
The fund is one of several mutual funds in which certain MFS funds may invest. The MFS funds do not invest in the underlying funds for the purpose of exercising management or control. At the end of the period, the MFS Moderate Allocation Portfolio, the MFS Growth Allocation Portfolio, and the MFS Conservative Allocation Portfolio were the owners of record of approximately 6%, 2%, and 1%, respectively, of the value of outstanding voting shares of the fund.
(6) Line of Credit
The fund and certain other funds managed by MFS participate in a $1.25 billion unsecured committed line of credit of which $1 billion is reserved for use by the fund and certain other MFS U.S. funds. The line of credit is provided by a syndicate of banks under a credit agreement. Borrowings may be made for temporary financing needs. Interest is charged to each fund, based on its borrowings, generally at a rate equal to the highest of one month LIBOR, the Federal Funds Effective Rate and the Overnight Bank Funding Rate, plus an agreed upon spread. A commitment fee, based on the average daily, unused portion of the committed line of credit, is allocated among the participating funds. In addition, the fund and other funds managed by MFS have established unsecured uncommitted borrowing arrangements with certain banks for temporary financing needs. Interest is charged to each fund, based on its borrowings, at rates equal to customary reference rates plus an agreed upon spread. For the six months ended June 30, 2021, the fund’s commitment fee and interest expense were $4,518 and $0, respectively, and are included in “Miscellaneous” expense in the Statement of Operations.
(7) Investments in Affiliated Issuers
An affiliated issuer may be considered one in which the fund owns 5% or more of the outstanding voting securities, or a company which is under common control. For the purposes of this report, the following were affiliated issuers:
| Affiliated Issuers | Beginning
Value | Purchases | Sales
Proceeds | Realized
Gain
(Loss) | Change in
Unrealized
Appreciation or
Depreciation | Ending
Value |
| MFS Institutional Money Market Portfolio | $18,169,621 | $153,313,864 | $171,483,283 | $— | $— | $202 |
| Affiliated Issuers | Dividend
Income | Capital Gain
Distributions |
| MFS Institutional Money Market Portfolio | $3,519 | $— |
(8) Impacts of COVID-19
The pandemic related to the global spread of novel coronavirus disease (COVID-19), which was first detected in December 2019, has resulted in significant disruptions to global business activity and the global economy, as well as the economies of individual countries, the financial performance of individual companies and sectors, and the securities and commodities markets in general. Multiple
Notes to Financial Statements (unaudited) - continued
surges in cases globally, the availability and widespread adoption of vaccines, and the emergence of variant strains of the virus continue to create uncertainty as to the future and long-term impacts resulting from the pandemic including impacts to the prices and liquidity of the fund's investments and the fund's performance.
Statement Regarding Liquidity Risk Management Program
The fund has adopted and implemented a liquidity risk management program (the “Program”) as required by Rule 22e-4 under the Investment Company Act of 1940, as amended. The fund’s Board of Trustees (the “Board”) has designated MFS as the administrator of the Program. The Program is reasonably designed to assess and manage the liquidity risk of the fund. Liquidity risk is the risk that the fund could not meet requests to redeem shares issued by the fund without significant dilution of remaining investors' interests.
MFS provided a written report to the Board for consideration at its April 2021 meeting that addressed the operation of the Program and provided an assessment of the adequacy and effectiveness of the Program during the period from January 1, 2020 to December 31, 2020 (the “Covered Period”). The report concluded that during the Covered Period the Program had operated effectively and had adequately and effectively been implemented to assess and manage the fund’s liquidity risk. MFS also reported that there were no liquidity events that impacted the fund or its ability to timely meet redemptions without dilution to existing shareholders during the Covered Period.
There can be no assurance that the Program will achieve its objectives in the future. Further information on liquidity risk, and other principal risks to which an investment in the fund may be subject, can be found in the prospectus.
Proxy Voting Policies and Information
MFS votes proxies on behalf of the fund pursuant to proxy voting policies and procedures that are available without charge, upon request, by calling 1-800-225-2606, by visiting mfs.com/proxyvoting, or by visiting the SEC’s Web site at http://www.sec.gov.
Information regarding how the fund voted proxies relating to portfolio securities during the most recent twelve-month period ended June 30 is available by August 31 of each year without charge by visiting mfs.com/proxyvoting, or by visiting the SEC’s Web site at http://www.sec.gov.
Quarterly Portfolio Disclosure
The fund files a complete schedule of portfolio holdings with the SEC for the first and third quarters of each fiscal year as an exhibit to its reports on Form N-PORT. The fund’s Form N-PORT reports are available on the SEC’s Web site at http://www.sec.gov. A shareholder can obtain the portfolio holdings report for the first and third quarters of the fund's fiscal year at mfs.com/vit1 by choosing the fund's name and then scrolling to the “Resources” section and clicking on the “Prospectus and Reports” tab.
FURTHER INFORMATION
From time to time, MFS may post important information about the fund or the MFS Funds on the MFS Web site (mfs.com). This information is available at https://www.mfs.com/announcements or at mfs.com/vit1 by choosing the fund's name and then scrolling to the “Resources” section and clicking on the “Announcements” tab, if any.
Information About Fund Contracts and Legal Claims
The fund has entered into contractual arrangements with an investment adviser, administrator, distributor, shareholder servicing agent, 529 program manager (if applicable), and custodian who each provide services to the fund. Unless expressly stated otherwise, shareholders are not parties to, or intended beneficiaries of these contractual arrangements, and these contractual arrangements are not intended to create any shareholder right to enforce them against the service providers or to seek any remedy under them against the service providers, either directly or on behalf of the fund.
Under the Trust’s By-Laws and Declaration of Trust, any claims asserted against or on behalf of the MFS Funds, including claims against Trustees and Officers, must be brought in state and federal courts located within the Commonwealth of Massachusetts.
Semiannual Report
June 30, 2021
MFS® Investors Trust Series
MFS® Variable Insurance Trust
MFS® Investors Trust Series
The report is prepared for the general information of contract owners. It is authorized for distribution to prospective investors only when preceded or accompanied by a current prospectus.
NOT FDIC INSURED • MAY LOSE VALUE • NO BANK OR CREDIT UNION GUARANTEE •
NOT A DEPOSIT • NOT INSURED BY ANY FEDERAL GOVERNMENT AGENCY OR NCUA/NCUSIF
MFS Investors Trust Series
Dear Contract Owners:
After experiencing dramatic swings in the early days of the coronavirus pandemic, global equity markets have performed strongly over the past year. Though the speedy development of vaccines brightened the economic and market outlook, uncertainty remains as new variants of the virus appear, and questions persist over how fast vaccines can be made widely available in the developing world.
Global central banks have taken aggressive steps to cushion the economic and market fallout related to the virus, and governments are deploying unprecedented levels of fiscal support. Having passed a $1.9 trillion stimulus package in March, the U.S. Congress could approve additional stimulus later this year, some of it focused on infrastructure. Along with extraordinary government expenditures, pent-up consumer demand fueled a surge in economic activity as coronavirus restrictions were eased, pushing up inflation, at least temporarily. Markets initially reacted by pushing up yields on global government bonds, though some of the rate rise has since been corrected.
A spirited debate is underway among investors over whether the current price pressures will persist or prove to be temporary, caused by pandemic-induced bottlenecks. The policy measures put in place to counteract the pandemic's effects have helped build a supportive environment and are encouraging economic recovery; however, if markets disconnect from fundamentals, they can sow the seeds of instability. As such, recent dramatic increases in speculative trading in cryptocurrencies, special purpose acquisition companies (SPACs), and the like bear watching.
In the aftermath of the crisis, we could see societal changes as households, businesses, and governments adjust to a new reality, and any such alterations could affect the investment landscape. For investors, events such as the COVID-19 outbreak demonstrate the importance of having a deep understanding of company fundamentals, and we have built our global research platform to do just that.
At MFS®, we put our clients’ assets to work responsibly by carefully navigating the increasing complexity of global markets and economies. Guided by our long-term philosophy and adhering to our commitment to sustainable investing, we tune out the noise and aim to uncover what we believe are the best, most durable investment opportunities in the market. Our unique global investment platform combines collective expertise, long-term discipline, and thoughtful risk management to create sustainable value for investors.
Respectfully,
Michael W. Roberge
Chief Executive Officer
MFS Investment Management
August 13, 2021
The opinions expressed in this letter are subject to change and may not be relied upon for investment advice. No forecasts can be guaranteed.
MFS Investors Trust Series
Top ten holdings
| Microsoft Corp. | 5.3% |
| Alphabet, Inc., “A” | 4.9% |
| JPMorgan Chase & Co. | 2.6% |
| Bank of America Corp. | 2.4% |
| Apple, Inc. | 2.3% |
| Visa, Inc., “A” | 2.2% |
| Facebook, Inc., “A” | 2.2% |
| Johnson & Johnson | 2.1% |
| American Tower Corp., REIT | 2.1% |
| Honeywell International, Inc. | 1.9% |
GICS equity sectors (g)
| Information Technology | 23.8% |
| Health Care | 17.4% |
| Communication Services | 12.8% |
| Financial Services | 12.0% |
| Consumer Discretionary | 8.7% |
| Consumer Staples | 7.7% |
| Industrials | 7.7% |
| Real Estate | 3.7% |
| Materials | 3.7% |
| Energy | 1.1% |
| Utilities | 0.6% |
| (g) | The Global Industry Classification Standard (GICS®) was developed by and/or is the exclusive property of MSCI, Inc. and S&P Global Market Intelligence Inc. (“S&P Global Market Intelligence”). GICS is a service mark of MSCI and S&P Global Market Intelligence and has been licensed for use by MFS. MFS has applied its own internal sector/industry classification methodology for equity securities and non-equity securities that are unclassified by GICS. |
Cash & Cash Equivalents includes any cash, investments in money market funds, short-term securities, and other assets less liabilities. Please see the Statement of Assets and Liabilities for additional information related to the fund’s cash position and other assets and liabilities.
Percentages are based on net assets as of June 30, 2021.
The portfolio is actively managed and current holdings may be different.
MFS Investors Trust Series
Expense Table
Fund Expenses Borne by the Contract Holders during the Period,
January 1, 2021 through June 30, 2021
As a contract holder of the fund, you incur ongoing costs, including management fees; distribution and/or service (12b-1) fees; and other fund expenses. This example is intended to help you understand your ongoing costs (in dollars) of investing in the fund and to compare these costs with the ongoing costs of investing in other mutual funds.
The example is based on an investment of $1,000 invested at the beginning of the period and held for the entire period January 1, 2021 through June 30, 2021.
Actual Expenses
The first line for each share class in the following table provides information about actual account values and actual expenses. You may use the information in this line, together with the amount you invested, to estimate the expenses that you paid over the period. Simply divide your account value by $1,000 (for example, an $8,600 account value divided by $1,000 = 8.6), then multiply the result by the number in the first line under the heading entitled “Expenses Paid During Period” to estimate the expenses you paid on your account during this period.
Hypothetical Example for Comparison Purposes
The second line for each share class in the following table provides information about hypothetical account values and hypothetical expenses based on the fund’s actual expense ratio and an assumed rate of return of 5% per year before expenses, which is not the fund’s actual return. The hypothetical account values and expenses may not be used to estimate the actual ending account balance or expenses you paid for the period. You may use this information to compare the ongoing costs of investing in the fund and other funds. To do so, compare this 5% hypothetical example with the 5% hypothetical examples that appear in the shareholder reports of the other funds.
Please note that the expenses shown in the table are meant to highlight the fund's ongoing costs only and do not take into account the fees and expenses imposed under the variable contracts through which your investment in the fund is made. Therefore, the second line for each share class in the table is useful in comparing ongoing costs associated with an investment in vehicles (such as the fund) which fund benefits under variable annuity and variable life insurance contracts and to qualified pension and retirement plans only, and will not help you determine the relative total costs of investing in the fund through variable annuity and variable life insurance contracts. If the fees and expenses imposed under the variable contracts were included, your costs would have been higher.
Share
Class | | Annualized
Expense
Ratio | Beginning
Account Value
1/01/21 | Ending
Account Value
6/30/21 | Expenses
Paid During
Period (p)
1/01/21-6/30/21 |
| Initial Class | Actual | 0.79% | $1,000.00 | $1,159.97 | $4.23 |
| Hypothetical (h) | 0.79% | $1,000.00 | $1,020.88 | $3.96 |
| Service Class | Actual | 1.03% | $1,000.00 | $1,158.66 | $5.51 |
| Hypothetical (h) | 1.03% | $1,000.00 | $1,019.69 | $5.16 |
| (h) | 5% class return per year before expenses. |
| (p) | “Expenses Paid During Period” are equal to each class's annualized expense ratio, as shown above, multiplied by the average account value over the period, multiplied by 181/365 (to reflect the one-half year period). |
MFS Investors Trust Series
Portfolio of Investments − 6/30/21 (unaudited)
The Portfolio of Investments is a complete list of all securities owned by your fund. It is categorized by broad-based asset classes.
| Issuer | | | Shares/Par | Value ($) |
| Common Stocks – 99.2% |
| Aerospace & Defense – 3.0% | |
| Honeywell International, Inc. | | 72,280 | $ 15,854,618 |
| Howmet Aerospace, Inc. (a) | | 69,037 | 2,379,705 |
| Raytheon Technologies Corp. | | 76,571 | 6,532,272 |
| | | | | $24,766,595 |
| Alcoholic Beverages – 2.5% | |
| Diageo PLC | | 220,681 | $ 10,565,326 |
| Pernod Ricard S.A. | | 42,832 | 9,507,523 |
| | | | | $20,072,849 |
| Apparel Manufacturers – 2.4% | |
| LVMH Moet Hennessy Louis Vuitton SE | | 15,346 | $ 12,033,359 |
| NIKE, Inc., “B” | | 50,930 | 7,868,176 |
| | | | | $19,901,535 |
| Biotechnology – 1.9% | |
| Illumina, Inc. (a) | | 14,333 | $ 6,782,519 |
| Vertex Pharmaceuticals, Inc. (a) | | 44,806 | 9,034,234 |
| | | | | $15,816,753 |
| Brokerage & Asset Managers – 3.2% | |
| Blackstone Group, Inc. | | 71,801 | $ 6,974,749 |
| Charles Schwab Corp. | | 87,306 | 6,356,750 |
| NASDAQ, Inc. | | 73,737 | 12,962,965 |
| | | | | $26,294,464 |
| Business Services – 4.7% | |
| Accenture PLC, “A” | | 32,311 | $ 9,524,959 |
| Amdocs Ltd. | | 116,836 | 9,038,433 |
| Fidelity National Information Services, Inc. | | 97,549 | 13,819,767 |
| Fiserv, Inc. (a) | | 56,402 | 6,028,810 |
| | | | | $38,411,969 |
| Cable TV – 2.4% | |
| Cable One, Inc. | | 2,408 | $ 4,606,047 |
| Comcast Corp., “A” | | 266,708 | 15,207,690 |
| | | | | $19,813,737 |
| Chemicals – 0.7% | |
| PPG Industries, Inc. | | 31,951 | $ 5,424,321 |
| Computer Software – 8.3% | |
| Adobe Systems, Inc. (a) | | 24,847 | $ 14,551,397 |
| Microsoft Corp. | | 160,424 | 43,458,862 |
| salesforce.com, inc. (a) | | 40,716 | 9,945,697 |
| | | | | $67,955,956 |
| Computer Software - Systems – 2.3% | |
| Apple, Inc. | | 136,039 | $ 18,631,902 |
| Construction – 1.6% | |
| Masco Corp. | | 76,383 | $ 4,499,723 |
| Sherwin-Williams Co. | | 30,890 | 8,415,980 |
| | | | | $12,915,703 |
| Issuer | | | Shares/Par | Value ($) |
| Common Stocks – continued |
| Consumer Products – 2.4% | |
| Colgate-Palmolive Co. | | 97,561 | $ 7,936,587 |
| Estee Lauder Cos., Inc., “A” | | 15,390 | 4,895,251 |
| Kimberly-Clark Corp. | | 48,071 | 6,430,939 |
| | | | | $19,262,777 |
| Containers – 1.2% | |
| Crown Holdings, Inc. | | 95,541 | $ 9,765,246 |
| Electrical Equipment – 3.6% | |
| AMETEK, Inc. | | 55,621 | $ 7,425,404 |
| Fortive Corp. | | 90,006 | 6,277,018 |
| Johnson Controls International PLC | | 108,149 | 7,422,266 |
| TE Connectivity Ltd. | | 59,483 | 8,042,696 |
| | | | | $29,167,384 |
| Electronics – 3.4% | |
| Analog Devices, Inc. | | 51,792 | $ 8,916,511 |
| Applied Materials, Inc. | | 36,931 | 5,258,974 |
| Texas Instruments, Inc. | | 72,281 | 13,899,636 |
| | | | | $28,075,121 |
| Energy - Independent – 0.8% | |
| ConocoPhillips | | 111,556 | $ 6,793,760 |
| Food & Beverages – 1.8% | |
| Danone S.A. | | 125,477 | $ 8,833,328 |
| Mondelez International, Inc. | | 93,717 | 5,851,690 |
| | | | | $14,685,018 |
| Forest & Paper Products – 0.3% | |
| Rayonier, Inc., REIT | | 63,898 | $ 2,295,855 |
| General Merchandise – 1.1% | |
| Dollar General Corp. | | 41,915 | $ 9,069,987 |
| Health Maintenance Organizations – 0.9% | |
| Cigna Corp. | | 29,401 | $ 6,970,095 |
| Insurance – 0.9% | |
| Chubb Ltd. | | 46,227 | $ 7,347,319 |
| Internet – 8.8% | |
| Alphabet, Inc., “A” (a) | | 16,378 | $ 39,991,637 |
| Alphabet, Inc., “C” (a) | | 5,711 | 14,313,593 |
| Facebook, Inc., “A” (a) | | 51,352 | 17,855,604 |
| | | | | $72,160,834 |
| Leisure & Toys – 1.5% | |
| Electronic Arts, Inc. | | 84,945 | $ 12,217,639 |
| Major Banks – 6.8% | |
| Bank of America Corp. | | 478,514 | $ 19,729,132 |
| Goldman Sachs Group, Inc. | | 37,696 | 14,306,763 |
| JPMorgan Chase & Co. | | 138,340 | 21,517,404 |
| | | | | $55,553,299 |
MFS Investors Trust Series
Portfolio of Investments (unaudited) – continued
| Issuer | | | Shares/Par | Value ($) |
| Common Stocks – continued |
| Medical & Health Technology & Services – 2.0% | |
| ICON PLC (a) | | 21,605 | $ 4,465,970 |
| PRA Health Sciences, Inc. (a) | | 70,329 | 11,619,054 |
| | | | | $16,085,024 |
| Medical Equipment – 6.8% | |
| Becton, Dickinson and Co. | | 53,559 | $ 13,025,013 |
| Danaher Corp. | | 44,211 | 11,864,464 |
| Medtronic PLC | | 126,380 | 15,687,550 |
| Thermo Fisher Scientific, Inc. | | 29,477 | 14,870,262 |
| | | | | $55,447,289 |
| Natural Gas - Pipeline – 0.3% | |
| Enterprise Products Partners LP | | 98,946 | $ 2,387,567 |
| Network & Telecom – 1.3% | |
| Equinix, Inc., REIT | | 13,377 | $ 10,736,380 |
| Other Banks & Diversified Financials – 5.2% | |
| Mastercard, Inc., “A” | | 41,861 | $ 15,283,032 |
| Truist Financial Corp. | | 163,069 | 9,050,330 |
| Visa, Inc., “A” | | 77,346 | 18,085,042 |
| | | | | $42,418,404 |
| Pharmaceuticals – 5.9% | |
| Eli Lilly & Co. | | 48,673 | $ 11,171,427 |
| Johnson & Johnson | | 105,081 | 17,311,044 |
| Merck & Co., Inc. | | 147,615 | 11,480,019 |
| Zoetis, Inc. | | 41,740 | 7,778,666 |
| | | | | $47,741,156 |
| Railroad & Shipping – 1.3% | |
| Canadian National Railway Co. | | 96,596 | $ 10,192,810 |
| Restaurants – 0.7% | |
| Starbucks Corp. | | 50,090 | $ 5,600,563 |
| Issuer | | | Shares/Par | Value ($) |
| Common Stocks – continued |
| Specialty Chemicals – 0.8% | |
| DuPont de Nemours, Inc. | | 83,839 | $ 6,489,977 |
| Specialty Stores – 5.6% | |
| Costco Wholesale Corp. | | 21,954 | $ 8,686,539 |
| Home Depot, Inc. | | 37,859 | 12,072,857 |
| Target Corp. | | 59,556 | 14,397,067 |
| Tractor Supply Co. | | 54,569 | 10,153,108 |
| | | | | $45,309,571 |
| Telecommunications - Wireless – 2.1% | |
| American Tower Corp., REIT | | 63,607 | $ 17,182,795 |
| Trucking – 0.2% | |
| Old Dominion Freight Line, Inc. | | 7,953 | $ 2,018,471 |
| Utilities - Electric Power – 0.5% | |
| American Electric Power Co., Inc. | | 52,877 | $ 4,472,866 |
| Total Common Stocks (Identified Cost, $348,806,747) | | $809,452,991 |
| Investment Companies (h) – 0.8% |
| Money Market Funds – 0.8% | |
| MFS Institutional Money Market Portfolio, 0.02% (v) (Identified Cost, $6,762,283) | | | 6,762,283 | $ 6,762,283 |
| Other Assets, Less Liabilities – (0.0)% | | (115,056) |
| Net Assets – 100.0% | $816,100,218 |
| (a) | Non-income producing security. | | | |
| (h) | An affiliated issuer, which may be considered one in which the fund owns 5% or more of the outstanding voting securities, or a company which is under common control. At period end, the aggregate values of the fund's investments in affiliated issuers and in unaffiliated issuers were $6,762,283 and $809,452,991, respectively. | | | |
| (v) | Affiliated issuer that is available only to investment companies managed by MFS. The rate quoted for the MFS Institutional Money Market Portfolio is the annualized seven-day yield of the fund at period end. | | | |
| The following abbreviations are used in this report and are defined: |
| REIT | Real Estate Investment Trust |
See Notes to Financial Statements
MFS Investors Trust Series
| Financial Statements | Statement of Assets and Liabilities (unaudited) |
This statement represents your fund’s balance sheet, which details the assets and liabilities comprising the total value of the fund.
| At 6/30/21Assets | |
| Investments in unaffiliated issuers, at value (identified cost, $348,806,747) | $809,452,991 |
| Investments in affiliated issuers, at value (identified cost, $6,762,283) | 6,762,283 |
| Receivables for | |
| Fund shares sold | 118,826 |
| Interest and dividends | 535,595 |
| Other assets | 2,215 |
| Total assets | $816,871,910 |
| Liabilities | |
| Payable to custodian | $21,266 |
| Payables for | |
| Fund shares reacquired | 562,996 |
| Payable to affiliates | |
| Investment adviser | 32,983 |
| Administrative services fee | 642 |
| Shareholder servicing costs | 461 |
| Distribution and/or service fees | 7,175 |
| Accrued expenses and other liabilities | 146,169 |
| Total liabilities | $771,692 |
| Net assets | $816,100,218 |
| Net assets consist of | |
| Paid-in capital | $277,189,665 |
| Total distributable earnings (loss) | 538,910,553 |
| Net assets | $816,100,218 |
| Shares of beneficial interest outstanding | 19,452,753 |
| | Net assets | Shares
outstanding | Net asset value
per share |
| Initial Class | $292,483,466 | 6,894,721 | $42.42 |
| Service Class | 523,616,752 | 12,558,032 | 41.70 |
See Notes to Financial Statements
MFS Investors Trust Series
| Financial Statements | Statement of Operations (unaudited) |
This statement describes how much your fund earned in investment income and accrued in expenses. It also describes any gains and/or losses generated by fund operations.
| Six months ended 6/30/21 | |
| Net investment income (loss) | |
| Income | |
| Dividends | $5,507,053 |
| Income on securities loaned | 9,652 |
| Other | 4,091 |
| Dividends from affiliated issuers | 1,187 |
| Foreign taxes withheld | (71,707) |
| Total investment income | $5,450,276 |
| Expenses | |
| Management fee | $2,948,425 |
| Distribution and/or service fees | 632,648 |
| Shareholder servicing costs | 20,390 |
| Administrative services fee | 55,721 |
| Independent Trustees' compensation | 6,502 |
| Custodian fee | 19,825 |
| Shareholder communications | 35,252 |
| Audit and tax fees | 29,128 |
| Legal fees | 2,682 |
| Miscellaneous | 15,198 |
| Total expenses | $3,765,771 |
| Reduction of expenses by investment adviser | (46,989) |
| Net expenses | $3,718,782 |
| Net investment income (loss) | $1,731,494 |
| Realized and unrealized gain (loss) | |
| Realized gain (loss) (identified cost basis) | |
| Unaffiliated issuers | $45,804,866 |
| Foreign currency | (5,728) |
| Net realized gain (loss) | $45,799,138 |
| Change in unrealized appreciation or depreciation | |
| Unaffiliated issuers | $69,382,316 |
| Translation of assets and liabilities in foreign currencies | (1,242) |
| Net unrealized gain (loss) | $69,381,074 |
| Net realized and unrealized gain (loss) | $115,180,212 |
| Change in net assets from operations | $116,911,706 |
See Notes to Financial Statements
MFS Investors Trust Series
| Financial Statements | Statements of Changes in Net Assets |
These statements describe the increases and/or decreases in net assets resulting from operations, any distributions, and any shareholder transactions.
| | Six months ended | Year ended |
| | 6/30/21
(unaudited) | 12/31/20 |
| Change in net assets | | |
| From operations | | |
| Net investment income (loss) | $1,731,494 | $4,322,833 |
| Net realized gain (loss) | 45,799,138 | 25,229,917 |
| Net unrealized gain (loss) | 69,381,074 | 66,669,474 |
| Change in net assets from operations | $116,911,706 | $96,222,224 |
| Total distributions to shareholders | $— | $(25,105,390) |
| Change in net assets from fund share transactions | $(66,756,982) | $(23,803,177) |
| Total change in net assets | $50,154,724 | $47,313,657 |
| Net assets | | |
| At beginning of period | 765,945,494 | 718,631,837 |
| At end of period | $816,100,218 | $765,945,494 |
See Notes to Financial Statements
MFS Investors Trust Series
| Financial Statements | Financial Highlights |
The financial highlights table is intended to help you understand the fund's financial performance for the semiannual period and the past 5 fiscal years. Certain information reflects financial results for a single fund share. The total returns in the table represent the rate that an investor would have earned (or lost) on an investment in the fund share class (assuming reinvestment of all distributions) held for the entire period.
| Initial Class | Six months
ended | Year ended |
| | 6/30/21
(unaudited) | 12/31/20 | 12/31/19 | 12/31/18 | 12/31/17 | 12/31/16 |
| Net asset value, beginning of period | $36.57 | $33.27 | $27.05 | $30.07 | $25.57 | $26.58 |
| Income (loss) from investment operations | | | | | | |
| Net investment income (loss) (d) | $0.12 | $0.25 | $0.25 | $0.26 | $0.22 | $0.23(c) |
| Net realized and unrealized gain (loss) | 5.73 | 4.26 | 8.08 | (1.71) | 5.62 | 2.01 |
| Total from investment operations | $5.85 | $4.51 | $8.33 | $(1.45) | $5.84 | $2.24 |
| Less distributions declared to shareholders | | | | | | |
| From net investment income | $— | $(0.21) | $(0.22) | $(0.20) | $(0.21) | $(0.24) |
| From net realized gain | — | (1.00) | (1.89) | (1.37) | (1.13) | (3.01) |
| Total distributions declared to shareholders | $— | $(1.21) | $(2.11) | $(1.57) | $(1.34) | $(3.25) |
| Net asset value, end of period (x) | $42.42 | $36.57 | $33.27 | $27.05 | $30.07 | $25.57 |
| Total return (%) (k)(r)(s)(x) | 16.00(n) | 13.87 | 31.58 | (5.49) | 23.35 | 8.59(c) |
Ratios (%) (to average net assets)
and Supplemental data: | | | | | | |
| Expenses before expense reductions (f) | 0.80(a) | 0.80 | 0.80 | 0.80 | 0.82 | 0.80(c) |
| Expenses after expense reductions (f) | 0.79(a) | 0.79 | 0.79 | 0.79 | 0.79 | 0.79(c) |
| Net investment income (loss) | 0.60(a) | 0.78 | 0.80 | 0.86 | 0.79 | 0.89(c) |
| Portfolio turnover | 5(n) | 19 | 18 | 16 | 18 | 20 |
| Net assets at end of period (000 omitted) | $292,483 | $269,852 | $265,499 | $231,900 | $283,237 | $270,796 |
See Notes to Financial Statements
MFS Investors Trust Series
Financial Highlights - continued
| Service Class | Six months
ended | Year ended |
| | 6/30/21
(unaudited) | 12/31/20 | 12/31/19 | 12/31/18 | 12/31/17 | 12/31/16 |
| Net asset value, beginning of period | $35.99 | $32.77 | $26.68 | $29.69 | $25.28 | $26.30 |
| Income (loss) from investment operations | | | | | | |
| Net investment income (loss) (d) | $0.07 | $0.17 | $0.17 | $0.18 | $0.15 | $0.16(c) |
| Net realized and unrealized gain (loss) | 5.64 | 4.19 | 7.97 | (1.68) | 5.55 | 1.98 |
| Total from investment operations | $5.71 | $4.36 | $8.14 | $(1.50) | $5.70 | $2.14 |
| Less distributions declared to shareholders | | | | | | |
| From net investment income | $— | $(0.14) | $(0.16) | $(0.14) | $(0.16) | $(0.15) |
| From net realized gain | — | (1.00) | (1.89) | (1.37) | (1.13) | (3.01) |
| Total distributions declared to shareholders | $— | $(1.14) | $(2.05) | $(1.51) | $(1.29) | $(3.16) |
| Net asset value, end of period (x) | $41.70 | $35.99 | $32.77 | $26.68 | $29.69 | $25.28 |
| Total return (%) (k)(r)(s)(x) | 15.87(n) | 13.60 | 31.25 | (5.71) | 23.03 | 8.32(c) |
Ratios (%) (to average net assets)
and Supplemental data: | | | | | | |
| Expenses before expense reductions (f) | 1.05(a) | 1.05 | 1.05 | 1.05 | 1.07 | 1.04(c) |
| Expenses after expense reductions (f) | 1.03(a) | 1.04 | 1.04 | 1.04 | 1.04 | 1.04(c) |
| Net investment income (loss) | 0.35(a) | 0.53 | 0.55 | 0.62 | 0.55 | 0.64(c) |
| Portfolio turnover | 5(n) | 19 | 18 | 16 | 18 | 20 |
| Net assets at end of period (000 omitted) | $523,617 | $496,093 | $453,132 | $325,159 | $318,611 | $228,741 |
| (a) | Annualized. |
| (c) | Amount reflects a one-time reimbursement of expenses by the custodian (or former custodian) without which net investment income and performance would be lower and expenses would be higher. |
| (d) | Per share data is based on average shares outstanding. |
| (f) | Ratios do not reflect reductions from fees paid indirectly, if applicable. |
| (k) | The total return does not reflect expenses that apply to separate accounts. Inclusion of these charges would reduce the total return figures for all periods shown. |
| (n) | Not annualized. |
| (r) | Certain expenses have been reduced without which performance would have been lower. |
| (s) | From time to time the fund may receive proceeds from litigation settlements, without which performance would be lower. |
| (x) | The net asset values and total returns have been calculated on net assets which include adjustments made in accordance with U.S. generally accepted accounting principles required at period end for financial reporting purposes. |
See Notes to Financial Statements
MFS Investors Trust Series
Notes to Financial Statements (unaudited)
(1) Business and Organization
MFS Investors Trust Series (the fund) is a diversified series of MFS Variable Insurance Trust (the trust). The trust is organized as a Massachusetts business trust and is registered under the Investment Company Act of 1940, as amended, as an open-end management investment company. The shareholders of each series of the trust are separate accounts of insurance companies, which offer variable annuity and/or life insurance products, and qualified retirement and pension plans.
The fund is an investment company and accordingly follows the investment company accounting and reporting guidance of the Financial Accounting Standards Board (FASB) Accounting Standards Codification Topic 946 Financial Services - Investment Companies.
(2) Significant Accounting Policies
General — The preparation of financial statements in conformity with U.S. generally accepted accounting principles requires management to make estimates and assumptions that affect the reported amounts of assets and liabilities, and disclosure of contingent assets and liabilities at the date of the financial statements and the reported amounts of increases and decreases in net assets from operations during the reporting period. Actual results could differ from those estimates. In the preparation of these financial statements, management has evaluated subsequent events occurring after the date of the fund’s Statement of Assets and Liabilities through the date that the financial statements were issued.
Certain of the fund's investments, derivatives, debt and other contracts may be based on reference interest rates such as the London Interbank Offered Rate (“LIBOR”). In 2017, the regulatory authority that oversees financial services firms in the United Kingdom announced plans to transition away from LIBOR by the end of 2021. In March 2021, the administrator of LIBOR announced the extension of the publication of the more commonly used U.S. dollar LIBOR settings to the end of June 2023. Although the full impacts of the transition away from LIBOR are not fully known, the transition may result in, among other things, an increase in volatility or illiquidity of the markets for instruments that currently rely on LIBOR to determine interest rates and this could have an adverse impact on the fund's performance. With respect to the fund's accounting for investments, derivatives, debt and other contracts that undergo reference rate-related modifications as a result of the transition, management will rely upon the relief provided by FASB Codification Topic 848 – Reference Rate Reform (Topic 848). The guidance in Topic 848 permits the fund to disregard the GAAP accounting requirements around certain contract modifications resulting from the LIBOR transition such that for contracts considered in scope, the fund can account for those modified contracts as a continuation of the existing contracts.
Balance Sheet Offsetting — The fund's accounting policy with respect to balance sheet offsetting is that, absent an event of default by the counterparty or a termination of the agreement, the International Swaps and Derivatives Association (ISDA) Master Agreement, or similar agreement, does not result in an offset of reported amounts of financial assets and financial liabilities in the Statement of Assets and Liabilities across transactions between the fund and the applicable counterparty. The fund's right to setoff may be restricted or prohibited by the bankruptcy or insolvency laws of the particular jurisdiction to which a specific master netting agreement counterparty is subject. Balance sheet offsetting disclosures, to the extent applicable to the fund, have been included in the fund’s Significant Accounting Policies note under the captions for each of the fund’s in-scope financial instruments and transactions.
Investment Valuations — Equity securities, including restricted equity securities, are generally valued at the last sale or official closing price on their primary market or exchange as provided by a third-party pricing service. Equity securities, for which there were no sales reported that day, are generally valued at the last quoted daily bid quotation on their primary market or exchange as provided by a third-party pricing service. Short-term instruments with a maturity at issuance of 60 days or less may be valued at amortized cost, which approximates market value. Open-end investment companies are generally valued at net asset value per share.
Securities and other assets generally valued on the basis of information from a third-party pricing service may also be valued at a broker/dealer bid quotation. In determining values, third-party pricing services can utilize both transaction data and market information such as yield, quality, coupon rate, maturity, type of issue, trading characteristics, and other market data. The values of foreign securities and other assets and liabilities expressed in foreign currencies are converted to U.S. dollars using the mean of bid and asked prices for rates provided by a third-party pricing service.
The Board of Trustees has delegated primary responsibility for determining or causing to be determined the value of the fund’s investments (including any fair valuation) to the adviser pursuant to valuation policies and procedures approved by the Board. If the adviser determines that reliable market quotations are not readily available, investments are valued at fair value as determined in good faith by the adviser in accordance with such procedures under the oversight of the Board of Trustees. Under the fund’s valuation policies and procedures, market quotations are not considered to be readily available for most types of debt instruments and floating rate loans and many types of derivatives. These investments are generally valued at fair value based on information from third-party pricing services. In addition, investments may be valued at fair value if the adviser determines that an investment’s value has been materially affected by events occurring after the close of the exchange or market on which the investment is principally
MFS Investors Trust Series
Notes to Financial Statements (unaudited) - continued
traded (such as foreign exchange or market) and prior to the determination of the fund’s net asset value, or after the halt of trading of a specific security where trading does not resume prior to the close of the exchange or market on which the security is principally traded. Events that occur after foreign markets close (such as developments in foreign markets and significant movements in the U.S. markets) and prior to the determination of the fund’s net asset value may be deemed to have a material effect on the value of securities traded in foreign markets. Accordingly, the fund’s foreign equity securities may often be valued at fair value. The adviser generally relies on third-party pricing services or other information (such as the correlation with price movements of similar securities in the same or other markets; the type, cost and investment characteristics of the security; the business and financial condition of the issuer; and trading and other market data) to assist in determining whether to fair value and at what value to fair value an investment. The value of an investment for purposes of calculating the fund’s net asset value can differ depending on the source and method used to determine value. When fair valuation is used, the value of an investment used to determine the fund’s net asset value may differ from quoted or published prices for the same investment. There can be no assurance that the fund could obtain the fair value assigned to an investment if it were to sell the investment at the same time at which the fund determines its net asset value per share.
Various inputs are used in determining the value of the fund's assets or liabilities. These inputs are categorized into three broad levels. In certain cases, the inputs used to measure fair value may fall into different levels of the fair value hierarchy. In such cases, an investment's level within the fair value hierarchy is based on the lowest level of input that is significant to the fair value measurement. The fund's assessment of the significance of a particular input to the fair value measurement in its entirety requires judgment, and considers factors specific to the investment. Level 1 includes unadjusted quoted prices in active markets for identical assets or liabilities. Level 2 includes other significant observable market-based inputs (including quoted prices for similar securities, interest rates, prepayment speed, and credit risk). Level 3 includes unobservable inputs, which may include the adviser's own assumptions in determining the fair value of investments. The following is a summary of the levels used as of June 30, 2021 in valuing the fund's assets or liabilities:
| Financial Instruments | Level 1 | Level 2 | Level 3 | Total |
| Equity Securities | $809,452,991 | $— | $— | $809,452,991 |
| Mutual Funds | 6,762,283 | — | — | 6,762,283 |
| Total | $816,215,274 | $— | $— | $816,215,274 |
For further information regarding security characteristics, see the Portfolio of Investments.
Foreign Currency Translation — Purchases and sales of foreign investments, income, and expenses are converted into U.S. dollars based upon currency exchange rates prevailing on the respective dates of such transactions or on the reporting date for foreign denominated receivables and payables. Gains and losses attributable to foreign currency exchange rates on sales of securities are recorded for financial statement purposes as net realized gains and losses on investments. Gains and losses attributable to foreign exchange rate movements on receivables, payables, income and expenses are recorded for financial statement purposes as foreign currency transaction gains and losses. That portion of both realized and unrealized gains and losses on investments that results from fluctuations in foreign currency exchange rates is not separately disclosed.
Security Loans — Under its Securities Lending Agency Agreement with the fund, State Street Bank and Trust Company, as lending agent, loans the securities of the fund to certain qualified institutions (the “Borrowers”) approved by the fund. Security loans can be terminated at the discretion of either the lending agent or the fund and the related securities must be returned within the earlier of the standard trade settlement period for such securities or within three business days. The loans are collateralized by cash and/or U.S. Treasury and federal agency obligations in an amount typically at least equal to the market value of the securities loaned. On loans collateralized by cash, the cash collateral is invested in a money market fund. The market value of the loaned securities is determined at the close of business of the fund and any additional required collateral is delivered to the fund on the next business day. The lending agent provides the fund with indemnification against Borrower default. In the event of Borrower default, the lending agent will, for the benefit of the fund, either purchase securities identical to those loaned or, when such purchase is commercially impracticable, pay the fund the market value of the loaned securities. In return, the lending agent assumes the fund's rights to the related collateral. If the collateral value is less than the cost to purchase identical securities, the lending agent is responsible for the shortfall, but only to the extent that such shortfall is not due to a decline in collateral value resulting from collateral reinvestment for which the fund bears the risk of loss. A portion of the income generated upon investment of the collateral is remitted to the Borrowers, and the remainder is allocated between the fund and the lending agent. On loans collateralized by U.S. Treasury and/or federal agency obligations, a fee is received from the Borrower, and is allocated between the fund and the lending agent. Income from securities lending is separately reported in the Statement of Operations. The dividend and interest income earned on the securities loaned is accounted for in the same manner as other dividend and interest income. At June 30, 2021, there were no securities on loan or collateral outstanding.
MFS Investors Trust Series
Notes to Financial Statements (unaudited) - continued
Indemnifications — Under the fund's organizational documents, its officers and Trustees may be indemnified against certain liabilities and expenses arising out of the performance of their duties to the fund. Additionally, in the normal course of business, the fund enters into agreements with service providers that may contain indemnification clauses. The fund's maximum exposure under these agreements is unknown as this would involve future claims that may be made against the fund that have not yet occurred.
Investment Transactions and Income — Investment transactions are recorded on the trade date. Dividends received in cash are recorded on the ex-dividend date. Certain dividends from foreign securities will be recorded when the fund is informed of the dividend if such information is obtained subsequent to the ex-dividend date. Dividend payments received in additional securities are recorded on the ex-dividend date in an amount equal to the value of the security on such date.
The fund may receive proceeds from litigation settlements. Any proceeds received from litigation involving portfolio holdings are reflected in the Statement of Operations in realized gain/loss if the security has been disposed of by the fund or in unrealized gain/loss if the security is still held by the fund. Any other proceeds from litigation not related to portfolio holdings are reflected as other income in the Statement of Operations.
Tax Matters and Distributions — The fund intends to qualify as a regulated investment company, as defined under Subchapter M of the Internal Revenue Code, and to distribute all of its taxable income, including realized capital gains. As a result, no provision for federal income tax is required. The fund’s federal tax returns, when filed, will remain subject to examination by the Internal Revenue Service for a three year period. Management has analyzed the fund’s tax positions taken on federal and state tax returns for all open tax years and does not believe that there are any uncertain tax positions that require recognition of a tax liability. Foreign taxes, if any, have been accrued by the fund in the accompanying financial statements in accordance with the applicable foreign tax law. Foreign income taxes may be withheld by certain countries in which the fund invests. Additionally, capital gains realized by the fund on securities issued in or by certain foreign countries may be subject to capital gains tax imposed by those countries.
Distributions to shareholders are recorded on the ex-dividend date. Income and capital gain distributions are determined in accordance with income tax regulations, which may differ from U.S. generally accepted accounting principles. Certain capital accounts in the financial statements are periodically adjusted for permanent differences in order to reflect their tax character. These adjustments have no impact on net assets or net asset value per share. Temporary differences which arise from recognizing certain items of income, expense, gain or loss in different periods for financial statement and tax purposes will reverse at some time in the future.
Book/tax differences primarily relate to wash sale loss deferrals and partnership adjustments.
The tax character of distributions declared to shareholders for the last fiscal year is as follows:
| | Year ended
12/31/20 |
| Ordinary income (including any short-term capital gains) | $3,919,176 |
| Long-term capital gains | 21,186,214 |
| Total distributions | $25,105,390 |
The federal tax cost and the tax basis components of distributable earnings were as follows:
| As of 6/30/21 | |
| Cost of investments | $357,024,004 |
| Gross appreciation | 461,295,325 |
| Gross depreciation | (2,104,055) |
| Net unrealized appreciation (depreciation) | $459,191,270 |
| As of 12/31/20 | |
| Undistributed ordinary income | 4,410,501 |
| Undistributed long-term capital gain | 25,400,697 |
| Other temporary differences | 2,229,658 |
| Net unrealized appreciation (depreciation) | 389,957,991 |
The aggregate cost above includes prior fiscal year end tax adjustments, if applicable.
MFS Investors Trust Series
Notes to Financial Statements (unaudited) - continued
Multiple Classes of Shares of Beneficial Interest — The fund offers multiple classes of shares, which differ in their respective distribution and/or service fees. The fund's income, realized and unrealized gain (loss), and common expenses are allocated to shareholders based on the daily net assets of each class. Dividends are declared separately for each class. Differences in per share dividend rates are generally due to differences in separate class expenses. The fund’s distributions declared to shareholders as reported in the Statements of Changes in Net Assets are presented by class as follows:
| | Six months
ended
6/30/21 | | Year
ended
12/31/20 |
| Initial Class | $— | | $9,047,272 |
| Service Class | — | | 16,058,118 |
| Total | $— | | $25,105,390 |
(3) Transactions with Affiliates
Investment Adviser — The fund has an investment advisory agreement with MFS to provide overall investment management and related administrative services and facilities to the fund. The management fee is computed daily and paid monthly at the following annual rates based on the fund's average daily net assets:
| Up to $1 billion | 0.75% |
| In excess of $1 billion and up to $2.5 billion | 0.65% |
| In excess of $2.5 billion | 0.60% |
MFS has agreed in writing to reduce its management fee by a specified amount if certain MFS mutual fund assets exceed thresholds agreed to by MFS and the fund's Board of Trustees. For the six months ended June 30, 2021, this management fee reduction amounted to $46,989, which is included in the reduction of total expenses in the Statement of Operations. The management fee incurred for the six months ended June 30, 2021 was equivalent to an annual effective rate of 0.74% of the fund's average daily net assets.
The investment adviser has agreed in writing to pay a portion of the fund’s total annual operating expenses, excluding interest, taxes, extraordinary expenses, brokerage and transaction costs, and investment-related expenses, such that total annual operating expenses do not exceed 0.79% of average daily net assets for the Initial Class shares and 1.04% of average daily net assets for the Service Class shares. This written agreement will continue until modified by the fund’s Board of Trustees, but such agreement will continue at least until April 30, 2023. For the six months ended June 30, 2021, the fund’s actual operating expenses did not exceed the limit and therefore, the investment adviser did not pay any portion of the fund’s expenses related to this agreement.
Distributor — MFS Fund Distributors, Inc. (MFD), a wholly-owned subsidiary of MFS, is the distributor of shares of the fund. The Trustees have adopted a distribution plan for the Service Class shares pursuant to Rule 12b-1 under the Investment Company Act of 1940.
The fund's distribution plan provides that the fund will pay MFD distribution and/or service fees equal to 0.25% per annum of its average daily net assets attributable to Service Class shares as partial consideration for services performed and expenses incurred by MFD and financial intermediaries (including participating insurance companies that invest in the fund to fund variable annuity and variable life insurance contracts, sponsors of qualified retirement and pension plans that invest in the fund, and affiliates of these participating insurance companies and plan sponsors) in connection with the sale and distribution of the Service Class shares. MFD may subsequently pay all, or a portion, of the distribution and/or service fees to financial intermediaries.
Shareholder Servicing Agent — MFS Service Center, Inc. (MFSC), a wholly-owned subsidiary of MFS, receives a fee from the fund for its services as shareholder servicing agent. For the six months ended June 30, 2021, the fee was $19,583, which equated to 0.0050% annually of the fund's average daily net assets. MFSC also receives reimbursement from the fund for out-of-pocket expenses paid by MFSC on behalf of the fund. For the six months ended June 30, 2021, these costs amounted to $807.
Administrator — MFS provides certain financial, legal, shareholder communications, compliance, and other administrative services to the fund. Under an administrative services agreement, the fund reimburses MFS the costs incurred to provide these services. The fund is charged an annual fixed amount of $17,500 plus a fee based on average daily net assets. The administrative services fee incurred for the six months ended June 30, 2021 was equivalent to an annual effective rate of 0.0142% of the fund's average daily net assets.
MFS Investors Trust Series
Notes to Financial Statements (unaudited) - continued
Trustees’ and Officers’ Compensation — The fund pays compensation to independent Trustees in the form of a retainer, attendance fees, and additional compensation to Board and Committee chairpersons. The fund does not pay compensation directly to Trustees or officers of the fund who are also officers of the investment adviser, all of whom receive remuneration from MFS for their services to the fund. Certain officers and Trustees of the fund are officers or directors of MFS, MFD, and MFSC.
Other — The fund invests in the MFS Institutional Money Market Portfolio which is managed by MFS and seeks current income consistent with preservation of capital and liquidity. This money market fund does not pay a management fee to MFS but does incur investment and operating costs.
The adviser has voluntarily undertaken to reimburse the fund from its own resources on a quarterly basis for the cost of investment research embedded in the cost of the fund’s securities trades. This agreement may be rescinded at any time. For the six months ended June 30, 2021, this reimbursement amounted to $3,994, which is included in “Other” income in the Statement of Operations.
(4) Portfolio Securities
For the six months ended June 30, 2021, purchases and sales of investments, other than short-term obligations, aggregated $39,753,985 and $108,696,249, respectively.
(5) Shares of Beneficial Interest
The fund's Declaration of Trust permits the Trustees to issue an unlimited number of full and fractional shares of beneficial interest. Transactions in fund shares were as follows:
| | Six months ended
6/30/21 | | Year ended
12/31/20 |
| | Shares | Amount | | Shares | Amount |
| Shares sold | | | | | |
| Initial Class | 68,665 | $2,691,400 | | 284,529 | $8,347,359 |
| Service Class | 139,669 | 5,409,974 | | 1,666,170 | 49,859,186 |
| | 208,334 | $8,101,374 | | 1,950,699 | $58,206,545 |
Shares issued to shareholders
in reinvestment of distributions | | | | | |
| Initial Class | — | $— | | 267,829 | $9,047,272 |
| Service Class | — | — | | 482,660 | 16,058,118 |
| | — | $— | | 750,489 | $25,105,390 |
| Shares reacquired | | | | | |
| Initial Class | (552,264) | $(21,808,935) | | (1,154,860) | $(37,139,929) |
| Service Class | (1,364,847) | (53,049,421) | | (2,192,948) | (69,975,183) |
| | (1,917,111) | $(74,858,356) | | (3,347,808) | $(107,115,112) |
| Net change | | | | | |
| Initial Class | (483,599) | $(19,117,535) | | (602,502) | $(19,745,298) |
| Service Class | (1,225,178) | (47,639,447) | | (44,118) | (4,057,879) |
| | (1,708,777) | $(66,756,982) | | (646,620) | $(23,803,177) |
(6) Line of Credit
The fund and certain other funds managed by MFS participate in a $1.25 billion unsecured committed line of credit of which $1 billion is reserved for use by the fund and certain other MFS U.S. funds. The line of credit is provided by a syndicate of banks under a credit agreement. Borrowings may be made for temporary financing needs. Interest is charged to each fund, based on its borrowings, generally at a rate equal to the highest of one month LIBOR, the Federal Funds Effective Rate and the Overnight Bank Funding Rate, plus an agreed upon spread. A commitment fee, based on the average daily, unused portion of the committed line of credit, is allocated among the participating funds. In addition, the fund and other funds managed by MFS have established unsecured uncommitted borrowing arrangements with certain banks for temporary financing needs. Interest is charged to each fund, based on its borrowings, at rates equal to customary reference rates plus an agreed upon spread. For the six months ended June 30, 2021, the fund’s commitment fee and interest expense were $1,516 and $0, respectively, and are included in “Miscellaneous” expense in the Statement of Operations.
MFS Investors Trust Series
Notes to Financial Statements (unaudited) - continued
(7) Investments in Affiliated Issuers
An affiliated issuer may be considered one in which the fund owns 5% or more of the outstanding voting securities, or a company which is under common control. For the purposes of this report, the following were affiliated issuers:
| Affiliated Issuers | Beginning
Value | Purchases | Sales
Proceeds | Realized
Gain
(Loss) | Change in
Unrealized
Appreciation or
Depreciation | Ending
Value |
| MFS Institutional Money Market Portfolio | $2,722,233 | $65,180,538 | $61,140,488 | $— | $— | $6,762,283 |
| Affiliated Issuers | Dividend
Income | Capital Gain
Distributions |
| MFS Institutional Money Market Portfolio | $1,187 | $— |
(8) Impacts of COVID-19
The pandemic related to the global spread of novel coronavirus disease (COVID-19), which was first detected in December 2019, has resulted in significant disruptions to global business activity and the global economy, as well as the economies of individual countries, the financial performance of individual companies and sectors, and the securities and commodities markets in general. Multiple surges in cases globally, the availability and widespread adoption of vaccines, and the emergence of variant strains of the virus continue to create uncertainty as to the future and long-term impacts resulting from the pandemic including impacts to the prices and liquidity of the fund's investments and the fund's performance.
MFS Investors Trust Series
Statement Regarding Liquidity Risk Management Program
The fund has adopted and implemented a liquidity risk management program (the “Program”) as required by Rule 22e-4 under the Investment Company Act of 1940, as amended. The fund’s Board of Trustees (the “Board”) has designated MFS as the administrator of the Program. The Program is reasonably designed to assess and manage the liquidity risk of the fund. Liquidity risk is the risk that the fund could not meet requests to redeem shares issued by the fund without significant dilution of remaining investors' interests.
MFS provided a written report to the Board for consideration at its April 2021 meeting that addressed the operation of the Program and provided an assessment of the adequacy and effectiveness of the Program during the period from January 1, 2020 to December 31, 2020 (the “Covered Period”). The report concluded that during the Covered Period the Program had operated effectively and had adequately and effectively been implemented to assess and manage the fund’s liquidity risk. MFS also reported that there were no liquidity events that impacted the fund or its ability to timely meet redemptions without dilution to existing shareholders during the Covered Period.
There can be no assurance that the Program will achieve its objectives in the future. Further information on liquidity risk, and other principal risks to which an investment in the fund may be subject, can be found in the prospectus.
MFS Investors Trust Series
Proxy Voting Policies and Information
MFS votes proxies on behalf of the fund pursuant to proxy voting policies and procedures that are available without charge, upon request, by calling 1-800-225-2606, by visiting mfs.com/proxyvoting, or by visiting the SEC’s Web site at http://www.sec.gov.
Information regarding how the fund voted proxies relating to portfolio securities during the most recent twelve-month period ended June 30 is available by August 31 of each year without charge by visiting mfs.com/proxyvoting, or by visiting the SEC’s Web site at http://www.sec.gov.
Quarterly Portfolio Disclosure
The fund files a complete schedule of portfolio holdings with the SEC for the first and third quarters of each fiscal year as an exhibit to its reports on Form N-PORT. The fund’s Form N-PORT reports are available on the SEC’s Web site at http://www.sec.gov. A shareholder can obtain the portfolio holdings report for the first and third quarters of the fund's fiscal year at mfs.com/vit1 by choosing the fund's name and then scrolling to the “Resources” section and clicking on the “Prospectus and Reports” tab.
FURTHER INFORMATION
From time to time, MFS may post important information about the fund or the MFS Funds on the MFS Web site (mfs.com). This information is available at https://www.mfs.com/announcements or at mfs.com/vit1 by choosing the fund's name and then scrolling to the “Resources” section and clicking on the “Announcements” tab, if any.
Information About Fund Contracts and Legal Claims
The fund has entered into contractual arrangements with an investment adviser, administrator, distributor, shareholder servicing agent, 529 program manager (if applicable), and custodian who each provide services to the fund. Unless expressly stated otherwise, shareholders are not parties to, or intended beneficiaries of these contractual arrangements, and these contractual arrangements are not intended to create any shareholder right to enforce them against the service providers or to seek any remedy under them against the service providers, either directly or on behalf of the fund.
Under the Trust’s By-Laws and Declaration of Trust, any claims asserted against or on behalf of the MFS Funds, including claims against Trustees and Officers, must be brought in state and federal courts located within the Commonwealth of Massachusetts.
Semiannual Report
June 30, 2021
MFS® Mid Cap Growth Series
MFS® Variable Insurance Trust
MFS® Mid Cap Growth Series
The report is prepared for the general information of contract owners. It is authorized for distribution to prospective investors only when preceded or accompanied by a current prospectus.
NOT FDIC INSURED • MAY LOSE VALUE • NO BANK OR CREDIT UNION GUARANTEE •
NOT A DEPOSIT • NOT INSURED BY ANY FEDERAL GOVERNMENT AGENCY OR NCUA/NCUSIF
MFS Mid Cap Growth Series
Dear Contract Owners:
After experiencing dramatic swings in the early days of the coronavirus pandemic, global equity markets have performed strongly over the past year. Though the speedy development of vaccines brightened the economic and market outlook, uncertainty remains as new variants of the virus appear, and questions persist over how fast vaccines can be made widely available in the developing world.
Global central banks have taken aggressive steps to cushion the economic and market fallout related to the virus, and governments are deploying unprecedented levels of fiscal support. Having passed a $1.9 trillion stimulus package in March, the U.S. Congress could approve additional stimulus later this year, some of it focused on infrastructure. Along with extraordinary government expenditures, pent-up consumer demand fueled a surge in economic activity as coronavirus restrictions were eased, pushing up inflation, at least temporarily. Markets initially reacted by pushing up yields on global government bonds, though some of the rate rise has since been corrected.
A spirited debate is underway among investors over whether the current price pressures will persist or prove to be temporary, caused by pandemic-induced bottlenecks. The policy measures put in place to counteract the pandemic's effects have helped build a supportive environment and are encouraging economic recovery; however, if markets disconnect from fundamentals, they can sow the seeds of instability. As such, recent dramatic increases in speculative trading in cryptocurrencies, special purpose acquisition companies (SPACs), and the like bear watching.
In the aftermath of the crisis, we could see societal changes as households, businesses, and governments adjust to a new reality, and any such alterations could affect the investment landscape. For investors, events such as the COVID-19 outbreak demonstrate the importance of having a deep understanding of company fundamentals, and we have built our global research platform to do just that.
At MFS®, we put our clients’ assets to work responsibly by carefully navigating the increasing complexity of global markets and economies. Guided by our long-term philosophy and adhering to our commitment to sustainable investing, we tune out the noise and aim to uncover what we believe are the best, most durable investment opportunities in the market. Our unique global investment platform combines collective expertise, long-term discipline, and thoughtful risk management to create sustainable value for investors.
Respectfully,
Michael W. Roberge
Chief Executive Officer
MFS Investment Management
August 13, 2021
The opinions expressed in this letter are subject to change and may not be relied upon for investment advice. No forecasts can be guaranteed.
MFS Mid Cap Growth Series
Portfolio structure
Top ten holdings
| Cadence Design Systems, Inc. | 2.9% |
| Bright Horizons Family Solutions, Inc. | 2.6% |
| PerkinElmer, Inc. | 2.5% |
| Monolithic Power Systems, Inc. | 2.5% |
| Take-Two Interactive Software, Inc. | 2.4% |
| MSCI, Inc. | 2.2% |
| Match Group, Inc. | 2.1% |
| Verisk Analytics, Inc., “A” | 2.1% |
| Copart, Inc. | 2.0% |
| AMETEK, Inc. | 1.9% |
GICS equity sectors (g)
| Information Technology | 25.0% |
| Health Care | 19.5% |
| Industrials | 18.9% |
| Consumer Discretionary | 15.6% |
| Communication Services | 7.5% |
| Financials | 6.9% |
| Materials | 3.3% |
| Real Estate | 2.2% |
| Consumer Staples | 0.3% |
| (g) | The Global Industry Classification Standard (GICS®) was developed by and/or is the exclusive property of MSCI, Inc. and S&P Global Market Intelligence Inc. (“S&P Global Market Intelligence”). GICS is a service mark of MSCI and S&P Global Market Intelligence and has been licensed for use by MFS. MFS has applied its own internal sector/industry classification methodology for equity securities and non-equity securities that are unclassified by GICS. |
Cash & Cash Equivalents includes any cash, investments in money market funds, short-term securities, and other assets less liabilities. Please see the Statement of Assets and Liabilities for additional information related to the fund’s cash position and other assets and liabilities.
Other includes equivalent exposure from currency derivatives and/or any offsets to derivative positions and may be negative.
Percentages are based on net assets as of June 30, 2021.
The portfolio is actively managed and current holdings may be different.
MFS Mid Cap Growth Series
Expense Table
Fund Expenses Borne by the Contract Holders during the Period,
January 1, 2021 through June 30, 2021
As a contract holder of the fund, you incur ongoing costs, including management fees; distribution and/or service (12b-1) fees; and other fund expenses. This example is intended to help you understand your ongoing costs (in dollars) of investing in the fund and to compare these costs with the ongoing costs of investing in other mutual funds.
The example is based on an investment of $1,000 invested at the beginning of the period and held for the entire period January 1, 2021 through June 30, 2021.
Actual Expenses
The first line for each share class in the following table provides information about actual account values and actual expenses. You may use the information in this line, together with the amount you invested, to estimate the expenses that you paid over the period. Simply divide your account value by $1,000 (for example, an $8,600 account value divided by $1,000 = 8.6), then multiply the result by the number in the first line under the heading entitled “Expenses Paid During Period” to estimate the expenses you paid on your account during this period.
Hypothetical Example for Comparison Purposes
The second line for each share class in the following table provides information about hypothetical account values and hypothetical expenses based on the fund’s actual expense ratio and an assumed rate of return of 5% per year before expenses, which is not the fund’s actual return. The hypothetical account values and expenses may not be used to estimate the actual ending account balance or expenses you paid for the period. You may use this information to compare the ongoing costs of investing in the fund and other funds. To do so, compare this 5% hypothetical example with the 5% hypothetical examples that appear in the shareholder reports of the other funds.
Please note that the expenses shown in the table are meant to highlight the fund's ongoing costs only and do not take into account the fees and expenses imposed under the variable contracts through which your investment in the fund is made. Therefore, the second line for each share class in the table is useful in comparing ongoing costs associated with an investment in vehicles (such as the fund) which fund benefits under variable annuity and variable life insurance contracts and to qualified pension and retirement plans only, and will not help you determine the relative total costs of investing in the fund through variable annuity and variable life insurance contracts. If the fees and expenses imposed under the variable contracts were included, your costs would have been higher.
Share
Class | | Annualized
Expense
Ratio | Beginning
Account Value
1/01/21 | Ending
Account Value
6/30/21 | Expenses
Paid During
Period (p)
1/01/21-6/30/21 |
| Initial Class | Actual | 0.79% | $1,000.00 | $1,053.01 | $4.02 |
| Hypothetical (h) | 0.79% | $1,000.00 | $1,020.88 | $3.96 |
| Service Class | Actual | 1.04% | $1,000.00 | $1,052.04 | $5.29 |
| Hypothetical (h) | 1.04% | $1,000.00 | $1,019.64 | $5.21 |
| (h) | 5% class return per year before expenses. |
| (p) | “Expenses Paid During Period” are equal to each class's annualized expense ratio, as shown above, multiplied by the average account value over the period, multiplied by 181/365 (to reflect the one-half year period). |
MFS Mid Cap Growth Series
Portfolio of Investments − 6/30/21 (unaudited)
The Portfolio of Investments is a complete list of all securities owned by your fund. It is categorized by broad-based asset classes.
| Issuer | | | Shares/Par | Value ($) |
| Common Stocks – 99.2% |
| Aerospace & Defense – 0.9% | |
| Howmet Aerospace, Inc. (a) | | 119,531 | $ 4,120,234 |
| Automotive – 2.2% | |
| Copart, Inc. (a) | | 61,320 | $ 8,083,816 |
| LKQ Corp. (a) | | 30,064 | 1,479,750 |
| | | | | $9,563,566 |
| Biotechnology – 1.2% | |
| Adaptive Biotechnologies Corp. (a) | | 36,512 | $ 1,491,880 |
| Alnylam Pharmaceuticals, Inc. (a) | | 15,600 | 2,644,512 |
| Exelixis, Inc. (a) | | 54,051 | 984,809 |
| | | | | $5,121,201 |
| Brokerage & Asset Managers – 2.3% | |
| NASDAQ, Inc. | | 38,257 | $ 6,725,581 |
| Tradeweb Markets, Inc. | | 41,236 | 3,486,916 |
| | | | | $10,212,497 |
| Business Services – 10.3% | |
| Clarivate PLC (a) | | 245,542 | $ 6,759,771 |
| CoStar Group, Inc. (a) | | 64,154 | 5,313,234 |
| Equifax, Inc. | | 23,946 | 5,735,306 |
| Global Payments, Inc. | | 11,332 | 2,125,203 |
| IHS Markit Ltd. | | 9,734 | 1,096,632 |
| MSCI, Inc. | | 20,469 | 10,911,615 |
| Paysafe Ltd. (a) | | 64,996 | 787,102 |
| Tyler Technologies, Inc. (a) | | 12,589 | 5,694,886 |
| Verisk Analytics, Inc., “A” | | 41,058 | 7,173,654 |
| | | | | $45,597,403 |
| Cable TV – 0.5% | |
| Cable One, Inc. | | 1,042 | $ 1,993,148 |
| Computer Software – 12.0% | |
| Autodesk, Inc. (a) | | 20,752 | $ 6,057,509 |
| Black Knight, Inc. (a) | | 63,115 | 4,921,708 |
| Bumble, Inc., “A” (a) | | 32,587 | 1,877,011 |
| Cadence Design Systems, Inc. (a) | | 68,738 | 9,404,733 |
| Coupa Software, Inc. (a) | | 8,765 | 2,297,394 |
| DocuSign, Inc. (a) | | 12,143 | 3,394,818 |
| Dragoneer Growth Opportunities Corp. (a)(zz) | | 55,215 | 573,684 |
| Dragoneer Growth Opportunities Corp. (PIPE) (a)(u)(w)(z) | | 13,884 | 132,962 |
| Dragoneer Growth Opportunities Corp. (SPAC) (a)(zz) | | 23,803 | 237,078 |
| Dun & Bradstreet Holdings, Inc. (a) | | 112,849 | 2,411,583 |
| Eventbrite, Inc. (a) | | 78,407 | 1,489,733 |
| Everbridge, Inc. (a) | | 20,810 | 2,831,825 |
| Okta, Inc. (a) | | 14,049 | 3,437,509 |
| Paylocity Holding Corp. (a) | | 21,003 | 4,007,372 |
| Qualtrics International, “A” (a) | | 20,776 | 794,682 |
| RingCentral, Inc. (a) | | 10,083 | 2,929,918 |
| Synopsys, Inc. (a) | | 18,391 | 5,072,054 |
| Topicus.com, Inc. (a) | | 5,940 | 431,508 |
| Issuer | | | Shares/Par | Value ($) |
| Common Stocks – continued |
| Computer Software – continued | |
| Unity Software, Inc. (a) | | 4,220 | $ 463,483 |
| | | | | $52,766,564 |
| Computer Software - Systems – 7.3% | |
| Constellation Software, Inc. | | 3,094 | $ 4,685,952 |
| NICE Systems Ltd., ADR (a) | | 24,808 | 6,138,988 |
| ServiceNow, Inc. (a) | | 7,878 | 4,329,355 |
| Square, Inc., “A” (a) | | 19,373 | 4,723,137 |
| SS&C Technologies Holdings, Inc. | | 29,443 | 2,121,663 |
| TransUnion | | 63,879 | 7,014,553 |
| Wix.com Ltd. (a) | | 11,166 | 3,241,266 |
| | | | | $32,254,914 |
| Construction – 5.1% | |
| AZEK Co. LLC (a) | | 49,812 | $ 2,115,018 |
| Builders FirstSource, Inc. (a) | | 60,581 | 2,584,385 |
| Lennox International, Inc. | | 10,702 | 3,754,262 |
| Pool Corp. | | 15,508 | 7,112,899 |
| Vulcan Materials Co. | | 38,542 | 6,709,006 |
| | | | | $22,275,570 |
| Consumer Products – 1.2% | |
| Scotts Miracle-Gro Co. | | 27,197 | $ 5,219,648 |
| Consumer Services – 2.7% | |
| Bright Horizons Family Solutions, Inc. (a) | | 57,097 | $ 8,399,540 |
| Peloton Interactive, Inc., “A” (a) | | 28,756 | 3,566,319 |
| | | | | $11,965,859 |
| Containers – 0.6% | |
| Ball Corp. | | 33,046 | $ 2,677,387 |
| Electrical Equipment – 2.7% | |
| AMETEK, Inc. | | 66,732 | $ 8,908,722 |
| Littlefuse, Inc. | | 11,345 | 2,890,592 |
| | | | | $11,799,314 |
| Electronics – 5.9% | |
| ASM International N.V. | | 9,422 | $ 3,094,682 |
| Entegris, Inc. | | 58,435 | 7,185,752 |
| MKS Instruments, Inc. | | 21,244 | 3,780,370 |
| Monolithic Power Systems, Inc. | | 28,108 | 10,496,933 |
| Silicon Laboratories, Inc. (a) | | 10,677 | 1,636,250 |
| | | | | $26,193,987 |
| Food & Beverages – 0.3% | |
| Oatly Group AB, ADR (a) | | 62,513 | $ 1,529,068 |
| Gaming & Lodging – 2.5% | |
| Caesars Entertainment, Inc. (a) | | 30,835 | $ 3,199,131 |
| DraftKings, Inc. (a) | | 18,174 | 948,138 |
| Penn National Gaming, Inc. (a) | | 31,686 | 2,423,662 |
| Red Rock Resorts, Inc. (a) | | 66,485 | 2,825,613 |
| Vail Resorts, Inc. (a) | | 4,637 | 1,467,703 |
| | | | | $10,864,247 |
MFS Mid Cap Growth Series
Portfolio of Investments (unaudited) – continued
| Issuer | | | Shares/Par | Value ($) |
| Common Stocks – continued |
| General Merchandise – 0.7% | |
| Five Below, Inc. (a) | | 15,393 | $ 2,975,005 |
| Insurance – 1.7% | |
| Arthur J. Gallagher & Co. | | 52,654 | $ 7,375,772 |
| Internet – 3.4% | |
| IAC/InterActiveCorp (a) | | 24,700 | $ 3,807,999 |
| Match Group, Inc. (a) | | 57,889 | 9,334,601 |
| Vimeo, Inc. (a) | | 40,099 | 1,964,851 |
| | | | | $15,107,451 |
| Leisure & Toys – 2.6% | |
| Electronic Arts, Inc. | | 13,668 | $ 1,965,868 |
| Roblox Corp., “A” (a) | | 17,324 | 1,558,814 |
| Take-Two Interactive Software, Inc. (a) | | 44,038 | 7,795,607 |
| | | | | $11,320,289 |
| Machinery & Tools – 1.7% | |
| IDEX Corp. | | 29,505 | $ 6,492,575 |
| Roper Technologies, Inc. | | 1,773 | 833,665 |
| | | | | $7,326,240 |
| Medical & Health Technology & Services – 6.0% | |
| Charles River Laboratories International, Inc. (a) | | 28,444 | $ 10,522,005 |
| Guardant Health, Inc. (a) | | 21,072 | 2,616,932 |
| HealthEquity, Inc. (a) | | 12,696 | 1,021,774 |
| ICON PLC (a) | | 29,122 | 6,019,809 |
| IDEXX Laboratories, Inc. (a) | | 6,360 | 4,016,658 |
| LifeStance Health Group, Inc. (a) | | 34,162 | 951,753 |
| Quest Diagnostics, Inc. | | 8,353 | 1,102,345 |
| | | | | $26,251,276 |
| Medical Equipment – 11.9% | |
| Agilent Technologies, Inc. | | 34,565 | $ 5,109,052 |
| Align Technology, Inc. (a) | | 7,925 | 4,842,175 |
| Bio-Techne Corp. | | 17,272 | 7,776,891 |
| Maravai Lifesciences Holdings, Inc., “A” (a) | | 69,040 | 2,881,039 |
| Masimo Corp. (a) | | 19,471 | 4,720,744 |
| Mettler-Toledo International, Inc. (a) | | 1,417 | 1,963,027 |
| PerkinElmer, Inc. | | 71,888 | 11,100,226 |
| STERIS PLC | | 39,754 | 8,201,250 |
| West Pharmaceutical Services, Inc. | | 16,588 | 5,956,751 |
| | | | | $52,551,155 |
| Network & Telecom – 0.9% | |
| CoreSite Realty Corp., REIT | | 29,825 | $ 4,014,445 |
| Other Banks & Diversified Financials – 0.4% | |
| Altimeter Growth Corp. (a) | | 65,079 | $ 800,472 |
| Altimeter Growth Corp. 2 (a) | | 60,282 | 617,890 |
| Catalyst Partners Acquisition Corp. (a) | | 41,381 | 415,465 |
| | | | | $1,833,827 |
| Pharmaceuticals – 0.5% | |
| Ascendis Pharma (a) | | 16,732 | $ 2,201,095 |
| Issuer | | | Shares/Par | Value ($) |
| Common Stocks – continued |
| Pollution Control – 0.5% | |
| Waste Connections, Inc. | | 20,112 | $ 2,401,976 |
| Printing & Publishing – 1.6% | |
| Warner Music Group Corp. | | 31,256 | $ 1,126,466 |
| Wolters Kluwer N.V. | | 58,357 | 5,862,355 |
| | | | | $6,988,821 |
| Railroad & Shipping – 0.6% | |
| Kansas City Southern Co. | | 9,583 | $ 2,715,535 |
| Real Estate – 0.5% | |
| Extra Space Storage, Inc., REIT | | 13,882 | $ 2,274,149 |
| Restaurants – 2.1% | |
| Chipotle Mexican Grill, Inc., “A” (a) | | 3,371 | $ 5,226,196 |
| Domino's Pizza, Inc. | | 8,815 | 4,112,109 |
| | | | | $9,338,305 |
| Specialty Stores – 5.6% | |
| Burlington Stores, Inc. (a) | | 20,575 | $ 6,624,944 |
| Chewy, Inc., “A” (a) | | 34,711 | 2,766,814 |
| Lululemon Athletica, Inc. (a) | | 13,246 | 4,834,393 |
| O'Reilly Automotive, Inc. (a) | | 6,188 | 3,503,707 |
| Petco Health & Wellness Co., Inc. (a) | | 18,468 | 413,868 |
| Tractor Supply Co. | | 14,742 | 2,742,897 |
| Ulta Beauty, Inc. (a) | | 11,369 | 3,931,059 |
| | | | | $24,817,682 |
| Telecommunications - Wireless – 0.8% | |
| SBA Communications Corp., REIT | | 10,943 | $ 3,487,534 |
| Total Common Stocks (Identified Cost, $210,732,899) | | $437,135,164 |
| | Strike
Price | First
Exercise | | |
| Warrants – 0.0% | | | | |
| Business Services – 0.0% | | | | |
| Paysafe Ltd. (1 share for 1 warrant, Expiration 12/31/28) (a) (Identified Cost, $74,706) | $11.50 | 4/16/21 | 22,336 | $ 79,963 |
| | | | | |
| Investment Companies (h) – 0.1% |
| Money Market Funds – 0.1% | |
| MFS Institutional Money Market Portfolio, 0.02% (v) (Identified Cost, $303,151) | | | 303,151 | $ 303,151 |
| Other Assets, Less Liabilities – 0.7% | | 3,108,568 |
| Net Assets – 100.0% | $440,626,846 |
MFS Mid Cap Growth Series
Portfolio of Investments (unaudited) – continued
| (a) | Non-income producing security. |
| (h) | An affiliated issuer, which may be considered one in which the fund owns 5% or more of the outstanding voting securities, or a company which is under common control. At period end, the aggregate values of the fund's investments in affiliated issuers and in unaffiliated issuers were $303,151 and $437,215,127, respectively. |
| (u) | The security was valued using significant unobservable inputs and is considered level 3 under the fair value hierarchy. For further information about the fund’s level 3 holdings, please see Note 2 in the Notes to Financial Statements. |
| (v) | Affiliated issuer that is available only to investment companies managed by MFS. The rate quoted for the MFS Institutional Money Market Portfolio is the annualized seven-day yield of the fund at period end. |
| (w) | When-issued security. |
| (z) | Restricted securities are not registered under the Securities Act of 1933 and are subject to legal restrictions on resale. These securities generally may be resold in transactions exempt from registration or to the public if the securities are subsequently registered. Disposal of these securities may involve time-consuming negotiations and prompt sale at an acceptable price may be difficult. The fund holds the following restricted securities: |
| Restricted Securities | Acquisition
Date | Cost | Value |
| Dragoneer Growth Opportunities Corp. (PIPE) | 2/02/21 | $138,840 | $132,962 |
| % of Net assets | | | 0.0% |
| (zz) | Securities subject to a restriction on resale. | | | |
| The following abbreviations are used in this report and are defined: |
| ADR | American Depositary Receipt |
| PIPE | Private Investment in Public Equity |
| REIT | Real Estate Investment Trust |
| SPAC | Special Purpose Acquisition Company |
See Notes to Financial Statements
MFS Mid Cap Growth Series
| Financial Statements | Statement of Assets and Liabilities (unaudited) |
This statement represents your fund’s balance sheet, which details the assets and liabilities comprising the total value of the fund.
| At 6/30/21Assets | |
| Investments in unaffiliated issuers, at value (identified cost, $210,807,605) | $437,215,127 |
| Investments in affiliated issuers, at value (identified cost, $303,151) | 303,151 |
| Cash | 138,840 |
| Receivables for | |
| Investments sold | 4,204,055 |
| Fund shares sold | 209,744 |
| Interest and dividends | 127,394 |
| Other assets | 1,253 |
| Total assets | $442,199,564 |
| Liabilities | |
| Payables for | |
| Fund shares reacquired | $1,344,897 |
| When-issued investments purchased | 138,840 |
| Payable to affiliates | |
| Investment adviser | 17,909 |
| Administrative services fee | 376 |
| Shareholder servicing costs | 261 |
| Distribution and/or service fees | 1,864 |
| Accrued expenses and other liabilities | 68,571 |
| Total liabilities | $1,572,718 |
| Net assets | $440,626,846 |
| Net assets consist of | |
| Paid-in capital | $99,362,582 |
| Total distributable earnings (loss) | 341,264,264 |
| Net assets | $440,626,846 |
| Shares of beneficial interest outstanding | 34,095,831 |
| | Net assets | Shares
outstanding | Net asset value
per share |
| Initial Class | $305,283,432 | 22,939,937 | $13.31 |
| Service Class | 135,343,414 | 11,155,894 | 12.13 |
See Notes to Financial Statements
MFS Mid Cap Growth Series
| Financial Statements | Statement of Operations (unaudited) |
This statement describes how much your fund earned in investment income and accrued in expenses. It also describes any gains and/or losses generated by fund operations.
| Six months ended 6/30/21 | |
| Net investment income (loss) | |
| Income | |
| Dividends | $788,521 |
| Other | 7,831 |
| Income on securities loaned | 1,313 |
| Dividends from affiliated issuers | 793 |
| Foreign taxes withheld | (14,705) |
| Total investment income | $783,753 |
| Expenses | |
| Management fee | $1,611,288 |
| Distribution and/or service fees | 161,016 |
| Shareholder servicing costs | 11,692 |
| Administrative services fee | 32,919 |
| Independent Trustees' compensation | 4,196 |
| Custodian fee | 13,492 |
| Shareholder communications | 11,391 |
| Audit and tax fees | 29,711 |
| Legal fees | 1,592 |
| Miscellaneous | 13,381 |
| Total expenses | $1,890,678 |
| Reduction of expenses by investment adviser | (25,629) |
| Net expenses | $1,865,049 |
| Net investment income (loss) | $(1,081,296) |
| Realized and unrealized gain (loss) | |
| Realized gain (loss) (identified cost basis) | |
| Unaffiliated issuers | $28,525,501 |
| Foreign currency | 1,600 |
| Net realized gain (loss) | $28,527,101 |
| Change in unrealized appreciation or depreciation | |
| Unaffiliated issuers | $(4,710,903) |
| Translation of assets and liabilities in foreign currencies | (1,676) |
| Net unrealized gain (loss) | $(4,712,579) |
| Net realized and unrealized gain (loss) | $23,814,522 |
| Change in net assets from operations | $22,733,226 |
See Notes to Financial Statements
MFS Mid Cap Growth Series
| Financial Statements | Statements of Changes in Net Assets |
These statements describe the increases and/or decreases in net assets resulting from operations, any distributions, and any shareholder transactions.
| | Six months ended | Year ended |
| | 6/30/21
(unaudited) | 12/31/20 |
| Change in net assets | | |
| From operations | | |
| Net investment income (loss) | $(1,081,296) | $(1,271,494) |
| Net realized gain (loss) | 28,527,101 | 88,862,036 |
| Net unrealized gain (loss) | (4,712,579) | 39,918,078 |
| Change in net assets from operations | $22,733,226 | $127,508,620 |
| Total distributions to shareholders | $— | $(29,460,280) |
| Change in net assets from fund share transactions | $(25,939,318) | $(48,232,077) |
| Total change in net assets | $(3,206,092) | $49,816,263 |
| Net assets | | |
| At beginning of period | 443,832,938 | 394,016,675 |
| At end of period | $440,626,846 | $443,832,938 |
See Notes to Financial Statements
MFS Mid Cap Growth Series
| Financial Statements | Financial Highlights |
The financial highlights table is intended to help you understand the fund's financial performance for the semiannual period and the past 5 fiscal years. Certain information reflects financial results for a single fund share. The total returns in the table represent the rate that an investor would have earned (or lost) on an investment in the fund share class (assuming reinvestment of all distributions) held for the entire period.
| Initial Class | Six months
ended | Year ended |
| | 6/30/21
(unaudited) | 12/31/20 | 12/31/19 | 12/31/18 | 12/31/17 | 12/31/16 |
| Net asset value, beginning of period | $12.64 | $9.96 | $8.23 | $9.51 | $7.96 | $8.21 |
| Income (loss) from investment operations | | | | | | |
| Net investment income (loss) (d) | $(0.03) | $(0.03) | $(0.01) | $(0.02) | $(0.01) | $0.01(c) |
| Net realized and unrealized gain (loss) | 0.70 | 3.53 | 3.10 | 0.39 | 2.11 | 0.41 |
| Total from investment operations | $0.67 | $3.50 | $3.09 | $0.37 | $2.10 | $0.42 |
| Less distributions declared to shareholders | | | | | | |
| From net investment income | $— | $— | $— | $— | $(0.01) | $— |
| From net realized gain | — | (0.82) | (1.36) | (1.65) | (0.54) | (0.67) |
| Total distributions declared to shareholders | $— | $(0.82) | $(1.36) | $(1.65) | $(0.55) | $(0.67) |
| Net asset value, end of period (x) | $13.31 | $12.64 | $9.96 | $8.23 | $9.51 | $7.96 |
| Total return (%) (k)(r)(s)(x) | 5.30(n) | 36.48 | 38.66 | 1.24 | 27.00 | 4.91(c) |
Ratios (%) (to average net assets)
and Supplemental data: | | | | | | |
| Expenses before expense reductions (f) | 0.81(a) | 0.81 | 0.81 | 0.81 | 0.81 | 0.75(c) |
| Expenses after expense reductions (f) | 0.79(a) | 0.80 | 0.80 | 0.80 | 0.80 | 0.74(c) |
| Net investment income (loss) | (0.43)(a) | (0.26) | (0.07) | (0.18) | (0.15) | 0.15(c) |
| Portfolio turnover | 11(n) | 40 | 17 | 21 | 32 | 37 |
| Net assets at end of period (000 omitted) | $305,283 | $311,988 | $290,512 | $247,614 | $297,463 | $294,226 |
See Notes to Financial Statements
MFS Mid Cap Growth Series
Financial Highlights - continued
| Service Class | Six months
ended | Year ended |
| | 6/30/21
(unaudited) | 12/31/20 | 12/31/19 | 12/31/18 | 12/31/17 | 12/31/16 |
| Net asset value, beginning of period | $11.53 | $9.17 | $7.68 | $8.99 | $7.56 | $7.85 |
| Income (loss) from investment operations | | | | | | |
| Net investment income (loss) (d) | $(0.04) | $(0.05) | $(0.03) | $(0.04) | $(0.03) | $(0.01)(c) |
| Net realized and unrealized gain (loss) | 0.64 | 3.23 | 2.88 | 0.38 | 2.00 | 0.39 |
| Total from investment operations | $0.60 | $3.18 | $2.85 | $0.34 | $1.97 | $0.38 |
| Less distributions declared to shareholders | | | | | | |
| From net investment income | $— | $— | $— | $— | $— | $— |
| From net realized gain | — | (0.82) | (1.36) | (1.65) | (0.54) | (0.67) |
| Total distributions declared to shareholders | $— | $(0.82) | $(1.36) | $(1.65) | $(0.54) | $(0.67) |
| Net asset value, end of period (x) | $12.13 | $11.53 | $9.17 | $7.68 | $8.99 | $7.56 |
| Total return (%) (k)(r)(s)(x) | 5.20(n) | 36.12 | 38.28 | 0.95 | 26.68 | 4.62(c) |
Ratios (%) (to average net assets)
and Supplemental data: | | | | | | |
| Expenses before expense reductions (f) | 1.05(a) | 1.06 | 1.06 | 1.06 | 1.06 | 0.99(c) |
| Expenses after expense reductions (f) | 1.04(a) | 1.05 | 1.05 | 1.05 | 1.05 | 0.99(c) |
| Net investment income (loss) | (0.68)(a) | (0.51) | (0.32) | (0.43) | (0.40) | (0.08)(c) |
| Portfolio turnover | 11(n) | 40 | 17 | 21 | 32 | 37 |
| Net assets at end of period (000 omitted) | $135,343 | $131,845 | $103,504 | $86,560 | $100,052 | $87,529 |
| (a) | Annualized. |
| (c) | Amount reflects a one-time reimbursement of expenses by the custodian (or former custodian) without which net investment income and performance would be lower and expenses would be higher. |
| (d) | Per share data is based on average shares outstanding. |
| (f) | Ratios do not reflect reductions from fees paid indirectly, if applicable. |
| (k) | The total return does not reflect expenses that apply to separate accounts. Inclusion of these charges would reduce the total return figures for all periods shown. |
| (n) | Not annualized. |
| (r) | Certain expenses have been reduced without which performance would have been lower. |
| (s) | From time to time the fund may receive proceeds from litigation settlements, without which performance would be lower. |
| (x) | The net asset values and total returns have been calculated on net assets which include adjustments made in accordance with U.S. generally accepted accounting principles required at period end for financial reporting purposes. |
See Notes to Financial Statements
MFS Mid Cap Growth Series
Notes to Financial Statements (unaudited)
(1) Business and Organization
MFS Mid Cap Growth Series (the fund) is a diversified series of MFS Variable Insurance Trust (the trust). The trust is organized as a Massachusetts business trust and is registered under the Investment Company Act of 1940, as amended, as an open-end management investment company. The shareholders of each series of the trust are separate accounts of insurance companies, which offer variable annuity and/or life insurance products, and qualified retirement and pension plans.
The fund is an investment company and accordingly follows the investment company accounting and reporting guidance of the Financial Accounting Standards Board (FASB) Accounting Standards Codification Topic 946 Financial Services - Investment Companies.
(2) Significant Accounting Policies
General — The preparation of financial statements in conformity with U.S. generally accepted accounting principles requires management to make estimates and assumptions that affect the reported amounts of assets and liabilities, and disclosure of contingent assets and liabilities at the date of the financial statements and the reported amounts of increases and decreases in net assets from operations during the reporting period. Actual results could differ from those estimates. In the preparation of these financial statements, management has evaluated subsequent events occurring after the date of the fund’s Statement of Assets and Liabilities through the date that the financial statements were issued.
Certain of the fund's investments, derivatives, debt and other contracts may be based on reference interest rates such as the London Interbank Offered Rate (“LIBOR”). In 2017, the regulatory authority that oversees financial services firms in the United Kingdom announced plans to transition away from LIBOR by the end of 2021. In March 2021, the administrator of LIBOR announced the extension of the publication of the more commonly used U.S. dollar LIBOR settings to the end of June 2023. Although the full impacts of the transition away from LIBOR are not fully known, the transition may result in, among other things, an increase in volatility or illiquidity of the markets for instruments that currently rely on LIBOR to determine interest rates and this could have an adverse impact on the fund's performance. With respect to the fund's accounting for investments, derivatives, debt and other contracts that undergo reference rate-related modifications as a result of the transition, management will rely upon the relief provided by FASB Codification Topic 848 – Reference Rate Reform (Topic 848). The guidance in Topic 848 permits the fund to disregard the GAAP accounting requirements around certain contract modifications resulting from the LIBOR transition such that for contracts considered in scope, the fund can account for those modified contracts as a continuation of the existing contracts.
Balance Sheet Offsetting — The fund's accounting policy with respect to balance sheet offsetting is that, absent an event of default by the counterparty or a termination of the agreement, the International Swaps and Derivatives Association (ISDA) Master Agreement, or similar agreement, does not result in an offset of reported amounts of financial assets and financial liabilities in the Statement of Assets and Liabilities across transactions between the fund and the applicable counterparty. The fund's right to setoff may be restricted or prohibited by the bankruptcy or insolvency laws of the particular jurisdiction to which a specific master netting agreement counterparty is subject. Balance sheet offsetting disclosures, to the extent applicable to the fund, have been included in the fund’s Significant Accounting Policies note under the captions for each of the fund’s in-scope financial instruments and transactions.
Investment Valuations — Equity securities, including restricted equity securities, are generally valued at the last sale or official closing price on their primary market or exchange as provided by a third-party pricing service. Equity securities, for which there were no sales reported that day, are generally valued at the last quoted daily bid quotation on their primary market or exchange as provided by a third-party pricing service. Short-term instruments with a maturity at issuance of 60 days or less may be valued at amortized cost, which approximates market value. Open-end investment companies are generally valued at net asset value per share.
Securities and other assets generally valued on the basis of information from a third-party pricing service may also be valued at a broker/dealer bid quotation. In determining values, third-party pricing services can utilize both transaction data and market information such as yield, quality, coupon rate, maturity, type of issue, trading characteristics, and other market data. The values of foreign securities and other assets and liabilities expressed in foreign currencies are converted to U.S. dollars using the mean of bid and asked prices for rates provided by a third-party pricing service.
The Board of Trustees has delegated primary responsibility for determining or causing to be determined the value of the fund’s investments (including any fair valuation) to the adviser pursuant to valuation policies and procedures approved by the Board. If the adviser determines that reliable market quotations are not readily available, investments are valued at fair value as determined in good faith by the adviser in accordance with such procedures under the oversight of the Board of Trustees. Under the fund’s valuation policies and procedures, market quotations are not considered to be readily available for most types of debt instruments and floating rate loans and many types of derivatives. These investments are generally valued at fair value based on information from third-party pricing services. In addition, investments may be valued at fair value if the adviser determines that an investment’s value has been materially affected by events occurring after the close of the exchange or market on which the investment is principally
MFS Mid Cap Growth Series
Notes to Financial Statements (unaudited) - continued
traded (such as foreign exchange or market) and prior to the determination of the fund’s net asset value, or after the halt of trading of a specific security where trading does not resume prior to the close of the exchange or market on which the security is principally traded. Events that occur after foreign markets close (such as developments in foreign markets and significant movements in the U.S. markets) and prior to the determination of the fund’s net asset value may be deemed to have a material effect on the value of securities traded in foreign markets. Accordingly, the fund’s foreign equity securities may often be valued at fair value. The adviser generally relies on third-party pricing services or other information (such as the correlation with price movements of similar securities in the same or other markets; the type, cost and investment characteristics of the security; the business and financial condition of the issuer; and trading and other market data) to assist in determining whether to fair value and at what value to fair value an investment. The value of an investment for purposes of calculating the fund’s net asset value can differ depending on the source and method used to determine value. When fair valuation is used, the value of an investment used to determine the fund’s net asset value may differ from quoted or published prices for the same investment. There can be no assurance that the fund could obtain the fair value assigned to an investment if it were to sell the investment at the same time at which the fund determines its net asset value per share.
Various inputs are used in determining the value of the fund's assets or liabilities. These inputs are categorized into three broad levels. In certain cases, the inputs used to measure fair value may fall into different levels of the fair value hierarchy. In such cases, an investment's level within the fair value hierarchy is based on the lowest level of input that is significant to the fair value measurement. The fund's assessment of the significance of a particular input to the fair value measurement in its entirety requires judgment, and considers factors specific to the investment. Level 1 includes unadjusted quoted prices in active markets for identical assets or liabilities. Level 2 includes other significant observable market-based inputs (including quoted prices for similar securities, interest rates, prepayment speed, and credit risk). Level 3 includes unobservable inputs, which may include the adviser's own assumptions in determining the fair value of investments. The following is a summary of the levels used as of June 30, 2021 in valuing the fund's assets or liabilities:
| Financial Instruments | Level 1 | Level 2 | Level 3 | Total |
| Equity Securities: | | | | |
| United States | $396,244,763 | $— | $132,962 | $396,377,725 |
| Israel | 9,380,254 | — | — | 9,380,254 |
| Netherlands | 8,957,037 | — | — | 8,957,037 |
| Canada | 7,519,436 | — | — | 7,519,436 |
| United Kingdom | 6,759,771 | — | — | 6,759,771 |
| Ireland | 6,019,809 | — | — | 6,019,809 |
| Denmark | 2,201,095 | — | — | 2,201,095 |
| Mutual Funds | 303,151 | — | — | 303,151 |
| Total | $437,385,316 | $— | $132,962 | $437,518,278 |
For further information regarding security characteristics, see the Portfolio of Investments.
The following is a reconciliation of level 3 assets for which significant unobservable inputs were used to determine fair value. The table presents the activity of level 3 securities held at the beginning and the end of the period.
| | Equity
Securities |
| Balance as of 12/31/20 | $— |
| Purchases | 132,962 |
| Balance as of 6/30/21 | $132,962 |
At June 30, 2021, the fund held one level 3 security.
Foreign Currency Translation — Purchases and sales of foreign investments, income, and expenses are converted into U.S. dollars based upon currency exchange rates prevailing on the respective dates of such transactions or on the reporting date for foreign denominated receivables and payables. Gains and losses attributable to foreign currency exchange rates on sales of securities are recorded for financial statement purposes as net realized gains and losses on investments. Gains and losses attributable to foreign exchange rate movements on receivables, payables, income and expenses are recorded for financial statement purposes as foreign currency transaction gains and losses. That portion of both realized and unrealized gains and losses on investments that results from fluctuations in foreign currency exchange rates is not separately disclosed.
Security Loans — Under its Securities Lending Agency Agreement with the fund, State Street Bank and Trust Company, as lending agent, loans the securities of the fund to certain qualified institutions (the “Borrowers”) approved by the fund. Security loans can be terminated at the discretion of either the lending agent or the fund and the related securities must be returned within the earlier of the standard trade settlement period for such securities or within three business days. The loans are collateralized by cash and/or
MFS Mid Cap Growth Series
Notes to Financial Statements (unaudited) - continued
U.S. Treasury and federal agency obligations in an amount typically at least equal to the market value of the securities loaned. On loans collateralized by cash, the cash collateral is invested in a money market fund. The market value of the loaned securities is determined at the close of business of the fund and any additional required collateral is delivered to the fund on the next business day. The lending agent provides the fund with indemnification against Borrower default. In the event of Borrower default, the lending agent will, for the benefit of the fund, either purchase securities identical to those loaned or, when such purchase is commercially impracticable, pay the fund the market value of the loaned securities. In return, the lending agent assumes the fund's rights to the related collateral. If the collateral value is less than the cost to purchase identical securities, the lending agent is responsible for the shortfall, but only to the extent that such shortfall is not due to a decline in collateral value resulting from collateral reinvestment for which the fund bears the risk of loss. A portion of the income generated upon investment of the collateral is remitted to the Borrowers, and the remainder is allocated between the fund and the lending agent. On loans collateralized by U.S. Treasury and/or federal agency obligations, a fee is received from the Borrower, and is allocated between the fund and the lending agent. Income from securities lending is separately reported in the Statement of Operations. The dividend and interest income earned on the securities loaned is accounted for in the same manner as other dividend and interest income. At June 30, 2021, there were no securities on loan or collateral outstanding.
Indemnifications — Under the fund's organizational documents, its officers and Trustees may be indemnified against certain liabilities and expenses arising out of the performance of their duties to the fund. Additionally, in the normal course of business, the fund enters into agreements with service providers that may contain indemnification clauses. The fund's maximum exposure under these agreements is unknown as this would involve future claims that may be made against the fund that have not yet occurred.
Investment Transactions and Income — Investment transactions are recorded on the trade date. Some securities may be purchased or sold on an extended settlement basis, which means that the receipt or delivery of the securities by the fund and related payments occur at a future date, usually beyond the customary settlement period. Interest income is recorded on the accrual basis.
Dividends received in cash are recorded on the ex-dividend date. Certain dividends from foreign securities will be recorded when the fund is informed of the dividend if such information is obtained subsequent to the ex-dividend date. Dividend payments received in additional securities are recorded on the ex-dividend date in an amount equal to the value of the security on such date.
The fund may purchase or sell securities on a when-issued or delayed delivery basis. In these extended settlement transactions, the receipt or delivery of the securities by the fund and related payments occur at a future date, usually beyond the normal settlement period. The price of such security and the date that the security will be settled are generally fixed at the time the transaction is negotiated. The value of the security varies with market fluctuations and for debt securities no interest accrues to the fund until settlement takes place. When the fund sells securities on a when-issued or delayed delivery basis, the fund typically owns or has the right to acquire securities equivalent in kind and amount to the securities sold. Purchase and sale commitments for when-issued or delayed delivery securities are held at carrying amount, which approximates fair value and are categorized as level 2 within the fair value hierarchy, and included in When-issued investments purchased in the Statement of Assets and Liabilities. Losses may arise due to changes in the value of the underlying securities prior to settlement date or if the counterparty does not perform under the contract’s terms, or if the issuer does not issue the securities due to political, economic or other factors. At the time that it enters into a when-issued or delayed delivery transaction, the fund is required to have sufficient cash and/or liquid securities to cover its commitments.
The fund may receive proceeds from litigation settlements. Any proceeds received from litigation involving portfolio holdings are reflected in the Statement of Operations in realized gain/loss if the security has been disposed of by the fund or in unrealized gain/loss if the security is still held by the fund. Any other proceeds from litigation not related to portfolio holdings are reflected as other income in the Statement of Operations.
Tax Matters and Distributions — The fund intends to qualify as a regulated investment company, as defined under Subchapter M of the Internal Revenue Code, and to distribute all of its taxable income, including realized capital gains. As a result, no provision for federal income tax is required. The fund’s federal tax returns, when filed, will remain subject to examination by the Internal Revenue Service for a three year period. Management has analyzed the fund’s tax positions taken on federal and state tax returns for all open tax years and does not believe that there are any uncertain tax positions that require recognition of a tax liability. Foreign taxes, if any, have been accrued by the fund in the accompanying financial statements in accordance with the applicable foreign tax law. Foreign income taxes may be withheld by certain countries in which the fund invests. Additionally, capital gains realized by the fund on securities issued in or by certain foreign countries may be subject to capital gains tax imposed by those countries.
MFS Mid Cap Growth Series
Notes to Financial Statements (unaudited) - continued
Distributions to shareholders are recorded on the ex-dividend date. Income and capital gain distributions are determined in accordance with income tax regulations, which may differ from U.S. generally accepted accounting principles. Certain capital accounts in the financial statements are periodically adjusted for permanent differences in order to reflect their tax character. These adjustments have no impact on net assets or net asset value per share. Temporary differences which arise from recognizing certain items of income, expense, gain or loss in different periods for financial statement and tax purposes will reverse at some time in the future.
Book/tax differences primarily relate to wash sale loss deferrals.
The tax character of distributions declared to shareholders for the last fiscal year is as follows:
| | Year ended
12/31/20 |
| Ordinary income (including any short-term capital gains) | $1,520,227 |
| Long-term capital gains | 27,940,053 |
| Total distributions | $29,460,280 |
The federal tax cost and the tax basis components of distributable earnings were as follows:
| As of 6/30/21 | |
| Cost of investments | $211,793,785 |
| Gross appreciation | 227,350,008 |
| Gross depreciation | (1,625,515) |
| Net unrealized appreciation (depreciation) | $225,724,493 |
| As of 12/31/20 | |
| Undistributed ordinary income | 1,059,807 |
| Undistributed long-term capital gain | 87,002,534 |
| Other temporary differences | 5,276 |
| Net unrealized appreciation (depreciation) | 230,463,421 |
The aggregate cost above includes prior fiscal year end tax adjustments, if applicable.
Multiple Classes of Shares of Beneficial Interest — The fund offers multiple classes of shares, which differ in their respective distribution and/or service fees. The fund's income, realized and unrealized gain (loss), and common expenses are allocated to shareholders based on the daily net assets of each class. Dividends are declared separately for each class. Differences in per share dividend rates are generally due to differences in separate class expenses. The fund’s distributions declared to shareholders as reported in the Statements of Changes in Net Assets are presented by class as follows:
| | Six months
ended
6/30/21 | | Year
ended
12/31/20 |
| Initial Class | $— | | $20,588,572 |
| Service Class | — | | 8,871,708 |
| Total | $— | | $29,460,280 |
(3) Transactions with Affiliates
Investment Adviser — The fund has an investment advisory agreement with MFS to provide overall investment management and related administrative services and facilities to the fund. The management fee is computed daily and paid monthly at the following annual rates based on the fund's average daily net assets:
| Up to $1 billion | 0.75% |
| In excess of $1 billion | 0.70% |
MFS has agreed in writing to reduce its management fee by a specified amount if certain MFS mutual fund assets exceed thresholds agreed to by MFS and the fund's Board of Trustees. For the six months ended June 30, 2021, this management fee reduction amounted to $25,629, which is included in the reduction of total expenses in the Statement of Operations. The management fee incurred for the six months ended June 30, 2021 was equivalent to an annual effective rate of 0.74% of the fund's average daily net assets.
MFS Mid Cap Growth Series
Notes to Financial Statements (unaudited) - continued
Distributor — MFS Fund Distributors, Inc. (MFD), a wholly-owned subsidiary of MFS, is the distributor of shares of the fund. The Trustees have adopted a distribution plan for the Service Class shares pursuant to Rule 12b-1 under the Investment Company Act of 1940.
The fund's distribution plan provides that the fund will pay MFD distribution and/or service fees equal to 0.25% per annum of its average daily net assets attributable to Service Class shares as partial consideration for services performed and expenses incurred by MFD and financial intermediaries (including participating insurance companies that invest in the fund to fund variable annuity and variable life insurance contracts, sponsors of qualified retirement and pension plans that invest in the fund, and affiliates of these participating insurance companies and plan sponsors) in connection with the sale and distribution of the Service Class shares. MFD may subsequently pay all, or a portion, of the distribution and/or service fees to financial intermediaries.
Shareholder Servicing Agent — MFS Service Center, Inc. (MFSC), a wholly-owned subsidiary of MFS, receives a fee from the fund for its services as shareholder servicing agent. For the six months ended June 30, 2021, the fee was $11,178, which equated to 0.0052% annually of the fund's average daily net assets. MFSC also receives reimbursement from the fund for out-of-pocket expenses paid by MFSC on behalf of the fund. For the six months ended June 30, 2021, these costs amounted to $514.
Administrator — MFS provides certain financial, legal, shareholder communications, compliance, and other administrative services to the fund. Under an administrative services agreement, the fund reimburses MFS the costs incurred to provide these services. The fund is charged an annual fixed amount of $17,500 plus a fee based on average daily net assets. The administrative services fee incurred for the six months ended June 30, 2021 was equivalent to an annual effective rate of 0.0153% of the fund's average daily net assets.
Trustees’ and Officers’ Compensation — The fund pays compensation to independent Trustees in the form of a retainer, attendance fees, and additional compensation to Board and Committee chairpersons. The fund does not pay compensation directly to Trustees or officers of the fund who are also officers of the investment adviser, all of whom receive remuneration from MFS for their services to the fund. Certain officers and Trustees of the fund are officers or directors of MFS, MFD, and MFSC.
Other — The fund invests in the MFS Institutional Money Market Portfolio which is managed by MFS and seeks current income consistent with preservation of capital and liquidity. This money market fund does not pay a management fee to MFS but does incur investment and operating costs.
The fund is permitted to engage in purchase and sale transactions with funds and accounts for which MFS serves as investment adviser or sub-adviser (“cross-trades”) pursuant to a policy adopted by the Board of Trustees. This policy has been designed to ensure that cross-trades conducted by the fund comply with Rule 17a-7 under the Investment Company Act of 1940. During the six months ended June 30, 2021, the fund engaged in sale transactions pursuant to this policy, which amounted to $277,311. The sales transactions resulted in net realized gains (losses) of $165,250.
The adviser has voluntarily undertaken to reimburse the fund from its own resources on a quarterly basis for the cost of investment research embedded in the cost of the fund’s securities trades. This agreement may be rescinded at any time. For the six months ended June 30, 2021, this reimbursement amounted to $7,769, which is included in “Other” income in the Statement of Operations.
(4) Portfolio Securities
For the six months ended June 30, 2021, purchases and sales of investments, other than short-term obligations, aggregated $45,097,224 and $73,291,308, respectively.
(5) Shares of Beneficial Interest
The fund's Declaration of Trust permits the Trustees to issue an unlimited number of full and fractional shares of beneficial interest. Transactions in fund shares were as follows:
| | Six months ended
6/30/21 | | Year ended
12/31/20 |
| | Shares | Amount | | Shares | Amount |
| Shares sold | | | | | |
| Initial Class | 931,204 | $11,748,058 | | 2,228,807 | $21,405,127 |
| Service Class | 1,431,727 | 16,460,623 | | 3,158,059 | 30,335,847 |
| | 2,362,931 | $28,208,681 | | 5,386,866 | $51,740,974 |
MFS Mid Cap Growth Series
Notes to Financial Statements (unaudited) - continued
| | Six months ended
6/30/21 | | Year ended
12/31/20 |
| | Shares | Amount | | Shares | Amount |
Shares issued to shareholders
in reinvestment of distributions | | | | | |
| Initial Class | — | $— | | 1,877,652 | $20,372,526 |
| Service Class | — | — | | 895,228 | 8,871,708 |
| | — | $— | | 2,772,880 | $29,244,234 |
| Shares reacquired | | | | | |
| Initial Class | (2,680,957) | $(34,323,417) | | (8,598,413) | $(91,175,151) |
| Service Class | (1,706,755) | (19,824,582) | | (3,909,750) | (38,042,134) |
| | (4,387,712) | $(54,147,999) | | (12,508,163) | $(129,217,285) |
| Net change | | | | | |
| Initial Class | (1,749,753) | $(22,575,359) | | (4,491,954) | $(49,397,498) |
| Service Class | (275,028) | (3,363,959) | | 143,537 | 1,165,421 |
| | (2,024,781) | $(25,939,318) | | (4,348,417) | $(48,232,077) |
The fund is one of several mutual funds in which certain MFS funds may invest. The MFS funds do not invest in the underlying funds for the purpose of exercising management or control. At the end of the period, the MFS Moderate Allocation Portfolio, the MFS Growth Allocation Portfolio, and the MFS Conservative Allocation Portfolio were the owners of record of approximately 23%, 8%, and 4%, respectively, of the value of outstanding voting shares of the fund.
(6) Line of Credit
The fund and certain other funds managed by MFS participate in a $1.25 billion unsecured committed line of credit of which $1 billion is reserved for use by the fund and certain other MFS U.S. funds. The line of credit is provided by a syndicate of banks under a credit agreement. Borrowings may be made for temporary financing needs. Interest is charged to each fund, based on its borrowings, generally at a rate equal to the highest of one month LIBOR, the Federal Funds Effective Rate and the Overnight Bank Funding Rate, plus an agreed upon spread. A commitment fee, based on the average daily, unused portion of the committed line of credit, is allocated among the participating funds. In addition, the fund and other funds managed by MFS have established unsecured uncommitted borrowing arrangements with certain banks for temporary financing needs. Interest is charged to each fund, based on its borrowings, at rates equal to customary reference rates plus an agreed upon spread. For the six months ended June 30, 2021, the fund’s commitment fee and interest expense were $877 and $0, respectively, and are included in “Miscellaneous” expense in the Statement of Operations.
(7) Investments in Affiliated Issuers
An affiliated issuer may be considered one in which the fund owns 5% or more of the outstanding voting securities, or a company which is under common control. For the purposes of this report, the following were affiliated issuers:
| Affiliated Issuers | Beginning
Value | Purchases | Sales
Proceeds | Realized
Gain
(Loss) | Change in
Unrealized
Appreciation or
Depreciation | Ending
Value |
| MFS Institutional Money Market Portfolio | $2,635,619 | $36,192,135 | $38,524,603 | $— | $— | $303,151 |
| Affiliated Issuers | Dividend
Income | Capital Gain
Distributions |
| MFS Institutional Money Market Portfolio | $793 | $— |
(8) Impacts of COVID-19
The pandemic related to the global spread of novel coronavirus disease (COVID-19), which was first detected in December 2019, has resulted in significant disruptions to global business activity and the global economy, as well as the economies of individual countries, the financial performance of individual companies and sectors, and the securities and commodities markets in general. Multiple
MFS Mid Cap Growth Series
Notes to Financial Statements (unaudited) - continued
surges in cases globally, the availability and widespread adoption of vaccines, and the emergence of variant strains of the virus continue to create uncertainty as to the future and long-term impacts resulting from the pandemic including impacts to the prices and liquidity of the fund's investments and the fund's performance.
MFS Mid Cap Growth Series
Statement Regarding Liquidity Risk Management Program
The fund has adopted and implemented a liquidity risk management program (the “Program”) as required by Rule 22e-4 under the Investment Company Act of 1940, as amended. The fund’s Board of Trustees (the “Board”) has designated MFS as the administrator of the Program. The Program is reasonably designed to assess and manage the liquidity risk of the fund. Liquidity risk is the risk that the fund could not meet requests to redeem shares issued by the fund without significant dilution of remaining investors' interests.
MFS provided a written report to the Board for consideration at its April 2021 meeting that addressed the operation of the Program and provided an assessment of the adequacy and effectiveness of the Program during the period from January 1, 2020 to December 31, 2020 (the “Covered Period”). The report concluded that during the Covered Period the Program had operated effectively and had adequately and effectively been implemented to assess and manage the fund’s liquidity risk. MFS also reported that there were no liquidity events that impacted the fund or its ability to timely meet redemptions without dilution to existing shareholders during the Covered Period.
There can be no assurance that the Program will achieve its objectives in the future. Further information on liquidity risk, and other principal risks to which an investment in the fund may be subject, can be found in the prospectus.
MFS Mid Cap Growth Series
Proxy Voting Policies and Information
MFS votes proxies on behalf of the fund pursuant to proxy voting policies and procedures that are available without charge, upon request, by calling 1-800-225-2606, by visiting mfs.com/proxyvoting, or by visiting the SEC’s Web site at http://www.sec.gov.
Information regarding how the fund voted proxies relating to portfolio securities during the most recent twelve-month period ended June 30 is available by August 31 of each year without charge by visiting mfs.com/proxyvoting, or by visiting the SEC’s Web site at http://www.sec.gov.
Quarterly Portfolio Disclosure
The fund files a complete schedule of portfolio holdings with the SEC for the first and third quarters of each fiscal year as an exhibit to its reports on Form N-PORT. The fund’s Form N-PORT reports are available on the SEC’s Web site at http://www.sec.gov. A shareholder can obtain the portfolio holdings report for the first and third quarters of the fund's fiscal year at mfs.com/vit1 by choosing the fund's name and then scrolling to the “Resources” section and clicking on the “Prospectus and Reports” tab.
FURTHER INFORMATION
From time to time, MFS may post important information about the fund or the MFS Funds on the MFS Web site (mfs.com). This information is available at https://www.mfs.com/announcements or at mfs.com/vit1 by choosing the fund's name and then scrolling to the “Resources” section and clicking on the “Announcements” tab, if any.
Information About Fund Contracts and Legal Claims
The fund has entered into contractual arrangements with an investment adviser, administrator, distributor, shareholder servicing agent, 529 program manager (if applicable), and custodian who each provide services to the fund. Unless expressly stated otherwise, shareholders are not parties to, or intended beneficiaries of these contractual arrangements, and these contractual arrangements are not intended to create any shareholder right to enforce them against the service providers or to seek any remedy under them against the service providers, either directly or on behalf of the fund.
Under the Trust’s By-Laws and Declaration of Trust, any claims asserted against or on behalf of the MFS Funds, including claims against Trustees and Officers, must be brought in state and federal courts located within the Commonwealth of Massachusetts.
Semiannual Report
June 30, 2021
MFS® New Discovery Series
MFS® Variable Insurance Trust
MFS® New Discovery Series
The report is prepared for the general information of contract owners. It is authorized for distribution to prospective investors only when preceded or accompanied by a current prospectus.
NOT FDIC INSURED • MAY LOSE VALUE • NO BANK OR CREDIT UNION GUARANTEE •
NOT A DEPOSIT • NOT INSURED BY ANY FEDERAL GOVERNMENT AGENCY OR NCUA/NCUSIF
Dear Contract Owners:
After experiencing dramatic swings in the early days of the coronavirus pandemic, global equity markets have performed strongly over the past year. Though the speedy development of vaccines brightened the economic and market outlook, uncertainty remains as new variants of the virus appear, and questions persist over how fast vaccines can be made widely available in the developing world.
Global central banks have taken aggressive steps to cushion the economic and market fallout related to the virus, and governments are deploying unprecedented levels of fiscal support. Having passed a $1.9 trillion stimulus package in March, the U.S. Congress could approve additional stimulus later this year, some of it focused on infrastructure. Along with extraordinary government expenditures, pent-up consumer demand fueled a surge in economic activity as coronavirus restrictions were eased, pushing up inflation, at least temporarily. Markets initially reacted by pushing up yields on global government bonds, though some of the rate rise has since been corrected.
A spirited debate is underway among investors over whether the current price pressures will persist or prove to be temporary, caused by pandemic-induced bottlenecks. The policy measures put in place to counteract the pandemic's effects have helped build a supportive environment and are encouraging economic recovery; however, if markets disconnect from fundamentals, they can sow the seeds of instability. As such, recent dramatic increases in speculative trading in cryptocurrencies, special purpose acquisition companies (SPACs), and the like bear watching.
In the aftermath of the crisis, we could see societal changes as households, businesses, and governments adjust to a new reality, and any such alterations could affect the investment landscape. For investors, events such as the COVID-19 outbreak demonstrate the importance of having a deep understanding of company fundamentals, and we have built our global research platform to do just that.
At MFS®, we put our clients’ assets to work responsibly by carefully navigating the increasing complexity of global markets and economies. Guided by our long-term philosophy and adhering to our commitment to sustainable investing, we tune out the noise and aim to uncover what we believe are the best, most durable investment opportunities in the market. Our unique global investment platform combines collective expertise, long-term discipline, and thoughtful risk management to create sustainable value for investors.
Respectfully,
Michael W. Roberge
Chief Executive Officer
MFS Investment Management
August 13, 2021
The opinions expressed in this letter are subject to change and may not be relied upon for investment advice. No forecasts can be guaranteed.
Top ten holdings
| Rapid7, Inc. | 2.0% |
| CACI International, Inc., “A” | 2.0% |
| Nuvei Corp. | 1.9% |
| Q2 Holdings, Inc. | 1.8% |
| Advanced Energy Industries, Inc. | 1.6% |
| Focus Financial Partners, “A” | 1.5% |
| Leslie’s, Inc. | 1.5% |
| CoreSite Realty Corp., REIT | 1.5% |
| Everbridge, Inc. | 1.4% |
| Ritchie Bros. Auctioneers, Inc. | 1.4% |
GICS equity sectors (g)
| Information Technology | 25.8% |
| Health Care | 22.1% |
| Industrials | 17.5% |
| Consumer Discretionary | 12.7% |
| Financials | 9.1% |
| Real Estate | 4.5% |
| Materials | 2.2% |
| Consumer Staples | 2.0% |
| Communication Services | 0.9% |
| Energy | 0.1% |
| (g) | The Global Industry Classification Standard (GICS®) was developed by and/or is the exclusive property of MSCI, Inc. and S&P Global Market Intelligence Inc. (“S&P Global Market Intelligence”). GICS is a service mark of MSCI and S&P Global Market Intelligence and has been licensed for use by MFS. MFS has applied its own internal sector/industry classification methodology for equity securities and non-equity securities that are unclassified by GICS. |
Cash & Cash Equivalents includes any cash, investments in money market funds, short-term securities, and other assets less liabilities. Please see the Statement of Assets and Liabilities for additional information related to the fund’s cash position and other assets and liabilities.
Percentages are based on net assets as of June 30, 2021.
The portfolio is actively managed and current holdings may be different.
Expense Table
Fund Expenses Borne by the Contract Holders during the Period,
January 1, 2021 through June 30, 2021
As a contract holder of the fund, you incur ongoing costs, including management fees; distribution and/or service (12b-1) fees; and other fund expenses. This example is intended to help you understand your ongoing costs (in dollars) of investing in the fund and to compare these costs with the ongoing costs of investing in other mutual funds.
The example is based on an investment of $1,000 invested at the beginning of the period and held for the entire period January 1, 2021 through June 30, 2021.
Actual Expenses
The first line for each share class in the following table provides information about actual account values and actual expenses. You may use the information in this line, together with the amount you invested, to estimate the expenses that you paid over the period. Simply divide your account value by $1,000 (for example, an $8,600 account value divided by $1,000 = 8.6), then multiply the result by the number in the first line under the heading entitled “Expenses Paid During Period” to estimate the expenses you paid on your account during this period.
Hypothetical Example for Comparison Purposes
The second line for each share class in the following table provides information about hypothetical account values and hypothetical expenses based on the fund’s actual expense ratio and an assumed rate of return of 5% per year before expenses, which is not the fund’s actual return. The hypothetical account values and expenses may not be used to estimate the actual ending account balance or expenses you paid for the period. You may use this information to compare the ongoing costs of investing in the fund and other funds. To do so, compare this 5% hypothetical example with the 5% hypothetical examples that appear in the shareholder reports of the other funds.
Please note that the expenses shown in the table are meant to highlight the fund's ongoing costs only and do not take into account the fees and expenses imposed under the variable contracts through which your investment in the fund is made. Therefore, the second line for each share class in the table is useful in comparing ongoing costs associated with an investment in vehicles (such as the fund) which fund benefits under variable annuity and variable life insurance contracts and to qualified pension and retirement plans only, and will not help you determine the relative total costs of investing in the fund through variable annuity and variable life insurance contracts. If the fees and expenses imposed under the variable contracts were included, your costs would have been higher.
Share
Class | | Annualized
Expense
Ratio | Beginning
Account Value
1/01/21 | Ending
Account Value
6/30/21 | Expenses
Paid During
Period (p)
1/01/21-6/30/21 |
| Initial Class | Actual | 0.87% | $1,000.00 | $1,088.65 | $4.51 |
| Hypothetical (h) | 0.87% | $1,000.00 | $1,020.48 | $4.36 |
| Service Class | Actual | 1.12% | $1,000.00 | $1,087.68 | $5.80 |
| Hypothetical (h) | 1.12% | $1,000.00 | $1,019.24 | $5.61 |
| (h) | 5% class return per year before expenses. |
| (p) | “Expenses Paid During Period” are equal to each class's annualized expense ratio, as shown above, multiplied by the average account value over the period, multiplied by 181/365 (to reflect the one-half year period). |
Portfolio of Investments − 6/30/21 (unaudited)
The Portfolio of Investments is a complete list of all securities owned by your fund. It is categorized by broad-based asset classes.
| Issuer | | | Shares/Par | Value ($) |
| Common Stocks – 96.9% |
| Aerospace & Defense – 2.5% | |
| CACI International, Inc., “A” (a) | | 87,257 | $ 22,261,006 |
| Kratos Defense & Security Solutions, Inc. (a) | | 180,125 | 5,131,761 |
| | | | | $27,392,767 |
| Airlines – 1.2% | |
| JetBlue Airways Corp. (a) | | 777,305 | $ 13,043,178 |
| Apparel Manufacturers – 1.4% | |
| Skechers USA, Inc., “A” (a) | | 300,839 | $ 14,990,807 |
| Automotive – 0.5% | |
| Visteon Corp. (a) | | 48,413 | $ 5,855,068 |
| Biotechnology – 5.7% | |
| Abcam PLC (a) | | 437,518 | $ 8,358,069 |
| Adaptive Biotechnologies Corp. (a) | | 119,610 | 4,887,265 |
| AlloVir, Inc. (a) | | 150,258 | 2,966,093 |
| Amicus Therapeutics, Inc. (a) | | 299,955 | 2,891,566 |
| Berkeley Lights, Inc. (a) | | 89,624 | 4,016,051 |
| BioAtla, Inc. (a) | | 101,226 | 4,289,958 |
| BioXcel Therapeutics, Inc. (a) | | 71,260 | 2,070,816 |
| BridgeBio Pharma, Inc. (a) | | 107,099 | 6,528,755 |
| Immunocore Holdings PLC, ADR (a) | | 23,070 | 900,884 |
| Lyell Immunopharma, Inc. (a) | | 234,046 | 3,800,907 |
| Morphosys AG, ADR (a) | | 56,980 | 1,096,865 |
| Neurocrine Biosciences, Inc. (a) | | 34,755 | 3,382,357 |
| Olink Holding AB (a) | | 116,674 | 4,015,919 |
| Prelude Therapeutics, Inc. (a) | | 89,645 | 2,566,536 |
| Recursion Pharmaceuticals, Inc. (a) | | 233,448 | 8,520,852 |
| Sana Biotechnology, Inc. (a) | | 115,281 | 2,266,424 |
| | | | | $62,559,317 |
| Brokerage & Asset Managers – 4.6% | |
| Focus Financial Partners, “A” (a) | | 346,806 | $ 16,820,091 |
| GCM Grosvenor, Inc. | | 286,515 | 2,985,486 |
| GCM Grosvenor, Inc. (PIPE) (a)(zz) | | 521,924 | 5,438,448 |
| Hamilton Lane, Inc., “A” | | 83,371 | 7,596,766 |
| TMX Group Ltd. | | 54,060 | 5,710,404 |
| WisdomTree Investments, Inc. | | 1,946,145 | 12,066,099 |
| | | | | $50,617,294 |
| Business Services – 11.1% | |
| Endava PLC, ADR (a) | | 126,752 | $ 14,371,142 |
| EVO Payments, Inc., “A” (a) | | 518,897 | 14,394,203 |
| ExlService Holdings, Inc. (a) | | 141,365 | 15,021,445 |
| Keywords Studios PLC (a) | | 387,839 | 13,358,792 |
| Nuvei Corp. (a) | | 260,080 | 21,456,600 |
| Stamps.com, Inc. (a) | | 63,365 | 12,691,376 |
| TaskUs, Inc., “A” (a) | | 169,702 | 5,810,596 |
| TriNet Group, Inc. (a) | | 149,816 | 10,858,663 |
| WNS (Holdings) Ltd., ADR (a) | | 185,109 | 14,784,656 |
| | | | | $122,747,473 |
| Chemicals – 1.1% | |
| Ingevity Corp. (a) | | 150,603 | $ 12,253,060 |
| Issuer | | | Shares/Par | Value ($) |
| Common Stocks – continued |
| Computer Software – 10.8% | |
| 8x8, Inc. (a) | | 341,831 | $ 9,489,228 |
| Alkami Technology, Inc. (a) | | 175,631 | 6,264,758 |
| Avalara, Inc. (a) | | 30,344 | 4,909,659 |
| DoubleVerify Holdings, Inc. (a) | | 245,646 | 10,400,652 |
| Everbridge, Inc. (a) | | 115,647 | 15,737,244 |
| nCino, Inc. (a) | | 116,311 | 6,969,355 |
| Open Lending Corp., “A” (a) | | 260,398 | 11,220,550 |
| Pagerduty, Inc. (a) | | 262,901 | 11,194,325 |
| Paylocity Holding Corp. (a) | | 51,072 | 9,744,538 |
| Ping Identity Holding Corp. (a) | | 358,857 | 8,217,825 |
| Procore Technologies, Inc. (a) | | 64,844 | 6,156,938 |
| VERTEX, Inc. (a) | | 628,992 | 13,800,084 |
| Zendesk, Inc. (a) | | 38,060 | 5,493,580 |
| | | | | $119,598,736 |
| Computer Software - Systems – 3.8% | |
| Q2 Holdings, Inc. (a) | | 194,176 | $ 19,918,574 |
| Rapid7, Inc. (a) | | 239,110 | 22,626,979 |
| | | | | $42,545,553 |
| Construction – 2.7% | |
| AZEK Co. LLC (a) | | 324,070 | $ 13,760,012 |
| Latch, Inc. (a) | | 690,509 | 8,472,546 |
| Trex Co., Inc. (a) | | 77,128 | 7,883,253 |
| | | | | $30,115,811 |
| Consumer Services – 1.2% | |
| Boyd Group Services, Inc. | | 38,169 | $ 6,945,921 |
| Bright Horizons Family Solutions, Inc. (a) | | 45,484 | 6,691,151 |
| | | | | $13,637,072 |
| Containers – 1.2% | |
| Gerresheimer AG | | 118,556 | $ 13,108,879 |
| Electrical Equipment – 3.7% | |
| Advanced Drainage Systems, Inc. | | 59,485 | $ 6,934,166 |
| Generac Holdings, Inc. (a) | | 34,846 | 14,466,317 |
| Littlefuse, Inc. | | 22,523 | 5,738,635 |
| Sensata Technologies Holding PLC (a) | | 229,815 | 13,322,376 |
| | | | | $40,461,494 |
| Electronics – 2.4% | |
| Advanced Energy Industries, Inc. | | 156,559 | $ 17,645,765 |
| Silicon Laboratories, Inc. (a) | | 56,805 | 8,705,366 |
| | | | | $26,351,131 |
| Entertainment – 0.9% | |
| Manchester United PLC, “A” (l) | | 644,801 | $ 9,794,527 |
| Food & Beverages – 2.0% | |
| Duckhorn Portfolio, Inc. (a) | | 406,237 | $ 8,961,588 |
| Laird Superfood, Inc. (a) | | 60,745 | 1,814,453 |
| Oatly Group AB, ADR (a) | | 449,251 | 10,988,680 |
| | | | | $21,764,721 |
Portfolio of Investments (unaudited) – continued
| Issuer | | | Shares/Par | Value ($) |
| Common Stocks – continued |
| Gaming & Lodging – 1.7% | |
| Genius Sports Ltd. (SPAC) (a) | | 692,106 | $ 12,990,830 |
| Penn National Gaming, Inc. (a) | | 77,995 | 5,965,837 |
| | | | | $18,956,667 |
| General Merchandise – 0.4% | |
| Ollie's Bargain Outlet Holdings, Inc. (a) | | 52,097 | $ 4,382,921 |
| Insurance – 0.7% | |
| Metromile, Inc. (a)(l) | | 873,290 | $ 7,990,603 |
| Internet – 0.7% | |
| Talkspace, Inc. (a) | | 871,635 | $ 7,243,287 |
| Leisure & Toys – 1.5% | |
| Malibu Boats, Inc., “A” (a) | | 166,266 | $ 12,192,286 |
| Thule Group AB | | 106,714 | 4,730,874 |
| | | | | $16,923,160 |
| Machinery & Tools – 1.6% | |
| Ritchie Bros. Auctioneers, Inc. | | 262,905 | $ 15,585,008 |
| Xometry, Inc., “A” (a) | | 27,636 | 2,415,110 |
| | | | | $18,000,118 |
| Medical & Health Technology & Services – 8.1% | |
| Certara, Inc. (a) | | 529,297 | $ 14,994,984 |
| Charles River Laboratories International, Inc. (a) | | 35,302 | 13,058,916 |
| Guardant Health, Inc. (a) | | 35,020 | 4,349,134 |
| Health Catalyst, Inc. (a) | | 81,853 | 4,543,660 |
| HealthEquity, Inc. (a) | | 128,042 | 10,304,820 |
| ICON PLC (a) | | 58,507 | 12,093,982 |
| LifeStance Health Group, Inc. (a) | | 367,285 | 10,232,560 |
| PRA Health Sciences, Inc. (a) | | 30,945 | 5,112,423 |
| Syneos Health, Inc. (a) | | 170,696 | 15,275,585 |
| | | | | $89,966,064 |
| Medical Equipment – 3.5% | |
| Acutus Medical, Inc. (a)(l) | | 265,012 | $ 4,499,904 |
| Maravai Lifesciences Holdings, Inc., “A” (a) | | 248,149 | 10,355,258 |
| Nevro Corp. (a) | | 51,830 | 8,592,896 |
| OptiNose, Inc. (a) | | 438,959 | 1,365,162 |
| Outset Medical, Inc. (a) | | 98,220 | 4,909,036 |
| PerkinElmer, Inc. | | 36,784 | 5,679,817 |
| Silk Road Medical, Inc. (a) | | 66,129 | 3,164,934 |
| | | | | $38,567,007 |
| Network & Telecom – 1.5% | |
| CoreSite Realty Corp., REIT | | 121,995 | $ 16,420,527 |
| Other Banks & Diversified Financials – 2.8% | |
| Bank OZK | | 139,420 | $ 5,877,947 |
| LegalZoom.com, Inc. (a) | | 136,356 | 5,161,075 |
| Payoneer Global, Inc. (a) | | 904,213 | 9,376,689 |
| Prosperity Bancshares, Inc. | | 114,521 | 8,222,608 |
| TPG Pace Tech Opportunities Corp. (SPAC) (a) | | 253,565 | 2,517,900 |
| | | | | $31,156,219 |
| Issuer | | | Shares/Par | Value ($) |
| Common Stocks – continued |
| Pharmaceuticals – 2.4% | |
| Annexon, Inc. (a) | | 175,410 | $ 3,948,479 |
| Collegium Pharmaceutical, Inc. (a) | | 180,963 | 4,277,965 |
| Harmony Biosciences Holdings (a) | | 161,779 | 4,567,021 |
| Orchard RX Ltd., ADR (a) | | 123,902 | 543,930 |
| SpringWorks Therapeutics, Inc. (a) | | 95,765 | 7,891,994 |
| Turning Point Therapeutics, Inc. (a) | | 67,509 | 5,267,052 |
| | | | | $26,496,441 |
| Pollution Control – 0.8% | |
| GFL Environmental, Inc. | | 293,037 | $ 9,353,741 |
| Railroad & Shipping – 0.1% | |
| StealthGas, Inc. (a) | | 442,589 | $ 1,252,527 |
| Real Estate – 3.0% | |
| Big Yellow Group PLC, REIT | | 482,968 | $ 8,731,931 |
| Industrial Logistics Properties Trust, REIT | | 349,427 | 9,134,022 |
| STAG Industrial, Inc., REIT | | 406,634 | 15,220,311 |
| | | | | $33,086,264 |
| Specialty Chemicals – 1.4% | |
| Axalta Coating Systems Ltd. (a) | | 396,033 | $ 12,075,046 |
| Rogers Corp. (a) | | 14,237 | 2,858,790 |
| | | | | $14,933,836 |
| Specialty Stores – 4.7% | |
| ACV Auctions, Inc. (a) | | 497,963 | $ 12,762,792 |
| Leslie's, Inc. (a) | | 611,196 | 16,801,778 |
| Petco Health & Wellness Co., Inc. (a) | | 327,416 | 7,337,392 |
| ThredUp, Inc. (a) | | 313,108 | 9,105,181 |
| Vroom, Inc. (a) | | 151,435 | 6,339,069 |
| | | | | $52,346,212 |
| Trucking – 3.0% | |
| CryoPort, Inc. (a) | | 225,649 | $ 14,238,452 |
| Knight-Swift Transportation Holdings, Inc. | | 251,961 | 11,454,147 |
| Schneider National, Inc. | | 344,409 | 7,497,784 |
| | | | | $33,190,383 |
| Utilities - Electric Power – 2.2% | |
| Array Technologies, Inc. (a) | | 661,446 | $ 10,318,558 |
| Shoals Technologies Group, Inc. (a) | | 407,915 | 14,480,982 |
| | | | | $24,799,540 |
| Total Common Stocks (Identified Cost, $767,908,522) | | $1,071,902,405 |
| Investment Companies (h) – 3.4% |
| Money Market Funds – 3.4% | |
| MFS Institutional Money Market Portfolio, 0.02% (v) (Identified Cost, $37,805,766) | | | 37,805,766 | $ 37,805,766 |
Portfolio of Investments (unaudited) – continued
| Issuer | | | Shares/Par | Value ($) |
| Collateral for Securities Loaned – 0.2% |
| State Street Navigator Securities Lending Government Money Market Portfolio, 0.02% (j) (Identified Cost, $2,585,086) | | | 2,585,086 | $ 2,585,086 |
| Other Assets, Less Liabilities – (0.5)% | | (5,697,472) |
| Net Assets – 100.0% | $1,106,595,785 |
| (a) | Non-income producing security. | | | |
| (h) | An affiliated issuer, which may be considered one in which the fund owns 5% or more of the outstanding voting securities, or a company which is under common control. At period end, the aggregate values of the fund's investments in affiliated issuers and in unaffiliated issuers were $37,805,766 and $1,074,487,491, respectively. | | | |
| (j) | The rate quoted is the annualized seven-day yield of the fund at period end. | | | |
| (l) | A portion of this security is on loan. See Note 2 for additional information. | | | |
| (v) | Affiliated issuer that is available only to investment companies managed by MFS. The rate quoted for the MFS Institutional Money Market Portfolio is the annualized seven-day yield of the fund at period end. | | | |
| (zz) | Securities subject to a restriction on resale. | | | |
| The following abbreviations are used in this report and are defined: |
| ADR | American Depositary Receipt |
| PIPE | Private Investment in Public Equity |
| REIT | Real Estate Investment Trust |
| SPAC | Special Purpose Acquisition Company |
See Notes to Financial Statements
| Financial Statements | Statement of Assets and Liabilities (unaudited) |
This statement represents your fund’s balance sheet, which details the assets and liabilities comprising the total value of the fund.
| At 6/30/21Assets | |
| Investments in unaffiliated issuers, at value, including $3,554,576 of securities on loan (identified cost, $770,493,608) | $1,074,487,491 |
| Investments in affiliated issuers, at value (identified cost, $37,805,766) | 37,805,766 |
| Cash | 480,368 |
| Receivables for | |
| Investments sold | 3,127,584 |
| Fund shares sold | 596,097 |
| Interest and dividends | 529,095 |
| Receivable from investment adviser | 8,556 |
| Other assets | 2,617 |
| Total assets | $1,117,037,574 |
| Liabilities | |
| Payables for | |
| Investments purchased | $6,804,784 |
| Fund shares reacquired | 880,926 |
| Collateral for securities loaned, at value (c) | 2,585,086 |
| Payable to affiliates | |
| Administrative services fee | 853 |
| Shareholder servicing costs | 743 |
| Distribution and/or service fees | 8,613 |
| Accrued expenses and other liabilities | 160,784 |
| Total liabilities | $10,441,789 |
| Net assets | $1,106,595,785 |
| Net assets consist of | |
| Paid-in capital | $491,025,745 |
| Total distributable earnings (loss) | 615,570,040 |
| Net assets | $1,106,595,785 |
| Shares of beneficial interest outstanding | 40,667,996 |
| | Net assets | Shares
outstanding | Net asset value
per share |
| Initial Class | $481,022,758 | 16,353,828 | $29.41 |
| Service Class | 625,573,027 | 24,314,168 | 25.73 |
| (c) | Non-cash collateral is not included. |
See Notes to Financial Statements
| Financial Statements | Statement of Operations (unaudited) |
This statement describes how much your fund earned in investment income and accrued in expenses. It also describes any gains and/or losses generated by fund operations.
| Six months ended 6/30/21 | |
| Net investment income (loss) | |
| Income | |
| Dividends | $2,093,125 |
| Income on securities loaned | 168,474 |
| Other | 65,698 |
| Dividends from affiliated issuers | 6,573 |
| Foreign taxes withheld | (75,360) |
| Total investment income | $2,258,510 |
| Expenses | |
| Management fee | $4,739,648 |
| Distribution and/or service fees | 741,894 |
| Shareholder servicing costs | 26,785 |
| Administrative services fee | 73,170 |
| Independent Trustees' compensation | 8,557 |
| Custodian fee | 29,466 |
| Shareholder communications | 45,439 |
| Audit and tax fees | 30,093 |
| Legal fees | 3,280 |
| Miscellaneous | 16,633 |
| Total expenses | $5,714,965 |
| Reduction of expenses by investment adviser | (354,389) |
| Net expenses | $5,360,576 |
| Net investment income (loss) | $(3,102,066) |
| Realized and unrealized gain (loss) | |
| Realized gain (loss) (identified cost basis) | |
| Unaffiliated issuers | $145,949,918 |
| Affiliated issuers | 31 |
| Foreign currency | 6,529 |
| Net realized gain (loss) | $145,956,478 |
| Change in unrealized appreciation or depreciation | |
| Unaffiliated issuers | $(51,122,016) |
| Affiliated issuers | (31) |
| Translation of assets and liabilities in foreign currencies | (4,755) |
| Net unrealized gain (loss) | $(51,126,802) |
| Net realized and unrealized gain (loss) | $94,829,676 |
| Change in net assets from operations | $91,727,610 |
See Notes to Financial Statements
| Financial Statements | Statements of Changes in Net Assets |
These statements describe the increases and/or decreases in net assets resulting from operations, any distributions, and any shareholder transactions.
| | Six months ended | Year ended |
| | 6/30/21
(unaudited) | 12/31/20 |
| Change in net assets | | |
| From operations | | |
| Net investment income (loss) | $(3,102,066) | $(3,663,059) |
| Net realized gain (loss) | 145,956,478 | 176,399,666 |
| Net unrealized gain (loss) | (51,126,802) | 163,806,112 |
| Change in net assets from operations | $91,727,610 | $336,542,719 |
| Total distributions to shareholders | $— | $(81,295,168) |
| Change in net assets from fund share transactions | $(35,722,617) | $(20,182,105) |
| Total change in net assets | $56,004,993 | $235,065,446 |
| Net assets | | |
| At beginning of period | 1,050,590,792 | 815,525,346 |
| At end of period | $1,106,595,785 | $1,050,590,792 |
See Notes to Financial Statements
| Financial Statements | Financial Highlights |
The financial highlights table is intended to help you understand the fund's financial performance for the semiannual period and the past 5 fiscal years. Certain information reflects financial results for a single fund share. The total returns in the table represent the rate that an investor would have earned (or lost) on an investment in the fund share class (assuming reinvestment of all distributions) held for the entire period.
| Initial Class | Six months
ended | Year ended |
| | 6/30/21
(unaudited) | 12/31/20 | 12/31/19 | 12/31/18 | 12/31/17 | 12/31/16 |
| Net asset value, beginning of period | $26.96 | $20.28 | $17.46 | $20.10 | $16.18 | $15.49 |
| Income (loss) from investment operations | | | | | | |
| Net investment income (loss) (d) | $(0.06) | $(0.06) | $(0.07) | $(0.09) | $(0.07) | $0.00(c)(w) |
| Net realized and unrealized gain (loss) | 2.51 | 8.84 | 6.89 | 0.35 | 4.34 | 1.40 |
| Total from investment operations | $2.45 | $8.78 | $6.82 | $0.26 | $4.27 | $1.40 |
| Less distributions declared to shareholders | | | | | | |
| From net realized gain | $— | $(2.10) | $(4.00) | $(2.90) | $(0.35) | $(0.71) |
| Net asset value, end of period (x) | $29.41 | $26.96 | $20.28 | $17.46 | $20.10 | $16.18 |
| Total return (%) (k)(r)(s)(x) | 9.09(n) | 45.89 | 41.70 | (1.48) | 26.65 | 9.05(c) |
Ratios (%) (to average net assets)
and Supplemental data: | | | | | | |
| Expenses before expense reductions (f) | 0.94(a) | 0.95 | 0.95 | 0.96 | 0.97 | 0.94(c) |
| Expenses after expense reductions (f) | 0.87(a) | 0.91 | 0.94 | 0.94 | 0.94 | 0.92(c) |
| Net investment income (loss) | (0.45)(a) | (0.30) | (0.33) | (0.43) | (0.37) | 0.02(c) |
| Portfolio turnover | 40(n) | 80 | 54 | 71 | 58 | 63 |
| Net assets at end of period (000 omitted) | $481,023 | $465,663 | $343,133 | $272,039 | $316,949 | $292,368 |
| Service Class | Six months
ended | Year ended |
| | 6/30/21
(unaudited) | 12/31/20 | 12/31/19 | 12/31/18 | 12/31/17 | 12/31/16 |
| Net asset value, beginning of period | $23.61 | $18.02 | $15.91 | $18.57 | $15.01 | $14.45 |
| Income (loss) from investment operations | | | | | | |
| Net investment income (loss) (d) | $(0.08) | $(0.10) | $(0.11) | $(0.13) | $(0.10) | $(0.03)(c) |
| Net realized and unrealized gain (loss) | 2.20 | 7.79 | 6.22 | 0.37 | 4.01 | 1.30 |
| Total from investment operations | $2.12 | $7.69 | $6.11 | $0.24 | $3.91 | $1.27 |
| Less distributions declared to shareholders | | | | | | |
| From net realized gain | $— | $(2.10) | $(4.00) | $(2.90) | $(0.35) | $(0.71) |
| Net asset value, end of period (x) | $25.73 | $23.61 | $18.02 | $15.91 | $18.57 | $15.01 |
| Total return (%) (k)(r)(s)(x) | 8.98(n) | 45.58 | 41.27 | (1.72) | 26.33 | 8.80(c) |
Ratios (%) (to average net assets)
and Supplemental data: | | | | | | |
| Expenses before expense reductions (f) | 1.19(a) | 1.20 | 1.20 | 1.21 | 1.22 | 1.19(c) |
| Expenses after expense reductions (f) | 1.12(a) | 1.16 | 1.19 | 1.19 | 1.19 | 1.17(c) |
| Net investment income (loss) | (0.69)(a) | (0.56) | (0.58) | (0.68) | (0.62) | (0.23)(c) |
| Portfolio turnover | 40(n) | 80 | 54 | 71 | 58 | 63 |
| Net assets at end of period (000 omitted) | $625,573 | $584,928 | $472,393 | $358,912 | $432,897 | $380,884 |
See Notes to Financial Statements
Financial Highlights - continued
| (a) | Annualized. |
| (c) | Amount reflects a one-time reimbursement of expenses by the custodian (or former custodian) without which net investment income and performance would be lower and expenses would be higher. |
| (d) | Per share data is based on average shares outstanding. |
| (f) | Ratios do not reflect reductions from fees paid indirectly, if applicable. |
| (k) | The total return does not reflect expenses that apply to separate accounts. Inclusion of these charges would reduce the total return figures for all periods shown. |
| (n) | Not annualized. |
| (r) | Certain expenses have been reduced without which performance would have been lower. |
| (s) | From time to time the fund may receive proceeds from litigation settlements, without which performance would be lower. |
| (w) | Per share amount was less than $0.01. |
| (x) | The net asset values and total returns have been calculated on net assets which include adjustments made in accordance with U.S. generally accepted accounting principles required at period end for financial reporting purposes. |
See Notes to Financial Statements
Notes to Financial Statements (unaudited)
(1) Business and Organization
MFS New Discovery Series (the fund) is a diversified series of MFS Variable Insurance Trust (the trust). The trust is organized as a Massachusetts business trust and is registered under the Investment Company Act of 1940, as amended, as an open-end management investment company. The shareholders of each series of the trust are separate accounts of insurance companies, which offer variable annuity and/or life insurance products, and qualified retirement and pension plans.
The fund is an investment company and accordingly follows the investment company accounting and reporting guidance of the Financial Accounting Standards Board (FASB) Accounting Standards Codification Topic 946 Financial Services - Investment Companies.
(2) Significant Accounting Policies
General — The preparation of financial statements in conformity with U.S. generally accepted accounting principles requires management to make estimates and assumptions that affect the reported amounts of assets and liabilities, and disclosure of contingent assets and liabilities at the date of the financial statements and the reported amounts of increases and decreases in net assets from operations during the reporting period. Actual results could differ from those estimates. In the preparation of these financial statements, management has evaluated subsequent events occurring after the date of the fund’s Statement of Assets and Liabilities through the date that the financial statements were issued. The fund will generally focus on securities of small size companies which may be more volatile than those of larger companies. The fund invests in foreign securities. Investments in foreign securities are vulnerable to the effects of changes in the relative values of the local currency and the U.S. dollar and to the effects of changes in each country’s market, economic, industrial, political, regulatory, geopolitical, and other conditions.
Certain of the fund's investments, derivatives, debt and other contracts may be based on reference interest rates such as the London Interbank Offered Rate (“LIBOR”). In 2017, the regulatory authority that oversees financial services firms in the United Kingdom announced plans to transition away from LIBOR by the end of 2021. In March 2021, the administrator of LIBOR announced the extension of the publication of the more commonly used U.S. dollar LIBOR settings to the end of June 2023. Although the full impacts of the transition away from LIBOR are not fully known, the transition may result in, among other things, an increase in volatility or illiquidity of the markets for instruments that currently rely on LIBOR to determine interest rates and this could have an adverse impact on the fund's performance. With respect to the fund's accounting for investments, derivatives, debt and other contracts that undergo reference rate-related modifications as a result of the transition, management will rely upon the relief provided by FASB Codification Topic 848 – Reference Rate Reform (Topic 848). The guidance in Topic 848 permits the fund to disregard the GAAP accounting requirements around certain contract modifications resulting from the LIBOR transition such that for contracts considered in scope, the fund can account for those modified contracts as a continuation of the existing contracts.
Balance Sheet Offsetting — The fund's accounting policy with respect to balance sheet offsetting is that, absent an event of default by the counterparty or a termination of the agreement, the International Swaps and Derivatives Association (ISDA) Master Agreement, or similar agreement, does not result in an offset of reported amounts of financial assets and financial liabilities in the Statement of Assets and Liabilities across transactions between the fund and the applicable counterparty. The fund's right to setoff may be restricted or prohibited by the bankruptcy or insolvency laws of the particular jurisdiction to which a specific master netting agreement counterparty is subject. Balance sheet offsetting disclosures, to the extent applicable to the fund, have been included in the fund’s Significant Accounting Policies note under the captions for each of the fund’s in-scope financial instruments and transactions.
Investment Valuations — Equity securities, including restricted equity securities, are generally valued at the last sale or official closing price on their primary market or exchange as provided by a third-party pricing service. Equity securities, for which there were no sales reported that day, are generally valued at the last quoted daily bid quotation on their primary market or exchange as provided by a third-party pricing service. Short-term instruments with a maturity at issuance of 60 days or less may be valued at amortized cost, which approximates market value. Open-end investment companies are generally valued at net asset value per share.
Securities and other assets generally valued on the basis of information from a third-party pricing service may also be valued at a broker/dealer bid quotation. In determining values, third-party pricing services can utilize both transaction data and market information such as yield, quality, coupon rate, maturity, type of issue, trading characteristics, and other market data. The values of foreign securities and other assets and liabilities expressed in foreign currencies are converted to U.S. dollars using the mean of bid and asked prices for rates provided by a third-party pricing service.
The Board of Trustees has delegated primary responsibility for determining or causing to be determined the value of the fund’s investments (including any fair valuation) to the adviser pursuant to valuation policies and procedures approved by the Board. If the adviser determines that reliable market quotations are not readily available, investments are valued at fair value as determined in good faith by the adviser in accordance with such procedures under the oversight of the Board of Trustees. Under the fund’s valuation policies and procedures, market quotations are not considered to be readily available for most types of debt instruments
Notes to Financial Statements (unaudited) - continued
and floating rate loans and many types of derivatives. These investments are generally valued at fair value based on information from third-party pricing services. In addition, investments may be valued at fair value if the adviser determines that an investment’s value has been materially affected by events occurring after the close of the exchange or market on which the investment is principally traded (such as foreign exchange or market) and prior to the determination of the fund’s net asset value, or after the halt of trading of a specific security where trading does not resume prior to the close of the exchange or market on which the security is principally traded. Events that occur after foreign markets close (such as developments in foreign markets and significant movements in the U.S. markets) and prior to the determination of the fund’s net asset value may be deemed to have a material effect on the value of securities traded in foreign markets. Accordingly, the fund’s foreign equity securities may often be valued at fair value. The adviser generally relies on third-party pricing services or other information (such as the correlation with price movements of similar securities in the same or other markets; the type, cost and investment characteristics of the security; the business and financial condition of the issuer; and trading and other market data) to assist in determining whether to fair value and at what value to fair value an investment. The value of an investment for purposes of calculating the fund’s net asset value can differ depending on the source and method used to determine value. When fair valuation is used, the value of an investment used to determine the fund’s net asset value may differ from quoted or published prices for the same investment. There can be no assurance that the fund could obtain the fair value assigned to an investment if it were to sell the investment at the same time at which the fund determines its net asset value per share.
Various inputs are used in determining the value of the fund's assets or liabilities. These inputs are categorized into three broad levels. In certain cases, the inputs used to measure fair value may fall into different levels of the fair value hierarchy. In such cases, an investment's level within the fair value hierarchy is based on the lowest level of input that is significant to the fair value measurement. The fund's assessment of the significance of a particular input to the fair value measurement in its entirety requires judgment, and considers factors specific to the investment. Level 1 includes unadjusted quoted prices in active markets for identical assets or liabilities. Level 2 includes other significant observable market-based inputs (including quoted prices for similar securities, interest rates, prepayment speed, and credit risk). Level 3 includes unobservable inputs, which may include the adviser's own assumptions in determining the fair value of investments. The following is a summary of the levels used as of June 30, 2021 in valuing the fund's assets or liabilities:
| Financial Instruments | Level 1 | Level 2 | Level 3 | Total |
| Equity Securities: | | | | |
| United States | $881,467,880 | $5,438,448 | $— | $886,906,328 |
| United Kingdom | 69,050,105 | — | — | 69,050,105 |
| Canada | 59,051,674 | — | — | 59,051,674 |
| India | 14,784,656 | — | — | 14,784,656 |
| Germany | 14,205,744 | — | — | 14,205,744 |
| Ireland | 12,093,982 | — | — | 12,093,982 |
| Sweden | 8,746,793 | — | — | 8,746,793 |
| Philippines | 5,810,596 | — | — | 5,810,596 |
| Greece | 1,252,527 | — | — | 1,252,527 |
| Mutual Funds | 40,390,852 | — | — | 40,390,852 |
| Total | $1,106,854,809 | $5,438,448 | $— | $1,112,293,257 |
For further information regarding security characteristics, see the Portfolio of Investments.
Foreign Currency Translation — Purchases and sales of foreign investments, income, and expenses are converted into U.S. dollars based upon currency exchange rates prevailing on the respective dates of such transactions or on the reporting date for foreign denominated receivables and payables. Gains and losses attributable to foreign currency exchange rates on sales of securities are recorded for financial statement purposes as net realized gains and losses on investments. Gains and losses attributable to foreign exchange rate movements on receivables, payables, income and expenses are recorded for financial statement purposes as foreign currency transaction gains and losses. That portion of both realized and unrealized gains and losses on investments that results from fluctuations in foreign currency exchange rates is not separately disclosed.
Security Loans — Under its Securities Lending Agency Agreement with the fund, State Street Bank and Trust Company, as lending agent, loans the securities of the fund to certain qualified institutions (the “Borrowers”) approved by the fund. Security loans can be terminated at the discretion of either the lending agent or the fund and the related securities must be returned within the earlier of the standard trade settlement period for such securities or within three business days. The loans are collateralized by cash and/or U.S. Treasury and federal agency obligations in an amount typically at least equal to the market value of the securities loaned. On loans collateralized by cash, the cash collateral is invested in a money market fund. The market value of the loaned securities is determined at the close of business of the fund and any additional required collateral is delivered to the fund on the next business day. The lending agent provides the fund with indemnification against Borrower default. In the event of Borrower default, the lending agent will, for the benefit of the fund, either purchase securities identical to those loaned or, when such purchase is
Notes to Financial Statements (unaudited) - continued
commercially impracticable, pay the fund the market value of the loaned securities. In return, the lending agent assumes the fund's rights to the related collateral. If the collateral value is less than the cost to purchase identical securities, the lending agent is responsible for the shortfall, but only to the extent that such shortfall is not due to a decline in collateral value resulting from collateral reinvestment for which the fund bears the risk of loss. At period end, the fund had investment securities on loan, all of which were classified as equity securities in the fund's Portfolio of Investments, with a fair value of $3,554,576. The fair value of the fund's investment securities on loan and a related liability of $2,585,086 for cash collateral received on securities loaned are both presented gross in the Statement of Assets and Liabilities. Additionally, these loans were collateralized by U.S. Treasury Obligations of $1,086,001 held by the lending agent. The collateral on securities loaned exceeded the value of securities on loan at period end. The liability for cash collateral for securities loaned is carried at fair value, which is categorized as level 2 within the fair value hierarchy. A portion of the income generated upon investment of the collateral is remitted to the Borrowers, and the remainder is allocated between the fund and the lending agent. On loans collateralized by U.S. Treasury and/or federal agency obligations, a fee is received from the Borrower, and is allocated between the fund and the lending agent. Income from securities lending is separately reported in the Statement of Operations. The dividend and interest income earned on the securities loaned is accounted for in the same manner as other dividend and interest income.
Indemnifications — Under the fund's organizational documents, its officers and Trustees may be indemnified against certain liabilities and expenses arising out of the performance of their duties to the fund. Additionally, in the normal course of business, the fund enters into agreements with service providers that may contain indemnification clauses. The fund's maximum exposure under these agreements is unknown as this would involve future claims that may be made against the fund that have not yet occurred.
Investment Transactions and Income — Investment transactions are recorded on the trade date. Interest income is recorded on the accrual basis. Dividends received in cash are recorded on the ex-dividend date. Certain dividends from foreign securities will be recorded when the fund is informed of the dividend if such information is obtained subsequent to the ex-dividend date. Dividend payments received in additional securities are recorded on the ex-dividend date in an amount equal to the value of the security on such date.
The fund may receive proceeds from litigation settlements. Any proceeds received from litigation involving portfolio holdings are reflected in the Statement of Operations in realized gain/loss if the security has been disposed of by the fund or in unrealized gain/loss if the security is still held by the fund. Any other proceeds from litigation not related to portfolio holdings are reflected as other income in the Statement of Operations.
Tax Matters and Distributions — The fund intends to qualify as a regulated investment company, as defined under Subchapter M of the Internal Revenue Code, and to distribute all of its taxable income, including realized capital gains. As a result, no provision for federal income tax is required. The fund’s federal tax returns, when filed, will remain subject to examination by the Internal Revenue Service for a three year period. Management has analyzed the fund’s tax positions taken on federal and state tax returns for all open tax years and does not believe that there are any uncertain tax positions that require recognition of a tax liability. Foreign taxes, if any, have been accrued by the fund in the accompanying financial statements in accordance with the applicable foreign tax law. Foreign income taxes may be withheld by certain countries in which the fund invests. Additionally, capital gains realized by the fund on securities issued in or by certain foreign countries may be subject to capital gains tax imposed by those countries.
Distributions to shareholders are recorded on the ex-dividend date. Income and capital gain distributions are determined in accordance with income tax regulations, which may differ from U.S. generally accepted accounting principles. Certain capital accounts in the financial statements are periodically adjusted for permanent differences in order to reflect their tax character. These adjustments have no impact on net assets or net asset value per share. Temporary differences which arise from recognizing certain items of income, expense, gain or loss in different periods for financial statement and tax purposes will reverse at some time in the future.
Book/tax differences primarily relate to wash sale loss deferrals.
The tax character of distributions declared to shareholders for the last fiscal year is as follows:
| | Year ended
12/31/20 |
| Ordinary income (including any short-term capital gains) | $24,424,056 |
| Long-term capital gains | 56,871,112 |
| Total distributions | $81,295,168 |
The federal tax cost and the tax basis components of distributable earnings were as follows:
Notes to Financial Statements (unaudited) - continued
| As of 6/30/21 | |
| Cost of investments | $820,114,605 |
| Gross appreciation | 326,596,271 |
| Gross depreciation | (34,417,619) |
| Net unrealized appreciation (depreciation) | $292,178,652 |
| As of 12/31/20 | |
| Undistributed ordinary income | 67,761,486 |
| Undistributed long-term capital gain | 112,268,925 |
| Other temporary differences | 10,649 |
| Net unrealized appreciation (depreciation) | 343,801,370 |
The aggregate cost above includes prior fiscal year end tax adjustments, if applicable.
Multiple Classes of Shares of Beneficial Interest — The fund offers multiple classes of shares, which differ in their respective distribution and/or service fees. The fund's income, realized and unrealized gain (loss), and common expenses are allocated to shareholders based on the daily net assets of each class. Dividends are declared separately for each class. Differences in per share dividend rates are generally due to differences in separate class expenses. The fund’s distributions declared to shareholders as reported in the Statements of Changes in Net Assets are presented by class as follows:
| | Six months ended
6/30/21 | | Year ended
12/31/20 |
| Initial Class | $— | | $31,864,295 |
| Service Class | — | | 49,430,873 |
| Total | $— | | $81,295,168 |
(3) Transactions with Affiliates
Investment Adviser — The fund has an investment advisory agreement with MFS to provide overall investment management and related administrative services and facilities to the fund. The management fee is computed daily and paid monthly at the following annual rates based on the fund's average daily net assets:
| Up to $1 billion | 0.90% |
| In excess of $1 billion | 0.80% |
MFS has agreed in writing to reduce its management fee by a specified amount if certain MFS mutual fund assets exceed thresholds agreed to by MFS and the fund's Board of Trustees. For the six months ended June 30, 2021, this management fee reduction amounted to $63,234, which is included in the reduction of total expenses in the Statement of Operations. The management fee incurred for the six months ended June 30, 2021 was equivalent to an annual effective rate of 0.88% of the fund's average daily net assets.
The investment adviser has agreed in writing to pay a portion of the fund’s total annual operating expenses, excluding interest, taxes, extraordinary expenses, brokerage and transaction costs, and investment-related expenses, such that total annual operating expenses do not exceed 0.87% of average daily net assets for the Initial Class shares and 1.12% of average daily net assets for the Service Class shares. This written agreement will continue until modified by the fund’s Board of Trustees, but such agreement will continue at least until April 30, 2023. For the six months ended June 30, 2021, this reduction amounted to $291,155, which is included in the reduction of total expenses in the Statement of Operations.
Distributor — MFS Fund Distributors, Inc. (MFD), a wholly-owned subsidiary of MFS, is the distributor of shares of the fund. The Trustees have adopted a distribution plan for the Service Class shares pursuant to Rule 12b-1 under the Investment Company Act of 1940.
The fund's distribution plan provides that the fund will pay MFD distribution and/or service fees equal to 0.25% per annum of its average daily net assets attributable to Service Class shares as partial consideration for services performed and expenses incurred by MFD and financial intermediaries (including participating insurance companies that invest in the fund to fund variable annuity and variable life insurance contracts, sponsors of qualified retirement and pension plans that invest in the fund, and affiliates of these participating insurance companies and plan sponsors) in connection with the sale and distribution of the Service Class shares. MFD may subsequently pay all, or a portion, of the distribution and/or service fees to financial intermediaries.
Notes to Financial Statements (unaudited) - continued
Shareholder Servicing Agent — MFS Service Center, Inc. (MFSC), a wholly-owned subsidiary of MFS, receives a fee from the fund for its services as shareholder servicing agent. For the six months ended June 30, 2021, the fee was $25,212, which equated to 0.0048% annually of the fund's average daily net assets. MFSC also receives reimbursement from the fund for out-of-pocket expenses paid by MFSC on behalf of the fund. For the six months ended June 30, 2021, these costs amounted to $1,573.
Administrator — MFS provides certain financial, legal, shareholder communications, compliance, and other administrative services to the fund. Under an administrative services agreement, the fund reimburses MFS the costs incurred to provide these services. The fund is charged an annual fixed amount of $17,500 plus a fee based on average daily net assets. The administrative services fee incurred for the six months ended June 30, 2021 was equivalent to an annual effective rate of 0.0138% of the fund's average daily net assets.
Trustees’ and Officers’ Compensation — The fund pays compensation to independent Trustees in the form of a retainer, attendance fees, and additional compensation to Board and Committee chairpersons. The fund does not pay compensation directly to Trustees or officers of the fund who are also officers of the investment adviser, all of whom receive remuneration from MFS for their services to the fund. Certain officers and Trustees of the fund are officers or directors of MFS, MFD, and MFSC.
Other — The fund invests in the MFS Institutional Money Market Portfolio which is managed by MFS and seeks current income consistent with preservation of capital and liquidity. This money market fund does not pay a management fee to MFS but does incur investment and operating costs.
The adviser has voluntarily undertaken to reimburse the fund from its own resources on a quarterly basis for the cost of investment research embedded in the cost of the fund’s securities trades. This agreement may be rescinded at any time. For the six months ended June 30, 2021, this reimbursement amounted to $65,580, which is included in “Other” income in the Statement of Operations.
(4) Portfolio Securities
For the six months ended June 30, 2021, purchases and sales of investments, other than short-term obligations, aggregated $418,202,558 and $460,467,722, respectively.
(5) Shares of Beneficial Interest
The fund's Declaration of Trust permits the Trustees to issue an unlimited number of full and fractional shares of beneficial interest. Transactions in fund shares were as follows:
| | Six months ended
6/30/21 | | Year ended
12/31/20 |
| | Shares | Amount | | Shares | Amount |
| Shares sold | | | | | |
| Initial Class | 947,848 | $26,577,405 | | 3,294,260 | $68,896,127 |
| Service Class | 2,996,201 | 74,233,543 | | 3,845,873 | 70,163,983 |
| | 3,944,049 | $100,810,948 | | 7,140,133 | $139,060,110 |
Shares issued to shareholders
in reinvestment of distributions | | | | | |
| Initial Class | — | $— | | 1,481,371 | $31,864,295 |
| Service Class | — | — | | 2,622,328 | 49,430,873 |
| | — | $— | | 4,103,699 | $81,295,168 |
| Shares reacquired | | | | | |
| Initial Class | (1,867,428) | $(51,959,436) | | (4,425,268) | $(93,651,928) |
| Service Class | (3,456,269) | (84,574,129) | | (7,901,694) | (146,885,455) |
| | (5,323,697) | $(136,533,565) | | (12,326,962) | $(240,537,383) |
| Net change | | | | | |
| Initial Class | (919,580) | $(25,382,031) | | 350,363 | $7,108,494 |
| Service Class | (460,068) | (10,340,586) | | (1,433,493) | (27,290,599) |
| | (1,379,648) | $(35,722,617) | | (1,083,130) | $(20,182,105) |
Notes to Financial Statements (unaudited) - continued
The fund is one of several mutual funds in which certain MFS funds may invest. The MFS funds do not invest in the underlying funds for the purpose of exercising management or control. At the end of the period, the MFS Moderate Allocation Portfolio was the owner of record of approximately 2% of the value of outstanding voting shares of the fund. In addition, the MFS Growth Allocation Portfolio and the MFS Conservative Allocation Portfolio were the owners of record of less than 1% of the value of outstanding voting shares of the fund.
(6) Line of Credit
The fund and certain other funds managed by MFS participate in a $1.25 billion unsecured committed line of credit of which $1 billion is reserved for use by the fund and certain other MFS U.S. funds. The line of credit is provided by a syndicate of banks under a credit agreement. Borrowings may be made for temporary financing needs. Interest is charged to each fund, based on its borrowings, generally at a rate equal to the highest of one month LIBOR, the Federal Funds Effective Rate and the Overnight Bank Funding Rate, plus an agreed upon spread. A commitment fee, based on the average daily, unused portion of the committed line of credit, is allocated among the participating funds. In addition, the fund and other funds managed by MFS have established unsecured uncommitted borrowing arrangements with certain banks for temporary financing needs. Interest is charged to each fund, based on its borrowings, at rates equal to customary reference rates plus an agreed upon spread. For the six months ended June 30, 2021, the fund’s commitment fee and interest expense were $2,002 and $0, respectively, and are included in “Miscellaneous” expense in the Statement of Operations.
(7) Investments in Affiliated Issuers
An affiliated issuer may be considered one in which the fund owns 5% or more of the outstanding voting securities, or a company which is under common control. For the purposes of this report, the following were affiliated issuers:
| Affiliated Issuers | Beginning
Value | Purchases | Sales
Proceeds | Realized
Gain
(Loss) | Change in
Unrealized
Appreciation or
Depreciation | Ending
Value |
| MFS Institutional Money Market Portfolio | $31,899,306 | $217,052,199 | $211,145,739 | $31 | $(31) | $37,805,766 |
| Affiliated Issuers | Dividend
Income | Capital Gain
Distributions |
| MFS Institutional Money Market Portfolio | $6,573 | $— |
(8) Impacts of COVID-19
The pandemic related to the global spread of novel coronavirus disease (COVID-19), which was first detected in December 2019, has resulted in significant disruptions to global business activity and the global economy, as well as the economies of individual countries, the financial performance of individual companies and sectors, and the securities and commodities markets in general. Multiple surges in cases globally, the availability and widespread adoption of vaccines, and the emergence of variant strains of the virus continue to create uncertainty as to the future and long-term impacts resulting from the pandemic including impacts to the prices and liquidity of the fund's investments and the fund's performance.
Statement Regarding Liquidity Risk Management Program
The fund has adopted and implemented a liquidity risk management program (the “Program”) as required by Rule 22e-4 under the Investment Company Act of 1940, as amended. The fund’s Board of Trustees (the “Board”) has designated MFS as the administrator of the Program. The Program is reasonably designed to assess and manage the liquidity risk of the fund. Liquidity risk is the risk that the fund could not meet requests to redeem shares issued by the fund without significant dilution of remaining investors' interests.
MFS provided a written report to the Board for consideration at its April 2021 meeting that addressed the operation of the Program and provided an assessment of the adequacy and effectiveness of the Program during the period from January 1, 2020 to December 31, 2020 (the “Covered Period”). The report concluded that during the Covered Period the Program had operated effectively and had adequately and effectively been implemented to assess and manage the fund’s liquidity risk. MFS also reported that there were no liquidity events that impacted the fund or its ability to timely meet redemptions without dilution to existing shareholders during the Covered Period.
There can be no assurance that the Program will achieve its objectives in the future. Further information on liquidity risk, and other principal risks to which an investment in the fund may be subject, can be found in the prospectus.
Proxy Voting Policies and Information
MFS votes proxies on behalf of the fund pursuant to proxy voting policies and procedures that are available without charge, upon request, by calling 1-800-225-2606, by visiting mfs.com/proxyvoting, or by visiting the SEC’s Web site at http://www.sec.gov.
Information regarding how the fund voted proxies relating to portfolio securities during the most recent twelve-month period ended June 30 is available by August 31 of each year without charge by visiting mfs.com/proxyvoting, or by visiting the SEC’s Web site at http://www.sec.gov.
Quarterly Portfolio Disclosure
The fund files a complete schedule of portfolio holdings with the SEC for the first and third quarters of each fiscal year as an exhibit to its reports on Form N-PORT. The fund’s Form N-PORT reports are available on the SEC’s Web site at http://www.sec.gov. A shareholder can obtain the portfolio holdings report for the first and third quarters of the fund's fiscal year at mfs.com/vit1 by choosing the fund's name and then scrolling to the “Resources” section and clicking on the “Prospectus and Reports” tab.
FURTHER INFORMATION
From time to time, MFS may post important information about the fund or the MFS Funds on the MFS Web site (mfs.com). This information is available at https://www.mfs.com/announcements or at mfs.com/vit1 by choosing the fund's name and then scrolling to the “Resources” section and clicking on the “Announcements” tab, if any.
Information About Fund Contracts and Legal Claims
The fund has entered into contractual arrangements with an investment adviser, administrator, distributor, shareholder servicing agent, 529 program manager (if applicable), and custodian who each provide services to the fund. Unless expressly stated otherwise, shareholders are not parties to, or intended beneficiaries of these contractual arrangements, and these contractual arrangements are not intended to create any shareholder right to enforce them against the service providers or to seek any remedy under them against the service providers, either directly or on behalf of the fund.
Under the Trust’s By-Laws and Declaration of Trust, any claims asserted against or on behalf of the MFS Funds, including claims against Trustees and Officers, must be brought in state and federal courts located within the Commonwealth of Massachusetts.
Semiannual Report
June 30, 2021
MFS® Total Return Bond Series
MFS® Variable Insurance Trust
MFS® Total Return Bond Series
The report is prepared for the general information of contract owners. It is authorized for distribution to prospective investors only when preceded or accompanied by a current prospectus.
NOT FDIC INSURED • MAY LOSE VALUE • NO BANK OR CREDIT UNION GUARANTEE •
NOT A DEPOSIT • NOT INSURED BY ANY FEDERAL GOVERNMENT AGENCY OR NCUA/NCUSIF
MFS Total Return Bond Series
Dear Contract Owners:
After experiencing dramatic swings in the early days of the coronavirus pandemic, global equity markets have performed strongly over the past year. Though the speedy development of vaccines brightened the economic and market outlook, uncertainty remains as new variants of the virus appear, and questions persist over how fast vaccines can be made widely available in the developing world.
Global central banks have taken aggressive steps to cushion the economic and market fallout related to the virus, and governments are deploying unprecedented levels of fiscal support. Having passed a $1.9 trillion stimulus package in March, the U.S. Congress could approve additional stimulus later this year, some of it focused on infrastructure. Along with extraordinary government expenditures, pent-up consumer demand fueled a surge in economic activity as coronavirus restrictions were eased, pushing up inflation, at least temporarily. Markets initially reacted by pushing up yields on global government bonds, though some of the rate rise has since been corrected.
A spirited debate is underway among investors over whether the current price pressures will persist or prove to be temporary, caused by pandemic-induced bottlenecks. The policy measures put in place to counteract the pandemic's effects have helped build a supportive environment and are encouraging economic recovery; however, if markets disconnect from fundamentals, they can sow the seeds of instability. As such, recent dramatic increases in speculative trading in cryptocurrencies, special purpose acquisition companies (SPACs), and the like bear watching.
In the aftermath of the crisis, we could see societal changes as households, businesses, and governments adjust to a new reality, and any such alterations could affect the investment landscape. For investors, events such as the COVID-19 outbreak demonstrate the importance of having a deep understanding of company fundamentals, and we have built our global research platform to do just that.
At MFS®, we put our clients’ assets to work responsibly by carefully navigating the increasing complexity of global markets and economies. Guided by our long-term philosophy and adhering to our commitment to sustainable investing, we tune out the noise and aim to uncover what we believe are the best, most durable investment opportunities in the market. Our unique global investment platform combines collective expertise, long-term discipline, and thoughtful risk management to create sustainable value for investors.
Respectfully,
Michael W. Roberge
Chief Executive Officer
MFS Investment Management
August 13, 2021
The opinions expressed in this letter are subject to change and may not be relied upon for investment advice. No forecasts can be guaranteed.
MFS Total Return Bond Series
Portfolio structure reflecting equivalent exposure of derivative positions (i)
Fixed income sectors (i)
| Investment Grade Corporates | 31.3% |
| Mortgage-Backed Securities | 17.4% |
| U.S. Treasury Securities | 16.5% |
| High Yield Corporates | 11.1% |
| Commercial Mortgage-Backed Securities | 9.8% |
| Collateralized Debt Obligations | 7.7% |
| Municipal Bonds | 2.7% |
| Emerging Markets Bonds | 2.7% |
| U.S. Government Agencies | 1.3% |
| Asset-Backed Securities | 1.2% |
| Residential Mortgage-Backed Securities | 0.5% |
| Non-U.S. Government Bonds | 0.2% |
Composition including fixed income credit quality (a)(i)
| AAA | 11.4% |
| AA | 5.2% |
| A | 11.5% |
| BBB | 25.7% |
| BB | 10.7% |
| B | 2.4% |
| C (o) | 0.0% |
| U.S. Government | 11.4% |
| Federal Agencies | 18.7% |
| Not Rated | 5.4% |
| Cash & Cash Equivalents | 2.7% |
| Other | (5.1)% |
Portfolio facts (i)
| Average Duration (d) | 6.1 |
| Average Effective Maturity (m) | 7.1 yrs. |
| (a) | For all securities other than those specifically described below, ratings are assigned to underlying securities utilizing ratings from Moody’s, Fitch, and Standard & Poor’s rating agencies and applying the following hierarchy: If all three agencies provide a rating, the middle rating (after dropping the highest and lowest ratings) is assigned; if two of the three agencies rate a security, the lower of the two is assigned. If none of the 3 rating agencies above assign a rating, but the security is rated by DBRS Morningstar, then the DBRS Morningstar rating is assigned. If none of the 4 ratings agencies listed above rate the security, but the security is rated by the Kroll Bond Rating Agency (KBRA), then the KBRA rating is assigned. Ratings are shown in the S&P and Fitch scale (e.g., AAA). Securities rated BBB or higher are considered investment grade. All ratings are subject to change. U.S. Government includes securities issued by the U.S. Department of the Treasury. Federal Agencies includes rated and unrated U.S. Agency fixed-income securities, U.S. Agency mortgage-backed securities, and collateralized mortgage obligations of U.S. Agency mortgage-backed securities. Not Rated includes fixed income securities and fixed income derivatives that have not been rated by any rating agency. The fund may or may not have held all of these instruments on this date. The fund is not rated by these agencies. |
| (d) | Duration is a measure of how much a bond’s price is likely to fluctuate with general changes in interest rates, e.g., if rates rise 1.00%, a bond with a 5-year duration is likely to lose about 5.00% of its value due to the interest rate move. |
| (i) | For purposes of this presentation, the components include the value of securities, and reflect the impact of the equivalent exposure of derivative positions, if any. These amounts may be negative from time to time. Equivalent exposure is a calculated amount that translates the derivative position into a reasonable approximation of the amount of the underlying asset that the portfolio would have to hold at a given point in time to have the same price sensitivity that results from the portfolio’s ownership of the derivative contract. When dealing with derivatives, equivalent exposure is a more representative measure of the potential impact of a position on portfolio performance than value. The bond component will include any accrued interest amounts. |
| (m) | In determining each instrument’s effective maturity for purposes of calculating the fund’s dollar-weighted average effective maturity, MFS uses the instrument’s stated maturity or, if applicable, an earlier date on which MFS believes it is probable that a maturity-shortening device (such as a put, pre-refunding or prepayment) will cause the instrument to be repaid. Such an earlier date can be substantially shorter than the instrument’s stated maturity. |
Cash & Cash Equivalents includes any cash, investments in money market funds, short-term securities, and other assets less liabilities. Please see the Statement of Assets and Liabilities for additional information related to the fund’s cash position and other assets and liabilities.
Other includes equivalent exposure from currency derivatives and/or any offsets to derivative positions and may be negative.
MFS Total Return Bond Series
Portfolio Composition - continued
Percentages are based on net assets as of June 30, 2021.
The portfolio is actively managed and current holdings may be different.
MFS Total Return Bond Series
Expense Table
Fund Expenses Borne by the Contract Holders during the Period,
January 1, 2021 through June 30, 2021
As a contract holder of the fund, you incur ongoing costs, including management fees; distribution and/or service (12b-1) fees; and other fund expenses. This example is intended to help you understand your ongoing costs (in dollars) of investing in the fund and to compare these costs with the ongoing costs of investing in other mutual funds.
The example is based on an investment of $1,000 invested at the beginning of the period and held for the entire period January 1, 2021 through June 30, 2021.
Actual Expenses
The first line for each share class in the following table provides information about actual account values and actual expenses. You may use the information in this line, together with the amount you invested, to estimate the expenses that you paid over the period. Simply divide your account value by $1,000 (for example, an $8,600 account value divided by $1,000 = 8.6), then multiply the result by the number in the first line under the heading entitled “Expenses Paid During Period” to estimate the expenses you paid on your account during this period.
Hypothetical Example for Comparison Purposes
The second line for each share class in the following table provides information about hypothetical account values and hypothetical expenses based on the fund’s actual expense ratio and an assumed rate of return of 5% per year before expenses, which is not the fund’s actual return. The hypothetical account values and expenses may not be used to estimate the actual ending account balance or expenses you paid for the period. You may use this information to compare the ongoing costs of investing in the fund and other funds. To do so, compare this 5% hypothetical example with the 5% hypothetical examples that appear in the shareholder reports of the other funds.
Please note that the expenses shown in the table are meant to highlight the fund's ongoing costs only and do not take into account the fees and expenses imposed under the variable contracts through which your investment in the fund is made. Therefore, the second line for each share class in the table is useful in comparing ongoing costs associated with an investment in vehicles (such as the fund) which fund benefits under variable annuity and variable life insurance contracts and to qualified pension and retirement plans only, and will not help you determine the relative total costs of investing in the fund through variable annuity and variable life insurance contracts. If the fees and expenses imposed under the variable contracts were included, your costs would have been higher.
Share
Class | | Annualized
Expense
Ratio | Beginning
Account Value
1/01/21 | Ending
Account Value
6/30/21 | Expenses
Paid During
Period (p)
1/01/21-6/30/21 |
| Initial Class | Actual | 0.53% | $1,000.00 | $990.79 | $2.62 |
| Hypothetical (h) | 0.53% | $1,000.00 | $1,022.17 | $2.66 |
| Service Class | Actual | 0.78% | $1,000.00 | $989.90 | $3.85 |
| Hypothetical (h) | 0.78% | $1,000.00 | $1,020.93 | $3.91 |
| (h) | 5% class return per year before expenses. |
| (p) | “Expenses Paid During Period” are equal to each class's annualized expense ratio, as shown above, multiplied by the average account value over the period, multiplied by 181/365 (to reflect the one-half year period). |
MFS Total Return Bond Series
Portfolio of Investments − 6/30/21 (unaudited)
The Portfolio of Investments is a complete list of all securities owned by your fund. It is categorized by broad-based asset classes.
| Issuer | | | Shares/Par | Value ($) |
| Bonds – 96.7% |
| Aerospace & Defense – 0.9% |
| Boeing Co., 2.196%, 2/04/2026 | | $ | 6,236,000 | $ 6,295,605 |
| Boeing Co., 5.15%, 5/01/2030 | | | 1,704,000 | 2,017,800 |
| Boeing Co., 5.705%, 5/01/2040 | | | 1,595,000 | 2,054,173 |
| Boeing Co., 5.805%, 5/01/2050 | | | 1,550,000 | 2,087,278 |
| TransDigm, Inc., 4.625%, 1/15/2029 (n) | | | 5,462,000 | 5,463,912 |
| | | | | $17,918,768 |
| Asset-Backed & Securitized – 19.2% |
| Allegro CLO Ltd., 2014-1RA, “A2”, FLR, 1.786% (LIBOR - 3mo. + 1.6%), 10/21/2028 (n) | | $ | 5,554,267 | $ 5,572,724 |
| Arbor Realty Trust, Inc., CLO, 2018-FL1, “A”, FLR, 1.222% (LIBOR - 1mo. + 1.15%), 6/15/2028 (n) | | | 7,720,000 | 7,722,409 |
| Arbor Realty Trust, Inc., CLO, 2019-FL1, “C”, FLR, 2.172% (LIBOR - 1mo. + 2.1%), 5/15/2037 (n) | | | 808,000 | 807,748 |
| Arbor Realty Trust, Inc., CLO, 2019-FL1, “D”, FLR, 2.572% (LIBOR - 1mo. + 2.5%), 5/15/2037 (n) | | | 6,995,000 | 6,986,270 |
| Arbor Realty Trust, Inc., CLO, 2019-FL2, “AS”, FLR, 1.574% (LIBOR - 1mo. + 1.45%), 9/15/2034 (n) | | | 980,500 | 980,806 |
| Arbor Realty Trust, Inc., CLO, 2019-FL2, “B”, FLR, 1.874% (LIBOR - 1mo. + 1.75%), 9/15/2034 (n) | | | 784,500 | 784,500 |
| Arbor Realty Trust, Inc., CLO, 2020-FL1, “C”, FLR, 2.174% (LIBOR - 1mo. + 2.05%), 2/15/2035 (n) | | | 3,529,000 | 3,526,643 |
| Arbor Realty Trust, Inc., CLO, 2021-FL1, “C”, FLR, 2.072% (LIBOR - 1mo. + 2%), 12/15/2035 (n) | | | 905,000 | 905,848 |
| Arbor Realty Trust, Inc., CLO, 2021-FL1, “D”, FLR, 3.022% (LIBOR - 1mo. + 2.95%), 12/15/2035 (n) | | | 831,500 | 833,842 |
| Arbor Realty Trust, Inc., CLO, 2021-FL2, “B”, 1.7%, 5/15/2036 (n) | | | 1,152,500 | 1,152,501 |
| AREIT CRE Trust, 2019-CRE3, “A”, FLR, 1.144% (LIBOR - 1mo. + 1.02%), 9/14/2036 (n) | | | 1,230,000 | 1,229,237 |
| AREIT CRE Trust, 2019-CRE3, “B”, FLR, 1.674% (LIBOR - 1mo. + 1.55%), 9/14/2036 (n) | | | 2,569,500 | 2,556,742 |
| AREIT CRE Trust, 2019-CRE3, “C”, FLR, 2.024% (LIBOR - 1mo. + 1.9%), 9/14/2036 (n) | | | 2,242,500 | 2,228,581 |
| AREIT CRE Trust, 2019-CRE3, “D”, FLR, 2.774% (LIBOR - 1mo. + 2.65%), 9/14/2036 (n) | | | 1,849,000 | 1,812,264 |
| Atrium XII Corp., 2012-A, “B1R”, FLR, 1.533% (LIBOR - 3mo. + 1.35%), 4/22/2027 (n) | | | 7,430,000 | 7,426,263 |
| Bancorp Commercial Mortgage Trust, 2017-CRE2, “B”, FLR, 1.672% (LIBOR - 1mo. + 1.6%), 8/15/2032 (z) | | | 2,312,000 | 2,314,543 |
| Issuer | | | Shares/Par | Value ($) |
| Bonds – continued |
| Asset-Backed & Securitized – continued |
| Bancorp Commercial Mortgage Trust, 2018-CRE3, “D”, FLR, 2.772% (LIBOR - 1mo. + 2.7%), 1/15/2033 (n) | | $ | 1,668,091 | $ 1,659,430 |
| Bancorp Commercial Mortgage Trust, 2018-CRE4, “B”, FLR, 1.322% (LIBOR - 1mo. + 1.25%), 9/15/2035 (n) | | | 1,228,047 | 1,219,469 |
| Bancorp Commercial Mortgage Trust, 2018-CRE4, “D”, FLR, 2.172% (LIBOR - 1mo. + 2.1%), 9/15/2035 (n) | | | 1,465,000 | 1,452,705 |
| Bancorp Commercial Mortgage Trust, 2019-CRE5, “A”, FLR, 1.072% (LIBOR - 1mo. + 1%), 3/15/2036 (n) | | | 648,440 | 648,440 |
| Bancorp Commercial Mortgage Trust, 2019-CRE5, “AS”, FLR, 1.422% (LIBOR - 1mo. + 1.35%), 3/15/2036 (n) | | | 1,394,437 | 1,393,607 |
| Bancorp Commercial Mortgage Trust, 2019-CRE6, “B”, FLR, 1.674% (LIBOR - 1mo. + 1.55%), 9/15/2036 (n) | | | 8,289,572 | 8,276,384 |
| Bancorp Commercial Mortgage Trust, 2019-CRE6, “D”, FLR, 2.424% (LIBOR - 1mo. + 2.54%), 9/15/2036 (n) | | | 545,000 | 542,289 |
| Barclays Commercial Mortgage Securities LLC, 2019-C5, “A4”, 3.063%, 11/15/2052 | | | 2,755,000 | 2,987,982 |
| Bayview Commercial Asset Trust, 0%, 12/25/2036 (i)(n) | | | 84,225 | 8 |
| Bayview Financial Revolving Mortgage Loan Trust, FLR, 1.695% (LIBOR - 1mo. + 1.6%), 12/28/2040 (n) | | | 44,145 | 47,473 |
| BDS Ltd., 2019-FL4, “A”, FLR, 1.181% (LIBOR - 1mo. + 1.10%), 8/15/2036 (n) | | | 5,165,000 | 5,161,849 |
| BDS Ltd., 2021-FL7, “B”, 1.574% (LIBOR - 1mo. + 1.5%), 6/16/2036 (n) | | | 1,259,500 | 1,259,890 |
| Bear Stearns Cos., Inc., “A2”, FLR, 0.991% (LIBOR - 1mo. + 0.45%), 12/25/2042 | | | 191,039 | 189,970 |
| Benchmark Mortgage Trust, 2020-B18, “A5”, 1.925%, 7/15/2053 | | | 2,133,596 | 2,121,854 |
| BSPRT Issuer Ltd., 2019-FL5, “C”, FLR, 2.072% (LIBOR - 1mo. + 2%), 5/15/2029 (n) | | | 3,295,000 | 3,270,508 |
| BSPRT Issuer Ltd., 2021-FL6, “B”, FLR, 1.672% (LIBOR - 1mo. + 1.6%), 3/15/2036 (n) | | | 3,669,500 | 3,667,218 |
| BSPRT Issuer Ltd., 2021-FL6, “C”, FLR, 2.122% (LIBOR - 1mo. + 2.05%), 3/15/2036 (n) | | | 1,288,000 | 1,287,198 |
MFS Total Return Bond Series
Portfolio of Investments (unaudited) – continued
| Issuer | | | Shares/Par | Value ($) |
| Bonds – continued |
| Asset-Backed & Securitized – continued |
| Business Jet Securities LLC, 2020-1A, “A”, 2.981%, 11/15/2035 (n) | | $ | 1,782,573 | $ 1,814,762 |
| Business Jet Securities LLC, 2021-1A, “B”, 2.918%, 4/15/2036 (n) | | | 609,293 | 614,358 |
| BXMT Ltd., 2020-FL2, “B”, FLR, 1.524% (LIBOR - 1mo. + 1.4%), 2/15/2038 (n) | | | 1,731,000 | 1,729,378 |
| Cantor Commercial Real Estate, 2019-CF2, “A5”, 2.874%, 11/15/2052 | | | 6,645,635 | 7,049,470 |
| Capital Automotive, 2020-1A, “A4”, REIT, 3.19%, 2/15/2050 (n) | | | 2,405,039 | 2,476,099 |
| CHCP 2021-FL1 Ltd., “B”, FLR, 1.774% (LIBOR - 1mo. + 1.65%), 2/15/2038 (n) | | | 1,102,500 | 1,103,883 |
| CHCP 2021-FL1 Ltd., “C”, FLR, 2.224% (LIBOR - 1mo. + 2.1%), 2/15/2038 (n) | | | 1,249,000 | 1,250,958 |
| Chesapeake Funding II LLC, 2018-1A, “A1”, 3.04%, 4/15/2030 (n) | | | 1,138,264 | 1,139,753 |
| Citigroup Commercial Mortgage Trust, 2014-GC25, “A4”, 3.635%, 10/10/2047 | | | 3,128,793 | 3,389,329 |
| Citigroup Commercial Mortgage Trust, 2016-P6, “A5”, 3.72%, 12/10/2049 | | | 1,754,000 | 1,953,374 |
| Citigroup Commercial Mortgage Trust, 2019-C7, “A4”, 3.102%, 12/15/2072 | | | 790,000 | 859,024 |
| CLNC Ltd., 2019-FL1, “B”, FLR, 2.024% (LIBOR - 1mo. + 1.9%), 8/20/2035 (n) | | | 1,850,000 | 1,839,881 |
| CLNC Ltd., 2019-FL1, “C”, FLR, 2.524% (LIBOR - 1mo. + 2.4%), 8/20/2035 (n) | | | 3,006,500 | 2,991,495 |
| Commercial Mortgage Trust, 2012-CR2, “A4”, 3.147%, 8/15/2045 | | | 3,950,000 | 4,025,154 |
| Commercial Mortgage Trust, 2015-LC21, “A4”, 3.708%, 7/10/2048 | | | 10,000,000 | 10,918,418 |
| Commercial Mortgage Trust, 2015-PC1, “A5”, 3.902%, 7/10/2050 | | | 2,888,848 | 3,172,633 |
| Credit Acceptance Auto Loan Trust, 2021-3A, “C”, 1.63%, 9/16/2030 (n) | | | 523,000 | 522,824 |
| CSAIL Commercial Mortgage Trust, 2015-C2, “A4”, 3.504%, 6/15/2057 | | | 2,695,346 | 2,910,026 |
| Cutwater Ltd., 2014-1A, “BR”, FLR, 2.583% (LIBOR - 3mo. + 2.4%), 7/15/2026 (n) | | | 3,135,000 | 3,122,319 |
| Cutwater Ltd., 2015-1A, “BR”, FLR, 1.983% (LIBOR - 3mo. + 1.8%), 1/15/2029 (n) | | | 10,770,000 | 10,644,411 |
| DT Auto Owner Trust, 2019-2A, “C”, 3.18%, 2/18/2025 (n) | | | 3,392,000 | 3,437,384 |
| Exeter Automobile Receivables Trust, 2020-1A, 2.49%, 1/15/2025 (n) | | | 1,905,000 | 1,938,879 |
| Issuer | | | Shares/Par | Value ($) |
| Bonds – continued |
| Asset-Backed & Securitized – continued |
| Fort CRE LLC, 2018-1A, “A1”, FLR, 1.445% (LIBOR - 1mo. + 1.35%), 11/16/2035 (n) | | $ | 4,761,675 | $ 4,761,675 |
| Galaxy CLO Ltd., 2018-29A, “A”, FLR, 0.945% (LIBOR - 3mo. + 0.79%), 11/15/2026 (n) | | | 3,251,531 | 3,250,032 |
| Galaxy CLO Ltd., 2018-29A, “B”, FLR, 1.555% (LIBOR - 3mo. + 1.4%), 11/15/2026 (n) | | | 2,878,803 | 2,890,566 |
| GLS Auto Receivables Trust, 2020-1A, “A”, 2.17%, 2/15/2024 (n) | | | 701,469 | 705,446 |
| Grand Avenue CRE Ltd., 2019-FL1, “A”, FLR, 1.192% (LIBOR - 1mo. + 1.12%), 6/15/2037 (n) | | | 1,786,072 | 1,786,072 |
| GS Mortgage Securities Trust, 2015-GC30, “A4”, 3.382%, 5/10/2050 | | | 7,904,407 | 8,549,151 |
| GS Mortgage Securities Trust, 2019-GSA1, “A4”, 3.047%, 11/10/2052 | | | 10,169,944 | 10,989,631 |
| HarbourView CLO VII Ltd., 7RA, “B”, FLR, 1.889% (LIBOR - 3mo. + 1.7%), 7/18/2031 (n) | | | 6,545,000 | 6,487,352 |
| Invitation Homes Trust, 2018-SFR1, “B”, FLR, 0.782% (LIBOR - 1mo. + 0.7%), 3/17/2037 (n) | | | 8,746,170 | 8,754,269 |
| Invitation Homes Trust, 2018-SFR2, “A”, FLR, 0.932% (LIBOR - 1mo. + 0.85%), 12/17/2036 (n) | | | 1,226,837 | 1,227,913 |
| JPMBB Commercial Mortgage Securities Trust, 2015-C28, “A4”, 3.227%, 10/15/2048 | | | 12,188,428 | 13,013,343 |
| JPMorgan Chase Commercial Mortgage Securities Corp., 5.788%, 7/15/2042 (n) | | | 18,491 | 15,255 |
| JPMorgan Chase Commercial Mortgage Securities Corp., 3.454%, 9/15/2050 | | | 7,520,623 | 8,301,473 |
| JPMorgan Chase Commercial Mortgage Securities Corp., “A3”, 4.171%, 8/15/2046 | | | 35,182 | 35,151 |
| JPMorgan Mortgage Trust, “A1”, 1.923%, 10/25/2033 | | | 78,638 | 79,488 |
| KKR Real Estate Financial Trust, Inc., 2018-FL1, “C”, FLR, 2.081% (LIBOR - 1mo. + 2%), 6/15/2036 (n) | | | 5,197,500 | 5,202,365 |
| Lehman Brothers Commercial Conduit Mortgage Trust, 1.099%, 2/18/2030 (i) | | | 1,757 | 0 |
| LoanCore Ltd., 2018-CRE1, “AS”, FLR, 1.572% (LIBOR - 1mo. + 1.5%), 5/15/2028 (n) | | | 8,900,000 | 8,900,000 |
| LoanCore Ltd., 2018-CRE1, “C”, FLR, 2.622% (LIBOR - 1mo. + 2.55%), 5/15/2028 (n) | | | 2,340,000 | 2,328,300 |
| LoanCore Ltd., 2018-CRE1, “C”, FLR, 2.022% (LIBOR - 1mo. + 1.95%), 4/15/2034 (n) | | | 1,836,900 | 1,818,549 |
MFS Total Return Bond Series
Portfolio of Investments (unaudited) – continued
| Issuer | | | Shares/Par | Value ($) |
| Bonds – continued |
| Asset-Backed & Securitized – continued |
| LoanCore Ltd., 2018-CRE1/CRE3, “B”, FLR, 1.672% (LIBOR - 1mo. + 1.6%), 4/15/2034 (n) | | $ | 1,873,800 | $ 1,864,442 |
| LoanCore Ltd., 2019-CRE2, “D”, FLR, 2.522% (LIBOR - 1mo. + 2.45%), 5/15/2036 (n) | | | 1,121,500 | 1,087,969 |
| LoanCore Ltd., 2019-CRE3, “AS”, FLR, 1.442% (LIBOR - 1mo. + 1.37%), 4/15/2034 (n) | | | 1,456,200 | 1,454,383 |
| LoanCore Ltd., 2021-CRE5, “AS”, 1.823%, 7/15/2036 (n) | | | 5,666,000 | 5,671,299 |
| LoanCore Ltd., 2021-CRE5, “B”, FLR, 2.072% (LIBOR - 1mo. + 2%), 7/15/2036 (n) | | | 2,054,000 | 2,055,925 |
| Madison Park Funding Ltd., 2017- 23A, “CR”, FLR, 2.16% (LIBOR - 3mo. + 2.0%), 7/27/2031 (n) | | | 5,894,060 | 5,891,107 |
| Merrill Lynch Mortgage Investors, Inc., “A”, 2.096%, 5/25/2036 | | | 91,019 | 92,521 |
| Merrill Lynch Mortgage Investors, Inc., “A5”, 1.99%, 4/25/2035 | | | 116,210 | 115,802 |
| MF1 CLO Ltd., 2019-FL2, “AS”, FLR, 1.562% (LIBOR - 1mo. + 1.43%), 12/25/2034 (n) | | | 11,245,000 | 11,244,990 |
| MF1 CLO Ltd., 2021-FL5, “C”, FLR, 1.824% (LIBOR - 1mo. + 1.7%), 7/15/2036 (n) | | | 2,589,000 | 2,586,574 |
| MF1 Multi-Family Housing Mortgage Loan Trust, 2020-FL4, FLR, 2.224% (LIBOR - 1mo. + 2.1%), 11/15/2035 (n) | | | 2,602,500 | 2,626,895 |
| Morgan Stanley Bank of America/Merrill Lynch Trust, “A4”, 3.176%, 8/15/2045 | | | 5,000,000 | 5,084,432 |
| NextGear Floorplan Master Owner Trust, 2019-2A, “A2”, 2.07%, 10/15/2024 (n) | | | 2,465,000 | 2,519,991 |
| OCP CLO Ltd., 2015-9A, “A2R”, FLR, 1.533% (LIBOR - 3mo. + 1.35%), 7/15/2027 (n) | | | 6,280,000 | 6,282,694 |
| Palmer Square Loan Funding Ltd., 2020-1A, “A2”, FLR, 1.505% (LIBOR - 3mo. + 1.35%), 2/20/2028 (n) | | | 3,930,000 | 3,909,874 |
| Palmer Square Loan Funding Ltd., 2020-1A, “B”, FLR, 2.055% (LIBOR - 3mo. + 1.9%), 2/20/2028 (n) | | | 3,453,628 | 3,384,835 |
| Parallel Ltd., 2015-1A, “C1R”, FLR, 1.938% (LIBOR - 3mo. + 1.75%), 7/20/2027 (n) | | | 1,680,000 | 1,680,576 |
| Parallel Ltd., 2015-1A, “C2R”, FLR, 1.938% (LIBOR - 3mo. + 1.75%), 7/20/2027 (n) | | | 1,810,000 | 1,799,162 |
| PFP III Ltd., 2021-7, “B”, FLR, 1.474% (LIBOR - 1mo. + 1.4%), 4/14/2038 (n) | | | 936,000 | 933,671 |
| PFP III Ltd., 2021-7, “C”, FLR, 1.724% (LIBOR - 1mo. + 1.65%), 4/14/2038 (n) | | | 1,640,500 | 1,636,417 |
| Issuer | | | Shares/Par | Value ($) |
| Bonds – continued |
| Asset-Backed & Securitized – continued |
| Preferred Term Securities XIX Ltd., CDO, FLR, 0.468% (LIBOR - 3mo. + 0.35%), 12/22/2035 (n) | | $ | 181,303 | $ 159,773 |
| Race Point CLO Ltd., 2013-8A, “AR-2”, FLR, 1.195% (LIBOR - 3mo. + 1.04%), 2/20/2030 (n) | | | 3,697,038 | 3,698,757 |
| Residential Funding Mortgage Securities, Inc., FGIC, 4.969%, 12/25/2035 | | | 3,845 | 3,819 |
| Santander Retail Auto Lease Trust, 2019-A, “B”, 3.01%, 5/22/2023 (n) | | | 3,222,000 | 3,261,770 |
| Santander Retail Auto Lease Trust, 2020-A, “C”, 2.08%, 3/20/2024 (n) | | | 2,276,000 | 2,325,577 |
| Securitized Term Auto Receivable Trust, 2019-CRTA, “B”, 2.453%, 3/25/2026 (n) | | | 1,003,776 | 1,020,611 |
| Securitized Term Auto Receivable Trust, 2019-CRTA, “C”, 2.849%, 3/25/2026 (n) | | | 1,197,037 | 1,221,734 |
| Starwood Commercial Mortgage, 2021-FL2, “C”, FLR, 2.182% (LIBOR - 1mo. + 2.1%), 4/18/2038 (n) | | | 2,027,000 | 2,030,807 |
| TICP CLO Ltd., 2018-IA, “A2”, FLR, 1.675% (LIBOR - 3mo. + 1.5%), 4/26/2028 (n) | | | 6,750,828 | 6,750,940 |
| UBS Commercial Mortgage Trust, 2017-C8, “A4”, 3.983%, 2/15/2051 | | | 5,865,766 | 6,633,582 |
| UBS Commercial Mortgage Trust, 2019-C17, “A4”, 2.921%, 9/15/2052 | | | 12,215,133 | 12,980,869 |
| Veros Auto Receivables Trust, 2020-1, “A”, 1.67%, 9/15/2023 (n) | | | 1,120,983 | 1,123,711 |
| Voya CLO Ltd., 2012-4A, “A2AR”, FLR, 2.083% (LIBOR - 3mo. + 1.90%), 10/15/2030 (n) | | | 1,940,000 | 1,950,043 |
| Voya CLO Ltd., 2016-4A, “CR”, 2.228% (LIBOR - 3mo. + 2.15%), 7/20/2029 (n) | | | 4,904,782 | 4,902,300 |
| Wells Fargo Commercial Mortgage Trust, 2016-LC25, “A4”, 3.64%, 12/15/2059 | | | 13,071,416 | 14,464,344 |
| Wells Fargo Commercial Mortgage Trust, 2017-C42, “A5”, 3.589%, 12/15/2050 | | | 3,970,000 | 4,407,716 |
| Wells Fargo Commercial Mortgage Trust, 2018-C46, “A4”, 4.152%, 8/15/2051 | | | 1,430,000 | 1,640,327 |
| Wells Fargo Commercial Mortgage Trust, 2019-C53, “A4”, 3.04%, 10/15/2052 | | | 10,239,837 | 11,063,351 |
| Wells Fargo Commercial Mortgage Trust, 2019-C54, “A4”, 3.146%, 12/15/2052 | | | 4,898,000 | 5,329,000 |
| Wells Fargo Commercial Mortgage Trust, 2020-C58, “A4”, 2.092%, 7/15/2053 | | | 3,745,000 | 3,767,665 |
MFS Total Return Bond Series
Portfolio of Investments (unaudited) – continued
| Issuer | | | Shares/Par | Value ($) |
| Bonds – continued |
| Asset-Backed & Securitized – continued |
| Wind River CLO Ltd., 2015-2A, “CR”, FLR, 1.883% (LIBOR - 3mo. + 1.7%), 10/15/2027 (n) | | $ | 975,000 | $ 976,790 |
| | | | | $391,664,083 |
| Automotive – 0.4% |
| Hyundai Capital America, 2.375%, 10/15/2027 (n) | | $ | 1,982,000 | $ 2,026,289 |
| Volkswagen Group of America Finance LLC, 3.2%, 9/26/2026 (n) | | | 3,573,000 | 3,863,251 |
| Volkswagen Group of America Finance LLC, 3.75%, 5/13/2030 (n) | | | 2,118,000 | 2,374,930 |
| | | | | $8,264,470 |
| Broadcasting – 0.9% |
| Discovery, Inc., 4.65%, 5/15/2050 | | $ | 4,028,000 | $ 4,713,595 |
| Prosus N.V., 3.68%, 1/21/2030 (n) | | | 4,905,000 | 5,238,093 |
| WMG Acquisition Corp., 3%, 2/15/2031 (n) | | | 8,700,000 | 8,242,902 |
| | | | | $18,194,590 |
| Brokerage & Asset Managers – 1.3% |
| E*TRADE Financial Corp., 3.8%, 8/24/2027 | | $ | 5,272,000 | $ 5,855,094 |
| E*TRADE Financial Corp., 4.5%, 6/20/2028 | | | 3,485,000 | 4,034,844 |
| Intercontinental Exchange, Inc., 3.75%, 9/21/2028 | | | 2,249,000 | 2,531,747 |
| Intercontinental Exchange, Inc., 2.1%, 6/15/2030 | | | 1,170,000 | 1,161,833 |
| LPL Holdings, Inc., 4%, 3/15/2029 (n) | | | 6,500,000 | 6,529,055 |
| Raymond James Financial, Inc., 4.95%, 7/15/2046 | | | 4,683,000 | 6,052,340 |
| | | | | $26,164,913 |
| Building – 0.8% |
| ABC Supply Co., Inc., 4%, 1/15/2028 (n) | | $ | 2,975,000 | $ 3,048,512 |
| Martin Marietta Materials, Inc., 3.45%, 6/01/2027 | | | 1,243,000 | 1,357,560 |
| Standard Industries, Inc., 4.375%, 7/15/2030 (n) | | | 4,065,000 | 4,192,031 |
| Standard Industries, Inc., 3.375%, 1/15/2031 (n) | | | 3,660,000 | 3,503,389 |
| Vulcan Materials Co., 3.5%, 6/01/2030 | | | 3,356,000 | 3,699,322 |
| | | | | $15,800,814 |
| Business Services – 1.1% |
| Equinix, Inc., 2.15%, 7/15/2030 | | $ | 4,789,000 | $ 4,758,428 |
| Fiserv, Inc., 3.5%, 7/01/2029 | | | 3,750,000 | 4,126,282 |
| Fiserv, Inc., 2.65%, 6/01/2030 | | | 4,000,000 | 4,141,507 |
| Iron Mountain, Inc., 4.5%, 2/15/2031 (n) | | | 5,315,000 | 5,381,437 |
| NXP Semiconductors N.V., 2.7%, 5/01/2025 (n) | | | 508,000 | 535,748 |
| Switch Ltd., 4.125%, 6/15/2029 (n) | | | 3,175,000 | 3,258,344 |
| | | | | $22,201,746 |
| Issuer | | | Shares/Par | Value ($) |
| Bonds – continued |
| Cable TV – 2.0% |
| CCO Holdings LLC/CCO Holdings Capital Corp., 5%, 2/01/2028 (n) | | $ | 4,470,000 | $ 4,687,912 |
| CCO Holdings LLC/CCO Holdings Capital Corp., 4.5%, 8/15/2030 (n) | | | 4,025,000 | 4,190,886 |
| Charter Communications Operating LLC/Charter Communications Operating Capital Corp., 4.908%, 7/23/2025 | | | 7,676,000 | 8,696,224 |
| CSC Holdings LLC, 4.125%, 12/01/2030 (n) | | | 5,940,000 | 5,902,875 |
| CSC Holdings LLC, 4.5%, 11/15/2031 (n) | | | 4,065,000 | 4,089,959 |
| Sirius XM Radio, Inc., 5.375%, 7/15/2026 (n) | | | 3,615,000 | 3,732,488 |
| Sirius XM Radio, Inc., 5.5%, 7/01/2029 (n) | | | 4,005,000 | 4,364,249 |
| Time Warner Cable, Inc., 4.5%, 9/15/2042 | | | 3,558,000 | 3,954,883 |
| Time Warner Entertainment Co. LP, 8.375%, 7/15/2033 | | | 290,000 | 439,417 |
| | | | | $40,058,893 |
| Chemicals – 0.1% |
| Axalta Coating Systems Ltd., 3.375%, 2/15/2029 (n) | | $ | 3,100,000 | $ 3,030,250 |
| Computer Software – 0.6% |
| Dell International LLC/EMC Corp., 5.3%, 10/01/2029 | | $ | 9,950,000 | $ 12,005,983 |
| Computer Software - Systems – 0.3% |
| SS&C Technologies Holdings, Inc., 5.5%, 9/30/2027 (n) | | $ | 6,040,000 | $ 6,400,588 |
| Conglomerates – 0.7% |
| BWX Technologies, Inc., 4.125%, 6/30/2028 (n) | | $ | 2,327,000 | $ 2,370,631 |
| Carrier Global Corp., 3.577%, 4/05/2050 | | | 6,276,000 | 6,655,487 |
| Westinghouse Air Brake Technologies Corp., 4.95%, 9/15/2028 | | | 4,993,000 | 5,791,813 |
| | | | | $14,817,931 |
| Consumer Products – 0.7% |
| Reckitt Benckiser Treasury Services PLC, 2.75%, 6/26/2024 (n) | | $ | 13,673,000 | $ 14,437,192 |
| Consumer Services – 0.6% |
| Booking Holdings, Inc., 3.65%, 3/15/2025 | | $ | 3,449,000 | $ 3,766,711 |
| Toll Road Investors Partnership II LP, Capital Appreciation, NPFG, 0%, 2/15/2026 (n) | | | 2,145,000 | 1,792,090 |
| Toll Road Investors Partnership II LP, Capital Appreciation, NPFG, 0%, 2/15/2029 (n) | | | 6,221,000 | 4,159,814 |
| Toll Road Investors Partnership II LP, Capital Appreciation, NPFG, 0%, 2/15/2031 (n) | | | 2,145,000 | 1,270,871 |
MFS Total Return Bond Series
Portfolio of Investments (unaudited) – continued
| Issuer | | | Shares/Par | Value ($) |
| Bonds – continued |
| Consumer Services – continued |
| Toll Road Investors Partnership II LP, Capital Appreciation, NPFG, 0%, 2/15/2043 (n) | | $ | 5,600,000 | $ 1,716,677 |
| | | | | $12,706,163 |
| Containers – 0.4% |
| Crown Americas LLC/Crown Americas Capital Corp. VI, 4.75%, 2/01/2026 | | $ | 7,030,000 | $ 7,295,031 |
| Electronics – 1.2% |
| Broadcom Corp./Broadcom Cayman Finance Ltd., 3.875%, 1/15/2027 | | $ | 3,219,000 | $ 3,556,924 |
| Broadcom, Inc., 4.75%, 4/15/2029 | | | 3,632,000 | 4,224,949 |
| Broadcom, Inc., 4.15%, 11/15/2030 | | | 5,906,000 | 6,623,077 |
| Broadcom, Inc., 3.469%, 4/15/2034 (n) | | | 3,589,000 | 3,796,281 |
| Sensata Technologies B.V., 5%, 10/01/2025 (n) | | | 3,740,000 | 4,165,425 |
| Sensata Technologies B.V., 4%, 4/15/2029 (n) | | | 2,670,000 | 2,710,272 |
| | | | | $25,076,928 |
| Emerging Market Quasi-Sovereign – 0.7% |
| Indian Railway Finance Corp., 2.8%, 2/10/2031 (n) | | $ | 6,055,000 | $ 5,852,095 |
| Office Cherifien des Phosphates S.A. (Kingdom of Morocco), 3.75%, 6/23/2031 (n) | | | 5,063,000 | 5,111,098 |
| Power Finance Corp. Ltd. (Republic of India), 3.95%, 4/23/2030 | | | 2,856,000 | 2,938,123 |
| | | | | $13,901,316 |
| Emerging Market Sovereign – 0.2% |
| Dominican Republic, 4.5%, 1/30/2030 (n) | | $ | 4,675,000 | $ 4,780,234 |
| Energy - Independent – 0.9% |
| Diamondback Energy, Inc., 4.4%, 3/24/2051 | | $ | 1,999,000 | $ 2,250,666 |
| Energean Israel Finance Ltd., 4.875%, 3/30/2026 | | | 3,943,000 | 4,036,725 |
| Energean Israel Finance Ltd., 5.375%, 3/30/2028 | | | 901,000 | 924,741 |
| Leviathan Bond Ltd., 6.5%, 6/30/2027 (n) | | | 2,675,000 | 2,969,250 |
| Leviathan Bond Ltd., 6.75%, 6/30/2030 (n) | | | 2,670,000 | 3,010,425 |
| Tengizchevroil Finance Co. International Ltd., 3.25%, 8/15/2030 | | | 4,908,000 | 4,996,835 |
| | | | | $18,188,642 |
| Energy - Integrated – 0.4% |
| Eni S.p.A., 4%, 9/12/2023 (n) | | $ | 5,176,000 | $ 5,528,134 |
| Exxon Mobil Corp., 4.227%, 3/19/2040 | | | 1,700,000 | 2,029,791 |
| | | | | $7,557,925 |
| Issuer | | | Shares/Par | Value ($) |
| Bonds – continued |
| Financial Institutions – 1.5% |
| AerCap Ireland Capital DAC, 4.5%, 9/15/2023 | | $ | 4,803,000 | $ 5,150,139 |
| AerCap Ireland Capital DAC, 6.5%, 7/15/2025 | | | 3,195,000 | 3,747,457 |
| Avolon Holdings Funding Ltd., 5.25%, 5/15/2024 (n) | | | 5,681,000 | 6,248,126 |
| Avolon Holdings Funding Ltd., 3.95%, 7/01/2024 (n) | | | 4,592,000 | 4,897,286 |
| Avolon Holdings Funding Ltd., 2.125%, 2/21/2026 (n) | | | 2,890,000 | 2,878,032 |
| Avolon Holdings Funding Ltd., 4.25%, 4/15/2026 (n) | | | 1,779,000 | 1,927,860 |
| Avolon Holdings Funding Ltd., 2.75%, 2/21/2028 (n) | | | 2,615,000 | 2,587,410 |
| Global Aircraft Leasing Co. Ltd., 6.5%,(6.5% cash or 7.25% PIK) 9/15/2024 (n)(p) | | | 3,849,623 | 3,868,871 |
| | | | | $31,305,181 |
| Food & Beverages – 0.8% |
| Anheuser-Busch Cos. LLC/Anheuser-Busch InBev Worldwide, Inc., 4.9%, 2/01/2046 | | $ | 2,901,000 | $ 3,671,941 |
| Anheuser-Busch InBev Worldwide, Inc., 5.45%, 1/23/2039 | | | 2,539,000 | 3,348,612 |
| Aramark Services, Inc., 5%, 2/01/2028 (n) | | | 3,825,000 | 4,005,540 |
| JBS USA Lux S.A./JBS USA Finance, Inc., 5.5%, 1/15/2030 (n) | | | 4,965,000 | 5,552,756 |
| | | | | $16,578,849 |
| Gaming & Lodging – 1.4% |
| GLP Capital LP/GLP Financing II, Inc., 5.375%, 11/01/2023 | | $ | 4,184,000 | $ 4,546,502 |
| GLP Capital LP/GLP Financing II, Inc., 5.25%, 6/01/2025 | | | 2,096,000 | 2,359,362 |
| Hilton Domestic Operating Co., Inc., 3.625%, 2/15/2032 (n) | | | 7,185,000 | 7,095,187 |
| Las Vegas Sands Corp., 3.5%, 8/18/2026 | | | 3,253,000 | 3,458,740 |
| Marriott International, Inc., 4.625%, 6/15/2030 | | | 1,503,000 | 1,731,008 |
| Marriott International, Inc., 2.85%, 4/15/2031 | | | 1,650,000 | 1,675,560 |
| Marriott International, Inc., 3.5%, 10/15/2032 | | | 3,330,000 | 3,537,466 |
| VICI Properties, Inc., 4.125%, 8/15/2030 (n) | | | 3,950,000 | 4,055,939 |
| | | | | $28,459,764 |
| Insurance - Property & Casualty – 3.0% |
| Allied World Assurance Co. Holdings Ltd., 4.35%, 10/29/2025 | | $ | 6,835,000 | $ 7,503,971 |
| American International Group, Inc., 3.75%, 7/10/2025 | | | 4,641,000 | 5,114,158 |
| American International Group, Inc., 3.9%, 4/01/2026 | | | 4,923,000 | 5,493,776 |
| American International Group, Inc., 4.7%, 7/10/2035 | | | 2,600,000 | 3,166,936 |
| Aon Corp., 3.75%, 5/02/2029 | | | 7,982,000 | 8,981,863 |
MFS Total Return Bond Series
Portfolio of Investments (unaudited) – continued
| Issuer | | | Shares/Par | Value ($) |
| Bonds – continued |
| Insurance - Property & Casualty – continued |
| Berkshire Hathaway Finance Corp., 2.85%, 10/15/2050 | | $ | 1,429,000 | $ 1,426,428 |
| Fairfax Financial Holdings Ltd., 4.85%, 4/17/2028 | | | 5,692,000 | 6,547,656 |
| Fairfax Financial Holdings Ltd., 3.375%, 3/03/2031 (n) | | | 1,060,000 | 1,104,679 |
| Hartford Financial Services Group, Inc., 2.8%, 8/19/2029 | | | 5,901,000 | 6,195,083 |
| Hartford Financial Services Group, Inc., 3.6%, 8/19/2049 | | | 3,484,000 | 3,819,985 |
| Liberty Mutual Group, Inc., 3.951%, 10/15/2050 (n) | | | 2,900,000 | 3,230,320 |
| Marsh & McLennan Cos., Inc., 4.2%, 3/01/2048 | | | 6,787,000 | 8,403,205 |
| Swiss Re Ltd., 4.25%, 12/06/2042 (n) | | | 736,000 | 901,561 |
| | | | | $61,889,621 |
| International Market Quasi-Sovereign – 0.2% |
| Electricite de France S.A., 4.875%, 9/21/2038 (n) | | $ | 2,687,000 | $ 3,301,510 |
| Machinery & Tools – 0.2% |
| CNH Industrial Capital LLC, 4.2%, 1/15/2024 | | $ | 1,209,000 | $ 1,308,238 |
| CNH Industrial Capital LLC, 3.85%, 11/15/2027 | | | 3,223,000 | 3,568,485 |
| | | | | $4,876,723 |
| Major Banks – 7.9% |
| Bank of America Corp., 3.419% to 12/20/2027, FLR (LIBOR - 3mo. + 1.04%) to 12/20/2028 | | $ | 8,192,000 | $ 8,921,984 |
| Bank of America Corp., 2.496% to 2/13/2030, FLR (LIBOR - 3mo. + 0.99%) to 2/13/2031 | | | 9,824,000 | 10,030,242 |
| Bank of America Corp., 2.676% to 6/19/2040, FLR (SOFR + 1.93%) to 6/19/2041 | | | 3,810,000 | 3,697,602 |
| Bank of America Corp., 4.443%, 1/20/2048 | | | 5,696,000 | 7,061,810 |
| Bank of America Corp., 6.5% to 10/23/2024, FLR (LIBOR - 3mo. + 4.174%) to 10/23/2049 | | | 3,843,000 | 4,352,197 |
| Bank of America Corp., 6.1%, 12/29/2049 | | | 8,096,000 | 9,090,756 |
| Bank of America Corp., 5.875% to 3/15/2028, FLR (LIBOR - 3mo. + 2.931%) to 12/31/2059 | | | 5,924,000 | 6,780,373 |
| Barclays PLC, 4.972% to 5/16/2028, FLR (LIBOR - 3mo. + 1.902%) to 5/16/2029 | | | 3,191,000 | 3,736,586 |
| Credit Suisse Group AG, 3.091% to 5/14/2031, FLR (SOFR + 1.73%) to 5/14/2032 (n) | | | 1,689,000 | 1,740,095 |
| Credit Suisse Group Fund (Guernsey) Ltd., 3.75%, 3/26/2025 | | | 3,021,000 | 3,276,898 |
| Goldman Sachs Group, Inc., 2.6%, 2/07/2030 | | | 6,000,000 | 6,226,085 |
| Issuer | | | Shares/Par | Value ($) |
| Bonds – continued |
| Major Banks – continued |
| HSBC Holdings PLC, 4% to 9/09/2026, FLR (CMT - 1yr. + 3.222%) to 9/09/2169 | | $ | 2,447,000 | $ 2,486,764 |
| HSBC Holdings PLC, 4.7% to 9/09/2031, FLR (CMT - 1yr. + 3.25%) to 9/09/2169 | | | 6,176,000 | 6,407,600 |
| JPMorgan Chase & Co., 3.125%, 1/23/2025 | | | 211,000 | 226,426 |
| JPMorgan Chase & Co., 3.509%, 1/23/2029 | | | 2,290,000 | 2,523,971 |
| JPMorgan Chase & Co., 4.005% to 4/23/2028, FLR (LIBOR - 3mo. + 1.12%) to 4/23/2029 | | | 11,383,000 | 12,868,917 |
| JPMorgan Chase & Co., 4.203% to 7/23/2028, FLR (LIBOR - 3mo. + 1.26%) to 7/23/2029 | | | 4,579,000 | 5,262,391 |
| JPMorgan Chase & Co., 2.956% to 5/13/2030, FLR (SOFR + 2.515%) to 5/13/2031 | | | 4,435,000 | 4,658,997 |
| Lloyds Bank PLC, 3.75%, 1/11/2027 | | | 5,328,000 | 5,884,689 |
| Mitsubishi UFJ Financial Group, Inc., 2.048%, 7/17/2030 | | | 9,749,000 | 9,715,099 |
| Morgan Stanley, 5.597% to 3/24/2050, FLR (SOFR + 4.84%) to 3/24/2051 | | | 4,557,000 | 6,782,291 |
| Sumitomo Mitsui Financial Group, Inc., 2.13%, 7/08/2030 | | | 9,717,000 | 9,769,608 |
| Sumitomo Mitsui Trust Bank Ltd., 0.85%, 3/25/2024 (n) | | | 7,868,000 | 7,880,021 |
| UBS Group AG, 4.375% to 2/10/2031, FLR (CMT - 1yr. + 3.313%) to 8/10/2069 (n) | | | 7,084,000 | 7,237,723 |
| UBS Group Funding (Jersey) Ltd., 4.125%, 9/24/2025 (n) | | | 4,524,000 | 5,047,110 |
| Wells Fargo & Co., 3.068% to 4/30/2040, FLR (SOFR + 2.53%) to 4/30/2041 | | | 4,381,000 | 4,493,518 |
| Westpac Banking Corp., 2.894% to 2/4/2025, FLR (CMT - 5yr. + 1.35%) to 2/04/2030 | | | 5,356,000 | 5,555,083 |
| | | | | $161,714,836 |
| Medical & Health Technology & Services – 2.7% |
| Alcon Finance Corp., 2.75%, 9/23/2026 (n) | | $ | 593,000 | $ 627,555 |
| Alcon, Inc., 2.6%, 5/27/2030 (n) | | | 1,096,000 | 1,119,259 |
| Charles River Laboratories International, Inc., 4%, 3/15/2031 (n) | | | 3,905,000 | 4,062,489 |
| CommonSpirit Health, 2.95%, 11/01/2022 | | | 6,666,000 | 6,881,172 |
| DaVita, Inc., 4.625%, 6/01/2030 (n) | | | 4,230,000 | 4,349,371 |
| HCA, Inc., 5.25%, 6/15/2026 | | | 3,026,000 | 3,502,776 |
| HCA, Inc., 5.625%, 9/01/2028 | | | 6,840,000 | 8,105,400 |
| HCA, Inc., 4.125%, 6/15/2029 | | | 4,581,000 | 5,158,555 |
| Laboratory Corp. of America Holdings, 4.7%, 2/01/2045 | | | 2,056,000 | 2,464,522 |
| Northwell Healthcare, Inc., 3.979%, 11/01/2046 | | | 1,503,000 | 1,701,520 |
MFS Total Return Bond Series
Portfolio of Investments (unaudited) – continued
| Issuer | | | Shares/Par | Value ($) |
| Bonds – continued |
| Medical & Health Technology & Services – continued |
| ProMedica Toledo Hospital, “B”, 5.325%, 11/15/2028 | | $ | 7,120,000 | $ 8,404,583 |
| ProMedica Toledo Hospital, “B”, AGM, 5.75%, 11/15/2038 | | | 2,562,000 | 3,118,586 |
| Tower Health, 4.451%, 2/01/2050 | | | 6,211,000 | 5,248,295 |
| | | | | $54,744,083 |
| Medical Equipment – 0.1% |
| Boston Scientific Corp., 4%, 3/01/2029 | | $ | 1,837,000 | $ 2,089,279 |
| Metals & Mining – 0.8% |
| Anglo American Capital PLC, 2.25%, 3/17/2028 (n) | | $ | 2,504,000 | $ 2,531,731 |
| Anglo American Capital PLC, 2.875%, 3/17/2031 (n) | | | 2,927,000 | 2,992,182 |
| Glencore Funding LLC, 4.125%, 5/30/2023 (n) | | | 2,796,000 | 2,973,928 |
| Glencore Funding LLC, 2.85%, 4/27/2031 (n) | | | 4,010,000 | 4,077,909 |
| Novelis Corp., 5.875%, 9/30/2026 (n) | | | 3,515,000 | 3,656,495 |
| | | | | $16,232,245 |
| Midstream – 2.6% |
| Cheniere Energy Partners LP, 4.5%, 10/01/2029 | | $ | 3,683,000 | $ 3,959,225 |
| Enbridge, Inc., 4.25%, 12/01/2026 | | | 7,640,000 | 8,605,668 |
| Galaxy Pipeline Assets Bidco Ltd., 2.16%, 3/31/2034 (n) | | | 7,022,000 | 6,890,680 |
| Kinder Morgan (Delaware), Inc., 7.75%, 1/15/2032 | | | 6,350,000 | 9,109,544 |
| Kinder Morgan Energy Partners LP, 6.375%, 3/01/2041 | | | 2,040,000 | 2,819,782 |
| Kinder Morgan Energy Partners LP, 5.4%, 9/01/2044 | | | 2,612,000 | 3,279,490 |
| ONEOK, Inc., 5.2%, 7/15/2048 | | | 5,104,000 | 6,254,323 |
| Plains All American Pipeline LP/PAA Finance Corp., 3.55%, 12/15/2029 | | | 2,839,000 | 2,989,533 |
| Sabine Pass Liquefaction LLC, 4.2%, 3/15/2028 | | | 2,675,000 | 3,020,958 |
| Sabine Pass Liquefaction LLC, 4.5%, 5/15/2030 | | | 1,975,000 | 2,279,253 |
| Targa Resources Partners LP/Targa Resources Finance Corp., 5.875%, 4/15/2026 | | | 3,333,000 | 3,500,683 |
| | | | | $52,709,139 |
| Mortgage-Backed – 17.4% | |
| Fannie Mae, 2.56%, 10/01/2021 | | $ | 744,622 | $ 744,448 |
| Fannie Mae, 2.75%, 3/01/2022 | | | 1,033,821 | 1,045,925 |
| Fannie Mae, 5.5%, 5/01/2022-4/01/2040 | | | 5,482,603 | 6,315,909 |
| Fannie Mae, 6%, 8/01/2022-3/01/2039 | | | 1,376,833 | 1,616,902 |
| Fannie Mae, 2.525%, 10/01/2022 | | | 1,655,889 | 1,684,520 |
| Fannie Mae, 2.68%, 3/01/2023 | | | 1,594,880 | 1,638,538 |
| Fannie Mae, 2.41%, 5/01/2023 | | | 1,859,602 | 1,909,667 |
| Fannie Mae, 2.55%, 5/01/2023 | | | 951,851 | 979,340 |
| Issuer | | | Shares/Par | Value ($) |
| Bonds – continued |
| Mortgage-Backed – continued | |
| Fannie Mae, 5%, 7/01/2023-3/01/2042 | | $ | 3,782,420 | $ 4,302,413 |
| Fannie Mae, 4.5%, 5/01/2024-6/01/2044 | | | 12,882,082 | 14,289,251 |
| Fannie Mae, 3.5%, 5/25/2025-7/01/2046 | | | 10,830,640 | 11,626,999 |
| Fannie Mae, 3.95%, 1/01/2027 | | | 331,651 | 372,160 |
| Fannie Mae, 3%, 11/01/2028-8/01/2047 | | | 8,808,408 | 9,328,553 |
| Fannie Mae, 2.5%, 11/01/2031-11/01/2046 | | | 1,039,104 | 1,080,751 |
| Fannie Mae, 6.5%, 7/01/2032-1/01/2033 | | | 3,071 | 3,507 |
| Fannie Mae, 3%, 2/25/2033 (i) | | | 536,025 | 52,298 |
| Fannie Mae, 4%, 12/01/2039-1/01/2047 | | | 20,445,176 | 22,364,309 |
| Fannie Mae, 3.25%, 5/25/2040 | | | 217,148 | 234,704 |
| Fannie Mae, 2%, 10/25/2040-4/25/2046 | | | 539,148 | 552,733 |
| Fannie Mae, 4%, 7/25/2046 (i) | | | 511,565 | 96,345 |
| Fannie Mae, 3.5%, 12/01/2046 (f) | | | 2,169,672 | 2,302,096 |
| Fannie Mae, UMBS, 3.5%, 5/01/2049 | | | 352,177 | 375,049 |
| Fannie Mae, UMBS, 2.5%, 2/01/2050-7/01/2050 | | | 6,138,956 | 6,408,450 |
| Fannie Mae, UMBS, 2%, 1/01/2051-2/01/2051 | | | 720,894 | 730,172 |
| Federal Home Loan Bank, 5%, 7/01/2035 | | | 1,147,657 | 1,314,977 |
| Freddie Mac, 2.791%, 1/25/2022 | | | 4,135,268 | 4,173,452 |
| Freddie Mac, 3.32%, 2/25/2023 | | | 3,956,000 | 4,127,504 |
| Freddie Mac, 3.531%, 7/25/2023 | | | 2,401,000 | 2,540,507 |
| Freddie Mac, 2.67%, 12/25/2024 | | | 2,784,000 | 2,956,595 |
| Freddie Mac, 2.811%, 1/25/2025 | | | 4,169,000 | 4,448,980 |
| Freddie Mac, 4%, 7/01/2025-4/01/2044 | | | 2,158,920 | 2,359,192 |
| Freddie Mac, 4.5%, 7/01/2025-5/01/2042 | | | 3,277,987 | 3,634,646 |
| Freddie Mac, 3.3%, 10/25/2026 | | | 2,958,000 | 3,280,448 |
| Freddie Mac, 3%, 6/15/2028-2/25/2059 | | | 15,982,790 | 16,961,634 |
| Freddie Mac, 4.06%, 10/25/2028 | | | 2,129,000 | 2,498,922 |
| Freddie Mac, 1.218%, 7/25/2029 (i) | | | 4,052,620 | 319,426 |
| Freddie Mac, 1.268%, 8/25/2029 (i) | | | 7,009,814 | 579,960 |
| Freddie Mac, 1.984%, 4/25/2030 (i) | | | 1,901,414 | 286,222 |
| Freddie Mac, 5.5%, 5/01/2034-1/01/2038 | | | 238,340 | 275,314 |
| Freddie Mac, 6%, 8/01/2034-7/01/2038 | | | 72,738 | 84,072 |
| Freddie Mac, 5%, 11/01/2035-7/01/2041 | | | 1,292,747 | 1,470,766 |
| Freddie Mac, 5.5%, 2/15/2036 (i) | | | 108,402 | 19,856 |
| Freddie Mac, 3.5%, 11/01/2037-10/25/2058 | | | 17,959,575 | 19,249,719 |
| Freddie Mac, 4.5%, 12/15/2040 (i) | | | 102,788 | 9,692 |
| Freddie Mac, 4%, 8/15/2044 (i) | | | 139,909 | 16,403 |
| Freddie Mac, UMBS, 3%, 2/01/2050-6/01/2050 | | | 2,412,184 | 2,533,852 |
MFS Total Return Bond Series
Portfolio of Investments (unaudited) – continued
| Issuer | | | Shares/Par | Value ($) |
| Bonds – continued |
| Mortgage-Backed – continued | |
| Ginnie Mae, 5.5%, 5/15/2033-1/20/2042 | | $ | 1,289,080 | $ 1,492,342 |
| Ginnie Mae, 6%, 1/20/2036-1/15/2039 | | | 133,607 | 157,164 |
| Ginnie Mae, 4.5%, 4/15/2039-9/20/2041 | | | 5,826,082 | 6,488,781 |
| Ginnie Mae, 4%, 10/20/2040-3/20/2048 | | | 1,914,215 | 2,095,824 |
| Ginnie Mae, 3.5%, 11/15/2040-9/20/2048 | | | 10,948,157 | 11,653,491 |
| Ginnie Mae, 3%, 11/20/2044-6/20/2051 | | | 16,456,025 | 17,320,050 |
| Ginnie Mae, 2.5%, 6/20/2051-7/20/2051 | | | 5,700,000 | 5,910,293 |
| Ginnie Mae, TBA, 2.5%, 7/15/2051 | | | 10,825,000 | 11,202,184 |
| Ginnie Mae, TBA, 3.5%, 7/15/2051 | | | 6,025,000 | 6,324,720 |
| Ginnie Mae, TBA, 4%, 7/15/2051 | | | 5,325,000 | 5,623,075 |
| Ginnie Mae, TBA, 2%, 7/21/2051 | | | 3,000,000 | 3,055,312 |
| Ginnie Mae, TBA, 3%, 7/21/2051 | | | 2,525,000 | 2,634,532 |
| UMBS, TBA, 3%, 7/19/2036-8/12/2051 | | | 11,950,000 | 12,482,761 |
| UMBS, TBA, 1.5%, 7/25/2036-8/17/2036 | | | 6,125,000 | 6,194,465 |
| UMBS, TBA, 2%, 7/25/2036-8/12/2051 | | | 63,750,000 | 64,490,443 |
| UMBS, TBA, 2.5%, 7/25/2036-8/25/2051 | | | 33,700,000 | 34,890,253 |
| | | | | $355,212,868 |
| Municipals – 2.7% |
| Bridgeview, IL, Stadium and Redevelopment Projects, AAC, 5.06%, 12/01/2025 | | $ | 910,000 | $ 935,422 |
| Bridgeview, IL, Stadium and Redevelopment Projects, AAC, 5.14%, 12/01/2036 | | | 8,850,000 | 9,358,020 |
| Escambia County, FL, Health Facilities Authority Rev. (Baptist Health Care Corp.), “B”, AGM, 3.607%, 8/15/2040 | | | 1,295,000 | 1,327,957 |
| New Jersey Economic Development Authority State Pension Funding Rev., “A”, NPFG, 7.425%, 2/15/2029 | | | 8,019,000 | 10,399,379 |
| New Jersey Economic Development Authority State Pension Funding Rev., Capital Appreciation, “B”, AGM, 0%, 2/15/2023 | | | 13,215,000 | 13,134,416 |
| Oklahoma Development Finance Authority, Health System Rev. (OU Medicine Project), “C”, 5.45%, 8/15/2028 | | | 3,770,000 | 4,215,451 |
| Philadelphia, PA, School District, “B”, AGM, 6.615%, 6/01/2030 | | | 3,250,000 | 4,205,135 |
| Philadelphia, PA, School District, “B”, AGM, 6.765%, 6/01/2040 | | | 2,195,000 | 3,192,471 |
| State of Florida, “A”, 2.154%, 7/01/2030 | | | 7,272,000 | 7,413,974 |
| | | | | $54,182,225 |
| Issuer | | | Shares/Par | Value ($) |
| Bonds – continued |
| Natural Gas - Distribution – 0.7% |
| Boston Gas Co., 3.15%, 8/01/2027 (n) | | $ | 9,122,000 | $ 9,780,546 |
| NiSource, Inc., 3.6%, 5/01/2030 | | | 4,171,000 | 4,618,160 |
| | | | | $14,398,706 |
| Network & Telecom – 0.4% |
| Verizon Communications, Inc., 2.1%, 3/22/2028 | | $ | 1,510,000 | $ 1,541,582 |
| Verizon Communications, Inc., 2.55%, 3/21/2031 | | | 2,832,000 | 2,894,658 |
| Verizon Communications, Inc., 4.272%, 1/15/2036 | | | 2,647,000 | 3,149,467 |
| | | | | $7,585,707 |
| Oils – 0.3% |
| Marathon Petroleum Corp., 4.75%, 9/15/2044 | | $ | 2,350,000 | $ 2,776,611 |
| Marathon Petroleum Corp., 5.85%, 12/15/2045 | | | 2,507,000 | 3,270,721 |
| | | | | $6,047,332 |
| Other Banks & Diversified Financials – 1.0% |
| Bangkok Bank (Hong Kong), 3.733% to 9/25/2029, FLR (CMT - 5yr. + 1.9%) to 9/25/2034 (n) | | $ | 5,693,000 | $ 5,900,624 |
| BBVA Bancomer S.A. de C.V., 6.75%, 9/30/2022 (n) | | | 2,570,000 | 2,728,826 |
| Branch Banking & Trust Co., 2.25%, 3/11/2030 | | | 910,000 | 923,207 |
| Groupe BPCE S.A., 4.5%, 3/15/2025 (n) | | | 5,458,000 | 6,013,614 |
| Macquarie Bank Ltd. of London, 6.125% to 3/08/2027, FLR (Swap Rate - 5yr. + 4.332%) to 12/31/2165 (n) | | | 4,694,000 | 5,134,062 |
| | | | | $20,700,333 |
| Real Estate - Apartment – 0.1% |
| Mid-America Apartment Communities, Inc., REIT, 4.3%, 10/15/2023 | | $ | 2,217,000 | $ 2,380,339 |
| Real Estate - Healthcare – 0.1% |
| MPT Operating Partnership LP/MPT Financial Co., REIT, 5%, 10/15/2027 | | $ | 2,569,000 | $ 2,723,371 |
| Real Estate - Office – 0.4% |
| Boston Properties, Inc., REIT, 2.55%, 4/01/2032 | | $ | 7,238,000 | $ 7,282,862 |
| Retailers – 0.2% |
| MercadoLibre, Inc., 3.125%, 1/14/2031 | | $ | 5,002,000 | $ 4,902,160 |
| Specialty Chemicals – 0.1% |
| Univar Solutions USA, Inc., 5.125%, 12/01/2027 (n) | | $ | 1,165,000 | $ 1,224,706 |
MFS Total Return Bond Series
Portfolio of Investments (unaudited) – continued
| Issuer | | | Shares/Par | Value ($) |
| Bonds – continued |
| Specialty Stores – 0.3% |
| Penske Automotive Group Co., 3.75%, 6/15/2029 | | $ | 5,155,000 | $ 5,187,174 |
| TJX Cos., Inc., 3.875%, 4/15/2030 | | | 661,000 | 757,682 |
| | | | | $5,944,856 |
| Telecommunications - Wireless – 2.2% |
| American Tower Corp., REIT, 3.55%, 7/15/2027 | | $ | 11,856,000 | $ 13,023,963 |
| American Tower Corp., REIT, 3.8%, 8/15/2029 | | | 1,403,000 | 1,563,251 |
| American Tower Corp., REIT, 3.1%, 6/15/2050 | | | 1,269,000 | 1,239,791 |
| Crown Castle International Corp., 3.7%, 6/15/2026 | | | 2,255,000 | 2,479,735 |
| Crown Castle International Corp., 4%, 3/01/2027 | | | 820,000 | 917,651 |
| Crown Castle International Corp., 3.8%, 2/15/2028 | | | 3,824,000 | 4,248,771 |
| Crown Castle International Corp., 3.25%, 1/15/2051 | | | 947,000 | 941,394 |
| SBA Communications Corp., 3.875%, 2/15/2027 | | | 5,059,000 | 5,195,112 |
| SBA Communications Corp., 3.125%, 2/01/2029 (n) | | | 4,025,000 | 3,880,366 |
| T-Mobile USA, Inc., 2.55%, 2/15/2031 | | | 8,138,000 | 8,229,146 |
| T-Mobile USA, Inc., 2.875%, 2/15/2031 | | | 1,557,000 | 1,545,322 |
| T-Mobile USA, Inc., 4.375%, 4/15/2040 | | | 1,357,000 | 1,590,811 |
| | | | | $44,855,313 |
| Tobacco – 0.3% |
| B.A.T. Capital Corp., 3.222%, 8/15/2024 | | $ | 5,968,000 | $ 6,338,969 |
| Transportation - Services – 0.4% |
| Element Fleet Management Corp., 1.6%, 4/06/2024 (n) | | $ | 3,162,000 | $ 3,213,442 |
| ERAC USA Finance LLC, 7%, 10/15/2037 (n) | | | 3,603,000 | 5,375,206 |
| | | | | $8,588,648 |
| U.S. Government Agencies and Equivalents – 1.3% |
| Small Business Administration, 4.93%, 1/01/2024 | | $ | 2,767 | $ 2,867 |
| Small Business Administration, 4.34%, 3/01/2024 | | | 5,902 | 6,093 |
| Small Business Administration, 4.99%, 9/01/2024 | | | 4,961 | 5,175 |
| Small Business Administration, 4.86%, 1/01/2025 | | | 12,636 | 13,211 |
| Small Business Administration, 4.625%, 2/01/2025 | | | 13,616 | 14,232 |
| Small Business Administration, 5.11%, 4/01/2025 | | | 6,549 | 6,906 |
| Small Business Administration, 4.43%, 5/01/2029 | | | 172,663 | 189,196 |
| Small Business Administration, 3.21%, 9/01/2030 | | | 2,444,107 | 2,594,280 |
| Issuer | | | Shares/Par | Value ($) |
| Bonds – continued |
| U.S. Government Agencies and Equivalents – continued |
| Small Business Administration, 3.25%, 11/01/2030 | | $ | 208,124 | $ 221,555 |
| Small Business Administration, 2.85%, 9/01/2031 | | | 513,513 | 539,265 |
| Small Business Administration, 2.37%, 8/01/2032 | | | 353,118 | 365,937 |
| Small Business Administration, 2.13%, 1/01/2033 | | | 1,645,926 | 1,698,342 |
| Small Business Administration, 2.21%, 2/01/2033 | | | 474,732 | 494,394 |
| Small Business Administration, 2.22%, 3/01/2033 | | | 1,567,474 | 1,620,345 |
| Small Business Administration, 2.08%, 4/01/2033 | | | 2,475,419 | 2,560,729 |
| Small Business Administration, 2.45%, 6/01/2033 | | | 2,602,377 | 2,706,607 |
| Small Business Administration, 3.15%, 7/01/2033 | | | 3,953,759 | 4,224,378 |
| Small Business Administration, 3.16%, 8/01/2033 | | | 4,190,020 | 4,476,421 |
| Small Business Administration, 3.62%, 9/01/2033 | | | 3,828,607 | 4,147,390 |
| | | | | $25,887,323 |
| U.S. Treasury Obligations – 11.4% |
| U.S. Treasury Bonds, 1.375%, 11/15/2040 | | $ | 43,300,000 | $ 38,895,578 |
| U.S. Treasury Bonds, 2.375%, 11/15/2049 | | | 18,550,000 | 19,752,852 |
| U.S. Treasury Notes, 0.125%, 12/31/2022 | | | 95,500,000 | 95,417,929 |
| U.S. Treasury Notes, 0.375%, 12/31/2025 | | | 80,000,000 | 78,484,375 |
| | | | | $232,550,734 |
| Utilities - Electric Power – 2.7% |
| AEP Transmission Co. LLC, 3.1%, 12/01/2026 | | $ | 2,375,000 | $ 2,578,480 |
| Calpine Corp., 3.75%, 3/01/2031 (n) | | | 6,120,000 | 5,828,382 |
| Clearway Energy Operating LLC, 4.75%, 3/15/2028 (n) | | | 6,630,000 | 6,953,212 |
| Enel Finance International N.V., 3.625%, 5/25/2027 (n) | | | 7,124,000 | 7,825,400 |
| Enel Finance International N.V., 3.5%, 4/06/2028 (n) | | | 5,692,000 | 6,232,187 |
| FirstEnergy Corp., 5.35%, 7/15/2047 | | | 6,088,000 | 7,305,600 |
| FirstEnergy Corp., 3.4%, 3/01/2050 | | | 2,429,000 | 2,374,348 |
| Jersey Central Power & Light Co., 2.75%, 3/01/2032 (n) | | | 4,238,000 | 4,301,956 |
| NextEra Energy Operating Co., 4.5%, 9/15/2027 (n) | | | 1,685,000 | 1,823,423 |
| Pacific Gas & Electric Co., 3%, 6/15/2028 | | | 2,630,000 | 2,641,830 |
| Pacific Gas & Electric Co., 3.3%, 8/01/2040 | | | 8,840,000 | 7,983,166 |
| | | | | $55,847,984 |
MFS Total Return Bond Series
Portfolio of Investments (unaudited) – continued
| Issuer | | | Shares/Par | Value ($) |
| Bonds – continued |
| Utilities - Gas – 0.1% |
| East Ohio Gas Co., 3%, 6/15/2050 (n) | | $ | 1,443,000 | $ 1,428,932 |
| Total Bonds (Identified Cost, $1,894,979,512) | | $ 1,972,451,058 |
| Investment Companies (h) – 9.9% |
| Money Market Funds – 9.9% | |
| MFS Institutional Money Market Portfolio, 0.02% (v) (Identified Cost, $201,562,587) | | | 201,562,587 | $ 201,562,587 |
| Other Assets, Less Liabilities – (6.6)% | | (133,975,685) |
| Net Assets – 100.0% | $ 2,040,037,960 |
| (f) | All or a portion of the security has been segregated as collateral for open futures contracts. |
| (h) | An affiliated issuer, which may be considered one in which the fund owns 5% or more of the outstanding voting securities, or a company which is under common control. At period end, the aggregate values of the fund's investments in affiliated issuers and in unaffiliated issuers were $201,562,587 and $1,972,451,058, respectively. |
| (i) | Interest only security for which the fund receives interest on notional principal (Par amount). Par amount shown is the notional principal and does not reflect the cost of the security. |
| (n) | Securities exempt from registration under Rule 144A of the Securities Act of 1933. These securities may be sold in the ordinary course of business in transactions exempt from registration, normally to qualified institutional buyers. At period end, the aggregate value of these securities was $581,434,739, representing 28.5% of net assets. |
| (p) | Payment-in-kind (PIK) security for which interest income may be received in additional securities and/or cash. |
| (v) | Affiliated issuer that is available only to investment companies managed by MFS. The rate quoted for the MFS Institutional Money Market Portfolio is the annualized seven-day yield of the fund at period end. |
| (z) | Restricted securities are not registered under the Securities Act of 1933 and are subject to legal restrictions on resale. These securities generally may be resold in transactions exempt from registration or to the public if the securities are subsequently registered. Disposal of these securities may involve time-consuming negotiations and prompt sale at an acceptable price may be difficult. The fund holds the following restricted securities: |
| Restricted Securities | Acquisition
Date | Cost | Value |
| Bancorp Commercial Mortgage Trust, 2017-CRE2, “B”, FLR, 1.672% (LIBOR - 1mo. + 1.6%), 8/15/2032 | 2/15/19 | $2,303,495 | $2,314,543 |
| % of Net assets | | | 0.1% |
| The following abbreviations are used in this report and are defined: |
| AAC | Ambac Assurance Corp. |
| AGM | Assured Guaranty Municipal |
| CDO | Collateralized Debt Obligation |
| CLO | Collateralized Loan Obligation |
| CMT | Constant Maturity Treasury |
| FGIC | Financial Guaranty Insurance Co. |
| FLR | Floating Rate. Interest rate resets periodically based on the parenthetically disclosed reference rate plus a spread (if any). The period-end rate reported may not be the current rate. All reference rates are USD unless otherwise noted. |
| LIBOR | London Interbank Offered Rate |
| NPFG | National Public Finance Guarantee Corp. |
| REIT | Real Estate Investment Trust |
| SOFR | Secured Overnight Financing Rate |
| TBA | To Be Announced |
| UMBS | Uniform Mortgage-Backed Security |
MFS Total Return Bond Series
Portfolio of Investments (unaudited) – continued
| Derivative Contracts at 6/30/21 |
| Futures Contracts |
| Description | Long/
Short | Currency | Contracts | Notional
Amount | Expiration
Date | Value/Unrealized
Appreciation
(Depreciation) |
| Asset Derivatives |
| Interest Rate Futures | | |
| U.S. Treasury Ultra Bond | Long | USD | 662 | $127,559,125 | September – 2021 | $4,955,531 |
| Liability Derivatives |
| Interest Rate Futures | | |
| U.S. Treasury Note 2 yr | Long | USD | 352 | $77,552,750 | September – 2021 | $(137,763) |
| U.S. Treasury Ultra Note 10 yr | Short | USD | 691 | 101,717,360 | September – 2021 | (1,371,742) |
| | | | | | | $(1,509,505) |
At June 30, 2021, the fund had cash collateral of $1,688,281 and other liquid securities with an aggregate value of $4,554,000 to cover any collateral or margin obligations for certain derivative contracts. Restricted cash and/or deposits with brokers in the Statement of Assets and Liabilities are comprised of cash collateral.
See Notes to Financial Statements
MFS Total Return Bond Series
| Financial Statements | Statement of Assets and Liabilities (unaudited) |
This statement represents your fund’s balance sheet, which details the assets and liabilities comprising the total value of the fund.
| At 6/30/21Assets | |
| Investments in unaffiliated issuers, at value (identified cost, $1,894,979,512) | $1,972,451,058 |
| Investments in affiliated issuers, at value (identified cost, $201,562,587) | 201,562,587 |
| Cash | 851,430 |
| Deposits with brokers for | |
| Futures contracts | 1,688,281 |
| Receivables for | |
| Net daily variation margin on open futures contracts | 418,328 |
| Investments sold | 2,075,851 |
| TBA sale commitments | 25,020,875 |
| Fund shares sold | 167,690 |
| Interest | 11,991,628 |
| Other assets | 5,111 |
| Total assets | $2,216,232,839 |
| Liabilities | |
| Payables for | |
| Investments purchased | $2,920,614 |
| TBA purchase commitments | 172,042,885 |
| Fund shares reacquired | 945,177 |
| Payable to affiliates | |
| Investment adviser | 54,407 |
| Administrative services fee | 1,513 |
| Shareholder servicing costs | 423 |
| Distribution and/or service fees | 14,874 |
| Accrued expenses and other liabilities | 214,986 |
| Total liabilities | $176,194,879 |
| Net assets | $2,040,037,960 |
| Net assets consist of | |
| Paid-in capital | $1,878,894,685 |
| Total distributable earnings (loss) | 161,143,275 |
| Net assets | $2,040,037,960 |
| Shares of beneficial interest outstanding | 147,348,222 |
| | Net assets | Shares
outstanding | Net asset value
per share |
| Initial Class | $953,295,203 | 68,132,905 | $13.99 |
| Service Class | 1,086,742,757 | 79,215,317 | 13.72 |
See Notes to Financial Statements
MFS Total Return Bond Series
| Financial Statements | Statement of Operations (unaudited) |
This statement describes how much your fund earned in investment income and accrued in expenses. It also describes any gains and/or losses generated by fund operations.
| Six months ended 6/30/21 | |
| Net investment income (loss) | |
| Income | |
| Interest | $26,929,603 |
| Dividends from affiliated issuers | 48,294 |
| Other | 250 |
| Total investment income | $26,978,147 |
| Expenses | |
| Management fee | $4,979,335 |
| Distribution and/or service fees | 1,335,300 |
| Shareholder servicing costs | 24,690 |
| Administrative services fee | 132,860 |
| Independent Trustees' compensation | 14,866 |
| Custodian fee | 49,250 |
| Shareholder communications | 56,817 |
| Audit and tax fees | 39,355 |
| Legal fees | 7,493 |
| Miscellaneous | 49,095 |
| Total expenses | $6,689,061 |
| Reduction of expenses by investment adviser | (119,068) |
| Net expenses | $6,569,993 |
| Net investment income (loss) | $20,408,154 |
| Realized and unrealized gain (loss) | |
| Realized gain (loss) (identified cost basis) | |
| Unaffiliated issuers | $15,155,037 |
| Futures contracts | (4,353,750) |
| Foreign currency | (166,881) |
| Net realized gain (loss) | $10,634,406 |
| Change in unrealized appreciation or depreciation | |
| Unaffiliated issuers | $(52,892,342) |
| Affiliated issuers | 1 |
| Futures contracts | 3,206,357 |
| Forward foreign currency exchange contracts | 384,133 |
| Translation of assets and liabilities in foreign currencies | (215,677) |
| Net unrealized gain (loss) | $(49,517,528) |
| Net realized and unrealized gain (loss) | $(38,883,122) |
| Change in net assets from operations | $(18,474,968) |
See Notes to Financial Statements
MFS Total Return Bond Series
| Financial Statements | Statements of Changes in Net Assets |
These statements describe the increases and/or decreases in net assets resulting from operations, any distributions, and any shareholder transactions.
| | Six months ended | Year ended |
| | 6/30/21
(unaudited) | 12/31/20 |
| Change in net assets | | |
| From operations | | |
| Net investment income (loss) | $20,408,154 | $49,347,183 |
| Net realized gain (loss) | 10,634,406 | 45,995,015 |
| Net unrealized gain (loss) | (49,517,528) | 51,345,923 |
| Change in net assets from operations | $(18,474,968) | $146,688,121 |
| Total distributions to shareholders | $— | $(63,395,758) |
| Change in net assets from fund share transactions | $47,162,438 | $(116,126,286) |
| Total change in net assets | $28,687,470 | $(32,833,923) |
| Net assets | | |
| At beginning of period | 2,011,350,490 | 2,044,184,413 |
| At end of period | $2,040,037,960 | $2,011,350,490 |
See Notes to Financial Statements
MFS Total Return Bond Series
| Financial Statements | Financial Highlights |
The financial highlights table is intended to help you understand the fund's financial performance for the semiannual period and the past 5 fiscal years. Certain information reflects financial results for a single fund share. The total returns in the table represent the rate that an investor would have earned (or lost) on an investment in the fund share class (assuming reinvestment of all distributions) held for the entire period.
| Initial Class | Six months
ended | Year ended |
| | 6/30/21
(unaudited) | 12/31/20 | 12/31/19 | 12/31/18 | 12/31/17 | 12/31/16 |
| Net asset value, beginning of period | $14.12 | $13.48 | $12.65 | $13.22 | $13.09 | $13.00 |
| Income (loss) from investment operations | | | | | | |
| Net investment income (loss) (d) | $0.15 | $0.37 | $0.42 | $0.39 | $0.36 | $0.40(c) |
| Net realized and unrealized gain (loss) | (0.28) | 0.76 | 0.87 | (0.53) | 0.22 | 0.16 |
| Total from investment operations | $(0.13) | $1.13 | $1.29 | $(0.14) | $0.58 | $0.56 |
| Less distributions declared to shareholders | | | | | | |
| From net investment income | $— | $(0.49) | $(0.46) | $(0.43) | $(0.45) | $(0.47) |
| Net asset value, end of period (x) | $13.99 | $14.12 | $13.48 | $12.65 | $13.22 | $13.09 |
| Total return (%) (k)(r)(s)(x) | (0.92)(n) | 8.47 | 10.21 | (1.09) | 4.46 | 4.23(c) |
Ratios (%) (to average net assets)
and Supplemental data: | | | | | | |
| Expenses before expense reductions (f) | 0.54(a) | 0.54 | 0.54 | 0.54 | 0.54 | 0.53(c) |
| Expenses after expense reductions (f) | 0.53(a) | 0.53 | 0.53 | 0.53 | 0.53 | 0.52(c) |
| Net investment income (loss) | 2.18(a) | 2.71 | 3.14 | 3.04 | 2.70 | 2.98(c) |
| Portfolio turnover | 87(n) | 112 | 79 | 48 | 47 | 37 |
| Net assets at end of period (000 omitted) | $953,295 | $921,342 | $939,179 | $862,752 | $997,415 | $986,877 |
| Service Class | Six months
ended | Year ended |
| | 6/30/21
(unaudited) | 12/31/20 | 12/31/19 | 12/31/18 | 12/31/17 | 12/31/16 |
| Net asset value, beginning of period | $13.86 | $13.24 | $12.43 | $12.99 | $12.87 | $12.78 |
| Income (loss) from investment operations | | | | | | |
| Net investment income (loss) (d) | $0.13 | $0.33 | $0.38 | $0.35 | $0.32 | $0.36(c) |
| Net realized and unrealized gain (loss) | (0.27) | 0.74 | 0.85 | (0.52) | 0.22 | 0.16 |
| Total from investment operations | $(0.14) | $1.07 | $1.23 | $(0.17) | $0.54 | $0.52 |
| Less distributions declared to shareholders | | | | | | |
| From net investment income | $— | $(0.45) | $(0.42) | $(0.39) | $(0.42) | $(0.43) |
| Net asset value, end of period (x) | $13.72 | $13.86 | $13.24 | $12.43 | $12.99 | $12.87 |
| Total return (%) (k)(r)(s)(x) | (1.01)(n) | 8.17 | 9.92 | (1.33) | 4.18 | 4.01(c) |
Ratios (%) (to average net assets)
and Supplemental data: | | | | | | |
| Expenses before expense reductions (f) | 0.79(a) | 0.79 | 0.79 | 0.79 | 0.79 | 0.78(c) |
| Expenses after expense reductions (f) | 0.78(a) | 0.78 | 0.78 | 0.78 | 0.78 | 0.77(c) |
| Net investment income (loss) | 1.93(a) | 2.46 | 2.89 | 2.79 | 2.45 | 2.73(c) |
| Portfolio turnover | 87(n) | 112 | 79 | 48 | 47 | 37 |
| Net assets at end of period (000 omitted) | $1,086,743 | $1,090,009 | $1,105,005 | $1,137,033 | $1,449,260 | $1,457,118 |
See Notes to Financial Statements
MFS Total Return Bond Series
Financial Highlights - continued
| (a) | Annualized. |
| (c) | Amount reflects a one-time reimbursement of expenses by the custodian (or former custodian) without which net investment income and performance would be lower and expenses would be higher. |
| (d) | Per share data is based on average shares outstanding. |
| (f) | Ratios do not reflect reductions from fees paid indirectly, if applicable. |
| (k) | The total return does not reflect expenses that apply to separate accounts. Inclusion of these charges would reduce the total return figures for all periods shown. |
| (n) | Not annualized. |
| (r) | Certain expenses have been reduced without which performance would have been lower. |
| (s) | From time to time the fund may receive proceeds from litigation settlements, without which performance would be lower. |
| (x) | The net asset values and total returns have been calculated on net assets which include adjustments made in accordance with U.S. generally accepted accounting principles required at period end for financial reporting purposes. |
See Notes to Financial Statements
MFS Total Return Bond Series
Notes to Financial Statements (unaudited)
(1) Business and Organization
MFS Total Return Bond Series (the fund) is a diversified series of MFS Variable Insurance Trust (the trust). The trust is organized as a Massachusetts business trust and is registered under the Investment Company Act of 1940, as amended, as an open-end management investment company. The shareholders of each series of the trust are separate accounts of insurance companies, which offer variable annuity and/or life insurance products, and qualified retirement and pension plans.
The fund is an investment company and accordingly follows the investment company accounting and reporting guidance of the Financial Accounting Standards Board (FASB) Accounting Standards Codification Topic 946 Financial Services - Investment Companies.
(2) Significant Accounting Policies
General — The preparation of financial statements in conformity with U.S. generally accepted accounting principles requires management to make estimates and assumptions that affect the reported amounts of assets and liabilities, and disclosure of contingent assets and liabilities at the date of the financial statements and the reported amounts of increases and decreases in net assets from operations during the reporting period. Actual results could differ from those estimates. In the preparation of these financial statements, management has evaluated subsequent events occurring after the date of the fund’s Statement of Assets and Liabilities through the date that the financial statements were issued. The fund invests in high-yield securities rated below investment grade. Investments in below investment grade quality securities can involve a substantially greater risk of default or can already be in default, and their values can decline significantly. Below investment grade quality securities tend to be more sensitive to adverse news about the issuer, or the market or economy in general, than higher quality debt instruments. The fund invests in foreign securities. Investments in foreign securities are vulnerable to the effects of changes in the relative values of the local currency and the U.S. dollar and to the effects of changes in each country’s market, economic, industrial, political, regulatory, geopolitical, environmental, public health, and other conditions.
Certain of the fund's investments, derivatives, debt and other contracts may be based on reference interest rates such as the London Interbank Offered Rate (“LIBOR”). In 2017, the regulatory authority that oversees financial services firms in the United Kingdom announced plans to transition away from LIBOR by the end of 2021. In March 2021, the administrator of LIBOR announced the extension of the publication of the more commonly used U.S. dollar LIBOR settings to the end of June 2023. Although the full impacts of the transition away from LIBOR are not fully known, the transition may result in, among other things, an increase in volatility or illiquidity of the markets for instruments that currently rely on LIBOR to determine interest rates and this could have an adverse impact on the fund's performance. With respect to the fund's accounting for investments, derivatives, debt and other contracts that undergo reference rate-related modifications as a result of the transition, management will rely upon the relief provided by FASB Codification Topic 848 – Reference Rate Reform (Topic 848). The guidance in Topic 848 permits the fund to disregard the GAAP accounting requirements around certain contract modifications resulting from the LIBOR transition such that for contracts considered in scope, the fund can account for those modified contracts as a continuation of the existing contracts.
Balance Sheet Offsetting — The fund's accounting policy with respect to balance sheet offsetting is that, absent an event of default by the counterparty or a termination of the agreement, the International Swaps and Derivatives Association (ISDA) Master Agreement, or similar agreement, does not result in an offset of reported amounts of financial assets and financial liabilities in the Statement of Assets and Liabilities across transactions between the fund and the applicable counterparty. The fund's right to setoff may be restricted or prohibited by the bankruptcy or insolvency laws of the particular jurisdiction to which a specific master netting agreement counterparty is subject. Balance sheet offsetting disclosures, to the extent applicable to the fund, have been included in the fund’s Significant Accounting Policies note under the captions for each of the fund’s in-scope financial instruments and transactions.
Investment Valuations — Debt instruments sold short are generally valued at an evaluated or composite mean as provided by a third-party pricing service. Short-term instruments with a maturity at issuance of 60 days or less may be valued at amortized cost, which approximates market value. Futures contracts are generally valued at last posted settlement price on their primary exchange as provided by a third-party pricing service. Futures contracts for which there were no trades that day for a particular position are generally valued at the closing bid quotation on their primary exchange as provided by a third-party pricing service. Forward foreign currency exchange contracts are generally valued at the mean of bid and asked prices for the time period interpolated from rates provided by a third-party pricing service for proximate time periods. Open-end investment companies are generally valued at net asset value per share. Securities and other assets generally valued on the basis of information from a third-party pricing service may also be valued at a broker/dealer bid quotation. In determining values, third-party pricing services can utilize both transaction data and market information such as yield, quality, coupon rate, maturity, type of issue, trading characteristics, and other market data. The values of foreign securities and other assets and liabilities expressed in foreign currencies are converted to U.S. dollars using the mean of bid and asked prices for rates provided by a third-party pricing service.
MFS Total Return Bond Series
Notes to Financial Statements (unaudited) - continued
The Board of Trustees has delegated primary responsibility for determining or causing to be determined the value of the fund’s investments (including any fair valuation) to the adviser pursuant to valuation policies and procedures approved by the Board. If the adviser determines that reliable market quotations are not readily available, investments are valued at fair value as determined in good faith by the adviser in accordance with such procedures under the oversight of the Board of Trustees. Under the fund’s valuation policies and procedures, market quotations are not considered to be readily available for most types of debt instruments and floating rate loans and many types of derivatives. These investments are generally valued at fair value based on information from third-party pricing services. In addition, investments may be valued at fair value if the adviser determines that an investment’s value has been materially affected by events occurring after the close of the exchange or market on which the investment is principally traded (such as foreign exchange or market) and prior to the determination of the fund’s net asset value, or after the halt of trading of a specific security where trading does not resume prior to the close of the exchange or market on which the security is principally traded. The adviser generally relies on third-party pricing services or other information (such as the correlation with price movements of similar securities in the same or other markets; the type, cost and investment characteristics of the security; the business and financial condition of the issuer; and trading and other market data) to assist in determining whether to fair value and at what value to fair value an investment. The value of an investment for purposes of calculating the fund’s net asset value can differ depending on the source and method used to determine value. When fair valuation is used, the value of an investment used to determine the fund’s net asset value may differ from quoted or published prices for the same investment. There can be no assurance that the fund could obtain the fair value assigned to an investment if it were to sell the investment at the same time at which the fund determines its net asset value per share.
Various inputs are used in determining the value of the fund's assets or liabilities. These inputs are categorized into three broad levels. In certain cases, the inputs used to measure fair value may fall into different levels of the fair value hierarchy. In such cases, an investment's level within the fair value hierarchy is based on the lowest level of input that is significant to the fair value measurement. The fund's assessment of the significance of a particular input to the fair value measurement in its entirety requires judgment, and considers factors specific to the investment. Level 1 includes unadjusted quoted prices in active markets for identical assets or liabilities. Level 2 includes other significant observable market-based inputs (including quoted prices for similar securities, interest rates, prepayment speed, and credit risk). Level 3 includes unobservable inputs, which may include the adviser's own assumptions in determining the fair value of investments. Other financial instruments are derivative instruments, such as futures contracts. The following is a summary of the levels used as of June 30, 2021 in valuing the fund's assets or liabilities:
| Financial Instruments | Level 1 | Level 2 | Level 3 | Total |
| U.S. Treasury Bonds & U.S. Government Agencies & Equivalents | $— | $258,438,057 | $— | $258,438,057 |
| Non - U.S. Sovereign Debt | — | 21,983,060 | — | 21,983,060 |
| Municipal Bonds | — | 54,182,225 | — | 54,182,225 |
| U.S. Corporate Bonds | — | 645,761,854 | — | 645,761,854 |
| Residential Mortgage-Backed Securities | — | 365,676,650 | — | 365,676,650 |
| Commercial Mortgage-Backed Securities | — | 199,405,307 | — | 199,405,307 |
| Asset-Backed Securities (including CDOs) | — | 181,794,994 | — | 181,794,994 |
| Foreign Bonds | — | 245,208,911 | — | 245,208,911 |
| Mutual Funds | 201,562,587 | — | — | 201,562,587 |
| Total | $201,562,587 | $1,972,451,058 | $— | $2,174,013,645 |
| Other Financial Instruments | | | | |
| Futures Contracts – Assets | $4,955,531 | $— | $— | $4,955,531 |
| Futures Contracts – Liabilities | (1,509,505) | — | — | (1,509,505) |
For further information regarding security characteristics, see the Portfolio of Investments.
Foreign Currency Translation — Purchases and sales of foreign investments, income, and expenses are converted into U.S. dollars based upon currency exchange rates prevailing on the respective dates of such transactions or on the reporting date for foreign denominated receivables and payables. Gains and losses attributable to foreign currency exchange rates on sales of securities are recorded for financial statement purposes as net realized gains and losses on investments. Gains and losses attributable to foreign exchange rate movements on receivables, payables, income and expenses are recorded for financial statement purposes as foreign currency transaction gains and losses. That portion of both realized and unrealized gains and losses on investments that results from fluctuations in foreign currency exchange rates is not separately disclosed.
Derivatives — The fund uses derivatives primarily to increase or decrease exposure to a particular market or segment of the market, or security, to increase or decrease interest rate or currency exposure, or as alternatives to direct investments. Derivatives are used for hedging or non-hedging purposes. While hedging can reduce or eliminate losses, it can also reduce or eliminate gains. When the fund uses derivatives as an investment to increase market exposure, or for hedging purposes, gains and losses from derivative instruments may be substantially greater than the derivative’s original cost.
MFS Total Return Bond Series
Notes to Financial Statements (unaudited) - continued
The derivative instruments used by the fund during the period were futures contracts and forward foreign currency exchange contracts. Depending on the type of derivative, a fund may exit a derivative position by entering into an offsetting transaction with a counterparty or exchange, negotiating an agreement with the derivative counterparty, or novating the position to a third party. The fund may be unable to promptly close out a futures position in instances where the daily fluctuation in the price for that type of future exceeds the daily limit set by the exchange. The fund's period end derivatives, as presented in the Portfolio of Investments and the associated Derivative Contract tables, generally are indicative of the volume of its derivative activity during the period.
The following table presents, by major type of derivative contract, the fair value, on a gross basis, of the asset and liability components of derivatives held by the fund at June 30, 2021 as reported in the Statement of Assets and Liabilities:
| | | Fair Value (a) |
| Risk | Derivative Contracts | Asset Derivatives | Liability Derivatives |
| Interest Rate | Interest Rate Futures | $4,955,531 | $(1,509,505) |
(a) Values presented in this table for futures contracts correspond to the values reported in the Portfolio of Investments. Only the current day net variation margin for futures contracts is separately reported within the Statement of Assets and Liabilities.
The following table presents, by major type of derivative contract, the realized gain (loss) on derivatives held by the fund for the six months ended June 30, 2021 as reported in the Statement of Operations:
| Risk | Futures
Contracts | Forward Foreign
Currency
Exchange
Contracts |
| Interest Rate | $(4,353,750) | $— |
| Foreign Exchange | — | (166,881) |
| Total | $(4,353,750) | $(166,881) |
The following table presents, by major type of derivative contract, the change in unrealized appreciation or depreciation on derivatives held by the fund for the six months ended June 30, 2021 as reported in the Statement of Operations:
| Risk | Futures
Contracts | Forward Foreign
Currency
Exchange
Contracts |
| Interest Rate | $3,206,357 | $— |
| Foreign Exchange | — | 384,133 |
| Total | $3,206,357 | $384,133 |
Derivative counterparty credit risk is managed through formal evaluation of the creditworthiness of all potential counterparties. On certain, but not all, uncleared derivatives, the fund attempts to reduce its exposure to counterparty credit risk whenever possible by entering into an ISDA Master Agreement on a bilateral basis. The ISDA Master Agreement gives each party to the agreement the right to terminate all transactions traded under such agreement if there is a specified deterioration in the credit quality of the other party. Upon an event of default or a termination of the ISDA Master Agreement, the non-defaulting party has the right to close out all transactions traded under such agreement and to net amounts owed under each agreement to one net amount payable by one party to the other. This right to close out and net payments across all transactions traded under the ISDA Master Agreement could result in a reduction of the fund's credit risk to such counterparty equal to any amounts payable by the fund under the applicable transactions, if any.
Collateral and margin requirements differ by type of derivative. For cleared derivatives (e.g., futures contracts, cleared swaps, and exchange-traded options), margin requirements are set by the clearing broker and the clearing house and collateral, in the form of cash or securities, is posted by the fund directly with the clearing broker. Collateral terms are counterparty agreement specific for uncleared derivatives (e.g., forward foreign currency exchange contracts, uncleared swap agreements, and uncleared options) and collateral, in the form of cash and securities, is held in segregated accounts with the fund's custodian in connection with these agreements. For derivatives traded under an ISDA Master Agreement, which contains a collateral support annex, the collateral requirements are netted across all transactions traded under such counterparty-specific agreement and an amount is posted from one party to the other to collateralize such obligations. Cash that has been segregated or delivered to cover the fund's collateral or margin obligations under derivative contracts, if any, will be reported separately in the Statement of Assets and Liabilities as restricted
MFS Total Return Bond Series
Notes to Financial Statements (unaudited) - continued
cash for uncleared derivatives and/or deposits with brokers for cleared derivatives. Securities pledged as collateral or margin for the same purpose, if any, are noted in the Portfolio of Investments. The fund may be required to make payments of interest on uncovered collateral or margin obligations with the broker. Any such payments are included in “Miscellaneous” expense in the Statement of Operations.
Futures Contracts — The fund entered into futures contracts which may be used to hedge against or obtain broad market exposure, interest rate exposure, currency exposure, or to manage duration. A futures contract represents a commitment for the future purchase or sale of an asset at a specified price on a specified date.
Upon entering into a futures contract, the fund is required to deposit with the broker, either in cash or securities, an initial margin in an amount equal to a specified percentage of the notional amount of the contract. Subsequent payments (variation margin) are made or received by the fund each day, depending on the daily fluctuations in the value of the contract, and are recorded for financial statement purposes as unrealized gain or loss by the fund until the contract is closed or expires at which point the gain or loss on futures contracts is realized.
The fund bears the risk of interest rates, exchange rates or securities prices moving unexpectedly, in which case, the fund may not achieve the anticipated benefits of the futures contracts and may realize a loss. While futures contracts may present less counterparty risk to the fund since the contracts are exchange traded and the exchange’s clearinghouse guarantees payments to the broker, there is still counterparty credit risk due to the insolvency of the broker. The fund’s maximum risk of loss due to counterparty credit risk is equal to the margin posted by the fund to the broker plus any gains or minus any losses on the outstanding futures contracts.
Forward Foreign Currency Exchange Contracts — The fund entered into forward foreign currency exchange contracts for the purchase or sale of a specific foreign currency at a fixed price on a future date. These contracts may be used to hedge the fund’s currency risk or for non-hedging purposes. For hedging purposes, the fund may enter into contracts to deliver or receive foreign currency that the fund will receive from or use in its normal investment activities. The fund may also use contracts to hedge against declines in the value of foreign currency denominated securities due to unfavorable exchange rate movements. For non-hedging purposes, the fund may enter into contracts with the intent of changing the relative exposure of the fund’s portfolio of securities to different currencies to take advantage of anticipated exchange rate changes.
Forward foreign currency exchange contracts are adjusted by the daily exchange rate of the underlying currency and any unrealized gains or losses are recorded as a receivable or payable for forward foreign currency exchange contracts until the contract settlement date. On contract settlement date, any gain or loss on the contract is recorded as realized gains or losses on forward foreign currency exchange contracts.
Risks may arise upon entering into these contracts from unanticipated movements in the value of the contract and from the potential inability of counterparties to meet the terms of their contracts. Generally, the fund’s maximum risk due to counterparty credit risk is the unrealized gain on the contract due to the use of Continuous Linked Settlement, a multicurrency cash settlement system for the centralized settlement of foreign transactions. This risk is mitigated in cases where there is an ISDA Master Agreement between the fund and the counterparty providing for netting as described above and, where applicable, by the posting of collateral by the counterparty to the fund to cover the fund’s exposure to the counterparty under such ISDA Master Agreement.
Indemnifications — Under the fund's organizational documents, its officers and Trustees may be indemnified against certain liabilities and expenses arising out of the performance of their duties to the fund. Additionally, in the normal course of business, the fund enters into agreements with service providers that may contain indemnification clauses. The fund's maximum exposure under these agreements is unknown as this would involve future claims that may be made against the fund that have not yet occurred.
Investment Transactions and Income — Investment transactions are recorded on the trade date. Some securities may be purchased or sold on an extended settlement basis, which means that the receipt or delivery of the securities by the fund and related payments occur at a future date, usually beyond the customary settlement period. Interest income is recorded on the accrual basis.
Interest payments received in additional securities are recorded on the ex-interest date in an amount equal to the value of the security on such date. All premium and discount is amortized or accreted for financial statement purposes in accordance with U.S. generally accepted accounting principles.
The fund may receive proceeds from litigation settlements. Any proceeds received from litigation involving portfolio holdings are reflected in the Statement of Operations in realized gain/loss if the security has been disposed of by the fund or in unrealized gain/loss if the security is still held by the fund. Any other proceeds from litigation not related to portfolio holdings are reflected as other income in the Statement of Operations.
The fund invests a significant portion of its assets in asset-backed and/or mortgage-backed securities. For these securities, the value of the debt instrument also depends on the credit quality and adequacy of the underlying assets or collateral as well as whether there is a security interest in the underlying assets or collateral. Enforcing rights, if any, against the underlying assets or collateral may be
MFS Total Return Bond Series
Notes to Financial Statements (unaudited) - continued
difficult. U.S. Government securities not supported as to the payment of principal or interest by the U.S. Treasury, such as those issued by Fannie Mae, Freddie Mac, and the Federal Home Loan Banks, are subject to greater credit risk than are U.S. Government securities supported by the U.S. Treasury, such as those issued by Ginnie Mae.
The fund may purchase or sell mortgage-backed securities on a “To Be Announced” (TBA) basis. A TBA transaction is subject to extended settlement and typically does not designate the actual security to be delivered, but instead includes an approximate principal amount. The price of the TBA security and the date that it will be settled are fixed at the time the transaction is negotiated. The value of the security varies with market fluctuations and no interest accrues to the fund until settlement takes place. TBA purchase and sale commitments are held at carrying amount, which approximates fair value and are categorized as level 2 within the fair value hierarchy and included in TBA purchase and TBA sale commitments in the Statement of Assets and Liabilities. Losses may arise as a result of changes in the value of the TBA investment prior to settlement date or due to counterparty non-performance. At the time that it enters into a TBA transaction, the fund is required to have sufficient cash and/or liquid securities to cover its commitments.
The fund may also enter into mortgage dollar rolls, typically TBA dollar rolls, in which the fund sells TBA mortgage-backed securities to financial institutions and simultaneously agrees to repurchase similar (same issuer, type and coupon) securities at a later date at an agreed-upon price. During the period between the sale and repurchase, the fund will not be entitled to receive interest and principal payments on the securities sold. The fund accounts for dollar roll transactions as purchases and sales and realizes gains and losses on these transactions. Dollar roll transactions involve the risk that the market value of the securities that the fund is required to purchase may decline below the agreed upon repurchase price of those securities.
To mitigate the counterparty credit risk on TBA transactions, mortgage dollar rolls, and other types of forward settling mortgage-backed and asset-backed security transactions, the fund whenever possible enters into a Master Securities Forward Transaction Agreement (“MSFTA”) on a bilateral basis with each of the counterparties with whom it undertakes a significant volume of transactions. The MSFTA gives each party to the agreement the right to terminate all transactions traded under such agreement if there is a specified deterioration in the credit quality of the other party. Upon an event of default or a termination of the MSFTA, the non-defaulting party has the right to close out all transactions traded under such agreement and to net amounts owed under each transaction to one net amount payable by one party to the other. This right to close out and net payments across all transactions traded under the MSFTA could result in a reduction of the fund's credit risk to such counterparty equal to any amounts payable by the fund under the applicable transactions, if any.
For mortgage-backed and asset-backed securities traded under a MSFTA, the collateral and margining requirements are contract specific. Collateral amounts across all transactions traded under such agreement are netted and an amount is posted from one party to the other to collateralize such obligations. Cash that has been pledged to cover the fund's collateral or margin obligations under a MSFTA, if any, will be reported separately on the Statement of Assets and Liabilities as restricted cash. Securities pledged as collateral or margin for the same purpose, if any, are noted in the Portfolio of Investments.
Tax Matters and Distributions — The fund intends to qualify as a regulated investment company, as defined under Subchapter M of the Internal Revenue Code, and to distribute all of its taxable income, including realized capital gains. As a result, no provision for federal income tax is required. The fund’s federal tax returns, when filed, will remain subject to examination by the Internal Revenue Service for a three year period. Management has analyzed the fund’s tax positions taken on federal and state tax returns for all open tax years and does not believe that there are any uncertain tax positions that require recognition of a tax liability. Foreign taxes, if any, have been accrued by the fund in the accompanying financial statements in accordance with the applicable foreign tax law. Foreign income taxes may be withheld by certain countries in which the fund invests. Additionally, capital gains realized by the fund on securities issued in or by certain foreign countries may be subject to capital gains tax imposed by those countries.
Distributions to shareholders are recorded on the ex-dividend date. Income and capital gain distributions are determined in accordance with income tax regulations, which may differ from U.S. generally accepted accounting principles. Certain capital accounts in the financial statements are periodically adjusted for permanent differences in order to reflect their tax character. These adjustments have no impact on net assets or net asset value per share. Temporary differences which arise from recognizing certain items of income, expense, gain or loss in different periods for financial statement and tax purposes will reverse at some time in the future.
Book/tax differences primarily relate to amortization and accretion of debt securities.
The tax character of distributions declared to shareholders for the last fiscal year is as follows:
| | Year ended
12/31/20 |
| Ordinary income (including any short-term capital gains) | $63,395,758 |
MFS Total Return Bond Series
Notes to Financial Statements (unaudited) - continued
The federal tax cost and the tax basis components of distributable earnings were as follows:
| As of 6/30/21 | |
| Cost of investments | $2,100,070,543 |
| Gross appreciation | 82,581,963 |
| Gross depreciation | (8,638,861) |
| Net unrealized appreciation (depreciation) | $73,943,102 |
| As of 12/31/20 | |
| Undistributed ordinary income | 52,720,492 |
| Undistributed long-term capital gain | 147,479 |
| Other temporary differences | 215,677 |
| Net unrealized appreciation (depreciation) | 126,534,595 |
The aggregate cost above includes prior fiscal year end tax adjustments, if applicable.
Multiple Classes of Shares of Beneficial Interest — The fund offers multiple classes of shares, which differ in their respective distribution and/or service fees. The fund's income, realized and unrealized gain (loss), and common expenses are allocated to shareholders based on the daily net assets of each class. Dividends are declared separately for each class. Differences in per share dividend rates are generally due to differences in separate class expenses. The fund’s distributions declared to shareholders as reported in the Statements of Changes in Net Assets are presented by class as follows:
| | Six months ended
6/30/21 | | Year ended
12/31/20 |
| Initial Class | $— | | $29,795,683 |
| Service Class | — | | 33,600,075 |
| Total | $— | | $63,395,758 |
(3) Transactions with Affiliates
Investment Adviser — The fund has an investment advisory agreement with MFS to provide overall investment management and related administrative services and facilities to the fund. The management fee is computed daily and paid monthly at the following annual rates based on the fund's average daily net assets:
| Up to $2.5 billion | 0.50% |
| In excess of $2.5 billion and up to $5 billion | 0.45% |
| In excess of $5 billion | 0.40% |
MFS has agreed in writing to reduce its management fee by a specified amount if certain MFS mutual fund assets exceed thresholds agreed to by MFS and the fund's Board of Trustees. For the six months ended June 30, 2021, this management fee reduction amounted to $119,068, which is included in the reduction of total expenses in the Statement of Operations. The management fee incurred for the six months ended June 30, 2021 was equivalent to an annual effective rate of 0.49% of the fund's average daily net assets.
Distributor — MFS Fund Distributors, Inc. (MFD), a wholly-owned subsidiary of MFS, is the distributor of shares of the fund. The Trustees have adopted a distribution plan for the Service Class shares pursuant to Rule 12b-1 under the Investment Company Act of 1940.
The fund's distribution plan provides that the fund will pay MFD distribution and/or service fees equal to 0.25% per annum of its average daily net assets attributable to Service Class shares as partial consideration for services performed and expenses incurred by MFD and financial intermediaries (including participating insurance companies that invest in the fund to fund variable annuity and variable life insurance contracts, sponsors of qualified retirement and pension plans that invest in the fund, and affiliates of these participating insurance companies and plan sponsors) in connection with the sale and distribution of the Service Class shares. MFD may subsequently pay all, or a portion, of the distribution and/or service fees to financial intermediaries.
Shareholder Servicing Agent — MFS Service Center, Inc. (MFSC), a wholly-owned subsidiary of MFS, receives a fee from the fund for its services as shareholder servicing agent. For the six months ended June 30, 2021, the fee was $24,051, which equated to 0.0024% annually of the fund's average daily net assets. MFSC also receives reimbursement from the fund for out-of-pocket expenses paid by MFSC on behalf of the fund. For the six months ended June 30, 2021, these costs amounted to $639.
MFS Total Return Bond Series
Notes to Financial Statements (unaudited) - continued
Administrator — MFS provides certain financial, legal, shareholder communications, compliance, and other administrative services to the fund. Under an administrative services agreement, the fund reimburses MFS the costs incurred to provide these services. The fund is charged an annual fixed amount of $17,500 plus a fee based on average daily net assets. The administrative services fee incurred for the six months ended June 30, 2021 was equivalent to an annual effective rate of 0.0133% of the fund's average daily net assets.
Trustees’ and Officers’ Compensation — The fund pays compensation to independent Trustees in the form of a retainer, attendance fees, and additional compensation to Board and Committee chairpersons. The fund does not pay compensation directly to Trustees or officers of the fund who are also officers of the investment adviser, all of whom receive remuneration from MFS for their services to the fund. Certain officers and Trustees of the fund are officers or directors of MFS, MFD, and MFSC.
Other — The fund invests in the MFS Institutional Money Market Portfolio which is managed by MFS and seeks current income consistent with preservation of capital and liquidity. This money market fund does not pay a management fee to MFS but does incur investment and operating costs.
The fund is permitted to engage in purchase and sale transactions with funds and accounts for which MFS serves as investment adviser or sub-adviser (“cross-trades”) pursuant to a policy adopted by the Board of Trustees. This policy has been designed to ensure that cross-trades conducted by the fund comply with Rule 17a-7 under the Investment Company Act of 1940. During the six months ended June 30, 2021, the fund engaged in purchase transactions pursuant to this policy, which amounted to $27,207.
(4) Portfolio Securities
For the six months ended June 30, 2021, purchases and sales of investments, other than short-term obligations, were as follows:
| | Purchases | Sales |
| U.S. Government securities | $1,525,543,521 | $1,390,207,660 |
| Non-U.S. Government securities | 270,396,620 | 318,171,279 |
(5) Shares of Beneficial Interest
The fund's Declaration of Trust permits the Trustees to issue an unlimited number of full and fractional shares of beneficial interest. Transactions in fund shares were as follows:
| | Six months ended
6/30/21 | | Year ended
12/31/20 |
| | Shares | Amount | | Shares | Amount |
| Shares sold | | | | | |
| Initial Class | 6,694,358 | $93,055,275 | | 13,168,136 | $181,339,136 |
| Service Class | 6,785,459 | 92,095,544 | | 10,980,723 | 150,262,829 |
| | 13,479,817 | $185,150,819 | | 24,148,859 | $331,601,965 |
Shares issued to shareholders
in reinvestment of distributions | | | | | |
| Initial Class | — | $— | | 2,116,668 | $29,167,687 |
| Service Class | — | — | | 2,481,542 | 33,600,075 |
| | — | $— | | 4,598,210 | $62,767,762 |
| Shares reacquired | | | | | |
| Initial Class | (3,829,834) | $(53,255,047) | | (19,695,908) | $(267,503,154) |
| Service Class | (6,224,926) | (84,733,334) | | (18,285,133) | (242,992,859) |
| | (10,054,760) | $(137,988,381) | | (37,981,041) | $(510,496,013) |
| Net change | | | | | |
| Initial Class | 2,864,524 | $39,800,228 | | (4,411,104) | $(56,996,331) |
| Service Class | 560,533 | 7,362,210 | | (4,822,868) | (59,129,955) |
| | 3,425,057 | $47,162,438 | | (9,233,972) | $(116,126,286) |
The fund is one of several mutual funds in which certain MFS funds may invest. The MFS funds do not invest in the underlying funds for the purpose of exercising management or control. At the end of the period, the MFS Moderate Allocation Portfolio and the MFS Conservative Allocation Portfolio were the owners of record of approximately 8% and 3%, respectively, of the value of outstanding voting shares of the fund. In addition, the MFS Growth Allocation Portfolio was the owner of record of less than 1% of the value of the outstanding voting shares of the fund.
MFS Total Return Bond Series
Notes to Financial Statements (unaudited) - continued
(6) Line of Credit
The fund and certain other funds managed by MFS participate in a $1.25 billion unsecured committed line of credit of which $1 billion is reserved for use by the fund and certain other MFS U.S. funds. The line of credit is provided by a syndicate of banks under a credit agreement. Borrowings may be made for temporary financing needs. Interest is charged to each fund, based on its borrowings, generally at a rate equal to the highest of one month LIBOR, the Federal Funds Effective Rate and the Overnight Bank Funding Rate, plus an agreed upon spread. A commitment fee, based on the average daily, unused portion of the committed line of credit, is allocated among the participating funds. In addition, the fund and other funds managed by MFS have established unsecured uncommitted borrowing arrangements with certain banks for temporary financing needs. Interest is charged to each fund, based on its borrowings, at rates equal to customary reference rates plus an agreed upon spread. For the six months ended June 30, 2021, the fund’s commitment fee and interest expense were $3,997 and $0, respectively, and are included in “Miscellaneous” expense in the Statement of Operations.
(7) Investments in Affiliated Issuers
An affiliated issuer may be considered one in which the fund owns 5% or more of the outstanding voting securities, or a company which is under common control. For the purposes of this report, the following were affiliated issuers:
| Affiliated Issuers | Beginning
Value | Purchases | Sales
Proceeds | Realized
Gain
(Loss) | Change in
Unrealized
Appreciation or
Depreciation | Ending
Value |
| MFS Institutional Money Market Portfolio | $160,402,627 | $384,266,844 | $343,106,885 | $— | $1 | $201,562,587 |
| Affiliated Issuers | Dividend
Income | Capital Gain
Distributions |
| MFS Institutional Money Market Portfolio | $48,294 | $— |
(8) Impacts of COVID-19
The pandemic related to the global spread of novel coronavirus disease (COVID-19), which was first detected in December 2019, has resulted in significant disruptions to global business activity and the global economy, as well as the economies of individual countries, the financial performance of individual companies and sectors, and the securities and commodities markets in general. Multiple surges in cases globally, the availability and widespread adoption of vaccines, and the emergence of variant strains of the virus continue to create uncertainty as to the future and long-term impacts resulting from the pandemic including impacts to the prices and liquidity of the fund's investments and the fund's performance.
MFS Total Return Bond Series
Statement Regarding Liquidity Risk Management Program
The fund has adopted and implemented a liquidity risk management program (the “Program”) as required by Rule 22e-4 under the Investment Company Act of 1940, as amended. The fund’s Board of Trustees (the “Board”) has designated MFS as the administrator of the Program. The Program is reasonably designed to assess and manage the liquidity risk of the fund. Liquidity risk is the risk that the fund could not meet requests to redeem shares issued by the fund without significant dilution of remaining investors' interests.
MFS provided a written report to the Board for consideration at its April 2021 meeting that addressed the operation of the Program and provided an assessment of the adequacy and effectiveness of the Program during the period from January 1, 2020 to December 31, 2020 (the “Covered Period”). The report concluded that during the Covered Period the Program had operated effectively and had adequately and effectively been implemented to assess and manage the fund’s liquidity risk. MFS also reported that there were no liquidity events that impacted the fund or its ability to timely meet redemptions without dilution to existing shareholders during the Covered Period.
There can be no assurance that the Program will achieve its objectives in the future. Further information on liquidity risk, and other principal risks to which an investment in the fund may be subject, can be found in the prospectus.
MFS Total Return Bond Series
Proxy Voting Policies and Information
MFS votes proxies on behalf of the fund pursuant to proxy voting policies and procedures that are available without charge, upon request, by calling 1-800-225-2606, by visiting mfs.com/proxyvoting, or by visiting the SEC’s Web site at http://www.sec.gov.
Information regarding how the fund voted proxies relating to portfolio securities during the most recent twelve-month period ended June 30 is available by August 31 of each year without charge by visiting mfs.com/proxyvoting, or by visiting the SEC’s Web site at http://www.sec.gov.
Quarterly Portfolio Disclosure
The fund files a complete schedule of portfolio holdings with the SEC for the first and third quarters of each fiscal year as an exhibit to its reports on Form N-PORT. The fund’s Form N-PORT reports are available on the SEC’s Web site at http://www.sec.gov. A shareholder can obtain the portfolio holdings report for the first and third quarters of the fund's fiscal year at mfs.com/vit1 by choosing the fund's name and then scrolling to the “Resources” section and clicking on the “Prospectus and Reports” tab.
FURTHER INFORMATION
From time to time, MFS may post important information about the fund or the MFS Funds on the MFS Web site (mfs.com). This information is available at https://www.mfs.com/announcements or at mfs.com/vit1 by choosing the fund's name and then scrolling to the “Resources” section and clicking on the “Announcements” tab, if any.
Information About Fund Contracts and Legal Claims
The fund has entered into contractual arrangements with an investment adviser, administrator, distributor, shareholder servicing agent, 529 program manager (if applicable), and custodian who each provide services to the fund. Unless expressly stated otherwise, shareholders are not parties to, or intended beneficiaries of these contractual arrangements, and these contractual arrangements are not intended to create any shareholder right to enforce them against the service providers or to seek any remedy under them against the service providers, either directly or on behalf of the fund.
Under the Trust’s By-Laws and Declaration of Trust, any claims asserted against or on behalf of the MFS Funds, including claims against Trustees and Officers, must be brought in state and federal courts located within the Commonwealth of Massachusetts.
Semiannual Report
June 30, 2021
MFS® Variable Insurance Trust
The report is prepared for the general information of contract owners. It is authorized for distribution to prospective investors only when preceded or accompanied by a current prospectus.
NOT FDIC INSURED • MAY LOSE VALUE • NO BANK OR CREDIT UNION GUARANTEE •
NOT A DEPOSIT • NOT INSURED BY ANY FEDERAL GOVERNMENT AGENCY OR NCUA/NCUSIF
Dear Contract Owners:
After experiencing dramatic swings in the early days of the coronavirus pandemic, global equity markets have performed strongly over the past year. Though the speedy development of vaccines brightened the economic and market outlook, uncertainty remains as new variants of the virus appear, and questions persist over how fast vaccines can be made widely available in the developing world.
Global central banks have taken aggressive steps to cushion the economic and market fallout related to the virus, and governments are deploying unprecedented levels of fiscal support. Having passed a $1.9 trillion stimulus package in March, the U.S. Congress could approve additional stimulus later this year, some of it focused on infrastructure. Along with extraordinary government expenditures, pent-up consumer demand fueled a surge in economic activity as coronavirus restrictions were eased, pushing up inflation, at least temporarily. Markets initially reacted by pushing up yields on global government bonds, though some of the rate rise has since been corrected.
A spirited debate is underway among investors over whether the current price pressures will persist or prove to be temporary, caused by pandemic-induced bottlenecks. The policy measures put in place to counteract the pandemic's effects have helped build a supportive environment and are encouraging economic recovery; however, if markets disconnect from fundamentals, they can sow the seeds of instability. As such, recent dramatic increases in speculative trading in cryptocurrencies, special purpose acquisition companies (SPACs), and the like bear watching.
In the aftermath of the crisis, we could see societal changes as households, businesses, and governments adjust to a new reality, and any such alterations could affect the investment landscape. For investors, events such as the COVID-19 outbreak demonstrate the importance of having a deep understanding of company fundamentals, and we have built our global research platform to do just that.
At MFS®, we put our clients’ assets to work responsibly by carefully navigating the increasing complexity of global markets and economies. Guided by our long-term philosophy and adhering to our commitment to sustainable investing, we tune out the noise and aim to uncover what we believe are the best, most durable investment opportunities in the market. Our unique global investment platform combines collective expertise, long-term discipline, and thoughtful risk management to create sustainable value for investors.
Respectfully,
Michael W. Roberge
Chief Executive Officer
MFS Investment Management
August 13, 2021
The opinions expressed in this letter are subject to change and may not be relied upon for investment advice. No forecasts can be guaranteed.
Portfolio structure
Top ten holdings
| Microsoft Corp. | 6.8% |
| Amazon.com, Inc. | 4.9% |
| Alphabet, Inc., “A” | 4.7% |
| Facebook, Inc., “A” | 3.0% |
| Apple, Inc. | 2.9% |
| Adobe Systems, Inc. | 2.2% |
| Visa, Inc., “A” | 2.2% |
| salesforce.com, inc. | 1.7% |
| Bank of America Corp. | 1.7% |
| Goldman Sachs Group, Inc. | 1.5% |
Global equity sectors (k)
| Technology | 32.3% |
| Financial Services | 14.1% |
| Consumer Cyclicals | 13.4% |
| Capital Goods | 13.4% |
| Health Care | 13.1% |
| Energy | 5.0% |
| Consumer Staples | 4.9% |
| Telecommunications/Cable Television (s) | 3.4% |
| (k) | The sectors set forth above and the associated portfolio composition are based on MFS’ own custom sector classification methodology. |
| (s) | Includes securities sold short. |
Cash & Cash Equivalents includes any cash, investments in money market funds, short-term securities, and other assets less liabilities. Please see the Statement of Assets and Liabilities for additional information related to the fund’s cash position and other assets and liabilities.
Percentages are based on net assets as of June 30, 2021.
The portfolio is actively managed and current holdings may be different.
Expense Table
Fund Expenses Borne by the Contract Holders during the Period,
January 1, 2021 through June 30, 2021
As a contract holder of the fund, you incur ongoing costs, including management fees; distribution and/or service (12b-1) fees; and other fund expenses. This example is intended to help you understand your ongoing costs (in dollars) of investing in the fund and to compare these costs with the ongoing costs of investing in other mutual funds.
The example is based on an investment of $1,000 invested at the beginning of the period and held for the entire period January 1, 2021 through June 30, 2021.
Actual Expenses
The first line for each share class in the following table provides information about actual account values and actual expenses. You may use the information in this line, together with the amount you invested, to estimate the expenses that you paid over the period. Simply divide your account value by $1,000 (for example, an $8,600 account value divided by $1,000 = 8.6), then multiply the result by the number in the first line under the heading entitled “Expenses Paid During Period” to estimate the expenses you paid on your account during this period.
Hypothetical Example for Comparison Purposes
The second line for each share class in the following table provides information about hypothetical account values and hypothetical expenses based on the fund’s actual expense ratio and an assumed rate of return of 5% per year before expenses, which is not the fund’s actual return. The hypothetical account values and expenses may not be used to estimate the actual ending account balance or expenses you paid for the period. You may use this information to compare the ongoing costs of investing in the fund and other funds. To do so, compare this 5% hypothetical example with the 5% hypothetical examples that appear in the shareholder reports of the other funds.
Please note that the expenses shown in the table are meant to highlight the fund's ongoing costs only and do not take into account the fees and expenses imposed under the variable contracts through which your investment in the fund is made. Therefore, the second line for each share class in the table is useful in comparing ongoing costs associated with an investment in vehicles (such as the fund) which fund benefits under variable annuity and variable life insurance contracts and to qualified pension and retirement plans only, and will not help you determine the relative total costs of investing in the fund through variable annuity and variable life insurance contracts. If the fees and expenses imposed under the variable contracts were included, your costs would have been higher.
Share
Class | | Annualized
Expense
Ratio | Beginning
Account Value
1/01/21 | Ending
Account Value
6/30/21 | Expenses
Paid During
Period (p)
1/01/21-6/30/21 |
| Initial Class | Actual | 0.78% | $1,000.00 | $1,146.64 | $4.15 |
| Hypothetical (h) | 0.78% | $1,000.00 | $1,020.93 | $3.91 |
| Service Class | Actual | 1.03% | $1,000.00 | $1,145.33 | $5.48 |
| Hypothetical (h) | 1.03% | $1,000.00 | $1,019.69 | $5.16 |
| (h) | 5% class return per year before expenses. |
| (p) | “Expenses Paid During Period” are equal to each class's annualized expense ratio, as shown above, multiplied by the average account value over the period, multiplied by 181/365 (to reflect the one-half year period). |
Notes to Expense Table
Expense ratios include 0.01% of investment related expenses from short sales (See Note 2 of the Notes to Financial Statements) that are outside of the expense limitation arrangement (See Note 3 of the Notes to Financial Statements).
Portfolio of Investments − 6/30/21 (unaudited)
The Portfolio of Investments is a complete list of all securities owned by your fund. It is categorized by broad-based asset classes.
| Issuer | | | Shares/Par | Value ($) |
| Common Stocks – 99.9% |
| Aerospace & Defense – 3.5% | |
| Honeywell International, Inc. | | 41,119 | $ 9,019,452 |
| Howmet Aerospace, Inc. (a) | | 82,295 | 2,836,709 |
| L3Harris Technologies, Inc. | | 23,448 | 5,068,285 |
| Northrop Grumman Corp. | | 9,984 | 3,628,485 |
| Raytheon Technologies Corp. | | 78,209 | 6,672,010 |
| | | | | $27,224,941 |
| Alcoholic Beverages – 0.6% | |
| Constellation Brands, Inc., “A” | | 18,367 | $ 4,295,858 |
| Apparel Manufacturers – 1.3% | |
| NIKE, Inc., “B” | | 65,701 | $ 10,150,147 |
| Biotechnology – 1.3% | |
| Illumina, Inc. (a) | | 8,744 | $ 4,137,748 |
| Vertex Pharmaceuticals, Inc. (a) | | 30,386 | 6,126,729 |
| | | | | $10,264,477 |
| Broadcasting – 0.2% | |
| Discovery Communications, Inc., “C” (a) | | 64,224 | $ 1,861,211 |
| Brokerage & Asset Managers – 2.0% | |
| Cboe Global Markets, Inc. | | 32,985 | $ 3,926,864 |
| Charles Schwab Corp. | | 161,844 | 11,783,862 |
| | | | | $15,710,726 |
| Business Services – 3.7% | |
| Accenture PLC, “A” | | 23,023 | $ 6,786,950 |
| Fidelity National Information Services, Inc. | | 59,510 | 8,430,782 |
| Fiserv, Inc. (a) | | 66,965 | 7,157,889 |
| Global Payments, Inc. | | 32,662 | 6,125,431 |
| | | | | $28,501,052 |
| Cable TV – 1.6% | |
| Cable One, Inc. | | 1,311 | $ 2,507,694 |
| Charter Communications, Inc., “A” (a) | | 13,338 | 9,622,700 |
| | | | | $12,130,394 |
| Chemicals – 0.4% | |
| FMC Corp. | | 31,538 | $ 3,412,412 |
| Computer Software – 12.1% | |
| Adobe Systems, Inc. (a) | | 29,011 | $ 16,990,002 |
| Atlassian Corp. PLC, “A” (a) | | 15,703 | 4,033,473 |
| Cadence Design Systems, Inc. (a) | | 50,859 | 6,958,528 |
| Microsoft Corp. (s) | | 196,579 | 53,253,251 |
| salesforce.com, inc. (a) | | 53,653 | 13,105,818 |
| | | | | $94,341,072 |
| Computer Software - Systems – 4.9% | |
| Apple, Inc. | | 165,319 | $ 22,642,090 |
| Constellation Software, Inc. | | 3,540 | 5,361,432 |
| EPAM Systems, Inc. (a) | | 11,207 | 5,726,329 |
| TransUnion | | 42,628 | 4,680,981 |
| | | | | $38,410,832 |
| Issuer | | | Shares/Par | Value ($) |
| Common Stocks – continued |
| Construction – 2.8% | |
| AvalonBay Communities, Inc., REIT | | 9,736 | $ 2,031,806 |
| AZEK Co. LLC (a) | | 66,861 | 2,838,918 |
| Masco Corp. | | 71,960 | 4,239,164 |
| Otis Worldwide Corp. | | 53,882 | 4,405,931 |
| Sherwin-Williams Co. | | 17,583 | 4,790,488 |
| Vulcan Materials Co. | | 20,903 | 3,638,585 |
| | | | | $21,944,892 |
| Consumer Products – 1.2% | |
| Colgate-Palmolive Co. | | 65,735 | $ 5,347,542 |
| Kimberly-Clark Corp. | | 31,718 | 4,243,234 |
| | | | | $9,590,776 |
| Electrical Equipment – 1.6% | |
| Johnson Controls International PLC | | 87,136 | $ 5,980,144 |
| Sensata Technologies Holding PLC (a) | | 60,999 | 3,536,112 |
| TE Connectivity Ltd. | | 22,743 | 3,075,081 |
| | | | | $12,591,337 |
| Electronics – 3.3% | |
| Applied Materials, Inc. | | 75,260 | $ 10,717,024 |
| Lam Research Corp. | | 11,291 | 7,347,054 |
| NXP Semiconductors N.V. | | 39,029 | 8,029,046 |
| | | | | $26,093,124 |
| Energy - Independent – 2.0% | |
| ConocoPhillips | | 105,218 | $ 6,407,776 |
| Diamondback Energy, Inc. | | 25,036 | 2,350,630 |
| Pioneer Natural Resources Co. | | 25,075 | 4,075,189 |
| Valero Energy Corp. | | 32,942 | 2,572,112 |
| | | | | $15,405,707 |
| Food & Beverages – 2.4% | |
| Hostess Brands, Inc. (a) | | 140,850 | $ 2,280,361 |
| Mondelez International, Inc. | | 96,039 | 5,996,675 |
| Oatly Group AB, ADR (a) | | 85,082 | 2,081,106 |
| PepsiCo, Inc. | | 53,992 | 7,999,995 |
| | | | | $18,358,137 |
| Food & Drug Stores – 1.2% | |
| Wal-Mart Stores, Inc. | | 67,349 | $ 9,497,556 |
| Gaming & Lodging – 0.5% | |
| Penn National Gaming, Inc. (a) | | 15,753 | $ 1,204,947 |
| Wyndham Hotels & Resorts, Inc. | | 38,151 | 2,757,936 |
| | | | | $3,962,883 |
| General Merchandise – 0.9% | |
| Dollar General Corp. | | 32,362 | $ 7,002,813 |
| Health Maintenance Organizations – 1.6% | |
| Cigna Corp. | | 31,116 | $ 7,376,670 |
| Humana, Inc. | | 12,160 | 5,383,475 |
| | | | | $12,760,145 |
Portfolio of Investments (unaudited) – continued
| Issuer | | | Shares/Par | Value ($) |
| Common Stocks – continued |
| Insurance – 2.7% | |
| Aon PLC | | 44,670 | $ 10,665,409 |
| Chubb Ltd. | | 40,021 | 6,360,938 |
| Reinsurance Group of America, Inc. | | 29,994 | 3,419,316 |
| Willis Towers Watson PLC | | 3,061 | 704,091 |
| | | | | $21,149,754 |
| Internet – 7.7% | |
| Alphabet, Inc., “A” (a)(s) | | 14,948 | $ 36,499,877 |
| Facebook, Inc., “A” (a) | | 67,625 | 23,513,889 |
| | | | | $60,013,766 |
| Leisure & Toys – 1.0% | |
| Electronic Arts, Inc. | | 55,479 | $ 7,979,545 |
| Machinery & Tools – 2.0% | |
| Ingersoll Rand, Inc. (a) | | 113,076 | $ 5,519,239 |
| Roper Technologies, Inc. | | 13,945 | 6,556,939 |
| Trane Technologies PLC | | 17,978 | 3,310,469 |
| | | | | $15,386,647 |
| Major Banks – 4.3% | |
| Bank of America Corp. | | 316,494 | $ 13,049,048 |
| Goldman Sachs Group, Inc. | | 31,550 | 11,974,172 |
| PNC Financial Services Group, Inc. | | 46,023 | 8,779,347 |
| | | | | $33,802,567 |
| Medical & Health Technology & Services – 1.7% | |
| ICON PLC (a) | | 24,364 | $ 5,036,283 |
| Laboratory Corp. of America Holdings (a) | | 15,259 | 4,209,195 |
| McKesson Corp. | | 20,838 | 3,985,059 |
| | | | | $13,230,537 |
| Medical Equipment – 4.8% | |
| Becton, Dickinson and Co. | | 23,923 | $ 5,817,834 |
| Boston Scientific Corp. (a) | | 166,503 | 7,119,668 |
| Danaher Corp. | | 43,491 | 11,671,245 |
| Medtronic PLC | | 69,950 | 8,682,893 |
| STERIS PLC | | 19,085 | 3,937,236 |
| | | | | $37,228,876 |
| Natural Gas - Pipeline – 0.5% | |
| Enterprise Products Partners LP | | 153,675 | $ 3,708,178 |
| Network & Telecom – 0.6% | |
| Equinix, Inc., REIT | | 5,828 | $ 4,677,553 |
| Other Banks & Diversified Financials – 3.9% | |
| Northern Trust Corp. | | 47,855 | $ 5,532,995 |
| Truist Financial Corp. | | 149,556 | 8,300,358 |
| Visa, Inc., “A” | | 72,445 | 16,939,090 |
| | | | | $30,772,443 |
| Pharmaceuticals – 3.7% | |
| Eli Lilly & Co. | | 33,016 | $ 7,577,832 |
| Johnson & Johnson | | 41,426 | 6,824,519 |
| Merck & Co., Inc. | | 111,529 | 8,673,610 |
| Organon & Co. (a) | | 11,153 | 337,490 |
| Zoetis, Inc. | | 28,904 | 5,386,550 |
| | | | | $28,800,001 |
| Issuer | | | Shares/Par | Value ($) |
| Common Stocks – continued |
| Railroad & Shipping – 1.3% | |
| Canadian Pacific Railway Ltd. | | 85,614 | $ 6,584,573 |
| Kansas City Southern Co. | | 13,178 | 3,734,250 |
| | | | | $10,318,823 |
| Real Estate – 1.1% | |
| Extra Space Storage, Inc., REIT | | 26,841 | $ 4,397,093 |
| STORE Capital Corp., REIT | | 126,695 | 4,372,244 |
| | | | | $8,769,337 |
| Restaurants – 1.5% | |
| Starbucks Corp. | | 75,444 | $ 8,435,394 |
| Wendy's Co. | | 142,955 | 3,348,006 |
| | | | | $11,783,400 |
| Specialty Chemicals – 1.8% | |
| Air Products & Chemicals, Inc. | | 15,374 | $ 4,422,792 |
| Axalta Coating Systems Ltd. (a) | | 130,604 | 3,982,116 |
| DuPont de Nemours, Inc. | | 67,209 | 5,202,649 |
| | | | | $13,607,557 |
| Specialty Stores – 6.7% | |
| Amazon.com, Inc. (a)(s) | | 11,071 | $ 38,086,011 |
| Home Depot, Inc. | | 26,091 | 8,320,159 |
| Ross Stores, Inc. | | 47,448 | 5,883,552 |
| | | | | $52,289,722 |
| Telecommunications - Wireless – 2.1% | |
| SBA Communications Corp., REIT | | 31,368 | $ 9,996,982 |
| T-Mobile USA, Inc. (a) | | 46,279 | 6,702,587 |
| | | | | $16,699,569 |
| Tobacco – 0.8% | |
| Philip Morris International, Inc. | | 60,393 | $ 5,985,550 |
| Utilities - Electric Power – 2.6% | |
| American Electric Power Co., Inc. | | 34,761 | $ 2,940,433 |
| Duke Energy Corp. | | 56,250 | 5,553,000 |
| NextEra Energy, Inc. | | 72,214 | 5,291,842 |
| PG&E Corp. (a) | | 239,310 | 2,433,783 |
| Southern Co. | | 70,171 | 4,246,047 |
| | | | | $20,465,105 |
| Total Common Stocks (Identified Cost, $403,747,300) | | $780,179,422 |
| Investment Companies (h) – 0.5% |
| Money Market Funds – 0.5% | |
| MFS Institutional Money Market Portfolio, 0.02% (v) (Identified Cost, $3,655,781) | | | 3,655,789 | $ 3,655,790 |
| Securities Sold Short – (0.3)% |
| Telecommunications - Wireless – (0.3)% |
| Crown Castle International Corp., REIT (Proceeds Received, $1,060,166) | | | (12,776) | $ (2,492,598) |
| Other Assets, Less Liabilities – (0.1)% | | (633,592) |
| Net Assets – 100.0% | $780,709,022 |
Portfolio of Investments (unaudited) – continued
| (a) | Non-income producing security. | | | |
| (h) | An affiliated issuer, which may be considered one in which the fund owns 5% or more of the outstanding voting securities, or a company which is under common control. At period end, the aggregate values of the fund's investments in affiliated issuers and in unaffiliated issuers were $3,655,790 and $780,179,422, respectively. | | | |
| (s) | Security or a portion of the security was pledged to cover collateral requirements for securities sold short. | | | |
| (v) | Affiliated issuer that is available only to investment companies managed by MFS. The rate quoted for the MFS Institutional Money Market Portfolio is the annualized seven-day yield of the fund at period end. | | | |
| The following abbreviations are used in this report and are defined: |
| ADR | American Depositary Receipt |
| REIT | Real Estate Investment Trust |
At June 30, 2021, the fund had cash collateral of $20,823 and other liquid securities with an aggregate value of $6,545,947 to cover any collateral or margin obligations for securities sold short. Restricted cash and/or deposits with brokers in the Statement of Assets and Liabilities are comprised of cash collateral.
See Notes to Financial Statements
| Financial Statements | Statement of Assets and Liabilities (unaudited) |
This statement represents your fund’s balance sheet, which details the assets and liabilities comprising the total value of the fund.
| At 6/30/21Assets | |
| Investments in unaffiliated issuers, at value (identified cost, $403,747,300) | $780,179,422 |
| Investments in affiliated issuers, at value (identified cost, $3,655,781) | 3,655,790 |
| Cash | 10,806 |
| Deposits with brokers for | |
| Securities sold short | 20,823 |
| Receivables for | |
| Fund shares sold | 109,711 |
| Dividends | 559,799 |
| Other assets | 2,140 |
| Total assets | $784,538,491 |
| Liabilities | |
| Payables for | |
| Securities sold short, at value (proceeds received, $1,060,166) | $2,492,598 |
| Fund shares reacquired | 1,189,192 |
| Payable to affiliates | |
| Investment adviser | 18,619 |
| Administrative services fee | 617 |
| Shareholder servicing costs | 484 |
| Distribution and/or service fees | 5,420 |
| Accrued expenses and other liabilities | 122,539 |
| Total liabilities | $3,829,469 |
| Net assets | $780,709,022 |
| Net assets consist of | |
| Paid-in capital | $325,425,921 |
| Total distributable earnings (loss) | 455,283,101 |
| Net assets | $780,709,022 |
| Shares of beneficial interest outstanding | 20,897,534 |
| | Net assets | Shares
outstanding | Net asset value
per share |
| Initial Class | $385,063,154 | 10,215,971 | $37.69 |
| Service Class | 395,645,868 | 10,681,563 | 37.04 |
See Notes to Financial Statements
| Financial Statements | Statement of Operations (unaudited) |
This statement describes how much your fund earned in investment income and accrued in expenses. It also describes any gains and/or losses generated by fund operations.
| Six months ended 6/30/21 | |
| Net investment income (loss) | |
| Income | |
| Dividends | $4,400,235 |
| Other | 19,230 |
| Dividends from affiliated issuers | 1,276 |
| Foreign taxes withheld | (11,695) |
| Total investment income | $4,409,046 |
| Expenses | |
| Management fee | $2,840,559 |
| Distribution and/or service fees | 477,143 |
| Shareholder servicing costs | 18,038 |
| Administrative services fee | 53,882 |
| Independent Trustees' compensation | 6,331 |
| Custodian fee | 18,397 |
| Shareholder communications | 25,847 |
| Audit and tax fees | 30,355 |
| Legal fees | 2,866 |
| Dividend and interest expense on securities sold short | 45,656 |
| Interest expense and fees | 1,506 |
| Miscellaneous | 15,810 |
| Total expenses | $3,536,390 |
| Reduction of expenses by investment adviser | (94,997) |
| Net expenses | $3,441,393 |
| Net investment income (loss) | $967,653 |
| Realized and unrealized gain (loss) | |
| Realized gain (loss) (identified cost basis) | |
| Unaffiliated issuers | $33,116,792 |
| Affiliated issuers | 48 |
| Foreign currency | 525 |
| Net realized gain (loss) | $33,117,365 |
| Change in unrealized appreciation or depreciation | |
| Unaffiliated issuers | $70,594,690 |
| Affiliated issuers | (47) |
| Securities sold short | (641,791) |
| Translation of assets and liabilities in foreign currencies | (91) |
| Net unrealized gain (loss) | $69,952,761 |
| Net realized and unrealized gain (loss) | $103,070,126 |
| Change in net assets from operations | $104,037,779 |
See Notes to Financial Statements
| Financial Statements | Statements of Changes in Net Assets |
These statements describe the increases and/or decreases in net assets resulting from operations, any distributions, and any shareholder transactions.
| | Six months ended | Year ended |
| | 6/30/21
(unaudited) | 12/31/20 |
| Change in net assets | | |
| From operations | | |
| Net investment income (loss) | $967,653 | $3,369,335 |
| Net realized gain (loss) | 33,117,365 | 43,017,213 |
| Net unrealized gain (loss) | 69,952,761 | 66,022,145 |
| Change in net assets from operations | $104,037,779 | $112,408,693 |
| Total distributions to shareholders | $— | $(31,733,190) |
| Change in net assets from fund share transactions | $(71,055,202) | $(14,633,535) |
| Total change in net assets | $32,982,577 | $66,041,968 |
| Net assets | | |
| At beginning of period | 747,726,445 | 681,684,477 |
| At end of period | $780,709,022 | $747,726,445 |
See Notes to Financial Statements
| Financial Statements | Financial Highlights |
The financial highlights table is intended to help you understand the fund's financial performance for the semiannual period and the past 5 fiscal years. Certain information reflects financial results for a single fund share. The total returns in the table represent the rate that an investor would have earned (or lost) on an investment in the fund share class (assuming reinvestment of all distributions) held for the entire period.
| Initial Class | Six months
ended | Year ended |
| | 6/30/21
(unaudited) | 12/31/20 | 12/31/19 | 12/31/18 | 12/31/17 | 12/31/16 |
| Net asset value, beginning of period | $32.87 | $29.49 | $24.93 | $29.50 | $26.00 | $26.68 |
| Income (loss) from investment operations | | | | | | |
| Net investment income (loss) (d) | $0.07 | $0.18 | $0.23 | $0.26 | $0.20 | $0.36(c) |
| Net realized and unrealized gain (loss) | 4.75 | 4.62 | 7.66 | (1.04) | 5.67 | 1.98 |
| Total from investment operations | $4.82 | $4.80 | $7.89 | $(0.78) | $5.87 | $2.34 |
| Less distributions declared to shareholders | | | | | | |
| From net investment income | $— | $(0.22) | $(0.24) | $(0.22) | $(0.40) | $(0.22) |
| From net realized gain | — | (1.20) | (3.09) | (3.57) | (1.97) | (2.80) |
| Total distributions declared to shareholders | $— | $(1.42) | $(3.33) | $(3.79) | $(2.37) | $(3.02) |
| Net asset value, end of period (x) | $37.69 | $32.87 | $29.49 | $24.93 | $29.50 | $26.00 |
| Total return (%) (k)(r)(s)(x) | 14.66(n) | 16.59 | 32.95 | (4.37) | 23.37 | 8.74(c) |
Ratios (%) (to average net assets)
and Supplemental data: | | | | | | |
| Expenses before expense reductions (f) | 0.81(a) | 0.82 | 0.83 | 0.82 | 0.83 | 0.80(c) |
| Expenses after expense reductions (f) | 0.78(a) | 0.79 | 0.81 | 0.81 | 0.81 | 0.79(c) |
| Net investment income (loss) | 0.38(a) | 0.62 | 0.82 | 0.88 | 0.70 | 1.36(c) |
| Portfolio turnover | 6(n) | 39 | 35 | 31 | 37 | 45 |
| Net assets at end of period (000 omitted) | $385,063 | $372,405 | $361,842 | $319,422 | $394,867 | $386,256 |
| Supplemental Ratios (%): | | | | | | |
| Ratios of expenses to average net assets after expense reductions excluding short sale expenses and interest expense and fees (f) | 0.77(a) | 0.77 | 0.78 | 0.79 | 0.79 | 0.78(c) |
See Notes to Financial Statements
Financial Highlights - continued
| Service Class | Six months
ended | Year ended |
| | 6/30/21
(unaudited) | 12/31/20 | 12/31/19 | 12/31/18 | 12/31/17 | 12/31/16 |
| Net asset value, beginning of period | $32.34 | $29.05 | $24.61 | $29.17 | $25.73 | $26.42 |
| Income (loss) from investment operations | | | | | | |
| Net investment income (loss) (d) | $0.02 | $0.11 | $0.16 | $0.18 | $0.13 | $0.29(c) |
| Net realized and unrealized gain (loss) | 4.68 | 4.54 | 7.55 | (1.03) | 5.61 | 1.96 |
| Total from investment operations | $4.70 | $4.65 | $7.71 | $(0.85) | $5.74 | $2.25 |
| Less distributions declared to shareholders | | | | | | |
| From net investment income | $— | $(0.16) | $(0.18) | $(0.14) | $(0.33) | $(0.14) |
| From net realized gain | — | (1.20) | (3.09) | (3.57) | (1.97) | (2.80) |
| Total distributions declared to shareholders | $— | $(1.36) | $(3.27) | $(3.71) | $(2.30) | $(2.94) |
| Net asset value, end of period (x) | $37.04 | $32.34 | $29.05 | $24.61 | $29.17 | $25.73 |
| Total return (%) (k)(r)(s)(x) | 14.53(n) | 16.31 | 32.60 | (4.62) | 23.07 | 8.49(c) |
Ratios (%) (to average net assets)
and Supplemental data: | | | | | | |
| Expenses before expense reductions (f) | 1.06(a) | 1.07 | 1.08 | 1.07 | 1.08 | 1.05(c) |
| Expenses after expense reductions (f) | 1.03(a) | 1.04 | 1.06 | 1.06 | 1.06 | 1.04(c) |
| Net investment income (loss) | 0.13(a) | 0.37 | 0.57 | 0.63 | 0.47 | 1.11(c) |
| Portfolio turnover | 6(n) | 39 | 35 | 31 | 37 | 45 |
| Net assets at end of period (000 omitted) | $395,646 | $375,322 | $319,842 | $215,898 | $228,102 | $220,341 |
| Supplemental Ratios (%): | | | | | | |
| Ratios of expenses to average net assets after expense reductions excluding short sale expenses and interest expense and fees (f) | 1.02(a) | 1.02 | 1.03 | 1.04 | 1.04 | 1.03(c) |
| (a) | Annualized. |
| (c) | Amount reflects a one-time reimbursement of expenses by the custodian (or former custodian) without which net investment income and performance would be lower and expenses would be higher. |
| (d) | Per share data is based on average shares outstanding. |
| (f) | Ratios do not reflect reductions from fees paid indirectly, if applicable. |
| (k) | The total return does not reflect expenses that apply to separate accounts. Inclusion of these charges would reduce the total return figures for all periods shown. |
| (n) | Not annualized. |
| (r) | Certain expenses have been reduced without which performance would have been lower. |
| (s) | From time to time the fund may receive proceeds from litigation settlements, without which performance would be lower. |
| (x) | The net asset values and total returns have been calculated on net assets which include adjustments made in accordance with U.S. generally accepted accounting principles required at period end for financial reporting purposes. |
See Notes to Financial Statements
Notes to Financial Statements (unaudited)
(1) Business and Organization
MFS Research Series (the fund) is a diversified series of MFS Variable Insurance Trust (the trust). The trust is organized as a Massachusetts business trust and is registered under the Investment Company Act of 1940, as amended, as an open-end management investment company. The shareholders of each series of the trust are separate accounts of insurance companies, which offer variable annuity and/or life insurance products, and qualified retirement and pension plans.
The fund is an investment company and accordingly follows the investment company accounting and reporting guidance of the Financial Accounting Standards Board (FASB) Accounting Standards Codification Topic 946 Financial Services - Investment Companies.
(2) Significant Accounting Policies
General — The preparation of financial statements in conformity with U.S. generally accepted accounting principles requires management to make estimates and assumptions that affect the reported amounts of assets and liabilities, and disclosure of contingent assets and liabilities at the date of the financial statements and the reported amounts of increases and decreases in net assets from operations during the reporting period. Actual results could differ from those estimates. In the preparation of these financial statements, management has evaluated subsequent events occurring after the date of the fund’s Statement of Assets and Liabilities through the date that the financial statements were issued.
Certain of the fund's investments, derivatives, debt and other contracts may be based on reference interest rates such as the London Interbank Offered Rate (“LIBOR”). In 2017, the regulatory authority that oversees financial services firms in the United Kingdom announced plans to transition away from LIBOR by the end of 2021. In March 2021, the administrator of LIBOR announced the extension of the publication of the more commonly used U.S. dollar LIBOR settings to the end of June 2023. Although the full impacts of the transition away from LIBOR are not fully known, the transition may result in, among other things, an increase in volatility or illiquidity of the markets for instruments that currently rely on LIBOR to determine interest rates and this could have an adverse impact on the fund's performance. With respect to the fund's accounting for investments, derivatives, debt and other contracts that undergo reference rate-related modifications as a result of the transition, management will rely upon the relief provided by FASB Codification Topic 848 – Reference Rate Reform (Topic 848). The guidance in Topic 848 permits the fund to disregard the GAAP accounting requirements around certain contract modifications resulting from the LIBOR transition such that for contracts considered in scope, the fund can account for those modified contracts as a continuation of the existing contracts.
Balance Sheet Offsetting — The fund's accounting policy with respect to balance sheet offsetting is that, absent an event of default by the counterparty or a termination of the agreement, the International Swaps and Derivatives Association (ISDA) Master Agreement, or similar agreement, does not result in an offset of reported amounts of financial assets and financial liabilities in the Statement of Assets and Liabilities across transactions between the fund and the applicable counterparty. The fund's right to setoff may be restricted or prohibited by the bankruptcy or insolvency laws of the particular jurisdiction to which a specific master netting agreement counterparty is subject. Balance sheet offsetting disclosures, to the extent applicable to the fund, have been included in the fund’s Significant Accounting Policies note under the captions for each of the fund’s in-scope financial instruments and transactions.
Investment Valuations — Equity securities, including restricted equity securities and equity securities sold short, are generally valued at the last sale or official closing price on their primary market or exchange as provided by a third-party pricing service. Equity securities, for which there were no sales reported that day, are generally valued at the last quoted daily bid quotation on their primary market or exchange as provided by a third-party pricing service. Equity securities sold short, for which there were no sales reported that day, are generally valued at the last quoted daily ask quotation on their primary market or exchange as provided by a third-party pricing service. Short-term instruments with a maturity at issuance of 60 days or less may be valued at amortized cost, which approximates market value. Open-end investment companies are generally valued at net asset value per share. Securities and other assets generally valued on the basis of information from a third-party pricing service may also be valued at a broker/dealer bid quotation. In determining values, third-party pricing services can utilize both transaction data and market information such as yield, quality, coupon rate, maturity, type of issue, trading characteristics, and other market data. The values of foreign securities and other assets and liabilities expressed in foreign currencies are converted to U.S. dollars using the mean of bid and asked prices for rates provided by a third-party pricing service.
The Board of Trustees has delegated primary responsibility for determining or causing to be determined the value of the fund’s investments (including any fair valuation) to the adviser pursuant to valuation policies and procedures approved by the Board. If the adviser determines that reliable market quotations are not readily available, investments are valued at fair value as determined in good faith by the adviser in accordance with such procedures under the oversight of the Board of Trustees. Under the fund’s valuation policies and procedures, market quotations are not considered to be readily available for most types of debt instruments and floating rate loans and many types of derivatives. These investments are generally valued at fair value based on information from
Notes to Financial Statements (unaudited) - continued
third-party pricing services. In addition, investments may be valued at fair value if the adviser determines that an investment’s value has been materially affected by events occurring after the close of the exchange or market on which the investment is principally traded (such as foreign exchange or market) and prior to the determination of the fund’s net asset value, or after the halt of trading of a specific security where trading does not resume prior to the close of the exchange or market on which the security is principally traded. Events that occur after foreign markets close (such as developments in foreign markets and significant movements in the U.S. markets) and prior to the determination of the fund’s net asset value may be deemed to have a material effect on the value of securities traded in foreign markets. Accordingly, the fund’s foreign equity securities may often be valued at fair value. The adviser generally relies on third-party pricing services or other information (such as the correlation with price movements of similar securities in the same or other markets; the type, cost and investment characteristics of the security; the business and financial condition of the issuer; and trading and other market data) to assist in determining whether to fair value and at what value to fair value an investment. The value of an investment for purposes of calculating the fund’s net asset value can differ depending on the source and method used to determine value. When fair valuation is used, the value of an investment used to determine the fund’s net asset value may differ from quoted or published prices for the same investment. There can be no assurance that the fund could obtain the fair value assigned to an investment if it were to sell the investment at the same time at which the fund determines its net asset value per share.
Various inputs are used in determining the value of the fund's assets or liabilities. These inputs are categorized into three broad levels. In certain cases, the inputs used to measure fair value may fall into different levels of the fair value hierarchy. In such cases, an investment's level within the fair value hierarchy is based on the lowest level of input that is significant to the fair value measurement. The fund's assessment of the significance of a particular input to the fair value measurement in its entirety requires judgment, and considers factors specific to the investment. Level 1 includes unadjusted quoted prices in active markets for identical assets or liabilities. Level 2 includes other significant observable market-based inputs (including quoted prices for similar securities, interest rates, prepayment speed, and credit risk). Level 3 includes unobservable inputs, which may include the adviser's own assumptions in determining the fair value of investments. The following is a summary of the levels used as of June 30, 2021 in valuing the fund's assets or liabilities:
| Financial Instruments | Level 1 | Level 2 | Level 3 | Total |
| Equity Securities | $780,179,422 | $— | $— | $780,179,422 |
| Mutual Funds | 3,655,790 | — | — | 3,655,790 |
| Total | $783,835,212 | $— | $— | $783,835,212 |
| Securities Sold Short | $(2,492,598) | $— | $— | $(2,492,598) |
For further information regarding security characteristics, see the Portfolio of Investments.
Foreign Currency Translation — Purchases and sales of foreign investments, income, and expenses are converted into U.S. dollars based upon currency exchange rates prevailing on the respective dates of such transactions or on the reporting date for foreign denominated receivables and payables. Gains and losses attributable to foreign currency exchange rates on sales of securities are recorded for financial statement purposes as net realized gains and losses on investments. Gains and losses attributable to foreign exchange rate movements on receivables, payables, income and expenses are recorded for financial statement purposes as foreign currency transaction gains and losses. That portion of both realized and unrealized gains and losses on investments that results from fluctuations in foreign currency exchange rates is not separately disclosed.
Short Sales — The fund entered into short sales whereby it sells a security it does not own in anticipation of a decline in the value of that security. The fund will realize a gain if the security price decreases and a loss if the security price increases between the date of the short sale and the date on which the fund replaces the borrowed security. Losses from short sales can exceed the proceeds of the security sold; and they can also exceed the potential loss from an ordinary buy and sell transaction. The amount of any premium, dividends, or interest the fund may be required to pay in connection with a short sale will be recognized as a fund expense. During the six months ended June 30, 2021, this expense amounted to $45,656. The fund segregates cash or marketable securities in an amount that, when combined with the amount of proceeds from the short sale deposited with the broker, at least equals the current market value of the security sold short.
Indemnifications — Under the fund's organizational documents, its officers and Trustees may be indemnified against certain liabilities and expenses arising out of the performance of their duties to the fund. Additionally, in the normal course of business, the fund enters into agreements with service providers that may contain indemnification clauses. The fund's maximum exposure under these agreements is unknown as this would involve future claims that may be made against the fund that have not yet occurred.
Investment Transactions and Income — Investment transactions are recorded on the trade date. Dividends received in cash are recorded on the ex-dividend date. Certain dividends from foreign securities will be recorded when the fund is informed of the dividend if such information is obtained subsequent to the ex-dividend date. Dividend payments received in additional securities are recorded on the ex-dividend date in an amount equal to the value of the security on such date.
Notes to Financial Statements (unaudited) - continued
The fund may receive proceeds from litigation settlements. Any proceeds received from litigation involving portfolio holdings are reflected in the Statement of Operations in realized gain/loss if the security has been disposed of by the fund or in unrealized gain/loss if the security is still held by the fund. Any other proceeds from litigation not related to portfolio holdings are reflected as other income in the Statement of Operations.
Tax Matters and Distributions — The fund intends to qualify as a regulated investment company, as defined under Subchapter M of the Internal Revenue Code, and to distribute all of its taxable income, including realized capital gains. As a result, no provision for federal income tax is required. The fund’s federal tax returns, when filed, will remain subject to examination by the Internal Revenue Service for a three year period. Management has analyzed the fund’s tax positions taken on federal and state tax returns for all open tax years and does not believe that there are any uncertain tax positions that require recognition of a tax liability. Foreign taxes, if any, have been accrued by the fund in the accompanying financial statements in accordance with the applicable foreign tax law. Foreign income taxes may be withheld by certain countries in which the fund invests. Additionally, capital gains realized by the fund on securities issued in or by certain foreign countries may be subject to capital gains tax imposed by those countries.
Distributions to shareholders are recorded on the ex-dividend date. Income and capital gain distributions are determined in accordance with income tax regulations, which may differ from U.S. generally accepted accounting principles. Certain capital accounts in the financial statements are periodically adjusted for permanent differences in order to reflect their tax character. These adjustments have no impact on net assets or net asset value per share. Temporary differences which arise from recognizing certain items of income, expense, gain or loss in different periods for financial statement and tax purposes will reverse at some time in the future.
Book/tax differences primarily relate to wash sale loss deferrals and partnership adjustments.
The tax character of distributions declared to shareholders for the last fiscal year is as follows:
| | Year ended
12/31/20 |
| Ordinary income (including any short-term capital gains) | $6,781,157 |
| Long-term capital gains | 24,952,033 |
| Total distributions | $31,733,190 |
The federal tax cost and the tax basis components of distributable earnings were as follows:
| As of 6/30/21 | |
| Cost of investments | $409,610,834 |
| Gross appreciation | 376,270,981 |
| Gross depreciation | (2,046,603) |
| Net unrealized appreciation (depreciation) | $374,224,378 |
| As of 12/31/20 | |
| Undistributed ordinary income | 6,770,939 |
| Undistributed long-term capital gain | 40,139,242 |
| Other temporary differences | 1,496,047 |
| Net unrealized appreciation (depreciation) | 302,839,094 |
The aggregate cost above includes prior fiscal year end tax adjustments, if applicable.
Multiple Classes of Shares of Beneficial Interest — The fund offers multiple classes of shares, which differ in their respective distribution and/or service fees. The fund's income, realized and unrealized gain (loss), and common expenses are allocated to shareholders based on the daily net assets of each class. Dividends are declared separately for each class. Differences in per share dividend rates are generally due to differences in separate class expenses. The fund’s distributions declared to shareholders as reported in the Statements of Changes in Net Assets are presented by class as follows:
| | Six months
ended
6/30/21 | | Year
ended
12/31/20 |
| Initial Class | $— | | $16,028,106 |
| Service Class | — | | 15,705,084 |
| Total | $— | | $31,733,190 |
Notes to Financial Statements (unaudited) - continued
(3) Transactions with Affiliates
Investment Adviser — The fund has an investment advisory agreement with MFS to provide overall investment management and related administrative services and facilities to the fund. The management fee is computed daily and paid monthly at the following annual rates based on the fund's average daily net assets:
| Up to $1 billion | 0.75% |
| In excess of $1 billion | 0.65% |
MFS has agreed in writing to reduce its management fee by a specified amount if certain MFS mutual fund assets exceed thresholds agreed to by MFS and the fund's Board of Trustees. For the six months ended June 30, 2021, this management fee reduction amounted to $45,265, which is included in the reduction of total expenses in the Statement of Operations. The management fee incurred for the six months ended June 30, 2021 was equivalent to an annual effective rate of 0.74% of the fund's average daily net assets.
The investment adviser has agreed in writing to pay a portion of the fund’s total annual operating expenses, excluding interest, taxes, extraordinary expenses, brokerage and transaction costs, and investment-related expenses (such as short sale dividend and interest expenses incurred in connection with the fund's investment activity), such that total annual operating expenses do not exceed 0.77% of average daily net assets for the Initial Class shares and 1.02% of average daily net assets for the Service Class shares. This written agreement will continue until modified by the fund’s Board of Trustees, but such agreement will continue at least until April 30, 2023. For the six months ended June 30, 2021, this reduction amounted to $49,732, which is included in the reduction of total expenses in the Statement of Operations.
Distributor — MFS Fund Distributors, Inc. (MFD), a wholly-owned subsidiary of MFS, is the distributor of shares of the fund. The Trustees have adopted a distribution plan for the Service Class shares pursuant to Rule 12b-1 under the Investment Company Act of 1940.
The fund's distribution plan provides that the fund will pay MFD distribution and/or service fees equal to 0.25% per annum of its average daily net assets attributable to Service Class shares as partial consideration for services performed and expenses incurred by MFD and financial intermediaries (including participating insurance companies that invest in the fund to fund variable annuity and variable life insurance contracts, sponsors of qualified retirement and pension plans that invest in the fund, and affiliates of these participating insurance companies and plan sponsors) in connection with the sale and distribution of the Service Class shares. MFD may subsequently pay all, or a portion, of the distribution and/or service fees to financial intermediaries.
Shareholder Servicing Agent — MFS Service Center, Inc. (MFSC), a wholly-owned subsidiary of MFS, receives a fee from the fund for its services as shareholder servicing agent. For the six months ended June 30, 2021, the fee was $17,190, which equated to 0.0045% annually of the fund's average daily net assets. MFSC also receives reimbursement from the fund for out-of-pocket expenses paid by MFSC on behalf of the fund. For the six months ended June 30, 2021, these costs amounted to $848.
Administrator — MFS provides certain financial, legal, shareholder communications, compliance, and other administrative services to the fund. Under an administrative services agreement, the fund reimburses MFS the costs incurred to provide these services. The fund is charged an annual fixed amount of $17,500 plus a fee based on average daily net assets. The administrative services fee incurred for the six months ended June 30, 2021 was equivalent to an annual effective rate of 0.0142% of the fund's average daily net assets.
Trustees’ and Officers’ Compensation — The fund pays compensation to independent Trustees in the form of a retainer, attendance fees, and additional compensation to Board and Committee chairpersons. The fund does not pay compensation directly to Trustees or officers of the fund who are also officers of the investment adviser, all of whom receive remuneration from MFS for their services to the fund. Certain officers and Trustees of the fund are officers or directors of MFS, MFD, and MFSC.
Other — The fund invests in the MFS Institutional Money Market Portfolio which is managed by MFS and seeks current income consistent with preservation of capital and liquidity. This money market fund does not pay a management fee to MFS but does incur investment and operating costs.
The adviser has voluntarily undertaken to reimburse the fund from its own resources on a quarterly basis for the cost of investment research embedded in the cost of the fund’s securities trades. This agreement may be rescinded at any time. For the six months ended June 30, 2021, this reimbursement amounted to $18,968, which is included in “Other” income in the Statement of Operations.
Notes to Financial Statements (unaudited) - continued
(4) Portfolio Securities
For the six months ended June 30, 2021, purchases and sales of investments, other than short sales and short-term obligations, aggregated $47,719,435 and $115,913,992, respectively.
(5) Shares of Beneficial Interest
The fund's Declaration of Trust permits the Trustees to issue an unlimited number of full and fractional shares of beneficial interest. Transactions in fund shares were as follows:
| | Six months ended
6/30/21 | | Year ended
12/31/20 |
| | Shares | Amount | | Shares | Amount |
| Shares sold | | | | | |
| Initial Class | 194,837 | $6,910,032 | | 764,523 | $19,867,933 |
| Service Class | 217,250 | 7,474,328 | | 2,051,974 | 55,469,934 |
| | 412,087 | $14,384,360 | | 2,816,497 | $75,337,867 |
Shares issued to shareholders
in reinvestment of distributions | | | | | |
| Initial Class | — | $— | | 522,599 | $16,028,106 |
| Service Class | — | — | | 520,036 | 15,705,084 |
| | — | $— | | 1,042,635 | $31,733,190 |
| Shares reacquired | | | | | |
| Initial Class | (1,307,686) | $(45,998,770) | | (2,228,768) | $(65,370,350) |
| Service Class | (1,139,872) | (39,440,792) | | (1,976,828) | (56,334,242) |
| | (2,447,558) | $(85,439,562) | | (4,205,596) | $(121,704,592) |
| Net change | | | | | |
| Initial Class | (1,112,849) | $(39,088,738) | | (941,646) | $(29,474,311) |
| Service Class | (922,622) | (31,966,464) | | 595,182 | 14,840,776 |
| | (2,035,471) | $(71,055,202) | | (346,464) | $(14,633,535) |
The fund is one of several mutual funds in which certain MFS funds may invest. The MFS funds do not invest in the underlying funds for the purpose of exercising management or control. At the end of the period, the MFS Moderate Allocation Portfolio, the MFS Growth Allocation Portfolio, and the MFS Conservative Allocation Portfolio were the owners of record of approximately 15%, 5%, and 3%, respectively, of the value of outstanding voting shares of the fund.
(6) Line of Credit
The fund and certain other funds managed by MFS participate in a $1.25 billion unsecured committed line of credit of which $1 billion is reserved for use by the fund and certain other MFS U.S. funds. The line of credit is provided by a syndicate of banks under a credit agreement. Borrowings may be made for temporary financing needs. Interest is charged to each fund, based on its borrowings, generally at a rate equal to the highest of one month LIBOR, the Federal Funds Effective Rate and the Overnight Bank Funding Rate, plus an agreed upon spread. A commitment fee, based on the average daily, unused portion of the committed line of credit, is allocated among the participating funds. In addition, the fund and other funds managed by MFS have established unsecured uncommitted borrowing arrangements with certain banks for temporary financing needs. Interest is charged to each fund, based on its borrowings, at rates equal to customary reference rates plus an agreed upon spread. For the six months ended June 30, 2021, the fund’s commitment fee and interest expense were $1,506 and $0, respectively, and are included in “Interest expense and fees” in the Statement of Operations.
(7) Investments in Affiliated Issuers
An affiliated issuer may be considered one in which the fund owns 5% or more of the outstanding voting securities, or a company which is under common control. For the purposes of this report, the following were affiliated issuers:
Notes to Financial Statements (unaudited) - continued
| Affiliated Issuers | Beginning
Value | Purchases | Sales
Proceeds | Realized
Gain
(Loss) | Change in
Unrealized
Appreciation or
Depreciation | Ending
Value |
| MFS Institutional Money Market Portfolio | $6,109,231 | $77,628,738 | $80,082,180 | $48 | $(47) | $3,655,790 |
| Affiliated Issuers | Dividend
Income | Capital Gain
Distributions |
| MFS Institutional Money Market Portfolio | $1,276 | $— |
(8) Impacts of COVID-19
The pandemic related to the global spread of novel coronavirus disease (COVID-19), which was first detected in December 2019, has resulted in significant disruptions to global business activity and the global economy, as well as the economies of individual countries, the financial performance of individual companies and sectors, and the securities and commodities markets in general. Multiple surges in cases globally, the availability and widespread adoption of vaccines, and the emergence of variant strains of the virus continue to create uncertainty as to the future and long-term impacts resulting from the pandemic including impacts to the prices and liquidity of the fund's investments and the fund's performance.
Statement Regarding Liquidity Risk Management Program
The fund has adopted and implemented a liquidity risk management program (the “Program”) as required by Rule 22e-4 under the Investment Company Act of 1940, as amended. The fund’s Board of Trustees (the “Board”) has designated MFS as the administrator of the Program. The Program is reasonably designed to assess and manage the liquidity risk of the fund. Liquidity risk is the risk that the fund could not meet requests to redeem shares issued by the fund without significant dilution of remaining investors' interests.
MFS provided a written report to the Board for consideration at its April 2021 meeting that addressed the operation of the Program and provided an assessment of the adequacy and effectiveness of the Program during the period from January 1, 2020 to December 31, 2020 (the “Covered Period”). The report concluded that during the Covered Period the Program had operated effectively and had adequately and effectively been implemented to assess and manage the fund’s liquidity risk. MFS also reported that there were no liquidity events that impacted the fund or its ability to timely meet redemptions without dilution to existing shareholders during the Covered Period.
There can be no assurance that the Program will achieve its objectives in the future. Further information on liquidity risk, and other principal risks to which an investment in the fund may be subject, can be found in the prospectus.
Proxy Voting Policies and Information
MFS votes proxies on behalf of the fund pursuant to proxy voting policies and procedures that are available without charge, upon request, by calling 1-800-225-2606, by visiting mfs.com/proxyvoting, or by visiting the SEC’s Web site at http://www.sec.gov.
Information regarding how the fund voted proxies relating to portfolio securities during the most recent twelve-month period ended June 30 is available by August 31 of each year without charge by visiting mfs.com/proxyvoting, or by visiting the SEC’s Web site at http://www.sec.gov.
Quarterly Portfolio Disclosure
The fund files a complete schedule of portfolio holdings with the SEC for the first and third quarters of each fiscal year as an exhibit to its reports on Form N-PORT. The fund’s Form N-PORT reports are available on the SEC’s Web site at http://www.sec.gov. A shareholder can obtain the portfolio holdings report for the first and third quarters of the fund's fiscal year at mfs.com/vit1 by choosing the fund's name and then scrolling to the “Resources” section and clicking on the “Prospectus and Reports” tab.
FURTHER INFORMATION
From time to time, MFS may post important information about the fund or the MFS Funds on the MFS Web site (mfs.com). This information is available at https://www.mfs.com/announcements or at mfs.com/vit1 by choosing the fund's name and then scrolling to the “Resources” section and clicking on the “Announcements” tab, if any.
Information About Fund Contracts and Legal Claims
The fund has entered into contractual arrangements with an investment adviser, administrator, distributor, shareholder servicing agent, 529 program manager (if applicable), and custodian who each provide services to the fund. Unless expressly stated otherwise, shareholders are not parties to, or intended beneficiaries of these contractual arrangements, and these contractual arrangements are not intended to create any shareholder right to enforce them against the service providers or to seek any remedy under them against the service providers, either directly or on behalf of the fund.
Under the Trust’s By-Laws and Declaration of Trust, any claims asserted against or on behalf of the MFS Funds, including claims against Trustees and Officers, must be brought in state and federal courts located within the Commonwealth of Massachusetts.
Semiannual Report
June 30, 2021
MFS® Variable Insurance Trust
The report is prepared for the general information of contract owners. It is authorized for distribution to prospective investors only when preceded or accompanied by a current prospectus.
NOT FDIC INSURED • MAY LOSE VALUE • NO BANK OR CREDIT UNION GUARANTEE •
NOT A DEPOSIT • NOT INSURED BY ANY FEDERAL GOVERNMENT AGENCY OR NCUA/NCUSIF
Dear Contract Owners:
After experiencing dramatic swings in the early days of the coronavirus pandemic, global equity markets have performed strongly over the past year. Though the speedy development of vaccines brightened the economic and market outlook, uncertainty remains as new variants of the virus appear, and questions persist over how fast vaccines can be made widely available in the developing world.
Global central banks have taken aggressive steps to cushion the economic and market fallout related to the virus, and governments are deploying unprecedented levels of fiscal support. Having passed a $1.9 trillion stimulus package in March, the U.S. Congress could approve additional stimulus later this year, some of it focused on infrastructure. Along with extraordinary government expenditures, pent-up consumer demand fueled a surge in economic activity as coronavirus restrictions were eased, pushing up inflation, at least temporarily. Markets initially reacted by pushing up yields on global government bonds, though some of the rate rise has since been corrected.
A spirited debate is underway among investors over whether the current price pressures will persist or prove to be temporary, caused by pandemic-induced bottlenecks. The policy measures put in place to counteract the pandemic's effects have helped build a supportive environment and are encouraging economic recovery; however, if markets disconnect from fundamentals, they can sow the seeds of instability. As such, recent dramatic increases in speculative trading in cryptocurrencies, special purpose acquisition companies (SPACs), and the like bear watching.
In the aftermath of the crisis, we could see societal changes as households, businesses, and governments adjust to a new reality, and any such alterations could affect the investment landscape. For investors, events such as the COVID-19 outbreak demonstrate the importance of having a deep understanding of company fundamentals, and we have built our global research platform to do just that.
At MFS®, we put our clients’ assets to work responsibly by carefully navigating the increasing complexity of global markets and economies. Guided by our long-term philosophy and adhering to our commitment to sustainable investing, we tune out the noise and aim to uncover what we believe are the best, most durable investment opportunities in the market. Our unique global investment platform combines collective expertise, long-term discipline, and thoughtful risk management to create sustainable value for investors.
Respectfully,
Michael W. Roberge
Chief Executive Officer
MFS Investment Management
August 13, 2021
The opinions expressed in this letter are subject to change and may not be relied upon for investment advice. No forecasts can be guaranteed.
Portfolio structure (i)
Top ten holdings (i)
| U.S. Treasury Notes, 0.375%, 11/30/2025 | 2.8% |
| U.S. Treasury Notes, 1.375%, 1/31/2025 | 2.7% |
| Goldman Sachs Group, Inc. | 2.3% |
| Microsoft Corp. | 2.1% |
| Comcast Corp., “A” | 2.0% |
| U.S. Treasury Notes, 0.125%, 12/31/2022 | 1.8% |
| Fannie Mae, 2%, 30 year | 1.8% |
| JPMorgan Chase & Co. | 1.7% |
| Johnson & Johnson | 1.7% |
| Charles Schwab Corp. | 1.6% |
Composition including fixed income credit quality (a)(i)
| AAA | 4.7% |
| AA | 1.3% |
| A | 3.3% |
| BBB | 9.1% |
| BB | 0.3% |
| B (o) | 0.0% |
| CCC (o) | 0.0% |
| U.S. Government | 10.1% |
| Federal Agencies | 10.7% |
| Not Rated (o) | 0.0% |
| Non-Fixed Income | 59.3% |
| Cash & Cash Equivalents | 1.2% |
GICS equity sectors (g)
| Financials | 14.7% |
| Health Care | 9.6% |
| Industrials | 9.3% |
| Information Technology | 8.0% |
| Consumer Staples | 5.1% |
| Communication Services | 3.7% |
| Utilities | 2.2% |
| Consumer Discretionary | 2.1% |
| Materials | 1.9% |
| Energy | 1.2% |
| Convertible Debt | 1.2% |
| Real Estate | 0.3% |
Fixed income sectors (i)
| Investment Grade Corporates | 12.1% |
| Mortgage-Backed Securities | 10.7% |
| U.S. Treasury Securities | 10.1% |
| Commercial Mortgage-Backed Securities | 2.6% |
| Collateralized Debt Obligations | 2.2% |
| Asset-Backed Securities | 0.5% |
| Emerging Markets Bonds | 0.4% |
| Municipal Bonds | 0.4% |
| Non-U.S. Government Bonds | 0.3% |
| High Yield Corporates | 0.2% |
| U.S. Government Agencies (o) | 0.0% |
| (a) | For all securities other than those specifically described below, ratings are assigned to underlying securities utilizing ratings from Moody’s, Fitch, and Standard & Poor’s rating agencies and applying the following hierarchy: If all three agencies provide a rating, the middle rating (after dropping the highest and lowest ratings) is assigned; if two of the three agencies rate a security, the lower of the two is assigned. If none of the 3 rating agencies above assign a rating, but the security is rated by DBRS Morningstar, then the DBRS Morningstar rating is assigned. If none of the 4 ratings agencies listed above rate the security, but the security is rated by the Kroll Bond Rating Agency (KBRA), then the KBRA rating is assigned. Ratings are shown in the S&P and Fitch scale (e.g., AAA). Securities rated BBB or higher are considered investment grade. All ratings are subject to change. U.S. Government includes securities issued by the U.S. Department of the Treasury. Federal Agencies includes rated and unrated U.S. Agency fixed-income securities, U.S. Agency mortgage-backed securities, and collateralized mortgage obligations of U.S. Agency mortgage-backed securities. Not Rated includes fixed income securities and fixed income derivatives that have not been rated by any rating agency. Non-Fixed Income includes equity securities (including convertible bonds and equity derivatives) and/or |
Portfolio Composition - continued
commodity-linked derivatives. The fund may or may not have held all of these instruments on this date. The fund is not rated by these agencies.
| (g) | The Global Industry Classification Standard (GICS®) was developed by and/or is the exclusive property of MSCI, Inc. and S&P Global Market Intelligence Inc. (“S&P Global Market Intelligence”). GICS is a service mark of MSCI and S&P Global Market Intelligence and has been licensed for use by MFS. MFS has applied its own internal sector/industry classification methodology for equity securities and non-equity securities that are unclassified by GICS. |
| (i) | For purposes of this presentation, the components include the value of securities, and reflect the impact of the equivalent exposure of derivative positions, if any. These amounts may be negative from time to time. Equivalent exposure is a calculated amount that translates the derivative position into a reasonable approximation of the amount of the underlying asset that the portfolio would have to hold at a given point in time to have the same price sensitivity that results from the portfolio’s ownership of the derivative contract. When dealing with derivatives, equivalent exposure is a more representative measure of the potential impact of a position on portfolio performance than value. The bond component will include any accrued interest amounts. |
Where the fund holds convertible bonds, they are treated as part of the equity portion of the portfolio.
Cash & Cash Equivalents includes any cash, investments in money market funds, short-term securities, and other assets less liabilities. Please see the Statement of Assets and Liabilities for additional information related to the fund’s cash position and other assets and liabilities.
Percentages are based on net assets as of June 30, 2021.
The portfolio is actively managed and current holdings may be different.
Expense Table
Fund Expenses Borne by the Contract Holders during the Period,
January 1, 2021 through June 30, 2021
As a contract holder of the fund, you incur ongoing costs, including management fees; distribution and/or service (12b-1) fees; and other fund expenses. This example is intended to help you understand your ongoing costs (in dollars) of investing in the fund and to compare these costs with the ongoing costs of investing in other mutual funds.
The example is based on an investment of $1,000 invested at the beginning of the period and held for the entire period January 1, 2021 through June 30, 2021.
Actual Expenses
The first line for each share class in the following table provides information about actual account values and actual expenses. You may use the information in this line, together with the amount you invested, to estimate the expenses that you paid over the period. Simply divide your account value by $1,000 (for example, an $8,600 account value divided by $1,000 = 8.6), then multiply the result by the number in the first line under the heading entitled “Expenses Paid During Period” to estimate the expenses you paid on your account during this period.
Hypothetical Example for Comparison Purposes
The second line for each share class in the following table provides information about hypothetical account values and hypothetical expenses based on the fund’s actual expense ratio and an assumed rate of return of 5% per year before expenses, which is not the fund’s actual return. The hypothetical account values and expenses may not be used to estimate the actual ending account balance or expenses you paid for the period. You may use this information to compare the ongoing costs of investing in the fund and other funds. To do so, compare this 5% hypothetical example with the 5% hypothetical examples that appear in the shareholder reports of the other funds.
Please note that the expenses shown in the table are meant to highlight the fund's ongoing costs only and do not take into account the fees and expenses imposed under the variable contracts through which your investment in the fund is made. Therefore, the second line for each share class in the table is useful in comparing ongoing costs associated with an investment in vehicles (such as the fund) which fund benefits under variable annuity and variable life insurance contracts and to qualified pension and retirement plans only, and will not help you determine the relative total costs of investing in the fund through variable annuity and variable life insurance contracts. If the fees and expenses imposed under the variable contracts were included, your costs would have been higher.
Share
Class | | Annualized
Expense
Ratio | Beginning
Account Value
1/01/21 | Ending
Account Value
6/30/21 | Expenses
Paid During
Period (p)
1/01/21-6/30/21 |
| Initial Class | Actual | 0.61% | $1,000.00 | $1,093.39 | $3.17 |
| Hypothetical (h) | 0.61% | $1,000.00 | $1,021.77 | $3.06 |
| Service Class | Actual | 0.86% | $1,000.00 | $1,091.77 | $4.46 |
| Hypothetical (h) | 0.86% | $1,000.00 | $1,020.53 | $4.31 |
| (h) | 5% class return per year before expenses. |
| (p) | “Expenses Paid During Period” are equal to each class's annualized expense ratio, as shown above, multiplied by the average account value over the period, multiplied by 181/365 (to reflect the one-half year period). |
Portfolio of Investments − 6/30/21 (unaudited)
The Portfolio of Investments is a complete list of all securities owned by your fund. It is categorized by broad-based asset classes.
| Issuer | | | Shares/Par | Value ($) |
| Common Stocks – 57.8% |
| Aerospace & Defense – 2.4% | |
| Honeywell International, Inc. | | 125,869 | $ 27,609,365 |
| L3Harris Technologies, Inc. | | 76,396 | 16,512,995 |
| Lockheed Martin Corp. | | 22,436 | 8,488,661 |
| Northrop Grumman Corp. | | 30,845 | 11,209,998 |
| | | | | $63,821,019 |
| Alcoholic Beverages – 0.6% | |
| Constellation Brands, Inc., “A” | | 31,986 | $ 7,481,206 |
| Diageo PLC | | 177,377 | 8,492,103 |
| | | | | $15,973,309 |
| Automotive – 1.2% | |
| Aptiv PLC (a) | | 28,884 | $ 4,544,320 |
| Lear Corp. | | 84,375 | 14,789,250 |
| LKQ Corp. (a) | | 261,997 | 12,895,492 |
| | | | | $32,229,062 |
| Biotechnology – 0.3% | |
| Vertex Pharmaceuticals, Inc. (a) | | 44,068 | $ 8,885,431 |
| Broadcasting – 0.3% | |
| Discovery Communications, Inc., “C” (a) | | 214,534 | $ 6,217,195 |
| Omnicom Group, Inc. | | 33,297 | 2,663,427 |
| | | | | $8,880,622 |
| Brokerage & Asset Managers – 2.9% | |
| BlackRock, Inc. | | 10,423 | $ 9,119,812 |
| Cboe Global Markets, Inc. | | 77,659 | 9,245,304 |
| Charles Schwab Corp. | | 573,556 | 41,760,613 |
| Invesco Ltd. | | 308,180 | 8,237,651 |
| NASDAQ, Inc. | | 54,472 | 9,576,178 |
| | | | | $77,939,558 |
| Business Services – 2.5% | |
| Accenture PLC, “A” | | 66,262 | $ 19,533,375 |
| Amdocs Ltd. | | 133,731 | 10,345,430 |
| Cognizant Technology Solutions Corp., “A” | | 56,795 | 3,933,622 |
| Equifax, Inc. | | 33,862 | 8,110,288 |
| Fidelity National Information Services, Inc. | | 91,615 | 12,979,097 |
| Fiserv, Inc. (a) | | 116,989 | 12,504,954 |
| | | | | $67,406,766 |
| Cable TV – 2.0% | |
| Comcast Corp., “A” | | 930,361 | $ 53,049,184 |
| Chemicals – 1.2% | |
| 3M Co. | | 64,104 | $ 12,732,978 |
| PPG Industries, Inc. | | 113,352 | 19,243,769 |
| | | | | $31,976,747 |
| Computer Software – 2.4% | |
| Microsoft Corp. | | 203,548 | $ 55,141,153 |
| Oracle Corp. | | 125,305 | 9,753,741 |
| | | | | $64,894,894 |
| Issuer | | | Shares/Par | Value ($) |
| Common Stocks – continued |
| Construction – 1.5% | |
| Masco Corp. | | 374,143 | $ 22,040,764 |
| Otis Worldwide Corp. | | 51,959 | 4,248,688 |
| Stanley Black & Decker, Inc. | | 44,162 | 9,052,768 |
| Vulcan Materials Co. | | 30,981 | 5,392,863 |
| | | | | $40,735,083 |
| Consumer Products – 0.7% | |
| Colgate-Palmolive Co. | | 119,569 | $ 9,726,938 |
| Kimberly-Clark Corp. | | 58,439 | 7,817,970 |
| | | | | $17,544,908 |
| Consumer Services – 0.2% | |
| Booking Holdings, Inc. (a) | | 1,738 | $ 3,802,900 |
| Electrical Equipment – 1.2% | |
| Johnson Controls International PLC | | 468,624 | $ 32,161,665 |
| Electronics – 3.1% | |
| Applied Materials, Inc. | | 105,014 | $ 14,953,994 |
| Intel Corp. | | 362,201 | 20,333,964 |
| NXP Semiconductors N.V. | | 61,292 | 12,608,990 |
| Taiwan Semiconductor Manufacturing Co. Ltd., ADR | | 118,938 | 14,291,590 |
| Texas Instruments, Inc. | | 107,079 | 20,591,292 |
| | | | | $82,779,830 |
| Energy - Independent – 1.2% | |
| ConocoPhillips | | 137,995 | $ 8,403,895 |
| Hess Corp. | | 166,533 | 14,541,662 |
| Pioneer Natural Resources Co. | | 27,286 | 4,434,521 |
| Valero Energy Corp. | | 64,897 | 5,067,158 |
| | | | | $32,447,236 |
| Food & Beverages – 2.2% | |
| Archer Daniels Midland Co. | | 157,327 | $ 9,534,016 |
| Danone S.A. | | 117,826 | 8,294,713 |
| General Mills, Inc. | | 128,011 | 7,799,711 |
| J.M. Smucker Co. | | 36,488 | 4,727,750 |
| Mondelez International, Inc. | | 105,589 | 6,592,977 |
| Nestle S.A. | | 106,419 | 13,252,199 |
| PepsiCo, Inc. | | 49,959 | 7,402,425 |
| | | | | $57,603,791 |
| Food & Drug Stores – 0.6% | |
| Wal-Mart Stores, Inc. | | 119,549 | $ 16,858,800 |
| Health Maintenance Organizations – 1.4% | |
| Cigna Corp. | | 161,246 | $ 38,226,589 |
| Insurance – 3.1% | |
| Aon PLC | | 91,632 | $ 21,878,056 |
| Chubb Ltd. | | 138,699 | 22,044,819 |
| Marsh & McLennan Cos., Inc. | | 59,949 | 8,433,625 |
| Travelers Cos., Inc. | | 94,480 | 14,144,601 |
| Willis Towers Watson PLC | | 64,134 | 14,752,103 |
| | | | | $81,253,204 |
Portfolio of Investments (unaudited) – continued
| Issuer | | | Shares/Par | Value ($) |
| Common Stocks – continued |
| Internet – 0.5% | |
| Alphabet, Inc., “A” (a) | | 5,097 | $ 12,445,804 |
| Leisure & Toys – 0.3% | |
| Electronic Arts, Inc. | | 60,636 | $ 8,721,276 |
| Machinery & Tools – 2.3% | |
| Eaton Corp. PLC | | 240,570 | $ 35,647,663 |
| Ingersoll Rand, Inc. (a) | | 245,485 | 11,982,123 |
| PACCAR, Inc. | | 43,305 | 3,864,971 |
| Trane Technologies PLC | | 54,816 | 10,093,818 |
| | | | | $61,588,575 |
| Major Banks – 6.6% | |
| Bank of America Corp. | | 867,078 | $ 35,749,626 |
| Goldman Sachs Group, Inc. | | 159,775 | 60,639,406 |
| JPMorgan Chase & Co. | | 287,541 | 44,724,127 |
| Morgan Stanley | | 194,360 | 17,820,868 |
| PNC Financial Services Group, Inc. | | 95,838 | 18,282,057 |
| | | | | $177,216,084 |
| Medical & Health Technology & Services – 1.4% | |
| ICON PLC (a) | | 29,690 | $ 6,137,220 |
| McKesson Corp. | | 77,581 | 14,836,590 |
| Quest Diagnostics, Inc. | | 114,478 | 15,107,662 |
| | | | | $36,081,472 |
| Medical Equipment – 2.7% | |
| Becton, Dickinson and Co. | | 31,790 | $ 7,731,010 |
| Danaher Corp. | | 97,708 | 26,220,919 |
| Medtronic PLC | | 221,620 | 27,509,691 |
| Thermo Fisher Scientific, Inc. | | 22,996 | 11,600,792 |
| | | | | $73,062,412 |
| Metals & Mining – 0.2% | |
| Rio Tinto PLC | | 67,825 | $ 5,581,490 |
| Other Banks & Diversified Financials – 2.2% | |
| Northern Trust Corp. | | 77,937 | $ 9,011,076 |
| Truist Financial Corp. | | 585,699 | 32,506,295 |
| U.S. Bancorp | | 276,625 | 15,759,326 |
| | | | | $57,276,697 |
| Pharmaceuticals – 3.7% | |
| Bayer AG | | 69,069 | $ 4,194,026 |
| Johnson & Johnson | | 270,130 | 44,501,216 |
| Merck & Co., Inc. | | 436,793 | 33,969,391 |
| Organon & Co. (a) | | 142,691 | 4,317,830 |
| Roche Holding AG | | 34,017 | 12,814,510 |
| | | | | $99,796,973 |
| Railroad & Shipping – 1.0% | |
| Union Pacific Corp. | | 124,425 | $ 27,364,790 |
| Real Estate – 0.3% | |
| STORE Capital Corp., REIT | | 257,387 | $ 8,882,425 |
| Restaurants – 0.2% | |
| Wendy's Co. | | 210,600 | $ 4,932,252 |
| Issuer | | | Shares/Par | Value ($) |
| Common Stocks – continued |
| Specialty Chemicals – 0.8% | |
| Axalta Coating Systems Ltd. (a) | | 371,731 | $ 11,334,078 |
| DuPont de Nemours, Inc. | | 117,256 | 9,076,787 |
| | | | | $20,410,865 |
| Specialty Stores – 0.5% | |
| Home Depot, Inc. | | 44,234 | $ 14,105,780 |
| Telecommunications - Wireless – 0.6% | |
| T-Mobile USA, Inc. (a) | | 114,201 | $ 16,539,731 |
| Tobacco – 1.0% | |
| Philip Morris International, Inc. | | 279,579 | $ 27,709,075 |
| Trucking – 0.3% | |
| United Parcel Service, Inc., “B” | | 31,911 | $ 6,636,531 |
| Utilities - Electric Power – 2.2% | |
| Duke Energy Corp. | | 199,832 | $ 19,727,415 |
| Exelon Corp. | | 223,135 | 9,887,112 |
| PG&E Corp. (a) | | 887,138 | 9,022,193 |
| Pinnacle West Capital Corp. | | 63,549 | 5,209,112 |
| Southern Co. | | 255,612 | 15,467,082 |
| | | | | $59,312,914 |
| Total Common Stocks (Identified Cost, $832,001,820) | | $ 1,546,135,744 |
| Bonds – 39.3% |
| Aerospace & Defense – 0.2% |
| BAE Systems PLC, 3.4%, 4/15/2030 (n) | | $ | 1,108,000 | $ 1,204,290 |
| Huntington Ingalls Industries, Inc., 3.844%, 5/01/2025 | | | 591,000 | 644,025 |
| L3Harris Technologies, Inc., 3.85%, 6/15/2023 | | | 2,215,000 | 2,354,347 |
| Raytheon Technologies Corp., 4.125%, 11/16/2028 | | | 1,570,000 | 1,806,379 |
| | | | | $6,009,041 |
| Apparel Manufacturers – 0.0% |
| NIKE, Inc., “B”, 3.25%, 3/27/2040 | | $ | 773,000 | $ 848,678 |
| Asset-Backed & Securitized – 5.3% |
| Allegro CLO Ltd., 2016-1A, “BR2”, FLR, 1.734% (LIBOR - 3mo. + 1.55%), 1/15/2030 (n) | | $ | 2,407,803 | $ 2,407,805 |
| ALM Loan Funding, CLO, 2013-7R2A, “A1B2”, FLR, 1.583% (LIBOR - 3mo. + 1.4%), 10/15/2027 (n) | | | 4,410,000 | 4,341,085 |
| Arbor Realty Trust, Inc., CLO, 2020-FL1, “AS”, FLR, 1.524% (LIBOR - 1mo. + 1.4%), 2/15/2035 (n) | | | 1,150,000 | 1,149,954 |
| Arbor Realty Trust, Inc., CLO, 2021-FL1, “AS”, FLR, 1.272% (LIBOR - 1mo. + 1.2%) 12/15/2035 (n) | | | 2,115,000 | 2,115,000 |
| AREIT CRE Trust, 2019-CRE3, “AS”, FLR, 1.424% (LIBOR - 1mo. + 1.3%), 9/14/2036 (n) | | | 3,366,000 | 3,361,823 |
| Avis Budget Rental Car Funding LLC, 2019-1A, “A”, 3.45%, 3/20/2023 (n) | | | 3,880,000 | 3,942,158 |
Portfolio of Investments (unaudited) – continued
| Issuer | | | Shares/Par | Value ($) |
| Bonds – continued |
| Asset-Backed & Securitized – continued |
| Bancorp Commercial Mortgage Trust, 2019-CRE6, “AS”, FLR, 1.424% (LIBOR - 1mo. + 1.3%), 9/15/2036 (n) | | $ | 3,469,924 | $ 3,467,850 |
| Bayview Financial Revolving Mortgage Loan Trust, FLR, 1.695% (LIBOR - 1mo. + 1.6%), 12/28/2040 (n) | | | 902,138 | 970,157 |
| BDS Ltd., 2019-FL4, “A”, FLR, 1.181% (LIBOR - 1mo. + 1.10%), 8/15/2036 (n) | | | 2,416,000 | 2,414,526 |
| BPCRE Holder LLC, FLR, 0.931% (LIBOR - 1mo. + 0.85%), 2/15/2037 (n) | | | 1,310,500 | 1,310,500 |
| BSPRT Issuer Ltd., 2021-FL6, “AS”, FLR, 1.372% (LIBOR - 1mo. + 1.3%), 3/15/2036 (n) | | | 4,964,000 | 4,960,912 |
| Business Jet Securities LLC, 2021-1A, “A”, 2.162%, 4/15/2036 (n) | | | 1,493,686 | 1,505,167 |
| BXMT Ltd., 2021-FL4, “AS”, FLR, 1.372% (LIBOR - 1mo. + 1.3%), 5/15/2038 (n) | | | 5,214,000 | 5,214,020 |
| CHCP 2021-FL1 Ltd., “AS”, FLR, 1.424% (LIBOR - 1mo. + 1.3%) 2/15/2038 (n) | | | 2,203,500 | 2,205,577 |
| Chesapeake Funding II LLC, 2018-1A, “A1”, 3.04%, 4/15/2030 (n) | | | 319,642 | 320,060 |
| Columbia Cent CLO 28 Ltd., “A-2-R”, 1.87%, 11/07/2030 (n) | | | 3,492,733 | 3,492,712 |
| Commercial Mortgage Pass-Through Certificates, 2019-BN17, “A4”, 3.714%, 4/15/2052 | | | 2,789,000 | 3,140,225 |
| Commercial Mortgage Trust, 2015-LC21, “A4”, 3.708%, 7/10/2048 | | | 3,980,975 | 4,346,595 |
| Credit Acceptance Auto Loan Trust, 2021-3A, “B”, 1.38%, 7/15/2030 (n) | | | 1,118,000 | 1,116,380 |
| CSAIL Commercial Mortgage Trust, 2015-C2, “A4”, 3.504%, 6/15/2057 | | | 2,316,427 | 2,500,927 |
| Cutwater Ltd., 2015-1A, “AR”, FLR, 1.404% (LIBOR - 3mo. + 1.22%), 1/15/2029 (n) | | | 3,359,444 | 3,359,515 |
| Dryden Senior Loan Fund, 2013-26A, “AR”, CLO, FLR, 1.084% (LIBOR - 3mo. + 0.9%), 4/15/2029 (n) | | | 2,088,000 | 2,087,829 |
| Dryden Senior Loan Fund, 2018-55A, “A1”, CLO, FLR, 1.203% (LIBOR - 3mo. + 1.02%), 4/15/2031 (n) | | | 4,414,000 | 4,415,673 |
| Exeter Automobile Receivables Trust, 2020-1, 2.26%, 4/15/2024 (n) | | | 702,443 | 705,941 |
| Fort CRE LLC, 2018-1A, “A1”, FLR, 1.445% (LIBOR - 1mo. + 1.35%), 11/16/2035 (n) | | | 1,258,489 | 1,258,489 |
| GLS Auto Receivables Trust, 2020-1A, “A”, 2.17%, 2/15/2024 (n) | | | 348,466 | 350,441 |
| GMAC Mortgage Corp. Loan Trust, FGIC, 5.805%, 10/25/2036 | | | 191,776 | 202,606 |
| Issuer | | | Shares/Par | Value ($) |
| Bonds – continued |
| Asset-Backed & Securitized – continued |
| GS Mortgage Securities Trust, 2015-GC30, “A4”, 3.382%, 5/10/2050 | | $ | 4,243,101 | $ 4,589,201 |
| GS Mortgage Securities Trust, 2019-GSA1, “A4”, 3.047%, 11/10/2052 | | | 2,182,474 | 2,358,379 |
| GS Mortgage Securities Trust, 2020-GC45, “A5”, 2.91%, 2/13/2053 | | | 2,001,659 | 2,145,806 |
| JPMBB Commercial Mortgage Securities Trust, 2014-C26, 3.494%, 1/15/2048 | | | 4,880,000 | 5,267,719 |
| JPMBB Commercial Mortgage Securities Trust, 2015-C28, “A4”, 3.227%, 10/15/2048 | | | 3,256,792 | 3,477,212 |
| KKR Real Estate Financial Trust, Inc., 2018-FL1, “A”, FLR, 1.181% (LIBOR - 1mo. + 1.1%), 6/15/2036 (n) | | | 2,007,207 | 2,007,830 |
| LoanCore Ltd., 2021-CRE5, “AS”, 1.823%, 7/15/2036 (n) | | | 5,288,000 | 5,292,945 |
| MF1 CLO Ltd., 2019-FL2, “A”, FLR, 1.262% (LIBOR - 1mo. + 1.13%), 12/25/2034 (n) | | | 1,556,068 | 1,556,068 |
| MF1 CLO Ltd., 2021-FL5, “AS”, FLR, 1.324% (LIBOR - 1mo. + 1.2%), 7/15/2036 (n) | | | 5,459,500 | 5,454,385 |
| MF1 Multi-Family Housing Mortgage Loan Trust, 2020-FL4, “A”, FLR, 1.824% (LIBOR - 1mo. + 1.7%), 11/15/2035 (n) | | | 1,701,000 | 1,714,818 |
| MidOcean Credit CLO, 2013-2A, “BR”, FLR, 1.853% (LIBOR - 3mo. + 1.65%), 1/29/2030 (n) | | | 3,932,725 | 3,932,863 |
| Morgan Stanley Bank of America Merrill Lynch Trust, 2017-C34, “A4”, 3.536%, 11/15/2052 | | | 1,600,004 | 1,773,934 |
| Morgan Stanley Capital I Trust, 2017-H1, “A5”, 3.53%, 6/15/2050 | | | 1,456,742 | 1,607,721 |
| Neuberger Berman CLO XX, Ltd., 2015-20A, FLR, 1.298% (LIBOR - 3mo. + 1.16%), 7/15/2034 (n) | | | 1,900,000 | 1,901,550 |
| Oaktree CLO Ltd., 2015-1A, “A2AR”, FLR, 1.538% (LIBOR - 3mo. + 1.35%), 10/20/2027 (n) | | | 809,537 | 809,131 |
| PFP III Ltd., 2021-7, “AS”, FLR, 1.222% (LIBOR - 1mo. + 1.15%), 4/14/2038 (n) | | | 3,912,500 | 3,902,766 |
| Ready Capital Mortgage Financing LLC, 2021-FL5, FLR, 1.091% (LIBOR - 1mo. + 1%) 4/25/2038 (n) | | | 3,140,000 | 3,140,980 |
| Residential Funding Mortgage Securities, Inc., FGIC, 4.969%, 12/25/2035 | | | 81,722 | 81,162 |
| Santander Retail Auto Lease Trust, 2020-A, “B”, 1.88%, 3/20/2024 (n) | | | 1,631,000 | 1,663,402 |
| TPG Real Estate Finance, 2021-FL4, “A”, FLR, 1.281% (LIBOR - 1mo. + 1.2%), 3/15/2038 (n) | | | 5,181,500 | 5,186,355 |
Portfolio of Investments (unaudited) – continued
| Issuer | | | Shares/Par | Value ($) |
| Bonds – continued |
| Asset-Backed & Securitized – continued |
| UBS Commercial Mortgage Trust, 2017-C8, “A4”, 3.983%, 2/15/2051 | | $ | 2,950,000 | $ 3,336,149 |
| UBS Commercial Mortgage Trust, 2019-C17, “A4”, 2.921%, 9/15/2052 | | | 2,461,404 | 2,615,703 |
| Verizon Owner Trust, 2020-A, “B”, 1.98%, 7/22/2024 | | | 2,616,000 | 2,685,746 |
| Veros Auto Receivables Trust, 2020-1, “A”, 1.67%, 9/15/2023 (n) | | | 542,187 | 543,506 |
| Wells Fargo Commercial Mortgage Trust, 2015-C28, “A4”, 3.54%, 5/15/2048 | | | 4,315,766 | 4,692,160 |
| Wells Fargo Commercial Mortgage Trust, 2019-C54, “A4”, 3.146%, 12/15/2052 | | | 3,579,870 | 3,894,881 |
| | | | | $142,296,299 |
| Automotive – 0.5% |
| General Motors Co., 6.75%, 4/01/2046 | | $ | 992,000 | $ 1,430,238 |
| Hyundai Capital America, 2.65%, 2/10/2025 (n) | | | 943,000 | 986,357 |
| Hyundai Capital America, 3%, 2/10/2027 (n) | | | 1,959,000 | 2,075,375 |
| Lear Corp., 3.8%, 9/15/2027 | | | 2,187,000 | 2,410,511 |
| Lear Corp., 4.25%, 5/15/2029 | | | 769,000 | 865,602 |
| Magna International, Inc., 2.45%, 6/15/2030 | | | 2,229,000 | 2,277,729 |
| Volkswagen Group of America Finance LLC, 3.35%, 5/13/2025 (n) | | | 3,867,000 | 4,172,909 |
| | | | | $14,218,721 |
| Broadcasting – 0.1% |
| Walt Disney Co., 3.5%, 5/13/2040 | | $ | 1,460,000 | $ 1,627,754 |
| Walt Disney Co., 3.6%, 1/13/2051 | | | 893,000 | 1,012,222 |
| | | | | $2,639,976 |
| Brokerage & Asset Managers – 0.3% |
| E*TRADE Financial Corp., 4.5%, 6/20/2028 | | $ | 975,000 | $ 1,128,830 |
| Intercontinental Exchange, Inc., 2.1%, 6/15/2030 | | | 2,155,000 | 2,139,958 |
| Intercontinental Exchange, Inc., 1.85%, 9/15/2032 | | | 634,000 | 599,997 |
| National Securities Clearing Corp., 1.5%, 4/23/2025 (n) | | | 1,462,000 | 1,490,991 |
| Raymond James Financial, Inc., 4.95%, 7/15/2046 | | | 2,057,000 | 2,658,480 |
| | | | | $8,018,256 |
| Building – 0.3% |
| CRH America Finance, Inc., 4.5%, 4/04/2048 (n) | | $ | 1,146,000 | $ 1,397,403 |
| Martin Marietta Materials, Inc., 3.5%, 12/15/2027 | | | 815,000 | 897,146 |
| Martin Marietta Materials, Inc., 2.5%, 3/15/2030 | | | 223,000 | 226,789 |
| Masco Corp., 2%, 2/15/2031 | | | 4,244,000 | 4,142,751 |
| Issuer | | | Shares/Par | Value ($) |
| Bonds – continued |
| Building – continued |
| Vulcan Materials Co., 3.5%, 6/01/2030 | | $ | 380,000 | $ 418,875 |
| | | | | $7,082,964 |
| Business Services – 0.9% |
| Equinix, Inc., 2.625%, 11/18/2024 | | $ | 2,863,000 | $ 3,012,394 |
| Equinix, Inc., 1.8%, 7/15/2027 | | | 1,829,000 | 1,851,205 |
| Experian Finance PLC, 4.25%, 2/01/2029 (n) | | | 1,699,000 | 1,928,016 |
| Fiserv, Inc., 2.65%, 6/01/2030 | | | 730,000 | 755,825 |
| Fiserv, Inc., 4.4%, 7/01/2049 | | | 1,461,000 | 1,762,203 |
| Global Payments, Inc., 1.2%, 3/01/2026 | | | 2,357,000 | 2,334,490 |
| IHS Markit Ltd., 3.625%, 5/01/2024 | | | 336,000 | 360,766 |
| IHS Markit Ltd., 4.75%, 2/15/2025 (n) | | | 555,000 | 621,322 |
| IHS Markit Ltd., 4%, 3/01/2026 (n) | | | 1,759,000 | 1,949,851 |
| IHS Markit Ltd., 4.25%, 5/01/2029 | | | 795,000 | 919,974 |
| NXP B.V./NXP Funding LLC/NXP USA, Inc., 2.5%, 5/11/2031 (n) | | | 2,212,000 | 2,233,880 |
| NXP B.V./NXP Funding LLC/NXP USA, Inc., 3.25%, 5/11/2041 (n) | | | 1,896,000 | 1,949,410 |
| RELX Capital, Inc., 3%, 5/22/2030 | | | 620,000 | 662,415 |
| Tencent Holdings Ltd., 2.39%, 6/03/2030 (n) | | | 1,814,000 | 1,807,244 |
| Verisk Analytics, Inc., 4.125%, 3/15/2029 | | | 2,176,000 | 2,468,159 |
| Western Union Co., 2.85%, 1/10/2025 | | | 578,000 | 611,064 |
| | | | | $25,228,218 |
| Cable TV – 0.4% |
| Charter Communications Operating LLC/Charter Communications Operating Capital Corp., 6.384%, 10/23/2035 | | $ | 1,053,000 | $ 1,407,510 |
| Charter Communications Operating LLC/Charter Communications Operating Capital Corp., 3.5%, 6/01/2041 | | | 2,122,000 | 2,136,366 |
| Charter Communications Operating LLC/Charter Communications Operating Capital Corp., 5.375%, 5/01/2047 | | | 430,000 | 526,926 |
| Comcast Corp., 2.8%, 1/15/2051 | | | 964,000 | 927,493 |
| Cox Communications, Inc., 1.8%, 10/01/2030 (n) | | | 1,333,000 | 1,270,450 |
| Time Warner Entertainment Co. LP, 8.375%, 7/15/2033 | | | 2,526,000 | 3,827,472 |
| | | | | $10,096,217 |
| Chemicals – 0.1% |
| Sherwin-Williams Co., 2.3%, 5/15/2030 | | $ | 1,590,000 | $ 1,608,431 |
| Sherwin-Williams Co., 4.5%, 6/01/2047 | | | 1,060,000 | 1,325,857 |
| | | | | $2,934,288 |
Portfolio of Investments (unaudited) – continued
| Issuer | | | Shares/Par | Value ($) |
| Bonds – continued |
| Computer Software – 0.1% |
| Dell International LLC/EMC Corp., 4.9%, 10/01/2026 | | $ | 1,640,000 | $ 1,892,698 |
| Microsoft Corp., 2.525%, 6/01/2050 | | | 2,011,000 | 1,975,769 |
| | | | | $3,868,467 |
| Computer Software - Systems – 0.1% |
| Apple, Inc., 3.85%, 5/04/2043 | | $ | 1,148,000 | $ 1,364,212 |
| Conglomerates – 0.4% |
| Carrier Global Corp., 3.377%, 4/05/2040 | | $ | 3,222,000 | $ 3,379,633 |
| Roper Technologies, Inc., 4.2%, 9/15/2028 | | | 791,000 | 909,636 |
| Roper Technologies, Inc., 2.95%, 9/15/2029 | | | 482,000 | 515,352 |
| Roper Technologies, Inc., 2%, 6/30/2030 | | | 1,526,000 | 1,502,729 |
| Westinghouse Air Brake Technologies Corp., 3.2%, 6/15/2025 | | | 808,000 | 859,308 |
| Westinghouse Air Brake Technologies Corp., 4.95%, 9/15/2028 | | | 2,112,000 | 2,449,892 |
| | | | | $9,616,550 |
| Consumer Products – 0.1% |
| Kimberly-Clark Corp., 3.1%, 3/26/2030 | | $ | 252,000 | $ 278,555 |
| Reckitt Benckiser Treasury Services PLC, 2.75%, 6/26/2024 (n) | | | 1,097,000 | 1,158,312 |
| | | | | $1,436,867 |
| Consumer Services – 0.1% |
| Booking Holdings, Inc., 4.625%, 4/13/2030 | | $ | 1,430,000 | $ 1,706,384 |
| Electronics – 0.4% |
| Broadcom Corp./Broadcom Cayman Finance Ltd., 3.5%, 1/15/2028 | | $ | 2,737,000 | $ 3,002,649 |
| Broadcom, Inc., 4.15%, 11/15/2030 | | | 595,000 | 667,242 |
| Broadcom, Inc., 4.3%, 11/15/2032 | | | 1,558,000 | 1,774,134 |
| Broadcom, Inc., 3.469%, 4/15/2034 (n) | | | 1,205,000 | 1,274,594 |
| Intel Corp., 4.75%, 3/25/2050 | | | 2,141,000 | 2,844,148 |
| | | | | $9,562,767 |
| Energy - Independent – 0.0% |
| Diamondback Energy, Inc., 4.4%, 3/24/2051 | | $ | 360,000 | $ 405,322 |
| Energy - Integrated – 0.2% |
| Cenovus Energy, Inc., 5.375%, 7/15/2025 | | $ | 912,000 | $ 1,043,358 |
| Eni S.p.A., 4.75%, 9/12/2028 (n) | | | 1,944,000 | 2,276,281 |
| Total Capital International S.A., 3.127%, 5/29/2050 | | | 1,732,000 | 1,755,688 |
| | | | | $5,075,327 |
| Issuer | | | Shares/Par | Value ($) |
| Bonds – continued |
| Financial Institutions – 0.3% |
| AerCap Ireland Capital DAC, 4.875%, 1/16/2024 | | $ | 362,000 | $ 394,088 |
| AerCap Ireland Capital DAC, 3.65%, 7/21/2027 | | | 2,329,000 | 2,488,030 |
| Avolon Holdings Funding Ltd., 4.375%, 5/01/2026 (n) | | | 682,000 | 741,327 |
| Avolon Holdings Funding Ltd., 3.25%, 2/15/2027 (n) | | | 1,024,000 | 1,055,756 |
| Park Aerospace Holdings Ltd., 5.5%, 2/15/2024 (n) | | | 2,285,000 | 2,511,909 |
| | | | | $7,191,110 |
| Food & Beverages – 0.6% |
| Anheuser-Busch InBev S.A., 8%, 11/15/2039 | | $ | 2,950,000 | $ 4,797,939 |
| Constellation Brands, Inc., 3.5%, 5/09/2027 | | | 2,322,000 | 2,555,392 |
| Diageo Capital PLC, 2.375%, 10/24/2029 | | | 2,618,000 | 2,710,025 |
| General Mills, Inc., 4%, 4/17/2025 | | | 2,134,000 | 2,364,530 |
| General Mills, Inc., 2.875%, 4/15/2030 | | | 435,000 | 460,802 |
| Keurig Dr Pepper, Inc., 3.2%, 5/01/2030 | | | 357,000 | 385,890 |
| Keurig Dr Pepper, Inc., 3.8%, 5/01/2050 | | | 732,000 | 824,906 |
| PepsiCo, Inc., 3.5%, 3/19/2040 | | | 567,000 | 647,505 |
| | | | | $14,746,989 |
| Gaming & Lodging – 0.3% |
| GLP Capital LP/GLP Financing II, Inc., 5.3%, 1/15/2029 | | $ | 1,593,000 | $ 1,855,845 |
| Las Vegas Sands Corp., 3.9%, 8/08/2029 | | | 918,000 | 977,314 |
| Marriott International, Inc., 4%, 4/15/2028 | | | 1,950,000 | 2,142,988 |
| Marriott International, Inc., 4.625%, 6/15/2030 | | | 1,979,000 | 2,279,219 |
| Marriott International, Inc., 2.85%, 4/15/2031 | | | 7,000 | 7,108 |
| | | | | $7,262,474 |
| Insurance – 0.0% |
| AIA Group Ltd., 3.375%, 4/07/2030 (n) | | $ | 731,000 | $ 805,290 |
| Insurance - Health – 0.0% |
| UnitedHealth Group, Inc., 3.5%, 8/15/2039 | | $ | 732,000 | $ 818,076 |
| Insurance - Property & Casualty – 0.5% |
| American International Group, Inc., 4.875%, 6/01/2022 | | $ | 3,154,000 | $ 3,283,072 |
| American International Group, Inc., 4.125%, 2/15/2024 | | | 2,315,000 | 2,520,795 |
| Aon Corp., 3.75%, 5/02/2029 | | | 4,102,000 | 4,615,836 |
| Hartford Financial Services Group, Inc., 3.6%, 8/19/2049 | | | 914,000 | 1,002,143 |
| Liberty Mutual Group, Inc., 3.951%, 10/15/2050 (n) | | | 1,087,000 | 1,210,813 |
Portfolio of Investments (unaudited) – continued
| Issuer | | | Shares/Par | Value ($) |
| Bonds – continued |
| Insurance - Property & Casualty – continued |
| Marsh & McLennan Cos., Inc., 4.75%, 3/15/2039 | | $ | 832,000 | $ 1,062,367 |
| | | | | $13,695,026 |
| International Market Quasi-Sovereign – 0.2% |
| Temasek Financial I Ltd. (Republic of Singapore), 2.375%, 1/23/2023 (n) | | $ | 6,400,000 | $ 6,591,488 |
| Machinery & Tools – 0.1% |
| CNH Industrial Capital LLC, 4.2%, 1/15/2024 | | $ | 1,679,000 | $ 1,816,817 |
| CNH Industrial Capital LLC, 1.875%, 1/15/2026 | | | 448,000 | 455,596 |
| | | | | $2,272,413 |
| Major Banks – 1.5% |
| Bank of America Corp., 3.366% to 1/23/2025, FLR (LIBOR - 3mo. + 0.81%) to 1/23/2026 | | $ | 1,626,000 | $ 1,753,145 |
| Bank of America Corp., 3.5%, 4/19/2026 | | | 1,361,000 | 1,499,358 |
| Bank of America Corp., 2.676% to 6/19/2040, FLR (SOFR + 1.93%) to 6/19/2041 | | | 1,986,000 | 1,927,411 |
| Credit Suisse Group AG, 3.091% to 5/14/2031, FLR (SOFR + 1.73%) to 5/14/2032 (n) | | | 399,000 | 411,070 |
| Goldman Sachs Group, Inc., 2.6%, 2/07/2030 | | | 6,003,000 | 6,229,198 |
| HSBC Holdings PLC, 4% to 9/09/2026, FLR (CMT - 1yr. + 3.222%) to 9/09/2169 | | | 442,000 | 449,182 |
| HSBC Holdings PLC, 4.7% to 9/09/2031, FLR (CMT - 1yr. + 3.25%) to 9/09/2169 | | | 1,122,000 | 1,164,075 |
| JPMorgan Chase & Co., 3.782% to 2/01/2027, FLR (LIBOR - 3mo. + 1.337%) to 2/01/2028 | | | 3,707,000 | 4,116,441 |
| JPMorgan Chase & Co., 2.739% to 10/15/2029, FLR (SOFR + 1.51%) to 10/15/2030 | | | 1,052,000 | 1,101,030 |
| JPMorgan Chase & Co., 2.956% to 5/13/2030, FLR (SOFR + 2.515%) to 5/13/2031 | | | 558,000 | 586,183 |
| JPMorgan Chase & Co., 3.109% to 4/22/2040, FLR (SOFR + 2.46%) to 4/22/2041 | | | 2,876,000 | 2,983,686 |
| JPMorgan Chase & Co., 3.897% to 1/23/2048, FLR (LIBOR - 3mo. + 1.22%) to 1/23/2049 | | | 1,100,000 | 1,278,326 |
| Morgan Stanley, 3.875%, 4/29/2024 | | | 1,358,000 | 1,476,993 |
| Morgan Stanley, 4%, 7/23/2025 | | | 1,063,000 | 1,182,328 |
| Morgan Stanley, 2.699% to 1/22/2030, FLR (SOFR + 1.143%) to 1/22/2031 | | | 6,047,000 | 6,330,015 |
| PNC Bank N.A., 2.7%, 10/22/2029 | | | 835,000 | 884,155 |
| Royal Bank of Canada, 1.15%, 6/10/2025 | | | 2,774,000 | 2,788,816 |
| Issuer | | | Shares/Par | Value ($) |
| Bonds – continued |
| Major Banks – continued |
| State Street Corp., 2.901% to 3/30/2025, FLR (SOFR + 2.6%) to 3/30/2026 | | $ | 404,000 | $ 431,350 |
| UBS Group AG, 2.095% to 2/11/2031, FLR (CMT - 1yr. + 1.0%) to 2/11/2032 (n) | | | 3,816,000 | 3,738,275 |
| | | | | $40,331,037 |
| Medical & Health Technology & Services – 0.6% |
| Alcon, Inc., 2.6%, 5/27/2030 (n) | | $ | 302,000 | $ 308,409 |
| Alcon, Inc., 3.8%, 9/23/2049 (n) | | | 1,564,000 | 1,738,000 |
| Becton, Dickinson and Co., 4.669%, 6/06/2047 | | | 1,805,000 | 2,248,675 |
| Cigna Corp., 3.2%, 3/15/2040 | | | 556,000 | 577,091 |
| HCA, Inc., 4.125%, 6/15/2029 | | | 2,120,000 | 2,387,282 |
| HCA, Inc., 5.125%, 6/15/2039 | | | 2,264,000 | 2,828,023 |
| Laboratory Corp. of America Holdings, 4.7%, 2/01/2045 | | | 1,404,000 | 1,682,971 |
| Northwell Healthcare, Inc., 3.979%, 11/01/2046 | | | 153,000 | 173,209 |
| Northwell Healthcare, Inc., 4.26%, 11/01/2047 | | | 1,205,000 | 1,420,814 |
| Thermo Fisher Scientific, Inc., 2.95%, 9/19/2026 | | | 1,174,000 | 1,265,993 |
| Thermo Fisher Scientific, Inc., 3.2%, 8/15/2027 | | | 2,267,000 | 2,475,263 |
| | | | | $17,105,730 |
| Medical Equipment – 0.3% |
| Boston Scientific Corp., 3.75%, 3/01/2026 | | $ | 2,370,000 | $ 2,627,818 |
| Boston Scientific Corp., 2.65%, 6/01/2030 | | | 1,590,000 | 1,644,552 |
| Zimmer Biomet Holdings, Inc., 3.55%, 4/01/2025 | | | 2,600,000 | 2,820,751 |
| | | | | $7,093,121 |
| Metals & Mining – 0.3% |
| Anglo American Capital PLC, 5.625%, 4/01/2030 (n) | | $ | 1,394,000 | $ 1,705,594 |
| Anglo American Capital PLC, 2.625%, 9/10/2030 (n) | | | 2,667,000 | 2,677,088 |
| Glencore Funding LLC, 4.125%, 5/30/2023 (n) | | | 1,244,000 | 1,323,164 |
| Glencore Funding LLC, 2.5%, 9/01/2030 (n) | | | 1,695,000 | 1,690,858 |
| Glencore Funding LLC, 2.85%, 4/27/2031 (n) | | | 709,000 | 721,007 |
| | | | | $8,117,711 |
| Midstream – 0.6% |
| Cheniere Corpus Christi Holdings LLC, 3.7%, 11/15/2029 | | $ | 1,833,000 | $ 2,002,153 |
| Enbridge, Inc., 2.5%, 1/15/2025 | | | 969,000 | 1,015,189 |
| Enterprise Products Operating LLC, 4.2%, 1/31/2050 | | | 774,000 | 892,733 |
| Galaxy Pipeline Assets Bidco Ltd., 2.16%, 3/31/2034 (n) | | | 2,495,000 | 2,448,341 |
| Kinder Morgan Energy Partners LP, 4.15%, 2/01/2024 | | | 1,207,000 | 1,303,281 |
Portfolio of Investments (unaudited) – continued
| Issuer | | | Shares/Par | Value ($) |
| Bonds – continued |
| Midstream – continued |
| ONEOK, Inc., 4.95%, 7/13/2047 | | $ | 2,331,000 | $ 2,735,640 |
| Plains All American Pipeline LP, 3.8%, 9/15/2030 | | | 1,881,000 | 2,012,779 |
| Sabine Pass Liquefaction LLC, 5%, 3/15/2027 | | | 1,561,000 | 1,802,552 |
| Sabine Pass Liquefaction LLC, 4.5%, 5/15/2030 | | | 512,000 | 590,875 |
| Spectra Energy Partners LP, 3.375%, 10/15/2026 | | | 828,000 | 900,047 |
| | | | | $15,703,590 |
| Mortgage-Backed – 10.7% | |
| Fannie Mae, 6%, 7/01/2021-7/01/2037 | | $ | 3,316,295 | $ 3,834,169 |
| Fannie Mae, 5.5%, 5/01/2022-4/01/2040 | | | 6,115,773 | 6,977,662 |
| Fannie Mae, 5%, 12/01/2023-3/01/2041 | | | 2,453,818 | 2,787,214 |
| Fannie Mae, 3.5%, 5/25/2025-7/01/2046 | | | 15,319,478 | 16,515,906 |
| Fannie Mae, 2.7%, 7/01/2025 | | | 367,000 | 392,542 |
| Fannie Mae, 2.563%, 12/25/2026 | | | 1,473,827 | 1,580,101 |
| Fannie Mae, 3%, 11/01/2028-9/01/2046 | | | 5,044,989 | 5,335,680 |
| Fannie Mae, 6.5%, 6/01/2031-7/01/2037 | | | 1,041,378 | 1,196,425 |
| Fannie Mae, 2.5%, 11/01/2031 | | | 94,365 | 98,877 |
| Fannie Mae, 3%, 2/25/2033 (i) | | | 417,062 | 40,701 |
| Fannie Mae, 4.5%, 8/01/2033-6/01/2044 | | | 5,870,229 | 6,517,410 |
| Fannie Mae, 3.25%, 5/25/2040 | | | 153,167 | 165,550 |
| Fannie Mae, 4%, 9/01/2040-6/01/2047 | | | 10,677,055 | 11,651,537 |
| Fannie Mae, 2%, 10/25/2040-4/25/2046 | | | 567,634 | 579,329 |
| Fannie Mae, 4%, 7/25/2046 (i) | | | 388,087 | 73,090 |
| Fannie Mae, UMBS, 2.5%, 2/01/2050-7/01/2050 | | | 3,055,085 | 3,191,145 |
| Fannie Mae, UMBS, 2%, 1/01/2051-2/01/2051 | | | 540,243 | 547,196 |
| Freddie Mac, 6%, 10/01/2021-6/01/2037 | | | 1,127,097 | 1,311,793 |
| Freddie Mac, 5%, 12/01/2021-1/15/2040 | | | 1,375,587 | 1,571,565 |
| Freddie Mac, 2.791%, 1/25/2022 | | | 1,383,391 | 1,396,165 |
| Freddie Mac, 2.51%, 11/25/2022 | | | 1,503,000 | 1,542,346 |
| Freddie Mac, 3.111%, 2/25/2023 | | | 2,136,000 | 2,221,729 |
| Freddie Mac, 3.32%, 2/25/2023 | | | 745,000 | 777,298 |
| Freddie Mac, 3.25%, 4/25/2023 | | | 2,474,000 | 2,583,552 |
| Freddie Mac, 3.06%, 7/25/2023 | | | 175,000 | 183,527 |
| Freddie Mac, 3.458%, 8/25/2023 | | | 1,642,000 | 1,737,800 |
| Freddie Mac, 1.016%, 4/25/2024 (i) | | | 5,258,067 | 99,762 |
| Freddie Mac, 0.633%, 7/25/2024 (i) | | | 14,179,000 | 218,999 |
| Freddie Mac, 0.732%, 7/25/2024 (i) | | | 5,035,705 | 69,217 |
| Freddie Mac, 4.5%, 8/01/2024-5/01/2042 | | | 1,091,746 | 1,203,124 |
| Freddie Mac, 0.431%, 8/25/2024 (i) | | | 15,246,000 | 172,236 |
| Freddie Mac, 0.526%, 8/25/2024 (i) | | | 27,436,711 | 286,294 |
| Freddie Mac, 3.064%, 8/25/2024 | | | 794,000 | 845,094 |
| Issuer | | | Shares/Par | Value ($) |
| Bonds – continued |
| Mortgage-Backed – continued | |
| Freddie Mac, 0.482%, 10/25/2024 (i) | | $ | 18,981,488 | $ 188,410 |
| Freddie Mac, 3.171%, 10/25/2024 | | | 1,304,000 | 1,403,211 |
| Freddie Mac, 0.401%, 11/25/2024 (i) | | | 15,385,000 | 148,496 |
| Freddie Mac, 2.67%, 12/25/2024 | | | 1,561,000 | 1,657,775 |
| Freddie Mac, 3.329%, 5/25/2025 | | | 2,660,000 | 2,895,999 |
| Freddie Mac, 3.01%, 7/25/2025 | | | 423,000 | 456,568 |
| Freddie Mac, 3.151%, 11/25/2025 | | | 1,001,000 | 1,090,793 |
| Freddie Mac, 0.773%, 6/25/2027 (i) | | | 13,682,000 | 520,619 |
| Freddie Mac, 0.887%, 6/25/2027 (i) | | | 4,672,706 | 185,679 |
| Freddie Mac, 3.117%, 6/25/2027 | | | 1,114,000 | 1,229,349 |
| Freddie Mac, 0.71%, 7/25/2027 (i) | | | 12,022,040 | 385,971 |
| Freddie Mac, 0.46%, 8/25/2027 (i) | | | 9,650,000 | 209,018 |
| Freddie Mac, 0.562%, 8/25/2027 (i) | | | 6,653,727 | 165,187 |
| Freddie Mac, 0.406%, 9/25/2027 (i) | | | 10,419,000 | 195,149 |
| Freddie Mac, 3.187%, 9/25/2027 | | | 754,000 | 837,795 |
| Freddie Mac, 0.325%, 11/25/2027 (i) | | | 16,290,000 | 227,824 |
| Freddie Mac, 0.417%, 11/25/2027 (i) | | | 11,605,660 | 198,869 |
| Freddie Mac, 0.455%, 11/25/2027 (i) | | | 10,398,341 | 209,035 |
| Freddie Mac, 0.371%, 12/25/2027 (i) | | | 10,109,000 | 174,028 |
| Freddie Mac, 0.413%, 12/25/2027 (i) | | | 11,210,000 | 221,543 |
| Freddie Mac, 0.493%, 12/25/2027 (i) | | | 17,757,084 | 393,016 |
| Freddie Mac, 3.65%, 2/25/2028 | | | 904,000 | 1,033,198 |
| Freddie Mac, 3.9%, 4/25/2028 | | | 1,667,000 | 1,931,706 |
| Freddie Mac, 1.218%, 7/25/2029 (i) | | | 829,541 | 65,384 |
| Freddie Mac, 1.268%, 8/25/2029 (i) | | | 5,217,532 | 431,675 |
| Freddie Mac, 1.915%, 4/25/2030 (i) | | | 900,000 | 129,690 |
| Freddie Mac, 1.984%, 4/25/2030 (i) | | | 2,701,417 | 406,647 |
| Freddie Mac, 1.765%, 5/25/2030 (i) | | | 1,301,002 | 175,511 |
| Freddie Mac, 1.906%, 5/25/2030 (i) | | | 3,334,078 | 486,181 |
| Freddie Mac, 1.436%, 6/25/2030 (i) | | | 1,327,631 | 147,088 |
| Freddie Mac, 1.704%, 8/25/2030 (i) | | | 1,191,673 | 158,785 |
| Freddie Mac, 1.262%, 9/25/2030 (i) | | | 775,587 | 76,777 |
| Freddie Mac, 1.172%, 11/25/2030 (i) | | | 1,356,411 | 125,951 |
| Freddie Mac, 0.423%, 1/25/2031 (i) | | | 5,332,445 | 147,467 |
| Freddie Mac, 0.873%, 1/25/2031 (i) | | | 2,233,850 | 154,865 |
| Freddie Mac, 1.026%, 1/25/2031 (i) | | | 1,493,151 | 121,917 |
| Freddie Mac, 0.625%, 3/25/2031 (i) | | | 4,318,725 | 195,517 |
| Freddie Mac, 0.837%, 3/25/2031 (i) | | | 1,837,683 | 123,509 |
| Freddie Mac, 1.224%, 5/25/2031 (i) | | | 822,353 | 90,528 |
| Freddie Mac, 0.442%, 11/25/2032 (i) | | | 8,669,673 | 241,434 |
| Freddie Mac, 5.5%, 12/01/2033-2/01/2037 | | | 985,894 | 1,127,367 |
| Freddie Mac, 6.5%, 5/01/2034-7/01/2037 | | | 614,611 | 696,898 |
| Freddie Mac, 5.5%, 2/15/2036 (i) | | | 82,326 | 15,079 |
| Freddie Mac, 4%, 8/01/2037-8/01/2047 | | | 5,366,087 | 5,832,593 |
| Freddie Mac, 3.5%, 11/01/2037-10/25/2058 | | | 10,545,720 | 11,367,713 |
| Freddie Mac, 3%, 1/01/2038-2/25/2059 | | | 12,403,168 | 13,206,228 |
| Freddie Mac, 4.5%, 12/15/2040 (i) | | | 78,042 | 7,359 |
| Freddie Mac, 4%, 8/15/2044 (i) | | | 106,255 | 12,457 |
| Freddie Mac, UMBS, 6.5%, 10/01/2034 | | | 33,391 | 38,165 |
| Freddie Mac, UMBS, 5%, 10/01/2035 | | | 199,119 | 228,084 |
Portfolio of Investments (unaudited) – continued
| Issuer | | | Shares/Par | Value ($) |
| Bonds – continued |
| Mortgage-Backed – continued | |
| Freddie Mac, UMBS, 6%, 1/01/2036-3/01/2036 | | $ | 90,404 | $ 102,135 |
| Freddie Mac, UMBS, 3%, 7/01/2050 | | | 104,284 | 111,035 |
| Ginnie Mae, 6%, 9/15/2032-1/15/2038 | | | 1,336,267 | 1,567,384 |
| Ginnie Mae, 5.5%, 5/15/2033-10/15/2035 | | | 811,331 | 940,845 |
| Ginnie Mae, 4.5%, 7/20/2033-9/20/2041 | | | 1,951,987 | 2,203,573 |
| Ginnie Mae, 5%, 7/20/2033-12/15/2034 | | | 266,755 | 308,198 |
| Ginnie Mae, 4%, 1/20/2041-2/20/2042 | | | 2,123,262 | 2,323,576 |
| Ginnie Mae, 3.5%, 12/15/2041-3/20/2048 | | | 5,549,567 | 5,958,458 |
| Ginnie Mae, 3%, 4/20/2045-6/20/2051 | | | 10,447,748 | 10,988,378 |
| Ginnie Mae, 2.5%, 6/20/2051-7/20/2051 | | | 6,775,000 | 7,025,044 |
| Ginnie Mae, 0.56%, 2/16/2059 (i) | | | 3,425,789 | 148,424 |
| Ginnie Mae, TBA, 2.5%, 7/15/2051 | | | 6,000,000 | 6,209,063 |
| Ginnie Mae, TBA, 3.5%, 7/15/2051 | | | 4,300,000 | 4,513,908 |
| Ginnie Mae, TBA, 4%, 7/15/2051 | | | 1,425,000 | 1,504,767 |
| Ginnie Mae, TBA, 2%, 7/21/2051 | | | 1,875,000 | 1,909,570 |
| Ginnie Mae, TBA, 3%, 7/21/2051 | | | 2,825,000 | 2,947,545 |
| UMBS, TBA, 3%, 7/19/2036-8/12/2051 | | | 14,375,000 | 14,985,050 |
| UMBS, TBA, 1.5%, 7/25/2036-8/17/2036 | | | 4,975,000 | 5,030,868 |
| UMBS, TBA, 2%, 7/25/2036-8/12/2051 | | | 50,650,000 | 51,169,361 |
| UMBS, TBA, 2.5%, 7/25/2036-8/25/2051 | | | 33,450,000 | 34,643,761 |
| UMBS, TBA, 4%, 7/25/2051 | | | 975,000 | 1,038,223 |
| | | | | $285,104,308 |
| Municipals – 0.4% |
| New Jersey Economic Development Authority State Pension Funding Rev., “A”, NPFG, 7.425%, 2/15/2029 | | $ | 2,750,000 | $ 3,566,316 |
| New Jersey Turnpike Authority Rev. (Build America Bonds), “F”, 7.414%, 1/01/2040 | | | 3,685,000 | 6,050,596 |
| State of Florida, “A”, 2.154%, 7/01/2030 | | | 1,437,000 | 1,465,055 |
| | | | | $11,081,967 |
| Natural Gas - Distribution – 0.0% |
| NiSource, Inc., 5.65%, 2/01/2045 | | $ | 486,000 | $ 669,853 |
| Natural Gas - Pipeline – 0.1% |
| APT Pipelines Ltd., 4.2%, 3/23/2025 (n) | | $ | 3,344,000 | $ 3,667,122 |
| APT Pipelines Ltd., 4.25%, 7/15/2027 (n) | | | 253,000 | 285,716 |
| | | | | $3,952,838 |
| Issuer | | | Shares/Par | Value ($) |
| Bonds – continued |
| Network & Telecom – 0.4% |
| AT&T, Inc., 2.75%, 6/01/2031 | | $ | 2,106,000 | $ 2,189,163 |
| AT&T, Inc., 3.65%, 9/15/2059 (n) | | | 1,786,000 | 1,811,180 |
| Verizon Communications, Inc., 2.1%, 3/22/2028 | | | 273,000 | 278,710 |
| Verizon Communications, Inc., 3.15%, 3/22/2030 | | | 1,053,000 | 1,136,999 |
| Verizon Communications, Inc., 2.55%, 3/21/2031 | | | 512,000 | 523,328 |
| Verizon Communications, Inc., 4.272%, 1/15/2036 | | | 1,477,000 | 1,757,372 |
| Verizon Communications, Inc., 4.812%, 3/15/2039 | | | 1,877,000 | 2,377,554 |
| | | | | $10,074,306 |
| Oils – 0.3% |
| Marathon Petroleum Corp., 4.75%, 9/15/2044 | | $ | 1,114,000 | $ 1,316,231 |
| Phillips 66 Co., 2.15%, 12/15/2030 | | | 3,438,000 | 3,379,778 |
| Valero Energy Corp., 4.9%, 3/15/2045 | | | 516,000 | 644,795 |
| Valero Energy, Corp., 6.625%, 6/15/2037 | | | 2,124,000 | 2,911,757 |
| | | | | $8,252,561 |
| Other Banks & Diversified Financials – 0.4% |
| BBVA Bancomer S.A. de C.V., 6.75%, 9/30/2022 (n) | | $ | 2,890,000 | $ 3,068,602 |
| Branch Banking & Trust Co., 2.25%, 3/11/2030 | | | 2,707,000 | 2,746,286 |
| Capital One Financial Corp., 3.75%, 3/09/2027 | | | 1,728,000 | 1,919,931 |
| Citigroup, Inc., 2.666% to 1/29/2030, FLR (SOFR + 1.146%) to 1/29/2031 | | | 2,869,000 | 2,960,897 |
| | | | | $10,695,716 |
| Pollution Control – 0.1% |
| Republic Services, Inc., 3.95%, 5/15/2028 | | $ | 1,245,000 | $ 1,416,298 |
| Republic Services, Inc., 1.45%, 2/15/2031 | | | 998,000 | 934,982 |
| | | | | $2,351,280 |
| Real Estate - Office – 0.0% |
| Boston Properties, Inc., REIT, 2.55%, 4/01/2032 | | $ | 1,316,000 | $ 1,324,157 |
| Real Estate - Other – 0.0% |
| Prologis LP, REIT, 2.25%, 4/15/2030 | | $ | 717,000 | $ 732,344 |
| Real Estate - Retail – 0.1% |
| Brixmor Operating Partnership LP, REIT, 4.125%, 5/15/2029 | | $ | 172,000 | $ 192,697 |
| Brixmor Operating Partnership LP, REIT, 4.05%, 7/01/2030 | | | 1,681,000 | 1,880,800 |
| Realty Income Corp., REIT, 3.25%, 1/15/2031 | | | 569,000 | 619,891 |
| | | | | $2,693,388 |
Portfolio of Investments (unaudited) – continued
| Issuer | | | Shares/Par | Value ($) |
| Bonds – continued |
| Retailers – 0.3% |
| Alimentation Couche-Tard, Inc., 3.439%, 5/13/2041 (n) | | $ | 2,106,000 | $ 2,174,369 |
| Amazon.com, Inc., 2.5%, 6/03/2050 | | | 1,592,000 | 1,504,284 |
| Best Buy Co., Inc., 4.45%, 10/01/2028 | | | 2,037,000 | 2,366,544 |
| Home Depot, Inc., 3.9%, 6/15/2047 | | | 1,113,000 | 1,321,101 |
| | | | | $7,366,298 |
| Specialty Stores – 0.0% |
| TJX Cos., Inc., 3.875%, 4/15/2030 | | $ | 453,000 | $ 519,258 |
| Telecommunications - Wireless – 0.6% |
| American Tower Corp., REIT, 3%, 6/15/2023 | | $ | 938,000 | $ 983,022 |
| American Tower Corp., REIT, 3.6%, 1/15/2028 | | | 1,138,000 | 1,251,675 |
| American Tower Corp., REIT, 3.1%, 6/15/2050 | | | 1,568,000 | 1,531,909 |
| American Tower Trust I, REIT, 3.07%, 3/15/2048 (n) | | | 3,121,000 | 3,136,182 |
| Crown Castle International Corp., 1.35%, 7/15/2025 | | | 701,000 | 705,771 |
| Crown Castle International Corp., 3.65%, 9/01/2027 | | | 2,565,000 | 2,828,152 |
| T-Mobile USA, Inc., 2.05%, 2/15/2028 | | | 1,892,000 | 1,920,702 |
| T-Mobile USA, Inc., 4.5%, 4/15/2050 | | | 2,244,000 | 2,672,005 |
| | | | | $15,029,418 |
| Telephone Services – 0.1% |
| Deutsche Telekom AG, 3.625%, 1/21/2050 (n) | | $ | 1,281,000 | $ 1,352,318 |
| Transportation - Services – 0.1% |
| ERAC USA Finance LLC, 7%, 10/15/2037 (n) | | $ | 1,826,000 | $ 2,724,154 |
| U.S. Government Agencies and Equivalents – 0.0% |
| Small Business Administration, 4.35%, 7/01/2023 | | $ | 873 | $ 897 |
| Small Business Administration, 4.77%, 4/01/2024 | | | 56,280 | 58,526 |
| Small Business Administration, 5.18%, 5/01/2024 | | | 74,900 | 78,910 |
| Small Business Administration, 5.52%, 6/01/2024 | | | 4,638 | 4,869 |
| Small Business Administration, 4.99%, 9/01/2024 | | | 105,202 | 109,732 |
| Small Business Administration, 4.95%, 3/01/2025 | | | 3,809 | 3,980 |
| Small Business Administration, 5.11%, 8/01/2025 | | | 359,708 | 380,835 |
| | | | | $637,749 |
| Issuer | | | Shares/Par | Value ($) |
| Bonds – continued |
| U.S. Treasury Obligations – 10.1% |
| U.S. Treasury Bonds, 1.375%, 11/15/2040 | | $ | 5,500,000 | $ 4,940,547 |
| U.S. Treasury Bonds, 2.875%, 5/15/2043 | | | 9,096,000 | 10,461,111 |
| U.S. Treasury Bonds, 2.5%, 2/15/2045 | �� | | 9,797,000 | 10,599,895 |
| U.S. Treasury Bonds, 3%, 11/15/2045 | | | 3,638,000 | 4,301,224 |
| U.S. Treasury Bonds, 3%, 2/15/2048 | | | 8,760,000 | 10,442,194 |
| U.S. Treasury Bonds, 2.875%, 5/15/2049 | | | 900,000 | 1,053,879 |
| U.S. Treasury Bonds, 2.375%, 11/15/2049 | | | 30,365,000 | 32,333,980 |
| U.S. Treasury Notes, 0.125%, 12/31/2022 | | | 48,500,000 | 48,458,320 |
| U.S. Treasury Notes, 1.375%, 1/31/2025 | | | 70,000,000 | 71,922,266 |
| U.S. Treasury Notes, 0.375%, 11/30/2025 | | | 76,500,000 | 75,122,402 |
| | | | | $269,635,818 |
| Utilities - Electric Power – 0.8% |
| Berkshire Hathaway Energy Co., 4.25%, 10/15/2050 | | $ | 257,000 | $ 312,839 |
| Duke Energy Corp., 2.65%, 9/01/2026 | | | 345,000 | 364,063 |
| Enel Finance International N.V., 2.65%, 9/10/2024 | | | 1,020,000 | 1,072,167 |
| Enel Finance International N.V., 4.875%, 6/14/2029 (n) | | | 1,916,000 | 2,286,583 |
| Enel Finance International N.V., 4.75%, 5/25/2047 (n) | | | 392,000 | 481,279 |
| Evergy, Inc., 2.9%, 9/15/2029 | | | 1,644,000 | 1,742,174 |
| Exelon Corp., 4.05%, 4/15/2030 | | | 1,913,000 | 2,178,786 |
| FirstEnergy Corp., 3.4%, 3/01/2050 | | | 1,078,000 | 1,053,745 |
| Georgia Power Co., 3.7%, 1/30/2050 | | | 147,000 | 159,642 |
| Jersey Central Power & Light Co., 4.3%, 1/15/2026 (n) | | | 1,333,000 | 1,475,318 |
| Jersey Central Power & Light Co., 2.75%, 3/01/2032 (n) | | | 738,000 | 749,137 |
| Northern States Power Co., 2.6%, 6/01/2051 | | | 1,912,000 | 1,816,036 |
| Oncor Electric Delivery Co. LLC, 5.75%, 3/15/2029 | | | 2,486,000 | 3,123,778 |
| Pacific Gas & Electric Co., 2.1%, 8/01/2027 | | | 480,000 | 466,168 |
| Pacific Gas & Electric Co., 3%, 6/15/2028 | | | 1,410,000 | 1,416,342 |
| Pacific Gas & Electric Co., 3.3%, 8/01/2040 | | | 926,000 | 836,246 |
| Xcel Energy, Inc., 3.4%, 6/01/2030 | | | 968,000 | 1,061,059 |
| Xcel Energy, Inc., 3.5%, 12/01/2049 | | | 1,154,000 | 1,245,355 |
| | | | | $21,840,717 |
| Utilities - Gas – 0.0% |
| East Ohio Gas Co., 2%, 6/15/2030 (n) | | $ | 1,330,000 | $ 1,314,851 |
| Total Bonds (Identified Cost, $1,008,378,934) | | $ 1,051,495,908 |
Portfolio of Investments (unaudited) – continued
| Issuer | | | Shares/Par | Value ($) |
| Convertible Preferred Stocks – 1.2% |
| Automotive – 0.3% | |
| Aptiv PLC, 5.5% | | 39,000 | $ 6,973,980 |
| Medical Equipment – 0.4% | |
| Boston Scientific Corp., 5.5% | | 66,836 | $ 7,756,986 |
| Danaher Corp., 4.75% | | 1,324 | 2,381,360 |
| | | | | $10,138,346 |
| Telecommunications - Wireless – 0.2% | |
| T-Mobile USA, Inc., 5.25% | | 5,432 | $ 6,844,157 |
| Utilities - Electric Power – 0.3% | |
| CenterPoint Energy, Inc., 7% | | 162,120 | $ 7,347,278 |
| Total Convertible Preferred Stocks (Identified Cost, $25,680,393) | $ 31,303,761 |
| Issuer | | | Shares/Par | Value ($) |
| Preferred Stocks – 0.3% |
| Computer Software - Systems – 0.3% | | | | |
| Samsung Electronics Co. Ltd. (Identified Cost, $4,011,179) | | 108,944 | $ 7,129,754 |
| Investment Companies (h) – 5.6% |
| Money Market Funds – 5.6% | |
| MFS Institutional Money Market Portfolio, 0.02% (v) (Identified Cost, $150,704,645) | | | 150,704,645 | $ 150,704,645 |
| Other Assets, Less Liabilities – (4.2)% | | (111,578,507) |
| Net Assets – 100.0% | $ 2,675,191,305 |
| (a) | Non-income producing security. | | | |
| (h) | An affiliated issuer, which may be considered one in which the fund owns 5% or more of the outstanding voting securities, or a company which is under common control. At period end, the aggregate values of the fund's investments in affiliated issuers and in unaffiliated issuers were $150,704,645 and $2,636,065,167, respectively. | | | |
| (i) | Interest only security for which the fund receives interest on notional principal (Par amount). Par amount shown is the notional principal and does not reflect the cost of the security. | | | |
| (n) | Securities exempt from registration under Rule 144A of the Securities Act of 1933. These securities may be sold in the ordinary course of business in transactions exempt from registration, normally to qualified institutional buyers. At period end, the aggregate value of these securities was $175,582,058, representing 6.6% of net assets. | | | |
| (v) | Affiliated issuer that is available only to investment companies managed by MFS. The rate quoted for the MFS Institutional Money Market Portfolio is the annualized seven-day yield of the fund at period end. | | | |
| The following abbreviations are used in this report and are defined: |
| ADR | American Depositary Receipt |
| CLO | Collateralized Loan Obligation |
| CMT | Constant Maturity Treasury |
| FGIC | Financial Guaranty Insurance Co. |
| FLR | Floating Rate. Interest rate resets periodically based on the parenthetically disclosed reference rate plus a spread (if any). The period-end rate reported may not be the current rate. All reference rates are USD unless otherwise noted. |
| LIBOR | London Interbank Offered Rate |
| NPFG | National Public Finance Guarantee Corp. |
| REIT | Real Estate Investment Trust |
| SOFR | Secured Overnight Financing Rate |
| TBA | To Be Announced |
| UMBS | Uniform Mortgage-Backed Security |
See Notes to Financial Statements
| Financial Statements | Statement of Assets and Liabilities (unaudited) |
This statement represents your fund’s balance sheet, which details the assets and liabilities comprising the total value of the fund.
| At 6/30/21Assets | |
| Investments in unaffiliated issuers, at value (identified cost, $1,870,072,326) | $2,636,065,167 |
| Investments in affiliated issuers, at value (identified cost, $150,704,645) | 150,704,645 |
| Cash | 3,933,263 |
| Receivables for | |
| Investments sold | 3,610,850 |
| TBA sale commitments | 17,391,129 |
| Fund shares sold | 2,597,478 |
| Interest and dividends | 7,127,781 |
| Receivable from investment adviser | 93,823 |
| Other assets | 6,591 |
| Total assets | $2,821,530,727 |
| Liabilities | |
| Payables for | |
| Investments purchased | $3,660,417 |
| TBA purchase commitments | 141,406,768 |
| Fund shares reacquired | 951,057 |
| Payable to affiliates | |
| Administrative services fee | 1,962 |
| Shareholder servicing costs | 799 |
| Distribution and/or service fees | 19,090 |
| Accrued expenses and other liabilities | 299,329 |
| Total liabilities | $146,339,422 |
| Net assets | $2,675,191,305 |
| Net assets consist of | |
| Paid-in capital | $1,595,466,078 |
| Total distributable earnings (loss) | 1,079,725,227 |
| Net assets | $2,675,191,305 |
| Shares of beneficial interest outstanding | 95,099,608 |
| | Net assets | Shares
outstanding | Net asset value
per share |
| Initial Class | $1,277,811,427 | 44,914,835 | $28.45 |
| Service Class | 1,397,379,878 | 50,184,773 | 27.84 |
See Notes to Financial Statements
| Financial Statements | Statement of Operations (unaudited) |
This statement describes how much your fund earned in investment income and accrued in expenses. It also describes any gains and/or losses generated by fund operations.
| Six months ended 6/30/21 | |
| Net investment income (loss) | |
| Income | |
| Dividends | $16,760,360 |
| Interest | 11,249,659 |
| Dividends from affiliated issuers | 35,008 |
| Other | 16,652 |
| Income on securities loaned | 9,564 |
| Foreign taxes withheld | (248,503) |
| Total investment income | $27,822,740 |
| Expenses | |
| Management fee | $8,635,022 |
| Distribution and/or service fees | 1,689,974 |
| Shareholder servicing costs | 36,276 |
| Administrative services fee | 171,755 |
| Independent Trustees' compensation | 18,798 |
| Custodian fee | 64,527 |
| Shareholder communications | 80,511 |
| Audit and tax fees | 39,217 |
| Legal fees | 9,776 |
| Miscellaneous | 36,940 |
| Total expenses | $10,782,796 |
| Reduction of expenses by investment adviser | (1,152,418) |
| Net expenses | $9,630,378 |
| Net investment income (loss) | $18,192,362 |
| Realized and unrealized gain (loss) | |
| Realized gain (loss) (identified cost basis) | |
| Unaffiliated issuers | $132,184,900 |
| Foreign currency | (6,431) |
| Net realized gain (loss) | $132,178,469 |
| Change in unrealized appreciation or depreciation | |
| Unaffiliated issuers | $81,038,930 |
| Translation of assets and liabilities in foreign currencies | (23,045) |
| Net unrealized gain (loss) | $81,015,885 |
| Net realized and unrealized gain (loss) | $213,194,354 |
| Change in net assets from operations | $231,386,716 |
See Notes to Financial Statements
| Financial Statements | Statements of Changes in Net Assets |
These statements describe the increases and/or decreases in net assets resulting from operations, any distributions, and any shareholder transactions.
| | Six months ended | Year ended |
| | 6/30/21
(unaudited) | 12/31/20 |
| Change in net assets | | |
| From operations | | |
| Net investment income (loss) | $18,192,362 | $43,611,772 |
| Net realized gain (loss) | 132,178,469 | 132,672,899 |
| Net unrealized gain (loss) | 81,015,885 | 42,984,940 |
| Change in net assets from operations | $231,386,716 | $219,269,611 |
| Total distributions to shareholders | $— | $(115,929,697) |
| Change in net assets from fund share transactions | $(94,953,954) | $(111,560,917) |
| Total change in net assets | $136,432,762 | $(8,221,003) |
| Net assets | | |
| At beginning of period | 2,538,758,543 | 2,546,979,546 |
| At end of period | $2,675,191,305 | $2,538,758,543 |
See Notes to Financial Statements
| Financial Statements | Financial Highlights |
The financial highlights table is intended to help you understand the fund's financial performance for the semiannual period and the past 5 fiscal years. Certain information reflects financial results for a single fund share. The total returns in the table represent the rate that an investor would have earned (or lost) on an investment in the fund share class (assuming reinvestment of all distributions) held for the entire period.
| Initial Class | Six months
ended | Year ended |
| | 6/30/21
(unaudited) | 12/31/20 | 12/31/19 | 12/31/18 | 12/31/17 | 12/31/16 |
| Net asset value, beginning of period | $26.02 | $24.90 | $21.78 | $24.70 | $23.18 | $22.60 |
| Income (loss) from investment operations | | | | | | |
| Net investment income (loss) (d) | $0.21 | $0.47 | $0.52 | $0.53 | $0.49 | $0.54(c) |
| Net realized and unrealized gain (loss) | 2.22 | 1.88 | 3.83 | (1.80) | 2.29 | 1.51 |
| Total from investment operations | $2.43 | $2.35 | $4.35 | $(1.27) | $2.78 | $2.05 |
| Less distributions declared to shareholders | | | | | | |
| From net investment income | $— | $(0.57) | $(0.58) | $(0.54) | $(0.58) | $(0.69) |
| From net realized gain | — | (0.66) | (0.65) | (1.11) | (0.68) | (0.78) |
| Total distributions declared to shareholders | $— | $(1.23) | $(1.23) | $(1.65) | $(1.26) | $(1.47) |
| Net asset value, end of period (x) | $28.45 | $26.02 | $24.90 | $21.78 | $24.70 | $23.18 |
| Total return (%) (k)(r)(s)(x) | 9.34(n) | 9.81 | 20.38 | (5.61) | 12.30 | 9.09(c) |
Ratios (%) (to average net assets)
and Supplemental data: | | | | | | |
| Expenses before expense reductions (f) | 0.70(a) | 0.71 | 0.70 | 0.70 | 0.71 | 0.71(c) |
| Expenses after expense reductions (f) | 0.61(a) | 0.61 | 0.62 | 0.62 | 0.63 | 0.62(c) |
| Net investment income (loss) | 1.53(a) | 1.95 | 2.18 | 2.20 | 2.04 | 2.33(c) |
| Portfolio turnover | 57(n) | 84 | 42 | 26 | 34 | 35 |
| Net assets at end of period (000 omitted) | $1,277,811 | $1,219,438 | $1,223,166 | $1,134,301 | $1,350,737 | $1,359,943 |
See Notes to Financial Statements
Financial Highlights - continued
| Service Class | Six months
ended | Year ended |
| | 6/30/21
(unaudited) | 12/31/20 | 12/31/19 | 12/31/18 | 12/31/17 | 12/31/16 |
| Net asset value, beginning of period | $25.50 | $24.43 | $21.38 | $24.28 | $22.81 | $22.26 |
| Income (loss) from investment operations | | | | | | |
| Net investment income (loss) (d) | $0.17 | $0.40 | $0.45 | $0.46 | $0.43 | $0.47(c) |
| Net realized and unrealized gain (loss) | 2.17 | 1.83 | 3.76 | (1.77) | 2.25 | 1.49 |
| Total from investment operations | $2.34 | $2.23 | $4.21 | $(1.31) | $2.68 | $1.96 |
| Less distributions declared to shareholders | | | | | | |
| From net investment income | $— | $(0.50) | $(0.51) | $(0.48) | $(0.53) | $(0.63) |
| From net realized gain | — | (0.66) | (0.65) | (1.11) | (0.68) | (0.78) |
| Total distributions declared to shareholders | $— | $(1.16) | $(1.16) | $(1.59) | $(1.21) | $(1.41) |
| Net asset value, end of period (x) | $27.84 | $25.50 | $24.43 | $21.38 | $24.28 | $22.81 |
| Total return (%) (k)(r)(s)(x) | 9.18(n) | 9.52 | 20.12 | (5.87) | 12.02 | 8.81(c) |
Ratios (%) (to average net assets)
and Supplemental data: | | | | | | |
| Expenses before expense reductions (f) | 0.95(a) | 0.96 | 0.95 | 0.95 | 0.96 | 0.96(c) |
| Expenses after expense reductions (f) | 0.86(a) | 0.86 | 0.87 | 0.87 | 0.88 | 0.87(c) |
| Net investment income (loss) | 1.28(a) | 1.71 | 1.93 | 1.95 | 1.79 | 2.08(c) |
| Portfolio turnover | 57(n) | 84 | 42 | 26 | 34 | 35 |
| Net assets at end of period (000 omitted) | $1,397,380 | $1,319,320 | $1,323,813 | $1,191,222 | $1,427,824 | $1,276,603 |
| (a) | Annualized. |
| (c) | Amount reflects a one-time reimbursement of expenses by the custodian (or former custodian) without which net investment income and performance would be lower and expenses would be higher. |
| (d) | Per share data is based on average shares outstanding. |
| (f) | Ratios do not reflect reductions from fees paid indirectly, if applicable. |
| (k) | The total return does not reflect expenses that apply to separate accounts. Inclusion of these charges would reduce the total return figures for all periods shown. |
| (n) | Not annualized. |
| (r) | Certain expenses have been reduced without which performance would have been lower. |
| (s) | From time to time the fund may receive proceeds from litigation settlements, without which performance would be lower. |
| (x) | The net asset values and total returns have been calculated on net assets which include adjustments made in accordance with U.S. generally accepted accounting principles required at period end for financial reporting purposes. |
See Notes to Financial Statements
Notes to Financial Statements (unaudited)
(1) Business and Organization
MFS Total Return Series (the fund) is a diversified series of MFS Variable Insurance Trust (the trust). The trust is organized as a Massachusetts business trust and is registered under the Investment Company Act of 1940, as amended, as an open-end management investment company. The shareholders of each series of the trust are separate accounts of insurance companies, which offer variable annuity and/or life insurance products, and qualified retirement and pension plans.
The fund is an investment company and accordingly follows the investment company accounting and reporting guidance of the Financial Accounting Standards Board (FASB) Accounting Standards Codification Topic 946 Financial Services - Investment Companies.
(2) Significant Accounting Policies
General — The preparation of financial statements in conformity with U.S. generally accepted accounting principles requires management to make estimates and assumptions that affect the reported amounts of assets and liabilities, and disclosure of contingent assets and liabilities at the date of the financial statements and the reported amounts of increases and decreases in net assets from operations during the reporting period. Actual results could differ from those estimates. In the preparation of these financial statements, management has evaluated subsequent events occurring after the date of the fund’s Statement of Assets and Liabilities through the date that the financial statements were issued.
Certain of the fund's investments, derivatives, debt and other contracts may be based on reference interest rates such as the London Interbank Offered Rate (“LIBOR”). In 2017, the regulatory authority that oversees financial services firms in the United Kingdom announced plans to transition away from LIBOR by the end of 2021. In March 2021, the administrator of LIBOR announced the extension of the publication of the more commonly used U.S. dollar LIBOR settings to the end of June 2023. Although the full impacts of the transition away from LIBOR are not fully known, the transition may result in, among other things, an increase in volatility or illiquidity of the markets for instruments that currently rely on LIBOR to determine interest rates and this could have an adverse impact on the fund's performance. With respect to the fund's accounting for investments, derivatives, debt and other contracts that undergo reference rate-related modifications as a result of the transition, management will rely upon the relief provided by FASB Codification Topic 848 – Reference Rate Reform (Topic 848). The guidance in Topic 848 permits the fund to disregard the GAAP accounting requirements around certain contract modifications resulting from the LIBOR transition such that for contracts considered in scope, the fund can account for those modified contracts as a continuation of the existing contracts.
Balance Sheet Offsetting — The fund's accounting policy with respect to balance sheet offsetting is that, absent an event of default by the counterparty or a termination of the agreement, the International Swaps and Derivatives Association (ISDA) Master Agreement, or similar agreement, does not result in an offset of reported amounts of financial assets and financial liabilities in the Statement of Assets and Liabilities across transactions between the fund and the applicable counterparty. The fund's right to setoff may be restricted or prohibited by the bankruptcy or insolvency laws of the particular jurisdiction to which a specific master netting agreement counterparty is subject. Balance sheet offsetting disclosures, to the extent applicable to the fund, have been included in the fund’s Significant Accounting Policies note under the captions for each of the fund’s in-scope financial instruments and transactions.
Investment Valuations — Equity securities, including restricted equity securities, are generally valued at the last sale or official closing price on their primary market or exchange as provided by a third-party pricing service. Equity securities, for which there were no sales reported that day, are generally valued at the last quoted daily bid quotation on their primary market or exchange as provided by a third-party pricing service. Debt instruments and floating rate loans, including restricted debt instruments, are generally valued at an evaluated or composite bid as provided by a third-party pricing service. Debt instruments sold short are generally valued at an evaluated or composite mean as provided by a third-party pricing service. Short-term instruments with a maturity at issuance of 60 days or less may be valued at amortized cost, which approximates market value. Open-end investment companies are generally valued at net asset value per share. Securities and other assets generally valued on the basis of information from a third-party pricing service may also be valued at a broker/dealer bid quotation. In determining values, third-party pricing services can utilize both transaction data and market information such as yield, quality, coupon rate, maturity, type of issue, trading characteristics, and other market data. The values of foreign securities and other assets and liabilities expressed in foreign currencies are converted to U.S. dollars using the mean of bid and asked prices for rates provided by a third-party pricing service.
The Board of Trustees has delegated primary responsibility for determining or causing to be determined the value of the fund’s investments (including any fair valuation) to the adviser pursuant to valuation policies and procedures approved by the Board. If the adviser determines that reliable market quotations are not readily available, investments are valued at fair value as determined in good faith by the adviser in accordance with such procedures under the oversight of the Board of Trustees. Under the fund’s valuation policies and procedures, market quotations are not considered to be readily available for most types of debt instruments and floating rate loans and many types of derivatives. These investments are generally valued at fair value based on information from
Notes to Financial Statements (unaudited) - continued
third-party pricing services. In addition, investments may be valued at fair value if the adviser determines that an investment’s value has been materially affected by events occurring after the close of the exchange or market on which the investment is principally traded (such as foreign exchange or market) and prior to the determination of the fund’s net asset value, or after the halt of trading of a specific security where trading does not resume prior to the close of the exchange or market on which the security is principally traded. Events that occur after foreign markets close (such as developments in foreign markets and significant movements in the U.S. markets) and prior to the determination of the fund’s net asset value may be deemed to have a material effect on the value of securities traded in foreign markets. Accordingly, the fund’s foreign equity securities may often be valued at fair value. The adviser generally relies on third-party pricing services or other information (such as the correlation with price movements of similar securities in the same or other markets; the type, cost and investment characteristics of the security; the business and financial condition of the issuer; and trading and other market data) to assist in determining whether to fair value and at what value to fair value an investment. The value of an investment for purposes of calculating the fund’s net asset value can differ depending on the source and method used to determine value. When fair valuation is used, the value of an investment used to determine the fund’s net asset value may differ from quoted or published prices for the same investment. There can be no assurance that the fund could obtain the fair value assigned to an investment if it were to sell the investment at the same time at which the fund determines its net asset value per share.
Various inputs are used in determining the value of the fund's assets or liabilities. These inputs are categorized into three broad levels. In certain cases, the inputs used to measure fair value may fall into different levels of the fair value hierarchy. In such cases, an investment's level within the fair value hierarchy is based on the lowest level of input that is significant to the fair value measurement. The fund's assessment of the significance of a particular input to the fair value measurement in its entirety requires judgment, and considers factors specific to the investment. Level 1 includes unadjusted quoted prices in active markets for identical assets or liabilities. Level 2 includes other significant observable market-based inputs (including quoted prices for similar securities, interest rates, prepayment speed, and credit risk). Level 3 includes unobservable inputs, which may include the adviser's own assumptions in determining the fair value of investments. The following is a summary of the levels used as of June 30, 2021 in valuing the fund's assets or liabilities:
| Financial Instruments | Level 1 | Level 2 | Level 3 | Total |
| Equity Securities: | | | | |
| United States | $1,497,537,497 | $6,844,157 | $— | $1,504,381,654 |
| Switzerland | 26,066,709 | — | — | 26,066,709 |
| Taiwan | 14,291,590 | — | — | 14,291,590 |
| United Kingdom | 14,073,593 | — | — | 14,073,593 |
| France | 8,294,713 | — | — | 8,294,713 |
| South Korea | 7,129,754 | — | — | 7,129,754 |
| Ireland | 6,137,220 | — | — | 6,137,220 |
| Germany | 4,194,026 | — | — | 4,194,026 |
| U.S. Treasury Bonds & U.S. Government Agencies & Equivalents | — | 270,273,567 | — | 270,273,567 |
| Non - U.S. Sovereign Debt | — | 6,591,488 | — | 6,591,488 |
| Municipal Bonds | — | 11,081,967 | — | 11,081,967 |
| U.S. Corporate Bonds | — | 260,209,756 | — | 260,209,756 |
| Residential Mortgage-Backed Securities | — | 285,388,076 | — | 285,388,076 |
| Commercial Mortgage-Backed Securities | — | 69,852,584 | — | 69,852,584 |
| Asset-Backed Securities (including CDOs) | — | 72,159,947 | — | 72,159,947 |
| Foreign Bonds | — | 75,938,523 | — | 75,938,523 |
| Mutual Funds | 150,704,645 | — | — | 150,704,645 |
| Total | $1,728,429,747 | $1,058,340,065 | $— | $2,786,769,812 |
For further information regarding security characteristics, see the Portfolio of Investments.
Foreign Currency Translation — Purchases and sales of foreign investments, income, and expenses are converted into U.S. dollars based upon currency exchange rates prevailing on the respective dates of such transactions or on the reporting date for foreign denominated receivables and payables. Gains and losses attributable to foreign currency exchange rates on sales of securities are recorded for financial statement purposes as net realized gains and losses on investments. Gains and losses attributable to foreign exchange rate movements on receivables, payables, income and expenses are recorded for financial statement purposes as foreign currency transaction gains and losses. That portion of both realized and unrealized gains and losses on investments that results from fluctuations in foreign currency exchange rates is not separately disclosed.
Security Loans — Under its Securities Lending Agency Agreement with the fund, State Street Bank and Trust Company, as lending agent, loans the securities of the fund to certain qualified institutions (the “Borrowers”) approved by the fund. Security loans can be terminated at the discretion of either the lending agent or the fund and the related securities must be returned within the earlier of
Notes to Financial Statements (unaudited) - continued
the standard trade settlement period for such securities or within three business days. The loans are collateralized by cash and/or U.S. Treasury and federal agency obligations in an amount typically at least equal to the market value of the securities loaned. On loans collateralized by cash, the cash collateral is invested in a money market fund. The market value of the loaned securities is determined at the close of business of the fund and any additional required collateral is delivered to the fund on the next business day. The lending agent provides the fund with indemnification against Borrower default. In the event of Borrower default, the lending agent will, for the benefit of the fund, either purchase securities identical to those loaned or, when such purchase is commercially impracticable, pay the fund the market value of the loaned securities. In return, the lending agent assumes the fund's rights to the related collateral. If the collateral value is less than the cost to purchase identical securities, the lending agent is responsible for the shortfall, but only to the extent that such shortfall is not due to a decline in collateral value resulting from collateral reinvestment for which the fund bears the risk of loss. A portion of the income generated upon investment of the collateral is remitted to the Borrowers, and the remainder is allocated between the fund and the lending agent. On loans collateralized by U.S. Treasury and/or federal agency obligations, a fee is received from the Borrower, and is allocated between the fund and the lending agent. Income from securities lending is separately reported in the Statement of Operations. The dividend and interest income earned on the securities loaned is accounted for in the same manner as other dividend and interest income. At June 30, 2021, there were no securities on loan or collateral outstanding.
Indemnifications — Under the fund's organizational documents, its officers and Trustees may be indemnified against certain liabilities and expenses arising out of the performance of their duties to the fund. Additionally, in the normal course of business, the fund enters into agreements with service providers that may contain indemnification clauses. The fund's maximum exposure under these agreements is unknown as this would involve future claims that may be made against the fund that have not yet occurred.
Investment Transactions and Income — Investment transactions are recorded on the trade date. Some securities may be purchased or sold on an extended settlement basis, which means that the receipt or delivery of the securities by the fund and related payments occur at a future date, usually beyond the customary settlement period. Interest income is recorded on the accrual basis.
Dividends received in cash are recorded on the ex-dividend date. Certain dividends from foreign securities will be recorded when the fund is informed of the dividend if such information is obtained subsequent to the ex-dividend date. Dividend and interest payments received in additional securities are recorded on the ex-dividend or ex-interest date in an amount equal to the value of the security on such date. All premium and discount is amortized or accreted for financial statement purposes in accordance with U.S. generally accepted accounting principles.
The fund may receive proceeds from litigation settlements. Any proceeds received from litigation involving portfolio holdings are reflected in the Statement of Operations in realized gain/loss if the security has been disposed of by the fund or in unrealized gain/loss if the security is still held by the fund. Any other proceeds from litigation not related to portfolio holdings are reflected as other income in the Statement of Operations.
The fund invests a significant portion of its assets in asset-backed and/or mortgage-backed securities. For these securities, the value of the debt instrument also depends on the credit quality and adequacy of the underlying assets or collateral as well as whether there is a security interest in the underlying assets or collateral. Enforcing rights, if any, against the underlying assets or collateral may be difficult. U.S. Government securities not supported as to the payment of principal or interest by the U.S. Treasury, such as those issued by Fannie Mae, Freddie Mac, and the Federal Home Loan Banks, are subject to greater credit risk than are U.S. Government securities supported by the U.S. Treasury, such as those issued by Ginnie Mae.
The fund may purchase or sell mortgage-backed securities on a “To Be Announced” (TBA) basis. A TBA transaction is subject to extended settlement and typically does not designate the actual security to be delivered, but instead includes an approximate principal amount. The price of the TBA security and the date that it will be settled are fixed at the time the transaction is negotiated. The value of the security varies with market fluctuations and no interest accrues to the fund until settlement takes place. TBA purchase and sale commitments are held at carrying amount, which approximates fair value and are categorized as level 2 within the fair value hierarchy and included in TBA purchase and TBA sale commitments in the Statement of Assets and Liabilities. Losses may arise as a result of changes in the value of the TBA investment prior to settlement date or due to counterparty non-performance. At the time that it enters into a TBA transaction, the fund is required to have sufficient cash and/or liquid securities to cover its commitments.
The fund may also enter into mortgage dollar rolls, typically TBA dollar rolls, in which the fund sells TBA mortgage-backed securities to financial institutions and simultaneously agrees to repurchase similar (same issuer, type and coupon) securities at a later date at an agreed-upon price. During the period between the sale and repurchase, the fund will not be entitled to receive interest and principal payments on the securities sold. The fund accounts for dollar roll transactions as purchases and sales and realizes gains and losses on these transactions. Dollar roll transactions involve the risk that the market value of the securities that the fund is required to purchase may decline below the agreed upon repurchase price of those securities.
Notes to Financial Statements (unaudited) - continued
To mitigate the counterparty credit risk on TBA transactions, mortgage dollar rolls, and other types of forward settling mortgage-backed and asset-backed security transactions, the fund whenever possible enters into a Master Securities Forward Transaction Agreement (“MSFTA”) on a bilateral basis with each of the counterparties with whom it undertakes a significant volume of transactions. The MSFTA gives each party to the agreement the right to terminate all transactions traded under such agreement if there is a specified deterioration in the credit quality of the other party. Upon an event of default or a termination of the MSFTA, the non-defaulting party has the right to close out all transactions traded under such agreement and to net amounts owed under each transaction to one net amount payable by one party to the other. This right to close out and net payments across all transactions traded under the MSFTA could result in a reduction of the fund's credit risk to such counterparty equal to any amounts payable by the fund under the applicable transactions, if any.
For mortgage-backed and asset-backed securities traded under a MSFTA, the collateral and margining requirements are contract specific. Collateral amounts across all transactions traded under such agreement are netted and an amount is posted from one party to the other to collateralize such obligations. Cash that has been pledged to cover the fund's collateral or margin obligations under a MSFTA, if any, will be reported separately on the Statement of Assets and Liabilities as restricted cash. Securities pledged as collateral or margin for the same purpose, if any, are noted in the Portfolio of Investments.
Tax Matters and Distributions — The fund intends to qualify as a regulated investment company, as defined under Subchapter M of the Internal Revenue Code, and to distribute all of its taxable income, including realized capital gains. As a result, no provision for federal income tax is required. The fund’s federal tax returns, when filed, will remain subject to examination by the Internal Revenue Service for a three year period. Management has analyzed the fund’s tax positions taken on federal and state tax returns for all open tax years and does not believe that there are any uncertain tax positions that require recognition of a tax liability. Foreign taxes, if any, have been accrued by the fund in the accompanying financial statements in accordance with the applicable foreign tax law. Foreign income taxes may be withheld by certain countries in which the fund invests. Additionally, capital gains realized by the fund on securities issued in or by certain foreign countries may be subject to capital gains tax imposed by those countries.
Distributions to shareholders are recorded on the ex-dividend date. Income and capital gain distributions are determined in accordance with income tax regulations, which may differ from U.S. generally accepted accounting principles. Certain capital accounts in the financial statements are periodically adjusted for permanent differences in order to reflect their tax character. These adjustments have no impact on net assets or net asset value per share. Temporary differences which arise from recognizing certain items of income, expense, gain or loss in different periods for financial statement and tax purposes will reverse at some time in the future.
Book/tax differences primarily relate to amortization and accretion of debt securities, wash sale loss deferrals and partnership adjustments.
The tax character of distributions declared to shareholders for the last fiscal year is as follows:
| | Year ended
12/31/20 |
| Ordinary income (including any short-term capital gains) | $52,307,667 |
| Long-term capital gains | 63,622,030 |
| Total distributions | $115,929,697 |
The federal tax cost and the tax basis components of distributable earnings were as follows:
| As of 6/30/21 | |
| Cost of investments | $2,036,035,903 |
| Gross appreciation | 761,650,467 |
| Gross depreciation | (10,916,558) |
| Net unrealized appreciation (depreciation) | $750,733,909 |
| As of 12/31/20 | |
| Undistributed ordinary income | 54,306,299 |
| Undistributed long-term capital gain | 118,976,833 |
| Other temporary differences | 3,767,505 |
| Net unrealized appreciation (depreciation) | 671,287,874 |
The aggregate cost above includes prior fiscal year end tax adjustments, if applicable.
Notes to Financial Statements (unaudited) - continued
Multiple Classes of Shares of Beneficial Interest — The fund offers multiple classes of shares, which differ in their respective distribution and/or service fees. The fund's income, realized and unrealized gain (loss), and common expenses are allocated to shareholders based on the daily net assets of each class. Dividends are declared separately for each class. Differences in per share dividend rates are generally due to differences in separate class expenses. The fund’s distributions declared to shareholders as reported in the Statements of Changes in Net Assets are presented by class as follows:
| | Six months
ended
6/30/21 | | Year
ended
12/31/20 |
| Initial Class | $— | | $56,532,062 |
| Service Class | — | | 59,397,635 |
| Total | $— | | $115,929,697 |
(3) Transactions with Affiliates
Investment Adviser — The fund has an investment advisory agreement with MFS to provide overall investment management and related administrative services and facilities to the fund. The management fee is computed daily and paid monthly at the following annual rates based on the fund's average daily net assets:
| Up to $1 billion | 0.70% |
| In excess of $1 billion and up to $2.5 billion | 0.65% |
| In excess of $2.5 billion and up to $5 billion | 0.55% |
| In excess of $5 billion | 0.50% |
MFS has agreed in writing to reduce its management fee by a specified amount if certain MFS mutual fund assets exceed thresholds agreed to by MFS and the fund's Board of Trustees. For the six months ended June 30, 2021, this management fee reduction amounted to $155,543, which is included in the reduction of total expenses in the Statement of Operations. The management fee incurred for the six months ended June 30, 2021 was equivalent to an annual effective rate of 0.65% of the fund's average daily net assets.
The investment adviser has agreed in writing to pay a portion of the fund’s total annual operating expenses, excluding interest, taxes, extraordinary expenses, brokerage and transaction costs, and investment-related expenses, such that total annual operating expenses do not exceed 0.61% of average daily net assets for the Initial Class shares and 0.86% of average daily net assets for the Service Class shares. This written agreement will continue until modified by the fund’s Board of Trustees, but such agreement will continue at least until April 30, 2023. For the six months ended June 30, 2021, this reduction amounted to $996,875, which is included in the reduction of total expenses in the Statement of Operations.
Distributor — MFS Fund Distributors, Inc. (MFD), a wholly-owned subsidiary of MFS, is the distributor of shares of the fund. The Trustees have adopted a distribution plan for the Service Class shares pursuant to Rule 12b-1 under the Investment Company Act of 1940.
The fund's distribution plan provides that the fund will pay MFD distribution and/or service fees equal to 0.25% per annum of its average daily net assets attributable to Service Class shares as partial consideration for services performed and expenses incurred by MFD and financial intermediaries (including participating insurance companies that invest in the fund to fund variable annuity and variable life insurance contracts, sponsors of qualified retirement and pension plans that invest in the fund, and affiliates of these participating insurance companies and plan sponsors) in connection with the sale and distribution of the Service Class shares. MFD may subsequently pay all, or a portion, of the distribution and/or service fees to financial intermediaries.
Shareholder Servicing Agent — MFS Service Center, Inc. (MFSC), a wholly-owned subsidiary of MFS, receives a fee from the fund for its services as shareholder servicing agent. For the six months ended June 30, 2021, the fee was $35,038, which equated to 0.0027% annually of the fund's average daily net assets. MFSC also receives reimbursement from the fund for out-of-pocket expenses paid by MFSC on behalf of the fund. For the six months ended June 30, 2021, these costs amounted to $1,238.
Administrator — MFS provides certain financial, legal, shareholder communications, compliance, and other administrative services to the fund. Under an administrative services agreement, the fund reimburses MFS the costs incurred to provide these services. The fund is charged an annual fixed amount of $17,500 plus a fee based on average daily net assets. The administrative services fee incurred for the six months ended June 30, 2021 was equivalent to an annual effective rate of 0.0132% of the fund's average daily net assets.
Notes to Financial Statements (unaudited) - continued
Trustees’ and Officers’ Compensation — The fund pays compensation to independent Trustees in the form of a retainer, attendance fees, and additional compensation to Board and Committee chairpersons. The fund does not pay compensation directly to Trustees or officers of the fund who are also officers of the investment adviser, all of whom receive remuneration from MFS for their services to the fund. Certain officers and Trustees of the fund are officers or directors of MFS, MFD, and MFSC.
Other — The fund invests in the MFS Institutional Money Market Portfolio which is managed by MFS and seeks current income consistent with preservation of capital and liquidity. This money market fund does not pay a management fee to MFS but does incur investment and operating costs.
The fund is permitted to engage in purchase and sale transactions with funds and accounts for which MFS serves as investment adviser or sub-adviser (“cross-trades”) pursuant to a policy adopted by the Board of Trustees. This policy has been designed to ensure that cross-trades conducted by the fund comply with Rule 17a-7 under the Investment Company Act of 1940. During the six months ended June 30, 2021, the fund engaged in sale transactions pursuant to this policy, which amounted to $191,534. The sales transactions resulted in net realized gains (losses) of $(119,421).
The adviser has voluntarily undertaken to reimburse the fund from its own resources on a quarterly basis for the cost of investment research embedded in the cost of the fund’s securities trades. This agreement may be rescinded at any time. For the six months ended June 30, 2021, this reimbursement amounted to $15,765, which is included in “Other” income in the Statement of Operations.
(4) Portfolio Securities
For the six months ended June 30, 2021, purchases and sales of investments, other than short-term obligations, were as follows:
| | Purchases | Sales |
| U.S. Government securities | $1,213,021,901 | $1,115,200,222 |
| Non-U.S. Government securities | 245,570,284 | 431,867,380 |
(5) Shares of Beneficial Interest
The fund's Declaration of Trust permits the Trustees to issue an unlimited number of full and fractional shares of beneficial interest. Transactions in fund shares were as follows:
| | Six months ended
6/30/21 | | Year ended
12/31/20 |
| | Shares | Amount | | Shares | Amount |
| Shares sold | | | | | |
| Initial Class | 705,060 | $19,174,324 | | 1,626,873 | $38,823,750 |
| Service Class | 1,794,028 | 48,262,975 | | 2,911,465 | 68,599,977 |
| | 2,499,088 | $67,437,299 | | 4,538,338 | $107,423,727 |
Shares issued to shareholders
in reinvestment of distributions | | | | | |
| Initial Class | — | $— | | 2,349,629 | $56,532,062 |
| Service Class | — | — | | 2,516,849 | 59,397,635 |
| | — | $— | | 4,866,478 | $115,929,697 |
| Shares reacquired | | | | | |
| Initial Class | (2,654,405) | $(72,771,877) | | (6,227,705) | $(149,473,288) |
| Service Class | (3,349,288) | (89,619,376) | | (7,882,515) | (185,441,053) |
| | (6,003,693) | $(162,391,253) | | (14,110,220) | $(334,914,341) |
| Net change | | | | | |
| Initial Class | (1,949,345) | $(53,597,553) | | (2,251,203) | $(54,117,476) |
| Service Class | (1,555,260) | (41,356,401) | | (2,454,201) | (57,443,441) |
| | (3,504,605) | $(94,953,954) | | (4,705,404) | $(111,560,917) |
(6) Line of Credit
The fund and certain other funds managed by MFS participate in a $1.25 billion unsecured committed line of credit of which $1 billion is reserved for use by the fund and certain other MFS U.S. funds. The line of credit is provided by a syndicate of banks under a credit agreement. Borrowings may be made for temporary financing needs. Interest is charged to each fund, based on its
Notes to Financial Statements (unaudited) - continued
borrowings, generally at a rate equal to the highest of one month LIBOR, the Federal Funds Effective Rate and the Overnight Bank Funding Rate, plus an agreed upon spread. A commitment fee, based on the average daily, unused portion of the committed line of credit, is allocated among the participating funds. In addition, the fund and other funds managed by MFS have established unsecured uncommitted borrowing arrangements with certain banks for temporary financing needs. Interest is charged to each fund, based on its borrowings, at rates equal to customary reference rates plus an agreed upon spread. For the six months ended June 30, 2021, the fund’s commitment fee and interest expense were $5,110 and $0, respectively, and are included in “Miscellaneous” expense in the Statement of Operations.
(7) Investments in Affiliated Issuers
An affiliated issuer may be considered one in which the fund owns 5% or more of the outstanding voting securities, or a company which is under common control. For the purposes of this report, the following were affiliated issuers:
| Affiliated Issuers | Beginning
Value | Purchases | Sales
Proceeds | Realized
Gain
(Loss) | Change in
Unrealized
Appreciation or
Depreciation | Ending
Value |
| MFS Institutional Money Market Portfolio | $118,744,977 | $427,791,590 | $395,831,922 | $— | $— | $150,704,645 |
| Affiliated Issuers | Dividend
Income | Capital Gain
Distributions |
| MFS Institutional Money Market Portfolio | $35,008 | $— |
(8) Impacts of COVID-19
The pandemic related to the global spread of novel coronavirus disease (COVID-19), which was first detected in December 2019, has resulted in significant disruptions to global business activity and the global economy, as well as the economies of individual countries, the financial performance of individual companies and sectors, and the securities and commodities markets in general. Multiple surges in cases globally, the availability and widespread adoption of vaccines, and the emergence of variant strains of the virus continue to create uncertainty as to the future and long-term impacts resulting from the pandemic including impacts to the prices and liquidity of the fund's investments and the fund's performance.
Statement Regarding Liquidity Risk Management Program
The fund has adopted and implemented a liquidity risk management program (the “Program”) as required by Rule 22e-4 under the Investment Company Act of 1940, as amended. The fund’s Board of Trustees (the “Board”) has designated MFS as the administrator of the Program. The Program is reasonably designed to assess and manage the liquidity risk of the fund. Liquidity risk is the risk that the fund could not meet requests to redeem shares issued by the fund without significant dilution of remaining investors' interests.
MFS provided a written report to the Board for consideration at its April 2021 meeting that addressed the operation of the Program and provided an assessment of the adequacy and effectiveness of the Program during the period from January 1, 2020 to December 31, 2020 (the “Covered Period”). The report concluded that during the Covered Period the Program had operated effectively and had adequately and effectively been implemented to assess and manage the fund’s liquidity risk. MFS also reported that there were no liquidity events that impacted the fund or its ability to timely meet redemptions without dilution to existing shareholders during the Covered Period.
There can be no assurance that the Program will achieve its objectives in the future. Further information on liquidity risk, and other principal risks to which an investment in the fund may be subject, can be found in the prospectus.
Proxy Voting Policies and Information
MFS votes proxies on behalf of the fund pursuant to proxy voting policies and procedures that are available without charge, upon request, by calling 1-800-225-2606, by visiting mfs.com/proxyvoting, or by visiting the SEC’s Web site at http://www.sec.gov.
Information regarding how the fund voted proxies relating to portfolio securities during the most recent twelve-month period ended June 30 is available by August 31 of each year without charge by visiting mfs.com/proxyvoting, or by visiting the SEC’s Web site at http://www.sec.gov.
Quarterly Portfolio Disclosure
The fund files a complete schedule of portfolio holdings with the SEC for the first and third quarters of each fiscal year as an exhibit to its reports on Form N-PORT. The fund’s Form N-PORT reports are available on the SEC’s Web site at http://www.sec.gov. A shareholder can obtain the portfolio holdings report for the first and third quarters of the fund's fiscal year at mfs.com/vit1 by choosing the fund's name and then scrolling to the “Resources” section and clicking on the “Prospectus and Reports” tab.
FURTHER INFORMATION
From time to time, MFS may post important information about the fund or the MFS Funds on the MFS Web site (mfs.com). This information is available at https://www.mfs.com/announcements or at mfs.com/vit1 by choosing the fund's name and then scrolling to the “Resources” section and clicking on the “Announcements” tab, if any.
Information About Fund Contracts and Legal Claims
The fund has entered into contractual arrangements with an investment adviser, administrator, distributor, shareholder servicing agent, 529 program manager (if applicable), and custodian who each provide services to the fund. Unless expressly stated otherwise, shareholders are not parties to, or intended beneficiaries of these contractual arrangements, and these contractual arrangements are not intended to create any shareholder right to enforce them against the service providers or to seek any remedy under them against the service providers, either directly or on behalf of the fund.
Under the Trust’s By-Laws and Declaration of Trust, any claims asserted against or on behalf of the MFS Funds, including claims against Trustees and Officers, must be brought in state and federal courts located within the Commonwealth of Massachusetts.
Semiannual Report
June 30, 2021
MFS® Variable Insurance Trust
The report is prepared for the general information of contract owners. It is authorized for distribution to prospective investors only when preceded or accompanied by a current prospectus.
NOT FDIC INSURED • MAY LOSE VALUE • NO BANK OR CREDIT UNION GUARANTEE •
NOT A DEPOSIT • NOT INSURED BY ANY FEDERAL GOVERNMENT AGENCY OR NCUA/NCUSIF
Dear Contract Owners:
After experiencing dramatic swings in the early days of the coronavirus pandemic, global equity markets have performed strongly over the past year. Though the speedy development of vaccines brightened the economic and market outlook, uncertainty remains as new variants of the virus appear, and questions persist over how fast vaccines can be made widely available in the developing world.
Global central banks have taken aggressive steps to cushion the economic and market fallout related to the virus, and governments are deploying unprecedented levels of fiscal support. Having passed a $1.9 trillion stimulus package in March, the U.S. Congress could approve additional stimulus later this year, some of it focused on infrastructure. Along with extraordinary government expenditures, pent-up consumer demand fueled a surge in economic activity as coronavirus restrictions were eased, pushing up inflation, at least temporarily. Markets initially reacted by pushing up yields on global government bonds, though some of the rate rise has since been corrected.
A spirited debate is underway among investors over whether the current price pressures will persist or prove to be temporary, caused by pandemic-induced bottlenecks. The policy measures put in place to counteract the pandemic's effects have helped build a supportive environment and are encouraging economic recovery; however, if markets disconnect from fundamentals, they can sow the seeds of instability. As such, recent dramatic increases in speculative trading in cryptocurrencies, special purpose acquisition companies (SPACs), and the like bear watching.
In the aftermath of the crisis, we could see societal changes as households, businesses, and governments adjust to a new reality, and any such alterations could affect the investment landscape. For investors, events such as the COVID-19 outbreak demonstrate the importance of having a deep understanding of company fundamentals, and we have built our global research platform to do just that.
At MFS®, we put our clients’ assets to work responsibly by carefully navigating the increasing complexity of global markets and economies. Guided by our long-term philosophy and adhering to our commitment to sustainable investing, we tune out the noise and aim to uncover what we believe are the best, most durable investment opportunities in the market. Our unique global investment platform combines collective expertise, long-term discipline, and thoughtful risk management to create sustainable value for investors.
Respectfully,
Michael W. Roberge
Chief Executive Officer
MFS Investment Management
August 13, 2021
The opinions expressed in this letter are subject to change and may not be relied upon for investment advice. No forecasts can be guaranteed.
Portfolio structure (i)
Top ten holdings (i)
| NextEra Energy, Inc. | 8.0% |
| EDP Renovaveis S.A. | 5.7% |
| Southern Co. | 5.2% |
| Duke Energy Corp. | 5.0% |
| Exelon Corp. | 4.9% |
| Dominion Energy, Inc. | 4.8% |
| Sempra Energy | 3.2% |
| Enel S.p.A. | 3.2% |
| Edison International | 2.9% |
| PG&E Corp. | 2.9% |
Top five industries (i)
| Utilities-Electric Power | 81.8% |
| Telecommunications-Wireless | 7.1% |
| Natural Gas-Distribution | 3.6% |
| Cable TV | 2.7% |
| Telephone Services | 2.2% |
Issuer country weightings (i)(x)
| United States | 69.1% |
| Portugal | 7.4% |
| Spain | 5.4% |
| United Kingdom | 4.5% |
| Italy | 3.2% |
| Germany | 3.0% |
| Canada | 2.3% |
| Thailand | 0.7% |
| Brazil | 0.7% |
| Other Countries | 3.7% |
| (i) | For purposes of this presentation, the components include the value of securities, and reflect the impact of the equivalent exposure of derivative positions, if any. These amounts may be negative from time to time. Equivalent exposure is a calculated amount that translates the derivative position into a reasonable approximation of the amount of the underlying asset that the portfolio would have to hold at a given point in time to have the same price sensitivity that results from the portfolio’s ownership of the derivative contract. When dealing with derivatives, equivalent exposure is a more representative measure of the potential impact of a position on portfolio performance than value. The bond component will include any accrued interest amounts. |
| (x) | Represents the portfolio’s exposure to issuer countries as a percentage of a portfolio’s net assets. For purposes of this presentation, United States includes Cash & Cash Equivalents and Other. |
Where the fund holds convertible bonds, they are treated as part of the equity portion of the portfolio.
Cash & Cash Equivalents includes any cash, investments in money market funds, short-term securities, and other assets less liabilities. Please see the Statement of Assets and Liabilities for additional information related to the fund’s cash position and other assets and liabilities.
Other includes equivalent exposure from currency derivatives and/or any offsets to derivative positions and may be negative.
Percentages are based on net assets as of June 30, 2021.
The portfolio is actively managed and current holdings may be different.
Expense Table
Fund Expenses Borne by the Contract Holders during the Period,
January 1, 2021 through June 30, 2021
As a contract holder of the fund, you incur ongoing costs, including management fees; distribution and/or service (12b-1) fees; and other fund expenses. This example is intended to help you understand your ongoing costs (in dollars) of investing in the fund and to compare these costs with the ongoing costs of investing in other mutual funds.
The example is based on an investment of $1,000 invested at the beginning of the period and held for the entire period January 1, 2021 through June 30, 2021.
Actual Expenses
The first line for each share class in the following table provides information about actual account values and actual expenses. You may use the information in this line, together with the amount you invested, to estimate the expenses that you paid over the period. Simply divide your account value by $1,000 (for example, an $8,600 account value divided by $1,000 = 8.6), then multiply the result by the number in the first line under the heading entitled “Expenses Paid During Period” to estimate the expenses you paid on your account during this period.
Hypothetical Example for Comparison Purposes
The second line for each share class in the following table provides information about hypothetical account values and hypothetical expenses based on the fund’s actual expense ratio and an assumed rate of return of 5% per year before expenses, which is not the fund’s actual return. The hypothetical account values and expenses may not be used to estimate the actual ending account balance or expenses you paid for the period. You may use this information to compare the ongoing costs of investing in the fund and other funds. To do so, compare this 5% hypothetical example with the 5% hypothetical examples that appear in the shareholder reports of the other funds.
Please note that the expenses shown in the table are meant to highlight the fund's ongoing costs only and do not take into account the fees and expenses imposed under the variable contracts through which your investment in the fund is made. Therefore, the second line for each share class in the table is useful in comparing ongoing costs associated with an investment in vehicles (such as the fund) which fund benefits under variable annuity and variable life insurance contracts and to qualified pension and retirement plans only, and will not help you determine the relative total costs of investing in the fund through variable annuity and variable life insurance contracts. If the fees and expenses imposed under the variable contracts were included, your costs would have been higher.
Share
Class | | Annualized
Expense
Ratio | Beginning
Account Value
1/01/21 | Ending
Account Value
6/30/21 | Expenses
Paid During
Period (p)
1/01/21-6/30/21 |
| Initial Class | Actual | 0.78% | $1,000.00 | $1,030.29 | $3.93 |
| Hypothetical (h) | 0.78% | $1,000.00 | $1,020.93 | $3.91 |
| Service Class | Actual | 1.03% | $1,000.00 | $1,029.12 | $5.18 |
| Hypothetical (h) | 1.03% | $1,000.00 | $1,019.69 | $5.16 |
| (h) | 5% class return per year before expenses. |
| (p) | “Expenses Paid During Period” are equal to each class's annualized expense ratio, as shown above, multiplied by the average account value over the period, multiplied by 181/365 (to reflect the one-half year period). |
Portfolio of Investments − 6/30/21 (unaudited)
The Portfolio of Investments is a complete list of all securities owned by your fund. It is categorized by broad-based asset classes.
| Issuer | | | Shares/Par | Value ($) |
| Common Stocks – 96.3% |
| Cable TV – 2.7% | |
| Charter Communications, Inc., “A” (a) | | 39,504 | $ 28,500,161 |
| NOS, SGPS S.A. | | 1,174,159 | 4,115,518 |
| | | | | $32,615,679 |
| Natural Gas - Distribution – 3.1% | |
| Atmos Energy Corp. | | 238,373 | $ 22,910,029 |
| China Resources Gas Group Ltd. | | 1,178,000 | 7,070,155 |
| UGI Corp. | | 162,556 | 7,527,968 |
| | | | | $37,508,152 |
| Natural Gas - Pipeline – 1.6% | |
| DT Midstream LLC (a) | | 121,993 | $ 4,716,250 |
| Enterprise Products Partners LP | | 372,985 | 9,000,128 |
| Equitrans Midstream Corp. | | 608,877 | 5,181,543 |
| Plains All American Pipeline LP | | 30,820 | 350,115 |
| | | | | $19,248,036 |
| Telecommunications - Wireless – 7.1% | |
| Advanced Info Service Public Co. Ltd. | | 1,649,500 | $ 8,800,764 |
| Cellnex Telecom S.A. | | 541,254 | 34,477,066 |
| KDDI Corp. | | 226,700 | 7,070,665 |
| Mobile TeleSystems PJSC, ADR | | 201,097 | 1,862,158 |
| SBA Communications Corp., REIT | | 62,355 | 19,872,539 |
| T-Mobile USA, Inc. (a) | | 97,685 | 14,147,719 |
| | | | | $86,230,911 |
| Telephone Services – 2.1% | |
| Hellenic Telecommunications Organization S.A. | | 472,528 | $ 7,928,247 |
| Rogers Communications, Inc., “B” | | 247,362 | 13,150,335 |
| Telesites S.A.B. de C.V. (a) | | 5,689,300 | 5,262,902 |
| | | | | $26,341,484 |
| Utilities - Electric Power – 79.7% | |
| AES Corp. | | 1,006,141 | $ 26,230,096 |
| ALLETE, Inc. | | 93,463 | 6,540,541 |
| Alliant Energy Corp. | | 457,667 | 25,519,512 |
| American Electric Power Co., Inc. | | 236,477 | 20,003,589 |
| CenterPoint Energy, Inc. | | 635,691 | 15,587,143 |
| CLP Holdings Ltd. | | 795,000 | 7,863,684 |
| Dominion Energy, Inc. | | 790,797 | 58,178,935 |
| DTE Energy Co. (a) | | 243,986 | 27,106,845 |
| Duke Energy Corp. | | 614,317 | 60,645,374 |
| E.ON SE | | 1,448,305 | 16,750,816 |
| Edison International | | 603,888 | 34,916,804 |
| EDP Renovaveis S.A. | | 2,981,666 | 69,083,882 |
| Electricite de France S.A. | | 513,208 | 7,010,340 |
| Issuer | | | Shares/Par | Value ($) |
| Common Stocks – continued |
| Utilities - Electric Power – continued | |
| Emera, Inc. | | 330,222 | $ 14,981,998 |
| Enel S.p.A. | | 4,146,654 | 38,509,126 |
| Energias de Portugal S.A. | | 3,185,812 | 16,885,769 |
| Entergy Corp. | | 86,898 | 8,663,731 |
| Equatorial Energia S.A. | | 1,133,900 | 5,653,770 |
| Evergy, Inc. | | 389,340 | 23,527,816 |
| Exelon Corp. | | 1,340,724 | 59,407,483 |
| FirstEnergy Corp. | | 717,511 | 26,698,584 |
| Iberdrola S.A. | | 2,503,418 | 30,515,442 |
| National Grid PLC | | 1,865,475 | 23,761,350 |
| Neoenergia S.A. | | 899,100 | 3,139,927 |
| NextEra Energy Partners LP | | 57,051 | 4,356,414 |
| NextEra Energy, Inc. | | 1,321,119 | 96,811,601 |
| PG&E Corp. (a) | | 3,428,206 | 34,864,855 |
| Pinnacle West Capital Corp. | | 158,310 | 12,976,671 |
| Portland General Electric Co. | | 128,597 | 5,925,750 |
| Public Service Enterprise Group, Inc. | | 362,117 | 21,632,870 |
| RWE AG | | 544,434 | 19,728,396 |
| Sempra Energy | | 293,977 | 38,946,073 |
| Southern Co. | | 1,049,095 | 63,480,738 |
| SSE PLC | | 1,469,511 | 30,501,782 |
| Vistra Corp. | | 511,227 | 9,483,261 |
| | | | | $965,890,968 |
| Total Common Stocks (Identified Cost, $858,683,548) | | $1,167,835,230 |
| Convertible Preferred Stocks – 2.7% |
| Utilities - Electric Power – 2.7% | |
| CenterPoint Energy, Inc., 7% | | 431,280 | $ 19,545,610 |
| DTE Energy Co., 6.25% | | 64,750 | 3,200,593 |
| NextEra Energy, Inc., 5.279% | | 64,600 | 3,162,816 |
| Sempra Energy, 6.75% | | 64,868 | 6,407,012 |
| Total Convertible Preferred Stocks (Identified Cost, $29,027,293) | $ 32,316,031 |
| Investment Companies (h) – 0.6% |
| Money Market Funds – 0.6% | |
| MFS Institutional Money Market Portfolio, 0.02% (v) (Identified Cost, $6,853,786) | | | 6,853,786 | $ 6,853,786 |
| Other Assets, Less Liabilities – 0.4% | | 4,908,483 |
| Net Assets – 100.0% | $1,211,913,530 |
| (a) | Non-income producing security. | | | |
| (h) | An affiliated issuer, which may be considered one in which the fund owns 5% or more of the outstanding voting securities, or a company which is under common control. At period end, the aggregate values of the fund's investments in affiliated issuers and in unaffiliated issuers were $6,853,786 and $1,200,151,261, respectively. | | | |
| (v) | Affiliated issuer that is available only to investment companies managed by MFS. The rate quoted for the MFS Institutional Money Market Portfolio is the annualized seven-day yield of the fund at period end. | | | |
Portfolio of Investments (unaudited) – continued
| The following abbreviations are used in this report and are defined: |
| ADR | American Depositary Receipt |
| REIT | Real Estate Investment Trust |
| Abbreviations indicate amounts shown in currencies other than the U.S. dollar. All amounts are stated in U.S. dollars unless otherwise indicated. A list of abbreviations is shown below: |
| CAD | Canadian Dollar |
| EUR | Euro |
| GBP | British Pound |
| Derivative Contracts at 6/30/21 |
| Forward Foreign Currency Exchange Contracts |
Currency
Purchased | Currency
Sold | Counterparty | Settlement
Date | Unrealized
Appreciation
(Depreciation) |
| Asset Derivatives |
| USD | 95,404 | CAD | 115,184 | Morgan Stanley Capital Services, Inc. | 7/16/2021 | $ 2,485 |
| USD | 71,481,800 | EUR | 58,647,884 | Barclays Bank PLC | 8/12/2021 | 1,881,876 |
| USD | 1,475,555 | EUR | 1,237,003 | BNP Paribas S.A. | 7/16/2021 | 8,347 |
| USD | 819,120 | EUR | 669,394 | Brown Brothers Harriman | 7/16/2021 | 25,153 |
| USD | 3,332,602 | EUR | 2,766,344 | Citibank N.A. | 7/16/2021 | 51,444 |
| USD | 6,235,856 | EUR | 5,227,125 | Merrill Lynch International | 7/16/2021 | 35,966 |
| USD | 95,335,754 | EUR | 79,799,040 | State Street Bank Corp. | 7/16/2021 | 686,172 |
| USD | 112,787 | GBP | 79,609 | State Street Bank Corp. | 7/16/2021 | 2,660 |
| | | | | | | $2,694,103 |
| Liability Derivatives |
| CAD | 499,067 | USD | 413,667 | BNP Paribas S.A. | 7/16/2021 | $ (11,068) |
| CAD | 518,076 | USD | 427,897 | Brown Brothers Harriman | 7/16/2021 | (9,963) |
| CAD | 205,670 | USD | 167,464 | Merrill Lynch International | 7/16/2021 | (1,550) |
| CAD | 1,238,993 | USD | 1,014,869 | Morgan Stanley Capital Services, Inc. | 7/16/2021 | (15,369) |
| EUR | 227,712 | USD | 276,030 | Brown Brothers Harriman | 7/16/2021 | (5,941) |
| EUR | 62,174 | USD | 74,576 | Citibank N.A. | 7/16/2021 | (831) |
| EUR | 14,834,090 | USD | 17,695,635 | HSBC Bank | 7/16/2021 | (100,932) |
| EUR | 35,130 | USD | 43,004 | Merrill Lynch International | 7/16/2021 | (1,336) |
| USD | 221,573 | CAD | 277,635 | Brown Brothers Harriman | 7/16/2021 | (2,397) |
| USD | 18,736,046 | CAD | 23,614,744 | JPMorgan Chase Bank N.A. | 7/16/2021 | (314,051) |
| USD | 31,953,801 | GBP | 23,260,934 | Goldman Sachs International | 7/16/2021 | (224,425) |
| USD | 398,076 | GBP | 288,520 | Morgan Stanley Capital Services, Inc. | 7/16/2021 | (1,051) |
| USD | 2,614,057 | GBP | 1,901,000 | State Street Bank Corp. | 7/16/2021 | (15,708) |
| | | | | | | $ (704,622) |
At June 30, 2021, the fund had cash collateral of $850,000 to cover any collateral or margin obligations for certain derivative contracts. Restricted cash and/or deposits with brokers in the Statement of Assets and Liabilities are comprised of cash collateral.
See Notes to Financial Statements
| Financial Statements | Statement of Assets and Liabilities (unaudited) |
This statement represents your fund’s balance sheet, which details the assets and liabilities comprising the total value of the fund.
| At 6/30/21Assets | |
| Investments in unaffiliated issuers, at value (identified cost, $887,710,841) | $1,200,151,261 |
| Investments in affiliated issuers, at value (identified cost, $6,853,786) | 6,853,786 |
| Restricted cash for | |
| Forward foreign currency exchange contracts | 850,000 |
| Receivables for | |
| Forward foreign currency exchange contracts | 2,694,103 |
| Investments sold | 610,331 |
| Fund shares sold | 16,035 |
| Interest and dividends | 2,945,099 |
| Other assets | 7,783 |
| Total assets | $1,214,128,398 |
| Liabilities | |
| Payables for | |
| Forward foreign currency exchange contracts | $704,622 |
| Fund shares reacquired | 1,216,985 |
| Payable to affiliates | |
| Investment adviser | 48,798 |
| Administrative services fee | 932 |
| Shareholder servicing costs | 769 |
| Distribution and/or service fees | 9,317 |
| Accrued expenses and other liabilities | 233,445 |
| Total liabilities | $2,214,868 |
| Net assets | $1,211,913,530 |
| Net assets consist of | |
| Paid-in capital | $801,754,151 |
| Total distributable earnings (loss) | 410,159,379 |
| Net assets | $1,211,913,530 |
| Shares of beneficial interest outstanding | 33,655,498 |
| | Net assets | Shares
outstanding | Net asset value
per share |
| Initial Class | $538,205,526 | 14,783,964 | $36.40 |
| Service Class | 673,708,004 | 18,871,534 | 35.70 |
See Notes to Financial Statements
| Financial Statements | Statement of Operations (unaudited) |
This statement describes how much your fund earned in investment income and accrued in expenses. It also describes any gains and/or losses generated by fund operations.
| Six months ended 6/30/21 | |
| Net investment income (loss) | |
| Income | |
| Dividends | $20,371,308 |
| Other | 47,147 |
| Income on securities loaned | 13,382 |
| Dividends from affiliated issuers | 3,140 |
| Foreign taxes withheld | (717,927) |
| Total investment income | $19,717,050 |
| Expenses | |
| Management fee | $4,470,441 |
| Distribution and/or service fees | 839,543 |
| Shareholder servicing costs | 27,442 |
| Administrative services fee | 82,656 |
| Independent Trustees' compensation | 9,439 |
| Custodian fee | 76,160 |
| Shareholder communications | 58,855 |
| Audit and tax fees | 32,230 |
| Legal fees | 4,417 |
| Miscellaneous | 17,923 |
| Total expenses | $5,619,106 |
| Reduction of expenses by investment adviser | (72,192) |
| Net expenses | $5,546,914 |
| Net investment income (loss) | $14,170,136 |
| Realized and unrealized gain (loss) | |
| Realized gain (loss) (identified cost basis) | |
| Unaffiliated issuers | $14,458,841 |
| Forward foreign currency exchange contracts | (2,463,154) |
| Foreign currency | 11,954 |
| Net realized gain (loss) | $12,007,641 |
| Change in unrealized appreciation or depreciation | |
| Unaffiliated issuers (net of $11,101 decrease in deferred country tax) | $2,853,688 |
| Forward foreign currency exchange contracts | 6,742,188 |
| Translation of assets and liabilities in foreign currencies | (43,287) |
| Net unrealized gain (loss) | $9,552,589 |
| Net realized and unrealized gain (loss) | $21,560,230 |
| Change in net assets from operations | $35,730,366 |
See Notes to Financial Statements
| Financial Statements | Statements of Changes in Net Assets |
These statements describe the increases and/or decreases in net assets resulting from operations, any distributions, and any shareholder transactions.
| | Six months ended | Year ended |
| | 6/30/21
(unaudited) | 12/31/20 |
| Change in net assets | | |
| From operations | | |
| Net investment income (loss) | $14,170,136 | $28,889,068 |
| Net realized gain (loss) | 12,007,641 | 30,463,188 |
| Net unrealized gain (loss) | 9,552,589 | (549,017) |
| Change in net assets from operations | $35,730,366 | $58,803,239 |
| Total distributions to shareholders | $— | $(56,937,274) |
| Change in net assets from fund share transactions | $(40,686,181) | $(75,290,012) |
| Total change in net assets | $(4,955,815) | $(73,424,047) |
| Net assets | | |
| At beginning of period | 1,216,869,345 | 1,290,293,392 |
| At end of period | $1,211,913,530 | $1,216,869,345 |
See Notes to Financial Statements
| Financial Statements | Financial Highlights |
The financial highlights table is intended to help you understand the fund's financial performance for the semiannual period and the past 5 fiscal years. Certain information reflects financial results for a single fund share. The total returns in the table represent the rate that an investor would have earned (or lost) on an investment in the fund share class (assuming reinvestment of all distributions) held for the entire period.
| Initial Class | Six months
ended | Year ended |
| | 6/30/21
(unaudited) | 12/31/20 | 12/31/19 | 12/31/18 | 12/31/17 | 12/31/16 |
| Net asset value, beginning of period | $35.33 | $35.18 | $29.38 | $29.50 | $26.81 | $25.56 |
| Income (loss) from investment operations | | | | | | |
| Net investment income (loss) (d) | $0.44 | $0.87 | $0.90 | $0.89 | $0.81 | $1.06(c) |
| Net realized and unrealized gain (loss) | 0.63 | 0.99 | 6.37 | (0.56) | 3.17 | 1.91 |
| Total from investment operations | $1.07 | $1.86 | $7.27 | $0.33 | $3.98 | $2.97 |
| Less distributions declared to shareholders | | | | | | |
| From net investment income | $— | $(0.84) | $(1.37) | $(0.33) | $(1.29) | $(1.08) |
| From net realized gain | — | (0.87) | (0.10) | (0.12) | — | (0.64) |
| Total distributions declared to shareholders | $— | $(1.71) | $(1.47) | $(0.45) | $(1.29) | $(1.72) |
| Net asset value, end of period (x) | $36.40 | $35.33 | $35.18 | $29.38 | $29.50 | $26.81 |
| Total return (%) (k)(r)(s)(x) | 3.03(n) | 5.90 | 25.07 | 1.06 | 14.83 | 11.47(c) |
Ratios (%) (to average net assets)
and Supplemental data: | | | | | | |
| Expenses before expense reductions (f) | 0.79(a) | 0.80 | 0.79 | 0.78 | 0.80 | 0.77(c) |
| Expenses after expense reductions (f) | 0.78(a) | 0.79 | 0.78 | 0.78 | 0.79 | 0.77(c) |
| Net investment income (loss) | 2.49(a) | 2.63 | 2.69 | 2.98 | 2.78 | 3.89(c) |
| Portfolio turnover | 9(n) | 32 | 28 | 27 | 27 | 33 |
| Net assets at end of period (000 omitted) | $538,206 | $537,240 | $556,301 | $492,930 | $561,744 | $556,607 |
See Notes to Financial Statements
Financial Highlights - continued
| Service Class | Six months
ended | Year ended |
| | 6/30/21
(unaudited) | 12/31/20 | 12/31/19 | 12/31/18 | 12/31/17 | 12/31/16 |
| Net asset value, beginning of period | $34.69 | $34.56 | $28.86 | $28.98 | $26.37 | $25.15 |
| Income (loss) from investment operations | | | | | | |
| Net investment income (loss) (d) | $0.39 | $0.77 | $0.80 | $0.81 | $0.73 | $0.97(c) |
| Net realized and unrealized gain (loss) | 0.62 | 0.97 | 6.27 | (0.56) | 3.09 | 1.90 |
| Total from investment operations | $1.01 | $1.74 | $7.07 | $0.25 | $3.82 | $2.87 |
| Less distributions declared to shareholders | | | | | | |
| From net investment income | $— | $(0.74) | $(1.27) | $(0.25) | $(1.21) | $(1.01) |
| From net realized gain | — | (0.87) | (0.10) | (0.12) | — | (0.64) |
| Total distributions declared to shareholders | $— | $(1.61) | $(1.37) | $(0.37) | $(1.21) | $(1.65) |
| Net asset value, end of period (x) | $35.70 | $34.69 | $34.56 | $28.86 | $28.98 | $26.37 |
| Total return (%) (k)(r)(s)(x) | 2.91(n) | 5.62 | 24.80 | 0.81 | 14.49 | 11.24(c) |
Ratios (%) (to average net assets)
and Supplemental data: | | | | | | |
| Expenses before expense reductions (f) | 1.04(a) | 1.05 | 1.04 | 1.04 | 1.05 | 1.02(c) |
| Expenses after expense reductions (f) | 1.03(a) | 1.04 | 1.03 | 1.03 | 1.04 | 1.02(c) |
| Net investment income (loss) | 2.24(a) | 2.38 | 2.44 | 2.76 | 2.53 | 3.64(c) |
| Portfolio turnover | 9(n) | 32 | 28 | 27 | 27 | 33 |
| Net assets at end of period (000 omitted) | $673,708 | $679,629 | $733,992 | $727,201 | $1,021,211 | $998,836 |
| (a) | Annualized. |
| (c) | Amount reflects a one-time reimbursement of expenses by the custodian (or former custodian) without which net investment income and performance would be lower and expenses would be higher. |
| (d) | Per share data is based on average shares outstanding. |
| (f) | Ratios do not reflect reductions from fees paid indirectly, if applicable. |
| (k) | The total return does not reflect expenses that apply to separate accounts. Inclusion of these charges would reduce the total return figures for all periods shown. |
| (n) | Not annualized. |
| (r) | Certain expenses have been reduced without which performance would have been lower. |
| (s) | From time to time the fund may receive proceeds from litigation settlements, without which performance would be lower. |
| (x) | The net asset values and total returns have been calculated on net assets which include adjustments made in accordance with U.S. generally accepted accounting principles required at period end for financial reporting purposes. |
See Notes to Financial Statements
Notes to Financial Statements (unaudited)
(1) Business and Organization
MFS Utilities Series (the fund) is a diversified series of MFS Variable Insurance Trust (the trust). The trust is organized as a Massachusetts business trust and is registered under the Investment Company Act of 1940, as amended, as an open-end management investment company. The shareholders of each series of the trust are separate accounts of insurance companies, which offer variable annuity and/or life insurance products, and qualified retirement and pension plans.
The fund is an investment company and accordingly follows the investment company accounting and reporting guidance of the Financial Accounting Standards Board (FASB) Accounting Standards Codification Topic 946 Financial Services - Investment Companies.
(2) Significant Accounting Policies
General — The preparation of financial statements in conformity with U.S. generally accepted accounting principles requires management to make estimates and assumptions that affect the reported amounts of assets and liabilities, and disclosure of contingent assets and liabilities at the date of the financial statements and the reported amounts of increases and decreases in net assets from operations during the reporting period. Actual results could differ from those estimates. In the preparation of these financial statements, management has evaluated subsequent events occurring after the date of the fund’s Statement of Assets and Liabilities through the date that the financial statements were issued. The fund invests primarily in securities of issuers in the utility industry. Issuers in a single industry can react similarly to market, currency, political, economic, regulatory, geopolitical, environmental, public health, and other conditions. The value of stocks in the utilities sector can be very volatile due to supply and/or demand for services or fuel, financing costs, conservation efforts, the negative impact of regulation, and other factors. The fund invests in foreign securities. Investments in foreign securities are vulnerable to the effects of changes in the relative values of the local currency and the U.S. dollar and to the effects of changes in each country’s market, economic, industrial, political, regulatory, geopolitical, environmental, public health, and other conditions.
Certain of the fund's investments, derivatives, debt and other contracts may be based on reference interest rates such as the London Interbank Offered Rate (“LIBOR”). In 2017, the regulatory authority that oversees financial services firms in the United Kingdom announced plans to transition away from LIBOR by the end of 2021. In March 2021, the administrator of LIBOR announced the extension of the publication of the more commonly used U.S. dollar LIBOR settings to the end of June 2023. Although the full impacts of the transition away from LIBOR are not fully known, the transition may result in, among other things, an increase in volatility or illiquidity of the markets for instruments that currently rely on LIBOR to determine interest rates and this could have an adverse impact on the fund's performance. With respect to the fund's accounting for investments, derivatives, debt and other contracts that undergo reference rate-related modifications as a result of the transition, management will rely upon the relief provided by FASB Codification Topic 848 – Reference Rate Reform (Topic 848). The guidance in Topic 848 permits the fund to disregard the GAAP accounting requirements around certain contract modifications resulting from the LIBOR transition such that for contracts considered in scope, the fund can account for those modified contracts as a continuation of the existing contracts.
Balance Sheet Offsetting — The fund's accounting policy with respect to balance sheet offsetting is that, absent an event of default by the counterparty or a termination of the agreement, the International Swaps and Derivatives Association (ISDA) Master Agreement, or similar agreement, does not result in an offset of reported amounts of financial assets and financial liabilities in the Statement of Assets and Liabilities across transactions between the fund and the applicable counterparty. The fund's right to setoff may be restricted or prohibited by the bankruptcy or insolvency laws of the particular jurisdiction to which a specific master netting agreement counterparty is subject. Balance sheet offsetting disclosures, to the extent applicable to the fund, have been included in the fund’s Significant Accounting Policies note under the captions for each of the fund’s in-scope financial instruments and transactions.
Investment Valuations — Equity securities, including restricted equity securities, are generally valued at the last sale or official closing price on their primary market or exchange as provided by a third-party pricing service. Equity securities, for which there were no sales reported that day, are generally valued at the last quoted daily bid quotation on their primary market or exchange as provided by a third-party pricing service. Short-term instruments with a maturity at issuance of 60 days or less may be valued at amortized cost, which approximates market value. Forward foreign currency exchange contracts are generally valued at the mean of bid and asked prices for the time period interpolated from rates provided by a third-party pricing service for proximate time periods.
Open-end investment companies are generally valued at net asset value per share. Securities and other assets generally valued on the basis of information from a third-party pricing service may also be valued at a broker/dealer bid quotation. In determining values, third-party pricing services can utilize both transaction data and market information such as yield, quality, coupon rate, maturity, type of issue, trading characteristics, and other market data. The values of foreign securities and other assets and liabilities expressed in foreign currencies are converted to U.S. dollars using the mean of bid and asked prices for rates provided by a third-party pricing service.
Notes to Financial Statements (unaudited) - continued
The Board of Trustees has delegated primary responsibility for determining or causing to be determined the value of the fund’s investments (including any fair valuation) to the adviser pursuant to valuation policies and procedures approved by the Board. If the adviser determines that reliable market quotations are not readily available, investments are valued at fair value as determined in good faith by the adviser in accordance with such procedures under the oversight of the Board of Trustees. Under the fund’s valuation policies and procedures, market quotations are not considered to be readily available for most types of debt instruments and floating rate loans and many types of derivatives. These investments are generally valued at fair value based on information from third-party pricing services. In addition, investments may be valued at fair value if the adviser determines that an investment’s value has been materially affected by events occurring after the close of the exchange or market on which the investment is principally traded (such as foreign exchange or market) and prior to the determination of the fund’s net asset value, or after the halt of trading of a specific security where trading does not resume prior to the close of the exchange or market on which the security is principally traded. Events that occur after foreign markets close (such as developments in foreign markets and significant movements in the U.S. markets) and prior to the determination of the fund’s net asset value may be deemed to have a material effect on the value of securities traded in foreign markets. Accordingly, the fund’s foreign equity securities may often be valued at fair value. The adviser generally relies on third-party pricing services or other information (such as the correlation with price movements of similar securities in the same or other markets; the type, cost and investment characteristics of the security; the business and financial condition of the issuer; and trading and other market data) to assist in determining whether to fair value and at what value to fair value an investment. The value of an investment for purposes of calculating the fund’s net asset value can differ depending on the source and method used to determine value. When fair valuation is used, the value of an investment used to determine the fund’s net asset value may differ from quoted or published prices for the same investment. There can be no assurance that the fund could obtain the fair value assigned to an investment if it were to sell the investment at the same time at which the fund determines its net asset value per share.
Various inputs are used in determining the value of the fund's assets or liabilities. These inputs are categorized into three broad levels. In certain cases, the inputs used to measure fair value may fall into different levels of the fair value hierarchy. In such cases, an investment's level within the fair value hierarchy is based on the lowest level of input that is significant to the fair value measurement. The fund's assessment of the significance of a particular input to the fair value measurement in its entirety requires judgment, and considers factors specific to the investment. Level 1 includes unadjusted quoted prices in active markets for identical assets or liabilities. Level 2 includes other significant observable market-based inputs (including quoted prices for similar securities, interest rates, prepayment speed, and credit risk). Level 3 includes unobservable inputs, which may include the adviser's own assumptions in determining the fair value of investments. Other financial instruments are derivative instruments, such as forward foreign currency exchange contracts. The following is a summary of the levels used as of June 30, 2021 in valuing the fund's assets or liabilities:
| Financial Instruments | Level 1 | Level 2 | Level 3 | Total |
| Equity Securities | $1,200,151,261 | $— | $— | $1,200,151,261 |
| Mutual Funds | 6,853,786 | — | — | 6,853,786 |
| Total | $1,207,005,047 | $— | $— | $1,207,005,047 |
| Other Financial Instruments | | | | |
| Forward Foreign Currency Exchange Contracts – Assets | $— | $2,694,103 | $— | $2,694,103 |
| Forward Foreign Currency Exchange Contracts – Liabilities | — | (704,622) | — | (704,622) |
For further information regarding security characteristics, see the Portfolio of Investments.
Foreign Currency Translation — Purchases and sales of foreign investments, income, and expenses are converted into U.S. dollars based upon currency exchange rates prevailing on the respective dates of such transactions or on the reporting date for foreign denominated receivables and payables. Gains and losses attributable to foreign currency exchange rates on sales of securities are recorded for financial statement purposes as net realized gains and losses on investments. Gains and losses attributable to foreign exchange rate movements on receivables, payables, income and expenses are recorded for financial statement purposes as foreign currency transaction gains and losses. That portion of both realized and unrealized gains and losses on investments that results from fluctuations in foreign currency exchange rates is not separately disclosed.
Derivatives — The fund uses derivatives primarily to increase or decrease exposure to a particular market or segment of the market, or security, to increase or decrease interest rate or currency exposure, or as alternatives to direct investments. Derivatives are used for hedging or non-hedging purposes. While hedging can reduce or eliminate losses, it can also reduce or eliminate gains. When the fund uses derivatives as an investment to increase market exposure, or for hedging purposes, gains and losses from derivative instruments may be substantially greater than the derivative’s original cost.
Notes to Financial Statements (unaudited) - continued
The derivative instruments used by the fund during the period were forward foreign currency exchange contracts. Depending on the type of derivative, a fund may exit a derivative position by entering into an offsetting transaction with a counterparty or exchange, negotiating an agreement with the derivative counterparty, or novating the position to a third party. The fund's period end derivatives, as presented in the Portfolio of Investments and the associated Derivative Contract tables, generally are indicative of the volume of its derivative activity during the period.
The following table presents, by major type of derivative contract, the fair value, on a gross basis, of the asset and liability components of derivatives held by the fund at June 30, 2021 as reported in the Statement of Assets and Liabilities:
| | | Fair Value |
| Risk | Derivative Contracts | Asset Derivatives | Liability Derivatives |
| Foreign Exchange | Forward Foreign Currency Exchange Contracts | $2,694,103 | $(704,622) |
The following table presents, by major type of derivative contract, the realized gain (loss) on derivatives held by the fund for the six months ended June 30, 2021 as reported in the Statement of Operations:
| Risk | Forward Foreign Currency Exchange
Contracts |
| Foreign Exchange | $(2,463,154) |
The following table presents, by major type of derivative contract, the change in unrealized appreciation or depreciation on derivatives held by the fund for the six months ended June 30, 2021 as reported in the Statement of Operations:
| Risk | Forward Foreign Currency Exchange
Contracts |
| Foreign Exchange | $6,742,188 |
Derivative counterparty credit risk is managed through formal evaluation of the creditworthiness of all potential counterparties. On certain, but not all, uncleared derivatives, the fund attempts to reduce its exposure to counterparty credit risk whenever possible by entering into an ISDA Master Agreement on a bilateral basis. The ISDA Master Agreement gives each party to the agreement the right to terminate all transactions traded under such agreement if there is a specified deterioration in the credit quality of the other party. Upon an event of default or a termination of the ISDA Master Agreement, the non-defaulting party has the right to close out all transactions traded under such agreement and to net amounts owed under each agreement to one net amount payable by one party to the other. This right to close out and net payments across all transactions traded under the ISDA Master Agreement could result in a reduction of the fund's credit risk to such counterparty equal to any amounts payable by the fund under the applicable transactions, if any.
Collateral and margin requirements differ by type of derivative. For cleared derivatives (e.g., futures contracts, cleared swaps, and exchange-traded options), margin requirements are set by the clearing broker and the clearing house and collateral, in the form of cash or securities, is posted by the fund directly with the clearing broker. Collateral terms are counterparty agreement specific for uncleared derivatives (e.g., forward foreign currency exchange contracts, uncleared swap agreements, and uncleared options) and collateral, in the form of cash and securities, is held in segregated accounts with the fund's custodian in connection with these agreements. For derivatives traded under an ISDA Master Agreement, which contains a collateral support annex, the collateral requirements are netted across all transactions traded under such counterparty-specific agreement and an amount is posted from one party to the other to collateralize such obligations. Cash that has been segregated or delivered to cover the fund's collateral or margin obligations under derivative contracts, if any, will be reported separately in the Statement of Assets and Liabilities as restricted cash for uncleared derivatives and/or deposits with brokers for cleared derivatives. Securities pledged as collateral or margin for the same purpose, if any, are noted in the Portfolio of Investments. The fund may be required to make payments of interest on uncovered collateral or margin obligations with the broker. Any such payments are included in “Miscellaneous” expense in the Statement of Operations.
Forward Foreign Currency Exchange Contracts — The fund entered into forward foreign currency exchange contracts for the purchase or sale of a specific foreign currency at a fixed price on a future date. These contracts may be used to hedge the fund’s currency risk or for non-hedging purposes. For hedging purposes, the fund may enter into contracts to deliver or receive foreign currency that the fund will receive from or use in its normal investment activities. The fund may also use contracts to hedge against declines in the value of foreign currency denominated securities due to unfavorable exchange rate movements. For non-hedging purposes, the fund may enter into contracts with the intent of changing the relative exposure of the fund’s portfolio of securities to different currencies to take advantage of anticipated exchange rate changes.
Notes to Financial Statements (unaudited) - continued
Forward foreign currency exchange contracts are adjusted by the daily exchange rate of the underlying currency and any unrealized gains or losses are recorded as a receivable or payable for forward foreign currency exchange contracts until the contract settlement date. On contract settlement date, any gain or loss on the contract is recorded as realized gains or losses on forward foreign currency exchange contracts.
Risks may arise upon entering into these contracts from unanticipated movements in the value of the contract and from the potential inability of counterparties to meet the terms of their contracts. Generally, the fund’s maximum risk due to counterparty credit risk is the unrealized gain on the contract due to the use of Continuous Linked Settlement, a multicurrency cash settlement system for the centralized settlement of foreign transactions. This risk is mitigated in cases where there is an ISDA Master Agreement between the fund and the counterparty providing for netting as described above and, where applicable, by the posting of collateral by the counterparty to the fund to cover the fund’s exposure to the counterparty under such ISDA Master Agreement.
Security Loans — Under its Securities Lending Agency Agreement with the fund, State Street Bank and Trust Company, as lending agent, loans the securities of the fund to certain qualified institutions (the “Borrowers”) approved by the fund. Security loans can be terminated at the discretion of either the lending agent or the fund and the related securities must be returned within the earlier of the standard trade settlement period for such securities or within three business days. The loans are collateralized by cash and/or U.S. Treasury and federal agency obligations in an amount typically at least equal to the market value of the securities loaned. On loans collateralized by cash, the cash collateral is invested in a money market fund. The market value of the loaned securities is determined at the close of business of the fund and any additional required collateral is delivered to the fund on the next business day. The lending agent provides the fund with indemnification against Borrower default. In the event of Borrower default, the lending agent will, for the benefit of the fund, either purchase securities identical to those loaned or, when such purchase is commercially impracticable, pay the fund the market value of the loaned securities. In return, the lending agent assumes the fund's rights to the related collateral. If the collateral value is less than the cost to purchase identical securities, the lending agent is responsible for the shortfall, but only to the extent that such shortfall is not due to a decline in collateral value resulting from collateral reinvestment for which the fund bears the risk of loss. A portion of the income generated upon investment of the collateral is remitted to the Borrowers, and the remainder is allocated between the fund and the lending agent. On loans collateralized by U.S. Treasury and/or federal agency obligations, a fee is received from the Borrower, and is allocated between the fund and the lending agent. Income from securities lending is separately reported in the Statement of Operations. The dividend and interest income earned on the securities loaned is accounted for in the same manner as other dividend and interest income. At June 30, 2021, there were no securities on loan or collateral outstanding.
Indemnifications — Under the fund's organizational documents, its officers and Trustees may be indemnified against certain liabilities and expenses arising out of the performance of their duties to the fund. Additionally, in the normal course of business, the fund enters into agreements with service providers that may contain indemnification clauses. The fund's maximum exposure under these agreements is unknown as this would involve future claims that may be made against the fund that have not yet occurred.
Investment Transactions and Income — Investment transactions are recorded on the trade date. Interest income is recorded on the accrual basis. Dividends received in cash are recorded on the ex-dividend date. Certain dividends from foreign securities will be recorded when the fund is informed of the dividend if such information is obtained subsequent to the ex-dividend date. Dividend payments received in additional securities are recorded on the ex-dividend date in an amount equal to the value of the security on such date.
The fund may receive proceeds from litigation settlements. Any proceeds received from litigation involving portfolio holdings are reflected in the Statement of Operations in realized gain/loss if the security has been disposed of by the fund or in unrealized gain/loss if the security is still held by the fund. Any other proceeds from litigation not related to portfolio holdings are reflected as other income in the Statement of Operations.
Tax Matters and Distributions — The fund intends to qualify as a regulated investment company, as defined under Subchapter M of the Internal Revenue Code, and to distribute all of its taxable income, including realized capital gains. As a result, no provision for federal income tax is required. The fund’s federal tax returns, when filed, will remain subject to examination by the Internal Revenue Service for a three year period. Management has analyzed the fund’s tax positions taken on federal and state tax returns for all open tax years and does not believe that there are any uncertain tax positions that require recognition of a tax liability. Foreign taxes, if any, have been accrued by the fund in the accompanying financial statements in accordance with the applicable foreign tax law. Foreign income taxes may be withheld by certain countries in which the fund invests. Additionally, capital gains realized by the fund on securities issued in or by certain foreign countries may be subject to capital gains tax imposed by those countries.
Notes to Financial Statements (unaudited) - continued
Distributions to shareholders are recorded on the ex-dividend date. Income and capital gain distributions are determined in accordance with income tax regulations, which may differ from U.S. generally accepted accounting principles. Certain capital accounts in the financial statements are periodically adjusted for permanent differences in order to reflect their tax character. These adjustments have no impact on net assets or net asset value per share. Temporary differences which arise from recognizing certain items of income, expense, gain or loss in different periods for financial statement and tax purposes will reverse at some time in the future.
Book/tax differences primarily relate to wash sale loss deferrals, derivative transactions, partnership adjustments, and certain preferred stock treated as debt for tax purposes.
The tax character of distributions declared to shareholders for the last fiscal year is as follows:
| | Year ended
12/31/20 |
| Ordinary income (including any short-term capital gains) | $35,969,261 |
| Long-term capital gains | 20,968,013 |
| Total distributions | $56,937,274 |
The federal tax cost and the tax basis components of distributable earnings were as follows:
| As of 6/30/21 | |
| Cost of investments | $865,673,674 |
| Gross appreciation | 350,476,005 |
| Gross depreciation | (9,144,632) |
| Net unrealized appreciation (depreciation) | $341,331,373 |
| As of 12/31/20 | |
| Undistributed ordinary income | 21,343,618 |
| Undistributed long-term capital gain | 35,823,036 |
| Other temporary differences | (22,309,943) |
| Net unrealized appreciation (depreciation) | 339,572,302 |
The aggregate cost above includes prior fiscal year end tax adjustments, if applicable.
Multiple Classes of Shares of Beneficial Interest — The fund offers multiple classes of shares, which differ in their respective distribution and/or service fees. The fund's income, realized and unrealized gain (loss), and common expenses are allocated to shareholders based on the daily net assets of each class. Dividends are declared separately for each class. Differences in per share dividend rates are generally due to differences in separate class expenses. The fund’s distributions declared to shareholders as reported in the Statements of Changes in Net Assets are presented by class as follows:
| | Six months
ended
6/30/21 | | Year
ended
12/31/20 |
| Initial Class | $— | | $25,547,426 |
| Service Class | — | | 31,389,848 |
| Total | $— | | $56,937,274 |
(3) Transactions with Affiliates
Investment Adviser — The fund has an investment advisory agreement with MFS to provide overall investment management and related administrative services and facilities to the fund. The management fee is computed daily and paid monthly at the following annual rates based on the fund's average daily net assets:
| Up to $1 billion | 0.75% |
| In excess of $1 billion and up to $3 billion | 0.70% |
| In excess of $3 billion | 0.65% |
Notes to Financial Statements (unaudited) - continued
MFS has agreed in writing to reduce its management fee by a specified amount if certain MFS mutual fund assets exceed thresholds agreed to by MFS and the fund's Board of Trustees. For the six months ended June 30, 2021, this management fee reduction amounted to $72,192, which is included in the reduction of total expenses in the Statement of Operations. The management fee incurred for the six months ended June 30, 2021 was equivalent to an annual effective rate of 0.73% of the fund's average daily net assets.
Distributor — MFS Fund Distributors, Inc. (MFD), a wholly-owned subsidiary of MFS, is the distributor of shares of the fund. The Trustees have adopted a distribution plan for the Service Class shares pursuant to Rule 12b-1 under the Investment Company Act of 1940.
The fund's distribution plan provides that the fund will pay MFD distribution and/or service fees equal to 0.25% per annum of its average daily net assets attributable to Service Class shares as partial consideration for services performed and expenses incurred by MFD and financial intermediaries (including participating insurance companies that invest in the fund to fund variable annuity and variable life insurance contracts, sponsors of qualified retirement and pension plans that invest in the fund, and affiliates of these participating insurance companies and plan sponsors) in connection with the sale and distribution of the Service Class shares. MFD may subsequently pay all, or a portion, of the distribution and/or service fees to financial intermediaries.
Shareholder Servicing Agent — MFS Service Center, Inc. (MFSC), a wholly-owned subsidiary of MFS, receives a fee from the fund for its services as shareholder servicing agent. For the six months ended June 30, 2021, the fee was $25,988, which equated to 0.0043% annually of the fund's average daily net assets. MFSC also receives reimbursement from the fund for out-of-pocket expenses paid by MFSC on behalf of the fund. For the six months ended June 30, 2021, these costs amounted to $1,454.
Administrator — MFS provides certain financial, legal, shareholder communications, compliance, and other administrative services to the fund. Under an administrative services agreement, the fund reimburses MFS the costs incurred to provide these services. The fund is charged an annual fixed amount of $17,500 plus a fee based on average daily net assets. The administrative services fee incurred for the six months ended June 30, 2021 was equivalent to an annual effective rate of 0.0137% of the fund's average daily net assets.
Trustees’ and Officers’ Compensation — The fund pays compensation to independent Trustees in the form of a retainer, attendance fees, and additional compensation to Board and Committee chairpersons. The fund does not pay compensation directly to Trustees or officers of the fund who are also officers of the investment adviser, all of whom receive remuneration from MFS for their services to the fund. Certain officers and Trustees of the fund are officers or directors of MFS, MFD, and MFSC.
Other — The fund invests in the MFS Institutional Money Market Portfolio which is managed by MFS and seeks current income consistent with preservation of capital and liquidity. This money market fund does not pay a management fee to MFS but does incur investment and operating costs.
The fund is permitted to engage in purchase and sale transactions with funds and accounts for which MFS serves as investment adviser or sub-adviser (“cross-trades”) pursuant to a policy adopted by the Board of Trustees. This policy has been designed to ensure that cross-trades conducted by the fund comply with Rule 17a-7 under the Investment Company Act of 1940. During the six months ended June 30, 2021, the fund engaged in sale transactions pursuant to this policy, which amounted to $1,219,147, respectively. The sales transactions resulted in net realized gains (losses) of $185,143.
The adviser has voluntarily undertaken to reimburse the fund from its own resources on a quarterly basis for the cost of investment research embedded in the cost of the fund’s securities trades. This agreement may be rescinded at any time. For the six months ended June 30, 2021, this reimbursement amounted to $46,990, which is included in “Other” income in the Statement of Operations.
(4) Portfolio Securities
For the six months ended June 30, 2021, purchases and sales of investments, other than short-term obligations, aggregated $102,876,177 and $133,813,032, respectively.
(5) Shares of Beneficial Interest
The fund's Declaration of Trust permits the Trustees to issue an unlimited number of full and fractional shares of beneficial interest. Transactions in fund shares were as follows:
Notes to Financial Statements (unaudited) - continued
| | Six months ended
6/30/21 | | Year ended
12/31/20 |
| | Shares | Amount | | Shares | Amount |
| Shares sold | | | | | |
| Initial Class | 344,927 | $12,297,484 | | 693,191 | $22,914,614 |
| Service Class | 731,526 | 25,779,753 | | 1,582,964 | 49,564,692 |
| | 1,076,453 | $38,077,237 | | 2,276,155 | $72,479,306 |
Shares issued to shareholders
in reinvestment of distributions | | | | | |
| Initial Class | — | $— | | 813,353 | $25,547,426 |
| Service Class | — | — | | 1,016,840 | 31,389,848 |
| | — | $— | | 1,830,193 | $56,937,274 |
| Shares reacquired | | | | | |
| Initial Class | (768,663) | $(27,604,790) | | (2,109,750) | $(69,285,092) |
| Service Class | (1,453,930) | (51,158,628) | | (4,245,334) | (135,421,500) |
| | (2,222,593) | $(78,763,418) | | (6,355,084) | $(204,706,592) |
| Net change | | | | | |
| Initial Class | (423,736) | $(15,307,306) | | (603,206) | $(20,823,052) |
| Service Class | (722,404) | (25,378,875) | | (1,645,530) | (54,466,960) |
| | (1,146,140) | $(40,686,181) | | (2,248,736) | $(75,290,012) |
(6) Line of Credit
The fund and certain other funds managed by MFS participate in a $1.25 billion unsecured committed line of credit of which $1 billion is reserved for use by the fund and certain other MFS U.S. funds. The line of credit is provided by a syndicate of banks under a credit agreement. Borrowings may be made for temporary financing needs. Interest is charged to each fund, based on its borrowings, generally at a rate equal to the highest of one month LIBOR, the Federal Funds Effective Rate and the Overnight Bank Funding Rate, plus an agreed upon spread. A commitment fee, based on the average daily, unused portion of the committed line of credit, is allocated among the participating funds. In addition, the fund and other funds managed by MFS have established unsecured uncommitted borrowing arrangements with certain banks for temporary financing needs. Interest is charged to each fund, based on its borrowings, at rates equal to customary reference rates plus an agreed upon spread. For the six months ended June 30, 2021, the fund’s commitment fee and interest expense were $2,457 and $0, respectively, and are included in “Miscellaneous” expense in the Statement of Operations.
(7) Investments in Affiliated Issuers
An affiliated issuer may be considered one in which the fund owns 5% or more of the outstanding voting securities, or a company which is under common control. For the purposes of this report, the following were affiliated issuers:
| Affiliated Issuers | Beginning
Value | Purchases | Sales
Proceeds | Realized
Gain
(Loss) | Change in
Unrealized
Appreciation or
Depreciation | Ending
Value |
| MFS Institutional Money Market Portfolio | $4,847,086 | $72,684,686 | $70,677,986 | $— | $— | $6,853,786 |
| Affiliated Issuers | Dividend
Income | Capital Gain
Distributions |
| MFS Institutional Money Market Portfolio | $3,140 | $— |
(8) Impacts of COVID-19
The pandemic related to the global spread of novel coronavirus disease (COVID-19), which was first detected in December 2019, has resulted in significant disruptions to global business activity and the global economy, as well as the economies of individual countries, the financial performance of individual companies and sectors, and the securities and commodities markets in general. Multiple
Notes to Financial Statements (unaudited) - continued
surges in cases globally, the availability and widespread adoption of vaccines, and the emergence of variant strains of the virus continue to create uncertainty as to the future and long-term impacts resulting from the pandemic including impacts to the prices and liquidity of the fund's investments and the fund's performance.
Statement Regarding Liquidity Risk Management Program
The fund has adopted and implemented a liquidity risk management program (the “Program”) as required by Rule 22e-4 under the Investment Company Act of 1940, as amended. The fund’s Board of Trustees (the “Board”) has designated MFS as the administrator of the Program. The Program is reasonably designed to assess and manage the liquidity risk of the fund. Liquidity risk is the risk that the fund could not meet requests to redeem shares issued by the fund without significant dilution of remaining investors' interests.
MFS provided a written report to the Board for consideration at its April 2021 meeting that addressed the operation of the Program and provided an assessment of the adequacy and effectiveness of the Program during the period from January 1, 2020 to December 31, 2020 (the “Covered Period”). The report concluded that during the Covered Period the Program had operated effectively and had adequately and effectively been implemented to assess and manage the fund’s liquidity risk. MFS also reported that there were no liquidity events that impacted the fund or its ability to timely meet redemptions without dilution to existing shareholders during the Covered Period.
There can be no assurance that the Program will achieve its objectives in the future. Further information on liquidity risk, and other principal risks to which an investment in the fund may be subject, can be found in the prospectus.
Proxy Voting Policies and Information
MFS votes proxies on behalf of the fund pursuant to proxy voting policies and procedures that are available without charge, upon request, by calling 1-800-225-2606, by visiting mfs.com/proxyvoting, or by visiting the SEC’s Web site at http://www.sec.gov.
Information regarding how the fund voted proxies relating to portfolio securities during the most recent twelve-month period ended June 30 is available by August 31 of each year without charge by visiting mfs.com/proxyvoting, or by visiting the SEC’s Web site at http://www.sec.gov.
Quarterly Portfolio Disclosure
The fund files a complete schedule of portfolio holdings with the SEC for the first and third quarters of each fiscal year as an exhibit to its reports on Form N-PORT. The fund’s Form N-PORT reports are available on the SEC’s Web site at http://www.sec.gov. A shareholder can obtain the portfolio holdings report for the first and third quarters of the fund's fiscal year at mfs.com/vit1 by choosing the fund's name and then scrolling to the “Resources” section and clicking on the “Prospectus and Reports” tab.
FURTHER INFORMATION
From time to time, MFS may post important information about the fund or the MFS Funds on the MFS Web site (mfs.com). This information is available at https://www.mfs.com/announcements or at mfs.com/vit1 by choosing the fund's name and then scrolling to the “Resources” section and clicking on the “Announcements” tab, if any.
Information About Fund Contracts and Legal Claims
The fund has entered into contractual arrangements with an investment adviser, administrator, distributor, shareholder servicing agent, 529 program manager (if applicable), and custodian who each provide services to the fund. Unless expressly stated otherwise, shareholders are not parties to, or intended beneficiaries of these contractual arrangements, and these contractual arrangements are not intended to create any shareholder right to enforce them against the service providers or to seek any remedy under them against the service providers, either directly or on behalf of the fund.
Under the Trust’s By-Laws and Declaration of Trust, any claims asserted against or on behalf of the MFS Funds, including claims against Trustees and Officers, must be brought in state and federal courts located within the Commonwealth of Massachusetts.
Semiannual Report
June 30, 2021
MFS® Variable Insurance Trust
The report is prepared for the general information of contract owners. It is authorized for distribution to prospective investors only when preceded or accompanied by a current prospectus.
NOT FDIC INSURED • MAY LOSE VALUE • NO BANK OR CREDIT UNION GUARANTEE •
NOT A DEPOSIT • NOT INSURED BY ANY FEDERAL GOVERNMENT AGENCY OR NCUA/NCUSIF
Dear Contract Owners:
After experiencing dramatic swings in the early days of the coronavirus pandemic, global equity markets have performed strongly over the past year. Though the speedy development of vaccines brightened the economic and market outlook, uncertainty remains as new variants of the virus appear, and questions persist over how fast vaccines can be made widely available in the developing world.
Global central banks have taken aggressive steps to cushion the economic and market fallout related to the virus, and governments are deploying unprecedented levels of fiscal support. Having passed a $1.9 trillion stimulus package in March, the U.S. Congress could approve additional stimulus later this year, some of it focused on infrastructure. Along with extraordinary government expenditures, pent-up consumer demand fueled a surge in economic activity as coronavirus restrictions were eased, pushing up inflation, at least temporarily. Markets initially reacted by pushing up yields on global government bonds, though some of the rate rise has since been corrected.
A spirited debate is underway among investors over whether the current price pressures will persist or prove to be temporary, caused by pandemic-induced bottlenecks. The policy measures put in place to counteract the pandemic's effects have helped build a supportive environment and are encouraging economic recovery; however, if markets disconnect from fundamentals, they can sow the seeds of instability. As such, recent dramatic increases in speculative trading in cryptocurrencies, special purpose acquisition companies (SPACs), and the like bear watching.
In the aftermath of the crisis, we could see societal changes as households, businesses, and governments adjust to a new reality, and any such alterations could affect the investment landscape. For investors, events such as the COVID-19 outbreak demonstrate the importance of having a deep understanding of company fundamentals, and we have built our global research platform to do just that.
At MFS®, we put our clients’ assets to work responsibly by carefully navigating the increasing complexity of global markets and economies. Guided by our long-term philosophy and adhering to our commitment to sustainable investing, we tune out the noise and aim to uncover what we believe are the best, most durable investment opportunities in the market. Our unique global investment platform combines collective expertise, long-term discipline, and thoughtful risk management to create sustainable value for investors.
Respectfully,
Michael W. Roberge
Chief Executive Officer
MFS Investment Management
August 13, 2021
The opinions expressed in this letter are subject to change and may not be relied upon for investment advice. No forecasts can be guaranteed.
Portfolio structure
Top ten holdings
| JPMorgan Chase & Co. | 4.4% |
| Johnson & Johnson | 3.5% |
| Comcast Corp., “A” | 3.2% |
| Texas Instruments, Inc. | 2.6% |
| Accenture PLC, “A” | 2.6% |
| Honeywell International, Inc. | 2.5% |
| Medtronic PLC | 2.5% |
| Aon PLC | 2.3% |
| Cigna Corp. | 2.2% |
| Duke Energy Corp. | 2.1% |
GICS equity sectors (g)
| Financials | 27.5% |
| Health Care | 18.3% |
| Industrials | 17.6% |
| Information Technology | 9.7% |
| Consumer Staples | 7.3% |
| Utilities | 6.2% |
| Materials | 3.9% |
| Communication Services | 3.5% |
| Energy | 2.5% |
| Consumer Discretionary | 1.8% |
| Real Estate | 0.4% |
| (g) | The Global Industry Classification Standard (GICS®) was developed by and/or is the exclusive property of MSCI, Inc. and S&P Global Market Intelligence Inc. (“S&P Global Market Intelligence”). GICS is a service mark of MSCI and S&P Global Market Intelligence and has been licensed for use by MFS. MFS has applied its own internal sector/industry classification methodology for equity securities and non-equity securities that are unclassified by GICS. |
Cash & Cash Equivalents includes any cash, investments in money market funds, short-term securities, and other assets less liabilities. Please see the Statement of Assets and Liabilities for additional information related to the fund’s cash position and other assets and liabilities.
Percentages are based on net assets as of June 30, 2021.
The portfolio is actively managed and current holdings may be different.
Expense Table
Fund Expenses Borne by the Contract Holders during the Period,
January 1, 2021 through June 30, 2021
As a contract holder of the fund, you incur ongoing costs, including management fees; distribution and/or service (12b-1) fees; and other fund expenses. This example is intended to help you understand your ongoing costs (in dollars) of investing in the fund and to compare these costs with the ongoing costs of investing in other mutual funds.
The example is based on an investment of $1,000 invested at the beginning of the period and held for the entire period January 1, 2021 through June 30, 2021.
Actual Expenses
The first line for each share class in the following table provides information about actual account values and actual expenses. You may use the information in this line, together with the amount you invested, to estimate the expenses that you paid over the period. Simply divide your account value by $1,000 (for example, an $8,600 account value divided by $1,000 = 8.6), then multiply the result by the number in the first line under the heading entitled “Expenses Paid During Period” to estimate the expenses you paid on your account during this period.
Hypothetical Example for Comparison Purposes
The second line for each share class in the following table provides information about hypothetical account values and hypothetical expenses based on the fund’s actual expense ratio and an assumed rate of return of 5% per year before expenses, which is not the fund’s actual return. The hypothetical account values and expenses may not be used to estimate the actual ending account balance or expenses you paid for the period. You may use this information to compare the ongoing costs of investing in the fund and other funds. To do so, compare this 5% hypothetical example with the 5% hypothetical examples that appear in the shareholder reports of the other funds.
Please note that the expenses shown in the table are meant to highlight the fund's ongoing costs only and do not take into account the fees and expenses imposed under the variable contracts through which your investment in the fund is made. Therefore, the second line for each share class in the table is useful in comparing ongoing costs associated with an investment in vehicles (such as the fund) which fund benefits under variable annuity and variable life insurance contracts and to qualified pension and retirement plans only, and will not help you determine the relative total costs of investing in the fund through variable annuity and variable life insurance contracts. If the fees and expenses imposed under the variable contracts were included, your costs would have been higher.
Share
Class | | Annualized
Expense
Ratio | Beginning
Account Value
1/01/21 | Ending
Account Value
6/30/21 | Expenses
Paid During
Period (p)
1/01/21-6/30/21 |
| Initial Class | Actual | 0.71% | $1,000.00 | $1,148.04 | $3.78 |
| Hypothetical (h) | 0.71% | $1,000.00 | $1,021.27 | $3.56 |
| Service Class | Actual | 0.96% | $1,000.00 | $1,146.79 | $5.11 |
| Hypothetical (h) | 0.96% | $1,000.00 | $1,020.03 | $4.81 |
| (h) | 5% class return per year before expenses. |
| (p) | “Expenses Paid During Period” are equal to each class's annualized expense ratio, as shown above, multiplied by the average account value over the period, multiplied by 181/365 (to reflect the one-half year period). |
Portfolio of Investments − 6/30/21 (unaudited)
The Portfolio of Investments is a complete list of all securities owned by your fund. It is categorized by broad-based asset classes.
| Issuer | | | Shares/Par | Value ($) |
| Common Stocks – 98.7% |
| Aerospace & Defense – 6.1% | |
| Honeywell International, Inc. | | 306,429 | $ 67,215,201 |
| Lockheed Martin Corp. | | 63,336 | 23,963,176 |
| Northrop Grumman Corp. | | 147,454 | 53,589,207 |
| Raytheon Technologies Corp. | | 217,113 | 18,521,910 |
| | | | | $163,289,494 |
| Alcoholic Beverages – 1.5% | |
| Diageo PLC | | 834,591 | $ 39,956,889 |
| Brokerage & Asset Managers – 3.7% | |
| BlackRock, Inc. | | 46,104 | $ 40,339,617 |
| NASDAQ, Inc. | | 270,415 | 47,538,957 |
| T. Rowe Price Group, Inc. | | 50,710 | 10,039,059 |
| | | | | $97,917,633 |
| Business Services – 5.9% | |
| Accenture PLC, “A” | | 237,009 | $ 69,867,883 |
| Equifax, Inc. | | 140,789 | 33,720,373 |
| Fidelity National Information Services, Inc. | | 214,119 | 30,334,239 |
| Fiserv, Inc. (a) | | 209,874 | 22,433,432 |
| | | | | $156,355,927 |
| Cable TV – 3.2% | |
| Comcast Corp., “A” | | 1,478,062 | $ 84,279,095 |
| Chemicals – 1.8% | |
| PPG Industries, Inc. | | 287,135 | $ 48,746,909 |
| Construction – 3.5% | |
| Masco Corp. | | 368,140 | $ 21,687,127 |
| Otis Worldwide Corp. | | 108,554 | 8,876,461 |
| Sherwin-Williams Co. | | 114,364 | 31,158,472 |
| Stanley Black & Decker, Inc. | | 155,160 | 31,806,248 |
| | | | | $93,528,308 |
| Consumer Products – 2.5% | |
| Colgate-Palmolive Co. | | 249,023 | $ 20,258,021 |
| International Flavors & Fragrances, Inc. | | 44,464 | 6,642,922 |
| Kimberly-Clark Corp. | | 169,592 | 22,688,018 |
| Reckitt Benckiser Group PLC | | 176,296 | 15,600,380 |
| | | | | $65,189,341 |
| Electrical Equipment – 1.4% | |
| Johnson Controls International PLC | | 542,504 | $ 37,232,050 |
| Electronics – 5.1% | |
| Analog Devices, Inc. | | 121,267 | $ 20,877,327 |
| Intel Corp. | | 385,262 | 21,628,609 |
| NXP Semiconductors N.V. | | 112,862 | 23,217,970 |
| Texas Instruments, Inc. | | 363,693 | 69,938,164 |
| | | | | $135,662,070 |
| Energy - Independent – 1.9% | |
| ConocoPhillips | | 365,717 | $ 22,272,165 |
| EOG Resources, Inc. | | 193,481 | 16,144,055 |
| Pioneer Natural Resources Co. | | 81,677 | 13,274,146 |
| | | | | $51,690,366 |
| Issuer | | | Shares/Par | Value ($) |
| Common Stocks – continued |
| Energy - Integrated – 0.6% | |
| Chevron Corp. | | 142,919 | $ 14,969,336 |
| Food & Beverages – 3.1% | |
| Archer Daniels Midland Co. | | 208,805 | $ 12,653,583 |
| J.M. Smucker Co. | | 52,810 | 6,842,592 |
| Nestle S.A. | | 346,249 | 43,117,870 |
| PepsiCo, Inc. | | 134,457 | 19,922,494 |
| | | | | $82,536,539 |
| Gaming & Lodging – 0.3% | |
| Marriott International, Inc., “A” (a) | | 67,920 | $ 9,272,438 |
| Health Maintenance Organizations – 2.2% | |
| Cigna Corp. | | 245,045 | $ 58,092,818 |
| Insurance – 8.7% | |
| Aon PLC | | 252,937 | $ 60,391,238 |
| Chubb Ltd. | | 321,509 | 51,100,641 |
| Marsh & McLennan Cos., Inc. | | 370,509 | 52,123,206 |
| Progressive Corp. | | 359,751 | 35,331,146 |
| Travelers Cos., Inc. | | 219,726 | 32,895,179 |
| | | | | $231,841,410 |
| Machinery & Tools – 4.5% | |
| Eaton Corp. PLC | | 287,886 | $ 42,658,947 |
| Illinois Tool Works, Inc. | | 198,114 | 44,290,366 |
| Trane Technologies PLC | | 174,622 | 32,154,895 |
| | | | | $119,104,208 |
| Major Banks – 8.7% | |
| Goldman Sachs Group, Inc. | | 88,259 | $ 33,496,938 |
| JPMorgan Chase & Co. | | 759,413 | 118,119,098 |
| Morgan Stanley | | 498,953 | 45,749,001 |
| PNC Financial Services Group, Inc. | | 178,683 | 34,085,569 |
| | | | | $231,450,606 |
| Medical & Health Technology & Services – 0.9% | |
| McKesson Corp. | | 122,719 | $ 23,468,782 |
| Medical Equipment – 8.4% | |
| Abbott Laboratories | | 361,890 | $ 41,953,908 |
| Boston Scientific Corp. (a) | | 609,739 | 26,072,439 |
| Danaher Corp. | | 160,930 | 43,187,175 |
| Medtronic PLC | | 531,342 | 65,955,482 |
| Thermo Fisher Scientific, Inc. | | 93,923 | 47,381,336 |
| | | | | $224,550,340 |
| Other Banks & Diversified Financials – 6.4% | |
| American Express Co. | | 273,601 | $ 45,207,093 |
| Citigroup, Inc. | | 767,998 | 54,335,859 |
| Moody's Corp. | | 44,520 | 16,132,712 |
| Truist Financial Corp. | | 371,659 | 20,627,075 |
| U.S. Bancorp | | 578,734 | 32,970,476 |
| | | | | $169,273,215 |
Portfolio of Investments (unaudited) – continued
| Issuer | | | Shares/Par | Value ($) |
| Common Stocks – continued |
| Pharmaceuticals – 6.8% | |
| Johnson & Johnson | | 566,301 | $ 93,292,427 |
| Merck & Co., Inc. | | 435,589 | 33,875,756 |
| Organon & Co. (a) | | 43,558 | 1,318,065 |
| Pfizer, Inc. | | 1,045,306 | 40,934,183 |
| Roche Holding AG | | 31,917 | 12,023,421 |
| | | | | $181,443,852 |
| Railroad & Shipping – 2.0% | |
| Canadian National Railway Co. | | 136,985 | $ 14,454,657 |
| Union Pacific Corp. | | 171,970 | 37,821,362 |
| | | | | $52,276,019 |
| Real Estate – 0.4% | |
| Public Storage, Inc., REIT | | 35,323 | $ 10,621,273 |
| Specialty Chemicals – 0.6% | |
| DuPont de Nemours, Inc. | | 218,666 | $ 16,926,935 |
| Specialty Stores – 1.5% | |
| Lowe's Cos., Inc. | | 200,324 | $ 38,856,846 |
| Telephone Services – 0.3% | |
| Verizon Communications, Inc. | | 129,720 | $ 7,268,212 |
| Issuer | | | Shares/Par | Value ($) |
| Common Stocks – continued |
| Tobacco – 0.5% | |
| Philip Morris International, Inc. | | 135,953 | $ 13,474,302 |
| Utilities - Electric Power – 6.2% | |
| American Electric Power Co., Inc. | | 222,282 | $ 18,802,834 |
| Dominion Energy, Inc. | | 501,797 | 36,917,205 |
| Duke Energy Corp. | | 559,921 | 55,275,401 |
| Southern Co. | | 686,309 | 41,528,558 |
| Xcel Energy, Inc. | | 192,752 | 12,698,502 |
| | | | | $165,222,500 |
| Total Common Stocks (Identified Cost, $1,250,564,102) | | $2,624,497,713 |
| Investment Companies (h) – 1.2% |
| Money Market Funds – 1.2% | |
| MFS Institutional Money Market Portfolio, 0.02% (v) (Identified Cost, $31,540,709) | | | 31,540,709 | $ 31,540,709 |
| Other Assets, Less Liabilities – 0.1% | | 3,019,552 |
| Net Assets – 100.0% | $2,659,057,974 |
| (a) | Non-income producing security. | | | |
| (h) | An affiliated issuer, which may be considered one in which the fund owns 5% or more of the outstanding voting securities, or a company which is under common control. At period end, the aggregate values of the fund's investments in affiliated issuers and in unaffiliated issuers were $31,540,709 and $2,624,497,713, respectively. | | | |
| (v) | Affiliated issuer that is available only to investment companies managed by MFS. The rate quoted for the MFS Institutional Money Market Portfolio is the annualized seven-day yield of the fund at period end. | | | |
| The following abbreviations are used in this report and are defined: |
| REIT | Real Estate Investment Trust |
See Notes to Financial Statements
| Financial Statements | Statement of Assets and Liabilities (unaudited) |
This statement represents your fund’s balance sheet, which details the assets and liabilities comprising the total value of the fund.
| At 6/30/21Assets | |
| Investments in unaffiliated issuers, at value (identified cost, $1,250,564,102) | $2,624,497,713 |
| Investments in affiliated issuers, at value (identified cost, $31,540,709) | 31,540,709 |
| Cash | 73,336 |
| Receivables for | |
| Investments sold | 957,948 |
| Fund shares sold | 1,715,756 |
| Interest and dividends | 3,250,718 |
| Other assets | 6,728 |
| Total assets | $2,662,042,908 |
| Liabilities | |
| Payables for | |
| Fund shares reacquired | $2,612,996 |
| Payable to affiliates | |
| Investment adviser | 97,747 |
| Administrative services fee | 1,952 |
| Shareholder servicing costs | 644 |
| Distribution and/or service fees | 19,127 |
| Accrued expenses and other liabilities | 252,468 |
| Total liabilities | $2,984,934 |
| Net assets | $2,659,057,974 |
| Net assets consist of | |
| Paid-in capital | $1,105,359,311 |
| Total distributable earnings (loss) | 1,553,698,663 |
| Net assets | $2,659,057,974 |
| Shares of beneficial interest outstanding | 114,926,485 |
| | Net assets | Shares
outstanding | Net asset value
per share |
| Initial Class | $1,259,835,365 | 53,796,788 | $23.42 |
| Service Class | 1,399,222,609 | 61,129,697 | 22.89 |
See Notes to Financial Statements
| Financial Statements | Statement of Operations (unaudited) |
This statement describes how much your fund earned in investment income and accrued in expenses. It also describes any gains and/or losses generated by fund operations.
| Six months ended 6/30/21 | |
| Net investment income (loss) | |
| Income | |
| Dividends | $26,783,633 |
| Income on securities loaned | 24,033 |
| Other | 19,606 |
| Dividends from affiliated issuers | 6,218 |
| Foreign taxes withheld | (251,549) |
| Total investment income | $26,581,941 |
| Expenses | |
| Management fee | $8,837,975 |
| Distribution and/or service fees | 1,669,618 |
| Shareholder servicing costs | 32,944 |
| Administrative services fee | 170,272 |
| Independent Trustees' compensation | 18,355 |
| Custodian fee | 58,908 |
| Shareholder communications | 82,818 |
| Audit and tax fees | 29,615 |
| Legal fees | 8,799 |
| Miscellaneous | 23,899 |
| Total expenses | $10,933,203 |
| Reduction of expenses by investment adviser | (154,253) |
| Net expenses | $10,778,950 |
| Net investment income (loss) | $15,802,991 |
| Realized and unrealized gain (loss) | |
| Realized gain (loss) (identified cost basis) | |
| Unaffiliated issuers | $78,068,098 |
| Foreign currency | 21,670 |
| Net realized gain (loss) | $78,089,768 |
| Change in unrealized appreciation or depreciation | |
| Unaffiliated issuers | $261,594,645 |
| Translation of assets and liabilities in foreign currencies | (93,023) |
| Net unrealized gain (loss) | $261,501,622 |
| Net realized and unrealized gain (loss) | $339,591,390 |
| Change in net assets from operations | $355,394,381 |
See Notes to Financial Statements
| Financial Statements | Statements of Changes in Net Assets |
These statements describe the increases and/or decreases in net assets resulting from operations, any distributions, and any shareholder transactions.
| | Six months ended | Year ended |
| | 6/30/21
(unaudited) | 12/31/20 |
| Change in net assets | | |
| From operations | | |
| Net investment income (loss) | $15,802,991 | $32,732,755 |
| Net realized gain (loss) | 78,089,768 | 59,434,807 |
| Net unrealized gain (loss) | 261,501,622 | 16,634,536 |
| Change in net assets from operations | $355,394,381 | $108,802,098 |
| Total distributions to shareholders | $— | $(132,057,054) |
| Change in net assets from fund share transactions | $(146,905,867) | $249,518,336 |
| Total change in net assets | $208,488,514 | $226,263,380 |
| Net assets | | |
| At beginning of period | 2,450,569,460 | 2,224,306,080 |
| At end of period | $2,659,057,974 | $2,450,569,460 |
See Notes to Financial Statements
| Financial Statements | Financial Highlights |
The financial highlights table is intended to help you understand the fund's financial performance for the semiannual period and the past 5 fiscal years. Certain information reflects financial results for a single fund share. The total returns in the table represent the rate that an investor would have earned (or lost) on an investment in the fund share class (assuming reinvestment of all distributions) held for the entire period.
| Initial Class | Six months
ended | Year ended |
| | 6/30/21
(unaudited) | 12/31/20 | 12/31/19 | 12/31/18 | 12/31/17 | 12/31/16 |
| Net asset value, beginning of period | $20.40 | $20.95 | $17.30 | $20.92 | $18.90 | $18.39 |
| Income (loss) from investment operations | | | | | | |
| Net investment income (loss) (d) | $0.15 | $0.31 | $0.33 | $0.41 | $0.30 | $0.38(c) |
| Net realized and unrealized gain (loss) | 2.87 | 0.29 | 4.68 | (2.32) | 2.93 | 2.16 |
| Total from investment operations | $3.02 | $0.60 | $5.01 | $(1.91) | $3.23 | $2.54 |
| Less distributions declared to shareholders | | | | | | |
| From net investment income | $— | $(0.30) | $(0.44) | $(0.32) | $(0.40) | $(0.42) |
| From net realized gain | — | (0.85) | (0.92) | (1.39) | (0.81) | (1.61) |
| Total distributions declared to shareholders | $— | $(1.15) | $(1.36) | $(1.71) | $(1.21) | $(2.03) |
| Net asset value, end of period (x) | $23.42 | $20.40 | $20.95 | $17.30 | $20.92 | $18.90 |
| Total return (%) (k)(r)(s)(x) | 14.80(n) | 3.48 | 29.80 | (10.09) | 17.65 | 14.09(c) |
Ratios (%) (to average net assets)
and Supplemental data: | | | | | | |
| Expenses before expense reductions (f) | 0.72(a) | 0.73 | 0.73 | 0.73 | 0.74 | 0.73(c) |
| Expenses after expense reductions (f) | 0.71(a) | 0.71 | 0.72 | 0.72 | 0.73 | 0.72(c) |
| Net investment income (loss) | 1.36(a) | 1.64 | 1.67 | 2.02 | 1.51 | 2.02(c) |
| Portfolio turnover | 5(n) | 17 | 13 | 8 | 10 | 15 |
| Net assets at end of period (000 omitted) | $1,259,835 | $1,183,318 | $945,183 | $823,744 | $996,794 | $968,078 |
See Notes to Financial Statements
Financial Highlights - continued
| Service Class | Six months
ended | Year ended |
| | 6/30/21
(unaudited) | 12/31/20 | 12/31/19 | 12/31/18 | 12/31/17 | 12/31/16 |
| Net asset value, beginning of period | $19.96 | $20.52 | $16.96 | $20.55 | $18.59 | $18.12 |
| Income (loss) from investment operations | | | | | | |
| Net investment income (loss) (d) | $0.12 | $0.25 | $0.27 | $0.35 | $0.25 | $0.33(c) |
| Net realized and unrealized gain (loss) | 2.81 | 0.29 | 4.59 | (2.28) | 2.87 | 2.11 |
| Total from investment operations | $2.93 | $0.54 | $4.86 | $(1.93) | $3.12 | $2.44 |
| Less distributions declared to shareholders | | | | | | |
| From net investment income | $— | $(0.25) | $(0.38) | $(0.27) | $(0.35) | $(0.36) |
| From net realized gain | — | (0.85) | (0.92) | (1.39) | (0.81) | (1.61) |
| Total distributions declared to shareholders | $— | $(1.10) | $(1.30) | $(1.66) | $(1.16) | $(1.97) |
| Net asset value, end of period (x) | $22.89 | $19.96 | $20.52 | $16.96 | $20.55 | $18.59 |
| Total return (%) (k)(r)(s)(x) | 14.68(n) | 3.22 | 29.51 | (10.36) | 17.35 | 13.78(c) |
Ratios (%) (to average net assets)
and Supplemental data: | | | | | | |
| Expenses before expense reductions (f) | 0.97(a) | 0.98 | 0.98 | 0.98 | 0.99 | 0.98(c) |
| Expenses after expense reductions (f) | 0.96(a) | 0.96 | 0.97 | 0.97 | 0.98 | 0.97(c) |
| Net investment income (loss) | 1.10(a) | 1.38 | 1.42 | 1.77 | 1.26 | 1.78(c) |
| Portfolio turnover | 5(n) | 17 | 13 | 8 | 10 | 15 |
| Net assets at end of period (000 omitted) | $1,399,223 | $1,267,251 | $1,279,123 | $1,127,848 | $1,398,374 | $1,302,307 |
| (a) | Annualized. |
| (c) | Amount reflects a one-time reimbursement of expenses by the custodian (or former custodian) without which net investment income and performance would be lower and expenses would be higher. |
| (d) | Per share data is based on average shares outstanding. |
| (f) | Ratios do not reflect reductions from fees paid indirectly, if applicable. |
| (k) | The total return does not reflect expenses that apply to separate accounts. Inclusion of these charges would reduce the total return figures for all periods shown. |
| (n) | Not annualized. |
| (r) | Certain expenses have been reduced without which performance would have been lower. |
| (s) | From time to time the fund may receive proceeds from litigation settlements, without which performance would be lower. |
| (x) | The net asset values and total returns have been calculated on net assets which include adjustments made in accordance with U.S. generally accepted accounting principles required at period end for financial reporting purposes. |
See Notes to Financial Statements
Notes to Financial Statements (unaudited)
(1) Business and Organization
MFS Value Series (the fund) is a diversified series of MFS Variable Insurance Trust (the trust). The trust is organized as a Massachusetts business trust and is registered under the Investment Company Act of 1940, as amended, as an open-end management investment company. The shareholders of each series of the trust are separate accounts of insurance companies, which offer variable annuity and/or life insurance products, and qualified retirement and pension plans.
The fund is an investment company and accordingly follows the investment company accounting and reporting guidance of the Financial Accounting Standards Board (FASB) Accounting Standards Codification Topic 946 Financial Services - Investment Companies.
(2) Significant Accounting Policies
General — The preparation of financial statements in conformity with U.S. generally accepted accounting principles requires management to make estimates and assumptions that affect the reported amounts of assets and liabilities, and disclosure of contingent assets and liabilities at the date of the financial statements and the reported amounts of increases and decreases in net assets from operations during the reporting period. Actual results could differ from those estimates. In the preparation of these financial statements, management has evaluated subsequent events occurring after the date of the fund’s Statement of Assets and Liabilities through the date that the financial statements were issued.
Certain of the fund's investments, derivatives, debt and other contracts may be based on reference interest rates such as the London Interbank Offered Rate (“LIBOR”). In 2017, the regulatory authority that oversees financial services firms in the United Kingdom announced plans to transition away from LIBOR by the end of 2021. In March 2021, the administrator of LIBOR announced the extension of the publication of the more commonly used U.S. dollar LIBOR settings to the end of June 2023. Although the full impacts of the transition away from LIBOR are not fully known, the transition may result in, among other things, an increase in volatility or illiquidity of the markets for instruments that currently rely on LIBOR to determine interest rates and this could have an adverse impact on the fund's performance. With respect to the fund's accounting for investments, derivatives, debt and other contracts that undergo reference rate-related modifications as a result of the transition, management will rely upon the relief provided by FASB Codification Topic 848 – Reference Rate Reform (Topic 848). The guidance in Topic 848 permits the fund to disregard the GAAP accounting requirements around certain contract modifications resulting from the LIBOR transition such that for contracts considered in scope, the fund can account for those modified contracts as a continuation of the existing contracts.
Balance Sheet Offsetting — The fund's accounting policy with respect to balance sheet offsetting is that, absent an event of default by the counterparty or a termination of the agreement, the International Swaps and Derivatives Association (ISDA) Master Agreement, or similar agreement, does not result in an offset of reported amounts of financial assets and financial liabilities in the Statement of Assets and Liabilities across transactions between the fund and the applicable counterparty. The fund's right to setoff may be restricted or prohibited by the bankruptcy or insolvency laws of the particular jurisdiction to which a specific master netting agreement counterparty is subject. Balance sheet offsetting disclosures, to the extent applicable to the fund, have been included in the fund’s Significant Accounting Policies note under the captions for each of the fund’s in-scope financial instruments and transactions.
Investment Valuations — Equity securities, including restricted equity securities, are generally valued at the last sale or official closing price on their primary market or exchange as provided by a third-party pricing service. Equity securities, for which there were no sales reported that day, are generally valued at the last quoted daily bid quotation on their primary market or exchange as provided by a third-party pricing service. Short-term instruments with a maturity at issuance of 60 days or less may be valued at amortized cost, which approximates market value. Open-end investment companies are generally valued at net asset value per share.
Securities and other assets generally valued on the basis of information from a third-party pricing service may also be valued at a broker/dealer bid quotation. In determining values, third-party pricing services can utilize both transaction data and market information such as yield, quality, coupon rate, maturity, type of issue, trading characteristics, and other market data. The values of foreign securities and other assets and liabilities expressed in foreign currencies are converted to U.S. dollars using the mean of bid and asked prices for rates provided by a third-party pricing service.
The Board of Trustees has delegated primary responsibility for determining or causing to be determined the value of the fund’s investments (including any fair valuation) to the adviser pursuant to valuation policies and procedures approved by the Board. If the adviser determines that reliable market quotations are not readily available, investments are valued at fair value as determined in good faith by the adviser in accordance with such procedures under the oversight of the Board of Trustees. Under the fund’s valuation policies and procedures, market quotations are not considered to be readily available for most types of debt instruments and floating rate loans and many types of derivatives. These investments are generally valued at fair value based on information from third-party pricing services. In addition, investments may be valued at fair value if the adviser determines that an investment’s value has been materially affected by events occurring after the close of the exchange or market on which the investment is principally
Notes to Financial Statements (unaudited) - continued
traded (such as foreign exchange or market) and prior to the determination of the fund’s net asset value, or after the halt of trading of a specific security where trading does not resume prior to the close of the exchange or market on which the security is principally traded. Events that occur after foreign markets close (such as developments in foreign markets and significant movements in the U.S. markets) and prior to the determination of the fund’s net asset value may be deemed to have a material effect on the value of securities traded in foreign markets. Accordingly, the fund’s foreign equity securities may often be valued at fair value. The adviser generally relies on third-party pricing services or other information (such as the correlation with price movements of similar securities in the same or other markets; the type, cost and investment characteristics of the security; the business and financial condition of the issuer; and trading and other market data) to assist in determining whether to fair value and at what value to fair value an investment. The value of an investment for purposes of calculating the fund’s net asset value can differ depending on the source and method used to determine value. When fair valuation is used, the value of an investment used to determine the fund’s net asset value may differ from quoted or published prices for the same investment. There can be no assurance that the fund could obtain the fair value assigned to an investment if it were to sell the investment at the same time at which the fund determines its net asset value per share.
Various inputs are used in determining the value of the fund's assets or liabilities. These inputs are categorized into three broad levels. In certain cases, the inputs used to measure fair value may fall into different levels of the fair value hierarchy. In such cases, an investment's level within the fair value hierarchy is based on the lowest level of input that is significant to the fair value measurement. The fund's assessment of the significance of a particular input to the fair value measurement in its entirety requires judgment, and considers factors specific to the investment. Level 1 includes unadjusted quoted prices in active markets for identical assets or liabilities. Level 2 includes other significant observable market-based inputs (including quoted prices for similar securities, interest rates, prepayment speed, and credit risk). Level 3 includes unobservable inputs, which may include the adviser's own assumptions in determining the fair value of investments. The following is a summary of the levels used as of June 30, 2021 in valuing the fund's assets or liabilities:
| Financial Instruments | Level 1 | Level 2 | Level 3 | Total |
| Equity Securities | $2,624,497,713 | $— | $— | $2,624,497,713 |
| Mutual Funds | 31,540,709 | — | — | 31,540,709 |
| Total | $2,656,038,422 | $— | $— | $2,656,038,422 |
For further information regarding security characteristics, see the Portfolio of Investments.
Foreign Currency Translation — Purchases and sales of foreign investments, income, and expenses are converted into U.S. dollars based upon currency exchange rates prevailing on the respective dates of such transactions or on the reporting date for foreign denominated receivables and payables. Gains and losses attributable to foreign currency exchange rates on sales of securities are recorded for financial statement purposes as net realized gains and losses on investments. Gains and losses attributable to foreign exchange rate movements on receivables, payables, income and expenses are recorded for financial statement purposes as foreign currency transaction gains and losses. That portion of both realized and unrealized gains and losses on investments that results from fluctuations in foreign currency exchange rates is not separately disclosed.
Security Loans — Under its Securities Lending Agency Agreement with the fund, State Street Bank and Trust Company, as lending agent, loans the securities of the fund to certain qualified institutions (the “Borrowers”) approved by the fund. Security loans can be terminated at the discretion of either the lending agent or the fund and the related securities must be returned within the earlier of the standard trade settlement period for such securities or within three business days. The loans are collateralized by cash and/or U.S. Treasury and federal agency obligations in an amount typically at least equal to the market value of the securities loaned. On loans collateralized by cash, the cash collateral is invested in a money market fund. The market value of the loaned securities is determined at the close of business of the fund and any additional required collateral is delivered to the fund on the next business day. The lending agent provides the fund with indemnification against Borrower default. In the event of Borrower default, the lending agent will, for the benefit of the fund, either purchase securities identical to those loaned or, when such purchase is commercially impracticable, pay the fund the market value of the loaned securities. In return, the lending agent assumes the fund's rights to the related collateral. If the collateral value is less than the cost to purchase identical securities, the lending agent is responsible for the shortfall, but only to the extent that such shortfall is not due to a decline in collateral value resulting from collateral reinvestment for which the fund bears the risk of loss. A portion of the income generated upon investment of the collateral is remitted to the Borrowers, and the remainder is allocated between the fund and the lending agent. On loans collateralized by U.S. Treasury and/or federal agency obligations, a fee is received from the Borrower, and is allocated between the fund and the lending agent. Income from securities lending is separately reported in the Statement of Operations. The dividend and interest income earned on the securities loaned is accounted for in the same manner as other dividend and interest income. At June 30, 2021, there were no securities on loan or collateral outstanding.
Notes to Financial Statements (unaudited) - continued
Indemnifications — Under the fund's organizational documents, its officers and Trustees may be indemnified against certain liabilities and expenses arising out of the performance of their duties to the fund. Additionally, in the normal course of business, the fund enters into agreements with service providers that may contain indemnification clauses. The fund's maximum exposure under these agreements is unknown as this would involve future claims that may be made against the fund that have not yet occurred.
Investment Transactions and Income — Investment transactions are recorded on the trade date. Interest income is recorded on the accrual basis. Dividends received in cash are recorded on the ex-dividend date. Certain dividends from foreign securities will be recorded when the fund is informed of the dividend if such information is obtained subsequent to the ex-dividend date. Dividend payments received in additional securities are recorded on the ex-dividend date in an amount equal to the value of the security on such date.
The fund may receive proceeds from litigation settlements. Any proceeds received from litigation involving portfolio holdings are reflected in the Statement of Operations in realized gain/loss if the security has been disposed of by the fund or in unrealized gain/loss if the security is still held by the fund. Any other proceeds from litigation not related to portfolio holdings are reflected as other income in the Statement of Operations.
Tax Matters and Distributions — The fund intends to qualify as a regulated investment company, as defined under Subchapter M of the Internal Revenue Code, and to distribute all of its taxable income, including realized capital gains. As a result, no provision for federal income tax is required. The fund’s federal tax returns, when filed, will remain subject to examination by the Internal Revenue Service for a three year period. Management has analyzed the fund’s tax positions taken on federal and state tax returns for all open tax years and does not believe that there are any uncertain tax positions that require recognition of a tax liability. Foreign taxes, if any, have been accrued by the fund in the accompanying financial statements in accordance with the applicable foreign tax law. Foreign income taxes may be withheld by certain countries in which the fund invests. Additionally, capital gains realized by the fund on securities issued in or by certain foreign countries may be subject to capital gains tax imposed by those countries.
Distributions to shareholders are recorded on the ex-dividend date. Income and capital gain distributions are determined in accordance with income tax regulations, which may differ from U.S. generally accepted accounting principles. Certain capital accounts in the financial statements are periodically adjusted for permanent differences in order to reflect their tax character. These adjustments have no impact on net assets or net asset value per share. Temporary differences which arise from recognizing certain items of income, expense, gain or loss in different periods for financial statement and tax purposes will reverse at some time in the future.
Book/tax differences primarily relate to wash sale loss deferrals.
The tax character of distributions declared to shareholders for the last fiscal year is as follows:
| | Year ended
12/31/20 |
| Ordinary income (including any short-term capital gains) | $34,922,070 |
| Long-term capital gains | 97,134,984 |
| Total distributions | $132,057,054 |
The federal tax cost and the tax basis components of distributable earnings were as follows:
| As of 6/30/21 | |
| Cost of investments | $1,287,475,211 |
| Gross appreciation | 1,372,545,427 |
| Gross depreciation | (3,982,216) |
| Net unrealized appreciation (depreciation) | $1,368,563,211 |
| As of 12/31/20 | |
| Undistributed ordinary income | 32,690,653 |
| Undistributed long-term capital gain | 59,232,794 |
| Other temporary differences | 130,254 |
| Net unrealized appreciation (depreciation) | 1,106,250,581 |
The aggregate cost above includes prior fiscal year end tax adjustments, if applicable.
Notes to Financial Statements (unaudited) - continued
Multiple Classes of Shares of Beneficial Interest — The fund offers multiple classes of shares, which differ in their respective distribution and/or service fees. The fund's income, realized and unrealized gain (loss), and common expenses are allocated to shareholders based on the daily net assets of each class. Dividends are declared separately for each class. Differences in per share dividend rates are generally due to differences in separate class expenses. The fund’s distributions declared to shareholders as reported in the Statements of Changes in Net Assets are presented by class as follows:
| | Six months
ended
6/30/21 | | Year
ended
12/31/20 |
| Initial Class | $— | | $64,613,595 |
| Service Class | — | | 67,443,459 |
| Total | $— | | $132,057,054 |
(3) Transactions with Affiliates
Investment Adviser — The fund has an investment advisory agreement with MFS to provide overall investment management and related administrative services and facilities to the fund. The management fee is computed daily and paid monthly at the following annual rates based on the fund's average daily net assets:
| Up to $1 billion | 0.75% |
| In excess of $1 billion and up to $2.5 billion | 0.65% |
| In excess of $2.5 billion | 0.60% |
MFS has agreed in writing to reduce its management fee by a specified amount if certain MFS mutual fund assets exceed thresholds agreed to by MFS and the fund's Board of Trustees. For the six months ended June 30, 2021, this management fee reduction amounted to $154,253, which is included in the reduction of total expenses in the Statement of Operations. The management fee incurred for the six months ended June 30, 2021 was equivalent to an annual effective rate of 0.67% of the fund's average daily net assets.
The investment adviser has agreed in writing to pay a portion of the fund’s total annual operating expenses, excluding interest, taxes, extraordinary expenses, brokerage and transaction costs, and investment-related expenses, such that total annual operating expenses do not exceed 0.71% of average daily net assets for the Initial Class shares and 0.96% of average daily net assets for the Service Class shares. This written agreement will continue until modified by the fund’s Board of Trustees, but such agreement will continue at least until April 30, 2023. For the six months ended June 30, 2021, the fund’s actual operating expenses did not exceed the limit and therefore, the investment adviser did not pay any portion of the fund’s expenses related to this agreement.
Distributor — MFS Fund Distributors, Inc. (MFD), a wholly-owned subsidiary of MFS, is the distributor of shares of the fund. The Trustees have adopted a distribution plan for the Service Class shares pursuant to Rule 12b-1 under the Investment Company Act of 1940.
The fund's distribution plan provides that the fund will pay MFD distribution and/or service fees equal to 0.25% per annum of its average daily net assets attributable to Service Class shares as partial consideration for services performed and expenses incurred by MFD and financial intermediaries (including participating insurance companies that invest in the fund to fund variable annuity and variable life insurance contracts, sponsors of qualified retirement and pension plans that invest in the fund, and affiliates of these participating insurance companies and plan sponsors) in connection with the sale and distribution of the Service Class shares. MFD may subsequently pay all, or a portion, of the distribution and/or service fees to financial intermediaries.
Shareholder Servicing Agent — MFS Service Center, Inc. (MFSC), a wholly-owned subsidiary of MFS, receives a fee from the fund for its services as shareholder servicing agent. For the six months ended June 30, 2021, the fee was $31,977, which equated to 0.0025% annually of the fund's average daily net assets. MFSC also receives reimbursement from the fund for out-of-pocket expenses paid by MFSC on behalf of the fund. For the six months ended June 30, 2021, these costs amounted to $967.
Administrator — MFS provides certain financial, legal, shareholder communications, compliance, and other administrative services to the fund. Under an administrative services agreement, the fund reimburses MFS the costs incurred to provide these services. The fund is charged an annual fixed amount of $17,500 plus a fee based on average daily net assets. The administrative services fee incurred for the six months ended June 30, 2021 was equivalent to an annual effective rate of 0.0132% of the fund's average daily net assets.
Notes to Financial Statements (unaudited) - continued
Trustees’ and Officers’ Compensation — The fund pays compensation to independent Trustees in the form of a retainer, attendance fees, and additional compensation to Board and Committee chairpersons. The fund does not pay compensation directly to Trustees or officers of the fund who are also officers of the investment adviser, all of whom receive remuneration from MFS for their services to the fund. Certain officers and Trustees of the fund are officers or directors of MFS, MFD, and MFSC.
Other — The fund invests in the MFS Institutional Money Market Portfolio which is managed by MFS and seeks current income consistent with preservation of capital and liquidity. This money market fund does not pay a management fee to MFS but does incur investment and operating costs.
The fund is permitted to engage in purchase and sale transactions with funds and accounts for which MFS serves as investment adviser or sub-adviser (“cross-trades”) pursuant to a policy adopted by the Board of Trustees. This policy has been designed to ensure that cross-trades conducted by the fund comply with Rule 17a-7 under the Investment Company Act of 1940. During the six months ended June 30, 2021, the fund engaged in purchase and sale transactions pursuant to this policy, which amounted to $14,714 and $1,080,104, respectively. The sales transactions resulted in net realized gains (losses) of $268,451.
The adviser has voluntarily undertaken to reimburse the fund from its own resources on a quarterly basis for the cost of investment research embedded in the cost of the fund’s securities trades. This agreement may be rescinded at any time. For the six months ended June 30, 2021, this reimbursement amounted to $19,334, which is included in “Other” income in the Statement of Operations.
(4) Portfolio Securities
For the six months ended June 30, 2021, purchases and sales of investments, other than short-term obligations, aggregated $122,899,812 and $256,680,608, respectively.
(5) Shares of Beneficial Interest
The fund's Declaration of Trust permits the Trustees to issue an unlimited number of full and fractional shares of beneficial interest. Transactions in fund shares were as follows:
| | Six months ended
6/30/21 | | Year ended
12/31/20 |
| | Shares | Amount | | Shares | Amount |
| Shares sold | | | | | |
| Initial Class | 3,663,797 | $79,262,546 | | 17,458,957 | $326,082,166 |
| Service Class | 3,516,125 | 76,271,556 | | 10,385,417 | 178,855,955 |
| | 7,179,922 | $155,534,102 | | 27,844,374 | $504,938,121 |
Shares issued to shareholders
in reinvestment of distributions | | | | | |
| Initial Class | — | $— | | 3,496,407 | $64,613,595 |
| Service Class | — | — | | 3,726,158 | 67,443,459 |
| | — | $— | | 7,222,565 | $132,057,054 |
| Shares reacquired | | | | | |
| Initial Class | (7,877,809) | $(175,459,443) | | (8,069,039) | $(151,590,113) |
| Service Class | (5,869,199) | (126,980,526) | | (12,963,112) | (235,886,726) |
| | (13,747,008) | $(302,439,969) | | (21,032,151) | $(387,476,839) |
| Net change | | | | | |
| Initial Class | (4,214,012) | $(96,196,897) | | 12,886,325 | $239,105,648 |
| Service Class | (2,353,074) | (50,708,970) | | 1,148,463 | 10,412,688 |
| | (6,567,086) | $(146,905,867) | | 14,034,788 | $249,518,336 |
The fund is one of several mutual funds in which certain MFS funds may invest. The MFS funds do not invest in the underlying funds for the purpose of exercising management or control. At the end of the period, the MFS Moderate Allocation Portfolio, the MFS Growth Allocation Portfolio, and the MFS Conservative Allocation Portfolio were the owners of record of approximately 5%, 2%, and 1%, respectively, of the value of outstanding voting shares of the fund.
Notes to Financial Statements (unaudited) - continued
(6) Line of Credit
The fund and certain other funds managed by MFS participate in a $1.25 billion unsecured committed line of credit of which $1 billion is reserved for use by the fund and certain other MFS U.S. funds. The line of credit is provided by a syndicate of banks under a credit agreement. Borrowings may be made for temporary financing needs. Interest is charged to each fund, based on its borrowings, generally at a rate equal to the highest of one month LIBOR, the Federal Funds Effective Rate and the Overnight Bank Funding Rate, plus an agreed upon spread. A commitment fee, based on the average daily, unused portion of the committed line of credit, is allocated among the participating funds. In addition, the fund and other funds managed by MFS have established unsecured uncommitted borrowing arrangements with certain banks for temporary financing needs. Interest is charged to each fund, based on its borrowings, at rates equal to customary reference rates plus an agreed upon spread. For the six months ended June 30, 2021, the fund’s commitment fee and interest expense were $4,979 and $0, respectively, and are included in “Miscellaneous” expense in the Statement of Operations.
(7) Investments in Affiliated Issuers
An affiliated issuer may be considered one in which the fund owns 5% or more of the outstanding voting securities, or a company which is under common control. For the purposes of this report, the following were affiliated issuers:
| Affiliated Issuers | Beginning
Value | Purchases | Sales
Proceeds | Realized
Gain
(Loss) | Change in
Unrealized
Appreciation or
Depreciation | Ending
Value |
| MFS Institutional Money Market Portfolio | $30,323,177 | $184,446,355 | $183,228,823 | $— | $— | $31,540,709 |
| Affiliated Issuers | Dividend
Income | Capital Gain
Distributions |
| MFS Institutional Money Market Portfolio | $6,218 | $— |
(8) Impacts of COVID-19
The pandemic related to the global spread of novel coronavirus disease (COVID-19), which was first detected in December 2019, has resulted in significant disruptions to global business activity and the global economy, as well as the economies of individual countries, the financial performance of individual companies and sectors, and the securities and commodities markets in general. Multiple surges in cases globally, the availability and widespread adoption of vaccines, and the emergence of variant strains of the virus continue to create uncertainty as to the future and long-term impacts resulting from the pandemic including impacts to the prices and liquidity of the fund's investments and the fund's performance.
Statement Regarding Liquidity Risk Management Program
The fund has adopted and implemented a liquidity risk management program (the “Program”) as required by Rule 22e-4 under the Investment Company Act of 1940, as amended. The fund’s Board of Trustees (the “Board”) has designated MFS as the administrator of the Program. The Program is reasonably designed to assess and manage the liquidity risk of the fund. Liquidity risk is the risk that the fund could not meet requests to redeem shares issued by the fund without significant dilution of remaining investors' interests.
MFS provided a written report to the Board for consideration at its April 2021 meeting that addressed the operation of the Program and provided an assessment of the adequacy and effectiveness of the Program during the period from January 1, 2020 to December 31, 2020 (the “Covered Period”). The report concluded that during the Covered Period the Program had operated effectively and had adequately and effectively been implemented to assess and manage the fund’s liquidity risk. MFS also reported that there were no liquidity events that impacted the fund or its ability to timely meet redemptions without dilution to existing shareholders during the Covered Period.
There can be no assurance that the Program will achieve its objectives in the future. Further information on liquidity risk, and other principal risks to which an investment in the fund may be subject, can be found in the prospectus.
Proxy Voting Policies and Information
MFS votes proxies on behalf of the fund pursuant to proxy voting policies and procedures that are available without charge, upon request, by calling 1-800-225-2606, by visiting mfs.com/proxyvoting, or by visiting the SEC’s Web site at http://www.sec.gov.
Information regarding how the fund voted proxies relating to portfolio securities during the most recent twelve-month period ended June 30 is available by August 31 of each year without charge by visiting mfs.com/proxyvoting, or by visiting the SEC’s Web site at http://www.sec.gov.
Quarterly Portfolio Disclosure
The fund files a complete schedule of portfolio holdings with the SEC for the first and third quarters of each fiscal year as an exhibit to its reports on Form N-PORT. The fund’s Form N-PORT reports are available on the SEC’s Web site at http://www.sec.gov. A shareholder can obtain the portfolio holdings report for the first and third quarters of the fund's fiscal year at mfs.com/vit1 by choosing the fund's name and then scrolling to the “Resources” section and clicking on the “Prospectus and Reports” tab.
FURTHER INFORMATION
From time to time, MFS may post important information about the fund or the MFS Funds on the MFS Web site (mfs.com). This information is available at https://www.mfs.com/announcements or at mfs.com/vit1 by choosing the fund's name and then scrolling to the “Resources” section and clicking on the “Announcements” tab, if any.
Information About Fund Contracts and Legal Claims
The fund has entered into contractual arrangements with an investment adviser, administrator, distributor, shareholder servicing agent, 529 program manager (if applicable), and custodian who each provide services to the fund. Unless expressly stated otherwise, shareholders are not parties to, or intended beneficiaries of these contractual arrangements, and these contractual arrangements are not intended to create any shareholder right to enforce them against the service providers or to seek any remedy under them against the service providers, either directly or on behalf of the fund.
Under the Trust’s By-Laws and Declaration of Trust, any claims asserted against or on behalf of the MFS Funds, including claims against Trustees and Officers, must be brought in state and federal courts located within the Commonwealth of Massachusetts.
Item 1(b):
Not applicable
During the period covered by this report, the Registrant has not amended any provision in its Code of Ethics (the “Code”) that relates to an element of the Code’s definitions enumerated in paragraph (b) of Item 2 of this Form N-CSR. During the period covered by this report, the Registrant did not grant a waiver, including an implicit waiver, from any provision of the Code.
| ITEM 3. | AUDIT COMMITTEE FINANCIAL EXPERT. |
Not applicable for semi-annual reports.
| ITEM 4. | PRINCIPAL ACCOUNTANT FEES AND SERVICES. |
Not applicable for semi-annual reports.
| ITEM 5. | AUDIT COMMITTEE OF LISTED REGISTRANTS. |
Not applicable to the Registrant.
A schedule of investments for each series of the Registrant is included as part of the report to shareholders of such series under Item 1(a) of this Form N-CSR.
| ITEM 7. | DISCLOSURE OF PROXY VOTING POLICIES AND PROCEDURES FOR CLOSED-END MANAGEMENT INVESTMENT COMPANIES. |
Not applicable to the Registrant.
| ITEM 8. | PORTFOLIO MANAGERS OF CLOSED-END MANAGEMENT INVESTMENT COMPANIES. |
Not applicable to the Registrant.
| ITEM 9. | PURCHASES OF EQUITY SECURITIES BY CLOSED-END MANAGEMENT INVESTMENT COMPANY AND AFFILIATED PURCHASERS. |
Not applicable to the Registrant.
| ITEM 10. | SUBMISSION OF MATTERS TO A VOTE OF SECURITY HOLDERS. |
There were no material changes to the procedures by which shareholders may send recommendations to the Board for nominees to the Registrant’s Board since the Registrant last provided disclosure as to such procedures in response to the requirements of Item 407 (c)(2)(iv) of Regulation S-K or this Item.
| ITEM 11. | CONTROLS AND PROCEDURES. |
| (a) | Based upon their evaluation of the effectiveness of the registrant’s disclosure controls and procedures (as defined in Rule 30a-3(c) under the Investment Company Act of 1940 (the “Act”)) as conducted within 90 days of the filing date of this report on Form N-CSR, the registrant’s principal financial officer and principal executive officer have concluded that those disclosure controls and procedures provide reasonable assurance that the material information required to be disclosed by the registrant on this report is recorded, processed, summarized and reported within the time periods specified in the Securities and Exchange Commission’s rules and forms. |
| (b) | There were no changes in the registrant’s internal controls over financial reporting (as defined in Rule 30a-3(d) under the Act) that occurred during the period covered by the report that have materially affected, or are reasonably likely to materially affect, the registrant’s internal control over financial reporting. |
| ITEM 12. | DISCLOSURE OF SECURITIES LENDING ACTIVITIES FOR CLOSED-END MANAGEMENT INVESTMENT COMPANIES. |
Not applicable to the Registrant.
| (a) (1) | Any code of ethics, or amendment thereto, that is the subject of the disclosure required by Item 2, to the extent that the registrant intends to satisfy the Item 2 requirements through filing of an exhibit. Not applicable. |
| | (2) | A separate certification for each principal executive officer and principal financial officer of the registrant as required by Rule 30a-2(a) under the Act (17 CFR 270.30a-2): Attached hereto as EX-99.302CERT. |
| | (3) | Any written solicitation to purchase securities under Rule 23c-1 under the Act (17 CFR 270.23c-1) sent or given during the period covered by the report by or on behalf of the registrant to 10 or more persons. Not applicable. |
| | (4) | Change in the registrant’s independent public accountant. Not applicable. |
| (b) | If the report is filed under Section 13(a) or 15(d) of the Exchange Act, provide the certifications required by Rule 30a-2(b) under the Act (17 CFR 270.30a-2(b)), Rule 13a-14(b) or Rule 15d-14(b) under the Exchange Act (17 CFR 240.13a-14(b) or 240.15d-14(b)) and Section 1350 of Chapter 63 of Title 18 of the United States Code (18 U.S.C. 1350) as an exhibit. A certification furnished pursuant to this paragraph will not be deemed “filed” for the purposes of Section 18 of the Exchange Act (15 U.S.C. 78r), or otherwise subject to the liability of that section. Such certification will not be deemed to be incorporated by reference into any filing under the Securities Act of 1933 or the Exchange Act, except to the extent that the registrant specifically incorporates it by reference. Attached hereto as EX-99.906CERT. |
Notice
A copy of the Amended and Restated Declaration of Trust, as amended, of the Registrant is on file with the Secretary of State of The Commonwealth of Massachusetts and notice is hereby given that this instrument is executed on behalf of the Registrant by an officer of the Registrant as an officer and not individually and the obligations of or arising out of this instrument are not binding upon any of the Trustees or shareholders individually, but are binding only upon the assets and property of the respective constituent series of the Registrant.
SIGNATURES
Pursuant to the requirements of the Securities Exchange Act of 1934 and the Investment Company Act of 1940, the registrant has duly caused this report to be signed on its behalf by the undersigned, thereunto duly authorized.
(Registrant) MFS VARIABLE INSURANCE TRUST
| | |
| By (Signature and Title)* | | /S/ DAVID L. DILORENZO |
| | David L. DiLorenzo, President |
Date: August 13, 2021
Pursuant to the requirements of the Securities Exchange Act of 1934 and the Investment Company Act of 1940, this report has been signed below by the following persons on behalf of the registrant and in the capacities and on the dates indicated.
| | |
| By (Signature and Title)* | | /S/ DAVID L. DILORENZO |
| | David L. DiLorenzo, President (Principal Executive Officer) |
Date: August 13, 2021
| | |
| By (Signature and Title)* | | /S/ JAMES O. YOST |
| | James O. Yost, Treasurer (Principal Financial Officer and Accounting Officer) |
Date: August 13, 2021
| * | Print name and title of each signing officer under his or her signature. |