UNITED STATES
SECURITIES AND EXCHANGE COMMISSION
Washington, D.C. 20549
FORM N-CSR
CERTIFIED SHAREHOLDER REPORT OF
REGISTERED MANAGEMENT INVESTMENT COMPANIES
Investment Company Act file number 811-8326
MFS VARIABLE INSURANCE TRUST
(Exact name of registrant as specified in charter)
111 Huntington Avenue, Boston, Massachusetts 02199
(Address of principal executive offices) (Zip code)
Christopher R. Bohane
Massachusetts Financial Services Company
111 Huntington Avenue
Boston, Massachusetts 02199
(Name and address of agents for service)
Registrant’s telephone number, including area code: (617) 954-5000
Date of fiscal year end: December 31
Date of reporting period: June 30, 2020
| ITEM 1. | REPORTS TO STOCKHOLDERS. |
Semiannual Report
June 30, 2020

MFS® Global Equity Series

MFS® Variable Insurance Trust
Beginning on January 1, 2021, as permitted by regulations adopted by the U.S. Securities and Exchange Commission, the insurance company that offers your contract may determine that it will no longer send you paper copies of the fund’s annual and semiannual shareholder reports unless you specifically request paper copies from the insurance company or from your financial intermediary. Instead, the shareholder reports will be made available on a Web site (insurancefunds.mfs.com or other Web site of which you will be notified), and the insurance company will notify you by mail each time a report is posted and provide you with a Web site link to access the report. Instructions for requesting paper copies will be provided by your insurance company or financial intermediary.
If you already elected to receive shareholder reports by email, you will not be affected by this change and you need not take any action. If your insurance company or financial intermediary offers electronic delivery, you may elect to receive shareholder reports and other communications from the insurance company or financial intermediary by email by following the instructions provided by the insurance company or financial intermediary.
Beginning on January 1, 2019, you may elect to receive all future reports in paper free of charge from the insurance company or financial intermediary. You can inform the insurance company or financial intermediary that you wish to continue receiving paper copies of your shareholder reports by contacting your insurance company or financial intermediary. Your election to receive reports in paper will apply to all funds held in your account with your insurance company or financial intermediary.
VGE-SEM
MFS® Global Equity Series
CONTENTS
The report is prepared for the general information of contract owners. It is authorized for distribution to prospective investors only when preceded or accompanied by a current prospectus.
NOT FDIC INSURED • MAY LOSE VALUE • NO BANK OR CREDIT UNION GUARANTEE • NOT A DEPOSIT • NOT INSURED BY ANY FEDERAL GOVERNMENT AGENCY OR NCUA/NCUSIF
MFS Global Equity Series
LETTER FROM THE EXECUTIVE CHAIR

Dear Contract Owners:
Markets experienced dramatic swings in early 2020, as the coronavirus pandemic brought the global economy to a standstill for several months. Optimism over the development of vaccines and therapeutics, along with a decline in cases in countries that had been affected by the outbreak early on, brightened the economic and market outlook during the second quarter, as did the phased reopening of US states. However, a great deal of uncertainty remains, including the possibility of a second wave of cases later this year, as many countries continue to experience COVID-19 flare-ups.
Global central banks have taken aggressive steps to cushion the economic and market fallout related to the virus, and governments are deploying unprecedented levels of fiscal support. As uncertainty recedes, these measures can help build a supportive environment and encourage economic recovery; however, if markets disconnect from fundamentals, they can also sow the seeds of instability. In the aftermath of the crisis, societal changes may be likely, as households, businesses, and governments adjust to a new reality, and these alterations could affect the investment landscape. For investors, events, such as the COVID-19 outbreak, demonstrate the importance of having a deep understanding of company fundamentals, and we have built our global research platform to do just that.
Here at MFS®, we aim to help our clients navigate the growing complexity of the markets and world economies. Our long-term investment philosophy and commitment to the responsible allocation of capital allow us to tune out the noise and uncover what we believe are the best, most durable investment opportunities in the market. Through our unique global investment platform, we combine collective expertise, thoughtful risk management, and long-term discipline to create sustainable value for investors.
Respectfully,

Robert J. Manning
Executive Chair
MFS Investment Management
August 17, 2020
The opinions expressed in this letter are subject to change, may not be relied upon for investment advice, and no forecasts can be guaranteed.
1
MFS Global Equity Series
PORTFOLIO COMPOSITION
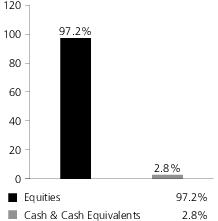
Portfolio structure

| | | | |
| Top ten holdings | | | | |
| Thermo Fisher Scientific, Inc. | | | 3.5% | |
| Visa, Inc., “A” | | | 3.4% | |
| Comcast Corp., “A” | | | 3.2% | |
| Nestle S.A. | | | 3.0% | |
| Medtronic PLC | | | 2.9% | |
| Schneider Electric SE | | | 2.8% | |
| Accenture PLC, “A” | | | 2.8% | |
| LVMH Moet Hennessy Louis Vuitton SE | | | 2.5% | |
| Roche Holding AG | | | 2.3% | |
| Essity AB | | | 2.2% | |
| |
| GICS equity sectors (g) | | | | |
| Health Care | | | 20.0% | |
| Industrials | | | 19.3% | |
| Consumer Staples | | | 16.6% | |
| Information Technology | | | 14.5% | |
| Financials | | | 8.9% | |
| Consumer Discretionary | | | 8.0% | |
| Communication Services | | | 5.9% | |
| Materials | | | 5.7% | |
| Real Estate | | | 0.4% | |
| | | | |
| Issuer country weightings (x) | | | | |
| United States | | | 54.9% | |
| France | | | 11.7% | |
| Switzerland | | | 8.1% | |
| United Kingdom | | | 6.6% | |
| Germany | | | 4.6% | |
| Netherlands | | | 2.8% | |
| Japan | | | 2.7% | |
| Sweden | | | 2.2% | |
| Canada | | | 2.0% | |
| Other Countries | | | 4.4% | |
| |
| Currency exposure weightings (y) | | | | |
| United States Dollar | | | 56.2% | |
| Euro | | | 22.1% | |
| Swiss Franc | | | 8.1% | |
| British Pound Sterling | | | 6.6% | |
| Japanese Yen | | | 2.7% | |
| Swedish Krona | | | 2.2% | |
| South Korean Won | | | 0.9% | |
| Danish Krone | | | 0.6% | |
| Brazilian Real | | | 0.2% | |
| Other Currencies | | | 0.4% | |
| (g) | The Global Industry Classification Standard (GICS®) was developed by and/or is the exclusive property of MSCI, Inc. and S&P Global Market Intelligence Inc. (“S&P Global Market Intelligence”). GICS is a service mark of MSCI and S&P Global Market Intelligence and has been licensed for use by MFS. |
| (x) | Represents the portfolio’s exposure to issuer countries as a percentage of a portfolio’s net assets. For purposes of this presentation, United States includes Cash & Cash Equivalents. |
| (y) | Represents the portfolio’s exposure to a particular currency as a percentage of a portfolio’s net assets. For purposes of this presentation, United States Dollar includes Cash & Cash Equivalents. |
Cash & Cash Equivalents includes any cash, investments in money market funds, short-term securities, and other assets less liabilities. Please see the Statement of Assets and Liabilities for additional information related to the fund’s cash position and other assets and liabilities.
Percentages are based on net assets as of June 30, 2020.
The portfolio is actively managed and current holdings may be different.
2
MFS Global Equity Series
EXPENSE TABLE
Fund Expenses Borne by the Contract Holders during the Period,
January 1, 2020 through June 30, 2020
As a contract holder of the fund, you incur ongoing costs, including management fees; distribution and/or service (12b-1) fees; and other fund expenses. This example is intended to help you understand your ongoing costs (in dollars) of investing in the fund and to compare these costs with the ongoing costs of investing in other mutual funds.
The example is based on an investment of $1,000 invested at the beginning of the period and held for the entire period January 1, 2020 through June 30, 2020.
Actual Expenses
The first line for each share class in the following table provides information about actual account values and actual expenses. You may use the information in this line, together with the amount you invested, to estimate the expenses that you paid over the period. Simply divide your account value by $1,000 (for example, an $8,600 account value divided by $1,000 = 8.6), then multiply the result by the number in the first line under the heading entitled “Expenses Paid During Period” to estimate the expenses you paid on your account during this period.
Hypothetical Example for Comparison Purposes
The second line for each share class in the following table provides information about hypothetical account values and hypothetical expenses based on the fund’s actual expense ratio and an assumed rate of return of 5% per year before expenses, which is not the fund’s actual return. The hypothetical account values and expenses may not be used to estimate the actual ending account balance or expenses you paid for the period. You may use this information to compare the ongoing costs of investing in the fund and other funds. To do so, compare this 5% hypothetical example with the 5% hypothetical examples that appear in the shareholder reports of the other funds.
Please note that the expenses shown in the table are meant to highlight the fund’s ongoing costs only and do not take into account the fees and expenses imposed under the variable contracts through which your investment in the fund is made. Therefore, the second line for each share class in the table is useful in comparing ongoing costs associated with an investment in vehicles (such as the fund) which fund benefits under variable annuity and variable life insurance contracts and to qualified pension and retirement plans only, and will not help you determine the relative total costs of investing in the fund through variable annuity and variable life insurance contracts. If the fees and expenses imposed under the variable contracts were included, your costs would have been higher.
| | | | | | | | | | | | | | | | | | |
| Share Class | | | | Annualized
Expense Ratio | | | Beginning
Account Value
1/01/20 | | | Ending
Account Value
6/30/20 | | | Expenses Paid
During Period (p)
1/01/20-6/30/20 | |
| Initial Class | | Actual | | | 0.92% | | | | $1,000.00 | | | | $911.37 | | | | $4.37 | |
| | Hypothetical (h) | | | 0.92% | | | | $1,000.00 | | | | $1,020.29 | | | | $4.62 | |
| Service Class | | Actual | | | 1.17% | | | | $1,000.00 | | | | $909.81 | | | | $5.56 | |
| | Hypothetical (h) | | | 1.17% | | | | $1,000.00 | | | | $1,019.05 | | | | $5.87 | |
| (h) | 5% class return per year before expenses. |
| (p) | “Expenses Paid During Period” are equal to each class’s annualized expense ratio, as shown above, multiplied by the average account value over the period, multiplied by 182/366 (to reflect the one-half year period). |
3
MFS Global Equity Series
PORTFOLIO OF INVESTMENTS – 6/30/20 (unaudited)
The Portfolio of Investments is a complete list of all securities owned by your fund. It is categorized by broad-based asset classes.
| | | | | | | | |
| Issuer | | Shares/Par | | | Value ($) | |
| COMMON STOCKS – 99.3% | | | | | | | | |
| Aerospace – 3.0% | | | | | |
| Honeywell International, Inc. | | | 7,902 | | | $ | 1,142,550 | |
| MTU Aero Engines Holding AG | | | 1,459 | | | | 252,681 | |
| Rolls-Royce Holdings PLC | | | 61,023 | | | | 215,801 | |
| | | | | | | | |
| | | | | | $ | 1,611,032 | |
| | | | | | | | |
| Airlines – 1.0% | | | | | |
| Aena S.A. (a) | | | 3,897 | | | $ | 519,702 | |
| | | | | | | | |
| Alcoholic Beverages – 5.8% | | | | | |
| Ambev S.A. | | | 38,468 | | | $ | 100,024 | |
| Carlsberg A.S., “B” | | | 2,326 | | | | 307,421 | |
| Diageo PLC | | | 32,881 | | | | 1,092,520 | |
| Heineken N.V. | | | 8,864 | | | | 817,211 | |
| Pernod Ricard S.A. | | | 5,169 | | | | 813,322 | |
| | | | | | | | |
| | | | | | $ | 3,130,498 | |
| | | | | | | | |
| Apparel Manufacturers – 4.0% | | | | | |
| Burberry Group PLC | | | 14,456 | | | $ | 286,510 | |
| Compagnie Financiere Richemont S.A. | | | 8,270 | | | | 527,562 | |
| LVMH Moet Hennessy Louis Vuitton SE | | | 3,032 | | | | 1,330,219 | |
| | | | | | | | |
| | | | | | $ | 2,144,291 | |
| | | | | | | | |
| Automotive – 0.4% | | | | | |
| Aptiv PLC | | | 2,850 | | | $ | 222,072 | |
| | | | | | | | |
| Broadcasting – 2.7% | | | | | |
| Omnicom Group, Inc. | | | 3,299 | | | $ | 180,126 | |
| Walt Disney Co. | | | 8,384 | | | | 934,900 | |
| WPP Group PLC | | | 41,940 | | | | 327,813 | |
| | | | | | | | |
| | | | | | $ | 1,442,839 | |
| | | | | | | | |
| Brokerage & Asset Managers – 1.5% | | | | | |
| Charles Schwab Corp. | | | 3,563 | | | $ | 120,215 | |
| Deutsche Boerse AG | | | 1,608 | | | | 290,951 | |
| TD Ameritrade Holding Corp. | | | 10,528 | | | | 383,009 | |
| | | | | | | | |
| | | | | | $ | 794,175 | |
| | | | | | | | |
| Business Services – 8.6% | | | | | |
| Accenture PLC, “A” | | | 6,951 | | | $ | 1,492,519 | |
| Adecco S.A. | | | 4,590 | | | | 215,390 | |
| Brenntag AG | | | 5,231 | | | | 274,868 | |
| Cognizant Technology Solutions Corp., “A” | | | 8,774 | | | | 498,539 | |
| Compass Group PLC | | | 23,675 | | | | 326,213 | |
| Equifax, Inc. | | | 3,747 | | | | 644,034 | |
| Fidelity National Information Services, Inc. | | | 4,169 | | | | 559,021 | |
| PayPal Holdings, Inc. (a) | | | 3,568 | | | | 621,653 | |
| | | | | | | | |
| | | | | | $ | 4,632,237 | |
| | | | | | | | |
| Cable TV – 3.2% | | | | | |
| Comcast Corp., “A” | | | 44,378 | | | $ | 1,729,854 | |
| | | | | | | | |
| Chemicals – 2.6% | | | | | |
| 3M Co. | | | 5,343 | | | $ | 833,455 | |
| PPG Industries, Inc. | | | 5,390 | | | | 571,663 | |
| | | | | | | | |
| | | | | | $ | 1,405,118 | |
| | | | | | | | |
| | | | | | | | |
| Issuer | | Shares/Par | | | Value ($) | |
| COMMON STOCKS – continued | | | | | |
| Computer Software – 2.7% | | | | | |
| Check Point Software Technologies Ltd. (a) | | | 6,153 | | | $ | 661,017 | |
| Oracle Corp. | | | 14,897 | | | | 823,357 | |
| | | | | | | | |
| | | | | | $ | 1,484,374 | |
| | | | | | | | |
| Computer Software – Systems – 0.6% | | | | | |
| Cisco Systems, Inc. | | | 7,184 | | | $ | 335,062 | |
| | | | | | | | |
| Construction – 0.5% | | | | | |
| Otis Worldwide Corp. | | | 4,878 | | | $ | 277,363 | |
| | | | | | | | |
| Consumer Products – 5.4% | | | | | |
| Colgate-Palmolive Co. | | | 8,584 | | | $ | 628,864 | |
| Essity AB (a) | | | 37,469 | | | | 1,210,740 | |
| Reckitt Benckiser Group PLC | | | 11,917 | | | | 1,097,436 | |
| | | | | | | | |
| | | | | | $ | 2,937,040 | |
| | | | | | | | |
| Electrical Equipment – 4.5% | | | | | |
| Amphenol Corp., “A” | | | 3,065 | | | $ | 293,658 | |
| Legrand S.A. | | | 8,227 | | | | 625,014 | |
| Schneider Electric SE | | | 13,767 | | | | 1,529,398 | |
| | | | | | | | |
| | | | | | $ | 2,448,070 | |
| | | | | | | | |
| Electronics – 1.9% | | | | | |
| Hoya Corp. | | | 3,400 | | | $ | 325,601 | |
| Microchip Technology, Inc. | | | 2,506 | | | | 263,907 | |
| Samsung Electronics Co. Ltd. | | | 10,294 | | | | 456,324 | |
| | | | | | | | |
| | | | | | $ | 1,045,832 | |
| | | | | | | | |
| Food & Beverages – 5.3% | | | | | |
| Danone S.A. | | | 15,749 | | | $ | 1,089,242 | |
| Kellogg Co. | | | 2,725 | | | | 180,013 | |
| Nestle S.A. | | | 14,567 | | | | 1,610,373 | |
| | | | | | | | |
| | | | | | $ | 2,879,628 | |
| | | | | | | | |
| Gaming & Lodging – 0.7% | | | | | |
| Marriott International, Inc., “A” | | | 3,175 | | | $ | 272,193 | |
| Sands China Ltd. | | | 18,400 | | | | 72,171 | |
| Wynn Resorts Ltd. | | | 772 | | | | 57,506 | |
| | | | | | | | |
| | | | | | $ | 401,870 | |
| | | | | | | | |
| Insurance – 1.4% | | | | | |
| AON PLC | | | 3,407 | | | $ | 656,188 | |
| Willis Towers Watson PLC | | | 575 | | | | 113,246 | |
| | | | | | | | |
| | | | | | $ | 769,434 | |
| | | | | | | | |
| Internet – 1.2% | | | | | |
| eBay, Inc. | | | 12,070 | | | $ | 633,072 | |
| | | | | | | | |
| Machinery & Tools – 1.5% | | | | | |
| Carrier Global Corp. | | | 4,029 | | | $ | 89,524 | |
| Kubota Corp. | | | 48,800 | | | | 726,746 | |
| | | | | | | | |
| | | | | | $ | 816,270 | |
| | | | | | | | |
| Major Banks – 4.3% | | | | | |
| Bank of New York Mellon Corp. | | | 15,770 | | | $ | 609,510 | |
| Erste Group Bank AG (a) | | | 5,780 | | | | 136,046 | |
4
MFS Global Equity Series
Portfolio of Investments (unaudited) – continued
| | | | | | | | |
| Issuer | | Shares/Par | | | Value ($) | |
| COMMON STOCKS – continued | | | | | |
| Major Banks – continued | | | | | |
| Goldman Sachs Group, Inc. | | | 3,597 | | | $ | 710,839 | |
| State Street Corp. | | | 6,717 | | | | 426,865 | |
| UBS Group AG | | | 38,764 | | | | 446,168 | |
| | | | | | | | |
| | | | | | $ | 2,329,428 | |
| | | | | | | | |
| Medical Equipment – 14.6% | | | | | |
| Abbott Laboratories | | | 8,847 | | | $ | 808,881 | |
| Cooper Cos., Inc. | | | 1,828 | | | | 518,494 | |
| EssilorLuxottica (a) | | | 1,620 | | | | 207,943 | |
| Medtronic PLC | | | 17,122 | | | | 1,570,087 | |
| Olympus Corp. | | | 21,900 | | | | 420,963 | |
| Sonova Holding AG (a) | | | 676 | | | | 134,958 | |
| Stryker Corp. | | | 5,216 | | | | 939,871 | |
| Thermo Fisher Scientific, Inc. | | | 5,221 | | | | 1,891,777 | |
| Waters Corp. (a) | | | 2,986 | | | | 538,674 | |
| Zimmer Biomet Holdings, Inc. | | | 7,187 | | | | 857,840 | |
| | | | | | | | |
| | | | | | $ | 7,889,488 | |
| | | | | | | | |
| Other Banks & Diversified Financials – 5.1% | | | | | |
| American Express Co. | | | 5,884 | | | $ | 560,157 | |
| Grupo Financiero Banorte S.A. de C.V. (a) | | | 24,894 | | | | 86,343 | |
| Julius Baer Group Ltd. | | | 4,977 | | | | 208,283 | |
| Kasikornbank Co. Ltd. | | | 16,900 | | | | 50,852 | |
| Visa, Inc., “A” | | | 9,511 | | | | 1,837,240 | |
| | | | | | | | |
| | | | | | $ | 2,742,875 | |
| | | | | | | | |
| Pharmaceuticals – 5.2% | | | | | |
| Bayer AG | | | 13,373 | | | $ | 981,572 | |
| Johnson & Johnson | | | 797 | | | | 112,082 | |
| Merck KGaA | | | 4,198 | | | | 487,210 | |
| Roche Holding AG | | | 3,601 | | | | 1,247,969 | |
| | | | | | | | |
| | | | | | $ | 2,828,833 | |
| | | | | | | | |
| Railroad & Shipping – 4.7% | | | | | |
| Canadian National Railway Co. | | | 11,832 | | | $ | 1,047,960 | |
| Kansas City Southern Co. | | | 6,710 | | | | 1,001,736 | |
| Union Pacific Corp. | | | 2,732 | | | | 461,899 | |
| | | | | | | | |
| | | | | | $ | 2,511,595 | |
| | | | | | | | |
| Real Estate – 0.4% | | | | | |
| Deutsche Wohnen SE | | | 4,771 | | | $ | 214,141 | |
| | | | | | | | |
| | | | | | | | |
| Issuer | | Shares/Par | | | Value ($) | |
| COMMON STOCKS – continued | | | | | |
| Restaurants – 0.4% | | | | | |
| Whitbread PLC | | | 7,977 | | | $ | 219,629 | |
| | | | | | | | |
| Specialty Chemicals – 4.7% | | | | | |
| Akzo Nobel N.V. | | | 7,789 | | | $ | 697,800 | |
| L’Air Liquide S.A. | | | 3,973 | | | | 573,134 | |
| Linde PLC | | | 1,352 | | | | 286,773 | |
| Linde PLC | | | 4,569 | | | | 961,718 | |
| | | | | | | | |
| | | | | | $ | 2,519,425 | |
| | | | | | | | |
| Specialty Stores – 0.3% | | | | | |
| Hermes International | | | 173 | | | $ | 144,569 | |
| | | | | | | | |
| Trucking – 1.1% | | | | | |
| United Parcel Service, Inc., “B” | | | 5,391 | | | $ | 599,371 | |
| | | | | | | | |
Total Common Stocks
(Identified Cost, $30,373,569) | | | | | | $ | 53,659,187 | |
| | | | | | | | |
|
| INVESTMENT COMPANIES (h) – 1.0% | |
| Money Market Funds – 1.0% | | | | | | | | |
| MFS Institutional Money Market Portfolio, 0.17% (v) (Identified Cost, $576,928) | | | 576,871 | | | $ | 576,928 | |
| | | | | | | | |
OTHER ASSETS, LESS
LIABILITIES – (0.3)% | | | | | | | (183,313 | ) |
| | | | | | | | |
| NET ASSETS – 100.0% | | | | | | $ | 54,052,802 | |
| | | | | | | | |
| (a) | | Non-income producing security. |
| (h) | | An affiliated issuer, which may be considered one in which the fund owns 5% or more of the outstanding voting securities, or a company which is under common control. At period end, the aggregate values of the fund’s investments in affiliated issuers and in unaffiliated issuers were $576,928 and $53,659,187, respectively. |
| (v) | | Affiliated issuer that is available only to investment companies managed by MFS. The rate quoted for the MFS Institutional Money Market Portfolio is the annualized seven-day yield of the fund at period end. |
See Notes to Financial Statements
5
MFS Global Equity Series
FINANCIAL STATEMENTS | STATEMENT OF ASSETS AND LIABILITIES (unaudited)
This statement represents your fund’s balance sheet, which details the assets and liabilities comprising the total value of the fund.
| | | | |
At 6/30/20 | | | | |
| |
Assets | | | | |
Investments in unaffiliated issuers, at value (identified cost, $30,373,569) | | | $53,659,187 | |
Investments in affiliated issuers, at value (identified cost, $576,928) | | | 576,928 | |
Cash | | | 4,270 | |
Receivables for | | | | |
Investments sold | | | 9,658 | |
Fund shares sold | | | 8,102 | |
Dividends | | | 146,349 | |
Receivable from investment adviser | | | 9,247 | |
Other assets | | | 295 | |
Total assets | | | $54,414,036 | |
| |
Liabilities | | | | |
Payables for | | | | |
Investments purchased | | | $25,466 | |
Fund shares reacquired | | | 275,528 | |
Payable to affiliates | | | | |
Administrative services fee | | | 98 | |
Shareholder servicing costs | | | 187 | |
Distribution and/or service fees | | | 149 | |
Accrued expenses and other liabilities | | | 59,806 | |
Total liabilities | | | $361,234 | |
Net assets | | | $54,052,802 | |
| |
Net assets consist of | | | | |
Paid-in capital | | | $27,263,122 | |
Total distributable earnings (loss) | | | 26,789,680 | |
Net assets | | | $54,052,802 | |
Shares of beneficial interest outstanding | | | 2,607,698 | |
| | | | | | | | | | | | |
| | | |
| | | Net assets | | | Shares
outstanding | | | Net asset value
per share | |
Initial Class | | | $43,016,931 | | | | 2,071,553 | | | | $20.77 | |
Service Class | | | 11,035,871 | | | | 536,145 | | | | 20.58 | |
See Notes to Financial Statements
6
MFS Global Equity Series
FINANCIAL STATEMENTS | STATEMENT OF OPERATIONS (unaudited)
This statement describes how much your fund earned in investment income and accrued in expenses. It also describes any gains and/or losses generated by fund operations.
| | | | |
Six months ended 6/30/20 | | | | |
| |
Net investment income (loss) | | | | |
Income | | | | |
Dividends | | | $592,526 | |
Dividends from affiliated issuers | | | 2,375 | |
Other | | | 666 | |
Income on securities loaned | | | 10 | |
Foreign taxes withheld | | | (41,689 | ) |
Total investment income | | | $553,888 | |
Expenses | | | | |
Management fee | | | $242,383 | |
Distribution and/or service fees | | | 13,342 | |
Shareholder servicing costs | | | 3,774 | |
Administrative services fee | | | 9,033 | |
Independent Trustees’ compensation | | | 1,313 | |
Custodian fee | | | 12,128 | |
Shareholder communications | | | 4,774 | |
Audit and tax fees | | | 29,368 | |
Legal fees | | | 295 | |
Miscellaneous | | | 11,651 | |
Total expenses | | | $328,061 | |
Reduction of expenses by investment adviser | | | (66,742 | ) |
Net expenses | | | $261,319 | |
Net investment income (loss) | | | $292,569 | |
| |
Realized and unrealized gain (loss) | | | | |
Realized gain (loss) (identified cost basis) | | | | |
Unaffiliated issuers | | | $911,682 | |
Affiliated issuers | | | (54 | ) |
Foreign currency | | | (856 | ) |
Net realized gain (loss) | | | $910,772 | |
Change in unrealized appreciation or depreciation | | | | |
Unaffiliated issuers | | | $(6,633,346 | ) |
Translation of assets and liabilities in foreign currencies | | | 998 | |
Net unrealized gain (loss) | | | $(6,632,348 | ) |
Net realized and unrealized gain (loss) | | | $(5,721,576 | ) |
Change in net assets from operations | | | $(5,429,007 | ) |
See Notes to Financial Statements
7
MFS Global Equity Series
FINANCIAL STATEMENTS | STATEMENTS OF CHANGES IN NET ASSETS
These statements describe the increases and/or decreases in net assets resulting from operations, any distributions, and any shareholder transactions.
| | | | | | | | |
| | | Six months ended
6/30/20 | | | Year ended
12/31/19 | |
| | | (unaudited) | | | | |
Change in net assets | | | | | | | | |
| | |
From operations | | | | | | | | |
Net investment income (loss) | | | $292,569 | | | | $629,173 | |
Net realized gain (loss) | | | 910,772 | | | | 2,141,172 | |
Net unrealized gain (loss) | | | (6,632,348 | ) | | | 12,139,593 | |
Change in net assets from operations | | | $(5,429,007 | ) | | | $14,909,938 | |
Total distributions to shareholders | | | $— | | | | $(4,146,029 | ) |
Change in net assets from fund share transactions | | | $(1,607,962 | ) | | | $(2,032,350 | ) |
Total change in net assets | | | $(7,036,969 | ) | | | $8,731,559 | |
| | |
Net assets | | | | | | | | |
At beginning of period | | | 61,089,771 | | | | 52,358,212 | |
At end of period | | | $54,052,802 | | | | $61,089,771 | |
See Notes to Financial Statements
8
MFS Global Equity Series
FINANCIAL STATEMENTS | FINANCIAL HIGHLIGHTS
The financial highlights table is intended to help you understand the fund’s financial performance for the semiannual period and the past 5 fiscal years. Certain information reflects financial results for a single fund share. The total returns in the table represent the rate that an investor would have earned (or lost) on an investment in the fund share class (assuming reinvestment of all distributions) held for the entire period.
| | | | | | | | | | | | | | | | | | | | | | | | |
| Initial Class | | Six months
ended 6/30/20 | | | Year ended | |
| | | 12/31/19 | | | 12/31/18 | | | 12/31/17 | | | 12/31/16 | | | 12/31/15 | |
| | | | | | |
| | | (unaudited) | | | | | | | | | | | | | | | | |
| | | | | | |
Net asset value, beginning of period | | | $22.79 | | | | $18.82 | | | | $22.00 | | | | $18.59 | | | | $18.39 | | | | $19.59 | |
| | | | | | |
| Income (loss) from investment operations | | | | | | | | | | | | | | | | | | | | | | | | |
Net investment income (loss) (d) | | | $0.12 | | | | $0.25 | | | | $0.23 | | | | $0.20 | | | | $0.17 | | | | $0.18 | |
Net realized and unrealized gain (loss) | | | (2.14 | ) | | | 5.35 | | | | (2.23 | ) | | | 4.20 | | | | 1.20 | | | | (0.49 | ) |
Total from investment operations | | | $(2.02 | ) | | | $5.60 | | | | $(2.00 | ) | | | $4.40 | | | | $1.37 | | | | $(0.31 | ) |
| | | | | | |
| Less distributions declared to shareholders | | | | | | | | | | | | | | | | | | | | | | | | |
From net investment income | | | $— | | | | $(0.25 | ) | | | $(0.21 | ) | | | $(0.18 | ) | | | $(0.18 | ) | | | $(0.21 | ) |
From net realized gain | | | — | | | | (1.38 | ) | | | (0.97 | ) | | | (0.81 | ) | | | (0.99 | ) | | | (0.68 | ) |
Total distributions declared to shareholders | | | $— | | | | $(1.63 | ) | | | $(1.18 | ) | | | $(0.99 | ) | | | $(1.17 | ) | | | $(0.89 | ) |
Net asset value, end of period (x) | | | $20.77 | | | | $22.79 | | | | $18.82 | | | | $22.00 | | | | $18.59 | | | | $18.39 | |
Total return (%) (k)(r)(s)(x) | | | (8.86 | )(n) | | | 30.57 | | | | (9.74 | ) | | | 24.07 | | | | 7.35 | | | | (1.41 | ) |
| | | | | | |
Ratios (%) (to average net assets)
and Supplemental data: | | | | | | | | | | | | | | | | | | | | | | | | |
Expenses before expense reductions (f) | | | 1.17 | (a) | | | 1.16 | | | | 1.13 | | | | 1.16 | | | | 1.19 | | | | 1.26 | |
Expenses after expense reductions (f) | | | 0.92 | (a) | | | 0.95 | | | | 0.97 | | | | 0.97 | | | | 0.99 | | | | 1.00 | |
Net investment income (loss) | | | 1.14 | (a) | | | 1.16 | | | | 1.07 | | | | 0.95 | | | | 0.93 | | | | 0.91 | |
Portfolio turnover | �� | | 10 | (n) | | | 11 | | | | 15 | | | | 11 | | | | 13 | | | | 12 | |
Net assets at end of period (000 omitted) | | | $43,017 | | | | $49,771 | | | | $45,219 | | | | $52,850 | | | | $44,756 | | | | $45,946 | |
| | |
| Service Class | | Six months
ended 6/30/20 | | | Year ended | |
| | | 12/31/19 | | | 12/31/18 | | | 12/31/17 | | | 12/31/16 | | | 12/31/15 | |
| | | | | | |
| | | (unaudited) | | | | | | | | | | | | | | | | |
| | | | | | |
Net asset value, beginning of period | | | $22.62 | | | | $18.70 | | | | $21.86 | | | | $18.49 | | | | $18.30 | | | | $19.50 | |
| | | | | | |
| Income (loss) from investment operations | | | | | | | | | | | | | | | | | | | | | | | | |
Net investment income (loss) (d) | | | $0.09 | | | | $0.18 | | | | $0.18 | | | | $0.14 | | | | $0.13 | | | | $0.13 | |
Net realized and unrealized gain (loss) | | | (2.13 | ) | | | 5.32 | | | | (2.21 | ) | | | 4.18 | | | | 1.18 | | | | (0.48 | ) |
Total from investment operations | | | $(2.04 | ) | | | $5.50 | | | | $(2.03 | ) | | | $4.32 | | | | $1.31 | | | | $(0.35 | ) |
| | | | | | |
| Less distributions declared to shareholders | | | | | | | | | | | | | | | | | | | | | | | | |
From net investment income | | | $— | | | | $(0.20 | ) | | | $(0.16 | ) | | | $(0.14 | ) | | | $(0.13 | ) | | | $(0.17 | ) |
From net realized gain | | | — | | | | (1.38 | ) | | | (0.97 | ) | | | (0.81 | ) | | | (0.99 | ) | | | (0.68 | ) |
Total distributions declared to shareholders | | | $— | | | | $(1.58 | ) | | | $(1.13 | ) | | | $(0.95 | ) | | | $(1.12 | ) | | | $(0.85 | ) |
Net asset value, end of period (x) | | | $20.58 | | | | $22.62 | | | | $18.70 | | | | $21.86 | | | | $18.49 | | | | $18.30 | |
Total return (%) (k)(r)(s)(x) | | | (9.02 | )(n) | | | 30.20 | | | | (9.92 | ) | | | 23.75 | | | | 7.06 | | | | (1.67 | ) |
| | | | | | |
Ratios (%) (to average net assets)
and Supplemental data: | | | | | | | | | | | | | | | | | | | | | | | | |
Expenses before expense reductions (f) | | | 1.42 | (a) | | | 1.41 | | | | 1.38 | | | | 1.42 | | | | 1.44 | | | | 1.51 | |
Expenses after expense reductions (f) | | | 1.17 | (a) | | | 1.20 | | | | 1.22 | | | | 1.22 | | | | 1.24 | | | | 1.25 | |
Net investment income (loss) | | | 0.88 | (a) | | | 0.85 | | | | 0.86 | | | | 0.68 | | | | 0.70 | | | | 0.67 | |
Portfolio turnover | | | 10 | (n) | | | 11 | | | | 15 | | | | 11 | | | | 13 | | | | 12 | |
Net assets at end of period (000 omitted) | | | $11,036 | | | | $11,319 | | | | $7,139 | | | | $10,162 | | | | $7,033 | | | | $6,893 | |
See Notes to Financial Statements
9
MFS Global Equity Series
Financial Highlights – continued
| (d) | Per share data is based on average shares outstanding. |
| (f) | Ratios do not reflect reductions from fees paid indirectly, if applicable. |
| (k) | The total return does not reflect expenses that apply to separate accounts. Inclusion of these charges would reduce the total return figures for all periods shown. |
| (r) | Certain expenses have been reduced without which performance would have been lower. |
| (s) | From time to time the fund may receive proceeds from litigation settlements, without which performance would be lower. |
| (x) | The net asset values and total returns have been calculated on net assets which include adjustments made in accordance with U.S. generally accepted accounting principles required at period end for financial reporting purposes. |
See Notes to Financial Statements
10
MFS Global Equity Series
NOTES TO FINANCIAL STATEMENTS (unaudited)
| (1) | | Business and Organization |
MFS Global Equity Series (the fund) is a diversified series of MFS Variable Insurance Trust (the trust). The trust is organized as a Massachusetts business trust and is registered under the Investment Company Act of 1940, as amended, as an open-end management investment company. The shareholders of each series of the trust are separate accounts of insurance companies, which offer variable annuity and/or life insurance products, and qualified retirement and pension plans.
The fund is an investment company and accordingly follows the investment company accounting and reporting guidance of the Financial Accounting Standards Board (FASB) Accounting Standards Codification Topic 946 Financial Services – Investment Companies.
| (2) | | Significant Accounting Policies |
General – The preparation of financial statements in conformity with U.S. generally accepted accounting principles requires management to make estimates and assumptions that affect the reported amounts of assets and liabilities, and disclosure of contingent assets and liabilities at the date of the financial statements and the reported amounts of increases and decreases in net assets from operations during the reporting period. Actual results could differ from those estimates. In the preparation of these financial statements, management has evaluated subsequent events occurring after the date of the fund’s Statement of Assets and Liabilities through the date that the financial statements were issued. The fund invests in foreign securities. Investments in foreign securities are vulnerable to the effects of changes in the relative values of the local currency and the U.S. dollar and to the effects of changes in each country’s market, economic, industrial, political, regulatory, geopolitical, environmental, public health, and other conditions.
In March 2020, the FASB issued Accounting Standards Update 2020-04, Reference Rate Reform (Topic 848) – Facilitation of the Effects of Reference Rate Reform on Financial Reporting (“ASU 2020-04”), which provides optional, temporary relief with respect to the financial reporting of contracts subject to certain types of modifications due to the planned discontinuation of the London Interbank Offered Rate (LIBOR) and other IBOR-based reference rates as of the end of 2021. The temporary relief provided by ASU 2020-04 is effective for certain reference rate-related contract modifications that occur during the period from March 12, 2020 through December 31, 2022. Management is evaluating the impact of ASU 2020-04 on the fund’s investments, derivatives, debt and other contracts that will undergo reference rate-related modifications as a result of the reference rate reform.
Balance Sheet Offsetting – The fund’s accounting policy with respect to balance sheet offsetting is that, absent an event of default by the counterparty or a termination of the agreement, the International Swaps and Derivatives Association (ISDA) Master Agreement, or similar agreement, does not result in an offset of reported amounts of financial assets and financial liabilities in the Statement of Assets and Liabilities across transactions between the fund and the applicable counterparty. The fund’s right to setoff may be restricted or prohibited by the bankruptcy or insolvency laws of the particular jurisdiction to which a specific master netting agreement counterparty is subject. Balance sheet offsetting disclosures, to the extent applicable to the fund, have been included in the fund’s Significant Accounting Policies note under the captions for each of the fund’s in-scope financial instruments and transactions.
Investment Valuations – Equity securities, including restricted equity securities, are generally valued at the last sale or official closing price on their primary market or exchange as provided by a third-party pricing service. Equity securities, for which there were no sales reported that day, are generally valued at the last quoted daily bid quotation on their primary market or exchange as provided by a third-party pricing service. Short-term instruments with a maturity at issuance of 60 days or less may be valued at amortized cost, which approximates market value. Open-end investment companies are generally valued at net asset value per share. Securities and other assets generally valued on the basis of information from a third-party pricing service may also be valued at a broker/dealer bid quotation. In determining values, third-party pricing services can utilize both transaction data and market information such as yield, quality, coupon rate, maturity, type of issue, trading characteristics, and other market data. The values of foreign securities and other assets and liabilities expressed in foreign currencies are converted to U.S. dollars using the mean of bid and asked prices for rates provided by a third-party pricing service.
The Board of Trustees has delegated primary responsibility for determining or causing to be determined the value of the fund’s investments (including any fair valuation) to the adviser pursuant to valuation policies and procedures approved by the Board. If the adviser determines that reliable market quotations are not readily available, investments are valued at fair value as determined in good faith by the adviser in accordance with such procedures under the oversight of the Board of Trustees. Under the fund’s valuation policies and procedures, market quotations are not considered to be readily available for most types of debt instruments and floating rate loans and many types of derivatives. These investments are generally valued at fair value based on information from third-party pricing services. In addition, investments may be valued at fair value if the adviser determines that an investment’s value has been materially affected by events occurring after the close of the exchange or market on which the investment is principally traded (such as foreign exchange or market) and prior to the determination of the fund’s net asset value, or after the halt of trading of a specific security where trading does not resume prior to the close of the exchange or market on which the security is principally
11
MFS Global Equity Series
Notes to Financial Statements (unaudited) – continued
traded. Events that occur after foreign markets close (such as developments in foreign markets and significant movements in the U.S. markets) and prior to the determination of the fund’s net asset value may be deemed to have a material effect on the value of securities traded in foreign markets. Accordingly, the fund’s foreign equity securities may often be valued at fair value. The adviser generally relies on third-party pricing services or other information (such as the correlation with price movements of similar securities in the same or other markets; the type, cost and investment characteristics of the security; the business and financial condition of the issuer; and trading and other market data) to assist in determining whether to fair value and at what value to fair value an investment. The value of an investment for purposes of calculating the fund’s net asset value can differ depending on the source and method used to determine value. When fair valuation is used, the value of an investment used to determine the fund’s net asset value may differ from quoted or published prices for the same investment. There can be no assurance that the fund could obtain the fair value assigned to an investment if it were to sell the investment at the same time at which the fund determines its net asset value per share.
Various inputs are used in determining the value of the fund’s assets or liabilities. These inputs are categorized into three broad levels. In certain cases, the inputs used to measure fair value may fall into different levels of the fair value hierarchy. In such cases, an investment’s level within the fair value hierarchy is based on the lowest level of input that is significant to the fair value measurement. The fund’s assessment of the significance of a particular input to the fair value measurement in its entirety requires judgment, and considers factors specific to the investment. Level 1 includes unadjusted quoted prices in active markets for identical assets or liabilities. Level 2 includes other significant observable market-based inputs (including quoted prices for similar securities, interest rates, prepayment speed, and credit risk). Level 3 includes unobservable inputs, which may include the adviser’s own assumptions in determining the fair value of investments. The following is a summary of the levels used as of June 30, 2020 in valuing the fund’s assets or liabilities:
| | | | | | | | | | | | | | | | |
| Financial Instruments | | Level 1 | | | Level 2 | | | Level 3 | | | Total | |
| Equity Securities: | | | | | | | | | | | | | | | | |
United States | | | $28,289,659 | | | | $961,718 | | | | $— | | | | $29,251,377 | |
France | | | 6,312,841 | | | | — | | | | — | | | | 6,312,841 | |
Switzerland | | | 4,390,703 | | | | — | | | | — | | | | 4,390,703 | |
United Kingdom | | | 3,565,922 | | | | — | | | | — | | | | 3,565,922 | |
Germany | | | 1,519,851 | | | | 981,572 | | | | — | | | | 2,501,423 | |
Netherlands | | | 1,515,011 | | | | — | | | | — | | | | 1,515,011 | |
Japan | | | 1,147,709 | | | | 325,601 | | | | — | | | | 1,473,310 | |
Sweden | | | 1,210,740 | | | | — | | | | — | | | | 1,210,740 | |
Canada | | | 1,047,960 | | | | — | | | | — | | | | 1,047,960 | |
Other Countries | | | 1,933,576 | | | | 456,324 | | | | — | | | | 2,389,900 | |
| Mutual Funds | | | 576,928 | | | | — | | | | — | | | | 576,928 | |
| Total | | | $51,510,900 | | | | $2,725,215 | | | | $— | | | | $54,236,115 | |
For further information regarding security characteristics, see the Portfolio of Investments.
Foreign Currency Translation – Purchases and sales of foreign investments, income, and expenses are converted into U.S. dollars based upon currency exchange rates prevailing on the respective dates of such transactions or on the reporting date for foreign denominated receivables and payables. Gains and losses attributable to foreign currency exchange rates on sales of securities are recorded for financial statement purposes as net realized gains and losses on investments. Gains and losses attributable to foreign exchange rate movements on receivables, payables, income and expenses are recorded for financial statement purposes as foreign currency transaction gains and losses. That portion of both realized and unrealized gains and losses on investments that results from fluctuations in foreign currency exchange rates is not separately disclosed.
Security Loans – Under its Securities Lending Agency Agreement with the fund, State Street Bank and Trust Company, as lending agent, loans the securities of the fund to certain qualified institutions (the “Borrowers”) approved by the fund. Security loans can be terminated at the discretion of either the lending agent or the fund and the related securities must be returned within the earlier of the standard trade settlement period for such securities or within three business days. The loans are collateralized by cash and/or U.S. Treasury and federal agency obligations in an amount typically at least equal to the market value of the securities loaned. On loans collateralized by cash, the cash collateral is invested in a money market fund. The market value of the loaned securities is determined at the close of business of the fund and any additional required collateral is delivered to the fund on the next business day. The lending agent provides the fund with indemnification against Borrower default. In the event of Borrower default, the lending agent will, for the benefit of the fund, either purchase securities identical to those loaned or, when such purchase is commercially impracticable, pay the fund the market value of the loaned securities. In return, the lending agent assumes the fund’s rights to the related collateral. If the collateral value is less than the cost to purchase identical securities, the lending agent is responsible for the shortfall, but only to the extent that such shortfall is not due to a decline in collateral value resulting from collateral reinvestment for which the fund bears the risk of loss. A portion of the income generated upon investment of the collateral
12
MFS Global Equity Series
Notes to Financial Statements (unaudited) – continued
is remitted to the Borrowers, and the remainder is allocated between the fund and the lending agent. On loans collateralized by U.S. Treasury and/or federal agency obligations, a fee is received from the Borrower, and is allocated between the fund and the lending agent. Income from securities lending is separately reported in the Statement of Operations. The dividend and interest income earned on the securities loaned is accounted for in the same manner as other dividend and interest income. At June 30, 2020, there were no securities on loan or collateral outstanding.
Indemnifications – Under the fund’s organizational documents, its officers and Trustees may be indemnified against certain liabilities and expenses arising out of the performance of their duties to the fund. Additionally, in the normal course of business, the fund enters into agreements with service providers that may contain indemnification clauses. The fund’s maximum exposure under these agreements is unknown as this would involve future claims that may be made against the fund that have not yet occurred.
Investment Transactions and Income – Investment transactions are recorded on the trade date. Dividends received in cash are recorded on the ex-dividend date. Certain dividends from foreign securities will be recorded when the fund is informed of the dividend if such information is obtained subsequent to the ex-dividend date. Dividend payments received in additional securities are recorded on the ex-dividend date in an amount equal to the value of the security on such date.
The fund may receive proceeds from litigation settlements. Any proceeds received from litigation involving portfolio holdings are reflected in the Statement of Operations in realized gain/loss if the security has been disposed of by the fund or in unrealized gain/loss if the security is still held by the fund. Any other proceeds from litigation not related to portfolio holdings are reflected as other income in the Statement of Operations.
Tax Matters and Distributions – The fund intends to qualify as a regulated investment company, as defined under Subchapter M of the Internal Revenue Code, and to distribute all of its taxable income, including realized capital gains. As a result, no provision for federal income tax is required. The fund’s federal tax returns, when filed, will remain subject to examination by the Internal Revenue Service for a three year period. Management has analyzed the fund’s tax positions taken on federal and state tax returns for all open tax years and does not believe that there are any uncertain tax positions that require recognition of a tax liability. Foreign taxes, if any, have been accrued by the fund in the accompanying financial statements in accordance with the applicable foreign tax law. Foreign income taxes may be withheld by certain countries in which the fund invests. Additionally, capital gains realized by the fund on securities issued in or by certain foreign countries may be subject to capital gains tax imposed by those countries.
Distributions to shareholders are recorded on the ex-dividend date. Income and capital gain distributions are determined in accordance with income tax regulations, which may differ from U.S. generally accepted accounting principles. Certain capital accounts in the financial statements are periodically adjusted for permanent differences in order to reflect their tax character. These adjustments have no impact on net assets or net asset value per share. Temporary differences which arise from recognizing certain items of income, expense, gain or loss in different periods for financial statement and tax purposes will reverse at some time in the future.
Book/tax differences primarily relate to wash sale loss deferrals.
The tax character of distributions declared to shareholders for the last fiscal year is as follows:
| | | | |
| | | Year ended
12/31/19 | |
| Ordinary income (including any short-term capital gains) | | | $712,018 | |
| Long-term capital gains | | | 3,434,011 | |
| Total distributions | | | $4,146,029 | |
The federal tax cost and the tax basis components of distributable earnings were as follows:
| | | | |
| As of 6/30/20 | | | | |
| |
| Cost of investments | | | $31,417,205 | |
| Gross appreciation | | | 24,183,264 | |
| Gross depreciation | | | (1,364,354 | ) |
| Net unrealized appreciation (depreciation) | | | $22,818,910 | |
| |
| As of 12/31/19 | | | | |
| |
| Undistributed ordinary income | | | 698,843 | |
| Undistributed long-term capital gain | | | 2,067,497 | |
| Other temporary differences | | | 90 | |
| Net unrealized appreciation (depreciation) | | | 29,452,257 | |
The aggregate cost above includes prior fiscal year end tax adjustments, if applicable.
13
MFS Global Equity Series
Notes to Financial Statements (unaudited) – continued
Multiple Classes of Shares of Beneficial Interest – The fund offers multiple classes of shares, which differ in their respective distribution and/or service fees. The fund’s income, realized and unrealized gain (loss), and common expenses are allocated to shareholders based on the daily net assets of each class. Dividends are declared separately for each class. Differences in per share dividend rates are generally due to differences in separate class expenses. The fund’s distributions declared to shareholders as reported in the Statements of Changes in Net Assets are presented by class as follows:
| | | | | | | | |
| | |
| | | Six months ended
6/30/20 | | | Year ended
12/31/19 | |
| Initial Class | | | $— | | | | $3,413,794 | |
| Service Class | | | — | | | | 732,235 | |
| Total | | | $— | | | | $4,146,029 | |
| (3) | | Transactions with Affiliates |
Investment Adviser – The fund has an investment advisory agreement with MFS to provide overall investment management and related administrative services and facilities to the fund. The management fee is computed daily and paid monthly at the following annual rates based on the fund’s average daily net assets:
| | | | |
| Up to $1 billion | | | 0.90% | |
| In excess of $1 billion and up to $2.5 billion | | | 0.75% | |
| In excess of $2.5 billion | | | 0.65% | |
MFS has agreed in writing to reduce its management fee by a specified amount if certain MFS mutual fund assets exceed thresholds agreed to by MFS and the fund’s Board of Trustees. For the six months ended June 30, 2020, this management fee reduction amounted to $2,902, which is included in the reduction of total expenses in the Statement of Operations. The management fee incurred for the six months ended June 30, 2020 was equivalent to an annual effective rate of 0.89% of the fund’s average daily net assets.
The investment adviser has agreed in writing to pay a portion of the fund’s total annual operating expenses, excluding interest, taxes, extraordinary expenses, brokerage and transaction costs, and investment-related expenses, such that total annual operating expenses do not exceed 0.92% of average daily net assets for the Initial Class shares and 1.17% of average daily net assets for the Service Class shares. This written agreement will continue until modified by the fund’s Board of Trustees, but such agreement will continue at least until April 30, 2022. For the six months ended June 30, 2020, this reduction amounted to $63,840, which is included in the reduction of total expenses in the Statement of Operations.
Distributor – MFS Fund Distributors, Inc. (MFD), a wholly-owned subsidiary of MFS, is the distributor of shares of the fund. The Trustees have adopted a distribution plan for the Service Class shares pursuant to Rule 12b-1 under the Investment Company Act of 1940.
The fund’s distribution plan provides that the fund will pay MFD distribution and/or service fees equal to 0.25% per annum of its average daily net assets attributable to Service Class shares as partial consideration for services performed and expenses incurred by MFD and financial intermediaries (including participating insurance companies that invest in the fund to fund variable annuity and variable life insurance contracts, sponsors of qualified retirement and pension plans that invest in the fund, and affiliates of these participating insurance companies and plan sponsors) in connection with the sale and distribution of the Service Class shares. MFD may subsequently pay all, or a portion, of the distribution and/or service fees to financial intermediaries.
Shareholder Servicing Agent – MFS Service Center, Inc. (MFSC), a wholly-owned subsidiary of MFS, receives a fee from the fund for its services as shareholder servicing agent. For the six months ended June 30, 2020, the fee was $3,627, which equated to 0.0135% annually of the fund’s average daily net assets. MFSC also receives payment from the fund for out-of-pocket expenses paid by MFSC on behalf of the fund. For the six months ended June 30, 2020, these costs amounted to $147.
Administrator – MFS provides certain financial, legal, shareholder communications, compliance, and other administrative services to the fund. Under an administrative services agreement, the fund reimburses MFS the costs incurred to provide these services. The fund is charged an annual fixed amount of $17,500 plus a fee based on average daily net assets. The administrative services fee incurred for the six months ended June 30, 2020 was equivalent to an annual effective rate of 0.0335% of the fund’s average daily net assets.
Trustees’ and Officers’ Compensation – The fund pays compensation to independent Trustees in the form of a retainer, attendance fees, and additional compensation to Board and Committee chairpersons. The fund does not pay compensation directly to Trustees or officers of the fund who are also officers of the investment adviser, all of whom receive remuneration from MFS for their services to the fund. Certain officers and Trustees of the fund are officers or directors of MFS, MFD, and MFSC.
14
MFS Global Equity Series
Notes to Financial Statements (unaudited) – continued
Other – The fund invests in the MFS Institutional Money Market Portfolio which is managed by MFS and seeks current income consistent with preservation of capital and liquidity. This money market fund does not pay a management fee to MFS but does incur investment and operating costs.
The fund is permitted to engage in purchase and sale transactions with funds and accounts for which MFS serves as investment adviser or sub-adviser (“cross-trades”) pursuant to a policy adopted by the Board of Trustees. This policy has been designed to ensure that cross-trades conducted by the fund comply with Rule 17a-7 under the Investment Company Act of 1940. During the six months ended June 30, 2020, the fund engaged in purchase and sale transactions pursuant to this policy, which amounted to $8,446 and $36,536, respectively. The sales transactions resulted in net realized gains (losses) of $13,872.
For the six months ended June 30, 2020, purchases and sales of investments, other than short-term obligations, aggregated $5,132,978 and $6,656,920, respectively.
| (5) | | Shares of Beneficial Interest |
The fund’s Declaration of Trust permits the Trustees to issue an unlimited number of full and fractional shares of beneficial interest. Transactions in fund shares were as follows:
| | | | | | | | | | | | | | | | |
| | | Six months ended 6/30/20 | | | Year ended 12/31/19 | |
| | | | |
| | | Shares | | | Amount | | | Shares | | | Amount | |
| Shares sold | | | | | | | | | | | | | | | | |
Initial Class | | | 245,039 | | | | $4,721,895 | | | | 243,665 | | | | $5,233,272 | |
Service Class | | | 145,662 | | | | 2,906,793 | | | | 181,904 | | | | 3,932,099 | |
| | | 390,701 | | | | $7,628,688 | | | | 425,569 | | | | $9,165,371 | |
| | | | |
| Shares issued to shareholders in reinvestment of distributions | | | | | | | | | | | | | | | | |
Initial Class | | | — | | | | $— | | | | 164,362 | | | | $3,413,794 | |
Service Class | | | — | | | | — | | | | 35,494 | | | | 732,235 | |
| | | — | | | | $— | | | | 199,856 | | | | $4,146,029 | |
| | | | |
| Shares reacquired | | | | | | | | | | | | | | | | |
Initial Class | | | (357,505 | ) | | | $(7,122,082 | ) | | | (626,155 | ) | | | $(13,215,661 | ) |
Service Class | | | (109,939 | ) | | | (2,114,568 | ) | | | (98,818 | ) | | | (2,128,089 | ) |
| | | (467,444 | ) | | | $(9,236,650 | ) | | | (724,973 | ) | | | $(15,343,750 | ) |
| | | | |
| Net change | | | | | | | | | | | | | | | | |
Initial Class | | | (112,466 | ) | | | $(2,400,187 | ) | | | (218,128 | ) | | | $(4,568,595 | ) |
Service Class | | | 35,723 | | | | 792,225 | | | | 118,580 | | | | 2,536,245 | |
| | | (76,743 | ) | | | $(1,607,962 | ) | | | (99,548 | ) | | | $(2,032,350 | ) |
The fund and certain other funds managed by MFS participate in a $1.25 billion unsecured committed line of credit, subject to a $1 billion sublimit, provided by a syndicate of banks under a credit agreement. Borrowings may be made for temporary financing needs. Interest is charged to each fund, based on its borrowings, generally at a rate equal to the highest of one month LIBOR, the Federal Funds Effective Rate and the Overnight Bank Funding Rate, plus an agreed upon spread. A commitment fee, based on the average daily, unused portion of the committed line of credit, is allocated among the participating funds. In addition, the fund and other funds managed by MFS have established unsecured uncommitted borrowing arrangements with certain banks for temporary financing needs. Interest is charged to each fund, based on its borrowings, at rates equal to customary reference rates plus an agreed upon spread. For the six months ended June 30, 2020, the fund’s commitment fee and interest expense were $145 and $0, respectively, and are included in “Miscellaneous” expense in the Statement of Operations.
| (7) | | Investments in Affiliated Issuers |
An affiliated issuer may be considered one in which the fund owns 5% or more of the outstanding voting securities, or a company which is under common control. For the purposes of this report, the following were affiliated issuers:
| | | | | | | | | | | | | | | | | | | | | | | | |
| Affiliated Issuers | | Beginning
Value | | | Purchases | | | Sales
Proceeds | | | Realized
Gain
(Loss) | | | Change in
Unrealized
Appreciation or
Depreciation | | | Ending
Value | |
| MFS Institutional Money Market Portfolio | | | $198,259 | | | | $7,377,963 | | | | $6,999,240 | | | | $(54 | ) | | | $— | | | | $576,928 | |
| | | | | | |
| Affiliated Issuers | | | | | | | | | | | | | | Dividend
Income | | | Capital Gain
Distributions | |
| MFS Institutional Money Market Portfolio | | | | | | | | | | | | $2,375 | | | | $— | |
15
MFS Global Equity Series
Notes to Financial Statements (unaudited) – continued
The pandemic related to the global spread of novel coronavirus disease (COVID-19), which was first detected in December 2019, has resulted in significant disruptions to global business activity and the global economy, as well as the economies of individual countries, the financial performance of individual companies and sectors, and the securities and commodities markets in general. This pandemic, the full effects of which are still unknown, has resulted in substantial market volatility and may have adversely impacted the prices and liquidity of the fund’s investments and the fund’s performance.
16
MFS Global Equity Series
STATEMENT REGARDING LIQUIDITY RISK MANAGEMENT PROGRAM
The fund has adopted and implemented a liquidity risk management program (the “Program”) as required by Rule 22e-4 under the Investment Company Act of 1940, as amended. The fund’s Board of Trustees (the “Board”) has designated MFS as the administrator of the Program. The Program is reasonably designed to assess and manage the liquidity risk of the fund. Liquidity risk is the risk that the fund could not meet requests to redeem shares issued by the fund without significant dilution of remaining investors’ interests.
MFS provided a written report to the Board for consideration at its April 2020 meeting that addressed the operation of the Program and provided an assessment of the adequacy and effectiveness of the Program during the period from the adoption of the Program on December 1, 2018 to December 31, 2019 (the “Covered Period”). The report concluded that during the Covered Period the Program had operated effectively and had adequately and effectively been implemented to assess and manage the fund’s liquidity risk. MFS also reported that there were no liquidity events that impacted the fund or its ability to timely meet redemptions without dilution to existing shareholders during the Covered Period.
There can be no assurance that the Program will achieve its objectives in the future. Further information on liquidity risk, and other principal risks to which an investment in the fund may be subject, can be found in the prospectus.
17
MFS Global Equity Series
PROXY VOTING POLICIES AND INFORMATION
MFS votes proxies on behalf of the fund pursuant to proxy voting policies and procedures that are available without charge, upon request, by calling 1-800-225-2606, by visiting mfs.com/proxyvoting, or by visiting the SEC’s Web site at http://www.sec.gov.
Information regarding how the fund voted proxies relating to portfolio securities during the most recent twelve-month period ended June 30 is available by August 31 of each year without charge by visiting mfs.com/proxyvoting, or by visiting the SEC’s Web site at http://www.sec.gov.
QUARTERLY PORTFOLIO DISCLOSURE
The fund files a complete schedule of portfolio holdings with the SEC for the first and third quarters of each fiscal year as an exhibit to its reports on Form N-PORT. The fund’s Form N-PORT reports are available on the SEC’s website at http://www.sec.gov. A shareholder can obtain the portfolio holdings report for the first and third quarters of the fund’s fiscal year at mfs.com/vit1 by choosing the fund’s name and then selecting the “Resources” tab and clicking on “Prospectus and Reports”.
FURTHER INFORMATION
From time to time, MFS may post important information about the fund or the MFS funds on the MFS web site (mfs.com). This information is available at https://www.mfs.com/announcements or at mfs.com/vit1 by choosing the fund’s name and then selecting the “Resources” tab and clicking on the “Announcements” tab, if any.
INFORMATION ABOUT FUND CONTRACTS AND LEGAL CLAIMS
The fund has entered into contractual arrangements with an investment adviser, administrator, distributor, shareholder servicing agent, 529 program manager (if applicable), and custodian who each provide services to the fund. Unless expressly stated otherwise, shareholders are not parties to, or intended beneficiaries of these contractual arrangements, and these contractual arrangements are not intended to create any shareholder right to enforce them against the service providers or to seek any remedy under them against the service providers, either directly or on behalf of the fund.
Under the Trust’s By-Laws and Declaration of Trust, any claims asserted against or on behalf of the MFS Funds, including claims against Trustees and Officers, must be brought in state and federal courts located within the Commonwealth of Massachusetts.
18
Semiannual Report
June 30, 2020

MFS® Growth Series

MFS® Variable Insurance Trust
Beginning on January 1, 2021, as permitted by regulations adopted by the U.S. Securities and Exchange Commission, the insurance company that offers your contract may determine that it will no longer send you paper copies of the fund’s annual and semiannual shareholder reports unless you specifically request paper copies from the insurance company or from your financial intermediary. Instead, the shareholder reports will be made available on a Web site (insurancefunds.mfs.com or other Web site of which you will be notified), and the insurance company will notify you by mail each time a report is posted and provide you with a Web site link to access the report. Instructions for requesting paper copies will be provided by your insurance company or financial intermediary.
If you already elected to receive shareholder reports by email, you will not be affected by this change and you need not take any action. If your insurance company or financial intermediary offers electronic delivery, you may elect to receive shareholder reports and other communications from the insurance company or financial intermediary by email by following the instructions provided by the insurance company or financial intermediary.
Beginning on January 1, 2019, you may elect to receive all future reports in paper free of charge from the insurance company or financial intermediary. You can inform the insurance company or financial intermediary that you wish to continue receiving paper copies of your shareholder reports by contacting your insurance company or financial intermediary. Your election to receive reports in paper will apply to all funds held in your account with your insurance company or financial intermediary.
VEG-SEM
MFS® Growth Series
CONTENTS
The report is prepared for the general information of contract owners. It is authorized for distribution to prospective investors only when preceded or accompanied by a current prospectus.
NOT FDIC INSURED • MAY LOSE VALUE • NO BANK OR CREDIT UNION GUARANTEE • NOT A DEPOSIT • NOT INSURED BY ANY FEDERAL GOVERNMENT AGENCY OR NCUA/NCUSIF
MFS Growth Series
LETTER FROM THE EXECUTIVE CHAIR

Dear Contract Owners:
Markets experienced dramatic swings in early 2020, as the coronavirus pandemic brought the global economy to a standstill for several months. Optimism over the development of vaccines and therapeutics, along with a decline in cases in countries that had been affected by the outbreak early on, brightened the economic and market outlook during the second quarter, as did the phased reopening of US states. However, a great deal of uncertainty remains, including the possibility of a second wave of cases later this year, as many countries continue to experience COVID-19 flare-ups.
Global central banks have taken aggressive steps to cushion the economic and market fallout related to the virus, and governments are deploying unprecedented levels of fiscal support. As uncertainty recedes, these measures can help build a supportive environment and encourage economic recovery; however, if markets disconnect from fundamentals, they can also sow the seeds of instability. In the aftermath of the crisis, societal changes may be likely, as households, businesses, and governments adjust to a new reality, and these alterations could affect the investment landscape. For investors, events, such as the COVID-19 outbreak, demonstrate the importance of having a deep understanding of company fundamentals, and we have built our global research platform to do just that.
Here at MFS®, we aim to help our clients navigate the growing complexity of the markets and world economies. Our long-term investment philosophy and commitment to the responsible allocation of capital allow us to tune out the noise and uncover what we believe are the best, most durable investment opportunities in the market. Through our unique global investment platform, we combine collective expertise, thoughtful risk management, and long-term discipline to create sustainable value for investors.
Respectfully,

Robert J. Manning
Executive Chair
MFS Investment Management
August 17, 2020
The opinions expressed in this letter are subject to change, may not be relied upon for investment advice, and no forecasts can be guaranteed.
1
MFS Growth Series
PORTFOLIO COMPOSITION
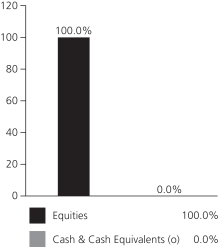
Portfolio structure
| | | | |
| Top ten holdings | | | | |
| Microsoft Corp. | | | 10.4% | |
| Amazon.com, Inc. | | | 8.3% | |
| Adobe Systems, Inc. | | | 4.5% | |
| Alphabet, Inc., “A” | | | 4.2% | |
| Visa, Inc., “A” | | | 3.9% | |
| MasterCard, Inc., “A” | | | 3.3% | |
| Facebook, Inc., “A” | | | 2.9% | |
| Salesforce.com, Inc. | | | 2.2% | |
| Apple, Inc. | | | 2.2% | |
| Thermo Fisher Scientific, Inc. | | | 2.1% | |
| | | | |
| GICS equity sectors (g) | | | | |
| Information Technology | | | 42.6% | |
| Communication Services | | | 15.5% | |
| Health Care | | | 13.2% | |
| Consumer Discretionary | | | 11.9% | |
| Industrials | | | 6.8% | |
| Financials | | | 3.5% | |
| Materials | | | 2.3% | |
| Consumer Staples | | | 2.1% | |
| Real Estate | | | 2.1% | |
| (g) | The Global Industry Classification Standard (GICS®) was developed by and/or is the exclusive property of MSCI, Inc. and S&P Global Market Intelligence Inc. (“S&P Global Market Intelligence”). GICS is a service mark of MSCI and S&P Global Market Intelligence and has been licensed for use by MFS. |
Cash & Cash Equivalents includes any cash, investments in money market funds, short-term securities, and other assets less liabilities. Please see the Statement of Assets and Liabilities for additional information related to the fund’s cash position and other assets and liabilities.
Percentages are based on net assets as of June 30, 2020.
The portfolio is actively managed and current holdings may be different.
2
MFS Growth Series
EXPENSE TABLE
Fund Expenses Borne by the Contract Holders during the Period,
January 1, 2020 through June 30, 2020
As a contract holder of the fund, you incur ongoing costs, including management fees; distribution and/or service (12b-1) fees; and other fund expenses. This example is intended to help you understand your ongoing costs (in dollars) of investing in the fund and to compare these costs with the ongoing costs of investing in other mutual funds.
The example is based on an investment of $1,000 invested at the beginning of the period and held for the entire period January 1, 2020 through June 30, 2020.
Actual Expenses
The first line for each share class in the following table provides information about actual account values and actual expenses. You may use the information in this line, together with the amount you invested, to estimate the expenses that you paid over the period. Simply divide your account value by $1,000 (for example, an $8,600 account value divided by $1,000 = 8.6), then multiply the result by the number in the first line under the heading entitled “Expenses Paid During Period” to estimate the expenses you paid on your account during this period.
Hypothetical Example for Comparison Purposes
The second line for each share class in the following table provides information about hypothetical account values and hypothetical expenses based on the fund’s actual expense ratio and an assumed rate of return of 5% per year before expenses, which is not the fund’s actual return. The hypothetical account values and expenses may not be used to estimate the actual ending account balance or expenses you paid for the period. You may use this information to compare the ongoing costs of investing in the fund and other funds. To do so, compare this 5% hypothetical example with the 5% hypothetical examples that appear in the shareholder reports of the other funds.
Please note that the expenses shown in the table are meant to highlight the fund’s ongoing costs only and do not take into account the fees and expenses imposed under the variable contracts through which your investment in the fund is made. Therefore, the second line for each share class in the table is useful in comparing ongoing costs associated with an investment in vehicles (such as the fund) which fund benefits under variable annuity and variable life insurance contracts and to qualified pension and retirement plans only, and will not help you determine the relative total costs of investing in the fund through variable annuity and variable life insurance contracts. If the fees and expenses imposed under the variable contracts were included, your costs would have been higher.
| | | | | | | | | | | | | | | | | | |
| Share Class | | | | Annualized
Expense Ratio | | | Beginning
Account Value
1/01/20 | | | Ending Account Value
6/30/20 | | | Expenses Paid
During Period (p)
1/01/20-6/30/20 | |
| Initial Class | | Actual | | | 0.73% | | | | $1,000.00 | | | | $1,100.17 | | | | $3.81 | |
| | Hypothetical (h) | | | 0.73% | | | | $1,000.00 | | | | $1,021.23 | | | | $3.67 | |
| Service Class | | Actual | | | 0.98% | | | | $1,000.00 | | | | $1,099.09 | | | | $5.11 | |
| | Hypothetical (h) | | | 0.98% | | | | $1,000.00 | | | | $1,019.99 | | | | $4.92 | |
| (h) | 5% class return per year before expenses. |
| (p) | “Expenses Paid During Period” are equal to each class’s annualized expense ratio, as shown above, multiplied by the average account value over the period, multiplied by 182/366 (to reflect the one-half year period). |
3
MFS Growth Series
PORTFOLIO OF INVESTMENTS – 6/30/20 (unaudited)
The Portfolio of Investments is a complete list of all securities owned by your fund. It is categorized by broad-based asset classes.
| | | | | | | | |
| Issuer | | Shares/Par | | | Value ($) | |
| COMMON STOCKS – 100.0% | | | | | | | | |
| Apparel Manufacturers – 0.6% | | | | | | | | |
| NIKE, Inc., “B” | | | 115,345 | | | $ | 11,309,577 | |
| | | | | | | | |
| Biotechnology – 2.6% | | | | | | | | |
| Alnylam Pharmaceuticals, Inc. (a) | | | 26,496 | | | $ | 3,924,322 | |
| Illumina, Inc. (a) | | | 40,840 | | | | 15,125,094 | |
| Seattle Genetics, Inc. (a) | | | 41,016 | | | | 6,969,439 | |
| Vertex Pharmaceuticals, Inc. (a) | | | 82,247 | | | | 23,877,127 | |
| | | | | | | | |
| | | | | | $ | 49,895,982 | |
| | | | | | | | |
| Broadcasting – 1.9% | | | | | | | | |
| Netflix, Inc. (a) | | | 82,473 | | | $ | 37,528,514 | |
| | | | | | | | |
| Brokerage & Asset Managers – 0.6% | | | | | |
| Intercontinental Exchange, Inc. | | | 129,980 | | | $ | 11,906,168 | |
| | | | | | | | |
| Business Services – 12.0% | | | | | | | | |
| Clarivate PLC (a) | | | 632,283 | | | $ | 14,118,880 | |
| CoStar Group, Inc. (a) | | | 15,196 | | | | 10,799,341 | |
| Equifax, Inc. | | | 31,515 | | | | 5,416,798 | |
| Fidelity National Information Services, Inc. | | | 240,003 | | | | 32,182,002 | |
| Fiserv, Inc. (a) | | | 283,010 | | | | 27,627,436 | |
| Global Payments, Inc. | | | 176,228 | | | | 29,891,793 | |
| IHS Markit Ltd. | | | 153,504 | | | | 11,589,552 | |
| MSCI, Inc. | | | 86,814 | | | | 28,980,250 | |
| PayPal Holdings, Inc. (a) | | | 218,792 | | | | 38,120,130 | |
| Verisk Analytics, Inc., “A” | | | 188,790 | | | | 32,132,058 | |
| | | | | | | | |
| | | | | | $ | 230,858,240 | |
| | | | | | | | |
| Cable TV – 1.5% | | | | | | | | |
| Charter Communications, Inc., “A” (a) | | | 55,860 | | | $ | 28,490,834 | |
| | | | | | | | |
| Computer Software – 21.2% | | | | | | | | |
| Adobe Systems, Inc. (a) | | | 199,867 | | | $ | 87,004,104 | |
| Atlassian Corp. PLC, “A” (a) | | | 37,517 | | | | 6,763,190 | |
| Autodesk, Inc. (a) | | | 12,360 | | | | 2,956,388 | |
| Black Knight, Inc. (a) | | | 72,421 | | | | 5,254,868 | |
| Cadence Design Systems, Inc. (a) | | | 213,019 | | | | 20,441,303 | |
| Intuit, Inc. | | | 118,060 | | | | 34,968,191 | |
| Microsoft Corp. | | | 982,186 | | | | 199,884,673 | |
| Salesforce.com, Inc. (a) | | | 226,607 | | | | 42,450,289 | |
| Synopsys, Inc. (a) | | | 45,940 | | | | 8,958,300 | |
| | | | | | | | |
| | | | | | $ | 408,681,306 | |
| | | | | | | | |
| Computer Software – Systems – 4.5% | | | | | |
| Apple, Inc. | | | 116,284 | | | $ | 42,420,403 | |
| ServiceNow, Inc. (a) | | | 36,789 | | | | 14,901,753 | |
| Square, Inc., “A” (a) | | | 152,815 | | | | 16,036,406 | |
| TransUnion | | | 160,149 | | | | 13,939,369 | |
| | | | | | | | |
| | | | | | $ | 87,297,931 | |
| | | | | | | | |
| Construction – 2.3% | | | | | | | | |
| Sherwin-Williams Co. | | | 40,928 | | | $ | 23,650,245 | |
| Vulcan Materials Co. | | | 173,124 | | | | 20,056,415 | |
| | | | | | | | |
| | | | | | $ | 43,706,660 | |
| | | | | | | | |
| | | | | | | | |
| Issuer | | Shares/Par | | | Value ($) | |
| COMMON STOCKS – continued | | | | | |
| Consumer Products – 2.0% | | | | | | | | |
| Colgate-Palmolive Co. | | | 339,542 | | | $ | 24,874,847 | |
| Estee Lauder Cos., Inc., “A” | | | 70,215 | | | | 13,248,166 | |
| | | | | | | | |
| | | | | | $ | 38,123,013 | |
| | | | | | | | |
| Electrical Equipment – 0.6% | | | | | | | | |
| AMETEK, Inc. | | | 126,861 | | | $ | 11,337,568 | |
| Amphenol Corp., “A” | | | 11,741 | | | | 1,124,905 | |
| | | | | | | | |
| | | | | | $ | 12,462,473 | |
| | | | | | | | |
| Electronics – 3.2% | | | | | | | | |
| Applied Materials, Inc. | | | 99,640 | | | $ | 6,023,238 | |
| ASML Holding N.V. | | | 25,808 | | | | 9,498,118 | |
| Lam Research Corp. | | | 36,186 | | | | 11,704,724 | |
| NVIDIA Corp. | | | 89,564 | | | | 34,026,259 | |
| | | | | | | | |
| | | | | | $ | 61,252,339 | |
| | | | | | | | |
| General Merchandise – 0.8% | | | | | | | | |
| Dollar General Corp. | | | 79,392 | | | $ | 15,124,970 | |
| | | | | | | | |
| Health Maintenance Organizations – 0.5% | | | | | |
| UnitedHealth Group, Inc. | | | 32,780 | | | $ | 9,668,461 | |
| | | | | | | | |
| Insurance – 1.4% | | | | | | | | |
| AON PLC | | | 137,046 | | | $ | 26,395,060 | |
| | | | | | | | |
| Internet – 9.7% | | | | | | | | |
| Alibaba Group Holding Ltd., ADR (a) | | | 60,523 | | | $ | 13,054,811 | |
| Alphabet, Inc., “A” (a) | | | 57,110 | | | | 80,984,835 | |
| Alphabet, Inc., “C” (a) | | | 18,032 | | | | 25,490,216 | |
| Facebook, Inc., “A” (a) | | | 248,453 | | | | 56,416,223 | |
| Match Group, Inc. (a)(l) | | | 41,672 | | | | 4,460,988 | |
| Spotify Technology S.A. (a) | | | 28,428 | | | | 7,339,825 | |
| | | | | | | | |
| | | | | | $ | 187,746,898 | |
| | | | | | �� | | |
| Leisure & Toys – 3.0% | | | | | | | | |
| Activision Blizzard, Inc. | | | 245,092 | | | $ | 18,602,483 | |
| Electronic Arts, Inc. (a) | | | 214,818 | | | | 28,366,717 | |
| Take-Two Interactive Software, Inc. (a) | | | 77,201 | | | | 10,774,943 | |
| | | | | | | | |
| | | | | | $ | 57,744,143 | |
| | | | | | | | |
| Machinery & Tools – 1.1% | | | | | | | | |
| Roper Technologies, Inc. | | | 54,134 | | | $ | 21,018,067 | |
| | | | | | | | |
| Medical Equipment – 7.5% | | | | | | | | |
| Abbott Laboratories | | | 186,521 | | | $ | 17,053,615 | |
| Becton, Dickinson and Co. | | | 48,967 | | | | 11,716,334 | |
| Boston Scientific Corp. (a) | | | 573,556 | | | | 20,137,551 | |
| Danaher Corp. | | | 208,918 | | | | 36,942,970 | |
| Edwards Lifesciences Corp. (a) | | | 150,801 | | | | 10,421,857 | |
| Medtronic PLC | | | 50,503 | | | | 4,631,125 | |
| STERIS PLC | | | 28,668 | | | | 4,398,818 | |
| Thermo Fisher Scientific, Inc. | | | 111,543 | | | | 40,416,491 | |
| | | | | | | | |
| | | | | | $ | 145,718,761 | |
| | | | | | | | |
| Network & Telecom – 0.7% | | | | | | | | |
| Equinix, Inc., REIT | | | 19,518 | | | $ | 13,707,491 | |
| | | | | | | | |
4
MFS Growth Series
Portfolio of Investments (unaudited) – continued
| | | | | | | | |
| Issuer | | Shares/Par | | | Value ($) | |
| COMMON STOCKS – continued | | | | | |
| Other Banks & Diversified Financials – 7.2% | | | | | |
| Mastercard, Inc., “A” | | | 217,701 | | | $ | 64,374,186 | |
| Visa, Inc., “A” | | | 385,353 | | | | 74,438,639 | |
| | | | | | | | |
| | | | | | $ | 138,812,825 | |
| | | | | | | | |
| Pharmaceuticals – 2.6% | | | | | | | | |
| Eli Lilly & Co. | | | 57,056 | | | $ | 9,367,454 | |
| Merck & Co., Inc. | | | 160,316 | | | | 12,397,236 | |
| Zoetis, Inc. | | | 208,267 | | | | 28,540,910 | |
| | | | | | | | |
| | | | | | $ | 50,305,600 | |
| | | | | | | | |
| Railroad & Shipping – 0.6% | | | | | | | | |
| Canadian Pacific Railway Ltd. | | | 42,934 | | | $ | 10,962,767 | |
| | | | | | | | |
| Restaurants – 0.7% | | | | | | | | |
| Chipotle Mexican Grill, Inc., “A” (a) | | | 10,205 | | | $ | 10,739,334 | |
| Starbucks Corp. | | | 28,376 | | | | 2,088,190 | |
| | | | | | | | |
| | | | | | $ | 12,827,524 | |
| | | | | | | | |
| Retailers – 0.1% | | | | | | | | |
| Costco Wholesale Corp. | | | 7,761 | | | $ | 2,353,213 | |
| | | | | | | | |
| Specialty Stores – 9.7% | | | | | | | | |
| Amazon.com, Inc. (a) | | | 57,774 | | | $ | 159,388,067 | |
| Lululemon Athletica, Inc. (a) | | | 30,339 | | | | 9,466,071 | |
| Ross Stores, Inc. | | | 95,058 | | | | 8,102,744 | |
| Shopify, Inc. (a) | | | 10,018 | | | | 9,509,086 | |
| | | | | | | | |
| | | | | | $ | 186,465,968 | |
| | | | | | | | |
| Telecommunications – Wireless – 1.4% | | | | | |
| American Tower Corp., REIT | | | 102,320 | | | $ | 26,453,813 | |
| | | | | | | | |
Total Common Stocks
(Identified Cost, $794,191,865) | | | | | | $ | 1,926,818,598 | |
| | | | | | | | |
| | | | | | | | |
| Issuer | | Shares/Par | | | Value ($) | |
| INVESTMENT COMPANIES (h) – 0.6% | | | | | |
| Money Market Funds – 0.6% | | | | | | | | |
| MFS Institutional Money Market Portfolio, 0.17% (v) (Identified Cost, $11,337,487) | | | 11,336,688 | | | $ | 11,337,822 | |
| | | | | | | | |
|
| COLLATERAL FOR SECURITIES LOANED – 0.0% | |
| State Street Navigator Securities Lending Government Money Market Portfolio, 0.13% (j) (Identified Cost, $1,212,183) | | | 1,212,183 | | | $ | 1,212,183 | |
| | | | | | | | |
OTHER ASSETS, LESS
LIABILITIES – (0.6)% | | | | | | | (12,000,484 | ) |
| | | | | | | | |
| NET ASSETS – 100.0% | | | | | | $ | 1,927,368,119 | |
| | | | | | | | |
| (a) | | Non-income producing security. |
| (h) | | An affiliated issuer, which may be considered one in which the fund owns 5% or more of the outstanding voting securities, or a company which is under common control. At period end, the aggregate values of the fund’s investments in affiliated issuers and in unaffiliated issuers were $11,337,822 and $1,928,030,781, respectively. |
| (j) | | The rate quoted is the annualized seven-day yield of the fund at period end. |
| (l) | | A portion of this security is on loan. See Note 2 for additional information. |
| (v) | | Affiliated issuer that is available only to investment companies managed by MFS. The rate quoted for the MFS Institutional Money Market Portfolio is the annualized seven-day yield of the fund at period end. |
The following abbreviations are used in this report and are defined:
| ADR | | American Depositary Receipt |
| REIT | | Real Estate Investment Trust |
See Notes to Financial Statements
5
MFS Growth Series
FINANCIAL STATEMENTS | STATEMENT OF ASSETS AND LIABILITIES (unaudited)
This statement represents your fund’s balance sheet, which details the assets and liabilities comprising the total value of the fund.
| | | | |
At 6/30/20 | | | | |
| |
Assets | | | | |
Investments in unaffiliated issuers, at value, including $1,198,746 of securities on loan (identified cost, $795,404,048) | | | $1,928,030,781 | |
Investments in affiliated issuers, at value (identified cost, $11,337,487) | | | 11,337,822 | |
Cash | | | 892,215 | |
Receivables for | | | | |
Investments sold | | | 16,158,119 | |
Fund shares sold | | | 38,546 | |
Interest and dividends | | | 460,089 | |
Other assets | | | 3,864 | |
Total assets | | | $1,956,921,436 | |
| |
Liabilities | | | | |
Payables for | | | | |
Investments purchased | | | $18,185,086 | |
Fund shares reacquired | | | 9,878,485 | |
Collateral for securities loaned, at value | | | 1,212,183 | |
Payable to affiliates | | | | |
Investment adviser | | | 71,364 | |
Administrative services fee | | | 1,494 | |
Shareholder servicing costs | | | 1,582 | |
Distribution and/or service fees | | | 5,798 | |
Accrued expenses and other liabilities | | | 197,325 | |
Total liabilities | | | $29,553,317 | |
Net assets | | | $1,927,368,119 | |
| |
Net assets consist of | | | | |
Paid-in capital | | | $496,279,588 | |
Total distributable earnings (loss) | | | 1,431,088,531 | |
Net assets | | | $1,927,368,119 | |
Shares of beneficial interest outstanding | | | 29,799,290 | |
| | | | | | | | | | | | |
| | | |
| | | Net assets | | | Shares
outstanding | | | Net asset value
per share | |
Initial Class | | | $1,494,185,831 | | | | 22,862,683 | | | | $65.35 | |
Service Class | | | 433,182,288 | | | | 6,936,607 | | | | 62.45 | |
See Notes to Financial Statements
6
MFS Growth Series
FINANCIAL STATEMENTS | STATEMENT OF OPERATIONS (unaudited)
This statement describes how much your fund earned in investment income and accrued in expenses. It also describes any gains and/or losses generated by fund operations.
| | | | |
Six months ended 6/30/20 | | | | |
| |
Net investment income (loss) | | | | |
Income | | | | |
Dividends | | | $5,335,041 | |
Dividends from affiliated issuers | | | 87,266 | |
Income on securities loaned | | | 59,557 | |
Other | | | 21,862 | |
Foreign taxes withheld | | | (8,561 | ) |
Total investment income | | | $5,495,165 | |
Expenses | | | | |
Management fee | | | $6,369,844 | |
Distribution and/or service fees | | | 497,172 | |
Shareholder servicing costs | | | 24,288 | |
Administrative services fee | | | 128,528 | |
Independent Trustees’ compensation | | | 15,967 | |
Custodian fee | | | 43,682 | |
Shareholder communications | | | 56,275 | |
Audit and tax fees | | | 30,470 | |
Legal fees | | | 8,001 | |
Miscellaneous | | | 24,841 | |
Total expenses | | | $7,199,068 | |
Reduction of expenses by investment adviser | | | (97,537 | ) |
Net expenses | | | $7,101,531 | |
Net investment income (loss) | | | $(1,606,366 | ) |
| |
Realized and unrealized gain (loss) | | | | |
Realized gain (loss) (identified cost basis) | | | | |
Unaffiliated issuers | | | $173,702,883 | |
Affiliated issuers | | | (186 | ) |
Foreign currency | | | (1,722 | ) |
Net realized gain (loss) | | | $173,700,975 | |
Change in unrealized appreciation or depreciation | | | | |
Unaffiliated issuers | | | $4,272,883 | |
Affiliated issuers | | | 335 | |
Translation of assets and liabilities in foreign currencies | | | (271 | ) |
Net unrealized gain (loss) | | | $4,272,947 | |
Net realized and unrealized gain (loss) | | | $177,973,922 | |
Change in net assets from operations | | | $176,367,556 | |
See Notes to Financial Statements
7
MFS Growth Series
FINANCIAL STATEMENTS | STATEMENTS OF CHANGES IN NET ASSETS
These statements describe the increases and/or decreases in net assets resulting from operations, any distributions, and any shareholder transactions.
| | | | | | | | |
| | | Six months ended | | | Year ended | |
| | | 6/30/20 | | | 12/31/19 | |
| | | (unaudited) | | | | |
Change in net assets | | | | | | | | |
| | |
From operations | | | | | | | | |
Net investment income (loss) | | | $(1,606,366 | ) | | | $(1,992,050 | ) |
Net realized gain (loss) | | | 173,700,975 | | | | 128,302,639 | |
Net unrealized gain (loss) | | | 4,272,947 | | | | 424,578,183 | |
Change in net assets from operations | | | $176,367,556 | | | | $550,888,772 | |
Total distributions to shareholders | | | $— | | | | $(152,335,206 | ) |
Change in net assets from fund share transactions | | | $(117,286,935 | ) | | | $(43,895,060 | ) |
Total change in net assets | | | $59,080,621 | | | | $354,658,506 | |
| | |
Net assets | | | | | | | | |
At beginning of period | | | 1,868,287,498 | | | | 1,513,628,992 | |
At end of period | | | $1,927,368,119 | | | | $1,868,287,498 | |
See Notes to Financial Statements
8
MFS Growth Series
FINANCIAL STATEMENTS | FINANCIAL HIGHLIGHTS
The financial highlights table is intended to help you understand the fund’s financial performance for the semiannual period and the past 5 fiscal years. Certain information reflects financial results for a single fund share. The total returns in the table represent the rate that an investor would have earned (or lost) on an investment in the fund share class (assuming reinvestment of all distributions) held for the entire period.
| | | | | | | | | | | | | | | | | | | | | | | | |
| Initial Class | | Six months ended 6/30/20 | | | Year ended | |
| | | 12/31/19 | | | 12/31/18 | | | 12/31/17 | | | 12/31/16 | | | 12/31/15 | |
| | | | | | |
| | | (unaudited) | | | | | | | | | | | | | | | | |
| | | | | | |
Net asset value, beginning of period | | | $59.40 | | | | $47.01 | | | | $48.90 | | | | $38.76 | | | | $40.17 | | | | $39.75 | |
| | | | | | |
| Income (loss) from investment operations | | | | | | | | | | | | | | | | | | | | | | | | |
Net investment income (loss) (d) | | | $(0.04 | ) | | | $(0.04 | ) | | | $0.00 | (w) | | | $0.06 | | | | $0.05 | (c) | | | $0.03 | |
Net realized and unrealized gain (loss) | | | 5.99 | | | | 17.53 | | | | 1.81 | | | | 11.95 | | | | 1.01 | | | | 2.73 | |
Total from investment operations | | | $5.95 | | | | $17.49 | | | | $1.81 | | | | $12.01 | | | | $1.06 | | | | $2.76 | |
| | | | | | |
| Less distributions declared to shareholders | | | | | | | | | | | | | | | | | | | | | | | | |
From net investment income | | | $— | | | | $— | | | | $(0.05 | ) | | | $(0.05 | ) | | | $(0.02 | ) | | | $(0.07 | ) |
From net realized gain | | | — | | | | (5.10 | ) | | | (3.65 | ) | | | (1.82 | ) | | | (2.45 | ) | | | (2.27 | ) |
Total distributions declared to shareholders | | | $— | | | | $(5.10 | ) | | | $(3.70 | ) | | | $(1.87 | ) | | | $(2.47 | ) | | | $(2.34 | ) |
Net asset value, end of period (x) | | | $65.35 | | | | $59.40 | | | | $47.01 | | | | $48.90 | | | | $38.76 | | | | $40.17 | |
Total return (%) (k)(r)(s)(x) | | | 10.02 | (n) | | | 38.15 | | | | 2.67 | | | | 31.40 | | | | 2.44 | (c) | | | 7.56 | |
| | | | | | |
Ratios (%) (to average net assets)
and Supplemental data: | | | | | | | | | | | | | | | | | | | | | | | | |
Expenses before expense reductions (f) | | | 0.74 | (a) | | | 0.74 | | | | 0.75 | | | | 0.76 | | | | 0.75 | (c) | | | 0.76 | |
Expenses after expense reductions (f) | | | 0.73 | (a) | | | 0.73 | | | | 0.74 | | | | 0.75 | | | | 0.74 | (c) | | | 0.75 | |
Net investment income (loss) | | | (0.12 | )(a) | | | (0.06 | ) | | | 0.00 | (w) | | | 0.13 | | | | 0.12 | (c) | | | 0.08 | |
Portfolio turnover | | | 16 | (n) | | | 11 | | | | 15 | | | | 14 | | | | 24 | | | | 31 | |
Net assets at end of period (000 omitted) | | | $1,494,186 | | | | $1,467,280 | | | | $1,226,217 | | | | $1,332,128 | | | | $1,179,822 | | | | $1,273,204 | |
| | |
| Service Class | | Six months
ended 6/30/20 | | | Year ended | |
| | | 12/31/19 | | | 12/31/18 | | | 12/31/17 | | | 12/31/16 | | | 12/31/15 | |
| | | | | | |
| | | (unaudited) | | | | | | | | | | | | | | | | |
| | | | | | |
Net asset value, beginning of period | | | $56.82 | | | | $45.26 | | | | $47.27 | | | | $37.57 | | | | $39.09 | | | | $38.77 | |
| | | | | | |
| Income (loss) from investment operations | | | | | | | | | | | | | | | | | | | | | | | | |
Net investment income (loss) (d) | | | $(0.11 | ) | | | $(0.17 | ) | | | $(0.13 | ) | | | $(0.05 | ) | | | $(0.05 | )(c) | | | $(0.07 | ) |
Net realized and unrealized gain (loss) | | | 5.74 | | | | 16.83 | | | | 1.77 | | | | 11.57 | | | | 0.98 | | | | 2.66 | |
Total from investment operations | | | $5.63 | | | | $16.66 | | | | $1.64 | | | | $11.52 | | | | $0.93 | | | | $2.59 | |
| | | | | | |
| Less distributions declared to shareholders | | | | | | | | | | | | | | | | | | | | | | | | |
From net investment income | | | $— | | | | $— | | | | $— | | | | $— | | | | $— | | | | $— | |
From net realized gain | | | — | | | | (5.10 | ) | | | (3.65 | ) | | | (1.82 | ) | | | (2.45 | ) | | | (2.27 | ) |
Total distributions declared to shareholders | | | $— | | | | $(5.10 | ) | | | $(3.65 | ) | | | $(1.82 | ) | | | $(2.45 | ) | | | $(2.27 | ) |
Net asset value, end of period (x) | | | $62.45 | | | | $56.82 | | | | $45.26 | | | | $47.27 | | | | $37.57 | | | | $39.09 | |
Total return (%) (k)(r)(s)(x) | | | 9.91 | (n) | | | 37.78 | | | | 2.41 | | | | 31.08 | | | | 2.18 | (c) | | | 7.30 | |
| | | | | | |
Ratios (%) (to average net assets)
and Supplemental data: | | | | | | | | | | | | | | | | | | | | | | | | |
Expenses before expense reductions (f) | | | 0.99 | (a) | | | 0.99 | | | | 1.00 | | | | 1.01 | | | | 1.00 | (c) | | | 1.01 | |
Expenses after expense reductions (f) | | | 0.98 | (a) | | | 0.98 | | | | 0.99 | | | | 1.00 | | | | 0.99 | (c) | | | 1.00 | |
Net investment income (loss) | | | (0.37 | )(a) | | | (0.31 | ) | | | (0.25 | ) | | | (0.12 | ) | | | (0.13 | )(c) | | | (0.16 | ) |
Portfolio turnover | | | 16 | (n) | | | 11 | | | | 15 | | | | 14 | | | | 24 | | | | 31 | |
Net assets at end of period (000 omitted) | | | $433,182 | | | | $401,008 | | | | $287,412 | | | | $289,733 | | | | $235,869 | | | | $224,694 | |
See Notes to Financial Statements
9
MFS Growth Series
Financial Highlights – continued
| (c) | | Amount reflects a one-time reimbursement of expenses by the custodian (or former custodian) without which net investment income and performance would be lower and expenses would be higher. |
| (d) | | Per share data is based on average shares outstanding. |
| (f) | | Ratios do not reflect reductions from fees paid indirectly, if applicable. |
| (k) | | The total return does not reflect expenses that apply to separate accounts. Inclusion of these charges would reduce the total return figures for all periods shown. |
| (r) | | Certain expenses have been reduced without which performance would have been lower. |
| (s) | | From time to time the fund may receive proceeds from litigation settlements, without which performance would be lower. |
| (w) | | Per share amount was less than $0.01 and total return or ratio was less than 0.01%, as applicable. |
| (x) | | The net asset values and total returns have been calculated on net assets which include adjustments made in accordance with U.S. generally accepted accounting principles required at period end for financial reporting purposes. |
See Notes to Financial Statements
10
MFS Growth Series
NOTES TO FINANCIAL STATEMENTS (unaudited)
| (1) | | Business and Organization |
MFS Growth Series (the fund) is a diversified series of MFS Variable Insurance Trust (the trust). The trust is organized as a Massachusetts business trust and is registered under the Investment Company Act of 1940, as amended, as an open-end management investment company. The shareholders of each series of the trust are separate accounts of insurance companies, which offer variable annuity and/or life insurance products, and qualified retirement and pension plans.
The fund is an investment company and accordingly follows the investment company accounting and reporting guidance of the Financial Accounting Standards Board (FASB) Accounting Standards Codification Topic 946 Financial Services – Investment Companies.
| (2) | | Significant Accounting Policies |
General – The preparation of financial statements in conformity with U.S. generally accepted accounting principles requires management to make estimates and assumptions that affect the reported amounts of assets and liabilities, and disclosure of contingent assets and liabilities at the date of the financial statements and the reported amounts of increases and decreases in net assets from operations during the reporting period. Actual results could differ from those estimates. In the preparation of these financial statements, management has evaluated subsequent events occurring after the date of the fund’s Statement of Assets and Liabilities through the date that the financial statements were issued.
In March 2020, the FASB issued Accounting Standards Update 2020-04, Reference Rate Reform (Topic 848) – Facilitation of the Effects of Reference Rate Reform on Financial Reporting (“ASU 2020-04”), which provides optional, temporary relief with respect to the financial reporting of contracts subject to certain types of modifications due to the planned discontinuation of the London Interbank Offered Rate (LIBOR) and other IBOR-based reference rates as of the end of 2021. The temporary relief provided by ASU 2020-04 is effective for certain reference rate-related contract modifications that occur during the period from March 12, 2020 through December 31, 2022. Management is evaluating the impact of ASU 2020-04 on the fund’s investments, derivatives, debt and other contracts that will undergo reference rate-related modifications as a result of the reference rate reform.
Balance Sheet Offsetting – The fund’s accounting policy with respect to balance sheet offsetting is that, absent an event of default by the counterparty or a termination of the agreement, the International Swaps and Derivatives Association (ISDA) Master Agreement, or similar agreement, does not result in an offset of reported amounts of financial assets and financial liabilities in the Statement of Assets and Liabilities across transactions between the fund and the applicable counterparty. The fund’s right to setoff may be restricted or prohibited by the bankruptcy or insolvency laws of the particular jurisdiction to which a specific master netting agreement counterparty is subject. Balance sheet offsetting disclosures, to the extent applicable to the fund, have been included in the fund’s Significant Accounting Policies note under the captions for each of the fund’s in-scope financial instruments and transactions.
Investment Valuations – Equity securities, including restricted equity securities, are generally valued at the last sale or official closing price on their primary market or exchange as provided by a third-party pricing service. Equity securities, for which there were no sales reported that day, are generally valued at the last quoted daily bid quotation on their primary market or exchange as provided by a third-party pricing service. Short-term instruments with a maturity at issuance of 60 days or less may be valued at amortized cost, which approximates market value. Open-end investment companies are generally valued at net asset value per share. Securities and other assets generally valued on the basis of information from a third-party pricing service may also be valued at a broker/dealer bid quotation. In determining values, third-party pricing services can utilize both transaction data and market information such as yield, quality, coupon rate, maturity, type of issue, trading characteristics, and other market data. The values of foreign securities and other assets and liabilities expressed in foreign currencies are converted to U.S. dollars using the mean of bid and asked prices for rates provided by a third-party pricing service.
The Board of Trustees has delegated primary responsibility for determining or causing to be determined the value of the fund’s investments (including any fair valuation) to the adviser pursuant to valuation policies and procedures approved by the Board. If the adviser determines that reliable market quotations are not readily available, investments are valued at fair value as determined in good faith by the adviser in accordance with such procedures under the oversight of the Board of Trustees. Under the fund’s valuation policies and procedures, market quotations are not considered to be readily available for most types of debt instruments and floating rate loans and many types of derivatives. These investments are generally valued at fair value based on information from third-party pricing services. In addition, investments may be valued at fair value if the adviser determines that an investment’s value has been materially affected by events occurring after the close of the exchange or market on which the investment is principally traded (such as foreign exchange or market) and prior to the determination of the fund’s net asset value, or after the halt of trading of a specific security where trading does not resume prior to the close of the exchange or market on which the security is principally traded. Events that occur after foreign markets close (such as developments in foreign markets and significant movements in the U.S. markets) and prior to the determination of the fund’s net asset value may be deemed to have a material effect on the value of securities traded in foreign markets. Accordingly, the fund’s foreign equity securities may often be valued at fair value. The adviser
11
MFS Growth Series
Notes to Financial Statements (unaudited) – continued
generally relies on third-party pricing services or other information (such as the correlation with price movements of similar securities in the same or other markets; the type, cost and investment characteristics of the security; the business and financial condition of the issuer; and trading and other market data) to assist in determining whether to fair value and at what value to fair value an investment. The value of an investment for purposes of calculating the fund’s net asset value can differ depending on the source and method used to determine value. When fair valuation is used, the value of an investment used to determine the fund’s net asset value may differ from quoted or published prices for the same investment. There can be no assurance that the fund could obtain the fair value assigned to an investment if it were to sell the investment at the same time at which the fund determines its net asset value per share.
Various inputs are used in determining the value of the fund’s assets or liabilities. These inputs are categorized into three broad levels. In certain cases, the inputs used to measure fair value may fall into different levels of the fair value hierarchy. In such cases, an investment’s level within the fair value hierarchy is based on the lowest level of input that is significant to the fair value measurement. The fund’s assessment of the significance of a particular input to the fair value measurement in its entirety requires judgment, and considers factors specific to the investment. Level 1 includes unadjusted quoted prices in active markets for identical assets or liabilities. Level 2 includes other significant observable market-based inputs (including quoted prices for similar securities, interest rates, prepayment speed, and credit risk). Level 3 includes unobservable inputs, which may include the adviser’s own assumptions in determining the fair value of investments. The following is a summary of the levels used as of June 30, 2020 in valuing the fund’s assets or liabilities:
| | | | | | | | | | | | | | | | |
| Financial Instruments | | Level 1 | | | Level 2 | | | Level 3 | | | Total | |
| Equity Securities | | | $1,926,818,598 | | | | $— | | | | $— | | | | $1,926,818,598 | |
| Mutual Funds | | | 12,550,005 | | | | — | | | | — | | | | 12,550,005 | |
| Total | | | $1,939,368,603 | | | | $— | | | | $— | | | | $1,939,368,603 | |
For further information regarding security characteristics, see the Portfolio of Investments.
Foreign Currency Translation – Purchases and sales of foreign investments, income, and expenses are converted into U.S. dollars based upon currency exchange rates prevailing on the respective dates of such transactions or on the reporting date for foreign denominated receivables and payables. Gains and losses attributable to foreign currency exchange rates on sales of securities are recorded for financial statement purposes as net realized gains and losses on investments. Gains and losses attributable to foreign exchange rate movements on receivables, payables, income and expenses are recorded for financial statement purposes as foreign currency transaction gains and losses. That portion of both realized and unrealized gains and losses on investments that results from fluctuations in foreign currency exchange rates is not separately disclosed.
Security Loans – Under its Securities Lending Agency Agreement with the fund, State Street Bank and Trust Company, as lending agent, loans the securities of the fund to certain qualified institutions (the “Borrowers”) approved by the fund. Security loans can be terminated at the discretion of either the lending agent or the fund and the related securities must be returned within the earlier of the standard trade settlement period for such securities or within three business days. The loans are collateralized by cash and/or U.S. Treasury and federal agency obligations in an amount typically at least equal to the market value of the securities loaned. On loans collateralized by cash, the cash collateral is invested in a money market fund. The market value of the loaned securities is determined at the close of business of the fund and any additional required collateral is delivered to the fund on the next business day. The lending agent provides the fund with indemnification against Borrower default. In the event of Borrower default, the lending agent will, for the benefit of the fund, either purchase securities identical to those loaned or, when such purchase is commercially impracticable, pay the fund the market value of the loaned securities. In return, the lending agent assumes the fund’s rights to the related collateral. If the collateral value is less than the cost to purchase identical securities, the lending agent is responsible for the shortfall, but only to the extent that such shortfall is not due to a decline in collateral value resulting from collateral reinvestment for which the fund bears the risk of loss. At period end, the fund had investment securities on loan, all of which were classified as equity securities in the fund’s Portfolio of Investments, with a fair value of $1,198,746. The fair value of the fund’s investment securities on loan and a related liability of $1,212,183 for cash collateral received on securities loaned are both presented gross in the Statement of Assets and Liabilities. The collateral on securities loaned exceeded the value of securities on loan at period end. The liability for cash collateral for securities loaned is carried at fair value, which is categorized as level 2 within the fair value hierarchy. A portion of the income generated upon investment of the collateral is remitted to the Borrowers, and the remainder is allocated between the fund and the lending agent. On loans collateralized by U.S. Treasury and/or federal agency obligations, a fee is received from the Borrower, and is allocated between the fund and the lending agent. Income from securities lending is separately reported in the Statement of Operations. The dividend and interest income earned on the securities loaned is accounted for in the same manner as other dividend and interest income.
Indemnifications – Under the fund’s organizational documents, its officers and Trustees may be indemnified against certain liabilities and expenses arising out of the performance of their duties to the fund. Additionally, in the normal course of business, the
12
MFS Growth Series
Notes to Financial Statements (unaudited) – continued
fund enters into agreements with service providers that may contain indemnification clauses. The fund’s maximum exposure under these agreements is unknown as this would involve future claims that may be made against the fund that have not yet occurred.
Investment Transactions and Income – Investment transactions are recorded on the trade date. Interest income is recorded on the accrual basis. Dividends received in cash are recorded on the ex-dividend date. Certain dividends from foreign securities will be recorded when the fund is informed of the dividend if such information is obtained subsequent to the ex-dividend date. Dividend payments received in additional securities are recorded on the ex-dividend date in an amount equal to the value of the security on such date.
The fund may receive proceeds from litigation settlements. Any proceeds received from litigation involving portfolio holdings are reflected in the Statement of Operations in realized gain/loss if the security has been disposed of by the fund or in unrealized gain/loss if the security is still held by the fund. Any other proceeds from litigation not related to portfolio holdings are reflected as other income in the Statement of Operations.
Tax Matters and Distributions – The fund intends to qualify as a regulated investment company, as defined under Subchapter M of the Internal Revenue Code, and to distribute all of its taxable income, including realized capital gains. As a result, no provision for federal income tax is required. The fund’s federal tax returns, when filed, will remain subject to examination by the Internal Revenue Service for a three year period. Management has analyzed the fund’s tax positions taken on federal and state tax returns for all open tax years and does not believe that there are any uncertain tax positions that require recognition of a tax liability. Foreign taxes, if any, have been accrued by the fund in the accompanying financial statements in accordance with the applicable foreign tax law. Foreign income taxes may be withheld by certain countries in which the fund invests. Additionally, capital gains realized by the fund on securities issued in or by certain foreign countries may be subject to capital gains tax imposed by those countries.
Distributions to shareholders are recorded on the ex-dividend date. Income and capital gain distributions are determined in accordance with income tax regulations, which may differ from U.S. generally accepted accounting principles. Certain capital accounts in the financial statements are periodically adjusted for permanent differences in order to reflect their tax character. These adjustments have no impact on net assets or net asset value per share. Temporary differences which arise from recognizing certain items of income, expense, gain or loss in different periods for financial statement and tax purposes will reverse at some time in the future.
Book/tax differences primarily relate to net operating losses and wash sale loss deferrals.
The tax character of distributions declared to shareholders for the last fiscal year is as follows:
| | | | |
| | | Year ended
12/31/19 | |
| Long-term capital gains | | | $152,335,206 | |
The federal tax cost and the tax basis components of distributable earnings were as follows:
| | | | |
| As of 6/30/20 | | | | |
| |
| Cost of investments | | | $807,965,519 | |
| Gross appreciation | | | 1,133,989,184 | |
| Gross depreciation | | | (2,586,100 | ) |
| Net unrealized appreciation (depreciation) | | | $1,131,403,084 | |
| |
| As of 12/31/19 | | | | |
| |
| Undistributed long-term capital gain | | | 127,590,711 | |
| Other temporary differences | | | 398 | |
| Net unrealized appreciation (depreciation) | | | 1,127,129,866 | |
The aggregate cost above includes prior fiscal year end tax adjustments, if applicable.
Multiple Classes of Shares of Beneficial Interest – The fund offers multiple classes of shares, which differ in their respective distribution and/or service fees. The fund’s income, realized and unrealized gain (loss), and common expenses are allocated to shareholders based on the daily net assets of each class. Dividends are declared separately for each class. Differences in per share dividend rates are generally due to differences in separate class expenses. The fund’s distributions declared to shareholders as reported in the Statements of Changes in Net Assets are presented by class as follows:
| | | | | | | | |
| | |
| | | Six months ended
6/30/20 | | | Year ended
12/31/19 | |
| Initial Class | | | $— | | | | $120,147,549 | |
| Service Class | | | — | | | | 32,187,657 | |
| Total | | | $— | | | | $152,335,206 | |
13
MFS Growth Series
Notes to Financial Statements (unaudited) – continued
| (3) | | Transactions with Affiliates |
Investment Adviser – The fund has an investment advisory agreement with MFS to provide overall investment management and related administrative services and facilities to the fund. The management fee is computed daily and paid monthly at the following annual rates based on the fund’s average daily net assets:
| | | | |
| Up to $1 billion | | | 0.75% | |
| In excess of $1 billion | | | 0.65% | |
MFS has agreed in writing to reduce its management fee by a specified amount if certain MFS mutual fund assets exceed thresholds agreed to by MFS and the fund’s Board of Trustees. For the six months ended June 30, 2020, this management fee reduction amounted to $97,537, which is included in the reduction of total expenses in the Statement of Operations. The management fee incurred for the six months ended June 30, 2020 was equivalent to an annual effective rate of 0.69% of the fund’s average daily net assets.
Distributor – MFS Fund Distributors, Inc. (MFD), a wholly-owned subsidiary of MFS, is the distributor of shares of the fund. The Trustees have adopted a distribution plan for the Service Class shares pursuant to Rule 12b-1 under the Investment Company Act of 1940.
The fund’s distribution plan provides that the fund will pay MFD distribution and/or service fees equal to 0.25% per annum of its average daily net assets attributable to Service Class shares as partial consideration for services performed and expenses incurred by MFD and financial intermediaries (including participating insurance companies that invest in the fund to fund variable annuity and variable life insurance contracts, sponsors of qualified retirement and pension plans that invest in the fund, and affiliates of these participating insurance companies and plan sponsors) in connection with the sale and distribution of the Service Class shares. MFD may subsequently pay all, or a portion, of the distribution and/or service fees to financial intermediaries.
Shareholder Servicing Agent – MFS Service Center, Inc. (MFSC), a wholly-owned subsidiary of MFS, receives a fee from the fund for its services as shareholder servicing agent. For the six months ended June 30, 2020, the fee was $22,886, which equated to 0.0025% annually of the fund’s average daily net assets. MFSC also receives payment from the fund for out-of-pocket expenses paid by MFSC on behalf of the fund. For the six months ended June 30, 2020, these costs amounted to $1,402.
Administrator – MFS provides certain financial, legal, shareholder communications, compliance, and other administrative services to the fund. Under an administrative services agreement, the fund reimburses MFS the costs incurred to provide these services. The fund is charged an annual fixed amount of $17,500 plus a fee based on average daily net assets. The administrative services fee incurred for the six months ended June 30, 2020 was equivalent to an annual effective rate of 0.0142% of the fund’s average daily net assets.
Trustees’ and Officers’ Compensation – The fund pays compensation to independent Trustees in the form of a retainer, attendance fees, and additional compensation to Board and Committee chairpersons. The fund does not pay compensation directly to Trustees or officers of the fund who are also officers of the investment adviser, all of whom receive remuneration from MFS for their services to the fund. Certain officers and Trustees of the fund are officers or directors of MFS, MFD, and MFSC.
Other – The fund invests in the MFS Institutional Money Market Portfolio which is managed by MFS and seeks current income consistent with preservation of capital and liquidity. This money market fund does not pay a management fee to MFS but does incur investment and operating costs.
The fund is permitted to engage in purchase and sale transactions with funds and accounts for which MFS serves as investment adviser or sub-adviser (“cross-trades”) pursuant to a policy adopted by the Board of Trustees. This policy has been designed to ensure that cross-trades conducted by the fund comply with Rule 17a-7 under the Investment Company Act of 1940. During the six months ended June 30, 2020, the fund engaged in sale transactions pursuant to this policy, which amounted to $1,795,960. The sales transactions resulted in net realized gains (losses) of $1,157,747.
The adviser has voluntarily undertaken to reimburse the fund from its own resources on a quarterly basis for the cost of investment research embedded in the cost of the fund’s securities trades. This agreement may be rescinded at any time. For the six months ended June 30, 2020, this reimbursement amounted to $21,862, which is included in “Other” income in the Statement of Operations.
For the six months ended June 30, 2020, purchases and sales of investments, other than short-term obligations, aggregated $294,915,850 and $391,695,256, respectively.
14
MFS Growth Series
Notes to Financial Statements (unaudited) – continued
| (5) | | Shares of Beneficial Interest |
The fund’s Declaration of Trust permits the Trustees to issue an unlimited number of full and fractional shares of beneficial interest. Transactions in fund shares were as follows:
| | | | | | | | | | | | | | | | |
| | | Six months ended 6/30/20 | | | Year ended 12/31/19 | |
| | | | |
| | | Shares | | | Amount | | | Shares | | | Amount | |
| Shares sold | | | | | | | | | | | | | | | | |
Initial Class | | | 883,007 | | | | $51,277,166 | | | | 1,217,214 | | | | $67,244,090 | |
Service Class | | | 802,979 | | | | 46,006,273 | | | | 1,261,274 | | | | 67,355,720 | |
| | | 1,685,986 | | | | $97,283,439 | | | | 2,478,488 | | | | $134,599,810 | |
| | | | |
| Shares issued to shareholders in reinvestment of distributions | | | | | | | | | | | | | | | | |
Initial Class | | | — | | | | $— | | | | 2,176,755 | | | | $118,894,370 | |
Service Class | | | — | | | | — | | | | 615,443 | | | | 32,187,657 | |
| | | — | | | | $— | | | | 2,792,198 | | | | $151,082,027 | |
| | | | |
| Shares reacquired | | | | | | | | | | | | | | | | |
Initial Class | | | (2,723,948 | ) | | | $(162,683,919 | ) | | | (4,773,226 | ) | | | $(266,754,702 | ) |
Service Class | | | (923,301 | ) | | | (51,886,455 | ) | | | (1,169,906 | ) | | | (62,822,195 | ) |
| | | (3,647,249 | ) | | | $(214,570,374 | ) | | | (5,943,132 | ) | | | $(329,576,897 | ) |
| | | | |
| Net change | | | | | | | | | | | | | | | | |
Initial Class | | | (1,840,941 | ) | | | $(111,406,753 | ) | | | (1,379,257 | ) | | | $(80,616,242 | ) |
Service Class | | | (120,322 | ) | | | (5,880,182 | ) | | | 706,811 | | | | 36,721,182 | |
| | | (1,961,263 | ) | | | $(117,286,935 | ) | | | (672,446 | ) | | | $(43,895,060 | ) |
The fund is one of several mutual funds in which certain MFS funds may invest. The MFS funds do not invest in the underlying funds for the purpose of exercising management or control. At the end of the period, the MFS Moderate Allocation Portfolio, the MFS Growth Allocation Portfolio, and the MFS Conservative Allocation Portfolio were the owners of record of approximately 6%, 2%, and 1%, respectively, of the value of outstanding voting shares of the fund.
The fund and certain other funds managed by MFS participate in a $1.25 billion unsecured committed line of credit, subject to a $1 billion sublimit, provided by a syndicate of banks under a credit agreement. Borrowings may be made for temporary financing needs. Interest is charged to each fund, based on its borrowings, generally at a rate equal to the highest of one month LIBOR, the Federal Funds Effective Rate and the Overnight Bank Funding Rate, plus an agreed upon spread. A commitment fee, based on the average daily, unused portion of the committed line of credit, is allocated among the participating funds. In addition, the fund and other funds managed by MFS have established unsecured uncommitted borrowing arrangements with certain banks for temporary financing needs. Interest is charged to each fund, based on its borrowings, at rates equal to customary reference rates plus an agreed upon spread. For the six months ended June 30, 2020, the fund’s commitment fee and interest expense were $4,557 and $0, respectively, and are included in “Miscellaneous” expense in the Statement of Operations.
| (7) | | Investments in Affiliated Issuers |
An affiliated issuer may be considered one in which the fund owns 5% or more of the outstanding voting securities, or a company which is under common control. For the purposes of this report, the following were affiliated issuers:
| | | | | | | | | | | | | | | | | | | | | | | | |
| Affiliated Issuers | | Beginning
Value | | | Purchases | | | Sales
Proceeds | | | Realized
Gain
(Loss) | | | Change in
Unrealized
Appreciation or
Depreciation | | | Ending
Value | |
| MFS Institutional Money Market Portfolio | | | $13,494 | | | | $165,681,928 | | | | $154,357,749 | | | | $(186 | ) | | | $335 | | | | $11,337,822 | |
| | | | | | |
| Affiliated Issuers | | | | | | | | | | | | | | Dividend
Income | | | Capital Gain
Distributions | |
| MFS Institutional Money Market Portfolio | | | | | | | | | | | | | | | | | | | $87,266 | | | | $— | |
The pandemic related to the global spread of novel coronavirus disease (COVID-19), which was first detected in December 2019, has resulted in significant disruptions to global business activity and the global economy, as well as the economies of individual countries, the financial performance of individual companies and sectors, and the securities and commodities markets in general. This pandemic, the full effects of which are still unknown, has resulted in substantial market volatility and may have adversely impacted the prices and liquidity of the fund’s investments and the fund’s performance.
15
MFS Growth Series
STATEMENT REGARDING LIQUIDITY RISK MANAGEMENT PROGRAM
The fund has adopted and implemented a liquidity risk management program (the “Program”) as required by Rule 22e-4 under the Investment Company Act of 1940, as amended. The fund’s Board of Trustees (the “Board”) has designated MFS as the administrator of the Program. The Program is reasonably designed to assess and manage the liquidity risk of the fund. Liquidity risk is the risk that the fund could not meet requests to redeem shares issued by the fund without significant dilution of remaining investors’ interests.
MFS provided a written report to the Board for consideration at its April 2020 meeting that addressed the operation of the Program and provided an assessment of the adequacy and effectiveness of the Program during the period from the adoption of the Program on December 1, 2018 to December 31, 2019 (the “Covered Period”). The report concluded that during the Covered Period the Program had operated effectively and had adequately and effectively been implemented to assess and manage the fund’s liquidity risk. MFS also reported that there were no liquidity events that impacted the fund or its ability to timely meet redemptions without dilution to existing shareholders during the Covered Period.
There can be no assurance that the Program will achieve its objectives in the future. Further information on liquidity risk, and other principal risks to which an investment in the fund may be subject, can be found in the prospectus.
16
MFS Growth Series
PROXY VOTING POLICIES AND INFORMATION
MFS votes proxies on behalf of the fund pursuant to proxy voting policies and procedures that are available without charge, upon request, by calling 1-800-225-2606, by visiting mfs.com/proxyvoting, or by visiting the SEC’s Web site at http://www.sec.gov.
Information regarding how the fund voted proxies relating to portfolio securities during the most recent twelve-month period ended June 30 is available by August 31 of each year without charge by visiting mfs.com/proxyvoting, or by visiting the SEC’s Web site at http://www.sec.gov.
QUARTERLY PORTFOLIO DISCLOSURE
The fund files a complete schedule of portfolio holdings with the SEC for the first and third quarters of each fiscal year as an exhibit to its reports on Form N-PORT. The fund’s Form N-PORT reports are available on the SEC’s website at http://www.sec.gov. A shareholder can obtain the portfolio holdings report for the first and third quarters of the fund’s fiscal year at mfs.com/vit1 by choosing the fund’s name and then selecting the “Resources” tab and clicking on “Prospectus and Reports”.
FURTHER INFORMATION
From time to time, MFS may post important information about the fund or the MFS funds on the MFS web site (mfs.com). This information is available at https://www.mfs.com/announcements or at mfs.com/vit1 by choosing the fund’s name and then selecting the “Resources” tab and clicking on the “Announcements” tab, if any.
INFORMATION ABOUT FUND CONTRACTS AND LEGAL CLAIMS
The fund has entered into contractual arrangements with an investment adviser, administrator, distributor, shareholder servicing agent, 529 program manager (if applicable), and custodian who each provide services to the fund. Unless expressly stated otherwise, shareholders are not parties to, or intended beneficiaries of these contractual arrangements, and these contractual arrangements are not intended to create any shareholder right to enforce them against the service providers or to seek any remedy under them against the service providers, either directly or on behalf of the fund.
Under the Trust’s By-Laws and Declaration of Trust, any claims asserted against or on behalf of the MFS Funds, including claims against Trustees and Officers, must be brought in state and federal courts located within the Commonwealth of Massachusetts.
17
Semiannual Report
June 30, 2020

MFS® Investors Trust Series

MFS® Variable Insurance Trust
Beginning on January 1, 2021, as permitted by regulations adopted by the U.S. Securities and Exchange Commission, the insurance company that offers your contract may determine that it will no longer send you paper copies of the fund’s annual and semiannual shareholder reports unless you specifically request paper copies from the insurance company or from your financial intermediary. Instead, the shareholder reports will be made available on a Web site (insurancefunds.mfs.com or other Web site of which you will be notified), and the insurance company will notify you by mail each time a report is posted and provide you with a Web site link to access the report. Instructions for requesting paper copies will be provided by your insurance company or financial intermediary.
If you already elected to receive shareholder reports by email, you will not be affected by this change and you need not take any action. If your insurance company or financial intermediary offers electronic delivery, you may elect to receive shareholder reports and other communications from the insurance company or financial intermediary by email by following the instructions provided by the insurance company or financial intermediary.
Beginning on January 1, 2019, you may elect to receive all future reports in paper free of charge from the insurance company or financial intermediary. You can inform the insurance company or financial intermediary that you wish to continue receiving paper copies of your shareholder reports by contacting your insurance company or financial intermediary. Your election to receive reports in paper will apply to all funds held in your account with your insurance company or financial intermediary.
VGI-SEM
MFS® Investors Trust Series
CONTENTS
The report is prepared for the general information of contract owners. It is authorized for distribution to prospective investors only when preceded or accompanied by a current prospectus.
NOT FDIC INSURED • MAY LOSE VALUE • NO BANK OR CREDIT UNION GUARANTEE • NOT A DEPOSIT • NOT INSURED BY ANY FEDERAL GOVERNMENT AGENCY OR NCUA/NCUSIF
MFS Investors Trust Series
LETTER FROM THE EXECUTIVE CHAIR

Dear Contract Owners:
Markets experienced dramatic swings in early 2020, as the coronavirus pandemic brought the global economy to a standstill for several months. Optimism over the development of vaccines and therapeutics, along with a decline in cases in countries that had been affected by the outbreak early on, brightened the economic and market outlook during the second quarter, as did the phased reopening of US states. However, a great deal of uncertainty remains, including the possibility of a second wave of cases later this year, as many countries continue to experience COVID-19 flare-ups.
Global central banks have taken aggressive steps to cushion the economic and market fallout related to the virus, and governments are deploying unprecedented levels of fiscal support. As uncertainty recedes, these measures can help build a supportive environment and encourage economic recovery; however, if markets disconnect from fundamentals, they can also sow the seeds of instability. In the aftermath of the crisis, societal changes may be likely, as households, businesses, and governments adjust to a new reality, and these alterations could affect the investment landscape. For investors, events, such as the COVID-19 outbreak, demonstrate the importance of having a deep understanding of company fundamentals, and we have built our global research platform to do just that.
Here at MFS®, we aim to help our clients navigate the growing complexity of the markets and world economies. Our long-term investment philosophy and commitment to the responsible allocation of capital allow us to tune out the noise and uncover what we believe are the best, most durable investment opportunities in the market. Through our unique global investment platform, we combine collective expertise, thoughtful risk management, and long-term discipline to create sustainable value for investors.
Respectfully,

Robert J. Manning
Executive Chair
MFS Investment Management
August 17, 2020
The opinions expressed in this letter are subject to change, may not be relied upon for investment advice, and no forecasts can be guaranteed.
1
MFS Investors Trust Series
PORTFOLIO COMPOSITION
Portfolio structure

| | | | |
| Top ten holdings | | | | |
| Microsoft Corp. | | | 5.5% | |
| Alphabet, Inc., “A” | | | 3.9% | |
| Johnson & Johnson | | | 2.9% | |
| Visa, Inc., “A” | | | 2.5% | |
| Mastercard, Inc., “A” | | | 2.5% | |
| American Tower Corp., REIT | | | 2.4% | |
| Medtronic PLC | | | 2.2% | |
| JPMorgan Chase & Co. | | | 2.2% | |
| Fidelity National Information Services, Inc. | | | 2.1% | |
| Apple, Inc. | | | 2.1% | |
| | | | |
| GICS equity sectors (g) | | | | |
| Information Technology | | | 26.2% | |
| Health Care | | | 18.2% | |
| Communication Services | | | 10.8% | |
| Financials | | | 10.4% | |
| Consumer Discretionary | | | 8.9% | |
| Consumer Staples | | | 8.1% | |
| Industrials | | | 5.9% | |
| Materials | | | 4.1% | |
| Real Estate | | | 3.7% | |
| Energy | | | 2.0% | |
| Utilities | | | 0.6% | |
| (g) | The Global Industry Classification Standard (GICS®) was developed by and/or is the exclusive property of MSCI, Inc. and S&P Global Market Intelligence Inc. (“S&P Global Market Intelligence”). GICS is a service mark of MSCI and S&P Global Market Intelligence and has been licensed for use by MFS. |
Cash & Cash Equivalents includes any cash, investments in money market funds, short-term securities, and other assets less liabilities. Please see the Statement of Assets and Liabilities for additional information related to the fund’s cash position and other assets and liabilities.
Percentages are based on net assets as of June 30, 2020.
The portfolio is actively managed and current holdings may be different.
2
MFS Investors Trust Series
EXPENSE TABLE
Fund Expenses Borne by the Contract Holders during the Period,
January 1, 2020 through June 30, 2020
As a contract holder of the fund, you incur ongoing costs, including management fees; distribution and/or service (12b-1) fees; and other fund expenses. This example is intended to help you understand your ongoing costs (in dollars) of investing in the fund and to compare these costs with the ongoing costs of investing in other mutual funds.
The example is based on an investment of $1,000 invested at the beginning of the period and held for the entire period January 1, 2020 through June 30, 2020.
Actual Expenses
The first line for each share class in the following table provides information about actual account values and actual expenses. You may use the information in this line, together with the amount you invested, to estimate the expenses that you paid over the period. Simply divide your account value by $1,000 (for example, an $8,600 account value divided by $1,000 = 8.6), then multiply the result by the number in the first line under the heading entitled “Expenses Paid During Period” to estimate the expenses you paid on your account during this period.
Hypothetical Example for Comparison Purposes
The second line for each share class in the following table provides information about hypothetical account values and hypothetical expenses based on the fund’s actual expense ratio and an assumed rate of return of 5% per year before expenses, which is not the fund’s actual return. The hypothetical account values and expenses may not be used to estimate the actual ending account balance or expenses you paid for the period. You may use this information to compare the ongoing costs of investing in the fund and other funds. To do so, compare this 5% hypothetical example with the 5% hypothetical examples that appear in the shareholder reports of the other funds.
Please note that the expenses shown in the table are meant to highlight the fund’s ongoing costs only and do not take into account the fees and expenses imposed under the variable contracts through which your investment in the fund is made. Therefore, the second line for each share class in the table is useful in comparing ongoing costs associated with an investment in vehicles (such as the fund) which fund benefits under variable annuity and variable life insurance contracts and to qualified pension and retirement plans only, and will not help you determine the relative total costs of investing in the fund through variable annuity and variable life insurance contracts. If the fees and expenses imposed under the variable contracts were included, your costs would have been higher.
| | | | | | | | | | | | | | | | | | |
| Share Class | | | | Annualized
Expense Ratio | | | Beginning
Account Value
1/01/20 | | | Ending
Account Value
6/30/20 | | | Expenses Paid
During Period (p)
1/01/20-6/30/20 | |
| Initial Class | | Actual | | | 0.79% | | | | $1,000.00 | | | | $948.90 | | | | $3.83 | |
| | Hypothetical (h) | | | 0.79% | | | | $1,000.00 | | | | $1,020.93 | | | | $3.97 | |
| Service Class | | Actual | | | 1.04% | | | | $1,000.00 | | | | $947.82 | | | | $5.04 | |
| | Hypothetical (h) | | | 1.04% | | | | $1,000.00 | | | | $1,019.69 | | | | $5.22 | |
| (h) | 5% class return per year before expenses. |
| (p) | “Expenses Paid During Period” are equal to each class’s annualized expense ratio, as shown above, multiplied by the average account value over the period, multiplied by 182/366 (to reflect the one-half year period). |
3
MFS Investors Trust Series
PORTFOLIO OF INVESTMENTS – 6/30/20 (unaudited)
The Portfolio of Investments is a complete list of all securities owned by your fund. It is categorized by broad-based asset classes.
| | | | | | | | |
| Issuer | | Shares/Par | | | Value ($) | |
| COMMON STOCKS – 98.9% | | | | | | | | |
| Aerospace – 1.8% | | | | | | | | |
| Honeywell International, Inc. | | | 85,184 | | | $ | 12,316,755 | |
| | | | | | | | |
| Alcoholic Beverages – 2.3% | | | | | | | | |
| Diageo PLC | | | 231,512 | | | $ | 7,692,329 | |
| Pernod Ricard S.A. | | | 48,939 | | | | 7,700,362 | |
| | | | | | | | |
| | | | | | $ | 15,392,691 | |
| | | | | | | | |
| Apparel Manufacturers – 2.2% | | | | | | | | |
| LVMH Moet Hennessy Louis Vuitton SE | | | 19,589 | | | $ | 8,594,215 | |
| NIKE, Inc., “B” | | | 64,629 | | | | 6,336,873 | |
| | | | | | | | |
| | | | | | $ | 14,931,088 | |
| | | | | | | | |
| Biotechnology – 0.9% | | | | | | | | |
| Illumina, Inc. (a) | | | 16,646 | | | $ | 6,164,846 | |
| | | | | | | | |
| Brokerage & Asset Managers – 3.0% | | | | | | | | |
| Blackstone Group, Inc. | | | 93,190 | | | $ | 5,280,145 | |
| NASDAQ, Inc. | | | 98,244 | | | | 11,737,211 | |
| TD Ameritrade Holding Corp. | | | 92,759 | | | | 3,374,572 | |
| | | | | | | | |
| | | | | | $ | 20,391,928 | |
| | | | | | | | |
| Business Services – 5.2% | | | | | | | | |
| Accenture PLC, “A” | | | 53,716 | | | $ | 11,533,900 | |
| Amdocs Ltd. | | | 121,184 | | | | 7,377,682 | |
| Cognizant Technology Solutions Corp., “A” | | | 36,764 | | | | 2,088,930 | |
| Fidelity National Information Services, Inc. | | | 109,059 | | | | 14,623,721 | |
| | | | | | | | |
| | | | | | $ | 35,624,233 | |
| | | | | | | | |
| Cable TV – 1.9% | | | | | | | | |
| Comcast Corp., “A” | | | 328,236 | | | $ | 12,794,639 | |
| | | | | | | | |
| Chemicals – 0.8% | | | | | | | | |
| PPG Industries, Inc. | | | 50,123 | | | $ | 5,316,045 | |
| | | | | | | | |
| Computer Software – 8.7% | | | | | | | | |
| Adobe Systems, Inc. (a) | | | 30,711 | | | $ | 13,368,805 | |
| Microsoft Corp. | | | 184,515 | | | | 37,550,648 | |
| Salesforce.com, Inc. (a) | | | 46,732 | | | | 8,754,306 | |
| | | | | | | | |
| | | | | | $ | 59,673,759 | |
| | | | | | | | |
| Computer Software – Systems – 2.8% | | | | | |
| Apple, Inc. | | | 38,827 | | | $ | 14,164,090 | |
| Cisco Systems, Inc. | | | 104,468 | | | | 4,872,387 | |
| | | | | | | | |
| | | | | | $ | 19,036,477 | |
| | | | | | | | |
| Construction – 1.4% | | | | | | | | |
| Sherwin-Williams Co. | | | 16,789 | | | $ | 9,701,524 | |
| | | | | | | | |
| Consumer Products – 2.6% | | | | | | | | |
| Colgate-Palmolive Co. | | | 111,385 | | | $ | 8,160,065 | |
| Estee Lauder Cos., Inc., “A” | | | 17,584 | | | | 3,317,749 | |
| Kimberly-Clark Corp. | | | 43,940 | | | | 6,210,919 | |
| | | | | | | | |
| | | | | | $ | 17,688,733 | |
| | | | | | | | |
| Containers – 1.1% | | | | | | | | |
| Crown Holdings, Inc. (a) | | | 113,660 | | | $ | 7,402,676 | |
| | | | | | | | |
| | | | | | | | |
| Issuer | | Shares/Par | | | Value ($) | |
| COMMON STOCKS – continued | | | | | | | | |
| Electrical Equipment – 3.3% | | | | | | | | |
| AMETEK, Inc. | | | 97,569 | | | $ | 8,719,742 | |
| Fortive Corp. | | | 122,167 | | | | 8,265,819 | |
| TE Connectivity Ltd. | | | 67,907 | | | | 5,537,816 | |
| | | | | | | | |
| | | | | | $ | 22,523,377 | |
| | | | | | | | |
| Electronics – 3.6% | | | | | | | | |
| Analog Devices, Inc. | | | 59,127 | | | $ | 7,251,335 | |
| Intel Corp. | | | 108,819 | | | | 6,510,641 | |
| Texas Instruments, Inc. | | | 87,468 | | | | 11,105,812 | |
| | | | | | | | |
| | | | | | $ | 24,867,788 | |
| | | | | | | | |
| Energy – Independent – 1.0% | | | | | | | | |
| ConocoPhillips | | | 111,477 | | | $ | 4,684,264 | |
| EOG Resources, Inc. | | | 36,293 | | | | 1,838,603 | |
| | | | | | | | |
| | | | | | $ | 6,522,867 | |
| | | | | | | | |
| Food & Beverages – 2.1% | | | | | | | | |
| Danone S.A. | | | 110,746 | | | $ | 7,659,485 | |
| Mondelez International, Inc. | | | 128,859 | | | | 6,588,561 | |
| | | | | | | | |
| | | | | | $ | 14,248,046 | |
| | | | | | | | |
| General Merchandise – 1.3% | | | | | | | | |
| Dollar General Corp. | | | 47,818 | | | $ | 9,109,807 | |
| | | | | | | | |
| Health Maintenance Organizations – 0.8% | | | | | |
| Cigna Corp. | | | 30,713 | | | $ | 5,763,294 | |
| | | | | | | | |
| Insurance – 1.0% | | | | | | | | |
| Chubb Ltd. | | | 52,774 | | | $ | 6,682,244 | |
| | | | | | | | |
| Internet – 7.3% | | | | | | | | |
| Alphabet, Inc., “A” (a) | | | 18,698 | | | $ | 26,514,699 | |
| Alphabet, Inc., “C” (a) | | | 6,944 | | | | 9,816,108 | |
| Facebook, Inc., “A” (a) | | | 58,624 | | | | 13,311,751 | |
| | | | | | | | |
| | | | | | $ | 49,642,558 | |
| | | | | | | | |
| Leisure & Toys – 1.7% | | | | | | | | |
| Electronic Arts, Inc. (a) | | | 87,634 | | | $ | 11,572,070 | |
| | | | | | | | |
| Major Banks – 5.4% | | | | | | | | |
| Bank of America Corp. | | | 532,260 | | | $ | 12,641,175 | |
| Goldman Sachs Group, Inc. | | | 48,811 | | | | 9,646,030 | |
| JPMorgan Chase & Co. | | | 157,946 | | | | 14,856,401 | |
| | | | | | | | |
| | | | | | $ | 37,143,606 | |
| | | | | | | | |
| Medical & Health Technology & Services – 1.6% | | | | | |
| ICON PLC (a) | | | 25,152 | | | $ | 4,237,106 | |
| PRA Health Sciences, Inc. (a) | | | 70,573 | | | | 6,866,047 | |
| | | | | | | | |
| | | | | | $ | 11,103,153 | |
| | | | | | | | |
| Medical Equipment – 7.9% | | | | | | | | |
| Becton, Dickinson and Co. | | | 58,457 | | | $ | 13,987,006 | |
| Danaher Corp. | | | 64,802 | | | | 11,458,937 | |
| Medtronic PLC | | | 165,761 | | | | 15,200,284 | |
| Thermo Fisher Scientific, Inc. | | | 36,652 | | | | 13,280,486 | |
| | | | | | | | |
| | | | | | $ | 53,926,713 | |
| | | | | | | | |
4
MFS Investors Trust Series
Portfolio of Investments (unaudited) – continued
| | | | | | | | |
| Issuer | | Shares/Par | | | Value ($) | |
| COMMON STOCKS – continued | | | | | |
| Natural Gas – Pipeline – 1.1% | | | | | | | | |
| Enterprise Products Partners LP | | | 401,982 | | | $ | 7,304,013 | |
| | | | | | | | |
| Network & Telecom – 1.4% | | | | | | | | |
| Equinix, Inc., REIT | | | 13,189 | | | $ | 9,262,635 | |
| | | | | | | | |
| Other Banks & Diversified Financials – 6.0% | | | | | |
| Mastercard, Inc., “A” | | | 56,808 | | | $ | 16,798,125 | |
| Truist Financial Corp. | | | 187,132 | | | | 7,026,807 | |
| Visa, Inc., “A” | | | 88,960 | | | | 17,184,403 | |
| | | | | | | | |
| | | | | | $ | 41,009,335 | |
| | | | | | | | |
| Pharmaceuticals – 6.9% | | | | | | | | |
| Eli Lilly & Co. | | | 74,093 | | | $ | 12,164,589 | |
| Johnson & Johnson | | | 139,308 | | | | 19,590,884 | |
| Merck & Co., Inc. | | | 110,714 | | | | 8,561,514 | |
| Zoetis, Inc. | | | 52,037 | | | | 7,131,150 | |
| | | | | | | | |
| | | | | | $ | 47,448,137 | |
| | | | | | | | |
| Railroad & Shipping – 1.4% | | | | | | | | |
| Canadian National Railway Co. | | | 106,779 | | | $ | 9,457,416 | |
| | | | | | | | |
| Restaurants – 0.8% | | | | | | | | |
| Starbucks Corp. | | | 73,684 | | | $ | 5,422,406 | |
| | | | | | | | |
| Retailers – 1.1% | | | | | | | | |
| Costco Wholesale Corp. | | | 25,076 | | | $ | 7,603,294 | |
| | | | | | | | |
| Specialty Chemicals – 0.8% | | | | | | | | |
| DuPont de Nemours, Inc. | | | 105,967 | | | $ | 5,630,027 | |
| | | | | | | | |
| Specialty Stores – 4.6% | | | | | | | | |
| Home Depot, Inc. | | | 35,509 | | | $ | 8,895,360 | |
| Ross Stores, Inc. | | | 22,423 | | | | 1,911,336 | |
| Target Corp. | | | 77,392 | | | | 9,281,622 | |
| Tractor Supply Co. | | | 83,834 | | | | 11,048,483 | |
| | | | | | | | |
| | | | | | $ | 31,136,801 | |
| | | | | | | | |
| | | | | | | | |
| Issuer | | Shares/Par | | | Value ($) | |
| COMMON STOCKS – continued | | | | | | | | |
| Telecommunications – Wireless – 2.4% | | | | | |
| American Tower Corp., REIT | | | 62,320 | | | $ | 16,112,213 | |
| | | | | | | | |
| Trucking – 0.2% | | | | | | | | |
| Old Dominion Freight Line, Inc. | | | 8,584 | | | $ | 1,455,761 | |
| | | | | | | | |
| Utilities – Electric Power – 0.5% | | | | | | | | |
| American Electric Power Co., Inc. | | | 47,299 | | | $ | 3,766,892 | |
| | | | | | | | |
Total Common Stocks
(Identified Cost, $391,478,552) | | | | | | $ | 675,149,847 | |
| | | | | | | | |
| |
| INVESTMENT COMPANIES (h) – 1.1% | | | | | |
| Money Market Funds – 1.1% | | | | | | | | |
| MFS Institutional Money Market Portfolio, 0.17% (v) (Identified Cost, $7,754,178) | | | 7,754,019 | | | $ | 7,754,795 | |
| | | | | | | | |
OTHER ASSETS, LESS
LIABILITIES – 0.0% | | | | 160,308 | |
| | | | | | | | |
| NET ASSETS – 100.0% | | | | | | $ | 683,064,950 | |
| | | | | | | | |
| (a) | | Non-income producing security. |
| (h) | | An affiliated issuer, which may be considered one in which the fund owns 5% or more of the outstanding voting securities, or a company which is under common control. At period end, the aggregate values of the fund’s investments in affiliated issuers and in unaffiliated issuers were $7,754,795 and $675,149,847, respectively. |
| (v) | | Affiliated issuer that is available only to investment companies managed by MFS. The rate quoted for the MFS Institutional Money Market Portfolio is the annualized seven-day yield of the fund at period end. |
The following abbreviations are used in this report and are defined:
| REIT | | Real Estate Investment Trust |
See Notes to Financial Statements
5
MFS Investors Trust Series
FINANCIAL STATEMENTS | STATEMENT OF ASSETS AND LIABILITIES (unaudited)
This statement represents your fund’s balance sheet, which details the assets and liabilities comprising the total value of the fund.
| | | | |
At 6/30/20 | | | | |
| |
Assets | | | | |
Investments in unaffiliated issuers, at value (identified cost, $391,478,552) | | | $675,149,847 | |
Investments in affiliated issuers, at value (identified cost, $7,754,178) | | | 7,754,795 | |
Cash | | | 38,318 | |
Receivables for | | | | |
Fund shares sold | | | 481,721 | |
Dividends | | | 499,757 | |
Other assets | | | 1,678 | |
Total assets | | | $683,926,116 | |
| |
Liabilities | | | | |
Payables for | | | | |
Fund shares reacquired | | | $705,922 | |
Payable to affiliates | | | | |
Investment adviser | | | 23,905 | |
Administrative services fee | | | 566 | |
Shareholder servicing costs | | | 841 | |
Distribution and/or service fees | | | 5,917 | |
Accrued expenses and other liabilities | | | 124,015 | |
Total liabilities | | | $861,166 | |
Net assets | | | $683,064,950 | |
| |
Net assets consist of | | | | |
Paid-in capital | | | $367,470,381 | |
Total distributable earnings (loss) | | | 315,594,569 | |
Net assets | | | $683,064,950 | |
Shares of beneficial interest outstanding | | | 21,869,390 | |
| | | | | | | | | | | | |
| | | |
| | | Net assets | | | Shares
outstanding | | | Net asset value
per share | |
Initial Class | | | $240,692,796 | | | | 7,625,121 | | | | $31.57 | |
Service Class | | | 442,372,154 | | | | 14,244,269 | | | | 31.06 | |
See Notes to Financial Statements
6
MFS Investors Trust Series
FINANCIAL STATEMENTS | STATEMENT OF OPERATIONS (unaudited)
This statement describes how much your fund earned in investment income and accrued in expenses. It also describes any gains and/or losses generated by fund operations.
| | | | |
Six months ended 6/30/20 | | | | |
| |
Net investment income (loss) | | | | |
Income | | | | |
Dividends | | | $5,239,741 | |
Dividends from affiliated issuers | | | 55,383 | |
Income on securities loaned | | | 18,137 | |
Other | | | 11,148 | |
Foreign taxes withheld | | | (15,598 | ) |
Total investment income | | | $5,308,811 | |
Expenses | | | | |
Management fee | | | $2,474,539 | |
Distribution and/or service fees | | | 527,763 | |
Shareholder servicing costs | | | 15,282 | |
Administrative services fee | | | 50,280 | |
Independent Trustees’ compensation | | | 7,605 | |
Custodian fee | | | 18,147 | |
Shareholder communications | | | 33,112 | |
Audit and tax fees | | | 28,821 | |
Legal fees | | | 3,008 | |
Miscellaneous | | | 15,380 | |
Total expenses | | | $3,173,937 | |
Reduction of expenses by investment adviser | | | (38,974 | ) |
Net expenses | | | $3,134,963 | |
Net investment income (loss) | | | $2,173,848 | |
| |
Realized and unrealized gain (loss) | | | | |
Realized gain (loss) (identified cost basis) | | | | |
Unaffiliated issuers | | | $3,474,191 | |
Affiliated issuers | | | (2,492 | ) |
Foreign currency | | | (8,700 | ) |
Net realized gain (loss) | | | $3,462,999 | |
Change in unrealized appreciation or depreciation | | | | |
Unaffiliated issuers | | | $(40,923,181 | ) |
Affiliated issuers | | | 639 | |
Net unrealized gain (loss) | | | $(40,922,542 | ) |
Net realized and unrealized gain (loss) | | | $(37,459,543 | ) |
Change in net assets from operations | | | $(35,285,695 | ) |
See Notes to Financial Statements
7
MFS Investors Trust Series
FINANCIAL STATEMENTS | STATEMENTS OF CHANGES IN NET ASSETS
These statements describe the increases and/or decreases in net assets resulting from operations, any distributions, and any shareholder transactions.
| | | | | | | | |
| | | Six months ended
6/30/20 | | | Year ended
12/31/19 | |
| | | (unaudited) | | | | |
Change in net assets | | | | | | | | |
| | |
From operations | | | | | | | | |
Net investment income (loss) | | | $2,173,848 | | | | $4,245,875 | |
Net realized gain (loss) | | | 3,462,999 | | | | 21,650,086 | |
Net unrealized gain (loss) | | | (40,922,542 | ) | | | 148,081,475 | |
Change in net assets from operations | | | $(35,285,695 | ) | | | $173,977,436 | |
Total distributions to shareholders | | | $— | | | | $(42,277,259 | ) |
Change in net assets from fund share transactions | | | $(281,192 | ) | | | $29,872,889 | |
Total change in net assets | | | $(35,566,887 | ) | | | $161,573,066 | |
| | |
Net assets | | | | | | | | |
At beginning of period | | | 718,631,837 | | | | 557,058,771 | |
At end of period | | | $683,064,950 | | | | $718,631,837 | |
See Notes to Financial Statements
8
MFS Investors Trust Series
FINANCIAL STATEMENTS | FINANCIAL HIGHLIGHTS
The financial highlights table is intended to help you understand the fund’s financial performance for the semiannual period and the past 5 fiscal years. Certain information reflects financial results for a single fund share. The total returns in the table represent the rate that an investor would have earned (or lost) on an investment in the fund share class (assuming reinvestment of all distributions) held for the entire period.
| | | | | | | | | | | | | | | | | | | | | | | | |
| Initial Class | | Six months
ended 6/30/20 | | | Year ended | |
| | | 12/31/19 | | | 12/31/18 | | | 12/31/17 | | | 12/31/16 | | | 12/31/15 | |
| | | | | | |
| | | (unaudited) | | | | | | | | | | | | | | | | |
| | | | | | |
Net asset value, beginning of period | | | $33.27 | | | | $27.05 | | | | $30.07 | | | | $25.57 | | | | $26.58 | | | | $30.41 | |
| | | | | | |
| Income (loss) from investment operations | | | | | | | | | | | | | | | | | | | | | | | | |
Net investment income (loss) (d) | | | $0.12 | | | | $0.25 | | | | $0.26 | | | | $0.22 | | | | $0.23 | (c) | | | $0.21 | |
Net realized and unrealized gain (loss) | | | (1.82 | ) | | | 8.08 | | | | (1.71 | ) | | | 5.62 | | | | 2.01 | | | | (0.42 | ) |
Total from investment operations | | | $(1.70 | ) | | | $8.33 | | | | $(1.45 | ) | | | $5.84 | | | | $2.24 | | | | $(0.21 | ) |
| | | | | | |
| Less distributions declared to shareholders | | | | | | | | | | | | | | | | | | | | | | | | |
From net investment income | | | $— | | | | $(0.22 | ) | | | $(0.20 | ) | | | $(0.21 | ) | | | $(0.24 | ) | | | $(0.28 | ) |
From net realized gain | | | — | | | | (1.89 | ) | | | (1.37 | ) | | | (1.13 | ) | | | (3.01 | ) | | | (3.34 | ) |
Total distributions declared to shareholders | | | $— | | | | $(2.11 | ) | | | $(1.57 | ) | | | $(1.34 | ) | | | $(3.25 | ) | | | $(3.62 | ) |
Net asset value, end of period (x) | | | $31.57 | | | | $33.27 | | | | $27.05 | | | | $30.07 | | | | $25.57 | | | | $26.58 | |
Total return (%) (k)(r)(s)(x) | | | (5.11 | )(n) | | | 31.58 | | | | (5.49 | ) | | | 23.35 | | | | 8.59 | (c) | | | 0.22 | |
| | | | | | |
Ratios (%) (to average net assets)
and Supplemental data: | | | | | | | | | | | | | | | | | | | | | | | | |
Expenses before expense reductions (f) | | | 0.80 | (a) | | | 0.80 | | | | 0.80 | | | | 0.82 | | | | 0.80 | (c) | | | 0.82 | |
Expenses after expense reductions (f) | | | 0.79 | (a) | | | 0.79 | | | | 0.79 | | | | 0.79 | | | | 0.79 | (c) | | | 0.81 | |
Net investment income (loss) | | | 0.82 | (a) | | | 0.80 | | | | 0.86 | | | | 0.79 | | | | 0.89 | (c) | | | 0.73 | |
Portfolio turnover | | | 13 | (n) | | | 18 | | | | 16 | | | | 18 | | | | 20 | | | | 17 | |
Net assets at end of period (000 omitted) | | | $240,693 | | | | $265,499 | | | | $231,900 | | | | $283,237 | | | | $270,796 | | | | $293,203 | |
| | |
| Service Class | | Six months
ended 6/30/20 | | | Year ended | |
| | | 12/31/19 | | | 12/31/18 | | | 12/31/17 | | | 12/31/16 | | | 12/31/15 | |
| | | | | | |
| | | (unaudited) | | | | | | | | | | | | | | | | |
| | | | | | |
Net asset value, beginning of period | | | $32.77 | | | | $26.68 | | | | $29.69 | | | | $25.28 | | | | $26.30 | | | | $30.13 | |
| | | | | | |
| Income (loss) from investment operations | | | | | | | | | | | | | | | | | | | | | | | | |
Net investment income (loss) (d) | | | $0.09 | | | | $0.17 | | | | $0.18 | | | | $0.15 | | | | $0.16 | (c) | | | $0.14 | |
Net realized and unrealized gain (loss) | | | (1.80 | ) | | | 7.97 | | | | (1.68 | ) | | | 5.55 | | | | 1.98 | | | | (0.42 | ) |
Total from investment operations | | | $(1.71 | ) | | | $8.14 | | | | $(1.50 | ) | | | $5.70 | | | | $2.14 | | | | $(0.28 | ) |
| | | | | | |
| Less distributions declared to shareholders | | | | | | | | | | | | | | | | | | | | | | | | |
From net investment income | | | $— | | | | $(0.16 | ) | | | $(0.14 | ) | | | $(0.16 | ) | | | $(0.15 | ) | | | $(0.21 | ) |
From net realized gain | | | — | | | | (1.89 | ) | | | (1.37 | ) | | | (1.13 | ) | | | (3.01 | ) | | | (3.34 | ) |
Total distributions declared to shareholders | | | $— | | | | $(2.05 | ) | | | $(1.51 | ) | | | $(1.29 | ) | | | $(3.16 | ) | | | $(3.55 | ) |
Net asset value, end of period (x) | | | $31.06 | | | | $32.77 | | | | $26.68 | | | | $29.69 | | | | $25.28 | | | | $26.30 | |
Total return (%) (k)(r)(s)(x) | | | (5.22 | )(n) | | | 31.25 | | | | (5.71 | ) | | | 23.03 | | | | 8.32 | (c) | | | (0.05 | ) |
| | | | | | |
Ratios (%) (to average net assets)
and Supplemental data: | | | | | | | | | | | | | | | | | | | | | | | | |
Expenses before expense reductions (f) | | | 1.05 | (a) | | | 1.05 | | | | 1.05 | | | | 1.07 | | | | 1.04 | (c) | | | 1.07 | |
Expenses after expense reductions (f) | | | 1.04 | (a) | | | 1.04 | | | | 1.04 | | | | 1.04 | | | | 1.04 | (c) | | | 1.06 | |
Net investment income (loss) | | | 0.57 | (a) | | | 0.55 | | | | 0.62 | | | | 0.55 | | | | 0.64 | (c) | | | 0.47 | |
Portfolio turnover | | | 13 | (n) | | | 18 | | | | 16 | | | | 18 | | | | 20 | | | | 17 | |
Net assets at end of period (000 omitted) | | | $442,372 | | | | $453,132 | | | | $325,159 | | | | $318,611 | | | | $228,741 | | | | $193,116 | |
See Notes to Financial Statements
9
MFS Investors Trust Series
Financial Highlights – continued
| (c) | Amount reflects a one-time reimbursement of expenses by the custodian (or former custodian) without which net investment income and performance would be lower and expenses would be higher. |
| (d) | Per share data is based on average shares outstanding. |
| (f) | Ratios do not reflect reductions from fees paid indirectly, if applicable. |
| (k) | The total return does not reflect expenses that apply to separate accounts. Inclusion of these charges would reduce the total return figures for all periods shown. |
| (r) | Certain expenses have been reduced without which performance would have been lower. |
| (s) | From time to time the fund may receive proceeds from litigation settlements, without which performance would be lower. |
| (x) | The net asset values and total returns have been calculated on net assets which include adjustments made in accordance with U.S. generally accepted accounting principles required at period end for financial reporting purposes. |
See Notes to Financial Statements
10
MFS Investors Trust Series
NOTES TO FINANCIAL STATEMENTS (unaudited)
| (1) | | Business and Organization |
MFS Investors Trust Series (the fund) is a diversified series of MFS Variable Insurance Trust (the trust). The trust is organized as a Massachusetts business trust and is registered under the Investment Company Act of 1940, as amended, as an open-end management investment company. The shareholders of each series of the trust are separate accounts of insurance companies, which offer variable annuity and/or life insurance products, and qualified retirement and pension plans.
The fund is an investment company and accordingly follows the investment company accounting and reporting guidance of the Financial Accounting Standards Board (FASB) Accounting Standards Codification Topic 946 Financial Services – Investment Companies.
| (2) | | Significant Accounting Policies |
General – The preparation of financial statements in conformity with U.S. generally accepted accounting principles requires management to make estimates and assumptions that affect the reported amounts of assets and liabilities, and disclosure of contingent assets and liabilities at the date of the financial statements and the reported amounts of increases and decreases in net assets from operations during the reporting period. Actual results could differ from those estimates. In the preparation of these financial statements, management has evaluated subsequent events occurring after the date of the fund’s Statement of Assets and Liabilities through the date that the financial statements were issued.
In March 2020, the FASB issued Accounting Standards Update 2020-04, Reference Rate Reform (Topic 848) – Facilitation of the Effects of Reference Rate Reform on Financial Reporting (“ASU 2020-04”), which provides optional, temporary relief with respect to the financial reporting of contracts subject to certain types of modifications due to the planned discontinuation of the London Interbank Offered Rate (LIBOR) and other IBOR-based reference rates as of the end of 2021. The temporary relief provided by ASU 2020-04 is effective for certain reference rate-related contract modifications that occur during the period from March 12, 2020 through December 31, 2022. Management is evaluating the impact of ASU 2020-04 on the fund’s investments, derivatives, debt and other contracts that will undergo reference rate-related modifications as a result of the reference rate reform.
Balance Sheet Offsetting – The fund’s accounting policy with respect to balance sheet offsetting is that, absent an event of default by the counterparty or a termination of the agreement, the International Swaps and Derivatives Association (ISDA) Master Agreement, or similar agreement, does not result in an offset of reported amounts of financial assets and financial liabilities in the Statement of Assets and Liabilities across transactions between the fund and the applicable counterparty. The fund’s right to setoff may be restricted or prohibited by the bankruptcy or insolvency laws of the particular jurisdiction to which a specific master netting agreement counterparty is subject. Balance sheet offsetting disclosures, to the extent applicable to the fund, have been included in the fund’s Significant Accounting Policies note under the captions for each of the fund’s in-scope financial instruments and transactions.
Investment Valuations – Equity securities, including restricted equity securities, are generally valued at the last sale or official closing price on their primary market or exchange as provided by a third-party pricing service. Equity securities, for which there were no sales reported that day, are generally valued at the last quoted daily bid quotation on their primary market or exchange as provided by a third-party pricing service. Short-term instruments with a maturity at issuance of 60 days or less may be valued at amortized cost, which approximates market value. Open-end investment companies are generally valued at net asset value per share. Securities and other assets generally valued on the basis of information from a third-party pricing service may also be valued at a broker/dealer bid quotation. In determining values, third-party pricing services can utilize both transaction data and market information such as yield, quality, coupon rate, maturity, type of issue, trading characteristics, and other market data. The values of foreign securities and other assets and liabilities expressed in foreign currencies are converted to U.S. dollars using the mean of bid and asked prices for rates provided by a third-party pricing service.
The Board of Trustees has delegated primary responsibility for determining or causing to be determined the value of the fund’s investments (including any fair valuation) to the adviser pursuant to valuation policies and procedures approved by the Board. If the adviser determines that reliable market quotations are not readily available, investments are valued at fair value as determined in good faith by the adviser in accordance with such procedures under the oversight of the Board of Trustees. Under the fund’s valuation policies and procedures, market quotations are not considered to be readily available for most types of debt instruments and floating rate loans and many types of derivatives. These investments are generally valued at fair value based on information from third-party pricing services. In addition, investments may be valued at fair value if the adviser determines that an investment’s value has been materially affected by events occurring after the close of the exchange or market on which the investment is principally traded (such as foreign exchange or market) and prior to the determination of the fund’s net asset value, or after the halt of trading of a specific security where trading does not resume prior to the close of the exchange or market on which the security is principally traded. Events that occur after foreign markets close (such as developments in foreign markets and significant movements in the U.S. markets) and prior to the determination of the fund’s net asset value may be deemed to have a material effect on the value of securities traded in foreign markets. Accordingly, the fund’s foreign equity securities may often be valued at fair value. The adviser
11
MFS Investors Trust Series
Notes to Financial Statements (unaudited) – continued
generally relies on third-party pricing services or other information (such as the correlation with price movements of similar securities in the same or other markets; the type, cost and investment characteristics of the security; the business and financial condition of the issuer; and trading and other market data) to assist in determining whether to fair value and at what value to fair value an investment. The value of an investment for purposes of calculating the fund’s net asset value can differ depending on the source and method used to determine value. When fair valuation is used, the value of an investment used to determine the fund’s net asset value may differ from quoted or published prices for the same investment. There can be no assurance that the fund could obtain the fair value assigned to an investment if it were to sell the investment at the same time at which the fund determines its net asset value per share.
Various inputs are used in determining the value of the fund’s assets or liabilities. These inputs are categorized into three broad levels. In certain cases, the inputs used to measure fair value may fall into different levels of the fair value hierarchy. In such cases, an investment’s level within the fair value hierarchy is based on the lowest level of input that is significant to the fair value measurement. The fund’s assessment of the significance of a particular input to the fair value measurement in its entirety requires judgment, and considers factors specific to the investment. Level 1 includes unadjusted quoted prices in active markets for identical assets or liabilities. Level 2 includes other significant observable market-based inputs (including quoted prices for similar securities, interest rates, prepayment speed, and credit risk). Level 3 includes unobservable inputs, which may include the adviser’s own assumptions in determining the fair value of investments. The following is a summary of the levels used as of June 30, 2020 in valuing the fund’s assets or liabilities:
| | | | | | | | | | | | | | | | |
| Financial Instruments | | Level 1 | | | Level 2 | | | Level 3 | | | Total | |
| Equity Securities | | | $675,149,847 | | | | $— | | | | $— | | | | $675,149,847 | |
| Mutual Funds | | | 7,754,795 | | | | — | | | | — | | | | 7,754,795 | |
| Total | | | $682,904,642 | | | | $— | | | | $— | | | | $682,904,642 | |
For further information regarding security characteristics, see the Portfolio of Investments.
Foreign Currency Translation – Purchases and sales of foreign investments, income, and expenses are converted into U.S. dollars based upon currency exchange rates prevailing on the respective dates of such transactions or on the reporting date for foreign denominated receivables and payables. Gains and losses attributable to foreign currency exchange rates on sales of securities are recorded for financial statement purposes as net realized gains and losses on investments. Gains and losses attributable to foreign exchange rate movements on receivables, payables, income and expenses are recorded for financial statement purposes as foreign currency transaction gains and losses. That portion of both realized and unrealized gains and losses on investments that results from fluctuations in foreign currency exchange rates is not separately disclosed.
Security Loans – Under its Securities Lending Agency Agreement with the fund, State Street Bank and Trust Company, as lending agent, loans the securities of the fund to certain qualified institutions (the “Borrowers”) approved by the fund. Security loans can be terminated at the discretion of either the lending agent or the fund and the related securities must be returned within the earlier of the standard trade settlement period for such securities or within three business days. The loans are collateralized by cash and/or U.S. Treasury and federal agency obligations in an amount typically at least equal to the market value of the securities loaned. On loans collateralized by cash, the cash collateral is invested in a money market fund. The market value of the loaned securities is determined at the close of business of the fund and any additional required collateral is delivered to the fund on the next business day. The lending agent provides the fund with indemnification against Borrower default. In the event of Borrower default, the lending agent will, for the benefit of the fund, either purchase securities identical to those loaned or, when such purchase is commercially impracticable, pay the fund the market value of the loaned securities. In return, the lending agent assumes the fund’s rights to the related collateral. If the collateral value is less than the cost to purchase identical securities, the lending agent is responsible for the shortfall, but only to the extent that such shortfall is not due to a decline in collateral value resulting from collateral reinvestment for which the fund bears the risk of loss. A portion of the income generated upon investment of the collateral is remitted to the Borrowers, and the remainder is allocated between the fund and the lending agent. On loans collateralized by U.S. Treasury and/or federal agency obligations, a fee is received from the Borrower, and is allocated between the fund and the lending agent. Income from securities lending is separately reported in the Statement of Operations. The dividend and interest income earned on the securities loaned is accounted for in the same manner as other dividend and interest income. At June 30, 2020, there were no securities on loan or collateral outstanding
Indemnifications – Under the fund’s organizational documents, its officers and Trustees may be indemnified against certain liabilities and expenses arising out of the performance of their duties to the fund. Additionally, in the normal course of business, the fund enters into agreements with service providers that may contain indemnification clauses. The fund’s maximum exposure under these agreements is unknown as this would involve future claims that may be made against the fund that have not yet occurred.
Investment Transactions and Income – Investment transactions are recorded on the trade date. Interest income is recorded on the accrual basis. Dividends received in cash are recorded on the ex-dividend date. Certain dividends from foreign securities will be
12
MFS Investors Trust Series
Notes to Financial Statements (unaudited) – continued
recorded when the fund is informed of the dividend if such information is obtained subsequent to the ex-dividend date. Dividend payments received in additional securities are recorded on the ex-dividend date in an amount equal to the value of the security on such date.
The fund may receive proceeds from litigation settlements. Any proceeds received from litigation involving portfolio holdings are reflected in the Statement of Operations in realized gain/loss if the security has been disposed of by the fund or in unrealized gain/loss if the security is still held by the fund. Any other proceeds from litigation not related to portfolio holdings are reflected as other income in the Statement of Operations.
Tax Matters and Distributions – The fund intends to qualify as a regulated investment company, as defined under Subchapter M of the Internal Revenue Code, and to distribute all of its taxable income, including realized capital gains. As a result, no provision for federal income tax is required. The fund’s federal tax returns, when filed, will remain subject to examination by the Internal Revenue Service for a three year period. Management has analyzed the fund’s tax positions taken on federal and state tax returns for all open tax years and does not believe that there are any uncertain tax positions that require recognition of a tax liability. Foreign taxes, if any, have been accrued by the fund in the accompanying financial statements in accordance with the applicable foreign tax law. Foreign income taxes may be withheld by certain countries in which the fund invests. Additionally, capital gains realized by the fund on securities issued in or by certain foreign countries may be subject to capital gains tax imposed by those countries.
Distributions to shareholders are recorded on the ex-dividend date. Income and capital gain distributions are determined in accordance with income tax regulations, which may differ from U.S. generally accepted accounting principles. Certain capital accounts in the financial statements are periodically adjusted for permanent differences in order to reflect their tax character. These adjustments have no impact on net assets or net asset value per share. Temporary differences which arise from recognizing certain items of income, expense, gain or loss in different periods for financial statement and tax purposes will reverse at some time in the future.
Book/tax differences primarily relate to wash sale loss deferrals and partnership adjustments.
The tax character of distributions declared to shareholders for the last fiscal year is as follows:
| | | | |
| | | Year ended
12/31/19 | |
| Ordinary income (including any short-term capital gains) | | | $5,420,196 | |
| Long-term capital gains | | | 36,857,063 | |
| Total distributions | | | $42,277,259 | |
The federal tax cost and the tax basis components of distributable earnings were as follows:
| | | | |
| As of 6/30/20 | | | | |
| |
| Cost of investments | | | $400,085,613 | |
| Gross appreciation | | | 295,158,976 | |
| Gross depreciation | | | (12,339,947 | ) |
| Net unrealized appreciation (depreciation) | | | $282,819,029 | |
| |
| As of 12/31/19 | | | | |
| |
| Undistributed ordinary income | | | 4,647,476 | |
| Undistributed long-term capital gain | | | 21,127,709 | |
| Other temporary differences | | | 1,363,508 | |
| Net unrealized appreciation (depreciation) | | | 323,741,571 | |
The aggregate cost above includes prior fiscal year end tax adjustments, if applicable.
Multiple Classes of Shares of Beneficial Interest – The fund offers multiple classes of shares, which differ in their respective distribution and/or service fees. The fund’s income, realized and unrealized gain (loss), and common expenses are allocated to shareholders based on the daily net assets of each class. Dividends are declared separately for each class. Differences in per share dividend rates are generally due to differences in separate class expenses. The fund’s distributions declared to shareholders as reported in the Statements of Changes in Net Assets are presented by class as follows:
| | | | | | | | |
| | |
| | | Six months ended
6/30/20 | | | Year ended
12/31/19 | |
| Initial Class | | | $— | | | | $16,490,409 | |
| Service Class | | | — | | | | 25,786,850 | |
| Total | | | $— | | | | $42,277,259 | |
13
MFS Investors Trust Series
Notes to Financial Statements (unaudited) – continued
| (3) | | Transactions with Affiliates |
Investment Adviser – The fund has an investment advisory agreement with MFS to provide overall investment management and related administrative services and facilities to the fund. The management fee is computed daily and paid monthly at the following annual rates based on the fund’s average daily net assets:
| | | | |
| Up to $1 billion | | | 0.75% | |
| In excess of $1 billion and up to $2.5 billion | | | 0.65% | |
| In excess of $2.5 billion | | | 0.60% | |
MFS has agreed in writing to reduce its management fee by a specified amount if certain MFS mutual fund assets exceed thresholds agreed to by MFS and the fund’s Board of Trustees. For the six months ended June 30, 2020, this management fee reduction amounted to $35,592, which is included in the reduction of total expenses in the Statement of Operations. The management fee incurred for the six months ended June 30, 2020 was equivalent to an annual effective rate of 0.74% of the fund’s average daily net assets.
The investment adviser has agreed in writing to pay a portion of the fund’s total annual operating expenses, excluding interest, taxes, extraordinary expenses, brokerage and transaction costs, and investment-related expenses, such that total annual operating expenses do not exceed 0.79% of average daily net assets for the Initial Class shares and 1.04% of average daily net assets for the Service Class shares. This written agreement will continue until modified by the fund’s Board of Trustees, but such agreement will continue at least until April 30, 2022. For the six months ended June 30, 2020, this reduction amounted to $3,382, which is included in the reduction of total expenses in the Statement of Operations.
Distributor – MFS Fund Distributors, Inc. (MFD), a wholly-owned subsidiary of MFS, is the distributor of shares of the fund. The Trustees have adopted a distribution plan for the Service Class shares pursuant to Rule 12b-1 under the Investment Company Act of 1940.
The fund’s distribution plan provides that the fund will pay MFD distribution and/or service fees equal to 0.25% per annum of its average daily net assets attributable to Service Class shares as partial consideration for services performed and expenses incurred by MFD and financial intermediaries (including participating insurance companies that invest in the fund to fund variable annuity and variable life insurance contracts, sponsors of qualified retirement and pension plans that invest in the fund, and affiliates of these participating insurance companies and plan sponsors) in connection with the sale and distribution of the Service Class shares. MFD may subsequently pay all, or a portion, of the distribution and/or service fees to financial intermediaries.
Shareholder Servicing Agent – MFS Service Center, Inc. (MFSC), a wholly-owned subsidiary of MFS, receives a fee from the fund for its services as shareholder servicing agent. For the six months ended June 30, 2020, the fee was $14,551, which equated to 0.0044% annually of the fund’s average daily net assets. MFSC also receives payment from the fund for out-of-pocket expenses paid by MFSC on behalf of the fund. For the six months ended June 30, 2020, these costs amounted to $731.
Administrator – MFS provides certain financial, legal, shareholder communications, compliance, and other administrative services to the fund. Under an administrative services agreement, the fund reimburses MFS the costs incurred to provide these services. The fund is charged an annual fixed amount of $17,500 plus a fee based on average daily net assets. The administrative services fee incurred for the six months ended June 30, 2020 was equivalent to an annual effective rate of 0.0152% of the fund’s average daily net assets.
Trustees’ and Officers’ Compensation – The fund pays compensation to independent Trustees in the form of a retainer, attendance fees, and additional compensation to Board and Committee chairpersons. The fund does not pay compensation directly to Trustees or officers of the fund who are also officers of the investment adviser, all of whom receive remuneration from MFS for their services to the fund. Certain officers and Trustees of the fund are officers or directors of MFS, MFD, and MFSC.
Other – The fund invests in the MFS Institutional Money Market Portfolio which is managed by MFS and seeks current income consistent with preservation of capital and liquidity. This money market fund does not pay a management fee to MFS but does incur investment and operating costs.
The adviser has voluntarily undertaken to reimburse the fund from its own resources on a quarterly basis for the cost of investment research embedded in the cost of the fund’s securities trades. This agreement may be rescinded at any time. For the six months ended June 30, 2020, this reimbursement amounted to $11,148, which is included in “Other” income in the Statement of Operations.
For the six months ended June 30, 2020, purchases and sales of investments, other than short-term obligations, aggregated $89,829,393 and $83,777,804, respectively.
14
MFS Investors Trust Series
Notes to Financial Statements (unaudited) – continued
| (5) | | Shares of Beneficial Interest |
The fund’s Declaration of Trust permits the Trustees to issue an unlimited number of full and fractional shares of beneficial interest. Transactions in fund shares were as follows:
| | | | | | | | | | | | | | | | |
| | | Six months ended 6/30/20 | | | Year ended 12/31/19 | |
| | | | |
| | | Shares | | | Amount | | | Shares | | | Amount | |
| Shares sold | | | | | | | | | | | | | | | | |
Initial Class | | | 220,896 | | | | $6,211,772 | | | | 273,184 | | | | $8,234,981 | |
Service Class | | | 1,384,219 | | | | 40,546,257 | | | | 2,049,570 | | | | 63,025,793 | |
| | | 1,605,115 | | | | $46,758,029 | | | | 2,322,754 | | | | $71,260,774 | |
| | | | |
| Shares issued to shareholders in reinvestment of distributions | | | | | | | | | | | | | | | | |
Initial Class | | | — | | | | $— | | | | 543,879 | | | | $16,490,409 | |
Service Class | | | — | | | | — | | | | 862,725 | | | | 25,786,850 | |
| | | — | | | | $— | | | | 1,406,604 | | | | $42,277,259 | |
| | | | |
| Shares reacquired | | | | | | | | | | | | | | | | |
Initial Class | | | (576,597 | ) | | | $(17,744,440 | ) | | | (1,410,131 | ) | | | $(44,272,121 | ) |
Service Class | | | (967,278 | ) | | | (29,294,781 | ) | | | (1,272,751 | ) | | | (39,393,023 | ) |
| | | (1,543,875 | ) | | | $(47,039,221 | ) | | | (2,682,882 | ) | | | $(83,665,144 | ) |
| | | | |
| Net change | | | | | | | | | | | | | | | | |
Initial Class | | | (355,701 | ) | | | $(11,532,668 | ) | | | (593,068 | ) | | | $(19,546,731 | ) |
Service Class | | | 416,941 | | | | 11,251,476 | | | | 1,639,544 | | | | 49,419,620 | |
| | | 61,240 | | | | $(281,192 | ) | | | 1,046,476 | | | | $29,872,889 | |
The fund and certain other funds managed by MFS participate in a $1.25 billion unsecured committed line of credit, subject to a $1 billion sublimit, provided by a syndicate of banks under a credit agreement. Borrowings may be made for temporary financing needs. Interest is charged to each fund, based on its borrowings, generally at a rate equal to the highest of one month LIBOR, the Federal Funds Effective Rate and the Overnight Bank Funding Rate, plus an agreed upon spread. A commitment fee, based on the average daily, unused portion of the committed line of credit, is allocated among the participating funds. In addition, the fund and other funds managed by MFS have established unsecured uncommitted borrowing arrangements with certain banks for temporary financing needs. Interest is charged to each fund, based on its borrowings, at rates equal to customary reference rates plus an agreed upon spread. For the six months ended June 30, 2020, the fund’s commitment fee and interest expense were $1,684 and $0, respectively, and are included in “Miscellaneous” expense in the Statement of Operations.
| (7) | | Investments in Affiliated Issuers |
An affiliated issuer may be considered one in which the fund owns 5% or more of the outstanding voting securities, or a company which is under common control. For the purposes of this report, the following were affiliated issuers:
| | | | | | | | | | | | | | | | | | | | | | | | |
| Affiliated Issuers | | Beginning
Value | | | Purchases | | | Sales
Proceeds | | | Realized
Gain
(Loss) | | | Change in
Unrealized
Appreciation or
Depreciation | | | Ending
Value | |
| MFS Institutional Money Market Portfolio | | | $11,859,653 | | | | $35,418,694 | | | | $39,521,699 | | | | $(2,492 | ) | | | $639 | | | | $7,754,795 | |
| | | | | | |
| Affiliated Issuers | | | | | | | | | | | | | | Dividend
Income | | | Capital Gain
Distributions | |
| MFS Institutional Money Market Portfolio | | | | | | | | | | | | $55,383 | | | | $— | |
The pandemic related to the global spread of novel coronavirus disease (COVID-19), which was first detected in December 2019, has resulted in significant disruptions to global business activity and the global economy, as well as the economies of individual countries, the financial performance of individual companies and sectors, and the securities and commodities markets in general. This pandemic, the full effects of which are still unknown, has resulted in substantial market volatility and may have adversely impacted the prices and liquidity of the fund’s investments and the fund’s performance.
15
MFS Investors Trust Series
STATEMENT REGARDING LIQUIDITY RISK MANAGEMENT PROGRAM
The fund has adopted and implemented a liquidity risk management program (the “Program”) as required by Rule 22e-4 under the Investment Company Act of 1940, as amended. The fund’s Board of Trustees (the “Board”) has designated MFS as the administrator of the Program. The Program is reasonably designed to assess and manage the liquidity risk of the fund. Liquidity risk is the risk that the fund could not meet requests to redeem shares issued by the fund without significant dilution of remaining investors’ interests.
MFS provided a written report to the Board for consideration at its April 2020 meeting that addressed the operation of the Program and provided an assessment of the adequacy and effectiveness of the Program during the period from the adoption of the Program on December 1, 2018 to December 31, 2019 (the “Covered Period”). The report concluded that during the Covered Period the Program had operated effectively and had adequately and effectively been implemented to assess and manage the fund’s liquidity risk. MFS also reported that there were no liquidity events that impacted the fund or its ability to timely meet redemptions without dilution to existing shareholders during the Covered Period.
There can be no assurance that the Program will achieve its objectives in the future. Further information on liquidity risk, and other principal risks to which an investment in the fund may be subject, can be found in the prospectus.
16
MFS Investors Trust Series
PROXY VOTING POLICIES AND INFORMATION
MFS votes proxies on behalf of the fund pursuant to proxy voting policies and procedures that are available without charge, upon request, by calling 1-800-225-2606, by visiting mfs.com/proxyvoting, or by visiting the SEC’s Web site at http://www.sec.gov.
Information regarding how the fund voted proxies relating to portfolio securities during the most recent twelve-month period ended June 30 is available by August 31 of each year without charge by visiting mfs.com/proxyvoting, or by visiting the SEC’s Web site at http://www.sec.gov.
QUARTERLY PORTFOLIO DISCLOSURE
The fund files a complete schedule of portfolio holdings with the SEC for the first and third quarters of each fiscal year as an exhibit to its reports on Form N-PORT. The fund’s Form N-PORT reports are available on the SEC’s website at http://www.sec.gov. A shareholder can obtain the portfolio holdings report for the first and third quarters of the fund’s fiscal year at mfs.com/vit1 by choosing the fund’s name and then selecting the “Resources” tab and clicking on “Prospectus and Reports”.
FURTHER INFORMATION
From time to time, MFS may post important information about the fund or the MFS funds on the MFS web site (mfs.com). This information is available at https://www.mfs.com/announcements or at mfs.com/vit1 by choosing the fund’s name and then selecting the “Resources” tab and clicking on the “Announcements” tab, if any.
INFORMATION ABOUT FUND CONTRACTS AND LEGAL CLAIMS
The fund has entered into contractual arrangements with an investment adviser, administrator, distributor, shareholder servicing agent, 529 program manager (if applicable), and custodian who each provide services to the fund. Unless expressly stated otherwise, shareholders are not parties to, or intended beneficiaries of these contractual arrangements, and these contractual arrangements are not intended to create any shareholder right to enforce them against the service providers or to seek any remedy under them against the service providers, either directly or on behalf of the fund.
Under the Trust’s By-Laws and Declaration of Trust, any claims asserted against or on behalf of the MFS Funds, including claims against Trustees and Officers, must be brought in state and federal courts located within the Commonwealth of Massachusetts.
17
Semiannual Report
June 30, 2020

MFS® Mid Cap Growth Series

MFS® Variable Insurance Trust
Beginning on January 1, 2021, as permitted by regulations adopted by the U.S. Securities and Exchange Commission, the insurance company that offers your contract may determine that it will no longer send you paper copies of the fund’s annual and semiannual shareholder reports unless you specifically request paper copies from the insurance company or from your financial intermediary. Instead, the shareholder reports will be made available on a Web site (insurancefunds.mfs.com or other Web site of which you will be notified), and the insurance company will notify you by mail each time a report is posted and provide you with a Web site link to access the report. Instructions for requesting paper copies will be provided by your insurance company or financial intermediary.
If you already elected to receive shareholder reports by email, you will not be affected by this change and you need not take any action. If your insurance company or financial intermediary offers electronic delivery, you may elect to receive shareholder reports and other communications from the insurance company or financial intermediary by email by following the instructions provided by the insurance company or financial intermediary.
Beginning on January 1, 2019, you may elect to receive all future reports in paper free of charge from the insurance company or financial intermediary. You can inform the insurance company or financial intermediary that you wish to continue receiving paper copies of your shareholder reports by contacting your insurance company or financial intermediary. Your election to receive reports in paper will apply to all funds held in your account with your insurance company or financial intermediary.
VMG-SEM
MFS® Mid Cap Growth Series
CONTENTS
The report is prepared for the general information of contract owners. It is authorized for distribution to prospective investors only when preceded or accompanied by a current prospectus.
NOT FDIC INSURED • MAY LOSE VALUE • NO BANK OR CREDIT UNION GUARANTEE • NOT A DEPOSIT • NOT INSURED BY ANY FEDERAL GOVERNMENT AGENCY OR NCUA/NCUSIF
MFS Mid Cap Growth Series
LETTER FROM THE EXECUTIVE CHAIR

Dear Contract Owners:
Markets experienced dramatic swings in early 2020, as the coronavirus pandemic brought the global economy to a standstill for several months. Optimism over the development of vaccines and therapeutics, along with a decline in cases in countries that had been affected by the outbreak early on, brightened the economic and market outlook during the second quarter, as did the phased reopening of US states. However, a great deal of uncertainty remains, including the possibility of a second wave of cases later this year, as many countries continue to experience COVID-19 flare-ups.
Global central banks have taken aggressive steps to cushion the economic and market fallout related to the virus, and governments are deploying unprecedented levels of fiscal support. As uncertainty recedes, these measures can help build a supportive environment and encourage economic recovery; however, if markets disconnect from fundamentals, they can also sow the seeds of instability. In the aftermath of the crisis, societal changes may be likely, as households, businesses, and governments adjust to a new reality, and these alterations could affect the investment landscape. For investors, events, such as the COVID-19 outbreak, demonstrate the importance of having a deep understanding of company fundamentals, and we have built our global research platform to do just that.
Here at MFS®, we aim to help our clients navigate the growing complexity of the markets and world economies. Our long-term investment philosophy and commitment to the responsible allocation of capital allow us to tune out the noise and uncover what we believe are the best, most durable investment opportunities in the market. Through our unique global investment platform, we combine collective expertise, thoughtful risk management, and long-term discipline to create sustainable value for investors.
Respectfully,

Robert J. Manning
Executive Chair
MFS Investment Management
August 17, 2020
The opinions expressed in this letter are subject to change, may not be relied upon for investment advice, and no forecasts can be guaranteed.
1
MFS Mid Cap Growth Series
PORTFOLIO COMPOSITION
Portfolio structure
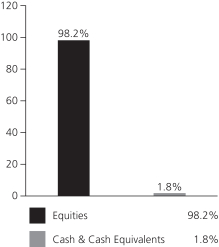
| | | | |
| Top ten holdings | | | | |
| Cadence Design Systems, Inc. | | | 2.8% | |
| Global Payments, Inc. | | | 2.8% | |
| Bright Horizons Family Solutions, Inc. | | | 2.3% | |
| Verisk Analytics, Inc., “A” | | | 2.2% | |
| Autodesk, Inc. | | | 2.2% | |
| MSCI, Inc. | | | 2.2% | |
| Monolithic Power Systems, Inc. | | | 2.2% | |
| PerkinElmer, Inc. | | | 2.2% | |
| SBA Communications Corp., REIT | | | 2.1% | |
| Take-Two Interactive Software, Inc. | | | 2.0% | |
| | | | |
| GICS equity sectors (g) | | | | |
| Information Technology | | | 30.6% | |
| Industrials | | | 18.3% | |
| Health Care | | | 17.5% | |
| Consumer Discretionary | | | 12.5% | |
| Financials | | | 7.3% | |
| Communication Services | | | 5.7% | |
| Real Estate | | | 3.4% | |
| Materials | | | 2.9% | |
| (g) | The Global Industry Classification Standard (GICS®) was developed by and/or is the exclusive property of MSCI, Inc. and S&P Global Market Intelligence Inc. (“S&P Global Market Intelligence”). GICS is a service mark of MSCI and S&P Global Market Intelligence and has been licensed for use by MFS. |
Cash & Cash Equivalents includes any cash, investments in money market funds, short-term securities, and other assets less liabilities. Please see the Statement of Assets and Liabilities for additional information related to the fund’s cash position and other assets and liabilities.
Percentages are based on net assets as of June 30, 2020.
The portfolio is actively managed and current holdings may be different.
2
MFS Mid Cap Growth Series
EXPENSE TABLE
Fund Expenses Borne by the Contract Holders during the Period,
January 1, 2020 through June 30, 2020
As a contract holder of the fund, you incur ongoing costs, including management fees; distribution and/or service (12b-1) fees; and other fund expenses. This example is intended to help you understand your ongoing costs (in dollars) of investing in the fund and to compare these costs with the ongoing costs of investing in other mutual funds.
The example is based on an investment of $1,000 invested at the beginning of the period and held for the entire period January 1, 2020 through June 30, 2020.
Actual Expenses
The first line for each share class in the following table provides information about actual account values and actual expenses. You may use the information in this line, together with the amount you invested, to estimate the expenses that you paid over the period. Simply divide your account value by $1,000 (for example, an $8,600 account value divided by $1,000 = 8.6), then multiply the result by the number in the first line under the heading entitled “Expenses Paid During Period” to estimate the expenses you paid on your account during this period.
Hypothetical Example for Comparison Purposes
The second line for each share class in the following table provides information about hypothetical account values and hypothetical expenses based on the fund’s actual expense ratio and an assumed rate of return of 5% per year before expenses, which is not the fund’s actual return. The hypothetical account values and expenses may not be used to estimate the actual ending account balance or expenses you paid for the period. You may use this information to compare the ongoing costs of investing in the fund and other funds. To do so, compare this 5% hypothetical example with the 5% hypothetical examples that appear in the shareholder reports of the other funds.
Please note that the expenses shown in the table are meant to highlight the fund’s ongoing costs only and do not take into account the fees and expenses imposed under the variable contracts through which your investment in the fund is made. Therefore, the second line for each share class in the table is useful in comparing ongoing costs associated with an investment in vehicles (such as the fund) which fund benefits under variable annuity and variable life insurance contracts and to qualified pension and retirement plans only, and will not help you determine the relative total costs of investing in the fund through variable annuity and variable life insurance contracts. If the fees and expenses imposed under the variable contracts were included, your costs would have been higher.
| | | | | | | | | | | | | | | | | | |
| Share Class | | | | Annualized
Expense Ratio | | | Beginning
Account Value
1/01/20 | | | Ending
Account Value
6/30/20 | | | Expenses Paid
During Period (p)
1/01/20-6/30/20 | |
| Initial Class | | Actual | | | 0.80% | | | | $1,000.00 | | | | $1,061.25 | | | | $4.10 | |
| | Hypothetical (h) | | | 0.80% | | | | $1,000.00 | | | | $1,020.89 | | | | $4.02 | |
| Service Class | | Actual | | | 1.05% | | | | $1,000.00 | | | | $1,059.98 | | | | $5.38 | |
| | Hypothetical (h) | | | 1.05% | | | | $1,000.00 | | | | $1,019.64 | | | | $5.27 | |
| (h) | 5% class return per year before expenses. |
| (p) | “Expenses Paid During Period” are equal to each class’s annualized expense ratio, as shown above, multiplied by the average account value over the period, multiplied by 182/366 (to reflect the one-half year period). |
3
MFS Mid Cap Growth Series
PORTFOLIO OF INVESTMENTS – 6/30/20 (unaudited)
The Portfolio of Investments is a complete list of all securities owned by your fund. It is categorized by broad-based asset classes.
| | | | | | | | |
| Issuer | | Shares/Par | | | Value ($) | |
| COMMON STOCKS – 98.2% | | | | | | | | |
| Automotive – 1.6% | | | | | |
| Copart, Inc. (a) | | | 72,434 | | | $ | 6,031,579 | |
| | | | | | | | |
| Biotechnology – 2.4% | | | | | |
| Adaptive Biotechnologies Corp. (a) | | | 45,693 | | | $ | 2,210,627 | |
| Alnylam Pharmaceuticals, Inc. (a) | | | 14,854 | | | | 2,200,026 | |
| Exelixis, Inc. (a) | | | 68,490 | | | | 1,625,953 | |
| Seattle Genetics, Inc. (a) | | | 18,052 | | | | 3,067,396 | |
| | | | | | | | |
| | | | | | $ | 9,104,002 | |
| | | | | | | | |
| Brokerage & Asset Managers – 3.0% | | | | | |
| Apollo Global Management, Inc. | | | 45,506 | | | $ | 2,271,660 | |
| NASDAQ, Inc. | | | 58,001 | | | | 6,929,379 | |
| Tradeweb Markets, Inc. | | | 36,708 | | | | 2,134,203 | |
| | | | | | | | |
| | | | | | $ | 11,335,242 | |
| | | | | | | | |
| Business Services – 17.5% | | | | | | | | |
| Clarivate PLC (a) | | | 295,838 | | | $ | 6,606,062 | |
| CoStar Group, Inc. (a) | | | 7,730 | | | | 5,493,479 | |
| Equifax, Inc. | | | 21,220 | | | | 3,647,294 | |
| Fidelity National Information Services, Inc. | | | 49,746 | | | | 6,670,441 | |
| Fiserv, Inc. (a) | | | 48,256 | | | | 4,710,751 | |
| Global Payments, Inc. | | | 61,622 | | | | 10,452,324 | |
| IHS Markit Ltd. | | | 95,017 | | | | 7,173,783 | |
| MSCI, Inc. | | | 24,663 | | | | 8,233,003 | |
| Tyler Technologies, Inc. (a) | | | 14,614 | | | | 5,069,304 | |
| Verisk Analytics, Inc., “A” | | | 49,469 | | | | 8,419,624 | |
| | | | | | | | |
| | | | | | $ | 66,476,065 | |
| | | | | | | | |
| Cable TV – 0.4% | | | | | | | | |
| Altice USA, Inc., “A” (a) | | | 73,483 | | | $ | 1,656,307 | |
| | | | | | | | |
| Computer Software – 11.7% | | | | | | | | |
| Autodesk, Inc. (a) | | | 34,969 | | | $ | 8,364,235 | |
| Black Knight, Inc. (a) | | | 67,375 | | | | 4,888,730 | |
| Cadence Design Systems, Inc. (a) | | | 110,943 | | | | 10,646,090 | |
| Coupa Software, Inc. (a) | | | 14,032 | | | | 3,887,425 | |
| DocuSign, Inc. (a) | | | 14,609 | | | | 2,515,816 | |
| Everbridge, Inc. (a) | | | 17,462 | | | | 2,416,042 | |
| Livongo Health, Inc. (a) | | | 15,945 | | | | 1,198,905 | |
| Okta, Inc. (a) | | | 17,317 | | | | 3,467,383 | |
| Paylocity Holding Corp. (a) | | | 12,348 | | | | 1,801,450 | |
| RingCentral, Inc. (a) | | | 9,014 | | | | 2,569,080 | |
| Synopsys, Inc. (a) | | | 13,606 | | | | 2,653,170 | |
| | | | | | | | |
| | | | | | $ | 44,408,326 | |
| | | | | | | | |
| Computer Software – Systems – 9.2% | | | | | |
| Constellation Software, Inc. | | | 3,538 | | | $ | 3,994,818 | |
| Guidewire Software, Inc. (a) | | | 29,836 | | | | 3,307,321 | |
| NICE Systems Ltd., ADR (a) | | | 30,732 | | | | 5,815,724 | |
| ServiceNow, Inc. (a) | | | 16,998 | | | | 6,885,210 | |
| Square, Inc., “A” (a) | | | 28,422 | | | | 2,982,605 | |
| SS&C Technologies Holdings, Inc. | | | 43,372 | | | | 2,449,650 | |
| TransUnion | | | 69,628 | | | | 6,060,421 | |
| Wix.com Ltd. (a) | | | 12,548 | | | | 3,215,048 | |
| | | | | | | | |
| | | | | | $ | 34,710,797 | |
| | | | | | | | |
| | | | | | | | |
| Issuer | | Shares/Par | | | Value ($) | |
| COMMON STOCKS – continued | | | | | |
| Construction – 3.0% | | | | | |
| AZEK Co. LLC (a) | | | 7,377 | | | $ | 235,031 | |
| Lennox International, Inc. | | | 15,373 | | | | 3,581,755 | |
| Pool Corp. | | | 11,105 | | | | 3,019,117 | |
| Vulcan Materials Co. | | | 38,941 | | | | 4,511,315 | |
| | | | | | | | |
| | | | | | $ | 11,347,218 | |
| | | | | | | | |
| Consumer Products – 1.0% | | | | | | | | |
| Scotts Miracle-Gro Co. | | | 28,926 | | | $ | 3,889,679 | |
| | | | | | | | |
| Consumer Services – 2.9% | | | | | | | | |
| Bright Horizons Family Solutions, Inc. (a) | | | 75,640 | | | $ | 8,865,008 | |
| Peloton Interactive, Inc., “A” (a) | | | 34,646 | | | | 2,001,499 | |
| | | | | | | | |
| | | | | | $ | 10,866,507 | |
| | | | | | | | |
| Electrical Equipment – 2.7% | | | | | | | | |
| AMETEK, Inc. | | | 74,264 | | | $ | 6,636,974 | |
| Amphenol Corp., “A” | | | 23,478 | | | | 2,249,427 | |
| Littlefuse, Inc. | | | 8,261 | | | | 1,409,574 | |
| | | | | | | | |
| | | | | | $ | 10,295,975 | |
| | | | | | | | |
| Electronics – 3.5% | | | | | | | | |
| ASM International N.V. | | | 8,355 | | | $ | 1,291,160 | |
| Entegris, Inc. | | | 24,842 | | | | 1,466,920 | |
| MKS Instruments, Inc. | | | 10,101 | | | | 1,143,837 | |
| Monolithic Power Systems, Inc. | | | 34,626 | | | | 8,206,362 | |
| Silicon Laboratories, Inc. (a) | | | 12,862 | | | | 1,289,673 | |
| | | | | | | | |
| | | | | | $ | 13,397,952 | |
| | | | | | | | |
| Food & Beverages – 0.7% | | | | | | | | |
| Chr. Hansen Holding A.S. | | | 24,651 | | | $ | 2,542,222 | |
| | | | | | | | |
| Gaming & Lodging – 0.3% | | | | | | | | |
| Vail Resorts, Inc. | | | 5,586 | | | $ | 1,017,490 | |
| | | | | | | | |
| General Merchandise – 0.5% | | | | | | | | |
| Dollar Tree, Inc. (a) | | | 13,359 | | | $ | 1,238,112 | |
| Five Below, Inc. (a) | | | 4,846 | | | | 518,086 | |
| | | | | | | | |
| | | | | | $ | 1,756,198 | |
| | | | | | | | |
| Insurance – 1.7% | | | | | | | | |
| Arthur J. Gallagher & Co. | | | 67,652 | | | $ | 6,595,393 | |
| | | | | | | | |
| Internet – 2.5% | | | | | | | | |
| DraftKings, Inc. (a) | | | 17,907 | | | $ | 595,587 | |
| IAC/InterActiveCorp (a) | | | 16,420 | | | | 5,310,228 | |
| Match Group, Inc. (a)(l) | | | 33,190 | | | | 3,552,989 | |
| | | | | | | | |
| | | | | | $ | 9,458,804 | |
| | | | | | | | |
| Leisure & Toys – 2.7% | | | | | | | | |
| Electronic Arts, Inc. (a) | | | 18,481 | | | $ | 2,440,416 | |
| Take-Two Interactive Software, Inc. (a) | | | 54,891 | | | | 7,661,137 | |
| | | | | | | | |
| | | | | | $ | 10,101,553 | |
| | | | | | | | |
| Machinery & Tools – 1.9% | | | | | | | | |
| IDEX Corp. | | | 4,663 | | | $ | 736,941 | |
| Roper Technologies, Inc. | | | 16,259 | | | | 6,312,719 | |
| | | | | | | | |
| | | | | | $ | 7,049,660 | |
| | | | | | | | |
4
MFS Mid Cap Growth Series
Portfolio of Investments (unaudited) – continued
| | | | | | | | |
| Issuer | | Shares/Par | | | Value ($) | |
| COMMON STOCKS – continued | |
| Medical & Health Technology & Services – 3.7% | |
| Charles River Laboratories International, Inc. (a) | | | 19,196 | | | $ | 3,346,823 | |
| Guardant Health, Inc. (a) | | | 20,234 | | | | 1,641,584 | |
| ICON PLC (a) | | | 29,887 | | | | 5,034,764 | |
| IDEXX Laboratories, Inc. (a) | | | 7,266 | | | | 2,398,943 | |
| PRA Health Sciences, Inc. (a) | | | 7,553 | | | | 734,831 | |
| Quest Diagnostics, Inc. | | | 6,490 | | | | 739,600 | |
| | | | | | | | |
| | | | | | $ | 13,896,545 | |
| | | | | | | | |
| Medical Equipment – 11.0% | | | | | | | | |
| Agilent Technologies, Inc. | | | 23,235 | | | $ | 2,053,277 | |
| Align Technology, Inc. (a) | | | 2,710 | | | | 743,732 | |
| Bio-Techne Corp. | | | 20,811 | | | | 5,495,561 | |
| Cooper Cos., Inc. | | | 6,558 | | | | 1,860,111 | |
| DexCom, Inc. (a) | | | 10,901 | | | | 4,419,266 | |
| Masimo Corp. (a) | | | 29,605 | | | | 6,749,644 | |
| Mettler-Toledo International, Inc. (a) | | | 2,136 | | | | 1,720,655 | |
| PerkinElmer, Inc. | | | 83,134 | | | | 8,154,614 | |
| STERIS PLC | | | 47,896 | | | | 7,349,162 | |
| West Pharmaceutical Services, Inc. | | | 14,558 | | | | 3,307,141 | |
| | | | | | | | |
| | | | | | $ | 41,853,163 | |
| | | | | | | | |
| Network & Telecom – 1.0% | | | | | | | | |
| CoreSite Realty Corp. | | | 29,875 | | | $ | 3,616,668 | |
| | | | | | | | |
| Other Banks & Diversified Financials – 0.4% | |
| First Republic Bank | | | 15,132 | | | $ | 1,603,841 | |
| | | | | | | | |
| Printing & Publishing – 1.6% | | | | | | | | |
| Warner Music Group Corp. (a) | | | 37,658 | | | $ | 1,110,911 | |
| Wolters Kluwer N.V. | | | 65,399 | | | | 5,108,034 | |
| | | | | | | | |
| | | | | | $ | 6,218,945 | |
| | | | | | | | |
| Railroad & Shipping – 0.9% | | | | | | | | |
| Kansas City Southern Co. | | | 21,886 | | | $ | 3,267,361 | |
| | | | | | | | |
| Real Estate – 0.3% | | | | | | | | |
| Extra Space Storage, Inc., REIT | | | 13,954 | | | $ | 1,288,931 | |
| | | | | | | | |
| Restaurants – 3.1% | | | | | | | | |
| Chipotle Mexican Grill, Inc., “A” (a) | | | 5,677 | | | $ | 5,974,247 | |
| Domino’s Pizza, Inc. | | | 8,413 | | | | 3,108,099 | |
| Dunkin Brands Group, Inc. | | | 38,239 | | | | 2,494,330 | |
| | | | | | | | |
| | | | | | $ | 11,576,676 | |
| | | | | | | | |
| | | | | | | | |
| Issuer | | Shares/Par | | | Value ($) | |
| COMMON STOCKS – continued | | | | | | | | |
| Specialty Stores – 4.9% | | | | | | | | |
| Burlington Stores, Inc. (a) | | | 17,778 | | | $ | 3,501,022 | |
| Chewy, Inc., “A” (a) | | | 42,825 | | | | 1,913,849 | |
| Lululemon Athletica, Inc. (a) | | | 17,590 | | | | 5,488,256 | |
| O’Reilly Automotive, Inc. (a) | | | 8,925 | | | | 3,763,405 | |
| Tractor Supply Co. | | | 29,089 | | | | 3,833,639 | |
| | | | | | | | |
| | | | | | $ | 18,500,171 | |
| | | | | | | | |
| Telecommunications – Wireless – 2.1% | | | | | |
| SBA Communications Corp., REIT | | | 27,194 | | | $ | 8,101,636 | |
| | | | | | | | |
Total Common Stocks
(Identified Cost, $190,792,434) | | | | | | $ | 371,964,906 | |
| | | | | | | | |
|
| INVESTMENT COMPANIES (h) – 2.1% | |
| Money Market Funds – 2.1% | | | | | | | | |
| MFS Institutional Money Market Portfolio, 0.17% (v) (Identified Cost, $7,789,668) | | | 7,788,890 | | | $ | 7,789,668 | |
| | | | | | | | |
|
| COLLATERAL FOR SECURITIES LOANED – 0.4% | |
| State Street Navigator Securities Lending Government Money Market Portfolio, 0.13% (j) (Identified Cost, $1,562,805) | | | 1,562,805 | | | $ | 1,562,805 | |
| | | | | | | | |
OTHER ASSETS, LESS
LIABILITIES – (0.7)% | | | | | | | (2,549,204 | ) |
| | | | | | | | |
| NET ASSETS – 100.0% | | | | | | $ | 378,768,175 | |
| | | | | | | | |
| (a) | | Non-income producing security. |
| (h) | | An affiliated issuer, which may be considered one in which the fund owns 5% or more of the outstanding voting securities, or a company which is under common control. At period end, the aggregate values of the fund’s investments in affiliated issuers and in unaffiliated issuers were $7,789,668 and $373,527,711, respectively. |
| (j) | | The rate quoted is the annualized seven-day yield of the fund at period end. |
| (l) | | A portion of this security is on loan. See Note 2 for additional information. |
| (v) | | Affiliated issuer that is available only to investment companies managed by MFS. The rate quoted for the MFS Institutional Money Market Portfolio is the annualized seven-day yield of the fund at period end. |
The following abbreviations are used in this report and are defined:
| ADR | | American Depositary Receipt |
| REIT | | Real Estate Investment Trust |
See Notes to Financial Statements
5
MFS Mid Cap Growth Series
FINANCIAL STATEMENTS | STATEMENT OF ASSETS AND LIABILITIES (unaudited)
This statement represents your fund’s balance sheet, which details the assets and liabilities comprising the total value of the fund.
| | | | |
At 6/30/20 | | | | |
| |
Assets | | | | |
Investments in unaffiliated issuers, at value, including $1,545,481 of securities on loan (identified cost, $192,355,239) | | | $373,527,711 | |
Investments in affiliated issuers, at value (identified cost, $7,789,668) | | | 7,789,668 | |
Cash | | | 352,097 | |
Receivables for | | | | |
Investments sold | | | 4,535,757 | |
Fund shares sold | | | 160,783 | |
Interest and dividends | | | 155,486 | |
Other assets | | | 1,028 | |
Total assets | | | $386,522,530 | |
| |
Liabilities | | | | |
Payables for | | | | |
Investments purchased | | | $4,868,044 | |
Fund shares reacquired | | | 1,234,019 | |
Collateral for securities loaned, at value | | | 1,562,805 | |
Payable to affiliates | | | | |
Investment adviser | | | 14,994 | |
Administrative services fee | | | 340 | |
Shareholder servicing costs | | | 434 | |
Distribution and/or service fees | | | 1,403 | |
Accrued expenses and other liabilities | | | 72,316 | |
Total liabilities | | | $7,754,355 | |
Net assets | | | $378,768,175 | |
| |
Net assets consist of | | | | |
Paid-in capital | | | $134,283,938 | |
Total distributable earnings (loss) | | | 244,484,237 | |
Net assets | | | $378,768,175 | |
Shares of beneficial interest outstanding | | | 36,703,812 | |
| | | | | | | | | | | | |
| | | |
| | | Net assets | | | Shares
outstanding | | | Net asset value
per share | |
Initial Class | | | $274,574,284 | | | | 25,985,377 | | | | $10.57 | |
Service Class | | | 104,193,891 | | | | 10,718,435 | | | | 9.72 | |
See Notes to Financial Statements
6
MFS Mid Cap Growth Series
FINANCIAL STATEMENTS | STATEMENT OF OPERATIONS (unaudited)
This statement describes how much your fund earned in investment income and accrued in expenses. It also describes any gains and/or losses generated by fund operations.
| | | | |
Six months ended 6/30/20 | | | | |
| |
Net investment income (loss) | | | | |
Income | | | | |
Dividends | | | $1,052,391 | |
Income on securities loaned | | | 69,235 | |
Dividends from affiliated issuers | | | 23,328 | |
Other | | | 6,482 | |
Foreign taxes withheld | | | (10,151 | ) |
Total investment income | | | $1,141,285 | |
Expenses | | | | |
Management fee | | | $1,382,594 | |
Distribution and/or service fees | | | 123,182 | |
Shareholder servicing costs | | | 7,843 | |
Administrative services fee | | | 30,422 | |
Independent Trustees’ compensation | | | 4,505 | |
Custodian fee | | | 10,779 | |
Shareholder communications | | | 12,246 | |
Audit and tax fees | | | 29,409 | |
Legal fees | | | 1,754 | |
Miscellaneous | | | 13,530 | |
Total expenses | | | $1,616,264 | |
Reduction of expenses by investment adviser | | | (19,876 | ) |
Net expenses | | | $1,596,388 | |
Net investment income (loss) | | | $(455,103 | ) |
| |
Realized and unrealized gain (loss) | | | | |
Realized gain (loss) (identified cost basis) | | | | |
Unaffiliated issuers | | | $34,482,841 | |
Affiliated issuers | | | (1,433 | ) |
Foreign currency | | | 8,004 | |
Net realized gain (loss) | | | $34,489,412 | |
Change in unrealized appreciation or depreciation | | | | |
Unaffiliated issuers | | | $(10,032,664 | ) |
Affiliated issuers | | | 55 | |
Translation of assets and liabilities in foreign currencies | | | (161 | ) |
Net unrealized gain (loss) | | | $(10,032,770 | ) |
Net realized and unrealized gain (loss) | | | $24,456,642 | |
Change in net assets from operations | | | $24,001,539 | |
See Notes to Financial Statements
7
MFS Mid Cap Growth Series
FINANCIAL STATEMENTS | STATEMENTS OF CHANGES IN NET ASSETS
These statements describe the increases and/or decreases in net assets resulting from operations, any distributions, and any shareholder transactions.
| | | | | | | | |
| | | Six months ended
6/30/20 | | | Year ended
12/31/19 | |
| | | (unaudited) | | | | |
Change in net assets | | | | | | | | |
| | |
From operations | | | | | | | | |
Net investment income (loss) | | | $(455,103 | ) | | | $(496,978 | ) |
Net realized gain (loss) | | | 34,489,412 | | | | 30,021,306 | |
Net unrealized gain (loss) | | | (10,032,770 | ) | | | 91,391,474 | |
Change in net assets from operations | | | $24,001,539 | | | | $120,915,802 | |
Total distributions to shareholders | | | $— | | | | $(49,459,422 | ) |
Change in net assets from fund share transactions | | | $(39,250,039 | ) | | | $(11,612,994 | ) |
Total change in net assets | | | $(15,248,500 | ) | | | $59,843,386 | |
| | |
Net assets | | | | | | | | |
At beginning of period | | | 394,016,675 | | | | 334,173,289 | |
At end of period | | | $378,768,175 | | | | $394,016,675 | |
See Notes to Financial Statements
8
MFS Mid Cap Growth Series
FINANCIAL STATEMENTS | FINANCIAL HIGHLIGHTS
The financial highlights table is intended to help you understand the fund’s financial performance for the semiannual period and the past 5 fiscal years. Certain information reflects financial results for a single fund share. The total returns in the table represent the rate that an investor would have earned (or lost) on an investment in the fund share class (assuming reinvestment of all distributions) held for the entire period.
| | | | | | | | | | | | | | | | | | | | | | | | |
| Initial Class | | Six months
ended 6/30/20 | | | Year ended | |
| | | 12/31/19 | | | 12/31/18 | | | 12/31/17 | | | 12/31/16 | | | 12/31/15 | |
| | | | | | |
| | | (unaudited) | | | | | | | | | | | | | | | | |
| | | | | | |
Net asset value, beginning of period | | | $9.96 | | | | $8.23 | | | | $9.51 | | | | $7.96 | | | | $8.21 | | | | $8.76 | |
|
| Income (loss) from investment operations | |
Net investment income (loss) (d) | | | $(0.01 | ) | | | $(0.01 | ) | | | $(0.02 | ) | | | $(0.01 | ) | | | $0.01 | (c) | | | $(0.03 | ) |
Net realized and unrealized gain (loss) | | | 0.62 | | | | 3.10 | | | | 0.39 | | | | 2.11 | | | | 0.41 | | | | 0.39 | |
Total from investment operations | | | $0.61 | | | | $3.09 | | | | $0.37 | | | | $2.10 | | | | $0.42 | | | | $0.36 | |
|
| Less distributions declared to shareholders | |
From net investment income | | | $— | | | | $— | | | | $— | | | | $(0.01 | ) | | | $— | | | | $— | |
From net realized gain | | | — | | | | (1.36 | ) | | | (1.65 | ) | | | (0.54 | ) | | | (0.67 | ) | | | (0.91 | ) |
Total distributions declared to shareholders | | | $— | | | | $(1.36 | ) | | | $(1.65 | ) | | | $(0.55 | ) | | | $(0.67 | ) | | | $(0.91 | ) |
Net asset value, end of period (x) | | | $10.57 | | | | $9.96 | | | | $8.23 | | | | $9.51 | | | | $7.96 | | | | $8.21 | |
Total return (%) (k)(r)(s)(x) | | | 6.12 | (n) | | | 38.66 | | | | 1.24 | | | | 27.00 | | | | 4.91 | (c) | | | 4.61 | |
|
Ratios (%) (to average net assets)
and Supplemental data: | |
Expenses before expense reductions (f) | | | 0.81 | (a) | | | 0.81 | | | | 0.81 | | | | 0.81 | | | | 0.75 | (c) | | | 0.81 | |
Expenses after expense reductions (f) | | | 0.80 | (a) | | | 0.80 | | | | 0.80 | | | | 0.80 | | | | 0.74 | (c) | | | 0.80 | |
Net investment income (loss) | | | (0.18 | )(a) | | | (0.07 | ) | | | (0.18 | ) | | | (0.15 | ) | | | 0.15 | (c) | | | (0.33 | ) |
Portfolio turnover | | | 21 | (n) | | | 17 | | | | 21 | | | | 32 | | | | 37 | | | | 37 | |
Net assets at end of period (000 omitted) | | | $274,574 | | | | $290,512 | | | | $247,614 | | | | $297,463 | | | | $294,226 | | | | $324,754 | |
| | |
| Service Class | | Six months
ended 6/30/20 | | | Year ended | |
| | | 12/31/19 | | | 12/31/18 | | | 12/31/17 | | | 12/31/16 | | | 12/31/15 | |
| | | | | | |
| | | (unaudited) | | | | | | | | | | | | | | | | |
| | | | | | |
Net asset value, beginning of period | | | $9.17 | | | | $7.68 | | | | $8.99 | | | | $7.56 | | | | $7.85 | | | | $8.43 | |
|
| Income (loss) from investment operations | |
Net investment income (loss) (d) | | | $(0.02 | ) | | | $(0.03 | ) | | | $(0.04 | ) | | | $(0.03 | ) | | | $(0.01 | )(c) | | | $(0.05 | ) |
Net realized and unrealized gain (loss) | | | 0.57 | | | | 2.88 | | | | 0.38 | | | | 2.00 | | | | 0.39 | | | | 0.38 | |
Total from investment operations | | | $0.55 | | | | $2.85 | | | | $0.34 | | | | $1.97 | | | | $0.38 | | | | $0.33 | |
|
| Less distributions declared to shareholders | |
From net investment income | | | $— | | | | $— | | | | $— | | | | $— | | | | $— | | | | $— | |
From net realized gain | | | — | | | | (1.36 | ) | | | (1.65 | ) | | | (0.54 | ) | | | (0.67 | ) | | | (0.91 | ) |
Total distributions declared to shareholders | | | $— | | | | $(1.36 | ) | | | $(1.65 | ) | | | $(0.54 | ) | | | $(0.67 | ) | | | $(0.91 | ) |
Net asset value, end of period (x) | | | $9.72 | | | | $9.17 | | | | $7.68 | | | | $8.99 | | | | $7.56 | | | | $7.85 | |
Total return (%) (k)(r)(s)(x) | | | 6.00 | (n) | | | 38.28 | | | | 0.95 | | | | 26.68 | | | | 4.62 | (c) | | | 4.43 | |
|
Ratios (%) (to average net assets)
and Supplemental data: | |
Expenses before expense reductions (f) | | | 1.06 | (a) | | | 1.06 | | | | 1.06 | | | | 1.06 | | | | 0.99 | (c) | | | 1.06 | |
Expenses after expense reductions (f) | | | 1.05 | (a) | | | 1.05 | | | | 1.05 | | | | 1.05 | | | | 0.99 | (c) | | | 1.05 | |
Net investment income (loss) | | | (0.43 | )(a) | | | (0.32 | ) | | | (0.43 | ) | | | (0.40 | ) | | | (0.08 | )(c) | | | (0.57 | ) |
Portfolio turnover | �� | | 21 | (n) | | | 17 | | | | 21 | | | | 32 | | | | 37 | | | | 37 | |
Net assets at end of period (000 omitted) | | | $104,194 | | | | $103,504 | | | | $86,560 | | | | $100,052 | | | | $87,529 | | | | $87,008 | |
See Notes to Financial Statements
9
MFS Mid Cap Growth Series
Financial Highlights – continued
| (c) | Amount reflects a one-time reimbursement of expenses by the custodian (or former custodian) without which net investment income and performance would be lower and expenses would be higher. |
| (d) | Per share data is based on average shares outstanding. |
| (f) | Ratios do not reflect reductions from fees paid indirectly, if applicable. |
| (k) | The total return does not reflect expenses that apply to separate accounts. Inclusion of these charges would reduce the total return figures for all periods shown. |
| (r) | Certain expenses have been reduced without which performance would have been lower. |
| (s) | From time to time the fund may receive proceeds from litigation settlements, without which performance would be lower. |
| (x) | The net asset values and total returns have been calculated on net assets which include adjustments made in accordance with U.S. generally accepted accounting principles required at period end for financial reporting purposes. |
See Notes to Financial Statements
10
MFS Mid Cap Growth Series
NOTES TO FINANCIAL STATEMENTS (unaudited)
| (1) | | Business and Organization |
MFS Mid Cap Growth Series (the fund) is a diversified series of MFS Variable Insurance Trust (the trust). The trust is organized as a Massachusetts business trust and is registered under the Investment Company Act of 1940, as amended, as an open-end management investment company. The shareholders of each series of the trust are separate accounts of insurance companies, which offer variable annuity and/or life insurance products, and qualified retirement and pension plans.
The fund is an investment company and accordingly follows the investment company accounting and reporting guidance of the Financial Accounting Standards Board (FASB) Accounting Standards Codification Topic 946 Financial Services – Investment Companies.
| (2) | | Significant Accounting Policies |
General – The preparation of financial statements in conformity with U.S. generally accepted accounting principles requires management to make estimates and assumptions that affect the reported amounts of assets and liabilities, and disclosure of contingent assets and liabilities at the date of the financial statements and the reported amounts of increases and decreases in net assets from operations during the reporting period. Actual results could differ from those estimates. In the preparation of these financial statements, management has evaluated subsequent events occurring after the date of the fund’s Statement of Assets and Liabilities through the date that the financial statements were issued.
In March 2020, the FASB issued Accounting Standards Update 2020-04, Reference Rate Reform (Topic 848) – Facilitation of the Effects of Reference Rate Reform on Financial Reporting (“ASU 2020-04”), which provides optional, temporary relief with respect to the financial reporting of contracts subject to certain types of modifications due to the planned discontinuation of the London Interbank Offered Rate (LIBOR) and other IBOR-based reference rates as of the end of 2021. The temporary relief provided by ASU 2020-04 is effective for certain reference rate-related contract modifications that occur during the period from March 12, 2020 through December 31, 2022. Management is evaluating the impact of ASU 2020-04 on the fund’s investments, derivatives, debt and other contracts that will undergo reference rate-related modifications as a result of the reference rate reform.
Balance Sheet Offsetting – The fund’s accounting policy with respect to balance sheet offsetting is that, absent an event of default by the counterparty or a termination of the agreement, the International Swaps and Derivatives Association (ISDA) Master Agreement, or similar agreement, does not result in an offset of reported amounts of financial assets and financial liabilities in the Statement of Assets and Liabilities across transactions between the fund and the applicable counterparty. The fund’s right to setoff may be restricted or prohibited by the bankruptcy or insolvency laws of the particular jurisdiction to which a specific master netting agreement counterparty is subject. Balance sheet offsetting disclosures, to the extent applicable to the fund, have been included in the fund’s Significant Accounting Policies note under the captions for each of the fund’s in-scope financial instruments and transactions.
Investment Valuations – Equity securities, including restricted equity securities, are generally valued at the last sale or official closing price on their primary market or exchange as provided by a third-party pricing service. Equity securities, for which there were no sales reported that day, are generally valued at the last quoted daily bid quotation on their primary market or exchange as provided by a third-party pricing service. Short-term instruments with a maturity at issuance of 60 days or less may be valued at amortized cost, which approximates market value. Open-end investment companies are generally valued at net asset value per share. Securities and other assets generally valued on the basis of information from a third-party pricing service may also be valued at a broker/dealer bid quotation. In determining values, third-party pricing services can utilize both transaction data and market information such as yield, quality, coupon rate, maturity, type of issue, trading characteristics, and other market data. The values of foreign securities and other assets and liabilities expressed in foreign currencies are converted to U.S. dollars using the mean of bid and asked prices for rates provided by a third-party pricing service.
The Board of Trustees has delegated primary responsibility for determining or causing to be determined the value of the fund’s investments (including any fair valuation) to the adviser pursuant to valuation policies and procedures approved by the Board. If the adviser determines that reliable market quotations are not readily available, investments are valued at fair value as determined in good faith by the adviser in accordance with such procedures under the oversight of the Board of Trustees. Under the fund’s valuation policies and procedures, market quotations are not considered to be readily available for most types of debt instruments and floating rate loans and many types of derivatives. These investments are generally valued at fair value based on information from third-party pricing services. In addition, investments may be valued at fair value if the adviser determines that an investment’s value has been materially affected by events occurring after the close of the exchange or market on which the investment is principally traded (such as foreign exchange or market) and prior to the determination of the fund’s net asset value, or after the halt of trading of a specific security where trading does not resume prior to the close of the exchange or market on which the security is principally traded. Events that occur after foreign markets close (such as developments in foreign markets and significant movements in the U.S. markets) and prior to the determination of the fund’s net asset value may be deemed to have a material effect on the value of securities traded in foreign markets. Accordingly, the fund’s foreign equity securities may often be valued at fair value. The adviser generally relies on third-party pricing services or other information (such as the correlation with price movements of similar securities
11
MFS Mid Cap Growth Series
Notes to Financial Statements (unaudited) – continued
in the same or other markets; the type, cost and investment characteristics of the security; the business and financial condition of the issuer; and trading and other market data) to assist in determining whether to fair value and at what value to fair value an investment. The value of an investment for purposes of calculating the fund’s net asset value can differ depending on the source and method used to determine value. When fair valuation is used, the value of an investment used to determine the fund’s net asset value may differ from quoted or published prices for the same investment. There can be no assurance that the fund could obtain the fair value assigned to an investment if it were to sell the investment at the same time at which the fund determines its net asset value per share.
Various inputs are used in determining the value of the fund’s assets or liabilities. These inputs are categorized into three broad levels. In certain cases, the inputs used to measure fair value may fall into different levels of the fair value hierarchy. In such cases, an investment’s level within the fair value hierarchy is based on the lowest level of input that is significant to the fair value measurement. The fund’s assessment of the significance of a particular input to the fair value measurement in its entirety requires judgment, and considers factors specific to the investment. Level 1 includes unadjusted quoted prices in active markets for identical assets or liabilities. Level 2 includes other significant observable market-based inputs (including quoted prices for similar securities, interest rates, prepayment speed, and credit risk). Level 3 includes unobservable inputs, which may include the adviser’s own assumptions in determining the fair value of investments. The following is a summary of the levels used as of June 30, 2020 in valuing the fund’s assets or liabilities:
| | | | | | | | | | | | | | | | |
| Financial Instruments | | Level 1 | | | Level 2 | | | Level 3 | | | Total | |
| Equity Securities | | | $371,964,906 | | | | $— | | | | $— | | | | $371,964,906 | |
| Mutual Funds | | | 9,352,473 | | | | — | | | | — | | | | 9,352,473 | |
| Total | | | $381,317,379 | | | | $— | | | | $— | | | | $381,317,379 | |
For further information regarding security characteristics, see the Portfolio of Investments.
Foreign Currency Translation – Purchases and sales of foreign investments, income, and expenses are converted into U.S. dollars based upon currency exchange rates prevailing on the respective dates of such transactions or on the reporting date for foreign denominated receivables and payables. Gains and losses attributable to foreign currency exchange rates on sales of securities are recorded for financial statement purposes as net realized gains and losses on investments. Gains and losses attributable to foreign exchange rate movements on receivables, payables, income and expenses are recorded for financial statement purposes as foreign currency transaction gains and losses. That portion of both realized and unrealized gains and losses on investments that results from fluctuations in foreign currency exchange rates is not separately disclosed.
Security Loans – Under its Securities Lending Agency Agreement with the fund, State Street Bank and Trust Company, as lending agent, loans the securities of the fund to certain qualified institutions (the “Borrowers”) approved by the fund. Security loans can be terminated at the discretion of either the lending agent or the fund and the related securities must be returned within the earlier of the standard trade settlement period for such securities or within three business days. The loans are collateralized by cash and/or U.S. Treasury and federal agency obligations in an amount typically at least equal to the market value of the securities loaned. On loans collateralized by cash, the cash collateral is invested in a money market fund. The market value of the loaned securities is determined at the close of business of the fund and any additional required collateral is delivered to the fund on the next business day. The lending agent provides the fund with indemnification against Borrower default. In the event of Borrower default, the lending agent will, for the benefit of the fund, either purchase securities identical to those loaned or, when such purchase is commercially impracticable, pay the fund the market value of the loaned securities. In return, the lending agent assumes the fund’s rights to the related collateral. If the collateral value is less than the cost to purchase identical securities, the lending agent is responsible for the shortfall, but only to the extent that such shortfall is not due to a decline in collateral value resulting from collateral reinvestment for which the fund bears the risk of loss. At period end, the fund had investment securities on loan, all of which were classified as equity securities in the fund’s Portfolio of Investments, with a fair value of $1,545,481. The fair value of the fund’s investment securities on loan and a related liability of $1,562,805 for cash collateral received on securities loaned are both presented gross in the Statement of Assets and Liabilities. The collateral on securities loaned exceeded the value of securities on loan at period end. The liability for cash collateral for securities loaned is carried at fair value, which is categorized as level 2 within the fair value hierarchy. A portion of the income generated upon investment of the collateral is remitted to the Borrowers, and the remainder is allocated between the fund and the lending agent. On loans collateralized by U.S. Treasury and/or federal agency obligations, a fee is received from the Borrower, and is allocated between the fund and the lending agent. Income from securities lending is separately reported in the Statement of Operations. The dividend and interest income earned on the securities loaned is accounted for in the same manner as other dividend and interest income.
Indemnifications – Under the fund’s organizational documents, its officers and Trustees may be indemnified against certain liabilities and expenses arising out of the performance of their duties to the fund. Additionally, in the normal course of business, the fund enters into agreements with service providers that may contain indemnification clauses. The fund’s maximum exposure under these agreements is unknown as this would involve future claims that may be made against the fund that have not yet occurred.
12
MFS Mid Cap Growth Series
Notes to Financial Statements (unaudited) – continued
Investment Transactions and Income – Investment transactions are recorded on the trade date. Interest income is recorded on the accrual basis. Dividends received in cash are recorded on the ex-dividend date. Certain dividends from foreign securities will be recorded when the fund is informed of the dividend if such information is obtained subsequent to the ex-dividend date. Dividend payments received in additional securities are recorded on the ex-dividend date in an amount equal to the value of the security on such date.
The fund may receive proceeds from litigation settlements. Any proceeds received from litigation involving portfolio holdings are reflected in the Statement of Operations in realized gain/loss if the security has been disposed of by the fund or in unrealized gain/loss if the security is still held by the fund. Any other proceeds from litigation not related to portfolio holdings are reflected as other income in the Statement of Operations.
Tax Matters and Distributions – The fund intends to qualify as a regulated investment company, as defined under Subchapter M of the Internal Revenue Code, and to distribute all of its taxable income, including realized capital gains. As a result, no provision for federal income tax is required. The fund’s federal tax returns, when filed, will remain subject to examination by the Internal Revenue Service for a three year period. Management has analyzed the fund’s tax positions taken on federal and state tax returns for all open tax years and does not believe that there are any uncertain tax positions that require recognition of a tax liability. Foreign taxes, if any, have been accrued by the fund in the accompanying financial statements in accordance with the applicable foreign tax law. Foreign income taxes may be withheld by certain countries in which the fund invests. Additionally, capital gains realized by the fund on securities issued in or by certain foreign countries may be subject to capital gains tax imposed by those countries.
Distributions to shareholders are recorded on the ex-dividend date. Income and capital gain distributions are determined in accordance with income tax regulations, which may differ from U.S. generally accepted accounting principles. Certain capital accounts in the financial statements are periodically adjusted for permanent differences in order to reflect their tax character. These adjustments have no impact on net assets or net asset value per share. Temporary differences which arise from recognizing certain items of income, expense, gain or loss in different periods for financial statement and tax purposes will reverse at some time in the future.
Book/tax differences primarily relate to wash sale loss deferrals.
The tax character of distributions declared to shareholders for the last fiscal year is as follows:
| | | | |
| | | Year ended
12/31/19 | |
| Ordinary income (including any short-term capital gains) | | | $3,440,170 | |
| Long-term capital gains | | | 46,019,252 | |
| Total distributions | | | $49,459,422 | |
The federal tax cost and the tax basis components of distributable earnings were as follows:
| | | | |
| As of 6/30/20 | | | | |
| |
| Cost of investments | | | $200,374,250 | |
| Gross appreciation | | | 181,673,162 | |
| Gross depreciation | | | (730,033 | ) |
| Net unrealized appreciation (depreciation) | | | $180,943,129 | |
| |
| As of 12/31/19 | | | | |
| |
| Undistributed ordinary income | | | 1,546,390 | |
| Undistributed long-term capital gain | | | 27,924,556 | |
| Other temporary differences | | | 542 | |
| Net unrealized appreciation (depreciation) | | | 191,011,210 | |
The aggregate cost above includes prior fiscal year end tax adjustments, if applicable.
Multiple Classes of Shares of Beneficial Interest – The fund offers multiple classes of shares, which differ in their respective distribution and/or service fees. The fund’s income, realized and unrealized gain (loss), and common expenses are allocated to shareholders based on the daily net assets of each class. Dividends are declared separately for each class. Differences in per share dividend rates are generally due to differences in separate class expenses. The fund’s distributions declared to shareholders as reported in the Statements of Changes in Net Assets are presented by class as follows:
| | | | | | | | |
| | |
| | | Six months ended
6/30/20 | | | Year ended
12/31/19 | |
| Initial Class | | | $— | | | | $35,977,779 | |
| Service Class | | | — | | | | 13,481,643 | |
| Total | | | $— | | | | $49,459,422 | |
13
MFS Mid Cap Growth Series
Notes to Financial Statements (unaudited) – continued
| (3) | | Transactions with Affiliates |
Investment Adviser – The fund has an investment advisory agreement with MFS to provide overall investment management and related administrative services and facilities to the fund. The management fee is computed daily and paid monthly at the following annual rates based on the fund’s average daily net assets:
| | | | |
| Up to $1 billion | | | 0.75% | |
| In excess of $1 billion | | | 0.70% | |
MFS has agreed in writing to reduce its management fee by a specified amount if certain MFS mutual fund assets exceed thresholds agreed to by MFS and the fund’s Board of Trustees. For the six months ended June 30, 2020, this management fee reduction amounted to $19,876, which is included in the reduction of total expenses in the Statement of Operations. The management fee incurred for the six months ended June 30, 2020 was equivalent to an annual effective rate of 0.74% of the fund’s average daily net assets.
Distributor – MFS Fund Distributors, Inc. (MFD), a wholly-owned subsidiary of MFS, is the distributor of shares of the fund. The Trustees have adopted a distribution plan for the Service Class shares pursuant to Rule 12b-1 under the Investment Company Act of 1940.
The fund’s distribution plan provides that the fund will pay MFD distribution and/or service fees equal to 0.25% per annum of its average daily net assets attributable to Service Class shares as partial consideration for services performed and expenses incurred by MFD and financial intermediaries (including participating insurance companies that invest in the fund to fund variable annuity and variable life insurance contracts, sponsors of qualified retirement and pension plans that invest in the fund, and affiliates of these participating insurance companies and plan sponsors) in connection with the sale and distribution of the Service Class shares. MFD may subsequently pay all, or a portion, of the distribution and/or service fees to financial intermediaries.
Shareholder Servicing Agent – MFS Service Center, Inc. (MFSC), a wholly-owned subsidiary of MFS, receives a fee from the fund for its services as shareholder servicing agent. For the six months ended June 30, 2020, the fee was $7,386, which equated to 0.0040% annually of the fund’s average daily net assets. MFSC also receives payment from the fund for out-of-pocket expenses paid by MFSC on behalf of the fund. For the six months ended June 30, 2020, these costs amounted to $457.
Administrator – MFS provides certain financial, legal, shareholder communications, compliance, and other administrative services to the fund. Under an administrative services agreement, the fund reimburses MFS the costs incurred to provide these services. The fund is charged an annual fixed amount of $17,500 plus a fee based on average daily net assets. The administrative services fee incurred for the six months ended June 30, 2020 was equivalent to an annual effective rate of 0.0165% of the fund’s average daily net assets.
Trustees’ and Officers’ Compensation – The fund pays compensation to independent Trustees in the form of a retainer, attendance fees, and additional compensation to Board and Committee chairpersons. The fund does not pay compensation directly to Trustees or officers of the fund who are also officers of the investment adviser, all of whom receive remuneration from MFS for their services to the fund. Certain officers and Trustees of the fund are officers or directors of MFS, MFD, and MFSC.
Other – The fund invests in the MFS Institutional Money Market Portfolio which is managed by MFS and seeks current income consistent with preservation of capital and liquidity. This money market fund does not pay a management fee to MFS but does incur investment and operating costs.
The fund is permitted to engage in purchase and sale transactions with funds and accounts for which MFS serves as investment adviser or sub-adviser (“cross-trades”) pursuant to a policy adopted by the Board of Trustees. This policy has been designed to ensure that cross-trades conducted by the fund comply with Rule 17a-7 under the Investment Company Act of 1940. During the six months ended June 30, 2020, the fund engaged in purchase and sale transactions pursuant to this policy, which amounted to $137,089 and $133,308, respectively. The sales transactions resulted in net realized gains (losses) of $57,818.
The adviser has voluntarily undertaken to reimburse the fund from its own resources on a quarterly basis for the cost of investment research embedded in the cost of the fund’s securities trades. This agreement may be rescinded at any time. For the six months ended June 30, 2020, this reimbursement amounted to $6,482, which is included in “Other” income in the Statement of Operations.
For the six months ended June 30, 2020, purchases and sales of investments, other than short-term obligations, aggregated $75,956,330 and $120,013,136, respectively.
14
MFS Mid Cap Growth Series
Notes to Financial Statements (unaudited) – continued
| (5) | | Shares of Beneficial Interest |
The fund’s Declaration of Trust permits the Trustees to issue an unlimited number of full and fractional shares of beneficial interest. Transactions in fund shares were as follows:
| | | | | | | | | | | | | | | | |
| | | Six months ended 6/30/20 | | | Year ended 12/31/19 | |
| | | | |
| | | Shares | | | Amount | | | Shares | | | Amount | |
| Shares sold | | | | | | | | | | | | | | | | |
Initial Class | | | 1,557,010 | | | | $13,663,691 | | | | 2,461,006 | | | | $24,284,094 | |
Service Class | | | 1,501,880 | | | | 13,076,866 | | | | 2,054,824 | | | | 18,713,982 | |
| | | 3,058,890 | | | | $26,740,557 | | | | 4,515,830 | | | | $42,998,076 | |
| | | | |
| Shares issued to shareholders in reinvestment of distributions | | | | | | | | | | | | | | | | |
Initial Class | | | — | | | | $— | | | | 3,800,896 | | | | $35,576,388 | |
Service Class | | | — | | | | — | | | | 1,562,183 | | | | 13,481,643 | |
| | | — | | | | $— | | | | 5,363,079 | | | | $49,058,031 | |
| | | | |
| Shares reacquired | | | | | | | | | | | | | | | | |
Initial Class | | | (4,753,277 | ) | | | $(47,207,694 | ) | | | (7,169,474 | ) | | | $(70,824,035 | ) |
Service Class | | | (2,070,830 | ) | | | (18,782,902 | ) | | | (3,599,134 | ) | | | (32,845,066 | ) |
| | | (6,824,107 | ) | | | $(65,990,596 | ) | | | (10,768,608 | ) | | | $(103,669,101 | ) |
| | | | |
| Net change | | | | | | | | | | | | | | | | |
Initial Class | | | (3,196,267 | ) | | | $(33,544,003 | ) | | | (907,572 | ) | | | $(10,963,553 | ) |
Service Class | | | (568,950 | ) | | | (5,706,036 | ) | | | 17,873 | | | | (649,441 | ) |
| | | (3,765,217 | ) | | | $(39,250,039 | ) | | | (889,699 | ) | | | $(11,612,994 | ) |
The fund is one of several mutual funds in which certain MFS funds may invest. The MFS funds do not invest in the underlying funds for the purpose of exercising management or control. At the end of the period, the MFS Moderate Allocation Portfolio, the MFS Growth Allocation Portfolio, and the MFS Conservative Allocation Portfolio were the owners of record of approximately 25%, 8%, and 4%, respectively, of the value of outstanding voting shares of the fund.
The fund and certain other funds managed by MFS participate in a $1.25 billion unsecured committed line of credit, subject to a $1 billion sublimit, provided by a syndicate of banks under a credit agreement. Borrowings may be made for temporary financing needs. Interest is charged to each fund, based on its borrowings, generally at a rate equal to the highest of one month LIBOR, the Federal Funds Effective Rate and the Overnight Bank Funding Rate, plus an agreed upon spread. A commitment fee, based on the average daily, unused portion of the committed line of credit, is allocated among the participating funds. In addition, the fund and other funds managed by MFS have established unsecured uncommitted borrowing arrangements with certain banks for temporary financing needs. Interest is charged to each fund, based on its borrowings, at rates equal to customary reference rates plus an agreed upon spread. For the six months ended June 30, 2020, the fund’s commitment fee and interest expense were $970 and $0, respectively, and are included in “Miscellaneous” expense in the Statement of Operations.
| (7) | | Investments in Affiliated Issuers |
An affiliated issuer may be considered one in which the fund owns 5% or more of the outstanding voting securities, or a company which is under common control. For the purposes of this report, the following were affiliated issuers:
| | | | | | | | | | | | | | | | | | | | | | | | |
| Affiliated Issuers | | Beginning
Value | | | Purchases | | | Sales
Proceeds | | | Realized
Gain
(Loss) | | | Change in
Unrealized
Appreciation or
Depreciation | | | Ending
Value | |
| MFS Institutional Money Market Portfolio | | | $2,090,550 | | | | $56,653,918 | | | | $50,953,422 | | | | $(1,433 | ) | | | $55 | | | | $7,789,668 | |
| | | | | | |
| Affiliated Issuers | | | | | | | | | | | | | | Dividend
Income | | | Capital Gain
Distributions | |
| MFS Institutional Money Market Portfolio | | | | | | | | | | | | $23,328 | | | | $— | |
The pandemic related to the global spread of novel coronavirus disease (COVID-19), which was first detected in December 2019, has resulted in significant disruptions to global business activity and the global economy, as well as the economies of individual countries, the financial performance of individual companies and sectors, and the securities and commodities markets in general. This pandemic, the full effects of which are still unknown, has resulted in substantial market volatility and may have adversely impacted the prices and liquidity of the fund’s investments and the fund’s performance.
15
MFS Mid Cap Growth Series
STATEMENT REGARDING LIQUIDITY RISK MANAGEMENT PROGRAM
The fund has adopted and implemented a liquidity risk management program (the “Program”) as required by Rule 22e-4 under the Investment Company Act of 1940, as amended. The fund’s Board of Trustees (the “Board”) has designated MFS as the administrator of the Program. The Program is reasonably designed to assess and manage the liquidity risk of the fund. Liquidity risk is the risk that the fund could not meet requests to redeem shares issued by the fund without significant dilution of remaining investors’ interests.
MFS provided a written report to the Board for consideration at its April 2020 meeting that addressed the operation of the Program and provided an assessment of the adequacy and effectiveness of the Program during the period from the adoption of the Program on December 1, 2018 to December 31, 2019 (the “Covered Period”). The report concluded that during the Covered Period the Program had operated effectively and had adequately and effectively been implemented to assess and manage the fund’s liquidity risk. MFS also reported that there were no liquidity events that impacted the fund or its ability to timely meet redemptions without dilution to existing shareholders during the Covered Period.
There can be no assurance that the Program will achieve its objectives in the future. Further information on liquidity risk, and other principal risks to which an investment in the fund may be subject, can be found in the prospectus.
16
MFS Mid Cap Growth Series
PROXY VOTING POLICIES AND INFORMATION
MFS votes proxies on behalf of the fund pursuant to proxy voting policies and procedures that are available without charge, upon request, by calling 1-800-225-2606, by visiting mfs.com/proxyvoting, or by visiting the SEC’s Web site at http://www.sec.gov.
Information regarding how the fund voted proxies relating to portfolio securities during the most recent twelve-month period ended June 30 is available by August 31 of each year without charge by visiting mfs.com/proxyvoting, or by visiting the SEC’s Web site at http://www.sec.gov.
QUARTERLY PORTFOLIO DISCLOSURE
The fund files a complete schedule of portfolio holdings with the SEC for the first and third quarters of each fiscal year as an exhibit to its reports on Form N-PORT. The fund’s Form N-PORT reports are available on the SEC’s website at http://www.sec.gov. A shareholder can obtain the portfolio holdings report for the first and third quarters of the fund’s fiscal year at mfs.com/vit1 by choosing the fund’s name and then selecting the “Resources” tab and clicking on “Prospectus and Reports”.
FURTHER INFORMATION
From time to time, MFS may post important information about the fund or the MFS funds on the MFS web site (mfs.com). This information is available at https://www.mfs.com/announcements or at mfs.com/vit1 by choosing the fund’s name and then selecting the “Resources” tab and clicking on the “Announcements” tab, if any.
INFORMATION ABOUT FUND CONTRACTS AND LEGAL CLAIMS
The fund has entered into contractual arrangements with an investment adviser, administrator, distributor, shareholder servicing agent, 529 program manager (if applicable), and custodian who each provide services to the fund. Unless expressly stated otherwise, shareholders are not parties to, or intended beneficiaries of these contractual arrangements, and these contractual arrangements are not intended to create any shareholder right to enforce them against the service providers or to seek any remedy under them against the service providers, either directly or on behalf of the fund.
Under the Trust’s By-Laws and Declaration of Trust, any claims asserted against or on behalf of the MFS Funds, including claims against Trustees and Officers, must be brought in state and federal courts located within the Commonwealth of Massachusetts.
17
Semiannual Report
June 30, 2020
MFS® New Discovery Series
MFS® Variable Insurance Trust
Beginning on January 1, 2021, as permitted by regulations adopted by the U.S. Securities and Exchange Commission, the insurance company that offers your contract may determine that it will no longer send you paper copies of the fund's annual and semiannual shareholder reports unless you specifically request paper copies from the insurance company or from your financial intermediary. Instead, the shareholder reports will be made available on a Web site (insurancefunds.mfs.com or other Web site of which you will be notified), and the insurance company will notify you by mail each time a report is posted and provide you with a Web site link to access the report. Instructions for requesting paper copies will be provided by your insurance company or financial intermediary.
If you already elected to receive shareholder reports by email, you will not be affected by this change and you need not take any action. If your insurance company or financial intermediary offers electronic delivery, you may elect to receive shareholder reports and other communications from the insurance company or financial intermediary by email by following the instructions provided by the insurance company or financial intermediary.
Beginning on January 1, 2019, you may elect to receive all future reports in paper free of charge from the insurance company or financial intermediary. You can inform the insurance company or financial intermediary that you wish to continue receiving paper copies of your shareholder reports by contacting your insurance company or financial intermediary. Your election to receive reports in paper will apply to all funds held in your account with your insurance company or financial intermediary.
The report is prepared for the general information of contract owners. It is authorized for distribution to prospective investors only when preceded or accompanied by a current prospectus.
NOT FDIC INSURED • MAY LOSE VALUE • NO BANK OR CREDIT UNION GUARANTEE •
NOT A DEPOSIT • NOT INSURED BY ANY FEDERAL GOVERNMENT AGENCY OR NCUA/NCUSIF
LETTER FROM THE EXECUTIVE CHAIR
Dear Contract Owners:
Markets experienced dramatic swings in early 2020, as the coronavirus pandemic brought the global economy to a standstill for several months. Optimism over the development of vaccines and therapeutics, along with a decline in cases in countries that had been affected by the outbreak early on, brightened the economic and market outlook during the second quarter, as did the phased reopening of US states. However, a great deal of uncertainty remains, including the possibility of a second wave of cases later this year, as many countries continue to experience COVID-19 flare-ups.
Global central banks have taken aggressive steps to cushion the economic and market fallout related to the virus, and governments are deploying unprecedented levels of fiscal support. As uncertainty recedes, these measures can help build a supportive environment and encourage economic recovery; however, if markets disconnect from fundamentals, they can also sow the seeds of instability. In the aftermath of the crisis, societal changes may be likely, as households, businesses, and governments adjust to a new reality, and these alterations could affect the investment landscape. For investors, events, such as the COVID-19 outbreak, demonstrate the importance of having a deep understanding of company fundamentals, and we have built our global research platform to do just that.
Here at MFS®, we aim to help our clients navigate the growing complexity of the markets and world economies. Our long-term investment philosophy and commitment to the responsible allocation of capital allow us to tune out the noise and uncover what we believe are the best, most durable investment opportunities in the market. Through our unique global investment platform, we combine collective expertise, thoughtful risk management, and long-term discipline to create sustainable value for investors.
Respectfully,
Robert J. Manning
Executive Chair
MFS Investment Management
August 17, 2020
The opinions expressed in this letter are subject to change and may not be relied upon for investment advice. No forecasts can be guaranteed.
Top ten holdings
| QTS Realty Trust, Inc., REIT, “A” | 2.3% |
| Rapid7, Inc. | 2.1% |
| PRA Health Sciences, Inc. | 1.9% |
| Box, Inc., “A” | 1.7% |
| Pagerduty, Inc. | 1.7% |
| Ping Identity Holding Corp. | 1.6% |
| STAG Industrial, Inc., REIT | 1.6% |
| Generac Holdings, Inc. | 1.6% |
| Everbridge, Inc. | 1.6% |
| WNS (Holdings) Ltd., ADR | 1.6% |
GICS equity sectors (g)
| Health Care | 27.9% |
| Information Technology | 27.0% |
| Industrials | 12.3% |
| Consumer Discretionary | 8.0% |
| Real Estate | 7.3% |
| Financials | 6.0% |
| Materials | 5.3% |
| Communication Services | 1.6% |
| Consumer Staples | 1.6% |
| Energy | 0.2% |
| (g) | The Global Industry Classification Standard (GICS®) was developed by and/or is the exclusive property of MSCI, Inc. and S&P Global Market Intelligence Inc. (“S&P Global Market Intelligence”). GICS is a service mark of MSCI and S&P Global Market Intelligence and has been licensed for use by MFS. |
Cash & Cash Equivalents includes any cash, investments in money market funds, short-term securities, and other assets less liabilities. Please see the Statement of Assets and Liabilities for additional information related to the fund’s cash position and other assets and liabilities.
Percentages are based on net assets as of June 30, 2020.
The portfolio is actively managed and current holdings may be different.
Expense Table
Fund Expenses Borne by the Contract Holders during the Period,
January 1, 2020 through June 30, 2020
As a contract holder of the fund, you incur ongoing costs, including management fees; distribution and/or service (12b-1) fees; and other fund expenses. This example is intended to help you understand your ongoing costs (in dollars) of investing in the fund and to compare these costs with the ongoing costs of investing in other mutual funds.
The example is based on an investment of $1,000 invested at the beginning of the period and held for the entire period January 1, 2020 through June 30, 2020.
Actual Expenses
The first line for each share class in the following table provides information about actual account values and actual expenses. You may use the information in this line, together with the amount you invested, to estimate the expenses that you paid over the period. Simply divide your account value by $1,000 (for example, an $8,600 account value divided by $1,000 = 8.6), then multiply the result by the number in the first line under the heading entitled “Expenses Paid During Period” to estimate the expenses you paid on your account during this period.
Hypothetical Example for Comparison Purposes
The second line for each share class in the following table provides information about hypothetical account values and hypothetical expenses based on the fund’s actual expense ratio and an assumed rate of return of 5% per year before expenses, which is not the fund’s actual return. The hypothetical account values and expenses may not be used to estimate the actual ending account balance or expenses you paid for the period. You may use this information to compare the ongoing costs of investing in the fund and other funds. To do so, compare this 5% hypothetical example with the 5% hypothetical examples that appear in the shareholder reports of the other funds.
Please note that the expenses shown in the table are meant to highlight the fund's ongoing costs only and do not take into account the fees and expenses imposed under the variable contracts through which your investment in the fund is made. Therefore, the second line for each share class in the table is useful in comparing ongoing costs associated with an investment in vehicles (such as the fund) which fund benefits under variable annuity and variable life insurance contracts and to qualified pension and retirement plans only, and will not help you determine the relative total costs of investing in the fund through variable annuity and variable life insurance contracts. If the fees and expenses imposed under the variable contracts were included, your costs would have been higher.
Share
Class | | Annualized
Expense
Ratio | Beginning
Account Value
1/01/20 | Ending
Account Value
6/30/20 | Expenses
Paid During
Period (p)
1/01/20-6/30/20 |
| Initial Class | Actual | 0.94% | $1,000.00 | $1,051.78 | $4.80 |
| Hypothetical (h) | 0.94% | $1,000.00 | $1,020.19 | $4.72 |
| Service Class | Actual | 1.19% | $1,000.00 | $1,051.05 | $6.07 |
| Hypothetical (h) | 1.19% | $1,000.00 | $1,018.95 | $5.97 |
| (h) | 5% class return per year before expenses. |
| (p) | “Expenses Paid During Period” are equal to each class's annualized expense ratio, as shown above, multiplied by the average account value over the period, multiplied by 182/366 (to reflect the one-half year period). |
Notes to Expense Table
Changes to the fund's fee arrangements will occur during the fund's current fiscal year. Had these fee changes been in effect during the six month period, the annualized expense ratios, the actual expenses paid during the period, and the hypothetical expenses paid during the period would have been approximately 0.87%, $4.44, and $4.37 for Initial Class and 1.12%, $5.71, and $5.62 for Service Class, respectively. For further information about the fund's fee arrangements and changes to those fee arrangements, please see Note 3 in the Notes to Financial Statements.
Portfolio of Investments − 6/30/20 (unaudited)
The Portfolio of Investments is a complete list of all securities owned by your fund. It is categorized by broad-based asset classes.
| Issuer | | | Shares/Par | Value ($) |
| Common Stocks – 97.2% |
| Aerospace – 2.7% | |
| CACI International, Inc., “A” (a) | | 57,045 | $ 12,371,920 |
| Kratos Defense & Security Solutions, Inc. (a) | | 570,029 | 8,909,553 |
| | | | | $21,281,473 |
| Apparel Manufacturers – 1.7% | |
| Levi Strauss & Co., “A” (l) | | 219,254 | $ 2,938,003 |
| Skechers USA, Inc., “A” (a) | | 345,702 | 10,848,129 |
| | | | | $13,786,132 |
| Automotive – 0.8% | |
| Hella KGaA Hueck & Co. | | 70,708 | $ 2,891,631 |
| Visteon Corp. (a) | | 47,746 | 3,270,601 |
| | | | | $6,162,232 |
| Biotechnology – 6.1% | |
| 10x Genomics, Inc., “A” (a) | | 36,572 | $ 3,266,245 |
| Adaptive Biotechnologies Corp. (a) | | 176,985 | 8,562,534 |
| Aimmune Therapeutics, Inc. (a)(l) | | 103,319 | 1,726,460 |
| Amicus Therapeutics, Inc. (a) | | 524,463 | 7,908,902 |
| BioXcel Therapeutics, Inc. (a) | | 80,999 | 4,293,757 |
| Immunomedics, Inc. (a) | | 130,511 | 4,625,310 |
| Morphosys AG, ADR (a) | | 152,961 | 4,844,275 |
| Neurocrine Biosciences, Inc. (a) | | 31,013 | 3,783,586 |
| Tricida, Inc. (a) | | 103,006 | 2,830,605 |
| Twist Bioscience Corp. (a) | | 140,422 | 6,361,117 |
| | | | | $48,202,791 |
| Brokerage & Asset Managers – 3.0% | |
| Hamilton Lane, Inc., “A” | | 142,744 | $ 9,616,663 |
| TMX Group Ltd. | | 93,579 | 9,252,437 |
| WisdomTree Investments, Inc. | | 1,437,931 | 4,989,621 |
| | | | | $23,858,721 |
| Business Services – 6.4% | |
| Clarivate PLC (a) | | 248,496 | $ 5,548,916 |
| EVO Payments, Inc., “A” (a) | | 272,247 | 6,215,399 |
| ExlService Holdings, Inc. (a) | | 155,406 | 9,852,740 |
| Proofpoint, Inc. (a) | | 65,697 | 7,300,251 |
| TriNet Group, Inc. (a) | | 152,685 | 9,304,624 |
| WNS (Holdings) Ltd., ADR (a) | | 230,102 | 12,651,008 |
| | | | | $50,872,938 |
| Chemicals – 1.2% | |
| Ingevity Corp. (a) | | 187,670 | $ 9,865,812 |
| Computer Software – 13.4% | |
| 8x8, Inc. (a) | | 671,159 | $ 10,738,544 |
| Altair Engineering, Inc., “A” (a) | | 167,301 | 6,650,215 |
| Avalara, Inc. (a) | | 87,708 | 11,673,058 |
| Everbridge, Inc. (a) | | 92,204 | 12,757,345 |
| Health Catalyst, Inc. (a) | | 221,466 | 6,460,163 |
| Livongo Health, Inc. (a) | | 157,781 | 11,863,553 |
| Pagerduty, Inc. (a) | | 465,810 | 13,331,482 |
| Paylocity Holding Corp. (a) | | 55,971 | 8,165,609 |
| Ping Identity Holding Corp. (a) | | 402,394 | 12,912,824 |
| Schrodinger, Inc. (a) | | 43,754 | 4,006,554 |
| Issuer | | | Shares/Par | Value ($) |
| Common Stocks – continued |
| Computer Software – continued | |
| Zendesk, Inc. (a) | | 90,461 | $ 8,008,512 |
| | | | | $ 106,567,859 |
| Computer Software - Systems – 7.3% | |
| Box, Inc., “A” (a) | | 648,359 | $ 13,459,933 |
| Five9, Inc. (a) | | 60,527 | 6,698,523 |
| Q2 Holdings, Inc. (a) | | 143,001 | 12,268,056 |
| Rapid7, Inc. (a) | | 319,033 | 16,277,063 |
| RealPage, Inc. (a) | | 144,513 | 9,394,790 |
| | | | | $58,098,365 |
| Construction – 3.7% | |
| AZEK Co. LLC (a) | | 264,051 | $ 8,412,665 |
| Summit Materials, Inc., “A” (a) | | 769,974 | 12,381,182 |
| Trex Co., Inc. (a) | | 63,340 | 8,238,634 |
| | | | | $29,032,481 |
| Consumer Services – 2.6% | |
| Boyd Group Services, Inc. | | 43,386 | $ 6,457,726 |
| Bright Horizons Family Solutions, Inc. (a) | | 45,950 | 5,385,340 |
| MakeMyTrip Ltd. (a) | | 254,034 | 3,891,801 |
| Planet Fitness, Inc. (a) | | 87,117 | 5,276,677 |
| | | | | $21,011,544 |
| Containers – 1.4% | |
| Gerresheimer AG | | 119,144 | $ 10,989,761 |
| Electrical Equipment – 3.5% | |
| Generac Holdings, Inc. (a) | | 105,732 | $ 12,891,903 |
| Littlefuse, Inc. | | 49,595 | 8,462,395 |
| Sensata Technologies Holding PLC (a) | | 182,979 | 6,812,308 |
| | | | | $28,166,606 |
| Electronics – 1.9% | |
| Brooks Automation, Inc. | | 91,609 | $ 4,052,782 |
| Monolithic Power Systems, Inc. | | 20,982 | 4,972,734 |
| Silicon Laboratories, Inc. (a) | | 59,531 | 5,969,174 |
| | | | | $14,994,690 |
| Entertainment – 1.6% | |
| CTS Eventim AG (a) | | 119,485 | $ 4,966,930 |
| Manchester United PLC, “A” | | 509,849 | 8,070,909 |
| | | | | $13,037,839 |
| Food & Drug Stores – 1.6% | |
| Grocery Outlet Holding Corp. (a) | | 302,768 | $ 12,352,934 |
| General Merchandise – 1.3% | |
| Ollie's Bargain Outlet Holdings, Inc. (a) | | 103,126 | $ 10,070,254 |
| Insurance – 0.9% | |
| Selectquote, Inc. (a) | | 277,104 | $ 7,019,044 |
| Internet – 0.6% | |
| DraftKings, Inc. (a) | | 143,985 | $ 4,788,941 |
Portfolio of Investments (unaudited) – continued
| Issuer | | | Shares/Par | Value ($) |
| Common Stocks – continued |
| Leisure & Toys – 1.4% | |
| Malibu Boats, Inc., “A” (a) | | 132,569 | $ 6,886,959 |
| Thule Group AB | | 154,664 | 3,903,863 |
| | | | | $10,790,822 |
| Machinery & Tools – 0.6% | |
| Ritchie Bros. Auctioneers, Inc. | | 108,101 | $ 4,415,926 |
| Medical & Health Technology & Services – 5.4% | |
| Charles River Laboratories International, Inc. (a) | | 51,822 | $ 9,035,166 |
| Guardant Health, Inc. (a) | | 68,870 | 5,587,423 |
| HealthEquity, Inc. (a) | | 55,260 | 3,242,104 |
| ICON PLC (a) | | 40,415 | 6,808,311 |
| PRA Health Sciences, Inc. (a) | | 151,552 | 14,744,494 |
| Teladoc Health, Inc. (a) | | 19,989 | 3,814,701 |
| | | | | $43,232,199 |
| Medical Equipment – 8.6% | |
| Bio-Techne Corp. | | 21,169 | $ 5,590,098 |
| Inari Medical, Inc. (a) | | 17,593 | 852,205 |
| Inspire Medical Systems, Inc. (a) | | 33,842 | 2,944,931 |
| iRhythm Technologies, Inc. (a) | | 53,690 | 6,222,134 |
| Masimo Corp. (a) | | 17,349 | 3,955,398 |
| Merit Medical Systems, Inc. (a) | | 174,138 | 7,949,400 |
| Nevro Corp. (a) | | 38,199 | 4,563,635 |
| OptiNose, Inc. (a)(l) | | 425,117 | 3,162,870 |
| OrthoPediatrics Corp. (a) | | 154,614 | 6,765,909 |
| PerkinElmer, Inc. | | 56,856 | 5,577,005 |
| Quidel Corp. (a) | | 47,757 | 10,685,151 |
| Silk Road Medical, Inc. (a) | | 125,303 | 5,248,943 |
| STERIS PLC | | 32,355 | 4,964,551 |
| | | | | $68,482,230 |
| Network & Telecom – 3.8% | |
| CoreSite Realty Corp. | | 98,947 | $ 11,978,524 |
| QTS Realty Trust, Inc., REIT, “A” | | 280,914 | 18,003,778 |
| | | | | $29,982,302 |
| Other Banks & Diversified Financials – 2.1% | |
| Bank OZK | | 107,530 | $ 2,523,729 |
| Prosperity Bancshares, Inc. | | 101,586 | 6,032,177 |
| Signature Bank | | 29,915 | 3,198,512 |
| Wintrust Financial Corp. | | 114,925 | 5,013,028 |
| | | | | $16,767,446 |
| Pharmaceuticals – 2.8% | |
| BridgeBio Pharma, Inc. (a)(l) | | 115,899 | $ 3,779,466 |
| Collegium Pharmaceutical, Inc. (a) | | 159,231 | 2,786,543 |
| GW Pharmaceuticals PLC, ADR (a)(l) | | 45,923 | 5,635,671 |
| Issuer | | | Shares/Par | Value ($) |
| Common Stocks – continued |
| Pharmaceuticals – continued | |
| Orchard RX Ltd., ADR (a) | | 140,835 | $ 845,010 |
| Principia Biopharma, Inc. (a) | | 53,128 | 3,176,523 |
| SpringWorks Therapeutics, Inc. (a) | | 135,387 | 5,686,254 |
| | | | | $21,909,467 |
| Pollution Control – 1.2% | |
| Casella Waste Systems, Inc., “A” (a) | | 180,076 | $ 9,385,561 |
| Railroad & Shipping – 0.2% | |
| StealthGas, Inc. (a) | | 503,074 | $ 1,398,546 |
| Real Estate – 3.5% | |
| Big Yellow Group PLC, REIT | | 548,972 | $ 6,829,524 |
| Industrial Logistics Properties Trust, REIT | | 397,181 | 8,162,070 |
| STAG Industrial, Inc., REIT | | 440,370 | 12,911,648 |
| | | | | $27,903,242 |
| Specialty Chemicals – 2.5% | |
| Axalta Coating Systems Ltd. (a) | | 424,851 | $ 9,580,390 |
| Ferro Corp. (a) | | 458,771 | 5,477,726 |
| RPM International, Inc. | | 64,285 | 4,825,232 |
| | | | | $19,883,348 |
| Specialty Stores – 0.4% | |
| Vroom, Inc. (a) | | 67,448 | $ 3,516,739 |
| Trucking – 3.0% | |
| Cryoport, Inc. (a) | | 200,938 | $ 6,078,374 |
| Knight-Swift Transportation Holdings, Inc. | | 191,925 | 8,005,192 |
| Schneider National, Inc. | | 387,719 | 9,565,028 |
| | | | | $23,648,594 |
| Total Common Stocks (Identified Cost, $560,367,690) | | $771,476,839 |
| Investment Companies (h) – 2.9% |
| Money Market Funds – 2.9% | |
| MFS Institutional Money Market Portfolio, 0.17% (v) (Identified Cost, $22,634,992) | | | 22,632,775 | $ 22,635,038 |
| Collateral for Securities Loaned – 0.4% |
| State Street Navigator Securities Lending Government Money Market Portfolio, 0.13% (j) (Identified Cost, $3,419,519) | | | 3,419,519 | $ 3,419,519 |
| Other Assets, Less Liabilities – (0.5)% | | (4,052,898) |
| Net Assets – 100.0% | $793,478,498 |
| (a) | Non-income producing security. | | | |
| (h) | An affiliated issuer, which may be considered one in which the fund owns 5% or more of the outstanding voting securities, or a company which is under common control. At period end, the aggregate values of the fund's investments in affiliated issuers and in unaffiliated issuers were $22,635,038 and $774,896,358, respectively. | | | |
| (j) | The rate quoted is the annualized seven-day yield of the fund at period end. | | | |
| (l) | A portion of this security is on loan. See Note 2 for additional information. | | | |
| (v) | Affiliated issuer that is available only to investment companies managed by MFS. The rate quoted for the MFS Institutional Money Market Portfolio is the annualized seven-day yield of the fund at period end. | | | |
Portfolio of Investments (unaudited) – continued
| The following abbreviations are used in this report and are defined: |
| ADR | American Depositary Receipt |
| REIT | Real Estate Investment Trust |
See Notes to Financial Statements
| Financial Statements | Statement of Assets and Liabilities (unaudited) |
This statement represents your fund’s balance sheet, which details the assets and liabilities comprising the total value of the fund.
| At 6/30/20Assets | |
| Investments in unaffiliated issuers, at value, including $5,430,473 of securities on loan (identified cost, $563,787,209) | $774,896,358 |
| Investments in affiliated issuers, at value (identified cost, $22,634,992) | 22,635,038 |
| Receivables for | |
| Investments sold | 5,891,541 |
| Fund shares sold | 176,980 |
| Interest and dividends | 629,448 |
| Other assets | 1,733 |
| Total assets | $804,231,098 |
| Liabilities | |
| Payables for | |
| Investments purchased | $4,188,952 |
| Fund shares reacquired | 2,954,671 |
| Collateral for securities loaned, at value (c) | 3,419,519 |
| Payable to affiliates | |
| Investment adviser | 28,834 |
| Administrative services fee | 648 |
| Shareholder servicing costs | 1,556 |
| Distribution and/or service fees | 6,092 |
| Accrued expenses and other liabilities | 152,328 |
| Total liabilities | $10,752,600 |
| Net assets | $793,478,498 |
| Net assets consist of | |
| Paid-in capital | $485,631,593 |
| Total distributable earnings (loss) | 307,846,905 |
| Net assets | $793,478,498 |
| Shares of beneficial interest outstanding | 39,907,032 |
| | Net assets | Shares
outstanding | Net asset value
per share |
| Initial Class | $337,715,258 | 15,836,284 | $21.33 |
| Service Class | 455,763,240 | 24,070,748 | 18.93 |
| (c) | Non-cash collateral is not included. |
See Notes to Financial Statements
| Financial Statements | Statement of Operations (unaudited) |
This statement describes how much your fund earned in investment income and accrued in expenses. It also describes any gains and/or losses generated by fund operations.
| Six months ended 6/30/20 | |
| Net investment income (loss) | |
| Income | |
| Dividends | $2,344,610 |
| Income on securities loaned | 117,189 |
| Dividends from affiliated issuers | 66,136 |
| Other | 27,034 |
| Foreign taxes withheld | (68,726) |
| Total investment income | $2,486,243 |
| Expenses | |
| Management fee | $3,298,987 |
| Distribution and/or service fees | 526,697 |
| Shareholder servicing costs | 16,875 |
| Administrative services fee | 55,214 |
| Independent Trustees' compensation | 7,663 |
| Custodian fee | 20,355 |
| Shareholder communications | 54,157 |
| Audit and tax fees | 29,791 |
| Legal fees | 3,439 |
| Miscellaneous | 15,833 |
| Total expenses | $4,029,011 |
| Reduction of expenses by investment adviser | (55,135) |
| Net expenses | $3,973,876 |
| Net investment income (loss) | $(1,487,633) |
| Realized and unrealized gain (loss) | |
| Realized gain (loss) (identified cost basis) | |
| Unaffiliated issuers | $20,950,453 |
| Affiliated issuers | (1,830) |
| Foreign currency | 1,989 |
| Net realized gain (loss) | $20,950,612 |
| Change in unrealized appreciation or depreciation | |
| Unaffiliated issuers | $19,790,274 |
| Affiliated issuers | (23) |
| Translation of assets and liabilities in foreign currencies | (1,204) |
| Net unrealized gain (loss) | $19,789,047 |
| Net realized and unrealized gain (loss) | $40,739,659 |
| Change in net assets from operations | $39,252,026 |
See Notes to Financial Statements
| Financial Statements | Statements of Changes in Net Assets |
These statements describe the increases and/or decreases in net assets resulting from operations, any distributions, and any shareholder transactions.
| | Six months ended | Year ended |
| | 6/30/20
(unaudited) | 12/31/19 |
| Change in net assets | | |
| From operations | | |
| Net investment income (loss) | $(1,487,633) | $(3,520,316) |
| Net realized gain (loss) | 20,950,612 | 82,971,956 |
| Net unrealized gain (loss) | 19,789,047 | 172,414,321 |
| Change in net assets from operations | $39,252,026 | $251,865,961 |
| Total distributions to shareholders | $— | $(140,125,461) |
| Change in net assets from fund share transactions | $(61,298,874) | $72,834,089 |
| Total change in net assets | $(22,046,848) | $184,574,589 |
| Net assets | | |
| At beginning of period | 815,525,346 | 630,950,757 |
| At end of period | $793,478,498 | $815,525,346 |
See Notes to Financial Statements
| Financial Statements | Financial Highlights |
The financial highlights table is intended to help you understand the fund's financial performance for the semiannual period and the past 5 fiscal years. Certain information reflects financial results for a single fund share. The total returns in the table represent the rate that an investor would have earned (or lost) on an investment in the fund share class (assuming reinvestment of all distributions) held for the entire period.
| Initial Class | Six months
ended | Year ended |
| | 6/30/20
(unaudited) | 12/31/19 | 12/31/18 | 12/31/17 | 12/31/16 | 12/31/15 |
| Net asset value, beginning of period | $20.28 | $17.46 | $20.10 | $16.18 | $15.49 | $16.32 |
| Income (loss) from investment operations | | | | | | |
| Net investment income (loss) (d) | $(0.02) | $(0.07) | $(0.09) | $(0.07) | $0.00(c)(w) | $(0.08) |
| Net realized and unrealized gain (loss) | 1.07 | 6.89 | 0.35 | 4.34 | 1.40 | (0.22) |
| Total from investment operations | $1.05 | $6.82 | $0.26 | $4.27 | $1.40 | $(0.30) |
| Less distributions declared to shareholders | | | | | | |
| From net realized gain | $— | $(4.00) | $(2.90) | $(0.35) | $(0.71) | $(0.53) |
| Net asset value, end of period (x) | $21.33 | $20.28 | $17.46 | $20.10 | $16.18 | $15.49 |
| Total return (%) (k)(r)(s)(x) | 5.18(n) | 41.70 | (1.48) | 26.65 | 9.05(c) | (1.89) |
Ratios (%) (to average net assets)
and Supplemental data: | | | | | | |
| Expenses before expense reductions (f) | 0.96(a) | 0.95 | 0.96 | 0.97 | 0.94(c) | 0.96 |
| Expenses after expense reductions (f) | 0.94(a) | 0.94 | 0.94 | 0.94 | 0.92(c) | 0.94 |
| Net investment income (loss) | (0.26)(a) | (0.33) | (0.43) | (0.37) | 0.02(c) | (0.48) |
| Portfolio turnover | 40(n) | 54 | 71 | 58 | 63 | 60 |
| Net assets at end of period (000 omitted) | $337,715 | $343,133 | $272,039 | $316,949 | $292,368 | $312,151 |
| Service Class | Six months
ended | Year ended |
| | 6/30/20
(unaudited) | 12/31/19 | 12/31/18 | 12/31/17 | 12/31/16 | 12/31/15 |
| Net asset value, beginning of period | $18.02 | $15.91 | $18.57 | $15.01 | $14.45 | $15.30 |
| Income (loss) from investment operations | | | | | | |
| Net investment income (loss) (d) | $(0.04) | $(0.11) | $(0.13) | $(0.10) | $(0.03)(c) | $(0.11) |
| Net realized and unrealized gain (loss) | 0.95 | 6.22 | 0.37 | 4.01 | 1.30 | (0.21) |
| Total from investment operations | $0.91 | $6.11 | $0.24 | $3.91 | $1.27 | $(0.32) |
| Less distributions declared to shareholders | | | | | | |
| From net realized gain | $— | $(4.00) | $(2.90) | $(0.35) | $(0.71) | $(0.53) |
| Net asset value, end of period (x) | $18.93 | $18.02 | $15.91 | $18.57 | $15.01 | $14.45 |
| Total return (%) (k)(r)(s)(x) | 5.05(n) | 41.27 | (1.72) | 26.33 | 8.80(c) | (2.15) |
Ratios (%) (to average net assets)
and Supplemental data: | | | | | | |
| Expenses before expense reductions (f) | 1.21(a) | 1.20 | 1.21 | 1.22 | 1.19(c) | 1.21 |
| Expenses after expense reductions (f) | 1.19(a) | 1.19 | 1.19 | 1.19 | 1.17(c) | 1.19 |
| Net investment income (loss) | (0.51)(a) | (0.58) | (0.68) | (0.62) | (0.23)(c) | (0.73) |
| Portfolio turnover | 40(n) | 54 | 71 | 58 | 63 | 60 |
| Net assets at end of period (000 omitted) | $455,763 | $472,393 | $358,912 | $432,897 | $380,884 | $388,966 |
See Notes to Financial Statements
Financial Highlights - continued
| (a) | Annualized. |
| (c) | Amount reflects a one-time reimbursement of expenses by the custodian (or former custodian) without which net investment income and performance would be lower and expenses would be higher. |
| (d) | Per share data is based on average shares outstanding. |
| (f) | Ratios do not reflect reductions from fees paid indirectly, if applicable. |
| (k) | The total return does not reflect expenses that apply to separate accounts. Inclusion of these charges would reduce the total return figures for all periods shown. |
| (n) | Not annualized. |
| (r) | Certain expenses have been reduced without which performance would have been lower. |
| (s) | From time to time the fund may receive proceeds from litigation settlements, without which performance would be lower. |
| (w) | Per share amount was less than $0.01. |
| (x) | The net asset values and total returns have been calculated on net assets which include adjustments made in accordance with U.S. generally accepted accounting principles required at period end for financial reporting purposes. |
See Notes to Financial Statements
Notes to Financial Statements (unaudited)
(1) Business and Organization
MFS New Discovery Series (the fund) is a diversified series of MFS Variable Insurance Trust (the trust). The trust is organized as a Massachusetts business trust and is registered under the Investment Company Act of 1940, as amended, as an open-end management investment company. The shareholders of each series of the trust are separate accounts of insurance companies, which offer variable annuity and/or life insurance products, and qualified retirement and pension plans.
The fund is an investment company and accordingly follows the investment company accounting and reporting guidance of the Financial Accounting Standards Board (FASB) Accounting Standards Codification Topic 946 Financial Services - Investment Companies.
(2) Significant Accounting Policies
General — The preparation of financial statements in conformity with U.S. generally accepted accounting principles requires management to make estimates and assumptions that affect the reported amounts of assets and liabilities, and disclosure of contingent assets and liabilities at the date of the financial statements and the reported amounts of increases and decreases in net assets from operations during the reporting period. Actual results could differ from those estimates. In the preparation of these financial statements, management has evaluated subsequent events occurring after the date of the fund’s Statement of Assets and Liabilities through the date that the financial statements were issued. The fund will generally focus on securities of small size companies which may be more volatile than those of larger companies. The fund invests in foreign securities. Investments in foreign securities are vulnerable to the effects of changes in the relative values of the local currency and the U.S. dollar and to the effects of changes in each country’s market, economic, industrial, political, regulatory, geopolitical, and other conditions.
In March 2020, the FASB issued Accounting Standards Update 2020-04, Reference Rate Reform (Topic 848) – Facilitation of the Effects of Reference Rate Reform on Financial Reporting (“ASU 2020-04”), which provides optional, temporary relief with respect to the financial reporting of contracts subject to certain types of modifications due to the planned discontinuation of the London Interbank Offered Rate (LIBOR) and other IBOR-based reference rates as of the end of 2021. The temporary relief provided by ASU 2020-04 is effective for certain reference rate-related contract modifications that occur during the period from March 12, 2020 through December 31, 2022. Management is evaluating the impact of ASU 2020-04 on the fund's investments, derivatives, debt and other contracts that will undergo reference rate-related modifications as a result of the reference rate reform.
Balance Sheet Offsetting — The fund's accounting policy with respect to balance sheet offsetting is that, absent an event of default by the counterparty or a termination of the agreement, the International Swaps and Derivatives Association (ISDA) Master Agreement, or similar agreement, does not result in an offset of reported amounts of financial assets and financial liabilities in the Statement of Assets and Liabilities across transactions between the fund and the applicable counterparty. The fund's right to setoff may be restricted or prohibited by the bankruptcy or insolvency laws of the particular jurisdiction to which a specific master netting agreement counterparty is subject. Balance sheet offsetting disclosures, to the extent applicable to the fund, have been included in the fund’s Significant Accounting Policies note under the captions for each of the fund’s in-scope financial instruments and transactions.
Investment Valuations — Equity securities, including restricted equity securities, are generally valued at the last sale or official closing price on their primary market or exchange as provided by a third-party pricing service. Equity securities, for which there were no sales reported that day, are generally valued at the last quoted daily bid quotation on their primary market or exchange as provided by a third-party pricing service. Short-term instruments with a maturity at issuance of 60 days or less may be valued at amortized cost, which approximates market value. Open-end investment companies are generally valued at net asset value per share. Securities and other assets generally valued on the basis of information from a third-party pricing service may also be valued at a broker/dealer bid quotation. In determining values, third-party pricing services can utilize both transaction data and market information such as yield, quality, coupon rate, maturity, type of issue, trading characteristics, and other market data. The values of foreign securities and other assets and liabilities expressed in foreign currencies are converted to U.S. dollars using the mean of bid and asked prices for rates provided by a third-party pricing service.
The Board of Trustees has delegated primary responsibility for determining or causing to be determined the value of the fund’s investments (including any fair valuation) to the adviser pursuant to valuation policies and procedures approved by the Board. If the adviser determines that reliable market quotations are not readily available, investments are valued at fair value as determined in good faith by the adviser in accordance with such procedures under the oversight of the Board of Trustees. Under the fund’s valuation policies and procedures, market quotations are not considered to be readily available for most types of debt instruments and floating rate loans and many types of derivatives. These investments are generally valued at fair value based on information from third-party pricing services. In addition, investments may be valued at fair value if the adviser determines that an investment’s value has been materially affected by events occurring after the close of the exchange or market on which the investment is principally traded (such as foreign exchange or market) and prior to the determination of the fund’s net asset value, or after the halt of trading
Notes to Financial Statements (unaudited) - continued
of a specific security where trading does not resume prior to the close of the exchange or market on which the security is principally traded. Events that occur after foreign markets close (such as developments in foreign markets and significant movements in the U.S. markets) and prior to the determination of the fund’s net asset value may be deemed to have a material effect on the value of securities traded in foreign markets. Accordingly, the fund’s foreign equity securities may often be valued at fair value. The adviser generally relies on third-party pricing services or other information (such as the correlation with price movements of similar securities in the same or other markets; the type, cost and investment characteristics of the security; the business and financial condition of the issuer; and trading and other market data) to assist in determining whether to fair value and at what value to fair value an investment. The value of an investment for purposes of calculating the fund’s net asset value can differ depending on the source and method used to determine value. When fair valuation is used, the value of an investment used to determine the fund’s net asset value may differ from quoted or published prices for the same investment. There can be no assurance that the fund could obtain the fair value assigned to an investment if it were to sell the investment at the same time at which the fund determines its net asset value per share.
Various inputs are used in determining the value of the fund's assets or liabilities. These inputs are categorized into three broad levels. In certain cases, the inputs used to measure fair value may fall into different levels of the fair value hierarchy. In such cases, an investment's level within the fair value hierarchy is based on the lowest level of input that is significant to the fair value measurement. The fund's assessment of the significance of a particular input to the fair value measurement in its entirety requires judgment, and considers factors specific to the investment. Level 1 includes unadjusted quoted prices in active markets for identical assets or liabilities. Level 2 includes other significant observable market-based inputs (including quoted prices for similar securities, interest rates, prepayment speed, and credit risk). Level 3 includes unobservable inputs, which may include the adviser's own assumptions in determining the fair value of investments. The following is a summary of the levels used as of June 30, 2020 in valuing the fund's assets or liabilities:
| Financial Instruments | Level 1 | Level 2 | Level 3 | Total |
| Equity Securities | $771,476,839 | $— | $— | $771,476,839 |
| Mutual Funds | 26,054,557 | — | — | 26,054,557 |
| Total | $797,531,396 | $— | $— | $797,531,396 |
For further information regarding security characteristics, see the Portfolio of Investments.
Foreign Currency Translation — Purchases and sales of foreign investments, income, and expenses are converted into U.S. dollars based upon currency exchange rates prevailing on the respective dates of such transactions or on the reporting date for foreign denominated receivables and payables. Gains and losses attributable to foreign currency exchange rates on sales of securities are recorded for financial statement purposes as net realized gains and losses on investments. Gains and losses attributable to foreign exchange rate movements on receivables, payables, income and expenses are recorded for financial statement purposes as foreign currency transaction gains and losses. That portion of both realized and unrealized gains and losses on investments that results from fluctuations in foreign currency exchange rates is not separately disclosed.
Security Loans — Under its Securities Lending Agency Agreement with the fund, State Street Bank and Trust Company, as lending agent, loans the securities of the fund to certain qualified institutions (the “Borrowers”) approved by the fund. Security loans can be terminated at the discretion of either the lending agent or the fund and the related securities must be returned within the earlier of the standard trade settlement period for such securities or within three business days. The loans are collateralized by cash and/or U.S. Treasury and federal agency obligations in an amount typically at least equal to the market value of the securities loaned. On loans collateralized by cash, the cash collateral is invested in a money market fund. The market value of the loaned securities is determined at the close of business of the fund and any additional required collateral is delivered to the fund on the next business day. The lending agent provides the fund with indemnification against Borrower default. In the event of Borrower default, the lending agent will, for the benefit of the fund, either purchase securities identical to those loaned or, when such purchase is commercially impracticable, pay the fund the market value of the loaned securities. In return, the lending agent assumes the fund's rights to the related collateral. If the collateral value is less than the cost to purchase identical securities, the lending agent is responsible for the shortfall, but only to the extent that such shortfall is not due to a decline in collateral value resulting from collateral reinvestment for which the fund bears the risk of loss. At period end, the fund had investment securities on loan, all of which were classified as equity securities in the fund's Portfolio of Investments, with a fair value of $5,430,473. The fair value of the fund's investment securities on loan and a related liability of $3,419,519 for cash collateral received on securities loaned are both presented gross in the Statement of Assets and Liabilities. Additionally, these loans were collateralized by U.S. Treasury Obligations of $2,052,296 held by the lending agent. The collateral on securities loaned exceeded the value of securities on loan at period end. The liability for cash collateral for securities loaned is carried at fair value, which is categorized as level 2 within the fair value hierarchy. A portion of the income generated upon investment of the collateral is remitted to the Borrowers, and the remainder is allocated
Notes to Financial Statements (unaudited) - continued
between the fund and the lending agent. On loans collateralized by U.S. Treasury and/or federal agency obligations, a fee is received from the Borrower, and is allocated between the fund and the lending agent. Income from securities lending is separately reported in the Statement of Operations. The dividend and interest income earned on the securities loaned is accounted for in the same manner as other dividend and interest income.
Indemnifications — Under the fund's organizational documents, its officers and Trustees may be indemnified against certain liabilities and expenses arising out of the performance of their duties to the fund. Additionally, in the normal course of business, the fund enters into agreements with service providers that may contain indemnification clauses. The fund's maximum exposure under these agreements is unknown as this would involve future claims that may be made against the fund that have not yet occurred.
Investment Transactions and Income — Investment transactions are recorded on the trade date. Interest income is recorded on the accrual basis. Dividends received in cash are recorded on the ex-dividend date. Certain dividends from foreign securities will be recorded when the fund is informed of the dividend if such information is obtained subsequent to the ex-dividend date. Dividend payments received in additional securities are recorded on the ex-dividend date in an amount equal to the value of the security on such date.
The fund may receive proceeds from litigation settlements. Any proceeds received from litigation involving portfolio holdings are reflected in the Statement of Operations in realized gain/loss if the security has been disposed of by the fund or in unrealized gain/loss if the security is still held by the fund. Any other proceeds from litigation not related to portfolio holdings are reflected as other income in the Statement of Operations.
Tax Matters and Distributions — The fund intends to qualify as a regulated investment company, as defined under Subchapter M of the Internal Revenue Code, and to distribute all of its taxable income, including realized capital gains. As a result, no provision for federal income tax is required. The fund’s federal tax returns, when filed, will remain subject to examination by the Internal Revenue Service for a three year period. Management has analyzed the fund’s tax positions taken on federal and state tax returns for all open tax years and does not believe that there are any uncertain tax positions that require recognition of a tax liability. Foreign taxes, if any, have been accrued by the fund in the accompanying financial statements in accordance with the applicable foreign tax law. Foreign income taxes may be withheld by certain countries in which the fund invests. Additionally, capital gains realized by the fund on securities issued in or by certain foreign countries may be subject to capital gains tax imposed by those countries.
Distributions to shareholders are recorded on the ex-dividend date. Income and capital gain distributions are determined in accordance with income tax regulations, which may differ from U.S. generally accepted accounting principles. Certain capital accounts in the financial statements are periodically adjusted for permanent differences in order to reflect their tax character. These adjustments have no impact on net assets or net asset value per share. Temporary differences which arise from recognizing certain items of income, expense, gain or loss in different periods for financial statement and tax purposes will reverse at some time in the future.
Book/tax differences primarily relate to wash sale loss deferrals.
The tax character of distributions declared to shareholders for the last fiscal year is as follows:
| | Year ended
12/31/19 |
| Ordinary income (including any short-term capital gains) | $47,170,114 |
| Long-term capital gains | 92,955,347 |
| Total distributions | $140,125,461 |
The federal tax cost and the tax basis components of distributable earnings were as follows:
| As of 6/30/20 | |
| Cost of investments | $590,831,853 |
| Gross appreciation | 235,184,359 |
| Gross depreciation | (28,484,816) |
| Net unrealized appreciation (depreciation) | $206,699,543 |
| As of 12/31/19 | |
| Undistributed ordinary income | 24,422,627 |
| Undistributed long-term capital gain | 56,870,869 |
| Other temporary differences | 1,523 |
| Net unrealized appreciation (depreciation) | 187,299,860 |
Notes to Financial Statements (unaudited) - continued
The aggregate cost above includes prior fiscal year end tax adjustments, if applicable.
Multiple Classes of Shares of Beneficial Interest — The fund offers multiple classes of shares, which differ in their respective distribution and/or service fees. The fund's income, realized and unrealized gain (loss), and common expenses are allocated to shareholders based on the daily net assets of each class. Dividends are declared separately for each class. Differences in per share dividend rates are generally due to differences in separate class expenses. The fund’s distributions declared to shareholders as reported in the Statements of Changes in Net Assets are presented by class as follows:
| | Six months ended
6/30/20 | | Year ended
12/31/19 |
| Initial Class | $— | | $57,060,289 |
| Service Class | — | | 83,065,172 |
| Total | $— | | $140,125,461 |
(3) Transactions with Affiliates
Investment Adviser — The fund has an investment advisory agreement with MFS to provide overall investment management and related administrative services and facilities to the fund. The management fee is computed daily and paid monthly at the following annual rates based on the fund's average daily net assets:
| Up to $1 billion | 0.90% |
| In excess of $1 billion | 0.80% |
MFS has agreed in writing to reduce its management fee by a specified amount if certain MFS mutual fund assets exceed thresholds agreed to by MFS and the fund's Board of Trustees. For the six months ended June 30, 2020, this management fee reduction amounted to $39,513, which is included in the reduction of total expenses in the Statement of Operations. The management fee incurred for the six months ended June 30, 2020 was equivalent to an annual effective rate of 0.89% of the fund's average daily net assets.
The investment adviser has agreed in writing to pay a portion of the fund’s total annual operating expenses, excluding interest, taxes, extraordinary expenses, brokerage and transaction costs, and investment-related expenses, such that total annual operating expenses do not exceed 0.94% of average daily net assets for the Initial Class shares and 1.19% of average daily net assets for the Service Class shares. This written agreement will terminate on July 31, 2020. For the six months ended June 30, 2020, this reduction amounted to $15,622, which is included in the reduction of total expenses in the Statement of Operations. Effective August 1, 2020, the investment adviser has agreed in writing to pay a portion of the fund’s total annual operating expenses, excluding interest, taxes, extraordinary expenses, brokerage and transaction costs, and investment-related expenses, such that total annual operating expenses do not exceed 0.87% of average daily net assets for the Initial Class shares and 1.12% of average daily net assets for the Service Class shares. This written agreement will continue until modified by the fund’s Board of Trustees, but such agreement will continue at least until April 30, 2022.
Distributor — MFS Fund Distributors, Inc. (MFD), a wholly-owned subsidiary of MFS, is the distributor of shares of the fund. The Trustees have adopted a distribution plan for the Service Class shares pursuant to Rule 12b-1 under the Investment Company Act of 1940.
The fund's distribution plan provides that the fund will pay MFD distribution and/or service fees equal to 0.25% per annum of its average daily net assets attributable to Service Class shares as partial consideration for services performed and expenses incurred by MFD and financial intermediaries (including participating insurance companies that invest in the fund to fund variable annuity and variable life insurance contracts, sponsors of qualified retirement and pension plans that invest in the fund, and affiliates of these participating insurance companies and plan sponsors) in connection with the sale and distribution of the Service Class shares. MFD may subsequently pay all, or a portion, of the distribution and/or service fees to financial intermediaries.
Shareholder Servicing Agent — MFS Service Center, Inc. (MFSC), a wholly-owned subsidiary of MFS, receives a fee from the fund for its services as shareholder servicing agent. For the six months ended June 30, 2020, the fee was $15,387, which equated to 0.0042% annually of the fund's average daily net assets. MFSC also receives payment from the fund for out-of-pocket expenses paid by MFSC on behalf of the fund. For the six months ended June 30, 2020, these costs amounted to $1,488.
Administrator — MFS provides certain financial, legal, shareholder communications, compliance, and other administrative services to the fund. Under an administrative services agreement, the fund reimburses MFS the costs incurred to provide these services. The fund is charged an annual fixed amount of $17,500 plus a fee based on average daily net assets. The administrative services fee incurred for the six months ended June 30, 2020 was equivalent to an annual effective rate of 0.0151% of the fund's average daily net assets.
Notes to Financial Statements (unaudited) - continued
Trustees’ and Officers’ Compensation — The fund pays compensation to independent Trustees in the form of a retainer, attendance fees, and additional compensation to Board and Committee chairpersons. The fund does not pay compensation directly to Trustees or officers of the fund who are also officers of the investment adviser, all of whom receive remuneration from MFS for their services to the fund. Certain officers and Trustees of the fund are officers or directors of MFS, MFD, and MFSC.
Other — The fund invests in the MFS Institutional Money Market Portfolio which is managed by MFS and seeks current income consistent with preservation of capital and liquidity. This money market fund does not pay a management fee to MFS but does incur investment and operating costs.
The fund is permitted to engage in purchase and sale transactions with funds and accounts for which MFS serves as investment adviser or sub-adviser (“cross-trades”) pursuant to a policy adopted by the Board of Trustees. This policy has been designed to ensure that cross-trades conducted by the fund comply with Rule 17a-7 under the Investment Company Act of 1940. During the six months ended June 30, 2020, the fund engaged in sale transactions pursuant to this policy, which amounted to $539,353. The sales transactions resulted in net realized gains (losses) of $(28,615).
The adviser has voluntarily undertaken to reimburse the fund from its own resources on a quarterly basis for the cost of investment research embedded in the cost of the fund’s securities trades. This agreement may be rescinded at any time. For the six months ended June 30, 2020, this reimbursement amounted to $27,034, which is included in “Other” income in the Statement of Operations.
(4) Portfolio Securities
For the six months ended June 30, 2020, purchases and sales of investments, other than short-term obligations, aggregated $292,144,535 and $357,064,045, respectively.
(5) Shares of Beneficial Interest
The fund's Declaration of Trust permits the Trustees to issue an unlimited number of full and fractional shares of beneficial interest. Transactions in fund shares were as follows:
| | Six months ended
6/30/20 | | Year ended
12/31/19 |
| | Shares | Amount | | Shares | Amount |
| Shares sold | | | | | |
| Initial Class | 1,049,270 | $18,176,400 | | 1,458,759 | $29,581,160 |
| Service Class | 1,829,596 | 29,034,543 | | 3,433,407 | 62,530,706 |
| | 2,878,866 | $47,210,943 | | 4,892,166 | $92,111,866 |
Shares issued to shareholders in
reinvestment of distributions | | | | | |
| Initial Class | — | $— | | 3,140,358 | $57,060,289 |
| Service Class | — | — | | 5,140,172 | 83,065,172 |
| | — | $— | | 8,280,530 | $140,125,461 |
| Shares reacquired | | | | | |
| Initial Class | (2,136,031) | $(41,130,636) | | (3,255,470) | $(67,473,742) |
| Service Class | (3,966,577) | (67,379,181) | | (4,923,843) | (91,929,496) |
| | (6,102,608) | $(108,509,817) | | (8,179,313) | $(159,403,238) |
| Net change | | | | | |
| Initial Class | (1,086,761) | $(22,954,236) | | 1,343,647 | $19,167,707 |
| Service Class | (2,136,981) | (38,344,638) | | 3,649,736 | 53,666,382 |
| | (3,223,742) | $(61,298,874) | | 4,993,383 | $72,834,089 |
The fund is one of several mutual funds in which certain MFS funds may invest. The MFS funds do not invest in the underlying funds for the purpose of exercising management or control. At the end of the period, the MFS Moderate Allocation Portfolio was the owner of record of approximately 3% of the value of outstanding voting shares of the fund. In addition, the MFS Growth Allocation Portfolio and the MFS Conservative Allocation Portfolio were the owners of record of less than 1% of the value of outstanding voting shares of the fund.
Notes to Financial Statements (unaudited) - continued
(6) Line of Credit
The fund and certain other funds managed by MFS participate in a $1.25 billion unsecured committed line of credit, subject to a $1 billion sublimit, provided by a syndicate of banks under a credit agreement. Borrowings may be made for temporary financing needs. Interest is charged to each fund, based on its borrowings, generally at a rate equal to the highest of one month LIBOR, the Federal Funds Effective Rate and the Overnight Bank Funding Rate, plus an agreed upon spread. A commitment fee, based on the average daily, unused portion of the committed line of credit, is allocated among the participating funds. In addition, the fund and other funds managed by MFS have established unsecured uncommitted borrowing arrangements with certain banks for temporary financing needs. Interest is charged to each fund, based on its borrowings, at rates equal to customary reference rates plus an agreed upon spread. For the six months ended June 30, 2020, the fund’s commitment fee and interest expense were $1,834 and $0, respectively, and are included in “Miscellaneous” expense in the Statement of Operations.
(7) Investments in Affiliated Issuers
An affiliated issuer may be considered one in which the fund owns 5% or more of the outstanding voting securities, or a company which is under common control. For the purposes of this report, the following were affiliated issuers:
| Affiliated Issuers | Beginning
Value | Purchases | Sales
Proceeds | Realized
Gain
(Loss) | Change in
Unrealized
Appreciation or
Depreciation | Ending
Value |
| MFS Institutional Money Market Portfolio | $20,765,476 | $159,958,453 | $158,087,038 | $(1,830) | $(23) | $22,635,038 |
| Affiliated Issuers | Dividend
Income | Capital Gain
Distributions |
| MFS Institutional Money Market Portfolio | $66,136 | $— |
(8) Impacts of COVID-19
The pandemic related to the global spread of novel coronavirus disease (COVID-19), which was first detected in December 2019, has resulted in significant disruptions to global business activity and the global economy, as well as the economies of individual countries, the financial performance of individual companies and sectors, and the securities and commodities markets in general. This pandemic, the full effects of which are still unknown, has resulted in substantial market volatility and may have adversely impacted the prices and liquidity of the fund's investments and the fund's performance.
Statement Regarding Liquidity Risk Management Program
The fund has adopted and implemented a liquidity risk management program (the “Program”) as required by Rule 22e-4 under the Investment Company Act of 1940, as amended. The fund’s Board of Trustees (the “Board”) has designated MFS as the administrator of the Program. The Program is reasonably designed to assess and manage the liquidity risk of the fund. Liquidity risk is the risk that the fund could not meet requests to redeem shares issued by the fund without significant dilution of remaining investors' interests.
MFS provided a written report to the Board for consideration at its April 2020 meeting that addressed the operation of the Program and provided an assessment of the adequacy and effectiveness of the Program during the period from the adoption of the Program on December 1, 2018 to December 31, 2019 (the “Covered Period”). The report concluded that during the Covered Period the Program had operated effectively and had adequately and effectively been implemented to assess and manage the fund’s liquidity risk. MFS also reported that there were no liquidity events that impacted the fund or its ability to timely meet redemptions without dilution to existing shareholders during the Covered Period.
There can be no assurance that the Program will achieve its objectives in the future. Further information on liquidity risk, and other principal risks to which an investment in the fund may be subject, can be found in the prospectus.
Proxy Voting Policies and Information
MFS votes proxies on behalf of the fund pursuant to proxy voting policies and procedures that are available without charge, upon request, by calling 1-800-225-2606, by visiting mfs.com/proxyvoting, or by visiting the SEC’s Web site at http://www.sec.gov.
Information regarding how the fund voted proxies relating to portfolio securities during the most recent twelve-month period ended June 30 is available by August 31 of each year without charge by visiting mfs.com/proxyvoting, or by visiting the SEC’s Web site at http://www.sec.gov.
Quarterly Portfolio Disclosure
The fund files a complete schedule of portfolio holdings with the SEC for the first and third quarters of each fiscal year as an exhibit to its reports on Form N-PORT. The fund’s Form N-PORT reports are available on the SEC’s website at http://www.sec.gov. A shareholder can obtain the portfolio holdings report for the first and third quarters of the fund's fiscal year at mfs.com/vit1 by choosing the fund's name and then selecting the “Resources” tab and clicking on “Prospectus and Reports”.
FURTHER INFORMATION
From time to time, MFS may post important information about the fund or the MFS funds on the MFS web site (mfs.com). This information is available at https://www.mfs.com/announcements or at mfs.com/vit1 by choosing the fund's name and then selecting the “Resources” tab and clicking on the “Announcements” tab, if any.
Information About Fund Contracts and Legal Claims
The fund has entered into contractual arrangements with an investment adviser, administrator, distributor, shareholder servicing agent, 529 program manager (if applicable), and custodian who each provide services to the fund. Unless expressly stated otherwise, shareholders are not parties to, or intended beneficiaries of these contractual arrangements, and these contractual arrangements are not intended to create any shareholder right to enforce them against the service providers or to seek any remedy under them against the service providers, either directly or on behalf of the fund.
Under the Trust’s By-Laws and Declaration of Trust, any claims asserted against or on behalf of the MFS Funds, including claims against Trustees and Officers, must be brought in state and federal courts located within the Commonwealth of Massachusetts.
Semiannual Report
June 30, 2020
MFS® Total Return Bond Series
MFS® Variable Insurance Trust
Beginning on January 1, 2021, as permitted by regulations adopted by the U.S. Securities and Exchange Commission, the insurance company that offers your contract may determine that it will no longer send you paper copies of the fund's annual and semiannual shareholder reports unless you specifically request paper copies from the insurance company or from your financial intermediary. Instead, the shareholder reports will be made available on a Web site (insurancefunds.mfs.com or other Web site of which you will be notified), and the insurance company will notify you by mail each time a report is posted and provide you with a Web site link to access the report. Instructions for requesting paper copies will be provided by your insurance company or financial intermediary.
If you already elected to receive shareholder reports by email, you will not be affected by this change and you need not take any action. If your insurance company or financial intermediary offers electronic delivery, you may elect to receive shareholder reports and other communications from the insurance company or financial intermediary by email by following the instructions provided by the insurance company or financial intermediary.
Beginning on January 1, 2019, you may elect to receive all future reports in paper free of charge from the insurance company or financial intermediary. You can inform the insurance company or financial intermediary that you wish to continue receiving paper copies of your shareholder reports by contacting your insurance company or financial intermediary. Your election to receive reports in paper will apply to all funds held in your account with your insurance company or financial intermediary.
The report is prepared for the general information of contract owners. It is authorized for distribution to prospective investors only when preceded or accompanied by a current prospectus.
NOT FDIC INSURED • MAY LOSE VALUE • NO BANK OR CREDIT UNION GUARANTEE •
NOT A DEPOSIT • NOT INSURED BY ANY FEDERAL GOVERNMENT AGENCY OR NCUA/NCUSIF
MFS Total Return Bond Series
LETTER FROM THE EXECUTIVE CHAIR
Dear Contract Owners:
Markets experienced dramatic swings in early 2020, as the coronavirus pandemic brought the global economy to a standstill for several months. Optimism over the development of vaccines and therapeutics, along with a decline in cases in countries that had been affected by the outbreak early on, brightened the economic and market outlook during the second quarter, as did the phased reopening of US states. However, a great deal of uncertainty remains, including the possibility of a second wave of cases later this year, as many countries continue to experience COVID-19 flare-ups.
Global central banks have taken aggressive steps to cushion the economic and market fallout related to the virus, and governments are deploying unprecedented levels of fiscal support. As uncertainty recedes, these measures can help build a supportive environment and encourage economic recovery; however, if markets disconnect from fundamentals, they can also sow the seeds of instability. In the aftermath of the crisis, societal changes may be likely, as households, businesses, and governments adjust to a new reality, and these alterations could affect the investment landscape. For investors, events, such as the COVID-19 outbreak, demonstrate the importance of having a deep understanding of company fundamentals, and we have built our global research platform to do just that.
Here at MFS®, we aim to help our clients navigate the growing complexity of the markets and world economies. Our long-term investment philosophy and commitment to the responsible allocation of capital allow us to tune out the noise and uncover what we believe are the best, most durable investment opportunities in the market. Through our unique global investment platform, we combine collective expertise, thoughtful risk management, and long-term discipline to create sustainable value for investors.
Respectfully,
Robert J. Manning
Executive Chair
MFS Investment Management
August 17, 2020
The opinions expressed in this letter are subject to change and may not be relied upon for investment advice. No forecasts can be guaranteed.
MFS Total Return Bond Series
Portfolio structure reflecting equivalent exposure of derivative positions (i)
Fixed income sectors (i)
| Investment Grade Corporates | 44.5% |
| Mortgage-Backed Securities | 20.8% |
| Commercial Mortgage-Backed Securities | 10.9% |
| Collateralized Debt Obligations | 8.6% |
| High Yield Corporates | 7.8% |
| U.S. Treasury Securities | 3.6% |
| Municipal Bonds | 3.3% |
| Asset-Backed Securities | 2.7% |
| U.S. Government Agencies | 1.7% |
| Emerging Markets Bonds | 0.9% |
| Residential Mortgage-Backed Securities | 0.6% |
| Non-U.S. Government Bonds | 0.2% |
Composition including fixed income credit quality (a)(i)
| AAA | 12.4% |
| AA | 6.4% |
| A | 15.5% |
| BBB | 31.5% |
| BB | 6.0% |
| B | 1.1% |
| CCC | 0.1% |
| D (o) | 0.0% |
| Federal Agencies | 22.4% |
| Not Rated | 10.2% |
| Cash & Cash Equivalents | (0.4)% |
| Other | (5.2)% |
Portfolio facts (i)
| Average Duration (d) | 6.1 |
| Average Effective Maturity (m) | 8.4 yrs. |
| (a) | For all securities other than those specifically described below, ratings are assigned to underlying securities utilizing ratings from Moody’s, Fitch, and Standard & Poor’s rating agencies and applying the following hierarchy: If all three agencies provide a rating, the middle rating (after dropping the highest and lowest ratings) is assigned; if two of the three agencies rate a security, the lower of the two is assigned. Ratings are shown in the S&P and Fitch scale (e.g., AAA). Securities rated BBB or higher are considered investment grade. All ratings are subject to change.Federal Agencies includes rated and unrated U.S. Agency fixed-income securities, U.S. Agency mortgage-backed securities, and collateralized mortgage obligations of U.S. Agency mortgage-backed securities.Non-Fixed Income includes any equity securities (including convertible bonds and equity derivatives) and/or commodity-linked derivatives.The fund may or may not have held all of these instruments on this date. The fund is not rated by these agencies. |
| (d) | Duration is a measure of how much a bond’s price is likely to fluctuate with general changes in interest rates, e.g., if rates rise 1.00%, a bond with a 5-year duration is likely to lose about 5.00% of its value due to the interest rate move. |
| (i) | For purposes of this presentation, the components include the value of securities, and reflect the impact of the equivalent exposure of derivative positions, if any. These amounts may be negative from time to time. Equivalent exposure is a calculated amount that translates the derivative position into a reasonable approximation of the amount of the underlying asset that the portfolio would have to hold at a given point in time to have the same price sensitivity that results from the portfolio’s ownership of the derivative contract. When dealing with derivatives, equivalent exposure is a more representative measure of the potential impact of a position on portfolio performance than value. The bond component will include any accrued interest amounts. |
| (m) | In determining each instrument’s effective maturity for purposes of calculating the fund’s dollar-weighted average effective maturity, MFS uses the instrument’s stated maturity or, if applicable, an earlier date on which MFS believes it is probable that a maturity-shortening device (such as a put, pre-refunding or prepayment) will cause the instrument to be repaid. Such an earlier date can be substantially shorter than the instrument’s stated maturity. |
Cash & Cash Equivalents includes any cash, investments in money market funds, short-term securities, and other assets less liabilities. Please see the Statement of Assets and Liabilities for additional information related to the fund’s cash position and other assets and liabilities.
From time to time Cash & Cash Equivalents may be negative due to timing of cash receipts and disbursements.
Other includes equivalent exposure from currency derivatives and/or any offsets to derivative positions and may be negative.
Percentages are based on net assets as of June 30, 2020.
The portfolio is actively managed and current holdings may be different.
MFS Total Return Bond Series
Expense Table
Fund Expenses Borne by the Contract Holders during the Period,
January 1, 2020 through June 30, 2020
As a contract holder of the fund, you incur ongoing costs, including management fees; distribution and/or service (12b-1) fees; and other fund expenses. This example is intended to help you understand your ongoing costs (in dollars) of investing in the fund and to compare these costs with the ongoing costs of investing in other mutual funds.
The example is based on an investment of $1,000 invested at the beginning of the period and held for the entire period January 1, 2020 through June 30, 2020.
Actual Expenses
The first line for each share class in the following table provides information about actual account values and actual expenses. You may use the information in this line, together with the amount you invested, to estimate the expenses that you paid over the period. Simply divide your account value by $1,000 (for example, an $8,600 account value divided by $1,000 = 8.6), then multiply the result by the number in the first line under the heading entitled “Expenses Paid During Period” to estimate the expenses you paid on your account during this period.
Hypothetical Example for Comparison Purposes
The second line for each share class in the following table provides information about hypothetical account values and hypothetical expenses based on the fund’s actual expense ratio and an assumed rate of return of 5% per year before expenses, which is not the fund’s actual return. The hypothetical account values and expenses may not be used to estimate the actual ending account balance or expenses you paid for the period. You may use this information to compare the ongoing costs of investing in the fund and other funds. To do so, compare this 5% hypothetical example with the 5% hypothetical examples that appear in the shareholder reports of the other funds.
Please note that the expenses shown in the table are meant to highlight the fund's ongoing costs only and do not take into account the fees and expenses imposed under the variable contracts through which your investment in the fund is made. Therefore, the second line for each share class in the table is useful in comparing ongoing costs associated with an investment in vehicles (such as the fund) which fund benefits under variable annuity and variable life insurance contracts and to qualified pension and retirement plans only, and will not help you determine the relative total costs of investing in the fund through variable annuity and variable life insurance contracts. If the fees and expenses imposed under the variable contracts were included, your costs would have been higher.
Share
Class | | Annualized
Expense
Ratio | Beginning
Account Value
1/01/20 | Ending
Account Value
6/30/20 | Expenses
Paid During
Period (p)
1/01/20-6/30/20 |
| Initial Class | Actual | 0.53% | $1,000.00 | $1,041.54 | $2.69 |
| Hypothetical (h) | 0.53% | $1,000.00 | $1,022.23 | $2.66 |
| Service Class | Actual | 0.78% | $1,000.00 | $1,040.03 | $3.96 |
| Hypothetical (h) | 0.78% | $1,000.00 | $1,020.98 | $3.92 |
| (h) | 5% class return per year before expenses. |
| (p) | “Expenses Paid During Period” are equal to each class's annualized expense ratio, as shown above, multiplied by the average account value over the period, multiplied by 182/366 (to reflect the one-half year period). |
MFS Total Return Bond Series
Portfolio of Investments − 6/30/20 (unaudited)
The Portfolio of Investments is a complete list of all securities owned by your fund. It is categorized by broad-based asset classes.
| Issuer | | | Shares/Par | Value ($) |
| Bonds – 99.8% |
| Aerospace – 1.1% |
| Boeing Co., 5.805%, 5/01/2050 | | $ | 7,000,000 | $ 8,266,899 |
| Raytheon Technologies Corp., 4.125%, 11/16/2028 | | | 2,100,000 | 2,473,556 |
| Raytheon Technologies Corp., 4.05%, 5/04/2047 | | | 3,608,000 | 4,311,688 |
| TransDigm, Inc., 6.5%, 7/15/2024 | | | 5,985,000 | 5,714,418 |
| | | | | $20,766,561 |
| Asset-Backed & Securitized – 22.7% |
| Allegro CLO Ltd., 2014-1RA, “A2”, FLR, 2.709% (LIBOR - 3mo. + 1.6%), 10/21/2028 (n) | | $ | 5,554,267 | $ 5,343,399 |
| ALM Loan Funding, CLO, 2015-16A, “AAR2”, FLR, 2.118% (LIBOR - 3mo. + 0.90%), 7/15/2027 (n) | | | 1,727,405 | 1,709,506 |
| Arbor Realty Trust, Inc., CLO, 2018-FL1, “A”, FLR, 1.334% (LIBOR - 1mo. + 1.15%), 6/15/2028 (n) | | | 7,720,000 | 7,576,232 |
| Arbor Realty Trust, Inc., CLO, 2019-FL1, “D”, FLR, 2.684% (LIBOR - 1mo. + 2.5%), 5/15/2037 (n) | | | 6,995,000 | 6,243,226 |
| Arbor Realty Trust, Inc., CLO, 2020-FL1, “C”, FLR, 2.234% (LIBOR - 1mo. + 2.05%), 2/15/2035 (n) | | | 3,529,000 | 3,300,892 |
| AREIT CRE Trust, 2019-CRE3, “A”, FLR, 1.215% (LIBOR - 1mo. + 1.02%), 9/14/2036 (n) | | | 1,230,000 | 1,179,263 |
| AREIT CRE Trust, 2019-CRE3, “B”, FLR, 1.745% (LIBOR - 1mo. + 1.55%), 9/14/2036 (n) | | | 2,569,500 | 2,332,775 |
| AREIT CRE Trust, 2019-CRE3, “C”, FLR, 2.095% (LIBOR - 1mo. + 1.9%), 9/14/2036 (n) | | | 2,242,500 | 1,984,817 |
| AREIT CRE Trust, 2019-CRE3, “D”, FLR, 2.845% (LIBOR - 1mo. + 2.65%), 9/14/2036 (n) | | | 1,849,000 | 1,621,120 |
| Atrium XII Corp., 2012-A, “B1R”, FLR, 2.447% (LIBOR - 3mo. + 1.35%), 4/22/2027 (n) | | | 7,430,000 | 7,123,713 |
| Bancorp Commercial Mortgage Trust, 2017-CRE2, “B”, FLR, 1.784% (LIBOR - 1mo. + 1.6%), 8/15/2032 (z) | | | 2,312,000 | 2,292,375 |
| Bancorp Commercial Mortgage Trust, 2018-CRE3, “A”, FLR, 1.034% (LIBOR - 1mo. + 0.85%), 1/15/2033 (n) | | | 520,986 | 496,144 |
| Bancorp Commercial Mortgage Trust, 2018-CRE3, “AS”, FLR, 1.434% (LIBOR - 1mo. + 1.25%), 1/15/2033 (n) | | | 3,929,321 | 3,703,427 |
| Bancorp Commercial Mortgage Trust, 2018-CRE3, “D”, FLR, 2.884% (LIBOR - 1mo. + 2.7%), 1/15/2033 (n) | | | 1,668,091 | 1,489,108 |
| Issuer | | | Shares/Par | Value ($) |
| Bonds – continued |
| Asset-Backed & Securitized – continued |
| Bancorp Commercial Mortgage Trust, 2018-CRE4, “AS”, FLR, 1.284% (LIBOR - 1mo. + 1.1%), 9/15/2035 (n) | | $ | 2,255,000 | $ 2,121,015 |
| Bancorp Commercial Mortgage Trust, 2018-CRE4, “B”, FLR, 1.434% (LIBOR - 1mo. + 1.25%), 9/15/2035 (n) | | | 2,030,000 | 1,868,360 |
| Bancorp Commercial Mortgage Trust, 2018-CRE4, “D”, FLR, 2.284% (LIBOR - 1mo. + 2.1%), 9/15/2035 (n) | | | 1,465,000 | 1,301,144 |
| Bancorp Commercial Mortgage Trust, 2019-CRE5, “A”, FLR, 1.184% (LIBOR - 1mo. + 1%), 3/15/2036 (n) | | | 3,810,169 | 3,672,050 |
| Bancorp Commercial Mortgage Trust, 2019-CRE5, “AS”, FLR, 1.534% (LIBOR - 1mo. + 1.35%), 3/15/2036 (n) | | | 1,394,437 | 1,264,832 |
| Bancorp Commercial Mortgage Trust, 2019-CRE6, “B”, FLR, 1.734% (LIBOR - 1mo. + 1.55%), 9/15/2036 (n) | | | 8,289,572 | 7,754,846 |
| Bancorp Commercial Mortgage Trust, 2019-CRE6, “D”, FLR, 2.484% (LIBOR - 1mo. + 2.54%), 9/15/2036 (n) | | | 545,000 | 490,703 |
| Barclays Commercial Mortgage Securities LLC, 2019-C5, “A4”, 3.063%, 11/15/2052 | | | 2,755,000 | 3,052,887 |
| Bayview Commercial Asset Trust, 0%, 12/25/2036 (i)(n) | | | 102,137 | 10 |
| Bayview Financial Revolving Mortgage Loan Trust, FLR, 1.784% (LIBOR - 1mo. + 1.6%), 12/28/2040 (n) | | | 55,592 | 55,951 |
| BDS Ltd., 2018-FL2, “A”, FLR, 1.143% (LIBOR - 1mo. + 0.95%), 8/15/2035 (n) | | | 2,208,953 | 2,175,818 |
| BDS Ltd., 2019-FL4, “A”, FLR, 1.294% (LIBOR - 1mo. + 1.10%), 8/15/2036 (n) | | | 5,165,000 | 5,016,925 |
| Bear Stearns Cos., Inc., “A2”, FLR, 0.634% (LIBOR - 1mo. + 0.45%), 12/25/2042 | | | 354,401 | 346,506 |
| BSPRT Ltd., 2019-FL5, “C”, FLR, 2.184% (LIBOR - 1mo. + 2%), 5/15/2029 (n) | | | 3,295,000 | 2,776,001 |
| Business Jet Securities LLC, 2018-1, “A”, 4.335%, 2/15/2033 (n) | | | 4,769,393 | 4,793,513 |
| BXMT Ltd., 2020-FL2, “B”, FLR, 1.593% (LIBOR - 1mo. + 1.4%), 2/16/2037 (n) | | | 1,731,000 | 1,631,110 |
| Cantor Commercial Real Estate, 2019-CF2, “A5”, 2.874%, 11/15/2052 | | | 6,645,635 | 6,869,060 |
MFS Total Return Bond Series
Portfolio of Investments (unaudited) – continued
| Issuer | | | Shares/Par | Value ($) |
| Bonds – continued |
| Asset-Backed & Securitized – continued |
| Capital Automotive, 2020-1A, “A4”, REIT, 3.19%, 2/15/2050 (n) | | $ | 2,409,054 | $ 2,343,810 |
| Chesapeake Funding II LLC, 2017-4A, “A1”, 2.12%, 11/15/2029 (n) | | | 2,162,930 | 2,177,842 |
| Chesapeake Funding II LLC, 2018-1A, “A1”, 3.04%, 4/15/2030 (n) | | | 2,788,702 | 2,849,788 |
| Citigroup Commercial Mortgage Trust, 2014-GC25, “A4”, 3.635%, 10/10/2047 | | | 3,128,793 | 3,382,363 |
| Citigroup Commercial Mortgage Trust, 2016-P6, “A5”, 3.72%, 12/10/2049 | | | 1,754,000 | 1,976,854 |
| Citigroup Commercial Mortgage Trust, 2019-C7, “A4”, 3.102%, 12/15/2072 | | | 790,000 | 880,311 |
| CLNC Ltd., 2019-FL1, “B”, FLR, 2.093% (LIBOR - 1mo. + 1.9%), 8/20/2035 (n) | | | 1,850,000 | 1,727,519 |
| CLNC Ltd., 2019-FL1, “C”, FLR, 2.593% (LIBOR - 1mo. + 2.4%), 8/20/2035 (n) | | | 3,006,500 | 2,588,312 |
| Commercial Mortgage Trust, 2012-CR2, “A4”, 3.147%, 8/15/2045 | | | 3,950,000 | 4,061,047 |
| Commercial Mortgage Trust, 2015-LC21, “A4”, 3.708%, 7/10/2048 | | | 10,000,000 | 10,990,204 |
| Commercial Mortgage Trust, 2015-PC1, “A5”, 3.902%, 7/10/2050 | | | 2,888,848 | 3,180,077 |
| CPS Auto Trust, 2019-B, “B”, 3.09%, 4/17/2023 (n) | | | 2,302,000 | 2,324,428 |
| CSAIL Commercial Mortgage Trust, 2015-C2, “A4”, 3.504%, 6/15/2057 | | | 2,695,346 | 2,913,529 |
| Cutwater Ltd., 2014-1A, “BR”, FLR, 3.618% (LIBOR - 3mo. + 2.4%), 7/15/2026 (n) | | | 3,135,000 | 3,023,388 |
| Cutwater Ltd., 2015-1A, “BR”, FLR, 3.018% (LIBOR - 3mo. + 1.8%), 1/15/2029 (n) | | | 10,770,000 | 10,394,332 |
| DT Auto Owner Trust, 2019-2A, “C”, 3.18%, 2/18/2025 (n) | | | 3,392,000 | 3,440,869 |
| Exantas Capital Corp. CLO Ltd., 2018-RS06, “B”, FLR, 1.343% (LIBOR - 1mo. + 1.15%), 6/15/2035 (n) | | | 2,090,000 | 2,004,282 |
| Exantas Capital Corp. CLO Ltd., 2019-RS07, “B”, FLR, 1.893% (LIBOR - 1mo. + 1.7%), 4/15/2036 (n) | | | 2,753,500 | 2,468,072 |
| Exeter Automobile Receivables Trust, 2020-1A, 2.49%, 1/15/2025 (n) | | | 1,905,000 | 1,922,737 |
| Flatiron CLO Ltd., 2015-1A, “BR”, FLR, 2.618% (LIBOR - 3mo. + 1.4%), 4/15/2027 (n) | | | 10,675,817 | 10,395,432 |
| Flatiron CLO Ltd., 2015-1A, “CR”, FLR, 3.118% (LIBOR - 3mo. + 1.9%), 4/15/2027 (n) | | | 1,970,000 | 1,901,752 |
| Fort CRE LLC, 2018-1A, “A1”, FLR, 1.54% (LIBOR - 1mo. + 1.35%), 11/16/2035 (n) | | | 6,199,500 | 6,139,222 |
| Galaxy CLO Ltd., 2018-29A, “A”, FLR, 1.182% (LIBOR - 3mo. + 0.79%), 11/15/2026 (n) | | | 5,074,315 | 4,989,498 |
| Issuer | | | Shares/Par | Value ($) |
| Bonds – continued |
| Asset-Backed & Securitized – continued |
| Galaxy CLO Ltd., 2018-29A, “B”, FLR, 1.792% (LIBOR - 3mo. + 1.4%), 11/15/2026 (n) | | $ | 2,878,803 | $ 2,785,887 |
| GLS Auto Receivables Trust, 2020-1A, “A”, 2.17%, 2/15/2024 (n) | | | 1,955,438 | 1,977,504 |
| GMF Floorplan Owner Revolving Trust, 2017-2, “C”, 2.63%, 7/15/2022 (n) | | | 3,932,000 | 3,928,254 |
| Grand Avenue CRE Ltd., 2019-FL1, “A”, FLR, 1.304% (LIBOR - 1mo. + 1.12%), 6/15/2037 (n) | | | 5,172,500 | 5,081,981 |
| Granite Point Mortgage Trust, Inc., 2018-FL1, “A” FLR, 1.093% (LIBOR - 1mo. + 0.9%), 11/21/2035 (n) | | | 1,230,640 | 1,219,973 |
| GS Mortgage Securities Trust, 2015-GC30, “A4”, 3.382%, 5/10/2050 | | | 7,904,407 | 8,544,964 |
| GS Mortgage Securities Trust, 2019-GSA1, “A4”, 3.047%, 11/10/2052 | | | 10,169,944 | 11,213,891 |
| HarbourView CLO VII Ltd., 7RA, “B”, FLR, 2.835% (LIBOR - 3mo. + 1.7%), 7/18/2031 (n) | | | 6,545,000 | 5,943,593 |
| Hunt CRE Ltd., 2018-FL2, “AS”, FLR, 1.634% (LIBOR - 1mo. + 1.45%), 8/15/2028 (n) | | | 875,000 | 830,684 |
| Hunt CRE Ltd., 2018-FL2, “B”, FLR, 1.834% (LIBOR - 1mo. + 1.65%), 8/15/2028 (n) | | | 1,800,000 | 1,681,055 |
| Hunt CRE Ltd., 2018-FL2, “C”, FLR, 2.534% (LIBOR - 1mo. + 2.35%), 8/15/2028 (n) | | | 595,000 | 571,200 |
| Invitation Homes Trust, 2018-SFR1, “B”, FLR, 0.893% (LIBOR - 1mo. + 0.7%), 3/17/2037 (n) | | | 9,090,410 | 8,925,288 |
| Invitation Homes Trust, 2018-SFR2, “A”, FLR, 1.043% (LIBOR - 1mo. + 0.85%), 12/17/2036 (n) | | | 1,253,981 | 1,238,518 |
| JPMBB Commercial Mortgage Securities Trust, 2015-C28, “A4”, 3.227%, 10/15/2048 | | | 12,188,428 | 13,043,326 |
| JPMorgan Chase Commercial Mortgage Securities Corp., 5.962%, 7/15/2042 (n) | | | 30,688 | 19,998 |
| JPMorgan Chase Commercial Mortgage Securities Corp., 3.454%, 9/15/2050 | | | 7,520,623 | 8,376,407 |
| JPMorgan Chase Commercial Mortgage Securities Corp., “A3”, 4.171%, 8/15/2046 | | | 92,601 | 94,531 |
| JPMorgan Mortgage Trust, “A1”, 3.314%, 10/25/2033 | | | 102,270 | 100,165 |
| KKR Real Estate Financial Trust, Inc., 2018-FL1, “C”, FLR, 2.193% (LIBOR - 1mo. + 2%), 6/15/2036 (n) | | | 5,197,500 | 4,937,625 |
| Lehman Brothers Commercial Conduit Mortgage Trust, 1.111%, 2/18/2030 (i) | | | 2,554 | 0 |
MFS Total Return Bond Series
Portfolio of Investments (unaudited) – continued
| Issuer | | | Shares/Par | Value ($) |
| Bonds – continued |
| Asset-Backed & Securitized – continued |
| LoanCore Ltd., 2018-CRE1, “AS”, FLR, 1.684% (LIBOR - 1mo. + 1.5%), 5/15/2028 (n) | | $ | 8,900,000 | $ 8,717,980 |
| LoanCore Ltd., 2018-CRE1, “C”, FLR, 2.734% (LIBOR - 1mo. + 2.55%), 5/15/2028 (n) | | | 2,340,000 | 2,193,194 |
| LoanCore Ltd., 2018-CRE1, “C”, FLR, 2.134% (LIBOR - 1mo. + 1.95%), 4/15/2034 (n) | | | 2,041,000 | 1,821,653 |
| LoanCore Ltd., 2018-CRE1/CRE3, “B”, FLR, 1.784% (LIBOR - 1mo. + 1.6%), 4/15/2034 (n) | | | 2,082,000 | 1,941,780 |
| LoanCore Ltd., 2019-CRE2, “D”, FLR, 2.634% (LIBOR - 1mo. + 2.45%), 5/15/2036 (n) | | | 1,121,500 | 923,068 |
| LoanCore Ltd., 2019-CRE3, “AS”, FLR, 1.554% (LIBOR - 1mo. + 1.37%), 4/15/2034 (n) | | | 1,618,000 | 1,540,957 |
| Loomis, Sayles & Co., CLO, 2015-2A, “A1R”, FLR, 2.118% (LIBOR - 3mo. + 0.9%), 4/15/2028 (n) | | | 2,978,780 | 2,881,425 |
| Merrill Lynch Mortgage Investors, Inc., “A”, 3.235%, 5/25/2036 | | | 164,573 | 159,071 |
| Merrill Lynch Mortgage Investors, Inc., “A5”, 3.413%, 4/25/2035 | | | 143,829 | 135,313 |
| MF1 CLO Ltd., 2019-FL2, “AS”, FLR, 1.614% (LIBOR - 1mo. + 1.43%), 12/25/2034 (n) | | | 11,245,000 | 10,851,718 |
| Morgan Stanley Bank of America/Merrill Lynch Trust, “A4”, 3.176%, 8/15/2045 | | | 5,000,000 | 5,110,403 |
| Navistar Financial Dealer Note Master Owner Trust, 2019-1, “A”, FLR, 0.824% (LIBOR - 1mo. + 0.64%), 5/25/2024 (n) | | | 6,175,000 | 6,152,057 |
| Neuberger Berman CLO Ltd., 2017-16SA, “B”, FLR, 2.468% (LIBOR - 3mo. + 1.25%), 1/15/2028 (n) | | | 4,360,000 | 4,218,431 |
| NextGear Floorplan Master Owner Trust, 2018-1A, “A2”, 3.22%, 2/15/2023 (n) | | | 3,250,000 | 3,265,679 |
| NextGear Floorplan Master Owner Trust, 2019-2A, “A2”, 2.07%, 10/15/2024 (n) | | | 2,465,000 | 2,428,082 |
| OCP CLO Ltd., 2015-9A, “A2R”, FLR, 2.568% (LIBOR - 3mo. + 1.35%), 7/15/2027 (n) | | | 6,280,000 | 6,117,078 |
| Palmer Square Loan Funding Ltd., 2020-1A, “A2”, FLR, 1.726% (LIBOR - 3mo. + 1.35%), 2/20/2028 (n) | | | 3,930,000 | 3,797,032 |
| Palmer Square Loan Funding Ltd., 2020-1A, “B”, FLR, 2.276% (LIBOR - 3mo. + 1.9%), 2/20/2028 (n) | | | 3,453,628 | 3,328,696 |
| Parallel Ltd., 2015-1A, “C1R”, FLR, 2.885% (LIBOR - 3mo. + 1.75%), 7/20/2027 (n) | | | 1,680,000 | 1,600,580 |
| Parallel Ltd., 2015-1A, “C2R”, FLR, 2.885% (LIBOR - 3mo. + 1.75%), 7/20/2027 (n) | | | 1,810,000 | 1,724,434 |
| Issuer | | | Shares/Par | Value ($) |
| Bonds – continued |
| Asset-Backed & Securitized – continued |
| Preferred Term Securities XIX Ltd., CDO, FLR, 0.663% (LIBOR - 3mo. + 0.35%), 12/22/2035 (n) | | $ | 247,001 | $ 205,937 |
| Race Point CLO Ltd., 2013-8A, “AR-2”, FLR, 1.416% (LIBOR - 3mo. + 1.04%), 2/20/2030 (n) | | | 3,727,257 | 3,662,448 |
| Residential Funding Mortgage Securities, Inc., 5.32%, 12/25/2035 | | | 16,771 | 16,803 |
| Santander Retail Auto Lease Trust, 2019-A, “B”, 3.01%, 5/22/2023 (n) | | | 3,222,000 | 3,269,293 |
| Santander Retail Auto Lease Trust, 2020-A, “C”, 2.08%, 3/20/2024 (n) | | | 2,276,000 | 2,261,428 |
| Securitized Term Auto Receivable Trust, 2019-CRTA, “B”, 2.453%, 3/25/2026 (n) | | | 1,786,389 | 1,809,177 |
| Securitized Term Auto Receivable Trust, 2019-CRTA, “C”, 2.849%, 3/25/2026 (n) | | | 2,130,329 | 2,161,572 |
| Shelter Growth CRE, 2018-FL1, “B”, FLR, 1.684% (LIBOR - 1mo. + 1.5%), 1/15/2035 (n) | | | 2,040,958 | 2,034,354 |
| TICP CLO Ltd., 2018-IA, “A2”, FLR, 2.491% (LIBOR - 3mo. + 1.5%), 4/26/2028 (n) | | | 6,750,828 | 6,513,585 |
| UBS Commercial Mortgage Trust, 2017-C8, “A4”, 3.983%, 2/15/2051 | | | 5,865,766 | 6,713,734 |
| UBS Commercial Mortgage Trust, 2019-C17, “A4”, 2.921%, 9/15/2052 | | | 12,215,133 | 13,221,781 |
| Veros Auto Receivables Trust, 2020-1, “A”, 1.67%, 9/15/2023 (n) | | | 3,948,020 | 3,943,009 |
| Voya CLO Ltd., 2012-4A, “A2AR”, FLR, 3.118% (LIBOR - 3mo. + 1.90%), 10/15/2030 (n) | | | 1,940,000 | 1,904,089 |
| Wells Fargo Commercial Mortgage Trust, 2016-LC25, “A4”, 3.64%, 12/15/2059 | | | 13,071,416 | 14,632,540 |
| Wells Fargo Commercial Mortgage Trust, 2017-C42, “A5”, 3.589%, 12/15/2050 | | | 3,970,000 | 4,465,105 |
| Wells Fargo Commercial Mortgage Trust, 2018-C46, “A4”, 4.152%, 8/15/2051 | | | 1,430,000 | 1,666,380 |
| Wells Fargo Commercial Mortgage Trust, 2019-C53, “A4”, 3.04%, 10/15/2052 | | | 10,239,837 | 11,276,672 |
| Wells Fargo Commercial Mortgage Trust, 2019-C54, “A4”, 3.146%, 12/15/2052 | | | 4,898,000 | 5,448,824 |
| West CLO Ltd., 2014-1A, “A2R”, FLR, 2.485% (LIBOR - 3mo. + 1.35%), 7/18/2026 (n) | | | 8,174,074 | 8,082,851 |
| West CLO Ltd., 2014-1A, “CR”, FLR, 4.135% (LIBOR - 3mo. + 3%), 7/18/2026 (n) | | | 1,680,000 | 1,576,717 |
| Wind River CLO Ltd., 2012-1A, “CR2”, FLR, 3.268% (LIBOR - 3mo. + 2.05%), 1/15/2026 (n) | | | 5,112,331 | 5,047,645 |
MFS Total Return Bond Series
Portfolio of Investments (unaudited) – continued
| Issuer | | | Shares/Par | Value ($) |
| Bonds – continued |
| Asset-Backed & Securitized – continued |
| Wind River CLO Ltd., 2015-2A, “CR”, FLR, 2.918% (LIBOR - 3mo. + 1.7%), 10/15/2027 (n) | | $ | 975,000 | $ 916,972 |
| | | | | $429,916,787 |
| Automotive – 1.1% |
| Allison Transmission, Inc., 4.75%, 10/01/2027 (n) | | $ | 6,375,000 | $ 6,327,187 |
| General Motors Co., 3.6%, 6/21/2030 | | | 4,150,000 | 4,039,047 |
| KAR Auction Services, Inc., 5.125%, 6/01/2025 (n) | | | 3,035,000 | 2,989,475 |
| Volkswagen Group of America LLC, 3.2%, 9/26/2026 (n) | | | 3,881,000 | 4,153,596 |
| Volkswagen Group of America LLC, 3.75%, 5/13/2030 (n) | | | 2,426,000 | 2,678,522 |
| | | | | $20,187,827 |
| Broadcasting – 1.6% |
| Discovery, Inc., 4.65%, 5/15/2050 | | $ | 4,190,000 | $ 4,780,632 |
| Fox Corp., 4.709%, 1/25/2029 | | | 8,554,000 | 10,275,561 |
| Netflix, Inc., 4.875%, 4/15/2028 | | | 1,185,000 | 1,267,085 |
| Prosus N.V., 3.68%, 1/21/2030 (n) | | | 4,905,000 | 5,136,035 |
| Walt Disney Co., 3.6%, 1/13/2051 | | | 7,385,000 | 8,226,455 |
| | | | | $29,685,768 |
| Brokerage & Asset Managers – 1.6% |
| Charles Schwab Corp., 5.375%, 6/01/2025 | | $ | 2,864,000 | $ 3,059,669 |
| Charles Schwab Corp., 3.2%, 1/25/2028 | | | 2,607,000 | 2,914,855 |
| E*TRADE Financial Corp., 3.8%, 8/24/2027 | | | 5,435,000 | 6,027,971 |
| E*TRADE Financial Corp., 4.5%, 6/20/2028 | | | 3,485,000 | 4,030,137 |
| Intercontinental Exchange, Inc., 3.75%, 9/21/2028 | | | 2,412,000 | 2,818,019 |
| Intercontinental Exchange, Inc., 2.1%, 6/15/2030 | | | 1,170,000 | 1,195,517 |
| Intercontinental Exchange, Inc., 3%, 6/15/2050 | | | 3,160,000 | 3,235,660 |
| Raymond James Financial, Inc., 4.95%, 7/15/2046 | | | 4,683,000 | 5,664,977 |
| TD Ameritrade Holding Corp., 3.3%, 4/01/2027 | | | 1,271,000 | 1,423,348 |
| | | | | $30,370,153 |
| Building – 1.5% |
| ABC Supply Co., Inc., 4%, 1/15/2028 (n) | | $ | 2,975,000 | $ 2,891,016 |
| Martin Marietta Materials, Inc., 4.25%, 7/02/2024 | | | 8,330,000 | 9,076,867 |
| Martin Marietta Materials, Inc., 3.45%, 6/01/2027 | | | 1,407,000 | 1,514,201 |
| Martin Marietta Materials, Inc., 4.25%, 12/15/2047 | | | 3,819,000 | 4,196,430 |
| Masco Corp., 4.375%, 4/01/2026 | | | 6,170,000 | 7,043,346 |
| Issuer | | | Shares/Par | Value ($) |
| Bonds – continued |
| Building – continued |
| Vulcan Materials Co., 3.5%, 6/01/2030 | | $ | 3,356,000 | $ 3,655,787 |
| | | | | $28,377,647 |
| Business Services – 1.9% |
| Equinix, Inc., 5.375%, 5/15/2027 | | $ | 6,006,000 | $ 6,552,546 |
| Equinix, Inc., 2.15%, 7/15/2030 | | | 4,950,000 | 4,906,588 |
| Fidelity National Information Services, Inc., 3%, 8/15/2026 | | | 7,885,000 | 8,736,607 |
| Fiserv, Inc., 3.5%, 7/01/2029 | | | 3,911,000 | 4,396,437 |
| Fiserv, Inc., 2.65%, 6/01/2030 | | | 4,000,000 | 4,238,280 |
| NXP Semiconductors N.V., 2.7%, 5/01/2025 (n) | | | 508,000 | 532,528 |
| Tencent Holdings Ltd., 3.24%, 6/03/2050 (n) | | | 6,379,000 | 6,393,050 |
| | | | | $35,756,036 |
| Cable TV – 2.1% |
| CCO Holdings LLC/CCO Holdings Capital Corp., 5%, 2/01/2028 (n) | | $ | 5,680,000 | $ 5,864,600 |
| Charter Communications Operating LLC/Charter Communications Operating Capital Corp., 4.908%, 7/23/2025 | | | 7,676,000 | 8,797,334 |
| Comcast Corp., 2.8%, 1/15/2051 | | | 5,588,000 | 5,730,411 |
| CSC Holdings LLC, 5.5%, 5/15/2026 (n) | | | 6,560,000 | 6,732,987 |
| Sirius XM Radio, Inc., 5.375%, 7/15/2026 (n) | | | 7,020,000 | 7,249,835 |
| Time Warner Cable, Inc., 4.5%, 9/15/2042 | | | 3,721,000 | 3,961,757 |
| Time Warner Entertainment Co. LP, 8.375%, 7/15/2033 | | | 290,000 | 436,732 |
| | | | | $38,773,656 |
| Computer Software – 1.0% |
| Dell Investments LLC/EMC Corp., 5.3%, 10/01/2029 (n) | | $ | 10,112,000 | $ 11,160,908 |
| Microsoft Corp., 4.1%, 2/06/2037 | | | 3,664,000 | 4,724,484 |
| Microsoft Corp., 2.525%, 6/01/2050 | | | 2,172,000 | 2,265,412 |
| | | | | $18,150,804 |
| Computer Software - Systems – 0.4% |
| Apple, Inc., 4.375%, 5/13/2045 | | $ | 4,792,000 | $ 6,318,021 |
| Apple, Inc., 3.85%, 8/04/2046 | | | 881,000 | 1,098,281 |
| SS&C Technologies Holdings, Inc., 5.5%, 9/30/2027 (n) | | | 985,000 | 999,420 |
| | | | | $8,415,722 |
| Conglomerates – 0.6% |
| BWX Technologies, Inc., 4.125%, 6/30/2028 (n) | | $ | 2,327,000 | $ 2,321,183 |
| Westinghouse Air Brake Technologies Corp., 4.95%, 9/15/2028 | | | 7,993,000 | 8,908,534 |
| | | | | $11,229,717 |
MFS Total Return Bond Series
Portfolio of Investments (unaudited) – continued
| Issuer | | | Shares/Par | Value ($) |
| Bonds – continued |
| Consumer Products – 1.2% |
| Reckitt Benckiser Treasury Services PLC, 3.625%, 9/21/2023 (n) | | $ | 6,765,000 | $ 7,277,426 |
| Reckitt Benckiser Treasury Services PLC, 2.75%, 6/26/2024 (n) | | | 13,673,000 | 14,539,439 |
| | | | | $21,816,865 |
| Consumer Services – 0.8% |
| Booking Holdings, Inc., 3.65%, 3/15/2025 | | $ | 3,610,000 | $ 3,964,130 |
| Booking Holdings, Inc., 4.5%, 4/13/2027 | | | 2,084,000 | 2,393,609 |
| Toll Road Investors Partnership II LP, Capital Appreciation, 0%, 2/15/2026 (n) | | | 2,145,000 | 1,764,269 |
| Toll Road Investors Partnership II LP, Capital Appreciation, 0%, 2/15/2029 (z) | | | 6,221,000 | 4,032,291 |
| Toll Road Investors Partnership II LP, Capital Appreciation, 0%, 2/15/2031 (n) | | | 2,145,000 | 1,302,360 |
| Toll Road Investors Partnership II LP, Capital Appreciation, 0%, 2/15/2043 (n) | | | 5,600,000 | 1,669,457 |
| | | | | $15,126,116 |
| Containers – 0.4% |
| Crown Americas LLC/Crown Americas Capital Corp. VI, 4.75%, 2/01/2026 | | $ | 7,030,000 | $ 7,163,781 |
| Electronics – 1.5% |
| Broadcom Corp./Broadcom Cayman Finance Ltd., 3.875%, 1/15/2027 | | $ | 8,969,000 | $ 9,692,047 |
| Broadcom, Inc., 4.75%, 4/15/2029 (n) | | | 3,794,000 | 4,306,702 |
| Broadcom, Inc., 4.15%, 11/15/2030 (n) | | | 9,906,000 | 10,764,669 |
| Sensata Technologies B.V., 5%, 10/01/2025 (n) | | | 3,740,000 | 3,981,978 |
| | | | | $28,745,396 |
| Energy - Integrated – 0.9% |
| Eni S.p.A., 4%, 9/12/2023 (n) | | $ | 5,485,000 | $ 5,933,332 |
| Exxon Mobil Corp., 4.227%, 3/19/2040 | | | 1,700,000 | 2,041,802 |
| Exxon Mobil Corp., 3.452%, 4/15/2051 | | | 2,428,000 | 2,688,841 |
| Total Capital International S.A., 2.986%, 6/29/2041 | | | 2,835,000 | 2,896,793 |
| Total Capital International S.A., 3.127%, 5/29/2050 | | | 4,177,000 | 4,285,472 |
| | | | | $17,846,240 |
| Entertainment – 0.2% |
| Live Nation Entertainment, Inc., 4.75%, 10/15/2027 (n) | | $ | 3,495,000 | $ 3,006,434 |
| Issuer | | | Shares/Par | Value ($) |
| Bonds – continued |
| Financial Institutions – 1.1% |
| AerCap Ireland Capital DAC, 4.5%, 9/15/2023 | | $ | 5,027,000 | $ 5,027,589 |
| AerCap Ireland Capital DAC, 6.5%, 7/15/2025 | | | 3,419,000 | 3,584,838 |
| Avolon Holdings Funding Ltd., 5.25%, 5/15/2024 (n) | | | 5,845,000 | 5,336,714 |
| Avolon Holdings Funding Ltd., 3.95%, 7/01/2024 (n) | | | 4,754,000 | 4,130,360 |
| GE Capital International Funding Co., 4.418%, 11/15/2035 | | | 1,099,000 | 1,117,412 |
| Global Aircraft Leasing Co. Ltd., 6.5%, (6.5% cash or 7.25% PIK) 9/15/2024 (n)(p) | | | 3,585,000 | 2,401,950 |
| | | | | $21,598,863 |
| Food & Beverages – 1.8% |
| Anheuser-Busch Cos. LLC/Anheuser-Busch InBev Worldwide, Inc., 4.9%, 2/01/2046 | | $ | 3,064,000 | $ 3,749,372 |
| Anheuser-Busch InBev Worldwide, Inc., 3.7%, 2/01/2024 | | | 2,400,000 | 2,638,126 |
| Anheuser-Busch InBev Worldwide, Inc., 5.45%, 1/23/2039 | | | 2,702,000 | 3,413,942 |
| Anheuser-Busch InBev Worldwide, Inc., 4.5%, 6/01/2050 | | | 7,423,000 | 8,800,114 |
| Constellation Brands, Inc., 2.875%, 5/01/2030 | | | 817,000 | 865,642 |
| Constellation Brands, Inc., 3.75%, 5/01/2050 | | | 1,188,000 | 1,297,136 |
| Diageo Capital PLC, 2.125%, 4/29/2032 | | | 4,571,000 | 4,739,603 |
| JBS USA Lux S.A./JBS USA Finance, Inc., 5.5%, 1/15/2030 (n) | | | 1,185,000 | 1,214,625 |
| Keurig Dr Pepper, Inc., 3.2%, 5/01/2030 | | | 671,000 | 746,473 |
| Keurig Dr Pepper, Inc., 3.8%, 5/01/2050 | | | 1,375,000 | 1,553,690 |
| PepsiCo, Inc., 3.5%, 3/19/2040 | | | 2,643,000 | 3,116,078 |
| Pilgrim's Pride Corp., 5.875%, 9/30/2027 (n) | | | 2,170,000 | 2,170,434 |
| | | | | $34,305,235 |
| Gaming & Lodging – 0.6% |
| GLP Capital LP/GLP Financing II, Inc., 5.375%, 11/01/2023 | | $ | 4,350,000 | $ 4,630,140 |
| GLP Capital LP/GLP Financing II, Inc., 5.25%, 6/01/2025 | | | 2,257,000 | 2,454,262 |
| Las Vegas Sands Corp., 3.5%, 8/18/2026 | | | 3,415,000 | 3,405,325 |
| Marriott International, Inc., 4.625%, 6/15/2030 | | | 1,503,000 | 1,559,535 |
| | | | | $12,049,262 |
MFS Total Return Bond Series
Portfolio of Investments (unaudited) – continued
| Issuer | | | Shares/Par | Value ($) |
| Bonds – continued |
| Insurance – 0.8% |
| American International Group, Inc., 3.75%, 7/10/2025 | | $ | 4,804,000 | $ 5,316,303 |
| American International Group, Inc., 3.9%, 4/01/2026 | | | 5,113,000 | 5,776,775 |
| American International Group, Inc., 4.7%, 7/10/2035 | | | 2,777,000 | 3,382,806 |
| | | | | $14,475,884 |
| Insurance - Health – 0.1% |
| UnitedHealth Group, Inc., 3.7%, 8/15/2049 | | $ | 1,765,000 | $ 2,088,108 |
| Insurance - Property & Casualty – 2.4% |
| Allied World Assurance Co. Holdings Ltd., 4.35%, 10/29/2025 | | $ | 6,835,000 | $ 7,152,903 |
| Aon Corp., 3.75%, 5/02/2029 | | | 7,982,000 | 9,139,130 |
| Fairfax Financial Holdings Ltd., 4.85%, 4/17/2028 | | | 5,854,000 | 6,270,437 |
| Hartford Financial Services Group, Inc., 2.8%, 8/19/2029 | | | 6,063,000 | 6,419,629 |
| Hartford Financial Services Group, Inc., 3.6%, 8/19/2049 | | | 3,624,000 | 3,821,111 |
| Liberty Mutual Group, Inc., 3.951%, 10/15/2050 (n) | | | 2,900,000 | 3,064,278 |
| Marsh & McLennan Cos., Inc., 4.2%, 3/01/2048 | | | 6,949,000 | 8,495,130 |
| Progressive Corp., 3.2%, 3/26/2030 | | | 533,000 | 606,317 |
| Swiss Re Ltd., 4.25%, 12/06/2042 (n) | | | 926,000 | 1,132,116 |
| | | | | $46,101,051 |
| International Market Quasi-Sovereign – 0.2% |
| Electricite de France S.A., 4.875%, 9/21/2038 (n) | | $ | 2,687,000 | $ 3,170,667 |
| Machinery & Tools – 0.4% |
| CNH Industrial Capital LLC, 1.95%, 7/02/2023 | | $ | 2,514,000 | $ 2,530,498 |
| CNH Industrial Capital LLC, 4.2%, 1/15/2024 | | | 1,209,000 | 1,288,194 |
| CNH Industrial Capital LLC, 3.85%, 11/15/2027 | | | 3,385,000 | 3,567,545 |
| | | | | $7,386,237 |
| Major Banks – 7.0% |
| ABN AMRO Bank N.V., 4.8%, 4/18/2026 (n) | | $ | 5,000,000 | $ 5,568,600 |
| Bank of America Corp., 3.419% to 12/20/2027, FLR (LIBOR - 3mo. + 1.04%) to 12/20/2028 | | | 8,376,000 | 9,329,625 |
| Bank of America Corp., 4.443%, 1/20/2048 | | | 6,670,000 | 8,641,390 |
| Bank of America Corp., 6.1%, 12/29/2049 | | | 8,260,000 | 8,714,300 |
| Bank of America Corp., 5.875%, 12/31/2059 | | | 6,088,000 | 6,219,158 |
| Bank of America Corp., FLR, 6.5% (LIBOR - 3mo. + 4.174%), 10/29/2049 | | | 4,004,000 | 4,302,939 |
| Issuer | | | Shares/Par | Value ($) |
| Bonds – continued |
| Major Banks – continued |
| Barclays PLC, 4.972% to 5/16/2028, FLR (LIBOR - 3mo. + 1.902%) to 5/16/2029 | | $ | 3,499,000 | $ 4,099,573 |
| Credit Suisse Group Fund (Guernsey) Ltd., 3.75%, 3/26/2025 | | | 3,355,000 | 3,698,360 |
| JPMorgan Chase & Co., 4.25%, 10/15/2020 | | | 1,385,000 | 1,400,680 |
| JPMorgan Chase & Co., 3.125%, 1/23/2025 | | | 374,000 | 407,618 |
| JPMorgan Chase & Co., 3.509%, 1/23/2029 | | | 2,455,000 | 2,742,287 |
| JPMorgan Chase & Co., 4.005% to 4/23/2028, FLR (LIBOR - 3mo. + 1.12%) to 4/23/2029 | | | 11,547,000 | 13,324,217 |
| JPMorgan Chase & Co., 4.203% to 7/23/2028, FLR (LIBOR - 3mo. + 1.26%) to 7/23/2029 | | | 4,743,000 | 5,561,001 |
| JPMorgan Chase & Co., 2.956% to 5/13/2030, FLR (SOFR + 2.515%) to 5/13/2031 | | | 4,435,000 | 4,703,688 |
| Lloyds Bank PLC, 3.75%, 1/11/2027 | | | 5,639,000 | 6,242,288 |
| Morgan Stanley, 2.699% to 1/22/2030, FLR (SOFR + 1.143%) to 1/22/2031 | | | 530,000 | 561,421 |
| PNC Bank N.A., 3.1%, 10/25/2027 | | | 8,157,000 | 9,149,496 |
| Sumitomo Mitsui Financial Group, Inc., 2.13%, 7/08/2030 | | | 10,025,000 | 10,043,413 |
| UBS Group Funding (Jersey) Ltd., 4.125%, 9/24/2025 (n) | | | 4,836,000 | 5,481,386 |
| Wachovia Corp., 6.605%, 10/01/2025 | | | 1,764,000 | 2,129,335 |
| Wells Fargo & Co., 3.068% to 4/30/2040, FLR (SOFR + 2.53%) to 4/30/2041 | | | 7,635,000 | 7,963,961 |
| Wells Fargo & Co., 5.013% to 4/4/2050, FLR (LIBOR - 3mo. + 4.24%) to 4/04/2051 | | | 5,215,000 | 7,238,327 |
| Westpac Banking Corp., 2.894% to 2/4/2025, FLR (CMT - 5yr. + 1.35%) to 2/04/2030 | | | 5,518,000 | 5,624,937 |
| | | | | $133,148,000 |
| Medical & Health Technology & Services – 4.0% |
| Alcon Finance Corp., 2.75%, 9/23/2026 (n) | | $ | 901,000 | $ 969,273 |
| Alcon, Inc., 2.6%, 5/27/2030 (n) | | | 1,096,000 | 1,123,492 |
| Becton, Dickinson and Co., 3.794%, 5/20/2050 | | | 7,001,000 | 7,775,867 |
| Berks County, PA, Industrial Development Authority (Tower Health Project), 4.451%, 2/01/2050 | | | 6,211,000 | 5,692,668 |
| Cigna Corp., 2.4%, 3/15/2030 | | | 3,463,000 | 3,593,258 |
| CommonSpirit Health, 2.95%, 11/01/2022 | | | 6,666,000 | 6,888,440 |
| Hackensack Meridian Health, Inc., 4.211%, 7/01/2048 | | | 3,555,000 | 4,294,938 |
| Hackensack Meridian Health, Inc., 4.5%, 7/01/2057 | | | 5,360,000 | 7,026,606 |
| HCA, Inc., 5.25%, 6/15/2026 | | | 3,026,000 | 3,496,006 |
| HCA, Inc., 5.625%, 9/01/2028 | | | 7,640,000 | 8,528,150 |
MFS Total Return Bond Series
Portfolio of Investments (unaudited) – continued
| Issuer | | | Shares/Par | Value ($) |
| Bonds – continued |
| Medical & Health Technology & Services – continued |
| HCA, Inc., 4.125%, 6/15/2029 | | $ | 4,743,000 | $ 5,231,944 |
| Laboratory Corp. of America Holdings, 4.7%, 2/01/2045 | | | 2,518,000 | 3,065,060 |
| Northwell Healthcare, Inc., 3.979%, 11/01/2046 | | | 1,503,000 | 1,572,488 |
| Northwell Healthcare, Inc., 4.26%, 11/01/2047 | | | 4,465,000 | 4,883,924 |
| ProMedica Toledo Hospital, “B”, 5.75%, 11/15/2038 | | | 2,562,000 | 2,992,575 |
| Toledo Hospital, 5.325%, 11/15/2028 | | | 7,120,000 | 7,623,858 |
| | | | | $74,758,547 |
| Medical Equipment – 0.4% |
| Abbott Laboratories, 3.4%, 11/30/2023 | | $ | 2,684,000 | $ 2,923,164 |
| Abbott Laboratories, 1.15%, 1/30/2028 | | | 1,891,000 | 1,895,347 |
| Boston Scientific Corp., 4%, 3/01/2029 | | | 2,000,000 | 2,288,459 |
| | | | | $7,106,970 |
| Metals & Mining – 0.8% |
| Freeport-McMoRan Copper & Gold, Inc., 5.4%, 11/14/2034 | | $ | 5,570,000 | $ 5,505,597 |
| Glencore Funding LLC, 4.125%, 5/30/2023 (n) | | | 2,796,000 | 2,989,005 |
| Kaiser Aluminum Corp., 4.625%, 3/01/2028 (n) | | | 1,195,000 | 1,142,802 |
| Novelis Corp., 5.875%, 9/30/2026 (n) | | | 5,245,000 | 5,238,444 |
| | | | | $14,875,848 |
| Midstream – 2.7% |
| Cheniere Energy Partners LP, 4.875%, 5/28/2021 | | $ | 3,845,000 | $ 3,882,297 |
| Enbridge, Inc., 4.25%, 12/01/2026 | | | 7,802,000 | 8,874,498 |
| Kinder Morgan (Delaware), Inc., 7.75%, 1/15/2032 | | | 6,550,000 | 9,154,658 |
| Kinder Morgan Energy Partners LP, 6.375%, 3/01/2041 | | | 2,240,000 | 2,752,661 |
| Kinder Morgan Energy Partners LP, 5.4%, 9/01/2044 | | | 2,778,000 | 3,330,000 |
| ONEOK, Inc., 5.2%, 7/15/2048 | | | 5,276,000 | 5,276,344 |
| Plains All American Pipeline, 3.55%, 12/15/2029 | | | 3,000,000 | 2,922,765 |
| Sabine Pass Liquefaction LLC, 5.75%, 5/15/2024 | | | 5,449,000 | 6,136,390 |
| Sabine Pass Liquefaction LLC, 4.2%, 3/15/2028 | | | 2,847,000 | 3,056,130 |
| Sabine Pass Liquefaction LLC, 4.5%, 5/15/2030 (n) | | | 1,975,000 | 2,192,653 |
| Targa Resources Partners LP/Targa Resources Finance Corp., 5.875%, 4/15/2026 | | | 3,333,000 | 3,299,670 |
| | | | | $50,878,066 |
| Issuer | | | Shares/Par | Value ($) |
| Bonds – continued |
| Mortgage-Backed – 20.7% | |
| Fannie Mae, 5%, 8/01/2020 - 3/01/2042 | | $ | 5,241,792 | $ 6,002,235 |
| Fannie Mae, 3.477%, 10/01/2020 | | | 306,708 | 308,669 |
| Fannie Mae, 5.5%, 3/01/2021 - 4/01/2040 | | | 7,211,894 | 8,253,503 |
| Fannie Mae, 2.14%, 5/01/2021 | | | 861,787 | 866,295 |
| Fannie Mae, 3.89%, 7/01/2021 | | | 1,067,227 | 1,086,816 |
| Fannie Mae, 2.56%, 10/01/2021 | | | 762,634 | 773,491 |
| Fannie Mae, 2.75%, 3/01/2022 | | | 1,063,210 | 1,095,453 |
| Fannie Mae, 6%, 8/01/2022 - 3/01/2039 | | | 1,812,202 | 2,091,591 |
| Fannie Mae, 2.525%, 10/01/2022 | | | 1,701,789 | 1,757,886 |
| Fannie Mae, 2.68%, 3/01/2023 | | | 1,637,744 | 1,708,766 |
| Fannie Mae, 2.41%, 5/01/2023 | | | 1,909,086 | 1,982,790 |
| Fannie Mae, 2.55%, 5/01/2023 | | | 977,739 | 1,019,179 |
| Fannie Mae, 4.5%, 5/01/2024 - 6/01/2044 | | | 19,664,424 | 21,880,948 |
| Fannie Mae, 3.5%, 5/25/2025 - 11/01/2048 | | | 17,882,807 | 19,257,374 |
| Fannie Mae, 3.95%, 1/01/2027 | | | 339,755 | 386,649 |
| Fannie Mae, 3%, 11/01/2028 - 7/01/2050 | | | 21,826,725 | 23,373,616 |
| Fannie Mae, 2.5%, 11/01/2031 - 7/01/2050 | | | 11,678,800 | 12,313,152 |
| Fannie Mae, 6.5%, 7/01/2032 - 1/01/2033 | | | 3,924 | 4,503 |
| Fannie Mae, 3%, 2/25/2033 (i) | | | 666,523 | 69,898 |
| Fannie Mae, 4%, 12/01/2039 - 1/01/2047 | | | 35,686,957 | 39,160,204 |
| Fannie Mae, 3.25%, 5/25/2040 | | | 308,735 | 333,320 |
| Fannie Mae, 2%, 10/25/2040 - 4/25/2046 | | | 812,916 | 835,405 |
| Fannie Mae, 4%, 7/25/2046 (i) | | | 591,635 | 111,254 |
| Fannie Mae, 3.5%, 12/01/2046 (f) | | | 10,553,731 | 11,209,165 |
| Fannie Mae, TBA, 2%, 7/16/2035 - 8/13/2050 | | | 8,375,000 | 8,580,131 |
| Fannie Mae, TBA, 3%, 7/16/2035 - 8/13/2050 | | | 8,700,000 | 9,144,664 |
| Fannie Mae, TBA, 1.5%, 9/25/2035 | | | 1,175,000 | 1,192,258 |
| Fannie Mae, TBA, 2.5%, 7/14/2050 - 8/25/2050 | | | 9,295,000 | 9,679,541 |
| Fannie Mae, TBA, 3.5%, 7/14/2050 | | | 13,600,000 | 14,303,906 |
| Fannie Mae, TBA, 4%, 7/25/2050 | | | 5,325,000 | 5,642,940 |
| Federal Home Loan Bank, 5%, 7/01/2035 | | | 1,506,882 | 1,729,271 |
| Federal Home Loan Bank, 3.5%, 5/01/2049 | | | 719,873 | 762,897 |
| Federal Home Loan Bank, 3%, 6/01/2050 | | | 885,041 | 940,408 |
| Freddie Mac, 3.034%, 10/25/2020 | | | 1,150,665 | 1,151,783 |
| Freddie Mac, 5.5%, 11/01/2020 - 1/01/2038 | | | 317,894 | 363,683 |
| Freddie Mac, 2.791%, 1/25/2022 | | | 4,439,000 | 4,566,559 |
| Freddie Mac, 3.32%, 2/25/2023 | | | 3,956,000 | 4,207,050 |
| Freddie Mac, 3.531%, 7/25/2023 | | | 2,401,000 | 2,597,696 |
| Freddie Mac, 2.67%, 12/25/2024 | | | 2,784,000 | 3,009,976 |
| Freddie Mac, 2.811%, 1/25/2025 | | | 4,169,000 | 4,538,135 |
| Freddie Mac, 4%, 7/01/2025 - 4/01/2044 | | | 3,718,666 | 4,054,810 |
MFS Total Return Bond Series
Portfolio of Investments (unaudited) – continued
| Issuer | | | Shares/Par | Value ($) |
| Bonds – continued |
| Mortgage-Backed – continued | |
| Freddie Mac, 4.5%, 7/01/2025 - 5/01/2042 | | $ | 4,950,249 | $ 5,496,564 |
| Freddie Mac, 3.3%, 10/25/2026 | | | 2,958,000 | 3,364,712 |
| Freddie Mac, 3%, 6/15/2028 - 2/25/2059 | | | 33,134,353 | 35,548,163 |
| Freddie Mac, 4.06%, 10/25/2028 | | | 2,129,000 | 2,583,110 |
| Freddie Mac, 1.218%, 7/25/2029 (i) | | | 4,055,470 | 342,747 |
| Freddie Mac, 1.269%, 8/25/2029 (i) | | | 7,028,683 | 621,216 |
| Freddie Mac, 0.757%, 11/25/2029 (i) | | | 15,609,607 | 811,100 |
| Freddie Mac, 6%, 8/01/2034 - 7/01/2038 | | | 92,088 | 104,746 |
| Freddie Mac, 5%, 11/01/2035 - 7/01/2041 | | | 1,967,827 | 2,242,964 |
| Freddie Mac, 5.5%, 2/15/2036 (i) | | | 138,665 | 27,397 |
| Freddie Mac, 3.5%, 11/01/2037 - 10/25/2058 | | | 38,039,365 | 40,727,139 |
| Freddie Mac, 4.5%, 12/15/2040 (i) | | | 151,373 | 14,497 |
| Freddie Mac, 4%, 8/15/2044 (i) | | | 168,738 | 20,786 |
| Ginnie Mae, 2.5%, 7/20/2032 | | | 500,000 | 531,835 |
| Ginnie Mae, 5.5%, 5/15/2033 - 1/20/2042 | | | 1,750,733 | 2,019,268 |
| Ginnie Mae, 6%, 1/20/2036 - 1/15/2039 | | | 225,061 | 263,034 |
| Ginnie Mae, 4.5%, 4/15/2039 - 9/20/2041 | | | 8,400,581 | 9,301,032 |
| Ginnie Mae, 4%, 10/20/2040 - 3/20/2048 | | | 2,794,297 | 3,077,227 |
| Ginnie Mae, 3.5%, 11/15/2040 - 9/20/2048 | | | 22,172,435 | 23,629,372 |
| Ginnie Mae, 3%, 11/20/2044 - 1/20/2048 | | | 27,405,573 | 29,097,756 |
| | | | | $392,172,535 |
| Municipals – 3.3% |
| Bridgeview, IL, Stadium and Redevelopment Projects, 5.06%, 12/01/2025 | | $ | 910,000 | $ 901,355 |
| Bridgeview, IL, Stadium and Redevelopment Projects, 5.14%, 12/01/2036 | | | 8,850,000 | 8,476,795 |
| Escambia County, FL, Health Facilities Authority Rev. (Baptist Health Care Corp.), “B”, 3.607%, 8/15/2040 | | | 1,295,000 | 1,301,734 |
| New Jersey Economic Development Authority State Pension Funding Rev., “A”, 7.425%, 2/15/2029 | | | 8,019,000 | 9,690,160 |
| New Jersey Economic Development Authority State Pension Funding Rev., Capital Appreciation, “B”, 0%, 2/15/2023 | | | 13,215,000 | 12,761,065 |
| New York Dormitory Authority Rev. (Cornell University), “A”, 5%, 7/01/2030 | | | 530,000 | 739,483 |
| Oklahoma Development Finance Authority, Health System Rev. (OU Medicine Project), “C”, 5.45%, 8/15/2028 | | | 3,770,000 | 4,413,652 |
| Philadelphia, PA, School District, “B”, 6.615%, 6/01/2030 | | | 3,250,000 | 4,184,570 |
| Issuer | | | Shares/Par | Value ($) |
| Bonds – continued |
| Municipals – continued |
| Philadelphia, PA, School District, “B”, 6.765%, 6/01/2040 | | $ | 2,195,000 | $ 2,911,711 |
| State of California, 4%, 3/01/2029 | | | 3,245,000 | 4,087,305 |
| State of California (Build America Bonds), 7.625%, 3/01/2040 | | | 860,000 | 1,518,063 |
| State of California (Build America Bonds), 7.6%, 11/01/2040 | | | 5,010,000 | 9,197,208 |
| University of California Limited Project Rev., “J”, 4.131%, 5/15/2045 | | | 2,260,000 | 2,745,041 |
| | | | | $62,928,142 |
| Natural Gas - Distribution – 1.3% |
| Boston Gas Co., 3.15%, 8/01/2027 (n) | | $ | 9,294,000 | $ 10,140,771 |
| KeySpan Gas East Corp., 2.742%, 8/15/2026 (n) | | | 8,200,000 | 8,765,376 |
| NiSource, Inc., 3.6%, 5/01/2030 | | | 5,378,000 | 6,160,024 |
| | | | | $25,066,171 |
| Network & Telecom – 0.2% |
| Verizon Communications, Inc., 4.272%, 1/15/2036 | | $ | 2,647,000 | $ 3,273,516 |
| Oils – 0.4% |
| Marathon Petroleum Corp., 4.75%, 9/15/2044 | | $ | 4,350,000 | $ 4,534,693 |
| Marathon Petroleum Corp., 5.85%, 12/15/2045 | | | 2,683,000 | 2,818,357 |
| | | | | $7,353,050 |
| Other Banks & Diversified Financials – 0.8% |
| BBVA Bancomer S.A. de C.V., 6.75%, 9/30/2022 (n) | | $ | 2,570,000 | $ 2,739,363 |
| Branch Banking & Trust Co., 2.25%, 3/11/2030 | | | 910,000 | 918,518 |
| Groupe BPCE S.A., 4.5%, 3/15/2025 (n) | | | 5,771,000 | 6,301,139 |
| Macquarie Bank Ltd. of London, 6.125% to 3/08/2027, FLR (Swap Rate - 5yr. + 4.332%) to 12/31/2165 (n) | | | 5,003,000 | 4,952,970 |
| | | | | $14,911,990 |
| Pharmaceuticals – 1.1% |
| AbbVie, Inc., 3.8%, 3/15/2025 (n) | | $ | 9,371,000 | $ 10,397,270 |
| Elanco Animal Health, Inc., 5.022%, 8/28/2023 | | | 3,654,000 | 3,836,700 |
| Elanco Animal Health, Inc., 5.65%, 8/28/2028 | | | 2,914,000 | 3,231,043 |
| Takeda Pharmaceutical Co. Ltd., 3.175%, 7/09/2050 | | | 4,177,000 | 4,163,450 |
| | | | | $21,628,463 |
| Pollution Control – 0.2% |
| Republic Services, Inc., 3.95%, 5/15/2028 | | $ | 2,924,000 | $ 3,414,619 |
| Railroad & Shipping – 0.1% |
| CSX Corp., 3.8%, 4/15/2050 | | $ | 869,000 | $ 1,029,687 |
MFS Total Return Bond Series
Portfolio of Investments (unaudited) – continued
| Issuer | | | Shares/Par | Value ($) |
| Bonds – continued |
| Real Estate - Apartment – 0.1% |
| Mid-America Apartment Communities, Inc., REIT, 4.3%, 10/15/2023 | | $ | 2,417,000 | $ 2,645,195 |
| Real Estate - Healthcare – 0.2% |
| MPT Operating Partnership LP/MPT Financial Co., REIT, 5%, 10/15/2027 | | $ | 3,890,000 | $ 3,996,975 |
| Real Estate - Retail – 0.4% |
| VEREIT Operating Partnership LP, REIT, 3.1%, 12/15/2029 | | $ | 7,508,000 | $ 7,236,240 |
| Retailers – 0.2% |
| Home Depot, Inc., 3.35%, 4/15/2050 | | $ | 3,476,000 | $ 3,971,458 |
| Specialty Chemicals – 0.1% |
| Univar Solutions USA, Inc., 5.125%, 12/01/2027 (n) | | $ | 1,165,000 | $ 1,178,537 |
| Specialty Stores – 0.3% |
| Penske Automotive Group Co., 5.5%, 5/15/2026 | | $ | 1,170,000 | $ 1,167,075 |
| TJX Cos., Inc., 3.875%, 4/15/2030 | | | 1,446,000 | 1,699,318 |
| TJX Cos., Inc., 4.5%, 4/15/2050 | | | 1,731,000 | 2,224,375 |
| | | | | $5,090,768 |
| Telecommunications - Wireless – 2.2% |
| American Tower Corp., REIT, 3.55%, 7/15/2027 | | $ | 12,018,000 | $ 13,388,577 |
| American Tower Corp., REIT, 3.8%, 8/15/2029 | | | 1,564,000 | 1,770,096 |
| American Tower Corp., REIT, 3.1%, 6/15/2050 | | | 2,905,000 | 2,873,432 |
| Crown Castle International Corp., 3.2%, 9/01/2024 | | | 2,497,000 | 2,709,571 |
| Crown Castle International Corp., 3.7%, 6/15/2026 | | | 2,419,000 | 2,706,697 |
| Crown Castle International Corp., 4%, 3/01/2027 | | | 984,000 | 1,118,402 |
| Crown Castle International Corp., 3.8%, 2/15/2028 | | | 4,000,000 | 4,495,986 |
| Crown Castle, REIT, 3.25%, 1/15/2051 | | | 1,465,000 | 1,479,215 |
| SBA Communications Corp., 3.875%, 2/15/2027 (n) | | | 1,795,000 | 1,788,269 |
| T-Mobile USA, Inc., 2.55%, 2/15/2031 (n) | | | 8,299,000 | 8,328,213 |
| T-Mobile USA, Inc., 4.375%, 4/15/2040 (n) | | | 1,518,000 | 1,755,901 |
| | | | | $42,414,359 |
| Tobacco – 0.7% |
| B.A.T Capital Corp., 3.222%, 8/15/2024 | | $ | 6,134,000 | $ 6,569,428 |
| B.A.T Capital Corp., 4.758%, 9/06/2049 | | | 6,440,000 | 7,150,986 |
| | | | | $13,720,414 |
| Issuer | | | Shares/Par | Value ($) |
| Bonds – continued |
| Transportation - Services – 0.3% |
| ERAC USA Finance LLC, 3.85%, 11/15/2024 (n) | | $ | 1,612,000 | $ 1,697,376 |
| ERAC USA Finance LLC, 7%, 10/15/2037 (n) | | | 3,603,000 | 4,615,607 |
| | | | | $6,312,983 |
| U.S. Government Agencies and Equivalents – 1.6% |
| Small Business Administration, 4.93%, 1/01/2024 | | $ | 4,072 | $ 4,257 |
| Small Business Administration, 4.34%, 3/01/2024 | | | 9,628 | 10,005 |
| Small Business Administration, 4.99%, 9/01/2024 | | | 6,949 | 7,305 |
| Small Business Administration, 4.86%, 1/01/2025 | | | 16,666 | 17,564 |
| Small Business Administration, 4.625%, 2/01/2025 | | | 17,517 | 18,448 |
| Small Business Administration, 5.11%, 4/01/2025 | | | 9,005 | 9,548 |
| Small Business Administration, 4.43%, 5/01/2029 | | | 217,780 | 235,212 |
| Small Business Administration, 3.21%, 9/01/2030 | | | 3,106,009 | 3,262,300 |
| Small Business Administration, 3.25%, 11/01/2030 | | | 275,975 | 294,835 |
| Small Business Administration, 2.85%, 9/01/2031 | | | 635,418 | 673,914 |
| Small Business Administration, 2.37%, 8/01/2032 | | | 458,270 | 474,756 |
| Small Business Administration, 2.13%, 1/01/2033 | | | 1,985,154 | 2,044,644 |
| Small Business Administration, 2.21%, 2/01/2033 | | | 571,773 | 588,807 |
| Small Business Administration, 2.22%, 3/01/2033 | | | 1,963,636 | 2,026,588 |
| Small Business Administration, 2.08%, 4/01/2033 | | | 2,975,121 | 3,048,065 |
| Small Business Administration, 2.45%, 6/01/2033 | | | 3,132,947 | 3,237,254 |
| Small Business Administration, 3.15%, 7/01/2033 | | | 4,827,361 | 5,112,693 |
| Small Business Administration, 3.16%, 8/01/2033 | | | 4,816,518 | 5,107,181 |
| Small Business Administration, 3.62%, 9/01/2033 | | | 4,514,450 | 4,851,394 |
| | | | | $31,024,770 |
| Utilities - Electric Power – 2.6% |
| AEP Transmission Co. LLC, 3.1%, 12/01/2026 | | $ | 2,539,000 | $ 2,841,089 |
| AEP Transmission Co. LLC, 3.65%, 4/01/2050 | | | 1,627,000 | 1,881,092 |
| Clearway Energy Operating LLC, 4.75%, 3/15/2028 (n) | | | 1,195,000 | 1,218,828 |
| Dominion Resources, Inc., 3.9%, 10/01/2025 | | | 2,048,000 | 2,319,817 |
| Enel Finance International N.V., 3.625%, 5/25/2027 (n) | | | 14,433,000 | 15,757,993 |
| Enel Finance International N.V., 3.5%, 4/06/2028 (n) | | | 6,000,000 | 6,454,026 |
MFS Total Return Bond Series
Portfolio of Investments (unaudited) – continued
| Issuer | | | Shares/Par | Value ($) |
| Bonds – continued |
| Utilities - Electric Power – continued |
| Exelon Corp., 3.497%, 6/01/2022 | | $ | 1,184,000 | $ 1,239,126 |
| Exelon Corp., 4.7%, 4/15/2050 | | | 1,529,000 | 1,945,398 |
| FirstEnergy Corp., 4.85%, 7/15/2047 | | | 5,403,000 | 6,846,974 |
| NextEra Energy Operating Co., 4.5%, 9/15/2027 (n) | | | 570,000 | 595,838 |
| Pacific Gas & Electric Co., 3.3%, 8/01/2040 | | | 8,840,000 | 8,615,994 |
| | | | | $49,716,175 |
| Utilities - Gas – 0.1% |
| East Ohio Gas Co., 3%, 6/15/2050 (n) | | $ | 1,606,000 | $ 1,598,893 |
| Total Bonds (Identified Cost, $1,789,505,207) | | $ 1,887,963,188 |
| Issuer | | | Shares/Par | Value ($) |
| Investment Companies (h) – 2.3% |
| Money Market Funds – 2.3% | |
| MFS Institutional Money Market Portfolio, 0.17% (v) (Identified Cost, $43,482,744) | | | 43,478,396 | $ 43,482,744 |
| Other Assets, Less Liabilities – (2.1)% | | (39,312,848) |
| Net Assets – 100.0% | $ 1,892,133,084 |
| (f) | All or a portion of the security has been segregated as collateral for open futures contracts and cleared swap agreements. |
| (h) | An affiliated issuer, which may be considered one in which the fund owns 5% or more of the outstanding voting securities, or a company which is under common control. At period end, the aggregate values of the fund's investments in affiliated issuers and in unaffiliated issuers were $43,482,744 and $1,887,963,188, respectively. |
| (i) | Interest only security for which the fund receives interest on notional principal (Par amount). Par amount shown is the notional principal and does not reflect the cost of the security. |
| (n) | Securities exempt from registration under Rule 144A of the Securities Act of 1933. These securities may be sold in the ordinary course of business in transactions exempt from registration, normally to qualified institutional buyers. At period end, the aggregate value of these securities was $541,341,241, representing 28.6% of net assets. |
| (p) | Payment-in-kind (PIK) security for which interest income may be received in additional securities and/or cash. |
| (v) | Affiliated issuer that is available only to investment companies managed by MFS. The rate quoted for the MFS Institutional Money Market Portfolio is the annualized seven-day yield of the fund at period end. |
| (z) | Restricted securities are not registered under the Securities Act of 1933 and are subject to legal restrictions on resale. These securities generally may be resold in transactions exempt from registration or to the public if the securities are subsequently registered. Disposal of these securities may involve time-consuming negotiations and prompt sale at an acceptable price may be difficult. The fund holds the following restricted securities: |
| Restricted Securities | Acquisition
Date | Cost | Value |
| Bancorp Commercial Mortgage Trust, 2017-CRE2, “B”, FLR, 1.784% (LIBOR - 1mo. + 1.6%), 8/15/2032 | 2/15/19 | $2,302,768 | $2,292,375 |
| Toll Road Investors Partnership II LP, Capital Appreciation, 0%, 2/15/2029 | 5/23/18 | 3,791,281 | 4,032,291 |
| Total Restricted Securities | | | $6,324,666 |
| % of Net assets | | | 0.3% |
| The following abbreviations are used in this report and are defined: |
| CDO | Collateralized Debt Obligation |
| CLO | Collateralized Loan Obligation |
| CMT | Constant Maturity Treasury |
| FLR | Floating Rate. Interest rate resets periodically based on the parenthetically disclosed reference rate plus a spread (if any). The period-end rate reported may not be the current rate. All reference rates are USD unless otherwise noted. |
| LIBOR | London Interbank Offered Rate |
| REIT | Real Estate Investment Trust |
| SOFR | Secured Overnight Financing Rate |
| TBA | To Be Announced |
MFS Total Return Bond Series
Portfolio of Investments (unaudited) – continued
| Derivative Contracts at 6/30/20 |
| Futures Contracts |
| Description | Long/
Short | Currency | Contracts | Notional
Amount | Expiration
Date | Value/Unrealized
Appreciation
(Depreciation) |
| Asset Derivatives |
| Interest Rate Futures | | |
| U.S. Treasury Note 2 yr | Long | USD | 611 | $134,925,985 | September – 2020 | $40,805 |
| U.S. Treasury Ultra Bond | Long | USD | 320 | 69,810,000 | September – 2020 | 237,705 |
| | | | | | | $278,510 |
| Liability Derivatives |
| Interest Rate Futures | | |
| U.S. Treasury Ultra Note 10 yr | Short | USD | 862 | $135,751,531 | September – 2020 | $(721,682) |
| Cleared Swap Agreements |
Maturity
Date | Notional
Amount | Counterparty | Cash Flows
to Receive/
Frequency | Cash Flows
to Pay/
Frequency | Unrealized
Appreciation
(Depreciation) | | Net Unamortized
Upfront Payments
(Receipts) | | Value |
| Liability Derivatives | | | | | |
| Credit Default Swaps | | | | | |
| 6/20/25 | USD | 30,295,500 | centrally cleared | 5%/Quarterly | (1) | $836,536 | | $(1,018,260) | | $(181,724) |
(1) Fund, as protection seller, to pay notional amount upon a defined credit event by a reference obligation specified in the CDX North American High-Yield Index, 5.00%, 6/20/25, a B rated credit default index. The fund entered into the contract to gain issuer exposure.
At June 30, 2020, the fund had cash collateral of $4,035,000 and other liquid securities with an aggregate value of $3,104,595 to cover any collateral or margin obligations for certain derivative contracts. Restricted cash and/or deposits with brokers in the Statement of Assets and Liabilities are comprised of cash collateral.
See Notes to Financial Statements
MFS Total Return Bond Series
| Financial Statements | Statement of Assets and Liabilities (unaudited) |
This statement represents your fund’s balance sheet, which details the assets and liabilities comprising the total value of the fund.
| At 6/30/20Assets | |
| Investments in unaffiliated issuers, at value (identified cost, $1,789,505,207) | $1,887,963,188 |
| Investments in affiliated issuers, at value (identified cost, $43,482,744) | 43,482,744 |
| Cash | 3,921,943 |
| Deposits with brokers for | |
| Cleared swaps | 2,665,000 |
| Futures contracts | 1,370,000 |
| Receivables for | |
| Net daily variation margin on open cleared swap agreements | 985,066 |
| Investments sold | 7,749,406 |
| TBA sale commitments | 4,639,980 |
| Fund shares sold | 17,675,526 |
| Interest | 12,327,029 |
| Other assets | 4,270 |
| Total assets | $1,982,784,152 |
| Liabilities | |
| Payables for | |
| Due to cleared swap brokers | $122,188 |
| Net daily variation margin on open futures contracts | 104,950 |
| Investments purchased | 35,271,682 |
| TBA purchase commitments | 53,229,335 |
| Fund shares reacquired | 1,634,175 |
| Payable to affiliates | |
| Investment adviser | 50,305 |
| Administrative services fee | 1,490 |
| Shareholder servicing costs | 738 |
| Distribution and/or service fees | 14,188 |
| Accrued expenses and other liabilities | 222,017 |
| Total liabilities | $90,651,068 |
| Net assets | $1,892,133,084 |
| Net assets consist of | |
| Paid-in capital | $1,725,840,460 |
| Total distributable earnings (loss) | 166,292,624 |
| Net assets | $1,892,133,084 |
| Shares of beneficial interest outstanding | 136,215,050 |
| | Net assets | Shares
outstanding | Net asset value
per share |
| Initial Class | $852,250,397 | 60,703,570 | $14.04 |
| Service Class | 1,039,882,687 | 75,511,480 | 13.77 |
See Notes to Financial Statements
MFS Total Return Bond Series
| Financial Statements | Statement of Operations (unaudited) |
This statement describes how much your fund earned in investment income and accrued in expenses. It also describes any gains and/or losses generated by fund operations.
| Six months ended 6/30/20 | |
| Net investment income (loss) | |
| Income | |
| Interest | $32,083,922 |
| Dividends from affiliated issuers | 430,347 |
| Other | 10,323 |
| Total investment income | $32,524,592 |
| Expenses | |
| Management fee | $4,716,842 |
| Distribution and/or service fees | 1,298,893 |
| Shareholder servicing costs | 18,740 |
| Administrative services fee | 133,885 |
| Independent Trustees' compensation | 19,780 |
| Custodian fee | 51,581 |
| Shareholder communications | 54,994 |
| Audit and tax fees | 39,088 |
| Legal fees | 9,264 |
| Miscellaneous | 58,388 |
| Total expenses | $6,401,455 |
| Reduction of expenses by investment adviser | (101,656) |
| Net expenses | $6,299,799 |
| Net investment income (loss) | $26,224,793 |
| Realized and unrealized gain (loss) | |
| Realized gain (loss) (identified cost basis) | |
| Unaffiliated issuers | $17,949,085 |
| Affiliated issuers | 45,374 |
| Futures contracts | 12,230,228 |
| Swap agreements | (6,387,049) |
| Forward foreign currency exchange contracts | 142,184 |
| Foreign currency | (39) |
| Net realized gain (loss) | $23,979,783 |
| Change in unrealized appreciation or depreciation | |
| Unaffiliated issuers | $18,200,870 |
| Affiliated issuers | (140) |
| Futures contracts | 867,111 |
| Swap agreements | 836,536 |
| Forward foreign currency exchange contracts | (158,908) |
| Translation of assets and liabilities in foreign currencies | 16,699 |
| Net unrealized gain (loss) | $19,762,168 |
| Net realized and unrealized gain (loss) | $43,741,951 |
| Change in net assets from operations | $69,966,744 |
See Notes to Financial Statements
MFS Total Return Bond Series
| Financial Statements | Statements of Changes in Net Assets |
These statements describe the increases and/or decreases in net assets resulting from operations, any distributions, and any shareholder transactions.
| | Six months ended | Year ended |
| | 6/30/20
(unaudited) | 12/31/19 |
| Change in net assets | | |
| From operations | | |
| Net investment income (loss) | $26,224,793 | $61,197,882 |
| Net realized gain (loss) | 23,979,783 | 13,890,726 |
| Net unrealized gain (loss) | 19,762,168 | 119,677,493 |
| Change in net assets from operations | $69,966,744 | $194,766,101 |
| Total distributions to shareholders | $— | $(66,623,045) |
| Change in net assets from fund share transactions | $(222,018,073) | $(83,743,514) |
| Total change in net assets | $(152,051,329) | $44,399,542 |
| Net assets | | |
| At beginning of period | 2,044,184,413 | 1,999,784,871 |
| At end of period | $1,892,133,084 | $2,044,184,413 |
See Notes to Financial Statements
MFS Total Return Bond Series
| Financial Statements | Financial Highlights |
The financial highlights table is intended to help you understand the fund's financial performance for the semiannual period and the past 5 fiscal years. Certain information reflects financial results for a single fund share. The total returns in the table represent the rate that an investor would have earned (or lost) on an investment in the fund share class (assuming reinvestment of all distributions) held for the entire period.
| Initial Class | Six months
ended | Year ended |
| | 6/30/20
(unaudited) | 12/31/19 | 12/31/18 | 12/31/17 | 12/31/16 | 12/31/15 |
| Net asset value, beginning of period | $13.48 | $12.65 | $13.22 | $13.09 | $13.00 | $13.50 |
| Income (loss) from investment operations | | | | | | |
| Net investment income (loss) (d) | $0.20 | $0.42 | $0.39 | $0.36 | $0.40(c) | $0.38 |
| Net realized and unrealized gain (loss) | 0.36 | 0.87 | (0.53) | 0.22 | 0.16 | (0.42) |
| Total from investment operations | $0.56 | $1.29 | $(0.14) | $0.58 | $0.56 | $(0.04) |
| Less distributions declared to shareholders | | | | | | |
| From net investment income | $— | $(0.46) | $(0.43) | $(0.45) | $(0.47) | $(0.46) |
| Net asset value, end of period (x) | $14.04 | $13.48 | $12.65 | $13.22 | $13.09 | $13.00 |
| Total return (%) (k)(r)(s)(x) | 4.15(n) | 10.21 | (1.09) | 4.46 | 4.23(c) | (0.30) |
Ratios (%) (to average net assets)
and Supplemental data: | | | | | | |
| Expenses before expense reductions (f) | 0.54(a) | 0.54 | 0.54 | 0.54 | 0.53(c) | 0.54 |
| Expenses after expense reductions (f) | 0.53(a) | 0.53 | 0.53 | 0.53 | 0.52(c) | 0.53 |
| Net investment income (loss) | 2.91(a) | 3.14 | 3.04 | 2.70 | 2.98(c) | 2.83 |
| Portfolio turnover | 61(n) | 79 | 48 | 47 | 37 | 62 |
| Net assets at end of period (000 omitted) | $852,250 | $939,179 | $862,752 | $997,415 | $986,877 | $1,030,563 |
| Service Class | Six months
ended | Year ended |
| | 6/30/20
(unaudited) | 12/31/19 | 12/31/18 | 12/31/17 | 12/31/16 | 12/31/15 |
| Net asset value, beginning of period | $13.24 | $12.43 | $12.99 | $12.87 | $12.78 | $13.28 |
| Income (loss) from investment operations | | | | | | |
| Net investment income (loss) (d) | $0.18 | $0.38 | $0.35 | $0.32 | $0.36(c) | $0.34 |
| Net realized and unrealized gain (loss) | 0.35 | 0.85 | (0.52) | 0.22 | 0.16 | (0.41) |
| Total from investment operations | $0.53 | $1.23 | $(0.17) | $0.54 | $0.52 | $(0.07) |
| Less distributions declared to shareholders | | | | | | |
| From net investment income | $— | $(0.42) | $(0.39) | $(0.42) | $(0.43) | $(0.43) |
| Net asset value, end of period (x) | $13.77 | $13.24 | $12.43 | $12.99 | $12.87 | $12.78 |
| Total return (%) (k)(r)(s)(x) | 4.00(n) | 9.92 | (1.33) | 4.18 | 4.01(c) | (0.58) |
Ratios (%) (to average net assets)
and Supplemental data: | | | | | | |
| Expenses before expense reductions (f) | 0.79(a) | 0.79 | 0.79 | 0.79 | 0.78(c) | 0.79 |
| Expenses after expense reductions (f) | 0.78(a) | 0.78 | 0.78 | 0.78 | 0.77(c) | 0.78 |
| Net investment income (loss) | 2.67(a) | 2.89 | 2.79 | 2.45 | 2.73(c) | 2.58 |
| Portfolio turnover | 61(n) | 79 | 48 | 47 | 37 | 62 |
| Net assets at end of period (000 omitted) | $1,039,883 | $1,105,005 | $1,137,033 | $1,449,260 | $1,457,118 | $1,539,194 |
See Notes to Financial Statements
MFS Total Return Bond Series
Financial Highlights - continued
| (a) | Annualized. |
| (c) | Amount reflects a one-time reimbursement of expenses by the custodian (or former custodian) without which net investment income and performance would be lower and expenses would be higher. |
| (d) | Per share data is based on average shares outstanding. |
| (f) | Ratios do not reflect reductions from fees paid indirectly, if applicable. |
| (k) | The total return does not reflect expenses that apply to separate accounts. Inclusion of these charges would reduce the total return figures for all periods shown. |
| (n) | Not annualized. |
| (r) | Certain expenses have been reduced without which performance would have been lower. |
| (s) | From time to time the fund may receive proceeds from litigation settlements, without which performance would be lower. |
| (x) | The net asset values and total returns have been calculated on net assets which include adjustments made in accordance with U.S. generally accepted accounting principles required at period end for financial reporting purposes. |
See Notes to Financial Statements
MFS Total Return Bond Series
Notes to Financial Statements (unaudited)
(1) Business and Organization
MFS Total Return Bond Series (the fund) is a diversified series of MFS Variable Insurance Trust (the trust). The trust is organized as a Massachusetts business trust and is registered under the Investment Company Act of 1940, as amended, as an open-end management investment company. The shareholders of each series of the trust are separate accounts of insurance companies, which offer variable annuity and/or life insurance products, and qualified retirement and pension plans.
The fund is an investment company and accordingly follows the investment company accounting and reporting guidance of the Financial Accounting Standards Board (FASB) Accounting Standards Codification Topic 946 Financial Services - Investment Companies.
(2) Significant Accounting Policies
General — The preparation of financial statements in conformity with U.S. generally accepted accounting principles requires management to make estimates and assumptions that affect the reported amounts of assets and liabilities, and disclosure of contingent assets and liabilities at the date of the financial statements and the reported amounts of increases and decreases in net assets from operations during the reporting period. Actual results could differ from those estimates. In the preparation of these financial statements, management has evaluated subsequent events occurring after the date of the fund’s Statement of Assets and Liabilities through the date that the financial statements were issued. The fund invests in foreign securities. Investments in foreign securities are vulnerable to the effects of changes in the relative values of the local currency and the U.S. dollar and to the effects of changes in each country’s market, economic, industrial, political, regulatory, geopolitical, environmental, public health, and other conditions.
In March 2020, the FASB issued Accounting Standards Update 2020-04, Reference Rate Reform (Topic 848) – Facilitation of the Effects of Reference Rate Reform on Financial Reporting (“ASU 2020-04”), which provides optional, temporary relief with respect to the financial reporting of contracts subject to certain types of modifications due to the planned discontinuation of the London Interbank Offered Rate (LIBOR) and other IBOR-based reference rates as of the end of 2021. The temporary relief provided by ASU 2020-04 is effective for certain reference rate-related contract modifications that occur during the period from March 12, 2020 through December 31, 2022. Management is evaluating the impact of ASU 2020-04 on the fund's investments, derivatives, debt and other contracts that will undergo reference rate-related modifications as a result of the reference rate reform.
Balance Sheet Offsetting — The fund's accounting policy with respect to balance sheet offsetting is that, absent an event of default by the counterparty or a termination of the agreement, the International Swaps and Derivatives Association (ISDA) Master Agreement, or similar agreement, does not result in an offset of reported amounts of financial assets and financial liabilities in the Statement of Assets and Liabilities across transactions between the fund and the applicable counterparty. The fund's right to setoff may be restricted or prohibited by the bankruptcy or insolvency laws of the particular jurisdiction to which a specific master netting agreement counterparty is subject. Balance sheet offsetting disclosures, to the extent applicable to the fund, have been included in the fund’s Significant Accounting Policies note under the captions for each of the fund’s in-scope financial instruments and transactions.
Investment Valuations — Debt instruments and floating rate loans, including restricted debt instruments, are generally valued at an evaluated or composite bid as provided by a third-party pricing service. Short-term instruments with a maturity at issuance of 60 days or less may be valued at amortized cost, which approximates market value. Exchange-traded options are generally valued at the last sale or official closing price on their primary exchange as provided by a third-party pricing service. Exchange-traded options for which there were no sales reported that day are generally valued at the last daily bid quotation on their primary exchange as provided by a third-party pricing service. For put options, the position may be valued at the last daily ask quotation if there are no trades reported during the day. Options not traded on an exchange are generally valued at a broker/dealer bid quotation. Foreign currency options are generally valued at valuations provided by a third-party pricing service. Futures contracts are generally valued at last posted settlement price on their primary exchange as provided by a third-party pricing service. Futures contracts for which there were no trades that day for a particular position are generally valued at the closing bid quotation on their primary exchange as provided by a third-party pricing service. Forward foreign currency exchange contracts are generally valued at the mean of bid and asked prices for the time period interpolated from rates provided by a third-party pricing service for proximate time periods. Swap agreements are generally valued using valuations provided by a third-party pricing service, which for cleared swaps includes an evaluation of any trading activity at the clearinghouses. Open-end investment companies are generally valued at net asset value per share. Securities and other assets generally valued on the basis of information from a third-party pricing service may also be valued at a broker/dealer bid quotation. In determining values, third-party pricing services can utilize both transaction data and market information such as yield, quality, coupon rate, maturity, type of issue, trading characteristics, and other market data. The values of foreign securities and other assets and liabilities expressed in foreign currencies are converted to U.S. dollars using the mean of bid and asked prices for rates provided by a third-party pricing service.
MFS Total Return Bond Series
Notes to Financial Statements (unaudited) - continued
The Board of Trustees has delegated primary responsibility for determining or causing to be determined the value of the fund’s investments (including any fair valuation) to the adviser pursuant to valuation policies and procedures approved by the Board. If the adviser determines that reliable market quotations are not readily available, investments are valued at fair value as determined in good faith by the adviser in accordance with such procedures under the oversight of the Board of Trustees. Under the fund’s valuation policies and procedures, market quotations are not considered to be readily available for most types of debt instruments and floating rate loans and many types of derivatives. These investments are generally valued at fair value based on information from third-party pricing services. In addition, investments may be valued at fair value if the adviser determines that an investment’s value has been materially affected by events occurring after the close of the exchange or market on which the investment is principally traded (such as foreign exchange or market) and prior to the determination of the fund’s net asset value, or after the halt of trading of a specific security where trading does not resume prior to the close of the exchange or market on which the security is principally traded. The adviser generally relies on third-party pricing services or other information (such as the correlation with price movements of similar securities in the same or other markets; the type, cost and investment characteristics of the security; the business and financial condition of the issuer; and trading and other market data) to assist in determining whether to fair value and at what value to fair value an investment. The value of an investment for purposes of calculating the fund’s net asset value can differ depending on the source and method used to determine value. When fair valuation is used, the value of an investment used to determine the fund’s net asset value may differ from quoted or published prices for the same investment. There can be no assurance that the fund could obtain the fair value assigned to an investment if it were to sell the investment at the same time at which the fund determines its net asset value per share.
Various inputs are used in determining the value of the fund's assets or liabilities. These inputs are categorized into three broad levels. In certain cases, the inputs used to measure fair value may fall into different levels of the fair value hierarchy. In such cases, an investment's level within the fair value hierarchy is based on the lowest level of input that is significant to the fair value measurement. The fund's assessment of the significance of a particular input to the fair value measurement in its entirety requires judgment, and considers factors specific to the investment. Level 1 includes unadjusted quoted prices in active markets for identical assets or liabilities. Level 2 includes other significant observable market-based inputs (including quoted prices for similar securities, interest rates, prepayment speed, and credit risk). Level 3 includes unobservable inputs, which may include the adviser's own assumptions in determining the fair value of investments. Other financial instruments are derivative instruments, such as futures contracts and swap agreements. The following is a summary of the levels used as of June 30, 2020 in valuing the fund's assets or liabilities:
| Financial Instruments | Level 1 | Level 2 | Level 3 | Total |
| U.S. Treasury Bonds & U.S. Government Agencies & Equivalents | $— | $31,024,770 | $— | $31,024,770 |
| Non - U.S. Sovereign Debt | — | 3,170,667 | — | 3,170,667 |
| Municipal Bonds | — | 62,928,142 | — | 62,928,142 |
| U.S. Corporate Bonds | — | 751,327,208 | — | 751,327,208 |
| Residential Mortgage-Backed Securities | — | 403,094,199 | — | 403,094,199 |
| Commercial Mortgage-Backed Securities | — | 205,697,486 | — | 205,697,486 |
| Asset-Backed Securities (including CDOs) | — | 213,297,637 | — | 213,297,637 |
| Foreign Bonds | — | 217,423,079 | — | 217,423,079 |
| Mutual Funds | 43,482,744 | — | — | 43,482,744 |
| Total | $43,482,744 | $1,887,963,188 | $— | $1,931,445,932 |
| Other Financial Instruments | | | | |
| Futures Contracts – Assets | $278,510 | $— | $— | $278,510 |
| Futures Contracts – Liabilities | (721,682) | — | — | (721,682) |
| Swap Agreements – Liabilities | — | (181,724) | — | (181,724) |
For further information regarding security characteristics, see the Portfolio of Investments.
Foreign Currency Translation — Purchases and sales of foreign investments, income, and expenses are converted into U.S. dollars based upon currency exchange rates prevailing on the respective dates of such transactions or on the reporting date for foreign denominated receivables and payables. Gains and losses attributable to foreign currency exchange rates on sales of securities are recorded for financial statement purposes as net realized gains and losses on investments. Gains and losses attributable to foreign exchange rate movements on receivables, payables, income and expenses are recorded for financial statement purposes as foreign currency transaction gains and losses. That portion of both realized and unrealized gains and losses on investments that results from fluctuations in foreign currency exchange rates is not separately disclosed.
MFS Total Return Bond Series
Notes to Financial Statements (unaudited) - continued
Derivatives — The fund uses derivatives primarily to increase or decrease exposure to a particular market or segment of the market, or security, to increase or decrease interest rate or currency exposure, or as alternatives to direct investments. Derivatives are used for hedging or non-hedging purposes. While hedging can reduce or eliminate losses, it can also reduce or eliminate gains. When the fund uses derivatives as an investment to increase market exposure, or for hedging purposes, gains and losses from derivative instruments may be substantially greater than the derivative’s original cost.
The derivative instruments used by the fund during the period weres, purchased options, futures contracts, forward foreign currency exchange contracts, and swap agreements. Depending on the type of derivative, the fund may exit a derivative position by entering into an offsetting transaction with a counterparty or exchange, negotiating an agreement with the derivative counterparty, or novating the position to a third party. The fund may be unable to promptly close out a futures position in instances where the daily fluctuation in the price for that type of future exceeds the daily limit set by the exchange. The fund's period end derivatives, as presented in the Portfolio of Investments and the associated Derivative Contract tables, generally are indicative of the volume of its derivative activity during the period.
The following table presents, by major type of derivative contract, the fair value, on a gross basis, of the asset and liability components of derivatives held by the fund at June 30, 2020 as reported in the Statement of Assets and Liabilities:
| | | Fair Value (a) |
| Risk | Derivative Contracts | Asset Derivatives | Liability Derivatives |
| Interest Rate | Interest Rate Futures | $278,510 | $(721,682) |
| Credit | Credit Default Swaps | — | (181,724) |
| Total | | $278,510 | $(903,406) |
(a) Values presented in this table for futures contracts and cleared swap agreements correspond to the values reported in the fund's Portfolio of Investments. Only the current day net variation margin for futures contracts and cleared swap agreements is separately reported within the fund's Statement of Assets and Liabilities.
The following table presents, by major type of derivative contract, the realized gain (loss) on derivatives held by the fund for the six months ended June 30, 2020 as reported in the Statement of Operations:
| Risk | Futures
Contracts | Swap
Agreements | Forward Foreign
Currency
Exchange
Contracts | Unaffiliated Issuers
(Purchased
Options) |
| Interest Rate | $12,230,228 | $— | $— | $— |
| Foreign Exchange | — | — | 142,184 | — |
| Credit | — | (6,387,049) | — | 1,480,005 |
| Total | $12,230,228 | $(6,387,049) | $142,184 | $1,480,005 |
The following table presents, by major type of derivative contract, the change in unrealized appreciation or depreciation on derivatives held by the fund for the six months ended June 30, 2020 as reported in the Statement of Operations:
| Risk | Futures
Contracts | Swap
Agreements | Forward Foreign
Currency
Exchange
Contracts | Unaffiliated Issuers
(Purchased
Options) |
| Interest Rate | $867,111 | $— | $— | $— |
| Foreign Exchange | — | — | (158,908) | — |
| Credit | — | 836,536 | — | 388,278 |
| Total | $867,111 | $836,536 | $(158,908) | $388,278 |
Derivative counterparty credit risk is managed through formal evaluation of the creditworthiness of all potential counterparties. On certain, but not all, uncleared derivatives, the fund attempts to reduce its exposure to counterparty credit risk whenever possible by entering into an ISDA Master Agreement on a bilateral basis. The ISDA Master Agreement gives each party to the agreement the right to terminate all transactions traded under such agreement if there is a specified deterioration in the credit quality of the other party. Upon an event of default or a termination of the ISDA Master Agreement, the non-defaulting party has the right to close out all transactions traded under such agreement and to net amounts owed under each agreement to one net amount payable by one party to the other. This right to close out and net payments across all transactions traded under the ISDA Master Agreement could result in a reduction of the fund's credit risk to such counterparty equal to any amounts payable by the fund under the applicable transactions, if any.
MFS Total Return Bond Series
Notes to Financial Statements (unaudited) - continued
Collateral and margin requirements differ by type of derivative. For cleared derivatives (e.g., futures contracts, cleared swaps, and exchange-traded options), margin requirements are set by the clearing broker and the clearing house and collateral, in the form of cash or securities, is posted by the fund directly with the clearing broker. Collateral terms are counterparty agreement specific for uncleared derivatives (e.g., forward foreign currency exchange contracts, uncleared swap agreements, and uncleared options) and collateral, in the form of cash and securities, is held in segregated accounts with the fund's custodian in connection with these agreements. For derivatives traded under an ISDA Master Agreement, which contains a collateral support annex, the collateral requirements are netted across all transactions traded under such counterparty-specific agreement and an amount is posted from one party to the other to collateralize such obligations. Cash that has been segregated or delivered to cover the fund's collateral or margin obligations under derivative contracts, if any, will be reported separately in the Statement of Assets and Liabilities as restricted cash for uncleared derivatives and/or deposits with brokers for cleared derivatives. Securities pledged as collateral or margin for the same purpose, if any, are noted in the Portfolio of Investments. The fund may be required to make payments of interest on uncovered collateral or margin obligations with the broker. Any such payments are included in “Miscellaneous” expense in the Statement of Operations.
Purchased Options — The fund purchased put options for a premium. Purchased put options entitle the holder to sell a specified number of shares or units of a particular security, currency or index at a specified price at a specified date or within a specified period of time. Purchasing put options may hedge against an anticipated decline in the value of portfolio securities or currency or decrease the fund’s exposure to an underlying instrument.
The premium paid is initially recorded as an investment in the Statement of Assets and Liabilities. That investment is subsequently marked-to-market daily with the difference between the premium paid and the market value of the purchased option being recorded as unrealized appreciation or depreciation. Premiums paid for purchased put options which have expired are treated as realized losses on investments in the Statement of Operations. Upon the exercise or closing of a purchased put option, the premium paid is offset against the proceeds on the sale of the underlying security or financial instrument in order to determine the realized gain or loss on investments.
Whether or not the option is exercised, the fund’s maximum risk of loss from purchasing an option is the amount of premium paid. All option contracts involve credit risk if the counterparty to the option contract fails to perform. For uncleared options, this risk is mitigated in cases where there is an ISDA Master Agreement between the fund and the counterparty providing for netting as described above and, where applicable, by the posting of collateral by the counterparty to the fund to cover the fund’s exposure to the counterparty under such ISDA Master Agreement.
Futures Contracts — The fund entered into futures contracts which may be used to hedge against or obtain broad market exposure, interest rate exposure, currency exposure, or to manage duration. A futures contract represents a commitment for the future purchase or sale of an asset at a specified price on a specified date.
Upon entering into a futures contract, the fund is required to deposit with the broker, either in cash or securities, an initial margin in an amount equal to a specified percentage of the notional amount of the contract. Subsequent payments (variation margin) are made or received by the fund each day, depending on the daily fluctuations in the value of the contract, and are recorded for financial statement purposes as unrealized gain or loss by the fund until the contract is closed or expires at which point the gain or loss on futures contracts is realized.
The fund bears the risk of interest rates, exchange rates or securities prices moving unexpectedly, in which case, the fund may not achieve the anticipated benefits of the futures contracts and may realize a loss. While futures contracts may present less counterparty risk to the fund since the contracts are exchange traded and the exchange’s clearinghouse guarantees payments to the broker, there is still counterparty credit risk due to the insolvency of the broker. The fund’s maximum risk of loss due to counterparty credit risk is equal to the margin posted by the fund to the broker plus any gains or minus any losses on the outstanding futures contracts.
Forward Foreign Currency Exchange Contracts — The fund entered into forward foreign currency exchange contracts for the purchase or sale of a specific foreign currency at a fixed price on a future date. These contracts may be used to hedge the fund’s currency risk or for non-hedging purposes. For hedging purposes, the fund may enter into contracts to deliver or receive foreign currency that the fund will receive from or use in its normal investment activities. The fund may also use contracts to hedge against declines in the value of foreign currency denominated securities due to unfavorable exchange rate movements. For non-hedging purposes, the fund may enter into contracts with the intent of changing the relative exposure of the fund’s portfolio of securities to different currencies to take advantage of anticipated exchange rate changes.
Forward foreign currency exchange contracts are adjusted by the daily exchange rate of the underlying currency and any unrealized gains or losses are recorded as a receivable or payable for forward foreign currency exchange contracts until the contract settlement date. On contract settlement date, any gain or loss on the contract is recorded as realized gains or losses on forward foreign currency exchange contracts.
MFS Total Return Bond Series
Notes to Financial Statements (unaudited) - continued
Risks may arise upon entering into these contracts from unanticipated movements in the value of the contract and from the potential inability of counterparties to meet the terms of their contracts. Generally, the fund’s maximum risk due to counterparty credit risk is the unrealized gain on the contract due to the use of Continuous Linked Settlement, a multicurrency cash settlement system for the centralized settlement of foreign transactions. This risk is mitigated in cases where there is an ISDA Master Agreement between the fund and the counterparty providing for netting as described above and, where applicable, by the posting of collateral by the counterparty to the fund to cover the fund’s exposure to the counterparty under such ISDA Master Agreement.
Swap Agreements — During the period the fund entered into swap agreements. Swap agreements generally involve a periodic exchange of cash payments on a net basis, at specified intervals or upon the occurrence of specified events, between the fund and a counterparty. Certain swap agreements may be entered into as a bilateral contract (“uncleared swaps”) while others are required to be centrally cleared (“cleared swaps”). In a cleared swap transaction, the ultimate counterparty to the transaction is a clearinghouse (the “clearinghouse”). The contract is transferred and accepted by the clearinghouse immediately following execution of the swap contract with an executing broker. Thereafter, throughout the term of the cleared swap, the fund interfaces indirectly with the clearinghouse through a clearing broker and has counterparty risk to the clearing broker as well.
Both cleared and uncleared swap agreements are marked to market daily. The value of uncleared swap agreements is reported in the Statement of Assets and Liabilities as “Uncleared swaps, at value” which includes any related interest accruals to be paid or received by the fund. For cleared swaps, payments (variation margin) are made or received by the fund each day, depending on the daily fluctuations in the value of the cleared swap, such that only the current day net receivable or payable for variation margin is reported in the Statement of Assets and Liabilities.
For both cleared and uncleared swaps, the periodic exchange of net cash payments, at specified intervals or upon the occurrence of specified events as stipulated by the agreement, is recorded as realized gain or loss on swap agreements in the Statement of Operations. Premiums paid or received at the inception of the agreements are amortized using the effective interest method over the term of the agreement as realized gain or loss on swap agreements in the Statement of Operations. A liquidation payment received or made upon early termination is recorded as a realized gain or loss on swap agreements in the Statement of Operations. The change in unrealized appreciation or depreciation on swap agreements in the Statement of Operations reflects the aggregate change over the reporting period in the value of swaps net of any unamortized premiums paid or received.
Risks related to swap agreements include the possible lack of a liquid market, unfavorable market and interest rate movements of the underlying instrument and the failure of the counterparty to perform under the terms of the agreements. The fund's maximum risk of loss from counterparty credit risk is the discounted net value of the cash flows to be received from/paid to the counterparty over the contract's remaining life, to the extent that the amount is positive. To address counterparty risk, uncleared swap agreements are limited to only highly-rated counterparties. Risk is further reduced by having an ISDA Master Agreement between the fund and the counterparty providing for netting as described above and, where applicable, by the posting of collateral by the counterparty to the fund to cover the fund’s exposure to the counterparty under such ISDA Master Agreement. The fund's counterparty risk due to cleared swaps is mitigated by the fact that the clearinghouse is the true counterparty to the transaction and the regulatory requirement safeguards in the event of a clearing broker bankruptcy.
The fund entered into credit default swap agreements in order to manage its exposure to the market or certain sectors of the market, to reduce its credit risk exposure to defaults of corporate and sovereign issuers or to create exposure to corporate or sovereign issuers to which it is not otherwise exposed. In a credit default swap agreement, the protection buyer can make an upfront payment and will make a stream of payments to the protection seller based on a fixed percentage applied to the agreement notional amount in exchange for the right to receive a specified return upon the occurrence of a defined credit event on the reference obligation (which may be either a single security or a basket of securities issued by corporate or sovereign issuers) and, with respect to the cases where physical settlement applies, the delivery by the buyer to the seller of a defined deliverable obligation. Although agreement-specific, credit events generally consist of a combination of the following: bankruptcy, failure to pay, restructuring, obligation acceleration, obligation default, or repudiation/moratorium, each as defined in the 2003 ISDA Credit Derivatives Definitions as amended by the relevant agreement. Restructuring is generally not applicable when the reference obligation is issued by a North American corporation and obligation acceleration, obligation default, or repudiation/moratorium are generally only applicable when the reference obligation is issued by a sovereign entity or an entity in an emerging country. Upon determination of the final price for the deliverable obligation (or upon delivery of the deliverable obligation in the case of physical settlement), the difference between the value of the deliverable obligation and the swap agreement’s notional amount is recorded as realized gain or loss on swap agreements in the Statement of Operations.
Credit default swap agreements are considered to have credit-risk-related contingent features since they trigger payment by the protection seller to the protection buyer upon the occurrence of a defined credit event. The aggregate fair value of credit default swap agreements in a net liability position as of June 30, 2020 is disclosed in the footnotes to the Portfolio of Investments. The maximum amount of future, undiscounted payments that the fund, as protection seller, could be required to make is equal to the
MFS Total Return Bond Series
Notes to Financial Statements (unaudited) - continued
swap agreement’s notional amount. The protection seller’s payment obligation would be offset to the extent of the value of the agreement’s deliverable obligation. If a defined credit event had occurred as of June 30, 2020, the swap agreement's credit-risk-related contingent features would have been triggered and, for those swap agreements in a net liability position for which the fund is the protection seller, the fund in order to settle these swap agreements would have been required to either (1) pay the swap agreement’s notional value of $30,295,500 less the value of the agreements’ related deliverable obligations as decided through an ISDA auction or (2) pay the notional value of the swap agreements in return for physical receipt of the deliverable obligations. The fund’s maximum risk of loss from counterparty risk, either as the protection seller or as the protection buyer, is the fair value of the agreement.
Indemnifications — Under the fund's organizational documents, its officers and Trustees may be indemnified against certain liabilities and expenses arising out of the performance of their duties to the fund. Additionally, in the normal course of business, the fund enters into agreements with service providers that may contain indemnification clauses. The fund's maximum exposure under these agreements is unknown as this would involve future claims that may be made against the fund that have not yet occurred.
Investment Transactions and Income — Investment transactions are recorded on the trade date. Some securities may be purchased or sold on an extended settlement basis, which means that the receipt or delivery of the securities by the fund and related payments occur at a future date, usually beyond the customary settlement period. Interest income is recorded on the accrual basis. All premium and discount is amortized or accreted for financial statement purposes in accordance with U.S. generally accepted accounting principles. Interest payments received in additional securities are recorded on the ex-interest date in an amount equal to the value of the security on such date.
The fund may receive proceeds from litigation settlements. Any proceeds received from litigation involving portfolio holdings are reflected in the Statement of Operations in realized gain/loss if the security has been disposed of by the fund or in unrealized gain/loss if the security is still held by the fund. Any other proceeds from litigation not related to portfolio holdings are reflected as other income in the Statement of Operations.
The fund invests a significant portion of its assets in asset-backed and/or mortgage-backed securities. For these securities, the value of the debt instrument also depends on the credit quality and adequacy of the underlying assets or collateral as well as whether there is a security interest in the underlying assets or collateral. Enforcing rights, if any, against the underlying assets or collateral may be difficult. U.S. Government securities not supported as to the payment of principal or interest by the U.S. Treasury, such as those issued by Fannie Mae, Freddie Mac, and the Federal Home Loan Banks, are subject to greater credit risk than are U.S. Government securities supported by the U.S. Treasury, such as those issued by Ginnie Mae.
The fund may purchase or sell mortgage-backed securities on a “To Be Announced” (TBA) basis. A TBA transaction is subject to extended settlement and typically does not designate the actual security to be delivered, but instead includes an approximate principal amount. The price of the TBA security and the date that it will be settled are fixed at the time the transaction is negotiated. The value of the security varies with market fluctuations and no interest accrues to the fund until settlement takes place. TBA purchase and sale commitments are held at carrying amount, which approximates fair value and are categorized as level 2 within the fair value hierarchy and included in TBA purchase and TBA sale commitments in the Statement of Assets and Liabilities. Losses may arise as a result of changes in the value of the TBA investment prior to settlement date or due to counterparty non-performance. At the time that it enters into a TBA transaction, the fund is required to have sufficient cash and/or liquid securities to cover its commitments.
The fund may also enter into mortgage dollar rolls, typically TBA dollar rolls, in which the fund sells TBA mortgage-backed securities to financial institutions and simultaneously agrees to repurchase similar (same issuer, type and coupon) securities at a later date at an agreed-upon price. During the period between the sale and repurchase, the fund will not be entitled to receive interest and principal payments on the securities sold. The fund accounts for dollar roll transactions as purchases and sales and realizes gains and losses on these transactions. Dollar roll transactions involve the risk that the market value of the securities that the fund is required to purchase may decline below the agreed upon repurchase price of those securities.
To mitigate the counterparty credit risk on TBA transactions, mortgage dollar rolls, and other types of forward settling mortgage-backed and asset-backed security transactions, the fund whenever possible enters into a Master Securities Forward Transaction Agreement (“MSFTA”) on a bilateral basis with each of the counterparties with whom it undertakes a significant volume of transactions. The MSFTA gives each party to the agreement the right to terminate all transactions traded under such agreement if there is a specified deterioration in the credit quality of the other party. Upon an event of default or a termination of the MSFTA, the non-defaulting party has the right to close out all transactions traded under such agreement and to net amounts owed under each transaction to one net amount payable by one party to the other. This right to close out and net payments across all transactions traded under the MSFTA could result in a reduction of the fund's credit risk to such counterparty equal to any amounts payable by the fund under the applicable transactions, if any.
MFS Total Return Bond Series
Notes to Financial Statements (unaudited) - continued
For mortgage-backed and asset-backed securities traded under a MSFTA, the collateral and margining requirements are contract specific. Collateral amounts across all transactions traded under such agreement are netted and an amount is posted from one party to the other to collateralize such obligations. Cash that has been pledged to cover the fund's collateral or margin obligations under a MSFTA, if any, will be reported separately on the Statement of Assets and Liabilities as restricted cash. Securities pledged as collateral or margin for the same purpose, if any, are noted in the Portfolio of Investments.
Tax Matters and Distributions — The fund intends to qualify as a regulated investment company, as defined under Subchapter M of the Internal Revenue Code, and to distribute all of its taxable income, including realized capital gains. As a result, no provision for federal income tax is required. The fund’s federal tax returns, when filed, will remain subject to examination by the Internal Revenue Service for a three year period. Management has analyzed the fund’s tax positions taken on federal and state tax returns for all open tax years and does not believe that there are any uncertain tax positions that require recognition of a tax liability. Foreign taxes, if any, have been accrued by the fund in the accompanying financial statements in accordance with the applicable foreign tax law. Foreign income taxes may be withheld by certain countries in which the fund invests. Additionally, capital gains realized by the fund on securities issued in or by certain foreign countries may be subject to capital gains tax imposed by those countries.
Distributions to shareholders are recorded on the ex-dividend date. Income and capital gain distributions are determined in accordance with income tax regulations, which may differ from U.S. generally accepted accounting principles. Certain capital accounts in the financial statements are periodically adjusted for permanent differences in order to reflect their tax character. These adjustments have no impact on net assets or net asset value per share. Temporary differences which arise from recognizing certain items of income, expense, gain or loss in different periods for financial statement and tax purposes will reverse at some time in the future.
Book/tax differences primarily relate to amortization and accretion of debt securities and derivative transactions.
The tax character of distributions declared to shareholders for the last fiscal year is as follows:
| | Year ended
12/31/19 |
| Ordinary income (including any short-term capital gains) | $66,623,045 |
The federal tax cost and the tax basis components of distributable earnings were as follows:
| As of 6/30/20 | |
| Cost of investments | $1,836,821,305 |
| Gross appreciation | 111,902,990 |
| Gross depreciation | (17,278,363) |
| Net unrealized appreciation (depreciation) | $94,624,627 |
| As of 12/31/19 | |
| Undistributed ordinary income | 63,393,954 |
| Capital loss carryforwards | (42,269,007) |
| Other temporary differences | (16,699) |
| Net unrealized appreciation (depreciation) | 75,217,632 |
The aggregate cost above includes prior fiscal year end tax adjustments, if applicable.
As of December 31, 2019, the fund had capital loss carryforwards available to offset future realized gains. These net capital losses may be carried forward indefinitely and their character is retained as short-term and/or long-term losses. Such losses are characterized as follows:
| Short-Term | $(13,097,459) |
| Long-Term | (29,171,548) |
| Total | $(42,269,007) |
Multiple Classes of Shares of Beneficial Interest — The fund offers multiple classes of shares, which differ in their respective distribution and/or service fees. The fund's income, realized and unrealized gain (loss), and common expenses are allocated to shareholders based on the daily net assets of each class. Dividends are declared separately for each class. Differences in per share dividend rates are generally due to differences in separate class expenses. The fund’s distributions declared to shareholders as reported in the Statements of Changes in Net Assets are presented by class as follows:
MFS Total Return Bond Series
Notes to Financial Statements (unaudited) - continued
| | Six months ended
6/30/20 | | Year ended
12/31/19 |
| Initial Class | $— | | $31,038,442 |
| Service Class | — | | 35,584,603 |
| Total | $— | | $66,623,045 |
(3) Transactions with Affiliates
Investment Adviser — The fund has an investment advisory agreement with MFS to provide overall investment management and related administrative services and facilities to the fund. The management fee is computed daily and paid monthly at the following annual rates based on the fund's average daily net assets:
| Up to $2.5 billion | 0.50% |
| In excess of $2.5 billion and up to $5 billion | 0.45% |
| In excess of $5 billion | 0.40% |
MFS has agreed in writing to reduce its management fee by a specified amount if certain MFS mutual fund assets exceed thresholds agreed to by MFS and the fund's Board of Trustees. For the six months ended June 30, 2020, this management fee reduction amounted to $101,656, which is included in the reduction of total expenses in the Statement of Operations. The management fee incurred for the six months ended June 30, 2020 was equivalent to an annual effective rate of 0.49% of the fund's average daily net assets.
Distributor — MFS Fund Distributors, Inc. (MFD), a wholly-owned subsidiary of MFS, is the distributor of shares of the fund. The Trustees have adopted a distribution plan for the Service Class shares pursuant to Rule 12b-1 under the Investment Company Act of 1940.
The fund's distribution plan provides that the fund will pay MFD distribution and/or service fees equal to 0.25% per annum of its average daily net assets attributable to Service Class shares as partial consideration for services performed and expenses incurred by MFD and financial intermediaries (including participating insurance companies that invest in the fund to fund variable annuity and variable life insurance contracts, sponsors of qualified retirement and pension plans that invest in the fund, and affiliates of these participating insurance companies and plan sponsors) in connection with the sale and distribution of the Service Class shares. MFD may subsequently pay all, or a portion, of the distribution and/or service fees to financial intermediaries.
Shareholder Servicing Agent — MFS Service Center, Inc. (MFSC), a wholly-owned subsidiary of MFS, receives a fee from the fund for its services as shareholder servicing agent. For the six months ended June 30, 2020, the fee was $18,160, which equated to 0.0019% annually of the fund's average daily net assets. MFSC also receives payment from the fund for out-of-pocket expenses paid by MFSC on behalf of the fund. For the six months ended June 30, 2020, these costs amounted to $580.
Administrator — MFS provides certain financial, legal, shareholder communications, compliance, and other administrative services to the fund. Under an administrative services agreement, the fund reimburses MFS the costs incurred to provide these services. The fund is charged an annual fixed amount of $17,500 plus a fee based on average daily net assets. The administrative services fee incurred for the six months ended June 30, 2020 was equivalent to an annual effective rate of 0.0142% of the fund's average daily net assets.
Trustees’ and Officers’ Compensation — The fund pays compensation to independent Trustees in the form of a retainer, attendance fees, and additional compensation to Board and Committee chairpersons. The fund does not pay compensation directly to Trustees or officers of the fund who are also officers of the investment adviser, all of whom receive remuneration from MFS for their services to the fund. Certain officers and Trustees of the fund are officers or directors of MFS, MFD, and MFSC.
Other — The fund invests in the MFS Institutional Money Market Portfolio which is managed by MFS and seeks current income consistent with preservation of capital and liquidity. This money market fund does not pay a management fee to MFS but does incur investment and operating costs.
(4) Portfolio Securities
For the six months ended June 30, 2020, purchases and sales of investments, other than purchased option transactions and short-term obligations, were as follows:
MFS Total Return Bond Series
Notes to Financial Statements (unaudited) - continued
| | Purchases | Sales |
| U.S. Government securities | $762,165,573 | $1,012,155,007 |
| Non-U.S. Government securities | 392,270,107 | 358,085,662 |
(5) Shares of Beneficial Interest
The fund's Declaration of Trust permits the Trustees to issue an unlimited number of full and fractional shares of beneficial interest. Transactions in fund shares were as follows:
| | Six months ended
6/30/20 | | Year ended
12/31/19 |
| | Shares | Amount | | Shares | Amount |
| Shares sold | | | | | |
| Initial Class | 7,228,852 | $98,191,219 | | 8,456,171 | $112,135,400 |
| Service Class | 4,753,926 | 64,741,604 | | 5,257,057 | 68,444,844 |
| | 11,982,778 | $162,932,823 | | 13,713,228 | $180,580,244 |
Shares issued to shareholders in
reinvestment of distributions | | | | | |
| Initial Class | — | $— | | 2,247,912 | $30,369,288 |
| Service Class | — | — | | 2,679,563 | 35,584,603 |
| | — | $— | | 4,927,475 | $65,953,891 |
| Shares reacquired | | | | | |
| Initial Class | (16,204,767) | $(218,631,226) | | (9,216,617) | $(122,502,428) |
| Service Class | (12,720,098) | (166,319,670) | | (15,939,795) | (207,775,221) |
| | (28,924,865) | $(384,950,896) | | (25,156,412) | $(330,277,649) |
| Net change | | | | | |
| Initial Class | (8,975,915) | $(120,440,007) | | 1,487,466 | $20,002,260 |
| Service Class | (7,966,172) | (101,578,066) | | (8,003,175) | (103,745,774) |
| | (16,942,087) | $(222,018,073) | | (6,515,709) | $(83,743,514) |
The fund is one of several mutual funds in which certain MFS funds may invest. The MFS funds do not invest in the underlying funds for the purpose of exercising management or control. At the end of the period, the MFS Moderate Allocation Portfolio and the MFS Conservative Allocation Portfolio were the owners of record of approximately 8% and 4%, respectively, of the value of outstanding voting shares of the fund. In addition, the MFS Growth Allocation Portfolio was the owner of record of less than 1% of the value of the outstanding voting shares of the fund.
(6) Line of Credit
The fund and certain other funds managed by MFS participate in a $1.25 billion unsecured committed line of credit, subject to a $1 billion sublimit, provided by a syndicate of banks under a credit agreement. Borrowings may be made for temporary financing needs. Interest is charged to each fund, based on its borrowings, generally at a rate equal to the highest of one month LIBOR, the Federal Funds Effective Rate and the Overnight Bank Funding Rate, plus an agreed upon spread. A commitment fee, based on the average daily, unused portion of the committed line of credit, is allocated among the participating funds. In addition, the fund and other funds managed by MFS have established unsecured uncommitted borrowing arrangements with certain banks for temporary financing needs. Interest is charged to each fund, based on its borrowings, at rates equal to customary reference rates plus an agreed upon spread. For the six months ended June 30, 2020, the fund’s commitment fee and interest expense were $4,990 and $318, respectively, and are included in “Miscellaneous” expense in the Statement of Operations.
(7) Investments in Affiliated Issuers
An affiliated issuer may be considered one in which the fund owns 5% or more of the outstanding voting securities, or a company which is under common control. For the purposes of this report, the following were affiliated issuers:
MFS Total Return Bond Series
Notes to Financial Statements (unaudited) - continued
| Affiliated Issuers | Beginning
Value | Purchases | Sales
Proceeds | Realized
Gain
(Loss) | Change in
Unrealized
Appreciation or
Depreciation | Ending
Value |
| MFS Institutional Money Market Portfolio | $23,060,848 | $515,424,507 | $495,047,845 | $45,374 | $(140) | $43,482,744 |
| Affiliated Issuers | Dividend
Income | Capital Gain
Distributions |
| MFS Institutional Money Market Portfolio | $430,347 | $— |
(8) Impacts of COVID-19
The pandemic related to the global spread of novel coronavirus disease (COVID-19), which was first detected in December 2019, has resulted in significant disruptions to global business activity and the global economy, as well as the economies of individual countries, the financial performance of individual companies and sectors, and the securities and commodities markets in general. This pandemic, the full effects of which are still unknown, has resulted in substantial market volatility and may have adversely impacted the prices and liquidity of the fund's investments and the fund's performance.
MFS Total Return Bond Series
Statement Regarding Liquidity Risk Management Program
The fund has adopted and implemented a liquidity risk management program (the “Program”) as required by Rule 22e-4 under the Investment Company Act of 1940, as amended. The fund’s Board of Trustees (the “Board”) has designated MFS as the administrator of the Program. The Program is reasonably designed to assess and manage the liquidity risk of the fund. Liquidity risk is the risk that the fund could not meet requests to redeem shares issued by the fund without significant dilution of remaining investors' interests.
MFS provided a written report to the Board for consideration at its April 2020 meeting that addressed the operation of the Program and provided an assessment of the adequacy and effectiveness of the Program during the period from the adoption of the Program on December 1, 2018 to December 31, 2019 (the “Covered Period”). The report concluded that during the Covered Period the Program had operated effectively and had adequately and effectively been implemented to assess and manage the fund’s liquidity risk. MFS also reported that there were no liquidity events that impacted the fund or its ability to timely meet redemptions without dilution to existing shareholders during the Covered Period.
There can be no assurance that the Program will achieve its objectives in the future. Further information on liquidity risk, and other principal risks to which an investment in the fund may be subject, can be found in the prospectus.
MFS Total Return Bond Series
Proxy Voting Policies and Information
MFS votes proxies on behalf of the fund pursuant to proxy voting policies and procedures that are available without charge, upon request, by calling 1-800-225-2606, by visiting mfs.com/proxyvoting, or by visiting the SEC’s Web site at http://www.sec.gov.
Information regarding how the fund voted proxies relating to portfolio securities during the most recent twelve-month period ended June 30 is available by August 31 of each year without charge by visiting mfs.com/proxyvoting, or by visiting the SEC’s Web site at http://www.sec.gov.
Quarterly Portfolio Disclosure
The fund files a complete schedule of portfolio holdings with the SEC for the first and third quarters of each fiscal year as an exhibit to its reports on Form N-PORT. The fund’s Form N-PORT reports are available on the SEC’s website at http://www.sec.gov. A shareholder can obtain the portfolio holdings report for the first and third quarters of the fund's fiscal year at mfs.com/vit1 by choosing the fund's name and then selecting the “Resources” tab and clicking on “Prospectus and Reports”.
FURTHER INFORMATION
From time to time, MFS may post important information about the fund or the MFS funds on the MFS web site (mfs.com). This information is available at https://www.mfs.com/announcements or at mfs.com/vit1 by choosing the fund's name and then selecting the “Resources” tab and clicking on the “Announcements” tab, if any.
Information About Fund Contracts and Legal Claims
The fund has entered into contractual arrangements with an investment adviser, administrator, distributor, shareholder servicing agent, 529 program manager (if applicable), and custodian who each provide services to the fund. Unless expressly stated otherwise, shareholders are not parties to, or intended beneficiaries of these contractual arrangements, and these contractual arrangements are not intended to create any shareholder right to enforce them against the service providers or to seek any remedy under them against the service providers, either directly or on behalf of the fund.
Under the Trust’s By-Laws and Declaration of Trust, any claims asserted against or on behalf of the MFS Funds, including claims against Trustees and Officers, must be brought in state and federal courts located within the Commonwealth of Massachusetts.
Semiannual Report
June 30, 2020

MFS® Research Series

MFS® Variable Insurance Trust
Beginning on January 1, 2021, as permitted by regulations adopted by the U.S. Securities and Exchange Commission, the insurance company that offers your contract may determine that it will no longer send you paper copies of the fund’s annual and semiannual shareholder reports unless you specifically request paper copies from the insurance company or from your financial intermediary. Instead, the shareholder reports will be made available on a Web site (insurancefunds.mfs.com or other Web site of which you will be notified), and the insurance company will notify you by mail each time a report is posted and provide you with a Web site link to access the report. Instructions for requesting paper copies will be provided by your insurance company or financial intermediary.
If you already elected to receive shareholder reports by email, you will not be affected by this change and you need not take any action. If your insurance company or financial intermediary offers electronic delivery, you may elect to receive shareholder reports and other communications from the insurance company or financial intermediary by email by following the instructions provided by the insurance company or financial intermediary.
Beginning on January 1, 2019, you may elect to receive all future reports in paper free of charge from the insurance company or financial intermediary. You can inform the insurance company or financial intermediary that you wish to continue receiving paper copies of your shareholder reports by contacting your insurance company or financial intermediary. Your election to receive reports in paper will apply to all funds held in your account with your insurance company or financial intermediary.
VFR-SEM
MFS® Research Series
CONTENTS
The report is prepared for the general information of contract owners. It is authorized for distribution to prospective investors only when preceded or accompanied by a current prospectus.
NOT FDIC INSURED • MAY LOSE VALUE • NO BANK OR CREDIT UNION GUARANTEE • NOT A DEPOSIT • NOT INSURED BY ANY FEDERAL GOVERNMENT AGENCY OR NCUA/NCUSIF
MFS Research Series
LETTER FROM THE EXECUTIVE CHAIR

Dear Contract Owners:
Markets experienced dramatic swings in early 2020, as the coronavirus pandemic brought the global economy to a standstill for several months. Optimism over the development of vaccines and therapeutics, along with a decline in cases in countries that had been affected by the outbreak early on, brightened the economic and market outlook during the second quarter, as did the phased reopening of US states. However, a great deal of uncertainty remains, including the possibility of a second wave of cases later this year, as many countries continue to experience COVID-19 flare-ups.
Global central banks have taken aggressive steps to cushion the economic and market fallout related to the virus, and governments are deploying unprecedented levels of fiscal support. As uncertainty recedes, these measures can help build a supportive environment and encourage economic recovery; however, if markets disconnect from fundamentals, they can also sow the seeds of instability. In the aftermath of the crisis, societal changes may be likely, as households, businesses, and governments adjust to a new reality, and these alterations could affect the investment landscape. For investors, events, such as the COVID-19 outbreak, demonstrate the importance of having a deep understanding of company fundamentals, and we have built our global research platform to do just that.
Here at MFS®, we aim to help our clients navigate the growing complexity of the markets and world economies. Our long-term investment philosophy and commitment to the responsible allocation of capital allow us to tune out the noise and uncover what we believe are the best, most durable investment opportunities in the market. Through our unique global investment platform, we combine collective expertise, thoughtful risk management, and long-term discipline to create sustainable value for investors.
Respectfully,

Robert J. Manning
Executive Chair
MFS Investment Management
August 17, 2020
The opinions expressed in this letter are subject to change, may not be relied upon for investment advice, and no forecasts can be guaranteed.
1
MFS Research Series
PORTFOLIO COMPOSITION
Portfolio structure
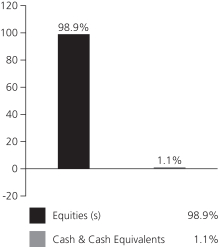
| | | | |
| Top ten holdings | | | | |
| Microsoft Corp. | | | 7.1% | |
| Amazon.com, Inc. | | | 5.6% | |
| Alphabet, Inc., “A” | | | 3.7% | |
| Visa, Inc., “A” | | | 2.7% | |
| Apple, Inc. | | | 2.7% | |
| Facebook, Inc., “A“ | | | 2.7% | |
| Adobe Systems, Inc. | | | 2.0% | |
| Johnson & Johnson | | | 1.8% | |
| Intel Corp. | | | 1.8% | |
| Salesforce.com, Inc. | | | 1.7% | |
| | | | |
| Global equity sectors (k) | | | | |
| Technology | | | 30.7% | |
| Health Care (s) | | | 14.3% | |
| Consumer Cyclicals | | | 14.0% | |
| Financial Services | | | 13.6% | |
| Capital Goods | | | 11.3% | |
| Energy | | | 5.6% | |
| Consumer Staples | | | 5.3% | |
| Telecommunications/Cable Television (s) | | | 4.1% | |
| (k) | The sectors set forth above and the associated portfolio composition are based on MFS’ own custom sector classification methodology. |
| (s) | Includes securities sold short. |
Cash & Cash Equivalents includes any cash, investments in money market funds, short-term securities, and other assets less liabilities. Please see the Statement of Assets and Liabilities for additional information related to the fund’s cash position and other assets and liabilities.
Percentages are based on net assets as of June 30, 2020.
The portfolio is actively managed and current holdings may be different.
2
MFS Research Series
EXPENSE TABLE
Fund Expenses Borne by the Contract Holders during the Period,
January 1, 2020 through June 30, 2020
As a contract holder of the fund, you incur ongoing costs, including management fees; distribution and/or service (12b-1) fees; and other fund expenses. This example is intended to help you understand your ongoing costs (in dollars) of investing in the fund and to compare these costs with the ongoing costs of investing in other mutual funds.
The example is based on an investment of $1,000 invested at the beginning of the period and held for the entire period January 1, 2020 through June 30, 2020.
Actual Expenses
The first line for each share class in the following table provides information about actual account values and actual expenses. You may use the information in this line, together with the amount you invested, to estimate the expenses that you paid over the period. Simply divide your account value by $1,000 (for example, an $8,600 account value divided by $1,000 = 8.6), then multiply the result by the number in the first line under the heading entitled “Expenses Paid During Period” to estimate the expenses you paid on your account during this period.
Hypothetical Example for Comparison Purposes
The second line for each share class in the following table provides information about hypothetical account values and hypothetical expenses based on the fund’s actual expense ratio and an assumed rate of return of 5% per year before expenses, which is not the fund’s actual return. The hypothetical account values and expenses may not be used to estimate the actual ending account balance or expenses you paid for the period. You may use this information to compare the ongoing costs of investing in the fund and other funds. To do so, compare this 5% hypothetical example with the 5% hypothetical examples that appear in the shareholder reports of the other funds.
Please note that the expenses shown in the table are meant to highlight the fund’s ongoing costs only and do not take into account the fees and expenses imposed under the variable contracts through which your investment in the fund is made. Therefore, the second line for each share class in the table is useful in comparing ongoing costs associated with an investment in vehicles (such as the fund) which fund benefits under variable annuity and variable life insurance contracts and to qualified pension and retirement plans only, and will not help you determine the relative total costs of investing in the fund through variable annuity and variable life insurance contracts. If the fees and expenses imposed under the variable contracts were included, your costs would have been higher.
| | | | | | | | | | | | | | | | | | |
| Share Class | | | | Annualized
Expense Ratio | | | Beginning
Account Value
1/01/20 | | | Ending
Account Value
6/30/20 | | | Expenses Paid
During Period (p)
1/01/20-6/30/20 | |
| Initial Class | | Actual | | | 0.80% | | | | $1,000.00 | | | | $973.89 | | | | $3.93 | |
| | Hypothetical (h) | | | 0.80% | | | | $1,000.00 | | | | $1,020.89 | | | | $4.02 | |
| Service Class | | Actual | | | 1.05% | | | | $1,000.00 | | | | $972.81 | | | | $5.15 | |
| | Hypothetical (h) | | | 1.05% | | | | $1,000.00 | | | | $1,019.64 | | | | $5.27 | |
| (h) | 5% class return per year before expenses. |
| (p) | “Expenses Paid During Period” are equal to each class’s annualized expense ratio, as shown above, multiplied by the average account value over the period, multiplied by 182/366 (to reflect the one-half year period). |
Notes to Expense Table
Expense ratios include 0.03% of investment related expenses from short sales (See Note 2 of the Notes to Financial Statements) that are outside of the expense limitation arrangement (See Note 3 of the Notes to Financial Statements).
3
MFS Research Series
PORTFOLIO OF INVESTMENTS – 6/30/20 (unaudited)
The Portfolio of Investments is a complete list of all securities owned by your fund. It is categorized by broad-based asset classes.
| | | | | | | | |
| Issuer | | Shares/Par | | | Value ($) | |
| COMMON STOCKS – 99.4% | | | | | | | | |
| Aerospace – 2.3% | | | | | |
| Honeywell International, Inc. | | | 48,428 | | | $ | 7,002,204 | |
| L3Harris Technologies, Inc. | | | 25,246 | | | | 4,283,489 | |
| Northrop Grumman Corp. | | | 12,245 | | | | 3,764,603 | |
| | | | | | | | |
| | | | | | $ | 15,050,296 | |
| | | | | | | | |
| Alcoholic Beverages – 0.5% | | | | | | | | |
| Constellation Brands, Inc., “A” | | | 18,103 | | | $ | 3,167,120 | |
| | | | | | | | |
| Apparel Manufacturers – 1.3% | | | | | | | | |
| NIKE, Inc., “B” | | | 86,398 | | | $ | 8,471,324 | |
| | | | | | | | |
| Biotechnology – 0.9% | | | | | | | | |
| Illumina, Inc. (a) | | | 15,839 | | | $ | 5,865,974 | |
| | | | | | | | |
| Brokerage & Asset Managers – 1.8% | | | | | | | | |
| Charles Schwab Corp. | | | 217,599 | | | $ | 7,341,790 | |
| NASDAQ, Inc. | | | 39,078 | | | | 4,668,649 | |
| | | | | | | | |
| | | | | | $ | 12,010,439 | |
| | | | | | | | |
| Business Services – 5.0% | | | | | | | | |
| Accenture PLC, “A” | | | 27,263 | | | $ | 5,853,912 | |
| Fidelity National Information Services, Inc. | | | 70,478 | | | | 9,450,395 | |
| Fiserv, Inc. (a) | | | 79,307 | | | | 7,741,949 | |
| Global Payments, Inc. | | | 36,534 | | | | 6,196,897 | |
| Verisk Analytics, Inc., “A” | | | 23,746 | | | | 4,041,569 | |
| | | | | | | | |
| | | | | | $ | 33,284,722 | |
| | | | | | | | |
| Cable TV – 2.2% | | | | | | | | |
| Charter Communications, Inc., “A” (a) | | | 12,920 | | | $ | 6,589,717 | |
| Comcast Corp., “A” | | | 205,886 | | | | 8,025,436 | |
| | | | | | | | |
| | | | | | $ | 14,615,153 | |
| | | | | | | | |
| Chemicals – 0.5% | | | | | | | | |
| FMC Corp. | | | 37,196 | | | $ | 3,705,466 | |
| | | | | | | | |
| Computer Software – 12.1% | | | | | | | | |
| Adobe Systems, Inc. (a) | | | 31,078 | | | $ | 13,528,564 | |
| Atlassian Corp. PLC, “A” (a) | | | 13,593 | | | | 2,450,410 | |
| Cadence Design Systems, Inc. (a) | | | 60,235 | | | | 5,780,151 | |
| Microsoft Corp. (s) | | | 232,813 | | | | 47,379,774 | |
| Salesforce.com, Inc. (a) | | | 59,823 | | | | 11,206,642 | |
| | | | | | | | |
| | | | | | $ | 80,345,541 | |
| | | | | | | | |
| Computer Software – Systems – 3.9% | | | | | |
| Apple, Inc. | | | 48,948 | | | $ | 17,856,230 | |
| Constellation Software, Inc. | | | 4,192 | | | | 4,733,261 | |
| EPAM Systems, Inc. (a) | | | 13,274 | | | | 3,345,181 | |
| | | | | | | | |
| | | | | | $ | 25,934,672 | |
| | | | | | | | |
| Construction – 3.2% | | | | | | | | |
| AZEK Co. LLC (a) | | | 51,472 | | | $ | 1,639,898 | |
| D.R. Horton, Inc. | | | 52,743 | | | | 2,924,599 | |
| Masco Corp. | | | 125,089 | | | | 6,280,719 | |
| Otis Worldwide Corp. | | | 52,393 | | | | 2,979,066 | |
| Sherwin-Williams Co. | | | 7,912 | | | | 4,571,949 | |
| Vulcan Materials Co. | | | 24,751 | | | | 2,867,403 | |
| | | | | | | | |
| | | | | | $ | 21,263,634 | |
| | | | | | | | |
| | | | | | | | |
| Issuer | | Shares/Par | | | Value ($) | |
| COMMON STOCKS – continued | |
| Consumer Products – 1.6% | | | | | | | | |
| Colgate-Palmolive Co. | | | 77,850 | | | $ | 5,703,291 | |
| Kimberly-Clark Corp. | | | 34,672 | | | | 4,900,887 | |
| | | | | | | | |
| | | | | | $ | 10,604,178 | |
| | | | | | | | |
| Electrical Equipment – 1.2% | | | | | | | | |
| HD Supply Holdings, Inc. (a) | | | 87,269 | | | $ | 3,023,871 | |
| Sensata Technologies Holding PLC (a) | | | 71,313 | | | | 2,654,983 | |
| TE Connectivity Ltd. | | | 27,399 | | | | 2,234,388 | |
| | | | | | | | |
| | | | | | $ | 7,913,242 | |
| | | | | | | | |
| Electronics – 2.7% | | | | | | | | |
| Intel Corp. | | | 196,665 | | | $ | 11,766,467 | |
| NXP Semiconductors N.V. | | | 55,440 | | | | 6,322,378 | |
| | | | | | | | |
| | | | | | $ | 18,088,845 | |
| | | | | | | | |
| Energy – Independent – 1.4% | | | | | | | | |
| ConocoPhillips | | | 79,865 | | | $ | 3,355,927 | |
| Diamondback Energy, Inc. | | | 26,358 | | | | 1,102,291 | |
| Pioneer Natural Resources Co. | | | 24,661 | | | | 2,409,380 | |
| Valero Energy Corp. | | | 39,012 | | | | 2,294,686 | |
| | | | | | | | |
| | | | | | $ | 9,162,284 | |
| | | | | | | | |
| Energy – Integrated – 0.7% | | | | | | | | |
| BP PLC, ADR | | | 211,507 | | | $ | 4,932,343 | |
| | | | | | | | |
| Food & Beverages – 2.6% | | | | | | | | |
| Hostess Brands, Inc. (a) | | | 90,572 | | | $ | 1,106,790 | |
| J.M. Smucker Co. | | | 14,697 | | | | 1,555,090 | |
| Mondelez International, Inc. | | | 120,247 | | | | 6,148,229 | |
| PepsiCo, Inc. | | | 65,524 | | | | 8,666,204 | |
| | | | | | | | |
| | | | | | $ | 17,476,313 | |
| | | | | | | | |
| Food & Drug Stores – 1.3% | | | | | | | | |
| Wal-Mart Stores, Inc. | | | 70,827 | | | $ | 8,483,658 | |
| | | | | | | | |
| Gaming & Lodging – 0.4% | | | | | | | | |
| Marriott International, Inc., “A” | | | 9,564 | | | $ | 819,922 | |
| Wyndham Hotels & Resorts, Inc. | | | 45,184 | | | | 1,925,742 | |
| | | | | | | | |
| | | | | | $ | 2,745,664 | |
| | | | | | | | |
| General Merchandise – 1.1% | | | | | | | | |
| Dollar General Corp. | | | 38,327 | | | $ | 7,301,677 | |
| | | | | | | | |
| Health Maintenance Organizations – 1.9% | | | | | |
| Cigna Corp. | | | 36,851 | | | $ | 6,915,090 | |
| Humana, Inc. | | | 14,404 | | | | 5,585,151 | |
| | | | | | | | |
| | | | | | $ | 12,500,241 | |
| | | | | | | | |
| Insurance – 2.8% | | | | | | | | |
| AON PLC | | | 52,904 | | | $ | 10,189,310 | |
| Chubb Ltd. | | | 47,398 | | | | 6,001,535 | |
| Reinsurance Group of America, Inc. | | | 35,524 | | | | 2,786,503 | |
| | | | | | | | |
| | | | | | $ | 18,977,348 | |
| | | | | | | | |
4
MFS Research Series
Portfolio of Investments (unaudited) – continued
| | | | | | | | |
| Issuer | | Shares/Par | | | Value ($) | |
| COMMON STOCKS – continued | |
| Internet – 6.3% | | | | | | | | |
| Alphabet, Inc., “A” (a)(s) | | | 17,252 | | | $ | 24,464,198 | |
| Facebook, Inc., “A” (a) | | | 78,309 | | | | 17,781,625 | |
| | | | | | | | |
| | | | | | $ | 42,245,823 | |
| | | | | | | | |
| Leisure & Toys – 1.2% | | | | | | | | |
| Electronic Arts, Inc. (a) | | | 59,836 | | | $ | 7,901,344 | |
| | | | | | | | |
| Machinery & Tools – 1.5% | | | | | | | | |
| Ingersoll Rand, Inc. (a) | | | 112,013 | | | $ | 3,149,805 | |
| Roper Technologies, Inc. | | | 14,064 | | | | 5,460,489 | |
| Trane Technologies PLC | | | 16,062 | | | | 1,429,197 | |
| | | | | | | | |
| | | | | | $ | 10,039,491 | |
| | | | | | | | |
| Major Banks – 2.7% | | | | | | | | |
| Bank of America Corp. | | | 274,698 | | | $ | 6,524,077 | |
| Goldman Sachs Group, Inc. | | | 46,909 | | | | 9,270,157 | |
| PNC Financial Services Group, Inc. | | | 22,027 | | | | 2,317,461 | |
| | | | | | | | |
| | | | | | $ | 18,111,695 | |
| | | | | | | | |
| Medical & Health Technology & Services – 1.8% | |
| ICON PLC (a) | | | 23,528 | | | $ | 3,963,527 | |
| McKesson Corp. | | | 26,902 | | | | 4,127,305 | |
| PRA Health Sciences, Inc. (a) | | | 17,089 | | | | 1,662,589 | |
| Quest Diagnostics, Inc. | | | 18,835 | | | | 2,146,436 | |
| | | | | | | | |
| | | | | | $ | 11,899,857 | |
| | | | | | | | |
| Medical Equipment – 4.9% | | | | | | | | |
| Becton, Dickinson and Co. | | | 28,333 | | | $ | 6,779,237 | |
| Boston Scientific Corp. (a) | | | 152,366 | | | | 5,349,570 | |
| Danaher Corp. | | | 54,819 | | | | 9,693,644 | |
| Medtronic PLC | | | 82,843 | | | | 7,596,703 | |
| STERIS PLC | | | 22,604 | | | | 3,468,358 | |
| | | | | | | | |
| | | | | | $ | 32,887,512 | |
| | | | | | | | |
| Natural Gas – Distribution – 0.4% | | | | | | | | |
| Sempra Energy | | | 21,512 | | | $ | 2,521,852 | |
| | | | | | | | |
| Natural Gas – Pipeline – 0.4% | | | | | | | | |
| Enterprise Products Partners LP | | | 140,526 | | | $ | 2,553,357 | |
| | | | | | | | |
| Network & Telecom – 0.7% | | | | | | | | |
| Equinix, Inc., REIT | | | 6,229 | | | $ | 4,374,627 | |
| | | | | | | | |
| Oil Services – 0.1% | | | | | | | | |
| Core Laboratories N.V. | | | 23,884 | | | $ | 485,323 | |
| | | | | | | | |
| Other Banks & Diversified Financials – 5.0% | |
| Northern Trust Corp. | | | 56,674 | | | $ | 4,496,515 | |
| Truist Financial Corp. | | | 185,680 | | | | 6,972,284 | |
| U.S. Bancorp | | | 98,812 | | | | 3,638,258 | |
| Visa, Inc., “A” | | | 93,250 | | | | 18,013,102 | |
| | | | | | | | |
| | | | | | $ | 33,120,159 | |
| | | | | | | | |
| Pharmaceuticals – 5.0% | | | | | | | | |
| Eli Lilly & Co. | | | 45,116 | | | $ | 7,407,145 | |
| Johnson & Johnson | | | 86,310 | | | | 12,137,775 | |
| Merck & Co., Inc. | | | 103,827 | | | | 8,028,942 | |
| | | | | | | | |
| Issuer | | Shares/Par | | | Value ($) | |
| COMMON STOCKS – continued | |
| Pharmaceuticals – continued | | | | | | | | |
| Zoetis, Inc. | | | 42,555 | | | $ | 5,831,737 | |
| | | | | | | | |
| | | | | | $ | 33,405,599 | |
| | | | | | | | |
| Railroad & Shipping – 1.5% | | | | | | | | |
| Canadian Pacific Railway Ltd. | | | 21,350 | | | $ | 5,451,509 | |
| Kansas City Southern Co. | | | 30,842 | | | | 4,604,402 | |
| | | | | | | | |
| | | | | | $ | 10,055,911 | |
| | | | | | | | |
| Real Estate – 1.2% | | | | | | | | |
| Public Storage, Inc., REIT | | | 21,300 | | | $ | 4,087,257 | |
| STORE Capital Corp., REIT | | | 161,942 | | | | 3,855,839 | |
| | | | | | | | |
| | | | | | $ | 7,943,096 | |
| | | | | | | | |
| Restaurants – 1.4% | | | | | | | | |
| Starbucks Corp. | | | 105,368 | | | $ | 7,754,031 | |
| Texas Roadhouse, Inc. | | | 35,520 | | | | 1,867,287 | |
| | | | | | | | |
| | | | | | $ | 9,621,318 | |
| | | | | | | | |
| Specialty Chemicals – 1.1% | | | | | | | | |
| Air Products & Chemicals, Inc. | | | 8,645 | | | $ | 2,087,421 | |
| DuPont de Nemours, Inc. | | | 97,929 | | | | 5,202,968 | |
| | | | | | | | |
| | | | | | $ | 7,290,389 | |
| | | | | | | | |
| Specialty Stores – 7.3% | | | | | | | | |
| Amazon.com, Inc. (a)(s) | | | 13,428 | | | $ | 37,045,435 | |
| Ross Stores, Inc. | | | 56,193 | | | | 4,789,891 | |
| Target Corp. | | | 59,114 | | | | 7,089,542 | |
| | | | | | | | |
| | | | | | $ | 48,924,868 | |
| | | | | | | | |
| Telecommunications – Wireless – 2.2% | |
| American Tower Corp., REIT | | | 37,725 | | | $ | 9,753,421 | |
| T-Mobile USA, Inc. (a) | | | 48,570 | | | | 5,058,566 | |
| | | | | | | | |
| | | | | | $ | 14,811,987 | |
| | | | | | | | |
| Tobacco – 0.6% | | | | | | | | |
| Philip Morris International, Inc. | | | 57,976 | | | $ | 4,061,799 | |
| | | | | | | | |
| Utilities – Electric Power – 2.7% | |
| American Electric Power Co., Inc. | | | 40,610 | | | $ | 3,234,180 | |
| CMS Energy Corp. | | | 51,300 | | | | 2,996,946 | |
| Duke Energy Corp. | | | 44,735 | | | | 3,573,879 | |
| FirstEnergy Corp. | | | 92,200 | | | | 3,575,516 | |
| NextEra Energy, Inc. | | | 18,332 | | | | 4,402,797 | |
| | | | | | | | |
| | | | | | $ | 17,783,318 | |
| | | | | | | | |
Total Common Stocks
(Identified Cost, $459,358,974) | | | | | | $ | 661,939,459 | |
| | | | | | | | |
| | | | | | | | | | | | | | | | |
| | | Strike
Price | | | First
Exercise | | | | | | | |
| RIGHTS – 0.0% | | | | | | | | | |
| Telecommunications – Wireless – 0.0% | | | | | |
T-Mobile USA, Inc. (1 share for 20 rights, Expiration 8/10/20) (a)
(Identified Cost, $7,601) | | $ | 103 | | | | 6/24/20 | | | | 20,543 | | | $ | 3,451 | |
| | | | | | | | | | | | | | | | |
5
MFS Research Series
Portfolio of Investments (unaudited) – continued
| | | | | | | | |
| Issuer | | Shares/Par | | | Value ($) | |
| INVESTMENT COMPANIES (h) – 1.0% | | | | | |
| Money Market Funds – 1.0% | | | | | |
| MFS Institutional Money Market Portfolio, 0.17% (v) (Identified Cost, $6,850,731) | | | 6,850,235 | | | $ | 6,850,920 | |
| | | | | | | | |
| |
| SECURITIES SOLD SHORT – (0.5)% | | | | | |
| Medical & Health Technology & Services – (0.2)% | |
| Healthcare Services Group, Inc. | | | (44,372 | ) | | $ | (1,085,339 | ) |
| | | | | | | | |
| Telecommunications – Wireless – (0.3)% | | | | | |
| Crown Castle International Corp., REIT | | | (12,776 | ) | | $ | (2,138,063 | ) |
| | | | | | | | |
Total Securities Sold Short
(Proceeds Received, $2,490,023) | | | | | | $ | (3,223,402 | ) |
| | | | | | | | |
OTHER ASSETS, LESS
LIABILITIES – 0.1% | | | | | | | 486,359 | |
| | | | | | | | |
| NET ASSETS – 100.0% | | | | | | $ | 666,056,787 | |
| | | | | | | | |
| (a) | | Non-income producing security. |
| (h) | | An affiliated issuer, which may be considered one in which the fund owns 5% or more of the outstanding voting securities, or a company which is under common control. At period end, the aggregate values of the fund’s investments in affiliated issuers and in unaffiliated issuers were $6,850,920 and $661,942,910, respectively. |
| (s) | | Security or a portion of the security was pledged to cover collateral requirements for securities sold short. |
| (v) | | Affiliated issuer that is available only to investment companies managed by MFS. The rate quoted for the MFS Institutional Money Market Portfolio is the annualized seven-day yield of the fund at period end. |
The following abbreviations are used in this report and are defined:
| ADR | | American Depositary Receipt |
| REIT | | Real Estate Investment Trust |
At June 30, 2020, the fund had cash collateral of $83,671 and other liquid securities with an aggregate value of $7,696,033 to cover any collateral or margin obligations for securities sold short. Restricted cash and/or deposits with brokers in the Statement of Assets and Liabilities are comprised of cash collateral.
See Notes to Financial Statements
6
MFS Research Series
FINANCIAL STATEMENTS | STATEMENT OF ASSETS AND LIABILITIES (unaudited)
This statement represents your fund’s balance sheet, which details the assets and liabilities comprising the total value of the fund.
| | | | |
At 6/30/20 | | | | |
| |
Assets | | | | |
Investments in unaffiliated issuers, at value (identified cost, $459,366,575) | | | $661,942,910 | |
Investments in affiliated issuers, at value (identified cost, $6,850,731) | | | 6,850,920 | |
Deposits with brokers for | | | | |
Securities sold short | | | 83,671 | |
Receivables for | | | | |
Fund shares sold | | | 491,794 | |
Interest and dividends | | | 683,141 | |
Other assets | | | 1,657 | |
Total assets | | | $670,054,093 | |
| |
Liabilities | | | | |
Payables for | | | | |
Securities sold short, at value (proceeds received, $2,490,023) | | | $3,223,402 | |
Fund shares reacquired | | | 644,013 | |
Payable to affiliates | | | | |
Investment adviser | | | 11,556 | |
Administrative services fee | | | 553 | |
Shareholder servicing costs | | | 913 | |
Distribution and/or service fees | | | 4,433 | |
Accrued expenses and other liabilities | | | 112,436 | |
Total liabilities | | | $3,997,306 | |
Net assets | | | $666,056,787 | |
| |
Net assets consist of | | | | |
Paid-in capital | | | $409,978,407 | |
Total distributable earnings (loss) | | | 256,078,380 | |
Net assets | | | $666,056,787 | |
Shares of beneficial interest outstanding | | | 23,378,824 | |
| | | | | | | | | | | | |
| | | |
| | | Net assets | | | Shares
outstanding | | | Net asset value
per share | |
Initial Class | | | $333,985,209 | | | | 11,628,686 | | | | $28.72 | |
Service Class | | | 332,071,578 | | | | 11,750,138 | | | | 28.26 | |
See Notes to Financial Statements
7
MFS Research Series
FINANCIAL STATEMENTS | STATEMENT OF OPERATIONS (unaudited)
This statement describes how much your fund earned in investment income and accrued in expenses. It also describes any gains and/or losses generated by fund operations.
| | | | |
Six months ended 6/30/20 | | | | |
| |
Net investment income (loss) | | | | |
Income | | | | |
Dividends | | | $5,010,687 | |
Dividends from affiliated issuers | | | 37,848 | |
Other | | | 32,176 | |
Income on securities loaned | | | 30,684 | |
Foreign taxes withheld | | | (12,681 | ) |
Total investment income | | | $5,098,714 | |
Expenses | | | | |
Management fee | | | $2,410,645 | |
Distribution and/or service fees | | | 388,795 | |
Shareholder servicing costs | | | 13,835 | |
Administrative services fee | | | 49,135 | |
Independent Trustees’ compensation | | | 7,584 | |
Custodian fee | | | 16,684 | |
Shareholder communications | | | 24,922 | |
Audit and tax fees | | | 30,044 | |
Legal fees | | | 2,879 | |
Dividend and interest expense on securities sold short | | | 80,933 | |
Interest expense and fees | | | 1,659 | |
Miscellaneous | | | 15,997 | |
Total expenses | | | $3,043,112 | |
Reduction of expenses by investment adviser | | | (97,833 | ) |
Net expenses | | | $2,945,279 | |
Net investment income (loss) | | | $2,153,435 | |
| |
Realized and unrealized gain (loss) | | | | |
Realized gain (loss) (identified cost basis) | | | | |
Unaffiliated issuers | | | $20,538,506 | |
Affiliated issuers | | | (208 | ) |
Foreign currency | | | (813 | ) |
Net realized gain (loss) | | | $20,537,485 | |
Change in unrealized appreciation or depreciation | | | | |
Unaffiliated issuers | | | $(37,083,885 | ) |
Affiliated issuers | | | 132 | |
Securities sold short | | | (97,702 | ) |
Translation of assets and liabilities in foreign currencies | | | (69 | ) |
Net unrealized gain (loss) | | | $(37,181,524 | ) |
Net realized and unrealized gain (loss) | | | $(16,644,039 | ) |
Change in net assets from operations | | | $(14,490,604 | ) |
See Notes to Financial Statements
8
MFS Research Series
FINANCIAL STATEMENTS | STATEMENTS OF CHANGES IN NET ASSETS
These statements describe the increases and/or decreases in net assets resulting from operations, any distributions, and any shareholder transactions.
| | | | | | | | |
| | | Six months ended
6/30/20
| | | Year ended
12/31/19 | |
| | | (unaudited) | | | | |
Change in net assets | | | | | | | | |
| | |
From operations | | | | | | | | |
Net investment income (loss) | | | $2,153,435 | | | | $4,427,864 | |
Net realized gain (loss) | | | 20,537,485 | | | | 27,940,886 | |
Net unrealized gain (loss) | | | (37,181,524 | ) | | | 141,393,667 | |
Change in net assets from operations | | | $(14,490,604 | ) | | | $173,762,417 | |
Total distributions to shareholders | | | $— | | | | $(69,043,322 | ) |
Change in net assets from fund share transactions | | | $(1,137,086 | ) | | | $41,645,153 | |
Total change in net assets | | | $(15,627,690 | ) | | | $146,364,248 | |
| | |
Net assets | | | | | | | | |
At beginning of period | | | 681,684,477 | | | | 535,320,229 | |
At end of period | | | $666,056,787 | | | | $681,684,477 | |
See Notes to Financial Statements
9
MFS Research Series
FINANCIAL STATEMENTS | FINANCIAL HIGHLIGHTS
The financial highlights table is intended to help you understand the fund’s financial performance for the semiannual period and the past 5 fiscal years. Certain information reflects financial results for a single fund share. The total returns in the table represent the rate that an investor would have earned (or lost) on an investment in the fund share class (assuming reinvestment of all distributions) held for the entire period.
| | | | | | | | | | | | | | | | | | | | | | | | |
| Initial Class | | Six months ended 6/30/20 | | | Year ended | |
| | | 12/31/19 | | | 12/31/18 | | | 12/31/17 | | | 12/31/16 | | | 12/31/15 | |
| | | | | | |
| | | (unaudited) | | | | | | | | | | | | | | | | |
| | | | | | |
Net asset value, beginning of period | | | $29.49 | | | | $24.93 | | | | $29.50 | | | | $26.00 | | | | $26.68 | | | | $29.11 | |
| | | | | | |
| Income (loss) from investment operations | | | | | | | | | | | | | | | | | | | | | | | | |
Net investment income (loss) (d) | | | $0.11 | | | | $0.23 | | | | $0.26 | | | | $0.20 | | | | $0.36 | (c) | | | $0.21 | |
Net realized and unrealized gain (loss) | | | (0.88 | ) | | | 7.66 | | | | (1.04 | ) | | | 5.67 | | | | 1.98 | | | | (0.17 | )(g) |
Total from investment operations | | | $(0.77 | ) | | | $7.89 | | | | $(0.78 | ) | | | $5.87 | | | | $2.34 | | | | $0.04 | |
| | | | | | |
| Less distributions declared to shareholders | | | | | | | | | | | | | | | | | | | | | | | | |
From net investment income | | | $— | | | | $(0.24 | ) | | | $(0.22 | ) | | | $(0.40 | ) | | | $(0.22 | ) | | | $(0.22 | ) |
From net realized gain | | | — | | | | (3.09 | ) | | | (3.57 | ) | | | (1.97 | ) | | | (2.80 | ) | | | (2.25 | ) |
Total distributions declared to shareholders | | | $— | | | | $(3.33 | ) | | | $(3.79 | ) | | | $(2.37 | ) | | | $(3.02 | ) | | | $(2.47 | ) |
Net asset value, end of period (x) | | | $28.72 | | | | $29.49 | | | | $24.93 | | | | $29.50 | | | | $26.00 | | | | $26.68 | |
Total return (%) (k)(r)(s)(x) | | | (2.61 | )(n) | | | 32.95 | | | | (4.37 | ) | | | 23.37 | | | | 8.74 | (c) | | | 0.80 | |
| | | | | | |
Ratios (%) (to average net assets)
and Supplemental data: | | | | | | | | | | | | | | | | | | | | | | | | |
Expenses before expense reductions (f) | | | 0.83 | (a) | | | 0.83 | | | | 0.82 | | | | 0.83 | | | | 0.80 | (c) | | | 0.82 | |
Expenses after expense reductions (f) | | | 0.80 | (a) | | | 0.81 | | | | 0.81 | | | | 0.81 | | | | 0.79 | (c) | | | 0.81 | |
Net investment income (loss) | | | 0.79 | (a) | | | 0.82 | | | | 0.88 | | | | 0.70 | | | | 1.36 | (c) | | | 0.72 | |
Portfolio turnover | | | 25 | (n) | | | 35 | | | | 31 | | | | 37 | | | | 45 | | | | 43 | |
Net assets at end of period (000 omitted) | | | $333,985 | | | | $361,842 | | | | $319,422 | | | | $394,867 | | | | $386,256 | | | | $410,178 | |
| | | | | | |
| Supplemental Ratios (%): | | | | | | | | | | | | | | | | | | | | | | | | |
Ratios of expenses to average net assets after expense reductions excluding short sale expenses and interest expense and fees (f) | | | 0.77 | (a) | | | 0.78 | | | | 0.79 | | | | 0.79 | | | | 0.78 | (c) | | | 0.80 | |
See Notes to Financial Statements
10
MFS Research Series
Financial Highlights – continued
| | | | | | | | | | | | | | | | | | | | | | | | |
| Service Class | | Six months
ended 6/30/20 | | | Year ended | |
| | | 12/31/19 | | | 12/31/18 | | | 12/31/17 | | | 12/31/16 | | | 12/31/15 | |
| | | | | | |
| | | (unaudited) | | | | | | | | | | | | | | | | |
| | | | | | |
Net asset value, beginning of period | | | $29.05 | | | | $24.61 | | | | $29.17 | | | | $25.73 | | | | $26.42 | | | | $28.84 | |
| | | | | | |
| Income (loss) from investment operations | | | | | | | | | | | | | | | | | | | | | | | | |
Net investment income (loss) (d) | | | $0.07 | | | | $0.16 | | | | $0.18 | | | | $0.13 | | | | $0.29 | (c) | | | $0.13 | |
Net realized and unrealized gain (loss) | | | (0.86 | ) | | | 7.55 | | | | (1.03 | ) | | | 5.61 | | | | 1.96 | | | | (0.16 | )(g) |
Total from investment operations | | | $(0.79 | ) | | | $7.71 | | | | $(0.85 | ) | | | $5.74 | | | | $2.25 | | | | $(0.03 | ) |
| | | | | | |
| Less distributions declared to shareholders | | | | | | | | | | | | | | | | | | | | | | | | |
From net investment income | | | $— | | | | $(0.18 | ) | | | $(0.14 | ) | | | $(0.33 | ) | | | $(0.14 | ) | | | $(0.14 | ) |
From net realized gain | | | — | | | | (3.09 | ) | | | (3.57 | ) | | | (1.97 | ) | | | (2.80 | ) | | | (2.25 | ) |
Total distributions declared to shareholders | | | $— | | | | $(3.27 | ) | | | $(3.71 | ) | | | $(2.30 | ) | | | $(2.94 | ) | | | $(2.39 | ) |
Net asset value, end of period (x) | | | $28.26 | | | | $29.05 | | | | $24.61 | | | | $29.17 | | | | $25.73 | | | | $26.42 | |
Total return (%) (k)(r)(s)(x) | | | (2.72 | )(n) | | | 32.60 | | | | (4.62 | ) | | | 23.07 | | | | 8.49 | (c) | | | 0.53 | |
| | | | | | |
Ratios (%) (to average net assets)
and Supplemental data: | | | | | | | | | | | | | | | | | | | | | | | | |
Expenses before expense reductions (f) | | | 1.08 | (a) | | | 1.08 | | | | 1.07 | | | | 1.08 | | | | 1.05 | (c) | | | 1.07 | |
Expenses after expense reductions (f) | | | 1.05 | (a) | | | 1.06 | | | | 1.06 | | | | 1.06 | | | | 1.04 | (c) | | | 1.06 | |
Net investment income (loss) | | | 0.55 | (a) | | | 0.57 | | | | 0.63 | | | | 0.47 | | | | 1.11 | (c) | | | 0.47 | |
Portfolio turnover | | | 25 | (n) | | | 35 | | | | 31 | | | | 37 | | | | 45 | | | | 43 | |
Net assets at end of period (000 omitted) | | | $332,072 | | | | $319,842 | | | | $215,898 | | | | $228,102 | | | | $220,341 | | | | $226,704 | |
| | | | | | |
| Supplemental Ratios (%): | | | | | | | | | | | | | | | | | | | | | | | | |
Ratios of expenses to average net assets after expense reductions excluding short sale expenses and interest expense and fees (f) | | | 1.02 | (a) | | | 1.03 | | | | 1.04 | | | | 1.04 | | | | 1.03 | (c) | | | 1.05 | |
| (c) | Amount reflects a one-time reimbursement of expenses by the custodian (or former custodian) without which net investment income and performance would be lower and expenses would be higher. |
| (d) | Per share data is based on average shares outstanding. |
| (f) | Ratios do not reflect reductions from fees paid indirectly, if applicable. |
| (g) | The per share amount varies from the net realized and unrealized gain/loss for the period because of the timing of sales of fund shares and the per share amount of realized and unrealized gains and losses at such time. |
| (k) | The total return does not reflect expenses that apply to separate accounts. Inclusion of these charges would reduce the total return figures for all periods shown. |
| (r) | Certain expenses have been reduced without which performance would have been lower. |
| (s) | From time to time the fund may receive proceeds from litigation settlements, without which performance would be lower. |
| (x) | The net asset values and total returns have been calculated on net assets which include adjustments made in accordance with U.S. generally accepted accounting principles required at period end for financial reporting purposes. |
See Notes to Financial Statements
11
MFS Research Series
NOTES TO FINANCIAL STATEMENTS (unaudited)
| (1) | | Business and Organization |
MFS Research Series (the fund) is a diversified series of MFS Variable Insurance Trust (the trust). The trust is organized as a Massachusetts business trust and is registered under the Investment Company Act of 1940, as amended, as an open-end management investment company. The shareholders of each series of the trust are separate accounts of insurance companies, which offer variable annuity and/or life insurance products, and qualified retirement and pension plans.
The fund is an investment company and accordingly follows the investment company accounting and reporting guidance of the Financial Accounting Standards Board (FASB) Accounting Standards Codification Topic 946 Financial Services – Investment Companies.
| (2) | | Significant Accounting Policies |
General – The preparation of financial statements in conformity with U.S. generally accepted accounting principles requires management to make estimates and assumptions that affect the reported amounts of assets and liabilities, and disclosure of contingent assets and liabilities at the date of the financial statements and the reported amounts of increases and decreases in net assets from operations during the reporting period. Actual results could differ from those estimates. In the preparation of these financial statements, management has evaluated subsequent events occurring after the date of the fund’s Statement of Assets and Liabilities through the date that the financial statements were issued.
In March 2020, the FASB issued Accounting Standards Update 2020-04, Reference Rate Reform (Topic 848) – Facilitation of the Effects of Reference Rate Reform on Financial Reporting (“ASU 2020-04”), which provides optional, temporary relief with respect to the financial reporting of contracts subject to certain types of modifications due to the planned discontinuation of the London Interbank Offered Rate (LIBOR) and other IBOR-based reference rates as of the end of 2021. The temporary relief provided by ASU 2020-04 is effective for certain reference rate-related contract modifications that occur during the period from March 12, 2020 through December 31, 2022. Management is evaluating the impact of ASU 2020-04 on the fund’s investments, derivatives, debt and other contracts that will undergo reference rate-related modifications as a result of the reference rate reform.
Balance Sheet Offsetting – The fund’s accounting policy with respect to balance sheet offsetting is that, absent an event of default by the counterparty or a termination of the agreement, the International Swaps and Derivatives Association (ISDA) Master Agreement, or similar agreement, does not result in an offset of reported amounts of financial assets and financial liabilities in the Statement of Assets and Liabilities across transactions between the fund and the applicable counterparty. The fund’s right to setoff may be restricted or prohibited by the bankruptcy or insolvency laws of the particular jurisdiction to which a specific master netting agreement counterparty is subject. Balance sheet offsetting disclosures, to the extent applicable to the fund, have been included in the fund’s Significant Accounting Policies note under the captions for each of the fund’s in-scope financial instruments and transactions.
Investment Valuations – Equity securities, including restricted equity securities and equity securities sold short, are generally valued at the last sale or official closing price on their primary market or exchange as provided by a third-party pricing service. Equity securities, for which there were no sales reported that day, are generally valued at the last quoted daily bid quotation on their primary market or exchange as provided by a third-party pricing service. Equity securities sold short, for which there were no sales reported for that day, are generally valued at the last quoted daily ask quotation on their primary market or exchange as provided by a third-party pricing service. Short-term instruments with a maturity at issuance of 60 days or less may be valued at amortized cost, which approximates market value. Open-end investment companies are generally valued at net asset value per share. Securities and other assets generally valued on the basis of information from a third-party pricing service may also be valued at a broker/dealer bid quotation. In determining values, third-party pricing services can utilize both transaction data and market information such as yield, quality, coupon rate, maturity, type of issue, trading characteristics, and other market data. The values of foreign securities and other assets and liabilities expressed in foreign currencies are converted to U.S. dollars using the mean of bid and asked prices for rates provided by a third-party pricing service.
The Board of Trustees has delegated primary responsibility for determining or causing to be determined the value of the fund’s investments (including any fair valuation) to the adviser pursuant to valuation policies and procedures approved by the Board. If the adviser determines that reliable market quotations are not readily available, investments are valued at fair value as determined in good faith by the adviser in accordance with such procedures under the oversight of the Board of Trustees. Under the fund’s valuation policies and procedures, market quotations are not considered to be readily available for most types of debt instruments and floating rate loans and many types of derivatives. These investments are generally valued at fair value based on information from third-party pricing services. In addition, investments may be valued at fair value if the adviser determines that an investment’s value has been materially affected by events occurring after the close of the exchange or market on which the investment is principally traded (such as foreign exchange or market) and prior to the determination of the fund’s net asset value, or after the halt of trading of a specific security where trading does not resume prior to the close of the exchange or market on which the security is principally traded. Events that occur after foreign markets close (such as developments in foreign markets and significant movements in the U.S.
12
MFS Research Series
Notes to Financial Statements (unaudited) – continued
markets) and prior to the determination of the fund’s net asset value may be deemed to have a material effect on the value of securities traded in foreign markets. Accordingly, the fund’s foreign equity securities may often be valued at fair value. The adviser generally relies on third-party pricing services or other information (such as the correlation with price movements of similar securities in the same or other markets; the type, cost and investment characteristics of the security; the business and financial condition of the issuer; and trading and other market data) to assist in determining whether to fair value and at what value to fair value an investment. The value of an investment for purposes of calculating the fund’s net asset value can differ depending on the source and method used to determine value. When fair valuation is used, the value of an investment used to determine the fund’s net asset value may differ from quoted or published prices for the same investment. There can be no assurance that the fund could obtain the fair value assigned to an investment if it were to sell the investment at the same time at which the fund determines its net asset value per share.
Various inputs are used in determining the value of the fund’s assets or liabilities. These inputs are categorized into three broad levels. In certain cases, the inputs used to measure fair value may fall into different levels of the fair value hierarchy. In such cases, an investment’s level within the fair value hierarchy is based on the lowest level of input that is significant to the fair value measurement. The fund’s assessment of the significance of a particular input to the fair value measurement in its entirety requires judgment, and considers factors specific to the investment. Level 1 includes unadjusted quoted prices in active markets for identical assets or liabilities. Level 2 includes other significant observable market-based inputs (including quoted prices for similar securities, interest rates, prepayment speed, and credit risk). Level 3 includes unobservable inputs, which may include the adviser’s own assumptions in determining the fair value of investments. The following is a summary of the levels used as of June 30, 2020 in valuing the fund’s assets or liabilities:
| | | | | | | | | | | | | | | | |
| Financial Instruments | | Level 1 | | | Level 2 | | | Level 3 | | | Total | |
| Equity Securities | | | $661,942,910 | | | | $— | | | | $— | | | | $661,942,910 | |
| Mutual Funds | | | 6,850,920 | | | | — | | | | — | | | | 6,850,920 | |
| Total | | | $668,793,830 | | | | $— | | | | $— | | | | $668,793,830 | |
| | | | |
| Securities Sold Short | | | $(3,223,402 | ) | | | $— | | | | $— | | | | $(3,223,402 | ) |
For further information regarding security characteristics, see the Portfolio of Investments.
Foreign Currency Translation – Purchases and sales of foreign investments, income, and expenses are converted into U.S. dollars based upon currency exchange rates prevailing on the respective dates of such transactions or on the reporting date for foreign denominated receivables and payables. Gains and losses attributable to foreign currency exchange rates on sales of securities are recorded for financial statement purposes as net realized gains and losses on investments. Gains and losses attributable to foreign exchange rate movements on receivables, payables, income and expenses are recorded for financial statement purposes as foreign currency transaction gains and losses. That portion of both realized and unrealized gains and losses on investments that results from fluctuations in foreign currency exchange rates is not separately disclosed.
Short Sales – The fund entered into short sales whereby it sells a security it does not own in anticipation of a decline in the value of that security. The fund will realize a gain if the security price decreases and a loss if the security price increases between the date of the short sale and the date on which the fund replaces the borrowed security. Losses from short sales can exceed the proceeds of the security sold; and they can also exceed the potential loss from an ordinary buy and sell transaction. The amount of any premium, dividends, or interest the fund may be required to pay in connection with a short sale will be recognized as a fund expense. During the six months ended June 30, 2020, this expense amounted to $80,933. The fund segregates cash or marketable securities in an amount that, when combined with the amount of proceeds from the short sale deposited with the broker, at least equals the current market value of the security sold short.
Security Loans – Under its Securities Lending Agency Agreement with the fund, State Street Bank and Trust Company, as lending agent, loans the securities of the fund to certain qualified institutions (the “Borrowers”) approved by the fund. Security loans can be terminated at the discretion of either the lending agent or the fund and the related securities must be returned within the earlier of the standard trade settlement period for such securities or within three business days. The loans are collateralized by cash and/or U.S. Treasury and federal agency obligations in an amount typically at least equal to the market value of the securities loaned. On loans collateralized by cash, the cash collateral is invested in a money market fund. The market value of the loaned securities is determined at the close of business of the fund and any additional required collateral is delivered to the fund on the next business day. The lending agent provides the fund with indemnification against Borrower default. In the event of Borrower default, the lending agent will, for the benefit of the fund, either purchase securities identical to those loaned or, when such purchase is commercially impracticable, pay the fund the market value of the loaned securities. In return, the lending agent assumes the fund’s rights to the related collateral. If the collateral value is less than the cost to purchase identical securities, the lending agent is responsible for the shortfall, but only to the extent that such shortfall is not due to a decline in collateral value resulting from collateral reinvestment for which the fund bears the risk of loss. A portion of the income generated upon investment of the collateral is remitted to the Borrowers, and the remainder is allocated between the fund and the lending agent. On loans collateralized by U.S. Treasury and/or
13
MFS Research Series
Notes to Financial Statements (unaudited) – continued
federal agency obligations, a fee is received from the Borrower, and is allocated between the fund and the lending agent. Income from securities lending is separately reported in the Statement of Operations. The dividend and interest income earned on the securities loaned is accounted for in the same manner as other dividend and interest income. At June 30, 2020, there were no securities on loan or collateral outstanding.
Indemnifications – Under the fund’s organizational documents, its officers and Trustees may be indemnified against certain liabilities and expenses arising out of the performance of their duties to the fund. Additionally, in the normal course of business, the fund enters into agreements with service providers that may contain indemnification clauses. The fund’s maximum exposure under these agreements is unknown as this would involve future claims that may be made against the fund that have not yet occurred.
Investment Transactions and Income – Investment transactions are recorded on the trade date. Interest income is recorded on the accrual basis. Dividends received in cash are recorded on the ex-dividend date. Certain dividends from foreign securities will be recorded when the fund is informed of the dividend if such information is obtained subsequent to the ex-dividend date. Dividend payments received in additional securities are recorded on the ex-dividend date in an amount equal to the value of the security on such date.
The fund may receive proceeds from litigation settlements. Any proceeds received from litigation involving portfolio holdings are reflected in the Statement of Operations in realized gain/loss if the security has been disposed of by the fund or in unrealized gain/loss if the security is still held by the fund. Any other proceeds from litigation not related to portfolio holdings are reflected as other income in the Statement of Operations.
Tax Matters and Distributions – The fund intends to qualify as a regulated investment company, as defined under Subchapter M of the Internal Revenue Code, and to distribute all of its taxable income, including realized capital gains. As a result, no provision for federal income tax is required. The fund’s federal tax returns, when filed, will remain subject to examination by the Internal Revenue Service for a three year period. Management has analyzed the fund’s tax positions taken on federal and state tax returns for all open tax years and does not believe that there are any uncertain tax positions that require recognition of a tax liability. Foreign taxes, if any, have been accrued by the fund in the accompanying financial statements in accordance with the applicable foreign tax law. Foreign income taxes may be withheld by certain countries in which the fund invests. Additionally, capital gains realized by the fund on securities issued in or by certain foreign countries may be subject to capital gains tax imposed by those countries.
Distributions to shareholders are recorded on the ex-dividend date. Income and capital gain distributions are determined in accordance with income tax regulations, which may differ from U.S. generally accepted accounting principles. Certain capital accounts in the financial statements are periodically adjusted for permanent differences in order to reflect their tax character. These adjustments have no impact on net assets or net asset value per share. Temporary differences which arise from recognizing certain items of income, expense, gain or loss in different periods for financial statement and tax purposes will reverse at some time in the future.
Book/tax differences primarily relate to wash sale loss deferrals and partnership adjustments.
The tax character of distributions declared to shareholders for the last fiscal year is as follows:
| | | | |
| | | Year ended | |
| | | 12/31/19 | |
| Ordinary income (including any short-term capital gains) | | | $8,055,147 | |
| Long-term capital gains | | | 60,988,175 | |
| Total distributions | | | $69,043,322 | |
The federal tax cost and the tax basis components of distributable earnings were as follows:
| | | | |
| As of 6/30/20 | | | | |
| |
| Cost of investments | | | $467,645,924 | |
| Gross appreciation | | | 223,353,484 | |
| Gross depreciation | | | (22,205,578 | ) |
| Net unrealized appreciation (depreciation) | | | $201,147,906 | |
| |
| As of 12/31/19 | | | | |
| |
| Undistributed ordinary income | | | 6,993,168 | |
| Undistributed long-term capital gain | | | 24,897,394 | |
| Other temporary differences | | | 1,082,441 | |
| Net unrealized appreciation (depreciation) | | | 237,595,981 | |
The aggregate cost above includes prior fiscal year end tax adjustments, if applicable.
14
MFS Research Series
Notes to Financial Statements (unaudited) – continued
Multiple Classes of Shares of Beneficial Interest – The fund offers multiple classes of shares, which differ in their respective distribution and/or service fees. The fund’s income, realized and unrealized gain (loss), and common expenses are allocated to shareholders based on the daily net assets of each class. Dividends are declared separately for each class. Differences in per share dividend rates are generally due to differences in separate class expenses. The fund’s distributions declared to shareholders as reported in the Statements of Changes in Net Assets are presented by class as follows:
| | | | | | | | |
| | |
| | | Six months ended
6/30/20 | | | Year ended
12/31/19 | |
| Initial Class | | | $— | | | | $38,326,191 | |
| Service Class | | | — | | | | 30,717,131 | |
| Total | | | $— | | | | $69,043,322 | |
| (3) | | Transactions with Affiliates |
Investment Adviser – The fund has an investment advisory agreement with MFS to provide overall investment management and related administrative services and facilities to the fund. The management fee is computed daily and paid monthly at the following annual rates based on the fund’s average daily net assets:
| | | | |
| Up to $1 billion | | | 0.75% | |
| In excess of $1 billion | | | 0.65% | |
MFS has agreed in writing to reduce its management fee by a specified amount if certain MFS mutual fund assets exceed thresholds agreed to by MFS and the fund’s Board of Trustees. For the six months ended June 30, 2020, this management fee reduction amounted to $34,690, which is included in the reduction of total expenses in the Statement of Operations. The management fee incurred for the six months ended June 30, 2020 was equivalent to an annual effective rate of 0.74% of the fund’s average daily net assets.
The investment adviser has agreed in writing to pay a portion of the fund’s total annual operating expenses, excluding interest, taxes, extraordinary expenses, brokerage and transaction costs, and investment-related expenses (such as short sale dividend and interest expenses incurred in connection with the fund’s investment activity), such that total annual operating expenses do not exceed 0.77% of average daily net assets for the Initial Class shares and 1.02% of average daily net assets for the Service Class shares. This written agreement will continue until modified by the fund’s Board of Trustees, but such agreement will continue at least until April 30, 2022. For the six months ended June 30, 2020, this reduction amounted to $63,143, which is included in the reduction of total expenses in the Statement of Operations.
Distributor – MFS Fund Distributors, Inc. (MFD), a wholly-owned subsidiary of MFS, is the distributor of shares of the fund. The Trustees have adopted a distribution plan for the Service Class shares pursuant to Rule 12b-1 under the Investment Company Act of 1940.
The fund’s distribution plan provides that the fund will pay MFD distribution and/or service fees equal to 0.25% per annum of its average daily net assets attributable to Service Class shares as partial consideration for services performed and expenses incurred by MFD and financial intermediaries (including participating insurance companies that invest in the fund to fund variable annuity and variable life insurance contracts, sponsors of qualified retirement and pension plans that invest in the fund, and affiliates of these participating insurance companies and plan sponsors) in connection with the sale and distribution of the Service Class shares. MFD may subsequently pay all, or a portion, of the distribution and/or service fees to financial intermediaries.
Shareholder Servicing Agent – MFS Service Center, Inc. (MFSC), a wholly-owned subsidiary of MFS, receives a fee from the fund for its services as shareholder servicing agent. For the six months ended June 30, 2020, the fee was $12,990, which equated to 0.0040% annually of the fund’s average daily net assets. MFSC also receives payment from the fund for out-of-pocket expenses paid by MFSC on behalf of the fund. For the six months ended June 30, 2020, these costs amounted to $845.
Administrator – MFS provides certain financial, legal, shareholder communications, compliance, and other administrative services to the fund. Under an administrative services agreement, the fund reimburses MFS the costs incurred to provide these services. The fund is charged an annual fixed amount of $17,500 plus a fee based on average daily net assets. The administrative services fee incurred for the six months ended June 30, 2020 was equivalent to an annual effective rate of 0.0153% of the fund’s average daily net assets.
Trustees’ and Officers’ Compensation – The fund pays compensation to independent Trustees in the form of a retainer, attendance fees, and additional compensation to Board and Committee chairpersons. The fund does not pay compensation directly to Trustees or officers of the fund who are also officers of the investment adviser, all of whom receive remuneration from MFS for their services to the fund. Certain officers and Trustees of the fund are officers or directors of MFS, MFD, and MFSC.
Other – The fund invests in the MFS Institutional Money Market Portfolio which is managed by MFS and seeks current income consistent with preservation of capital and liquidity. This money market fund does not pay a management fee to MFS but does incur investment and operating costs.
15
MFS Research Series
Notes to Financial Statements (unaudited) – continued
The fund is permitted to engage in purchase and sale transactions with funds and accounts for which MFS serves as investment adviser or sub-adviser (“cross-trades”) pursuant to a policy adopted by the Board of Trustees. This policy has been designed to ensure that cross-trades conducted by the fund comply with Rule 17a-7 under the Investment Company Act of 1940. During the six months ended June 30, 2020, the fund engaged in purchase and sale transactions pursuant to this policy, which amounted to $449,800 and $361,301, respectively. The sales transactions resulted in net realized gains (losses) of $(116,502).
The adviser has voluntarily undertaken to reimburse the fund from its own resources on a quarterly basis for the cost of investment research embedded in the cost of the fund’s securities trades. This agreement may be rescinded at any time. For the six months ended June 30, 2020, this reimbursement amounted to $23,047, which is included in “Other” income in the Statement of Operations.
For the six months ended June 30, 2020, purchases and sales of investments, other than short sales and short-term obligations, aggregated $159,682,438 and $159,111,644, respectively.
| (5) | | Shares of Beneficial Interest |
The fund’s Declaration of Trust permits the Trustees to issue an unlimited number of full and fractional shares of beneficial interest. Transactions in fund shares were as follows:
| | | | | | | | | | | | | | | | |
| | | Six months ended 6/30/20 | | | Year ended 12/31/19 | |
| | | | |
| | | Shares | | | Amount | | | Shares | | | Amount | |
| Shares sold | | | | | | | | | | | | | | | | |
Initial Class | | | 592,679 | | | | $14,572,445 | | | | 633,043 | | | | $17,785,306 | |
Service Class | | | 1,713,747 | | | | 45,335,984 | | | | 2,518,541 | | | | 70,524,436 | |
| | | 2,306,426 | | | | $59,908,429 | | | | 3,151,584 | | | | $88,309,742 | |
| | | | |
| Shares issued to shareholders in reinvestment of distributions | | | | | | | | | | | | | | | | |
Initial Class | | | — | | | | $— | | | | 1,429,548 | | | | $38,326,191 | |
Service Class | | | — | | | | — | | | | 1,161,767 | | | | 30,717,131 | |
| | | — | | | | $— | | | | 2,591,315 | | | | $69,043,322 | |
| | | | |
| Shares reacquired | | | | | | | | | | | | | | | | |
Initial Class | | | (1,234,459 | ) | | | $(34,850,007 | ) | | | (2,606,676 | ) | | | $(74,894,897 | ) |
Service Class | | | (972,612 | ) | | | (26,195,508 | ) | | | (1,444,916 | ) | | | (40,813,014 | ) |
| | | (2,207,071 | ) | | | $(61,045,515 | ) | | | (4,051,592 | ) | | | $(115,707,911 | ) |
| | | | |
| Net change | | | | | | | | | | | | | | | | |
Initial Class | | | (641,780 | ) | | | $(20,277,562 | ) | | | (544,085 | ) | | | $(18,783,400 | ) |
Service Class | | | 741,135 | | | | 19,140,476 | | | | 2,235,392 | | | | 60,428,553 | |
| | | 99,355 | | | | $(1,137,086 | ) | | | 1,691,307 | | | | $41,645,153 | |
The fund is one of several mutual funds in which certain MFS funds may invest. The MFS funds do not invest in the underlying funds for the purpose of exercising management or control. At the end of the period, the MFS Moderate Allocation Portfolio, the MFS Growth Allocation Portfolio, and the MFS Conservative Allocation Portfolio were the owners of record of approximately 16%, 5%, and 4%, respectively, of the value of outstanding voting shares of the fund.
The fund and certain other funds managed by MFS participate in a $1.25 billion unsecured committed line of credit, subject to a $1 billion sublimit, provided by a syndicate of banks under a credit agreement. Borrowings may be made for temporary financing needs. Interest is charged to each fund, based on its borrowings, generally at a rate equal to the highest of one month LIBOR, the Federal Funds Effective Rate and the Overnight Bank Funding Rate, plus an agreed upon spread. A commitment fee, based on the average daily, unused portion of the committed line of credit, is allocated among the participating funds. In addition, the fund and other funds managed by MFS have established unsecured uncommitted borrowing arrangements with certain banks for temporary financing needs. Interest is charged to each fund, based on its borrowings, at rates equal to customary reference rates plus an agreed upon spread. For the six months ended June 30, 2020, the fund’s commitment fee and interest expense were $1,659 and $0, respectively, and are included in “Interest expense and fees” in the Statement of Operations.
16
MFS Research Series
Notes to Financial Statements (unaudited) – continued
| (7) | | Investments in Affiliated Issuers |
An affiliated issuer may be considered one in which the fund owns 5% or more of the outstanding voting securities, or a company which is under common control. For the purposes of this report, the following were affiliated issuers:
| | | | | | | | | | | | | | | | | | | | | | | | |
| Affiliated Issuers | | Beginning
Value | | | Purchases | | | Sales
Proceeds | | | Realized
Gain
(Loss) | | | Change in
Unrealized
Appreciation or
Depreciation | | �� | Ending
Value | |
| MFS Institutional Money Market Portfolio | | | $1,194,880 | | | | $60,968,045 | | | | $55,311,929 | | | | $(208 | ) | | | $132 | | | | $6,850,920 | |
| | | | | | |
| Affiliated Issuers | | | | | | | | | | | | | | Dividend
Income | | | Capital Gain
Distributions | |
| MFS Institutional Money Market Portfolio | | | | | | | | | | | | $37,848 | | | | $— | |
The pandemic related to the global spread of novel coronavirus disease (COVID-19), which was first detected in December 2019, has resulted in significant disruptions to global business activity and the global economy, as well as the economies of individual countries, the financial performance of individual companies and sectors, and the securities and commodities markets in general. This pandemic, the full effects of which are still unknown, has resulted in substantial market volatility and may have adversely impacted the prices and liquidity of the fund’s investments and the fund’s performance.
17
MFS Research Series
STATEMENT REGARDING LIQUIDITY RISK MANAGEMENT PROGRAM
The fund has adopted and implemented a liquidity risk management program (the “Program”) as required by Rule 22e-4 under the Investment Company Act of 1940, as amended. The fund’s Board of Trustees (the “Board”) has designated MFS as the administrator of the Program. The Program is reasonably designed to assess and manage the liquidity risk of the fund. Liquidity risk is the risk that the fund could not meet requests to redeem shares issued by the fund without significant dilution of remaining investors’ interests.
MFS provided a written report to the Board for consideration at its April 2020 meeting that addressed the operation of the Program and provided an assessment of the adequacy and effectiveness of the Program during the period from the adoption of the Program on December 1, 2018 to December 31, 2019 (the “Covered Period”). The report concluded that during the Covered Period the Program had operated effectively and had adequately and effectively been implemented to assess and manage the fund’s liquidity risk. MFS also reported that there were no liquidity events that impacted the fund or its ability to timely meet redemptions without dilution to existing shareholders during the Covered Period.
There can be no assurance that the Program will achieve its objectives in the future. Further information on liquidity risk, and other principal risks to which an investment in the fund may be subject, can be found in the prospectus.
18
MFS Research Series
PROXY VOTING POLICIES AND INFORMATION
MFS votes proxies on behalf of the fund pursuant to proxy voting policies and procedures that are available without charge, upon request, by calling 1-800-225-2606, by visiting mfs.com/proxyvoting, or by visiting the SEC’s Web site at http://www.sec.gov.
Information regarding how the fund voted proxies relating to portfolio securities during the most recent twelve-month period ended June 30 is available by August 31 of each year without charge by visiting mfs.com/proxyvoting, or by visiting the SEC’s Web site at http://www.sec.gov.
QUARTERLY PORTFOLIO DISCLOSURE
The fund files a complete schedule of portfolio holdings with the SEC for the first and third quarters of each fiscal year as an exhibit to its reports on Form N-PORT. The fund’s Form N-PORT reports are available on the SEC’s website at http://www.sec.gov. A shareholder can obtain the portfolio holdings report for the first and third quarters of the fund’s fiscal year at mfs.com/vit1 by choosing the fund’s name and then selecting the “Resources” tab and clicking on “Prospectus and Reports”.
FURTHER INFORMATION
From time to time, MFS may post important information about the fund or the MFS funds on the MFS web site (mfs.com). This information is available at https://www.mfs.com/announcements or at mfs.com/vit1 by choosing the fund’s name and then selecting the “Resources” tab and clicking on the “Announcements” tab, if any.
INFORMATION ABOUT FUND CONTRACTS AND LEGAL CLAIMS
The fund has entered into contractual arrangements with an investment adviser, administrator, distributor, shareholder servicing agent, 529 program manager (if applicable), and custodian who each provide services to the fund. Unless expressly stated otherwise, shareholders are not parties to, or intended beneficiaries of these contractual arrangements, and these contractual arrangements are not intended to create any shareholder right to enforce them against the service providers or to seek any remedy under them against the service providers, either directly or on behalf of the fund.
Under the Trust’s By-Laws and Declaration of Trust, any claims asserted against or on behalf of the MFS Funds, including claims against Trustees and Officers, must be brought in state and federal courts located within the Commonwealth of Massachusetts.
19
Semiannual Report
June 30, 2020
MFS® Variable Insurance Trust
Beginning on January 1, 2021, as permitted by regulations adopted by the U.S. Securities and Exchange Commission, the insurance company that offers your contract may determine that it will no longer send you paper copies of the fund's annual and semiannual shareholder reports unless you specifically request paper copies from the insurance company or from your financial intermediary. Instead, the shareholder reports will be made available on a Web site (insurancefunds.mfs.com or other Web site of which you will be notified), and the insurance company will notify you by mail each time a report is posted and provide you with a Web site link to access the report. Instructions for requesting paper copies will be provided by your insurance company or financial intermediary.
If you already elected to receive shareholder reports by email, you will not be affected by this change and you need not take any action. If your insurance company or financial intermediary offers electronic delivery, you may elect to receive shareholder reports and other communications from the insurance company or financial intermediary by email by following the instructions provided by the insurance company or financial intermediary.
Beginning on January 1, 2019, you may elect to receive all future reports in paper free of charge from the insurance company or financial intermediary. You can inform the insurance company or financial intermediary that you wish to continue receiving paper copies of your shareholder reports by contacting your insurance company or financial intermediary. Your election to receive reports in paper will apply to all funds held in your account with your insurance company or financial intermediary.
The report is prepared for the general information of contract owners. It is authorized for distribution to prospective investors only when preceded or accompanied by a current prospectus.
NOT FDIC INSURED • MAY LOSE VALUE • NO BANK OR CREDIT UNION GUARANTEE •
NOT A DEPOSIT • NOT INSURED BY ANY FEDERAL GOVERNMENT AGENCY OR NCUA/NCUSIF
LETTER FROM THE EXECUTIVE CHAIR
Dear Contract Owners:
Markets experienced dramatic swings in early 2020, as the coronavirus pandemic brought the global economy to a standstill for several months. Optimism over the development of vaccines and therapeutics, along with a decline in cases in countries that had been affected by the outbreak early on, brightened the economic and market outlook during the second quarter, as did the phased reopening of US states. However, a great deal of uncertainty remains, including the possibility of a second wave of cases later this year, as many countries continue to experience COVID-19 flare-ups.
Global central banks have taken aggressive steps to cushion the economic and market fallout related to the virus, and governments are deploying unprecedented levels of fiscal support. As uncertainty recedes, these measures can help build a supportive environment and encourage economic recovery; however, if markets disconnect from fundamentals, they can also sow the seeds of instability. In the aftermath of the crisis, societal changes may be likely, as households, businesses, and governments adjust to a new reality, and these alterations could affect the investment landscape. For investors, events, such as the COVID-19 outbreak, demonstrate the importance of having a deep understanding of company fundamentals, and we have built our global research platform to do just that.
Here at MFS®, we aim to help our clients navigate the growing complexity of the markets and world economies. Our long-term investment philosophy and commitment to the responsible allocation of capital allow us to tune out the noise and uncover what we believe are the best, most durable investment opportunities in the market. Through our unique global investment platform, we combine collective expertise, thoughtful risk management, and long-term discipline to create sustainable value for investors.
Respectfully,
Robert J. Manning
Executive Chair
MFS Investment Management
August 17, 2020
The opinions expressed in this letter are subject to change and may not be relied upon for investment advice. No forecasts can be guaranteed.
Portfolio structure (i)
Top ten holdings (i)
| Microsoft Corp. | 2.2% |
| Johnson & Johnson | 2.0% |
| Comcast Corp., “A” | 1.9% |
| Cigna Corp. | 1.6% |
| Goldman Sachs Group, Inc. | 1.5% |
| JPMorgan Chase & Co. | 1.4% |
| U.S. Treasury Notes, 1.75%, 11/30/2021 | 1.3% |
| Fannie Mae, 3.5%, 30 Years | 1.2% |
| U.S. Treasury Notes, 1.375%, 1/31/2022 | 1.2% |
| Union Pacific Corp. | 1.2% |
Composition including fixed income credit quality (a)(i)
| AAA | 4.3% |
| AA | 1.3% |
| A | 5.9% |
| BBB | 9.4% |
| BB | 0.1% |
| B | 0.1% |
| CCC (o) | 0.0% |
| U.S. Government | 6.1% |
| Federal Agencies | 12.9% |
| Not Rated | 0.4% |
| Non-Fixed Income | 59.1% |
| Cash & Cash Equivalents | 0.4% |
GICS equity sectors (g)
| Financials | 12.0% |
| Health Care | 11.1% |
| Information Technology | 9.7% |
| Industrials | 8.6% |
| Consumer Staples | 4.9% |
| Communication Services | 3.3% |
| Consumer Discretionary | 2.9% |
| Utilities | 2.7% |
| Energy | 1.7% |
| Materials | 1.7% |
| Real Estate | 0.5% |
Fixed income sectors (i)
| Investment Grade Corporates | 15.5% |
| Mortgage-Backed Securities | 12.9% |
| U.S. Treasury Securities | 6.1% |
| Commercial Mortgage-Backed Securities | 2.8% |
| Collateralized Debt Obligations | 1.5% |
| Asset-Backed Securities | 0.7% |
| Municipal Bonds | 0.4% |
| Emerging Markets Bonds | 0.3% |
| Non-U.S. Government Bonds | 0.3% |
| U.S. Government Agencies (o) | 0.0% |
| (a) | For all securities other than those specifically described below, ratings are assigned to underlying securities utilizing ratings from Moody’s, Fitch, and Standard & Poor’s rating agencies and applying the following hierarchy: If all three agencies provide a rating, the middle rating (after dropping the highest and lowest ratings) is assigned; if two of the three agencies rate a security, the lower of the two is assigned. Ratings are shown in the S&P and Fitch scale (e.g., AAA). Securities rated BBB or higher are considered investment grade. All ratings are subject to change.U.S. Government includes securities issued by the U.S. Department of the Treasury. Federal Agencies includes rated and unrated U.S. Agency fixed-income securities, U.S. Agency mortgage-backed securities, and collateralized mortgage obligations of U.S. Agency mortgage-backed securities.Not Rated includes fixed income securities and fixed income derivatives, which have not been rated by any rating agency.Non-Fixed Income includes any equity securities (including convertible bonds and equity derivatives) and/or commodity-linked derivatives.The fund may or may not have held all of these instruments on this date. The fund is not rated by these agencies. |
Portfolio Composition - continued
| (g) | The Global Industry Classification Standard (GICS®) was developed by and/or is the exclusive property of MSCI, Inc. and S&P Global Market Intelligence Inc. (“S&P Global Market Intelligence”). GICS is a service mark of MSCI and S&P Global Market Intelligence and has been licensed for use by MFS. |
| (i) | For purposes of this presentation, the components include the value of securities, and reflect the impact of the equivalent exposure of derivative positions, if any. These amounts may be negative from time to time. Equivalent exposure is a calculated amount that translates the derivative position into a reasonable approximation of the amount of the underlying asset that the portfolio would have to hold at a given point in time to have the same price sensitivity that results from the portfolio’s ownership of the derivative contract. When dealing with derivatives, equivalent exposure is a more representative measure of the potential impact of a position on portfolio performance than value. The bond component will include any accrued interest amounts. |
Where the fund holds convertible bonds, they are treated as part of the equity portion of the portfolio.
Cash & Cash Equivalents includes any cash, investments in money market funds, short-term securities, and other assets less liabilities. Please see the Statement of Assets and Liabilities for additional information related to the fund’s cash position and other assets and liabilities.
Percentages are based on net assets as of June 30, 2020.
The portfolio is actively managed and current holdings may be different.
Expense Table
Fund Expenses Borne by the Contract Holders during the Period,
January 1, 2020 through June 30, 2020
As a contract holder of the fund, you incur ongoing costs, including management fees; distribution and/or service (12b-1) fees; and other fund expenses. This example is intended to help you understand your ongoing costs (in dollars) of investing in the fund and to compare these costs with the ongoing costs of investing in other mutual funds.
The example is based on an investment of $1,000 invested at the beginning of the period and held for the entire period January 1, 2020 through June 30, 2020.
Actual Expenses
The first line for each share class in the following table provides information about actual account values and actual expenses. You may use the information in this line, together with the amount you invested, to estimate the expenses that you paid over the period. Simply divide your account value by $1,000 (for example, an $8,600 account value divided by $1,000 = 8.6), then multiply the result by the number in the first line under the heading entitled “Expenses Paid During Period” to estimate the expenses you paid on your account during this period.
Hypothetical Example for Comparison Purposes
The second line for each share class in the following table provides information about hypothetical account values and hypothetical expenses based on the fund’s actual expense ratio and an assumed rate of return of 5% per year before expenses, which is not the fund’s actual return. The hypothetical account values and expenses may not be used to estimate the actual ending account balance or expenses you paid for the period. You may use this information to compare the ongoing costs of investing in the fund and other funds. To do so, compare this 5% hypothetical example with the 5% hypothetical examples that appear in the shareholder reports of the other funds.
Please note that the expenses shown in the table are meant to highlight the fund's ongoing costs only and do not take into account the fees and expenses imposed under the variable contracts through which your investment in the fund is made. Therefore, the second line for each share class in the table is useful in comparing ongoing costs associated with an investment in vehicles (such as the fund) which fund benefits under variable annuity and variable life insurance contracts and to qualified pension and retirement plans only, and will not help you determine the relative total costs of investing in the fund through variable annuity and variable life insurance contracts. If the fees and expenses imposed under the variable contracts were included, your costs would have been higher.
Share
Class | | Annualized
Expense
Ratio | Beginning
Account Value
1/01/20 | Ending
Account Value
6/30/20 | Expenses
Paid During
Period (p)
1/01/20-6/30/20 |
| Initial Class | Actual | 0.61% | $1,000.00 | $960.64 | $2.97 |
| Hypothetical (h) | 0.61% | $1,000.00 | $1,021.83 | $3.07 |
| Service Class | Actual | 0.86% | $1,000.00 | $959.07 | $4.19 |
| Hypothetical (h) | 0.86% | $1,000.00 | $1,020.59 | $4.32 |
| (h) | 5% class return per year before expenses. |
| (p) | “Expenses Paid During Period” are equal to each class's annualized expense ratio, as shown above, multiplied by the average account value over the period, multiplied by 182/366 (to reflect the one-half year period). |
Portfolio of Investments − 6/30/20 (unaudited)
The Portfolio of Investments is a complete list of all securities owned by your fund. It is categorized by broad-based asset classes.
| Issuer | | | Shares/Par | Value ($) |
| Common Stocks – 57.8% |
| Aerospace – 2.3% | |
| Honeywell International, Inc. | | 153,132 | $ 22,141,356 |
| L3Harris Technologies, Inc. | | 51,600 | 8,754,972 |
| Lockheed Martin Corp. | | 27,083 | 9,883,128 |
| Northrop Grumman Corp. | | 37,840 | 11,633,530 |
| | | | | $52,412,986 |
| Alcoholic Beverages – 0.4% | |
| Diageo PLC | | 282,106 | $ 9,373,390 |
| Automotive – 0.6% | |
| Aptiv PLC | | 47,452 | $ 3,697,460 |
| Lear Corp. | | 102,415 | 11,165,283 |
| | | | | $14,862,743 |
| Broadcasting – 0.1% | |
| Omnicom Group, Inc. | | 40,956 | $ 2,236,198 |
| Brokerage & Asset Managers – 2.7% | |
| BlackRock, Inc. | | 19,090 | $ 10,386,678 |
| Blackstone Group, Inc. | | 127,305 | 7,213,101 |
| Charles Schwab Corp. | | 396,900 | 13,391,406 |
| Invesco Ltd. | | 374,388 | 4,028,415 |
| NASDAQ, Inc. | | 99,770 | 11,919,522 |
| T. Rowe Price Group, Inc. | | 54,245 | 6,699,258 |
| TD Ameritrade Holding Corp. | | 222,090 | 8,079,634 |
| | | | | $61,718,014 |
| Business Services – 2.7% | |
| Accenture PLC, “A” | | 104,451 | $ 22,427,719 |
| Amdocs Ltd. | | 107,291 | 6,531,876 |
| Equifax, Inc. | | 51,966 | 8,931,916 |
| Fidelity National Information Services, Inc. | | 84,678 | 11,354,473 |
| Fiserv, Inc. (a) | | 130,201 | 12,710,222 |
| | | | | $61,956,206 |
| Cable TV – 1.9% | |
| Comcast Corp., “A” | | 1,139,769 | $ 44,428,196 |
| Chemicals – 1.2% | |
| 3M Co. | | 77,831 | $ 12,140,857 |
| PPG Industries, Inc. | | 158,697 | 16,831,404 |
| | | | | $28,972,261 |
| Computer Software – 3.2% | |
| Adobe Systems, Inc. (a) | | 30,183 | $ 13,138,962 |
| Microsoft Corp. | | 255,564 | 52,009,830 |
| Oracle Corp. | | 151,657 | 8,382,082 |
| | | | | $73,530,874 |
| Computer Software - Systems – 0.8% | |
| Apple, Inc. | | 52,982 | $ 19,327,834 |
| Construction – 1.9% | |
| Masco Corp. | | 391,881 | $ 19,676,345 |
| Otis Worldwide Corp. | | 62,879 | 3,575,300 |
| Stanley Black & Decker, Inc. | | 53,157 | 7,409,023 |
| Issuer | | | Shares/Par | Value ($) |
| Common Stocks – continued |
| Construction – continued | |
| Toll Brothers, Inc. | | 105,695 | $ 3,444,600 |
| Vulcan Materials Co. | | 37,680 | 4,365,228 |
| Whirlpool Corp. | | 42,570 | 5,514,092 |
| | | | | $43,984,588 |
| Consumer Products – 0.9% | |
| Colgate-Palmolive Co. | | 144,954 | $ 10,619,330 |
| Kimberly-Clark Corp. | | 70,669 | 9,989,063 |
| | | | | $20,608,393 |
| Electrical Equipment – 0.7% | |
| Johnson Controls International PLC | | 456,685 | $ 15,591,226 |
| Electronics – 2.9% | |
| Analog Devices, Inc. | | 29,277 | $ 3,590,531 |
| Applied Materials, Inc. | | 95,587 | 5,778,234 |
| Intel Corp. | | 336,488 | 20,132,077 |
| NXP Semiconductors N.V. | | 74,175 | 8,458,917 |
| Taiwan Semiconductor Manufacturing Co. Ltd., ADR | | 222,340 | 12,622,242 |
| Texas Instruments, Inc. | | 140,445 | 17,832,302 |
| | | | | $68,414,303 |
| Energy - Independent – 0.9% | |
| ConocoPhillips | | 157,281 | $ 6,608,948 |
| Hess Corp. | | 153,861 | 7,971,538 |
| Pioneer Natural Resources Co. | | 31,450 | 3,072,665 |
| Valero Energy Corp. | | 74,453 | 4,379,325 |
| | | | | $22,032,476 |
| Energy - Integrated – 0.4% | |
| BP PLC | | 1,389,888 | $ 5,290,632 |
| Suncor Energy, Inc. | | 262,409 | 4,424,383 |
| | | | | $9,715,015 |
| Food & Beverages – 2.6% | |
| Archer Daniels Midland Co. | | 233,468 | $ 9,315,373 |
| Danone S.A. | | 121,839 | 8,426,706 |
| General Mills, Inc. | | 154,890 | 9,548,969 |
| J.M. Smucker Co. | | 44,378 | 4,695,636 |
| Mondelez International, Inc. | | 129,041 | �� 6,597,867 |
| Nestle S.A. | | 129,363 | 14,300,998 |
| PepsiCo, Inc. | | 60,582 | 8,012,575 |
| | | | | $60,898,124 |
| Health Maintenance Organizations – 1.6% | |
| Cigna Corp. | | 202,920 | $ 38,077,938 |
| Insurance – 3.1% | |
| AON PLC | | 105,871 | $ 20,390,755 |
| Chubb Ltd. | | 169,046 | 21,404,604 |
| Marsh & McLennan Cos., Inc. | | 72,592 | 7,794,203 |
| Reinsurance Group of America, Inc. | | 43,974 | 3,449,321 |
| Travelers Cos., Inc. | | 114,364 | 13,043,214 |
| Willis Towers Watson PLC | | 29,983 | 5,905,152 |
| | | | | $71,987,249 |
Portfolio of Investments (unaudited) – continued
| Issuer | | | Shares/Par | Value ($) |
| Common Stocks – continued |
| Internet – 0.4% | |
| Alphabet, Inc., “A” (a) | | 6,175 | $ 8,756,459 |
| Leisure & Toys – 0.3% | |
| Electronic Arts, Inc. (a) | | 54,544 | $ 7,202,535 |
| Machinery & Tools – 2.1% | |
| Caterpillar, Inc. | | 64,412 | $ 8,148,118 |
| Deere & Co. | | 21,284 | 3,344,781 |
| Eaton Corp. PLC | | 293,175 | 25,646,949 |
| Ingersoll Rand, Inc. (a) | | 224,144 | 6,302,929 |
| Trane Technologies PLC | | 66,451 | 5,912,810 |
| | | | | $49,355,587 |
| Major Banks – 4.3% | |
| Bank of America Corp. | | 890,123 | $ 21,140,421 |
| Goldman Sachs Group, Inc. | | 180,004 | 35,572,391 |
| JPMorgan Chase & Co. | | 349,056 | 32,832,207 |
| PNC Financial Services Group, Inc. | | 65,129 | 6,852,222 |
| State Street Corp. | | 61,426 | 3,903,622 |
| | | | | $100,300,863 |
| Medical & Health Technology & Services – 0.9% | |
| McKesson Corp. | | 94,149 | $ 14,444,340 |
| Quest Diagnostics, Inc. | | 60,266 | 6,867,913 |
| | | | | $21,312,253 |
| Medical Equipment – 3.2% | |
| Becton, Dickinson and Co. | | 38,380 | $ 9,183,183 |
| Danaher Corp. | | 148,452 | 26,250,767 |
| Medtronic PLC | | 268,774 | 24,646,576 |
| Thermo Fisher Scientific, Inc. | | 41,271 | 14,954,134 |
| | | | | $75,034,660 |
| Metals & Mining – 0.2% | |
| Rio Tinto PLC | | 82,371 | $ 4,642,980 |
| Natural Gas - Distribution – 0.2% | |
| Sempra Energy | | 29,158 | $ 3,418,192 |
| Natural Gas - Pipeline – 0.3% | |
| Enterprise Products Partners LP | | 425,676 | $ 7,734,533 |
| Other Banks & Diversified Financials – 2.2% | |
| Northern Trust Corp. | | 44,137 | $ 3,501,830 |
| Truist Financial Corp. | | 711,347 | 26,711,080 |
| U.S. Bancorp | | 410,603 | 15,118,402 |
| Visa, Inc., “A” | | 28,471 | 5,499,743 |
| | | | | $50,831,055 |
| Pharmaceuticals – 5.0% | |
| Bayer AG | | 83,543 | $ 6,132,019 |
| Eli Lilly & Co. | | 72,220 | 11,857,079 |
| Johnson & Johnson | | 330,532 | 46,482,715 |
| Merck & Co., Inc. | | 319,717 | 24,723,716 |
| Pfizer, Inc. | | 399,894 | 13,076,534 |
| Roche Holding AG | | 41,267 | 14,301,567 |
| | | | | $116,573,630 |
| Railroad & Shipping – 1.2% | |
| Union Pacific Corp. | | 161,707 | $ 27,339,802 |
| Issuer | | | Shares/Par | Value ($) |
| Common Stocks – continued |
| Real Estate – 0.5% | |
| EPR Properties, REIT | | 79,356 | $ 2,629,064 |
| Public Storage, Inc., REIT | | 19,028 | 3,651,283 |
| STORE Capital Corp., REIT | | 270,590 | 6,442,748 |
| | | | | $12,723,095 |
| Restaurants – 0.4% | |
| Starbucks Corp. | | 128,394 | $ 9,448,514 |
| Specialty Chemicals – 0.6% | |
| Axalta Coating Systems Ltd. (a) | | 190,818 | $ 4,302,946 |
| Corteva, Inc. | | 65,340 | 1,750,458 |
| DuPont de Nemours, Inc. | | 142,445 | 7,568,103 |
| | | | | $13,621,507 |
| Specialty Stores – 1.3% | |
| Home Depot, Inc. | | 39,173 | $ 9,813,229 |
| Target Corp. | | 118,340 | 14,192,516 |
| Tractor Supply Co. | | 45,490 | 5,995,127 |
| | | | | $30,000,872 |
| Telecommunications - Wireless – 0.3% | |
| T-Mobile USA, Inc. (a) | | 71,219 | $ 7,417,459 |
| Tobacco – 1.0% | |
| Altria Group, Inc. | | 46,304 | $ 1,817,432 |
| Philip Morris International, Inc. | | 315,941 | 22,134,826 |
| | | | | $23,952,258 |
| Trucking – 0.2% | |
| United Parcel Service, Inc., “B” | | 38,675 | $ 4,299,886 |
| Utilities - Electric Power – 2.3% | |
| Duke Energy Corp. | | 227,346 | $ 18,162,672 |
| Exelon Corp. | | 279,529 | 10,144,108 |
| FirstEnergy Corp. | | 93,166 | 3,612,977 |
| Pinnacle West Capital Corp. | | 47,661 | 3,493,075 |
| Public Service Enterprise Group, Inc. | | 71,906 | 3,534,899 |
| Southern Co. | | 272,397 | 14,123,784 |
| | | | | $53,071,515 |
| Total Common Stocks (Identified Cost, $960,729,692) | | $ 1,347,165,669 |
| Bonds – 40.3% |
| Aerospace – 0.3% |
| BAE Systems PLC, 3.4%, 4/15/2030 (n) | | $ | 1,108,000 | $ 1,206,798 |
| Huntington Ingalls Industries, Inc., 3.844%, 5/01/2025 (n) | | | 591,000 | 641,722 |
| L3Harris Technologies, Inc., 3.85%, 6/15/2023 | | | 2,506,000 | 2,726,705 |
| Lockheed Martin Corp., 2.8%, 6/15/2050 | | | 433,000 | 455,663 |
| Raytheon Technologies Corp., 4.125%, 11/16/2028 | | | 1,778,000 | 2,094,277 |
| | | | | $7,125,165 |
| Apparel Manufacturers – 0.0% |
| NIKE, Inc., “B”, 3.25%, 3/27/2040 | | $ | 880,000 | $ 984,920 |
Portfolio of Investments (unaudited) – continued
| Issuer | | | Shares/Par | Value ($) |
| Bonds – continued |
| Asset-Backed & Securitized – 5.0% |
| ALM Loan Funding, CLO, 2013-7R2A, “A1B2”, FLR, 2.619% (LIBOR - 3mo. + 1.4%), 10/15/2027 (n) | | $ | 4,410,000 | $ 4,255,826 |
| AREIT CRE Trust, 2018-CRE2, “A”, FLR, 1.175% (LIBOR - 1mo. + 0.98%), 11/14/2035 (n) | | | 2,120,749 | 2,080,985 |
| AREIT CRE Trust, 2019-CRE3, “AS”, FLR, 1.495% (LIBOR - 1mo. + 1.3%), 9/14/2036 (n) | | | 3,366,000 | 3,150,159 |
| Avis Budget Rental Car Funding LLC, 2019-1A, “A”, 3.45%, 3/20/2023 (n) | | | 3,880,000 | 3,892,347 |
| Bancorp Commercial Mortgage Trust, 2018-CRE4, “A”, FLR, 1.085% (LIBOR - 1mo. + 0.9%), 9/15/2035 (n) | | | 1,573,543 | 1,493,953 |
| Bancorp Commercial Mortgage Trust, 2019-CRE6, “AS”, FLR, 1.485% (LIBOR - 1mo. + 1.3%), 9/15/2036 (n) | | | 3,469,924 | 3,318,122 |
| Bayview Financial Revolving Mortgage Loan Trust, FLR, 1.784% (LIBOR - 1mo. + 1.6%), 12/28/2040 (n) | | | 1,136,071 | 1,143,405 |
| BDS Ltd., 2019-FL4, “A”, FLR, 1.594% (LIBOR - 1mo. + 1.4%), 8/15/2035 (n) | | | 4,179,000 | 4,053,879 |
| BDS Ltd., 2019-FL4, “A”, FLR, 1.294% (LIBOR - 1mo. + 1.10%), 8/15/2036 (n) | | | 2,416,000 | 2,346,736 |
| Chesapeake Funding II LLC, 2018-1A, “A1”, 3.04%, 4/15/2030 (n) | | | 783,109 | 800,263 |
| Commercial Mortgage Pass-Through Certificates, 2019-BN17, “A4”, 3.714%, 4/15/2052 | | | 2,789,000 | 3,227,977 |
| Commercial Mortgage Trust, 2015-LC21, “A4”, 3.708%, 7/10/2048 | | | 3,980,975 | 4,375,173 |
| CSAIL Commercial Mortgage Trust, 2015-C2, “A4”, 3.504%, 6/15/2057 | | | 2,316,427 | 2,503,937 |
| Cutwater CLO Ltd., 2015-1A, “AR”, FLR, 2.438% (LIBOR - 3mo. + 1.22%), 1/15/2029 (n) | | | 4,371,485 | 4,299,259 |
| Dryden Senior Loan Fund, 2013-26A, “AR”, CLO, FLR, 2.119% (LIBOR - 3mo. + 0.9%), 4/15/2029 (n) | | | 2,088,000 | 2,049,247 |
| Dryden Senior Loan Fund, 2018-55A, “A1”, CLO, FLR, 2.238% (LIBOR - 3mo. + 1.02%), 4/15/2031 (n) | | | 4,414,000 | 4,309,454 |
| Exantas Capital Corp. CLO Ltd., 2019-RS07, “A”, FLR, 1.193% (LIBOR - 1mo. + 1%), 4/15/2036 (n) | | | 473,166 | 457,787 |
| Exeter Automobile Receivables Trust, 2020-1, 2.26%, 4/15/2024 (n) | | | 720,000 | 727,272 |
| Figueroa CLO Ltd., 2014-1A, “BR”, FLR, 2.719% (LIBOR - 3mo. + 1.5%), 1/15/2027 (n) | | | 1,330,000 | 1,302,585 |
| Fort CRE LLC, 2018-1A, “A1”, FLR, 1.54% (LIBOR - 1mo. + 1.35%), 11/16/2035 (n) | | | 1,638,500 | 1,622,569 |
| GLS Auto Receivables Trust, 2020-1A, “A”, 2.17%, 2/15/2024 (n) | | | 971,395 | 982,356 |
| GMAC Mortgage Corp. Loan Trust, 5.805%, 10/25/2036 | | | 284,444 | 292,375 |
| Issuer | | | Shares/Par | Value ($) |
| Bonds – continued |
| Asset-Backed & Securitized – continued |
| GS Mortgage Securities Trust, 2015-GC30, “A4”, 3.382%, 5/10/2050 | | $ | 4,243,101 | $ 4,586,953 |
| GS Mortgage Securities Trust, 2019-GSA1, “A4”, 3.047%, 11/10/2052 | | | 2,182,474 | 2,406,505 |
| GS Mortgage Securities Trust, 2020-GC45, “A5”, 2.91%, 2/13/2053 | | | 2,001,659 | 2,186,090 |
| JPMBB Commercial Mortgage Securities Trust, 2014-C26, 3.494%, 1/15/2048 | | | 4,880,000 | 5,276,699 |
| JPMBB Commercial Mortgage Securities Trust, 2015-C28, “A4”, 3.227%, 10/15/2048 | | | 3,256,792 | 3,485,224 |
| KKR Real Estate Financial Trust, Inc., 2018-FL1, “A”, FLR, 1.294% (LIBOR - 1mo. + 1.1%), 6/15/2036 (n) | | | 2,180,000 | 2,147,300 |
| MF1 CLO Ltd., 2019-FL2, “A”, FLR, 1.314% (LIBOR - 1mo. + 1.13%), 12/25/2034 (n) | | | 4,395,000 | 4,318,088 |
| Morgan Stanley Bank of America Merrill Lynch Trust, 2017-C34, “A4”, 3.536%, 11/15/2052 | | | 1,600,004 | 1,785,260 |
| Morgan Stanley Capital I Trust, 2017-H1, “A5”, 3.53%, 6/15/2050 | | | 1,456,742 | 1,621,019 |
| Mountain Hawk CLO Ltd., 2014-3A, “BR”, FLR, 2.935% (LIBOR - 3mo. + 1.8%), 4/18/2025 (n) | | | 4,534,203 | 4,470,316 |
| Navistar Financial Dealer Note Master Owner Trust II, 2018-1, “A”, FLR, 0.814% (LIBOR - 1mo. + 0.63%), 9/25/2023 (n) | | | 2,554,000 | 2,544,653 |
| Neuberger Berman CLO Ltd., 2015-20, “AR”, FLR, 2.019% (LIBOR - 3mo. + 0.8%), 1/15/2028 (n) | | | 1,869,456 | 1,838,569 |
| Oaktree CLO Ltd., 2015-1A, “A2AR”, FLR, 2.485% (LIBOR - 3mo. + 1.35%), 10/20/2027 (n) | | | 809,537 | 780,692 |
| Residential Funding Mortgage Securities, Inc., 5.32%, 12/25/2035 | | | 356,438 | 357,109 |
| Santander Retail Auto Lease Trust, 2020-A, “B”, 1.88%, 3/20/2024 (n) | | | 1,631,000 | 1,623,108 |
| Sound Point CLO Ltd., 2015-3A, “AR”, FLR, 2.025% (LIBOR - 3mo. + 0.89%), 1/20/2028 (n) | | | 440,048 | 435,062 |
| UBS Commercial Mortgage Trust, 2017-C8, “A4”, 3.983%, 2/15/2051 | | | 2,950,000 | 3,376,459 |
| UBS Commercial Mortgage Trust, 2019-C17, “A4”, 2.921%, 9/15/2052 | | | 2,461,404 | 2,664,248 |
| Venture Corp. Ltd., FLR, 1.571% (LIBOR - 3mo. + 1.2%), 2/28/2026 (n) | | | 4,608,000 | 4,421,800 |
| Verizon Owner Trust, 2020-A, “B”, 1.98%, 7/22/2024 | | | 2,616,000 | 2,639,261 |
| Veros Auto Receivables Trust, 2020-1, “A”, 1.67%, 9/15/2023 (n) | | | 1,909,541 | 1,907,118 |
| Wells Fargo Commercial Mortgage Trust, 2015-C28, “A4”, 3.54%, 5/15/2048 | | | 4,315,766 | 4,700,540 |
Portfolio of Investments (unaudited) – continued
| Issuer | | | Shares/Par | Value ($) |
| Bonds – continued |
| Asset-Backed & Securitized – continued |
| Wells Fargo Commercial Mortgage Trust, 2019-C54, “A4”, 3.146%, 12/15/2052 | | $ | 3,579,870 | $ 3,982,459 |
| | | | | $116,240,198 |
| Automotive – 0.6% |
| General Motors Co., 6.75%, 4/01/2046 | | $ | 1,124,000 | $ 1,224,322 |
| General Motors Financial Co., Inc., 4.35%, 4/09/2025 | | | 640,000 | 674,363 |
| General Motors Financial Co., Inc., 2.75%, 6/20/2025 | | | 1,174,000 | 1,159,567 |
| Hyundai Capital America, 2.65%, 2/10/2025 (n) | | | 1,073,000 | 1,077,495 |
| Hyundai Capital America, 3%, 2/10/2027 (n) | | | 1,846,000 | 1,823,231 |
| Lear Corp., 3.8%, 9/15/2027 | | | 2,474,000 | 2,511,176 |
| Lear Corp., 4.25%, 5/15/2029 | | | 875,000 | 897,664 |
| Magna International, Inc., 2.45%, 6/15/2030 | | | 2,523,000 | 2,580,216 |
| Toyota Motor Credit Corp., 3.375%, 4/01/2030 | | | 1,286,000 | 1,481,294 |
| Volkswagen Group of America Finance LLC, 3.35%, 5/13/2025 (n) | | | 1,010,000 | 1,077,908 |
| | | | | $14,507,236 |
| Broadcasting – 0.2% |
| RELX Capital, Inc., 3%, 5/22/2030 | | $ | 707,000 | $ 762,005 |
| Walt Disney Co., 3.5%, 5/13/2040 | | | 1,654,000 | 1,806,462 |
| Walt Disney Co., 3.6%, 1/13/2051 | | | 1,015,000 | 1,130,650 |
| | | | | $3,699,117 |
| Brokerage & Asset Managers – 0.4% |
| E*TRADE Financial Corp., 2.95%, 8/24/2022 | | $ | 750,000 | $ 780,913 |
| E*TRADE Financial Corp., 4.5%, 6/20/2028 | | | 1,107,000 | 1,280,161 |
| Intercontinental Exchange, Inc., 2.35%, 9/15/2022 | | | 410,000 | 425,396 |
| Intercontinental Exchange, Inc., 4%, 10/15/2023 | | | 1,061,000 | 1,173,294 |
| Intercontinental Exchange, Inc., 2.1%, 6/15/2030 | | | 2,439,000 | 2,492,194 |
| National Securities Clearing Corp., 1.5%, 4/23/2025 (n) | | | 1,462,000 | 1,495,283 |
| Raymond James Financial, Inc., 4.95%, 7/15/2046 | | | 2,325,000 | 2,812,529 |
| | | | | $10,459,770 |
| Building – 0.2% |
| CRH America Finance, Inc., 4.5%, 4/04/2048 (n) | | $ | 1,146,000 | $ 1,252,251 |
| Martin Marietta Materials, Inc., 3.5%, 12/15/2027 | | | 927,000 | 1,020,875 |
| Martin Marietta Materials, Inc., 2.5%, 3/15/2030 | | | 258,000 | 259,704 |
| Masco Corp., 4.375%, 4/01/2026 | | | 1,938,000 | 2,212,319 |
| Issuer | | | Shares/Par | Value ($) |
| Bonds – continued |
| Building – continued |
| Vulcan Materials Co., 3.5%, 6/01/2030 | | $ | 437,000 | $ 476,037 |
| | | | | $5,221,186 |
| Business Services – 0.5% |
| Equinix, Inc., 2.625%, 11/18/2024 | | $ | 3,239,000 | $ 3,448,304 |
| Equinix, Inc., 1.8%, 7/15/2027 | | | 2,070,000 | 2,068,903 |
| Fiserv, Inc., 2.65%, 6/01/2030 | | | 489,000 | 518,130 |
| Fiserv, Inc., 4.4%, 7/01/2049 | | | 1,654,000 | 2,013,056 |
| Tencent Holdings Ltd., 2.39%, 6/03/2030 (n) | | | 1,814,000 | 1,811,759 |
| Verisk Analytics, Inc., 4.125%, 3/15/2029 | | | 2,462,000 | 2,876,585 |
| | | | | $12,736,737 |
| Cable TV – 0.3% |
| Charter Communications Operating LLC/Charter Communications Operating Capital Corp., 5.375%, 5/01/2047 | | $ | 491,000 | $ 579,831 |
| Comcast Corp., 3.45%, 2/01/2050 | | | 1,746,000 | 2,002,932 |
| Comcast Corp., 2.8%, 1/15/2051 | | | 1,055,000 | 1,081,887 |
| Time Warner Entertainment Co. LP, 8.375%, 7/15/2033 | | | 2,855,000 | 4,299,550 |
| | | | | $7,964,200 |
| Chemicals – 0.1% |
| Sherwin-Williams Co., 4.5%, 6/01/2047 | | $ | 1,201,000 | $ 1,462,065 |
| Computer Software – 0.2% |
| Dell International LLC/EMC Corp., 4.9%, 10/01/2026 (n) | | $ | 1,857,000 | $ 2,049,017 |
| Microsoft Corp., 2.525%, 6/01/2050 | | | 2,278,000 | 2,375,971 |
| | | | | $4,424,988 |
| Computer Software - Systems – 0.3% |
| Apple, Inc., 2.85%, 5/11/2024 | | $ | 2,162,000 | $ 2,328,305 |
| Apple, Inc., 2.05%, 9/11/2026 | | | 432,000 | 461,571 |
| Apple, Inc., 3.35%, 2/09/2027 | | | 647,000 | 737,082 |
| Apple, Inc., 3.85%, 5/04/2043 | | | 1,303,000 | 1,612,976 |
| Apple, Inc., 3.85%, 8/04/2046 | | | 1,082,000 | 1,348,853 |
| | | | | $6,488,787 |
| Conglomerates – 0.3% |
| Roper Technologies, Inc., 4.2%, 9/15/2028 | | $ | 900,000 | $ 1,054,674 |
| Roper Technologies, Inc., 2.95%, 9/15/2029 | | | 551,000 | 601,870 |
| Roper Technologies, Inc., 2%, 6/30/2030 | | | 1,731,000 | 1,732,292 |
| Westinghouse Air Brake Co., 3.2%, 6/15/2025 | | | 800,000 | 815,198 |
| Westinghouse Air Brake Technologies Corp., 4.95%, 9/15/2028 | | | 2,041,000 | 2,274,780 |
| | | | | $6,478,814 |
Portfolio of Investments (unaudited) – continued
| Issuer | | | Shares/Par | Value ($) |
| Bonds – continued |
| Consumer Products – 0.3% |
| Estee Lauder Cos., Inc., 2.6%, 4/15/2030 | | $ | 1,048,000 | $ 1,140,189 |
| Kimberly-Clark Corp., 3.1%, 3/26/2030 | | | 290,000 | 330,218 |
| Reckitt Benckiser Treasury Services PLC, 3.625%, 9/21/2023 (n) | | | 3,463,000 | 3,725,310 |
| Reckitt Benckiser Treasury Services PLC, 2.75%, 6/26/2024 (n) | | | 1,097,000 | 1,166,515 |
| | | | | $6,362,232 |
| Consumer Services – 0.8% |
| Amazon.com, Inc., 2.5%, 6/03/2050 | | $ | 1,806,000 | $ 1,854,075 |
| Booking Holdings, Inc., 2.75%, 3/15/2023 | | | 3,809,000 | 3,993,411 |
| Booking Holdings, Inc., 4.5%, 4/13/2027 | | | 524,000 | 601,848 |
| Experian Finance PLC, 4.25%, 2/01/2029 (n) | | | 1,699,000 | 1,976,042 |
| IHS Markit Ltd., 3.625%, 5/01/2024 | | | 385,000 | 412,836 |
| IHS Markit Ltd., 4.75%, 2/15/2025 (n) | | | 634,000 | 710,080 |
| IHS Markit Ltd., 4%, 3/01/2026 (n) | | | 1,991,000 | 2,186,118 |
| IHS Markit Ltd., 4.25%, 5/01/2029 | | | 578,000 | 664,463 |
| Visa, Inc., 3.15%, 12/14/2025 | | | 4,677,000 | 5,209,938 |
| Western Union Co., 2.85%, 1/10/2025 | | | 660,000 | 687,693 |
| | | | | $18,296,504 |
| Electronics – 0.5% |
| Broadcom Corp./Broadcom Cayman Finance Ltd., 3.5%, 1/15/2028 | | $ | 3,096,000 | $ 3,276,334 |
| Broadcom, Inc., 4.25%, 4/15/2026 (n) | | | 1,367,000 | 1,521,341 |
| Broadcom, Inc., 4.15%, 11/15/2030 (n) | | | 678,000 | 736,770 |
| Broadcom, Inc., 4.3%, 11/15/2032 (n) | | | 1,765,000 | 1,936,520 |
| Intel Corp., 4.75%, 3/25/2050 | | | 2,420,000 | 3,411,619 |
| | | | | $10,882,584 |
| Energy - Integrated – 0.2% |
| Eni S.p.A., 4.75%, 9/12/2028 (n) | | $ | 1,944,000 | $ 2,166,456 |
| Total Capital International S.A., 3.127%, 5/29/2050 | | | 1,962,000 | 2,012,951 |
| | | | | $4,179,407 |
| Financial Institutions – 0.2% |
| AerCap Ireland Capital DAC, 4.875%, 1/16/2024 | | $ | 362,000 | $ 359,745 |
| AerCap Ireland Capital DAC, 3.65%, 7/21/2027 | | | 2,789,000 | 2,469,490 |
| Avolon Holdings Funding Ltd., 4.375%, 5/01/2026 (n) | | | 776,000 | 652,513 |
| Avolon Holdings Funding Ltd., 3.25%, 2/15/2027 (n) | | | 830,000 | 670,413 |
| | | | | $4,152,161 |
| Issuer | | | Shares/Par | Value ($) |
| Bonds – continued |
| Food & Beverages – 0.7% |
| Anheuser-Busch InBev S.A., 8%, 11/15/2039 | | $ | 2,610,000 | $ 4,109,826 |
| Constellation Brands, Inc., 3.5%, 5/09/2027 | | | 3,365,000 | 3,723,511 |
| Diageo Capital PLC, 2.375%, 10/24/2029 | | | 3,022,000 | 3,226,190 |
| General Mills, Inc., 4%, 4/17/2025 | | | 2,414,000 | 2,726,585 |
| General Mills, Inc., 2.875%, 4/15/2030 | | | 499,000 | 543,302 |
| Keurig Dr Pepper, Inc., 3.2%, 5/01/2030 | | | 409,000 | 455,003 |
| Keurig Dr Pepper, Inc., 3.8%, 5/01/2050 | | | 833,000 | 941,254 |
| PepsiCo, Inc., 3.5%, 3/19/2040 | | | 646,000 | 761,629 |
| | | | | $16,487,300 |
| Gaming & Lodging – 0.2% |
| GLP Capital LP/GLP Financing II, Inc., 5.3%, 1/15/2029 | | $ | 1,804,000 | $ 1,952,072 |
| Las Vegas Sands Corp., 3.9%, 8/08/2029 | | | 1,044,000 | 1,029,901 |
| Marriott International, Inc., 4%, 4/15/2028 | | | 2,208,000 | 2,223,164 |
| Marriott International, Inc., 4.625%, 6/15/2030 | | | 287,000 | 297,796 |
| | | | | $5,502,933 |
| Insurance – 0.3% |
| AIA Group Ltd., 3.375%, 4/07/2030 (n) | | $ | 731,000 | $ 794,760 |
| American International Group, Inc., 4.875%, 6/01/2022 | | | 3,566,000 | 3,848,974 |
| American International Group, Inc., 4.125%, 2/15/2024 | | | 2,620,000 | 2,924,314 |
| | | | | $7,568,048 |
| Insurance - Health – 0.1% |
| UnitedHealth Group, Inc., 3.5%, 8/15/2039 | | $ | 833,000 | $ 968,638 |
| UnitedHealth Group, Inc., 3.7%, 8/15/2049 | | | 2,163,000 | 2,558,968 |
| | | | | $3,527,606 |
| Insurance - Property & Casualty – 0.3% |
| Aon Corp., 3.75%, 5/02/2029 | | $ | 2,594,000 | $ 2,970,045 |
| Hartford Financial Services Group, Inc., 3.6%, 8/19/2049 | | | 1,068,000 | 1,126,089 |
| Liberty Mutual Group, Inc., 3.951%, 10/15/2050 (n) | | | 1,233,000 | 1,302,847 |
| Marsh & McLennan Cos., Inc., 4.75%, 3/15/2039 | | | 944,000 | 1,211,972 |
| | | | | $6,610,953 |
| International Market Quasi-Sovereign – 0.3% |
| Temasek Financial I Ltd. (Republic of Singapore), 2.375%, 1/23/2023 (n) | | $ | 6,400,000 | $ 6,677,888 |
| Machinery & Tools – 0.1% |
| CNH Industrial Capital LLC, 4.2%, 1/15/2024 | | $ | 1,901,000 | $ 2,025,523 |
Portfolio of Investments (unaudited) – continued
| Issuer | | | Shares/Par | Value ($) |
| Bonds – continued |
| Major Banks – 2.2% |
| Bank of America Corp., 4.1%, 7/24/2023 | | $ | 3,870,000 | $ 4,249,732 |
| Bank of America Corp., 4.125%, 1/22/2024 | | | 5,102,000 | 5,666,694 |
| Bank of America Corp., 3.366% to 1/23/2025, FLR (LIBOR - 3mo. + 0.81%) to 1/23/2026 | | | 1,842,000 | 2,011,820 |
| Bank of America Corp., 3.5%, 4/19/2026 | | | 1,542,000 | 1,735,745 |
| Bank of America Corp., 2.496% to 2/13/2030, FLR (LIBOR - 3mo. + 0.99%) to 2/13/2031 | | | 2,273,000 | 2,382,994 |
| Bank of New York Mellon Corp., 1.6%, 4/24/2025 | | | 2,086,000 | 2,159,134 |
| Goldman Sachs Group, Inc., 2.6%, 2/07/2030 | | | 3,245,000 | 3,402,692 |
| JPMorgan Chase & Co., 3.2%, 1/25/2023 | | | 5,489,000 | 5,835,824 |
| JPMorgan Chase & Co., 3.782% to 2/01/2027, FLR (LIBOR - 3mo. + 1.337%) to 2/01/2028 | | | 4,188,000 | 4,736,344 |
| JPMorgan Chase & Co., 2.956% to 5/13/2030, FLR (SOFR + 2.515%) to 5/13/2031 | | | 637,000 | 675,592 |
| JPMorgan Chase & Co., 3.109% to 4/22/2040, FLR (SOFR + 2.46%) to 4/22/2041 | | | 3,251,000 | 3,511,370 |
| JPMorgan Chase & Co., 3.897% to 1/23/2048, FLR (LIBOR - 3mo. + 1.22%) to 1/23/2049 | | | 1,248,000 | 1,508,416 |
| Morgan Stanley, 3.125%, 1/23/2023 | | | 424,000 | 449,569 |
| Morgan Stanley, 3.875%, 4/29/2024 | | | 1,539,000 | 1,701,790 |
| Morgan Stanley, 4%, 7/23/2025 | | | 1,206,000 | 1,367,419 |
| Morgan Stanley, 2.699% to 1/22/2030, FLR (SOFR + 1.143%) to 1/22/2031 | | | 4,760,000 | 5,042,201 |
| PNC Bank N.A., 2.7%, 10/22/2029 | | | 835,000 | 891,951 |
| Royal Bank of Canada, 1.15%, 6/10/2025 | | | 3,142,000 | 3,147,397 |
| State Street Corp., 2.901% to 3/30/2025, FLR (SOFR + 2.7%) to 3/30/2026 (n) | | | 464,000 | 502,264 |
| | | | | $50,978,948 |
| Medical & Health Technology & Services – 0.9% |
| Alcon, Inc., 2.6%, 5/27/2030 (n) | | $ | 302,000 | $ 309,575 |
| Alcon, Inc., 3.8%, 9/23/2049 (n) | | | 1,564,000 | 1,727,069 |
| Becton, Dickinson and Co., 3.125%, 11/08/2021 | | | 1,075,000 | 1,104,529 |
| Becton, Dickinson and Co., 4.669%, 6/06/2047 | | | 2,043,000 | 2,505,094 |
| Cigna Corp., 3.2%, 3/15/2040 | | | 635,000 | 672,669 |
| HCA, Inc., 5.125%, 6/15/2039 | | | 2,562,000 | 2,986,326 |
| Laboratory Corp. of America Holdings, 3.2%, 2/01/2022 | | | 660,000 | 684,605 |
| Laboratory Corp. of America Holdings, 3.25%, 9/01/2024 | | | 1,672,000 | 1,801,281 |
| Laboratory Corp. of America Holdings, 4.7%, 2/01/2045 | | | 1,590,000 | 1,935,443 |
| Issuer | | | Shares/Par | Value ($) |
| Bonds – continued |
| Medical & Health Technology & Services – continued |
| Northwell Healthcare, Inc., 3.979%, 11/01/2046 | | $ | 171,000 | $ 178,906 |
| Northwell Healthcare, Inc., 4.26%, 11/01/2047 | | | 1,367,000 | 1,495,257 |
| Thermo Fisher Scientific, Inc., 2.95%, 9/19/2026 | | | 2,583,000 | 2,857,052 |
| Thermo Fisher Scientific, Inc., 3.2%, 8/15/2027 | | | 2,566,000 | 2,861,711 |
| | | | | $21,119,517 |
| Medical Equipment – 0.4% |
| Abbott Laboratories, 4.9%, 11/30/2046 | | $ | 2,024,000 | $ 2,905,783 |
| Boston Scientific Corp., 3.75%, 3/01/2026 | | | 2,680,000 | 3,043,203 |
| Zimmer Biomet Holdings, Inc., 3.55%, 4/01/2025 | | | 2,940,000 | 3,193,203 |
| | | | | $9,142,189 |
| Metals & Mining – 0.1% |
| Glencore Funding LLC, 4.125%, 5/30/2023 (n) | | $ | 1,412,000 | $ 1,509,469 |
| Midstream – 0.6% |
| Cheniere Energy, Inc., 3.7%, 11/15/2029 (n) | | $ | 1,727,000 | $ 1,762,009 |
| Enbridge, Inc., 2.5%, 1/15/2025 | | | 1,100,000 | 1,142,492 |
| Enterprise Products Operating LLC, 4.2%, 1/31/2050 | | | 882,000 | 984,098 |
| Kinder Morgan Energy Partners LP, 4.15%, 2/01/2024 | | | 1,369,000 | 1,484,967 |
| ONEOK, Inc., 4.95%, 7/13/2047 | | | 2,637,000 | 2,580,934 |
| Plains All American Pipeline LP, 3.8%, 9/15/2030 | | | 1,781,000 | 1,744,983 |
| Sabine Pass Liquefaction LLC, 5%, 3/15/2027 | | | 1,769,000 | 1,979,322 |
| Sabine Pass Liquefaction LLC, 4.5%, 5/15/2030 (n) | | | 585,000 | 649,469 |
| Spectra Energy Partners LP, 3.375%, 10/15/2026 | | | 942,000 | 1,013,586 |
| | | | | $13,341,860 |
| Mortgage-Backed – 12.8% | |
| Fannie Mae, 5%, 7/01/2020 - 3/01/2041 | | $ | 3,322,585 | $ 3,797,841 |
| Fannie Mae, 5.5%, 1/01/2021 - 4/01/2040 | | | 7,905,859 | 8,946,878 |
| Fannie Mae, 6%, 1/01/2021 - 7/01/2037 | | | 4,208,617 | 4,809,251 |
| Fannie Mae, 2.59%, 5/01/2023 | | | 437,205 | 456,242 |
| Fannie Mae, 3.5%, 5/25/2025 - 11/01/2048 | | | 27,499,333 | 29,690,016 |
| Fannie Mae, 2.7%, 7/01/2025 | | | 367,000 | 396,419 |
| Fannie Mae, 3.43%, 6/01/2026 | | | 562,434 | 629,089 |
| Fannie Mae, 2.28%, 11/01/2026 | | | 469,374 | 501,685 |
| Fannie Mae, 2.584%, 12/25/2026 | | | 1,585,000 | 1,730,205 |
| Fannie Mae, 3%, 11/01/2028 - 7/01/2050 | | | 16,696,404 | 17,784,166 |
| Fannie Mae, 6.5%, 6/01/2031 - 7/01/2037 | | | 1,426,427 | 1,655,284 |
Portfolio of Investments (unaudited) – continued
| Issuer | | | Shares/Par | Value ($) |
| Bonds – continued |
| Mortgage-Backed – continued | |
| Fannie Mae, 2.5%, 11/01/2031 - 7/01/2050 | | $ | 4,895,323 | $ 5,154,492 |
| Fannie Mae, 3%, 2/25/2033 (i) | | | 518,587 | 54,428 |
| Fannie Mae, 4.5%, 8/01/2033 - 6/01/2044 | | | 8,547,805 | 9,485,694 |
| Fannie Mae, 3.25%, 5/25/2040 | | | 217,768 | 235,110 |
| Fannie Mae, 4%, 9/01/2040 - 6/01/2047 | | | 19,348,154 | 21,165,856 |
| Fannie Mae, 2%, 10/25/2040 - 4/25/2046 | | | 1,405,735 | 1,448,069 |
| Fannie Mae, 4%, 7/25/2046 (i) | | | 448,831 | 84,400 |
| Fannie Mae, TBA, 2%, 7/16/2035 - 7/14/2050 | | | 5,375,000 | 5,529,524 |
| Fannie Mae, TBA, 3%, 7/16/2035 - 8/13/2050 | | | 13,400,000 | 14,093,233 |
| Fannie Mae, TBA, 2.5%, 7/25/2035 - 8/25/2050 | | | 21,505,000 | 22,448,049 |
| Fannie Mae, TBA, 1.5%, 9/25/2035 | | | 875,000 | 887,852 |
| Fannie Mae, TBA, 4%, 7/25/2050 | | | 1,300,000 | 1,377,619 |
| Federal Home Loan Bank, 3%, 7/01/2050 | | | 125,183 | 133,859 |
| Freddie Mac, 6%, 5/01/2021 - 6/01/2037 | | | 1,662,386 | 1,898,109 |
| Freddie Mac, 5.5%, 10/01/2021 - 2/01/2037 | | | 1,198,974 | 1,358,033 |
| Freddie Mac, 5%, 12/01/2021 - 1/15/2040 | | | 2,109,394 | 2,417,416 |
| Freddie Mac, 2.791%, 1/25/2022 | | | 1,485,000 | 1,527,673 |
| Freddie Mac, 2.51%, 11/25/2022 | | | 1,503,000 | 1,563,143 |
| Freddie Mac, 3.111%, 2/25/2023 | | | 2,136,000 | 2,258,455 |
| Freddie Mac, 3.32%, 2/25/2023 | | | 745,000 | 792,278 |
| Freddie Mac, 3.25%, 4/25/2023 | | | 2,474,000 | 2,633,139 |
| Freddie Mac, 3.06%, 7/25/2023 | | | 175,000 | 186,912 |
| Freddie Mac, 3.458%, 8/25/2023 | | | 1,642,000 | 1,774,457 |
| Freddie Mac, 1.022%, 4/25/2024 (i) | | | 5,687,134 | 150,592 |
| Freddie Mac, 0.631%, 7/25/2024 (i) | | | 14,179,000 | 286,912 |
| Freddie Mac, 0.733%, 7/25/2024 (i) | | | 5,100,012 | 98,850 |
| Freddie Mac, 4.5%, 8/01/2024 - 5/01/2042 | | | 1,683,693 | 1,858,036 |
| Freddie Mac, 0.43%, 8/25/2024 (i) | | | 15,246,000 | 214,267 |
| Freddie Mac, 0.529%, 8/25/2024 (i) | | | 28,030,525 | 395,009 |
| Freddie Mac, 3.064%, 8/25/2024 | | | 794,000 | 860,991 |
| Freddie Mac, 0.489%, 10/25/2024 (i) | | | 20,463,080 | 261,768 |
| Freddie Mac, 3.171%, 10/25/2024 | | | 1,304,000 | 1,434,859 |
| Freddie Mac, 0.4%, 11/25/2024 (i) | | | 15,385,000 | 188,751 |
| Freddie Mac, 2.67%, 12/25/2024 | | | 1,561,000 | 1,687,706 |
| Freddie Mac, 3.329%, 5/25/2025 | | | 2,660,000 | 2,969,254 |
| Freddie Mac, 3.01%, 7/25/2025 | | | 423,000 | 466,776 |
| Freddie Mac, 3.151%, 11/25/2025 | | | 1,001,000 | 1,114,616 |
| Freddie Mac, 3.413%, 12/25/2026 | | | 780,000 | 894,500 |
| Freddie Mac, 3.43%, 1/25/2027 | | | 764,912 | 878,277 |
| Freddie Mac, 0.773%, 6/25/2027 (i) | | | 13,682,000 | 579,758 |
| Freddie Mac, 0.889%, 6/25/2027 (i) | | | 4,693,602 | 208,412 |
| Freddie Mac, 3.117%, 6/25/2027 | | | 1,114,000 | 1,264,589 |
| Freddie Mac, 0.712%, 7/25/2027 (i) | | | 12,073,061 | 436,307 |
| Freddie Mac, 0.461%, 8/25/2027 (i) | | | 9,650,000 | 229,660 |
| Freddie Mac, 0.565%, 8/25/2027 (i) | | | 6,718,054 | 184,953 |
| Freddie Mac, 3.244%, 8/25/2027 | | | 786,000 | 901,689 |
| Freddie Mac, 0.406%, 9/25/2027 (i) | | | 10,419,000 | 216,174 |
| Issuer | | | Shares/Par | Value ($) |
| Bonds – continued |
| Mortgage-Backed – continued | |
| Freddie Mac, 0.491%, 9/25/2027 (i) | | $ | 8,526,747 | $ 205,777 |
| Freddie Mac, 3.187%, 9/25/2027 | | | 754,000 | 862,314 |
| Freddie Mac, 0.325%, 11/25/2027 (i) | | | 16,290,000 | 251,107 |
| Freddie Mac, 0.418%, 11/25/2027 (i) | | | 11,656,162 | 223,503 |
| Freddie Mac, 0.456%, 11/25/2027 (i) | | | 10,455,525 | 234,279 |
| Freddie Mac, 0.371%, 12/25/2027 (i) | | | 10,109,000 | 191,766 |
| Freddie Mac, 0.413%, 12/25/2027 (i) | | | 11,210,000 | 250,818 |
| Freddie Mac, 0.494%, 12/25/2027 (i) | | | 17,863,998 | 439,758 |
| Freddie Mac, 3.65%, 2/25/2028 | | | 904,000 | 1,063,746 |
| Freddie Mac, 3.9%, 4/25/2028 | | | 1,667,000 | 1,996,336 |
| Freddie Mac, 1.218%, 7/25/2029 (i) | | | 830,125 | 70,158 |
| Freddie Mac, 1.269%, 8/25/2029 (i) | | | 5,231,577 | 462,382 |
| Freddie Mac, 0.757%, 11/25/2029 (i) | | | 12,162,798 | 631,998 |
| Freddie Mac, 1.868%, 4/25/2030 (i) | | | 1,219,861 | 199,627 |
| Freddie Mac, 0.444%, 11/25/2032 (i) | | | 8,864,552 | 250,476 |
| Freddie Mac, 6.5%, 5/01/2034 - 7/01/2037 | | | 813,146 | 925,971 |
| Freddie Mac, 5.5%, 2/15/2036 (i) | | | 105,310 | 20,806 |
| Freddie Mac, 4%, 8/01/2037 - 8/01/2047 | | | 9,258,194 | 10,037,764 |
| Freddie Mac, 3.5%, 11/01/2037 - 10/25/2058 | | | 20,697,729 | 22,314,850 |
| Freddie Mac, 3%, 1/01/2038 - 2/25/2059 | | | 20,883,425 | 22,493,343 |
| Freddie Mac, 4.5%, 12/15/2040 (i) | | | 114,931 | 11,007 |
| Freddie Mac, 4%, 8/15/2044 (i) | | | 128,149 | 15,786 |
| Ginnie Mae, 2.5%, 7/20/2032 | | | 350,000 | 372,285 |
| Ginnie Mae, 6%, 9/15/2032 - 1/15/2038 | | | 1,925,261 | 2,247,333 |
| Ginnie Mae, 5.5%, 5/15/2033 - 10/15/2035 | | | 1,115,920 | 1,297,020 |
| Ginnie Mae, 4.5%, 7/20/2033 - 9/20/2041 | | | 2,782,953 | 3,121,628 |
| Ginnie Mae, 5%, 7/20/2033 - 12/15/2034 | | | 373,438 | 426,487 |
| Ginnie Mae, 4%, 1/20/2041 - 2/20/2042 | | | 3,168,803 | 3,497,091 |
| Ginnie Mae, 3.5%, 12/15/2041 - 12/20/2049 | | | 14,724,892 | 15,756,043 |
| Ginnie Mae, 3%, 4/20/2045 - 2/20/2048 | | | 17,287,897 | 18,351,398 |
| Ginnie Mae, 0.659%, 2/16/2059 (i) | | | 6,865,370 | 359,471 |
| Ginnie Mae, TBA, 2.5%, 7/21/2050 | | | 2,750,000 | 2,894,805 |
| Ginnie Mae, TBA, 3%, 7/21/2050 | | | 75,000 | 79,462 |
| | | | | $298,244,177 |
| Municipals – 0.4% |
| New Jersey Economic Development Authority State Pension Funding Rev., “A”, 7.425%, 2/15/2029 | | $ | 2,750,000 | $ 3,323,100 |
| New Jersey Turnpike Authority Rev. (Build America Bonds), “F”, 7.414%, 1/01/2040 | | | 3,685,000 | 6,244,859 |
| | | | | $9,567,959 |
| Natural Gas - Distribution – 0.0% |
| NiSource, Inc., 5.65%, 2/01/2045 | | $ | 554,000 | $ 751,525 |
Portfolio of Investments (unaudited) – continued
| Issuer | | | Shares/Par | Value ($) |
| Bonds – continued |
| Natural Gas - Pipeline – 0.2% |
| APT Pipelines Ltd., 4.2%, 3/23/2025 (n) | | $ | 3,780,000 | $ 4,144,152 |
| APT Pipelines Ltd., 4.25%, 7/15/2027 (n) | | | 280,000 | 312,577 |
| | | | | $4,456,729 |
| Network & Telecom – 0.4% |
| AT&T, Inc., 5.45%, 3/01/2047 | | $ | 1,601,000 | $ 2,094,944 |
| Verizon Communications, Inc., 4.272%, 1/15/2036 | | | 2,164,000 | 2,676,195 |
| Verizon Communications, Inc., 4.812%, 3/15/2039 | | | 2,616,000 | 3,417,220 |
| | | | | $8,188,359 |
| Oils – 0.4% |
| Marathon Petroleum Corp., 4.75%, 9/15/2044 | | $ | 1,264,000 | $ 1,317,667 |
| Phillips 66 Co., 2.15%, 12/15/2030 | | | 3,897,000 | 3,782,838 |
| Valero Energy Corp., 4.9%, 3/15/2045 | | | 2,669,000 | 3,116,506 |
| | | | | $8,217,011 |
| Other Banks & Diversified Financials – 0.6% |
| Banco de Credito del Peru, 5.375%, 9/16/2020 | | $ | 2,967,000 | $ 2,991,685 |
| BBVA Bancomer S.A. de C.V., 6.75%, 9/30/2022 (n) | | | 2,890,000 | 3,080,451 |
| Branch Banking & Trust Co., 2.25%, 3/11/2030 | | | 2,707,000 | 2,732,337 |
| Capital One Financial Corp., 3.75%, 3/09/2027 | | | 1,956,000 | 2,160,094 |
| Citigroup, Inc., 2.666% to 1/29/2030, FLR (SOFR + 1.146%) to 1/29/2031 | | | 3,245,000 | 3,369,123 |
| | | | | $14,333,690 |
| Pollution Control – 0.1% |
| Republic Services, Inc., 3.95%, 5/15/2028 | | $ | 1,412,000 | $ 1,648,920 |
| Real Estate - Other – 0.0% |
| Prologis, Inc., REIT, 2.25%, 4/15/2030 | | $ | 816,000 | $ 859,245 |
| Real Estate - Retail – 0.1% |
| Brixmor Operating Partnership LP, REIT, 4.05%, 7/01/2030 | | $ | 1,424,000 | $ 1,456,415 |
| VEREIT Operating Partnership LP, REIT, 3.1%, 12/15/2029 | | | 1,759,000 | 1,695,331 |
| | | | | $3,151,746 |
| Retailers – 0.4% |
| Best Buy Co., Inc., 4.45%, 10/01/2028 | | $ | 2,306,000 | $ 2,675,516 |
| Costco Wholesale Corp., 1.75%, 4/20/2032 | | | 2,168,000 | 2,196,756 |
| Home Depot, Inc., 3.9%, 6/15/2047 | | | 1,262,000 | 1,534,161 |
| Target Corp., 2.25%, 4/15/2025 | | | 3,248,000 | 3,473,768 |
| | | | | $9,880,201 |
| Issuer | | | Shares/Par | Value ($) |
| Bonds – continued |
| Specialty Stores – 0.1% |
| TJX Cos., Inc., 3.75%, 4/15/2027 | | $ | 433,000 | $ 494,526 |
| TJX Cos., Inc., 3.875%, 4/15/2030 | | | 519,000 | 609,921 |
| TJX Cos., Inc., 4.5%, 4/15/2050 | | | 367,000 | 471,604 |
| | | | | $1,576,051 |
| Telecommunications - Wireless – 0.6% |
| American Tower Corp., REIT, 3%, 6/15/2023 | | $ | 1,065,000 | $ 1,135,577 |
| American Tower Corp., REIT, 3.6%, 1/15/2028 | | | 1,291,000 | 1,440,352 |
| American Tower Corp., REIT, 3.1%, 6/15/2050 | | | 1,779,000 | 1,759,668 |
| American Tower Trust I, REIT, 3.07%, 3/15/2023 (n) | | | 3,240,000 | 3,314,803 |
| Crown Castle International Corp., 1.35%, 7/15/2025 | | | 798,000 | 803,687 |
| Crown Castle International Corp., 3.65%, 9/01/2027 | | | 2,901,000 | 3,241,950 |
| T-Mobile USA, Inc., 2.05%, 2/15/2028 (n) | | | 1,801,000 | 1,801,846 |
| T-Mobile USA, Inc., 4.5%, 4/15/2050 (n) | | | 223,000 | 265,421 |
| | | | | $13,763,304 |
| Telephone Services – 0.1% |
| Deutsche Telekom AG, 3.625%, 1/21/2050 (n) | | $ | 1,281,000 | $ 1,409,681 |
| Tobacco – 0.1% |
| B.A.T Capital Corp., 4.7%, 4/02/2027 | | $ | 433,000 | $ 494,892 |
| B.A.T Capital Corp., 4.906%, 4/02/2030 | | | 1,199,000 | 1,402,255 |
| | | | | $1,897,147 |
| Transportation - Services – 0.1% |
| ERAC USA Finance LLC, 7%, 10/15/2037 (n) | | $ | 2,064,000 | $ 2,644,078 |
| U.S. Government Agencies and Equivalents – 0.0% |
| Small Business Administration, 4.35%, 7/01/2023 | | $ | 1,285 | $ 1,332 |
| Small Business Administration, 4.77%, 4/01/2024 | | | 82,448 | 86,433 |
| Small Business Administration, 5.18%, 5/01/2024 | | | 127,838 | 135,544 |
| Small Business Administration, 5.52%, 6/01/2024 | | | 6,832 | 7,275 |
| Small Business Administration, 4.99%, 9/01/2024 | | | 147,367 | 154,920 |
| Small Business Administration, 4.95%, 3/01/2025 | | | 5,080 | 5,347 |
| Small Business Administration, 5.11%, 8/01/2025 | | | 468,842 | 499,352 |
| | | | | $890,203 |
| U.S. Treasury Obligations – 6.0% |
| U.S. Treasury Bonds, 8%, 11/15/2021 | | $ | 723,000 | $ 800,722 |
| U.S. Treasury Bonds, 6%, 2/15/2026 | | | 777,000 | 1,021,027 |
| U.S. Treasury Bonds, 2.875%, 5/15/2043 | | | 9,096,000 | 11,882,716 |
Portfolio of Investments (unaudited) – continued
| Issuer | | | Shares/Par | Value ($) |
| Bonds – continued |
| U.S. Treasury Obligations – continued |
| U.S. Treasury Bonds, 2.5%, 2/15/2045 | | $ | 9,797,000 | $ 12,084,752 |
| U.S. Treasury Bonds, 3%, 11/15/2045 | | | 3,638,000 | 4,903,626 |
| U.S. Treasury Bonds, 3%, 2/15/2048 | | | 8,760,000 | 11,991,961 |
| U.S. Treasury Bonds, 2.875%, 5/15/2049 | | | 900,000 | 1,217,602 |
| U.S. Treasury Bonds, 2.375%, 11/15/2049 | | | 11,750,000 | 14,513,086 |
| U.S. Treasury Notes, 1.75%, 11/30/2021 | | | 29,605,000 | 30,265,330 |
| U.S. Treasury Notes, 1.375%, 1/31/2022 | | | 27,500,000 | 28,019,922 |
| U.S. Treasury Notes, 1.75%, 9/30/2022 | | | 23,068,000 | 23,885,292 |
| | | | | $140,586,036 |
| Utilities - Electric Power – 1.2% |
| Berkshire Hathaway Energy Co., 3.75%, 11/15/2023 | | $ | 1,930,000 | $ 2,121,131 |
| Berkshire Hathaway Energy Co., 4.25%, 10/15/2050 (n) | | | 296,000 | 372,749 |
| Duke Energy Corp., 2.65%, 9/01/2026 | | | 397,000 | 430,728 |
| Enel Finance International N.V., 2.65%, 9/10/2024 | | | 1,020,000 | 1,065,457 |
| Enel Finance International N.V., 4.875%, 6/14/2029 (n) | | | 1,916,000 | 2,263,177 |
| Enel Finance International N.V., 4.75%, 5/25/2047 (n) | | | 392,000 | 467,776 |
| Evergy, Inc., 2.9%, 9/15/2029 | | | 1,863,000 | 1,989,151 |
| Exelon Corp., 4.05%, 4/15/2030 | | | 2,165,000 | 2,499,927 |
| FirstEnergy Corp., 3.4%, 3/01/2050 | | | 1,229,000 | 1,297,722 |
| Georgia Power Co., 3.7%, 1/30/2050 | | | 171,000 | 188,987 |
| Jersey Central Power & Light Co., 4.3%, 1/15/2026 (n) | | | 1,511,000 | 1,747,159 |
| Northern States Power Co., 2.6%, 6/01/2051 | | | 2,166,000 | 2,203,885 |
| Oncor Electric Delivery Co. LLC, 5.75%, 3/15/2029 | | | 2,810,000 | 3,683,785 |
| Pacific Gas & Electric Co., 2.1%, 8/01/2027 | | | 549,000 | 543,318 |
| Pacific Gas & Electric Co., 3.3%, 8/01/2040 | | | 1,053,000 | 1,026,317 |
| PPL Capital Funding, Inc., 5%, 3/15/2044 | | | 870,000 | 1,027,321 |
| Issuer | | | Shares/Par | Value ($) |
| Bonds – continued |
| Utilities - Electric Power – continued |
| PPL Corp., 3.4%, 6/01/2023 | | $ | 2,940,000 | $ 3,112,895 |
| Xcel Energy, Inc., 3.4%, 6/01/2030 | | | 1,099,000 | 1,262,699 |
| Xcel Energy, Inc., 3.5%, 12/01/2049 | | | 1,310,000 | 1,450,421 |
| | | | | $28,754,605 |
| Utilities - Gas – 0.1% |
| East Ohio Gas Co., 2%, 6/15/2030 (n) | | $ | 1,509,000 | $ 1,507,503 |
| Total Bonds (Identified Cost, $873,573,720) | | $ 938,486,475 |
| Convertible Preferred Stocks – 1.0% |
| Automotive – 0.2% | |
| Aptiv PLC, 5.5% | | 39,000 | $ 4,008,420 |
| Medical Equipment – 0.3% | |
| Boston Scientific Corp., 5.5% | | 58,483 | $ 6,122,585 |
| Danaher Corp., 4.75% | | 1,324 | 1,650,856 |
| | | | | $7,773,441 |
| Telecommunications - Wireless – 0.2% | |
| T-Mobile USA, Inc., 5.25% (a) | | 5,432 | $ 5,554,492 |
| Utilities - Electric Power – 0.3% | |
| CenterPoint Energy, Inc., 7% | | 162,120 | $ 5,764,987 |
| Total Convertible Preferred Stocks (Identified Cost, $24,803,342) | $ 23,101,340 |
| Preferred Stocks – 0.2% |
| Electronics – 0.2% | | | | |
| Samsung Electronics Co. Ltd. (Identified Cost, $5,022,479) | | 132,192 | $ 5,162,387 |
| Investment Companies (h) – 2.4% |
| Money Market Funds – 2.4% | |
| MFS Institutional Money Market Portfolio, 0.17% (v) (Identified Cost, $56,231,318) | | | 56,225,695 | $ 56,231,318 |
| Other Assets, Less Liabilities – (1.7)% | | (40,753,875) |
| Net Assets – 100.0% | $ 2,329,393,314 |
| (a) | Non-income producing security. | | | |
| (h) | An affiliated issuer, which may be considered one in which the fund owns 5% or more of the outstanding voting securities, or a company which is under common control. At period end, the aggregate values of the fund's investments in affiliated issuers and in unaffiliated issuers were $56,231,318 and $2,313,915,871, respectively. | | | |
| (i) | Interest only security for which the fund receives interest on notional principal (Par amount). Par amount shown is the notional principal and does not reflect the cost of the security. | | | |
| (n) | Securities exempt from registration under Rule 144A of the Securities Act of 1933. These securities may be sold in the ordinary course of business in transactions exempt from registration, normally to qualified institutional buyers. At period end, the aggregate value of these securities was $135,223,175, representing 5.8% of net assets. | | | |
| (v) | Affiliated issuer that is available only to investment companies managed by MFS. The rate quoted for the MFS Institutional Money Market Portfolio is the annualized seven-day yield of the fund at period end. | | | |
Portfolio of Investments (unaudited) – continued
| The following abbreviations are used in this report and are defined: |
| ADR | American Depositary Receipt |
| CLO | Collateralized Loan Obligation |
| FLR | Floating Rate. Interest rate resets periodically based on the parenthetically disclosed reference rate plus a spread (if any). The period-end rate reported may not be the current rate. All reference rates are USD unless otherwise noted. |
| LIBOR | London Interbank Offered Rate |
| REIT | Real Estate Investment Trust |
| SOFR | Secured Overnight Financing Rate |
| TBA | To Be Announced |
See Notes to Financial Statements
| Financial Statements | Statement of Assets and Liabilities (unaudited) |
This statement represents your fund’s balance sheet, which details the assets and liabilities comprising the total value of the fund.
| At 6/30/20Assets | |
| Investments in unaffiliated issuers, at value (identified cost, $1,864,129,233) | $2,313,915,871 |
| Investments in affiliated issuers, at value (identified cost, $56,231,318) | 56,231,318 |
| Cash | 28,571 |
| Receivables for | |
| Investments sold | 1,306,506 |
| TBA sale commitments | 21,493,887 |
| Fund shares sold | 136,051 |
| Interest and dividends | 7,976,958 |
| Receivable from investment adviser | 105,916 |
| Other assets | 4,965 |
| Total assets | $2,401,200,043 |
| Liabilities | |
| Payables for | |
| Investments purchased | $1,174,415 |
| TBA purchase commitments | 68,708,297 |
| Fund shares reacquired | 1,635,928 |
| Payable to affiliates | |
| Administrative services fee | 1,810 |
| Shareholder servicing costs | 1,474 |
| Distribution and/or service fees | 16,382 |
| Accrued expenses and other liabilities | 268,423 |
| Total liabilities | $71,806,729 |
| Net assets | $2,329,393,314 |
| Net assets consist of | |
| Paid-in capital | $1,688,865,080 |
| Total distributable earnings (loss) | 640,528,234 |
| Net assets | $2,329,393,314 |
| Shares of beneficial interest outstanding | 98,427,706 |
| | Net assets | Shares
outstanding | Net asset value
per share |
| Initial Class | $1,116,940,552 | 46,690,807 | $23.92 |
| Service Class | 1,212,452,762 | 51,736,899 | 23.43 |
See Notes to Financial Statements
| Financial Statements | Statement of Operations (unaudited) |
This statement describes how much your fund earned in investment income and accrued in expenses. It also describes any gains and/or losses generated by fund operations.
| Six months ended 6/30/20 | |
| Net investment income (loss) | |
| Income | |
| Dividends | $19,335,641 |
| Interest | 13,709,988 |
| Dividends from affiliated issuers | 158,313 |
| Income on securities loaned | 108,072 |
| Other | 51,794 |
| Foreign taxes withheld | (244,024) |
| Total investment income | $33,119,784 |
| Expenses | |
| Management fee | $7,828,390 |
| Distribution and/or service fees | 1,518,331 |
| Shareholder servicing costs | 26,528 |
| Administrative services fee | 164,437 |
| Independent Trustees' compensation | 20,123 |
| Custodian fee | 67,472 |
| Shareholder communications | 67,450 |
| Audit and tax fees | 39,233 |
| Legal fees | 11,203 |
| Miscellaneous | 39,924 |
| Total expenses | $9,783,091 |
| Reduction of expenses by investment adviser | (1,136,921) |
| Net expenses | $8,646,170 |
| Net investment income (loss) | $24,473,614 |
| Realized and unrealized gain (loss) | |
| Realized gain (loss) (identified cost basis) | |
| Unaffiliated issuers | $63,358,889 |
| Affiliated issuers | 5,182 |
| Foreign currency | (86,922) |
| Net realized gain (loss) | $63,277,149 |
| Change in unrealized appreciation or depreciation | |
| Unaffiliated issuers | $(192,224,287) |
| Affiliated issuers | (837) |
| Translation of assets and liabilities in foreign currencies | 7,142 |
| Net unrealized gain (loss) | $(192,217,982) |
| Net realized and unrealized gain (loss) | $(128,940,833) |
| Change in net assets from operations | $(104,467,219) |
See Notes to Financial Statements
| Financial Statements | Statements of Changes in Net Assets |
These statements describe the increases and/or decreases in net assets resulting from operations, any distributions, and any shareholder transactions.
| | Six months ended | Year ended |
| | 6/30/20
(unaudited) | 12/31/19 |
| Change in net assets | | |
| From operations | | |
| Net investment income (loss) | $24,473,614 | $50,698,568 |
| Net realized gain (loss) | 63,277,149 | 66,327,737 |
| Net unrealized gain (loss) | (192,217,982) | 335,264,447 |
| Change in net assets from operations | $(104,467,219) | $452,290,752 |
| Total distributions to shareholders | $— | $(121,022,024) |
| Change in net assets from fund share transactions | $(113,119,013) | $(109,812,128) |
| Total change in net assets | $(217,586,232) | $221,456,600 |
| Net assets | | |
| At beginning of period | 2,546,979,546 | 2,325,522,946 |
| At end of period | $2,329,393,314 | $2,546,979,546 |
See Notes to Financial Statements
| Financial Statements | Financial Highlights |
The financial highlights table is intended to help you understand the fund's financial performance for the semiannual period and the past 5 fiscal years. Certain information reflects financial results for a single fund share. The total returns in the table represent the rate that an investor would have earned (or lost) on an investment in the fund share class (assuming reinvestment of all distributions) held for the entire period.
| Initial Class | Six months
ended | Year ended |
| | 6/30/20
(unaudited) | 12/31/19 | 12/31/18 | 12/31/17 | 12/31/16 | 12/31/15 |
| Net asset value, beginning of period | $24.90 | $21.78 | $24.70 | $23.18 | $22.60 | $24.31 |
| Income (loss) from investment operations | | | | | | |
| Net investment income (loss) (d) | $0.26 | $0.52 | $0.53 | $0.49 | $0.54(c) | $0.62 |
| Net realized and unrealized gain (loss) | (1.24) | 3.83 | (1.80) | 2.29 | 1.51 | (0.77) |
| Total from investment operations | $(0.98) | $4.35 | $(1.27) | $2.78 | $2.05 | $(0.15) |
| Less distributions declared to shareholders | | | | | | |
| From net investment income | $— | $(0.58) | $(0.54) | $(0.58) | $(0.69) | $(0.64) |
| From net realized gain | — | (0.65) | (1.11) | (0.68) | (0.78) | (0.92) |
| Total distributions declared to shareholders | $— | $(1.23) | $(1.65) | $(1.26) | $(1.47) | $(1.56) |
| Net asset value, end of period (x) | $23.92 | $24.90 | $21.78 | $24.70 | $23.18 | $22.60 |
| Total return (%) (k)(r)(s)(x) | (3.94)(n) | 20.38 | (5.61) | 12.30 | 9.09(c) | (0.37) |
Ratios (%) (to average net assets)
and Supplemental data: | | | | | | |
| Expenses before expense reductions (f) | 0.71(a) | 0.70 | 0.70 | 0.71 | 0.71(c) | 0.79 |
| Expenses after expense reductions (f) | 0.61(a) | 0.62 | 0.62 | 0.63 | 0.62(c) | 0.65 |
| Net investment income (loss) | 2.23(a) | 2.18 | 2.20 | 2.04 | 2.33(c) | 2.57 |
| Portfolio turnover | 50(n) | 42 | 26 | 34 | 35 | 41 |
| Net assets at end of period (000 omitted) | $1,116,941 | $1,223,166 | $1,134,301 | $1,350,737 | $1,359,943 | $1,423,284 |
See Notes to Financial Statements
Financial Highlights - continued
| Service Class | Six months
ended | Year ended |
| | 6/30/20
(unaudited) | 12/31/19 | 12/31/18 | 12/31/17 | 12/31/16 | 12/31/15 |
| Net asset value, beginning of period | $24.43 | $21.38 | $24.28 | $22.81 | $22.26 | $23.95 |
| Income (loss) from investment operations | | | | | | |
| Net investment income (loss) (d) | $0.23 | $0.45 | $0.46 | $0.43 | $0.47(c) | $0.55 |
| Net realized and unrealized gain (loss) | (1.23) | 3.76 | (1.77) | 2.25 | 1.49 | (0.74) |
| Total from investment operations | $(1.00) | $4.21 | $(1.31) | $2.68 | $1.96 | $(0.19) |
| Less distributions declared to shareholders | | | | | | |
| From net investment income | $— | $(0.51) | $(0.48) | $(0.53) | $(0.63) | $(0.58) |
| From net realized gain | — | (0.65) | (1.11) | (0.68) | (0.78) | (0.92) |
| Total distributions declared to shareholders | $— | $(1.16) | $(1.59) | $(1.21) | $(1.41) | $(1.50) |
| Net asset value, end of period (x) | $23.43 | $24.43 | $21.38 | $24.28 | $22.81 | $22.26 |
| Total return (%) (k)(r)(s)(x) | (4.09)(n) | 20.12 | (5.87) | 12.02 | 8.81(c) | (0.58) |
Ratios (%) (to average net assets)
and Supplemental data: | | | | | | |
| Expenses before expense reductions (f) | 0.96(a) | 0.95 | 0.95 | 0.96 | 0.96(c) | 1.04 |
| Expenses after expense reductions (f) | 0.86(a) | 0.87 | 0.87 | 0.88 | 0.87(c) | 0.90 |
| Net investment income (loss) | 1.98(a) | 1.93 | 1.95 | 1.79 | 2.08(c) | 2.32 |
| Portfolio turnover | 50(n) | 42 | 26 | 34 | 35 | 41 |
| Net assets at end of period (000 omitted) | $1,212,453 | $1,323,813 | $1,191,222 | $1,427,824 | $1,276,603 | $1,191,583 |
| (a) | Annualized. |
| (c) | Amount reflects a one-time reimbursement of expenses by the custodian (or former custodian) without which net investment income and performance would be lower and expenses would be higher. |
| (d) | Per share data is based on average shares outstanding. |
| (f) | Ratios do not reflect reductions from fees paid indirectly, if applicable. |
| (k) | The total return does not reflect expenses that apply to separate accounts. Inclusion of these charges would reduce the total return figures for all periods shown. |
| (n) | Not annualized. |
| (r) | Certain expenses have been reduced without which performance would have been lower. |
| (s) | From time to time the fund may receive proceeds from litigation settlements, without which performance would be lower. |
| (x) | The net asset values and total returns have been calculated on net assets which include adjustments made in accordance with U.S. generally accepted accounting principles required at period end for financial reporting purposes. |
See Notes to Financial Statements
Notes to Financial Statements (unaudited)
(1) Business and Organization
MFS Total Return Series (the fund) is a diversified series of MFS Variable Insurance Trust (the trust). The trust is organized as a Massachusetts business trust and is registered under the Investment Company Act of 1940, as amended, as an open-end management investment company. The shareholders of each series of the trust are separate accounts of insurance companies, which offer variable annuity and/or life insurance products, and qualified retirement and pension plans.
The fund is an investment company and accordingly follows the investment company accounting and reporting guidance of the Financial Accounting Standards Board (FASB) Accounting Standards Codification Topic 946 Financial Services - Investment Companies.
(2) Significant Accounting Policies
General — The preparation of financial statements in conformity with U.S. generally accepted accounting principles requires management to make estimates and assumptions that affect the reported amounts of assets and liabilities, and disclosure of contingent assets and liabilities at the date of the financial statements and the reported amounts of increases and decreases in net assets from operations during the reporting period. Actual results could differ from those estimates. In the preparation of these financial statements, management has evaluated subsequent events occurring after the date of the fund’s Statement of Assets and Liabilities through the date that the financial statements were issued.
In March 2020, the FASB issued Accounting Standards Update 2020-04, Reference Rate Reform (Topic 848) – Facilitation of the Effects of Reference Rate Reform on Financial Reporting (“ASU 2020-04”), which provides optional, temporary relief with respect to the financial reporting of contracts subject to certain types of modifications due to the planned discontinuation of the London Interbank Offered Rate (LIBOR) and other IBOR-based reference rates as of the end of 2021. The temporary relief provided by ASU 2020-04 is effective for certain reference rate-related contract modifications that occur during the period from March 12, 2020 through December 31, 2022. Management is evaluating the impact of ASU 2020-04 on the fund's investments, derivatives, debt and other contracts that will undergo reference rate-related modifications as a result of the reference rate reform.
Balance Sheet Offsetting — The fund's accounting policy with respect to balance sheet offsetting is that, absent an event of default by the counterparty or a termination of the agreement, the International Swaps and Derivatives Association (ISDA) Master Agreement, or similar agreement, does not result in an offset of reported amounts of financial assets and financial liabilities in the Statement of Assets and Liabilities across transactions between the fund and the applicable counterparty. The fund's right to setoff may be restricted or prohibited by the bankruptcy or insolvency laws of the particular jurisdiction to which a specific master netting agreement counterparty is subject. Balance sheet offsetting disclosures, to the extent applicable to the fund, have been included in the fund’s Significant Accounting Policies note under the captions for each of the fund’s in-scope financial instruments and transactions.
Investment Valuations — Equity securities, including restricted equity securities, are generally valued at the last sale or official closing price on their primary market or exchange as provided by a third-party pricing service. Equity securities, for which there were no sales reported that day, are generally valued at the last quoted daily bid quotation on their primary market or exchange as provided by a third-party pricing service. Debt instruments and floating rate loans, including restricted debt instruments, are generally valued at an evaluated or composite bid as provided by a third-party pricing service. Debt instruments sold short are generally valued at an evaluated or composite mean as provided by a third-party pricing service. Short-term instruments with a maturity at issuance of 60 days or less may be valued at amortized cost, which approximates market value. Open-end investment companies are generally valued at net asset value per share. Securities and other assets generally valued on the basis of information from a third-party pricing service may also be valued at a broker/dealer bid quotation. In determining values, third-party pricing services can utilize both transaction data and market information such as yield, quality, coupon rate, maturity, type of issue, trading characteristics, and other market data. The values of foreign securities and other assets and liabilities expressed in foreign currencies are converted to U.S. dollars using the mean of bid and asked prices for rates provided by a third-party pricing service.
The Board of Trustees has delegated primary responsibility for determining or causing to be determined the value of the fund’s investments (including any fair valuation) to the adviser pursuant to valuation policies and procedures approved by the Board. If the adviser determines that reliable market quotations are not readily available, investments are valued at fair value as determined in good faith by the adviser in accordance with such procedures under the oversight of the Board of Trustees. Under the fund’s valuation policies and procedures, market quotations are not considered to be readily available for most types of debt instruments and floating rate loans and many types of derivatives. These investments are generally valued at fair value based on information from third-party pricing services. In addition, investments may be valued at fair value if the adviser determines that an investment’s value has been materially affected by events occurring after the close of the exchange or market on which the investment is principally traded (such as foreign exchange or market) and prior to the determination of the fund’s net asset value, or after the halt of trading of a specific security where trading does not resume prior to the close of the exchange or market on which the security is principally
Notes to Financial Statements (unaudited) - continued
traded. Events that occur after foreign markets close (such as developments in foreign markets and significant movements in the U.S. markets) and prior to the determination of the fund’s net asset value may be deemed to have a material effect on the value of securities traded in foreign markets. Accordingly, the fund’s foreign equity securities may often be valued at fair value. The adviser generally relies on third-party pricing services or other information (such as the correlation with price movements of similar securities in the same or other markets; the type, cost and investment characteristics of the security; the business and financial condition of the issuer; and trading and other market data) to assist in determining whether to fair value and at what value to fair value an investment. The value of an investment for purposes of calculating the fund’s net asset value can differ depending on the source and method used to determine value. When fair valuation is used, the value of an investment used to determine the fund’s net asset value may differ from quoted or published prices for the same investment. There can be no assurance that the fund could obtain the fair value assigned to an investment if it were to sell the investment at the same time at which the fund determines its net asset value per share.
Various inputs are used in determining the value of the fund's assets or liabilities. These inputs are categorized into three broad levels. In certain cases, the inputs used to measure fair value may fall into different levels of the fair value hierarchy. In such cases, an investment's level within the fair value hierarchy is based on the lowest level of input that is significant to the fair value measurement. The fund's assessment of the significance of a particular input to the fair value measurement in its entirety requires judgment, and considers factors specific to the investment. Level 1 includes unadjusted quoted prices in active markets for identical assets or liabilities. Level 2 includes other significant observable market-based inputs (including quoted prices for similar securities, interest rates, prepayment speed, and credit risk). Level 3 includes unobservable inputs, which may include the adviser's own assumptions in determining the fair value of investments. The following is a summary of the levels used as of June 30, 2020 in valuing the fund's assets or liabilities:
| Financial Instruments | Level 1 | Level 2 | Level 3 | Total |
| Equity Securities: | | | | |
| United States | $1,276,738,683 | $5,554,492 | $— | $1,282,293,175 |
| Switzerland | 28,602,565 | — | — | 28,602,565 |
| United Kingdom | 19,307,002 | — | — | 19,307,002 |
| Taiwan | 12,622,242 | — | — | 12,622,242 |
| Netherlands | 8,458,917 | — | — | 8,458,917 |
| France | 8,426,706 | — | — | 8,426,706 |
| Germany | — | 6,132,019 | — | 6,132,019 |
| South Korea | — | 5,162,387 | — | 5,162,387 |
| Canada | 4,424,383 | — | — | 4,424,383 |
| U.S. Treasury Bonds & U.S. Government Agencies & Equivalents | — | 141,476,239 | — | 141,476,239 |
| Non - U.S. Sovereign Debt | — | 6,677,888 | — | 6,677,888 |
| Municipal Bonds | — | 9,567,959 | — | 9,567,959 |
| U.S. Corporate Bonds | — | 308,790,761 | — | 308,790,761 |
| Residential Mortgage-Backed Securities | — | 298,893,661 | — | 298,893,661 |
| Commercial Mortgage-Backed Securities | — | 65,051,516 | — | 65,051,516 |
| Asset-Backed Securities (including CDOs) | — | 50,539,198 | — | 50,539,198 |
| Foreign Bonds | — | 57,489,253 | — | 57,489,253 |
| Mutual Funds | 56,231,318 | — | — | 56,231,318 |
| Total | $1,414,811,816 | $955,335,373 | $— | $2,370,147,189 |
For further information regarding security characteristics, see the Portfolio of Investments.
Foreign Currency Translation — Purchases and sales of foreign investments, income, and expenses are converted into U.S. dollars based upon currency exchange rates prevailing on the respective dates of such transactions or on the reporting date for foreign denominated receivables and payables. Gains and losses attributable to foreign currency exchange rates on sales of securities are recorded for financial statement purposes as net realized gains and losses on investments. Gains and losses attributable to foreign exchange rate movements on receivables, payables, income and expenses are recorded for financial statement purposes as foreign currency transaction gains and losses. That portion of both realized and unrealized gains and losses on investments that results from fluctuations in foreign currency exchange rates is not separately disclosed.
Security Loans — Under its Securities Lending Agency Agreement with the fund, State Street Bank and Trust Company, as lending agent, loans the securities of the fund to certain qualified institutions (the “Borrowers”) approved by the fund. Security loans can be terminated at the discretion of either the lending agent or the fund and the related securities must be returned within the earlier of the standard trade settlement period for such securities or within three business days. The loans are collateralized by cash and/or U.S. Treasury and federal agency obligations in an amount typically at least equal to the market value of the securities loaned. On loans collateralized by cash, the cash collateral is invested in a money market fund. The market value of the loaned securities is
Notes to Financial Statements (unaudited) - continued
determined at the close of business of the fund and any additional required collateral is delivered to the fund on the next business day. The lending agent provides the fund with indemnification against Borrower default. In the event of Borrower default, the lending agent will, for the benefit of the fund, either purchase securities identical to those loaned or, when such purchase is commercially impracticable, pay the fund the market value of the loaned securities. In return, the lending agent assumes the fund's rights to the related collateral. If the collateral value is less than the cost to purchase identical securities, the lending agent is responsible for the shortfall, but only to the extent that such shortfall is not due to a decline in collateral value resulting from collateral reinvestment for which the fund bears the risk of loss. A portion of the income generated upon investment of the collateral is remitted to the Borrowers, and the remainder is allocated between the fund and the lending agent. On loans collateralized by U.S. Treasury and/or federal agency obligations, a fee is received from the Borrower, and is allocated between the fund and the lending agent. Income from securities lending is separately reported in the Statement of Operations. The dividend and interest income earned on the securities loaned is accounted for in the same manner as other dividend and interest income. At June 30, 2020, there were no securities on loan or collateral outstanding.
Indemnifications — Under the fund's organizational documents, its officers and Trustees may be indemnified against certain liabilities and expenses arising out of the performance of their duties to the fund. Additionally, in the normal course of business, the fund enters into agreements with service providers that may contain indemnification clauses. The fund's maximum exposure under these agreements is unknown as this would involve future claims that may be made against the fund that have not yet occurred.
Investment Transactions and Income — Investment transactions are recorded on the trade date. Some securities may be purchased or sold on an extended settlement basis, which means that the receipt or delivery of the securities by the fund and related payments occur at a future date, usually beyond the customary settlement period. Interest income is recorded on the accrual basis. All premium and discount is amortized or accreted for financial statement purposes in accordance with U.S. generally accepted accounting principles. Dividends received in cash are recorded on the ex-dividend date. Certain dividends from foreign securities will be recorded when the fund is informed of the dividend if such information is obtained subsequent to the ex-dividend date. Dividend and interest payments received in additional securities are recorded on the ex-dividend or ex-interest date in an amount equal to the value of the security on such date.
The fund may receive proceeds from litigation settlements. Any proceeds received from litigation involving portfolio holdings are reflected in the Statement of Operations in realized gain/loss if the security has been disposed of by the fund or in unrealized gain/loss if the security is still held by the fund. Any other proceeds from litigation not related to portfolio holdings are reflected as other income in the Statement of Operations.
The fund invests a significant portion of its assets in asset-backed and/or mortgage-backed securities. For these securities, the value of the debt instrument also depends on the credit quality and adequacy of the underlying assets or collateral as well as whether there is a security interest in the underlying assets or collateral. Enforcing rights, if any, against the underlying assets or collateral may be difficult. U.S. Government securities not supported as to the payment of principal or interest by the U.S. Treasury, such as those issued by Fannie Mae, Freddie Mac, and the Federal Home Loan Banks, are subject to greater credit risk than are U.S. Government securities supported by the U.S. Treasury, such as those issued by Ginnie Mae.
The fund may purchase or sell mortgage-backed securities on a “To Be Announced” (TBA) basis. A TBA transaction is subject to extended settlement and typically does not designate the actual security to be delivered, but instead includes an approximate principal amount. The price of the TBA security and the date that it will be settled are fixed at the time the transaction is negotiated. The value of the security varies with market fluctuations and no interest accrues to the fund until settlement takes place. TBA purchase and sale commitments are held at carrying amount, which approximates fair value and are categorized as level 2 within the fair value hierarchy and included in TBA purchase and TBA sale commitments in the Statement of Assets and Liabilities. Losses may arise as a result of changes in the value of the TBA investment prior to settlement date or due to counterparty non-performance. At the time that it enters into a TBA transaction, the fund is required to have sufficient cash and/or liquid securities to cover its commitments.
The fund may also enter into mortgage dollar rolls, typically TBA dollar rolls, in which the fund sells TBA mortgage-backed securities to financial institutions and simultaneously agrees to repurchase similar (same issuer, type and coupon) securities at a later date at an agreed-upon price. During the period between the sale and repurchase, the fund will not be entitled to receive interest and principal payments on the securities sold. The fund accounts for dollar roll transactions as purchases and sales and realizes gains and losses on these transactions. Dollar roll transactions involve the risk that the market value of the securities that the fund is required to purchase may decline below the agreed upon repurchase price of those securities.
To mitigate the counterparty credit risk on TBA transactions, mortgage dollar rolls, and other types of forward settling mortgage-backed and asset-backed security transactions, the fund whenever possible enters into a Master Securities Forward Transaction Agreement (“MSFTA”) on a bilateral basis with each of the counterparties with whom it undertakes a significant volume of transactions. The MSFTA gives each party to the agreement the right to terminate all transactions traded under such agreement if
Notes to Financial Statements (unaudited) - continued
there is a specified deterioration in the credit quality of the other party. Upon an event of default or a termination of the MSFTA, the non-defaulting party has the right to close out all transactions traded under such agreement and to net amounts owed under each transaction to one net amount payable by one party to the other. This right to close out and net payments across all transactions traded under the MSFTA could result in a reduction of the fund's credit risk to such counterparty equal to any amounts payable by the fund under the applicable transactions, if any.
For mortgage-backed and asset-backed securities traded under a MSFTA, the collateral and margining requirements are contract specific. Collateral amounts across all transactions traded under such agreement are netted and an amount is posted from one party to the other to collateralize such obligations. Cash that has been pledged to cover the fund's collateral or margin obligations under a MSFTA, if any, will be reported separately on the Statement of Assets and Liabilities as restricted cash. Securities pledged as collateral or margin for the same purpose, if any, are noted in the Portfolio of Investments.
Tax Matters and Distributions — The fund intends to qualify as a regulated investment company, as defined under Subchapter M of the Internal Revenue Code, and to distribute all of its taxable income, including realized capital gains. As a result, no provision for federal income tax is required. The fund’s federal tax returns, when filed, will remain subject to examination by the Internal Revenue Service for a three year period. Management has analyzed the fund’s tax positions taken on federal and state tax returns for all open tax years and does not believe that there are any uncertain tax positions that require recognition of a tax liability. Foreign taxes, if any, have been accrued by the fund in the accompanying financial statements in accordance with the applicable foreign tax law. Foreign income taxes may be withheld by certain countries in which the fund invests. Additionally, capital gains realized by the fund on securities issued in or by certain foreign countries may be subject to capital gains tax imposed by those countries.
Distributions to shareholders are recorded on the ex-dividend date. Income and capital gain distributions are determined in accordance with income tax regulations, which may differ from U.S. generally accepted accounting principles. Certain capital accounts in the financial statements are periodically adjusted for permanent differences in order to reflect their tax character. These adjustments have no impact on net assets or net asset value per share. Temporary differences which arise from recognizing certain items of income, expense, gain or loss in different periods for financial statement and tax purposes will reverse at some time in the future.
Book/tax differences primarily relate to amortization and accretion of debt securities, wash sale loss deferrals, and partnership adjustments.
The tax character of distributions declared to shareholders for the last fiscal year is as follows:
| | Year ended
12/31/19 |
| Ordinary income (including any short-term capital gains) | $54,824,164 |
| Long-term capital gains | 66,197,860 |
| Total distributions | $121,022,024 |
The federal tax cost and the tax basis components of distributable earnings were as follows:
| As of 6/30/20 | |
| Cost of investments | $1,934,100,847 |
| Gross appreciation | 475,680,769 |
| Gross depreciation | (39,634,427) |
| Net unrealized appreciation (depreciation) | $436,046,342 |
| As of 12/31/19 | |
| Undistributed ordinary income | 52,951,957 |
| Undistributed long-term capital gain | 63,475,232 |
| Other temporary differences | 3,083,411 |
| Net unrealized appreciation (depreciation) | 625,484,853 |
The aggregate cost above includes prior fiscal year end tax adjustments, if applicable.
Multiple Classes of Shares of Beneficial Interest — The fund offers multiple classes of shares, which differ in their respective distribution and/or service fees. The fund's income, realized and unrealized gain (loss), and common expenses are allocated to shareholders based on the daily net assets of each class. Dividends are declared separately for each class. Differences in per share dividend rates are generally due to differences in separate class expenses. The fund’s distributions declared to shareholders as reported in the Statements of Changes in Net Assets are presented by class as follows:
Notes to Financial Statements (unaudited) - continued
| | Six months
ended
6/30/20 | | Year
ended
12/31/19 |
| Initial Class | $— | | $59,383,887 |
| Service Class | — | | 61,638,137 |
| Total | $— | | $121,022,024 |
(3) Transactions with Affiliates
Investment Adviser — The fund has an investment advisory agreement with MFS to provide overall investment management and related administrative services and facilities to the fund. The management fee is computed daily and paid monthly at the following annual rates based on the fund's average daily net assets:
| Up to $1 billion | 0.70% |
| In excess of $1 billion and up to $2.5 billion | 0.65% |
| In excess of $2.5 billion and up to $5 billion | 0.55% |
| In excess of $5 billion | 0.50% |
MFS has agreed in writing to reduce its management fee by a specified amount if certain MFS mutual fund assets exceed thresholds agreed to by MFS and the fund's Board of Trustees. For the six months ended June 30, 2020, this management fee reduction amounted to $125,880, which is included in the reduction of total expenses in the Statement of Operations. The management fee incurred for the six months ended June 30, 2020 was equivalent to an annual effective rate of 0.66% of the fund's average daily net assets.
The investment adviser has agreed in writing to pay a portion of the fund’s total annual operating expenses, excluding interest, taxes, extraordinary expenses, brokerage and transaction costs, and investment-related expenses, such that total annual operating expenses do not exceed 0.61% of average daily net assets for the Initial Class shares and 0.86% of average daily net assets for the Service Class shares. This written agreement will continue until modified by the fund’s Board of Trustees, but such agreement will continue at least until April 30, 2022. For the six months ended June 30, 2020, this reduction amounted to $1,011,041, which is included in the reduction of total expenses in the Statement of Operations.
Distributor — MFS Fund Distributors, Inc. (MFD), a wholly-owned subsidiary of MFS, is the distributor of shares of the fund. The Trustees have adopted a distribution plan for the Service Class shares pursuant to Rule 12b-1 under the Investment Company Act of 1940.
The fund's distribution plan provides that the fund will pay MFD distribution and/or service fees equal to 0.25% per annum of its average daily net assets attributable to Service Class shares as partial consideration for services performed and expenses incurred by MFD and financial intermediaries (including participating insurance companies that invest in the fund to fund variable annuity and variable life insurance contracts, sponsors of qualified retirement and pension plans that invest in the fund, and affiliates of these participating insurance companies and plan sponsors) in connection with the sale and distribution of the Service Class shares. MFD may subsequently pay all, or a portion, of the distribution and/or service fees to financial intermediaries.
Shareholder Servicing Agent — MFS Service Center, Inc. (MFSC), a wholly-owned subsidiary of MFS, receives a fee from the fund for its services as shareholder servicing agent. For the six months ended June 30, 2020, the fee was $25,300, which equated to 0.0022% annually of the fund's average daily net assets. MFSC also receives payment from the fund for out-of-pocket expenses paid by MFSC on behalf of the fund. For the six months ended June 30, 2020, these costs amounted to $1,228.
Administrator — MFS provides certain financial, legal, shareholder communications, compliance, and other administrative services to the fund. Under an administrative services agreement, the fund reimburses MFS the costs incurred to provide these services. The fund is charged an annual fixed amount of $17,500 plus a fee based on average daily net assets. The administrative services fee incurred for the six months ended June 30, 2020 was equivalent to an annual effective rate of 0.0141% of the fund's average daily net assets.
Trustees’ and Officers’ Compensation — The fund pays compensation to independent Trustees in the form of a retainer, attendance fees, and additional compensation to Board and Committee chairpersons. The fund does not pay compensation directly to Trustees or officers of the fund who are also officers of the investment adviser, all of whom receive remuneration from MFS for their services to the fund. Certain officers and Trustees of the fund are officers or directors of MFS, MFD, and MFSC.
Notes to Financial Statements (unaudited) - continued
Other — The fund invests in the MFS Institutional Money Market Portfolio which is managed by MFS and seeks current income consistent with preservation of capital and liquidity. This money market fund does not pay a management fee to MFS but does incur investment and operating costs.
The fund is permitted to engage in purchase and sale transactions with funds and accounts for which MFS serves as investment adviser or sub-adviser (“cross-trades”) pursuant to a policy adopted by the Board of Trustees. This policy has been designed to ensure that cross-trades conducted by the fund comply with Rule 17a-7 under the Investment Company Act of 1940. During the six months ended June 30, 2020, the fund engaged in purchase and sale transactions pursuant to this policy, which amounted to $3,876,362 and $701,009, respectively. The sales transactions resulted in net realized gains (losses) of $(146,767).
The adviser has voluntarily undertaken to reimburse the fund from its own resources on a quarterly basis for the cost of investment research embedded in the cost of the fund’s securities trades. This agreement may be rescinded at any time. For the six months ended June 30, 2020, this reimbursement amounted to $48,111, which is included in “Other” income in the Statement of Operations.
(4) Portfolio Securities
For the six months ended June 30, 2020, purchases and sales of investments, other than short-term obligations, were as follows:
| | Purchases | Sales |
| U.S. Government securities | $573,419,614 | $799,575,208 |
| Non-U.S. Government securities | 601,019,498 | 515,379,787 |
(5) Shares of Beneficial Interest
The fund's Declaration of Trust permits the Trustees to issue an unlimited number of full and fractional shares of beneficial interest. Transactions in fund shares were as follows:
| | Six months ended
6/30/20 | | Year ended
12/31/19 |
| | Shares | Amount | | Shares | Amount |
| Shares sold | | | | | |
| Initial Class | 767,352 | $17,733,296 | | 1,735,912 | $41,322,525 |
| Service Class | 1,513,686 | 34,717,560 | | 3,594,794 | 83,324,924 |
| | 2,281,038 | $52,450,856 | | 5,330,706 | $124,647,449 |
Shares issued to shareholders in
reinvestment of distributions | | | | | |
| Initial Class | — | $— | | 2,558,547 | $59,383,887 |
| Service Class | — | — | | 2,704,613 | 61,638,137 |
| | — | $— | | 5,263,160 | $121,022,024 |
| Shares reacquired | | | | | |
| Initial Class | (3,191,928) | $(74,475,238) | | (7,253,162) | $(172,852,561) |
| Service Class | (3,971,021) | (91,094,631) | | (7,815,403) | (182,629,040) |
| | (7,162,949) | $(165,569,869) | | (15,068,565) | $(355,481,601) |
| Net change | | | | | |
| Initial Class | (2,424,576) | $(56,741,942) | | (2,958,703) | $(72,146,149) |
| Service Class | (2,457,335) | (56,377,071) | | (1,515,996) | (37,665,979) |
| | (4,881,911) | $(113,119,013) | | (4,474,699) | $(109,812,128) |
(6) Line of Credit
The fund and certain other funds managed by MFS participate in a $1.25 billion unsecured committed line of credit, subject to a $1 billion sublimit, provided by a syndicate of banks under a credit agreement. Borrowings may be made for temporary financing needs. Interest is charged to each fund, based on its borrowings, generally at a rate equal to the highest of one month LIBOR, the Federal Funds Effective Rate and the Overnight Bank Funding Rate, plus an agreed upon spread. A commitment fee, based on the average daily, unused portion of the committed line of credit, is allocated among the participating funds. In addition, the fund and other funds managed by MFS have established unsecured uncommitted borrowing arrangements with certain banks for temporary
Notes to Financial Statements (unaudited) - continued
financing needs. Interest is charged to each fund, based on its borrowings, at rates equal to customary reference rates plus an agreed upon spread. For the six months ended June 30, 2020, the fund’s commitment fee and interest expense were $6,018 and $0, respectively, and are included in “Miscellaneous” expense in the Statement of Operations.
(7) Investments in Affiliated Issuers
An affiliated issuer may be considered one in which the fund owns 5% or more of the outstanding voting securities, or a company which is under common control. For the purposes of this report, the following were affiliated issuers:
| Affiliated Issuers | Beginning
Value | Purchases | Sales
Proceeds | Realized
Gain
(Loss) | Change in
Unrealized
Appreciation or
Depreciation | Ending
Value |
| MFS Institutional Money Market Portfolio | $40,930,012 | $312,099,040 | $296,802,079 | $5,182 | $(837) | $56,231,318 |
| Affiliated Issuers | Dividend
Income | Capital Gain
Distributions |
| MFS Institutional Money Market Portfolio | $158,313 | $— |
(8) Impacts of COVID-19
The pandemic related to the global spread of novel coronavirus disease (COVID-19), which was first detected in December 2019, has resulted in significant disruptions to global business activity and the global economy, as well as the economies of individual countries, the financial performance of individual companies and sectors, and the securities and commodities markets in general. This pandemic, the full effects of which are still unknown, has resulted in substantial market volatility and may have adversely impacted the prices and liquidity of the fund's investments and the fund's performance.
Statement Regarding Liquidity Risk Management Program
The fund has adopted and implemented a liquidity risk management program (the “Program”) as required by Rule 22e-4 under the Investment Company Act of 1940, as amended. The fund’s Board of Trustees (the “Board”) has designated MFS as the administrator of the Program. The Program is reasonably designed to assess and manage the liquidity risk of the fund. Liquidity risk is the risk that the fund could not meet requests to redeem shares issued by the fund without significant dilution of remaining investors' interests.
MFS provided a written report to the Board for consideration at its April 2020 meeting that addressed the operation of the Program and provided an assessment of the adequacy and effectiveness of the Program during the period from the adoption of the Program on December 1, 2018 to December 31, 2019 (the “Covered Period”). The report concluded that during the Covered Period the Program had operated effectively and had adequately and effectively been implemented to assess and manage the fund’s liquidity risk. MFS also reported that there were no liquidity events that impacted the fund or its ability to timely meet redemptions without dilution to existing shareholders during the Covered Period.
There can be no assurance that the Program will achieve its objectives in the future. Further information on liquidity risk, and other principal risks to which an investment in the fund may be subject, can be found in the prospectus.
Proxy Voting Policies and Information
MFS votes proxies on behalf of the fund pursuant to proxy voting policies and procedures that are available without charge, upon request, by calling 1-800-225-2606, by visiting mfs.com/proxyvoting, or by visiting the SEC’s Web site at http://www.sec.gov.
Information regarding how the fund voted proxies relating to portfolio securities during the most recent twelve-month period ended June 30 is available by August 31 of each year without charge by visiting mfs.com/proxyvoting, or by visiting the SEC’s Web site at http://www.sec.gov.
Quarterly Portfolio Disclosure
The fund files a complete schedule of portfolio holdings with the SEC for the first and third quarters of each fiscal year as an exhibit to its reports on Form N-PORT. The fund’s Form N-PORT reports are available on the SEC’s website at http://www.sec.gov. A shareholder can obtain the portfolio holdings report for the first and third quarters of the fund's fiscal year at mfs.com/vit1 by choosing the fund's name and then selecting the “Resources” tab and clicking on “Prospectus and Reports”.
FURTHER INFORMATION
From time to time, MFS may post important information about the fund or the MFS funds on the MFS web site (mfs.com). This information is available at https://www.mfs.com/announcements or at mfs.com/vit1 by choosing the fund's name and then selecting the “Resources” tab and clicking on the “Announcements” tab, if any.
Information About Fund Contracts and Legal Claims
The fund has entered into contractual arrangements with an investment adviser, administrator, distributor, shareholder servicing agent, 529 program manager (if applicable), and custodian who each provide services to the fund. Unless expressly stated otherwise, shareholders are not parties to, or intended beneficiaries of these contractual arrangements, and these contractual arrangements are not intended to create any shareholder right to enforce them against the service providers or to seek any remedy under them against the service providers, either directly or on behalf of the fund.
Under the Trust’s By-Laws and Declaration of Trust, any claims asserted against or on behalf of the MFS Funds, including claims against Trustees and Officers, must be brought in state and federal courts located within the Commonwealth of Massachusetts.
Semiannual Report
June 30, 2020

MFS® Utilities Series

MFS® Variable Insurance Trust
Beginning on January 1, 2021, as permitted by regulations adopted by the U.S. Securities and Exchange Commission, the insurance company that offers your contract may determine that it will no longer send you paper copies of the fund’s annual and semiannual shareholder reports unless you specifically request paper copies from the insurance company or from your financial intermediary. Instead, the shareholder reports will be made available on a Web site (insurancefunds.mfs.com or other Web site of which you will be notified), and the insurance company will notify you by mail each time a report is posted and provide you with a Web site link to access the report. Instructions for requesting paper copies will be provided by your insurance company or financial intermediary.
If you already elected to receive shareholder reports by email, you will not be affected by this change and you need not take any action. If your insurance company or financial intermediary offers electronic delivery, you may elect to receive shareholder reports and other communications from the insurance company or financial intermediary by email by following the instructions provided by the insurance company or financial intermediary.
Beginning on January 1, 2019, you may elect to receive all future reports in paper free of charge from the insurance company or financial intermediary. You can inform the insurance company or financial intermediary that you wish to continue receiving paper copies of your shareholder reports by contacting your insurance company or financial intermediary. Your election to receive reports in paper will apply to all funds held in your account with your insurance company or financial intermediary.
VUF-SEM
MFS® Utilities Series
CONTENTS
The report is prepared for the general information of contract owners. It is authorized for distribution to prospective investors only when preceded or accompanied by a current prospectus.
NOT FDIC INSURED • MAY LOSE VALUE • NO BANK OR CREDIT UNION GUARANTEE • NOT A DEPOSIT • NOT INSURED BY ANY FEDERAL GOVERNMENT AGENCY OR NCUA/NCUSIF
MFS Utilities Series
LETTER FROM THE EXECUTIVE CHAIR

Dear Contract Owners:
Markets experienced dramatic swings in early 2020, as the coronavirus pandemic brought the global economy to a standstill for several months. Optimism over the development of vaccines and therapeutics, along with a decline in cases in countries that had been affected by the outbreak early on, brightened the economic and market outlook during the second quarter, as did the phased reopening of US states. However, a great deal of uncertainty remains, including the possibility of a second wave of cases later this year, as many countries continue to experience COVID-19 flare-ups.
Global central banks have taken aggressive steps to cushion the economic and market fallout related to the virus, and governments are deploying unprecedented levels of fiscal support. As uncertainty recedes, these measures can help build a supportive environment and encourage economic recovery; however, if markets disconnect from fundamentals, they can also sow the seeds of instability. In the aftermath of the crisis, societal changes may be likely, as households, businesses, and governments adjust to a new reality, and these alterations could affect the investment landscape. For investors, events, such as the COVID-19 outbreak, demonstrate the importance of having a deep understanding of company fundamentals, and we have built our global research platform to do just that.
Here at MFS®, we aim to help our clients navigate the growing complexity of the markets and world economies. Our long-term investment philosophy and commitment to the responsible allocation of capital allow us to tune out the noise and uncover what we believe are the best, most durable investment opportunities in the market. Through our unique global investment platform, we combine collective expertise, thoughtful risk management, and long-term discipline to create sustainable value for investors.
Respectfully,

Robert J. Manning
Executive Chair
MFS Investment Management
August 17, 2020
The opinions expressed in this letter are subject to change, may not be relied upon for investment advice, and no forecasts can be guaranteed.
1
MFS Utilities Series
PORTFOLIO COMPOSITION
Portfolio structure (i)
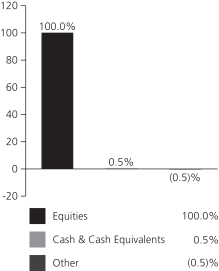
| | | | |
| Top ten holdings (i) | | | | |
| NextEra Energy, Inc. | | | 7.1% | |
| EDP Renovaveis S.A. | | | 5.6% | |
| Dominion Energy, Inc. | | | 5.3% | |
| Exelon Corp. | | | 4.6% | |
| Duke Energy Corp. | | | 3.6% | |
| Enel S.p.A. | | | 3.3% | |
| Entergy Corp. | | | 3.1% | |
| Edison International | | | 2.7% | |
| Public Service Enterprise Group, Inc. | | | 2.7% | |
| FirstEnergy Corp. | | | 2.6% | |
| | | | |
| Top five industries (i) | | | | |
| Utilities-Electric Power | | | 75.1% | |
| Telecommunications – Wireless | | | 7.6% | |
| Natural Gas – Distribution | | | 6.2% | |
| Natural Gas – Pipeline | | | 5.2% | |
| Cable TV | | | 3.7% | |
| |
| Issuer country weightings (i)(x) | | | | |
| United States | | | 69.4% | |
| Portugal | | | 7.7% | |
| Canada | | | 4.6% | |
| Spain | | | 4.1% | |
| United Kingdom | | | 3.8% | |
| Italy | | | 3.3% | |
| Germany | | | 1.4% | |
| Japan | | | 1.0% | |
| Thailand | | | 0.9% | |
| Other Countries | | | 3.8% | |
| (i) | For purposes of this presentation, the components include the value of securities, and reflect the impact of the equivalent exposure of derivative positions, if any. These amounts may be negative from time to time. Equivalent exposure is a calculated amount that translates the derivative position into a reasonable approximation of the amount of the underlying asset that the portfolio would have to hold at a given point in time to have the same price sensitivity that results from the portfolio’s ownership of the derivative contract. When dealing with derivatives, equivalent exposure is a more representative measure of the potential impact of a position on portfolio performance than value. The bond component will include any accrued interest amounts. |
| (x) | Represents the portfolio’s exposure to issuer countries as a percentage of a portfolio’s net assets. For purposes of this presentation, United States includes Cash & Cash Equivalents and Other. |
Where the fund holds convertible bonds, they are treated as part of the equity portion of the portfolio.
Cash & Cash Equivalents includes any cash, investments in money market funds, short-term securities, and other assets less liabilities. Please see the Statement of Assets and Liabilities for additional information related to the fund’s cash position and other assets and liabilities.
Other includes equivalent exposure from currency derivatives and/or any offsets to derivative positions and may be negative.
Percentages are based on net assets as of June 30, 2020.
The portfolio is actively managed and current holdings may be different.
2
MFS Utilities Series
EXPENSE TABLE
Fund Expenses Borne by the Contract Holders during the Period,
January 1, 2020 through June 30, 2020
As a contract holder of the fund, you incur ongoing costs, including management fees; distribution and/or service (12b-1) fees; and other fund expenses. This example is intended to help you understand your ongoing costs (in dollars) of investing in the fund and to compare these costs with the ongoing costs of investing in other mutual funds.
The example is based on an investment of $1,000 invested at the beginning of the period and held for the entire period January 1, 2020 through June 30, 2020.
Actual Expenses
The first line for each share class in the following table provides information about actual account values and actual expenses. You may use the information in this line, together with the amount you invested, to estimate the expenses that you paid over the period. Simply divide your account value by $1,000 (for example, an $8,600 account value divided by $1,000 = 8.6), then multiply the result by the number in the first line under the heading entitled “Expenses Paid During Period” to estimate the expenses you paid on your account during this period.
Hypothetical Example for Comparison Purposes
The second line for each share class in the following table provides information about hypothetical account values and hypothetical expenses based on the fund’s actual expense ratio and an assumed rate of return of 5% per year before expenses, which is not the fund’s actual return. The hypothetical account values and expenses may not be used to estimate the actual ending account balance or expenses you paid for the period. You may use this information to compare the ongoing costs of investing in the fund and other funds. To do so, compare this 5% hypothetical example with the 5% hypothetical examples that appear in the shareholder reports of the other funds.
Please note that the expenses shown in the table are meant to highlight the fund’s ongoing costs only and do not take into account the fees and expenses imposed under the variable contracts through which your investment in the fund is made. Therefore, the second line for each share class in the table is useful in comparing ongoing costs associated with an investment in vehicles (such as the fund) which fund benefits under variable annuity and variable life insurance contracts and to qualified pension and retirement plans only, and will not help you determine the relative total costs of investing in the fund through variable annuity and variable life insurance contracts. If the fees and expenses imposed under the variable contracts were included, your costs would have been higher.
| | | | | | | | | | | | | | | | | | |
| Share Class | | | | Annualized
Expense Ratio | | | Beginning
Account Value
1/01/20 | | | Ending
Account Value
6/30/20 | | | Expenses Paid
During Period (p)
1/01/20-6/30/20 | |
| Initial Class | | Actual | | | 0.79% | | | | $1,000.00 | | | | $903.07 | | | | $3.74 | |
| | Hypothetical (h) | | | 0.79% | | | | $1,000.00 | | | | $1,020.93 | | | | $3.97 | |
| Service Class | | Actual | | | 1.04% | | | | $1,000.00 | | | | $901.62 | | | | $4.92 | |
| | Hypothetical (h) | | | 1.04% | | | | $1,000.00 | | | | $1,019.69 | | | | $5.22 | |
| (h) | 5% class return per year before expenses. |
| (p) | “Expenses Paid During Period” are equal to each class’s annualized expense ratio, as shown above, multiplied by the average account value over the period, multiplied by 182/366 (to reflect the one-half year period). |
3
MFS Utilities Series
PORTFOLIO OF INVESTMENTS – 6/30/20 (unaudited)
The Portfolio of Investments is a complete list of all securities owned by your fund. It is categorized by broad-based asset classes.
| | | | | | | | |
| Issuer | | Shares/Par | | | Value ($) | |
| COMMON STOCKS – 96.1% | | | | | | | | |
| Cable TV – 3.7% | | | | | |
| Charter Communications, Inc., “A” (a) | | | 41,069 | | | $ | 20,946,833 | |
| Comcast Corp., “A” | | | 286,007 | | | | 11,148,553 | |
| NOS, SGPS S.A. | | | 1,947,603 | | | | 8,498,701 | |
| | | | | | | | |
| | | | | | $ | 40,594,087 | |
| | | | | | | | |
| Natural Gas – Distribution – 5.1% | | | | | |
| Atmos Energy Corp. | | | 22,846 | | | $ | 2,275,005 | |
| China Resources Gas Group Ltd. | | | 1,222,000 | | | | 5,951,939 | |
| NiSource, Inc. | | | 613,757 | | | | 13,956,834 | |
| Sempra Energy | | | 239,141 | | | | 28,034,499 | |
| UGI Corp. | | | 180,675 | | | | 5,745,465 | |
| | | | | | | | |
| | | | | | $ | 55,963,742 | |
| | | | | | | | |
| Natural Gas – Pipeline – 5.2% | | | | | |
| Cheniere Energy, Inc. (a) | | | 331,260 | | | $ | 16,006,483 | |
| Enterprise Products Partners LP | | | 1,248,890 | | | | 22,692,331 | |
| Equitrans Midstream Corp. | | | 592,486 | | | | 4,923,556 | |
| Magellan Midstream Partners LP | | | 119,753 | | | | 5,169,737 | |
| Plains All American Pipeline LP | | | 956,546 | | | | 8,455,867 | |
| | | | | | | | |
| | | | | | $ | 57,247,974 | |
| | | | | | | | |
| Telecommunications – Wireless – 7.6% | | | | | |
| Advanced Info Service Public Co. Ltd. | | | 1,603,500 | | | $ | 9,597,913 | |
| American Tower Corp., REIT | | | 46,189 | | | | 11,941,699 | |
| Cellnex Telecom S.A. | | | 278,426 | | | | 16,966,895 | |
| KDDI Corp. | | | 364,800 | | | | 10,926,262 | |
| Mobile TeleSystems PJSC, ADR | | | 568,199 | | | | 5,221,749 | |
| Rogers Communications, Inc., “B” | | | 276,608 | | | | 11,114,442 | |
| Tele2 AB, “B” | | | 417,741 | | | | 5,538,827 | |
| T-Mobile USA, Inc. (a) | | | 114,785 | | | | 11,954,858 | |
| | | | | | | | |
| | | | | | $ | 83,262,645 | |
| | | | | | | | |
| Telephone Services – 2.2% | | | | | |
| Hellenic Telecommunications Organization S.A. | | | 516,279 | | | $ | 6,966,271 | |
| Telesites S.A.B. de C.V. (a) | | | 5,973,500 | | | | 3,786,634 | |
| TELUS Corp. | | | 803,304 | | | | 13,473,212 | |
| | | | | | | | |
| | | | | | $ | 24,226,117 | |
| | | | | | | | |
| Utilities – Electric Power – 72.3% | | | | | |
| AES Corp. | | | 1,047,310 | | | $ | 15,175,522 | |
| ALLETE, Inc. | | | 115,929 | | | | 6,330,883 | |
| Alliant Energy Corp. | | | 250,703 | | | | 11,993,631 | |
| AltaGas Ltd. (l) | | | 1,182,207 | | | | 13,628,123 | |
| American Electric Power Co., Inc. | | | 350,844 | | | | 27,941,216 | |
| CenterPoint Energy, Inc. | | | 329,845 | | | | 6,158,206 | |
| CenterPoint Energy, Inc. (a)(n) | | | 657,518 | | | | 12,275,861 | |
| CLP Holdings Ltd. | | | 708,000 | | | | 6,942,520 | |
| Dominion Energy, Inc. | | | 715,898 | | | | 58,116,600 | |
| DTE Energy Co. | | | 251,798 | | | | 27,068,285 | |
| Duke Energy Corp. | | | 494,374 | | | | 39,495,539 | |
| E.ON SE | | | 53,508 | | | | 602,064 | |
| Edison International | | | 544,329 | | | | 29,562,508 | |
| | | | | | | | |
| Issuer | | Shares/Par | | | Value ($) | |
| COMMON STOCKS – continued | | | | | |
| Utilities – Electric Power – continued | | | | | |
| EDP Renovaveis S.A. | | | 4,436,875 | | | $ | 61,313,374 | |
| Emera, Inc. | | | 321,067 | | | | 12,633,617 | |
| Enel S.p.A. | | | 4,215,303 | | | | 36,362,172 | |
| Energias de Portugal S.A. | | | 3,159,347 | | | | 15,085,481 | |
| Entergy Corp. | | | 358,765 | | | | 33,655,745 | |
| Equatorial Energia S.A. | | | 1,102,800 | | | | 4,708,817 | |
| Evergy, Inc. | | | 352,912 | | | | 20,924,152 | |
| Exelon Corp. | | | 1,382,457 | | | | 50,169,366 | |
| FirstEnergy Corp. | | | 750,200 | | | | 29,092,756 | |
| Iberdrola S.A. | | | 2,404,614 | | | | 27,880,334 | |
| National Grid PLC | | | 1,813,769 | | | | 22,231,698 | |
| Neoenergia S.A. | | | 873,900 | | | | 3,072,575 | |
| NextEra Energy Partners LP | | | 112,789 | | | | 5,783,820 | |
| NextEra Energy, Inc. | | | 323,014 | | | | 77,578,275 | |
| PG&E Corp. (a) | | | 2,586,376 | | | | 22,941,155 | |
| Pinnacle West Capital Corp. | | | 132,168 | | | | 9,686,593 | |
| Public Service Enterprise Group, Inc. | | | 595,538 | | | | 29,276,648 | |
| RWE AG | | | 424,482 | | | | 14,836,525 | |
| Southern Co. | | | 318,362 | | | | 16,507,070 | |
| SSE PLC | | | 1,120,342 | | | | 18,942,213 | |
| Vistra Energy Corp. | | | 1,458,043 | | | | 27,148,761 | |
| | | | | | | | |
| | | | | | $ | 795,122,105 | |
| | | | | | | | |
Total Common Stocks
(Identified Cost, $883,348,272) | | | | | | $ | 1,056,416,670 | |
| | | | | | | | |
|
| CONVERTIBLE PREFERRED STOCKS – 3.9% | |
| Natural Gas – Distribution – 1.2% | | | | | |
| Sempra Energy, 6% | | | 64,703 | | | $ | 6,323,424 | |
| Sempra Energy, 6.75% | | | 64,868 | | | | 6,373,930 | |
| | | | | | | | |
| | | | | | $ | 12,697,354 | |
| | | | | | | | |
| Utilities – Electric Power – 2.7% | | | | | |
| CenterPoint Energy, Inc., 7% | | | 442,384 | | | $ | 15,731,175 | |
| Dominion Energy, Inc., 7.25% | | | 83,215 | | | | 8,433,008 | |
| DTE Energy Co., 6.25% | | | 64,750 | | | | 2,740,220 | |
| NextEra Energy, Inc., 5.279% | | | 64,600 | | | | 2,742,270 | |
| | | | | | | | |
| | | | | | $ | 29,646,673 | |
| | | | | | | | |
Total Convertible Preferred Stocks
(Identified Cost, $44,401,954) | | | | | | $ | 42,344,027 | |
| | | | | | | | |
| |
| INVESTMENT COMPANIES (h) – 2.1% | | | | | |
| Money Market Funds – 2.1% | | | | | | | | |
| MFS Institutional Money Market Portfolio, 0.17% (v) (Identified Cost, $23,533,777) | | | 23,531,695 | | | $ | 23,534,049 | |
| | | | | | | | |
OTHER ASSETS, LESS
LIABILITIES – (2.1)% | | | | | | | (23,411,946 | ) |
| | | | | | | | |
| NET ASSETS – 100.0% | | | | | | $ | 1,098,882,800 | |
| | | | | | | | |
4
MFS Utilities Series
Portfolio of Investments (unaudited) – continued
| (a) | | Non-income producing security. |
| (h) | | An affiliated issuer, which may be considered one in which the fund owns 5% or more of the outstanding voting securities, or a company which is under common control. At period end, the aggregate values of the fund’s investments in affiliated issuers and in unaffiliated issuers were $23,534,049 and $1,098,760,697, respectively. |
| (l) | | A portion of this security is on loan. See Note 2 for additional information. |
| (n) | | Securities exempt from registration under Rule 144A of the Securities Act of 1933. These securities may be sold in the ordinary course of business in transactions exempt from registration, normally to qualified institutional buyers. At period end, the aggregate value of these securities was $12,275,861, representing 1.1% of net assets. |
| (v) | | Affiliated issuer that is available only to investment companies managed by MFS. The rate quoted for the MFS Institutional Money Market Portfolio is the annualized seven-day yield of the fund at period end. |
The following abbreviations are used in this report and are defined:
| ADR | | American Depositary Receipt |
| REIT | | Real Estate Investment Trust |
Abbreviations indicate amounts shown in currencies other than the U.S. dollar. All amounts are stated in U.S. dollars unless otherwise indicated. A list of abbreviations is shown below:
Derivative Contracts at 6/30/20
Forward Foreign Currency Exchange Contracts
| | | | | | | | | | | | | | | | | | | | |
| Currency Purchased | | Currency Sold | | Counterparty | | Settlement Date | | | Unrealized
Appreciation
(Depreciation) | |
| Asset Derivatives | | | | | | | | | | | | |
| CAD | | | 424,011 | | | | | USD | | 310,125 | | Brown Brothers Harriman | | | 7/17/2020 | | | | $2,212 | |
| CAD | | | 1,012,972 | | | | | USD | | 741,485 | | Merrill Lynch International | | | 7/17/2020 | | | | 4,694 | |
| CAD | | | 724,108 | | | | | USD | | 531,530 | | Morgan Stanley Capital Services, Inc. | | | 7/17/2020 | | | | 1,867 | |
| CAD | | | 619,907 | | | | | USD | | 455,312 | | State Street Bank Corp. | | | 7/17/2020 | | | | 1,326 | |
| EUR | | | 71,772 | | | | | USD | | 78,535 | | BNP Paribas S.A. | | | 7/17/2020 | | | | 2,127 | |
| EUR | | | 6,006,338 | | | | | USD | | 6,715,299 | | Brown Brothers Harriman | | | 7/17/2020 | | | | 34,972 | |
| EUR | | | 117,331 | | | | | USD | | 128,139 | | Citibank N.A. | | | 7/17/2020 | | | | 3,725 | |
| EUR | | | 804,153 | | | | | USD | | 871,373 | | Citibank N.A. | | | 7/31/2020 | | | | 32,660 | |
| EUR | | | 1,189,524 | | | | | USD | | 1,312,514 | | Merrill Lynch International | | | 7/17/2020 | | | | 24,343 | |
| EUR | | | 1,004,516 | | | | | USD | | 1,115,254 | | State Street Bank Corp. | | | 7/17/2020 | | | | 13,679 | |
| USD | | | 178,317 | | | | | CAD | | 240,465 | | UBS AG | | | 7/17/2020 | | | | 1,184 | |
| USD | | | 193,328 | | | | | EUR | | 171,676 | | Brown Brothers Harriman | | | 7/17/2020 | | | | 389 | |
| USD | | | 174,713 | | | | | GBP | | 138,703 | | BNP Paribas S.A. | | | 7/17/2020 | | | | 2,830 | |
| USD | | | 3,551,296 | | | | | GBP | | 2,860,000 | | State Street Bank Corp. | | | 7/17/2020 | | | | 7,133 | |
| | | | | | | | | | | | | | | | | | | | |
| | | | | | | | | | | | | | | | | | | $133,141 | |
| | | | | | | | | | | | | | | | | | | | |
| Liability Derivatives | | | | | | | | | | | | |
| CAD | | | 1,198,775 | | | | | USD | | 895,852 | | Brown Brothers Harriman | | | 7/17/2020 | | | | $(12,805 | ) |
| CAD | | | 122,223 | | | | | USD | | 90,077 | | Merrill Lynch International | | | 7/17/2020 | | | | (44 | ) |
| CAD | | | 1,024,335 | | | | | USD | | 762,328 | | State Street Bank Corp. | | | 7/17/2020 | | | | (7,777 | ) |
| EUR | | | 130,305 | | | | | USD | | 147,448 | | Citibank N.A. | | | 7/17/2020 | | | | (1,004 | ) |
| EUR | | | 216,937 | | | | | USD | | 246,455 | | Merrill Lynch International | | | 7/10/2020 | | | | (2,686 | ) |
| EUR | | | 1,688,660 | | | | | USD | | 1,905,855 | | Merrill Lynch International | | | 7/17/2020 | | | | (8,042 | ) |
| EUR | | | 206,521 | | | | | USD | | 234,534 | | Morgan Stanley Capital Services, Inc. | | | 7/17/2020 | | | | (2,433 | ) |
| GBP | | | 574,717 | | | | | USD | | 713,662 | | Merrill Lynch International | | | 7/17/2020 | | | | (1,462 | ) |
| SEK | | | 24,438,591 | | | | | USD | | 2,639,018 | | Citibank N.A. | | | 7/17/2020 | | | | (15,886 | ) |
| USD | | | 84,641 | | | | | CAD | | 119,347 | | Citibank N.A. | | | 7/31/2020 | | | | (3,276 | ) |
| USD | | | 35,057,112 | | | | | CAD | | 48,940,955 | | JPMorgan Chase Bank N.A. | | | 7/17/2020 | | | | (994,034 | ) |
| USD | | | 11,962,475 | | | | | EUR | | 10,893,000 | | BNP Paribas S.A. | | | 7/17/2020 | | | | (279,709 | ) |
| USD | | | 1,894,334 | | | | | EUR | | 1,749,596 | | Citibank N.A. | | | 7/17/2020 | | | | (71,964 | ) |
| USD | | | 41,101,997 | | | | | EUR | | 37,961,692 | | HSBC Bank | | | 7/17/2020 | | | | (1,561,550 | ) |
| USD | | | 63,332,384 | | | | | EUR | | 58,647,884 | | HSBC Bank | | | 7/20/2020 | | | | (2,583,867 | ) |
| USD | | | 373,201 | | | | | EUR | | 333,542 | | State Street Bank Corp. | | | 7/17/2020 | | | | (1,652 | ) |
5
MFS Utilities Series
Portfolio of Investments (unaudited) – continued
Forward Foreign Currency Exchange Contracts - continued
| | | | | | | | | | | | | | | | | | | | |
| Currency Purchased | | Currency Sold | | Counterparty | | Settlement Date | | | Unrealized
Appreciation
(Depreciation) | |
| Liability Derivatives – continued | | | | | | | | | | |
| USD | | | 22,513,055 | | | | | GBP | | 18,318,078 | | Barclays Bank PLC | | | 7/17/2020 | | | | $(187,032 | ) |
| USD | | | 706,756 | | | | | GBP | | 576,760 | | Citibank N.A. | | | 7/17/2020 | | | | (7,975 | ) |
| USD | | | 6,218,009 | | | | | SEK | | 59,830,951 | | Merrill Lynch International | | | 7/17/2020 | | | | (203,984 | ) |
| | | | | | | | | | | | | | | | | | | | |
| | | | | | | | | | | | | | | | | | | $(5,947,182 | ) |
| | | | | | | | | | | | | | | | | | | | |
At June 30, 2020, the fund had cash collateral of $1,180,000 to cover any collateral or margin obligations for certain derivative contracts. Restricted cash and/or deposits with brokers in the Statement of Assets and Liabilities are comprised of cash collateral.
See Notes to Financial Statements
6
MFS Utilities Series
FINANCIAL STATEMENTS | STATEMENT OF ASSETS AND LIABILITIES (unaudited)
This statement represents your fund’s balance sheet, which details the assets and liabilities comprising the total value of the fund.
| | | | |
At 6/30/20 | | | | |
| |
Assets | | | | |
Investments in unaffiliated issuers, at value, including $7,008,263 of securities on loan (identified cost, $927,750,226) | | | $1,098,760,697 | |
Investments in affiliated issuers, at value (identified cost, $23,533,777) | | | 23,534,049 | |
Cash | | | 530,000 | |
Restricted cash for | | | | |
Forward foreign currency exchange contracts | | | 1,180,000 | |
Receivables for | | | | |
Forward foreign currency exchange contracts | | | 133,141 | |
Investments sold | | | 1,836,210 | |
Fund shares sold | | | 501,769 | |
Interest and dividends | | | 2,204,838 | |
Other assets | | | 2,658 | |
Total assets | | | $1,128,683,362 | |
| |
Liabilities | | | | |
Payables for | | | | |
Forward foreign currency exchange contracts | | | $5,947,182 | |
Investments purchased | | | 22,274,145 | |
Fund shares reacquired | | | 1,173,626 | |
Payable to affiliates | | | | |
Investment adviser | | | 43,586 | |
Administrative services fee | | | 883 | |
Shareholder servicing costs | | | 1,605 | |
Distribution and/or service fees | | | 8,350 | |
Deferred country tax expense payable | | | 81,213 | |
Accrued expenses and other liabilities | | | 269,972 | |
Total liabilities | | | $29,800,562 | |
Net assets | | | $1,098,882,800 | |
| |
Net assets consist of | | | | |
Paid-in capital | | | $850,350,010 | |
Total distributable earnings (loss) | | | 248,532,790 | |
Net assets | | | $1,098,882,800 | |
Shares of beneficial interest outstanding | | | 34,970,297 | |
| | | | | | | | | | | | |
| | | |
| | | Net assets | | | Shares
outstanding | | | Net asset value
per share | |
Initial Class | | | $480,112,951 | | | | 15,113,762 | | | | $31.77 | |
Service Class | | | 618,769,849 | | | | 19,856,535 | | | | 31.16 | |
See Notes to Financial Statements
7
MFS Utilities Series
FINANCIAL STATEMENTS | STATEMENT OF OPERATIONS (unaudited)
This statement describes how much your fund earned in investment income and accrued in expenses. It also describes any gains and/or losses generated by fund operations.
| | | | |
Six months ended 6/30/20 | | | | |
| |
Net investment income (loss) | | | | |
Income | | | | |
Dividends | | | $20,460,014 | |
Dividends from affiliated issuers | | | 63,174 | |
Other | | | 45,712 | |
Income on securities loaned | | | 13,679 | |
Foreign taxes withheld | | | (708,269 | ) |
Total investment income | | | $19,874,310 | |
Expenses | | | | |
Management fee | | | $4,291,227 | |
Distribution and/or service fees | | | 817,422 | |
Shareholder servicing costs | | | 20,922 | |
Administrative services fee | | | 83,932 | |
Independent Trustees’ compensation | | | 11,867 | |
Custodian fee | | | 92,490 | |
Shareholder communications | | | 54,831 | |
Audit and tax fees | | | 32,243 | |
Legal fees | | | 6,039 | |
Miscellaneous | | | 19,591 | |
Total expenses | | | $5,430,564 | |
Reduction of expenses by investment adviser | | | (62,169 | ) |
Net expenses | | | $5,368,395 | |
Net investment income (loss) | | | $14,505,915 | |
| |
Realized and unrealized gain (loss) | | | | |
Realized gain (loss) (identified cost basis) | | | | |
Unaffiliated issuers (net of $11,514 country tax) | | | $(8,842,428 | ) |
Affiliated issuers | | | 2,084 | |
Forward foreign currency exchange contracts | | | 9,959,211 | |
Foreign currency | | | (36,757 | ) |
Net realized gain (loss) | | | $1,082,110 | |
Change in unrealized appreciation or depreciation | | | | |
Unaffiliated issuers (net of $234,913 decrease in deferred country tax) | | | $(137,707,814 | ) |
Affiliated issuers | | | 272 | |
Forward foreign currency exchange contracts | | | (2,615,136 | ) |
Translation of assets and liabilities in foreign currencies | | | (22,853 | ) |
Net unrealized gain (loss) | | | $(140,345,531 | ) |
Net realized and unrealized gain (loss) | | | $(139,263,421 | ) |
Change in net assets from operations | | | $(124,757,506 | ) |
See Notes to Financial Statements
8
MFS Utilities Series
FINANCIAL STATEMENTS | STATEMENTS OF CHANGES IN NET ASSETS
These statements describe the increases and/or decreases in net assets resulting from operations, any distributions, and any shareholder transactions.
| | | | | | | | |
| | | Six months ended
6/30/20 | | | Year ended
12/31/19 | |
| | | (unaudited) | | | | |
Change in net assets | | | | | | | | |
| | |
From operations | | | | | | | | |
Net investment income (loss) | | | $14,505,915 | | | | $33,385,933 | |
Net realized gain (loss) | | | 1,082,110 | | | | 51,790,915 | |
Net unrealized gain (loss) | | | (140,345,531 | ) | | | 204,485,158 | |
Change in net assets from operations | | | $(124,757,506 | ) | | | $289,662,006 | |
Total distributions to shareholders | | | $— | | | | $(55,125,457 | ) |
Change in net assets from fund share transactions | | | $(66,653,086 | ) | | | $(164,373,912 | ) |
Total change in net assets | | | $(191,410,592 | ) | | | $70,162,637 | |
| | |
Net assets | | | | | | | | |
At beginning of period | | | 1,290,293,392 | | | | 1,220,130,755 | |
At end of period | | | $1,098,882,800 | | | | $1,290,293,392 | |
See Notes to Financial Statements
9
MFS Utilities Series
FINANCIAL STATEMENTS | FINANCIAL HIGHLIGHTS
The financial highlights table is intended to help you understand the fund’s financial performance for the semiannual period and the past 5 fiscal years. Certain information reflects financial results for a single fund share. The total returns in the table represent the rate that an investor would have earned (or lost) on an investment in the fund share class (assuming reinvestment of all distributions) held for the entire period.
| | | | | | | | | | | | | | | | | | | | | | | | |
| Initial Class | | Six months
ended 6/30/20 | | | Year ended | |
| | | 12/31/19 | | | 12/31/18 | | | 12/31/17 | | | 12/31/16 | | | 12/31/15 | |
| | | | | | |
| | | (unaudited) | | | | | | | | | | | | | | | | |
| | | | | | |
Net asset value, beginning of period | | | $35.18 | | | | $29.38 | | | | $29.50 | | | | $26.81 | | | | $25.56 | | | | $33.97 | |
|
| Income (loss) from investment operations | |
Net investment income (loss) (d) | | | $0.43 | | | | $0.90 | | | | $0.89 | | | | $0.81 | | | | $1.06 | (c) | | | $0.81 | |
Net realized and unrealized gain (loss) | | | (3.84 | ) | | | 6.37 | | | | (0.56 | ) | | | 3.17 | | | | 1.91 | | | | (5.56 | ) |
Total from investment operations | | | $(3.41 | ) | | | $7.27 | | | | $0.33 | | | | $3.98 | | | | $2.97 | | | | $(4.75 | ) |
|
| Less distributions declared to shareholders | |
From net investment income | | | $— | | | | $(1.37 | ) | | | $(0.33 | ) | | | $(1.29 | ) | | | $(1.08 | ) | | | $(1.38 | ) |
From net realized gain | | | — | | | | (0.10 | ) | | | (0.12 | ) | | | — | | | | (0.64 | ) | | | (2.28 | ) |
Total distributions declared to shareholders | | | $— | | | | $(1.47 | ) | | | $(0.45 | ) | | | $(1.29 | ) | | | $(1.72 | ) | | | $(3.66 | ) |
Net asset value, end of period (x) | | | $31.77 | | | | $35.18 | | | | $29.38 | | | | $29.50 | | | | $26.81 | | | | $25.56 | |
Total return (%) (k)(r)(s)(x) | | | (9.69 | )(n) | | | 25.07 | | | | 1.06 | | | | 14.83 | | | | 11.47 | (c) | | | (14.54 | ) |
|
Ratios (%) (to average net assets)
and Supplemental data: | |
Expenses before expense reductions (f) | | | 0.80 | (a) | | | 0.79 | | | | 0.78 | | | | 0.80 | | | | 0.77 | (c) | | | 0.79 | |
Expenses after expense reductions (f) | | | 0.79 | (a) | | | 0.78 | | | | 0.78 | | | | 0.79 | | | | 0.77 | (c) | | | 0.78 | |
Net investment income (loss) | | | 2.65 | (a) | | | 2.69 | | | | 2.98 | | | | 2.78 | | | | 3.89 | (c) | | | 2.59 | |
Portfolio turnover | | | 20 | (n) | | | 28 | | | | 27 | | | | 27 | | | | 33 | | | | 42 | |
Net assets at end of period (000 omitted) | | | $480,113 | | | | $556,301 | | | | $492,930 | | | | $561,744 | | | | $556,607 | | | | $561,517 | |
| | |
| Service Class | | Six months
ended 6/30/20 | | | Year ended | |
| | | 12/31/19 | | | 12/31/18 | | | 12/31/17 | | | 12/31/16 | | | 12/31/15 | |
| | | | | | |
| | | (unaudited) | | | | | | | | | | | | | | | | |
| | | | | | |
Net asset value, beginning of period | | | $34.56 | | | | $28.86 | | | | $28.98 | | | | $26.37 | | | | $25.15 | | | | $33.48 | |
|
| Income (loss) from investment operations | |
Net investment income (loss) (d) | | | $0.38 | | | | $0.80 | | | | $0.81 | | | | $0.73 | | | | $0.97 | (c) | | | $0.72 | |
Net realized and unrealized gain (loss) | | | (3.78 | ) | | | 6.27 | | | | (0.56 | ) | | | 3.09 | | | | 1.90 | | | | (5.47 | ) |
Total from investment operations | | | $(3.40 | ) | | | $7.07 | | | | $0.25 | | | | $3.82 | | | | $2.87 | | | | $(4.75 | ) |
|
| Less distributions declared to shareholders | |
From net investment income | | | $— | | | | $(1.27 | ) | | | $(0.25 | ) | | | $(1.21 | ) | | | $(1.01 | ) | | | $(1.30 | ) |
From net realized gain | | | — | | | | (0.10 | ) | | | (0.12 | ) | | | — | | | | (0.64 | ) | | | (2.28 | ) |
Total distributions declared to shareholders | | | $— | | | | $(1.37 | ) | | | $(0.37 | ) | | | $(1.21 | ) | | | $(1.65 | ) | | | $(3.58 | ) |
Net asset value, end of period (x) | | | $31.16 | | | | $34.56 | | | | $28.86 | | | | $28.98 | | | | $26.37 | | | | $25.15 | |
Total return (%) (k)(r)(s)(x) | | | (9.84 | )(n) | | | 24.80 | | | | 0.81 | | | | 14.49 | | | | 11.24 | (c) | | | (14.76 | ) |
|
Ratios (%) (to average net assets)
and Supplemental data: | |
Expenses before expense reductions (f) | | | 1.05 | (a) | | | 1.04 | | | | 1.04 | | | | 1.05 | | | | 1.02 | (c) | | | 1.04 | |
Expenses after expense reductions (f) | | | 1.04 | (a) | | | 1.03 | | | | 1.03 | | | | 1.04 | | | | 1.02 | (c) | | | 1.03 | |
Net investment income (loss) | | | 2.40 | (a) | | | 2.44 | | | | 2.76 | | | | 2.53 | | | | 3.64 | (c) | | | 2.34 | |
Portfolio turnover | | | 20 | (n) | | | 28 | | | | 27 | | | | 27 | | | | 33 | | | | 42 | |
Net assets at end of period (000 omitted) | | | $618,770 | | | | $733,992 | | | | $727,201 | | | | $1,021,211 | | | | $998,836 | | | | $967,824 | |
See Notes to Financial Statements
10
MFS Utilities Series
Financial Highlights – continued
| (c) | Amount reflects a one-time reimbursement of expenses by the custodian (or former custodian) without which net investment income and performance would be lower and expenses would be higher. |
| (d) | Per share data is based on average shares outstanding. |
| (f) | Ratios do not reflect reductions from fees paid indirectly, if applicable. |
| (k) | The total return does not reflect expenses that apply to separate accounts. Inclusion of these charges would reduce the total return figures for all periods shown. |
| (r) | Certain expenses have been reduced without which performance would have been lower. |
| (s) | From time to time the fund may receive proceeds from litigation settlements, without which performance would be lower. |
| (x) | The net asset values and total returns have been calculated on net assets which include adjustments made in accordance with U.S. generally accepted accounting principles required at period end for financial reporting purposes. |
See Notes to Financial Statements
11
MFS Utilities Series
NOTES TO FINANCIAL STATEMENTS (unaudited)
| (1) | | Business and Organization |
MFS Utilities Series (the fund) is a diversified series of MFS Variable Insurance Trust (the trust). The trust is organized as a Massachusetts business trust and is registered under the Investment Company Act of 1940, as amended, as an open-end management investment company. The shareholders of each series of the trust are separate accounts of insurance companies, which offer variable annuity and/or life insurance products, and qualified retirement and pension plans.
The fund is an investment company and accordingly follows the investment company accounting and reporting guidance of the Financial Accounting Standards Board (FASB) Accounting Standards Codification Topic 946 Financial Services – Investment Companies.
| (2) | | Significant Accounting Policies |
General – The preparation of financial statements in conformity with U.S. generally accepted accounting principles requires management to make estimates and assumptions that affect the reported amounts of assets and liabilities, and disclosure of contingent assets and liabilities at the date of the financial statements and the reported amounts of increases and decreases in net assets from operations during the reporting period. Actual results could differ from those estimates. In the preparation of these financial statements, management has evaluated subsequent events occurring after the date of the fund’s Statement of Assets and Liabilities through the date that the financial statements were issued. The fund invests primarily in securities of issuers in the utility industry. Issuers in a single industry can react similarly to market, currency, political, economic, regulatory, geopolitical, environmental, public health, and other conditions. The value of stocks in the utilities sector can be very volatile due to supply and/or demand for services or fuel, financing costs, conservation efforts, the negative impact of regulation, and other factors. The fund invests in foreign securities. Investments in foreign securities are vulnerable to the effects of changes in the relative values of the local currency and the U.S. dollar and to the effects of changes in each country’s market, economic, industrial, political, regulatory, geopolitical, environmental, public health, and other conditions.
In March 2020, the FASB issued Accounting Standards Update 2020-04, Reference Rate Reform (Topic 848) – Facilitation of the Effects of Reference Rate Reform on Financial Reporting (“ASU 2020-04”), which provides optional, temporary relief with respect to the financial reporting of contracts subject to certain types of modifications due to the planned discontinuation of the London Interbank Offered Rate (LIBOR) and other IBOR-based reference rates as of the end of 2021. The temporary relief provided by ASU 2020-04 is effective for certain reference rate-related contract modifications that occur during the period from March 12, 2020 through December 31, 2022. Managementis evaluating the impact of ASU 2020-04 on the fund’s investments, derivatives, debt and other contracts that will undergo reference rate-related modifications as a result of the reference rate reform.
Balance Sheet Offsetting – The fund’s accounting policy with respect to balance sheet offsetting is that, absent an event of default by the counterparty or a termination of the agreement, the International Swaps and Derivatives Association (ISDA) Master Agreement, or similar agreement, does not result in an offset of reported amounts of financial assets and financial liabilities in the Statement of Assets and Liabilities across transactions between the fund and the applicable counterparty. The fund’s right to setoff may be restricted or prohibited by the bankruptcy or insolvency laws of the particular jurisdiction to which a specific master netting agreement counterparty is subject. Balance sheet offsetting disclosures, to the extent applicable to the fund, have been included in the fund’s Significant Accounting Policies note under the captions for each of the fund’s in-scope financial instruments and transactions.
Investment Valuations – Equity securities, including restricted equity securities, are generally valued at the last sale or official closing price on their primary market or exchange as provided by a third-party pricing service. Equity securities, for which there were no sales reported that day, are generally valued at the last quoted daily bid quotation on their primary market or exchange as provided by a third-party pricing service. Short-term instruments with a maturity at issuance of 60 days or less may be valued at amortized cost, which approximates market value. Forward foreign currency exchange contracts are generally valued at the mean of bid and asked prices for the time period interpolated from rates provided by a third-party pricing service for proximate time periods. Open-end investment companies are generally valued at net asset value per share. Securities and other assets generally valued on the basis of information from a third-party pricing service may also be valued at a broker/dealer bid quotation. In determining values, third-party pricing services can utilize both transaction data and market information such as yield, quality, coupon rate, maturity, type of issue, trading characteristics, and other market data. The values of foreign securities and other assets and liabilities expressed in foreign currencies are converted to U.S. dollars using the mean of bid and asked prices for rates provided by a third-party pricing service.
The Board of Trustees has delegated primary responsibility for determining or causing to be determined the value of the fund’s investments (including any fair valuation) to the adviser pursuant to valuation policies and procedures approved by the Board. If the adviser determines that reliable market quotations are not readily available, investments are valued at fair value as determined in good faith by the adviser in accordance with such procedures under the oversight of the Board of Trustees. Under the fund’s valuation policies and procedures, market quotations are not considered to be readily available for most types of debt instruments and floating rate loans and many types of derivatives. These investments are generally valued at fair value based on information from
12
MFS Utilities Series
Notes to Financial Statements (unaudited) – continued
third-party pricing services. In addition, investments may be valued at fair value if the adviser determines that an investment’s value has been materially affected by events occurring after the close of the exchange or market on which the investment is principally traded (such as foreign exchange or market) and prior to the determination of the fund’s net asset value, or after the halt of trading of a specific security where trading does not resume prior to the close of the exchange or market on which the security is principally traded. Events that occur after foreign markets close (such as developments in foreign markets and significant movements in the U.S. markets) and prior to the determination of the fund’s net asset value may be deemed to have a material effect on the value of securities traded in foreign markets. Accordingly, the fund’s foreign equity securities may often be valued at fair value. The adviser generally relies on third-party pricing services or other information (such as the correlation with price movements of similar securities in the same or other markets; the type, cost and investment characteristics of the security; the business and financial condition of the issuer; and trading and other market data) to assist in determining whether to fair value and at what value to fair value an investment. The value of an investment for purposes of calculating the fund’s net asset value can differ depending on the source and method used to determine value. When fair valuation is used, the value of an investment used to determine the fund’s net asset value may differ from quoted or published prices for the same investment. There can be no assurance that the fund could obtain the fair value assigned to an investment if it were to sell the investment at the same time at which the fund determines its net asset value per share.
Various inputs are used in determining the value of the fund’s assets or liabilities. These inputs are categorized into three broad levels. In certain cases, the inputs used to measure fair value may fall into different levels of the fair value hierarchy. In such cases, an investment’s level within the fair value hierarchy is based on the lowest level of input that is significant to the fair value measurement. The fund’s assessment of the significance of a particular input to the fair value measurement in its entirety requires judgment, and considers factors specific to the investment. Level 1 includes unadjusted quoted prices in active markets for identical assets or liabilities. Level 2 includes other significant observable market-based inputs (including quoted prices for similar securities, interest rates, prepayment speed, and credit risk). Level 3 includes unobservable inputs, which may include the adviser’s own assumptions in determining the fair value of investments. Other financial instruments are derivative instruments, such as forward foreign currency exchange contracts. The following is a summary of the levels used as of June 30, 2020 in valuing the fund’s assets or liabilities:
| | | | | | | | | | | | | | | | |
| Financial Instruments | | Level 1 | | | Level 2 | | | Level 3 | | | Total | |
| Equity Securities: | | | | | | | | | | | | | | | | |
United States | | | $750,202,478 | | | | $12,275,861 | | | | $— | | | | $762,478,339 | |
Portugal | | | 84,897,556 | | | | — | | | | — | | | | 84,897,556 | |
Canada | | | 50,849,394 | | | | — | | | | — | | | | 50,849,394 | |
Spain | | | 44,847,229 | | | | — | | | | — | | | | 44,847,229 | |
United Kingdom | | | 41,173,911 | | | | — | | | | — | | | | 41,173,911 | |
Italy | | | 36,362,172 | | | | — | | | | — | | | | 36,362,172 | |
Germany | | | 15,438,589 | | | | — | | | | — | | | | 15,438,589 | |
Japan | | | 10,926,262 | | | | — | | | | — | | | | 10,926,262 | |
Thailand | | | — | | | | 9,597,913 | | | | — | | | | 9,597,913 | |
Other Countries | | | 42,189,332 | | | | — | | | | — | | | | 42,189,332 | |
| Mutual Funds | | | 23,534,049 | | | | — | | | | — | | | | 23,534,049 | |
| Total | | | $1,100,420,972 | | | | $21,873,774 | | | | $— | | | | $1,122,294,746 | |
| | | | |
| Other Financial Instruments | | | | | | | | | | | | |
| Forward Foreign Currency Exchange Contracts – Assets | | | $— | | | | $133,141 | | | | $— | | | | $133,141 | |
| Forward Foreign Currency Exchange Contracts – Liabilities | | | — | | | | (5,947,182 | ) | | | — | | | | (5,947,182 | ) |
For further information regarding security characteristics, see the Portfolio of Investments.
Foreign Currency Translation – Purchases and sales of foreign investments, income, and expenses are converted into U.S. dollars based upon currency exchange rates prevailing on the respective dates of such transactions or on the reporting date for foreign denominated receivables and payables. Gains and losses attributable to foreign currency exchange rates on sales of securities are recorded for financial statement purposes as net realized gains and losses on investments. Gains and losses attributable to foreign exchange rate movements on receivables, payables, income and expenses are recorded for financial statement purposes as foreign currency transaction gains and losses. That portion of both realized and unrealized gains and losses on investments that results from fluctuations in foreign currency exchange rates is not separately disclosed.
Derivatives – The fund uses derivatives primarily to increase or decrease exposure to a particular market or segment of the market, or security, to increase or decrease interest rate or currency exposure, or as alternatives to direct investments. Derivatives are used for hedging or non-hedging purposes. While hedging can reduce or eliminate losses, it can also reduce or eliminate gains. When the fund uses derivatives as an investment to increase market exposure, or for hedging purposes, gains and losses from derivative instruments may be substantially greater than the derivative’s original cost.
13
MFS Utilities Series
Notes to Financial Statements (unaudited) – continued
The derivative instruments used by the fund during the period were forward foreign currency exchange contracts. Depending on the type of derivative, the fund may exit a derivative position by entering into an offsetting transaction with a counterparty or exchange, negotiating an agreement with the derivative counterparty, or novating the position to a third party. The fund’s period end derivatives, as presented in the Portfolio of Investments and the associated Derivative Contract tables, generally are indicative of the volume of its derivative activity during the period.
The following table presents, by major type of derivative contract, the fair value, on a gross basis, of the asset and liability components of derivatives held by the fund at June 30, 2020 as reported in the Statement of Assets and Liabilities:
| | | | | | | | | | |
| | | | | Fair Value | |
| Risk | | Derivative Contracts | | Asset Derivatives | | | Liability Derivatives | |
| Foreign Exchange | | Forward Foreign Currency Exchange Contracts | | | $133,141 | | | | $(5,947,182 | ) |
The following table presents, by major type of derivative contract, the realized gain (loss) on derivatives held by the fund for the six months ended June 30, 2020 as reported in the Statement of Operations:
| | | | |
| Risk | | Forward Foreign
Currency Exchange
Contracts | |
| Foreign Exchange | | | $9,959,211 | |
The following table presents, by major type of derivative contract, the change in unrealized appreciation or depreciation on derivatives held by the fund for the six months ended June 30, 2020 as reported in the Statement of Operations:
| | | | |
| Risk | | Forward Foreign Currency Exchange
Contracts | |
| Foreign Exchange | | | $(2,615,136 | ) |
Derivative counterparty credit risk is managed through formal evaluation of the creditworthiness of all potential counterparties. On certain, but not all, uncleared derivatives, the fund attempts to reduce its exposure to counterparty credit risk whenever possible by entering into an ISDA Master Agreement on a bilateral basis. The ISDA Master Agreement gives each party to the agreement the right to terminate all transactions traded under such agreement if there is a specified deterioration in the credit quality of the other party. Upon an event of default or a termination of the ISDA Master Agreement, the non-defaulting party has the right to close out all transactions traded under such agreement and to net amounts owed under each agreement to one net amount payable by one party to the other. This right to close out and net payments across all transactions traded under the ISDA Master Agreement could result in a reduction of the fund’s credit risk to such counterparty equal to any amounts payable by the fund under the applicable transactions, if any.
Collateral and margin requirements differ by type of derivative. For cleared derivatives (e.g., futures contracts, cleared swaps, and exchange-traded options), margin requirements are set by the clearing broker and the clearing house and collateral, in the form of cash or securities, is posted by the fund directly with the clearing broker. Collateral terms are counterparty agreement specific for uncleared derivatives (e.g., forward foreign currency exchange contracts, uncleared swap agreements, and uncleared options) and collateral, in the form of cash and securities, is held in segregated accounts with the fund’s custodian in connection with these agreements. For derivatives traded under an ISDA Master Agreement, which contains a collateral support annex, the collateral requirements are netted across all transactions traded under such counterparty-specific agreement and an amount is posted from one party to the other to collateralize such obligations. Cash that has been segregated or delivered to cover the fund’s collateral or margin obligations under derivative contracts, if any, will be reported separately in the Statement of Assets and Liabilities as restricted cash for uncleared derivatives and/or deposits with brokers for cleared derivatives. Securities pledged as collateral or margin for the same purpose, if any, are noted in the Portfolio of Investments. The fund may be required to make payments of interest on uncovered collateral or margin obligations with the broker. Any such payments are included in “Miscellaneous” expense in the Statement of Operations.
Forward Foreign Currency Exchange Contracts – The fund entered into forward foreign currency exchange contracts for the purchase or sale of a specific foreign currency at a fixed price on a future date. These contracts may be used to hedge the fund’s currency risk or for non-hedging purposes. For hedging purposes, the fund may enter into contracts to deliver or receive foreign currency that the fund will receive from or use in its normal investment activities. The fund may also use contracts to hedge against declines in the value of foreign currency denominated securities due to unfavorable exchange rate movements. For non-hedging purposes, the fund may enter into contracts with the intent of changing the relative exposure of the fund’s portfolio of securities to different currencies to take advantage of anticipated exchange rate changes.
14
MFS Utilities Series
Notes to Financial Statements (unaudited) – continued
Forward foreign currency exchange contracts are adjusted by the daily exchange rate of the underlying currency and any unrealized gains or losses are recorded as a receivable or payable for forward foreign currency exchange contracts until the contract settlement date. On contract settlement date, any gain or loss on the contract is recorded as realized gains or losses on forward foreign currency exchange contracts.
Risks may arise upon entering into these contracts from unanticipated movements in the value of the contract and from the potential inability of counterparties to meet the terms of their contracts. Generally, the fund’s maximum risk due to counterparty credit risk is the unrealized gain on the contract due to the use of Continuous Linked Settlement, a multicurrency cash settlement system for the centralized settlement of foreign transactions. This risk is mitigated in cases where there is an ISDA Master Agreement between the fund and the counterparty providing for netting as described above and, where applicable, by the posting of collateral by the counterparty to the fund to cover the fund’s exposure to the counterparty under such ISDA Master Agreement.
Security Loans – Under its Securities Lending Agency Agreement with the fund, State Street Bank and Trust Company, as lending agent, loans the securities of the fund to certain qualified institutions (the “Borrowers”) approved by the fund. Security loans can be terminated at the discretion of either the lending agent or the fund and the related securities must be returned within the earlier of the standard trade settlement period for such securities or within three business days. The loans are collateralized by cash and/or U.S. Treasury and federal agency obligations in an amount typically at least equal to the market value of the securities loaned. On loans collateralized by cash, the cash collateral is invested in a money market fund. The market value of the loaned securities is determined at the close of business of the fund and any additional required collateral is delivered to the fund on the next business day. The lending agent provides the fund with indemnification against Borrower default. In the event of Borrower default, the lending agent will, for the benefit of the fund, either purchase securities identical to those loaned or, when such purchase is commercially impracticable, pay the fund the market value of the loaned securities. In return, the lending agent assumes the fund’s rights to the related collateral. If the collateral value is less than the cost to purchase identical securities, the lending agent is responsible for the shortfall, but only to the extent that such shortfall is not due to a decline in collateral value resulting from collateral reinvestment for which the fund bears the risk of loss. At period end, the fund had investment securities on loan, all of which were classified as equity securities in the fund’s Portfolio of Investments, with a fair value of $7,008,263. The fair value of the fund’s investment securities on loan is presented gross in the Statement of Assets and Liabilities. These loans were collateralized by U.S. Treasury Obligations of $7,195,387 held by the lending agent. The collateral on securities loaned exceeded the value of securities on loan at period end. A portion of the income generated upon investment of the collateral is remitted to the Borrowers, and the remainder is allocated between the fund and the lending agent. On loans collateralized by U.S. Treasury and/or federal agency obligations, a fee is received from the Borrower, and is allocated between the fund and the lending agent. Income from securities lending is separately reported in the Statement of Operations. The dividend and interest income earned on the securities loaned is accounted for in the same manner as other dividend and interest income.
Indemnifications – Under the fund’s organizational documents, its officers and Trustees may be indemnified against certain liabilities and expenses arising out of the performance of their duties to the fund. Additionally, in the normal course of business, the fund enters into agreements with service providers that may contain indemnification clauses. The fund’s maximum exposure under these agreements is unknown as this would involve future claims that may be made against the fund that have not yet occurred.
Investment Transactions and Income – Investment transactions are recorded on the trade date. Interest income is recorded on the accrual basis. All premium and discount is amortized or accreted for financial statement purposes in accordance with U.S. generally accepted accounting principles. Dividends received in cash are recorded on the ex-dividend date. Certain dividends from foreign securities will be recorded when the fund is informed of the dividend if such information is obtained subsequent to the ex-dividend date. Dividend payments received in additional securities are recorded on the ex-dividend date in an amount equal to the value of the security on such date.
The fund may receive proceeds from litigation settlements. Any proceeds received from litigation involving portfolio holdings are reflected in the Statement of Operations in realized gain/loss if the security has been disposed of by the fund or in unrealized gain/loss if the security is still held by the fund. Any other proceeds from litigation not related to portfolio holdings are reflected as other income in the Statement of Operations.
Tax Matters and Distributions – The fund intends to qualify as a regulated investment company, as defined under Subchapter M of the Internal Revenue Code, and to distribute all of its taxable income, including realized capital gains. As a result, no provision for federal income tax is required. The fund’s federal tax returns, when filed, will remain subject to examination by the Internal Revenue Service for a three year period. Management has analyzed the fund’s tax positions taken on federal and state tax returns for all open tax years and does not believe that there are any uncertain tax positions that require recognition of a tax liability. Foreign taxes, if any, have been accrued by the fund in the accompanying financial statements in accordance with the applicable foreign tax law. Foreign income taxes may be withheld by certain countries in which the fund invests. Additionally, capital gains realized by the fund on securities issued in or by certain foreign countries may be subject to capital gains tax imposed by those countries.
15
MFS Utilities Series
Notes to Financial Statements (unaudited) – continued
Distributions to shareholders are recorded on the ex-dividend date. Income and capital gain distributions are determined in accordance with income tax regulations, which may differ from U.S. generally accepted accounting principles. Certain capital accounts in the financial statements are periodically adjusted for permanent differences in order to reflect their tax character. These adjustments have no impact on net assets or net asset value per share. Temporary differences which arise from recognizing certain items of income, expense, gain or loss in different periods for financial statement and tax purposes will reverse at some time in the future.
Book/tax differences primarily relate to wash sale loss deferrals, derivative transactions, redemptions in-kind, partnership adjustments, and certain preferred stock treated as debt for tax purposes.
The tax character of distributions declared to shareholders for the last fiscal year is as follows:
| | | | |
| | | Year ended | |
| | | 12/31/19 | |
| Ordinary income (including any short-term capital gains) | | | $51,291,242 | |
| Long-term capital gains | | | 3,834,215 | |
| Total distributions | | | $55,125,457 | |
The federal tax cost and the tax basis components of distributable earnings were as follows:
| | | | |
| As of 6/30/20 | | | | |
| |
| Cost of investments | | | $907,644,521 | |
| Gross appreciation | | | 271,987,336 | |
| Gross depreciation | | | (57,337,111 | ) |
| Net unrealized appreciation (depreciation) | | | $214,650,225 | |
| |
| As of 12/31/19 | | | | |
| |
| Undistributed ordinary income | | | 51,545,614 | |
| Undistributed long-term capital gain | | | 4,351,856 | |
| Other temporary differences | | | (35,564,483 | ) |
| Net unrealized appreciation (depreciation) | | | 352,957,309 | |
The aggregate cost above includes prior fiscal year end tax adjustments, if applicable.
Multiple Classes of Shares of Beneficial Interest – The fund offers multiple classes of shares, which differ in their respective distribution and/or service fees. The fund’s income, realized and unrealized gain (loss), and common expenses are allocated to shareholders based on the daily net assets of each class. Dividends are declared separately for each class. Differences in per share dividend rates are generally due to differences in separate class expenses. The fund’s distributions declared to shareholders as reported in the Statements of Changes in Net Assets are presented by class as follows:
| | | | | | | | |
| | |
| | | Six months ended
6/30/20 | | | Year ended
12/31/19 | |
| Initial Class | | | $— | | | | $22,976,155 | |
| Service Class | | | — | | | | 32,149,302 | |
| Total | | | $— | | | | $55,125,457 | |
| (3) | | Transactions with Affiliates |
Investment Adviser – The fund has an investment advisory agreement with MFS to provide overall investment management and related administrative services and facilities to the fund. The management fee is computed daily and paid monthly at the following annual rates based on the fund’s average daily net assets:
| | | | |
| Up to $1 billion | | | 0.75% | |
| In excess of $1 billion and up to $3 billion | | | 0.70% | |
| In excess of $3 billion | | | 0.65% | |
MFS has agreed in writing to reduce its management fee by a specified amount if certain MFS mutual fund assets exceed thresholds agreed to by MFS and the fund’s Board of Trustees. For the six months ended June 30, 2020, this management fee reduction amounted to $62,169, which is included in the reduction of total expenses in the Statement of Operations. The management fee incurred for the six months ended June 30, 2020 was equivalent to an annual effective rate of 0.73% of the fund’s average daily net assets.
Distributor – MFS Fund Distributors, Inc. (MFD), a wholly-owned subsidiary of MFS, is the distributor of shares of the fund. The Trustees have adopted a distribution plan for the Service Class shares pursuant to Rule 12b-1 under the Investment Company Act of 1940.
16
MFS Utilities Series
Notes to Financial Statements (unaudited) – continued
The fund’s distribution plan provides that the fund will pay MFD distribution and/or service fees equal to 0.25% per annum of its average daily net assets attributable to Service Class shares as partial consideration for services performed and expenses incurred by MFD and financial intermediaries (including participating insurance companies that invest in the fund to fund variable annuity and variable life insurance contracts, sponsors of qualified retirement and pension plans that invest in the fund, and affiliates of these participating insurance companies and plan sponsors) in connection with the sale and distribution of the Service Class shares. MFD may subsequently pay all, or a portion, of the distribution and/or service fees to financial intermediaries.
Shareholder Servicing Agent – MFS Service Center, Inc. (MFSC), a wholly-owned subsidiary of MFS, receives a fee from the fund for its services as shareholder servicing agent. For the six months ended June 30, 2020, the fee was $19,436, which equated to 0.0034% annually of the fund’s average daily net assets. MFSC also receives payment from the fund for out-of-pocket expenses paid by MFSC on behalf of the fund. For the six months ended June 30, 2020, these costs amounted to $1,486.
Administrator – MFS provides certain financial, legal, shareholder communications, compliance, and other administrative services to the fund. Under an administrative services agreement, the fund reimburses MFS the costs incurred to provide these services. The fund is charged an annual fixed amount of $17,500 plus a fee based on average daily net assets. The administrative services fee incurred for the six months ended June 30, 2020 was equivalent to an annual effective rate of 0.0145% of the fund’s average daily net assets.
Trustees’ and Officers’ Compensation – The fund pays compensation to independent Trustees in the form of a retainer, attendance fees, and additional compensation to Board and Committee chairpersons. The fund does not pay compensation directly to Trustees or officers of the fund who are also officers of the investment adviser, all of whom receive remuneration from MFS for their services to the fund. Certain officers and Trustees of the fund are officers or directors of MFS, MFD, and MFSC.
Other – The fund invests in the MFS Institutional Money Market Portfolio which is managed by MFS and seeks current income consistent with preservation of capital and liquidity. This money market fund does not pay a management fee to MFS but does incur investment and operating costs.
The fund is permitted to engage in purchase and sale transactions with funds and accounts for which MFS serves as investment adviser or sub-adviser (“cross-trades”) pursuant to a policy adopted by the Board of Trustees. This policy has been designed to ensure that cross-trades conducted by the fund comply with Rule 17a-7 under the Investment Company Act of 1940. During the six months ended June 30, 2020, the fund engaged in sale transactions pursuant to this policy, which amounted to $702,089. The sales transactions resulted in net realized gains (losses) of $(24,529).
The adviser has voluntarily undertaken to reimburse the fund from its own resources on a quarterly basis for the cost of investment research embedded in the cost of the fund’s securities trades. This agreement may be rescinded at any time. For the six months ended June 30, 2020, this reimbursement amounted to $45,712, which is included in “Other” income in the Statement of Operations.
For the six months ended June 30, 2020, purchases and sales of investments, other than short-term obligations, aggregated $225,303,700 and $256,223,315, respectively.
| (5) | | Shares of Beneficial Interest |
The fund’s Declaration of Trust permits the Trustees to issue an unlimited number of full and fractional shares of beneficial interest. Transactions in fund shares were as follows:
| | | | | | | | | | | | | | | | |
| | | Six months ended 6/30/20 | | | Year ended 12/31/19 | |
| | | | |
| | | Shares | | | Amount | | | Shares | | | Amount | |
| Shares sold | | | | | | | | | | | | | | | | |
Initial Class | | | 365,393 | | | | $11,947,243 | | | | 575,639 | | | | $19,334,145 | |
Service Class | | | 989,848 | | | | 30,355,286 | | | | 1,744,019 | | | | 57,235,971 | |
| | | 1,355,241 | | | | $42,302,529 | | | | 2,319,658 | | | | $76,570,116 | |
| | | | |
| Shares issued to shareholders in reinvestment of distributions | | | | | | | | | | | | | | | | |
Initial Class | | | — | | | | $— | | | | 693,515 | | | | $22,976,155 | |
Service Class | | | — | | | | — | | | | 987,083 | | | | 32,149,302 | |
| | | — | | | | $— | | | | 1,680,598 | | | | $55,125,457 | |
| | | | |
| Shares reacquired | | | | | | | | | | | | | | | | |
Initial Class | | | (1,062,537 | ) | | | $(34,566,516 | ) | | | (2,237,515 | ) | | | $(74,404,174 | ) |
Service Class | | | (2,372,781 | ) | | | (74,389,099 | ) | | | (6,687,020 | ) | | | (221,665,311 | ) |
| | | (3,435,318 | ) | | | $(108,955,615 | ) | | | (8,924,535 | ) | | | $(296,069,485 | ) |
17
MFS Utilities Series
Notes to Financial Statements (unaudited) – continued
| | | | | | | | | | | | | | | | |
| | | Six months ended 6/30/20 | | | Year ended 12/31/19 | |
| | | | |
| | | Shares | | | Amount | | | Shares | | | Amount | |
| Net change | | | | | | | | | | | | | | | | |
Initial Class | | | (697,144 | ) | | | $(22,619,273 | ) | | | (968,361 | ) | | | $(32,093,874 | ) |
Service Class | | | (1,382,933 | ) | | | (44,033,813 | ) | | | (3,955,918 | ) | | | (132,280,038 | ) |
| | | (2,080,077 | ) | | | $(66,653,086 | ) | | | (4,924,279 | ) | | | $(164,373,912 | ) |
The fund and certain other funds managed by MFS participate in a $1.25 billion unsecured committed line of credit, subject to a $1 billion sublimit, provided by a syndicate of banks under a credit agreement. Borrowings may be made for temporary financing needs. Interest is charged to each fund, based on its borrowings, generally at a rate equal to the highest of one month LIBOR, the Federal Funds Effective Rate and the Overnight Bank Funding Rate, plus an agreed upon spread. A commitment fee, based on the average daily, unused portion of the committed line of credit, is allocated among the participating funds. In addition, the fund and other funds managed by MFS have established unsecured uncommitted borrowing arrangements with certain banks for temporary financing needs. Interest is charged to each fund, based on its borrowings, at rates equal to customary reference rates plus an agreed upon spread. For the six months ended June 30, 2020, the fund’s commitment fee and interest expense were $3,096 and $0, respectively, and are included in “Miscellaneous” expense in the Statement of Operations.
| (7) | | Investments in Affiliated Issuers |
An affiliated issuer may be considered one in which the fund owns 5% or more of the outstanding voting securities, or a company which is under common control. For the purposes of this report, the following were affiliated issuers:
| | | | | | | | | | | | | | | | | | | | | | | | |
| Affiliated Issuers | | Beginning
Value | | | Purchases | | | Sales
Proceeds | | | Realized
Gain
(Loss) | | | Change in
Unrealized
Appreciation or
Depreciation | | | Ending
Value | |
| MFS Institutional Money Market Portfolio | | | $13,336,599 | | | | $112,657,576 | | | | $102,462,482 | | | | $2,084 | | | | $272 | | | | $23,534,049 | |
| | | | | | |
| Affiliated Issuers | | | | | | | | | | | | | | Dividend
Income | | | Capital Gain
Distributions | |
| MFS Institutional Money Market Portfolio | | | | | | | | | | | | $63,174 | | | | $— | |
The pandemic related to the global spread of novel coronavirus disease (COVID-19), which was first detected in December 2019, has resulted in significant disruptions to global business activity and the global economy, as well as the economies of individual countries, the financial performance of individual companies and sectors, and the securities and commodities markets in general. This pandemic, the full effects of which are still unknown, has resulted in substantial market volatility and may have adversely impacted the prices and liquidity of the fund’s investments and the fund’s performance.
18
MFS Utilities Series
STATEMENT REGARDING LIQUIDITY RISK MANAGEMENT PROGRAM
The fund has adopted and implemented a liquidity risk management program (the “Program”) as required by Rule 22e-4 under the Investment Company Act of 1940, as amended. The fund’s Board of Trustees (the “Board”) has designated MFS as the administrator of the Program. The Program is reasonably designed to assess and manage the liquidity risk of the fund. Liquidity risk is the risk that the fund could not meet requests to redeem shares issued by the fund without significant dilution of remaining investors’ interests.
MFS provided a written report to the Board for consideration at its April 2020 meeting that addressed the operation of the Program and provided an assessment of the adequacy and effectiveness of the Program during the period from the adoption of the Program on December 1, 2018 to December 31, 2019 (the “Covered Period”). The report concluded that during the Covered Period the Program had operated effectively and had adequately and effectively been implemented to assess and manage the fund’s liquidity risk. MFS also reported that there were no liquidity events that impacted the fund or its ability to timely meet redemptions without dilution to existing shareholders during the Covered Period.
There can be no assurance that the Program will achieve its objectives in the future. Further information on liquidity risk, and other principal risks to which an investment in the fund may be subject, can be found in the prospectus.
19
MFS Utilities Series
PROXY VOTING POLICIES AND INFORMATION
MFS votes proxies on behalf of the fund pursuant to proxy voting policies and procedures that are available without charge, upon request, by calling 1-800-225-2606, by visiting mfs.com/proxyvoting, or by visiting the SEC’s Web site at http://www.sec.gov.
Information regarding how the fund voted proxies relating to portfolio securities during the most recent twelve-month period ended June 30 is available by August 31 of each year without charge by visiting mfs.com/proxyvoting, or by visiting the SEC’s Web site at http://www.sec.gov.
QUARTERLY PORTFOLIO DISCLOSURE
The fund files a complete schedule of portfolio holdings with the SEC for the first and third quarters of each fiscal year as an exhibit to its reports on Form N-PORT. The fund’s Form N-PORT reports are available on the SEC’s website at http://www.sec.gov. A shareholder can obtain the portfolio holdings report for the first and third quarters of the fund’s fiscal year at mfs.com/vit1 by choosing the fund’s name and then selecting the “Resources” tab and clicking on “Prospectus and Reports”.
FURTHER INFORMATION
From time to time, MFS may post important information about the fund or the MFS funds on the MFS web site (mfs.com). This information is available at https://www.mfs.com/announcements or at mfs.com/vit1 by choosing the fund’s name and then selecting the “Resources” tab and clicking on the “Announcements” tab, if any.
INFORMATION ABOUT FUND CONTRACTS AND LEGAL CLAIMS
The fund has entered into contractual arrangements with an investment adviser, administrator, distributor, shareholder servicing agent, 529 program manager (if applicable), and custodian who each provide services to the fund. Unless expressly stated otherwise, shareholders are not parties to, or intended beneficiaries of these contractual arrangements, and these contractual arrangements are not intended to create any shareholder right to enforce them against the service providers or to seek any remedy under them against the service providers, either directly or on behalf of the fund.
Under the Trust’s By-Laws and Declaration of Trust, any claims asserted against or on behalf of the MFS Funds, including claims against Trustees and Officers, must be brought in state and federal courts located within the Commonwealth of Massachusetts.
20
Semiannual Report
June 30, 2020

MFS® Value Series

MFS® Variable Insurance Trust
Beginning on January 1, 2021, as permitted by regulations adopted by the U.S. Securities and Exchange Commission, the insurance company that offers your contract may determine that it will no longer send you paper copies of the fund’s annual and semiannual shareholder reports unless you specifically request paper copies from the insurance company or from your financial intermediary. Instead, the shareholder reports will be made available on a Web site (insurancefunds.mfs.com or other Web site of which you will be notified), and the insurance company will notify you by mail each time a report is posted and provide you with a Web site link to access the report. Instructions for requesting paper copies will be provided by your insurance company or financial intermediary.
If you already elected to receive shareholder reports by email, you will not be affected by this change and you need not take any action. If your insurance company or financial intermediary offers electronic delivery, you may elect to receive shareholder reports and other communications from the insurance company or financial intermediary by email by following the instructions provided by the insurance company or financial intermediary.
Beginning on January 1, 2019, you may elect to receive all future reports in paper free of charge from the insurance company or financial intermediary. You can inform the insurance company or financial intermediary that you wish to continue receiving paper copies of your shareholder reports by contacting your insurance company or financial intermediary. Your election to receive reports in paper will apply to all funds held in your account with your insurance company or financial intermediary.
VLU-SEM
MFS® Value Series
CONTENTS
The report is prepared for the general information of contract owners. It is authorized for distribution to prospective investors only when preceded or accompanied by a current prospectus.
NOT FDIC INSURED • MAY LOSE VALUE • NO BANK OR CREDIT UNION GUARANTEE • NOT A DEPOSIT • NOT INSURED BY ANY FEDERAL GOVERNMENT AGENCY OR NCUA/NCUSIF
MFS Value Series
LETTER FROM THE EXECUTIVE CHAIR

Dear Contract Owners:
Markets experienced dramatic swings in early 2020, as the coronavirus pandemic brought the global economy to a standstill for several months. Optimism over the development of vaccines and therapeutics, along with a decline in cases in countries that had been affected by the outbreak early on, brightened the economic and market outlook during the second quarter, as did the phased reopening of US states. However, a great deal of uncertainty remains, including the possibility of a second wave of cases later this year, as many countries continue to experience COVID-19 flare-ups.
Global central banks have taken aggressive steps to cushion the economic and market fallout related to the virus, and governments are deploying unprecedented levels of fiscal support. As uncertainty recedes, these measures can help build a supportive environment and encourage economic recovery; however, if markets disconnect from fundamentals, they can also sow the seeds of instability. In the aftermath of the crisis, societal changes may be likely, as households, businesses, and governments adjust to a new reality, and these alterations could affect the investment landscape. For investors, events, such as the COVID-19 outbreak, demonstrate the importance of having a deep understanding of company fundamentals, and we have built our global research platform to do just that.
Here at MFS®, we aim to help our clients navigate the growing complexity of the markets and world economies. Our long-term investment philosophy and commitment to the responsible allocation of capital allow us to tune out the noise and uncover what we believe are the best, most durable investment opportunities in the market. Through our unique global investment platform, we combine collective expertise, thoughtful risk management, and long-term discipline to create sustainable value for investors.
Respectfully,

Robert J. Manning
Executive Chair
MFS Investment Management
August 17, 2020
The opinions expressed in this letter are subject to change, may not be relied upon for investment advice, and no forecasts can be guaranteed.
1
MFS Value Series
PORTFOLIO COMPOSITION
Portfolio structure

| | | | |
| Top ten holdings | | | | |
| Johnson & Johnson | | | 4.1% | |
| JPMorgan Chase & Co. | | | 3.9% | |
| Comcast Corp., “A” | | | 3.0% | |
| Medtronic PLC | | | 2.8% | |
| Accenture PLC, “A” | | | 2.7% | |
| Aon PLC | | | 2.5% | |
| Texas Instruments, Inc. | | | 2.4% | |
| Honeywell International, Inc. | | | 2.4% | |
| Cigna Corp. | | | 2.4% | |
| Northrop Grumman Corp. | | | 2.3% | |
| | | | |
| GICS equity sectors (g) | | | | |
| Financials | | | 24.8% | |
| Health Care | | | 19.7% | |
| Industrials | | | 17.2% | |
| Information Technology | | | 10.8% | |
| Utilities | | | 7.7% | |
| Consumer Staples | | | 7.2% | |
| Materials | | | 3.6% | |
| Communication Services | | | 3.4% | |
| Energy | | | 2.8% | |
| Consumer Discretionary | | | 1.1% | |
| Real Estate | | | 0.3% | |
| (g) | The Global Industry Classification Standard (GICS®) was developed by and/or is the exclusive property of MSCI, Inc. and S&P Global Market Intelligence Inc. (“S&P Global Market Intelligence”). GICS is a service mark of MSCI and S&P Global Market Intelligence and has been licensed for use by MFS. |
Cash & Cash Equivalents includes any cash, investments in money market funds, short-term securities, and other assets less liabilities. Please see the Statement of Assets and Liabilities for additional information related to the fund’s cash position and other assets and liabilities.
Percentages are based on net assets as of June 30, 2020.
The portfolio is actively managed and current holdings may be different.
2
MFS Value Series
EXPENSE TABLE
Fund Expenses Borne by the Contract Holders during the Period,
January 1, 2020 through June 30, 2020
As a contract holder of the fund, you incur ongoing costs, including management fees; distribution and/or service (12b-1) fees; and other fund expenses. This example is intended to help you understand your ongoing costs (in dollars) of investing in the fund and to compare these costs with the ongoing costs of investing in other mutual funds.
The example is based on an investment of $1,000 invested at the beginning of the period and held for the entire period January 1, 2020 through June 30, 2020.
Actual Expenses
The first line for each share class in the following table provides information about actual account values and actual expenses. You may use the information in this line, together with the amount you invested, to estimate the expenses that you paid over the period. Simply divide your account value by $1,000 (for example, an $8,600 account value divided by $1,000 = 8.6), then multiply the result by the number in the first line under the heading entitled “Expenses Paid During Period” to estimate the expenses you paid on your account during this period.
Hypothetical Example for Comparison Purposes
The second line for each share class in the following table provides information about hypothetical account values and hypothetical expenses based on the fund’s actual expense ratio and an assumed rate of return of 5% per year before expenses, which is not the fund’s actual return. The hypothetical account values and expenses may not be used to estimate the actual ending account balance or expenses you paid for the period. You may use this information to compare the ongoing costs of investing in the fund and other funds. To do so, compare this 5% hypothetical example with the 5% hypothetical examples that appear in the shareholder reports of the other funds.
Please note that the expenses shown in the table are meant to highlight the fund’s ongoing costs only and do not take into account the fees and expenses imposed under the variable contracts through which your investment in the fund is made. Therefore, the second line for each share class in the table is useful in comparing ongoing costs associated with an investment in vehicles (such as the fund) which fund benefits under variable annuity and variable life insurance contracts and to qualified pension and retirement plans only, and will not help you determine the relative total costs of investing in the fund through variable annuity and variable life insurance contracts. If the fees and expenses imposed under the variable contracts were included, your costs would have been higher.
| | | | | | | | | | | | | | | | | | |
| Share Class | | | | Annualized
Expense Ratio | | | Beginning
Account Value
1/01/20 | | | Ending
Account Value
6/30/20 | | | Expenses Paid
During Period (p)
1/01/20-6/30/20 | |
| Initial Class | | Actual | | | 0.71% | | | | $1,000.00 | | | | $867.30 | | | | $3.30 | |
| | Hypothetical (h) | | | 0.71% | | | | $1,000.00 | | | | $1,021.33 | | | | $3.57 | |
| Service Class | | Actual | | | 0.96% | | | | $1,000.00 | | | | $866.47 | | | | $4.46 | |
| | Hypothetical (h) | | | 0.96% | | | | $1,000.00 | | | | $1,020.09 | | | | $4.82 | |
| (h) | 5% class return per year before expenses. |
| (p) | “Expenses Paid During Period” are equal to each class’s annualized expense ratio, as shown above, multiplied by the average account value over the period, multiplied by 182/366 (to reflect the one-half year period). |
3
MFS Value Series
PORTFOLIO OF INVESTMENTS – 6/30/20 (unaudited)
The Portfolio of Investments is a complete list of all securities owned by your fund. It is categorized by broad-based asset classes.
| | | | | | | | |
| Issuer | | Shares/Par | | | Value ($) | |
| COMMON STOCKS – 98.6% | |
| Aerospace – 6.6% | | | | | | | | |
| Honeywell International, Inc. | | | 348,680 | | | $ | 50,415,641 | |
| Lockheed Martin Corp. | | | 69,185 | | | | 25,246,990 | |
| Northrop Grumman Corp. | | | 161,073 | | | | 49,520,283 | |
| Raytheon Technologies Corp. | | | 237,165 | | | | 14,614,108 | |
| | | | | | | | |
| | | | | | $ | 139,797,022 | |
| | | | | | | | |
| Alcoholic Beverages – 1.4% | | | | | |
| Diageo PLC | | | 911,670 | | | $ | 30,291,586 | |
| | | | | | | | |
| Automotive – 0.2% | | | | | |
| Aptiv PLC | | | 66,644 | | | $ | 5,192,900 | |
| | | | | | | | |
| Brokerage & Asset Managers – 3.4% | | | | | |
| BlackRock, Inc. | | | 50,362 | | | $ | 27,401,461 | |
| NASDAQ, Inc. | | | 270,415 | | | | 32,306,480 | |
| T. Rowe Price Group, Inc. | | | 100,088 | | | | 12,360,868 | |
| | | | | | | | |
| | | | | | $ | 72,068,809 | |
| | | | | | | | |
| Business Services – 6.8% | | | | | |
| Accenture PLC, “A” | | | 265,740 | | | $ | 57,059,693 | |
| Equifax, Inc. | | | 147,454 | | | | 25,344,393 | |
| Fidelity National Information Services, Inc. | | | 233,895 | | | | 31,362,981 | |
| Fiserv, Inc. (a) | | | 321,532 | | | | 31,387,954 | |
| | | | | | | | |
| | | | | | $ | 145,155,021 | |
| | | | | | | | |
| Cable TV – 3.0% | | | | | |
| Comcast Corp., “A” | | | 1,614,572 | | | $ | 62,936,017 | |
| | | | | | | | |
| Chemicals – 1.6% | | | | | |
| PPG Industries, Inc. | | | 313,655 | | | $ | 33,266,249 | |
| | | | | | | | |
| Construction – 3.6% | | | | | |
| Masco Corp. | | | 368,140 | | | $ | 18,484,309 | |
| Otis Worldwide Corp. | | | 118,582 | | | | 6,742,573 | |
| Sherwin-Williams Co. | | | 47,458 | | | | 27,423,605 | |
| Stanley Black & Decker, Inc. | | | 169,491 | | | | 23,623,656 | |
| | | | | | | | |
| | | | | | $ | 76,274,143 | |
| | | | | | | | |
| Consumer Products – 1.4% | | | | | |
| Colgate-Palmolive Co. | | | 66,306 | | | $ | 4,857,578 | |
| Kimberly-Clark Corp. | | | 97,186 | | | | 13,737,241 | |
| Reckitt Benckiser Group PLC | | | 127,609 | | | | 11,751,507 | |
| | | | | | | | |
| | | | | | $ | 30,346,326 | |
| | | | | | | | |
| Electrical Equipment – 1.0% | | | | | |
| Johnson Controls International PLC | | | 592,607 | | | $ | 20,231,603 | |
| | | | | | | | |
| Electronics – 5.1% | | | | | |
| Analog Devices, Inc. | | | 132,467 | | | $ | 16,245,753 | |
| Intel Corp. | | | 399,978 | | | | 23,930,684 | |
| NXP Semiconductors N.V. | | | 165,169 | | | | 18,835,873 | |
| Texas Instruments, Inc. | | | 397,283 | | | | 50,443,022 | |
| | | | | | | | |
| | | | | | $ | 109,455,332 | |
| | | | | | | | |
| Energy – Independent – 1.6% | | | | | |
| ConocoPhillips | | | 399,492 | | | $ | 16,786,654 | |
| EOG Resources, Inc. | | | 211,350 | | | | 10,706,991 | |
| | | | | | | | |
| Issuer | | Shares/Par | | | Value ($) | |
| COMMON STOCKS – continued | |
| Energy – Independent – continued | | | | | |
| Pioneer Natural Resources Co. | | | 63,747 | | | $ | 6,228,082 | |
| | | | | | | | |
| | | | | | $ | 33,721,727 | |
| | | | | | | | |
| Energy – Integrated – 1.2% | | | | | |
| Chevron Corp. | | | 156,118 | | | $ | 13,930,409 | |
| Suncor Energy, Inc. | | | 682,202 | | | | 11,502,360 | |
| | | | | | | | |
| | | | | | $ | 25,432,769 | |
| | | | | | | | |
| Food & Beverages – 3.8% | | | | | |
| Archer Daniels Midland Co. | | | 299,594 | | | $ | 11,953,801 | |
| Danone S.A. | | | 129,753 | | | | 8,974,059 | |
| J.M. Smucker Co. | | | 57,688 | | | | 6,103,967 | |
| Nestle S.A. | | | 378,227 | | | | 41,812,757 | |
| PepsiCo, Inc. | | | 95,282 | | | | 12,601,997 | |
| | | | | | | | |
| | | | | | $ | 81,446,581 | |
| | | | | | | | |
| Gaming & Lodging – 0.3% | | | | | |
| Marriott International, Inc., “A” | | | 74,194 | | | $ | 6,360,652 | |
| | | | | | | | |
| Health Maintenance Organizations – 2.4% | | | | | |
| Cigna Corp. | | | 267,677 | | | $ | 50,229,589 | |
| | | | | | | | |
| Insurance – 8.4% | | | | | |
| AON PLC | | | 276,297 | | | $ | 53,214,802 | |
| Chubb Ltd. | | | 351,203 | | | | 44,469,324 | |
| Marsh & McLennan Cos., Inc. | | | 404,729 | | | | 43,455,752 | |
| Travelers Cos., Inc. | | | 334,475 | | | | 38,146,874 | |
| | | | | | | | |
| | | | | | $ | 179,286,752 | |
| | | | | | | | |
| Machinery & Tools – 4.2% | | | | | |
| Carrier Global Corp. | | | 174,011 | | | $ | 3,866,524 | �� |
| Eaton Corp. PLC | | | 314,475 | | | | 27,510,273 | |
| Illinois Tool Works, Inc. | | | 232,881 | | | | 40,719,243 | |
| Trane Technologies PLC | | | 190,750 | | | | 16,972,935 | |
| | | | | | | | |
| | | | | | $ | 89,068,975 | |
| | | | | | | | |
| Major Banks – 7.0% | | | | | |
| Goldman Sachs Group, Inc. | | | 167,195 | | | $ | 33,041,076 | |
| JPMorgan Chase & Co. | | | 880,517 | | | | 82,821,429 | |
| PNC Financial Services Group, Inc. | | | 195,186 | | | | 20,535,519 | |
| State Street Corp. | | | 209,655 | | | | 13,323,575 | |
| | | | | | | | |
| | | | | | $ | 149,721,599 | |
| | | | | | | | |
| Medical & Health Technology & Services – 1.0% | |
| McKesson Corp. | | | 134,052 | | | $ | 20,566,258 | |
| | | | | | | | |
| Medical Equipment – 8.5% | | | | | |
| Abbott Laboratories | | | 341,915 | | | $ | 31,261,289 | |
| Boston Scientific Corp. (a) | | | 459,694 | | | | 16,139,856 | |
| Danaher Corp. | | | 209,147 | | | | 36,983,464 | |
| Medtronic PLC | | | 638,897 | | | | 58,586,855 | |
| Thermo Fisher Scientific, Inc. | | | 102,598 | | | | 37,175,359 | |
| | | | | | | | |
| | | | | | $ | 180,146,823 | |
| | | | | | | | |
4
MFS Value Series
Portfolio of Investments (unaudited) – continued
| | | | | | | | |
| Issuer | | Shares/Par | | | Value ($) | |
| COMMON STOCKS – continued | |
| Other Banks & Diversified Financials – 5.9% | |
| American Express Co. | | | 185,818 | | | $ | 17,689,873 | |
| Citigroup, Inc. | | | 838,928 | | | | 42,869,221 | |
| Moody’s Corp. | | | 48,633 | | | | 13,360,944 | |
| Truist Financial Corp. | | | 562,406 | | | | 21,118,345 | |
| U.S. Bancorp | | | 811,891 | | | | 29,893,827 | |
| | | | | | | | |
| | | | | | $ | 124,932,210 | |
| | | | | | | | |
| Pharmaceuticals – 7.9% | |
| Johnson & Johnson | | | 618,604 | | | $ | 86,994,281 | |
| Merck & Co., Inc. | | | 402,849 | | | | 31,152,313 | |
| Pfizer, Inc. | | | 1,141,846 | | | | 37,338,364 | |
| Roche Holding AG | | | 34,864 | | | | 12,082,531 | |
| | | | | | | | |
| | | | | | $ | 167,567,489 | |
| | | | | | | | |
| Railroad & Shipping – 2.0% | |
| Canadian National Railway Co. | | | 149,637 | | | $ | 13,253,349 | |
| Union Pacific Corp. | | | 175,817 | | | | 29,725,380 | |
| | | | | | | | |
| | | | | | $ | 42,978,729 | |
| | | | | | | | |
| Real Estate – 0.3% | |
| Public Storage, Inc., REIT | | | 38,585 | | | $ | 7,404,076 | |
| | | | | | | | |
| Specialty Chemicals – 0.8% | |
| DuPont de Nemours, Inc. | | | 303,192 | | | $ | 16,108,591 | |
| | | | | | | | |
| Specialty Stores – 0.5% | |
| Lowe’s Cos., Inc. | | | 80,045 | | | $ | 10,815,680 | |
| | | | | | | | |
| Telephone Services – 0.5% | |
| Verizon Communications, Inc. | | | 186,517 | | | $ | 10,282,682 | |
| | | | | | | | |
| Tobacco – 0.5% | |
| Philip Morris International, Inc. | | | 148,509 | | | $ | 10,404,541 | |
| | | | | | | | |
| | | | | | | | |
| Issuer | | Shares/Par | | | Value ($) | |
| COMMON STOCKS – continued | |
| Utilities – Electric Power – 7.7% | |
| American Electric Power Co., Inc. | | | 161,774 | | | $ | 12,883,681 | |
| Dominion Energy, Inc. | | | 296,464 | | | | 24,066,948 | |
| Duke Energy Corp. | | | 611,633 | | | | 48,863,360 | |
| FirstEnergy Corp. | | | 662,086 | | | | 25,675,695 | |
| Southern Co. | | | 749,694 | | | | 38,871,634 | |
| Xcel Energy, Inc. | | | 210,554 | | | | 13,159,625 | |
| | | | | | | | |
| | | | | | $ | 163,520,943 | |
| | | | | | | | |
Total Common Stocks
(Identified Cost, $1,368,415,193) | | | $ | 2,095,011,674 | |
| | | | | | | | |
| |
| INVESTMENT COMPANIES (h) – 1.3% | | | | | |
| Money Market Funds – 1.3% | | | | | | | | |
| MFS Institutional Money Market Portfolio, 0.17% (v) (Identified Cost, $27,336,620) | | | 27,334,840 | | | $ | 27,337,574 | |
| | | | | | | | |
OTHER ASSETS, LESS
LIABILITIES – 0.1% | | | | | | | 2,773,336 | |
| | | | | | | | |
| NET ASSETS – 100.0% | | | | | | $ | 2,125,122,584 | |
| | | | | | | | |
| (a) | | Non-income producing security. |
| (h) | | An affiliated issuer, which may be considered one in which the fund owns 5% or more of the outstanding voting securities, or a company which is under common control. At period end, the aggregate values of the fund’s investments in affiliated issuers and in unaffiliated issuers were $27,337,574 and $2,095,011,674, respectively. |
| (v) | | Affiliated issuer that is available only to investment companies managed by MFS. The rate quoted for the MFS Institutional Money Market Portfolio is the annualized seven-day yield of the fund at period end. |
The following abbreviations are used in this report and are defined:
| REIT | | Real Estate Investment Trust |
See Notes to Financial Statements
5
MFS Value Series
FINANCIAL STATEMENTS | STATEMENT OF ASSETS AND LIABILITIES (unaudited)
This statement represents your fund’s balance sheet, which details the assets and liabilities comprising the total value of the fund.
| | | | |
At 6/30/20 | | | | |
| |
Assets | | | | |
Investments in unaffiliated issuers, at value (identified cost, $1,368,415,193) | | | $2,095,011,674 | |
Investments in affiliated issuers, at value (identified cost, $27,336,620) | | | 27,337,574 | |
Cash | | | 154,795 | |
Receivables for | | | | |
Investments sold | | | 1,398,301 | |
Fund shares sold | | | 1,428,698 | |
Interest and dividends | | | 3,955,322 | |
Other assets | | | 7,182 | |
Total assets | | | $2,129,293,546 | |
| |
Liabilities | | | | |
Payables for | | | | |
Investments purchased | | | $1,354,042 | |
Fund shares reacquired | | | 2,537,647 | |
Payable to affiliates | | | | |
Investment adviser | | | 57,264 | |
Administrative services fee | | | 1,644 | |
Shareholder servicing costs | | | 1,117 | |
Distribution and/or service fees | | | 14,761 | |
Accrued expenses and other liabilities | | | 204,487 | |
Total liabilities | | | $4,170,962 | |
Net assets | | | $2,125,122,584 | |
| |
Net assets consist of | | | | |
Paid-in capital | | | $1,195,770,902 | |
Total distributable earnings (loss) | | | 929,351,682 | |
Net assets | | | $2,125,122,584 | |
Shares of beneficial interest outstanding | | | 118,292,207 | |
| | | | | | | | | | | | |
| | | |
| | | Net assets | | | Shares
outstanding | | | Net asset value
per share | |
Initial Class | | | $1,024,413,042 | | | | 56,380,535 | | | | $18.17 | |
Service Class | | | 1,100,709,542 | | | | 61,911,672 | | | | 17.78 | |
See Notes to Financial Statements
6
MFS Value Series
FINANCIAL STATEMENTS | STATEMENT OF OPERATIONS (unaudited)
This statement describes how much your fund earned in investment income and accrued in expenses. It also describes any gains and/or losses generated by fund operations.
| | | | |
Six months ended 6/30/20 | | | | |
| |
Net investment income (loss) | | | | |
Income | | | | |
Dividends | | | $26,495,859 | |
Income on securities loaned | | | 158,244 | |
Dividends from affiliated issuers | | | 141,258 | |
Other | | | 37,695 | |
Foreign taxes withheld | | | (308,084 | ) |
Total investment income | | | $26,524,972 | |
Expenses | | | | |
Management fee | | | $7,216,054 | |
Distribution and/or service fees | | | 1,401,288 | |
Shareholder servicing costs | | | 22,708 | |
Administrative services fee | | | 146,216 | |
Independent Trustees’ compensation | | | 17,206 | |
Custodian fee | | | 57,593 | |
Shareholder communications | | | 61,046 | |
Audit and tax fees | | | 29,318 | |
Legal fees | | | 9,700 | |
Miscellaneous | | | 24,506 | |
Total expenses | | | $8,985,635 | |
Reduction of expenses by investment adviser | | | (239,709 | ) |
Net expenses | | | $8,745,926 | |
Net investment income (loss) | | | $17,779,046 | |
| |
Realized and unrealized gain (loss) | | | | |
Realized gain (loss) (identified cost basis) | | | | |
Unaffiliated issuers | | | $59,243,221 | |
Affiliated issuers | | | (8,773 | ) |
Foreign currency | | | (29,823 | ) |
Net realized gain (loss) | | | $59,204,625 | |
Change in unrealized appreciation or depreciation | | | | |
Unaffiliated issuers | | | $(369,219,614 | ) |
Affiliated issuers | | | 954 | |
Translation of assets and liabilities in foreign currencies | | | 27,433 | |
Net unrealized gain (loss) | | | $(369,191,227 | ) |
Net realized and unrealized gain (loss) | | | $(309,986,602 | ) |
Change in net assets from operations | | | $(292,207,556 | ) |
See Notes to Financial Statements
7
MFS Value Series
FINANCIAL STATEMENTS | STATEMENTS OF CHANGES IN NET ASSETS
These statements describe the increases and/or decreases in net assets resulting from operations, any distributions, and any shareholder transactions.
| | | | | | | | |
| | | Six months ended
6/30/20 | | | Year ended
12/31/19 | |
| | | (unaudited) | | | | |
Change in net assets | | | | | | | | |
| | |
From operations | | | | | | | | |
Net investment income (loss) | | | $17,779,046 | | | | $32,574,207 | |
Net realized gain (loss) | | | 59,204,625 | | | | 103,173,679 | |
Net unrealized gain (loss) | | | (369,191,227 | ) | | | 413,709,693 | |
Change in net assets from operations | | | $(292,207,556 | ) | | | $549,457,579 | |
Total distributions to shareholders | | | $— | | | | $(138,541,235 | ) |
Change in net assets from fund share transactions | | | $193,024,060 | | | | $(138,202,942 | ) |
Total change in net assets | | | $(99,183,496 | ) | | | $272,713,402 | |
| | |
Net assets | | | | | | | | |
At beginning of period | | | 2,224,306,080 | | | | 1,951,592,678 | |
At end of period | | | $2,125,122,584 | | | | $2,224,306,080 | |
See Notes to Financial Statements
8
MFS Value Series
FINANCIAL STATEMENTS | FINANCIAL HIGHLIGHTS
The financial highlights table is intended to help you understand the fund’s financial performance for the semiannual period and the past 5 fiscal years. Certain information reflects financial results for a single fund share. The total returns in the table represent the rate that an investor would have earned (or lost) on an investment in the fund share class (assuming reinvestment of all distributions) held for the entire period.
| | | | | | | | | | | | | | | | | | | | | | | | |
| Initial Class | | Six months
ended 6/30/20 | | | Year ended | |
| | | 12/31/19 | | | 12/31/18 | | | 12/31/17 | | | 12/31/16 | | | 12/31/15 | |
| | | | | | |
| | | (unaudited) | | | | | | | | | | | | | | | | |
| | | | | | |
Net asset value, beginning of period | | | $20.95 | | | | $17.30 | | | | $20.92 | | | | $18.90 | | | | $18.39 | | | | $20.34 | |
|
| Income (loss) from investment operations | |
Net investment income (loss) (d) | | | $0.17 | | | | $0.33 | | | | $0.41 | | | | $0.30 | | | | $0.38 | (c) | | | $0.40 | |
Net realized and unrealized gain (loss) | | | (2.95 | ) | | | 4.68 | | | | (2.32 | ) | | | 2.93 | | | | 2.16 | | | | (0.67 | ) |
Total from investment operations | | | $(2.78 | ) | | | $5.01 | | | | $(1.91 | ) | | | $3.23 | | | | $2.54 | | | | $(0.27 | ) |
|
| Less distributions declared to shareholders | |
From net investment income | | | $— | | | | $(0.44 | ) | | | $(0.32 | ) | | | $(0.40 | ) | | | $(0.42 | ) | | | $(0.48 | ) |
From net realized gain | | | — | | | | (0.92 | ) | | | (1.39 | ) | | | (0.81 | ) | | | (1.61 | ) | | | (1.20 | ) |
Total distributions declared to shareholders | | | $— | | | | $(1.36 | ) | | | $(1.71 | ) | | | $(1.21 | ) | | | $(2.03 | ) | | | $(1.68 | ) |
Net asset value, end of period (x) | | | $18.17 | | | | $20.95 | | | | $17.30 | | | | $20.92 | | | | $18.90 | | | | $18.39 | |
Total return (%) (k)(r)(s)(x) | | | (13.27 | )(n) | | | 29.80 | | | | (10.09 | ) | | | 17.65 | | | | 14.09 | (c) | | | (0.74 | ) |
| |
Ratios (%) (to average net assets)
and Supplemental data: | | | | | |
Expenses before expense reductions (f) | | | 0.73 | (a) | | | 0.73 | | | | 0.73 | | | | 0.74 | | | | 0.73 | (c) | | | 0.73 | |
Expenses after expense reductions (f) | | | 0.71 | (a) | | | 0.72 | | | | 0.72 | | | | 0.73 | | | | 0.72 | (c) | | | 0.73 | |
Net investment income (loss) | | | 1.87 | (a) | | | 1.67 | | | | 2.02 | | | | 1.51 | | | | 2.02 | (c) | | | 2.00 | |
Portfolio turnover | | | 11 | (n) | | | 13 | | | | 8 | | | | 10 | | | | 15 | | | | 13 | |
Net assets at end of period (000 omitted) | | | $1,024,413 | | | | $945,183 | | | | $823,744 | | | | $996,794 | | | | $968,078 | | | | $964,811 | |
| | |
| Service Class | | Six months
ended 6/30/20 | | | Year ended | |
| | | 12/31/19 | | | 12/31/18 | | | 12/31/17 | | | 12/31/16 | | | 12/31/15 | |
| | | | | | |
| | | (unaudited) | | | | | | | | | | | | | | | | |
| | | | | | |
Net asset value, beginning of period | | | $20.52 | | | | $16.96 | | | | $20.55 | | | | $18.59 | | | | $18.12 | | | | $20.05 | |
|
| Income (loss) from investment operations | |
Net investment income (loss) (d) | | | $0.14 | | | | $0.27 | | | | $0.35 | | | | $0.25 | | | | $0.33 | (c) | | | $0.34 | |
Net realized and unrealized gain (loss) | | | (2.88 | ) | | | 4.59 | | | | (2.28 | ) | | | 2.87 | | | | 2.11 | | | | (0.65 | ) |
Total from investment operations | | | $(2.74 | ) | | | $4.86 | | | | $(1.93 | ) | | | $3.12 | | | | $2.44 | | | | $(0.31 | ) |
|
| Less distributions declared to shareholders | |
From net investment income | | | $— | | | | $(0.38 | ) | | | $(0.27 | ) | | | $(0.35 | ) | | | $(0.36 | ) | | | $(0.42 | ) |
From net realized gain | | | — | | | | (0.92 | ) | | | (1.39 | ) | | | (0.81 | ) | | | (1.61 | ) | | | (1.20 | ) |
Total distributions declared to shareholders | | | $— | | | | $(1.30 | ) | | | $(1.66 | ) | | | $(1.16 | ) | | | $(1.97 | ) | | | $(1.62 | ) |
Net asset value, end of period (x) | | | $17.78 | | | | $20.52 | | | | $16.96 | | | | $20.55 | | | | $18.59 | | | | $18.12 | |
Total return (%) (k)(r)(s)(x) | | | (13.35 | )(n) | | | 29.51 | | | | (10.36 | ) | | | 17.35 | | | | 13.78 | (c) | | | (0.93 | ) |
|
Ratios (%) (to average net assets)
and Supplemental data: | |
Expenses before expense reductions (f) | | | 0.98 | (a) | | | 0.98 | | | | 0.98 | | | | 0.99 | | | | 0.98 | (c) | | | 0.98 | |
Expenses after expense reductions (f) | | | 0.96 | (a) | | | 0.97 | | | | 0.97 | | | | 0.98 | | | | 0.97 | (c) | | | 0.98 | |
Net investment income (loss) | | | 1.59 | (a) | | | 1.42 | | | | 1.77 | | | | 1.26 | | | | 1.78 | (c) | | | 1.76 | |
Portfolio turnover | | | 11 | (n) | | | 13 | | | | 8 | | | | 10 | | | | 15 | | | | 13 | |
Net assets at end of period (000 omitted) | | | $1,100,710 | | | | $1,279,123 | | | | $1,127,848 | | | | $1,398,374 | | | | $1,302,307 | | | | $1,167,754 | |
See Notes to Financial Statements
9
MFS Value Series
Financial Highlights – continued
| (c) | Amount reflects a one-time reimbursement of expenses by the custodian (or former custodian) without which net investment income and performance would be lower and expenses would be higher. |
| (d) | Per share data is based on average shares outstanding. |
| (f) | Ratios do not reflect reductions from fees paid indirectly, if applicable. |
| (k) | The total return does not reflect expenses that apply to separate accounts. Inclusion of these charges would reduce the total return figures for all periods shown. |
| (r) | Certain expenses have been reduced without which performance would have been lower. |
| (s) | From time to time the fund may receive proceeds from litigation settlements, without which performance would be lower. |
| (x) | The net asset values and total returns have been calculated on net assets which include adjustments made in accordance with U.S. generally accepted accounting principles required at period end for financial reporting purposes. |
See Notes to Financial Statements
10
MFS Value Series
NOTES TO FINANCIAL STATEMENTS (unaudited)
| (1) | | Business and Organization |
MFS Value Series (the fund) is a diversified series of MFS Variable Insurance Trust (the trust). The trust is organized as a Massachusetts business trust and is registered under the Investment Company Act of 1940, as amended, as an open-end management investment company. The shareholders of each series of the trust are separate accounts of insurance companies, which offer variable annuity and/or life insurance products, and qualified retirement and pension plans.
The fund is an investment company and accordingly follows the investment company accounting and reporting guidance of the Financial Accounting Standards Board (FASB) Accounting Standards Codification Topic 946 Financial Services – Investment Companies.
| (2) | | Significant Accounting Policies |
General – The preparation of financial statements in conformity with U.S. generally accepted accounting principles requires management to make estimates and assumptions that affect the reported amounts of assets and liabilities, and disclosure of contingent assets and liabilities at the date of the financial statements and the reported amounts of increases and decreases in net assets from operations during the reporting period. Actual results could differ from those estimates. In the preparation of these financial statements, management has evaluated subsequent events occurring after the date of the fund’s Statement of Assets and Liabilities through the date that the financial statements were issued.
In March 2020, the FASB issued Accounting Standards Update 2020-04, Reference Rate Reform (Topic 848) – Facilitation of the Effects of Reference Rate Reform on Financial Reporting (“ASU 2020-04”), which provides optional, temporary relief with respect to the financial reporting of contracts subject to certain types of modifications due to the planned discontinuation of the London Interbank Offered Rate (LIBOR) and other IBOR-based reference rates as of the end of 2021. The temporary relief provided by ASU 2020-04 is effective for certain reference rate-related contract modifications that occur during the period from March 12, 2020 through December 31, 2022. Management is evaluating the impact of ASU 2020-04 on the fund’s investments, derivatives, debt and other contracts that will undergo reference rate-related modifications as a result of the reference rate reform.
Balance Sheet Offsetting – The fund’s accounting policy with respect to balance sheet offsetting is that, absent an event of default by the counterparty or a termination of the agreement, the International Swaps and Derivatives Association (ISDA) Master Agreement, or similar agreement, does not result in an offset of reported amounts of financial assets and financial liabilities in the Statement of Assets and Liabilities across transactions between the fund and the applicable counterparty. The fund’s right to setoff may be restricted or prohibited by the bankruptcy or insolvency laws of the particular jurisdiction to which a specific master netting agreement counterparty is subject. Balance sheet offsetting disclosures, to the extent applicable to the fund, have been included in the fund’s Significant Accounting Policies note under the captions for each of the fund’s in-scope financial instruments and transactions.
Investment Valuations – Equity securities, including restricted equity securities, are generally valued at the last sale or official closing price on their primary market or exchange as provided by a third-party pricing service. Equity securities, for which there were no sales reported that day, are generally valued at the last quoted daily bid quotation on their primary market or exchange as provided by a third-party pricing service. Short-term instruments with a maturity at issuance of 60 days or less may be valued at amortized cost, which approximates market value. Open-end investment companies are generally valued at net asset value per share. Securities and other assets generally valued on the basis of information from a third-party pricing service may also be valued at a broker/dealer bid quotation. In determining values, third-party pricing services can utilize both transaction data and market information such as yield, quality, coupon rate, maturity, type of issue, trading characteristics, and other market data. The values of foreign securities and other assets and liabilities expressed in foreign currencies are converted to U.S. dollars using the mean of bid and asked prices for rates provided by a third-party pricing service.
The Board of Trustees has delegated primary responsibility for determining or causing to be determined the value of the fund’s investments (including any fair valuation) to the adviser pursuant to valuation policies and procedures approved by the Board. If the adviser determines that reliable market quotations are not readily available, investments are valued at fair value as determined in good faith by the adviser in accordance with such procedures under the oversight of the Board of Trustees. Under the fund’s valuation policies and procedures, market quotations are not considered to be readily available for most types of debt instruments and floating rate loans and many types of derivatives. These investments are generally valued at fair value based on information from third-party pricing services. In addition, investments may be valued at fair value if the adviser determines that an investment’s value has been materially affected by events occurring after the close of the exchange or market on which the investment is principally traded (such as foreign exchange or market) and prior to the determination of the fund’s net asset value, or after the halt of trading of a specific security where trading does not resume prior to the close of the exchange or market on which the security is principally traded. Events that occur after foreign markets close (such as developments in foreign markets and significant movements in the U.S. markets) and prior to the determination of the fund’s net asset value may be deemed to have a material effect on the value of securities traded in foreign markets. Accordingly, the fund’s foreign equity securities may often be valued at fair value. The adviser
11
MFS Value Series
Notes to Financial Statements (unaudited) – continued
generally relies on third-party pricing services or other information (such as the correlation with price movements of similar securities in the same or other markets; the type, cost and investment characteristics of the security; the business and financial condition of the issuer; and trading and other market data) to assist in determining whether to fair value and at what value to fair value an investment. The value of an investment for purposes of calculating the fund’s net asset value can differ depending on the source and method used to determine value. When fair valuation is used, the value of an investment used to determine the fund’s net asset value may differ from quoted or published prices for the same investment. There can be no assurance that the fund could obtain the fair value assigned to an investment if it were to sell the investment at the same time at which the fund determines its net asset value per share.
Various inputs are used in determining the value of the fund’s assets or liabilities. These inputs are categorized into three broad levels. In certain cases, the inputs used to measure fair value may fall into different levels of the fair value hierarchy. In such cases, an investment’s level within the fair value hierarchy is based on the lowest level of input that is significant to the fair value measurement. The fund’s assessment of the significance of a particular input to the fair value measurement in its entirety requires judgment, and considers factors specific to the investment. Level 1 includes unadjusted quoted prices in active markets for identical assets or liabilities. Level 2 includes other significant observable market-based inputs (including quoted prices for similar securities, interest rates, prepayment speed, and credit risk). Level 3 includes unobservable inputs, which may include the adviser’s own assumptions in determining the fair value of investments. The following is a summary of the levels used as of June 30, 2020 in valuing the fund’s assets or liabilities:
| | | | | | | | | | | | | | | | |
| Financial Instruments | | Level 1 | | | Level 2 | | | Level 3 | | | Total | |
| Equity Securities | | | $2,095,011,674 | | | | $— | | | | $— | | | | $2,095,011,674 | |
| Mutual Funds | | | 27,337,574 | | | | — | | | | — | | | | 27,337,574 | |
| Total | | | $2,122,349,248 | | | | $— | | | | $— | | | | $2,122,349,248 | |
For further information regarding security characteristics, see the Portfolio of Investments.
Foreign Currency Translation – Purchases and sales of foreign investments, income, and expenses are converted into U.S. dollars based upon currency exchange rates prevailing on the respective dates of such transactions or on the reporting date for foreign denominated receivables and payables. Gains and losses attributable to foreign currency exchange rates on sales of securities are recorded for financial statement purposes as net realized gains and losses on investments. Gains and losses attributable to foreign exchange rate movements on receivables, payables, income and expenses are recorded for financial statement purposes as foreign currency transaction gains and losses. That portion of both realized and unrealized gains and losses on investments that results from fluctuations in foreign currency exchange rates is not separately disclosed.
Security Loans – Under its Securities Lending Agency Agreement with the fund, State Street Bank and Trust Company, as lending agent, loans the securities of the fund to certain qualified institutions (the “Borrowers”) approved by the fund. Security loans can be terminated at the discretion of either the lending agent or the fund and the related securities must be returned within the earlier of the standard trade settlement period for such securities or within three business days. The loans are collateralized by cash and/or U.S. Treasury and federal agency obligations in an amount typically at least equal to the market value of the securities loaned. On loans collateralized by cash, the cash collateral is invested in a money market fund. The market value of the loaned securities is determined at the close of business of the fund and any additional required collateral is delivered to the fund on the next business day. The lending agent provides the fund with indemnification against Borrower default. In the event of Borrower default, the lending agent will, for the benefit of the fund, either purchase securities identical to those loaned or, when such purchase is commercially impracticable, pay the fund the market value of the loaned securities. In return, the lending agent assumes the fund’s rights to the related collateral. If the collateral value is less than the cost to purchase identical securities, the lending agent is responsible for the shortfall, but only to the extent that such shortfall is not due to a decline in collateral value resulting from collateral reinvestment for which the fund bears the risk of loss. A portion of the income generated upon investment of the collateral is remitted to the Borrowers, and the remainder is allocated between the fund and the lending agent. On loans collateralized by U.S. Treasury and/or federal agency obligations, a fee is received from the Borrower, and is allocated between the fund and the lending agent. Income from securities lending is separately reported in the Statement of Operations. The dividend and interest income earned on the securities loaned is accounted for in the same manner as other dividend and interest income. At June 30, 2020, there were no securities on loan or collateral outstanding.
Indemnifications – Under the fund’s organizational documents, its officers and Trustees may be indemnified against certain liabilities and expenses arising out of the performance of their duties to the fund. Additionally, in the normal course of business, the fund enters into agreements with service providers that may contain indemnification clauses. The fund’s maximum exposure under these agreements is unknown as this would involve future claims that may be made against the fund that have not yet occurred.
Investment Transactions and Income – Investment transactions are recorded on the trade date. Interest income is recorded on the accrual basis. Dividends received in cash are recorded on the ex-dividend date. Certain dividends from foreign securities will be
12
MFS Value Series
Notes to Financial Statements (unaudited) – continued
recorded when the fund is informed of the dividend if such information is obtained subsequent to the ex-dividend date. Dividend payments received in additional securities are recorded on the ex-dividend date in an amount equal to the value of the security on such date.
The fund may receive proceeds from litigation settlements. Any proceeds received from litigation involving portfolio holdings are reflected in the Statement of Operations in realized gain/loss if the security has been disposed of by the fund or in unrealized gain/loss if the security is still held by the fund. Any other proceeds from litigation not related to portfolio holdings are reflected as other income in the Statement of Operations.
Tax Matters and Distributions – The fund intends to qualify as a regulated investment company, as defined under Subchapter M of the Internal Revenue Code, and to distribute all of its taxable income, including realized capital gains. As a result, no provision for federal income tax is required. The fund’s federal tax returns, when filed, will remain subject to examination by the Internal Revenue Service for a three year period. Management has analyzed the fund’s tax positions taken on federal and state tax returns for all open tax years and does not believe that there are any uncertain tax positions that require recognition of a tax liability. Foreign taxes, if any, have been accrued by the fund in the accompanying financial statements in accordance with the applicable foreign tax law. Foreign income taxes may be withheld by certain countries in which the fund invests. Additionally, capital gains realized by the fund on securities issued in or by certain foreign countries may be subject to capital gains tax imposed by those countries.
Distributions to shareholders are recorded on the ex-dividend date. Income and capital gain distributions are determined in accordance with income tax regulations, which may differ from U.S. generally accepted accounting principles. Certain capital accounts in the financial statements are periodically adjusted for permanent differences in order to reflect their tax character. These adjustments have no impact on net assets or net asset value per share. Temporary differences which arise from recognizing certain items of income, expense, gain or loss in different periods for financial statement and tax purposes will reverse at some time in the future.
Book/tax differences primarily relate to wash sale loss deferrals.
The tax character of distributions declared to shareholders for the last two fiscal years is as follows:
| | | | |
| | | Year ended
12/31/19 | |
| Ordinary income (including any short-term capital gains) | | | $42,575,241 | |
| Long-term capital gains | | | 95,965,994 | |
| Total distributions | | | $138,541,235 | |
The federal tax cost and the tax basis components of distributable earnings were as follows:
| | | | |
| As of 6/30/20 | | | | |
| |
| Cost of investments | | | $1,401,370,360 | |
| Gross appreciation | | | 757,325,488 | |
| Gross depreciation | | | (36,346,600 | ) |
| Net unrealized appreciation (depreciation) | | | $720,978,888 | |
| |
| As of 12/31/19 | | | | |
| |
| Undistributed ordinary income | | | 34,919,798 | |
| Undistributed long-term capital gain | | | 97,132,418 | |
| Other temporary differences | | | 18,589 | |
| Net unrealized appreciation (depreciation) | | | 1,089,488,433 | |
Multiple Classes of Shares of Beneficial Interest – The fund offers multiple classes of shares, which differ in their respective distribution and/or service fees. The fund’s income, realized and unrealized gain (loss), and common expenses are allocated to shareholders based on the daily net assets of each class. Dividends are declared separately for each class. Differences in per share dividend rates are generally due to differences in separate class expenses. The fund’s distributions declared to shareholders as reported in the Statements of Changes in Net Assets are presented by class as follows:
| | | | | | | | |
| | |
| | | Six months ended
6/30/20 | | | Year ended
12/31/19 | |
| Initial Class | | | $— | | | | $59,678,116 | |
| Service Class | | | — | | | | 78,863,119 | |
| Total | | | $— | | | | $138,541,235 | |
13
MFS Value Series
Notes to Financial Statements (unaudited) – continued
| (3) | | Transactions with Affiliates |
Investment Adviser – The fund has an investment advisory agreement with MFS to provide overall investment management and related administrative services and facilities to the fund. The management fee is computed daily and paid monthly at the following annual rates based on the fund’s average daily net assets:
| | | | |
| Up to $1 billion | | | 0.75% | |
| In excess of $1 billion and up to $2.5 billion | | | 0.65% | |
| In excess of $2.5 billion | | | 0.60% | |
MFS has agreed in writing to reduce its management fee by a specified amount if certain MFS mutual fund assets exceed thresholds agreed to by MFS and the fund’s Board of Trustees. For the six months ended June 30, 2020, this management fee reduction amounted to $111,522, which is included in the reduction of total expenses in the Statement of Operations. The management fee incurred for the six months ended June 30, 2020 was equivalent to an annual effective rate of 0.69% of the fund’s average daily net assets.
The investment adviser has agreed in writing to pay a portion of the fund’s total annual operating expenses, excluding interest, taxes, extraordinary expenses, brokerage and transaction costs, and investment-related expenses, such that total annual operating expenses do not exceed 0.71% of average daily net assets for the Initial Class shares and 0.96% of average daily net assets for the Service Class shares. This written agreement will continue until modified by the fund’s Board of Trustees, but such agreement will continue at least until April 30, 2022. For the six months ended June 30, 2020, this reduction amounted to $128,187, which is included in the reduction of total expenses in the Statement of Operations.
Distributor – MFS Fund Distributors, Inc. (MFD), a wholly-owned subsidiary of MFS, is the distributor of shares of the fund. The Trustees have adopted a distribution plan for the Service Class shares pursuant to Rule 12b-1 under the Investment Company Act of 1940.
The fund’s distribution plan provides that the fund will pay MFD distribution and/or service fees equal to 0.25% per annum of its average daily net assets attributable to Service Class shares as partial consideration for services performed and expenses incurred by MFD and financial intermediaries (including participating insurance companies that invest in the fund to fund variable annuity and variable life insurance contracts, sponsors of qualified retirement and pension plans that invest in the fund, and affiliates of these participating insurance companies and plan sponsors) in connection with the sale and distribution of the Service Class shares. MFD may subsequently pay all, or a portion, of the distribution and/or service fees to financial intermediaries.
Shareholder Servicing Agent – MFS Service Center, Inc. (MFSC), a wholly-owned subsidiary of MFS, receives a fee from the fund for its services as shareholder servicing agent. For the six months ended June 30, 2020, the fee was $21,780, which equated to 0.0021% annually of the fund’s average daily net assets. MFSC also receives payment from the fund for out-of-pocket expenses paid by MFSC on behalf of the fund. For the six months ended June 30, 2020, these costs amounted to $928.
Administrator – MFS provides certain financial, legal, shareholder communications, compliance, and other administrative services to the fund. Under an administrative services agreement, the fund reimburses MFS the costs incurred to provide these services. The fund is charged an annual fixed amount of $17,500 plus a fee based on average daily net assets. The administrative services fee incurred for the six months ended June 30, 2020 was equivalent to an annual effective rate of 0.0141% of the fund’s average daily net assets.
Trustees’ and Officers’ Compensation – The fund pays compensation to independent Trustees in the form of a retainer, attendance fees, and additional compensation to Board and Committee chairpersons. The fund does not pay compensation directly to Trustees or officers of the fund who are also officers of the investment adviser, all of whom receive remuneration from MFS for their services to the fund. Certain officers and Trustees of the fund are officers or directors of MFS, MFD, and MFSC.
Other – The fund invests in the MFS Institutional Money Market Portfolio which is managed by MFS and seeks current income consistent with preservation of capital and liquidity. This money market fund does not pay a management fee to MFS but does incur investment and operating costs.
The fund is permitted to engage in purchase and sale transactions with funds and accounts for which MFS serves as investment adviser or sub-adviser (“cross-trades”) pursuant to a policy adopted by the Board of Trustees. This policy has been designed to ensure that cross-trades conducted by the fund comply with Rule 17a-7 under the Investment Company Act of 1940. During the six months ended June 30, 2020, the fund engaged in purchase and sale transactions pursuant to this policy, which amounted to $4,972,645 and $1,037,560, respectively. The sales transactions resulted in net realized gains (losses) of $176,405.
The adviser has voluntarily undertaken to reimburse the fund from its own resources on a quarterly basis for the cost of investment research embedded in the cost of the fund’s securities trades. This agreement may be rescinded at any time. For the six months ended June 30, 2020, this reimbursement amounted to $37,695, which is included in “Other” income in the Statement of Operations.
14
MFS Value Series
Notes to Financial Statements (unaudited) – continued
For the six months ended June 30, 2020, purchases and sales of investments, other than short-term obligations, aggregated $438,235,851 and $229,241,096, respectively.
| (5) | | Shares of Beneficial Interest |
The fund’s Declaration of Trust permits the Trustees to issue an unlimited number of full and fractional shares of beneficial interest. Transactions in fund shares were as follows:
| | | | | | | | | | | | | | | | |
| | | Six months ended 6/30/20 | | | Year ended 12/31/19 | |
| | | | |
| | | Shares | | | Amount | | | Shares | | | Amount | |
| Shares sold | | | | | | | | | | | | | | | | |
Initial Class | | | 15,338,470 | | | | $285,651,328 | | | | 3,030,553 | | | | $59,564,452 | |
Service Class | | | 7,119,848 | | | | 118,212,064 | | | | 4,216,291 | | | | 80,005,530 | |
| | | 22,458,318 | | | | $403,863,392 | | | | 7,246,844 | | | | $139,569,982 | |
| | | | |
| Shares issued to shareholders in reinvestment of distributions | | | | | | | | | | | | | | | | |
Initial Class | | | — | | | | $— | | | | 3,169,311 | | | | $59,678,116 | |
Service Class | | | — | | | | — | | | | 4,272,108 | | | | 78,863,119 | |
| | | — | | | | $— | | | | 7,441,419 | | | | $138,541,235 | |
| | | | |
| Shares reacquired | | | | | | | | | | | | | | | | |
Initial Class | | | (4,082,410 | ) | | | $(75,586,757 | ) | | | (8,697,665 | ) | | | $(171,759,644 | ) |
Service Class | | | (7,542,484 | ) | | | (135,252,575 | ) | | | (12,637,014 | ) | | | (244,554,515 | ) |
| | | (11,624,894 | ) | | | $(210,839,332 | ) | | | (21,334,679 | ) | | | $(416,314,159 | ) |
| | | | |
| Net change | | | | | | | | | | | | | | | | |
Initial Class | | | 11,256,060 | | | | $210,064,571 | | | | (2,497,801 | ) | | | $(52,517,076 | ) |
Service Class | | | (422,636 | ) | | | (17,040,511 | ) | | | (4,148,615 | ) | | | (85,685,866 | ) |
| | | 10,833,424 | | | | $193,024,060 | | | | (6,646,416 | ) | | | $(138,202,942 | ) |
The fund is one of several mutual funds in which certain MFS funds may invest. The MFS funds do not invest in the underlying funds for the purpose of exercising management or control. At the end of the period, the MFS Moderate Allocation Portfolio, the MFS Growth Allocation Portfolio, and the MFS Conservative Allocation Portfolio were the owners of record of approximately 6%, 2%, and 1%, respectively, of the value of outstanding voting shares of the fund.
The fund and certain other funds managed by MFS participate in a $1.25 billion unsecured committed line of credit, subject to a $1 billion sublimit, provided by a syndicate of banks under a credit agreement. Borrowings may be made for temporary financing needs. Interest is charged to each fund, based on its borrowings, generally at a rate equal to the highest of one month LIBOR, the Federal Funds Effective Rate and the Overnight Bank Funding Rate, plus an agreed upon spread. A commitment fee, based on the average daily, unused portion of the committed line of credit, is allocated among the participating funds. In addition, the fund and other funds managed by MFS have established unsecured uncommitted borrowing arrangements with certain banks for temporary financing needs. Interest is charged to each fund, based on its borrowings, at rates equal to customary reference rates plus an agreed upon spread. For the six months ended June 30, 2020, the fund’s commitment fee and interest expense were $5,227 and $0, respectively, and are included in “Miscellaneous” expense in the Statement of Operations.
| (7) | | Investments in Affiliated Issuers |
An affiliated issuer may be considered one in which the fund owns 5% or more of the outstanding voting securities, or a company which is under common control. For the purposes of this report, the following were affiliated issuers:
| | | | | | | | | | | | | | | | | | | | | | | | |
| Affiliated Issuers | | Beginning
Value | | | Purchases | | | Sales Proceeds | | | Realized
Gain
(Loss) | | | Change in
Unrealized
Appreciation or
Depreciation | | | Ending Value | |
| MFS Institutional Money Market Portfolio | | | $25,583,427 | | | | $347,191,753 | | | | $345,429,787 | | | | $(8,773 | ) | | | $954 | | | | $27,337,574 | |
| | | | | | |
| Affiliated Issuers | | | | | | | | | | | | | | Dividend
Income | | | Capital Gain
Distributions | |
| MFS Institutional Money Market Portfolio | | | | | | | | | | | | | | | | | | | $141,258 | | | | $— | |
15
MFS Value Series
Notes to Financial Statements (unaudited) – continued
The pandemic related to the global spread of novel coronavirus disease (COVID-19), which was first detected in December 2019, has resulted in significant disruptions to global business activity and the global economy, as well as the economies of individual countries, the financial performance of individual companies and sectors, and the securities and commodities markets in general. This pandemic, the full effects of which are still unknown, has resulted in substantial market volatility and may have adversely impacted the prices and liquidity of the fund’s investments and the fund’s performance.
16
MFS Value Series
STATEMENT REGARDING LIQUIDITY RISK MANAGEMENT PROGRAM
The fund has adopted and implemented a liquidity risk management program (the “Program”) as required by Rule 22e-4 under the Investment Company Act of 1940, as amended. The fund’s Board of Trustees (the “Board”) has designated MFS as the administrator of the Program. The Program is reasonably designed to assess and manage the liquidity risk of the fund. Liquidity risk is the risk that the fund could not meet requests to redeem shares issued by the fund without significant dilution of remaining investors’ interests.
MFS provided a written report to the Board for consideration at its April 2020 meeting that addressed the operation of the Program and provided an assessment of the adequacy and effectiveness of the Program during the period from the adoption of the Program on December 1, 2018 to December 31, 2019 (the “Covered Period”). The report concluded that during the Covered Period the Program had operated effectively and had adequately and effectively been implemented to assess and manage the fund’s liquidity risk. MFS also reported that there were no liquidity events that impacted the fund or its ability to timely meet redemptions without dilution to existing shareholders during the Covered Period.
There can be no assurance that the Program will achieve its objectives in the future. Further information on liquidity risk, and other principal risks to which an investment in the fund may be subject, can be found in the prospectus.
17
MFS Value Series
PROXY VOTING POLICIES AND INFORMATION
MFS votes proxies on behalf of the fund pursuant to proxy voting policies and procedures that are available without charge, upon request, by calling 1-800-225-2606, by visiting mfs.com/proxyvoting, or by visiting the SEC’s Web site at http://www.sec.gov.
Information regarding how the fund voted proxies relating to portfolio securities during the most recent twelve-month period ended June 30 is available by August 31 of each year without charge by visiting mfs.com/proxyvoting, or by visiting the SEC’s Web site at http://www.sec.gov.
QUARTERLY PORTFOLIO DISCLOSURE
The fund files a complete schedule of portfolio holdings with the SEC for the first and third quarters of each fiscal year as an exhibit to its reports on Form N-PORT. The fund’s Form N-PORT reports are available on the SEC’s website at http://www.sec.gov. A shareholder can obtain the portfolio holdings report for the first and third quarters of the fund’s fiscal year at mfs.com/vit1 by choosing the fund’s name and then selecting the “Resources” tab and clicking on “Prospectus and Reports”.
FURTHER INFORMATION
From time to time, MFS may post important information about the fund or the MFS funds on the MFS web site (mfs.com). This information is available at https://www.mfs.com/announcements or at mfs.com/vit1 by choosing the fund’s name and then selecting the “Resources” tab and clicking on the “Announcements” tab, if any.
INFORMATION ABOUT FUND CONTRACTS AND LEGAL CLAIMS
The fund has entered into contractual arrangements with an investment adviser, administrator, distributor, shareholder servicing agent, 529 program manager (if applicable), and custodian who each provide services to the fund. Unless expressly stated otherwise, shareholders are not parties to, or intended beneficiaries of these contractual arrangements, and these contractual arrangements are not intended to create any shareholder right to enforce them against the service providers or to seek any remedy under them against the service providers, either directly or on behalf of the fund.
Under the Trust’s By-Laws and Declaration of Trust, any claims asserted against or on behalf of the MFS Funds, including claims against Trustees and Officers, must be brought in state and federal courts located within the Commonwealth of Massachusetts.
18
During the period covered by this report, the Registrant has not amended any provision in its Code of Ethics (the “Code”) that relates to an element of the Code’s definitions enumerated in paragraph (b) of Item 2 of this Form N-CSR. During the period covered by this report, the Registrant did not grant a waiver, including an implicit waiver, from any provision of the Code.
| ITEM 3. | AUDIT COMMITTEE FINANCIAL EXPERT. |
Not applicable for semi-annual reports.
| ITEM 4. | PRINCIPAL ACCOUNTANT FEES AND SERVICES. |
Not applicable for semi-annual reports.
| ITEM 5. | AUDIT COMMITTEE OF LISTED REGISTRANTS. |
Not applicable to the Registrant.
A schedule of investments for each series of the Registrant is included as part of the report to shareholders of such series under Item 1 of this Form N-CSR.
| ITEM 7. | DISCLOSURE OF PROXY VOTING POLICIES AND PROCEDURES FOR CLOSED-END MANAGEMENT INVESTMENT COMPANIES. |
Not applicable to the Registrant.
| ITEM 8. | PORTFOLIO MANAGERS OF CLOSED-END MANAGEMENT INVESTMENT COMPANIES. |
Not applicable to the Registrant.
| ITEM 9. | PURCHASES OF EQUITY SECURITIES BY CLOSED-END MANAGEMENT INVESTMENT COMPANY AND AFFILIATED PURCHASERS. |
Not applicable to the Registrant.
| ITEM 10. | SUBMISSION OF MATTERS TO A VOTE OF SECURITY HOLDERS. |
There were no material changes to the procedures by which shareholders may send recommendations to the Board for nominees to the Registrant’s Board since the Registrant last provided disclosure as to such procedures in response to the requirements of Item 407 (c)(2)(iv) of Regulation S-K or this Item.
| ITEM 11. | CONTROLS AND PROCEDURES. |
| (a) | Based upon their evaluation of the effectiveness of the registrant’s disclosure controls and procedures (as defined in Rule 30a-3(c) under the Investment Company Act of 1940 (the “Act”)) as conducted within 90 days of the filing date of this report on Form N-CSR, the registrant’s principal financial officer and principal executive officer have concluded that those disclosure controls and procedures provide reasonable assurance that the material information required to be disclosed by the registrant on this report is recorded, processed, summarized and reported within the time periods specified in the Securities and Exchange Commission’s rules and forms. |
| (b) | There were no changes in the registrant’s internal controls over financial reporting (as defined in Rule 30a-3(d) under the Act) that occurred during the period covered by the report that have materially affected, or are reasonably likely to materially affect, the registrant’s internal control over financial reporting. |
| ITEM 12. | DISCLOSURE OF SECURITIES LENDING ACTIVITIES FOR CLOSED-END MANAGEMENT INVESTMENT COMPANIES. |
Not applicable to the Registrant.
| (a) (1) | Any code of ethics, or amendment thereto, that is the subject of the disclosure required by Item 2, to the extent that the registrant intends to satisfy the Item 2 requirements through filing of an exhibit. Not applicable. |
| | (2) | A separate certification for each principal executive officer and principal financial officer of the registrant as required by Rule 30a-2(a) under the Act (17 CFR 270.30a-2): Attached hereto as EX-99.302CERT. |
| | (3) | Any written solicitation to purchase securities under Rule 23c-1 under the Act (17 CFR 270.23c-1) sent or given during the period covered by the report by or on behalf of the registrant to 10 or more persons. Not applicable. |
| | (4) | Change in the registrant’s independent public accountant. Not applicable. |
| (b) | If the report is filed under Section 13(a) or 15(d) of the Exchange Act, provide the certifications required by Rule 30a-2(b) under the Act (17 CFR 270.30a-2(b)), Rule 13a-14(b) or Rule 15d-14(b) under the Exchange Act (17 CFR 240.13a-14(b) or 240.15d-14(b)) and Section 1350 of Chapter 63 of Title 18 of the United States Code (18 U.S.C. 1350) as an exhibit. A certification furnished pursuant to this paragraph will not be deemed “filed” for the purposes of Section 18 of the Exchange Act (15 U.S.C. 78r), or otherwise subject to the liability of that section. Such certification will not be deemed to be incorporated by reference into any filing under the Securities Act of 1933 or the Exchange Act, except to the extent that the registrant specifically incorporates it by reference. Attached hereto as EX-99.906CERT. |
Notice
A copy of the Amended and Restated Declaration of Trust, as amended, of the Registrant is on file with the Secretary of State of The Commonwealth of Massachusetts and notice is hereby given that this instrument is executed on behalf of the Registrant by an officer of the Registrant as an officer and not individually and the obligations of or arising out of this instrument are not binding upon any of the Trustees or shareholders individually, but are binding only upon the assets and property of the respective constituent series of the Registrant.
SIGNATURES
Pursuant to the requirements of the Securities Exchange Act of 1934 and the Investment Company Act of 1940, the registrant has duly caused this report to be signed on its behalf by the undersigned, thereunto duly authorized.
(Registrant) MFS VARIABLE INSURANCE TRUST
| | |
| By (Signature and Title)* | | /S/ DAVID L. DILORENZO |
| | David L. DiLorenzo, President |
Date: August 17, 2020
Pursuant to the requirements of the Securities Exchange Act of 1934 and the Investment Company Act of 1940, this report has been signed below by the following persons on behalf of the registrant and in the capacities and on the dates indicated.
| | |
| By (Signature and Title)* | | /S/ DAVID L. DILORENZO |
| | David L. DiLorenzo, President (Principal Executive Officer) |
Date: August 17, 2020
| | |
| By (Signature and Title)* | | /S/ JAMES O. YOST |
| | James O. Yost, Treasurer (Principal Financial Officer and Accounting Officer) |
Date: August 17, 2020
| * | Print name and title of each signing officer under his or her signature. |