UNITEDSTATES
SECURITIESANDEXCHANGECOMMISSION
Washington,D.C.20549
FORM N-CSRS
CERTIFIED SHAREHOLDER REPORT OF REGISTERED MANAGEMENT
INVESTMENT COMPANIES
Investment Company Act file number 811-07177
Name of Fund: BlackRock Mid Cap Value Opportunities Fund of BlackRock Mid Cap Value Opportunities
Series, Inc.
Fund Address: 100 Bellevue Parkway, Wilmington, DE 19809
Name and address of agent for service: Anne F. Ackerley, Chief Executive Officer, BlackRock Mid Cap Value
Opportunities Fund of BlackRock Mid Cap Value Opportunities Series, Inc., 40 East 52nd Street, New
York, NY 10022.
Registrant’s telephone number, including area code: (800) 441-7762
Date of fiscal year end: 01/31/2010
Date of reporting period: 07/31/2009
Item 1 – Report to Stockholders

EQUITIES FIXED INCOME REAL ESTATE LIQUIDITY ALTERNATIVES BLACKROCK SOLUTIONS
BlackRock Mid Cap Value
Opportunities Fund
OF BLACKROCK MID CAP VALUE OPPORTUNITIES
SERIES, INC.
JULY 31, 2009 | SEMI-ANNUAL REPORT (UNAUDITED)
NOT FDIC INSURED
MAY LOSE VALUE
NO BANK GUARANTEE
| |
| Table of Contents | |
| | Page |
| Dear Shareholder | 3 |
| Semi-Annual Report: | |
| Fund Summary | 4 |
| Portfolio Information | 4 |
| About Fund Performance | 6 |
| Disclosure of Expenses | 6 |
| Financial Statements: | |
| Schedule of Investments | 7 |
| Statement of Assets and Liabilities | 10 |
| Statement of Operations | 11 |
| Statements of Changes in Net Assets | 12 |
| Financial Highlights | 13 |
| Notes to Financial Statements | 18 |
| Disclosure of Investment Advisory Agreement and Sub-Advisory Agreement | 22 |
| Officers and Directors | 26 |
| Additional Information | 27 |
| Mutual Fund Family | 30 |
2 BLACKROCK MID CAP VALUE OPPORTUNITIES FUND JULY 31, 2009
Dear Shareholder
The past 12 months reveal two distinct market backdrops — one of extreme investor pessimism and decided weakness, and another of cautious optimism
and nascent signs of recovery. The first half of the period was characterized by the former, as the global financial crisis erupted into the worst recession in
decades. Daily headlines recounted universal macroeconomic deterioration, financial sector casualties, volatile swings in global equity markets, and
unprecedented government intervention that included widespread (and globally coordinated) monetary and quantitative easing by central banks and
large-scale fiscal stimuli. Sentiment improved noticeably in March 2009, however, on the back of new program announcements by the US Treasury
Department and Federal Reserve, as well as generally stronger-than-expected economic data in a few key areas, including retail sales, business and
consumer confidence, manufacturing and housing.
In this environment, US equities contended with extraordinary volatility, posting steep declines through mid-March 2009 before going on a three-month
rally that largely negated year-to-date losses. Late in the period, investor enthusiasm waned and a correction ensued for several weeks, mostly as a result
of profit taking and portfolio rebalancing, as opposed to a change in the economic outlook. Equities rallied once again as the period drew to a close,
resulting in positive year-to-date returns for all major indexes. The experience in international markets was similar to that in the United States, though
performance was generally more extreme both on the decline and on the upturn. Notably, emerging markets, which lagged most developed regions
through the downturn, reassumed leadership in 2009 as these areas of the globe have generally seen a stronger acceleration in economic recovery.
In fixed income markets, while the flight to quality remained a prevalent theme, relatively attractive yields and distressed valuations, alongside a more favor-
able macro environment, eventually captured investor attention, leading to a sharp recovery in non-Treasury assets. This has been particularly evident in the
high yield sector, which has firmly outpaced all other taxable asset classes since the start of 2009. At the same time, the municipal bond market enjoyed a
strong return after the exceptional market volatility of 2008, buoyed by a combination of attractive valuations, robust retail investor demand and a slowdown in
forced selling. Direct aid to state and local governments via the American Recovery and Reinvestment Act of 2009 has also lent support to municipal bonds.
| | |
| Total Returns as of July 31, 2009 | 6-month | 12-month |
| US equities (S&P 500 Index) | 21.18% | (19.96)% |
| Small cap US equities (Russell 2000 Index) | 26.61 | (20.72) |
| International equities (MSCI Europe, Australasia, Far East Index) | 30.63 | (22.60) |
| US Treasury securities (Merrill Lynch 10-Year US Treasury Index) | (3.91) | 7.58 |
| Taxable fixed income (Barclays Capital US Aggregate Bond Index) | 4.47 | 7.85 |
| Tax-exempt fixed income (Barclays Capital Municipal Bond Index) | 4.38 | 5.11 |
| High yield bonds (Barclays Capital US Corporate High Yield 2% Issuer Capped Index) | 30.11 | 5.30 |
| Past performance is no guarantee of future results. Index performance shown for illustrative purposes only. You cannot invest directly in an index. | |
The market environment has clearly improved since the beginning of the year, but a great deal of uncertainty and risk remain. Through periods of market
turbulence, as ever, BlackRock’s full resources are dedicated to the management of our clients’ assets. For additional insight and timely “food for thought,”
we invite you to visit our award-winning Shareholder® magazine, now available exclusively online at www.blackrock.com/shareholdermagazine. We thank
you for entrusting BlackRock with your investments, and we look forward to continuing to serve you in the months and years ahead.

Announcement to Shareholders
On June 16, 2009, BlackRock, Inc. announced that it received written notice from Barclays PLC (“Barclays”) in which Barclays’ Board of Directors had
accepted BlackRock’s offer to acquire Barclays Global Investors (“BGI”). At a special meeting held on August 6, 2009, BlackRock’s proposed purchase of
BGI was approved by an overwhelming majority of Barclays’ voting shareholders, an important step toward closing the transaction. The combination of
BlackRock and BGI will bring together market leaders in active and index strategies to create the preeminent asset management firm. The transaction is
scheduled to be completed in the fourth quarter of 2009, subject to important fund shareholder and regulatory approvals.
THIS PAGE NOT PART OF YOUR FUND REPORT 3
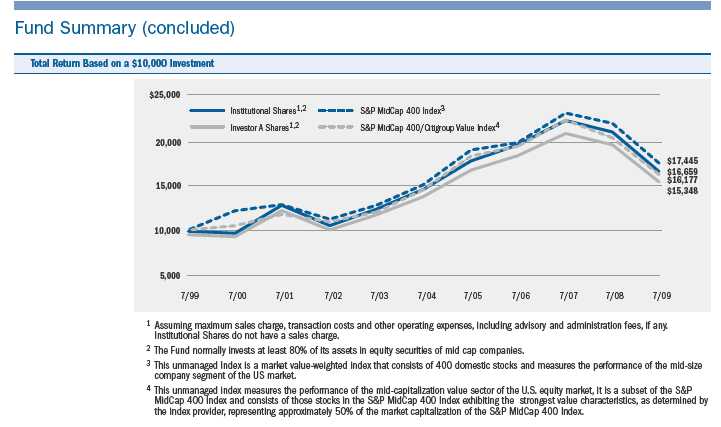
Fund Summary as of July 31, 2009
Portfolio Management Commentary
How did the Fund perform?
The Fund underperformed the benchmark S&P MidCap 400 Index and
the S&P MidCap 400/Citigroup Value Index for the six-month period.
What factors influenced performance?
Underperformance over the past six months stemmed primarily from
weakness in the materials and utilities sectors. Within materials, disap-
pointing stock selection among metals & mining names overshadowed
the positive effects of an overweight in the sub-sector. The Fund was
underexposed to stocks of the lowest quality and highest beta, which
led the sub-sector up nearly 70%. Underperformance in utilities can
be attributed largely to an overweight in multi-utilities, as the defensive
sub-sector lagged overall benchmark performance by roughly 20%.
The Fund’s relatively high average cash position during the period (7%)
significantly detracted from performance during the market rally, subtract-
ing more than 200 basis points from relative returns. Cash is a residual
of the investment process, and we would expect the position to fall back
below 5% as market conditions stabilize.
On the positive side, Fund performance benefited from strength in the
health care, energy and consumer discretionary sectors. In health care,
positive relative performance was driven primarily by stock selection in
the biotechnology and health care equipment & supplies sub-sectors.
In energy, although performance within the energy equipment & services
sub-sector lagged the benchmark, an overweight to and selection among
oil, gas & consumable fuels names drove relative strength within the
sector. Key contributors included Cabot Oil & Gas Corp. and Newfield
Exploration Co., both of which jumped more than 70% during the period.
In consumer discretionary, an underweight in diversified consumer services
stocks boosted relative returns.
Describe recent portfolio activity.
• During the six-month period, we increased the Fund’s exposure to health
care, adding positions in both the health care equipment & supplies and
health care providers & services sub-sectors. We also added to the Fund’s
weighting in consumer discretionary, with the largest additions in the tex-
tiles, apparel & luxury goods and specialty retail sub-sectors.
Describe Fund positioning at period end.
• The Fund ended the period with an overweight relative to the benchmark
in information technology (primarily among software companies), and
underweights in consumer discretionary (particularly within the hotels,
restaurants & leisure; diversified consumer services; and household
durables sub-sectors), financials (notably among commercial real estate
investment trusts and capital markets firms), industrials (primarily in elec-
trical equipment and professional services) and materials (particularly
chemicals).
The views expressed reflect the opinions of BlackRock as of the date of this report and are subject to change based on changes in market, economic or other conditions.
These views are not intended to be a forecast of future events and are no guarantee of future results.
| | | |
| Portfolio Information | | | |
| | Percent of | | Percent of |
| | Long-Term | | Long-Term |
| Ten Largest Holdings | Investments | Sector Allocation | Investments |
| Convergys Corp. | 3% | Information Technology | 18% |
| Tellabs, Inc. | 3 | Financials | 16 |
| OGE Energy Corp. | 2 | Consumer Discretionary | 13 |
| Harte-Hanks, Inc. | 2 | Health Care | 13 |
| Novell, Inc. | 2 | Industrials | 12 |
| Kinetic Concepts, Inc. | 2 | Utilities | 8 |
| MidCap SPDR Trust Series 1 | 2 | Energy | 7 |
| Dover Corp. | 1 | Materials | 4 |
| iShares Russell MidCap Growth Index Fund | 1 | Investment Companies | 4 |
| SPDR Gold Trust | 1 | Consumer Staples | 4 |
| | | Telecommunication Services | 1 |
| | | For Fund compliance purposes, the Fund’s sector classifications refer to any |
| | | one or more of the sector sub-classifications used by one or more widely recog- |
| | | nized market indexes or ratings group indexes, and/or as defined by Fund |
| | | management. This definition may not apply for purposes of this report, which |
| | | may combine sector sub-classifications for reporting ease. | |
4 BLACKROCK MID CAP VALUE OPPORTUNITIES FUND JULY 31, 2009
| | | | | | | | |
| Performance Summary for the Period Ended July 31, 2009 | | | | | | | |
| | | | Average Annual Total Returns5 | | | |
| | | 1 Year | 5 Years | | 10 Years |
| | 6-Month | w/o sales | w/sales | w/o sales | w/sales | w/o sales | w/sales |
| | Total Returns | charge | charge | charge | charge | charge | charge |
| Institutional | 24.71% | (20.88)% | N/A | 2.61% | N/A | 5.24% | N/A |
| Investor A | 24.43 | (21.23) | (25.37)% | 2.30 | 1.20% | 4.94 | 4.38% |
| Investor B | 23.98 | (21.83) | (25.35) | 1.50 | 1.26 | 4.27 | 4.27 |
| Investor C | 23.90 | (22.01) | (22.79) | 1.41 | 1.41 | 4.04 | 4.04 |
| Class R | 24.19 | (21.54) | N/A | 1.97 | N/A | 4.69 | N/A |
| S&P MidCap 400 Index | 27.17 | (20.25) | N/A | 3.04 | N/A | 5.72 | N/A |
| S&P MidCap 400/Citigroup Value Index | 24.89 | (20.16) | N/A | 2.25 | N/A | 4.93 | N/A |
| 5 Assuming maximum sales charges, if any. Average annual total returns with and without sales charges reflect reductions for distribution and service fees. See “About Fund |
| Performance” on page 6 for a detailed description of share classes, including any related sales charges and fees. | | | | |
| N/A — Not applicable as share class and index do not have a sales charge. Past performance is not indicative of future results. | | | |
| Expense Example | | | | | | | | |
| | | Actual | | | | Hypothetical7 | | |
| | Beginning | Ending | | Beginning | Ending | | |
| | Account Value | Account Value | Expenses Paid | Account Value | Account Value | | Expenses Paid |
| | February 1, 2009 | July 31, 2009 | During the Period6 | February 1, 2009 | July 31, 2009 | During the Period6 |
| Institutional | $1,000 | $1,247.10 | $ 5.96 | | $1,000 | $1,019.49 | | $ 5.36 |
| Investor A | $1,000 | $1,244.30 | $ 8.18 | | $1,000 | $1,017.51 | | $ 7.35 |
| Investor B | $1,000 | $1,239.80 | $13.16 | | $1,000 | $1,013.05 | | $11.83 |
| Investor C | $1,000 | $1,239.00 | $14.49 | | $1,000 | $1,011.86 | | $13.02 |
| Class R | $1,000 | $1,241.90 | $10.62 | | $1,000 | $1,015.33 | | $ 9.54 |
| 6 For each class of the Fund, expenses are equal to the annualized expense ratio for the class (1.07% for Institutional, 1.47% for Investor A, 2.37% for Investor B, 2.61% for |
| Investor C and 1.91% for Class R), multiplied by the average account value over the period, multiplied by 181/365 (to reflect the one-half year period shown). |
| 7 Hypothetical 5% annual return before expenses is calculated by pro rating the number of days in the most recent fiscal half-year divided by 365. | | |
| See “Disclosure of Expenses” on page 6 for further information on how expenses were calculated. | | | | | |
| BLACKROCK MID CAP VALUE OPPORTUNITIES FUND | | JULY 31, 2009 | | 5 |
About Fund Performance
• Institutional Shares are not subject to any sales charge. Institutional
Shares bear no ongoing distribution or service fees and are available only
to eligible investors.
• Investor A Shares incur a maximum initial sales charge (front-end load)
of 5.25% and a service fee of 0.25% per year (but no distribution fee).
• Investor B Shares are subject to a maximum contingent deferred sales
charge of 4.50% declining to 0% after six years. In addition, Investor B
Shares are subject to a distribution fee of 0.75% per year and a service
fee of 0.25% per year. These shares automatically convert to Investor A
Shares after approximately eight years. (There is no initial sales charge
for automatic share conversions.) All returns for periods greater than
eight years reflect this conversion. Investor B Shares of the Fund are
no longer available for purchase except through exchanges, dividend
reinvestments, and for purchase by certain qualified employee
benefit plans.
• Investor C Shares are subject to a 1.00% contingent deferred sales
charge if redeemed within one year of purchase. These shares are subject
to a distribution fee of 0.75% and a service fee of 0.25% per year.
• Class R Shares do not incur a maximum initial sales charge (front-end
load) or deferred sales charge. These shares are subject to a distribution
fee of 0.25% per year and a service fee of 0.25% per year. Class R
Shares are available only to certain retirement plans. Prior to February
4, 2003, Class R Share performance results are those of Institutional
Shares (which have no distribution or service fees) restated to reflect
Class R Share fees.
Performance information reflects past performance and does not guar-
antee future results. Current performance may be lower or higher than the
performance data quoted. Refer to www.blackrock.com/funds to obtain
performance data current to the most recent month-end. Performance
results do not reflect the deduction of taxes that a shareholder would
pay on fund distributions or the redemption of fund shares. Figures
shown in the performance table on the previous page assume reinvest-
ment of all dividends and capital gain distributions, if any, at net asset
value on the ex-dividend date. Investment return and principal value of
shares will fluctuate so that shares, when redeemed, may be worth more
or less than their original cost. Dividends paid to each class of shares will
vary because of the different levels of service, distribution and transfer
agency fees applicable to each class, which are deducted from the
income available to be paid to shareholders.
Disclosure of Expenses
Shareholders of the Fund may incur the following charges: (a) expenses
related to transactions, including sales charges, redemption fees and
exchange fees; and (b) operating expenses including advisory fees, distri-
bution fees including 12b-1 fees, and other Fund expenses. The expense
example on the previous page (which is based on a hypothetical invest-
ment of $1,000 invested on February 1, 2009 and held through July 31,
2009) is intended to assist shareholders both in calculating expenses
based on an investment in the Fund and in comparing these expenses
with similar costs of investing in other mutual funds.
The table provides information about actual account values and actual
expenses. In order to estimate the expenses a shareholder paid during the
period covered by this report, shareholders can divide their account value
by $1,000 and then multiply the results by the number corresponding
to their share class under the headings entitled “Expenses Paid During
the Period.”
The table also provides information about hypothetical account values
and hypothetical expenses based on the Fund’s actual expense ratio and
an assumed rate of return of 5% per year before expenses. In order to
assist shareholders in comparing the ongoing expenses of investing in this
Fund and other funds, compare the 5% hypothetical example with the 5%
hypothetical examples that appear in other funds’ shareholder reports.
The expenses shown in the table are intended to highlight shareholders’
ongoing costs only and do not reflect any transactional expenses, such as
sales charges, redemption fees or exchange fees. Therefore, the hypotheti-
cal example is useful in comparing ongoing expenses only, and will not
help shareholders determine the relative total expenses of owning differ-
ent funds. If these transactional expenses were included, shareholder
expenses would have been higher.
6 BLACKROCK MID CAP VALUE OPPORTUNITIES FUND JULY 31, 2009
Schedule of Investments July 31, 2009 (Unaudited) (Percentages shown are based on Net Assets)
| | |
| Common Stocks | Shares | Value |
| Aerospace & Defense — 1.6% | | |
| Alliant Techsystems, Inc. (a) | 30,700 | $ 2,416,704 |
| Curtiss-Wright Corp. | 55,800 | 1,843,074 |
| | | 4,259,778 |
| Airlines — 0.2% | | |
| Delta Air Lines, Inc. (a) | 80,500 | 557,865 |
| Capital Markets — 1.0% | | |
| Legg Mason, Inc. | 91,800 | 2,583,252 |
| Chemicals — 1.7% | | |
| Airgas, Inc. | 41,300 | 1,841,154 |
| Cytec Industries, Inc. | 55,200 | 1,385,520 |
| FMC Corp. | 26,600 | 1,293,824 |
| | | 4,520,498 |
| Commercial Banks — 4.5% | | |
| BancorpSouth, Inc. | 109,500 | 2,463,750 |
| Bank of Hawaii Corp. | 34,200 | 1,312,254 |
| Commerce Bancshares, Inc. | 2,900 | 106,314 |
| Cullen/Frost Bankers, Inc. | 62,100 | 2,982,663 |
| Fifth Third Bancorp | 220,800 | 2,097,600 |
| M&T Bank Corp. (b) | 18,200 | 1,061,424 |
| Regions Financial Corp. | 173,800 | 768,196 |
| Wilmington Trust Corp. (b) | 69,125 | 794,246 |
| | | 11,586,447 |
| Commercial Services & Supplies — 1.4% | | |
| Cintas Corp. | 98,000 | 2,467,640 |
| Republic Services, Inc. Class A | 48,795 | 1,297,947 |
| | | 3,765,587 |
| Communications Equipment — 2.3% | | |
| Tellabs, Inc. (a) | 1,036,100 | 6,009,380 |
| Construction & Engineering — 2.1% | | |
| Foster Wheeler AG (a) | 77,700 | 1,794,870 |
| Jacobs Engineering Group, Inc. (a) | 25,200 | 1,032,696 |
| URS Corp. (a) | 50,200 | 2,540,120 |
| | | 5,367,686 |
| Consumer Finance — 0.3% | | |
| Discover Financial Services, Inc. | 55,700 | 661,716 |
| Containers & Packaging — 1.5% | | |
| Bemis Co. | 45,800 | 1,205,456 |
| Packaging Corp. of America | 53,200 | 1,046,444 |
| Sonoco Products Co. | 63,200 | 1,673,536 |
| | | 3,925,436 |
| Diversified Consumer Services — 0.7% | | |
| Brink’s Home Security Holdings, Inc. (a) | 27,400 | 817,068 |
| Regis Corp. | 71,000 | 969,860 |
| | | 1,786,928 |
| Diversified Telecommunication Services — 0.9% | | |
| Qwest Communications International Inc. | 633,200 | 2,444,152 |
| Electric Utilities — 1.4% | | |
| Cleco Corp. | 96,500 | 2,286,085 |
| NV Energy, Inc. | 109,200 | 1,255,800 |
| | | 3,541,885 |
| | |
| Common Stocks | Shares | Value |
| Electronic Equipment, Instruments | | |
| & Components — 2.0% | | |
| Anixter International, Inc. (a) | 61,300 | $ 2,097,686 |
| Avnet, Inc. (a) | 64,400 | 1,571,360 |
| Ingram Micro, Inc. Class A (a) | 94,800 | 1,594,536 |
| | | 5,263,582 |
| Energy Equipment & Services — 2.2% | | |
| BJ Services Co. | 210,200 | 2,980,636 |
| Smith International, Inc. | 63,000 | 1,583,190 |
| Superior Energy Services, Inc. (a) | 76,500 | 1,269,135 |
| | | 5,832,961 |
| Food Products — 0.8% | | |
| Dean Foods Co. (a) | 41,900 | 887,861 |
| The J.M. Smucker Co. | 23,700 | 1,185,711 |
| | | 2,073,572 |
| Gas Utilities — 0.7% | | |
| Atmos Energy Corp. | 70,700 | 1,920,212 |
| Health Care Equipment & Supplies — 5.3% | | |
| Beckman Coulter, Inc. | 33,800 | 2,129,062 |
| Boston Scientific Corp. (a) | 262,000 | 2,813,880 |
| Covidien Plc | 45,700 | 1,727,917 |
| Inverness Medical Innovations, Inc. (a) | 19,200 | 646,080 |
| Kinetic Concepts, Inc. (a) | 114,000 | 3,604,680 |
| Zimmer Holdings, Inc. (a) | 63,000 | 2,935,800 |
| | | 13,857,419 |
| Health Care Providers & Services — 2.6% | | |
| AmerisourceBergen Corp. | 65,400 | 1,289,688 |
| Coventry Health Care, Inc. (a) | 25,900 | 595,700 |
| Henry Schein, Inc. (a) | 26,200 | 1,346,156 |
| Mednax, Inc. (a) | 23,300 | 1,079,955 |
| Patterson Cos., Inc. (a) | 27,900 | 707,544 |
| Universal Health Services, Inc. Class B | 29,700 | 1,651,617 |
| | | 6,670,660 |
| Health Care Technology — 0.5% | | |
| IMS Health, Inc. | 107,000 | 1,284,000 |
| Hotels, Restaurants & Leisure — 0.6% | | |
| Burger King Holdings, Inc. | 94,500 | 1,608,390 |
| Household Durables — 0.7% | | |
| Jarden Corp. (a) | 69,100 | 1,703,315 |
| Household Products — 1.7% | | |
| Church & Dwight Co., Inc. | 37,900 | 2,235,342 |
| Clorox Co. | 36,400 | 2,220,764 |
| | | 4,456,106 |
| IT Services — 3.7% | | |
| Amdocs Ltd. (a) | 86,200 | 2,061,904 |
| Convergys Corp. (a) | 598,000 | 6,404,580 |
| Perot Systems Corp. Class A (a) | 80,400 | 1,284,792 |
| | | 9,751,276 |
| Insurance — 4.9% | | |
| Arch Capital Group Ltd. (a) | 29,200 | 1,815,948 |
| Axis Capital Holdings Ltd. | 46,000 | 1,309,160 |
| Fidelity National Title Group, Inc. Class A | 120,100 | 1,723,435 |
See Notes to Financial Statements.
BLACKROCK MID CAP VALUE OPPORTUNITIES FUND JULY 31, 2009 7
Schedule of Investments (continued) (Percentages shown are based on Net Assets)
| | |
| Common Stocks | Shares | Value |
| Insurance (concluded) | | |
| The Hanover Insurance Group, Inc. | 27,400 | $ 1,077,094 |
| MetLife, Inc. | 39,200 | 1,330,840 |
| PartnerRe Ltd. | 18,600 | 1,275,774 |
| ProAssurance Corp. (a) | 13,400 | 680,452 |
| Prudential Financial, Inc. | 51,000 | 2,257,770 |
| W.R. Berkley Corp. | 55,000 | 1,277,650 |
| | | 12,748,123 |
| Internet Software & Services — 0.9% | | |
| IAC/InterActiveCorp. (a) | 132,800 | 2,444,848 |
| Leisure Equipment & Products — 1.1% | | |
| Mattel, Inc. | 167,700 | 2,948,166 |
| Life Sciences Tools & Services — 1.3% | | |
| Affymetrix, Inc. (a) | 223,200 | 1,973,088 |
| Thermo Fisher Scientific, Inc. (a) | 29,100 | 1,317,648 |
| | | 3,290,736 |
| Machinery — 6.1% | | |
| AGCO Corp. (a) | 87,800 | 2,762,188 |
| Dover Corp. | 102,000 | 3,469,020 |
| Joy Global, Inc. | 77,400 | 2,877,732 |
| Parker Hannifin Corp. | 56,800 | 2,515,104 |
| SPX Corp. | 24,400 | 1,288,808 |
| Timken Co. | 149,100 | 3,038,658 |
| | | 15,951,510 |
| Media — 1.8% | | |
| Harte-Hanks, Inc. | 442,600 | 4,788,932 |
| Metals & Mining — 0.2% | | |
| Carpenter Technology Corp. | 25,700 | 480,333 |
| Multi-Utilities — 5.0% | | |
| Alliant Energy Corp. | 95,922 | 2,509,320 |
| NiSource, Inc. | 139,400 | 1,796,866 |
| OGE Energy Corp. | 190,100 | 5,722,010 |
| Wisconsin Energy Corp. | 69,800 | 2,999,306 |
| | | 13,027,502 |
| Multiline Retail — 1.1% | | |
| J.C. Penney Co., Inc. | 90,800 | 2,737,620 |
| Oil, Gas & Consumable Fuels — 4.3% | | |
| Cabot Oil & Gas Corp. Class A | 66,700 | 2,343,171 |
| Frontier Oil Corp. | 16,900 | 234,910 |
| Newfield Exploration Co. (a) | 65,800 | 2,587,914 |
| PetroHawk Energy Corp. (a) | 22,000 | 534,160 |
| Plains Exploration & Production Co. (a) | 105,200 | 3,013,980 |
| Whiting Petroleum Corp. (a) | 54,800 | 2,518,608 |
| | | 11,232,743 |
| Personal Products — 0.8% | | |
| Alberto-Culver Co. | 35,700 | 914,634 |
| Mead Johnson Nutrition Co. | 29,100 | 1,059,531 |
| | | 1,974,165 |
| Pharmaceuticals — 2.2% | | |
| King Pharmaceuticals, Inc. (a) | 152,900 | 1,386,803 |
| Medicis Pharmaceutical Corp. Class A | 135,800 | 2,324,896 |
| Sepracor, Inc. (a) | 110,400 | 1,915,440 |
| | | 5,627,139 |
| | |
| Common Stocks | Shares | Value |
| Real Estate Investment Trusts (REITs) — 2.1% | | |
| Alexandria Real Estate Equities, Inc. (b) | 10,600 | $ 403,966 |
| Host Marriott Corp. | 201,200 | 1,826,896 |
| The Macerich Co. | 46,000 | 904,820 |
| Omega Healthcare Investors, Inc. | 33,900 | 566,469 |
| ProLogis | 146,500 | 1,287,735 |
| UDR, Inc. | 39,200 | 409,640 |
| | | 5,399,526 |
| Real Estate Management & Development — 0.7% | | |
| Jones Lang LaSalle, Inc. | 46,700 | 1,772,732 |
| Semiconductors & Semiconductor | | |
| Equipment — 2.9% | | |
| Intersil Corp. Class A | 178,900 | 2,570,793 |
| KLA-Tencor Corp. | 81,000 | 2,582,280 |
| Microchip Technology, Inc. (b) | 87,500 | 2,356,375 |
| | | 7,509,448 |
| Software — 4.8% | | |
| Activision Blizzard, Inc. (a) | 113,300 | 1,297,285 |
| CA, Inc. | 104,100 | 2,200,674 |
| Novell, Inc. (a) | 1,002,100 | 4,589,618 |
| Synopsys, Inc. (a) | 87,500 | 1,748,250 |
| TIBCO Software, Inc. (a) | 303,100 | 2,646,063 |
| | | 12,481,890 |
| Specialty Retail — 4.3% | | |
| Foot Locker, Inc. | 117,500 | 1,301,900 |
| The Gap, Inc. | 165,600 | 2,702,592 |
| Limited Brands, Inc. | 220,900 | 2,858,446 |
| RadioShack Corp. | 158,200 | 2,453,682 |
| Urban Outfitters, Inc. (a) | 75,800 | 1,822,232 |
| | | 11,138,852 |
| Textiles, Apparel & Luxury Goods — 1.5% | | |
| Phillips-Van Heusen Corp. | 38,100 | 1,347,978 |
| VF Corp. | 40,200 | 2,600,538 |
| | | 3,948,516 |
| Thrifts & Mortgage Finance — 0.2% | | |
| New York Community Bancorp, Inc. | 48,000 | 525,120 |
| Total Common Stocks — 86.6% | | 225,460,004 |
| Investment Companies | | |
| iShares Dow Jones U.S. Real Estate Index Fund (b) | 59,900 | 2,148,613 |
| iShares Russell Midcap Growth Index Fund (b) | 84,800 | 3,316,528 |
| MidCap SPDR Trust Series 1 (b) | 38,500 | 4,390,540 |
| SPDR Gold Trust (a) | 33,100 | 3,089,885 |
| Total Investment Companies — 5.0% | | 12,945,566 |
| Total Long-Term Investments | | |
| (Cost — $221,927,716) — 91.6% | | 238,405,570 |
See Notes to Financial Statements.
8 BLACKROCK MID CAP VALUE OPPORTUNITIES FUND JULY 31, 2009
Schedule of Investments (concluded) (Percentages shown are based on Net Assets)
| | | | |
| | | | Interest | |
| Short-Term Securities | | (000) | Value |
| BlackRock Liquidity Series LLC, | | | |
| Money Market Series 0.44% (c)(d)(e) | $ 13,018 | $ 13,017,650 |
| | | | Shares | |
| BlackRock Liquidity Funds, | | | |
| TempFund, 0.29% (c)(d) | 22,847,641 | 22,847,641 |
| Total Short-Term Securities | | | |
| (Cost — $35,865,291) — 13.8% | | | 35,865,291 |
| Total Investments (Cost — $257,793,007*) — 105.4% | 274,270,861 |
| Liabilities in Excess of Other Assets — (5.4)% | | | (14,016,460) |
| Net Assets — 100.0% | | | $ 260,254,401 |
| * The cost and unrealized appreciation (depreciation) of investments as of July 31, |
| | 2009, as computed for federal income tax purposes, were as follows: |
| | Aggregate cost | | | $ 272,435,845 |
| | Gross unrealized appreciation | | | $ 29,643,091 |
| | Gross unrealized depreciation | | | (27,808,075) |
| | Net unrealized appreciation | | | $ 1,835,016 |
| (a) | Non-income producing security. | | | |
| (b) | Security, or a portion of security, is on loan. | | | |
| (c) | Investments in companies considered to be an affiliate of the Fund, for purposes |
| | of Section 2(a)(3) of the Investment Company Act of 1940, were as follows: |
| | | | Net | |
| | Affiliate | | Activity | Income |
| | BlackRock Liquidity Funds, TempFund | | 22,847,641 | $ 28,504 |
| | BlackRock Liquidity Series, LLC | | | |
| | Cash Sweep Series | $(23,188,699) | $ 14,161 |
| | BlackRock Liquidity Series, LLC | | | |
| | Money Market Series | $ (3,801,300) | $ 76,003 |
| (d) | Represents the current yield as of report date. | | |
| (e) | Security was purchased with the cash proceeds from securities loans. |
| • | For Fund compliance purposes, the Fund’s industry classifications refer to any |
| | one or more of the industry sub-classifications used by one or more widely |
| | recognized market indexes or ratings group indexes, and/or as defined by Fund |
| | management. This definition may not apply for purposes of this report, which |
| | may combine industry sub-classifications for reporting ease. | |
• Financial Accounting Standards Board Statement of Financial Accounting
Standards No. 157, “Fair Value Measurements” clarifies the definition of fair
value, establishes a framework for measuring fair values and requires additional
disclosures about the use of fair value measurements. Various inputs are used
in determining the fair value of investments, which are as follows:
• Level 1 — price quotations in active markets/exchanges for identical securities
• Level 2 — other observable inputs (including, but not limited to: quoted prices
for similar assets or liabilities in markets that are active, quoted prices for
identical or similar assets or liabilities in markets that are not active, inputs
other than quoted prices that are observable for the assets or liabilities (such
as interest rates, yield curves, volatilities, prepayment speeds, loss severities,
credit risks and default rates) or other market-corroborated inputs)
• Level 3 — unobservable inputs based on the best information available in the
circumstances, to the extent observable inputs are not available (including the
Fund's own assumptions used in determining the fair value of investments)
The inputs or methodology used for valuing securities are not necessarily an in-
dication of the risk associated with investing in those securities. For information
about the Fund’s policy regarding valuation of investments and other significant
accounting policies, please refer to Note 1 of the Notes to Financial Statements.
The following table summarizes the inputs used as of July 31, 2009 in determin-
ing the fair valuation of the Fund’s investments:
| |
| Valuation | Investments in |
| Inputs | Securities |
| | Assets |
| Level 1 | |
| Long-Term Investments1 | $ 238,405,570 |
| Short-Term Securities | 22,847,641 |
| Total Level 1 | 261,253,211 |
| Level 2 — Short-Term Securities | 13,017,650 |
| Level 3 | — |
| Total | $ 274,270,861 |
| 1 See above Schedule of Investments for values in each industry. |
See Notes to Financial Statements.
BLACKROCK MID CAP VALUE OPPORTUNITIES FUND JULY 31, 2009 9
| |
| Statement of Assets and Liabilities | |
| July 31, 2009 (Unaudited) | |
| Assets | |
| Investments at value — unaffiliated (including securities loaned of $12,706,594) (cost — $221,927,716) | $ 238,405,570 |
| Investments at value — affiliated (cost — $35,865,291) | 35,865,291 |
| Investments sold receivable | 4,269,598 |
| Capital shares sold receivable | 403,901 |
| Dividends receivable | 126,736 |
| Securities lending income receivable — affiliated | 25,068 |
| Prepaid expenses | 18,622 |
| Total assets | 279,114,786 |
| Liabilities | |
| Collateral at value — securities loaned | 13,017,650 |
| Investments purchased payable | 4,794,765 |
| Capital shares redeemed payable | 623,862 |
| Investment advisory fees payable | 133,302 |
| Service and distribution fees payable | 92,953 |
| Other affiliates payable | 11,802 |
| Officer’s and Directors’ fees payable | 152 |
| Other accrued expenses payable | 184,240 |
| Other liabilities | 1,659 |
| Total liabilities | 18,860,385 |
| Net Assets | |
| Net assets | $ 260,254,401 |
| Net Assets Consist of | |
| Paid-in capital | $ 374,079,468 |
| Accumulated net investment loss | (635,082) |
| Accumulated net realized loss | (129,667,839) |
| Net unrealized appreciation/depreciation | 16,477,854 |
| Net Assets | $ 260,254,401 |
| Net Asset Value | |
| Institutional — Based on net assets of $59,964,052 and 5,168,773 shares outstanding 20 million shares authorized, $0.10 par value | $ 11.60 |
| Investor A — Based on net assets of $83,670,353 and 7,362,257 shares outstanding 40 million shares authorized, $0.10 par value | $ 11.36 |
| Investor B — Based on net assets of $18,228,178 and 1,720,208 shares outstanding 40 million shares authorized, $0.10 par value | $ 10.60 |
| Investor C — Based on net assets of $54,310,685 and 5,214,486 shares outstanding 40 million shares authorized, $0.10 par value | $ 10.42 |
| Class R — Based on net assets of $44,081,133 and 4,146,556 shares outstanding 40 million shares authorized, $0.10 par value | $ 10.63 |
See Notes to Financial Statements.
10 BLACKROCK MID CAP VALUE OPPORTUNITIES FUND JULY 31, 2009
| |
| Statement of Operations | |
| Six Months Ended July 31, 2009 (Unaudited) | |
| Investment Income | |
| Dividends | $ 1,190,658 |
| Foreign tax withheld | (189) |
| Income — affiliated | 42,665 |
| Securities lending — affiliated | 76,003 |
| Total income | 1,309,137 |
| Expenses | |
| Investment advisory | 727,085 |
| Transfer agent — Institutional | 60,643 |
| Transfer agent — Investor A | 141,405 |
| Transfer agent — Investor B | 48,652 |
| Transfer agent — Investor C | 187,493 |
| Transfer agent — Class R | 105,546 |
| Service — Investor A | 83,892 |
| Service and distribution — Investor B | 91,969 |
| Service and distribution — Investor C | 240,897 |
| Service and distribution — Class R | 91,536 |
| Accounting services | 57,587 |
| Professional | 36,721 |
| Printing | 35,376 |
| Registration | 34,266 |
| Custodian | 17,179 |
| Officer and Directors | 11,861 |
| Miscellaneous | 15,774 |
| Total expenses | 1,987,882 |
| Less fees waived by advisor | (4,100) |
| Total expenses after fees waived | 1,983,782 |
| Net investment loss | (674,645) |
| Realized and Unrealized Gain (Loss) | |
| Net realized loss from investments | (26,876,174) |
| Net change in unrealized appreciation/depreciation on investments | 77,792,970 |
| Total realized and unrealized gain | 50,916,796 |
| Net Increase in Net Assets Resulting from Operations | $ 50,242,151 |
See Notes to Financial Statements.
BLACKROCK MID CAP VALUE OPPORTUNITIES FUND JULY 31, 2009 11
| | |
| Statements of Changes in Net Assets | | |
| | Six Months | |
| | Ended | Year Ended |
| | July 31,2009 | January 31, |
| Increase (Decrease) in Net Assets: | (Unaudited) | 2009 |
| Operations | | |
| Net investment income (loss) | $ (674,645) | $ 531,855 |
| Net realized loss | (26,876,174) | (95,998,581) |
| Net change in unrealized appreciation/depreciation | 77,792,970 | (31,773,375) |
| Net increase (decrease) in net assets resulting from operations | 50,242,151 | (127,240,101) |
| Dividends and Distributions to Shareholders From | | |
| Net investment income: | | |
| Institutional | (435,001) | — |
| Investor A | (276,391) | — |
| Class R | (4,030) | — |
| Net realized gain: | | |
| Institutional | — | (624,349) |
| Investor A | — | (824,034) |
| Investor B | — | (299,995) |
| Investor C | — | (618,544) |
| Class R | — | (428,160) |
| Decrease in net assets resulting from dividends and distributions to shareholders | (715,422) | (2,795,082) |
| Capital Share Transactions | | |
| Net decrease in net assets derived from capital share transactions | (1,514,494) | (28,668,524) |
| Net Assets: | | |
| Total increase (decrease) in net assets | 48,012,235 | (158,703,707) |
| Beginning of period | 212,242,166 | 370,945,873 |
| End of period | $ 260,254,401 | $ 212,242,166 |
| Undistributed (accumulated) net investment income (loss) | $ (635,082) | $ 754,985 |
See Notes to Financial Statements.
12 BLACKROCK MID CAP VALUE OPPORTUNITIES FUND JULY 31, 2009
| | | | | | | |
| Financial Highlights | | | | | | | |
| | | | | Institutional | | | |
| | Six Months | | | | | | |
| | Ended | | | | | | |
| | July 31,2009 | | Year Ended January 31, | | |
| | (Unaudited) | 2009 | 2008 | 2007 | | 2006 | 2005 |
| Per Share Operating Performance | | | | | | | |
| Net asset value, beginning of period | $ 9.37 | $ 14.80 | $ 18.79 | $ 19.89 | $ 19.58 | $ 17.56 |
| Net investment income1 | 0.01 | 0.11 | 0.05 | 0.05 | | 0.07 | 0.01 |
| Net realized and unrealized gain (loss) | 2.30 | (5.42) | (0.81) | 1.79 | | 4.34 | 2.14 |
| Net increase (decrease) from investment operations | 2.31 | (5.31) | (0.76) | 1.84 | | 4.41 | 2.15 |
| Dividends and distributions from: | | | | | | | |
| Net investment income | (0.08) | — | — | — | | — | — |
| Net realized gain | — | (0.12) | (3.23) | (2.94) | | (4.10) | (0.13) |
| Total dividends and distributions | (0.08) | (0.12) | (3.23) | (2.94) | | (4.10) | (0.13) |
| Net asset value, end of period | $ 11.60 | $ 9.37 | $ 14.80 | $ 18.79 | $ 19.89 | $ 19.58 |
| Total Investment Return2 | | | | | | | |
| Based on net asset value | 24.71%3 | (36.16)% | (5.36)% | 10.09% | | 23.90% | 12.24% |
| Ratios to Average Net Assets | | | | | | | |
| Total expenses | 1.08%4 | 0.98% | 0.93% | 1.01% | | 1.01% | 1.01% |
| Total expenses after fees waived | 1.07%4 | 0.98% | 0.93% | 1.01% | | 1.01% | 1.01% |
| Net investment income | 0.11%4 | 0.84% | 0.29% | 0.28% | | 0.34% | 0.04% |
| Supplemental Data | | | | | | | |
| Net assets, end of period (000) | $ 59,964 | $ 46,590 | $ 78,988 | $ 105,207 | $ 114,921 | $ 126,651 |
| Portfolio turnover | 60% | 154% | 148% | 99% | | 110% | 82% |
| 1 Based on average shares outstanding. | | | | | | | |
| 2 Total investment return excludes the effects of sales charges. | | | | | | | |
| 3 Aggregate total investment return. | | | | | | | |
| 4 Annualized. | | | | | | | |
See Notes to Financial Statements.
BLACKROCK MID CAP VALUE OPPORTUNITIES FUND JULY 31, 2009 13
| | | | | | | |
| Financial Highlights (continued) | | | | | | | |
| | | | | Investor A | | | |
| | Six Months | | | | | | |
| | Ended | | | | | | |
| | July 31,2009 | | Year Ended January 31, | | |
| | (Unaudited) | 2009 | 2008 | 2007 | | 2006 | 2005 |
| Per Share Operating Performance | | | | | | | |
| Net asset value, beginning of period | $ 9.16 | $ 14.52 | $ 18.49 | $ 19.63 | $ 19.33 | $ 17.39 |
| Net investment income (loss)1 | (0.01) | 0.06 | (0.00)2 | 0.003 | | 0.03 | (0.04) |
| Net realized and unrealized gain (loss) | 2.25 | (5.30) | (0.79) | 1.76 | | 4.28 | 2.11 |
| Net increase (decrease) from investment operations | 2.24 | (5.24) | (0.79) | 1.76 | | 4.31 | 2.07 |
| Dividends and distributions from: | | | | | | | |
| Net investment income | (0.04) | — | — | — | | — | — |
| Net realized gain | — | (0.12) | (3.18) | (2.90) | | (4.01) | (0.13) |
| Total dividends and distributions | (0.04) | (0.12) | (3.18) | (2.90) | | (4.01) | (0.13) |
| Net asset value, end of period | $ 11.36 | $ 9.16 | $ 14.52 | $ 18.49 | $ 19.63 | $ 19.33 |
| Total Investment Return4 | | | | | | | |
| Based on net asset value | 24.43%5 | (36.39)% | (5.64)% | 9.76% | | 23.66% | 11.90% |
| Ratios to Average Net Assets | | | | | | | |
| Total expenses | 1.48%6 | 1.36% | 1.24% | 1.26% | | 1.26% | 1.26% |
| Total expenses after fees waived | 1.47%6 | 1.36% | 1.24% | 1.26% | | 1.26% | 1.26% |
| Net investment income (loss) | (0.30)%6 | 0.46% | (0.02)% | 0.00%7 | | 0.13% | (0.20)% |
| Supplemental Data | | | | | | | |
| Net assets, end of period (000) | $ 83,670 | $ 64,948 | $ 110,362 | $ 121,065 | $ 98,343 | $ 85,184 |
| Portfolio turnover | 60% | 154% | 148% | 99% | | 110% | 82% |
| 1 Based on average shares outstanding. | | | | | | | |
| 2 Amount is less than ($0.01) per share. | | | | | | | |
| 3 Amount is less than $0.01 per share. | | | | | | | |
| 4 Total investment returns exclude the effects of sales charges. | | | | | | | |
| 5 Aggregate total investment return. | | | | | | | |
| 6 Annualized. | | | | | | | |
| 7 Amount is less than 0.01%. | | | | | | | |
See Notes to Financial Statements.
14 BLACKROCK MID CAP VALUE OPPORTUNITIES FUND JULY 31, 2009
| | | | | | | |
| Financial Highlights (continued) | | | | | | | |
| | | | | Investor B | | | |
| | Six Months | | | | | | |
| | Ended | | | | | | |
| | July 31,2009 | | Year Ended January 31, | | |
| | (Unaudited) | 2009 | 2008 | 2007 | | 2006 | 2005 |
| Per Share Operating Performance | | | | | | | |
| Net asset value, beginning of period | $ 8.55 | $ 13.66 | $ 17.54 | $ 18.73 | $ 18.43 | $ 16.72 |
| Net investment loss1 | (0.06) | (0.04) | (0.14) | (0.14) | | (0.13) | (0.17) |
| Net realized and unrealized gain (loss) | 2.11 | (4.96) | (0.74) | 1.67 | | 4.09 | 2.01 |
| Net increase (decrease) from investment operations | 2.05 | (5.00) | (0.88) | 1.53 | | 3.96 | 1.84 |
| Distributions from net realized gain | — | (0.11) | (3.00) | (2.72) | | (3.66) | (0.13) |
| Net asset value, end of period | $ 10.60 | $ 8.55 | $ 13.66 | $ 17.54 | $ 18.73 | $ 18.43 |
| Total Investment Return2 | | | | | | | |
| Based on net asset value | 23.98%3 | (36.91)% | (6.38)% | 8.94% | | 22.69% | 11.00% |
| Ratios to Average Net Assets | | | | | | | |
| Total expenses | 2.37%4 | 2.12% | 2.04% | 2.03% | | 2.04% | 2.05% |
| Total expenses after fees waived | 2.37%4 | 2.12% | 2.04% | 2.03% | | 2.04% | 2.05% |
| Net investment loss | (1.24)%4 | (0.34)% | (0.83)% | (0.75)% | | (0.67)% | (0.99)% |
| Supplemental Data | | | | | | | |
| Net assets, end of period (000) | $ 18,228 | $ 20,131 | $ 46,499 | $ 78,174 | $ 112,073 | $ 125,145 |
| Portfolio turnover | 60% | 154% | 148% | 99% | | 110% | 82% |
| 1 Based on average shares outstanding. | | | | | | | |
| 2 Total investment return excludes the effects of sales charges. | | | | | | | |
| 3 Aggregate total investment return. | | | | | | | |
| 4 Annualized. | | | | | | | |
See Notes to Financial Statements.
BLACKROCK MID CAP VALUE OPPORTUNITIES FUND JULY 31, 2009 15
| | | | | | | |
| Financial Highlights (continued) | | | | | | | |
| | | | | Investor C | | | |
| | Six Months | | | | | | |
| | Ended | | | | | | |
| | July 31,2009 | | Year Ended January 31, | | |
| | (Unaudited) | 2009 | 2008 | 2007 | | 2006 | 2005 |
| Per Share Operating Performance | | | | | | | |
| Net asset value, end of period | $ 8.41 | $ 13.47 | $ 17.36 | $ 18.61 | $ 18.39 | $ 16.68 |
| Net investment loss1 | (0.06) | (0.06) | (0.16) | (0.14) | | (0.13) | (0.18) |
| Net realized and unrealized gain (loss) | 2.07 | (4.90) | (0.72) | 1.65 | | 4.07 | 2.02 |
| Net increase (decrease) from investment operations | 2.01 | (4.96) | (0.88) | 1.51 | | 3.94 | 1.84 |
| Distributions from net realized gain | — | (0.10) | (3.01) | (2.76) | | (3.72) | (0.13) |
| Net asset value, end of period | $ 10.42 | $ 8.41 | $ 13.47 | $ 17.36 | $ 18.61 | $ 18.39 |
| Total Investment Return2 | | | | | | | |
| Based on net asset value | 23.90%3 | (37.06)% | (6.50)% | 8.90% | | 22.65% | 11.03% |
| Ratios to Average Net Assets | | | | | | | |
| Total expenses | 2.62%4 | 2.35% | 2.15% | 2.04% | | 2.05% | 2.06% |
| Total expenses after fees waived | 2.61%4 | 2.35% | 2.15% | 2.04% | | 2.05% | 2.06% |
| Net investment loss | (1.45)%4 | (0.54)% | (0.93)% | (0.78)% | | (0.67)% | (1.00)% |
| Supplemental Data | | | | | | | |
| Net assets, end of period (000) | $ 54,311 | $ 47,034 | $ 85,547 | $ 111,084 | $ 103,468 | $ 89,771 |
| Portfolio turnover | 60% | 154% | 148% | 99% | | 110% | 82% |
| 1 Based on average shares outstanding. | | | | | | | |
| 2 Total investment return excludes the effects of sales charges. | | | | | | | |
| 3 Aggregate total investment return. | | | | | | | |
| 4 Annualized. | | | | | | | |
See Notes to Financial Statements.
16 BLACKROCK MID CAP VALUE OPPORTUNITIES FUND JULY 31, 2009
| | | | | | | |
| Financial Highlights (concluded) | | | | | | | |
| | | | | Class R | | | |
| | Six Months | | | | | | |
| | Ended | | | | | | |
| | July 31,2009 | | Year Ended January 31, | | |
| | (Unaudited) | 2009 | 2008 | 2007 | | 2006 | 2005 |
| Per Share Operating Performance | | | | | | | |
| Net asset value, beginning of period | $ 8.56 | $ 13.63 | $ 17.58 | $ 18.81 | $ 18.71 | $ 16.87 |
| Net investment income (loss)1 | (0.03) | 0.01 | (0.07) | (0.05) | | (0.02) | (0.08) |
| Net realized and unrealized gain (loss) | 2.10 | (4.97) | (0.74) | 1.69 | | 4.11 | 2.05 |
| Net increase (decrease) from investment operations | 2.07 | (4.96) | (0.81) | 1.64 | | 4.09 | 1.97 |
| Dividends and distributions from: | | | | | | | |
| Net investment income | (0.00)2 | — | — | — | | — | — |
| Net realized gain | — | (0.11) | (3.14) | (2.87) | | (3.99) | (0.13) |
| Total dividends and distributions | (0.00)2 | (0.11) | (3.14) | (2.87) | | (3.99) | (0.13) |
| Net asset value, end of period | $ 10.63 | $ 8.56 | $ 13.63 | $ 17.58 | $ 18.81 | $ 18.71 |
| Total Investment Return | | | | | | | |
| Based on net asset value | 24.19%3 | (36.66)% | (6.02)% | 9.55% | | 23.26% | 11.68% |
| Ratios to Average Net Assets | | | | | | | |
| Total expenses | 1.91%4 | 1.78% | 1.64% | 1.51% | | 1.51% | 1.51% |
| Total expenses after fees waived | 1.91%4 | 1.78% | 1.64% | 1.51% | | 1.51% | 1.51% |
| Net investment income (loss) | (0.73)%4 | 0.07% | (0.39)% | (0.28)% | | (0.11)% | (0.45)% |
| Supplemental Data | | | | | | | |
| Net assets, end of period (000) | $ 44,081 | $ 33,540 | $ 49,550 | $ 32,476 | $ 17,981 | $ 7,356 |
| Portfolio turnover | 60% | 154% | 148% | 99% | | 110% | 82% |
| 1 Based on average shares outstanding. | | | | | | | |
| 2 Amount is less than (0.01) per share. | | | | | | | |
| 3 Aggregate total investment return. | | | | | | | |
| 4 Annualized. | | | | | | | |
See Notes to Financial Statements.
BLACKROCK MID CAP VALUE OPPORTUNITIES FUND JULY 31, 2009 17
Notes to Financial Statements (Unaudited)
1. Organization and Significant Accounting Policies:
BlackRock Mid Cap Value Opportunities Fund (the “Fund”) of BlackRock
Mid Cap Value Opportunities Series, Inc. (the “Series”) is registered under
the Investment Company Act of 1940, as amended (the “1940 Act”), as
a diversified, open-end management investment company and is organ-
ized as a Maryland corporation. The Fund’s financial statements are pre-
pared in conformity with accounting principles generally accepted in the
United States of America, which may require the use of management
accruals and estimates. Actual results may differ from these estimates.
The Fund offers multiple classes of shares. Institutional Shares are sold
without a sales charge and only to certain eligible investors. Investor A
Shares are generally sold with a front-end sales charge. Shares of
Investor B and Investor C may be subject to a contingent deferred sales
charge. Class R Shares are generally sold only to certain retirement or
similar plans. All classes of shares have identical voting, dividend, liqui-
dation and other rights and the same terms and conditions, except
that Investor A, Investor B, Investor C and Class R Shares bear certain
expenses related to the shareholder servicing of such shares, and
Investor B, Investor C and Class R Shares also bear certain expenses
related to the distribution of such shares. Investor B Shares automati-
cally convert to Investor A Shares after approximately eight years.
Each class has exclusive voting rights with respect to matters relating
to its shareholder servicing and distribution expenditures (except that
Investor B shareholders may vote on material changes to the Investor A
distribution plan).
The following is a summary of significant accounting policies followed
by the Fund:
Valuation of Investments: Equity investments traded on a recognized
securities exchange or the NASDAQ Global Market System are valued at
the last reported sale price that day or the NASDAQ official closing price,
if applicable. For equity investments traded on more than one exchange,
the last reported sale price on the exchange where the stock is primarily
traded is used. Equity investments traded on a recognized exchange for
which there were no sales on that day are valued at the last available
bid price. If no bid price is available, the prior day’s price will be used
unless it is determined that such prior day’s price no longer reflects the
fair value of the security. Investments in open-end investment companies
are valued at their net asset value each business day. The Fund values
its investments in Cash Sweep Series and Money Market Series, each
a series of the BlackRock Liquidity Series, LLC, at fair value, which is
ordinarily based upon their pro rata ownership in the net assets of the
underlying fund.
In the event that application of these methods of valuation results in
a price for an investment which is deemed not to be representative of
the market value of such investment, the investment will be valued by
a method approved by the Board of Directors (the "Board") as reflecting
fair value (“Fair Value Assets”). When determining the price for Fair Value
Assets, the investment advisor and/or sub-advisor seeks to determine
the price that the Fund might reasonably expect to receive from the
current sale of that asset in an arm’s-length transaction. Fair value deter-
minations shall be based upon all available factors that the investment
advisor and/or sub-advisor deems relevant. The pricing of all Fair Value
Assets is subsequently reported to the Board or a committee thereof.
Investment Transactions and Investment Income: For financial reporting
purposes, investment transactions are recorded on the dates the trans-
actions are entered into (the trade dates). Realized gains and losses on
investment transactions are determined on the identified cost basis.
Dividend income is recorded on the ex-dividend dates. Dividends from
foreign securities where the ex-dividend date may have passed are sub-
sequently recorded when the Fund has determined the ex-dividend date.
Upon notification from issuers, some of the dividend income received
from a real estate investment trust may be redesignated as a reduction
of cost of the related investment and/or realized gain. Interest income
is recognized on the accrual basis.
Dividends and Distributions: Dividends and distributions paid by the
Fund are recorded on the ex-dividend dates.
Securities Lending: The Fund may lend securities to financial institutions
that provide cash as collateral, which will be maintained at all times in
an amount equal to at least 100% of the current market value of the
loaned securities. The market value of the loaned securities is deter-
mined at the close of business of the Fund and any additional required
collateral is delivered to the Fund on the next business day. The Fund
typically receives the income on the loaned securities but does not
receive the income on the collateral. The Fund may invest the cash col-
lateral and retain the amount earned on such investment, net of any
amount rebated to the borrower. Loans of securities are terminable at
any time and the borrower, after notice, is required to return borrowed
securities within the standard time period for settlement of securities
transactions. The Fund may pay reasonable lending agent, administrative
and custodial fees in connection with its loans. In the event that the bor-
rower defaults on its obligation to return borrowed securities because of
insolvency or for any other reason, the Fund could experience delays and
costs in gaining access to the collateral. The Fund also could suffer a
loss if the value of an investment purchased with cash collateral falls
below the market value of the loaned securities, or if the value of an
investment purchased with cash collateral falls below the value of the
original cash collateral received.
Income Taxes: It is the Fund’s policy to comply with the requirements of
the Internal Revenue Code applicable to regulated investment compa-
nies and to distribute substantially all of its taxable income to its share-
holders. Therefore, no federal income tax provision is required. Under the
applicable foreign tax laws, a withholding tax may be imposed on inter-
est, dividends and capital gains at various rates.
18 BLACKROCK MID CAP VALUE OPPORTUNITIES FUND JULY 31, 2009
Notes to Financial Statements (continued)
The Fund files US federal and various state and local tax returns. No
income tax returns are currently under examination. The statutes of
limitations on the Fund’s US federal tax returns remain open for each
of the four years ended January 31, 2009. The statutes of limitations on
the Fund’s state and local tax returns may remain open for an additional
year depending upon the jurisdiction.
Recent Accounting Pronouncement: In June 2009, Statement of
Financial Accounting Standards No. 166, “Accounting for Transfers of
Financial Assets — an amendment of FASB Statement No. 140” (“FAS
166”), was issued. FAS 166 is intended to improve the relevance, repre-
sentational faithfulness and comparability of the information that a
reporting entity provides in its financial statements about a transfer of
financial assets; the effects of a transfer on its financial position, finan-
cial performance, and cash flows; and a transferor’s continuing involve-
ment, if any, in transferred financial assets. FAS 166 is effective for
financial statements issued for fiscal years and interim periods begin-
ning after November 15, 2009. Earlier application is prohibited. The
recognition and measurement provisions of FAS 166 must be applied to
transfers occurring on or after the effective date. Additionally, the disclo-
sure provisions of FAS 166 should be applied to transfers that occurred
both before and after the effective date of FAS 166. The impact of FAS
166 on the Fund’s financial statement disclosures, if any, is currently
being assessed.
Other: Expenses directly related to the Fund or its classes are charged to
that Fund or class. Other operating expenses shared by several funds are
prorated among those funds on the basis of relative net assets or other
appropriate methods. Other expenses of the Fund are allocated daily to
each class based on their relative net assets.
2. Investment Advisory Agreement and Other Transactions
with Affiliates:
The PNC Financial Services Group, Inc. (“PNC”) and Bank of America
Corporation (“BAC”) are the largest stockholders of BlackRock, Inc.
(“BlackRock”). Due to the ownership structure, PNC is an affiliate for
1940 Act purposes, but BAC is not.
The Series, on behalf of the Fund, entered into an Investment Advisory
Agreement with BlackRock Advisors, LLC (the “Manager”), the Fund’s
investment advisor, an indirect, wholly owned subsidiary of BlackRock,
to provide investment advisory and administration services.
The Manager is responsible for the management of the Fund’s portfolio
and provides the necessary personnel, facilities, equipment and certain
other services necessary to the operation of the Fund. For such services,
the Fund pays the Manager a monthly fee at an annual rate of 0.65% of
the average daily value of the Fund’s net assets.
The Manager has agreed to waive its advisory fee by the amount
of investment advisory fees the Fund pays to the Manager indirectly
through its investment in affiliated money market funds. This amount
is shown as fees waived by advisor in the Statement of Operations.
The Manager has entered into a separate sub-advisory agreement with
BlackRock Investment Management, LLC (“BIM”), an affiliate of the
Manager, under which the Manager pays BIM for services it provides, a
monthly fee that is a percentage of the investment advisory fee paid by
the Fund to the Manager.
For the six months ended July 31, 2009, the Series, on behalf of the
Fund, reimbursed the Manager $2,118 for certain accounting services,
which is included in accounting services in the Statement of Operations.
The Fund has entered into a Distribution Agreement and Distribution
Plans with BlackRock Investments, LLC (“BRIL”), which is an affiliate
of BlackRock.
Pursuant to the Distribution Plans adopted by the Fund in accordance
with Rule 12b-1 under the 1940 Act, the Fund pays BRIL ongoing service
and distribution fees. The fees are accrued daily and paid monthly at
annual rates based upon the average daily net assets of the shares
as follows:
| | |
| | Service | Distribution |
| | Fee | Fee |
| Investor A | 0.25% | — |
| Investor B | 0.25% | 0.75% |
| Investor C | 0.25% | 0.75% |
| Class R | 0.25% | 0.25% |
Pursuant to sub-agreements with BRIL, broker-dealers and BRIL provide
shareholder servicing and distribution services to the Fund. The ongoing
service fee and/or distribution fee compensates BRIL and each broker-
dealer for providing shareholder servicing and/or distribution-related
services to Investor A, Investor B, Investor C and Class R shareholders.
For the six months ended July 31, 2009, affiliates earned underwriting
discounts, direct commissions and dealer concessions on sales of the
Fund’s Investor A Shares, which totaled $73. Affiliates received contin-
gent deferred sales charges of $5,991, and $1,510 relating to trans-
actions in Investor B and Investor C Shares, respectively. Furthermore,
affiliates received contingent deferred sales charges of $5 relating
to transactions subject to front-end sales charge waivers on Investor
A Shares.
The Fund has received an exemptive order from the Securities and
Exchange Commission permitting it, among other things, to pay an affili-
ated securities lending agent a fee based on a share of the income
derived from the securities lending activities. The Fund has retained BIM
as the securities lending agent for a fee based on a share of the income
from investment of cash collateral. BIM may, on behalf of the Fund,
BLACKROCK MID CAP VALUE OPPORTUNITIES FUND JULY 31, 2009 19
Notes to Financial Statements (continued)
invest cash collateral received by the Fund for such loans, among other
things, in a private investment company managed by the Manager or in
registered money market funds advised by the Manager or its affiliates.
The share of income earned by the Fund on such investments is shown
as securities lending — affiliated in the Statement of Operations. For the
six months ended July 31, 2009, BIM received $19,332 in securities
lending agent fees.
PNC Global Investment Servicing (U.S.) Inc., an indirect, wholly owned
subsidiary of PNC and an affiliate of the Manager, serves as transfer
agent and dividend disbursing agent. Each class of the Fund bears the
costs of transfer agent fees associated with such respective classes.
Transfer agency fees borne by each class of the Fund are comprised
of those fees charged for all shareholder communications including
mailing of shareholder reports, dividend and distribution notices, and
proxy materials for shareholder meetings, as well as per account and
per transaction fees related to servicing and maintenance of shareholder
accounts, including the issuing, redeeming and transferring of shares of
each class of the Fund, 12b-1 fee calculation, check writing, anti-money
laundering services, and customer identification services.
The Manager maintains a call center, which is responsible for providing
certain shareholder services to the Fund, such as responding to share-
holder inquiries and processing transactions based upon instructions
from shareholders with respect to the subscription and redemption of
Fund shares. For the six months ended July 31, 2009, the Fund reim-
bursed the Manager for costs incurred running the call center, which are
included in transfer agent in the Statement of Operations.
| |
| | Call Center |
| | Fees |
| Institutional | $ 346 |
| Investor A | $2,031 |
| Investor B | $ 709 |
| Investor C | $1,162 |
| Class R | $ 385 |
Certain officers and/or directors of the Fund are officers and/or directors
of BlackRock or its affiliates. The Fund reimburses the Manager for com-
pensation paid to the Fund’s Chief Compliance Officer.
3. Investments:
Purchases and sales of investments, excluding short-term securities,
for the six months ended July 31, 2009 were $126,039,867 and
$126,039,400, respectively.
4. Short-Term Borrowings:
The Fund along with certain other funds managed by the Manager and
its affiliates, is a party to a $500 million credit agreement with a group
of lenders, which expires in November 2009. The Fund may borrow under
the credit agreement to fund shareholder redemptions and for other
lawful purposes other than for leverage. The Fund may borrow up to the
maximum amount allowable under the Fund’s current Prospectus and
Statement of Additional Information, subject to various other legal, regu-
latory or contractual limits. The Fund paid its pro rata share of a 0.02%
upfront fee on the aggregate commitment amount based on its net
assets. The Fund pays a commitment fee of 0.08% per annum based on
the Fund’s pro rata share of the unused portion of the credit agreement,
which is included in miscellaneous in the Statement of Operations.
Amounts borrowed under the credit agreement bear interest at a rate
equal to the higher of the (a) federal funds effective rate and (b) reserve
adjusted one month LIBOR, plus, in each case, the higher of (i) 1.50%
and (ii) 50% of the CDX Index (as defined in the credit agreement) in
effect from time to time. The Fund did not borrow under the credit agree-
ment during the six months ended July 31, 2009.
5. Capital Loss Carryforward:
As of January 31, 2009, the Fund had a capital loss carryforward of
$32,503,018 available to offset future realized capital gains, which
expires January 31, 2017.
6. Market and Credit Risk:
In the normal course of business, the Fund invests in securities and
enters into transactions where risks exist due to fluctuations in the
market (market risk) or failure of the issuer of a security to meet all its
obligations (credit risk). The value of securities held by the Fund may
decline in response to certain events, including those directly involving
the issuers whose securities are owned by the Fund; conditions affecting
the general economy; overall market changes; local, regional or global
political, social or economic instability; and currency and interest rate
and price fluctuations. Similar to credit risk, the Fund may be exposed to
counterparty risk, or the risk that an entity with which the Fund have
unsettled or open transactions may default. Financial assets, which
potentially expose the Fund to credit and counterparty risks, consist
principally of investments and cash due from counterparties. The extent
of the Fund’s exposure to credit and counterparty risks with respect to
these financial assets is approximated by their value recorded in the
Fund’s Statement of Assets and Liabilities.
20 BLACKROCK MID CAP VALUE OPPORTUNITIES FUND JULY 31, 2009
| | | | | |
| Notes to Financial Statements (concluded) | | | | |
| 7. Capital Share Transactions: | | | | | |
| Capital share transactions for each class were as follows: | | | | | |
| | Six Months Ended | Year Ended | |
| | July 31, 2009 | | January 31, 2009 |
| | Shares | | Amount | Shares | Amount |
| Institutional | | | | | |
| Shares sold | 774,285 | $ 7,701,472 | 894,301 | $ 11,455,153 |
| Shares issued to shareholders in reinvestment | | | | | |
| of dividends and distributions | 36,094 | | 413,997 | 41,113 | 590,260 |
| Total issued | 810,379 | | 8,115,469 | 935,414 | 12,045,413 |
| Shares redeemed | (615,610) | | (5,866,611) | (1,298,490) | (16,730,965) |
| Net increase (decrease) | 194,769 | $ 2,248,858 | (363,076) | $ (4,685,552) |
| Investor A | | | | | |
| Shares sold and automatic conversion of shares | 1,358,260 | $ 13,453,180 | 2,531,583 | $ 32,621,453 |
| Shares issued to shareholders in reinvestment | | | | | |
| of dividends and distributions | 23,192 | | 260,447 | 55,323 | 778,361 |
| Total issued | 1,381,452 | | 13,713,627 | 2,586,906 | 33,399,814 |
| Shares redeemed | (1,111,759) | | (10,677,785) | (3,092,464) | (38,735,071) |
| Net increase (decrease) | 269,693 | $ 3,035,842 | (505,558) | $ (5,335,257) |
| Investor B | | | | | |
| Shares sold | 77,202 | $ 690,151 | 224,445 | $ 2,637,937 |
| Shares issued to shareholders in reinvestment | | | | | |
| of distributions | — | | — | 20,760 | 273,808 |
| Total issued | 77,202 | | 690,151 | 245,205 | 2,911,745 |
| Shares redeemed and automatic conversion of shares | (712,144) | | (6,473,636) | (1,294,910) | (15,558,989) |
| Net decrease | (634,942) | $ (5,783,485) | (1,049,705) | $(12,647,244) |
| Investor C | | | | | |
| Shares sold | 456,270 | $ 4,039,843 | 1,149,424 | $ 13,409,837 |
| Shares issued to shareholders in reinvestment | | | | | |
| of distributions | — | | — | 44,752 | 581,751 |
| Total issued | 456,270 | | 4,039,843 | 1,194,176 | 13,991,588 |
| Shares redeemed | (833,089) | | (7,279,953) | (1,951,732) | (23,077,661) |
| Net decrease | (376,819) | $ (3,240,110) | (757,556) | $ (9,086,073) |
| Class R | | | | | |
| Shares sold | 1,144,480 | $ 10,479,357 | 2,075,802 | $ 24,379,139 |
| Shares issued to shareholders in reinvestment | | | | | |
| of dividends and distributions | 383 | | 4,030 | 32,466 | 427,903 |
| Total issued | 1,144,863 | | 10,483,387 | 2,108,268 | 24,807,042 |
| Shares redeemed | (918,033) | | (8,258,986) | (1,823,292) | (21,721,440) |
| Net increase | 226,830 | $ 2,224,401 | 284,976 | $ 3,085,602 |
| 8. Subsequent Events: | | | | | |
| Management has evaluated the impact of all subsequent events on the | | | | |
| Fund through September 25, 2009, the date the financial statements | | | | |
| were issued, and has determined that there were no subsequent events | | | | |
| requiring adjustment or disclosure in the financial statements. | | | | |
BLACKROCK MID CAP VALUE OPPORTUNITIES FUND JULY 31, 2009 21
Disclosure of Investment Advisory Agreement and Sub-Advisory Agreement
The Board of Directors (the “Board,” and the members of which
are referred to as “Board Members”) of BlackRock Mid Cap Value
Opportunities Fund (the “Fund”), a series of BlackRock Mid Cap Value
Opportunities Series, Inc. (the “Corporation”), met on May 5, 2009
and June 4 – 5, 2009 to consider the approval of the Fund’s invest-
ment advisory agreement (the “Advisory Agreement”) with BlackRock
Advisors, LLC (the “Manager”), the Fund’s investment advisor. The
Board also considered the approval of the sub-advisory agreement
(the “Sub-Advisory Agreement”) between the Manager and BlackRock
Investment Management, LLC (the “Sub-Advisor”) with respect to the
Fund. The Manager and the Sub-Advisor are referred to herein as
“BlackRock.” For simplicity, the Fund and the Corporation are referred
to herein as the “Fund.” The Advisory Agreement and the Sub-Advisory
Agreement are referred to herein as the “Agreements.”
Activities and Composition of the Board
The Board of the Fund consisted of fifteen individuals, twelve of
whom were not “interested persons” of the Fund as defined in the
Investment Company Act of 1940, as amended (the “1940 Act”) (the
“Independent Board Members”), at the time of the Board’s approval
of the Agreements. The Board Members are responsible for the oversight
of the operations of the Fund and perform the various duties imposed
on the directors of investment companies by the 1940 Act. The
Independent Board Members have retained independent legal counsel
to assist them in connection with their duties. The Chairman of the
Board is an Independent Board Member. The Board has established
five standing committees: an Audit Committee, a Governance and
Nominating Committee, a Compliance Committee, a Performance
Oversight Committee and an Executive Committee, each of which
is composed of Independent Board Members (except for the
Performance Oversight Committee and the Executive Committee,
which each have one interested Board Member) and is chaired by
Independent Board Members.
The Agreements
Pursuant to the 1940 Act, the Board is required to consider the
continuation of the Agreements on an annual basis. In connection
with this process, the Board assessed, among other things, the nature,
scope and quality of the services provided to the Fund by the person-
nel of BlackRock and its affiliates, including investment management,
administrative services, shareholder services, oversight of fund account-
ing and custody, marketing services and assistance in meeting legal
and regulatory requirements.
Throughout the year, the Board, acting directly and through its com-
mittees, considers at each of its meetings factors that are relevant
to its annual consideration of the renewal of the Agreements, including
the services and support provided by BlackRock to the Fund and its
shareholders. Among the matters the Board considered were: (a) invest-
ment performance for one-, three- and five-year periods, as applicable,
against peer funds, and applicable benchmarks, if any, as well as senior
management and portfolio managers’ analysis of the reasons for any
underperformance against its peers; (b) fees, including advisory, admin-
istration, if applicable, and other amounts paid to BlackRock and its
affiliates by the Fund for services, such as transfer agency, marketing
and distribution, call center and fund accounting; (c) Fund operating
expenses; (d) the resources devoted to and compliance reports relat-
ing to the Fund’s investment objective, policies and restrictions,
(e) the Fund’s compliance with its Code of Ethics and compliance
policies and procedures; (f) the nature, cost and character of non-
investment management services provided by BlackRock and its
affiliates; (g) BlackRock’s and other service providers’ internal controls;
(h) BlackRock’s implementation of the proxy voting policies approved by
the Board; (i) the use of brokerage commissions and execution quality;
(j) BlackRock’s implementation of the Fund’s valuation and liquidity
procedures; and (k) periodic updates on BlackRock’s business.
Board Considerations in Approving the Agreements
The Approval Process: Prior to the May 5, 2009 meeting, the
Board requested and received materials specifically relating to
the Agreements. The Board is engaged in an ongoing process with
BlackRock to continuously review the nature and scope of the infor-
mation provided to better assist its deliberations. The materials pro-
vided in connection with the May meeting included (a) information
independently compiled and prepared by Lipper, Inc. (“Lipper”) on
Fund fees and expenses, and the investment performance of the
Fund as compared with a peer group of funds as determined by
Lipper (collectively, “Peers”); (b) information on the profitability of
the Agreements to BlackRock and a discussion of fall-out benefits to
BlackRock and its affiliates and significant shareholders; (c) a general
analysis provided by BlackRock concerning investment advisory fees
charged to other clients, such as institutional and closed-end funds,
under similar investment mandates, as well as the performance of
such other clients; (d) the impact of economies of scale; (e) a sum-
mary of aggregate amounts paid by the Fund to BlackRock; (f) sales
and redemption data regarding the Fund’s shares; and (g) an internal
comparison of management fees classified by Lipper, if applicable.
At an in-person meeting held on May 5, 2009, the Board reviewed
materials relating to its consideration of the Agreements. As a result of
the discussions that occurred during the May 5, 2009 meeting, the
Board presented BlackRock with questions and requests for additional
22 BLACKROCK MID CAP VALUE OPPORTUNITIES FUND JULY 31, 2009
Disclosure of Investment Advisory Agreement and Sub-Advisory Agreement (continued)
information and BlackRock responded to these requests with additional
written information in advance of the June 4 – 5, 2009 Board meeting.
At an in-person meeting held on June 4 – 5, 2009, the Fund’s Board,
including the Independent Board Members, unanimously approved the
continuation of the Advisory Agreement between the Manager and the
Fund and the Sub-Advisory Agreement between the Manager and the
Sub-Advisor with respect to the Fund, each for a one-year term ending
June 30, 2010. The Board considered all factors it believed relevant
with respect to the Fund, including, among other factors: (a) the nature,
extent and quality of the services provided by BlackRock; (b) the invest-
ment performance of the Fund and BlackRock portfolio management;
(c) the advisory fee and the cost of the services and profits to be real-
ized by BlackRock and certain affiliates from the relationship with the
Fund; (d) economies of scale; and (e) other factors.
The Board also considered other matters it deemed important to
the approval process, such as payments made to BlackRock or its
affiliates relating to the distribution of Fund shares, services related
to the valuation and pricing of Fund portfolio holdings, direct and indi-
rect benefits to BlackRock and its affiliates from their relationship with
the Fund and advice from independent legal counsel with respect to
the review process and materials submitted for the Board’s review. The
Board noted the willingness of BlackRock personnel to engage in open,
candid discussions with the Board. The Board did not identify any par-
ticular information as controlling, and each Board Member may have
attributed different weights to the various items considered.
A. Nature, Extent and Quality of the Services: The Board, including
the Independent Board Members, reviewed the nature, extent and
quality of services provided by BlackRock, including the investment
advisory services and the resulting performance of the Fund. Through-
out the year, the Board compared Fund performance to the perform-
ance of a comparable group of mutual funds, and the performance of
at least one relevant benchmark, if any. The Board met with BlackRock’s
senior management personnel responsible for investment operations,
including the senior investment officers. The Board also reviewed
the materials provided by the Fund’s portfolio management team
discussing Fund performance and the Fund’s investment objective,
strategies and outlook.
The Board considered, among other factors, the number, education
and experience of BlackRock’s investment personnel generally and
the Fund’s portfolio management team, investments by portfolio
managers in the funds they manage, BlackRock’s portfolio trading
capabilities, BlackRock’s use of technology, BlackRock’s commitment
to compliance and BlackRock’s approach to training and retaining port-
folio managers and other research, advisory and management personnel.
The Board also reviewed a general description of BlackRock’s compen-
sation structure with respect to the Fund’s portfolio management team
and BlackRock’s ability to attract and retain high-quality talent.
In addition to advisory services, the Board considered the quality of
the administrative and non-investment advisory services provided to
the Fund. BlackRock and its affiliates provide the Fund with certain
administrative, transfer agency, shareholder and other services (in
addition to any such services provided to the Fund by third parties)
and officers and other personnel as are necessary for the operations
of the Fund. In addition to investment advisory services, BlackRock
and its affiliates provide the Fund with other services, including
(i) preparing disclosure documents, such as the prospectus, the
statement of additional information and periodic shareholder reports;
(ii) assisting with daily accounting and pricing; (iii) overseeing and
coordinating the activities of other service providers; (iv) organizing
Board meetings and preparing the materials for such Board meetings;
(v) providing legal and compliance support; and (vi) performing other
administrative functions necessary for the operation of the Fund, such
as tax reporting, fulfilling regulatory filing requirements, and call center
services. The Board reviewed the structure and duties of BlackRock’s
fund administration, accounting, legal and compliance departments
and considered BlackRock’s policies and procedures for assuring
compliance with applicable laws and regulations.
B. The Investment Performance of the Fund and BlackRock: The
Board, including the Independent Board Members, also reviewed
and considered the performance history of the Fund. In preparation
for the May 5, 2009 meeting, the Board was provided with reports,
independently prepared by Lipper, which included a comprehensive
analysis of the Fund’s performance. The Board also reviewed a narra-
tive and statistical analysis of the Lipper data that was prepared by
BlackRock, which analyzed various factors that affect Lipper’s rankings.
In connection with its review, the Board received and reviewed infor-
mation regarding the investment performance of the Fund as com-
pared to a representative group of similar funds as determined by
Lipper and to all funds in the Fund’s applicable Lipper category. The
Board was provided with a description of the methodology used by
Lipper to select peer funds. The Board regularly reviews the perform-
ance of the Fund throughout the year. The Board attaches more
importance to performance over relatively long periods of time,
typically three to five years.
BLACKROCK MID CAP VALUE OPPORTUNITIES FUND JULY 31, 2009 23
Disclosure of Investment Advisory Agreement and Sub-Advisory Agreement (continued)
The Board noted that the Fund ranked in the second quartile against
its Lipper Performance Universe for each of the one-, three- and five-
year periods reported.
C. Consideration of the Advisory Fees and the Cost of the Services
and Profits to be Realized by BlackRock and its Affiliates from their
Relationship with the Fund: The Board, including the Independent
Board Members, reviewed the Fund’s contractual advisory fee rates
compared with the other funds in its Lipper category. It also compared
the Fund’s total expenses, as well as actual management fees, to
those of other comparable funds. The Board considered the services
provided and the fees charged by BlackRock to other types of clients
with similar investment mandates, including separately managed
institutional accounts.
The Board received and reviewed statements relating to BlackRock’s
financial condition and profitability with respect to the services it
provided the Fund. The Board was also provided with a profitability
analysis that detailed the revenues earned and the expenses incurred
by BlackRock for services provided to the Fund. The Board reviewed
BlackRock’s profitability with respect to the Fund and other funds
the Board currently oversees for the year ended December 31, 2008
compared to available aggregate profitability data provided for the
year ended December 31, 2007. The Board reviewed BlackRock’s
profitability with respect to other fund complexes managed by the
Manager and/or its affiliates. The Board reviewed BlackRock’s assump-
tions and methodology of allocating expenses in the profitability analy-
sis, noting the inherent limitations in allocating costs among various
advisory products. The Board recognized that profitability may be
affected by numerous factors including, among other things, fee
waivers and expense reimbursements by the Manager, the types of
funds managed, expense allocations and business mix, and therefore
comparability of profitability is somewhat limited.
The Board noted that, in general, individual fund or product line
profitability of other advisors is not publicly available. Nevertheless,
to the extent such information is available, the Board considered
BlackRock’s operating margin in general compared to the operating
margin for leading investment management firms whose operations
include advising open-end funds, among other product types. The
comparison indicated that operating margins for BlackRock with
respect to its registered funds are consistent with margins earned by
similarly situated publicly traded competitors. In addition, the Board
considered, among other things, certain third party data comparing
BlackRock’s operating margin with that of other publicly-traded asset
management firms, which concluded that larger asset bases do not,
in themselves, translate to higher profit margins.
In addition, the Board considered the cost of the services provided
to the Fund by BlackRock, and BlackRock’s and its affiliates’ profits
relating to the management and distribution of the Fund and the other
funds advised by BlackRock and its affiliates. As part of its analysis,
the Board reviewed BlackRock’s methodology in allocating its costs
to the management of the Fund. The Board also considered whether
BlackRock has the financial resources necessary to attract and retain
high quality investment management personnel to perform its obliga-
tions under the Agreements and to continue to provide the high quality
of services that is expected by the Board.
The Board noted that the Fund’s contractual advisory fees, which do
not take into account any expense reimbursements or fee waivers,
were lower than or equal to the median contractual advisory fees paid
by the Fund’s Peers.
D. Economies of Scale: The Board, including the Independent Board
Members, considered the extent to which economies of scale might
be realized as the assets of the Fund increase and whether there
should be changes in the advisory fee rate or structure in order to
enable the Fund to participate in these economies of scale, for exam-
ple through the use of breakpoints in the advisory fee based upon
the assets of the Fund. The Board considered that the funds in the
BlackRock fund complex share some common resources and, as a
result, an increase in the overall size of the complex could permit
each fund to incur lower expenses than it would otherwise as a stand-
alone entity. The Board also considered BlackRock’s overall operations
and its efforts to expand the scale of, and improve the quality of,
its operations.
E. Other Factors: The Board also took into account other ancillary
or “fall-out” benefits that BlackRock or its affiliates and significant
shareholders may derive from its relationship with the Fund, both
tangible and intangible, such as BlackRock’s ability to leverage its
investment professionals who manage other portfolios, an increase
in BlackRock’s profile in the investment advisory community, and
the engagement of BlackRock’s affiliates as service providers to the
Fund, including for administrative, transfer agency and distribution
services. The Board also noted that BlackRock may use third party
research obtained by soft dollars generated by certain mutual fund
transactions to assist itself in managing all or a number of its other
client accounts.
24 BLACKROCK MID CAP VALUE OPPORTUNITIES FUND JULY 31, 2009
Disclosure of Investment Advisory Agreement and Sub-Advisory Agreement (concluded)
In connection with its consideration of the Agreements, the Board
also received information regarding BlackRock’s brokerage and soft
dollar practices. The Board received reports from BlackRock which
included information on brokerage commissions and trade execution
practices throughout the year.
Conclusion
The Board, including the Independent Board Members, unanimously
approved the continuation of the Advisory Agreement between the
Manager and the Fund for a one-year term ending June 30, 2010 and
the Sub-Advisory Agreement between the Manager and Sub-Advisor
with respect to the Fund for a one-year term ending June 30, 2010.
Based upon its evaluation of all these factors in their totality, the
Board, including the Independent Board Members, was satisfied that
the terms of the Agreements were fair and reasonable and in the best
interest of the Fund and its shareholders. In arriving at a decision to
approve the Agreements, the Board did not identify any single factor
or group of factors as all-important or controlling, but considered all
factors together, and different Board Members may have attributed
different weights to the various factors considered. The Independent
Board Members were also assisted by the advice of independent
legal counsel in making this determination. The contractual fee
arrangements for the Fund reflect the results of several years of
review by the Board Members and predecessor Board Members, and
discussions between such Board Members (and predecessor Board
Members) and BlackRock. Certain aspects of the arrangements may
be the subject of more attention in some years than in others, and
the Board Members’ conclusions may be based in part on their con-
sideration of these arrangements in prior years.
BLACKROCK MID CAP VALUE OPPORTUNITIES FUND JULY 31, 2009 25
Officers and Directors
Robert M. Hernandez, Chairman of the Board, Director and Member of
the Audit Committee
Fred G. Weiss, Vice Chair of the Board, Director and Member of
the Audit Committee
James H. Bodurtha, Director
Bruce R. Bond, Director
Donald W. Burton, Director
Richard S. Davis, Director
Stuart E. Eizenstat, Director
Laurence D. Fink, Director
Kenneth A. Froot, Director
Henry Gabbay, Director
John F. O’Brien, Director
Roberta Cooper Ramo, Director
Jean Margo Reid, Director
David H. Walsh, Director
Richard R. West, Director and Member of the Audit Committee
Donald C. Burke, Series President and Chief Executive Officer
Anne F. Ackerley, Vice President
Neal J. Andrews, Chief Financial Officer
Jay M. Fife, Treasurer
Brian P. Kindelan, Chief Compliance Officer
Howard B. Surloff, Secretary
Investment Advisor
BlackRock Advisors, LLC
Wilmington, DE 19809
Sub-Advisor
BlackRock Investment Management, LLC
Plainsboro, NJ 08536
Custodian
The Bank of New York Mellon
New York, NY 10286
Transfer Agent
PNC Global Investment Servicing (U.S.) Inc.
Wilmington, DE 19809
Accounting Agent
State Street Bank and Trust Company
Princeton, NJ 08540
Distributor
BlackRock Investments, LLC
New York, NY 10022
Legal Counsel
Willkie Farr & Gallagher LLP
New York, NY 10019
Independent Registered
Public Accounting Firm
Deloitte & Touche LLP
Princeton, NJ 08540
Address of the Fund
100 Bellevue Parkway
Wilmington, DE 19809
Effective July 31, 2009, Donald C. Burke, President and Chief Executive Officer of the Series
retired. The Series’ Board of Directors wishes Mr. Burke well in his retirement.
Effective August 1, 2009, Anne F. Ackerley became President and Chief Executive Officer
of the Series, and Jeffrey Holland and Brian Schmidt became Vice Presidents of the Series.
Effective August 1, 2009, Jean Margo Reid resigned as a Director of the Series. The Board wishes
Ms. Reid well in her future endeavors.
Effective September 9, 2009, Brendan Kyne became a Vice President of the Series.
26 BLACKROCK MID CAP VALUE OPPORTUNITIES FUND JULY 31, 2009
Additional Information
BlackRock Privacy Principles
BlackRock is committed to maintaining the privacy of its current and
former fund investors and individual clients (collectively, “Clients”) and
to safeguarding their non-public personal information. The following infor-
mation is provided to help you understand what personal information
BlackRock collects, how we protect that information and why in certain
cases we share such information with select parties.
If you are located in a jurisdiction where specific laws, rules or regula-
tions require BlackRock to provide you with additional or different privacy-
related rights beyond what is set forth below, then BlackRock will comply
with those specific laws, rules or regulations.
BlackRock obtains or verifies personal non-public information from and
about you from different sources, including the following: (i) information
we receive from you or, if applicable, your financial intermediary, on appli-
cations, forms or other documents; (ii) information about your trans-
actions with us, our affiliates, or others; (iii) information we receive from
a consumer reporting agency; and (iv) from visits to our Web sites.
BlackRock does not sell or disclose to non-affiliated third parties any non-
public personal information about its Clients, except as permitted by law
or as is necessary to respond to regulatory requests or to service Client
accounts. These non-affiliated third parties are required to protect the
confidentiality and security of this information and to use it only for its
intended purpose.
We may share information with our affiliates to service your account
or to provide you with information about other BlackRock products or
services that may be of interest to you. In addition, BlackRock restricts
access to non-public personal information about its Clients to those
BlackRock employees with a legitimate business need for the information.
BlackRock maintains physical, electronic and procedural safeguards
that are designed to protect the non-public personal information of its
Clients, including procedures relating to the proper storage and disposal
of such information.
BLACKROCK MID CAP VALUE OPPORTUNITIES FUND JULY 31, 2009 27
Additional Information (continued)
General Information
Electronic Delivery
Electronic copies of most financial reports and prospectuses are available
on the Fund’s Web site or shareholders can sign up for e-mail notifications
of quarterly statements, annual and semi-annual reports and prospectuses
by enrolling in the Fund’s electronic delivery program.
To enroll:
Shareholders Who Hold Accounts with Investment Advisors, Banks or
Brokerages:
Please contact your financial advisor. Please note that not all investment
advisers, banks or brokerages may offer this service.
Shareholders Who Hold Accounts Directly with BlackRock:
1) Access the BlackRock Web site at
http://www.blackrock.com/edelivery
2) Select “eDelivery” under the “More Information” section
3) Log into your account
Householding
The Fund will mail only one copy of shareholder documents, including
prospectuses, annual and semi-annual reports and proxy statements, to
shareholders with multiple accounts at the same address. This practice is
commonly called “householding” and it is intended to reduce expenses
and eliminate duplicate mailings of shareholder documents. Mailings of
your shareholder documents may be householded indefinitely unless you
instruct us otherwise. If you do not want the mailing of these documents
to be combined with those for other members of your household, please
contact the Fund at (800) 441-7762.
Availability of Proxy Voting Policies and Procedures
A description of the policies and procedures that the Fund uses to
determine how to vote proxies relating to portfolio securities is available
(1) without charge, upon request, by calling toll-free (800) 441-7762;
(2) at www.blackrock.com; and (3) on the Securities and Exchange
Commission’s (the “SEC”) website at http://www.sec.gov.
28 BLACKROCK MID CAP VALUE OPPORTUNITIES FUND JULY 31, 2009
Additional Information (concluded)
General Information (concluded)
Availability of Proxy Voting Record
Information about how the Fund votes proxies relating to securities held
in the Fund’s portfolio during the most recent 12-month period ended
June 30 is available upon request and without charge (1) at www.black-
rock.com or by calling (800) 441-7762 and (2) on the SEC’s website at
http://www.sec.gov.
Availability of Quarterly Portfolio Schedule
The Fund files its complete schedule of portfolio holdings with the SEC
for the first and third quarters of each fiscal year on Form N-Q. The Fund’s
Forms N-Q are available on the SEC’s website at http://www.sec.gov
and may also be reviewed and copied at the SEC’s Public Reference
Room in Washington, D.C. Information on the operation of the Public
Reference Room may be obtained by calling (202) 551-8090. The
Fund’s Forms N-Q may also be obtained upon request and without
charge by calling (800) 441-7762.
Shareholder Privileges
Account Information
Call us at (800) 441-7762 from 8:00 AM to 6:00 PM EST to get infor-
mation about your account balances, recent transactions and share
prices. You can also reach us on the Web at www.blackrock.com/funds.
Automatic Investment Plans
Investor Class shareholders who want to invest regularly can arrange to
have $50 or more automatically deducted from their checking or savings
account and invested in any of the BlackRock funds.
Systematic Withdrawal Plans
Investor Class shareholders can establish a systematic withdrawal plan
and receive periodic payments of $50 or more from their BlackRock
funds, as long as their account is at least $10,000.
Retirement Plans
Shareholders may make investments in conjunction with Traditional,
Rollover, Roth, Coverdell, Simple IRAs, SEP IRAs and 403(b) Plans.
BLACKROCK MID CAP VALUE OPPORTUNITIES FUND JULY 31, 2009 29
A World-Class Mutual Fund Family
BlackRock offers a diverse lineup of open-end mutual funds crossing all investment styles and managed by experts in equity, fixed income and
tax-exempt investing.
| | |
| Equity Funds | | |
| BlackRock All-Cap Energy & Resources Portfolio | BlackRock Global Opportunities Portfolio | BlackRock Mid-Cap Value Equity Portfolio |
| BlackRock Asset Allocation Portfolio† | BlackRock Global SmallCap Fund | BlackRock Mid Cap Value Opportunities Fund |
| BlackRock Aurora Portfolio | BlackRock Health Sciences Opportunities Portfolio | BlackRock Natural Resources Trust |
| BlackRock Balanced Capital Fund† | BlackRock Healthcare Fund | BlackRock Pacific Fund |
| BlackRock Basic Value Fund | BlackRock Index Equity Portfolio* | BlackRock Science & Technology |
| BlackRock Capital Appreciation Portfolio | BlackRock International Fund | Opportunities Portfolio |
| BlackRock Energy & Resources Portfolio | BlackRock International Diversification Fund | BlackRock Small Cap Core Equity Portfolio |
| BlackRock Equity Dividend Fund | BlackRock International Index Fund | BlackRock Small Cap Growth Equity Portfolio |
| BlackRock EuroFund | BlackRock International Opportunities Portfolio | BlackRock Small Cap Growth Fund II |
| BlackRock Focus Growth Fund | BlackRock International Value Fund | BlackRock Small Cap Index Fund |
| BlackRock Focus Value Fund | BlackRock Large Cap Core Fund | BlackRock Small Cap Value Equity Portfolio* |
| BlackRock Fundamental Growth Fund | BlackRock Large Cap Core Plus Fund | BlackRock Small/Mid-Cap Growth Portfolio |
| BlackRock Global Allocation Fund† | BlackRock Large Cap Growth Fund | BlackRock S&P 500 Index Fund |
| BlackRock Global Dynamic Equity Fund | BlackRock Large Cap Value Fund | BlackRock U.S. Opportunities Portfolio |
| BlackRock Global Emerging Markets Fund | BlackRock Latin America Fund | BlackRock Utilities and Telecommunications Fund |
| BlackRock Global Financial Services Fund | BlackRock Mid-Cap Growth Equity Portfolio | BlackRock Value Opportunities Fund |
| BlackRock Global Growth Fund | | |
| Fixed Income Funds | | |
| BlackRock Bond Portfolio | BlackRock Income Portfolio† | BlackRock Low Duration Bond Portfolio |
| BlackRock Emerging Market Debt Portfolio | BlackRock Income Builder Portfolio† | BlackRock Managed Income Portfolio |
| BlackRock Enhanced Income Portfolio | BlackRock Inflation Protected Bond Portfolio | BlackRock Short-Term Bond Fund |
| BlackRock GNMA Portfolio | BlackRock Intermediate Government | BlackRock Strategic Income Portfolio |
| BlackRock Government Income Portfolio | Bond Portfolio | BlackRock Total Return Fund |
| BlackRock High Income Fund | BlackRock International Bond Portfolio | BlackRock Total Return Portfolio II |
| BlackRock High Yield Bond Portfolio | BlackRock Long Duration Bond Portfolio | BlackRock World Income Fund |
| Municipal Bond Funds | | |
| BlackRock AMT-Free Municipal Bond Portfolio | BlackRock Kentucky Municipal Bond Portfolio | BlackRock New York Municipal Bond Fund |
| BlackRock California Municipal Bond Fund | BlackRock Municipal Insured Fund | BlackRock Ohio Municipal Bond Portfolio |
| BlackRock Delaware Municipal Bond Portfolio | BlackRock National Municipal Fund | BlackRock Pennsylvania Municipal Bond Fund |
| BlackRock High Yield Municipal Fund | BlackRock New Jersey Municipal Bond Fund | BlackRock Short-Term Municipal Fund |
| BlackRock Intermediate Municipal Fund | | |
| Target Risk & Target Date Funds | | |
| BlackRock Prepared Portfolios | BlackRock Lifecycle Prepared Portfolios | |
| Conservative Prepared Portfolio | Prepared Portfolio 2010 | Prepared Portfolio 2030 |
| Moderate Prepared Portfolio | Prepared Portfolio 2015 | Prepared Portfolio 2035 |
| Growth Prepared Portfolio | Prepared Portfolio 2020 | Prepared Portfolio 2040 |
| Aggressive Growth Prepared Portfolio | Prepared Portfolio 2025 | Prepared Portfolio 2045 |
| | | Prepared Portfolio 2050 |
| * See the prospectus for information on specific limitations on investments in the fund. | |
| † Mixed asset fund. | | |
| BlackRock mutual funds are currently distributed by BlackRock Investments, LLC. You should consider the investment objectives, risks, charges and |
| expenses of the funds under consideration carefully before investing. Each fund’s prospectus contains this and other information and is available at |
| www.blackrock.com or by calling (800) 882-0052 or from your financial advisor. The prospectus should be read carefully before investing. |
30 BLACKROCK MID CAP VALUE OPPORTUNITIES FUND JULY 31, 2009

This report is not authorized for use as an offer of sale or a solicita-
tion of an offer to buy shares of the Fund unless accompanied or
preceded by the Fund’s current prospectus. Past performance
results shown in this report should not be considered a representa-
tion of future performance. Investment return and principal value of
shares will fluctuate so that shares, when redeemed, may be worth
more or less than their original cost. Statements and other informa-
tion herein are as dated and are subject to change.

Item 2 – Code of Ethics – Not Applicable to this semi-annual report
Item 3 – Audit Committee Financial Expert – Not Applicable to this semi-annual report
Item 4 – Principal Accountant Fees and Services – Not Applicable to this semi-annual report
Item 5 – Audit Committee of Listed Registrants – Not Applicable
Item 6 – Investments
(a) The registrant’s Schedule of Investments is included as part of the Report to Stockholders filed under Item 1 of
this form.
(b) Not Applicable due to no such divestments during the semi-annual period covered since the previous Form N-
CSR filing.
Item 7 – Disclosure of Proxy Voting Policies and Procedures for Closed-End Management Investment Companies – Not
Applicable
Item 8 – Portfolio Managers of Closed-End Management Investment Companies – Not Applicable
Item 9 – Purchases of Equity Securities by Closed-End Management Investment Company and Affiliated Purchasers – Not
Applicable
Item 10 – Submission of Matters to a Vote of Security Holders – The registrant’s Nominating and Governance Committee will
consider nominees to the board of directors recommended by shareholders when a vacancy becomes available.
Shareholders who wish to recommend a nominee should send nominations that include biographical information and
set forth the qualifications of the proposed nominee to the registrant’s Secretary. There have been no material
changes to these procedures.
Item 11 – Controls and Procedures
11(a) – The registrant’s principal executive and principal financial officers or persons performing similar functions have
concluded that the registrant’s disclosure controls and procedures (as defined in Rule 30a-3(c) under the Investment
Company Act of 1940, as amended (the “1940 Act”)) are effective as of a date within 90 days of the filing of this
report based on the evaluation of these controls and procedures required by Rule 30a-3(b) under the 1940 Act and
Rule 15(d)-15(b) under the Securities Exchange Act of 1934, as amended.
11(b) – There were no changes in the registrant’s internal control over financial reporting (as defined in Rule 30a-3(d) under
the 1940 Act) that occurred during the second fiscal quarter of the period covered by this report that have materially
affected, or are reasonably likely to materially affect, the registrant’s internal control over financial reporting.
Item 12 – Exhibits attached hereto
12(a)(1) – Code of Ethics – Not Applicable to this semi-annual report
12(a)(2) – Certifications – Attached hereto
12(a)(3) – Not Applicable
12(b) – Certifications – Attached hereto
Pursuant to the requirements of the Securities Exchange Act of 1934 and the Investment Company Act of 1940, the
registrant has duly caused this report to be signed on its behalf by the undersigned, thereunto duly authorized.
BlackRock Mid Cap Value Opportunities Fund of BlackRock Mid Cap Value Opportunities Series, Inc.
By: /s/ Anne F. Ackerley
Anne F. Ackerley
Chief Executive Officer of
BlackRock Mid Cap Value Opportunities Fund of BlackRock Mid Cap Value Opportunities Series, Inc.
Date: September 22, 2009
Pursuant to the requirements of the Securities Exchange Act of 1934 and the Investment Company Act of 1940, this
report has been signed below by the following persons on behalf of the registrant and in the capacities and on the
dates indicated.
By: /s/ Anne F. Ackerley
Anne F. Ackerley
Chief Executive Officer (principal executive officer) of
BlackRock Mid Cap Value Opportunities Fund of BlackRock Mid Cap Value Opportunities Series, Inc.
Date: September 22, 2009
By: /s/Neal J. Andrews
Neal J. Andrews
Chief Financial Officer (principal financial officer) of
BlackRock Mid Cap Value Opportunities Fund of BlackRock Mid Cap Value Opportunities Series, Inc.
Date: September 22, 2009