UNITEDSTATES
SECURITIESANDEXCHANGECOMMISSION
Washington,D.C.20549
FORM N-CSRS
CERTIFIED SHAREHOLDER REPORT OF REGISTERED MANAGEMENT
INVESTMENT COMPANIES
Investment Company Act file number 811-07177
Name of Fund: BlackRock Mid Cap Value Opportunities Fund of BlackRock Mid Cap Value
Opportunities Series, Inc.
Fund Address: 100 Bellevue Parkway, Wilmington, DE 19809
Name and address of agent for service: Anne F. Ackerley, Chief Executive Officer, BlackRock Mid
Cap Value Opportunities Fund of BlackRock Mid Cap Value Opportunities Series, Inc., 55
East 52nd Street, New York, NY 10055
Registrant’s telephone number, including area code: (800) 441-7762
Date of fiscal year end: 01/31/2011
Date of reporting period: 07/31/2010
Item 1 – Report to Stockholders

Semi-Annual Report (Unaudited)
BlackRock Mid Cap Value Opportunities Fund | of BlackRock Mid Cap Value Opportunities Series, Inc.
July 31, 2010
Not FDIC Insured • No Bank Guarantee • May Lose Value
| |
| Table of Contents | |
| | Page |
| Dear Shareholder | 3 |
| Semi-Annual Report: | |
| Fund Summary | 4 |
| About Fund Performance | 6 |
| Disclosure of Expenses | 6 |
| Financial Statements: | |
| Schedule of Investments | 7 |
| Statement of Assets and Liabilities | 10 |
| Statement of Operations | 11 |
| Statements of Changes in Net Assets | 12 |
| Financial Highlights | 13 |
| Notes to Financial Statements | 18 |
| Dislosure of Investment Advisory Agreement and Sub-Advisory Agreement | 23 |
| Officers and Directors | 27 |
| Additional Information | 28 |
| Mutual Fund Family | 30 |
2 BLACKROCK MID CAP VALUE OPPORTUNITIES FUND
JULY 31, 2010
Dear Shareholder
The global economy is continuing to slowly improve, with the United States and emerging markets leading the way; however global and US economic
statistics show that the pace of economic growth has trailed off in recent months. Market volatility has remained elevated over the past several months
as investors remain uncertain about the future direction of economic growth. The sovereign debt crisis in Europe, slowing growth in China and concerns
over the possibility that the United States and other developed markets are heading for a double-dip recession have all acted to depress investor senti-
ment. It is our view that the recent soft patch of economic data is just that — a slowdown in the pace of recovery and not an indication that the economy
is sliding back into recession. In the United States, we expect to see slightly slower economic growth over the next several quarters; however, true
double-dip recessions are quite rare, and unless there is a major shock to the economy, we believe the recovery will continue.
Global equity markets have moved unevenly higher since bottoming out in early 2009 as investors were enticed by depressed valuations, improved
corporate earnings, and their desire for higher yields. Several significant downturns, however, have occurred — primarily as a result of mixed economic
data and concerns about the possibility of prolonged deflation (especially in Europe). As the period drew to a close, equity markets were staging a muted
recovery. On a 12-month basis global equities were still showing positive returns thanks to improving corporate revenues and profits and a reasonably
strong macro backdrop. From a geographic perspective, US equities have significantly outpaced their international counterparts over the past six and
twelve months, as the domestic economic recovery has been more pronounced and credit-related issues have held European markets down. Within
the United States, smaller cap stocks have outperformed large caps year-to-date.
In fixed income markets, yields have fluctuated significantly over the past year as economic data has been mixed. Over recent months, risk aversion and
credit issues kept interest rates low and US Treasury yields have fallen significantly as investors favored “safe haven” assets. As the period drew to a close,
higher-risk fixed income assets performed well due to strong earnings announcements and better-than-expected results on European bank stress tests.
Meanwhile, tax-exempt municipal bonds slightly outperformed US investment grade bonds on a 12-month basis, but underperformed year-to-date as
investors rotated to the relative safety of Treasuries.
Regarding cash investments, yields on money market securities remain near all-time lows (producing returns only marginally above zero percent), with
the Federal Open Market Committee reiterating that economic circumstances are likely to necessitate an accommodative interest rate stance for an
“extended period.”
| | |
| Against this backdrop, the major market averages posted the following returns: | | |
| Total Returns as of July 31, 2010 | 6-month | 12-month |
| US large cap equities (S&P 500 Index) | 3.61% | 13.84% |
| US small cap equities (Russell 2000 Index) | 8.79 | 18.43 |
| International equities (MSCI Europe, Australasia, Far East Index) | (0.62) | 6.26 |
| 3-month Treasury bill (BofA Merrill Lynch 3-Month Treasury Bill Index) | 0.06 | 0.16 |
| US Treasury securities (BofA Merrill Lynch 10-Year US Treasury Index) | 7.67 | 8.34 |
| US investment grade bonds (Barclays Capital US Aggregate Bond Index) | 4.85 | 8.91 |
| Tax-exempt municipal bonds (Barclays Capital Municipal Bond Index) | 4.06 | 9.15 |
| US high yield bonds (Barclays Capital US Corporate High Yield 2% Issuer Capped Index) | 6.72 | 23.69 |
Past performance is no guarantee of future results. Index performance shown for illustrative purposes only. You cannot invest directly in an index.
Although conditions are certainly better than they were a couple of years ago, global financial markets continue to face high volatility while questions
about the strength and sustainability of the recovery abound. Through periods of uncertainty, as ever, BlackRock’s full resources are dedicated to the man-
agement of our clients’ assets. For additional market perspective and investment insight, visit www.blackrock.com/shareholdermagazine, where you’ll find
the most recent issue of our award-winning Shareholder® magazine, as well as its quarterly companion newsletter, Shareholder Perspectives. We thank
you for entrusting BlackRock with your investments, and we look forward to your continued partnership in the months and years ahead.

President, BlackRock Advisors, LLC
THIS PAGE NOT PART OF YOUR FUND REPORT
3
Fund Summary as of July 31, 2010
Portfolio Management Commentary
How did the Fund perform?
• For the six-month period ended July 31, 2010, the Fund outperformed
its benchmark, the S&P MidCap 400 Value Index.
What factors influenced performance?
• Stock selection in the consumer discretionary, energy and materials
sectors drove outperformance relative to benchmark for the period. In
consumer discretionary, the Fund benefited from a position in specialty
retailer Limited Brands, Inc., which gained ground as earnings exceeded
expectations. Stock selection among energy equipment & services com-
panies boosted relative returns in the energy sector, with notable contri-
butions from Dresser-Rand Group, Inc. and Smith International, Inc. Oil &
gas exploration & production company Whiting Petroleum Corp. also con-
tributed to outperformance. The materials sector rebounded sharply dur-
ing the period in response to global demand and encouraging import
figures from China. Key contributors to positive returns included iron ore
producer Cliffs Natural Resources, Inc. and chemicals manufacturers
Airgas, Inc. and FMC Corp.
• Conversely, stock selection in the health care sector detracted from per-
formance primarily among pharmaceuticals, health care providers and
services and health care equipment and supplies manufacturers. In
particular, individual detractors included King Pharmaceuticals, Inc.,
which lost ground when a US Food and Drug Administration panel
rejected its experimental painkiller, and Coventry Health Care, Inc.,
which fell on investor concerns about the potential impact of health
care reform legislation.
Describe recent portfolio activity.
• During the six-month period, we increased exposure to financials, prima-
rily in the insurance and commercial banking industries, by establishing
positions in Arthur J. Gallagher & Co., Protective Life Corp. and Marshall &
Ilsley Corp. among others. We also added to the Fund’s utilities exposure
by adding water company Aqua America, Inc. and gas company UGI Corp.
In consumer discretionary, we added to household durables and automo-
bile-related stocks. In materials, we reduced exposure to chemical pro-
ducers, which included the sale of Airgas, and trimmed positions in
metals & mining companies. In the information technology (IT) sector, we
trimmed exposure to all semiconductor-related holdings.
Describe Fund positioning at period end.
• At the end of the period, the Fund was positioned for a slow growth
environment with a bias toward historically cyclical sectors. Relative to its
benchmark, the S&P MidCap 400 Value Index, the Fund was overweight
in the IT, energy and consumer discretionary sectors, and underweight in
industrials, financials, materials and utilities.
The views expressed reflect the opinions of BlackRock as of the date of this report and are subject to change based on changes in market, economic or other conditions.
These views are not intended to be a forecast of future events and are no guarantee of future results.
| | | |
| Portfolio Information | | | |
| | Percent of | | Percent of |
| | Long-Term | | Long-Term |
| Ten Largest Holdings | Investments | Sector Allocation | Investments |
| Coventry Health Care, Inc. | 2% | Financials | 25% |
| Whiting Petroleum Corp. | 2 | Information Technology | 14 |
| Pharmaceutical Product Development, Inc. | 2 | Industrials | 13 |
| Health Net, Inc. | 2 | Consumer Discretionary | 12 |
| King Pharmaceuticals, Inc. | 1 | Utilities | 10 |
| Wisconsin Energy Corp. | 1 | Health Care | 8 |
| New York Community Bancorp, Inc. | 1 | Energy | 7 |
| Alliant Energy Corp. | 1 | Materials | 6 |
| Dresser-Rand Group, Inc. | 1 | Consumer Staples | 4 |
| Parker Hannifin Corp. | 1 | Telecommunication Services | 1 |
For Fund compliance purposes, the Fund's sector classifications refer to any one
or more of the sector sub-classifications used by one or more widely recognized
market indexes or ratings group indexes, and/or as defined by Fund management.
This definition may not apply for purposes of this report, which may combine
sector sub-classifications for reporting ease.
4 BLACKROCK MID CAP VALUE OPPORTUNITIES FUND
JULY 31, 2010
Total Return Based on a $10,000 Investment
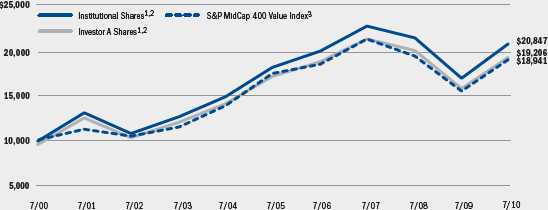
1 Assuming maximum sales charge, transaction costs and other operating expenses, including investment advisory fees, if any. Institutional
Shares do not have a sales charge.
2 The Fund normally invests at least 80% of its assets in equity securities of mid cap companies.
3 This unmanaged index measures the performance of the mid-capitalization value sector of the US equity market. It is a subset of the S&P
MidCap 400 Index and consists of those stocks in the S&P MidCap 400 Index exhibiting the strongest value characteristics, as determined by
the index provider, representing approximately 50% of the market capitalization of the S&P MidCap 400 Index.
| | | | | | | |
| Performance Summary for the Period Ended July 31, 2010 | | | | | | |
| | | | | Average Annual Total Returns4 | | |
| | | 1 Year | | 5 Years | | 10 Years |
| | 6-Month | w/o sales | w/sales | w/o sales | w/sales | w/o sales | w/sales |
| | Total Returns | charge | charge | charge | charge | charge | charge |
| Institutional | 8.64% | 22.50% | N/A | 2.73% | N/A | 7.62% | N/A |
| Investor A | 8.52 | 22.18 | 15.77% | 2.39 | 1.29% | 7.32 | 6.74% |
| Investor B | 8.00 | 21.04 | 16.54 | 1.58 | 1.33 | 6.64 | 6.64 |
| Investor C | 7.88 | 20.83 | 19.83 | 1.45 | 1.45 | 6.38 | 6.38 |
| Class R | 8.38 | 21.73 | N/A | 2.05 | N/A | 7.05 | N/A |
| S&P MidCap 400 Value Index | 7.49 | 22.68 | N/A | 1.72 | N/A | 6.60 | N/A |
4 Assuming maximum sales charges, if any. Average annual total returns with and without sales charges reflect reductions for distribution and service fees. See “About Fund
Performance” on page 6 for a detailed description of share classes, including any related sales charges and fees.
N/A — Not applicable as share class and index do not have a sales charge. Past performance is not indicative of future results.
| | | | | | | |
| Expense Example | | | | | | | |
| | | Actual | | | Hypothetical6 | | |
| | Beginning | Ending | | Beginning | Ending | | Annualized |
| | Account Value | Account Value | Expenses Paid | Account Value | Account Value | Expenses Paid | Expense |
| | February 1, 2010 | July 31, 2010 | During the Period5 | February 1, 2010 | July 31, 2010 | During the Period5 | Ratio |
| Institutional | $1,000 | $1,086.40 | $ 5.12 | $1,000 | $1,019.89 | $ 4.96 | 0.99% |
| Investor A | $1,000 | $1,085.20 | $ 6.72 | $1,000 | $1,018.35 | $ 6.51 | 1.30% |
| Investor B | $1,000 | $1,080.00 | $11.76 | $1,000 | $1,013.49 | $11.38 | 2.28% |
| Investor C | $1,000 | $1,078.80 | $11.96 | $1,000 | $1,013.30 | $11.58 | 2.32% |
| Class R | $1,000 | $1,083.80 | $ 8.47 | $1,000 | $1,016.67 | $ 8.20 | 1.64% |
5 For each class of the Fund, expenses are equal to the annualized expense ratio for the class, multiplied by the average account value over the period, multiplied by 181/365
(to reflect the one-half year period shown).
6 Hypothetical 5% annual return before expenses is calculated by pro rating the number of days in the most recent fiscal half-year divided by 365.
BLACKROCK MID CAP VALUE OPPORTUNITIES FUND
JULY 31, 2010
5
About Fund Performance
• Institutional Shares are not subject to any sales charge. Institutional
Shares bear no ongoing distribution or service fees and are available only
to eligible investors.
• Investor A Shares incur a maximum initial sales charge (front-end load)
of 5.25% and a service fee of 0.25% per year (but no distribution fee).
• Investor B Shares are subject to a maximum contingent deferred sales
charge of 4.50% declining to 0% after six years. In addition, Investor B
Shares are subject to a distribution fee of 0.75% per year and a service
fee of 0.25% per year. These shares automatically convert to Investor A
Shares after approximately eight years. (There is no initial sales charge
for automatic share conversions.) All returns for periods greater than
eight years reflect this conversion. Investor B Shares are only available
through exchanges, dividend reinvestment by existing shareholders or
for purchase by certain qualified employee benefit plans.
• Investor C Shares are subject to a 1.00% contingent deferred sales
charge if redeemed within one year of purchase. In addition, Investor C
Shares are subject to a distribution fee of 0.75% and a service fee of
0.25% per year.
• Class R Shares do not incur a maximum initial sales charge (front-end
load) or deferred sales charge. These shares are subject to a distribution
fee of 0.25% per year and a service fee of 0.25% per year. Class R
Shares are available only to certain retirement plans. Prior to February
4, 2003, Class R Share performance results are those of Institutional
Shares (which have no distribution or service fees) restated to reflect
Class R Share fees.
Performance information reflects past performance and does not guaran-
tee future results. Current performance may be lower or higher than the
performance data quoted. Refer to www.blackrock.com/funds to obtain
performance data current to the most recent month-end. Performance
results do not reflect the deduction of taxes that a shareholder would
pay on fund distributions or the redemption of fund shares. Figures shown
in the performance table on the previous page assume reinvestment of
all dividends and capital gain distributions, if any, at net asset value on
the ex-dividend date. Investment return and principal value of shares
will fluctuate so that shares, when redeemed, may be worth more or less
than their original cost. Dividends paid to each class of shares will vary
because of the different levels of service, distribution and transfer agency
fees applicable to each class, which are deducted from the income avail-
able to be paid to shareholders. The Fund’s investment advisor waived a
portion of its investment advisory fee. Without such waiver, the Fund’s
performance would have been lower.
Disclosure of Expenses
Shareholders of this Fund may incur the following charges: (a) expenses
related to transactions, including sales charges, redemption fees and
exchange fees; and (b) operating expenses including advisory fees,
service and distribution fees including 12b-1 fees and other Fund
expenses. The expense example on the previous page (which is based
on a hypothetical investment of $1,000 invested on February 1, 2010
and held through July 31, 2010) is intended to assist shareholders both
in calculating expenses based on an investment in the Fund and
in comparing these expenses with similar costs of investing in other
mutual funds.
The table provides information about actual account values and actual
expenses. In order to estimate the expenses a shareholder paid during the
period covered by this report, shareholders can divide their account value
by $1,000 and then multiply the result by the number corresponding
to their share class under the heading entitled “Expenses Paid During
the Period.”
The table also provides information about hypothetical account values
and hypothetical expenses based on the Fund’s actual expense ratio and
an assumed rate of return of 5% per year before expenses. In order to
assist shareholders in comparing the ongoing expenses of investing in this
Fund and other funds, compare the 5% hypothetical example with the 5%
hypothetical examples that appear in other funds’ shareholder reports.
The expenses shown in the table are intended to highlight shareholders’
ongoing costs only and do not reflect any transactional expenses, such as
sales charges, redemption fees or exchange fees. Therefore, the hypotheti-
cal example is useful in comparing ongoing expenses only, and will not
help shareholders determine the relative total expenses of owning differ-
ent funds. If these transactional expenses were included, shareholder
expenses would have been higher.
6 BLACKROCK MID CAP VALUE OPPORTUNITIES FUND
JULY 31, 2010
Schedule of Investments July 31, 2010 (Unaudited)
(Percentages shown are based on Net Assets)
| | |
| Common Stocks | Shares | Value |
| Aerospace & Defense — 1.4% | | |
| Alliant Techsystems, Inc. (a) | 30,700 | $ 2,061,812 |
| Curtiss-Wright Corp. | 70,500 | 2,135,445 |
| | | 4,197,257 |
| Airlines — 0.6% | | |
| Delta Air Lines, Inc. (a) | 143,900 | 1,709,532 |
| Auto Components — 0.4% | | |
| BorgWarner, Inc. (a) | 27,100 | 1,188,606 |
| Automobiles — 0.5% | | |
| Thor Industries, Inc. | 53,100 | 1,478,304 |
| Capital Markets — 0.3% | | |
| Jefferies Group, Inc., New Shares (b) | 31,000 | 765,390 |
| Chemicals — 1.9% | | |
| Cytec Industries, Inc. | 46,600 | 2,326,272 |
| FMC Corp. | 43,100 | 2,693,319 |
| Intrepid Potash, Inc. (a)(b) | 26,200 | 634,040 |
| | | 5,653,631 |
| Commercial Banks — 6.3% | | |
| Associated Banc-Corp. (b) | 157,900 | 2,145,861 |
| BancorpSouth, Inc. | 64,200 | 941,172 |
| Bank of Hawaii Corp. | 49,900 | 2,485,519 |
| City National Corp. | 19,600 | 1,110,732 |
| Cullen/Frost Bankers, Inc. | 41,700 | 2,302,257 |
| FirstMerit Corp. | 72,500 | 1,428,975 |
| Marshall & Ilsley Corp. | 171,377 | 1,204,780 |
| Popular, Inc. (a) | 149,366 | 428,681 |
| Regions Financial Corp. | 323,400 | 2,370,522 |
| TCF Financial Corp. | 141,000 | 2,233,440 |
| Valley National Bancorp | 150,175 | 2,179,039 |
| | | 18,830,978 |
| Communications Equipment — 1.6% | | |
| Brocade Communications Systems, Inc. (a) | 385,100 | 1,906,245 |
| JDS Uniphase Corp. (a) | 134,900 | 1,463,665 |
| Tellabs, Inc. | 213,900 | 1,493,022 |
| | | 4,862,932 |
| Construction & Engineering — 1.6% | | |
| Foster Wheeler AG (a) | 30,600 | 704,412 |
| Jacobs Engineering Group, Inc. (a) | 47,300 | 1,729,761 |
| URS Corp. (a) | 62,100 | 2,508,219 |
| | | 4,942,392 |
| Consumer Finance — 0.9% | | |
| Discover Financial Services, Inc. | 165,200 | 2,522,604 |
| Containers & Packaging — 2.1% | | |
| Bemis Co. | 50,100 | 1,500,996 |
| Owens-Illinois, Inc. (a) | 47,400 | 1,310,610 |
| Packaging Corp. of America | 31,700 | 760,800 |
| Sonoco Products Co. | 78,800 | 2,576,760 |
| | | 6,149,166 |
| Distributors — 0.8% | | |
| Genuine Parts Co. | 54,000 | 2,312,820 |
| Diversified Consumer Services — 0.4% | | |
| Regis Corp. | 73,000 | 1,111,790 |
| Diversified Telecommunication Services — 1.2% | | |
| Qwest Communications International, Inc. | 610,400 | 3,454,864 |
| | |
| Common Stocks | Shares | Value |
| Electric Utilities — 2.1% | | |
| DPL, Inc. | 70,800 | $ 1,791,948 |
| Hawaiian Electric Industries, Inc. (b) | 71,400 | 1,681,470 |
| Northeast Utilities, Inc. | 96,400 | 2,683,776 |
| | | 6,157,194 |
| Electrical Equipment — 0.6% | | |
| Ametek, Inc. | 44,000 | 1,947,880 |
| Electronic Equipment, Instruments | | |
| & Components — 3.2% | | |
| Arrow Electronics, Inc. (a) | 88,400 | 2,191,436 |
| Avnet, Inc. (a) | 115,100 | 2,894,765 |
| Ingram Micro, Inc., Class A (a) | 143,700 | 2,375,361 |
| Molex, Inc. (b) | 100,100 | 1,972,971 |
| | | 9,434,533 |
| Energy Equipment & Services — 2.5% | | |
| Dresser-Rand Group, Inc. (a) | 94,700 | 3,523,787 |
| Patterson-UTI Energy, Inc. | 116,700 | 1,917,381 |
| Superior Energy Services, Inc. (a) | 95,000 | 2,165,050 |
| | | 7,606,218 |
| Food Products — 0.9% | | |
| The J.M. Smucker Co. | 23,300 | 1,431,319 |
| Smithfield Foods, Inc. (a) | 92,200 | 1,313,850 |
| | | 2,745,169 |
| Gas Utilities — 2.2% | | |
| Nicor, Inc. | 35,700 | 1,563,303 |
| South Jersey Industries, Inc. | 48,100 | 2,247,232 |
| UGI Corp. | 106,300 | 2,865,848 |
| | | 6,676,383 |
| Health Care Equipment & Supplies — 1.0% | | |
| Alere, Inc. (a) | 54,500 | 1,533,085 |
| Beckman Coulter, Inc. | 23,400 | 1,072,422 |
| Kinetic Concepts, Inc. (a) | 9,400 | 333,794 |
| | | 2,939,301 |
| Health Care Providers & Services — 3.0% | | |
| Coventry Health Care, Inc. (a) | 238,800 | 4,735,404 |
| Health Net, Inc. (a) | 184,500 | 4,344,975 |
| | | 9,080,379 |
| Hotels, Restaurants & Leisure — 0.1% | | |
| Burger King Holdings, Inc. | 14,800 | 255,744 |
| Household Durables — 1.7% | | |
| Jarden Corp. | 64,900 | 1,878,855 |
| Lennar Corp., Class A | 103,100 | 1,522,787 |
| MDC Holdings, Inc. | 53,200 | 1,549,184 |
| | | 4,950,826 |
| Household Products — 2.3% | | |
| Church & Dwight Co., Inc. | 26,600 | 1,762,782 |
| Clorox Co. | 41,700 | 2,705,496 |
| Energizer Holdings, Inc. (a) | 41,800 | 2,571,536 |
| | | 7,039,814 |
| IT Services — 1.5% | | |
| Amdocs Ltd. (a) | 74,000 | 2,022,420 |
| Convergys Corp. (a) | 145,900 | 1,629,703 |
| CoreLogic, Inc. | 48,900 | 979,467 |
| | | 4,631,590 |
See Notes to Financial Statements.
BLACKROCK MID CAP VALUE OPPORTUNITIES FUND
JULY 31, 2010
7
Schedule of Investments (continued)
(Percentages shown are based on Net Assets)
| | |
| Common Stocks | Shares | Value |
| Insurance — 8.3% | | |
| American Financial Group, Inc. | 61,900 | $ 1,824,193 |
| Arch Capital Group Ltd. (a) | 29,000 | 2,269,540 |
| Arthur J. Gallagher & Co. | 99,800 | 2,536,916 |
| Brown & Brown, Inc. | 66,000 | 1,321,320 |
| Everest Re Group Ltd. | 14,700 | 1,141,014 |
| Fidelity National Title Group, Inc., Class A | 76,500 | 1,129,905 |
| First American Financial Corp. | 65,200 | 961,700 |
| HCC Insurance Holdings, Inc. | 60,400 | 1,577,648 |
| The Hanover Insurance Group, Inc. | 50,200 | 2,200,266 |
| Mercury General Corp. | 39,400 | 1,699,322 |
| PartnerRe Ltd. | 8,500 | 615,145 |
| ProAssurance Corp. (a) | 38,500 | 2,291,135 |
| Protective Life Corp. | 84,500 | 1,900,405 |
| Reinsurance Group of America, Inc. | 7,600 | 364,648 |
| W.R. Berkley Corp. | 106,800 | 2,884,668 |
| | | 24,717,825 |
| Internet Software & Services — 1.1% | | |
| IAC/InterActiveCorp. (a) | 135,500 | 3,387,500 |
| Leisure Equipment & Products — 1.0% | | |
| Mattel, Inc. | 138,600 | 2,932,776 |
| Life Sciences Tools & Services — 2.0% | | |
| Affymetrix, Inc. (a) | 323,600 | 1,582,404 |
| Pharmaceutical Product Development, Inc. | 181,400 | 4,400,764 |
| | | 5,983,168 |
| Machinery — 7.8% | | |
| AGCO Corp. (a) | 86,300 | 2,999,788 |
| Dover Corp. | 67,700 | 3,247,569 |
| Harsco Corp. | 55,100 | 1,276,116 |
| IDEX Corp. | 62,700 | 2,017,059 |
| Joy Global, Inc. | 31,800 | 1,887,966 |
| Kennametal, Inc. | 47,600 | 1,303,764 |
| Parker Hannifin Corp. | 55,800 | 3,466,296 |
| SPX Corp. | 40,200 | 2,394,312 |
| Terex Corp. (a) | 85,600 | 1,689,744 |
| Timken Co. | 91,000 | 3,059,420 |
| | | 23,342,034 |
| Media — 1.0% | | |
| Harte-Hanks, Inc. | 264,100 | 2,979,048 |
| Metals & Mining — 1.7% | | |
| Carpenter Technology Corp. | 53,500 | 1,869,825 |
| Cliffs Natural Resources, Inc. | 54,600 | 3,088,722 |
| | | 4,958,547 |
| Multi-Utilities — 4.6% | | |
| Alliant Energy Corp. | 102,122 | 3,529,336 |
| MDU Resources Group, Inc. | 65,500 | 1,293,625 |
| NSTAR (b) | 50,700 | 1,884,012 |
| OGE Energy Corp. | 41,500 | 1,645,060 |
| Vectren Corp. | 55,000 | 1,362,350 |
| Wisconsin Energy Corp. | 72,300 | 3,924,444 |
| | | 13,638,827 |
| Multiline Retail — 0.6% | | |
| JCPenney Co., Inc. | 71,900 | 1,770,897 |
| Oil, Gas & Consumable Fuels — 4.4% | | |
| Arch Coal, Inc. | 51,600 | 1,222,404 |
| Cabot Oil & Gas Corp., Class A | 36,500 | 1,112,155 |
| Frontier Oil Corp. | 62,300 | 765,667 |
| Oasis Petroleum, Inc. (a) | 115,900 | 1,993,480 |
| | |
| Common Stocks | Shares | Value |
| Oil, Gas & Consumable Fuels (concluded) | | |
| Petrohawk Energy Corp. (a) | 76,200 | $ 1,201,674 |
| SM Energy Co. | 57,400 | 2,377,508 |
| Whiting Petroleum Corp. (a) | 51,400 | 4,523,714 |
| | | 13,196,602 |
| Personal Products — 0.3% | | |
| Alberto-Culver Co. | 35,100 | 1,027,377 |
| Pharmaceuticals — 2.0% | | |
| Forest Laboratories, Inc. (a) | 72,400 | 2,009,100 |
| King Pharmaceuticals, Inc. (a) | 472,400 | 4,138,224 |
| | | 6,147,324 |
| Real Estate Investment Trusts (REITs) — 6.4% | | |
| AMB Property Corp. | 109,600 | 2,735,616 |
| American Campus Communities, Inc. | 57,000 | 1,650,150 |
| BioMed Realty Trust, Inc. | 103,900 | 1,874,356 |
| Camden Property Trust | 27,300 | 1,242,696 |
| CommonWealth REIT | 86,775 | 2,251,811 |
| Corporate Office Properties Trust | 35,300 | 1,323,750 |
| Essex Property Trust, Inc. | 17,600 | 1,849,936 |
| Federal Realty Investment Trust | 26,000 | 2,032,940 |
| Highwoods Properties, Inc. | 26,500 | 829,715 |
| The Macerich Co. (b) | 72,912 | 3,022,213 |
| Plum Creek Timber Co., Inc. | 8,500 | 304,980 |
| | | 19,118,163 |
| Real Estate Management & Development — 0.4% | | |
| Jones Lang LaSalle, Inc. | 15,900 | 1,231,614 |
| Semiconductors & Semiconductor Equipment — 2.2% | |
| Intersil Corp., Class A | 145,100 | 1,648,336 |
| KLA-Tencor Corp. | 62,300 | 1,973,041 |
| Microchip Technology, Inc. (b) | 53,500 | 1,629,075 |
| RF Micro Devices, Inc. (a) | 351,700 | 1,466,589 |
| | | 6,717,041 |
| Software — 3.5% | | |
| CA, Inc. | 124,100 | 2,427,396 |
| Electronic Arts, Inc. (a) | 128,900 | 2,053,377 |
| Novell, Inc. (a) | 234,900 | 1,418,796 |
| Synopsys, Inc. (a) | 86,600 | 1,891,344 |
| TIBCO Software, Inc. (a) | 198,700 | 2,694,372 |
| | | 10,485,285 |
| Specialty Retail — 3.8% | | |
| Foot Locker, Inc. | 196,057 | 2,664,414 |
| The Gap, Inc. | 84,900 | 1,537,539 |
| Limited Brands, Inc. | 104,800 | 2,687,072 |
| RadioShack Corp. | 70,300 | 1,514,262 |
| Urban Outfitters, Inc. (a) | 95,800 | 3,080,928 |
| | | 11,484,215 |
| Textiles, Apparel & Luxury Goods — 1.6% | | |
| Phillips-Van Heusen Corp. | 37,900 | 1,966,631 |
| VF Corp. | 35,600 | 2,824,148 |
| | | 4,790,779 |
| Thrifts & Mortgage Finance — 2.0% | | |
| First Niagara Financial Group, Inc. | 188,600 | 2,529,126 |
| New York Community Bancorp, Inc. (b) | 206,200 | 3,559,012 |
| | | 6,088,138 |
| Water Utilities — 1.0% | | |
| Aqua America, Inc. (b) | 151,800 | 2,958,582 |
| Total Long-Term Investments | | |
| (Cost – $244,290,758) – 96.8% | | 289,601,039 |
See Notes to Financial Statements.
8 BLACKROCK MID CAP VALUE OPPORTUNITIES FUND
JULY 31, 2010
Schedule of Investments (concluded) (Percentages shown are based on Net Assets)
| | |
| Short-Term Securities | Shares | Value |
| BlackRock Liquidity Funds, TempFund, | | |
| Institutional Class, 0.21% (c)(d) | 8,387,047 | $ 8,387,047 |
| | Beneficial | |
| | Interest | |
| | (000) | |
| BlackRock Liquidity Series, LLC Money Market Series, | | |
| 0.34% (c)(d)(e) | $15,403 | 15,402,550 |
| Total Short-Term Securities | | |
| (Cost – $23,789,597) — 8.0% | | 23,789,597 |
| Total Investments | | |
| (Cost – $268,080,355*) — 104.8% | | 313,390,636 |
| Liabilities in Excess of Other Assets — (4.8)% | | (14,216,618) |
| Net Assets – 100.0% | | $ 299,174,018 |
* The cost and unrealized appreciation (depreciation) of investments as of July 31,
2010, as computed for federal income tax purposes, were as follows:
| |
| Aggregate cost | $ 273,086,776 |
| Gross unrealized appreciation | $ 49,003,820 |
| Gross unrealized depreciation | (8,699,960) |
| Net unrealized appreciation | $ 40,303,860 |
(a) Non-income producing security.
(b) Security, or a portion of security, is on loan.
(c) Investments in companies considered to be an affiliate of the Fund during the period, for purposes of Section 2(a)(3) of the Investment Company Act of 1940,
as amended, were as follows:
| | | | | | | |
| | Shares/ | Shares/ | Shares/ | Shares/ | | | |
| | Beneficial | Beneficial | Beneficial | Beneficial | | | �� |
| | Interest at | Interest at | Interest at | Interest at | Value at | Realized | |
| Affiliate | January 31, 2010 | Purchased | Sold | July 31, 2010 | July 31, 2010 | Gain | Income |
| BlackRock Liquidity Funds, | | | | | | | |
| TempFund, Institutional Class | 9,914,420 | — | (1,527,373)1 | 8,387,047 | $ 8,387,047 | — | $ 4,473 |
| BlackRock Liquidity Series, | | | | | | | |
| LLC Money Market Series | $ 31,550,050 | — | $(16,147,500)1 | $ 15,402,550 | $ 15,402,550 | — | $ 11,124 |
| iShares Dow Jones US Real | | | | | | | |
| Estate Index Fund | 25,900 | — | (25,900) | — | — | $ 185,612 | — |
1 Represents net sale cost.
(d) Represents the current yield as of report date.
(e) Security was purchased with the cash collateral from loaned securities.
• For Fund compliance purposes, the Fund's industry classifications refer to any one
or more of the industry sub-classifications used by one or more widely recognized
market indexes or rating group indexes, and/or as defined by Fund management.
This definition may not apply for purposes of this report, which may combine such
industry sub-classifications for reporting ease.
• Fair Value Measurements — Various inputs are used in determining the fair value
of investments, which are as follows:
• Level 1 — price quotations in active markets/exchanges for identical assets
and liabilities
• Level 2 — other observable inputs (including, but not limited to: quoted prices
for similar assets or liabilities in markets that are active, quoted prices for iden-
tical or similar assets or liabilities in markets that are not active, inputs other
than quoted prices that are observable for the assets or liabilities (such as
interest rates, yield curves, volatilities, prepayment speeds, loss severities,
credit risks and default rates) or other market-corroborated inputs)
• Level 3 — unobservable inputs based on the best information available in the
circumstances, to the extent observable inputs are not available (including the
Fund's own assumptions used in determining the fair value of investments)
The inputs or methodologies used for valuing securities are not necessarily
an indication of the risk associated with investing in those securities. For infor-
mation about the Fund's policy regarding valuation of investments and other
significant accounting policies, please refer to Note 1 of the Notes to
Financial Statements.
The following table summarizes the inputs used as of July 31, 2010 in
determining the fair valuation of the Fund's investments:
| | | | |
| Valuation Inputs | Level 1 | Level 2 | Level 3 | Total |
| Assets: | | | | |
| Investments in | | | | |
| Securities: | | | | |
| Long-Term | | | | |
| Investments1 | $289,601,039 | — | — | $289,601,039 |
| Short-Term | | | | |
| Securities | 8,387,047 $ | 15,402,550 | — | 23,789,597 |
| Total | $297,988,086 $ | 15,402,550 | — | $313,390,636 |
1 See above Schedule of Investments for values in each industry.
See Notes to Financial Statements.
BLACKROCK MID CAP VALUE OPPORTUNITIES FUND
JULY 31, 2010
9
| |
| Statement of Assets and Liabilities | |
| July 31, 2010 (Unaudited) | |
| Assets | |
| Investments at value — unaffiliated (including securities loaned of $14,939,903) (cost — $244,290,758) | $ 289,601,039 |
| Investments at value — affiliated (cost — $23,789,597) | 23,789,597 |
| Investments sold receivable | 3,464,745 |
| Capital shares sold receivable | 401,704 |
| Dividends receivable | 191,016 |
| Securities lending income receivable — affiliated | 2,787 |
| Prepaid expenses | 18,594 |
| Total assets | 317,469,482 |
| Liabilities | |
| Collateral on securities loaned at value | 15,402,550 |
| Capital shares redeemed payable | 1,649,410 |
| Investments purchased payable | 714,240 |
| Investment advisory fees payable | 154,750 |
| Service and distribution fees payable | 104,515 |
| Other affiliates payable | 1,940 |
| Officer's and Directors' fees payable | 156 |
| Other accrued expenses payable | 267,903 |
| Total liabilities | 18,295,464 |
| Net Assets | $ 299,174,018 |
| Net Assets Consist of | |
| Paid-in capital | $ 357,392,743 |
| Undistributed net investment income | 411,423 |
| Accumulated net realized loss | (103,940,429) |
| Net unrealized appreciation/depreciation | 45,310,281 |
| Net Assets | $ 299,174,018 |
| Net Asset Value | |
| Institutional — Based on net assets of $58,334,022 and 4,104,458 shares outstanding, 20 million shares authorized, $0.10 par value | $ 14.21 |
| Investor A — Based on net assets of $114,287,233 and 8,236,703 shares outstanding, 40 million shares authorized, $0.10 par value | $ 13.88 |
| Investor B — Based on net assets of $8,435,001 and 657,546 shares outstanding, 40 million shares authorized, $0.10 par value | $ 12.83 |
| Investor C — Based on net assets of $58,409,176 and 4,639,051 shares outstanding, 40 million shares authorized, $0.10 par value | $ 12.59 |
| Class R — Based on net assets of $59,708,586 and 4,616,046 shares outstanding, 40 million shares authorized, $0.10 par value | $ 12.94 |
See Notes to Financial Statements.
10 BLACKROCK MID CAP VALUE OPPORTUNITIES FUND
JULY 31, 2010
| |
| Statement of Operations | |
| Six Months Ended July 31, 2010 (Unaudited) | |
| Investment Income | |
| Dividends — unaffiliated | $ 2,736,570 |
| Securities lending — affiliated | 11,124 |
| Dividends — affiliated | 4,473 |
| Total income | 2,752,167 |
| Expenses | |
| Investment advisory | 995,640 |
| Service — Investor A | 142,831 |
| Service and distribution — Investor B | 52,738 |
| Service and distribution — Investor C | 303,512 |
| Service and distribution — Class R | 143,566 |
| Transfer agent — Institutional | 59,360 |
| Transfer agent — Investor A | 141,631 |
| Transfer agent — Investor B | 25,145 |
| Transfer agent — Investor C | 155,822 |
| Transfer agent — Class R | 97,515 |
| Accounting services | 67,010 |
| Professional | 49,712 |
| Printing | 38,362 |
| Registration | 34,099 |
| Custodian | 19,829 |
| Officer and Directors | 12,223 |
| Miscellaneous | 16,610 |
| Total expenses | 2,355,605 |
| Less fees waived by advisor | (2,387) |
| Total expenses after fees waived | 2,353,218 |
| Net investment income | 398,949 |
| Realized and Unrealized Gain | |
| Net realized gain from: | |
| Investments — unaffiliated | 8,675,674 |
| Investments — affiliated | 185,612 |
| | 8,861,286 |
| Net change in unrealized appreciation/depreciation on investments | 13,668,287 |
| Total realized and unrealized gain | 22,529,573 |
| Net Increase in Net Assets Resulting from Operations | $ 22,928,522 |
See Notes to Financial Statements.
BLACKROCK MID CAP VALUE OPPORTUNITIES FUND
JULY 31, 2010
11
| | |
| Statements of Changes in Net Assets | | |
| | Six Months | |
| | Ended | Year Ended |
| | July 31, 2010 | January 31, |
| Increase (Decrease) in Net Assets: | (Unaudited) | 2010 |
| Operations | | |
| Net investment income (loss) | $ 398,949 | $ (275,812) |
| Net realized gain (loss) | 8,861,286 | (10,040,996) |
| Net change in unrealized appreciation/depreciation | 13,668,287 | 92,957,110 |
| Net increase in net assets resulting from operations | 22,928,522 | 82,640,302 |
| Dividends to Shareholders From | | |
| Net investment income: | | |
| Institutional | — | (435,001) |
| Investor A | — | (276,392) |
| Class R | — | (4,030) |
| Decrease in net assets resulting from dividends to shareholders | — | (715,423) |
| Capital Share Transactions | | |
| Net decrease in net assets derived from capital share transactions | (5,619,527) | (12,302,022) |
| Net Assets | | |
| Total increase in net assets | 17,308,995 | 69,622,857 |
| Beginning of period | 281,865,023 | 212,242,166 |
| End of period | $ 299,174,018 | $ 281,865,023 |
| Undistributed net investment income | $ 411,423 | $ 12,474 |
See Notes to Financial Statements.
12 BLACKROCK MID CAP VALUE OPPORTUNITIES FUND
JULY 31, 2010
| | | | | | | |
| Financial Highlights | | | | | | | |
| | | | Institutional | | | |
| | Six Months | | | | | | |
| | Ended | | | | | | |
| | July 31, 2010 | | Year Ended January 31, | | |
| | (Unaudited) | 2010 | 2009 | 2008 | | 2007 | 2006 |
| Per Share Operating Performance | | | | | | | |
| Net asset value, beginning of period | $ 13.08 | $ 9.37 | $ 14.80 | $ 18.79 | $ 19.89 | $ 19.58 |
| Net investment income1 | 0.06 | 0.06 | 0.11 | 0.05 | | 0.05 | 0.07 |
| Net realized and unrealized gain (loss) | 1.07 | 3.73 | (5.42) | (0.81) | | 1.79 | 4.34 |
| Net increase (decrease) from investment operations | 1.13 | 3.79 | (5.31) | (0.76) | | 1.84 | 4.41 |
| Dividends and distributions from: | | | | | | | |
| Net investment income | — | (0.08) | — | — | | — | — |
| Net realized gain | — | — | (0.12) | (3.23) | | (2.94) | (4.10) |
| Total dividends and distributions | — | (0.08) | (0.12) | (3.23) | | (2.94) | (4.10) |
| Net asset value, end of period | $ 14.21 | $ 13.08 | $ 9.37 | $ 14.80 | $ 18.79 | $ 19.89 |
| Total Investment Return2 | | | | | | | |
| Based on net asset value | 8.64%3 | 40.63%4 | (36.16)% | (5.36)% | | 10.09% | 23.90% |
| Ratios to Average Net Assets | | | | | | | |
| Total expenses | 0.99%5 | 1.04% | 0.98% | 0.93% | | 1.01% | 1.01% |
| Total expenses after fees waived | 0.99%5 | 1.04% | 0.98% | 0.93% | | 1.01% | 1.01% |
| Net investment income | 0.81%5 | 0.53% | 0.84% | 0.29% | | 0.28% | 0.34% |
| Supplemental Data | | | | | | | |
| Net assets, end of period (000) | $ 58,334 | $ 60,549 | $ 46,590 | $ 78,988 | $ 105,207 | $ 114,921 |
| Portfolio turnover | 25% | 106% | 154% | 148% | | 99% | 110% |
1 Based on average shares outstanding.
2 Where applicable, total investment returns exclude the effects of sales charges and include the reinvestment of dividends and distributions.
3 Aggregate total investment return.
4 Includes proceeds received from a settlement of litigation, which impacted the Fund’s total investment return. Not including these proceeds, the total investment return would
have been 40.20%.
5 Annualized.
See Notes to Financial Statements.
BLACKROCK MID CAP VALUE OPPORTUNITIES FUND
JULY 31, 2010
13
| | | | | | | |
| Financial Highlights (continued) | | | | | | | |
| | | | Investor A | | | |
| | Six Months | | | | | | |
| | Ended | | | | | | |
| | July 31, 2010 | | Year Ended January 31, | | |
| | (Unaudited) | 2010 | 2009 | 2008 | | 2007 | 2006 |
| Per Share Operating Performance | | | | | | | |
| Net asset value, beginning of period | $ 12.79 | $ 9.16 | $ 14.52 | $ 18.49 | $ 19.63 | $ 19.33 |
| Net investment income (loss)1 | 0.03 | 0.02 | 0.06 | (0.00)2 | | 0.003 | 0.03 |
| Net realized and unrealized gain (loss) | 1.06 | 3.65 | (5.30) | (0.79) | | 1.76 | 4.28 |
| Net increase (decrease) from investment operations | 1.09 | 3.67 | (5.24) | (0.79) | | 1.76 | 4.31 |
| Dividends and distributions from: | | | | | | | |
| Net investment income | — | (0.04) | — | — | | — | — |
| Net realized gain | — | — | (0.12) | (3.18) | | (2.90) | (4.01) |
| Total dividends and distributions | — | (0.04) | (0.12) | (3.18) | | (2.90) | (4.01) |
| Net asset value, end of period | $ 13.88 | $ 12.79 | $ 9.16 | $ 14.52 | $ 18.49 | $ 19.63 |
| Total Investment Return4 | | | | | | | |
| Based on net asset value | 8.52%5 | 40.10%6 | (36.39)% | (5.64)% | | 9.76% | 23.66% |
| Ratios to Average Net Assets | | | | | | | |
| Total expenses | 1.30%7 | 1.42% | 1.36% | 1.24% | | 1.26% | 1.26% |
| Total expenses after fees waived | 1.30%7 | 1.42% | 1.36% | 1.24% | | 1.26% | 1.26% |
| Net investment income (loss) | 0.49%7 | 0.17% | 0.46% | (0.02)% | | 0.00%8 | 0.13% |
| Supplemental Data | | | | | | | |
| Net assets, end of period (000) | $ 114,287 | $ 101,184 | $ 64,948 | $ 110,362 | $ 121,065 | $ 98,343 |
| Portfolio turnover | 25% | 106% | 154% | 148% | | 99% | 110% |
1 Based on average shares outstanding.
2 Amount is less than $(0.01) per share.
3 Amount is less than $0.01 per share.
4 Where applicable, total investment returns exclude the effects of any sales charges and include the reinvestment of dividends and distributions.
5 Aggregate total investment return.
6 Includes proceeds received from a settlement of litigation, which impacted the Fund’s total investment return. Not including these proceeds, the total investment return would
have been 39.66%.
7 Annualized.
8 Amount is less than 0.01%.
See Notes to Financial Statements.
14 BLACKROCK MID CAP VALUE OPPORTUNITIES FUND
JULY 31, 2010
| | | | | | | |
| Financial Highlights (continued) | | | | | | | |
| | | | Investor B | | | |
| | Six Months | | | | | | |
| | Ended | | | | | | |
| | July 31, 2010 | | Year Ended January 31, | | |
| | (Unaudited) | 2010 | 2009 | 2008 | | 2007 | 2006 |
| Per Share Operating Performance | | | | | | | |
| Net asset value, beginning of period | $ 11.88 | $ 8.55 | $ 13.66 | $ 17.54 | $ 18.73 | $ 18.43 |
| Net investment loss1 | (0.03) | (0.08) | (0.04) | (0.14) | | (0.14) | (0.13) |
| Net realized and unrealized gain (loss) | 0.98 | 3.41 | (4.96) | (0.74) | | 1.67 | 4.09 |
| Net increase (decrease) from investment operations | 0.95 | 3.33 | (5.00) | (0.88) | | 1.53 | 3.96 |
| Distributions from net realized gain | — | — | (0.11) | (3.00) | | (2.72) | (3.66) |
| Net asset value, end of period | $ 12.83 | $ 11.88 | $ 8.55 | $ 13.66 | $ 17.54 | $ 18.73 |
| Total Investment Return2 | | | | | | | |
| Based on net asset value | 8.00%3 | 38.95%4 | (36.91)% | (6.38)% | | 8.94% | 22.69% |
| Ratios to Average Net Assets | | | | | | | |
| Total expenses | 2.28%5 | 2.26% | 2.12% | 2.04% | | 2.03% | 2.04% |
| Total expenses after fees waived | 2.28%5 | 2.26% | 2.12% | 2.04% | | 2.03% | 2.04% |
| Net investment loss | (0.43)%5 | (0.77)% | (0.34)% | (0.83)% | | (0.75)% | (0.67)% |
| Supplemental Data | | | | | | | |
| Net assets, end of period (000) | $ 8,435 | $ 12,708 | $ 20,131 | $ 46,499 | $ 78,174 | $ 112,073 |
| Portfolio turnover | 25% | 106% | 154% | 148% | | 99% | 110% |
1 Based on average shares outstanding.
2 Where applicable, total investment returns exclude the effects of any sales charges and include the reinvestment of dividends and distributions.
3 Aggregate total investment return.
4 Includes proceeds received from a settlement of litigation, which impacted the Fund’s total investment return. Not including these proceeds, the total investment return would
have been 38.60%.
5 Annualized.
See Notes to Financial Statements.
BLACKROCK MID CAP VALUE OPPORTUNITIES FUND
JULY 31, 2010
15
| | | | | | | |
| Financial Highlights (continued) | | | | | | | |
| | | | Investor C | | | |
| | Six Months | | | | | | |
| | Ended | | | | | | |
| | July 31, 2010 | | Year Ended January 31, | | |
| | (Unaudited) | 2010 | 2009 | 2008 | | 2007 | 2006 |
| Per Share Operating Performance | | | | | | | |
| Net asset value, beginning of period | $ 11.67 | $ 8.41 | $ 13.47 | $ 17.36 | $ 18.61 | $ 18.39 |
| Net investment loss1 | (0.03) | (0.09) | (0.06) | (0.16) | | (0.14) | (0.13) |
| Net realized and unrealized gain (loss) | 0.95 | 3.35 | (4.90) | (0.72) | | 1.65 | 4.07 |
| Net increase (decrease) from investment operations | 0.92 | 3.26 | (4.96) | (0.88) | | 1.51 | 3.94 |
| Distributions from net realized gain | — | — | (0.10) | (3.01) | | (2.76) | (3.72) |
| Net asset value, end of period | $ 12.59 | $ 11.67 | $ 8.41 | $ 13.47 | $ 17.36 | $ 18.61 |
| Total Investment Return2 | | | | | | | |
| Based on net asset value | 7.88%3 | 38.76%4 | (37.06)% | (6.50)% | | 8.90% | 22.65% |
| Ratios to Average Net Assets | | | | | | | |
| Total expenses | 2.32%5 | 2.48% | 2.35% | 2.15% | | 2.04% | 2.05% |
| Total expenses after fees waived | 2.32%5 | 2.47% | 2.35% | 2.15% | | 2.04% | 2.05% |
| Net investment loss | (0.52)%5 | (0.92)% | (0.54)% | (0.93)% | | (0.78)% | (0.67)% |
| Supplemental Data | | | | | | | |
| Net assets, end of period (000) | $ 58,409 | $ 57,113 | $ 47,034 | $ 85,547 | $ 111,084 | $ 103,468 |
| Portfolio turnover | 25% | 106% | 154% | 148% | | 99% | 110% |
1 Based on average shares outstanding.
2 Where applicable, total investment returns exclude the effects of any sales charges and include the reinvestment of dividends and distributions.
3 Aggregate total investment return.
4 Includes proceeds received from a settlement of litigation, which impacted the Fund’s total investment return. Not including these proceeds, the total investment return would
have been 38.29%.
5 Annualized.
See Notes to Financial Statements.
16 BLACKROCK MID CAP VALUE OPPORTUNITIES FUND
JULY 31, 2010
| | | | | | | |
| Financial Highlights (concluded) | | | | | | | |
| | | | | Class R | | | |
| | Six Months | | | | | | |
| | Ended | | | | | | |
| | July 31, 2010 | | Year Ended January 31, | | |
| | (Unaudited) | 2010 | 2009 | 2008 | | 2007 | 2006 |
| Per Share Operating Performance | | | | | | | |
| Net asset value, beginning of period | $ 11.94 | $ 8.56 | $ 13.63 | $ 17.58 | $ 18.81 | $ 18.71 |
| Net investment income (loss)1 | 0.01 | (0.02) | 0.01 | (0.07) | | (0.05) | (0.02) |
| Net realized and unrealized gain (loss) | 0.99 | 3.40 | (4.97) | (0.74) | | 1.69 | 4.11 |
| Net increase (decrease) from investment operations | 1.00 | 3.38 | (4.96) | (0.81) | | 1.64 | 4.09 |
| Dividends and distributions from: | | | | | | | |
| Net investment income | — | (0.00)2 | — | — | | — | — |
| Net realized gain | — | — | (0.11) | (3.14) | | (2.87) | (3.99) |
| Total dividends and distributions | — | (0.00) | (0.11) | (3.14) | | (2.87) | (3.99) |
| Net asset value, end of period | $ 12.94 | $ 11.94 | $ 8.56 | $ 13.63 | $ 17.58 | $ 18.81 |
| Total Investment Return3 | | | | | | | |
| Based on net asset value | 8.38%4 | 39.50%5 | (36.66)% | (6.02)% | | 9.55% | 23.26% |
| Ratios to Average Net Assets | | | | | | | |
| Total expenses | 1.64%6 | 1.81% | 1.78% | 1.64% | | 1.51% | 1.51% |
| Total expenses after fees waived | 1.64%6 | 1.80% | 1.78% | 1.64% | | 1.51% | 1.51% |
| Net investment income (loss) | 0.14%6 | (0.22)% | 0.07% | (0.39)% | | (0.28)% | (0.11)% |
| Supplemental Data | | | | | | | |
| Net assets, end of period (000) | $ 59,709 | $ 50,310 | $ 33,540 | $ 49,550 | $ 32,476 | $ 17,981 |
| Portfolio turnover | 25% | 106% | 154% | 148% | | 99% | 110% |
1 Based on average shares outstanding.
2 Amount is less than $(0.01) per share.
3 Where applicable, total investment returns include the reinvestment of dividends and distributions.
4 Aggregate total investment return.
5 Includes proceeds received from a settlement of litigation, which impacted the Fund’s total investment return. Not including these proceeds, the total investment return would
have been 39.15%.
6 Annualized.
See Notes to Financial Statements.
BLACKROCK MID CAP VALUE OPPORTUNITIES FUND
JULY 31, 2010
17
Notes to Financial Statements (Unaudited)
1. Organization and Significant Accounting Policies:
BlackRock Mid Cap Value Opportunities Fund (the “Fund”) of BlackRock
Mid Cap Value Opportunities Series, Inc. (the “Series”) is registered
under the Investment Company Act of 1940, as amended (the “1940
Act”), as a diversified, open-end management investment company.
The Fund is organized as a Maryland corporation. The Fund's financial
statements are prepared in conformity with accounting principles gener-
ally accepted in the United States of America ("US GAAP"), which may
require management to make estimates and assumptions that affect
the reported amounts and disclosures in the financial statements.
Actual results could differ from those estimates. The Fund offers multiple
classes of shares. Institutional Shares are sold without a sales charge
and only to certain eligible investors. Investor A Shares are generally sold
with a front-end sales charge. Investor B and Investor C Shares may be
subject to a contingent deferred sales charge. Class R Shares are sold
without a sales charge and only to certain retirement and other similar
plans. All classes of shares have identical voting, dividend, liquidation
and other rights and the same terms and conditions, except that Investor
A, Investor B, Investor C and Class R Shares bear certain expenses
related to the shareholder servicing of such shares, and Investor B,
Investor C and Class R Shares also bear certain expenses related to
the distribution of such shares. Investor B Shares automatically convert
to Investor A Shares after approximately eight years. Investor B Shares
are only available through exchanges, dividend reinvestment by existing
shareholders or for purchase by certain qualified employee benefit
plans. Each class has exclusive voting rights with respect to matters
relating to its shareholder servicing and distribution expenditures
(except that Investor B shareholders may vote on material changes to
the Investor A distribution plan).
The following is a summary of significant accounting policies followed by
the Fund:
Valuation: The Fund fair values its financial instruments at market value
using independent dealers or pricing services under policies approved
by the Board of Directors (the "Board"). Equity investments traded on a
recognized securities exchange or the NASDAQ Global Market System
are valued at the last reported sale price that day or the NASDAQ official
closing price, if applicable. For equity investments traded on more than
one exchange, the last reported sale price on the exchange where the
stock is primarily traded is used. Equity investments traded on a recog-
nized exchange for which there were no sales on that day are valued at
the last available bid price. If no bid price is available, the prior day’s
price will be used, unless it is determined that such prior day’s price no
longer reflects the fair value of the security. Investments in open-end
investment companies are valued at net asset value each business day.
Short-term securities with remaining maturities of 60 days or less may
be valued at amortized cost, which approximates fair value.
The Fund values its investments in BlackRock Liquidity Series, LLC
Money Market Series (the “Money Market Series”) at fair value, which
is ordinarily based upon its pro rata ownership in the net assets of the
underlying fund. The Money Market Series seeks current income consis-
tent with maintaining liquidity and preserving capital. Although the
Money Market Series is not registered under the 1940 Act, its invest-
ments will follow the parameters of investments by a money market
fund that is subject to Rule 2a-7 promulgated by the Securities and
Exchange Commission (“SEC”) under the 1940 Act. The Fund may with-
draw up to 25% of its investment daily, although the manager of the
Money Market Series, in its sole discretion, may permit an investor to
withdraw more than 25% on any one day.
In the event that application of these methods of valuation results in a
price for an investment which is deemed not to be representative of the
market value of such investment or is not available, the investment will
be valued in accordance with a policy approved by the Board as reflect-
ing fair value (“Fair Value Assets”). When determining the price for Fair
Value Assets, the investment advisor and/or the sub-advisor seeks to
determine the price that the Fund might reasonably expect to receive
from the current sale of that asset in an arm’s-length transaction. Fair
value determinations shall be based upon all available factors that the
investment advisor and/or sub-advisor deems relevant. The pricing of
all Fair Value Assets is subsequently reported to the Board or a
committee thereof.
Investment Transactions and Investment Income: For financial reporting
purposes, investment transactions are recorded on the dates the trans-
actions are entered into (the trade dates). Realized gains and losses on
investment transactions are determined on the identified cost basis.
Dividend income is recorded on the ex-dividend dates. Upon notification
from issuers, some of the dividend income received from a real estate
investment trust may be redesignated as a reduction of cost of the
related investment and/or realized gain. Interest income is recognized
on the accrual basis. Income and realized and unrealized gains and
losses are allocated daily to each class based on its relative net assets.
Dividends and Distributions: Dividends and distributions paid by the
Fund are recorded on the ex-dividend dates. The amount and timing of
dividends and distributions are determined in accordance with federal
income tax regulations, which may differ from US GAAP.
Securities Lending: The Fund may lend securities to financial institutions
that provide cash as collateral, which will be maintained at all times in
an amount equal to at least 100% of the current market value of the
loaned securities. The market value of the loaned securities is deter-
mined at the close of business of the Fund and any additional required
collateral is delivered to the Fund on the next business day. Securities
lending income, as disclosed in the Statement of Operations, represents
18 BLACKROCK MID CAP VALUE OPPORTUNITIES FUND
JULY 31, 2010
Notes to Financial Statements (continued)
the income earned from the investment of the cash collateral, net of
rebates paid to, or fees paid by, borrowers and less the fees paid to the
securities lending agent. Loans of securities are terminable at any time
and the borrower, after notice, is required to return borrowed securities
within the standard time period for settlement of securities transactions.
In the event that the borrower defaults on its obligation to return bor-
rowed securities because of insolvency or for any other reason, the
Fund could experience delays and costs in gaining access to the collat-
eral. The Fund also could suffer a loss if the value of an investment
purchased with cash collateral falls below the market value of loaned
securities or if the value of an investment purchased with cash collateral
falls below the value of the original cash collateral received.
Income Taxes: It is the Fund's policy to comply with the requirements of
the Internal Revenue Code of 1986, as amended, applicable to regu-
lated investment companies and to distribute substantially all of its tax-
able income to its shareholders. Therefore, no federal income tax
provision is required.
The Fund files US federal and various state and local tax returns. No
income tax returns are currently under examination. The statute of limita-
tions on the Fund's US federal tax returns remains open for each of the
four years ended January 31, 2010. The statutes of limitations on the
Fund's state and local tax returns may remain open for an additional
year depending upon the jurisdiction. There are no uncertain tax posi-
tions that require recognition of a tax liability.
Other: Expenses directly related to the Fund or its classes are charged to
the Fund or class. Other operating expenses shared by several funds are
pro rated among those funds on the basis of relative net assets or other
appropriate methods. Other expenses of the Fund are allocated daily to
each class based on its relative net assets. The Fund has an arrange-
ment with the custodian whereby fees may be reduced by credits earned
on uninvested cash balances, which if applicable are shown as fees paid
indirectly in the Statement of Operations. The custodian imposes fees on
overdrawn cash balances, which can be offset by accumulated credits
earned or may result in additional custody charges.
2. Investment Advisory Agreement and Other Transactions
with Affiliates:
The PNC Financial Services Group, Inc. ("PNC"), Bank of America
Corporation ("BAC") and Barclays Bank PLC ("Barclays") are the largest
stockholders of BlackRock, Inc. ("BlackRock"). Due to the ownership
structure, PNC is an affiliate of the Fund for 1940 Act purposes, but BAC
and Barclays are not.
The Series, on behalf of the Fund, entered into an Investment Advisory
Agreement with BlackRock Advisors, LLC (the “Manager”), the Fund's
investment advisor, an indirect, wholly owned subsidiary of BlackRock,
to provide investment advisory and administration services. The Manager
is responsible for the management of the Fund's portfolio and provides
the necessary personnel, facilities, equipment and certain other services
necessary to the operations of the Fund. For such services, the Fund
pays the Manager a monthly fee at an annual rate 0.65% of the Fund's
average daily net assets.
The Manager voluntarily agreed to waive its investment advisory fees by
the amount of investment advisory fees the Fund pays to the Manager
indirectly through its investment in affiliated money market funds; how-
ever, the Manager does not waive its investment advisory fees by the
amount of investment advisory fees paid through the Fund’s investment
in other affiliated investment companies, if any. This amount is shown
as fees waived by advisor in the Statement of Operations.
The Manager entered into a sub-advisory agreement with BlackRock
Investment Management, LLC (“BIM”), an affiliate of the Manager.
The Manager pays BIM for services it provides, a monthly fee that is
a percentage of the investment advisory fees paid by the Fund to
the Manager.
For the six months ended July 31, 2010, the Fund reimbursed the
Manager $2,941 for certain accounting services, which is included in
accounting services in the Statement of Operations.
The Series, on behalf of the Fund, entered into a Distribution Agreement
and Distribution Plan with BlackRock Investments, LLC (”BRIL“), an affili-
ate of BlackRock. Pursuant to the Distribution Plan and in accordance
with Rule 12b-1 under the 1940 Act, the Fund pays BRIL ongoing serv-
ice and distribution fees. The fees are accrued daily and paid monthly at
annual rates based upon the average daily net assets of the shares of
the Fund as follows:
| | |
| | Service | Distribution |
| | Fee | Fee |
| Investor A | 0.25% | — |
| Investor B | 0.25% | 0.75% |
| Investor C | 0.25% | 0.75% |
| Class R | 0.25% | 0.25% |
Pursuant to sub-agreements with BRIL, broker-dealers and BRIL provide
shareholder servicing and distribution services to the Fund. The ongoing
service and/or distribution fee compensates BRIL and each broker-
dealer for providing shareholder servicing and/or distribution related
services to Investor A, Investor B, Investor C and Class R shareholders.
For the six months ended July 31, 2010, affiliates earned underwriting
discounts, direct commissions and dealer concessions on sales of the
Fund's Investor A Shares, which totaled $3,371.
BLACKROCK MID CAP VALUE OPPORTUNITIES FUND
JULY 31, 2010
19
Notes to Financial Statements (continued)
For the six months ended July 31, 2010, affiliates received the following
contingent deferred sales charges relating to transactions in Investor B
and Investor C Shares.
| |
| Investor B | $ 3,392 |
| Investor C | $ 586 |
Furthermore, affiliates received contingent deferred sales charges of $3
relating to transactions subject to front-end sales charge waivers on
Investor A Shares.
PNC Global Investment Servicing (U.S.) Inc. ("PNCGIS"), an indirect,
wholly owned subsidiary of PNC and an affiliate of the Manager, serves
as transfer agent and dividend disbursing agent. Effective July 1, 2010,
PNCGIS was sold to The Bank of New York Mellon Corporation and is no
longer considered an affiliate of the Manager. At the close of the sale,
PNCGIS changed its name to BNY Mellon Investment Servicing (US) Inc.
Transfer agency fees borne by the Fund are comprised of those fees
charged for all shareholder communications including mailing of share-
holder reports, dividend and distribution notices, and proxy materials for
shareholder meetings, as well as per account and per transaction fees
related to servicing and maintenance of shareholder accounts, including
the issuing, redeeming and transferring of shares, check writing, anti-
money laundering services, and customer identification services.
Pursuant to written agreements, certain affiliates provide the Fund
with sub-accounting, recordkeeping, sub-transfer agency and other
administrative services with respect to sub-accounts they service. For
these services, these affiliates receive an annual fee per shareholder
account which will vary depending on share class. For the six months
ended July 31, 2010, the Fund paid $804 in return for these services
which is included in transfer agent — class specific in the Statement
of Operations.
The Manager maintains a call center, which is responsible for providing
certain shareholder services to the Fund, such as responding to share-
holder inquiries and processing transactions based upon instructions
from shareholders with respect to the subscription and redemption of
Fund shares. For the six months ended July 31, 2010, the Fund reim-
bursed the Manager the following amounts for costs incurred in running
the call center, which are included in transfer agent — class specific in
the Statement of Operations.
| |
| Institutional | $ 242 |
| Investor A | $ 1,435 |
| Investor B | $ 234 |
| Investor C | $ 781 |
| Class R | $ 345 |
The Fund received an exemptive order from the SEC permitting, among
other things, to pay an affiliated securities lending agent a fee based on
a share of the income derived from the securities lending activities and
has retained BIM as the securities lending agent. BIM may, on behalf of
the Fund, invest cash collateral received by the Fund for such loans,
among other things, in a private investment company managed by the
Manager or in registered money market funds advised by the Manager or
its affiliates. The market value of securities on loan and the value of the
related collateral are shown in the Statement of Assets and Liabilities as
securities loaned and collateral on securities loaned at value, respec-
tively. The cash collateral invested by BIM is disclosed in the Schedule of
Investments. The share of income earned by the Fund on such invest-
ments is shown as securities lending — affiliated in the Statement of
Operations. For the six months ended July 31, 2010, BIM received
$2,692 in securities lending agent fees related to securities lending
activities for the Fund.
Certain officers and/or directors of the Fund are officers and/or directors
of BlackRock or its affiliates. The Fund reimburses the Manager for com-
pensation paid to the Fund's Chief Compliance Officer.
3. Investments:
Purchases and sales of investments, excluding short-term securities
for the six months ended July 31, 2010, were $75,563,330 and
$74,306,701 respectively.
4. Borrowings:
The Series, on behalf of the Fund, along with certain other funds man-
aged by the Manager and its affiliates, is a party to a $500 million
credit agreement with a group of lenders, which expires in November
2010. The Fund may borrow under the credit agreement to fund share-
holder redemptions. The Fund paid its pro rata share of a 0.02% upfront
fee on the aggregate commitment amount which was allocated to the
Fund based on its net assets as of October 31, 2009, a commitment
fee of 0.10% per annum based on the Fund's pro rata share of the
unused portion of the credit agreement, which is included in miscella-
neous in the Statement of Operations, and interest at a rate equal to the
higher of (a) the one-month LIBOR plus 1.25% per annum and (b) the
Fed Funds rate plus 1.25% per annum on amounts borrowed. The Fund
did not borrow under the credit agreement during the six months ended
July 31, 2010.
5. Capital Loss Carryforward:
As of January 31, 2010, the Fund had capital loss carryforwards
available to offset future realized capital gains through the indicated
expiration dates:
| |
| Expires January 31, | |
| 2017 | $ 32,503,018 |
| 2018 | 75,279,802 |
| Total | $ 107,782,820 |
20 BLACKROCK MID CAP VALUE OPPORTUNITIES FUND
JULY 31, 2010
Notes to Financial Statements (continued)
6. Concentration, Market and Credit Risk:
In the normal course of business, the Fund invests in securities and
enters into transactions where risks exist due to fluctuations in the mar-
ket (market risk) or failure of the issuer of a security to meet all its obli-
gations (issuer credit risk). The value of securities held by the Fund may
decline in response to certain events, including those directly involving
the issuers whose securities are owned by the Fund; conditions affecting
the general economy; overall market changes; local, regional or global
political, social or economic instability; and currency and interest rate
and price fluctuations. Similar to issuer credit risk, the Fund may be
exposed to counterparty credit risk, or the risk that an entity with which
the Fund has unsettled or open transactions may fail to or be unable to
perform on its commitments. The Fund manages counterparty credit risk
by entering into transactions only with counterparties that it believes
have the financial resources to honor their obligations and by monitoring
the financial stability of those counterparties. Financial assets, which
potentially expose the Fund to market, issuer and counterparty credit
risks, consist principally of financial instruments and receivables due
from counterparties. The extent of the Fund's exposure to market, issuer
and counterparty credit risks with respect to these financial assets is
generally approximated by their value recorded in the Fund's Statement
of Assets and Liabilities, less any collateral held by the Fund.
The Fund invests a significant portion of its assets in securities in the
financials sector. Changes in economic conditions affecting the finan-
cials sector would have a greater impact on the Fund and could affect
the value, income and/or liquidity of positions in such securities.
| | | | | | |
| 7. Capital Share Transactions: | | | | | | |
| Transactions in capital shares for each class were as follows: | | | | | | |
| | Six Months Ended | Year Ended | |
| | July | 31, 2010 | January 31, 2010 |
| | Shares | | Amount | Shares | | Amount |
| Institutional | | | | | | |
| Shares sold | 380,731 | $ 5,433,176 | 1,197,992 | $ 13,095,393 |
| Shares issued to shareholders in reinvestment | | | | | | |
| of dividends | — | | — | 36,094 | | 413,997 |
| Total issued | 380,731 | | 5,433,176 | 1,234,086 | | 13,509,390 |
| Shares redeemed | (904,790) | | (12,629,500) | (1,579,573) | | (18,355,938) |
| Net decrease | (524,059) | $ (7,196,324) | (345,487) | $ (4,846,548) |
| Investor A | | | | | | |
| Shares sold and automatic conversion of shares | 1,526,652 | $ 21,548,310 | 2,903,260 | $ 32,744,277 |
| Shares issued to shareholders in reinvestment | | | | | | |
| of dividends | — | | — | 23,192 | | 260,446 |
| Total issued | 1,526,652 | | 21,548,310 | 2,926,452 | | 33,004,723 |
| Shares redeemed | (1,200,549) | | (16,710,205) | (2,108,416) | | (23,160,451) |
| Net increase | 326,103 | $ 4,838,105 | 818,036 | $ 9,844,272 |
| Investor B | | | | | | |
| Shares sold | 32,619 | $ 430,058 | 109,186 | $ 1,065,664 |
| Shares redeemed and automatic conversion of shares | (444,588) | | (5,787,535) | (1,394,821) | | (14,518,074) |
| Net decrease | (411,969) | $ (5,357,477) | (1,285,635) | $ (13,452,410) |
| Investor C | | | | | | |
| Shares sold | 422,994 | $ 5,439,003 | 845,202 | $ 8,557,135 |
| Shares redeemed | (679,785) | | (8,607,167) | (1,540,665) | | (15,444,453) |
| Net decrease | (256,791) | $ (3,168,164) | (695,463) | $ (6,887,318) |
BLACKROCK MID CAP VALUE OPPORTUNITIES FUND
JULY 31, 2010
21
| | | | | | |
| Notes to Financial Statements (concluded) | | | | | |
| | Six Months Ended | Year Ended | |
| | July 31, 2010 | | January 31, 2010 |
| | Shares | | Amount | Shares | | Amount |
| Class R | | | | | | |
| Shares sold | 1,154,095 | $ 15,060,508 | 2,024,704 | $ 20,891,203 |
| Shares issued to shareholders in reinvestment | | | | | | |
| of dividends | — | | — | 383 | | 4,030 |
| Total issued | 1,154,095 | | 15,060,508 | 2,025,087 | | 20,895,233 |
| Shares redeemed | (750,039) | | (9,796,175) | (1,732,823) | | (17,855,251) |
| Net increase | 404,056 | $ 5,264,333 | 292,264 | $ 3,039,982 |
8. Subsequent Events:
Management has evaluated the impact of all subsequent events on the
Fund through the date the financial statements were issued and has
determined that there were no subsequent events requiring adjustment
or additional disclosure in the financial statements.
22 BLACKROCK MID CAP VALUE OPPORTUNITIES FUND
JULY 31, 2010
Disclosure of Investment Advisory Agreement and Sub-Advisory Agreement
The Board of Directors (the “Board,” and the members of which are
referred to as “Board Members”) of BlackRock Mid Cap Value
Opportunities Fund (the “Fund”), a series of BlackRock Mid Cap Value
Opportunities Series, Inc. (the “Corporation”), met on April 13, 2010 and
May 11 – 12, 2010 to consider the approval of the Corporation’s invest-
ment advisory agreement (the “Advisory Agreement”), on behalf of the
Fund, with BlackRock Advisors, LLC (the “Manager”), the Fund’s invest-
ment advisor. The Board also considered the approval of the sub-advi-
sory agreement (the “Sub-Advisory Agreement”) between the Manager
and BlackRock Investment Management, LLC (the “Sub-Advisor”), with
respect to the Fund. The Manager and the Sub-Advisor are referred to
herein as “BlackRock.” The Advisory Agreement and the Sub-Advisory
Agreement are referred to herein as the “Agreements.”
Activities and Composition of the Board
The Board consists of fourteen individuals, eleven of whom are not
“interested persons” of the Corporation as defined in the Investment
Company Act of 1940, as amended (the “1940 Act”) (the “Independent
Board Members”). The Board Members are responsible for the oversight
of the operations of the Fund and perform the various duties imposed
on the directors of investment companies by the 1940 Act. The Inde-
pendent Board Members have retained independent legal counsel to
assist them in connection with their duties. The Chairman of the Board
is an Independent Board Member. The Board has established five stand-
ing committees: an Audit Committee, a Governance and Nominating
Committee, a Compliance Committee, a Performance Oversight
Committee and an Executive Committee, each of which is composed
of Independent Board Members (except for the Performance Oversight
Committee and the Executive Committee, each of which also has
one interested Board Member) and is chaired by Independent Board
Members. The Board also has one ad hoc committee, the Joint Product
Pricing Committee, which consists of Independent Board Members and
directors/trustees of the boards of certain other BlackRock-managed
funds, who are not “interested persons” of their respective funds.
The Agreements
Pursuant to the 1940 Act, the Board is required to consider the contin-
uation of the Agreements on an annual basis. In connection with this
process, the Board assessed, among other things, the nature, scope
and quality of the services provided to the Fund by the personnel of
BlackRock and its affiliates, including investment management, admin-
istrative and shareholder services, oversight of fund accounting and
custody, marketing services and assistance in meeting applicable legal
and regulatory requirements.
From time to time throughout the year, the Board, acting directly
and through its committees, considers at each of its meetings factors
that are relevant to its annual consideration of the renewal of the
Agreements, including the services and support provided by BlackRock
to the Fund and its shareholders. Among the matters the Board
considered were: (a) investment performance for one-, three- and five-
year periods, as applicable, against peer funds, and applicable bench-
marks, if any, as well as senior management’s and portfolio managers’
analysis of the reasons for any over performance or underperformance
against its peers and/or benchmark, as applicable; (b) fees, including
advisory, administration, if applicable, and other amounts paid to
BlackRock and its affiliates by the Fund for services, such as transfer
agency, marketing and distribution, call center and fund accounting;
(c) Fund operating expenses; (d) the resources devoted to and compli-
ance reports relating to the Fund’s investment objective, policies and
restrictions, (e) the Fund’s compliance with its Code of Ethics and com-
pliance policies and procedures; (f) the nature, cost and character of
non-investment management services provided by BlackRock and its
affiliates; (g) BlackRock’s and other service providers’ internal controls;
(h) BlackRock’s implementation of the proxy voting policies approved
by the Board; (i) the use of brokerage commissions and execution qual-
ity of portfolio transactions; (j) BlackRock’s implementation of the Fund’s
valuation and liquidity procedures; (k) an analysis of contractual and
actual management fees for products with similar investment objectives
across the open-end fund, closed-end fund and institutional account
product channels, as applicable; and (l) periodic updates on
BlackRock’s business.
Board Considerations in Approving the Agreements
The Approval Process: Prior to the April 13, 2010 meeting, the Board
requested and received materials specifically relating to the Agreements.
The Board is engaged in a process with BlackRock to periodically review
the nature and scope of the information provided to better assist its
deliberations. The materials provided in connection with the April meet-
ing included (a) information independently compiled and prepared by
Lipper, Inc. (“Lipper”) on Fund fees and expenses, and the investment
performance of the Fund as compared with a peer group of funds as
determined by Lipper (collectively, “Peers”); (b) information on the prof-
itability of the Agreements to BlackRock and a discussion of fall-out
benefits to BlackRock and its affiliates and significant shareholders;
(c) a general analysis provided by BlackRock concerning investment
advisory fees charged to other clients, such as institutional clients and
closed-end funds, under similar investment mandates, as well as the
performance of such other clients, as applicable; (d) the impact of
economies of scale; (e) a summary of aggregate amounts paid by the
Fund to BlackRock; (f) sales and redemption data regarding the Fund’s
shares; and (g) if applicable, a comparison of management fees to
similar BlackRock open-end funds, as classified by Lipper.
At an in-person meeting held on April 13, 2010, the Board reviewed
materials relating to its consideration of the Agreements. As a result of
the discussions that occurred during the April 13, 2010 meeting, the
Board presented BlackRock with questions and requests for additional
information and BlackRock responded to these requests with additional
written information in advance of the May 11 – 12, 2010 Board meeting.
BLACKROCK MID CAP VALUE OPPORTUNITIES FUND
JULY 31, 2010
23
Disclosure of Investment Advisory Agreement and Sub-Advisory Agreement (continued)
At an in-person meeting held on May 11 – 12, 2010, the Board, includ-
ing the Independent Board Members, unanimously approved the cont-
inuation of the Advisory Agreement between the Manager and the
Corporation, on behalf of the Fund, and the Sub-Advisory Agreement
between the Manager and the Sub-Advisor with respect to the Fund,
each for a one-year term ending June 30, 2011. In approving the contin-
uation of the Agreements, the Board considered: (a) the nature, extent
and quality of the services provided by BlackRock; (b) the investment
performance of the Fund and BlackRock; (c) the advisory fee and the
cost of the services and profits to be realized by BlackRock and its
affiliates from their relationship with the Fund; (d) economies of scale;
and (e) other factors deemed relevant by the Board Members.
The Board also considered other matters it deemed important to the
approval process, such as payments made to BlackRock or its affiliates
relating to the distribution of Fund shares, services related to the valua-
tion and pricing of Fund portfolio holdings, direct and indirect benefits to
BlackRock and its affiliates and significant shareholders from their rela-
tionship with the Fund and advice from independent legal counsel with
respect to the review process and materials submitted for the Board’s
review. The Board noted the willingness of BlackRock personnel to
engage in open, candid discussions with the Board. The Board did
not identify any particular information as controlling, and each Board
Member may have attributed different weights to the various
items considered.
A. Nature, Extent and Quality of the Services Provided by BlackRock:
The Board, including the Independent Board Members, reviewed the
nature, extent and quality of services provided by BlackRock, including
the investment advisory services and the resulting performance of the
Fund. Throughout the year, the Board compared Fund performance to the
performance of a comparable group of mutual funds, and the perform-
ance of a relevant benchmark, if any. The Board met with BlackRock’s
senior management personnel responsible for investment operations,
including the senior investment officers. The Board also reviewed the
materials provided by the Fund’s portfolio management team discussing
Fund performance and the Fund’s investment objective, strategies and
outlook.
The Board considered, among other factors, the number, education
and experience of BlackRock’s investment personnel generally and the
Fund’s portfolio management team, investments by portfolio managers
in the funds they manage, BlackRock’s portfolio trading capabilities,
BlackRock’s use of technology, BlackRock’s commitment to compliance,
BlackRock’s credit analysis capabilities, BlackRock’s risk analysis capa-
bilities and BlackRock’s approach to training and retaining portfolio
managers and other research, advisory and management personnel. The
Board also reviewed a general description of BlackRock’s compensation
structure with respect to the Fund’s portfolio management team and
BlackRock’s ability to attract and retain high-quality talent.
In addition to advisory services, the Board considered the quality of the
administrative and non-investment advisory services provided to the
Fund. BlackRock and its affiliates and significant shareholders provide
the Fund with certain administrative, transfer agency, shareholder and
other services (in addition to any such services provided to the Fund by
third parties) and officers and other personnel as are necessary for the
operations of the Fund. In addition to investment advisory services,
BlackRock and its affiliates provide the Fund with other services, includ-
ing (i) preparing disclosure documents, such as the prospectus, the
statement of additional information and periodic shareholder reports; (ii)
assisting with daily accounting and pricing; (iii) overseeing and coordi-
nating the activities of other service providers; (iv) organizing Board
meetings and preparing the materials for such Board meetings; (v) pro-
viding legal and compliance support; and (vi) performing other adminis-
trative functions necessary for the operation of the Fund, such as tax
reporting, fulfilling regulatory filing requirements, and call center serv-
ices. The Board reviewed the structure and duties of BlackRock’s fund
administration, accounting, legal and compliance departments and con-
sidered BlackRock’s policies and procedures for assuring compliance
with applicable laws and regulations.
B. The Investment Performance of the Fund and BlackRock: The Board,
including the Independent Board Members, also reviewed and consid-
ered the performance history of the Fund. In preparation for the April 13,
2010 meeting, the Board was provided with reports, independently pre-
pared by Lipper, which included a comprehensive analysis of the Fund’s
performance. The Board also reviewed a narrative and statistical analysis
of the Lipper data that was prepared by BlackRock, which analyzed vari-
ous factors that affect Lipper’s rankings. In connection with its review, the
Board received and reviewed information regarding the investment per-
formance of the Fund as compared to a representative group of similar
funds as determined by Lipper and to all funds in the Fund’s applicable
Lipper category. The Board was provided with a description of the
methodology used by Lipper to select peer funds. The Board regularly
reviews the performance of the Fund throughout the year. The Board
attaches more importance to performance over relatively long periods of
time, typically three to five years.
The Board noted that the Fund ranked in the second, first and second
quartiles against its Lipper Performance Universe for the one-, three- and
five-year periods reported, respectively.
C. Consideration of the Advisory Fees and the Cost of the Services and
Profits to be Realized by BlackRock and its Affiliates from their
Relationship with the Fund: The Board, including the Independent Board
Members, reviewed the Fund’s contractual advisory fee rate compared
with the other funds in its Lipper category. It also compared the Fund’s
total expenses, as well as actual management fees, to those of other
24 BLACKROCK MID CAP VALUE OPPORTUNITIES FUND
JULY 31, 2010
Disclosure of Investment Advisory Agreement and Sub-Advisory Agreement (continued)
funds in its Lipper category. The Board considered the services provided
and the fees charged by BlackRock to other types of clients with
similar investment mandates, including separately managed
institutional accounts.
The Board received and reviewed statements relating to BlackRock’s
financial condition and profitability with respect to the services it pro-
vided the Fund. The Board was also provided with a profitability analysis
that detailed the revenues earned and the expenses incurred by
BlackRock for services provided to the Fund. The Board reviewed
BlackRock’s profitability with respect to the Fund and other funds the
Board currently oversees for the year ended December 31, 2009 com-
pared to available aggregate profitability data provided for the year
ended December 31, 2008. The Board reviewed BlackRock’s profitability
with respect to other fund complexes managed by the Manager and/or
its affiliates. The Board reviewed BlackRock’s assumptions and method-
ology of allocating expenses in the profitability analysis, noting the inher-
ent limitations in allocating costs among various advisory products. The
Board recognized that profitability may be affected by numerous factors
including, among other things, fee waivers and expense reimbursements
by the Manager, the types of funds managed, expense allocations and
business mix, and the difficulty of comparing profitability as a result of
those factors.
The Board noted that, in general, individual fund or product line prof-
itability of other advisors is not publicly available. Nevertheless, to the
extent such information was available, the Board considered BlackRock’s
operating margin, in general, compared to the operating margin for lead-
ing investment management firms whose operations include advising
open-end funds, among other product types. That data indicates that
operating margins for BlackRock with respect to its registered funds are
generally consistent with margins earned by similarly situated publicly
traded competitors. In addition, the Board considered, among other
things, certain third party data comparing BlackRock’s operating margin
with that of other publicly-traded asset management firms. That third
party data indicates that larger asset bases do not, in themselves,
translate to higher profit margins.
In addition, the Board considered the cost of the services provided to
the Fund by BlackRock, and BlackRock’s and its affiliates’ profits relating
to the management and distribution of the Fund and the other funds
advised by BlackRock and its affiliates. As part of its analysis, the Board
reviewed BlackRock’s methodology in allocating its costs to the manage-
ment of the Fund. The Board also considered whether BlackRock has the
financial resources necessary to attract and retain high quality invest-
ment management personnel to perform its obligations under the
Agreements and to continue to provide the high quality of services
that is expected by the Board.
The Board noted that the Fund’s contractual advisory fee rate was lower
than or equal to the median contractual advisory fee rate paid by the
Fund’s Peers, in each case, before taking into account any expense
reimbursements or fee waivers.
D. Economies of Scale: The Board, including the Independent Board
Members, considered the extent to which economies of scale might be
realized as the assets of the Fund increase. The Board also considered
the extent to which the Fund benefits from such economies and whether
there should be changes in the advisory fee rate or structure in order to
enable the Fund to participate in these economies of scale, for example
through the use of breakpoints in the advisory fee based upon the asset
level of the Fund.
E. Other Factors Deemed Relevant by the Board Members: The Board,
including the Independent Board Members, also took into account other
ancillary or “fall-out” benefits that BlackRock or its affiliates and signifi-
cant shareholders may derive from their respective relationships with
the Fund, both tangible and intangible, such as BlackRock’s ability to
leverage its investment professionals who manage other portfolios, an
increase in BlackRock’s profile in the investment advisory community,
and the engagement of BlackRock’s affiliates and significant sharehold-
ers as service providers to the Fund, including for administrative, transfer
agency and distribution services. The Board also considered BlackRock’s
overall operations and its efforts to expand the scale of, and improve the
quality of, its operations. The Board also noted that BlackRock may use
and benefit from third party research obtained by soft dollars generated
by certain mutual fund transactions to assist in managing all or a num-
ber of its other client accounts. The Board further noted that BlackRock
completed the acquisition of a complex of exchange-traded funds
(“ETFs”) on December 1, 2009, and that BlackRock’s funds may invest
in such ETFs without any offset against the management fees payable
by the funds to BlackRock.
In connection with its consideration of the Agreements, the Board also
received information regarding BlackRock’s brokerage and soft dollar
practices. The Board received reports from BlackRock which included
information on brokerage commissions and trade execution practices
throughout the year.
The Board noted the competitive nature of the open-end fund market-
place, and that shareholders are able to redeem their Fund shares if
they believe that the Fund’s fees and expenses are too high or if they
are dissatisfied with the performance of the Fund.
BLACKROCK MID CAP VALUE OPPORTUNITIES FUND
JULY 31, 2010
25
Disclosure of Investment Advisory Agreement and Sub-Advisory Agreement (concluded)
Conclusion
The Board, including the Independent Board Members, unanimously
approved the continuation of the Advisory Agreement between the
Manager and the Corporation, on behalf of the Fund, for a one-year term
ending June 30, 2011 and the Sub-Advisory Agreement between the
Manager and the Sub-Advisor, with respect to the Fund, for a one-year
term ending June 30, 2011. As part of its approval, the Board consid-
ered the discussions of BlackRock’s fee structure, as it applies to the
Fund, being conducted by the ad hoc Joint Product Pricing Committee.
Based upon its evaluation of all of the aforementioned factors in their
totality, the Board, including the Independent Board Members, was satis-
fied that the terms of the Agreements were fair and reasonable and in
the best interest of the Fund and its shareholders. In arriving at a deci-
sion to approve the Agreements, the Board did not identify any single
factor or group of factors as all-important or controlling, but considered
all factors together, and different Board Members may have attributed
different weights to the various factors considered. The Independent
Board Members were also assisted by the advice of independent legal
counsel in making this determination. The contractual fee arrangements
for the Fund reflect the results of several years of review by the Board
Members and predecessor Board Members, and discussions between
such Board Members (and predecessor Board Members) and
BlackRock. Certain aspects of the arrangements may be the subject of
more attention in some years than in others, and the Board Members’
conclusions may be based in part on their consideration of these
arrangements in prior years.
26 BLACKROCK MID CAP VALUE OPPORTUNITIES FUND
JULY 31, 2010
Officers and Directors
Robert M. Hernandez, Chairman of the Board, Director and Member
of the Audit Committee
Fred G. Weiss, Vice Chairman of the Board, Chairman of
the Audit Committee and Director
James H. Bodurtha, Director
Bruce R. Bond, Director
Donald W. Burton, Director
Richard S. Davis, Director
Honorable Stuart E. Eizenstat, Director
Laurence D. Fink, Director
Kenneth A. Froot, Director
Henry Gabbay, Director
John F. O’Brien, Director
Roberta Cooper Ramo, Director
David H. Walsh, Director
Richard R. West, Director and Member of the Audit Committee
Anne Ackerley, President and Chief Executive Officer
Jeffrey Holland, Vice President
Brendan Kyne, Vice President
Brian Schmidt, Vice President
Neal Andrews, Chief Financial Officer
Jay Fife, Treasurer
Brian Kindelan, Chief Compliance Officer
Howard Surloff, Secretary
Investment Advisor
BlackRock Advisors, LLC
Wilmington, DE 19809
Sub-Advisor
BlackRock Investment Management, LLC
Plainsboro, NJ 08536
Custodian
The Bank of New York Mellon
New York, NY 10286
Transfer Agent
BNY Mellon Investment Servicing (US) Inc.
Wilmington, DE 19809
Accounting Agent
State Street Bank and Trust Company
Princeton, NJ 08540
Distributor
BlackRock Investments, LLC
New York, NY 10022
Legal Counsel
Willkie Farr & Gallagher LLP
New York, NY 10019
Independent Registered Public Accounting Firm
Deloitte & Touche LLP
Princeton, NJ 08540
Address of the Fund
100 Bellevue Parkway
Wilmington, DE 19809
Effective September 15, 2010, John M. Perlowski became
President and Chief Executive Officer of the Series.
BLACKROCK MID CAP VALUE OPPORTUNITIES FUND
JULY 31, 2010
27
Additional Information
General Information
Electronic Delivery
Electronic copies of most financial reports and prospectuses are available
on the Fund’s website or shareholders can sign up for e-mail notifications
of quarterly statements, annual and semi-annual reports and prospectuses
by enrolling in the Fund’s electronic delivery program.
To enroll:
Shareholders Who Hold Accounts with Investment Advisors, Banks or
Brokerages:
Please contact your financial advisor. Please note that not all investment
advisers, banks or brokerages may offer this service.
Shareholders Who Hold Accounts Directly with BlackRock:
1) Access the BlackRock Web site at
http://www.blackrock.com/edelivery
2) Select “eDelivery” under the “More Information” section
3) Log into your account
Householding
The Fund will mail only one copy of shareholder documents, including
prospectuses, annual and semi-annual reports and proxy statements, to
shareholders with multiple accounts at the same address. This practice
is commonly called “householding” and is intended to reduce expenses
and eliminate duplicate mailings of shareholder documents. Mailings of
your shareholder documents may be householded indefinitely unless you
instruct us otherwise. If you do not want the mailing of these documents
to be combined with those for other members of your household, please
call (800) 441-7762.
Availability of Quarterly Schedule of Investments
The Fund files its complete schedule of portfolio holdings with the
Securities and Exchange Commission (the “SEC”) for the first and third
quarters of each fiscal year on Form N-Q. The Fund’s Forms N-Q are
available on the SEC’s website at http://www.sec.gov and may also
be reviewed and copied at the SEC’s Public Reference Room in
Washington, D.C. Information on the operation of the Public Reference
Room may be obtained by calling (800) SEC-0330. The Fund’s Forms
N-Q may also be obtained upon request and without charge by calling
(800) 441-7762.
Availability of Proxy Voting Policies and Procedures
A description of the policies and procedures that the Fund uses to
determine how to vote proxies relating to portfolio securities is available
(1) without charge, upon request, by calling (800) 441-7762;
(2) at http://www.blackrock.com; and (3) on the SEC’s website
at http://www.sec.gov.
Availability of Proxy Voting Record
Information about how the Fund voted proxies relating to securities
held in the Fund’s portfolio during the most recent 12-month period
ended June 30 is available upon request and without charge (1) at
http://www.blackrock.com or by calling (800) 441-7762 and (2) on the
SEC’s website at http://www.sec.gov.
Shareholder Privileges
Account Information
Call us at (800) 441-7762 from 8:00 AM to 6:00 PM EST on any
business day to get information about your account balances, recent
transactions and share prices. You can also reach us on the Web at
http://www.blackrock.com/funds.
Automatic Investment Plans
Investor Class shareholders who want to invest regularly can arrange to
have $50 or more automatically deducted from their checking or savings
account and invested in any of the BlackRock funds.
Systematic Withdrawal Plans
Investor Class shareholders can establish a systematic withdrawal plan
and receive periodic payments of $50 or more from their BlackRock
funds, as long as their account balance is at least $10,000.
Retirement Plans
Shareholders may make investments in conjunction with Traditional,
Rollover, Roth, Coverdell, Simple IRAs, SEP IRAs and 403(b) Plans.
28 BLACKROCK MID CAP VALUE OPPORTUNITIES FUND
JULY 31, 2010
Additional Information (concluded)
BlackRock Privacy Principles
BlackRock is committed to maintaining the privacy of its current and
former fund investors and individual clients (collectively, “Clients”) and
to safeguarding their non-public personal information. The following infor-
mation is provided to help you understand what personal information
BlackRock collects, how we protect that information and why in certain
cases we share such information with select parties.
If you are located in a jurisdiction where specific laws, rules or regula-
tions require BlackRock to provide you with additional or different privacy-
related rights beyond what is set forth below, then BlackRock will comply
with those specific laws, rules or regulations.
BlackRock obtains or verifies personal non-public information from and
about you from different sources, including the following: (i) information
we receive from you or, if applicable, your financial intermediary, on appli-
cations, forms or other documents; (ii) information about your trans-
actions with us, our affiliates, or others; (iii) information we receive from
a consumer reporting agency; and (iv) from visits to our websites.
BlackRock does not sell or disclose to non-affiliated third parties any non-
public personal information about its Clients, except as permitted by law
or as is necessary to respond to regulatory requests or to service Client
accounts. These non-affiliated third parties are required to protect the
confidentiality and security of this information and to use it only for its
intended purpose.
We may share information with our affiliates to service your account
or to provide you with information about other BlackRock products or
services that may be of interest to you. In addition, BlackRock restricts
access to non-public personal information about its Clients to those
BlackRock employees with a legitimate business need for the information.
BlackRock maintains physical, electronic and procedural safeguards
that are designed to protect the non-public personal information of its
Clients, including procedures relating to the proper storage and disposal
of such information.
BLACKROCK MID CAP VALUE OPPORTUNITIES FUND
JULY 31, 2010
29
A World-Class Mutual Fund Family
BlackRock offers a diverse lineup of open-end mutual funds crossing all investment styles and managed by experts in equity, fixed income and
tax-exempt investing.
| | | | |
| Equity Funds | | | | |
| BlackRock All-Cap Energy & Resources Portfolio | BlackRock Global SmallCap Fund | BlackRock Natural Resources Trust |
| BlackRock Asset Allocation Portfolio† | BlackRock Health Sciences Opportunities Portfolio | BlackRock Pacific Fund |
| BlackRock Balanced Capital Fund† | BlackRock Healthcare Fund | BlackRock Science & Technology |
| BlackRock Basic Value Fund | BlackRock Index Equity Portfolio* | Opportunities Portfolio |
| BlackRock Capital Appreciation Fund | BlackRock International Fund | BlackRock Small Cap Core Equity Portfolio |
| BlackRock Energy & Resources Portfolio | BlackRock International Index Fund | BlackRock Small Cap Growth Equity Portfolio |
| BlackRock Equity Dividend Fund | BlackRock International Opportunities Portfolio | BlackRock Small Cap Growth Fund II |
| BlackRock EuroFund | BlackRock International Value Fund | BlackRock Small Cap Index Fund |
| BlackRock Focus Growth Fund | BlackRock Large Cap Core Fund | BlackRock Small/Mid-Cap Growth Portfolio |
| BlackRock Focus Value Fund | BlackRock Large Cap Core Plus Fund | BlackRock S&P 500 Index Fund |
| BlackRock Global Allocation Fund† | BlackRock Large Cap Growth Fund | BlackRock U.S. Opportunities Portfolio |
| BlackRock Global Dynamic Equity Fund | BlackRock Large Cap Value Fund | BlackRock Utilities and Telecommunications Fund |
| BlackRock Global Emerging Markets Fund | BlackRock Latin America Fund | BlackRock Value Opportunities Fund |
| BlackRock Global Financial Services Fund | BlackRock Mid-Cap Growth Equity Portfolio | BlackRock World Gold Fund |
| BlackRock Global Growth Fund | BlackRock Mid-Cap Value Equity Portfolio | | |
| BlackRock Global Opportunities Portfolio | BlackRock Mid Cap Value Opportunities Fund | | |
| Fixed Income Funds | | | | |
| BlackRock Bond Portfolio | BlackRock Income Builder Portfolio† | BlackRock Multi-Sector Bond Portfolio |
| BlackRock Emerging Market Debt Portfolio | BlackRock Inflation Protected Bond Portfolio | BlackRock Short-Term Bond Fund |
| BlackRock Floating Rate Income Portfolio | BlackRock Intermediate Government | BlackRock Strategic Income |
| BlackRock GNMA Portfolio | Bond Portfolio | | Opportunities Portfolio |
| BlackRock Government Income Portfolio | BlackRock International Bond Portfolio | BlackRock Total Return Fund |
| BlackRock High Income Fund | BlackRock Long Duration Bond Portfolio | BlackRock Total Return Portfolio II |
| BlackRock High Yield Bond Portfolio | BlackRock Low Duration Bond Portfolio | BlackRock World Income Fund |
| BlackRock Income Portfolio† | BlackRock Managed Income Portfolio | | |
| Municipal Bond Funds | | | | |
| BlackRock AMT-Free Municipal Bond Portfolio | BlackRock Kentucky Municipal Bond Portfolio | BlackRock New York Municipal Bond Fund |
| BlackRock California Municipal Bond Fund | BlackRock Municipal Insured Fund | BlackRock Ohio Municipal Bond Portfolio |
| BlackRock High Yield Municipal Fund | BlackRock National Municipal Fund | BlackRock Pennsylvania Municipal Bond Fund |
| BlackRock Intermediate Municipal Fund | BlackRock New Jersey Municipal Bond Fund | BlackRock Short-Term Municipal Fund |
| Target Risk & Target Date Funds† | | | | |
| BlackRock Prepared Portfolios | BlackRock Lifecycle Prepared Portfolios | BlackRock LifePath Portfolios |
| Conservative Prepared Portfolio | 2010 | 2035 | Retirement | 2040 |
| Moderate Prepared Portfolio | 2015 | 2040 | 2020 | 2045 |
| Growth Prepared Portfolio | 2020 | 2045 | 2025 | 2050 |
| Aggressive Growth Prepared Portfolio | 2025 | 2050 | 2030 | 2055 |
| | 2030 | | 2035 | |
* See the prospectus for information on specific limitations on investments in the fund.
† Mixed asset fund.
BlackRock mutual funds are currently distributed by BlackRock Investments, LLC. You should consider the investment objectives, risks, charges and
expenses of the funds under consideration carefully before investing. Each fund’s prospectus contains this and other information and is available at
www.blackrock.com or by calling (800) 441-7762 or from your financial advisor. The prospectus should be read carefully before investing.
30 BLACKROCK MID CAP VALUE OPPORTUNITIES FUND
JULY 31, 2010

This report is not authorized for use as an offer of sale or
a solicitation of an offer to buy shares of the Fund unless
accompanied or preceded by the Fund’s current prospectus.
Past performance results shown in this report should not
be considered a representation of future performance.
Investment return and principal value of shares will fluctuate
so that shares, when redeemed, may be worth more or less
than their original cost. Statements and other information
herein are as dated and are subject to change.

Item 2 – Code of Ethics – Not Applicable to this semi-annual report
Item 3 – Audit Committee Financial Expert – Not Applicable to this semi-annual report
Item 4 – Principal Accountant Fees and Services – Not Applicable to this semi-annual report
Item 5 – Audit Committee of Listed Registrants – Not Applicable
Item 6 – Investments
(a) The registrant’s Schedule of Investments is included as part of the Report to
Stockholders filed under Item 1 of this form.
(b) Not Applicable due to no such divestments during the semi-annual period covered since
the previous Form N-CSR filing.
Item 7 – Disclosure of Proxy Voting Policies and Procedures for Closed-End Management
Investment Companies – Not Applicable
Item 8 – Portfolio Managers of Closed-End Management Investment Companies – Not Applicable
Item 9 – Purchases of Equity Securities by Closed-End Management Investment Company and
Affiliated Purchasers – Not Applicable
Item 10 – Submission of Matters to a Vote of Security Holders – The registrant’s Nominating and
Governance Committee will consider nominees to the board of directors recommended by
shareholders when a vacancy becomes available. Shareholders who wish to recommend a
nominee should send nominations that include biographical information and set forth the
qualifications of the proposed nominee to the registrant’s Secretary. There have been no
material changes to these procedures.
Item 11 – Controls and Procedures
11(a) – The registrant’s principal executive and principal financial officers or persons performing
similar functions have concluded that the registrant’s disclosure controls and procedures (as
defined in Rule 30a-3(c) under the Investment Company Act of 1940, as amended (the
“1940 Act”)) are effective as of a date within 90 days of the filing of this report based on the
evaluation of these controls and procedures required by Rule 30a-3(b) under the 1940 Act
and Rule 15(d)-15(b) under the Securities Exchange Act of 1934, as amended.
11(b) – There were no changes in the registrant’s internal control over financial reporting (as
defined in Rule 30a-3(d) under the 1940 Act) that occurred during the second fiscal quarter
of the period covered by this report that have materially affected, or are reasonably likely to
materially affect, the registrant’s internal control over financial reporting.
Item 12 – Exhibits attached hereto
12(a)(1) – Code of Ethics – Not Applicable to this semi-annual report
12(a)(2) – Certifications – Attached hereto
12(a)(3) – Not Applicable
12(b) – Certifications – Attached hereto
Pursuant to the requirements of the Securities Exchange Act of 1934 and the Investment
Company Act of 1940, the registrant has duly caused this report to be signed on its behalf by
the undersigned, thereunto duly authorized.
BlackRock Mid Cap Value Opportunities Fund of BlackRock Mid Cap Value Opportunities
Series, Inc.
By: /s/ Anne F. Ackerley
Anne F. Ackerley
Chief Executive Officer of
BlackRock Mid Cap Value Opportunities Fund of BlackRock Mid Cap Value
Opportunities Series, Inc.
Date: October 6, 2010
Pursuant to the requirements of the Securities Exchange Act of 1934 and the Investment
Company Act of 1940, this report has been signed below by the following persons on behalf
of the registrant and in the capacities and on the dates indicated.
By: /s/ Anne F. Ackerley
Anne F. Ackerley
Chief Executive Officer (principal executive officer) of
BlackRock Mid Cap Value Opportunities Fund of BlackRock Mid Cap Value
Opportunities Series, Inc.
Date: October 6, 2010
By: /s/ Neal J. Andrews
Neal J. Andrews
Chief Financial Officer (principal financial officer) of
BlackRock Mid Cap Value Opportunities Fund of BlackRock Mid Cap Value
Opportunities Series, Inc.
Date: October 6, 2010