UNITEDSTATES
SECURITIESANDEXCHANGECOMMISSION
Washington,D.C.20549
FORM N-CSR
CERTIFIED SHAREHOLDER REPORT OF REGISTERED MANAGEMENT
INVESTMENT COMPANIES
Investment Company Act file number 811-07177
Name of Fund: BlackRock Mid Cap Value Opportunities Fund of BlackRock Mid Cap Value
Opportunities Series, Inc.
Fund Address: 100 Bellevue Parkway, Wilmington, DE 19809
Name and address of agent for service: John M. Perlowski, Chief Executive Officer, BlackRock Mid
Cap Value Opportunities Fund of BlackRock Mid Cap Value Opportunities Series, Inc., 55
East 52nd Street, New York, NY 10055
Registrant’s telephone number, including area code: (800) 441-7762
Date of fiscal year end: 01/31/2012
Date of reporting period: 07/31/2011
Item 1 – Report to Stockholders
Semi-Annual Report (Unaudited)
BlackRock Mid Cap Value Opportunities Fund | of BlackRock Mid Cap Value Opportunities Series, Inc.
Not FDIC Insured • No Bank Guarantee • May Lose Value
| Table of Contents | |
| Page | |
| Dear Shareholder | 3 |
| Semi-Annual Report: | |
| Fund Summary | 4 |
| About Fund Performance | 6 |
| Disclosure of Expenses | 6 |
| Financial Statements: | |
| Schedule of Investments | 7 |
| Statement of Assets and Liabilities | 10 |
| Statement of Operations | 11 |
| Statements of Changes in Net Assets | 12 |
| Financial Highlights | 13 |
| Notes to Financial Statements | 18 |
| Disclosure of Investment Advisory Agreement and Sub-Advisory Agreement | 23 |
| Officers and Directors | 27 |
| Additional Information | 28 |
| Mutual Fund Family | 31 |
| 2 | BLACKROCK MID CAP VALUE OPPORTUNITIES FUND | JULY 31, 2011 |
Dear Shareholder
Financial markets have been extremely volatile in the wake of the Standard & Poor’s downgrade of
US Treasury debt. While the August 5 announcement was the catalyst for the market turmoil, weaker-
than-expected economic data and Europe’s deepening financial crisis further compounded investor
uncertainty as the future direction of the global economy became increasingly questionable.
Although markets remain highly volatile and conditions are highly uncertain, BlackRock remains
focused on finding opportunities in this environment.
The pages that follow reflect your mutual fund’s reporting period ended July 31, 2011. Accordingly,
the below discussion is intended to provide you with additional perspective on the performance of
your investments during that period.
During the summer of 2010, investors were in “risk-off” mode as the global economy was sputtering
and the sovereign debt crisis was spreading across Europe. But markets were revived toward the end
of the summer on positive economic news and robust corporate earnings. The global economy had
finally gained traction and fear turned to optimism with the anticipation of a second round of quanti-
tative easing (“QE2”) from the US Federal Reserve (the “Fed”). Stock markets rallied even though
the European debt crisis continued and inflationary pressures loomed over emerging markets. Fixed
income markets, however, saw yields move sharply upward (pushing prices down) especially on the
long end of the historically steep yield curve. While high yield bonds benefited from the risk rally,
most fixed income sectors declined in the fourth quarter. The tax-exempt municipal market faced
additional headwinds as it became evident that the Build America Bond program would not be
extended and municipal finance troubles abounded.
The new year brought spikes of volatility as political turmoil swept across the Middle East/North
Africa region and as prices of oil and other commodities soared. Natural disasters in Japan disrupted
industrial supply chains and concerns mounted over US debt and deficit issues. Equities quickly
rebounded as investors chose to focus on the continuing stream of strong corporate earnings and
positive economic data. Credit markets were surprisingly resilient in this environment and yields
regained relative stability in 2011. The tax-exempt market saw relief from its headwinds and steadily
recovered from its fourth-quarter lows. Equities, commodities and high yield bonds outpaced higher-
quality assets as investors increased their risk tolerance.
However, longer-term headwinds had been brewing. Inflationary pressures intensified in emerging
economies, many of which were overheating, and the European debt crisis continued to escalate.
Markets were met with a sharp reversal in May when political unrest in Greece pushed the nation
closer to defaulting on its debt. This development rekindled fears about the broader debt crisis and
its further contagion among peripheral European countries. Concurrently, it became evident that the
pace of global economic growth had slowed. Higher oil prices and supply chain disruptions finally
showed up in economic data. In the final month of the reporting period, the prolonged debt ceiling
debate in Washington, DC led to a loss of confidence in policymakers. Stocks generally declined from
May through the end of the period, but 6- and 12-month returns through the end of July remained in
positive territory. In bond markets, yields were volatile but generally moved lower for the period as a
whole (pushing prices up). Continued low short-term interest rates kept yields on money market
securities near their all-time lows.


“Although markets remain highly
volatile and conditions are highly
uncertain, BlackRock remains
focused on finding opportunities
in this environment.”
Rob Kapito
President, BlackRock Advisors, LLC
| Total Returns as of July 31, 2011 | ||
| 6-month | 12-month | |
| US large cap equities | 1.46% | 19.65% |
| (S&P 500® Index) | ||
| US small cap equities | 2.63 | 23.92 |
| (Russell 2000® Index) | ||
| International equities | 0.93 | 17.17 |
| (MSCI Europe, Australasia, | ||
| Far East Index) | ||
| Emerging market | 3.23 | 17.45 |
| equities (MSCI Emerging | ||
| Markets Index) | ||
| 3-month Treasury | 0.07 | 0.14 |
| bill (BofA Merrill Lynch | ||
| 3-Month Treasury | ||
| Bill Index) | ||
| US Treasury securities | 6.93 | 4.53 |
| (BofA Merrill Lynch 10- | ||
| Year US Treasury Index) | ||
| US investment grade | 4.23 | 4.44 |
| bonds (Barclays | ||
| Capital US Aggregate | ||
| Bond Index) | ||
| Tax-exempt municipal | 6.27 | 3.24 |
| bonds (Barclays Capital | ||
| Municipal Bond Index) | ||
| US high yield bonds | 3.90 | 12.89 |
| (Barclays Capital US | ||
| Corporate High Yield 2% | ||
| Issuer Capped Index) | ||
Past performance is no guarantee of future results. Index performance
is shown for illustrative purposes only. You cannot invest directly in
an index.
| THIS PAGE NOT PART OF YOUR FUND REPORT | 3 |
Fund Summary as of July 31, 2011
Investment Objective
BlackRock Mid Cap Value Opportunities Fund’s (the “Fund”) investment objective is to seek capital appreciation and, secondarily, income, by investing
in securities, primarily equity securities that Fund management believes are undervalued and therefore represent an investment value.
Portfolio Management Commentary
How did the Fund perform?
• For the six-month period ended July 31, 2011, the Fund outperformed its
benchmark, the S&P MidCap 400® Value Index.
What factors influenced performance?
• During the period, performance benefited from an overweight position rel-
ative to the benchmark and stock selection in the energy sector, where
the Fund’s oil-related holdings contributed significantly to performance.
Stock selection also added value in information technology (IT), with
notable outperformance coming from select video game companies. An
overweight and stock selection in health care was a source of value, with
holdings performing well in health care providers & services, health care
equipment & supplies and biotechnology. Similarly positioning within
financials added value, as our bias toward thrifts and consumer finance
and away from banks and capital markets proved successful. Additionally,
stock selection among insurance companies and within materials added
value, with a handful of strong performers across industries ranging from
mining to chemicals to paper & packaging.
• Conversely, stock selection in industrials was a modest detractor, espe-
cially in airlines, machinery and railroads. Additionally, the Fund’s under-
weights in utilities and consumer staples detracted.
Describe recent portfolio activity.
• During the six-month period, we trimmed holdings in software
companies within IT. We exited biotechnology within health care,
where we trimmed health care suppliers and health care providers.
In financials, we reduced exposure to thrifts, eliminating New York
Community Bancorp, Inc. We modestly increased exposure to
chemicals and packaging companies within materials and
increased exposure to cash.
• Individual additions of note included Forest City Enterprises, Inc.,
Class A and Corporate Office Properties Trust in the real estate man-
agement and real estate investment trust groups, respectively. We
added Fidelity National Title Group, Inc., Class A as part of a reposi-
tioning in insurance. In telecommunication services, we added
CenturyLink, Inc. and eliminated Qwest Communications International,
Inc. In health care, we sold Kinetic Concepts, Inc. and reduced
DENTSPLY International, Inc.
Describe portfolio positioning at period end.
• At the end of the period, the Fund was underweight relative to the
benchmark in financials, industrials, utilities and consumer staples,
and overweight in health care, energy and IT. During this volatile
period, cash added to performance, as cash balances were increased
during the period, cushioning performance during the declining
markets near the end of the period.
The views expressed reflect the opinions of BlackRock as of the date of this report and are subject to change based on changes in market, economic or other conditions.
These views are not intended to be a forecast of future events and are no guarantee of future results.
| Portfolio Information | |
| Percent of | |
| Long-Term | |
| Ten Largest Holdings | Investments |
| Omnicare, Inc. | 2% |
| Coventry Health Care, Inc. | 2 |
| CareFusion Corp. | 2 |
| Pharmaceutical Product Development, Inc. | 2 |
| Health Net, Inc. | 2 |
| Corporate Office Properties Trust | 1 |
| HollyFrontier Corp. | 1 |
| SM Energy Co. | 1 |
| Forest City Enterprises, Inc., Class A | 1 |
| OGE Energy Corp. | 1 |
| Percent of | |
| Long-Term | |
| Sector Allocations | Investments |
| Financials | 22% |
| Industrials | 13 |
| Information Technology | 13 |
| Health Care | 11 |
| Energy | 11 |
| Consumer Discretionary | 10 |
| Utilities | 9 |
| Materials | 7 |
| Consumer Staples | 3 |
| Telecommunication Services | 1 |
For Fund compliance purposes, the Fund's sector classifications refer to any one
or more of the sector sub-classifications used by one or more widely recognized
market indexes or ratings group indexes, and/or as defined by Fund management.
These definitions may not apply for purposes of this report, which may combine
sector sub-classifications for reporting ease.
| 4 | BLACKROCK MID CAP VALUE OPPORTUNITIES FUND | JULY 31, 2011 |
Total Return Based on a $10,000 Investment
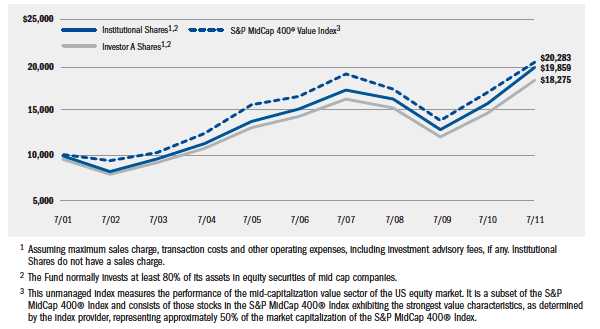
Performance Summary for the Period Ended July 31, 2011
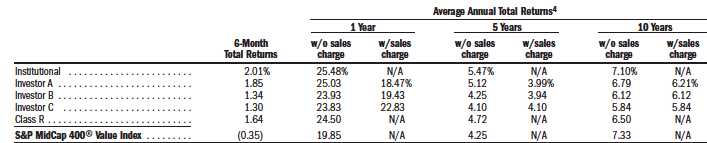
4 Assuming maximum sales charges, if any. Average annual total returns with and without sales charges reflect reductions for distribution and service fees. See “About Fund
Performance” on page 6 for a detailed description of share classes, including any related sales charges and fees.
N/A — Not applicable as share class and index do not have a sales charge.
Past performance is not indicative of future results.
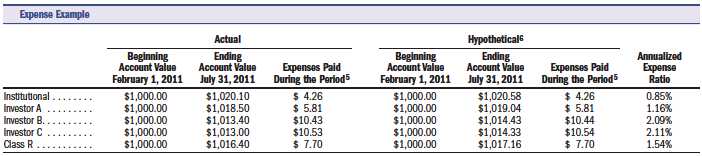
5 For each class of the Fund, expenses are equal to the annualized expense ratio for the class, multiplied by the average account value over the period, multiplied by 181/365
(to reflect the one-half year period shown).
6 Hypothetical 5% annual return before expenses is calculated by pro rating the number of days in the most recent fiscal half year divided by 365.
See “Disclosure of Expenses” on page 6 for further information on how expenses were calculated.
| BLACKROCK MID CAP VALUE OPPORTUNITIES FUND | JULY 31, 2011 | 5 |
About Fund Performance
• Institutional Shares are not subject to any sales charge. Institutional
Shares bear no ongoing distribution or service fees and are available only
to eligible investors.
• Investor A Shares incur a maximum initial sales charge (front-end load)
of 5.25% and a service fee of 0.25% per year (but no distribution fee).
• Investor B Shares are subject to a maximum contingent deferred sales
charge of 4.50% declining to 0% after six years. In addition, Investor B
Shares are subject to a distribution fee of 0.75% per year and a service
fee of 0.25% per year. These shares automatically convert to Investor A
Shares after approximately eight years. (There is no initial sales charge
for automatic share conversions.) All returns for periods greater than
eight years reflect this conversion. Investor B Shares are only available
through exchanges, dividend reinvestment by existing shareholders or
for purchase by certain qualified employee benefit plans.
• Investor C Shares are subject to a 1.00% contingent deferred sales
charge if redeemed within one year of purchase. In addition, Investor C
Shares are subject to a distribution fee of 0.75% and a service fee of
0.25% per year.
• Class R Shares do not incur a maximum initial sales charge (front-end
load) or deferred sales charge. These shares are subject to a distribution
fee of 0.25% per year and a service fee of 0.25% per year. Class R
Shares are available only to certain retirement plans. Prior to February
4, 2003, Class R Share performance results are those of Institutional
Shares (which have no distribution or service fees) restated to reflect
Class R Share fees.
Performance information reflects past performance and does not guaran-
tee future results. Current performance may be lower or higher than the
performance data quoted. Refer to www.blackrock.com/funds to obtain
performance data current to the most recent month end. Performance
results do not reflect the deduction of taxes that a shareholder would
pay on fund distributions or the redemption of fund shares. Figures shown
in the performance table on the previous page assume reinvestment of all
dividends and capital gain distributions, if any, at net asset value on the
ex-dividend date. Investment return and principal value of shares
will fluctuate so that shares, when redeemed, may be worth more or less
than their original cost. Dividends paid to each class of shares will vary
because of the different levels of service, distribution and transfer agency
fees applicable to each class, which are deducted from the income avail-
able to be paid to shareholders. The Fund’s investment advisor waived a
portion of its investment advisory fee. Without such waiver, the Fund’s
performance would have been lower.
Disclosure of Expenses
Shareholders of this Fund may incur the following charges: (a) expenses
related to transactions, including sales charges and exchange fees; and
(b) operating expenses including advisory fees, service and distribution
fees, including 12b-1 fees, and other Fund expenses. The expense exam-
ple on the previous page (which is based on a hypothetical investment
of $1,000 invested on February 1, 2011 and held through July 31, 2011)
is intended to assist shareholders both in calculating expenses based on
an investment in the Fund and in comparing these expenses with similar
costs of investing in other mutual funds.
The table provides information about actual account values and actual
expenses. In order to estimate the expenses a shareholder paid during the
period covered by this report, shareholders can divide their account value
by $1,000 and then multiply the result by the number corresponding
to their share class under the heading entitled “Expenses Paid During
the Period.”
The table also provides information about hypothetical account values
and hypothetical expenses based on the Fund’s actual expense ratio and
an assumed rate of return of 5% per year before expenses. In order to
assist shareholders in comparing the ongoing expenses of investing in this
Fund and other funds, compare the 5% hypothetical example with the 5%
hypothetical examples that appear in other funds’ shareholder reports.
The expenses shown in the table are intended to highlight shareholders’
ongoing costs only and do not reflect any transactional expenses, such as
sales charges or exchange fees, if any. Therefore, the hypothetical example
is useful in comparing ongoing expenses only, and will not help share-
holders determine the relative total expenses of owning different funds.
If these transactional expenses were included, shareholder expenses
would have been higher.
| 6 | BLACKROCK MID CAP VALUE OPPORTUNITIES FUND | JULY 31, 2011 |
Schedule of Investments July 31, 2011 (Unaudited)
(Percentages shown are based on Net Assets)
| Common Stocks | Shares | Value |
| Aerospace & Defense — 2.1% | ||
| Alliant Techsystems, Inc. | 49,000 | $ 3,196,270 |
| Curtiss-Wright Corp. | 72,900 | 2,329,884 |
| Spirit Aerosystems Holdings, Inc., Class A (a) | 77,500 | 1,587,975 |
| Textron, Inc. | 72,000 | 1,665,360 |
| 8,779,489 | ||
| Airlines — 0.5% | ||
| Delta Air Lines, Inc. (a) | 284,300 | 2,243,127 |
| Auto Components — 0.6% | ||
| TRW Automotive Holdings Corp. (a) | 52,500 | 2,649,675 |
| Automobiles — 0.3% | ||
| Thor Industries, Inc. | 56,100 | 1,387,353 |
| Capital Markets — 0.2% | ||
| Raymond James Financial, Inc. | 20,400 | 647,904 |
| Chemicals — 2.4% | ||
| Cytec Industries, Inc. | 76,700 | 4,295,200 |
| FMC Corp. | 44,600 | 3,905,622 |
| Huntsman Corp. | 93,600 | 1,787,760 |
| 9,988,582 | ||
| Commercial Banks — 5.6% | ||
| Associated Banc-Corp. | 212,200 | 2,896,530 |
| BancorpSouth, Inc. | 169,800 | 2,299,092 |
| Bank of Hawaii Corp. | 60,100 | 2,693,081 |
| City National Corp. | 16,100 | 864,248 |
| Commerce Bancshares, Inc. | 71,295 | 2,916,679 |
| Cullen/Frost Bankers, Inc. | 47,400 | 2,553,912 |
| East-West Bancorp, Inc. | 111,800 | 2,075,008 |
| Fulton Financial Corp. | 313,800 | 3,185,070 |
| TCF Financial Corp. | 38,700 | 492,264 |
| Valley National Bancorp | 249,520 | 3,281,188 |
| 23,257,072 | ||
| Communications Equipment — 1.3% | ||
| Brocade Communications Systems, Inc. (a)(b) | 472,600 | 2,589,848 |
| Motorola Mobility Holdings, Inc. (a) | 136,600 | 3,057,108 |
| 5,646,956 | ||
| Computers & Peripherals — 0.8% | ||
| NCR Corp. (a) | 170,600 | 3,403,470 |
| Construction & Engineering — 1.3% | ||
| Jacobs Engineering Group, Inc. (a) | 48,900 | 1,913,946 |
| KBR, Inc. | 30,000 | 1,069,500 |
| URS Corp. (a) | 64,100 | 2,617,203 |
| 5,600,649 | ||
| Construction Materials — 0.5% | ||
| Martin Marietta Materials, Inc. | 25,100 | 1,898,062 |
| Consumer Finance — 0.4% | ||
| Discover Financial Services, Inc. | 71,000 | 1,818,310 |
| Containers & Packaging — 2.2% | ||
| Bemis Co. | 80,700 | 2,550,120 |
| Owens-Illinois, Inc. (a) | 166,200 | 3,850,854 |
| Sonoco Products Co. | 81,400 | 2,608,870 |
| 9,009,844 | ||
| Distributors — 0.3% | ||
| Genuine Parts Co. | 23,400 | 1,243,944 |
| Diversified Consumer Services — 0.3% | ||
| Regis Corp. | 79,300 | 1,177,605 |
| Common Stocks | Shares | Value |
| Diversified Telecommunication Services — 0.8% | ||
| CenturyLink, Inc. | 92,706 | $ 3,440,320 |
| Electric Utilities — 2.0% | ||
| DPL, Inc. | 14,300 | 432,575 |
| Hawaiian Electric Industries, Inc. | 79,000 | 1,848,600 |
| Northeast Utilities, Inc. | 99,500 | 3,383,000 |
| Pinnacle West Capital Corp. | 64,900 | 2,748,515 |
| 8,412,690 | ||
| Electrical Equipment — 0.7% | ||
| Ametek, Inc. | 68,300 | 2,902,750 |
| Electronic Equipment, Instruments | ||
| & Components — 3.2% | ||
| Arrow Electronics, Inc. (a) | 87,400 | 3,037,150 |
| Avnet, Inc. (a) | 113,200 | 3,316,760 |
| Ingram Micro, Inc., Class A (a) | 148,400 | 2,752,820 |
| Jabil Circuit, Inc. | 131,600 | 2,409,596 |
| Molex, Inc. | 74,900 | 1,758,652 |
| 13,274,978 | ||
| Energy Equipment & Services — 3.3% | ||
| C & J Energy Services, Inc. (a) | 17,500 | 533,750 |
| Dresser-Rand Group, Inc. (a)(b) | 97,900 | 5,229,818 |
| Patterson-UTI Energy, Inc. | 120,600 | 3,923,118 |
| Superior Energy Services, Inc. (a) | 101,100 | 4,194,639 |
| 13,881,325 | ||
| Food Products — 0.8% | ||
| The J.M. Smucker Co. | 24,100 | 1,877,872 |
| Smithfield Foods, Inc. (a) | 75,600 | 1,664,712 |
| 3,542,584 | ||
| Gas Utilities — 1.1% | ||
| Energen Corp. | 45,200 | 2,658,212 |
| UGI Corp. | 65,900 | 1,996,770 |
| 4,654,982 | ||
| Health Care Equipment & Supplies — 2.4% | ||
| Alere Inc. (a) | 95,500 | 2,816,295 |
| CareFusion Corp. (a) | 247,000 | 6,518,330 |
| DENTSPLY International, Inc. | 19,100 | 723,699 |
| 10,058,324 | ||
| Health Care Providers & Services — 6.9% | ||
| Coventry Health Care, Inc. (a) | 205,300 | 6,569,600 |
| Health Net, Inc. (a) | 218,300 | 6,138,596 |
| Omnicare, Inc. | 266,500 | 8,128,250 |
| Owens & Minor, Inc. | 107,100 | 3,266,550 |
| Tenet Healthcare Corp. (a) | 841,000 | 4,675,960 |
| 28,778,956 | ||
| Hotels, Restaurants & Leisure — 1.4% | ||
| Darden Restaurants, Inc. | 43,900 | 2,230,120 |
| Dunkin' Brands Group, Inc. (a) | 17,200 | 497,596 |
| Wyndham Worldwide Corp. | 86,300 | 2,985,117 |
| 5,712,833 | ||
| Household Durables — 2.3% | ||
| Jarden Corp. | 67,100 | 2,079,429 |
| KB Home | 95,400 | 809,946 |
| Lennar Corp., Class A | 132,300 | 2,340,387 |
| NVR, Inc. (a) | 3,000 | 2,040,270 |
| Newell Rubbermaid, Inc. | 162,200 | 2,517,344 |
| 9,787,376 |
See Notes to Financial Statements.
| BLACKROCK MID CAP VALUE OPPORTUNITIES FUND | JULY 31, 2011 | 7 |
Schedule of Investments (continued)
(Percentages shown are based on Net Assets)
| Common Stocks | Shares | Value |
| Household Products — 1.7% | ||
| Church & Dwight Co., Inc. | 55,200 | $ 2,226,768 |
| Clorox Co. | 19,300 | 1,381,687 |
| Energizer Holdings, Inc. (a) | 43,200 | 3,483,648 |
| 7,092,103 | ||
| IT Services — 1.5% | ||
| Acxiom Corp. (a) | 150,600 | 2,069,244 |
| Amdocs Ltd. (a) | 76,400 | 2,408,892 |
| Convergys Corp. (a) | 135,200 | 1,681,888 |
| 6,160,024 | ||
| Insurance — 6.9% | ||
| American Financial Group, Inc. | 69,500 | 2,361,610 |
| Brown & Brown, Inc. | 72,000 | 1,570,320 |
| CNA Financial Corp. | 85,100 | 2,343,654 |
| Everest Re Group Ltd. | 25,300 | 2,077,636 |
| Fidelity National Title Group, Inc., Class A | 263,300 | 4,291,790 |
| HCC Insurance Holdings, Inc. | 84,000 | 2,530,920 |
| Old Republic International Corp. | 95,400 | 995,976 |
| ProAssurance Corp. (a) | 40,600 | 2,827,790 |
| Reinsurance Group of America, Inc. | 51,300 | 2,986,173 |
| Transatlantic Holdings, Inc. | 26,300 | 1,346,823 |
| Unum Group | 52,400 | 1,278,036 |
| W.R. Berkley Corp. | 134,700 | 4,147,413 |
| 28,758,141 | ||
| Internet Software & Services — 1.0% | ||
| IAC/InterActiveCorp. (a) | 96,700 | 4,002,413 |
| Leisure Equipment & Products — 0.8% | ||
| Mattel, Inc. | 127,200 | 3,391,152 |
| Life Sciences Tools & Services — 1.5% | ||
| Pharmaceutical Product Development, Inc. | 215,000 | 6,198,450 |
| Machinery — 6.8% | ||
| AGCO Corp. (a) | 60,800 | 2,883,136 |
| Dover Corp. | 69,900 | 4,226,853 |
| Harsco Corp. | 82,900 | 2,272,289 |
| IDEX Corp. | 64,700 | 2,683,756 |
| Kennametal, Inc. | 70,700 | 2,787,701 |
| Navistar International Corp. (a) | 27,900 | 1,431,549 |
| Parker Hannifin Corp. | 46,100 | 3,642,822 |
| SPX Corp. | 41,500 | 3,122,460 |
| Terex Corp. (a) | 64,400 | 1,430,324 |
| Timken Co. | 88,800 | 3,877,896 |
| 28,358,786 | ||
| Media — 0.4% | ||
| Harte-Hanks, Inc. | 227,500 | 1,858,675 |
| Metals & Mining — 1.7% | ||
| Carpenter Technology Corp. | 55,200 | 3,170,688 |
| Cliffs Natural Resources, Inc. | 42,400 | 3,808,368 |
| 6,979,056 | ||
| Multi-Utilities — 4.9% | ||
| Alliant Energy Corp. | 94,622 | 3,729,053 |
| MDU Resources Group, Inc. | 190,700 | 4,111,492 |
| NSTAR | 42,400 | 1,879,592 |
| OGE Energy Corp. | 108,400 | 5,424,336 |
| Vectren Corp. | 115,600 | 3,052,996 |
| Wisconsin Energy Corp. | 72,400 | 2,219,060 |
| 20,416,529 |
| Common Stocks | Shares | Value |
| Multiline Retail — 0.3% | ||
| Dollar Tree, Inc. (a) | 20,800 | $ 1,377,584 |
| Oil, Gas & Consumable Fuels — 7.0% | ||
| Arch Coal, Inc. | 62,500 | 1,600,000 |
| Bill Barrett Corp. (a) | 52,000 | 2,587,520 |
| Cabot Oil & Gas Corp., Class A | 34,600 | 2,563,168 |
| HollyFrontier Corp. | 77,678 | 5,856,123 |
| Oasis Petroleum, Inc. (a) | 133,200 | 3,934,728 |
| PetroHawk Energy Corp. (a) | 68,800 | 2,627,472 |
| SM Energy Co. | 76,700 | 5,779,345 |
| Whiting Petroleum Corp. (a) | 77,300 | 4,529,780 |
| 29,478,136 | ||
| Paper & Forest Products — 0.6% | ||
| MeadWestvaco Corp. | 81,700 | 2,544,138 |
| Professional Services — 0.3% | ||
| Manpower, Inc. | 21,000 | 1,060,920 |
| Real Estate Investment Trusts (REITs) — 6.0% | ||
| American Campus Communities, Inc. | 89,500 | 3,331,190 |
| BioMed Realty Trust, Inc. | 236,000 | 4,630,320 |
| CommonWealth REIT | 129,875 | 3,067,647 |
| Corporate Office Properties Trust | 189,800 | 5,897,086 |
| Dupont Fabros Technology, Inc. | 113,400 | 2,890,566 |
| Kilroy Realty Corp. | 79,400 | 3,063,252 |
| The Macerich Co. | 243 | 12,911 |
| Omega Healthcare Investors, Inc. | 114,800 | 2,254,672 |
| 25,147,644 | ||
| Real Estate Management & Development — 1.3% | ||
| Forest City Enterprises, Inc., Class A (a) | 306,000 | 5,511,060 |
| Road & Rail — 0.5% | ||
| Con-way, Inc. | 59,600 | 2,182,552 |
| Semiconductors & Semiconductor | ||
| Equipment — 1.5% | ||
| Advanced Micro Devices, Inc. (a) | 235,800 | 1,730,772 |
| Microchip Technology, Inc. | 48,400 | 1,633,500 |
| RF Micro Devices, Inc. (a) | 405,300 | 2,735,775 |
| 6,100,047 | ||
| Software — 2.8% | ||
| CA, Inc. | 108,200 | 2,412,860 |
| Electronic Arts, Inc. (a) | 140,200 | 3,119,450 |
| Nuance Communications, Inc. (a) | 170,700 | 3,415,707 |
| Synopsys, Inc. (a) | 89,500 | 2,145,315 |
| TIBCO Software, Inc. (a) | 23,300 | 606,732 |
| 11,700,064 | ||
| Specialty Retail — 1.8% | ||
| Foot Locker, Inc. | 63,357 | 1,376,748 |
| Guess?, Inc. | 55,000 | 2,096,600 |
| Limited Brands, Inc. | 92,800 | 3,513,408 |
| RadioShack Corp. | 49,707 | 691,921 |
| 7,678,677 | ||
| Textiles, Apparel & Luxury Goods — 0.8% | ||
| Phillips-Van Heusen Corp. | 45,100 | 3,226,905 |
| Thrifts & Mortgage Finance — 0.5% | ||
| First Niagara Financial Group, Inc. | 102,500 | 1,255,625 |
| Washington Federal, Inc. | 42,300 | 715,293 |
| 1,970,918 |
See Notes to Financial Statements.
| 8 | BLACKROCK MID CAP VALUE OPPORTUNITIES FUND | JULY 31, 2011 |
Schedule of Investments (concluded)
(Percentages shown are based on Net Assets)
| Common Stocks | Shares | Value |
| Water Utilities — 0.5% | ||
| Aqua America, Inc. | 90,900 | $ 1,922,534 |
| Total Long-Term Investments | ||
| (Cost — $321,630,854) — 94.8% | 396,315,668 | |
| Short-Term Securities | ||
| BlackRock Liquidity Funds, TempFund, | ||
| Institutional Class, 0.06% (c)(d) | 17,031,103 | 17,031,103 |
| Beneficial | ||
| Interest | ||
| (000) | ||
| BlackRock Liquidity Series, LLC Money Market | ||
| Series, 0.09% (c)(d)(e) | $941 | 940,500 |
| Total Short-Term Securities | ||
| (Cost — $17,971,603) — 4.3% | 17,971,603 | |
| Total Investments (Cost — $339,602,457*) — 99.1% | 414,287,271 | |
| Other Assets Less Liabilities — 0.9% | 3,826,913 | |
| Net Assets — 100.0% | $ 418,114,184 | |
| * The cost and unrealized appreciation (depreciation) of investments as of July 31, | |
| 2011, as computed for federal income tax purposes, were as follows: | |
| Aggregate cost | $ 342,451,439 |
| Gross unrealized appreciation | $ 82,609,010 |
| Gross unrealized depreciation | (10,773,178) |
| Net unrealized appreciation | $ 71,835,832 |
(a) Non-income producing security.
(b) Security, or a portion of security, is on loan.
(c) Investments in companies considered to be an affiliate of the Fund during the
period, for purposes of Section 2(a)(3) of the Investment Company Act of 1940,
as amended, were as follows:
| Shares/Beneficial | Shares/Beneficial | |||
| Interest Held at | Net | Interest Held at | ||
| Affiliate | January 31, 2011 | Activity | July 31, 2011 | Income |
| BlackRock | ||||
| Liquidity Funds, | ||||
| TempFund, | ||||
| Institutional | ||||
| Class | 6,880,283 | 10,150,820 | 17,031,103 | $ 7,846 |
| BlackRock | ||||
| Liquidity | ||||
| Series, LLC | ||||
| Money Market | ||||
| Series | $11,316,050 $(10,375,550) $ 940,500 | $ 5,332 | ||
(d) Represents the current yield as of report date.
(e) Security was purchased with the cash collateral from loaned securities.
• For Fund compliance purposes, the Fund’s industry classifications refer to any one
or more of the industry sub-classifications used by one or more widely recognized
market indexes or ratings group indexes, and/or as defined by Fund management.
These definitions may not apply for purposes of this report, which may combine
such industry sub-classifications for reporting ease.
• Fair Value Measurements — Various inputs are used in determining the fair value
of investments. These inputs are categorized in three broad levels for financial
statement purposes as follows:
• Level 1 — price quotations in active markets/exchanges for identical assets
and liabilities
• Level 2 — other observable inputs (including, but not limited to: quoted prices
for similar assets or liabilities in markets that are active, quoted prices for iden-
tical or similar assets or liabilities in markets that are not active, inputs other
than quoted prices that are observable for the assets or liabilities (such as
interest rates, yield curves, volatilities, prepayment speeds, loss severities,
credit risks and default rates) or other market-corroborated inputs)
• Level 3 — unobservable inputs based on the best information available in the
circumstances, to the extent observable inputs are not available (including the
Fund’s own assumptions used in determining the fair value of investments)
The categorization of a value determined for investments is based on the pricing
transparency of the investment and does not necessarily correspond to the
Fund’s perceived risk of investing in those securities. For information about the
Fund’s policy regarding valuation of investments and other significant accounting
policies, please refer to Note 1 of the Notes to Financial Statements.
The following table summarizes the inputs used as of July 31, 2011 in
determining the fair valuation of the Fund’s investments:
| Valuation Inputs | Level 1 | Level 2 | Level 3 | Total |
| Assets: | ||||
| Investments: | ||||
| Long-Term | ||||
| Investments1 | $396,315,668 | — | — | $396,315,668 |
| Short-Term | ||||
| Securities | 17,031,103 | $ 940,500 | — | 17,971,603 |
| Total | $413,346,771 | $ 940,500 | — | $414,287,271 |
1 See above Schedule of Investments for values in each industry.
See Notes to Financial Statements.
| BLACKROCK MID CAP VALUE OPPORTUNITIES FUND | JULY 31, 2011 | 9 |
| Statement of Assets and Liabilities | |
| July 31, 2011 (Unaudited) | |
| Assets | |
| Investments at value — unaffiliated (including securities loaned of $861,176) (cost — $321,630,854) | $ 396,315,668 |
| Investments at value — affiliated (cost — $17,971,603) | 17,971,603 |
| Investments sold receivable | 8,338,819 |
| Capital shares sold receivable | 996,486 |
| Dividends receivable | 284,970 |
| Securities lending income receivable — affiliated | 150 |
| Prepaid expenses | 6,577 |
| Total assets | 423,914,273 |
| Liabilities | |
| Collateral on securities loaned at value | 940,500 |
| Capital shares redeemed payable | 1,708,981 |
| Investments purchased payable | 2,507,455 |
| Investment advisory fees payable | 241,237 |
| Service and distribution fees payable | 137,246 |
| Other affiliates payable | 1,932 |
| Officer's and Directors' fees payable | 445 |
| Other accrued expenses payable | 262,293 |
| Total liabilities | 5,800,089 |
| Net Assets | $ 418,114,184 |
| Net Assets Consist of | |
| Paid-in capital | $ 403,111,045 |
| Undistributed net investment income | 509,414 |
| Accumulated net realized loss | (60,191,089) |
| Net unrealized appreciation/depreciation | 74,684,814 |
| Net Assets | $ 418,114,184 |
| Net Asset Value | |
| Institutional — Based on net assets of $95,222,886 and 5,370,804 shares outstanding, 20 million shares authorized, $0.10 par value | $ 17.73 |
| Investor A — Based on net assets of $181,483,925 and 10,499,295 shares outstanding, 40 million shares authorized, $0.10 par value | $ 17.29 |
| Investor B — Based on net assets of $7,294,488 and 458,685 shares outstanding, 40 million shares authorized, $0.10 par value | $ 15.90 |
| Investor C — Based on net assets of $68,874,598 and 4,417,596 shares outstanding, 40 million shares authorized, $0.10 par value | $ 15.59 |
| Class R — Based on net assets of $65,238,287 and 4,049,830 shares outstanding, 40 million shares authorized, $0.10 par value | $ 16.11 |
See Notes to Financial Statements.
| 10 | BLACKROCK MID CAP VALUE OPPORTUNITIES FUND | JULY 31, 2011 |
| Statement of Operations | |
| Six Months Ended July 31, 2011 (Unaudited) | |
| Investment Income | |
| Dividends — unaffiliated | $ 3,376,206 |
| Dividends — affiliated | 7,846 |
| Securities lending — affiliated | 5,332 |
| Total income | 3,389,384 |
| Expenses | |
| Investment advisory | 1,384,675 |
| Service — Investor A | 226,697 |
| Service and distribution — Investor B | 40,392 |
| Service and distribution — Investor C | 360,659 |
| Service and distribution — Class R | 180,094 |
| Transfer agent — Institutional | 55,823 |
| Transfer agent — Investor A | 159,059 |
| Transfer agent — Investor B | 14,786 |
| Transfer agent — Investor C | 140,831 |
| Transfer agent — Class R | 112,853 |
| Accounting services | 43,266 |
| Professional | 42,377 |
| Printing | 39,942 |
| Registration | 37,752 |
| Custodian | 19,233 |
| Officer and Directors | 10,700 |
| Miscellaneous | 15,344 |
| Total expenses | 2,884,483 |
| Less fees waived by advisor | (4,515) |
| Total expenses after fees waived | 2,879,968 |
| Net investment income | 509,416 |
| Realized and Unrealized Gain | |
| Net realized gain from investments | 22,561,767 |
| Net change in unrealized appreciation/depreciation on investments | (17,466,464) |
| Total realized and unrealized gain | 5,095,303 |
| Net Increase in Net Assets Resulting from Operations | $ 5,604,719 |
See Notes to Financial Statements.
| BLACKROCK MID CAP VALUE OPPORTUNITIES FUND | JULY 31, 2011 | 11 |
| Statements of Changes in Net Assets | ||
| Six Months | ||
| Ended | Year Ended | |
| July 31, 2011 | January 31, | |
| Increase (Decrease) in Net Assets: | ( Unaudited) | 2011 |
| Operations | ||
| Net investment income | $ 509,416 | $ 1,212,981 |
| Net realized gain | 22,561,767 | 30,099,830 |
| Net change in unrealized appreciation/depreciation | (17,466,464) | 60,509,284 |
| Net increase in net assets resulting from operations | 5,604,719 | 91,822,095 |
| Dividends to Shareholders From | ||
| Net investment income: | ||
| Institutional | (569,780) | — |
| Investor A | (706,648) | — |
| Decrease in net assets resulting from dividends to shareholders | (1,276,428) | — |
| Capital Share Transactions | ||
| Net increase in net assets derived from capital share transactions | 27,102,990 | 12,995,785 |
| Net Assets | ||
| Total increase in net assets | 31,431,281 | 104,817,880 |
| Beginning of period | 386,682,903 | 281,865,023 |
| End of period | $ 418,114,184 | $ 386,682,903 |
| Undistributed net investment income | $ 509,414 | $ 1,276,426 |
See Notes to Financial Statements.
| 12 | BLACKROCK MID CAP VALUE OPPORTUNITIES FUND | JULY 31, 2011 |
| Financial Highlights | |||||||
| Institutional | |||||||
| Six Months | |||||||
| Ended | |||||||
| July 31, 2011 | Year Ended January 31, | ||||||
| (Unaudited) | 2011 | 2010 | 2009 | 2008 | 2007 | ||
| Per Share Operating Performance | |||||||
| Net asset value, beginning of period | $ 17.48 | $ 13.08 | $ 9.37 | $ 14.80 | $ 18.79 | $ 19.89 | |
| Net investment income1 | 0.07 | 0.14 | 0.06 | 0.11 | 0.05 | 0.05 | |
| Net realized and unrealized gain (loss) | 0.29 | 4.26 | 3.73 | (5.42) | (0.81) | 1.79 | |
| Net increase (decrease) from investment operations | 0.36 | 4.40 | 3.79 | (5.31) | (0.76) | 1.84 | |
| Dividends and distributions from: | |||||||
| Net investment income | (0.11) | — | (0.08) | — | — | — | |
| Net realized gain | — | — | — | (0.12) | (3.23) | (2.94) | |
| Total dividends and distributions | (0.11) | — | (0.08) | (0.12) | (3.23) | (2.94) | |
| Net asset value, end of period | $ 17.73 | $ 17.48 | $ 13.08 | $ 9.37 | $ 14.80 | $ 18.79 | |
| Total Investment Return2 | |||||||
| Based on net asset value | 2.01%3 | 33.64% | 40.63%4 | (36.16)% | (5.36)% | 10.09% | |
| Ratios to Average Net Assets | |||||||
| Total expenses | 0.87%5 | 0.94% | 1.04% | 0.98% | 0.93% | 1.01% | |
| Total expenses after fees waived | 0.86%5 | 0.94% | 1.04% | 0.98% | 0.93% | 1.01% | |
| Net investment income | 0.72%5 | 0.93% | 0.53% | 0.84% | 0.29% | 0.28% | |
| Supplemental Data | |||||||
| Net assets, end of period (000) | $ 95,223 | $ 83,905 | $ 60,549 | $ 46,590 | $ 78,988 | $ 105,207 | |
| Portfolio turnover | 30% | 54% | 106% | 154% | 148% | 99% | |
1 Based on average shares outstanding.
2 Where applicable, total investment returns exclude the effects of any sales charges and include the reinvestment of dividends and distributions.
3 Aggregate total investment return.
4 Includes proceeds received from a settlement of litigation, which impacted the Fund’s total investment return. Not including these proceeds, the total investment return would
have been 40.20%.
5 Annualized.
See Notes to Financial Statements.
| BLACKROCK MID CAP VALUE OPPORTUNITIES FUND | JULY 31, 2011 | 13 |
| Financial Highlights (continued) | |||||||
| Investor A | |||||||
| Six Months | |||||||
| Ended | |||||||
| July 31, 2011 | Year Ended January 31, | ||||||
| (Unaudited) | 2011 | 2010 | 2009 | 2008 | 2007 | ||
| Per Share Operating Performance | |||||||
| Net asset value, beginning of period | $ 17.04 | $ 12.79 | $ 9.16 | $ 14.52 | $ 18.49 | $ 19.63 | |
| Net investment income (loss)1 | 0.04 | 0.09 | 0.02 | 0.06 | (0.00)2 | 0.003 | |
| Net realized and unrealized gain (loss) | 0.28 | 4.16 | 3.65 | (5.30) | (0.79) | 1.76 | |
| Net increase (decrease) from investment operations | 0.32 | 4.25 | 3.67 | (5.24) | (0.79) | 1.76 | |
| Dividends and distributions from: | |||||||
| Net investment income | (0.07) | — | (0.04) | — | — | — | |
| Net realized gain | — | — | — | (0.12) | (3.18) | (2.90) | |
| Total dividends and distributions | (0.07) | — | (0.04) | (0.12) | (3.18) | (2.90) | |
| Net asset value, end of period | $ 17.29 | $ 17.04 | $ 12.79 | $ 9.16 | $ 14.52 | $ 18.49 | |
| Total Investment Return4 | |||||||
| Based on net asset value | 1.85%5 | 33.23% | 40.10%6 | (36.39)% | (5.64)% | 9.76% | |
| Ratios to Average Net Assets | |||||||
| Total expenses | 1.18%7 | 1.28% | 1.42% | 1.36% | 1.24% | 1.26% | |
| Total expenses after fees waived | 1.17%7 | 1.28% | 1.42% | 1.36% | 1.24% | 1.26% | |
| Net investment income (loss) | 0.42%7 | 0.59% | 0.17% | 0.46% | (0.02)% | 0.00%8 | |
| Supplemental Data | |||||||
| Net assets, end of period (000) | $ 181,484 | $ 152,037 | $ 101,184 | $ 64,948 | $ 110,362 | $ 121,065 | |
| Portfolio turnover | 30% | 54% | 106% | 154% | 148% | 99% | |
1 Based on average shares outstanding.
2 Amount is less than $(0.01) per share.
3 Amount is less than $0.01 per share.
4 Where applicable, total investment returns exclude the effects of any sales charges and include the reinvestment of dividends and distributions.
5 Aggregate total investment return.
6 Includes proceeds received from a settlement of litigation, which impacted the Fund’s total investment return. Not including these proceeds, the total investment return would
have been 39.66%.
7 Annualized.
8 Amount is less than 0.01%.
See Notes to Financial Statements.
| 14 | BLACKROCK MID CAP VALUE OPPORTUNITIES FUND | JULY 31, 2011 |
| Financial Highlights (continued) | |||||||
| Investor B | |||||||
| Six Months | |||||||
| Ended | |||||||
| July 31, 2011 | Year Ended January 31, | ||||||
| (Unaudited) | 2011 | 2010 | 2009 | 2008 | 2007 | ||
| Per Share Operating Performance | |||||||
| Net asset value, beginning of period | $ 15.69 | $ 11.88 | $ 8.55 | $ 13.66 | $ 17.54 | $ 18.73 | |
| Net investment loss1 | (0.04) | (0.04) | (0.08) | (0.04) | (0.14) | (0.14) | |
| Net realized and unrealized gain (loss) | 0.25 | 3.85 | 3.41 | (4.96) | (0.74) | 1.67 | |
| Net increase (decrease) from investment operations | 0.21 | 3.81 | 3.33 | (5.00) | (0.88) | 1.53 | |
| Distributions from net realized gain | — | — | — | (0.11) | (3.00) | (2.72) | |
| Net asset value, end of period | $ 15.90 | $ 15.69 | $ 11.88 | $ 8.55 | $ 13.66 | $ 17.54 | |
| Total Investment Return2 | |||||||
| Based on net asset value | 1.34%3 | 32.07% | 38.95%4 | (36.91)% | (6.38)% | 8.94% | |
| Ratios to Average Net Assets | |||||||
| Total expenses | 2.11%5 | 2.17% | 2.26% | 2.12% | 2.04% | 2.03% | |
| Total expenses after fees waived | 2.11%5 | 2.17% | 2.26% | 2.12% | 2.04% | 2.03% | |
| Net investment loss | (0.51)%5 | (0.27)% | (0.77)% | (0.34)% | (0.83)% | (0.75)% | |
| Supplemental Data | |||||||
| Net assets, end of period (000) | $ 7,294 | $ 8,551 | $ 12,708 | $ 20,131 | $ 46,499 | $ 78,174 | |
| Portfolio turnover | 30% | 54% | 106% | 154% | 148% | 99% | |
1 Based on average shares outstanding.
2 Where applicable, total investment returns exclude the effects of any sales charges and include the reinvestment of dividends and distributions.
3 Aggregate total investment return.
4 Includes proceeds received from a settlement of litigation, which impacted the Fund’s total investment return. Not including these proceeds, the total investment return would
have been 38.60%.
5 Annualized.
See Notes to Financial Statements.
| BLACKROCK MID CAP VALUE OPPORTUNITIES FUND | JULY 31, 2011 | 15 |
| Financial Highlights (continued) | |||||||
| Investor C | |||||||
| Six Months | |||||||
| Ended | |||||||
| July 31, 2011 | Year Ended January 31, | ||||||
| (Unaudited) | 2011 | 2010 | 2009 | 2008 | 2007 | ||
| Per Share Operating Performance | |||||||
| Net asset value, beginning of period | $ 15.39 | $ 11.67 | $ 8.41 | $ 13.47 | $ 17.36 | $ 18.61 | |
| Net investment loss1 | (0.04) | (0.05) | (0.09) | (0.06) | (0.16) | (0.14) | |
| Net realized and unrealized gain (loss) | 0.24 | 3.77 | 3.35 | (4.90) | (0.72) | 1.65 | |
| Net increase (decrease) from investment operations | 0.20 | 3.72 | 3.26 | (4.96) | (0.88) | 1.51 | |
| Distributions from net realized gain | — | — | — | (0.10) | (3.01) | (2.76) | |
| Net asset value, end of period | $ 15.59 | $ 15.39 | $ 11.67 | $ 8.41 | $ 13.47 | $ 17.36 | |
| Total Investment Return2 | |||||||
| Based on net asset value | 1.30%3 | 31.88% | 38.76%4 | (37.06)% | (6.50)% | 8.90% | |
| Ratios to Average Net Assets | |||||||
| Total expenses | 2.14%5 | 2.27% | 2.48% | 2.35% | 2.15% | 2.04% | |
| Total expenses after fees waived | 2.14%5 | 2.27% | 2.47% | 2.35% | 2.15% | 2.04% | |
| Net investment loss | (0.54)%5 | (0.39)% | (0.92)% | (0.54)% | (0.93)% | (0.78)% | |
| Supplemental Data | |||||||
| Net assets, end of period (000) | $ 68,875 | $ 70,795 | $ 57,113 | $ 47,034 | $ 85,547 | $ 111,084 | |
| Portfolio turnover | 30% | 54% | 106% | 154% | 148% | 99% | |
1 Based on average shares outstanding.
2 Where applicable, total investment returns exclude the effects of any sales charges and include the reinvestment of dividends and distributions.
3 Aggregate total investment return.
4 Includes proceeds received from a settlement of litigation, which impacted the Fund’s total investment return. Not including these proceeds, the total investment return would
have been 38.29%.
5 Annualized.
See Notes to Financial Statements.
| 16 | BLACKROCK MID CAP VALUE OPPORTUNITIES FUND | JULY 31, 2011 |
| Financial Highlights (concluded) | |||||||
| Class R | |||||||
| Six Months | |||||||
| Ended | |||||||
| July 31, 2011 | Year Ended January 31, | ||||||
| (Unaudited) | 2011 | 2010 | 2009 | 2008 | 2007 | ||
| Per Share Operating Performance | |||||||
| Net asset value, beginning of period | $ 15.85 | $ 11.94 | $ 8.56 | $ 13.63 | $ 17.58 | $ 18.81 | |
| Net investment income (loss)1 | 0.002 | 0.03 | (0.02) | 0.01 | (0.07) | (0.05) | |
| Net realized and unrealized gain (loss) | 0.26 | 3.88 | 3.40 | (4.97) | (0.74) | 1.69 | |
| Net increase (decrease) from investment operations | 0.26 | 3.91 | 3.38 | (4.96) | (0.81) | 1.64 | |
| Dividends and distributions from: | |||||||
| Net investment income | — | — | (0.00)3 | — | — | — | |
| Net realized gain | — | — | — | (0.11) | (3.14) | (2.87) | |
| Total dividends and distributions | — | — | (0.00) | (0.11) | (3.14) | (2.87) | |
| Net asset value, end of period | $ 16.11 | $ 15.85 | $ 11.94 | $ 8.56 | $ 13.63 | $ 17.58 | |
| Total Investment Return4 | |||||||
| Based on net asset value | 1.64%5 | 32.75% | 39.50%6 | (36.66)% | (6.02)% | 9.55% | |
| Ratios to Average Net Assets | |||||||
| Total expenses | 1.56%7 | 1.65% | 1.81% | 1.78% | 1.64% | 1.51% | |
| Total expenses after fees waived | 1.56%7 | 1.65% | 1.80% | 1.78% | 1.64% | 1.51% | |
| Net investment income (loss) | 0.04%7 | 0.22% | (0.22)% | 0.07% | (0.39)% | (0.28)% | |
| Supplemental Data | |||||||
| Net assets, end of period (000) | $ 65,238 | $ 71,394 | $ 50,310 | $ 33,540 | $ 49,550 | $ 32,476 | |
| Portfolio turnover | 30% | 54% | 106% | 154% | 148% | 99% | |
1 Based on average shares outstanding.
2 Amount is less than $0.01 per share.
3 Amount is less than $(0.01) per share.
4 Where applicable, total investment returns include the reinvestment of dividends and distributions.
5 Aggregate total investment return.
6 Includes proceeds received from a settlement of litigation, which impacted the Fund’s total investment return. Not including these proceeds, the total investment return would
have been 39.15%.
7 Annualized.
See Notes to Financial Statements.
| BLACKROCK MID CAP VALUE OPPORTUNITIES FUND | JULY 31, 2011 | 17 |
Notes to Financial Statements (Unaudited)
1. Organization and Significant Accounting Policies:
BlackRock Mid Cap Value Opportunities Fund (the “Fund”) of BlackRock
Mid Cap Value Opportunities Series, Inc. (the “Series”) is registered
under the Investment Company Act of 1940, as amended (the “1940
Act”), as a diversified, open-end management investment company. The
Fund is organized as a Maryland corporation. The Fund’s financial state-
ments are prepared in conformity with accounting principles generally
accepted in the United States of America (“US GAAP”), which may
require management to make estimates and assumptions that affect the
reported amounts and disclosures in the financial statements. Actual
results could differ from those estimates. The Fund offers multiple
classes of shares. Institutional Shares are sold without a sales charge
and only to certain eligible investors. Investor A Shares are generally sold
with a front-end sales charge. Investor B and Investor C Shares may be
subject to a contingent deferred sales charge. Class R Shares are sold
without a sales charge and only to certain retirement and other similar
plans. All classes of shares have identical voting, dividend, liquidation
and other rights and the same terms and conditions, except that Investor
A, Investor B, Investor C and Class R Shares bear certain expenses
related to the shareholder servicing of such shares, and Investor B,
Investor C and Class R Shares also bear certain expenses related to
the distribution of such shares. Investor B Shares automatically convert
to Investor A Shares after approximately eight years. Investor B Shares
are only available through exchanges, dividend reinvestment by existing
shareholders or for purchase by certain qualified employee benefit
plans. Each class has exclusive voting rights with respect to matters
relating to its shareholder servicing and distribution expenditures
(except that Investor B shareholders may vote on material changes
to the Investor A distribution and service plan).
The following is a summary of significant accounting policies followed by
the Fund:
Valuation: US GAAP defines fair value as the price the Fund would
receive to sell an asset or pay to transfer a liability in an orderly trans-
action between market participants at the measurement date. The Fund
fair values its financial instruments at market value using independent
dealers or pricing services under policies approved by the Board of
Directors (the “Board”). Equity investments traded on a recognized
securities exchange or the NASDAQ Global Market System (“NASDAQ”)
are valued at the last reported sale price that day or the NASDAQ official
closing price, if applicable. For equity investments traded on more than
one exchange, the last reported sale price on the exchange where the
stock is primarily traded is used. Equity investments traded on a recog-
nized exchange for which there were no sales on that day are valued at
the last available bid price. If no bid price is available, the prior day’s
price will be used, unless it is determined that such prior day’s price
no longer reflects the fair value of the security. Investments in open-end
registered investment companies are valued at net asset value each
business day. Short-term securities with remaining maturities of 60 days
or less may be valued at amortized cost, which approximates fair value.
The Fund values its investments in BlackRock Liquidity Series, LLC
Money Market Series (the “Money Market Series”) at fair value, which is
ordinarily based upon its pro rata ownership in the underlying fund’s net
assets. The Money Market Series seeks current income consistent with
maintaining liquidity and preserving capital. Although the Money Market
Series is not registered under the 1940 Act, its investments will follow
the parameters of investments by a money market fund that is subject to
Rule 2a-7 under the 1940 Act. The Fund may withdraw up to 25% of its
investment daily, although the manager of the Money Market Series, in
its sole discretion, may permit an investor to withdraw more than 25%
on any one day.
In the event that application of these methods of valuation results in a
price for an investment which is deemed not to be representative of the
market value of such investment or is not available, the investment will
be valued in accordance with a policy approved by the Board as reflect-
ing fair value (“Fair Value Assets”). When determining the price for Fair
Value Assets, the investment advisor and/or the sub-advisor seeks to
determine the price that the Fund might reasonably expect to receive
from the current sale of that asset in an arm’s-length transaction. Fair
value determinations shall be based upon all available factors that the
investment advisor and/or sub-advisor deems relevant. The pricing of
all Fair Value Assets is subsequently reported to the Board or a
committee thereof.
Investment Transactions and Investment Income: For financial reporting
purposes, investment transactions are recorded on the dates the trans-
actions are entered into (the trade dates). Realized gains and losses
on investment transactions are determined on the identified cost basis.
Dividend income is recorded on the ex-dividend dates. Upon notification
from issuers, some of the dividend income received from a real estate
investment trust may be redesignated as a reduction of cost of the
related investment and/or realized gain. Interest income, including
amortization and accretion of premiums and discounts on debt securi-
ties, is recognized on the accrual basis. Income and realized and unreal-
ized gains and losses are allocated daily to each class based on its
relative net assets.
Dividends and Distributions: Dividends and distributions paid by the
Fund are recorded on the ex-dividend dates. The amount and timing of
dividends and distributions are determined in accordance with federal
income tax regulations, which may differ from US GAAP.
Securities Lending: The Fund may lend securities to approved borrowers,
such as banks, brokers and other financial institutions. The borrower
pledges cash, securities issued or guaranteed by the US government or
irrevocable letters of credit issued by a bank as collateral, which will
be maintained at all times in an amount equal to at least 100% of the
18 BLACKROCK MID CAP VALUE OPPORTUNITIES FUND JULY 31, 2011
Notes to Financial Statements (continued)
current market value of the loaned securities. The market value of the
loaned securities is determined at the close of business of the Fund and
any additional required collateral is delivered to the Fund on the next
business day. Securities lending income, as disclosed in the Statement
of Operations, represents the income earned from the investment of the
cash collateral, net of rebates paid to, or fees paid by, borrowers and
less the fees paid to the securities lending agent. During the term of the
loan, the Fund earns dividends and interest on the securities loaned but
does not receive dividend or interest income on the securities received
as collateral. Loans of securities are terminable at any time and the
borrower, after notice, is required to return borrowed securities within
the standard time period for settlement of securities transactions. In the
event that the borrower defaults on its obligation to return borrowed
securities because of insolvency or for any other reason, the Fund could
experience delays and costs in gaining access to the collateral. The Fund
also could suffer a loss if the value of an investment purchased with
cash collateral falls below the market value of loaned securities or if the
value of an investment purchased with cash collateral falls below the
value of the original cash collateral received. During the six months
ended July 31, 2011, the Fund accepted only cash collateral in
connection with securities loaned.
Income Taxes: It is the Fund’s policy to comply with the requirements
of the Internal Revenue Code of 1986, as amended, applicable to
regulated investment companies and to distribute substantially all of
its taxable income to its shareholders. Therefore, no federal income
tax provision is required.
The Fund files US federal and various state and local tax returns. No
income tax returns are currently under examination. The statute of
limitations on the Fund’s US federal tax returns remains open for each
of the four years ended January 31, 2011. The statutes of limitations
on the Fund’s state and local tax returns may remain open for an
additional year depending upon the jurisdiction. Management does
not believe there are any uncertain tax positions that require
recognition of a tax liability.
Recent Accounting Standard: In May 2011, the Financial Accounting
Standards Board issued amended guidance to improve disclosure about
fair value measurements which will require the following disclosures for
fair value measurements categorized as Level 3: quantitative information
about the unobservable inputs and assumptions used in the fair value
measurement, a description of the valuation policies and procedures
and a narrative description of the sensitivity of the fair value measure-
ment to changes in unobservable inputs and the interrelationships
between those unobservable inputs. In addition, the amounts and rea-
sons for all transfers in and out of Level 1 and Level 2 will be required to
be disclosed. The amended guidance is effective for financial statements
for fiscal years beginning after December 15, 2011, and interim periods
within those fiscal years. Management is evaluating the impact of this
guidance on the Fund’s financial statements and disclosures.
Other: Expenses directly related to the Fund or its classes are charged to
the Fund or class. Other operating expenses shared by several funds are
pro rated among those funds on the basis of relative net assets or other
appropriate methods. Other expenses of the Fund are allocated daily to
each class based on its relative net assets.
The Fund has an arrangement with the custodian whereby fees may
be reduced by credits earned on uninvested cash balances, which, if
applicable, are shown as fees paid indirectly in the Statement of
Operations. The custodian imposes fees on overdrawn cash balances,
which can be offset by accumulated credits earned or may result in
additional custody charges.
2. Investment Advisory Agreement and Other Transactions
with Affiliates:
The PNC Financial Services Group, Inc. (“PNC”) and Barclays Bank
PLC (“Barclays”) are the largest stockholders of BlackRock, Inc.
(“BlackRock”). Due to the ownership structure, PNC is an affiliate
of the Fund for 1940 Act purposes, but Barclays is not.
The Series, on behalf of the Fund, entered into an Investment Advisory
Agreement with BlackRock Advisors, LLC (the “Manager”), the Fund’s
investment advisor, an indirect, wholly owned subsidiary of BlackRock,
to provide investment advisory and administration services. The Manager
is responsible for the management of the Fund’s portfolio and provides
the necessary personnel, facilities, equipment and certain other serv-
ices necessary to the operations of the Fund. For such services, from
January 1, 2011 through May 31, 2011, the Fund paid the Manager a
monthly fee at an annual rate of 0.65% of the Fund’s average daily
net assets.
Effective June 1, 2011, the Fund paid the Manager a monthly fee based
on the Fund’s average daily net assets at the following annual rates:
| Rate of | |
| Average Daily Net Assets | Advisory Fee |
| Not exceeding $1 billion | 0.65% |
| In excess of $1 billion, but not exceeding $3 billion | 0.61% |
| In excess of $3 billion, but not exceeding $5 billion | 0.59% |
| In excess of $5 billion, but not exceeding $10 billion | 0.57% |
| In excess of $10 billion | 0.55% |
The Manager voluntarily agreed to waive its investment advisory fees by
the amount of investment advisory fees the Fund pays to the Manager
indirectly through its investment in affiliated money market funds, how-
ever the Manager does not waive its investment advisory fees by the
amount of investment advisory fees paid through the Fund’s investment
in other affiliated investment companies, if any. This amount is shown as
fees waived by advisor in the Statement of Operations.
The Manager entered into a sub-advisory agreement with BlackRock
Investment Management, LLC (“BIM”), an affiliate of the Manager. The
Manager pays BIM for services it provides, a monthly fee that is a
| BLACKROCK MID CAP VALUE OPPORTUNITIES FUND | JULY 31, 2011 | 19 |
Notes to Financial Statements (continued)
percentage of the investment advisory fees paid by the Fund to
the Manager.
For the six months ended July 31, 2011, the Fund reimbursed the
Manager $1,915 for certain accounting services, which is included in
accounting services in the Statement of Operations.
The Series, on behalf of the Fund, entered into a Distribution Agreement
and Distribution and Service Plan with BlackRock Investments, LLC
(“BRIL”), an affiliate of the Manager. Pursuant to the Distribution and
Service Plan and in accordance with Rule 12b-1 under the 1940 Act,
the Fund pays BRIL ongoing service and distribution fees. The fees are
accrued daily and paid monthly at annual rates based upon the average
daily net assets of the shares of the Fund as follows:
| Service | Distribution | |
| Fee | Fee | |
| Investor A | 0.25% | — |
| Investor B | 0.25% | 0.75% |
| Investor C | 0.25% | 0.75% |
| Class R | 0.25% | 0.25% |
Pursuant to sub-agreements with BRIL, broker-dealers and BRIL provide
shareholder servicing and distribution services to the Fund. The ongoing
service and/or distribution fee compensates BRIL and each broker-
dealer for providing shareholder servicing and/or distribution related
services to Investor A, Investor B, Investor C and Class R shareholders.
For the six months ended July 31, 2011, affiliates earned underwriting
discounts, direct commissions and dealer concessions on sales of the
Fund’s Investor A Shares, which totaled $8,611.
For the six months ended July 31, 2011, affiliates received the following
contingent deferred sales charges relating to transactions in Investor B
and Investor C Shares:
| Investor B | $ 1,282 |
| Investor C | $ 1,532 |
Furthermore, affiliates received contingent deferred sales charges of
$2,651 relating to transactions subject to front-end sales charge waivers
on Investor A Shares.
The Manager maintains a call center, which is responsible for providing
certain shareholder services to the Fund, such as responding to share-
holder inquiries and processing transactions based upon instructions
from shareholders with respect to the subscription and redemption of
Fund shares. For the six months ended July 31, 2011, the Fund reim-
bursed the Manager the following amounts for costs incurred in running
the call center, which are included in transfer agent — class specific in
the Statement of Operations:
| Institutional | $ 353 |
| Investor A | $1,536 |
| Investor B | $ 146 |
| Investor C | $ 781 |
| Class R | $ 388 |
The Fund received an exemptive order from the Securities and Exchange
Commission (“SEC”) permitting it, among other things, to pay an affili-
ated securities lending agent a fee based on a share of the income
derived from the securities lending activities and has retained BIM as
the securities lending agent. BIM may, on behalf of the Fund, invest cash
collateral received by the Fund for such loans, among other things, in a
private investment company managed by the Manager or in registered
money market funds advised by the Manager or its affiliates. The market
value of securities on loan and the value of the related collateral, if
applicable, are shown in the Statement of Assets and Liabilities as secu-
rities loaned at value and collateral on securities loaned at value,
respectively. The cash collateral invested by BIM is disclosed in the
Schedule of Investments. The share of income earned by the Fund on
such investments is shown as securities lending — affiliated in the
Statement of Operations. For the six months ended July 31, 2011, BIM
received $2,302 in securities lending agent fees related to securities
lending activities for the Fund.
Certain officers and/or directors of the Fund are officers and/or directors
of BlackRock or its affiliates. The Fund reimburses the Manager for com-
pensation paid to the Fund’s Chief Compliance Officer.
3. Investments:
Purchases and sales of investments, excluding short-term securities, for
the six months ended July 31, 2011, were $135,056,989 and
$124,457,552, respectively.
4. Borrowings:
The Series, on behalf of the Fund, along with certain other funds man-
aged by the Manager and its affiliates, is a party to a $500 million credit
agreement with a group of lenders, which expires in November 2011.
The Fund may borrow under the credit agreement to fund shareholder
redemptions. The Fund pays a commitment fee of 0.08% per annum
based on the Fund’s pro rata share of the unused portion of the credit
agreement and interest at a rate equal to the higher of (a) the one-
month LIBOR plus 1.00% per annum and (b) the Fed Funds rate plus
1.00% per annum on amounts borrowed. In addition, the Fund paid
administration and arrangement fees which were allocated to the Fund
based on its net assets as of October 31, 2010. The Fund did not
borrow under the credit agreement during the six months ended
July 31, 2011.
| 20 | BLACKROCK MID CAP VALUE OPPORTUNITIES FUND | JULY 31, 2011 |
Notes to Financial Statements (continued)
5. Capital Loss Carryforwards:
As of January 31, 2011, the Fund had capital loss carryforwards avail-
able to offset future realized capital gains through the indicated expira-
tion dates as follows:
| Expires January 31, | |
| 2017 | $ 4,624,072 |
| 2018 | 75,279,802 |
| Total | $ 79,903,874 |
Under the recently enacted Regulated Investment Company
Modernization Act of 2010, capital losses incurred by the Fund after
January 31, 2011 will not be subject to expiration. In addition, these
losses must be utilized prior to the losses incurred in pre-enactment
taxable years.
6. Concentration, Market and Credit Risk:
In the normal course of business, the Fund invests in securities and
enters into transactions where risks exist due to fluctuations in the mar-
ket (market risk) or failure of the issuer of a security to meet all its obli-
gations (issuer credit risk). The value of securities held by the Fund may
decline in response to certain events, including those directly involving
the issuers whose securities are owned by the Fund; conditions affecting
the general economy; overall market changes; local, regional or global
political, social or economic instability; and currency and interest rate
and price fluctuations. Similar to issuer credit risk, the Fund may be
exposed to counterparty credit risk, or the risk that an entity with which
the Fund has unsettled or open transactions may fail to or be unable to
perform on its commitments. The Fund manages counterparty credit risk
by entering into transactions only with counterparties that it believes
have the financial resources to honor their obligations and by monitoring
the financial stability of those counterparties. Financial assets, which
potentially expose the Fund to market, issuer and counterparty credit
risks, consist principally of financial instruments and receivables due
from counterparties. The extent of the Fund’s exposure to market, issuer
and counterparty credit risks with respect to these financial assets is
generally approximated by their value recorded in the Fund’s Statement
of Assets and Liabilities, less any collateral held by the Fund.
As of July 31, 2011, the Fund invested a significant portion of its assets
in securities in the Financials sector. Changes in economic conditions
affecting the Financials sector would have a greater impact on the Fund
and could affect the value, income and/or liquidity of positions in
such securities.
7. Capital Share Transactions:
Transactions in capital shares for each class were as follows:
| Six Months Ended | Year Ended | |||
| July 31, 2011 | January 31, 2011 | |||
| Shares | Amount | Shares | Amount | |
| Institutional | ||||
| Shares sold | 1,108,700 | $ 20,177,465 | 1,439,774 | $ 22,122,137 |
| Shares issued to shareholders | ||||
| in reinvestment of dividends | 28,586 | 530,557 | — | — |
| Total issued | 1,137,286 | 20,708,022 | 1,439,774 | 22,122,137 |
| Shares redeemed | (565,603) | (10,288,465) | (1,269,170) | (18,350,018) |
| Net increase | 571,683 | $ 10,419,557 | 170,604 | $ 3,772,119 |
| Investor A | ||||
| Shares sold and automatic conversion of shares | 3,375,879 | $ 60,561,875 | 3,343,064 | $ 49,917,396 |
| Shares issued to shareholders in | ||||
| reinvestment of dividends | 37,113 | 671,758 | — | — |
| Total issued | 3,412,992 | 61,233,633 | 3,343,064 | 49,917,396 |
| Shares redeemed | (1,837,168) | (32,539,508) | (2,330,193) | (33,890,163) |
| Net increase | 1,575,824 | $ 28,694,125 | 1,012,871 | $ 16,027,233 |
| BLACKROCK MID CAP VALUE OPPORTUNITIES FUND | JULY 31, 2011 | 21 |
Notes to Financial Statements (concluded)
| Six Months Ended | Year Ended | |||
| July 31, 2011 | January 31, 2011 | |||
| Shares | Amount | Shares | Amount | |
| Investor B | ||||
| Shares sold | 15,635 | $ 254,967 | 53,313 | $ 722,078 |
| Shares redeemed and automatic | ||||
| conversion of shares | (101,929) | (1,670,339) | (577,849) | (7,630,539) |
| Net decrease | (86,294) | $ (1,415,372) | (524,536) | $ (6,908,461) |
| Investor C | ||||
| Shares sold | 411,973 | $ 6,605,771 | 968,938 | $ 13,152,587 |
| Shares redeemed | (595,856) | (9,550,004) | (1,263,301) | (16,853,753) |
| Net decrease | (183,883) | $ (2,944,233) | (294,363) | $ (3,701,166) |
| Class R | ||||
| Shares sold | 1,005,140 | $ 16,577,313 | 2,042,715 | $ 27,984,844 |
| Shares redeemed | (1,459,385) | (24,228,400) | (1,750,630) | (24,178,784) |
| Net increase (decrease) | (454,245) | $ (7,651,087) | 292,085 | $ 3,806,060 |
8. Subsequent Events:
Management has evaluated the impact of all subsequent events on the Fund through the date the financial statements were issued and has
determined that there were no subsequent events requiring adjustment or additional disclosure in the financial statements.
| 22 | BLACKROCK MID CAP VALUE OPPORTUNITIES FUND | JULY 31, 2011 |
Disclosure of Investment Advisory Agreement and Sub-Advisory Agreement
The Board of Directors (the “Board,” and the members of which are
referred to as “Board Members”) of BlackRock Mid Cap Value
Opportunities Fund (the “Fund”), a series of BlackRock Mid Cap Value
Opportunities Series, Inc. (the “Series”), met on April 12, 2011 and May
10–11, 2011 to consider the approval of the Series’ investment advisory
agreement (the “Advisory Agreement”), on behalf of the Fund, with
BlackRock Advisors, LLC (the “Manager”), the Fund’s investment advisor.
The Board also considered the approval of the sub-advisory agreement
(the “Sub-Advisory Agreement”) between the Manager and BlackRock
Investment Management, LLC (the “Sub-Advisor”), with respect to the
Fund. The Manager and the Sub-Advisor are referred to herein as
“BlackRock.” The Advisory Agreement and the Sub-Advisory Agreement
are referred to herein as the “Agreements.”
Activities and Composition of the Board
The Board consists of thirteen individuals, ten of whom are not “inter-
ested persons” of the Series as defined in the Investment Company
Act of 1940, as amended (the “1940 Act”) (the “Independent Board
Members”). The Board Members are responsible for the oversight of the
operations of the Fund and perform the various duties imposed on the
directors of investment companies by the 1940 Act. The Independent
Board Members have retained independent legal counsel to assist
them in connection with their duties. The Chairman of the Board is an
Independent Board Member. The Board has established five standing
committees: an Audit Committee, a Governance and Nominating
Committee, a Compliance Committee, a Performance Oversight
Committee and an Executive Committee, each of which is composed
of Independent Board Members (except for the Performance Oversight
Committee and the Executive Committee, each of which also has
one interested Board Member) and is chaired by Independent Board
Members. The Board also established an ad hoc committee, the Joint
Product Pricing Committee, which consisted of Independent Board
Members and directors/trustees of the boards of certain other
BlackRock-managed funds, who were not “interested persons” of
their respective funds.
The Agreements
Pursuant to the 1940 Act, the Board is required to consider the con-
tinuation of the Agreements on an annual basis. In connection with this
process, the Board assessed, among other things, the nature, scope and
quality of the services provided to the Fund by BlackRock, its personnel
and its affiliates, including investment management, administrative and
shareholder services, oversight of fund accounting and custody, market-
ing services, risk oversight, compliance program and assistance in
meeting applicable legal and regulatory requirements.
The Board, acting directly and through its committees, considers at each
of its meetings, and from time to time as appropriate, factors that are
relevant to its annual consideration of the renewal of the Agreements,
including the services and support provided by BlackRock to the Fund
and its shareholders. Among the matters the Board considered were: (a)
investment performance for one-, three- and five-year periods, as appli-
cable, against peer funds, and applicable benchmarks, if any, as well as
senior management’s and portfolio managers’ analysis of the reasons for
any over performance or underperformance against its peers and/or
benchmark, as applicable; (b) fees, including advisory, administration, if
applicable, and other amounts paid to BlackRock and its affiliates by
the Fund for services, such as transfer agency, marketing and distribu-
tion, call center and fund accounting; (c) Fund operating expenses and
how BlackRock allocates expenses to the Fund; (d) the resources
devoted to, risk oversight of, and compliance reports relating to, imple-
mentation of the Fund’s investment objective, policies and restrictions;
(e) the Fund’s compliance with its Code of Ethics and other compliance
policies and procedures; (f) the nature, cost and character of non-invest-
ment management services provided by BlackRock and its affiliates;
(g) BlackRock’s and other service providers’ internal controls and risk
and compliance oversight mechanisms; (h) BlackRock’s implementation
of the proxy voting policies approved by the Board; (i) the use of broker-
age commissions and execution quality of portfolio transactions; (j)
BlackRock’s implementation of the Fund’s valuation and liquidity proce-
dures; (k) an analysis of contractual and actual management fees for
products with similar investment objectives across the open-end fund,
exchange traded fund (“ETF”), closed-end fund and institutional account
product channels, as applicable; (l) BlackRock’s compensation method-
ology for its investment professionals and the incentives it creates; and
(m) periodic updates on BlackRock’s business.
Board Considerations in Approving the Agreements
The Approval Process: Prior to the April 12, 2011 meeting, the Board
requested and received materials specifically relating to the Agreements.
The Board is engaged in a process with BlackRock to review periodically
the nature and scope of the information provided to better assist its
deliberations. The materials provided in connection with the April meet-
ing included (a) information independently compiled and prepared by
Lipper, Inc. (“Lipper”) on Fund fees and expenses and the investment
performance of the Fund as compared with a peer group of funds as
determined by Lipper (collectively, “Peers”); (b) information on the
profitability of the Agreements to BlackRock and a discussion of fall-out
benefits to BlackRock and its affiliates and significant shareholders;
(c) a general analysis provided by BlackRock concerning investment
management fees (a combination of the advisory fee and the adminis-
tration fee, if any) charged to other clients, such as institutional clients,
ETFs and closed-end funds, under similar investment mandates, as well
as the performance of such other clients, as applicable; (d) the impact
of economies of scale; (e) a summary of aggregate amounts paid by
the Fund to BlackRock; (f) sales and redemption data regarding the
Fund’s shares; and (g) if applicable, a comparison of management
fees to similar BlackRock open-end funds, as classified by Lipper.
| BLACKROCK MID CAP VALUE OPPORTUNITIES FUND | JULY 31, 2011 | 23 |
Disclosure of Investment Advisory Agreement and Sub-Advisory Agreement (continued)
At an in-person meeting held on April 12, 2011, the Board reviewed
materials relating to its consideration of the Agreements. As a result of
the discussions that occurred during the April 12, 2011 meeting, and as
a culmination of the Board’s year-long deliberative process, the Board
presented BlackRock with questions and requests for additional informa-
tion. BlackRock responded to these requests with additional written
information in advance of the May 10–11, 2011 Board meeting.
At an in-person meeting held on May 10–11, 2011, the Board,
including the Independent Board Members, unanimously approved the
continuation of the Advisory Agreement between the Manager and the
Series, on behalf of the Fund, and the Sub-Advisory Agreement between
the Manager and the Sub-Advisor with respect to the Fund, each for a
one-year term ending June 30, 2012. In approving the continuation of
the Agreements, the Board considered: (a) the nature, extent and quality
of the services provided by BlackRock; (b) the investment performance
of the Fund and BlackRock; (c) the advisory fee and the cost of the
services and profits to be realized by BlackRock and its affiliates from
their relationship with the Fund; (d) economies of scale; (e) fall-out
benefits to BlackRock as a result of its relationship with the Fund;
and (f) other factors deemed relevant by the Board Members.
The Board also considered other matters it deemed important to the
approval process, such as payments made to BlackRock or its affiliates
relating to the distribution of Fund shares, services related to the valua-
tion and pricing of Fund portfolio holdings, direct and indirect benefits
to BlackRock and its affiliates and significant shareholders from their
relationship with the Fund and advice from independent legal counsel
with respect to the review process and materials submitted for the
Board’s review. The Board noted the willingness of BlackRock personnel
to engage in open, candid discussions with the Board. The Board did
not identify any particular information as controlling, and each Board
Member may have attributed different weights to the various
items considered.
A. Nature, Extent and Quality of the Services Provided by BlackRock:
The Board, including the Independent Board Members, reviewed the
nature, extent and quality of services provided by BlackRock, including
the investment advisory services and the resulting performance of the
Fund. Throughout the year, the Board compared Fund performance to the
performance of a comparable group of mutual funds and/or the per-
formance of a relevant benchmark, if any. The Board met with
BlackRock’s senior management personnel responsible for investment
operations, including the senior investment officers. The Board also
reviewed the materials provided by the Fund’s portfolio management
team discussing Fund performance and the Fund’s investment objective,
strategies and outlook.
The Board considered, among other factors, the number, education and
experience of BlackRock’s investment personnel generally and the Fund’s
portfolio management team, investments by portfolio managers in
the funds they manage, BlackRock’s portfolio trading capabilities,
BlackRock’s use of technology, BlackRock’s commitment to compliance,
BlackRock’s credit analysis capabilities, BlackRock’s risk analysis capa-
bilities and BlackRock’s approach to training and retaining portfolio
managers and other research, advisory and management personnel. The
Board engaged in a review of BlackRock’s compensation structure with
respect to the Fund’s portfolio management team and BlackRock’s
ability to attract and retain high-quality talent and create
performance incentives.
In addition to advisory services, the Board considered the quality of
the administrative and non-investment advisory services provided to the
Fund. BlackRock and its affiliates provide the Fund with certain adminis-
trative, transfer agency, shareholder and other services (in addition to
any such services provided to the Fund by third parties) and officers
and other personnel as are necessary for the operations of the Fund.
In addition to investment advisory services, BlackRock and its affiliates
provide the Fund with other services, including (i) preparing disclosure
documents, such as the prospectus, the statement of additional infor-
mation and periodic shareholder reports; (ii) assisting with daily
accounting and pricing; (iii) overseeing and coordinating the activities
of other service providers; (iv) organizing Board meetings and preparing
the materials for such Board meetings; (v) providing legal and comp-
liance support; and (vi) performing other administrative functions
necessary for the operation of the Fund, such as tax reporting, fulfilling
regulatory filing requirements and call center services. The Board
reviewed the structure and duties of BlackRock’s fund administration,
accounting, legal and compliance departments and considered
BlackRock’s policies and procedures for assuring compliance with
applicable laws and regulations.
B. The Investment Performance of the Fund and BlackRock: The Board,
including the Independent Board Members, also reviewed and consid-
ered the performance history of the Fund. In preparation for the April 12,
2011 meeting, the Board worked with BlackRock and Lipper to develop
a template for, and was provided with, reports independently prepared
by Lipper, which included a comprehensive analysis of the Fund’s per-
formance. The Board also reviewed a narrative and statistical analysis of
the Lipper data that was prepared by BlackRock, which analyzed various
factors that affect Lipper’s rankings. In connection with its review, the
Board received and reviewed information regarding the investment per-
formance of the Fund as compared to funds in the Fund’s applicable
Lipper category. The Board was provided with a description of the
methodology used by Lipper to select peer funds. The Board and the
Board’s Performance Oversight Committee regularly review, and meet
with Fund management to discuss, the performance of the Fund
throughout the year.
| 24 | BLACKROCK MID CAP VALUE OPPORTUNITIES FUND | JULY 31, 2011 |
Disclosure of Investment Advisory Agreement and Sub-Advisory Agreement (continued)
The Board noted that the Fund ranked in the first, first and second quar-
tiles against its Lipper Performance Universe for the one-, three- and
five-year periods reported, respectively.
The Board noted that BlackRock has made changes to the organization
of the overall equity group management structure designed to result in a
strengthened leadership team.
C. Consideration of the Advisory/Management Fees and the Cost of the
Services and Profits to be Realized by BlackRock and its Affiliates from
their Relationship with the Fund: The Board, including the Independent
Board Members, reviewed the Fund’s contractual management fee ratio
compared with the other funds in its Lipper category. It also compared
the Fund’s total expense ratio, as well as actual management fee ratio,
to those of other funds in its Lipper category. The Board considered the
services provided and the fees charged by BlackRock to other types of
clients with similar investment mandates, including separately managed
institutional accounts.
The Board received and reviewed statements relating to BlackRock’s
financial condition and profitability with respect to the services it
provided the Fund. The Board was also provided with a profitability
analysis that detailed the revenues earned and the expenses incurred
by BlackRock for services provided to the Fund. The Board reviewed
BlackRock’s profitability with respect to the Fund and other funds
the Board currently oversees for the year ended December 31, 2010
compared to available aggregate profitability data provided for the
years ended December 31, 2009 and December 31, 2008. The Board
reviewed BlackRock’s profitability with respect to other fund complexes
managed by the Manager and/or its affiliates. The Board reviewed
BlackRock’s assumptions and methodology of allocating expenses in
the profitability analysis, noting the inherent limitations in allocating
costs among various advisory products. The Board recognized that
profitability may be affected by numerous factors including, among
other things, fee waivers and expense reimbursements by the Manager,
the types of funds managed, expense allocations and business mix,
and the difficulty of comparing profitability as a result of those factors.
The Board noted that, in general, individual fund or product line prof-
itability of other advisors is not publicly available. The Board considered
BlackRock’s operating margin, in general, compared to the operating
margin for leading investment management firms whose operations
include advising open-end funds, among other product types. That data
indicates that operating margins for BlackRock, in general and with
respect to its registered funds, are generally consistent with margins
earned by similarly situated publicly traded competitors. In addition, the
Board considered, among other things, certain third party data compar-
ing BlackRock’s operating margin with that of other publicly-traded asset
management firms. That third party data indicates that larger asset
bases do not, in themselves, translate to higher profit margins.
In addition, the Board considered the cost of the services provided to
the Fund by BlackRock, and BlackRock’s and its affiliates’ profits relating
to the management and distribution of the Fund and the other funds
advised by BlackRock and its affiliates. As part of its analysis, the Board
reviewed BlackRock’s methodology in allocating its costs to the manage-
ment of the Fund. The Board also considered whether BlackRock has
the financial resources necessary to attract and retain high quality
investment management personnel to perform its obligations under
the Agreements and to continue to provide the high quality of services
that is expected by the Board.
The Board noted that the Fund’s contractual management fee ratio (a
combination of the advisory fee and the administration fee, if any) was
lower than or equal to the median contractual management fee ratio
paid by the Fund’s Peers, in each case before taking into account any
expense reimbursements or fee waivers. The Board also noted that
effective June 1, 2011, the Fund has an advisory fee arrangement that
includes breakpoints that adjust the fee ratio downward as the size of
the Fund increases above certain contractually specified levels.
D. Economies of Scale: The Board, including the Independent Board
Members, considered the extent to which economies of scale might be
realized as the assets of the Fund increase. The Board also considered
the extent to which the Fund benefits from such economies and whether
there should be changes in the advisory fee rate or structure in order to
enable the Fund to participate in these economies of scale, for example
through the use of breakpoints in the advisory fee based upon the asset
level of the Fund.
E. Other Factors Deemed Relevant by the Board Members: The Board,
including the Independent Board Members, also took into account other
ancillary or “fall-out” benefits that BlackRock or its affiliates and signifi-
cant shareholders may derive from their respective relationships with the
Fund, both tangible and intangible, such as BlackRock’s ability to lever-
age its investment professionals who manage other portfolios and risk
management personnel, an increase in BlackRock’s profile in the invest-
ment advisory community, and the engagement of BlackRock’s affiliates
as service providers to the Fund, including for administrative, transfer
agency, distribution and securities lending services. The Board also con-
sidered BlackRock’s overall operations and its efforts to expand the
scale of, and improve the quality of, its operations. The Board also noted
that BlackRock may use and benefit from third party research obtained
by soft dollars generated by certain registered fund transactions to assist
in managing all or a number of its other client accounts. The Board
further noted that BlackRock’s funds may invest in affiliated ETFs
without any offset against the management fees payable by the funds
to BlackRock.
| BLACKROCK MID CAP VALUE OPPORTUNITIES FUND | JULY 31, 2011 | 25 |
Disclosure of Investment Advisory Agreement and Sub-Advisory Agreement (concluded)
In connection with its consideration of the Agreements, the Board also
received information regarding BlackRock’s brokerage and soft dollar
practices. The Board received reports from BlackRock which included
information on brokerage commissions and trade execution practices
throughout the year.
The Board noted the competitive nature of the open-end fund market-
place, and that shareholders are able to redeem their Fund shares if
they believe that the Fund’s fees and expenses are too high or if they
are dissatisfied with the performance of the Fund.
Conclusion
The Board, including the Independent Board Members, unanimously
approved the continuation of the Advisory Agreement between the
Manager and the Series, on behalf of the Fund, for a one-year term
ending June 30, 2012 and the Sub-Advisory Agreement between the
Manager and the Sub-Advisor, with respect to the Fund, for a one-year
term ending June 30, 2012. As part of its approval, the Board consid-
ered the detailed review of BlackRock’s fee structure, as it applies to the
Fund, conducted by the ad hoc Joint Product Pricing Committee. Based
upon its evaluation of all of the aforementioned factors in their totality,
the Board, including the Independent Board Members, was satisfied that
the terms of the Agreements were fair and reasonable and in the best
interest of the Fund and its shareholders. In arriving at its decision to
approve the Agreements, the Board did not identify any single factor or
group of factors as all-important or controlling, but considered all factors
together, and different Board Members may have attributed different
weights to the various factors considered. The Independent Board
Members were also assisted by the advice of independent legal counsel
in making this determination. The contractual fee arrangements for the
Fund reflect the results of several years of review by the Board Members
and predecessor Board Members, and discussions between such Board
Members (and predecessor Board Members) and BlackRock. As a result,
the Board Members’ conclusions may be based in part on their consid-
eration of these arrangements in prior years.
| 26 | BLACKROCK MID CAP VALUE OPPORTUNITIES FUND | JULY 31, 2011 |
Officers and Directors
Robert M. Hernandez, Chairman of the Board and Director
Fred G. Weiss, Vice Chairman of the Board and Director
James H. Bodurtha, Director
Bruce R. Bond, Director
Donald W. Burton, Director
Richard S. Davis, Director
Honorable Stuart E. Eizenstat, Director
Laurence D. Fink, Director
Kenneth A. Froot, Director
Henry Gabbay, Director
John F. O’Brien, Director
Roberta Cooper Ramo, Director
David H. Walsh, Director
John M. Perlowski, President and Chief Executive Officer
Brendan Kyne, Vice President
Neal Andrews, Chief Financial Officer
Jay Fife, Treasurer
Brian Kindelan, Chief Compliance Officer
and Anti-Money Laundering Officer
Ira P. Shapiro, Secretary
Investment Advisor
BlackRock Advisors, LLC
Wilmington, DE 19809
Sub-Advisor
BlackRock Investment Management, LLC
Princeton, NJ 08540
Custodian
The Bank of New York Mellon
New York, NY 10286
Transfer Agent
BNY Mellon Investment Servicing (US) Inc.
Wilmington, DE 19809
Accounting Agent
State Street Bank and Trust Company
Boston, MA 02116
Distributor
BlackRock Investments, LLC
New York, NY 10022
Legal Counsel
Willkie Farr & Gallagher LLP
New York, NY 10019
Independent Registered Public Accounting Firm
Deloitte & Touche LLP
Boston, MA 02116
Address of the Fund
100 Bellevue Parkway
Wilmington, DE 19809
Effective September 13, 2011, Richard S. Davis resigned as Director of the Fund, and Paul L. Audet became Director of the Fund.
| BLACKROCK MID CAP VALUE OPPORTUNITIES FUND | JULY 31, 2011 | 27 |
Additional Information
General Information
Electronic Delivery
Electronic copies of most financial reports and prospectuses are available
on the Fund’s website or shareholders can sign up for e-mail notifications
of quarterly statements, annual and semi-annual reports and prospectuses
by enrolling in the Fund’s electronic delivery program.
To enroll:
Shareholders Who Hold Accounts with Investment Advisors, Banks or
Brokerages:
Please contact your financial advisor. Please note that not all investment
advisors, banks or brokerages may offer this service.
Shareholders Who Hold Accounts Directly with BlackRock:
1) Access the BlackRock website at
http://www.blackrock.com/edelivery
2) Select “eDelivery” under the “More Information” section
3) Log into your account
Householding
The Fund will mail only one copy of shareholder documents, including
prospectuses, annual and semi-annual reports and proxy statements, to
shareholders with multiple accounts at the same address. This practice
is commonly called “householding” and is intended to reduce expenses
and eliminate duplicate mailings of shareholder documents. Mailings of
your shareholder documents may be householded indefinitely unless you
instruct us otherwise. If you do not want the mailing of these documents
to be combined with those for other members of your household, please
call (800) 441-7762.
Availability of Quarterly Schedule of Investments
The Fund files its complete schedule of portfolio holdings with the SEC
for the first and third quarters of each fiscal year on Form N-Q. The Fund’s
Forms N-Q are available on the SEC’s website at http://www.sec.gov
and may also be reviewed and copied at the SEC’s Public Reference
Room in Washington, D.C. Information on how to access documents
on the SEC’s website without charge may be obtained by calling
(800) SEC-0330. The Fund’s Forms N-Q may also be obtained
upon request and without charge by calling (800) 441-7762.
Availability of Proxy Voting Policies and Procedures
A description of the policies and procedures that the Fund uses to
determine how to vote proxies relating to portfolio securities is available
(1) without charge, upon request, by calling (800) 441-7762;
(2) at http://www.blackrock.com; and (3) on the SEC’s website
at http://www.sec.gov.
Availability of Proxy Voting Record
Information about how the Fund voted proxies relating to securities
held in the Fund’s portfolio during the most recent 12-month period
ended June 30 is available upon request and without charge (1) at
http://www.blackrock.com or by calling (800) 441-7762 and (2) on
the SEC’s website at http://www.sec.gov.
| 28 | BLACKROCK MID CAP VALUE OPPORTUNITIES FUND | JULY 31, 2011 |
Additional Information (continued)
Shareholder Privileges
Account Information
Call us at (800) 441-7762 from 8:00 AM to 6:00 PM EST on any
business day to get information about your account balances, recent
transactions and share prices. You can also reach us on the Web at
http://www.blackrock.com/funds.
Automatic Investment Plans
Investor Class shareholders who want to invest regularly can arrange to
have $50 or more automatically deducted from their checking or savings
account and invested in any of the BlackRock funds.
Systematic Withdrawal Plans
Investor Class shareholders can establish a systematic withdrawal plan
and receive periodic payments of $50 or more from their BlackRock
funds, as long as their account balance is at least $10,000.
Retirement Plans
Shareholders may make investments in conjunction with Traditional,
Rollover, Roth, Coverdell, Simple IRAs, SEP IRAs and 403(b) Plans.
| BLACKROCK MID CAP VALUE OPPORTUNITIES FUND | JULY 31, 2011 | 29 |
Additional Information (concluded)
BlackRock Privacy Principles
BlackRock is committed to maintaining the privacy of its current and
former fund investors and individual clients (collectively, “Clients”) and
to safeguarding their non-public personal information. The following infor-
mation is provided to help you understand what personal information
BlackRock collects, how we protect that information and why in certain
cases we share such information with select parties.
If you are located in a jurisdiction where specific laws, rules or regula-
tions require BlackRock to provide you with additional or different privacy-
related rights beyond what is set forth below, then BlackRock will comply
with those specific laws, rules or regulations.
BlackRock obtains or verifies personal non-public information from and
about you from different sources, including the following: (i) information
we receive from you or, if applicable, your financial intermediary, on appli-
cations, forms or other documents; (ii) information about your trans-
actions with us, our affiliates, or others; (iii) information we receive from
a consumer reporting agency; and (iv) from visits to our websites.
BlackRock does not sell or disclose to non-affiliated third parties any non-
public personal information about its Clients, except as permitted by law
or as is necessary to respond to regulatory requests or to service Client
accounts. These non-affiliated third parties are required to protect the
confidentiality and security of this information and to use it only for its
intended purpose.
We may share information with our affiliates to service your account
or to provide you with information about other BlackRock products or
services that may be of interest to you. In addition, BlackRock restricts
access to non-public personal information about its Clients to those
BlackRock employees with a legitimate business need for the information.
BlackRock maintains physical, electronic and procedural safeguards
that are designed to protect the non-public personal information of its
Clients, including procedures relating to the proper storage and disposal
of such information.
| 30 | BLACKROCK MID CAP VALUE OPPORTUNITIES FUND | JULY 31, 2011 |
| A World-Class Mutual Fund Family | ||||||
| BlackRock offers a diverse lineup of open-end mutual funds crossing all investment styles and managed by experts in equity, fixed income and | ||||||
| tax-exempt investing. | ||||||
| Equity Funds | ||||||
| BlackRock ACWI ex-US Index Fund | BlackRock Global Emerging Markets Fund | BlackRock Mid-Cap Value Equity Portfolio | ||||
| BlackRock All-Cap Energy & Resources Portfolio | BlackRock Global Opportunities Portfolio | BlackRock Mid Cap Value Opportunities Fund | ||||
| BlackRock Asset Allocation Portfolio† | BlackRock Global SmallCap Fund | BlackRock Natural Resources Trust | ||||
| BlackRock Balanced Capital Fund† | BlackRock Health Sciences Opportunities Portfolio | BlackRock Pacific Fund | ||||
| BlackRock Basic Value Fund | BlackRock Index Equity Portfolio | BlackRock Russell 1000 Index Fund | ||||
| BlackRock Capital Appreciation Fund | BlackRock India Fund | BlackRock Science & Technology | ||||
| BlackRock China Fund | BlackRock International Fund | Opportunities Portfolio | ||||
| BlackRock Energy & Resources Portfolio | BlackRock International Index Fund | BlackRock Small Cap Growth Equity Portfolio | ||||
| BlackRock Equity Dividend Fund | BlackRock International Opportunities Portfolio | BlackRock Small Cap Growth Fund II | ||||
| BlackRock EuroFund | BlackRock Large Cap Core Fund | BlackRock Small Cap Index Fund | ||||
| BlackRock Focus Growth Fund | BlackRock Large Cap Core Plus Fund | BlackRock S&P 500 Index Fund | ||||
| BlackRock Global Allocation Fund† | BlackRock Large Cap Growth Fund | BlackRock S&P 500 Stock Fund | ||||
| BlackRock Global Dividend Income Portfolio | BlackRock Large Cap Value Fund | BlackRock U.S. Opportunities Portfolio | ||||
| BlackRock Global Dynamic Equity Fund | BlackRock Latin America Fund | BlackRock Value Opportunities Fund | ||||
| BlackRock Mid-Cap Growth Equity Portfolio | BlackRock World Gold Fund | |||||
| Fixed Income Funds | ||||||
| BlackRock Bond Index Fund | BlackRock Income Portfolio† | BlackRock Strategic Income | ||||
| BlackRock Core Bond Portfolio | BlackRock Inflation Protected Bond Portfolio | Opportunities Portfolio | ||||
| BlackRock Emerging Market Debt Portfolio | BlackRock International Bond Portfolio | BlackRock Total Return Fund | ||||
| BlackRock Floating Rate Income Portfolio | BlackRock Long Duration Bond Portfolio | BlackRock US Government Bond Portfolio | ||||
| BlackRock GNMA Portfolio | BlackRock Low Duration Bond Portfolio | BlackRock World Income Fund | ||||
| BlackRock High Yield Bond Portfolio | BlackRock Multi-Sector Bond Portfolio | US Mortgage Portfolio | ||||
| Municipal Bond Funds | ||||||
| BlackRock California Municipal Bond Fund | BlackRock National Municipal Fund | BlackRock Pennsylvania Municipal Bond Fund | ||||
| BlackRock High Yield Municipal Fund | BlackRock New Jersey Municipal Bond Fund | BlackRock Short-Term Municipal Fund | ||||
| BlackRock Intermediate Municipal Fund | BlackRock New York Municipal Bond Fund | |||||
| Target Risk & Target Date Funds† | ||||||
| BlackRock Prepared Portfolios | BlackRock Lifecycle Prepared Portfolios | LifePath Portfolios | LifePath Index Portfolios | |||
| Conservative Prepared Portfolio | 2015 | 2035 | Retirement | 2040 | Retirement | 2040 |
| Moderate Prepared Portfolio | 2020 | 2040 | 2020 | 2045 | 2020 | 2045 |
| Growth Prepared Portfolio | 2025 | 2045 | 2025 | 2050 | 2025 | 2050 |
| Aggressive Growth Prepared Portfolio | 2030 | 2050 | 2030 | 2055 | 2030 | 2055 |
| 2035 | 2035 | |||||
| † Mixed asset fund. | ||||||
BlackRock mutual funds are currently distributed by BlackRock Investments, LLC. You should consider the investment objectives, risks, charges and
expenses of the funds under consideration carefully before investing. Each fund’s prospectus contains this and other information and is available at
www.blackrock.com or by calling (800) 441-7762 or from your financial advisor. The prospectus should be read carefully before investing.
| BLACKROCK MID CAP VALUE OPPORTUNITIES FUND | JULY 31, 2011 | 31 |

This report is not authorized for use as an offer of sale
or a solicitation of an offer to buy shares of the Fund unless
accompanied or preceded by the Fund’s current prospectus.
Past performance results shown in this report should not
be considered a representation of future performance.
Investment returns and principal value of shares will fluctuate
so that shares, when redeemed, may be worth more or less
than their original cost. Statements and other information
herein are as dated and are subject to change.

Item 2 – Code of Ethics – Not Applicable to this semi-annual report
Item 3 – Audit Committee Financial Expert – Not Applicable to this semi-annual report
Item 4 – Principal Accountant Fees and Services – Not Applicable to this semi-annual report
Item 5 – Audit Committee of Listed Registrants – Not Applicable
Item 6 – Investments
(a) The registrant’s Schedule of Investments is included as part of the Report to
Stockholders filed under Item 1 of this Form.
(b) Not Applicable due to no such divestments during the semi-annual period covered since
the previous Form N-CSR filing.
Item 7 – Disclosure of Proxy Voting Policies and Procedures for Closed-End Management
Investment Companies – Not Applicable
Item 8 – Portfolio Managers of Closed-End Management Investment Companies – Not Applicable
Item 9 – Purchases of Equity Securities by Closed-End Management Investment Company and
Affiliated Purchasers – Not Applicable
Item 10 – Submission of Matters to a Vote of Security Holders –There have been no material changes
to these procedures.
Item 11 – Controls and Procedures
11(a) – The registrant’s principal executive and principal financial officers, or persons performing
similar functions, have concluded that the registrant’s disclosure controls and procedures (as
defined in Rule 30a-3(c) under the Investment Company Act of 1940, as amended (the
“1940 Act”)) are effective as of a date within 90 days of the filing of this report based on the
evaluation of these controls and procedures required by Rule 30a-3(b) under the 1940 Act
and Rule 15d-15(b) under the Securities Exchange Act of 1934, as amended.
11(b) – There were no changes in the registrant’s internal control over financial reporting (as
defined in Rule 30a-3(d) under the 1940 Act) that occurred during the second fiscal quarter
of the period covered by this report that have materially affected, or are reasonably likely to
materially affect, the registrant’s internal control over financial reporting.
Item 12 – Exhibits attached hereto
12(a)(1) – Code of Ethics – Not Applicable to this semi-annual report
12(a)(2) – Certifications – Attached hereto
12(a)(3) – Not Applicable
12(b) – Certifications – Attached hereto
Pursuant to the requirements of the Securities Exchange Act of 1934 and the Investment
Company Act of 1940, the registrant has duly caused this report to be signed on its behalf by
the undersigned, thereunto duly authorized.
BlackRock Mid Cap Value Opportunities Fund of BlackRock Mid Cap Value Opportunities
Series, Inc.
By: /S/ John M. Perlowski
John M. Perlowski
Chief Executive Officer (principal executive officer) of
BlackRock Mid Cap Value Opportunities Fund of BlackRock Mid Cap Value
Opportunities Series, Inc.
Date: October 4, 2011
Pursuant to the requirements of the Securities Exchange Act of 1934 and the Investment
Company Act of 1940, this report has been signed below by the following persons on behalf
of the registrant and in the capacities and on the dates indicated.
By: /S/ John M. Perlowski
John M. Perlowski
Chief Executive Officer (principal executive officer) of
BlackRock Mid Cap Value Opportunities Fund of BlackRock Mid Cap Value
Opportunities Series, Inc.
Date: October 4, 2011
By: /S/ Neal J. Andrews
Neal J. Andrews
Chief Financial Officer (principal financial officer) of
BlackRock Mid Cap Value Opportunities Fund of BlackRock Mid Cap Value
Opportunities Series, Inc.
Date: October 4, 2011