UNITED STATES
SECURITIES AND EXCHANGE COMMISSION
Washington, D.C. 20549
FORM N-CSR
CERTIFIED SHAREHOLDER REPORT OF REGISTERED MANAGEMENT INVESTMENT COMPANIES
Investment Company Act file number: 811-07177
Name of Fund: BlackRock Mid Cap Value Opportunities Fund of BlackRock Mid Cap Value Opportunities Series, Inc.
Fund Address: 100 Bellevue Parkway, Wilmington, DE 19809
Name and address of agent for service: John M. Perlowski, Chief Executive Officer, BlackRock Mid Cap Value Opportunities Fund of BlackRock Mid Cap Value Opportunities Series, Inc., 55 East 52nd Street, New York, NY 10055
Registrant’s telephone number, including area code: (800) 441-7762
Date of fiscal year end: 01/31/2015
Date of reporting period: 07/31/2014
Item 1 – Report to Stockholders
JULY 31, 2014
| | | | | | |
SEMI-ANNUAL REPORT (UNAUDITED) | | | | | |  |
BlackRock Mid Cap Value Opportunities Fund | of BlackRock Mid Cap Value Opportunities Series, Inc.
|
| Not FDIC Insured • May Lose Value • No Bank Guarantee |
| | | | | | |
| | | | | | | |
| 2 | | BLACKROCK MID CAP VALUE OPPORTUNITIES FUND | | JULY 31, 2014 | | |
Dear Shareholder,
The latter part of 2013 was a strong period for equities and other risk assets such as high yield bonds, despite the mixed tone of economic and financial news and uncertainty as to when and by how much the U.S. Federal Reserve would begin to gradually reduce (or “taper”) its asset purchase programs. Stock markets rallied in September when the Fed defied investors’ expectations with its decision to delay tapering. The momentum was disrupted temporarily, however, when the U.S. debt ceiling debate led to a partial government shutdown, roiling financial markets globally until a compromise was struck in mid-October. The remainder of 2013 was generally positive for developed market stocks, while fixed income and emerging market investments struggled as Fed tapering became increasingly imminent. When the central bank ultimately announced its tapering plans in mid-December, equity investors reacted positively, as this action signaled the Fed’s perception of real improvement in the economy.
Most asset classes continued to move higher in 2014 despite the pull back in Fed stimulus. The year got off to a rocky start, however. A number of emerging economies showed signs of financial stress while facing the broader headwind of diminishing global liquidity. These risks, combined with disappointing U.S. economic data, caused equities to decline in January while bond markets found renewed strength from investors seeking relatively safer assets.
Although these headwinds persisted, equities were back on the rise in February as investors were encouraged by a one-year extension of the U.S. debt ceiling and market-friendly comments from the new Fed Chairwoman, Janet Yellen. While it was clear that U.S. economic data had softened, investors were assuaged by increasing evidence that the trend was temporary and weather-related, and continued to take on risk given expectations that growth would pick up later in the year.
In the months that followed, interest rates trended lower and bond prices climbed higher in the modest growth environment. Financial markets exhibited a remarkably low level of volatility despite rising geopolitical risks and mixed global economic news. Tensions in Russia and Ukraine and signs of decelerating growth in China caused some turbulence, but markets were resilient as investors focused on signs of improvement in the U.S. recovery, stronger corporate earnings and increased merger-and-acquisition activity. Importantly, investors were comforted by comments from the Fed offering reassurance that no changes to short-term interest rates were on the horizon.
In the low-rate environment, investors looked to equities as a source of yield, pushing major indices to record highs. As stock prices moved higher, investors soon became wary of stretched valuations and a new theme emerged in the markets. Stocks that had experienced significant price appreciation in 2013, particularly growth and momentum names, broadly declined as investors fled to stocks with cheaper valuations. This rotation resulted in the strongest performers of 2013 struggling most in 2014, and vice versa. Especially hard hit were U.S. small cap and European stocks where earnings growth had not kept pace with recent market gains. In contrast, emerging market stocks benefited from the trend. As a number of developing countries took steps to stabilize their finances, investors looked past political risks — hardly batting an eye at a military coup in Thailand — and poured back into these attractively priced investments.
Asset prices tend to be more vulnerable to bad news when investors believe valuations are stretched. Consequently, markets came under pressure in July as geopolitical tensions intensified with the tragic downing of a Malaysian civilian airliner over Ukraine, the continued fragmentation of Iraq and a ground war between Israel and Hamas in Gaza. As the period came to a close, financial troubles in Argentina and Portugal as well as new U.S. and European sanctions on Russia were additional headwinds for the markets.
Despite a host of challenges, most asset classes generated solid returns for the six- and 12-month periods ended July 31, 2014, with equities generally outperforming fixed income. Emerging market equities delivered impressive gains. Developed markets also performed well, although small cap stocks lagged due to relatively higher valuations. Most fixed income assets produced positive returns even as the Fed reduced its open-market purchases. Tax-exempt municipal bonds benefited from a favorable supply-and-demand environment. Short-term interest rates remained near zero, keeping yields on money market securities close to historic lows.
At BlackRock, we believe investors need to think globally, extend their scope across a broad array of asset classes and be prepared to move freely as market conditions change over time. We encourage you to talk with your financial advisor and visit blackrock.com for further insight about investing in today’s world.
Sincerely,

Rob Kapito
President, BlackRock Advisors, LLC

Asset prices pushed higher over the period despite modest global growth, geopolitical risks and a shift toward tighter U.S. monetary policy.
Rob Kapito
President, BlackRock Advisors, LLC
| | | | | | | | |
| Total Returns as of July 31, 2014 | |
| | | 6-month | | | 12-month | |
U.S. large cap equities
(S&P 500® Index) | | | 9.44 | % | | | 16.94 | % |
U.S. small cap equities
(Russell 2000® Index) | | | (0.30 | ) | | | 8.56 | |
International equities
(MSCI Europe, Australasia,
Far East Index) | | | 7.03 | | | | 15.07 | |
Emerging market equities
(MSCI Emerging
Markets Index) | | | 15.70 | | | | 15.32 | |
3-month Treasury bills
(BofA Merrill Lynch 3-Month
U.S. Treasury Bill Index) | | | 0.02 | | | | 0.05 | |
U.S. Treasury securities
(BofA Merrill Lynch 10-Year
U.S. Treasury Index) | | | 2.71 | | | | 3.50 | |
U.S. investment-grade
bonds (Barclays
U.S. Aggregate Bond Index) | | | 2.16 | | | | 3.97 | |
Tax-exempt municipal
bonds (S&P Municipal
Bond Index) | | | 4.11 | | | | 7.38 | |
U.S. high yield bonds
(Barclays U.S.
Corporate High Yield 2%
Issuer Capped Index) | | | 3.33 | | | | 8.18 | |
| Past performance is no guarantee of future results. Index performance is shown for illustrative purposes only. You cannot invest directly in an index. | |
| | | | | | |
| | | | | | | |
| | THIS PAGE NOT PART OF YOUR FUND REPORT | | | | 3 |
| | |
| Fund Summary as of July 31, 2014 | | |
BlackRock Mid Cap Value Opportunities Fund’s (the “Fund”) investment objective is to seek capital appreciation and, secondarily, income, by investing in securities, primarily equity securities that Fund management believes are undervalued and therefore represent an investment value.
| | |
| Portfolio Management Commentary | | |
How did the Fund perform?
| Ÿ | | For the six-month period ended July 31, 2014, the Fund outperformed its benchmark, the S&P MidCap 400® Value Index. |
What factors influenced performance?
| Ÿ | | Stock selection within industrials was a positive contributor to the Fund’s performance relative to the benchmark, notably holdings in machinery stocks as well as within commercial services & supplies. The Fund benefited from an overweight in and selection within energy, particularly in energy equipment & services. Stock selection in the health care sector was also helpful, specifically the Fund’s biotechnology holdings and an overweight in pharmaceuticals. Finally, stock selection had a positive impact in utilities, consumer staples, information technology (“IT”) and consumer discretionary. |
| Ÿ | | On the downside, stock selection within financials was challenged in the period, especially an underweight in and selection within real estate investment trusts (“REITs”), as well as an overweight in and selection within banks. In addition, the Fund’s allocation within materials detracted from performance, notably paper & forest products holdings. The absence of any exposure to telecommunication services slightly detracted from performance during the period. |
Describe recent portfolio activity.
| Ÿ | | During the six-month period, the Fund increased its exposure to REITs, electronic equipment, life sciences tools & services and aerospace & defense. The Fund decreased exposure to banks, technology hardware, storage & peripherals, biotechnology, electric utilities and software. |
Describe portfolio positioning at period end.
| Ÿ | | Relative to the S&P MidCap 400® Value Index, the Fund ended the period overweight in consumer discretionary, energy and industrials, while being underweight in financials, materials and IT. |
The views expressed reflect the opinions of BlackRock as of the date of this report and are subject to change based on changes in market, economic or other conditions. These views are not intended to be a forecast of future events and are no guarantee of future results.
| | |
| Ten Largest Holdings | | Percent of
Long-Term Investments |
| | | | |
American Campus Communities, Inc. | | | 2 | % |
Westar Energy, Inc. | | | 2 | |
Superior Energy Services, Inc. | | | 2 | |
Corporate Office Properties Trust | | | 2 | |
Owens & Minor, Inc. | | | 2 | |
Teleflex, Inc. | | | 2 | |
Alliant Energy Corp. | | | 2 | |
Tribune Co., Class A | | | 2 | |
Pitney Bowes, Inc. | | | 2 | |
Waters Corp. | | | 1 | |
| | |
| Sector Allocation | | Percent of
Long-Term Investments |
| | | | |
Financials | | | 20 | % |
Consumer Discretionary | | | 15 | |
Industrials | | | 14 | |
Information Technology | | | 13 | |
Utilities | | | 9 | |
Health Care | | | 8 | |
Energy | | | 8 | |
Materials | | | 8 | |
Consumer Staples | | | 5 | |
For Fund compliance purposes, the Fund’s sector classifications refer to any one or more of the sector sub-classifications used by one or more widely recognized market indexes or rating group indexes, and/or as defined by Fund management. These definitions may not apply for purposes of this report, which may combine such sector sub-classifications for reporting ease.
| | | | | | |
| | | | | | | |
| 4 | | BLACKROCK MID CAP VALUE OPPORTUNITIES FUND | | JULY 31, 2014 | | |
| | |
| Total Return Based on a $10,000 Investment | | |
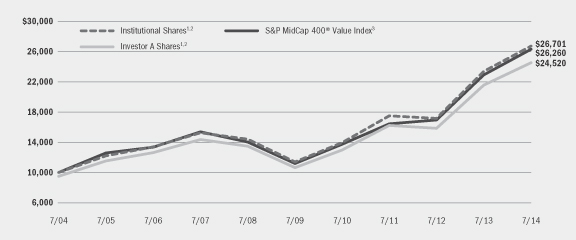
| | 1 | | Assuming maximum sales charges, if any, transaction costs and other operating expenses, including investment advisory fees. Institutional Shares do not have a sales charge. |
| | 2 | | The Fund normally invests at least 80% of its assets in equity securities of mid cap companies. |
| | 3 | | This unmanaged index measures the performance of the mid-capitalization value sector of the U.S. equity market. It is a subset of the S&P MidCap 400® Index and consists of those stocks in the S&P MidCap 400® Index exhibiting the strongest value characteristics, as determined by the index provider, representing approximately 50% of the market capitalization of the S&P MidCap 400® Index. |
| | |
| Performance Summary for the Period Ended July 31, 2014 | | |
| | | | | | | | | | | | | | | | | | | | | | | | | | | | |
| | | | | | Average Annual Total Returns4 | |
| | | | | | 1 Year | | | 5 Years | | | 10 Years | |
| | | 6-Month
Total Returns | | | w/o sales
charge | | | w/sales
charge | | | w/o sales
charge | | | w/sales
charge | | | w/o sales
charge | | | w/sales
charge | |
Institutional | | | 7.89 | % | | | 14.21 | % | | | N/A | | | | 18.61 | % | | | N/A | | | | 10.32 | % | | | N/A | |
Investor A | | | 7.74 | | | | 13.90 | | | | 7.92 | % | | | 18.23 | | | | 16.96 | % | | | 9.98 | | | | 9.38 | % |
Investor B | | | 7.19 | | | | 12.91 | | | | 8.41 | | | | 17.16 | | | | 16.95 | | | | 9.24 | | | | 9.24 | |
Investor C | | | 7.29 | | | | 12.94 | | | | 11.94 | | | | 17.12 | | | | 17.12 | | | | 8.98 | | | | 8.98 | |
Class R | | | 7.58 | | | | 13.57 | | | | N/A | | | | 17.81 | | | | N/A | | | | 9.60 | | | | N/A | |
S&P MidCap 400® Value Index | | | 7.03 | | | | 14.61 | | | | N/A | | | | 18.63 | | | | N/A | | | | 10.14 | | | | N/A | |
| | 4 | | Assuming maximum sales charges, if any. Average annual total returns with and without sales charges reflect reductions for distribution and service fees. See “About Fund Performance” on page 6 for a detailed description of share classes, including any related sales charges and fees. |
| | | | N/A — Not applicable as share class and index do not have a sales charge. |
| | | | Past performance is not indicative of future results. |
| | | | | | | | | | | | | | | | | | | | | | | | | | | | |
| | | Actual | | | Hypothetical6 | | | | |
| | | Beginning
Account Value
February 1, 2014 | | | Ending
Account Value
July 31, 2014 | | | Expenses Paid
During the Period5 | | | Beginning
Account Value
February 1, 2014 | | | Ending
Account Value
July 31, 2014 | | | Expenses Paid
During the Period5 | | | Annualized
Expense Ratio | |
Institutional | | $ | 1,000.00 | | | $ | 1,078.90 | | | $ | 4.43 | | | $ | 1,000.00 | | | $ | 1,020.53 | | | $ | 4.31 | | | | 0.86 | % |
Investor A | | $ | 1,000.00 | | | $ | 1,077.40 | | | $ | 5.87 | | | $ | 1,000.00 | | | $ | 1,019.14 | | | $ | 5.71 | | | | 1.14 | % |
Investor B | | $ | 1,000.00 | | | $ | 1,071.90 | | | $ | 10.89 | | | $ | 1,000.00 | | | $ | 1,014.28 | | | $ | 10.59 | | | | 2.12 | % |
Investor C | | $ | 1,000.00 | | | $ | 1,072.90 | | | $ | 10.18 | | | $ | 1,000.00 | | | $ | 1,014.98 | | | $ | 9.89 | | | | 1.98 | % |
Class R | | $ | 1,000.00 | | | $ | 1,075.80 | | | $ | 7.51 | | | $ | 1,000.00 | | | $ | 1,017.55 | | | $ | 7.30 | | | | 1.46 | % |
| | 5 | | For each class of the Fund, expenses are equal to the annualized net expense ratio for the class, multiplied by the average account value over the period, multiplied by 181/365 (to reflect the one-half year period shown). |
| | 6 | | Hypothetical 5% annual return before expenses is calculated by pro rating the number of days in the most recent fiscal half year divided by 365. |
| | | | See “Disclosure of Expenses” on page 6 for further information on how expenses were calculated. |
| | | | | | |
| | | | | | | |
| | BLACKROCK MID CAP VALUE OPPORTUNITIES FUND | | JULY 31, 2014 | | 5 |
| Ÿ | | Institutional Shares are not subject to any sales charge. These shares bear no ongoing distribution or service fees and are available only to eligible investors. |
| Ÿ | | Investor A Shares are subject to a maximum initial sales charge (front-end load) of 5.25% and a service fee of 0.25% per year (but no distribution fee). Certain redemptions of these shares may be subject to a contingent deferred sales charge (“CDSC”) where no initial sales charge was paid at the time of purchase. |
| Ÿ | | Investor B Shares are subject to a maximum CDSC of 4.50% declining to 0% after six years. In addition, these shares are subject to a distribution fee of 0.75% per year and a service fee of 0.25% per year. These shares automatically convert to Investor A Shares after approximately eight years. (There is no initial sales charge for automatic share conversions.) All returns for periods greater than eight years reflect this conversion. These shares are only available through exchanges and dividend reinvestments by existing shareholders and for purchase by certain employer-sponsored retirement plans. |
| Ÿ | | Investor C Shares are subject to a 1.00% CDSC if redeemed within one year of purchase. In addition, these shares are subject to a distribution fee of 0.75% per year and a service fee of 0.25% per year. |
| Ÿ | | Class R Shares are not subject to any sales charge. These shares are subject to a distribution fee of 0.25% per year and a service fee of 0.25% per year. These shares are available only to certain employer-sponsored retirement plans and other similar plans. |
Performance information reflects past performance and does not guarantee future results. Current performance may be lower or higher than the performance data quoted. Refer to www.blackrock.com/funds to obtain performance data current to the most recent month end. Performance results do not reflect the deduction of taxes that a shareholder would pay on fund distributions or the redemption of fund shares. Figures shown in the performance table on the previous page assume reinvestment of all dividends and capital gain distributions, if any, at net asset value (“NAV”) on the ex-dividend date. Investment return and principal value of shares will fluctuate so that shares, when redeemed, may be worth more or less than their original cost. Dividends paid to each class of shares will vary because of the different levels of service, distribution and transfer agency fees applicable to each class, which are deducted from the income available to be paid to shareholders. The Fund’s investment advisor waived a portion of its investment advisory fee. Without such waiver, the Fund’s performance would have been lower.
Shareholders of the Fund may incur the following charges: (a) transactional expenses, such as sales charges; and (b) operating expenses, including investment advisory fees, service and distribution fees, including 12b-1 fees, and other Fund expenses. The expense example shown on the previous page (which is based on a hypothetical investment of $1,000 invested on February 1, 2014 and held through July 31, 2014) is intended to assist shareholders both in calculating expenses based on an investment in the Fund and in comparing these expenses with similar costs of investing in other mutual funds.
The expense example provides information about actual account values and actual expenses. In order to estimate the expenses a shareholder paid during the period covered by this report, shareholders can divide their account value by $1,000 and then multiply the result by the number corresponding to their share class under the heading entitled “Expenses Paid During the Period.”
The expense example also provides information about hypothetical account values and hypothetical expenses based on the Fund’s actual expense ratio and an assumed rate of return of 5% per year before expenses. In order to assist shareholders in comparing the ongoing expenses of investing in this Fund and other funds, compare the 5% hypothetical example with the 5% hypothetical examples that appear in other funds’ shareholder reports.
The expenses shown in the expense example are intended to highlight shareholders’ ongoing costs only and do not reflect any transactional expenses, such as sales charges, if any. Therefore, the hypothetical example is useful in comparing ongoing expenses only, and will not help shareholders determine the relative total expenses of owning different funds. If these transactional expenses were included, shareholder expenses would have been higher.
| | | | | | |
| | | | | | | |
| 6 | | BLACKROCK MID CAP VALUE OPPORTUNITIES FUND | | JULY 31, 2014 | | |
| | |
| Schedule of Investments July 31, 2014 (Unaudited) | | (Percentages shown are based on Net Assets) |
| | | | | | | | |
| Common Stocks | | Shares | | | Value | |
Aerospace & Defense — 1.1% | | | | | | | | |
Triumph Group, Inc. | | | 110,000 | | | $ | 6,968,500 | |
Airlines — 1.1% | | | | | | | | |
Delta Air Lines, Inc. | | | 186,100 | | | | 6,971,306 | |
Auto Components — 1.2% | | | | | | | | |
Lear Corp. | | | 47,641 | | | | 4,486,353 | |
Tenneco, Inc. (a) | | | 58,659 | | | | 3,736,578 | |
| | | | | | | | |
| | | | | 8,222,931 | |
Automobiles — 0.4% | | | | | | | | |
Thor Industries, Inc. | | | 44,804 | | | | 2,373,268 | |
Banks — 2.3% | | | | | | | | |
Bank of Hawaii Corp. | | | 50,500 | | | | 2,887,590 | |
Fulton Financial Corp. | | | 116,600 | | | | 1,322,244 | |
Popular, Inc. (a) | | | 124,700 | | | | 3,977,930 | |
Valley National Bancorp | | | 249,100 | | | | 2,386,378 | |
Webster Financial Corp. | | | 90,700 | | | | 2,600,369 | |
Zions Bancorporation | | | 58,000 | | | | 1,671,560 | |
| | | | | | | | |
| | | | | 14,846,071 | |
Capital Markets — 1.9% | | | | | | | | |
Ares Management LP (a)(b) | | | 185,100 | | | | 3,596,493 | |
Federated Investors, Inc., Class B | | | 141,700 | | | | 3,998,774 | |
Janus Capital Group, Inc. | | | 450,900 | | | | 5,135,751 | |
| | | | | | | | |
| | | | | 12,731,018 | |
Chemicals — 2.3% | | | | | | | | |
Albemarle Corp. | | | 102,600 | | | | 6,293,484 | |
Axiall Corp. | | | 83,107 | | | | 3,559,473 | |
Huntsman Corp. | | | 76,000 | | | | 1,979,800 | |
Rockwood Holdings, Inc. | | | 42,427 | | | | 3,349,187 | |
| | | | | | | | |
| | | | | 15,181,944 | |
Commercial Services & Supplies — 2.7% | | | | | | | | |
The ADT Corp. (b) | | | 229,454 | | | | 7,984,999 | |
Pitney Bowes, Inc. | | | 354,791 | | | | 9,600,645 | |
| | | | | | | | |
| | | | | 17,585,644 | |
Communications Equipment — 1.2% | | | | | | | | |
Knowles Corp. (a)(b) | | | 232,466 | | | | 6,760,111 | |
Plantronics, Inc. | | | 26,500 | | | | 1,244,705 | |
| | | | | | | | |
| | | | | 8,004,816 | |
Construction & Engineering — 1.4% | | | | | | | | |
KBR, Inc. | | | 192,300 | | | | 3,972,918 | |
Quanta Services, Inc. (a) | | | 161,200 | | | | 5,398,588 | |
| | | | | | | | |
| | | | | 9,371,506 | |
Construction Materials — 0.4% | | | | | | | | |
Martin Marietta Materials, Inc. | | | 19,400 | | | | 2,410,062 | |
Consumer Finance — 1.1% | | | | | | | | |
Discover Financial Services | | | 50,700 | | | | 3,095,742 | |
Springleaf Holdings, Inc. (a)(b) | | | 151,100 | | | | 3,955,798 | |
| | | | | | | | |
| | | | | 7,051,540 | |
Containers & Packaging — 2.1% | | | | | | | | |
MeadWestvaco Corp. | | | 71,300 | | | | 2,980,340 | |
Owens-Illinois, Inc. (a) | | | 152,800 | | | | 4,765,832 | |
Rock-Tenn Co., Class A | | | 63,500 | | | | 6,313,805 | |
| | | | | | | | |
| | | | | 14,059,977 | |
| Common Stocks | | Shares | | | Value | |
Diversified Consumer Services — 1.7% | | | | | | | | |
Apollo Education Group, Inc., Class A (a) | | | 236,806 | | | $ | 6,613,992 | |
ServiceMaster Global Holdings, Inc. (a) | | | 250,400 | | | | 4,399,528 | |
| | | | | | | | |
| | | | | 11,013,520 | |
Diversified Financial Services — 1.5% | | | | | | | | |
Equity Commonwealth | | | 303,361 | | | | 8,148,277 | |
FNFV Group (a) | | | 107,956 | | | | 1,766,160 | |
| | | | | | | | |
| | | | | 9,914,437 | |
Electric Utilities — 3.7% | | | | | | | | |
Hawaiian Electric Industries, Inc. (b) | | | 42,102 | | | | 994,449 | |
OGE Energy Corp. | | | 158,200 | | | | 5,687,290 | |
PNM Resources, Inc. | | | 260,500 | | | | 6,681,825 | |
Westar Energy, Inc. | | | 303,100 | | | | 10,923,724 | |
| | | | | | | | |
| | | | | 24,287,288 | |
Electrical Equipment — 0.7% | | | | | | | | |
AMETEK, Inc. | | | 91,650 | | | | 4,462,439 | |
Electronic Equipment, Instruments & Components — 2.0% | |
Arrow Electronics, Inc. (a) | | | 84,800 | | | | 4,914,160 | |
Ingram Micro, Inc., Class A (a) | | | 194,781 | | | | 5,590,215 | |
Trimble Navigation Ltd. (a) | | | 78,100 | | | | 2,413,290 | |
| | | | | | | | |
| | | | | 12,917,665 | |
Energy Equipment & Services — 4.2% | | | | | | | | |
Helix Energy Solutions Group, Inc. (a) | | | 323,200 | | | | 8,218,976 | |
McDermott International, Inc. (a)(b) | | | 543,247 | | | | 3,965,703 | |
Patterson-UTI Energy, Inc. | | | 133,600 | | | | 4,589,160 | |
Superior Energy Services, Inc. | | | 323,900 | | | | 10,883,040 | |
| | | | | | | | |
| | | | | 27,656,879 | |
Food & Staples Retailing — 1.1% | | | | | | | | |
Supervalu, Inc. (a)(b) | | | 817,600 | | | | 7,497,392 | |
Food Products — 2.4% | | | | | | | | |
Flowers Foods, Inc. | | | 236,816 | | | | 4,520,817 | |
Ingredion, Inc. | | | 38,657 | | | | 2,846,315 | |
The J.M. Smucker Co. | | | 21,930 | | | | 2,185,105 | |
Pinnacle Foods, Inc. | | | 102,313 | | | | 3,082,691 | |
Tyson Foods, Inc., Class A | | | 91,113 | | | | 3,390,315 | |
| | | | | | | | |
| | | | | 16,025,243 | |
Gas Utilities — 1.1% | | | | | | | | |
UGI Corp. | | | 154,100 | | | | 7,480,014 | |
Health Care Equipment & Supplies — 3.0% | | | | | | | | |
Teleflex, Inc. | | | 95,672 | | | | 10,307,701 | |
Thoratec Corp. (a) | | | 283,224 | | | | 9,204,780 | |
| | | | | | | | |
| | | | | 19,512,481 | |
Health Care Providers & Services — 1.6% | | | | | | | | |
Owens & Minor, Inc. | | | 314,404 | | | | 10,403,628 | |
Hotels, Restaurants & Leisure — 0.8% | | | | | | | | |
Wyndham Worldwide Corp. | | | 65,879 | | | | 4,977,158 | |
Household Durables — 1.7% | | | | | | | | |
Jarden Corp. (a) | | | 61,482 | | | | 3,436,844 | |
Lennar Corp., Class A | | | 79,269 | | | | 2,871,916 | |
Mohawk Industries, Inc. (a) | | | 39,306 | | | | 4,904,209 | |
| | | | | | | | |
| | | | | 11,212,969 | |
Household Products — 1.3% | | | | | | | | |
Energizer Holdings, Inc. | | | 72,961 | | | | 8,373,004 | |
See Notes to Financial Statements.
| | | | | | |
| | | | | | | |
| | BLACKROCK MID CAP VALUE OPPORTUNITIES FUND | | JULY 31, 2014 | | 7 |
| | |
| Schedule of Investments (continued) | | (Percentages shown are based on Net Assets) |
| | | | | | | | |
| Common Stocks | | Shares | | | Value | |
Insurance — 2.3% | | | | | | | | |
FNF Group (a) | | | 313,000 | | | $ | 8,485,430 | |
The Hanover Insurance Group, Inc. | | | 76,000 | | | | 4,393,560 | |
Kemper Corp. | | | 17,193 | | | | 595,050 | |
Voya Financial, Inc. | | | 48,787 | | | | 1,809,997 | |
| | | | | | | | |
| | | | | 15,284,037 | |
Internet Software & Services — 0.9% | | | | | | | | |
AOL, Inc. (a) | | | 154,200 | | | | 5,944,410 | |
IT Services — 1.3% | | | | | | | | |
Amdocs Ltd. | | | 66,200 | | | | 3,001,508 | |
Euronet Worldwide, Inc. (a) | | | 105,366 | | | | 5,272,515 | |
| | | | | | | | |
| | | | | 8,274,023 | |
Life Sciences Tools & Services — 1.4% | | | | | | | | |
Waters Corp. (a) | | | 91,016 | | | | 9,414,695 | |
Machinery — 5.3% | | | | | | | | |
Crane Co. | | | 70,276 | | | | 4,821,636 | |
Dover Corp. | | | 64,800 | | | | 5,557,248 | |
Harsco Corp. | | | 189,800 | | | | 4,796,246 | |
Parker Hannifin Corp. | | | 54,300 | | | | 6,241,785 | |
SPX Corp. | | | 69,335 | | | | 6,873,179 | |
The Timken Co. | | | 147,100 | | | | 6,516,530 | |
| | | | | | | | |
| | | | | 34,806,624 | |
Media — 2.5% | | | | | | | | |
AMC Entertainment Holdings, Inc., Class A | | | 132,268 | | | | 2,994,548 | |
CBS Outdoor Americas, Inc. | | | 41,452 | | | | 1,379,937 | |
Markit Ltd. (a) | | | 69,300 | | | | 1,753,983 | |
Tribune Co., Class A (a) | | | 118,312 | | | | 9,760,740 | |
Tribune Publishing Co. (a) | | | 29,578 | | | | 622,025 | |
| | | | | | | | |
| | | | | 16,511,233 | |
Metals & Mining — 2.3% | | | | | | | | |
Carpenter Technology Corp. | | | 48,500 | | | | 2,625,790 | |
Cliffs Natural Resources, Inc. (b) | | | 39,000 | | | | 680,550 | |
Steel Dynamics, Inc. | | | 390,900 | | | | 8,290,989 | |
TimkenSteel Corp. (a) | | | 73,550 | | | | 3,200,161 | |
| | | | | | | | |
| | | | | 14,797,490 | |
Multi-Utilities — 3.4% | | | | | | | | |
Alliant Energy Corp. | | | 175,000 | | | | 9,887,500 | |
MDU Resources Group, Inc. | | | 149,200 | | | | 4,701,292 | |
TECO Energy, Inc. | | | 453,300 | | | | 7,914,618 | |
| | | | | | | | |
| | | | | 22,503,410 | |
Oil, Gas & Consumable Fuels — 4.9% | | | | | | | | |
Africa Oil Corp. (a)(b) | | | 479,427 | | | | 2,937,197 | |
Bill Barrett Corp. (a)(b) | | | 230,568 | | | | 5,535,938 | |
Murphy USA, Inc. (a) | | | 143,922 | | | | 7,112,625 | |
Oasis Petroleum, Inc. (a)(b) | | | 149,956 | | | | 8,015,148 | |
Parsley Energy, Inc., Class A (a) | | | 51,600 | | | | 1,164,612 | |
SM Energy Co. | | | 55,800 | | | | 4,382,532 | |
Whiting Petroleum Corp. (a) | | | 30,500 | | | | 2,698,945 | |
| | | | | | | | |
| | | | | 31,846,997 | |
Paper & Forest Products — 0.7% | | | | | | | | |
Domtar Corp. | | | 121,900 | | | | 4,378,648 | |
Pharmaceuticals — 2.1% | | | | | | | | |
Hospira, Inc. (a)(b) | | | 147,931 | | | | 8,205,733 | |
Mallinckrodt PLC (a)(b) | | | 76,004 | | | | 5,291,398 | |
| | | | | | | | |
| | | | | 13,497,131 | |
| Common Stocks | | Shares | | | Value | |
Professional Services — 0.4% | | | | | | | | |
Manpowergroup, Inc. | | | 32,700 | | | $ | 2,547,003 | |
Real Estate Investment Trusts (REITs) — 7.3% | | | | | | | | |
American Campus Communities, Inc. | | | 287,108 | | | | 11,174,243 | |
BioMed Realty Trust, Inc. | | | 375,982 | | | | 8,083,613 | |
Corporate Office Properties Trust (b) | | | 376,215 | | | | 10,673,219 | |
LTC Properties, Inc. | | | 235,133 | | | | 9,012,648 | |
Tanger Factory Outlet Centers | | | 259,767 | | | | 9,000,927 | |
| | | | | | | | |
| | | | | 47,944,650 | |
Real Estate Management & Development — 2.1% | |
Alexander & Baldwin, Inc. | | | 234,159 | | | | 8,937,849 | |
Forest City Enterprises, Inc., Class A (a) | | | 254,971 | | | | 4,887,794 | |
| | | | | | | | |
| | | | | 13,825,643 | |
Road & Rail — 1.0% | | | | | | | | |
Con-way, Inc. | | | 127,300 | | | | 6,282,255 | |
Semiconductors & Semiconductor Equipment — 3.5% | |
First Solar, Inc. (a) | | | 54,500 | | | | 3,439,495 | |
Microchip Technology, Inc. | | | 70,000 | | | | 3,151,400 | |
RF Micro Devices, Inc. (a) | | | 420,933 | | | | 4,697,612 | |
Semtech Corp. (a) | | | 160,900 | | | | 3,592,897 | |
Skyworks Solutions, Inc. | | | 157,300 | | | | 7,984,548 | |
| | | | | | | | |
| | | | | 22,865,952 | |
Software — 2.8% | | | | | | | | |
Check Point Software Technologies Ltd. (a)(b) | | | 75,900 | | | | 5,151,333 | |
PTC, Inc. (a) | | | 144,175 | | | | 5,184,533 | |
Synopsys, Inc. (a) | | | 31,600 | | | | 1,193,532 | |
TIBCO Software, Inc. (a) | | | 347,400 | | | | 6,704,820 | |
| | | | | | | | |
| | | | | 18,234,218 | |
Specialty Retail — 3.4% | | | | | | | | |
Abercrombie & Fitch Co., Class A | | | 218,855 | | | | 8,609,756 | |
Foot Locker, Inc. | | | 193,830 | | | | 9,212,740 | |
Office Depot, Inc. (a)(b) | | | 844,005 | | | | 4,228,465 | |
| | | | | | | | |
| | | | | 22,050,961 | |
Technology Hardware, Storage & Peripherals — 0.5% | |
NCR Corp. (a) | | | 60,525 | | | | 1,873,249 | |
NetApp, Inc. | | | 37,900 | | | | 1,472,036 | |
| | | | | | | | |
| | | | | 3,345,285 | |
Textiles, Apparel & Luxury Goods — 1.4% | | | | | | | | |
Deckers Outdoor Corp. (a) | | | 47,553 | | | | 4,208,916 | |
Hanesbrands, Inc. | | | 19,147 | | | | 1,870,853 | |
PVH Corp. | | | 29,786 | | | | 3,281,822 | |
| | | | | | | | |
| | | | | 9,361,591 | |
Thrifts & Mortgage Finance — 0.8% | | | | | | | | |
New York Community Bancorp, Inc. | | | 316,400 | | | | 5,024,432 | |
Trading Companies & Distributors — 0.4% | | | | | | | | |
MSC Industrial Direct Co., Inc., Class A | | | 34,700 | | | | 2,959,563 | |
Total Long-Term Investments (Cost — $490,090,457) — 96.7% | | | | 633,212,951 | |
| | | | | | | | |
| | | | | | | | | |
| | |
| Short-Term Securities | | | | | | |
BlackRock Liquidity Funds, TempFund, Institutional Class, 0.03% (c)(d) | | | 15,068,671 | | | | 15,068,671 | |
See Notes to Financial Statements.
| | | | | | |
| | | | | | | |
| 8 | | BLACKROCK MID CAP VALUE OPPORTUNITIES FUND | | JULY 31, 2014 | | |
| | |
| Schedule of Investments (continued) | | (Percentages shown are based on Net Assets) |
| | | | | | | | |
| | |
| Short-Term Securities | | Beneficial
Interest (000) | | | Value | |
BlackRock Liquidity Series, LLC,
Money Market Series, 0.19% (c)(d)(e) | | $ | 63,278 | | | $ | 63,278,219 | |
Total Short-Term Securities (Cost — $78,346,890) — 11.9% | | | | 78,346,890 | |
| Total Investments (Cost — $568,437,347) — 108.6% | | | | 711,559,841 | |
| Liabilities in Excess of Other Assets — (8.6)% | | | | (56,488,898 | ) |
| | | | | | | | |
| Net Assets — 100.0% | | | $ | 655,070,943 | |
| | | | | | | | |
|
| Notes to Schedule of Investments |
| (a) | | Non-income producing security. |
| (b) | | Security, or a portion of security, is on loan. |
| (c) | | Investments in issuers considered to be an affiliate of the Fund during the six months ended July 31, 2014, for purposes of Section 2(a)(3) of the Investment Company Act of 1940, as amended, were as follows: |
| | | | | | | | | | | | | | | | |
| Affiliate | | Shares/Beneficial Interest Held at
January 31, 2014 | | | Net
Activity | | | Shares/Beneficial Interest Held at
July 31, 2014 | | | Income | |
BlackRock Liquidity Funds, TempFund, Institutional Class | | | — | | | | 15,068,671 | | | | 15,068,671 | | | $ | 1,785 | |
BlackRock Liquidity Series, LLC, Money Market Series | | $ | 53,146,852 | | | $ | 10,131,367 | | | $ | 63,278,219 | | | $ | 398,075 | |
| (d) | | Represents the current yield as of report date. |
| (e) | | Security was purchased with the cash collateral from loaned securities. The Fund may withdraw up to 25% of its investment daily, although the manager of the BlackRock Liquidity Series, LLC, Money Market Series, in its sole discretion, may permit an investor to withdraw more than 25% on any one day. |
| Ÿ | | For Fund compliance purposes, the Fund’s industry classifications refer to any one or more of the industry sub-classifications used by one or more widely recognized market indexes or rating group indexes, and/or as defined by the investment advisor. These definitions may not apply for purposes of this report, which may combine such industry sub-classifications for reporting ease. |
| Ÿ | | Fair Value Measurements — Various inputs are used in determining the fair value of investments. These inputs to valuation techniques are categorized into a disclosure hierarchy consisting of three broad levels for financial statement purposes as follows: |
| | Ÿ | | Level 1 — unadjusted price quotations in active markets/exchanges for identical assets or liabilities that the Fund has the ability to access |
| | Ÿ | | Level 2 — other observable inputs (including, but not limited to, quoted prices for similar assets or liabilities in markets that are active, quoted prices for identical or similar assets or liabilities in markets that are not active, inputs other than quoted prices that are observable for the assets or liabilities (such as interest rates, yield curves, volatilities, prepayment speeds, loss severities, credit risks and default rates) or other market-corroborated inputs) |
| | Ÿ | | Level 3 — unobservable inputs based on the best information available in the circumstances, to the extent observable inputs are not available (including the Fund’s own assumptions used in determining the fair value of investments) |
The hierarchy gives the highest priority to unadjusted quoted prices in active markets for identical assets or liabilities (Level 1 measurements) and the lowest priority to unobservable inputs (Level 3 measurements). Accordingly, the degree of judgment exercised in determining fair value is greatest for instruments categorized in Level 3. The inputs used to measure fair value may fall into different levels of the fair value hierarchy. In such cases, for disclosure purposes, the fair value hierarchy classification is determined based on the lowest level input that is significant to the fair value measurement in its entirety.
Changes in valuation techniques may result in transfers into or out of an assigned level within the disclosure hierarchy. In accordance with the Fund’s policy, transfers between different levels of the fair value disclosure hierarchy are deemed to have occurred as of the beginning of the reporting period. The categorization of a value determined for investments is based on the pricing transparency of the investment and is not necessarily an indication of the risks associated with investing in those securities. For information about the Fund’s policy regarding valuation of investments, please refer to Note 2 of the Notes to Financial Statements.
The following table summarizes the Fund’s investments categorized in the disclosure hierarchy as of July 31, 2014:
| | | | | | | | | | | | | | |
| | | Level 1 | | | Level 2 | | | Level 3 | | Total | |
Assets: | | | | | | | | | | | | | | |
| Investments: | | | | | | | | | | | | | | |
Long-Term Investments1 | | $ | 633,212,951 | | | | — | | | — | | $ | 633,212,951 | |
Short-Term Securities | | | 15,068,671 | | | $ | 63,278,219 | | | — | | | 78,346,890 | |
| | | | |
Total | | $ | 648,281,622 | | | $ | 63,278,219 | | | — | | $ | 711,559,841 | |
| | | | |
1 See above Schedule of Investments for values in each industry. | | | | |
See Notes to Financial Statements.
| | | | | | |
| | | | | | | |
| | BLACKROCK MID CAP VALUE OPPORTUNITIES FUND | | JULY 31, 2014 | | 9 |
| | |
| Schedule of Investments (concluded) | | |
The Fund may hold assets and/or liabilities in which the fair value approximates the carrying amount for financial statement purposes. As of July 31, 2014, such assets and/or liabilities are categorized within the disclosure hierarchy as follows:
| | | | | | | | | | | | | | |
| | | Level 1 | | | Level 2 | | | Level 3 | | Total | |
Assets: | | | | | | | | | | | | | | |
Foreign currency at value | | $ | 198 | | | | — | | | — | | $ | 198 | |
Liabilities: | | | | | | | | | | | | | | |
Collateral on securities loaned at value | | | — | | | $ | (63,278,219 | ) | | — | | | (63,278,219 | ) |
| | | | |
Total | | $ | 198 | | | $ | (63,278,219 | ) | | — | | $ | (63,278,021 | ) |
| | | | |
There were no transfers between levels during the six months ended July 31, 2014.
See Notes to Financial Statements.
| | | | | | |
| | | | | | | |
| 10 | | BLACKROCK MID CAP VALUE OPPORTUNITIES FUND | | JULY 31, 2014 | | |
| | |
| Statement of Assets and Liabilities | | |
| | | | |
| July 31, 2014 (Unaudited) | | | |
| | | | |
| Assets | | | | |
Investments at value — unaffiliated (including securities loaned of $60,617,267) (cost — $490,090,457) | | $ | 633,212,951 | |
Investments at value — affiliated (cost — $78,346,890) | | | 78,346,890 | |
Investments sold receivable | | | 9,653,163 | |
Capital shares sold receivable | | | 1,133,846 | |
Dividends receivable | | | 373,259 | |
Securities lending income receivable — affiliated | | | 39,703 | |
Foreign currency at value (cost — $202) | | | 198 | |
Prepaid expenses | | | 47,993 | |
| | | | |
Total assets | | | 722,808,003 | |
| | | | |
| | | | |
| Liabilities | | | | |
Collateral on securities loaned at value | | | 63,278,219 | |
Capital shares redeemed payable | | | 1,893,592 | |
Investments purchased payable | | | 1,671,499 | |
Investment advisory fees payable | | | 373,666 | |
Service and distribution fees payable | | | 173,019 | |
Officer’s and Directors’ fees payable | | | 3,310 | |
Other affiliates payable | | | 1,336 | |
Other accrued expenses payable | | | 342,419 | |
| | | | |
Total liabilities | | | 67,737,060 | |
| | | | |
Net Assets | | $ | 655,070,943 | |
| | | | |
| | | | |
| Net Assets Consist of | | | | |
Paid-in capital | | $ | 477,061,756 | |
Undistributed net investment income | | | 988,182 | |
Accumulated net realized gain | | | 33,898,515 | |
Net unrealized appreciation/depreciation | | | 143,122,490 | |
| | | | |
Net Assets | | $ | 655,070,943 | |
| | | | |
| | | | |
| Net Asset Value | | | | |
Institutional — Based on net assets of $173,233,952 and 7,082,345 shares outstanding, 20 million shares authorized, $0.10 par value | | $ | 24.46 | |
| | | | |
Investor A — Based on net assets of $333,108,435 and 14,014,704 shares outstanding, 40 million shares authorized, $0.10 par value | | $ | 23.77 | |
| | | | |
Investor B — Based on net assets of $1,650,983 and 77,140 shares outstanding, 40 million shares authorized, $0.10 par value | | $ | 21.40 | |
| | | | |
Investor C — Based on net assets of $75,071,395 and 3,595,229 shares outstanding, 40 million shares authorized, $0.10 par value | | $ | 20.88 | |
| | | | |
Class R — Based on net assets of $72,006,178 and 3,285,689 shares outstanding, 40 million shares authorized, $0.10 par value | | $ | 21.92 | |
| | | | |
| | | | | | |
| See Notes to Financial Statements. | | | | |
| | | | | | | |
| | BLACKROCK MID CAP VALUE OPPORTUNITIES FUND | | JULY 31, 2014 | | 11 |
| | | | |
| Six Months Ended July 31, 2014 (Unaudited) | |
| | | | |
| Investment Income | | | | |
Dividends — unaffiliated | | $ | 4,592,111 | |
Securities lending — affiliated — net | | | 398,075 | |
Dividends — affiliated | | | 1,785 | |
| | | | |
Total income | | | 4,991,971 | |
| | | | |
| | | | |
| Expenses | | | | |
Investment advisory | | | 2,204,186 | |
Service — Investor A | | | 418,081 | |
Service and distribution — Investor B | | | 10,709 | |
Service and distribution — Investor C | | | 377,645 | |
Service and distribution — Class R | | | 180,887 | |
Transfer agent — Institutional | | | 132,792 | |
Transfer agent — Investor A | | | 273,821 | |
Transfer agent — Investor B | | | 4,334 | |
Transfer agent — Investor C | | | 97,820 | |
Transfer agent — Class R | | | 87,435 | |
Accounting services | | | 70,800 | |
Registration | | | 47,634 | |
Professional | | | 40,039 | |
Custodian | | | 31,721 | |
Printing | | | 30,453 | |
Officer and Directors | | | 12,303 | |
Miscellaneous | | | 13,722 | |
| | | | |
Total expenses | | | 4,034,382 | |
Less fees waived by Manager | | | (3,456 | ) |
| | | | |
Total expenses after fees waived | | | 4,030,926 | |
| | | | |
Net investment income | | | 961,045 | |
| | | | |
| | | | |
| Realized and Unrealized Gain | | | | |
| Net realized gain from: | | | | |
Investments | | | 36,119,825 | |
Foreign currency transactions | | | 683 | |
| | | | |
| | | 36,120,508 | |
| | | | |
| Net change in unrealized appreciation/depreciation on: | | | | |
Investments | | | 14,479,222 | |
Foreign currency translations | | | 42 | |
| | | | |
| | | 14,479,264 | |
| | | | |
Net realized and unrealized gain | | | 50,599,772 | |
| | | | |
Net Increase in Net Assets Resulting from Operations | | $ | 51,560,817 | |
| | | | |
| | | | | | |
| See Notes to Financial Statements. | | | | |
| | | | | | | |
| 12 | | BLACKROCK MID CAP VALUE OPPORTUNITIES FUND | | JULY 31, 2014 | | |
| | |
| Statements of Changes in Net Assets | | |
| | | | |
| Increase (Decrease) in Net Assets: | | Six Months Ended July 31, 2014 (Unaudited) | | Year Ended January 31, 2014 |
| | | | |
| Operations | | | | |
| | | | | | | | |
Net investment income | | $ | 961,045 | | | $ | 2,146,133 | |
Net realized gain | | | 36,120,508 | | | | 64,322,740 | |
Net change in unrealized appreciation/depreciation | | | 14,479,264 | | | | 39,519,501 | |
| | | | | | | | |
Net increase in net assets resulting from operations | | | 51,560,817 | | | | 105,988,374 | |
| | | | | | | | |
| | | | | | | | |
| Dividends and Distributions to Shareholders From | | | | | | | | |
| Net investment income | | | | | | | | |
Institutional | | | — | | | | (1,190,954 | )1 |
Investor A | | | — | | | | (1,314,148 | )1 |
Investor B | | | — | | | | (799 | )1 |
Investor C | | | — | | | | (15,651 | )1 |
Class R | | | — | | | | (131,732 | )1 |
| Net realized gain | | | | | | | | |
Institutional | | | (4,746,647 | ) | | | (10,060,513 | )1 |
Investor A | | | (9,360,857 | ) | | | (17,465,475 | )1 |
Investor B | | | (50,195 | ) | | | (145,966 | )1 |
Investor C | | | (2,349,874 | ) | | | (4,512,688 | )1 |
Class R | | | (2,193,987 | ) | | | (4,260,318 | )1 |
| | | | | | | | |
Decrease in net assets resulting from dividends and distributions to shareholders | | | (18,701,560 | ) | | | (39,098,244 | ) |
| | | | | | | | |
| | | | | | | | |
| Capital Share Transactions | | | | | | | | |
Net increase (decrease) in net assets derived from capital share transactions | | | (18,837,673 | ) | | | 101,453,635 | |
| | | | | | | | |
| | | | | | | | |
| Net Assets | | | | | | | | |
Total increase in net assets | | | 14,021,584 | | | | 168,343,765 | |
Beginning of period | | | 641,049,359 | | | | 472,705,594 | |
| | | | | | | | |
End of period | | $ | 655,070,943 | | | $ | 641,049,359 | |
| | | | | | | | |
Undistributed net investment income, end of period | | $ | 988,182 | | | $ | 27,137 | |
| | | | | | | | |
| | 1 | | Dividends and distributions for annual periods determined in accordance with federal income tax regulations. |
| | | | | | |
| See Notes to Financial Statements. | | | | |
| | | | | | | |
| | BLACKROCK MID CAP VALUE OPPORTUNITIES FUND | | JULY 31, 2014 | | 13 |
| | |
| Financial Highlights | | BlackRock Mid Cap Value Opportunities Fund |
| | | | | | | | | | | | |
| | | Institutional |
| | | Six Months Ended
July 31,
2014
(Unaudited) | | Year Ended January 31, |
| | | | 2014 | | 2013 | | 2012 | | 2011 | | 2010 |
| | | | | | | | | | | | |
| Per Share Operating Performance | | | | | | | | | | | | |
| | | | | | | | | | | | | | | | | | | | | | | | | | |
Net asset value, beginning of period | | | | $ | 23.30 | | | $ | 20.43 | | | $ | 17.92 | | | $ | 17.48 | | | $ | 13.08 | | | $ | 9.37 | |
| | | | | | |
Net investment income1 | | | | | 0.08 | | | | 0.17 | | | | 0.13 | | | | 0.12 | | | | 0.14 | | | | 0.06 | |
Net realized and unrealized gain | | | | | 1.77 | | | | 4.23 | | | | 2.56 | | | | 0.43 | | | | 4.26 | | | | 3.73 | |
| | | | | | |
Net increase from investment operations | | | | | 1.85 | | | | 4.40 | | | | 2.69 | | | | 0.55 | | | | 4.40 | | | | 3.79 | |
| | | | | | |
| Dividends and distributions from: | | | | | | | | | | | | | | | | | | | | | | | | | | |
Net investment income | | | | | — | | | | (0.17 | )2 | | | (0.18 | )2 | | | (0.11 | )2 | | | — | | | | (0.08 | )2 |
Net realized gain | | | | | (0.69 | ) | | | (1.36 | )2 | | | — | | | | — | | | | — | | | | — | |
| | | | | | |
Total dividends and distributions | | | | | (0.69 | ) | | | (1.53 | ) | | | (0.18 | ) | | | (0.11 | ) | | | — | | | | (0.08 | ) |
| | | | | | |
Net asset value, end of period | | | | $ | 24.46 | | | $ | 23.30 | | | $ | 20.43 | | | $ | 17.92 | | | $ | 17.48 | | | $ | 13.08 | |
| | | | | | |
| | | | | | | | | | | | | | | | | | | | | | | | | | |
| Total Return3 | | | | | | | | | | | | | | | | | | | | | | | | | | |
Based on net asset value | | | | | 7.89% | 4 | | | 21.66% | | | | 15.12% | | | | 3.10% | | | | 33.64% | | | | 40.63% | 5 |
| | | | | | |
| | | | | | | | | | | | | | | | | | | | | | | | | | |
| Ratios to Average Net Assets | | | | | | | | | | | | | | | | | | | | | | | | | | |
Total expenses | | | | | 0.86% | 6,7 | | | 0.86% | 8 | | | 0.89% | | | | 0.89% | | | | 0.94% | | | | 1.04% | |
| | | | | | |
Total expenses after fees waived | | | | | 0.86% | 6,7 | | | 0.86% | 8 | | | 0.89% | | | | 0.88% | | | | 0.94% | | | | 1.04% | |
| | | | | | |
Net investment income | | | | | 0.64% | 6,7 | | | 0.73% | 8 | | | 0.73% | | | | 0.70% | | | | 0.93% | | | | 0.53% | |
| | | | | | |
| | | | | | | | | | | | | | | | | | | | | | | | | | |
| Supplemental Data | | | | | | | | | | | | | | | | | | | | | | | | | | |
Net assets, end of period (000) | | | | $ | 173,234 | | | $ | 182,951 | | | $ | 133,748 | | | $ | 120,322 | | | $ | 83,905 | | | $ | 60,549 | |
| | | | | | |
Portfolio turnover rate | | | | | 25% | | | | 57% | | | | 55% | | | | 68% | | | | 54% | | | | 106% | |
| | | | | | |
| | 1 | | Based on average shares outstanding. |
| | 2 | | Dividends and distributions for annual periods determined in accordance with federal income tax regulations. |
| | 3 | | Where applicable, assumes the reinvestment of dividends and distributions. |
| | 4 | | Aggregate total return. |
| | 5 | | Includes proceeds received from a settlement of litigation which impacted the Fund’s total return. Not including these proceeds, the total return would have been 40.20%. |
| | 7 | | Ratios do not include expenses incurred indirectly as a result of investments in underlying funds of approximately 0.04%. |
| | 8 | | Ratios do not include expenses incurred indirectly as a result of investments in underlying funds of approximately 0.02%. |
| | | | | | |
| See Notes to Financial Statements. | | | | |
| | | | | | | |
| 14 | | BLACKROCK MID CAP VALUE OPPORTUNITIES FUND | | JULY 31, 2014 | | |
| | |
| Financial Highlights (continued) | | BlackRock Mid Cap Value Opportunities Fund |
| | | | | | | | | | | | |
| | | Investor A |
| | | Six Months Ended
July 31,
2014
(Unaudited) | | Year Ended January 31, |
| | | 2014 | | 2013 | | 2012 | | 2011 | | 2010 |
| | | | | | | | | | | | |
| Per Share Operating Performance | | | | | | | | | | | | |
| | | | | | | | | | | | | | | | | | | | | | | | | | |
Net asset value, beginning of period | | | | $ | 22.69 | | | $ | 19.94 | | | $ | 17.44 | | | $ | 17.04 | | | $ | 12.79 | | | $ | 9.16 | |
| | | | | | |
Net investment income1 | | | | | 0.04 | | | | 0.10 | | | | 0.07 | | | | 0.06 | | | | 0.09 | | | | 0.02 | |
Net realized and unrealized gain (loss) | | | | | 1.72 | | | | 4.12 | | | | 2.49 | | | | 0.41 | | | | 4.16 | | | | 3.65 | |
| | | | | | |
Net increase from investment operations | | | | | 1.76 | | | | 4.22 | | | | 2.56 | | | | 0.47 | | | | 4.25 | | | | 3.67 | |
| | | | | | |
| Dividends and distributions from: | | | | | | | | | | | | | | | | | | | | | | | | | | |
Net investment income | | | | | — | | | | (0.11 | )2 | | | (0.06 | )2 | | | (0.07 | )2 | | | — | | | | (0.04 | )2 |
Net realized gain | | | | | (0.68 | ) | | | (1.36 | )2 | | | — | | | | — | | | | — | | | | — | |
| | | | | | |
Total dividends and distributions | | | | | (0.68 | ) | | | (1.47 | ) | | | (0.06 | ) | | | (0.07 | ) | | | — | | | | (0.04 | ) |
| | | | | | |
Net asset value, end of period | | | | $ | 23.77 | | | $ | 22.69 | | | $ | 19.94 | | | $ | 17.44 | | | $ | 17.04 | | | $ | 12.79 | |
| | | | | | |
| | | | | | | | | | | | | | | | | | | | | | | | | | |
| Total Return3 | | | | | | | | | | | | | | | | | | | | | | | | | | |
Based on net asset value | | | | | 7.74% | 4 | | | 21.27% | | | | 14.74% | | | | 2.73% | | | | 33.23% | | | | 40.10% | 5 |
| | | | | | |
| | | | | | | | | | | | | | | | | | | | | | | | | | |
| Ratios to Average Net Assets | | �� | | | | | | | | | | | | | | | | | | | | | | | | |
Total expenses | | | | | 1.14% | 6,7 | | | 1.16% | 8 | | | 1.25% | | | | 1.22% | | | | 1.28% | | | | 1.42% | |
| | | | | | |
Total expenses after fees waived | | | | | 1.14% | 6,7 | | | 1.16% | 8 | | | 1.25% | | | | 1.21% | | | | 1.28% | | | | 1.42% | |
| | | | | | |
Net investment income | | | | | 0.33% | 6,7 | | | 0.43% | 8 | | | 0.37% | | | | 0.36% | | | | 0.59% | | | | 0.17% | |
| | | | | | |
| | | | | | | | | | | | | | | | | | | | | | | | | | |
| Supplemental Data | | | | | | | | | | | | | | | | | | | | | | | | | | |
Net assets, end of period (000) | | | | $ | 333,108 | | | $ | 314,481 | | | $ | 215,469 | | | $ | 182,931 | | | $ | 152,037 | | | $ | 101,184 | |
| | | | | | |
Portfolio turnover rate | | | | | 25% | | | | 57% | | | | 55% | | | | 68% | | | | 54% | | | | 106% | |
| | | | | | |
| | 1 | | Based on average shares outstanding. |
| | 2 | | Dividends and distributions for annual periods determined in accordance with federal income tax regulations. |
| | 3 | | Where applicable, excludes the effects of any sales charges and assumes the reinvestment of dividends and distributions. |
| | 4 | | Aggregate total return. |
| | 5 | | Includes proceeds received from a settlement of litigation which impacted the Fund’s total return. Not including these proceeds, the total return would have been 39.66%. |
| | 7 | | Ratios do not include expenses incurred indirectly as a result of investments in underlying funds of approximately 0.04%. |
| | 8 | | Ratios do not include expenses incurred indirectly as a result of investments in underlying funds of approximately 0.02%. |
| | | | | | |
| See Notes to Financial Statements. | | | | |
| | | | | | | |
| | BLACKROCK MID CAP VALUE OPPORTUNITIES FUND | | JULY 31, 2014 | | 15 |
| | |
| Financial Highlights (continued) | | BlackRock Mid Cap Value Opportunities Fund |
| | | | | | | | | | | | |
| | | Investor B |
| | | Six Months Ended
July 31,
2014
(Unaudited) | | Year Ended January 31, |
| | | | 2014 | | 2013 | | 2012 | | 2011 | | 2010 |
| | | | | | | | | | | | |
| Per Share Operating Performance | | | | | | | | | | | | |
| | | | | | | | | | | | | | | | | | | | | | | | | | |
Net asset value, beginning of period | | | | $ | 20.58 | | | $ | 18.16 | | | $ | 15.97 | | | $ | 15.69 | | | $ | 11.88 | | | $ | 8.55 | |
| | | | | | |
Net investment loss1 | | | | | (0.06 | ) | | | (0.09 | ) | | | (0.10 | ) | | | (0.09 | ) | | | (0.04 | ) | | | (0.08 | ) |
Net realized and unrealized gain | | | | | 1.55 | | | | 3.75 | | | | 2.29 | | | | 0.37 | | | | 3.85 | | | | 3.41 | |
| | | | | | |
Net increase from investment operations | | | | | 1.49 | | | | 3.66 | | | | 2.19 | | | | 0.28 | | | | 3.81 | | | | 3.33 | |
| | | | | | |
| Dividends and distributions from: | | | | | | | | | | | | | | | | | | | | | | | | | | |
Net investment income | | | | | — | | | | (0.01 | )2 | | | — | | | | — | | | | — | | | | — | |
Net realized gain | | | | | (0.67 | ) | | | (1.23 | )2 | | | — | | | | — | | | | — | | | | — | |
| | | | | | |
Total dividends and distributions | | | | | (0.67 | ) | | | (1.24 | ) | | | — | | | | — | | | | — | | | | — | |
| | | | | | |
Net asset value, end of period | | | | $ | 21.40 | | | $ | 20.58 | | | $ | 18.16 | | | $ | 15.97 | | | $ | 15.69 | | | $ | 11.88 | |
| | | | | | |
| | | | | | | | | | | | | | | | | | | | | | | | | | |
| Total Return3 | | | | | | | | | | | | | | | | | | | | | | | | | | |
Based on net asset value | | | | | 7.19% | 4 | | | 20.21% | | | | 13.71% | | | | 1.78% | | | | 32.07% | | | | 38.95% | 5 |
| | | | | | |
| | | | | | | | | | | | | | | | | | | | | | | | | | |
| Ratios to Average Net Assets | | | | | | | | | | | | | | | | | | | | | | | | | | |
Total expenses | | | | | 2.13% | 6,7 | | | 2.06% | 8 | | | 2.16% | | | | 2.15% | | | | 2.17% | | | | 2.26% | |
| | | | | | |
Total expenses after fees waived | | | | | 2.12% | 6,7 | | | 2.05% | 8 | | | 2.16% | | | | 2.15% | | | | 2.17% | | | | 2.26% | |
| | | | | | |
Net investment loss | | | | | (0.60)% | 6,7 | | | (0.46)% | 8 | | | (0.60)% | | | | (0.56)% | | | | (0.27)% | | | | (0.77)% | |
| | | | | | |
| | | | | | | | | | | | | | | | | | | | | | | | | | |
| Supplemental Data | | | | | | | | | | | | | | | | | | | | | | | | | | |
Net assets, end of period (000) | | | | $ | 1,651 | | | $ | 2,403 | | | $ | 3,310 | | | $ | 5,893 | | | $ | 8,551 | | | $ | 12,708 | |
| | | | | | |
Portfolio turnover rate | | | | | 25% | | | | 57% | | | | 55% | | | | 68% | | | | 54% | | | | 106% | |
| | | | | | |
| | 1 | | Based on average shares outstanding. |
| | 2 | | Dividends and distributions for annual periods determined in accordance with federal income tax regulations. |
| | 3 | | Where applicable, excludes the effects of any sales charges and assumes the reinvestment of dividends and distributions. |
| | 4 | | Aggregate total return. |
| | 5 | | Includes proceeds received from a settlement of litigation which impacted the Fund’s total return. Not including these proceeds, the total return would have been 38.60%. |
| | 7 | | Ratios do not include expenses incurred indirectly as a result of investments in underlying funds of approximately 0.04%. |
| | 8 | | Ratios do not include expenses incurred indirectly as a result of investments in underlying funds of approximately 0.02%. |
| | | | | | |
| See Notes to Financial Statements. | | | | |
| | | | | | | |
| 16 | | BLACKROCK MID CAP VALUE OPPORTUNITIES FUND | | JULY 31, 2014 | | |
| | |
| Financial Highlights (continued) | | BlackRock Mid Cap Value Opportunities Fund |
| | | | | | | | | | | | |
| | | Investor C |
| | | Six Months Ended
July 31,
2014
(Unaudited) | | Year Ended January 31, |
| | | | 2014 | | 2013 | | 2012 | | 2011 | | 2010 |
| | | | | | | | | | | | |
| Per Share Operating Performance | | | | | | | | | | | | |
| | | | | | | | | | | | | | | | | | | | | | | | | | |
Net asset value, beginning of period | | | | $ | 20.08 | | | $ | 17.80 | | | $ | 15.65 | | | $ | 15.39 | | | $ | 11.67 | | | $ | 8.41 | |
| | | | | | |
Net investment loss | | | | | (0.05 | ) | | | (0.08 | ) | | | (0.09 | ) | | | (0.09 | ) | | | (0.05 | ) | | | (0.09 | ) |
Net realized and unrealized gain1 | | | | | 1.52 | | | | 3.66 | | | | 2.24 | | | | 0.35 | | | | 3.77 | | | | 3.35 | |
| | | | | | |
Net increase from investment operations | | | | | 1.47 | | | | 3.58 | | | | 2.15 | | | | 0.26 | | | | 3.72 | | | | 3.26 | |
| | | | | | |
| Dividends and distributions from: | | | | | | | | | | | | | | | | | | | | | | | | | | |
Net investment income | | | | | — | | | | (0.00 | )2,3 | | | — | | | | — | | | | — | | | | — | |
Net realized gain | | | | | (0.67 | ) | | | (1.30 | )2 | | | — | | | | — | | | | — | | | | — | |
| | | | | | |
Total dividends and distributions | | | | | (0.67 | ) | | | (1.30 | ) | | | — | | | | — | | | | — | | | | — | |
| | | | | | |
Net asset value, end of period | | | | $ | 20.88 | | | $ | 20.08 | | | $ | 17.80 | | | $ | 15.65 | | | $ | 15.39 | | | $ | 11.67 | |
| | | | | | |
| | | | | | | | | | | | | | | | | | | | | | | | | | |
| Total Return4 | | | | | | | | | | | | | | | | | | | | | | | | | | |
Based on net asset value | | | | | 7.29% | 5 | | | 20.26% | | | | 13.74% | | | | 1.69% | | | | 31.88% | | | | 38.76% | 6 |
| | | | | | |
| | | | | | | | | | | | | | | | | | | | | | | | | | |
| Ratios to Average Net Assets | | | | | | | | | | | | | | | | | | | | | | | | | | |
Total expenses | | | | | 1.98% | 7,8 | | | 2.00% | 9 | | | 2.16% | | | | 2.17% | | | | 2.27% | | | | 2.48% | |
| | | | | | |
Total expenses after fees waived | | | | | 1.98% | 7,8 | | | 2.00% | 9 | | | 2.16% | | | | 2.16% | | | | 2.27% | | | | 2.47% | |
| | | | | | |
Net investment loss | | | | | (0.52)% | 7,8 | | | (0.41)% | 9 | | | (0.55)% | | | | (0.58)% | | | | (0.39)% | | | | (0.92)% | |
| | | | | | |
| | | | | | | | | | | | | | | | | | | | | | | | | | |
| Supplemental Data | | | | | | | | | | | | | | | | | | | | | | | | | | |
Net assets, end of period (000) | | | | $ | 75,071 | | | $ | 72,312 | | | $ | 61,756 | | | $ | 63,272 | | | $ | 70,795 | | | $ | 57,113 | |
| | | | | | |
Portfolio turnover rate | | | | | 25% | | | | 57% | | | | 55% | | | | 68% | | | | 54% | | | | 106% | |
| | | | | | |
| | 1 | | Based on average shares outstanding. |
| | 2 | | Dividends and distributions for annual periods determined in accordance with federal income tax regulations. |
| | 3 | | Amount is greater than $(0.005) per share. |
| | 4 | | Where applicable, excludes the effects of any sales charges and assumes the reinvestment of dividends and distributions. |
| | 5 | | Aggregate total return. |
| | 6 | | Includes proceeds received from a settlement of litigation which impacted the Fund’s total return. Not including these proceeds, the total return would have been 38.29%. |
| | 8 | | Ratios do not include expenses incurred indirectly as a result of investments in underlying funds of approximately 0.04%. |
| | 9 | | Ratios do not include expenses incurred indirectly as a result of investments in underlying funds of approximately 0.02%. |
| | | | | | |
| See Notes to Financial Statements. | | | | |
| | | | | | | |
| | BLACKROCK MID CAP VALUE OPPORTUNITIES FUND | | JULY 31, 2014 | | 17 |
| | |
| Financial Highlights (concluded) | | BlackRock Mid Cap Value Opportunities Fund |
| | | | | | | | | | | | |
| | | Class R |
| | | Six Months Ended
July 31,
2014
(Unaudited) | | Year Ended January 31, |
| | | | 2014 | | 2013 | | 2012 | | 2011 | | 2010 |
| | | | | | | | | | | | |
| Per Share Operating Performance | | | | | | | | | | | | |
| | | | | | | | | | | | | | | | | | | | | | | | | | |
Net asset value, beginning of period | | | | $ | 21.00 | | | $ | 18.55 | | | $ | 16.22 | | | $ | 15.85 | | | $ | 11.94 | | | $ | 8.56 | |
| | | | | | |
Net investment income (loss)1 | | | | | — | | | | 0.02 | | | | (0.00 | )2 | | | (0.00 | )2 | | | 0.03 | | | | (0.02 | ) |
Net realized and unrealized gain | | | | | 1.60 | | | | 3.83 | | | | 2.33 | | | | 0.37 | | | | 3.88 | | | | 3.40 | |
| | | | | | |
Net increase from investment operations | | | | | 1.60 | | | | 3.85 | | | | 2.33 | | | | 0.37 | | | | 3.91 | | | | 3.38 | |
| | | | | | |
| Dividends and distributions from: | | | | | | | | | | | | | | | | | | | | | | | | | | |
Net investment income | | | | | — | | | | (0.04 | )3 | | | — | | | | — | | | | — | | | | (0.00 | )2,3 |
Net realized gain | | | | | (0.68 | ) | | | (1.36 | )3 | | | — | | | | — | | | | — | | | | — | |
| | | | | | |
Total dividends and distributions | | | | | (0.68 | ) | | | (1.40 | ) | | | — | | | | — | | | | — | | | | (0.00 | )2 |
| | | | | | |
Net asset value, end of period | | | | $ | 21.92 | | | $ | 21.00 | | | $ | 18.55 | | | $ | 16.22 | | | $ | 15.85 | | | $ | 11.94 | |
| | | | | | |
| | | | | | | | | | | | | | | | | | | | | | | | | | |
| Total Return4 | |
Based on net asset value | | | | | 7.58% | 5 | | | 20.88% | | | | 14.37% | | | | 2.33% | | | | 32.75% | | | | 39.50% | 6 |
| | | | | | |
| | | | | | | | | | | | | | | | | | | | | | | | | | |
| Ratios to Average Net Assets | | | | | | | | | | | | | | | | | | | | | | | | | | |
Total expenses | | | | | 1.46% | 7,8 | | | 1.48% | 9 | | | 1.59% | | | | 1.60% | | | | 1.65% | | | | 1.81% | |
| | | | | | |
Total expenses after fees waived | | | | | 1.46% | 7,8 | | | 1.47% | 9 | | | 1.59% | | | | 1.60% | | | | 1.65% | | | | 1.80% | |
| | | | | | |
Net investment income (loss) | | | | | — | | | | 0.12% | 9 | | | 0.01% | | | | (0.02)% | | | | 0.22% | | | | (0.22)% | |
| | | | | | |
| | | | | | | | | | | | | | | | | | | | | | | | | | |
| Supplemental Data | | | | | | | | | | | | | | | | | | | | | | | | | | |
Net assets, end of period (000) | | | | $ | 72,006 | | | $ | 68,902 | | | $ | 58,422 | | | $ | 57,244 | | | $ | 71,394 | | | $ | 50,310 | |
| | | | | | |
Portfolio turnover rate | | | | | 25% | | | | 57% | | | | 55% | | | | 68% | | | | 54% | | | | 106% | |
| | | | | | |
| | 1 | | Based on average shares outstanding. |
| | 2 | | Amount is greater than $(0.005) per share. |
| | 3 | | Dividends and distributions for annual periods determined in accordance with federal income tax regulations. |
| | 4 | | Where applicable, assumes the reinvestment of dividends and distributions. |
| | 5 | | Aggregate total return. |
| | 6 | | Includes proceeds received from a settlement of litigation which impacted the Fund’s total return. Not including these proceeds, the total return would have been 39.15%. |
| | 8 | | Ratios do not include expenses incurred indirectly as a result of investments in underlying funds of approximately 0.04%. |
| | 9 | | Ratios do not include expenses incurred indirectly as a result of investments in underlying funds of approximately 0.02%. |
| | | | | | |
| See Notes to Financial Statements. | | | | |
| | | | | | | |
| 18 | | BLACKROCK MID CAP VALUE OPPORTUNITIES FUND | | JULY 31, 2014 | | |
| | | | |
| Notes to Financial Statements (Unaudited) | | |
1. Organization:
BlackRock Mid Cap Value Opportunities Fund (the “Fund”) of BlackRock Mid Cap Value Opportunities Series, Inc. (the “Corporation”) is registered under the Investment Company Act of 1940, as amended (the “1940 Act”), as a diversified, open-end management investment company. The Corporation is organized as a Maryland corporation.
The Fund offers multiple classes of shares. Institutional Shares are sold without a sales charge and only to certain eligible investors. Investor A Shares are generally sold with an initial sales charge and may be subject to a CDSC for certain redemptions where no initial sales charge was paid at the time of purchase. Investor B and Investor C Shares may be subject to a CDSC. Class R Shares are sold without a sales charge and only to certain employer-sponsored retirement plans. All classes of shares have identical voting, dividend, liquidation and other rights and are subject to the same terms and conditions, except that Investor A, Investor B, Investor C and Class R Shares bear certain expenses related to the shareholder servicing of such shares, and Investor B, Investor C and Class R Shares also bear certain expenses related to the distribution of such shares. Investor B Shares automatically convert to Investor A Shares after approximately eight years. Investor B Shares are only available through exchanges and dividend reinvestments by existing shareholders and for purchase by certain employer-sponsored retirement plans. Each class has exclusive voting rights with respect to matters relating to its shareholder servicing and distribution expenditures (except that Investor B shareholders may vote on material changes to the Investor A distribution and service plan).
The Fund, together with certain other registered investment companies advised by BlackRock Advisors, LLC (the “Manager”) or its affiliates, is included in a complex of open-end funds referred to as the Equity-Bond Complex.
2. Significant Accounting Policies:
The Fund’s financial statements are prepared in conformity with accounting principles generally accepted in the United States of America (“U.S. GAAP”), which may require management to make estimates and assumptions that affect the reported amounts of assets and liabilities in the financial statements and the reported amounts of increases and decreases in net assets from operations during the reporting period. Actual results could differ from those estimates. The Fund is considered an investment company under U.S. GAAP and follows the accounting and reporting guidance applicable to investment companies. The following is a summary of significant accounting policies followed by the Fund:
Valuation: U.S. GAAP defines fair value as the price the Fund would receive to sell an asset or pay to transfer a liability in an orderly transaction between market participants at the measurement date. The Fund determines the fair values of its financial instruments at market value using independent dealers or pricing services under policies approved by the Board of Directors of the Fund (the “Board”). The BlackRock Global Valuation Methodologies Committee (the “Global Valuation Committee”) is the committee formed by management to develop global pricing policies and procedures and to provide oversight of the pricing function for the Fund for all financial instruments.
Equity investments traded on a recognized securities exchange or the NASDAQ Stock Market (“NASDAQ”) are valued at the last reported sale price that day or the NASDAQ official closing price, if applicable. For equity investments traded on more than one exchange, the last reported sale price on the exchange where the stock is primarily traded is used. Equity investments traded on a recognized exchange for which there were no sales on that day are valued at the last available bid (long positions) or ask (short positions) price. Investments in open-end registered investment companies are valued at NAV each business day.
The Fund values its investments in BlackRock Liquidity Series, LLC, Money Market Series (the “Money Market Series”) at fair value, which is ordinarily based upon its pro rata ownership in the underlying fund’s net assets. The Money Market Series seeks current income consistent with maintaining liquidity and preserving capital. Although the Money Market Series is not registered under the 1940 Act, its investments will follow the parameters of investments by a money market fund that is subject to Rule 2a-7 under the 1940 Act. The Fund may withdraw up to 25% of its investment daily, although the manager of the Money Market Series, in its sole discretion, may permit an investor to withdraw more than 25% on any one day.
In the event that the application of these methods of valuation results in a price for an investment that is deemed not to be representative of the market value of such investment, or if a price is not available, the investment will be valued by the Global Valuation Committee, or its delegate, in accordance with a policy approved by the Board as reflecting fair value (“Fair Value Assets”). When determining the price for Fair Value Assets, the Global Valuation Committee, or its delegate, seeks to determine the price that each Fund might reasonably expect to receive from the current sale of that asset in an arm’s-length transaction. Fair value determinations shall be based upon all available factors that the Global Valuation Committee, or its delegate, deems relevant consistent with the principles of fair value measurement. The pricing of all Fair Value Assets is subsequently reported to the Board or a committee thereof on a quarterly basis.
| | | | | | |
| | | | | | | |
| | BLACKROCK MID CAP VALUE OPPORTUNITIES FUND | | JULY 31, 2014 | | 19 |
| | |
| Notes to Financial Statements (continued) | | |
Generally, trading in foreign instruments is substantially completed each day at various times prior to the close of business on the New York Stock Exchange (“NYSE”). Occasionally, events affecting the values of such instruments may occur between the foreign market close and the close of business on the NYSE that may not be reflected in the computation of the Fund’s net assets. If events (e.g., a company announcement, market volatility or a natural disaster) occur during such periods that are expected to materially affect the value of such instruments, those instruments may be Fair Value Assets and be valued at their fair value, as determined in good faith by the Global Valuation Committee, or its delegate, using a pricing service and/or policies approved by the Board. Each business day, the Fund uses a pricing service to assist with the valuation of certain foreign exchange-traded equity securities and foreign exchange-traded and over-the-counter options (the “Systematic Fair Value Price”). Using current market factors, the Systematic Fair Value Price is designed to value such foreign securities and foreign options at fair value as of the close of business on the NYSE, which follows the close of the local markets.
Foreign Currency: The Fund’s books and records are maintained in U.S. dollars. Purchases and sales of investment securities are recorded at the rates of exchange prevailing on the respective date of such transactions. Generally, when the U.S. dollar rises in value against a foreign currency, the Fund’s investments denominated in that currency will lose value because that currency is worth fewer U.S. dollars; the opposite effect occurs if the U.S. dollar falls in relative value.
The Fund does not isolate the portion of the results of operations arising as a result of changes in the foreign exchange rates from the changes in the market prices of investments held or sold for financial reporting purposes. Accordingly, the effects of changes in foreign currency exchange rates on investments are not segregated in the Statement of Operations from the effects of changes in market prices of those investments but are included as a component of net realized and unrealized gain (loss) from investments. The Fund reports realized currency gains (losses) on foreign currency related transactions as components of net realized gain (loss) for financial reporting purposes, whereas such components are generally treated as ordinary income for federal income tax purposes.
Investment Transactions and Investment Income: For financial reporting purposes, investment transactions are recorded on the dates the transactions are entered into (the trade dates). Realized gains and losses on investment transactions are determined on the identified cost basis. Dividend income is recorded on the ex-dividend date. Dividends from foreign securities where the ex-dividend date may have passed are subsequently recorded when the Fund is informed of the ex-dividend date. Under the applicable foreign tax laws, a withholding tax at various rates may be imposed on capital gains, dividends and interest. Upon notification from issuers, some of the dividend income received from a real estate investment trust may be redesignated as a reduction of cost of the related investment and/or realized gain. Interest income, including amortization and accretion of premiums and discounts on debt securities, is recognized on the accrual basis. Income, expenses and realized and unrealized gains and losses are allocated daily to each class based on its relative net assets.
Dividends and Distributions: Dividends and distributions paid by the Fund are recorded on the ex-dividend date. The character and timing of dividends and distributions are determined in accordance with federal income tax regulations, which may differ from U.S. GAAP.
Recent Accounting Standard: In June 2014, the Financial Accounting Standards Board issued guidance to improve the financial reporting of reverse repurchase agreements and other similar transactions. The guidance will require expanded disclosure requirements for entities that enter into reverse repurchase agreements and similar transactions accounted for as secured borrowings. It is effective for financial statements with fiscal years beginning on or after December 15, 2014 and interim periods within those fiscal years. Management is evaluating the impact, if any, of this guidance on the Fund’s financial statement disclosures.
Other: Expenses directly related to the Fund or its classes are charged to the Fund or the applicable class. Other operating expenses shared by several funds are pro rated among those funds on the basis of relative net assets or other appropriate methods. Expenses directly related to the Fund and other shared expenses pro rated to the Fund are allocated daily to each class based on its relative net assets or other appropriate methods.
The Fund has an arrangement with the custodian whereby fees may be reduced by credits earned on uninvested cash balances, which, if applicable, are shown as fees paid indirectly in the Statement of Operations. The custodian imposes fees on overdrawn cash balances, which can be offset by accumulated credits earned or may result in additional custody charges.
3. Securities and Other Investments:
Securities Lending: The Fund may lend its securities to approved borrowers, such as brokers, dealers and other financial institutions. The borrower pledges collateral consisting of cash, an irrevocable letter of credit issued by a bank, or securities issued or guaranteed by the U.S. government. The initial collateral received by the Fund is required to have a value of at least 102% of the current value of the loaned securities for securities traded on
| | | | | | |
| | | | | | | |
| 20 | | BLACKROCK MID CAP VALUE OPPORTUNITIES FUND | | JULY 31, 2014 | | |
| | | | |
| Notes to Financial Statements (continued) | | |
U.S. exchanges and a value of at least 105% for all other securities. The collateral is maintained thereafter, at a value equal to at least 100% of the current market value of the securities on loan. The market value of the loaned securities is determined at the close of each business day of the Fund and any additional required collateral is delivered to the Fund on the next business day. During the term of the loan, the Fund earns dividend or interest income on the securities loaned but does not receive interest income on any securities received as collateral. Loans of securities are terminable at any time and the borrower, after notice, is required to return borrowed securities within the standard time period for settlement of securities transactions.
The market value of securities on loan and the value of the related collateral are shown separately in the Statement of Assets and Liabilities as a component of investments at value—unaffiliated, and collateral on securities loaned at value, respectively. As of July 31, 2014, any securities on loan were collateralized by cash. The cash collateral invested by the securities lending agent, BlackRock Investment Management, LLC (“BIM”), if any, is disclosed in the Schedule of Investments.
Securities lending transactions are entered into by the Fund under Master Securities Lending Agreements (each, an “MSLA”) which provide the right, in the event of default (including bankruptcy or insolvency), for the non-defaulting party to liquidate the collateral and calculate a net exposure to the defaulting party or request additional collateral. In the event that a borrower defaults, the Fund, as lender, would offset the market value of the collateral received against the market value of the securities loaned. When the value of the collateral is greater than that of the market value of the securities loaned, the lender is left with a net amount payable to the defaulting party. However, bankruptcy or insolvency laws of a particular jurisdiction may impose restrictions on or prohibitions against such a right of offset in the event of an MSLA counterparty’s bankruptcy or insolvency. Under the MSLA, the borrower can resell or re-pledge the loaned securities, and the Fund can reinvest cash collateral, or, upon an event of default, resell or re-pledge the collateral.
The following table is a summary of the Fund’s securities lending agreements by counterparty, which are subject to offset under an MSLA as of July 31, 2014:
| | | | | | | | | | | | |
| Counterparty | | Securities Loaned at Value | | | Cash Collateral Received1 | | | Net
Amount | |
Citigroup Global Markets Limited | | $ | 8,530,350 | | | $ | (8,530,350 | ) | | | — | |
Credit Suisse Securities (USA) LLC | | | 3,952,072 | | | | (3,952,072 | ) | | | — | |
Goldman Sachs & Co. | | | 6,666,854 | | | | (6,666,854 | ) | | | — | |
Merrill Lynch, Pierce, Fenner & Smith Inc | | | 5,698,935 | | | | (5,698,935 | ) | | | — | |
Morgan Stanley & Co. LLC | | | 35,603,845 | | | | (35,603,845 | ) | | | — | |
National Financial Services LLC | | | 89,012 | | | | (89,012 | ) | | | — | |
UBS Securities LLC | | | 76,199 | | | | (76,199 | ) | | | — | |
| | | | |
Total | | $ | 60,617,267 | | | $ | (60,617,267 | ) | | | — | |
| | | | |
| | 1 | | Collateral with a value of $63,278,219 has been received in connection with securities lending agreements. Excess of collateral received from the individual counterparty is not shown for financial reporting purposes. |
The risks of securities lending include the risk that the borrower may not provide additional collateral when required or may not return the securities when due. To mitigate these risks, the Fund benefits from a borrower default indemnity provided by BIM. BIM’s indemnity allows for full replacement of the securities lent if the collateral received does not cover the value on the securities loaned in the event of borrower default. The Fund could suffer a loss if the value of an investment purchased with cash collateral falls below the market value of loaned securities or if the value of an investment purchased with cash collateral falls below the value of the original cash collateral received.
4. Investment Advisory Agreement and Other Transactions with Affiliates:
The PNC Financial Services Group, Inc. is the largest stockholder and an affiliate, for 1940 Act purposes, of BlackRock, Inc. (“BlackRock”).
| | | | | | |
| | | | | | | |
| | BLACKROCK MID CAP VALUE OPPORTUNITIES FUND | | JULY 31, 2014 | | 21 |
| | |
| Notes to Financial Statements (continued) | | |
The Corporation, on behalf of the Fund, entered into an Investment Advisory Agreement with the Manager, the Fund’s investment advisor, an indirect, wholly owned subsidiary of BlackRock, to provide investment advisory and administration services. The Manager is responsible for the management of the Fund’s portfolio and provides the necessary personnel, facilities, equipment and certain other services to the operations of the Fund. For such services, the Fund pays the Manager a monthly fee based on a percentage of the Fund’s average daily net assets at the following annual rates:
| | | | |
| Average Daily Net Assets | | Investment
Advisory Fee | |
First $1 Billion | | | 0.65% | |
$1 — $3 Billion | | | 0.61% | |
$3 — $5 Billion | | | 0.59% | |
$5 to $10 Billion | | | 0.57% | |
Greater than $10 Billion | | | 0.55% | |
The Manager voluntarily agreed to waive its investment advisory fees by the amount of investment advisory fees the Fund pays to the Manager indirectly through its investment in affiliated money market funds. However, the Manager does not waive its investment advisory fees by the amount of investment advisory fees paid in connection with the Fund’s investment in other affiliated investment companies, if any. This amount is shown as fees waived by Manager in the Statement of Operations.
Prior to July 1, 2014, BIM served as sub-advisor to the Fund, pursuant to a sub-advisory agreement with the Manager, and received for its services a monthly fee from the Manager at an annual rate equal to a percentage of the investment advisory fees paid by the Fund to the Manager.
For the six months ended July 31, 2014, the Fund reimbursed the Manager $3,216 for certain accounting services, which is included in Accounting services in the Statement of Operations.
The Corporation, on behalf of the Fund, entered into a Distribution Agreement and a Distribution and Service Plan with BlackRock Investments, LLC (“BRIL”), an affiliate of BlackRock. Pursuant to the Distribution and Service Plan and in accordance with Rule 12b-1 under the 1940 Act, the Fund pays BRIL ongoing service and distribution fees. The fees are accrued daily and paid monthly at annual rates based upon the average daily net assets of the relevant share class of the Fund as follows:
| | | | | | | | | | | | | | | | |
| | | Investor A | | | Investor B | | | Investor C | | | Class R | |
Service Fee | | | 0.25% | | | | 0.25% | | | | 0.25% | | | | 0.25% | |
Distribution Fee | | | — | | | | 0.75% | | | | 0.75% | | | | 0.25% | |
Pursuant to sub-agreements with BRIL, broker-dealers and BRIL provide shareholder servicing and distribution services to the Fund. The ongoing service and/or distribution fee compensates BRIL and each broker-dealer for providing shareholder servicing and/or distribution related services to Investor A, Investor B, Investor C and Class R shareholders.
For the six months ended July 31, 2014, affiliates earned underwriting discounts, direct commissions and dealer concessions on sales of the Fund’s Investor A Shares, which totaled $13,669.
For the six months ended July 31, 2014, affiliates received CDSCs as follows:
| | | | | | | | | | | | |
| | | Investor A | | | Investor B | | | Investor C | |
CDSCs | | $ | 2,152 | | | $ | 139 | | | $ | 2,929 | |
Pursuant to written agreements, certain financial intermediaries, some of which may be affiliates, provide the Fund with sub-accounting, recordkeeping, sub-transfer agency and other administrative services with respect to sub-accounts they service. For these services, these entities receive an asset based fee or an annual fee per shareholder account, which will vary depending on share class and/or net assets. For the six months ended July 31, 2014, the Fund paid $4,818 to affiliates of BlackRock in return for these services to Institutional shareholders, which is included in transfer agent in the Statement of Operations.
| | | | | | |
| | | | | | | |
| 22 | | BLACKROCK MID CAP VALUE OPPORTUNITIES FUND | | JULY 31, 2014 | | |
| | | | |
| Notes to Financial Statements (continued) | | |
The Manager maintains a call center, which is responsible for providing certain shareholder services to the Fund, such as responding to shareholder inquiries and processing transactions based upon instructions from shareholders with respect to the subscription and redemption of Fund shares. For the six months ended July 31, 2014, the Fund reimbursed the Manager the following amounts for costs incurred in running the call center, which are included in transfer agent — class specific in the Statement of Operations:
| | | | | | | | | | | | | | | | | | | | |
| | | Institutional | | | Investor A | | | Investor B | | | Investor C | | | Class R | |
Reimbursements | | $ | 383 | | | $ | 4,375 | | | $ | 152 | | | $ | 1,465 | | | $ | 315 | |
The U.S. Securities and Exchange Commission has issued an exemptive order which permits BIM, an affiliate of the Manager, to serve as securities lending agent for the Fund, subject to applicable conditions. As securities lending agent, BIM bears all operational costs directly related to securities lending. The Fund is responsible for expenses in connection with the investment of cash collateral received for securities on loan (the “collateral investment expenses”). The cash collateral is invested in a private investment company managed by the Manager or its affiliates. However, BIM has agreed to cap the collateral investment expenses of the private investment company to an annual rate of 0.04%. The investment advisor to the private investment company will not charge any advisory fees with respect to shares purchased by the Fund.
Securities lending income is equal to the total of income earned from the reinvestment of cash collateral, net of fees and other payments to and from borrowers of securities, and less the collateral investment expenses. The Fund retains a portion of securities lending income and remits a remaining portion to BIM as compensation for its services as securities lending agent.
Pursuant to a securities lending agreement effective February 1, 2014, the Fund retains 70% of securities lending income, and this amount retained can never be less than 65% of the total of securities lending income plus the collateral investment expenses.
In addition, commencing the business day following the date that the aggregate securities lending income earned across the Equity-Bond Complex in a calendar year exceeds the aggregate securities lending income earned across the Equity-Bond Complex in the calendar year 2013, the Fund, pursuant to the securities lending agreement, will retain for the remainder of that calendar year securities lending income as follows: 75% of securities lending income, and this amount retained can never be less than 65% of the total of securities lending income plus the collateral investment expenses.
Prior to February 1, 2014, the Fund retained 65% of securities lending income and paid a fee to BIM equal to 35% of such income. The share of securities lending income earned by the Fund is shown as securities lending — affiliated – net in the Statement of Operations. For the six months ended July 31, 2014, the Fund paid BIM $161,919 for securities lending agent services.
Certain officers and/or directors of the Corporation are officers and/or directors of BlackRock or its affiliates. The Fund reimburses the Manager for a portion of the compensation paid to the Corporation’s Chief Compliance Officer, which is included in officer and directors in the Statement of Operations.
5. Purchases and Sales:
Purchases and sales of investments excluding short-term securities for the six months ended July 31, 2014, were $166,498,315 and $222,655,308, respectively.
6. Income Tax Information:
It is the Fund’s policy to comply with the requirements of the Internal Revenue Code of 1986, as amended, applicable to regulated investment companies, and to distribute substantially all of its taxable income to its shareholders. Therefore, no federal income tax provision is required.
The Fund files U.S. federal and various state and local tax returns. No income tax returns are currently under examination. The statute of limitations on the Fund’s U.S. federal tax returns remains open for each of the four years ended January 31, 2014. The statutes of limitations on the Fund’s state and local tax returns may remain open for an additional year depending upon the jurisdiction.
Management has analyzed tax laws and regulations and their application to the Fund’s facts and circumstances and does not believe that there are any uncertain tax positions that require recognition of a tax liability.
| | | | | | |
| | | | | | | |
| | BLACKROCK MID CAP VALUE OPPORTUNITIES FUND | | JULY 31, 2014 | | 23 |
| | |
| Notes to Financial Statements (continued) | | |
As of July 31, 2014, gross unrealized appreciation and depreciation based on cost for federal income tax purposes were as follows:
| | | | |
Tax cost | | $ | 570,632,186 | |
| | | | |
Gross unrealized appreciation | | $ | 153,496,717 | |
Gross unrealized depreciation | | | (12,569,062 | ) |
| | | | |
Net unrealized appreciation | | $ | 140,927,655 | |
| | | | |
7. Bank Borrowings:
The Corporation, on behalf of the Fund, along with certain other funds managed by the Manager and its affiliates (“Participating Funds”), is a party to a 364-day, $1.1 billion credit agreement with a group of lenders, under which the Fund may borrow to fund shareholder redemptions. The agreement expires in April 2015. Excluding commitments designated for a certain individual fund, other Participating Funds, including the Fund, can borrow up to an aggregate commitment amount of $650 million, subject to asset coverage and other limitations as specified in the agreement. The credit agreement has the following terms: a fee of 0.06% per annum on unused commitment amounts and interest at a rate equal to the higher of (a) the one-month LIBOR plus 0.80% per annum or (b) the Fed Funds rate plus 0.80% per annum on amounts borrowed. Participating Funds paid administration and arrangement fees which, along with commitment fees, were allocated among such funds based upon portions of the aggregate commitment available to them and relative net assets of Participating Funds. The Fund did not borrow under the credit agreement during the six months ended July 31, 2014.
8. Concentration, Market and Credit Risk:
In the normal course of business, the Fund invests in securities and enters into transactions where risks exist due to fluctuations in the market (market risk) or failure of the issuer of a security to meet all its obligations (issuer credit risk). The value of securities held by the Fund may decline in response to certain events, including those directly involving the issuers whose securities are owned by the Fund; conditions affecting the general economy; overall market changes; local, regional or global political, social or economic instability; and currency and interest rate and price fluctuations. Similar to issuer credit risk, the Fund may be exposed to counterparty credit risk, or the risk that an entity with which the Fund have unsettled or open transactions may fail to or be unable to perform on its commitments. The Fund manages counterparty credit risk by entering into transactions only with counterparties that it believes have the financial resources to honor their obligations and by monitoring the financial stability of those counterparties. Financial assets, which potentially expose the Fund to market, issuer and counterparty credit risks, consist principally of financial instruments and receivables due from counterparties. The extent of the Fund’s exposure to market, issuer and counterparty credit risks with respect to these financial assets is generally approximated by their value recorded in the Statement of Assets and Liabilities, less any collateral held by the Fund.
As of July 31, 2014, the Fund invested a significant portion of its assets in securities in the financials sector. Changes in economic conditions affecting such sector would have a greater impact on the Fund and could affect the value, income and/or liquidity of positions in such securities.
| | | | | | |
| | | | | | | |
| 24 | | BLACKROCK MID CAP VALUE OPPORTUNITIES FUND | | JULY 31, 2014 | | |
| | | | |
| Notes to Financial Statements (concluded) | | |
9. Capital Share Transactions:
Transactions in capital shares for each class were as follows:
| | | | | | | | | | | | | | | | | | |
| | | Six Months Ended
July 31, 2014 | | | | | Year Ended
January 31, 2014 | |
| | Shares | | | Amount | | | | | Shares | | | Amount | |
| Institutional | | | | | | | | | | | | | | | | | | |
Shares sold | | | 1,547,894 | | | $ | 38,670,446 | | | | | | 2,855,551 | | | $ | 65,048,583 | |
Shares issued to shareholders in reinvestment of dividends | | | 170,486 | | | | 4,222,930 | | | | | | 436,555 | | | | 10,029,771 | |
Shares redeemed | | | (2,488,351 | ) | | | (64,078,210 | ) | | | | | (1,985,399 | ) | | | (46,855,673 | ) |
| | | | | | | | | | |
Net increase (decrease) | | | (769,971 | ) | | $ | (21,184,834 | ) | | | | | 1,306,707 | | | $ | 28,222,681 | |
| | | | | | | | | | |
| | | | | | | | | | | | | | | | | | |
| Investor A | | | | | | | | | | | | | | | | | | |
Shares sold and automatic conversion of shares | | | 1,858,127 | | | $ | 44,923,514 | | | | | | 5,740,091 | | | $ | 128,699,213 | |
Shares issued to shareholders in reinvestment of dividends | | | 379,198 | | | | 9,127,265 | | | | | | 816,585 | | | | 18,269,943 | |
Shares redeemed | | | (2,084,996 | ) | | | (50,743,693 | ) | | | | | (3,501,093 | ) | | | (77,707,060 | ) |
| | | | | | | | | | |
Net increase | | | 152,329 | | | $ | 3,307,086 | | | | | | 3,055,583 | | | $ | 69,262,096 | |
| | | | | | | | | | |
| | | | | | | | | | | | | | | | | | |
| Investor B | | | | | | | | | | | | | | | | | | |
Shares sold | | | 4,858 | | | $ | 107,683 | | | | | | 18,101 | | | $ | 366,224 | |
Shares issued to shareholders in reinvestment of dividends | | | 2,137 | | | | 46,323 | | | | | | 6,723 | | | | 136,564 | |
Shares redeemed and automatic conversion of shares | | | (46,653 | ) | | | (1,030,481 | ) | | | | | (90,305 | ) | | | (1,804,117 | ) |
| | | | | | | | | | |
Net decrease | | | (39,658 | ) | | $ | (876,475 | ) | | | | | (65,481 | ) | | $ | (1,301,329 | ) |
| | | | | | | | | | |
| | | | | | | | | | | | | | | | | | |
| Investor C | | | | | | | | | | | | | | | | | | |
Shares sold | | | 197,760 | | | $ | 4,206,009 | | | | | | 717,115 | | | $ | 14,162,730 | |
Shares issued to shareholders in reinvestment of dividends | | | 104,641 | | | | 2,213,149 | | | | | | 214,624 | | | | 4,254,155 | |
Shares redeemed | | | (308,666 | ) | | | (6,600,624 | ) | | | | | (799,692 | ) | | | (15,823,972 | ) |
| | | | | | | | | | |
Net increase (decrease) | | | (6,265 | ) | | $ | (181,466 | ) | | | | | 132,047 | | | $ | 2,592,913 | |
| | | | | | | | | | |
| | | | | | | | | | | | | | | | | | |
| Class R | | | | | | | | | | | | | | | | | | |
Shares sold | | | 409,971 | | | $ | 9,196,738 | | | | | | 1,210,969 | | | $ | 24,916,589 | |
Shares issued to shareholders in reinvestment of dividends | | | 98,811 | | | | 2,193,596 | | | | | | 212,000 | | | | 4,391,241 | |
Shares redeemed | | | (504,875 | ) | | | (11,292,318 | ) | | | | | (1,291,141 | ) | | | (26,630,556 | ) |
| | | | | | | | | | |
Net increase | | | 3,907 | | | $ | 98,016 | | | | | | 131,828 | | | $ | 2,677,274 | |
| | | | | | | | | | |
Total Net Increase (Decrease) | | | (659,658 | ) | | $ | (18,837,673 | ) | | | | | 4,560,684 | | | $ | 101,453,635 | |
| | | | | | | | | | |
10. Subsequent Events:
Management has evaluated the impact of all subsequent events on the Fund through the date the financial statements were issued and has determined that there were no subsequent events requiring adjustment or additional disclosure in the financial statements.
| | | | | | |
| | | | | | | |
| | BLACKROCK MID CAP VALUE OPPORTUNITIES FUND | | JULY 31, 2014 | | 25 |
| | |
| Disclosure of Investment Advisory Agreement |
The Board of Directors (the “Board,” and the members of which are referred to as “Board Members”) of BlackRock Mid Cap Value Opportunities Series, Inc. (the “Corporation”), met in person on April 8, 2014 (the “April Meeting”) and May 13-14, 2014 (the “May Meeting”) to consider the approval of the investment advisory agreement (the “Advisory Agreement” or the “Agreement”) between the Corporation, on behalf of BlackRock Mid Cap Value Opportunities Fund (the “Fund”), and BlackRock Advisors, LLC (the “Manager” or “BlackRock”), the Fund’s investment advisor. At the May Meeting, it was noted that the sub-advisory agreement between the Manager and BlackRock Investment Management, LLC, with respect to the Fund, would expire effective July 1, 2014. It was also noted that the non-renewal of the sub-advisory agreement would not result in any change in the nature or quality of services provided to the Fund, or in the portfolio management team that serves the Fund.
Activities and Composition of the Board
The Board consists of thirteen individuals, ten of whom are not “interested persons” of the Corporation as defined in the Investment Company Act of 1940, as amended (the “1940 Act”) (the “Independent Board Members”). The Board Members are responsible for the oversight of the operations of the Fund and perform the various duties imposed on the directors of investment companies by the 1940 Act. The Independent Board Members have retained independent legal counsel to assist them in connection with their duties. The Chairman of the Board is an Independent Board Member. The Board has established five standing committees: an Audit Committee, a Governance and Nominating Committee, a Compliance Committee, a Performance Oversight Committee and an Executive Committee, each of which is chaired by an Independent Board Member and composed of Independent Board Members (except for the Performance Oversight Committee and the Executive Committee, each of which also has one interested Board Member).
The Agreement
Pursuant to the 1940 Act, the Board is required to consider the continuation of the Agreement on an annual basis. The Board has four quarterly meetings per year, each extending over two days, and a fifth one-day meeting to consider specific information surrounding the consideration of renewing the Agreement. In connection with this process, the Board assessed, among other things, the nature, scope and quality of the services provided to the Fund by BlackRock, its personnel and its affiliates, including (as applicable) investment management; administrative and shareholder services; oversight of fund service providers; marketing services; risk oversight; compliance and assistance in meeting applicable legal and regulatory requirements.
The Board, acting directly and through its committees, considers at each of its meetings, and from time to time as appropriate, factors that are relevant to its annual consideration of the renewal of the Agreement, including the services and support provided by BlackRock to the Fund and its shareholders. Among the matters the Board considered were: (a) investment performance for one-year, three-year, five-year and/or since inception periods, as applicable, against peer funds, and applicable benchmarks, if any, as well as senior management’s and portfolio managers’ analysis of the reasons for any over-performance or underperformance against its peers and/or benchmark, as applicable; (b) fees, including advisory, administration, if applicable, and other amounts paid to BlackRock and its affiliates by the Fund for services, such as marketing and distribution, call center and fund accounting; (c) Fund operating expenses and how BlackRock allocates expenses to the Fund; (d) the resources devoted to, risk oversight of, and compliance reports relating to, implementation of the Fund’s investment objective, policies and restrictions, and meeting new regulatory requirements; (e) the Fund’s compliance with its Code of Ethics and other compliance policies and procedures; (f) the nature, cost and character of non-investment management services provided by BlackRock and its affiliates; (g) BlackRock’s and other service providers’ internal controls and risk and compliance oversight mechanisms; (h) BlackRock’s implementation of the proxy voting policies approved by the Board; (i) the use of brokerage commissions and execution quality of portfolio transactions; (j) BlackRock’s implementation of the Fund’s valuation and liquidity procedures; (k) an analysis of management fees for products with similar investment objectives across the open-end fund, exchange-traded fund (“ETF”), closed-end fund and institutional account product channels, as applicable, and the similarities and differences between the services provided to these products as compared to the Fund; (l) BlackRock’s compensation methodology for its investment professionals and the incentives it creates; and (m) periodic updates on BlackRock’s business.
The Board has engaged in an ongoing strategic review with BlackRock of opportunities to consolidate funds and of BlackRock’s commitment to investment performance. BlackRock also furnished information to the Board in response to specific questions. These questions covered issues such as: BlackRock’s profitability; investment performance; subadvisory and advisory relationships with other clients (including mutual funds sponsored by third parties); the viability of specific funds; manager capacity and the potential for closing certain funds to new investments; portfolio managers’ investments in funds they manage; supplemental service agreements with third party distribution partners; and management fee levels and breakpoints. The Board further discussed with BlackRock: BlackRock’s management structure; portfolio turnover, execution quality and use of soft dollars; BlackRock’s portfolio manager compensation and performance accountability; marketing support for the funds; services provided to the funds by BlackRock affiliates; and BlackRock’s oversight of relationships with third party service providers.
| | | | | | |
| | | | | | | |
| 26 | | BLACKROCK MID CAP VALUE OPPORTUNITIES FUND | | JULY 31, 2014 | | |
| | |
| Disclosure of Investment Advisory Agreement (continued) |
Board Considerations in Approving the Agreement
The Approval Process: Prior to the April Meeting, the Board requested and received materials specifically relating to the Agreement. The Board is continuously engaged in a process with its independent legal counsel and BlackRock to review the nature and scope of the information provided to better assist its deliberations. The materials provided in connection with the April Meeting included (a) information independently compiled and prepared by Lipper, Inc. (“Lipper”) on Fund fees and expenses as compared with a peer group of funds as determined by Lipper (“Expense Peers”) and the investment performance of the Fund as compared with a peer group of funds as determined by Lipper;1 (b) information on the profits realized by BlackRock and its affiliates pursuant to the Agreement and a discussion of fall-out benefits to BlackRock and its affiliates; (c) a general analysis provided by BlackRock concerning investment management fees charged to other clients, such as institutional clients, ETFs and closed-end funds, under similar investment mandates, as well as the performance of such other clients, as applicable; (d) review of non-management fees; (e) the existence, impact and sharing of potential economies of scale; (f) a summary of aggregate amounts paid by the Fund to BlackRock; (g) sales and redemption data regarding the Fund’s shares; and (h) if applicable, a comparison of management fees to similar BlackRock open-end funds, as classified by Lipper.
At the April Meeting, the Board reviewed materials relating to its consideration of the Agreement. As a result of the discussions that occurred during the April Meeting, and as a culmination of the Board’s year-long deliberative process, the Board presented BlackRock with questions and requests for additional information. BlackRock responded to these requests with additional written information in advance of the May Meeting.
At the May Meeting, the Board, including the Independent Board Members, approved the continuation of the Advisory Agreement between the Manager and the Fund for a one-year term ending June 30, 2015. In approving the continuation of the Agreement, the Board considered: (a) the nature, extent and quality of the services provided by BlackRock; (b) the investment performance of the Fund and BlackRock; (c) the advisory fee and the cost of the services and profits to be realized by BlackRock and its affiliates from their relationship with the Fund; (d) the Fund’s costs to investors compared to the costs of Expense Peers and performance compared to the relevant performance comparison as previously discussed; (e) economies of scale; (f) fall-out benefits to BlackRock and its affiliates as a result of its relationship with the Fund; and (g) other factors deemed relevant by the Board Members.
The Board also considered other matters it deemed important to the approval process, such as payments made to BlackRock or its affiliates relating to the distribution of Fund shares and securities lending, services related to the valuation and pricing of Fund portfolio holdings, direct and indirect benefits to BlackRock and its affiliates from their relationship with the Fund and advice from independent legal counsel with respect to the review process and materials submitted for the Board’s review. The Board noted the willingness of BlackRock personnel to engage in open, candid discussions with the Board. The Board did not identify any particular information as determinative, and each Board Member may have attributed different weights to the various items considered.
A. Nature, Extent and Quality of the Services Provided by BlackRock: The Board, including the Independent Board Members, reviewed the nature, extent and quality of services provided by BlackRock, including the investment advisory services and the resulting performance of the Fund. Throughout the year, the Board compared Fund performance to the performance of a comparable group of mutual funds and/or the performance of a relevant benchmark, as applicable. The Board met with BlackRock’s senior management personnel responsible for investment activities, including the senior investment officers. The Board also reviewed the materials provided by the Fund’s portfolio management team discussing the Fund’s performance and the Fund’s investment objective, strategies and outlook.
The Board considered, among other factors, with respect to BlackRock: the number, education and experience of investment personnel generally and the Fund’s portfolio management team; investments by portfolio managers in the funds they manage; portfolio trading capabilities; use of technology; commitment to compliance; credit analysis capabilities; risk analysis and oversight capabilities; and the approach to training and retaining portfolio managers and other research, advisory and management personnel. The Board engaged in a review of BlackRock’s compensation structure with respect to the Fund’s portfolio management team and BlackRock’s ability to attract and retain high-quality talent and create performance incentives.
In addition to advisory services, the Board considered the quality of the administrative and other non-investment advisory services provided to the Fund. BlackRock and its affiliates provide the Fund with certain administrative, shareholder and other services (in addition to any such services provided to the Fund by third parties) and officers and other personnel as are necessary for the operations of the Fund. In particular, BlackRock and its affiliates provide the Fund with the following administrative services including, among others: (i) preparing disclosure documents, such as the prospectus, the summary prospectus (as applicable), the statement of additional information and periodic shareholder reports; (ii) oversight of daily accounting and pricing; (iii) overseeing and coordinating the activities of other service providers; (iv) organizing Board meetings and preparing the materials for such Board meetings; (v) providing legal and compliance support;
| 1 | | Funds are ranked by Lipper in quartiles, ranging from first to fourth, where first is the most desirable quartile position and fourth is the least desirable. |
| | | | | | |
| | | | | | | |
| | BLACKROCK MID CAP VALUE OPPORTUNITIES FUND | | JULY 31, 2014 | | 27 |
| | |
| Disclosure of Investment Advisory Agreement (continued) |
(vi) furnishing analytical and other support to assist the Board in its consideration of strategic issues such as the merger or consolidation of certain open-end funds; and (vii) performing other administrative functions necessary for the operation of the Fund, such as tax reporting, fulfilling regulatory filing requirements and call center services. The Board reviewed the structure and duties of BlackRock’s fund administration, shareholder services, legal and compliance departments and considered BlackRock’s policies and procedures for assuring compliance with applicable laws and regulations.
B. The Investment Performance of the Fund and BlackRock: The Board, including the Independent Board Members, also reviewed and considered the performance history of the Fund. In preparation for the April Meeting, the Board worked with its independent legal counsel, BlackRock and Lipper to develop a template for, and was provided with, reports independently prepared by Lipper, which included a comprehensive analysis of the Fund’s performance. The Board also reviewed a narrative and statistical analysis of the Lipper data that was prepared by BlackRock, which analyzed various factors that affect Lipper’s rankings. In connection with its review, the Board received and reviewed information regarding the investment performance of the Fund as compared to other funds in its applicable Lipper category. The Board was provided with a description of the methodology used by Lipper to select peer funds and periodically meets with Lipper representatives to review its methodology. The Board and its Performance Oversight Committee regularly review, and meet with Fund management to discuss, the performance of the Fund throughout the year.
The Board noted that for the one-, three- and five-year periods reported, the Fund ranked in the fourth, third and third quartiles, respectively, against its Lipper Performance Universe. The Board and BlackRock reviewed and discussed the reasons for the Fund’s underperformance during these periods. The Board was informed that, among other things, the primary detractors of performance during the three- and five-year periods was being underweight in the industrials sector as the sector strongly outperformed in 2012. Stock selection in the sector also added to underperformance, notably being underweight to or absence from high-performing industries such as building products, industrial conglomerates or trading companies. Detracting from performance in the one-year period was stock selection in the information technology and semiconductor industries.
The Board and BlackRock also discussed BlackRock’s strategy for improving the Fund’s performance and BlackRock’s commitment to providing the resources necessary to assist the Fund’s portfolio managers in seeking to improve the Fund’s performance.
C. Consideration of the Advisory/Management Fees and the Cost of the Services and Profits to be Realized by BlackRock and its Affiliates from their Relationship with the Fund: The Board, including the Independent Board Members, reviewed the Fund’s contractual management fee rate compared with the other funds in its Lipper category. The contractual management fee rate represents a combination of the advisory fee and any administrative fees, before taking into account any reimbursements or fee waivers. The Board also compared the Fund’s total expense ratio, as well as its actual management fee rate, to those of other funds in its Lipper category. The total expense ratio represents a fund’s total net operating expenses, including any 12b-1 or non 12b-1 service fees. The total expense ratio gives effect to any expense reimbursements or fee waivers that benefit a fund, and the actual management fee rate gives effect to any management fee reimbursements or waivers that benefit a fund. The Board considered the services provided and the fees charged by BlackRock and its affiliates to other types of clients with similar investment mandates, as applicable, including institutional accounts.
The Board received and reviewed statements relating to BlackRock’s financial condition. The Board was also provided with a profitability analysis that detailed the revenues earned and the expenses incurred by BlackRock for services provided to the Fund. The Board reviewed BlackRock’s profitability with respect to the Fund and other funds the Board currently oversees for the year ended December 31, 2013 compared to available aggregate profitability data provided for the two prior years. The Board reviewed BlackRock’s profitability with respect to certain other fund complexes managed by the Manager and/or its affiliates. The Board reviewed BlackRock’s assumptions and methodology of allocating expenses in the profitability analysis, noting the inherent limitations in allocating costs among various advisory products. The Board recognized that profitability may be affected by numerous factors including, among other things, fee waivers and expense reimbursements by the Manager, the types of funds managed, precision of expense allocations and business mix. As a result, calculating and comparing profitability at individual fund levels is difficult.
The Board noted that, in general, individual fund or product line profitability of other advisors is not publicly available. The Board reviewed BlackRock’s overall operating margin, in general, compared to that of certain other publicly-traded asset management firms. The Board considered the differences between BlackRock and these other firms, including the contribution of technology at BlackRock, BlackRock’s expense management, and the relative product mix.
In addition, the Board considered the cost of the services provided to the Fund by BlackRock, and BlackRock’s and its affiliates’ profits relating to the management and distribution of the Fund and the other funds advised by BlackRock and its affiliates. As part of its analysis, the Board reviewed BlackRock’s methodology in allocating its costs to the management of the Fund. The Board also considered whether BlackRock has the financial resources necessary to attract and retain high quality investment management personnel to perform its obligations under the Agreement and to continue to provide the high quality of services that is expected by the Board. The Board further considered
| | | | | | |
| | | | | | | |
| 28 | | BLACKROCK MID CAP VALUE OPPORTUNITIES FUND | | JULY 31, 2014 | | |
| | |
| Disclosure of Investment Advisory Agreement (concluded) |
factors including but not limited to BlackRock’s commitment of time, assumption of risk and liability profile in servicing the Fund in contrast to what is required of BlackRock with respect to other products with similar investment objectives across the open-end fund, ETF, closed-end fund and institutional account product channels, as applicable.
The Board noted that the Fund’s contractual management fee rate ranked in the first quartile, and that the actual management fee rate and total expense ratio each ranked in the first quartile, relative to the Fund’s Expense Peers. The Board also noted that the Fund has an advisory fee arrangement that includes breakpoints that adjust the fee rate downward as the size of the Fund increases above certain contractually specified levels.
D. Economies of Scale: The Board, including the Independent Board Members, considered the extent to which economies of scale might be realized as the assets of the Fund increase, as well as the existence of expense caps, as applicable. The Board also considered the extent to which the Fund benefits from such economies and whether there should be changes in the advisory fee rate or breakpoint structure in order to enable the Fund to participate in these economies of scale, for example through the use of revised breakpoints in the advisory fee based upon the asset level of the Fund. In its consideration, the Board Members took into account the existence of any expense caps and further considered the continuation and/or implementation, as applicable, of such caps.
E. Other Factors Deemed Relevant by the Board Members: The Board, including the Independent Board Members, also took into account other ancillary or “fall-out” benefits that BlackRock or its affiliates may derive from their respective relationships with the Fund, both tangible and intangible, such as BlackRock’s ability to leverage its investment professionals who manage other portfolios and risk management personnel, an increase in BlackRock’s profile in the investment advisory community, and the engagement of BlackRock’s affiliates as service providers to the Fund, including for administrative, distribution, securities lending and cash management services. The Board also considered BlackRock’s overall operations and its efforts to expand the scale of, and improve the quality of, its operations. The Board also noted that BlackRock may use and benefit from third party research obtained by soft dollars generated by certain registered fund transactions to assist in managing all or a number of its other client accounts. The Board further noted that it had considered the investment by BlackRock’s funds in ETFs without any offset against the management fees payable by the funds to BlackRock.
In connection with its consideration of the Agreement, the Board also received information regarding BlackRock’s brokerage and soft dollar practices. The Board received reports from BlackRock which included information on brokerage commissions and trade execution practices throughout the year.
The Board noted the competitive nature of the open-end fund marketplace, and that shareholders are able to redeem their Fund shares if they believe that the Fund’s fees and expenses are too high or if they are dissatisfied with the performance of the Fund.
Conclusion
The Board, including the Independent Board Members, approved the continuation of the Advisory Agreement between the Manager and the Corporation, on behalf of the Fund, for a one-year term ending June 30, 2015. Based upon its evaluation of all of the aforementioned factors in their totality, the Board, including the Independent Board Members, was satisfied that the terms of the Agreement were fair and reasonable and in the best interest of the Fund and its shareholders. In arriving at its decision to approve the Agreement, the Board did not identify any single factor or group of factors as all-important or controlling, but considered all factors together, and different Board Members may have attributed different weights to the various factors considered. The Independent Board Members were also assisted by the advice of independent legal counsel in making this determination. The contractual fee arrangements for the Fund reflect the results of several years of review by the Board Members and predecessor Board Members, and discussions between such Board Members (and predecessor Board Members) and BlackRock. As a result, the Board Members’ conclusions may be based in part on their consideration of these arrangements in prior years.
| | | | | | |
| | | | | | | |
| | BLACKROCK MID CAP VALUE OPPORTUNITIES FUND | | JULY 31, 2014 | | 29 |
Robert M. Hernandez, Chairman of the Board and Director
Fred G.Weiss, Vice Chairman of the Board and Director
Paul L. Audet, Director
James H. Bodurtha, Director
Bruce R. Bond, Director
Donald W. Burton, Director
Honorable Stuart E. Eizenstat, Director
Laurence D. Fink, Director
Kenneth A. Froot, Director
Henry Gabbay, Director
John F. O’Brien, Director
Roberta Cooper Ramo, Director
David H. Walsh, Director
John M. Perlowski, President and Chief Executive Officer
Brendan Kyne, Vice President
Neal Andrews, Chief Financial Officer
Jay Fife, Treasurer
Charles Park, Chief Compliance Officer and Anti-Money Laundering Officer
Benjamin Archibald, Secretary
Effective May 14, 2014, Brian Kindelan resigned as Chief Compliance Officer and Anti-Money Laundering Officer of the Fund and Charles Park became Chief Compliance Officer and Anti-Money Laundering Officer of the Fund. Mr. Park joined BlackRock in 2009 and is the current Global Chief Compliance Officer of the BlackRock iShares exchange traded funds.
| | | | | | | | |
| | | | | |
Investment Advisor BlackRock Advisors, LLC Wilmington, DE 19809 | | Accounting Agent State Street Bank and
Trust Company Boston, MA 02110 | | Transfer Agent BNY Mellon Investment
Servicing Inc. Wilmington, DE 19809 | | Legal Counsel Willkie Farr & Gallagher LLP New York, NY 10019 | | Address of the Fund 100 Bellevue Parkway Wilmington, DE 19809 |
| | | | |
| | | | Custodian The Bank of New York Mellon New York, NY 10286 | | Distributor BlackRock Investments, LLC New York, NY 10022 | | |
| | | | |
| | | | | | Independent Registered Public
Accounting Firm Deloitte & Touche LLP Boston, MA 02116 | | |
| | | | | | |
| | | | | | | |
| 30 | | BLACKROCK MID CAP VALUE OPPORTUNITIES FUND | | JULY 31, 2014 | | |
Electronic Delivery
Electronic copies of most financial reports and prospectuses are available on the Fund’s website or shareholders can sign up for e-mail notifications of quarterly statements, annual and semi-annual reports and prospectuses by enrolling in the Fund’s electronic delivery program.
To enroll:
Shareholders Who Hold Accounts with Investment Advisors, Banks or Brokerages:
Please contact your financial advisor. Please note that not all investment advisors, banks or brokerages may offer this service.
Shareholders Who Hold Accounts Directly with BlackRock:
| 1) | Access the BlackRock website at |
| | http://www.blackrock.com/edelivery |
| 2) | Select “eDelivery” under the “More Information” section |
Householding
The Fund will mail only one copy of shareholder documents, including prospectuses, annual and semi-annual reports and proxy statements, to shareholders with multiple accounts at the same address. This practice is commonly called “householding” and is intended to reduce expenses and eliminate duplicate mailings of shareholder documents. Mailings of your shareholder documents may be householded indefinitely unless you instruct us otherwise. If you do not want the mailing of these documents to be combined with those for other members of your household, please call the Fund at (800) 441-7762.
Availability of Quarterly Schedule of Investments
The Fund files its complete schedule of portfolio holdings with the SEC for the first and third quarters of each fiscal year on Form N-Q. The Fund’s Forms N-Q are available on the SEC’s website at http://www.sec.gov and may also be reviewed and copied at the SEC’s Public Reference Room in Washington, DC. Information on how to access documents on the SEC’s website without charge may be obtained by calling (800) SEC-0330. The Fund’s Forms N-Q may also be obtained upon request and without charge by calling (800) 441-7762.
Availability of Proxy Voting Policies and Procedures
A description of the policies and procedures that the Fund uses to determine how to vote proxies relating to portfolio securities is available (1) without charge, upon request, by calling (800) 441-7762; (2) at http://www.blackrock.com; and (3) on the SEC’s website at http://www.sec.gov.
Availability of Proxy Voting Record
Information about how the Fund voted proxies relating to securities held in the Fund’s portfolio during the most recent 12-month period ended June 30 is available upon request and without charge (1) at http://www.blackrock.com or by calling (800) 441-7762 and (2) on the SEC’s website at http://www.sec.gov.
Account Information
Call us at (800) 441-7762 from 8:00 AM to 6:00 PM EST on any business day to get information about your account balances, recent transactions and share prices. You can also reach us on the Web at http://www.blackrock.com/funds.
Automatic Investment Plans
Investor Class shareholders who want to invest regularly can arrange to have $50 or more automatically deducted from their checking or savings account and invested in any of the BlackRock funds.
Systematic Withdrawal Plans
Investor Class shareholders can establish a systematic withdrawal plan and receive periodic payments of $50 or more from their BlackRock funds, as long as their account balance is at least $10,000.
Retirement Plans
Shareholders may make investments in conjunction with Traditional, Rollover, Roth, Coverdell, Simple IRAs, SEP IRAs and 403(b) Plans.
| | | | | | |
| | | | | | | |
| | BLACKROCK MID CAP VALUE OPPORTUNITIES FUND | | JULY 31, 2014 | | 31 |
| | | | |
| Additional Information (concluded) | | |
| | |
| BlackRock Privacy Principles | | |
BlackRock is committed to maintaining the privacy of its current and former fund investors and individual clients (collectively, “Clients”) and to safeguarding their non-public personal information. The following information is provided to help you understand what personal information BlackRock collects, how we protect that information and why in certain cases we share such information with select parties.
If you are located in a jurisdiction where specific laws, rules or regulations require BlackRock to provide you with additional or different privacy-related rights beyond what is set forth below, then BlackRock will comply with those specific laws, rules or regulations.
BlackRock obtains or verifies personal non-public information from and about you from different sources, including the following: (i) information we receive from you or, if applicable, your financial intermediary, on applications, forms or other documents; (ii) information about your transactions with us, our affiliates, or others; (iii) information we receive from a consumer reporting agency; and (iv) from visits to our websites.
BlackRock does not sell or disclose to non-affiliated third parties any non-public personal information about its Clients, except as permitted by law or as is necessary to respond to regulatory requests or to service Client accounts. These non-affiliated third parties are required to protect the confidentiality and security of this information and to use it only for its intended purpose.
We may share information with our affiliates to service your account or to provide you with information about other BlackRock products or services that may be of interest to you. In addition, BlackRock restricts access to non-public personal information about its Clients to those BlackRock employees with a legitimate business need for the information. BlackRock maintains physical, electronic and procedural safeguards that are designed to protect the non-public personal information of its Clients, including procedures relating to the proper storage and disposal of such information.
| | | | | | |
| | | | | | | |
| 32 | | BLACKROCK MID CAP VALUE OPPORTUNITIES FUND | | JULY 31, 2014 | | |
| | |
| A World-Class Mutual Fund Family | | |
BlackRock offers a diverse lineup of open-end mutual funds crossing all investment styles and managed by experts in equity, fixed income and tax-exempt investing.
BlackRock ACWI ex-US Index Fund
BlackRock All-Cap Energy & Resources Portfolio
BlackRock Basic Value Fund
BlackRock Capital Appreciation Fund
BlackRock Commodity Strategies Fund
BlackRock Disciplined Small Cap Core Fund
BlackRock Emerging Markets Dividend Fund
BlackRock Emerging Markets Fund
BlackRock Emerging Markets Long/Short Equity Fund
BlackRock Energy & Resources Portfolio
BlackRock Equity Dividend Fund
BlackRock EuroFund
BlackRock Flexible Equity Fund
BlackRock Focus Growth Fund
BlackRock Global Dividend Portfolio
BlackRock Global Long/Short Equity Fund
BlackRock Global Opportunities Portfolio
BlackRock Global SmallCap Fund
BlackRock Health Sciences Opportunities Portfolio
BlackRock International Fund
BlackRock International Index Fund
BlackRock International Opportunities Portfolio
BlackRock Large Cap Core Fund
BlackRock Large Cap Core Plus Fund
BlackRock Large Cap Growth Fund
BlackRock Large Cap Value Fund
BlackRock Latin America Fund
BlackRock Long-Horizon Equity Fund
BlackRock Mid-Cap Growth Equity Portfolio
BlackRock Mid Cap Value Opportunities Fund
BlackRock Natural Resources Trust
BlackRock Pacific Fund
BlackRock Real Estate Securities Fund
BlackRock Russell 1000® Index Fund
BlackRock Science & Technology Opportunities Portfolio
BlackRock Small Cap Growth Equity Portfolio
BlackRock Small Cap Growth Fund II
BlackRock Small Cap Index Fund
BlackRock S&P 500 Stock Fund
BlackRock U.S. Opportunities Portfolio
BlackRock Value Opportunities Fund
| | |
| Taxable Fixed Income Funds | | |
BlackRock Bond Index Fund
BlackRock Core Bond Portfolio
BlackRock CoreAlpha Bond Fund
BlackRock CoRI Funds
BlackRock Emerging Markets Flexible Dynamic Bond Portfolio
BlackRock Floating Rate Income Portfolio
BlackRock Global Long/Short Credit Fund
BlackRock GNMA Portfolio
BlackRock High Yield Bond Portfolio
BlackRock Inflation Protected Bond Portfolio
BlackRock Investment Grade Bond Portfolio
BlackRock Low Duration Bond Portfolio
BlackRock Secured Credit Portfolio
BlackRock Short Obligations Fund
BlackRock Short-Term Treasury Fund
BlackRock Strategic Income Opportunities Portfolio
BlackRock Total Return Fund
BlackRock U.S. Government Bond Portfolio
BlackRock U.S. Mortgage Portfolio
BlackRock Ultra-Short Obligations Fund
BlackRock World Income Fund
| | |
| Municipal Fixed Income Funds | | |
BlackRock California Municipal Bond Fund
BlackRock High Yield Municipal Fund
BlackRock National Municipal Fund
BlackRock New Jersey Municipal Bond Fund
BlackRock New York Municipal Bond Fund
BlackRock Pennsylvania Municipal Bond Fund
BlackRock Short-Term Municipal Fund
BlackRock Strategic Municipal Opportunities Fund
| | | | | | | | | | | | | | | | |
| BlackRock Balanced Capital Fund | | LifePath® Active Portfolios | | | | LifePath® Index Portfolios |
BlackRock Emerging Market Allocation Portfolio | | | | 2015 | | 2040 | | | | | | | | Retirement | | 2040 |
BlackRock Global Allocation Fund | | | | 2020 | | 2045 | | | | | | | | 2020 | | 2045 |
BlackRock Managed Volatility Portfolio | | | | 2025 | | 2050 | | | | | | | | 2025 | | 2050 |
BlackRock Multi-Asset Income Portfolio | | | | 2030 | | 2055 | | | | | | | | 2030 | | 2055 |
BlackRock Multi-Asset Real Return Fund | | | | 2035 | | | | | | | | | | 2035 | | |
BlackRock Multi-Manager Alternative Strategies Fund | | | | | | | | | | | | | | | | |
BlackRock Strategic Risk Allocation Fund | | | | | | | | | | | | | | | | |
| | LifePath® Portfolios | | | | | | | | | | |
| BlackRock Prepared Portfolios | | | | Retirement | | 2040 | | | | | | | | | | |
Conservative Prepared Portfolio | | | | 2020 | | 2045 | | | | | | | | | | |
Moderate Prepared Portfolio | | | | 2025 | | 2050 | | | | | | | | | | |
Growth Prepared Portfolio | | | | 2030 | | 2055 | | | | | | | | | | |
Aggressive Growth Prepared Portfolio | | | | 2035 | | | | | | | | | | | | |
BlackRock mutual funds are currently distributed by BlackRock Investments, LLC. You should consider the investment objectives, risks, charges and expenses of the funds under consideration carefully before investing. Each fund’s prospectus contains this and other information and is available at www.blackrock.com or by calling (800) 441-7762 or from your financial advisor. The prospectus should be read carefully before investing.
| | | | | | |
| | | | | | | |
| | BLACKROCK MID CAP VALUE OPPORTUNITIES FUND | | JULY 31, 2014 | | 33 |
This report is intended for existing shareholders. It is not authorized for use as an offer of sale or a solicitation of an offer to buy shares of the Fund unless preceded or accompanied by the Fund’s current prospectus. Past performance results shown in this report should not be considered a representation of future performance. Investment returns and principal value of shares will fluctuate so that shares, when redeemed, may be worth more or less than their original cost. Statements and other information herein are as dated and are subject to change.

| | |
| MIDCAPVAL-7/14-SAR | | |
| |
| |  |
| | |
| Item 2 – | | Code of Ethics – Not Applicable to this semi-annual report |
| |
| Item 3 – | | Audit Committee Financial Expert – Not Applicable to this semi-annual report |
| |
| Item 4 – | | Principal Accountant Fees and Services – Not Applicable to this semi-annual report |
| |
| Item 5 – | | Audit Committee of Listed Registrants – Not Applicable |
| |
| Item 6 – | | Investments |
| | (a) The registrant’s Schedule of Investments is included as part of the Report to Stockholders filed under Item 1 of this Form. |
| | (b) Not Applicable due to no such divestments during the semi-annual period covered since the previous Form N-CSR filing. |
| |
| Item 7 – | | Disclosure of Proxy Voting Policies and Procedures for Closed-End Management Investment Companies – Not Applicable |
| |
| Item 8 – | | Portfolio Managers of Closed-End Management Investment Companies – Not Applicable |
| |
| Item 9 – | | Purchases of Equity Securities by Closed-End Management Investment Company and Affiliated Purchasers – Not Applicable |
| |
| Item 10 – | | Submission of Matters to a Vote of Security Holders –There have been no material changes to these procedures. |
| |
| Item 11 – | | Controls and Procedures |
| |
| | (a) – The registrant’s principal executive and principal financial officers, or persons performing similar functions, have concluded that the registrant’s disclosure controls and procedures (as defined in Rule 30a-3(c) under the Investment Company Act of 1940, as amended (the “1940 Act”)) are effective as of a date within 90 days of the filing of this report based on the evaluation of these controls and procedures required by Rule 30a-3(b) under the 1940 Act and Rule 15d-15(b) under the Securities Exchange Act of 1934, as amended. |
| |
| | (b) – There were no changes in the registrant’s internal control over financial reporting (as defined in Rule 30a-3(d) under the 1940 Act) that occurred during the second fiscal quarter of the period covered by this report that have materially affected, or are reasonably likely to materially affect, the registrant’s internal control over financial reporting. |
| |
| Item 12 – | | Exhibits attached hereto |
| |
| | (a)(1) – Code of Ethics – Not Applicable to this semi-annual report |
| |
| | (a)(2) – Certifications – Attached hereto |
| |
| | (a)(3) – Not Applicable |
| |
| | (b) – Certifications – Attached hereto |
2
Pursuant to the requirements of the Securities Exchange Act of 1934 and the Investment Company Act of 1940, the registrant has duly caused this report to be signed on its behalf by the undersigned, thereunto duly authorized.
BlackRock Mid Cap Value Opportunities Fund of BlackRock Mid Cap Value Opportunities Series, Inc.
| | | | |
| By: | | /s/ John M. Perlowski | | |
| | John M. Perlowski | | |
| | Chief Executive Officer (principal executive officer) of |
| | BlackRock Mid Cap Value Opportunities Fund of BlackRock Mid Cap Value Opportunities Series, Inc. |
Date: October 1, 2014
Pursuant to the requirements of the Securities Exchange Act of 1934 and the Investment Company Act of 1940, this report has been signed below by the following persons on behalf of the registrant and in the capacities and on the dates indicated.
| | | | |
| By: | | /s/ John M. Perlowski | | |
| | John M. Perlowski | | |
| | Chief Executive Officer (principal executive officer) of |
| | BlackRock Mid Cap Value Opportunities Fund of BlackRock Mid Cap Value Opportunities Series, Inc. |
|
| Date: October 1, 2014 |
| | |
| By: | | /s/ Neal J. Andrews | | |
| | Neal J. Andrews | | |
| | Chief Financial Officer (principal financial officer) of |
| | BlackRock Mid Cap Value Opportunities Fund of BlackRock Mid Cap Value Opportunities Series, Inc. |
|
| Date: October 1, 2014 |
3