UNITED STATES
SECURITIES AND EXCHANGE COMMISSION
Washington, D.C. 20549
FORM N-CSR
CERTIFIED SHAREHOLDER REPORT OF REGISTERED
MANAGEMENT INVESTMENT COMPANIES
Investment Company Act file number 811-8352
LKCM Funds
(Exact name of registrant as specified in charter)
c/o Luther King Capital Management Corporation
301 Commerce Street, Suite 1600
Fort Worth, TX 76102
(Address of principal executive offices) (Zip code)
K&L Gates LLP
1601 K Street, NW
Washington, DC 20006
(Name and address of agent for service)
1-800-688-LKCM and 1-800-423-6369
Registrant's telephone number, including area code
Date of fiscal year end: December 31
Date of reporting period: December 31, 2012
Item 1. Reports to Stockholders.
LKCM
LKCM Small Cap Equity Fund
LKCM Small-Mid Cap Equity Fund
LKCM Equity Fund
LKCM Balanced Fund
LKCM Fixed Income Fund
Annual Report
December 31, 2012
Dear Fellow Shareholders:
We report the following performance information for the LKCM Funds:
| | | | | | | Five Year | Ten Year | Avg. |
| | | | | | One Year | Average | Average | Annual |
| | | | | | Total | Annualized | Annualized | Total |
| | | | Net | Gross | Return | Return | Return | Return |
| | Inception | NAV @ | Expense | Expense | Ended | Ended | Ended | Since |
| Funds | Dates | 12/31/12 | Ratio*, ** | Ratio** | 12/31/12 | 12/31/12 | 12/31/12 | Incept. |
| LKCM Equity Fund – | | | | | | | |
| Institutional Class | 1/3/96 | $17.62 | 0.81% | 1.00% | 15.69% | 4.04% | 7.83% | 7.47% |
S&P 500 Index1 | | | | 16.00% | 1.66% | 7.10% | 6.95% |
| LKCM Small Cap Equity Fund – | | | | | | | |
| Institutional Class | 7/14/94 | $22.69 | N/A | 0.96% | 9.74% | 4.24% | 10.20% | 10.71% |
Russell 2000 Index2 | | | | | 3.56% | 9.72% | 8.40% |
| LKCM Small Cap Equity Fund – | | | | | | | |
| Adviser Class | 6/5/03 | $22.07 | N/A | 1.21% | 9.45% | 3.97% | N/A | 9.25% |
Russell 2000 Index2 | | | | | | N/A | 8.10% |
| LKCM Small-Mid Cap Equity Fund – | | | | | | | |
| Institutional Class | 5/2/11 | $9.68 | 1.01% | 2.15% | 9.26% | N/A | N/A | -1.92% |
Russell 2500 Index3 | | | | 17.88% | N/A | N/A | 1.64% |
| LKCM Balanced Fund | 12/30/97 | $16.11 | 0.80% | 1.14% | 12.20% | 4.73% | 7.21% | 5.46% |
S&P 500 Index1 | | | | 16.00% | 1.66% | 7.10% | 4.47% |
| Barclays U.S. Intermediate | | | | | | | |
Government/Credit Bond Index4 | | | | | 5.18% | 4.62% | 5.58% |
| LKCM Fixed Income Fund | 12/30/97 | $11.23 | 0.65% | 0.72% | 5.44% | 5.81% | 4.67% | 5.30% |
| Barclays U.S. Intermediate | | | | | | | |
Government/Credit Bond Index4 | | | | | | 4.62% | 5.58% |
Performance data quoted represents past performance and does not guarantee future results. The investment return and principal value of an investment will fluctuate so that an investor’s shares, when redeemed, may be worth more or less than the original cost. Current performance of the Fund may be lower or higher than the performance quoted. Performance data current to the most recent month end may be obtained by calling 1-800-688-LKCM. The Funds impose a 1.00% redemption fee on shares held less than 30 days. If reflected, the fee would reduce performance shown.
| * | The Adviser has contractually agreed to waive all or a portion of its management fee and/or reimburse the Fund to maintain designated expense ratios through April 30, 2013. Investment performance reflects fee waivers, if any, in effect. In the absence of such waivers, total return would be reduced. Investment performance is based upon the net expense ratio. |
| ** | Expense ratios above are as of December 31, 2011, the Funds’ prior fiscal year end, as reported in the Funds’ most recent prospectus. Expense ratios reported for other periods in the financial highlights of this report may differ. |
| 1 | The S&P 500 Index is an unmanaged capitalization-weighted index of 500 stocks designed to measure performance of the broad domestic economy through changes in the aggregate market value of 500 stocks representing all major industries. |
| 2 | The Russell 2000 Index is an unmanaged index which measures the performance of the 2,000 smallest companies in the Russell 3000 Index. |
| 3 | The Russell 2500 Index is an unmanaged index which measures the performance of the 2,500 smallest companies in the Russell 3000 Index. |
| 4 | The Barclays U.S. Intermediate Government/Credit Bond Index is an unmanaged market value weighted index measuring both the principal price changes of, and income provided by, the underlying universe of securities that comprise the index. Securities included in the index must meet the following criteria: fixed as opposed to variable rate; remaining maturity of one to ten years; minimum outstanding par value of $250 million; rated investment grade or higher by Moody’s Investors Service or equivalent; must be dollar denominated and non-convertible; and must be publicly issued. |
Note: These indices defined above are not available for direct investment.
2012 Review
In many ways, the storyline of 2012 was the myopic focus on “tail risk,” which generally refers to events that are not likely, but are possible. A year ago, the list of tail risks included a hard economic landing in China, countries being expelled from the European Monetary Union, war in the Middle East and a disastrous domestic fiscal crunch. While none of these events came to pass, there was continuous concern of calamity around the next corner. Not unexpectedly, a pattern developed in the equity market where a relief rally ensued as the specter of each crisis faded. With the looming debt ceiling debate and sequestration onset scheduled in the first quarter of 2013, this pattern appears likely to continue in the short-run.
Early in 2012, global manufacturing data were better than expected, which helped fuel a strong equity market rally during the first quarter. The second quarter of 2012 was marked by a stall in manufacturing data, a cut in Chinese economic growth expectations and an increasing probability that Greece would exit the European Economic and Monetary Union. Last year marked the third consecutive year in which the equity market weakened during the summer over concern of sagging economic growth. A combination of further monetary easing by the Federal Reserve Bank and the European Central Bank in the third quarter of 2012 helped increase equity prices.
Beginning in the fall, our research revealed an increasing tendency for companies to delay significant capital decisions until resolution of the “fiscal cliff”. Although the most recent readings of manufacturing data are mixed, our research indicates we may see positive signs that manufacturing activity is improving early in 2013. We believe there are already early signs of a potential mini-renaissance in U.S. manufacturing as companies begin to bring many of these jobs back onshore. The shift to Asian manufacturing in the 1990’s was driven by cheaper labor and occurred at a time when oil was closer to $25 per barrel rather than $100 per barrel. Companies are citing time to market, quality, high energy costs and lower labor contribution to products as the impetus to bring manufacturing back to the United States.
We believe the quasi-resolution of the fiscal cliff reflected the current Washington D.C. model to reach for the lowest common denominator while deferring substantive progress. While a bevy of tax changes prevented an increase in tax rates across the board, Congress fell short of addressing spending cuts including sequestration. We believe these crucial items may instead be held hostage to the federal debt ceiling debate which is expected to occur over the first few months of 2013.
2013 Outlook
We believe the global economy is entering 2013 with a slight increase in momentum. The increased activity appears to be driven by the corporate sector which slowed in the middle of 2012 as concerns over the EuroZone and China intensified. Domestically, the corporate sector has been gripped by uncertainty around the Presidential election, fiscal cliff and tax issues. Policy actions in China have bolstered its economic growth forecast for 2013 and the European Central Bank’s actions in the second half of last year appear to have temporarily arrested further deterioration in the economic outlook for the EuroZone. Offsetting the benefit of the modest uptick in global growth are the home-grown issues of higher payroll taxes and a patchwork of additional tax increases. Our current forecast suggests that real Gross Domestic Product will grow between 2.0% and 2.4% in 2013, although we expect the growth to be back-end loaded.
We expect the negative real interest rate environment will remain an economic tailwind in 2013. Our base case is that the Federal Reserve’s conditional thresholds for higher interest rates of unemployment below 6.5% and inflation above 2.5% will not be met in 2013. This is not a deviation from the consensus forecast of many market observers. However, we stand apart from consensus in that we would not be surprised if capital markets began to focus more intently on this issue and discount higher rates towards the end of 2013. Current data such as average hourly earnings, excess manufacturing capacity and low velocity of the money stock suggest that inflation is not a near-term threat. With global growth accelerating, particularly with better economic data from China, we believe inflation expectations could rise in the marketplace during 2013 even though there are few indications of inflationary pressure today.
Although we have previously mentioned housing as a positive force for economic growth, we remain in the early stages of this development. We believe home prices have stabilized and begun to move higher. The monthly supply of new homes was approximately 4.9 months at year-end, well below the long-term average. The 30-year conventional mortgage rate rests at all-time lows. In our view, housing has the potential to add 1.0% growth to Gross Domestic Product in 2013. While this may represent a best case scenario, we believe there is little question that housing will positively impact the economy in 2013 to a greater degree than 2012.
Housing continues to positively impact consumer sentiment, and the wealth effect of housing helps sustain our continued outlook for positive consumer spending. Examining the domestic economy, we find that there has been little net deleveraging. However, there has been a significant shift of leverage from the private to the public sector. This has contributed to robust consumer spending, although the 2% payroll tax cut expiration on January 1, 2013, translates directly into a tax increase on discretionary income for a majority of paycheck earners in the country. Consistent with the nation’s approach to many difficult issues, Congress opted to bolster the consumer at the expense of the nation’s fiscal situation. However, this is largely an exercise in semantics. The private sector remains on the hook for public debt and ultimately pays the price through a combination of higher taxes, reduced services or inflation.
Although corporate profits registered a new high in 2012, we believe that it was valuation expansion which drove the equity market return. Earnings for the Standard & Poor’s 500 Index grew an estimated 3.0% in 2012 compared to the index return of 16.0% for the year. Although the Standard & Poor’s 500 Index’s earnings multiple of approximately 13.8X at year-end, based on trailing twelve month earnings, represents some multiple expansion in 2012, we are comfortable with the current market valuation. Our forecast for 2013 is for higher earnings growth, but less multiple expansion compared with 2012. The greatest risk to our outlook would be disappointing corporate earnings resulting from a combination of weaker consumer spending than expected, follow-on effects of the fiscal cliff debate and a surge in inflation.
We continue to anticipate a significant reallocation from bond funds into equity funds. Over the past four years, investors have plowed more than $1 trillion into bond mutual funds while withdrawing $500 billion from domestically oriented equity mutual funds. We believe this action is simply a reflection of stock price action from October 2007 through the March 2009 low in the equity market. However, since January 2009, the Standard & Poor’s 500 Index has posted a 14% compounded annual return, or roughly double the average of the past fifty years. In contrast, the compounded annual return on 10-Year U.S. Treasury bonds is 4.0% over this same time period. Given our view that equity valuations are attractive and bond valuations are less attractive, we maintain our cautious stance on the bond market. When rates begin to rise, there is likely to be a large asset allocation shift from bonds to equities. This may not be a 2013 event, but if our view on growing inflationary concerns unfolds in 2013, we think the markets will move meaningfully closer to reversing the equities-to-bonds money flow.
LKCM Equity Fund
The LKCM Equity Fund performed in line with the S&P 500 Index for the year ended December 31, 2012. The Fund’s performance relative to the benchmark benefited from stock selection in the Consumer Discretionary, Healthcare and Materials sectors, while stock selection in the Financials and Information Technology sectors detracted from the Fund’s relative performance. Our decision to overweight the Consumer Discretionary sector and underweight the Energy sector also enhanced the Fund’s performance relative to the benchmark, but our underweight position in the Financials sector detracted from the Fund’s relative performance. We believe the Fund’s concentration on quality companies can provide an opportunity to add value for the Fund and its shareholders in the upcoming year.
| | Total Return Year Ended |
| | December 31, 2012 |
| LKCM Equity Fund | 15.69% |
| S&P 500 Index | 16.00% |
LKCM Small Cap Equity Fund
The LKCM Small Cap Equity Fund underperformed the Russell 2000 Index during the year ended December 31, 2012. The Fund’s underperformance relative to the benchmark primarily resulted from our stock selection decisions, as our sector allocation decisions benefited the Fund’s returns. Stock selection in the Consumer Discretionary, Financials and Information Technology sectors detracted from the Fund’s relative performance, while our stock selection in the Healthcare sector benefited the Fund’s relative performance. Our decision to overweight the Consumer Discretionary sector benefited the Fund’s relative performance. Overall, we believe 2012 was a year in which the market was not interested in the companies identified by our small cap investment strategy, as our investments did not appreciate to the same degree as the benchmark.
| | Total Return Year Ended |
| | December 31, 2012 |
| LKCM Small Cap Equity Fund – Institutional Class | 9.74% |
| Russell 2000 Index | 16.35% |
LKCM Small-Mid Cap Equity Fund
The LKCM Small-Mid Cap Equity Fund underperformed the Russell 2500 Index during the year ended December 31, 2012. The Fund’s underperformance relative to the benchmark primarily resulted from our stock selection decisions. Stock selection in the Energy, Industrials, Materials and Financials sectors detracted from the Fund’s relative performance, while our stock selection in the Information Technology sector slightly benefited the Fund’s relative performance. Our sector allocation decisions did not have a meaningful impact on the Fund’s performance relative to the benchmark. Overall, we believe 2012 was a year in which the market was not interested in the companies identified by our small-mid cap investment strategy, as our investments did not appreciate to the same degree as the benchmark.
| | Total Return Year Ended |
| | December 31, 2012 |
| LKCM Small-Mid Cap Equity Fund | 9.26% |
| Russell 2500 Index | 17.88% |
LKCM Balanced Fund
The LKCM Balanced Fund’s blend of equity and fixed income securities, along with stock selection, benefited the Fund’s performance during the year ended December 31, 2012. Our stock selection decisions in the Healthcare, Consumer Discretionary and Materials sectors were positive to the Fund’s relative performance, while stock selection decisions in the Financials, Industrials and Information Technology sectors detracted from the Fund’s relative performance. The Fund continued to focus its holdings of fixed income securities on investment grade corporate bonds, which generated income for the Fund and helped reduce the overall volatility of the Fund’s performance during the year.
| | Total Return Year Ended |
| | December 31, 2012 |
| LKCM Balanced Fund | 12.20% |
| S&P 500 Index | 16.00% |
| Barclays U.S. Intermediate Government/Credit Bond Index | 3.89% |
LKCM Fixed Income Fund
The LKCM Fixed Income Fund outperformed its benchmark, the Barclays Intermediate Government/Credit Bond Index, during the year ended December 31, 2012, advancing 5.44% versus 3.89% for the benchmark. During the year, the corporate market continued to be bolstered by strong balance sheets and cash flow metrics and investors searched for yield, causing spreads relative to Treasuries to tighten further and yields to decline throughout much of the year. The Fund’s primary corporate bond focus, along with an overweighting in the
Financials sector, were additive to relative performance as the healing of the Financials sector continued and U.S. Treasury and Agency issues lagged despite the Federal Reserve’s extraordinary quantitative easing measures. The Fund was defensively postured with a 3.6 year average duration relative to the 3.9 average duration of the benchmark, which detracted from the Fund’s relative performance as longer duration issues continued to outperform their shorter duration counterparts. We believe the Fund’s investment emphasis on a diversified portfolio of high-quality, short-to-intermediate duration corporate bonds has the Fund well-positioned in this increasingly dynamic market environment.
| | Total Return Year Ended |
| | December 31, 2012 |
| LKCM Fixed Income Fund | 5.44% |
| Barclays U.S. Intermediate Government/Credit Bond Index | 3.89% |
J. Luther King, Jr., CFA, CIC
February 1, 2013
The information provided herein represents the opinion of J. Luther King, Jr., CFA, CIC and is not intended to be a forecast of future events, a guarantee of future results, nor investment advice.
Please refer to the Schedule of Investments found on pages 15-27 of the report for more information on Fund holdings. Fund holdings and sector allocations are subject to change and are not recommendations to buy or sell any securities.
Mutual fund investing involves risk. Principal loss is possible. Past performance is not a guarantee of future results. Small and medium capitalization funds typically carry additional risks, since smaller companies generally have a higher risk of failure, and, historically, their stocks have experienced a greater degree of market volatility than stocks on average. Investments in debt securities typically decrease in value when interest rates rise. This risk is greater for longer-term debt securities. These risks are discussed in the Fund’s summary and statutory prospectuses.
Current and future portfolio holdings are subject to risk.
Diversification does not assure a profit nor protect against loss in a declining market.
Earnings growth is not a measure of the Fund’s future performance.
Duration is a commonly used measure of the potential volatility of the price of a debt security, or the aggregate market value of a portfolio of debt securities, prior to maturity. Securities with a longer duration generally have more volatile prices than securities of comparable quality with a shorter duration.
Cash flow measures the cash generating capability of a company by adding non-cash charges (e.g. depreciation) and interest expense to pretax income.
Earnings multiple: The earnings multiple of a stock, also called the price/earnings (P/E) ratio, is the share price divided by the earnings per share. The earnings multiple is often based on the prior twelve months of earnings data.
Must be preceded or accompanied by a prospectus.
Quasar Distributors, LLC, distributor.
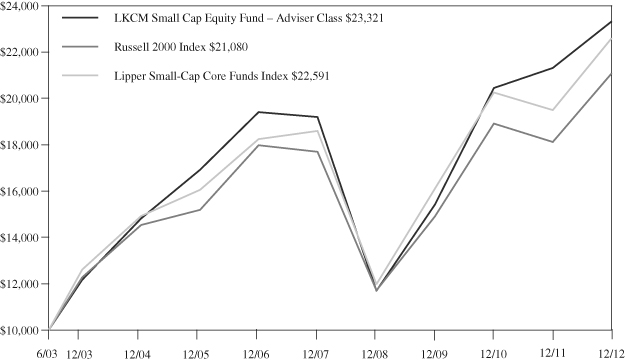
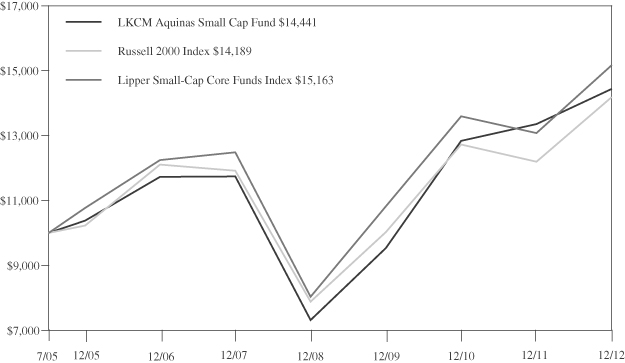
The following information illustrates the historical performance of LKCM Small Cap Equity Fund as of December 31, 2012 compared to the Fund’s representative market indices.
Performance data quoted represents past performance; past performance does not guarantee future results. The graph and table do not reflect the deduction of taxes that a shareholder would pay on Fund distributions or the redemption of Fund shares. The investment return and principal value of an investment will fluctuate so that an investor’s shares, when redeemed, may be worth more or less than their original cost. Current performance of the Fund may be lower or higher than the performance quoted. Performance data current to the most recent month end may be obtained by calling 1-800-688-LKCM.
An index is an unmanaged portfolio and does not trade or incur any expenses. One can not invest in an unmanaged index.
AVERAGE ANNUAL TOTAL RETURN (Periods Ended December 31, 2012)
| | Past | Past | Past | Since |
| | 1 Year | 5 Years(1) | 10 Years(1) | Inception(1)(2) |
| LKCM Small Cap Equity Fund – Institutional Class | 9.74% | 4.24% | 10.20% | 10.71% |
| Russell 2000 Index | 16.35% | 3.56% | 9.72% | 8.40% |
| Lipper Small-Cap Core Funds Index | 15.94% | 3.96% | 9.70% | 9.55% |
A HYPOTHETICAL $10,000 INVESTMENT IN LKCM SMALL CAP EQUITY FUND – INSTITUTIONAL CLASS
(for the ten years ended December 31, 2012)
The Russell 2000 Index is an unmanaged index consisting of the 2,000 smallest companies in the Russell 3000 Index.
The Lipper Small-Cap Core Funds Index is an index of small cap core mutual funds tracked by Lipper, Inc.
AVERAGE ANNUAL TOTAL RETURN (Periods Ended December 31, 2012)
| | Past | Past | Past | Since |
| | 1 Year | 3 Years(1) | 5 Years(1) | Inception(1)(2) |
| LKCM Small Cap Equity Fund – Adviser Class | 9.45% | 14.80% | 3.97% | 9.25% |
| Russell 2000 Index | 16.35% | 12.25% | 3.56% | 8.10% |
| Lipper Small-Cap Core Funds Index | 15.94% | 11.92% | 3.96% | 8.89% |
A HYPOTHETICAL $10,000 INVESTMENT IN LKCM SMALL CAP EQUITY FUND – ADVISER CLASS
(for the period from June 5, 2003 through December 31, 2012)
The Russell 2000 Index is an unmanaged index consisting of the 2,000 smallest companies in the Russell 3000 Index.
The Lipper Small-Cap Core Funds Index is an index of small cap core mutual funds tracked by Lipper, Inc.
The following information illustrates the historical performance of LKCM Small-Mid Cap Equity Fund as of December 31, 2012 compared to the Fund’s representative market indices.
Performance data quoted represents past performance; past performance does not guarantee future results. The graph and table do not reflect the deduction of taxes that a shareholder would pay on Fund distributions or the redemption of Fund shares. The investment return and principal value of an investment will fluctuate so that an investor’s shares, when redeemed, may be worth more or less than their original cost. Current performance of the Fund may be lower or higher than the performance quoted. Performance data current to the most recent month end may be obtained by calling 1-800-688-LKCM.
An index is an unmanaged portfolio and does not trade or incur any expenses. One can not invest in an unmanaged index.
AVERAGE ANNUAL TOTAL RETURN (Periods Ended December 31, 2012)
| | Past | Since |
| | 1 Year | Inception(1)(2) |
| LKCM Small-Mid Cap Equity Fund – Institutional Class | 9.26% | -1.92% |
| Russell 2500 Index | 17.88% | 1.64% |
| Lipper Small-Cap Core Funds Index | 15.94% | 0.67% |
A HYPOTHETICAL $10,000 INVESTMENT IN LKCM SMALL-MID CAP EQUITY FUND – INSTITUTIONAL CLASS
(for the period from May 2, 2011 to December 31, 2012)
The Russell 2500 Index is an unmanaged index consisting of the 2,500 smallest companies in the Russell 3000 Index.
The Lipper Small-Cap Core Funds Index is an index of small cap core mutual funds tracked by Lipper, Inc.
The following information illustrates the historical performance of LKCM Equity Fund as of December 31, 2012 compared to the Fund’s representative market indices.
Performance data quoted represents past performance; past performance does not guarantee future results. The graph and table do not reflect the deduction of taxes that a shareholder would pay on Fund distributions or the redemption of Fund shares. The investment return and principal value of an investment will fluctuate so that an investor’s shares, when redeemed, may be worth more or less than their original cost. Current performance of the Fund may be lower or higher than the performance quoted. Performance data current to the most recent month end may be obtained by calling 1-800-688-LKCM.
An index is an unmanaged portfolio and does not trade or incur any expenses. One can not invest in an unmanaged index.
AVERAGE ANNUAL TOTAL RETURN (Periods Ended December 31, 2012)
| | Past | Past | Past | Since |
| | 1 Year | 5 Years(1) | 10 Years(1) | Inception(1)(2) |
| LKCM Equity Fund – Institutional Class | 15.69% | 4.04% | 7.83% | 7.47% |
| S&P 500 Index | 16.00% | 1.66% | 7.10% | 6.95% |
| Lipper Large-Cap Core Funds Index | 15.32% | 0.97% | 6.13% | 6.03% |
A HYPOTHETICAL $10,000 INVESTMENT IN LKCM EQUITY FUND – INSTITUTIONAL CLASS
(for the ten years ended December 31, 2012)
The S&P 500 Index is an unmanaged capitalization-weighted index of 500 stocks designed to measure performance of the broad domestic economy through changes in the aggregate market value of 500 stocks representing all major industries.
The Lipper Large-Cap Core Funds Index is an index of large cap core mutual funds tracked by Lipper, Inc.
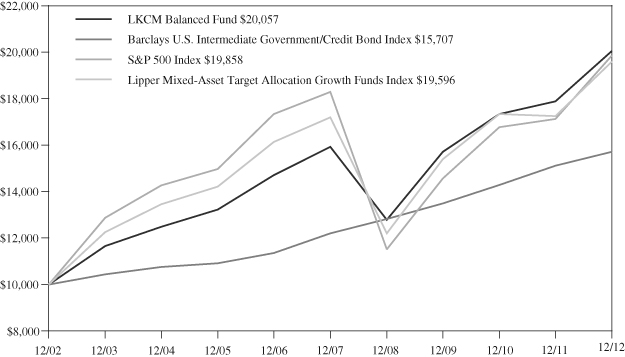
The following information illustrates the historical performance of LKCM Balanced Fund as of December 31, 2012 compared to the Fund’s representative market indices.
Performance data quoted represents past performance; past performance does not guarantee future results. The graph and table do not reflect the deduction of taxes that a shareholder would pay on Fund distributions or the redemption of Fund shares. The investment return and principal value of an investment will fluctuate so that an investor’s shares, when redeemed, may be worth more or less than their original cost. Current performance of the Fund may be lower or higher than the performance quoted. Performance data current to the most recent month end may be obtained by calling 1-800-688-LKCM.
An index is an unmanaged portfolio and does not trade or incur any expenses. One can not invest in an unmanaged index.
AVERAGE ANNUAL TOTAL RETURN (Periods Ended December 31, 2012)
| | Past | Past | Past | Since |
| | 1 Year | 5 Years(1) | 10 Years(1) | Inception(1)(2) |
| LKCM Balanced Fund | 12.20% | 4.73% | 7.21% | 5.46% |
| Barclays U.S. Intermediate Government/Credit Bond Index | 3.89% | 5.18% | 4.62% | 5.58% |
| S&P 500 Index | 16.00% | 1.66% | 7.10% | 4.47% |
| Lipper Mixed-Asset Target Allocation Growth Funds Index | 13.67% | 2.65% | 6.96% | 5.30% |
A HYPOTHETICAL $10,000 INVESTMENT IN LKCM BALANCED FUND
(for the ten years ended December 31, 2012)
The Barclays U.S. Intermediate Government/Credit Bond Index is an unmanaged market value weighted index measuring both the principal price changes of, and income provided by, the underlying universe of securities that comprise the index. Securities included in the index must meet the following criteria: fixed as opposed to variable rate; remaining maturity of one to ten years; minimum outstanding par value of $250 million; rated investment grade or higher by Moody’s Investors Service or equivalent; must be dollar denominated and non-convertible; and must be publicly issued.
The Lipper Mixed-Asset Target Allocation Growth Funds Index is an unmanaged index consisting of funds tracked by Lipper, Inc. that, by portfolio practice, maintain a mix of between 60%-80% equity securities, with the remainder invested in bonds, cash and cash equivalents.
The S&P 500 Index is an unmanaged capitalization-weighted index of 500 stocks designed to measure performance of the broad domestic economy through changes in the aggregate market value of 500 stocks representing all major industries.
The following information illustrates the historical performance of LKCM Fixed Income Fund as of December 31, 2012 compared to the Fund’s representative market indices.
Performance data quoted represents past performance; past performance does not guarantee future results. The graph and table do not reflect the deduction of taxes that a shareholder would pay on Fund distributions or the redemption of Fund shares. The investment return and principal value of an investment will fluctuate so that an investor’s shares, when redeemed, may be worth more or less than their original cost. Current performance of the Fund may be lower or higher than the performance quoted. Performance data current to the most recent month end may be obtained by calling 1-800-688-LKCM.
An index is an unmanaged portfolio and does not trade or incur any expenses. One can not invest in an unmanaged index.
AVERAGE ANNUAL TOTAL RETURN (Periods Ended December 31, 2012)
| | Past | Past | Past | Since |
| | 1 Year | 5 Years(1) | 10 Years(1) | Inception(1)(2) |
| LKCM Fixed Income Fund | 5.44% | 5.81% | 4.67% | 5.30% |
| Barclays U.S. Intermediate Government/Credit Bond Index | 3.89% | 5.18% | 4.62% | 5.58% |
| Lipper Short Intermediate Investment-Grade Debt Funds Index | 5.01% | 4.72% | 4.08% | 4.88% |
A HYPOTHETICAL $10,000 INVESTMENT IN LKCM FIXED INCOME FUND
(for the ten years ended December 31, 2012)
The Barclays U.S. Intermediate Government/Credit Bond Index is an unmanaged market value weighted index measuring both the principal price changes of, and income provided by, the underlying universe of securities that comprise the index. Securities included in the index must meet the following criteria: fixed as opposed to variable rate; remaining maturity of one to ten years; minimum outstanding par value of $250 million; rated investment grade or higher by Moody’s Investors Service or equivalent; must be dollar denominated and non-convertible; and must be publicly issued.
The Lipper Short Intermediate Investment-Grade Debt Funds Index is an index of short intermediate investment grade mutual funds tracked by Lipper, Inc.
LKCM Funds Expense Example — December 31, 2012
As a shareholder of the Funds, you incur two types of costs: (1) transaction costs, including redemption fees; and (2) ongoing costs, including management fees, distribution and/or service (12b-1) fees and other Fund expenses. This Example is intended to help you understand your ongoing costs (in dollars) of investing in the Funds and to compare these costs with the ongoing costs of investing in other mutual funds. The Example is based on an investment of $1,000 invested at the beginning of the period and held for the entire period (7/1/12-12/31/12).
ACTUAL EXPENSES
The first line of the tables below provides information about actual account values and actual expenses. Although the Funds charge no sales load, you will be assessed fees for outgoing wire transfers, returned checks and stop payment orders at prevailing rates charged by U.S. Bancorp Fund Services, LLC, the Funds’ transfer agent. If you request that a redemption be made by wire transfer, currently a $15.00 fee is charged by the Funds’ transfer agent. You will be charged a redemption fee equal to 1.00% of the net amount of the redemption if you redeem your shares of the LKCM Small Cap Equity, Small-Mid Cap Equity, Equity, Balanced and Fixed Income Funds within 30 days of purchase. To the extent the Funds invest in shares of other investment companies as part of their investment strategies, you will indirectly bear your proportionate share of any fees and expenses charged by the underlying funds in which the Funds invest in addition to the expenses of the Funds. Actual expenses of the underlying funds are expected to vary among the various underlying funds. These expenses are not included in the example below. The example below includes management fees, registration fees and other expenses. However, the example below does not include portfolio trading commissions and related expenses and other extraordinary expenses as determined under generally accepted accounting principles. You may use the information in this line, together with the amount you invested, to estimate the expenses that you paid over the period. Simply divide your account value by $1,000 (for example, an $8,600 account value divided by $1,000 = 8.6), then multiply the result by the number in the first line under the heading entitled “Expenses Paid During Period” to estimate the expenses you paid on your account during this period.
HYPOTHETICAL EXAMPLES FOR COMPARISON PURPOSES
The second line of the tables below provides information about hypothetical account values and hypothetical expenses based on the Funds’ actual expense ratios and an assumed rate of return of 5% per year before expenses, which are not the Funds’ actual returns. The hypothetical account values and expenses may not be used to estimate the actual ending account balance or expenses you paid for the period. You may use this information to compare the ongoing costs of investing in the Funds and other funds. To do so, compare this 5% hypothetical example with the 5% hypothetical examples that appear in the shareholder reports of the other funds. Please note that the expenses shown in the table are meant to highlight your ongoing costs only and do not reflect any transactional costs, such as redemption fees. Therefore, the second line of the table is useful in comparing ongoing costs only, and will not help you determine the relative total costs of owning different funds. In addition, if these transactions costs were included, your costs would have been higher.
| | LKCM Small Cap Equity Fund – Institutional Class |
| | Beginning | Ending | Expenses Paid |
| | Account Value | Account Value | During Period* |
| | 7/1/12 | 12/31/12 | 7/1/12 – 12/31/12 |
| Actual | $1,000.00 | $1,042.20 | $4.83 |
| Hypothetical (5% return before expense) | $1,000.00 | $1,020.41 | $4.77 |
| * | Expenses are equal to the Fund’s annualized net expense ratio of 0.94%, multiplied by the average account value over the period, multiplied by 184/366 to reflect the one-half year period. |
| | LKCM Small Cap Equity Fund – Adviser Class |
| | Beginning | Ending | Expenses Paid |
| | Account Value | Account Value | During Period* |
| | 7/1/12 | 12/31/12 | 7/1/12 – 12/31/12 |
| Actual | $1,000.00 | $1,040.80 | $6.10 |
| Hypothetical (5% return before expense) | $1,000.00 | $1,019.15 | $6.04 |
| * | Expenses are equal to the Fund’s annualized net expense ratio of 1.19%, multiplied by the average account value over the period, multiplied by 184/366 to reflect the one-half year period. |
| | LKCM Small-Mid Cap Equity Fund |
| | Beginning | Ending | Expenses Paid |
| | Account Value | Account Value | During Period* |
| | 7/1/12 | 12/31/12 | 7/1/12 – 12/31/12 |
| Actual | $1,000.00 | $1,034.20 | $5.11 |
| Hypothetical (5% return before expense) | $1,000.00 | $1,020.11 | $5.08 |
| * | Expenses are equal to the Fund’s annualized net expense ratio of 1.00%, multiplied by the average account value over the period, multiplied by 184/366 to reflect the one-half year period. |
| | LKCM Equity Fund |
| | Beginning | Ending | Expenses Paid |
| | Account Value | Account Value | During Period* |
| | 7/1/12 | 12/31/12 | 7/1/12 – 12/31/12 |
| Actual | $1,000.00 | $1,084.10 | $4.19 |
| Hypothetical (5% return before expense) | $1,000.00 | $1,021.11 | $4.06 |
| * | Expenses are equal to the Fund’s annualized net expense ratio of 0.80%, multiplied by the average account value over the period, multiplied by 184/366 to reflect the one-half year period. |
| | LKCM Balanced Fund |
| | Beginning | Ending | Expenses Paid |
| | Account Value | Account Value | During Period* |
| | 7/1/12 | 12/31/12 | 7/1/12 – 12/31/12 |
| Actual | $1,000.00 | $1,046.70 | $4.12 |
| Hypothetical (5% return before expense) | $1,000.00 | $1,021.11 | $4.06 |
| * | Expenses are equal to the Fund’s annualized net expense ratio of 0.80%, multiplied by the average account value over the period, multiplied by 184/366 to reflect the one-half year period. |
| | LKCM Fixed Income Fund |
| | Beginning | Ending | Expenses Paid |
| | Account Value | Account Value | During Period* |
| | 7/1/12 | 12/31/12 | 7/1/12 – 12/31/12 |
| Actual | $1,000.00 | $1,025.40 | $3.31 |
| Hypothetical (5% return before expense) | $1,000.00 | $1,021.87 | $3.30 |
| * | Expenses are equal to the Fund’s annualized net expense ratio of 0.65%, multiplied by the average account value over the period, multiplied by 184/366 to reflect the one-half year period. |
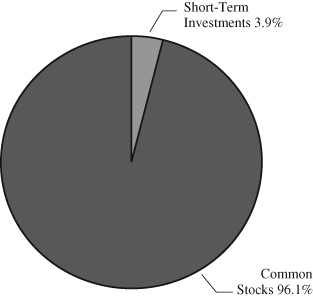
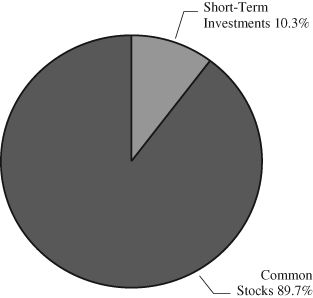
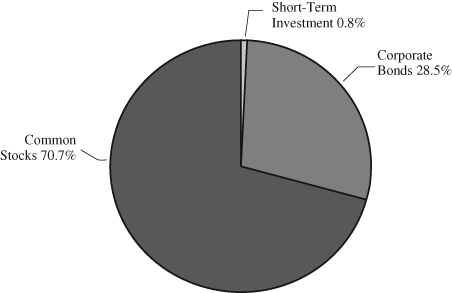
ALLOCATION OF PORTFOLIO HOLDINGS — LKCM Funds — December 31, 2012
Percentages represent market value as a percentage of total investments.
| LKCM Small Cap Equity Fund | LKCM Small-Mid Cap Equity Fund |
| | |
 |  |
| | |
| | |
| LKCM Equity Fund | LKCM Balanced Fund |
| | |
 |  |
| | |
| | |
| LKCM Fixed Income Fund | |
| | |
 | |
| | |
| | |
| LKCM Small Cap Equity Fund |
| Schedule of Investments |
December 31, 2012
| COMMON STOCKS - 97.6% | | Shares | | | Value | |
| | | | | | | |
| Aerospace & Defense - 2.4% | | | | | | |
| Hexcel Corporation (a) | | | 516,200 | | | $ | 13,916,752 | |
| Teledyne Technologies Incorporated (a) | | | 108,720 | | | | 7,074,410 | |
| | | | | | | | 20,991,162 | |
| Auto Components - 1.2% | | | | | | | | |
| Group 1 Automotive, Inc. | | | 169,130 | | | | 10,484,369 | |
| | | | | | | | | |
| Automobiles - 0.8% | | | | | | | | |
| Thor Industries, Inc. | | | 175,177 | | | | 6,556,875 | |
| | | | | | | | | |
| Banks - 8.7% | | | | | | | | |
| Community Bank System, Inc. | | | 377,430 | | | | 10,326,485 | |
| First Horizon National Corporation | | | 1,189,395 | | | | 11,786,904 | |
| Hancock Holding Company | | | 138,330 | | | | 4,390,594 | |
| Home Bancshares Inc. | | | 268,825 | | | | 8,876,602 | |
| Prosperity Bancshares, Inc. | | | 232,425 | | | | 9,761,850 | |
| Texas Capital Bancshares, Inc. (a) | | | 261,240 | | | | 11,708,777 | |
| UMB Financial Corporation | | | 200,443 | | | | 8,787,421 | |
| Umpqua Holdings Corporation | | | 812,550 | | | | 9,579,964 | |
| | | | | | | | 75,218,597 | |
| | | | | | | | | |
| Biotechnology - 0.8% | | | | | | | | |
| Exact Sciences Corp. (a) | | | 619,830 | | | | 6,564,000 | |
| | | | | | | | | |
| Building Products - 0.8% | | | | | | | | |
| Armstrong World Industries, Inc. | | | 142,830 | | | | 7,245,766 | |
| | | | | | | | | |
| Capital Markets - 1.3% | | | | | | | | |
| Greenhill & Co., Inc. | | | 218,675 | | | | 11,368,913 | |
| | | | | | | | | |
| Commercial Services & Supplies - 1.0% | | | | | | | | |
| Insperity, Inc. | | | 273,300 | | | | 8,898,648 | |
| | | | | | | | | |
| Communications Equipment - 4.7% | | | | | | | | |
| Ciena Corporation (a) | | | 654,225 | | | | 10,271,333 | |
| Infinera Corporation (a) | | | 543,500 | | | | 3,157,735 | |
| Ixia (a) | | | 625,250 | | | | 10,616,745 | |
| Loral Space & Communications Inc. | | | 120,475 | | | | 6,585,163 | |
| NICE Systems Limited - ADR (a) (b) | | | 293,745 | | | | 9,834,583 | |
| | | | | | | | 40,465,559 | |
| Consumer Finance - 2.0% | | | | | | | | |
| Cash America International, Inc. | | | 172,900 | | | | 6,858,943 | |
| First Cash Financial Services, Inc. (a) | | | 216,301 | | | | 10,732,856 | |
| | | | | | | | 17,591,799 | |
| Containers & Packaging - 1.1% | | | | | | | | |
| Silgan Holdings Inc. | | | 225,575 | | | | 9,381,664 | |
| | | | | | | | | |
| Electrical Equipment & Instruments - 4.8% | | | | | | | | |
| Belden Inc. | | | 294,325 | | | | 13,241,682 | |
| Franklin Electric Co., Inc. | | | 187,915 | | | | 11,682,675 | |
| Thermon Group Holdings Inc. (a) | | | 377,520 | | | | 8,505,526 | |
| Woodward Inc. | | | 207,195 | | | | 7,900,345 | |
| | | | | | | | 41,330,228 | |
| Electronic Equipment & Instruments - 1.4% | | | | | | | | |
| FARO Technologies, Inc. (a) | | | 117,800 | | | | 4,203,104 | |
| Mercury Computer Systems, Inc. (a) | | | 80,200 | | | | 737,840 | |
| | | | | | | | | |
| Electronic Equipment & Instruments - 1.4% | | | | | | | | |
| National Instruments Corporation | | | 268,000 | | | | 6,917,080 | |
| | | | | | | | 11,858,024 | |
| Energy Equipment & Services - 0.9% | | | | | | | | |
| Atwood Oceanics, Inc. (a) | | | 160,925 | | | | 7,368,756 | |
| | | | | | | | | |
| Food & Drug Retailing - 1.0% | | | | | | | | |
| Casey’s General Stores, Inc. | | | 164,465 | | | | 8,733,092 | |
| | | | | | | | | |
| Health Care Equipment & Supplies - 7.1% | | | | | | | | |
| Cyberonics, Inc. (a) | | | 233,290 | | | | 12,254,724 | |
| DexCom Inc. (a) | | | 700,900 | | | | 9,539,249 | |
| Endologix, Inc. (a) | | | 747,913 | | | | 10,650,281 | |
| Integra LifeSciences Holdings (a) | | | 263,350 | | | | 10,262,749 | |
| MWI Veterinary Supply, Inc. (a) | | | 131,100 | | | | 14,421,000 | |
| The Spectranetics Corporation (a) | | | 299,353 | | | | 4,421,444 | |
| | | | | | | | 61,549,447 | |
| Health Care Providers & Services - 5.0% | | | | | | | | |
| Computer Programs and Systems, Inc. | | | 185,675 | | | | 9,346,879 | |
| Health Management | | | | | | | | |
| Associates Inc. - Class A (a) | | | 1,112,330 | | | | 10,366,916 | |
| HMS Holdings Corporation (a) | | | 411,620 | | | | 10,669,190 | |
| Team Health Holdings, Inc. (a) | | | 427,275 | | | | 12,292,702 | |
| | | | | | | | 42,675,687 | |
| Household Durables - 1.9% | | | | | | | | |
| Select Comfort Corporation (a) | | | 370,050 | | | | 9,684,209 | |
| Tempur-Pedic International Inc. (a) | | | 222,450 | | | | 7,004,950 | |
| | | | | | | | 16,689,159 | |
| Industrial Conglomerates - 1.4% | | | | | | | | |
| Raven Industries, Inc. | | | 248,200 | | | | 6,542,552 | |
| Rexnord Corp. (a) | | | 253,445 | | | | 5,398,379 | |
| | | | | | | | 11,940,931 | |
| Insurance - 1.6% | | | | | | | | |
| AmTrust Financial Services, Inc. | | | 469,990 | | | | 13,484,013 | |
| | | | | | | | | |
| Internet Software & Services - 1.6% | | | | | | | | |
| LivePerson, Inc. (a) | | | 495,195 | | | | 6,506,862 | |
| LogMeIn, Inc. (a) | | | 345,025 | | | | 7,732,010 | |
| | | | | | | | 14,238,872 | |
| IT Consulting & Services - 1.0% | | | | | | | | |
| Acxiom Corporation (a) | | | 481,230 | | | | 8,402,276 | |
| | | | | | | | | |
| Machinery - 6.3% | | | | | | | | |
| Actuant Corporation - Class A | | | 385,950 | | | | 10,771,865 | |
| Barnes Group Inc. | | | 358,800 | | | | 8,058,648 | |
| Chart Industries, Inc. (a) | | | 104,530 | | | | 6,969,015 | |
| CLARCOR Inc. | | | 146,150 | | | | 6,983,047 | |
| The Middleby Corporation (a) | | | 105,920 | | | | 13,580,003 | |
| Westport Innovations Inc. (a) (b) | | | 285,521 | | | | 7,626,266 | |
| | | | | | | | 53,988,844 | |
| Marine - 1.2% | | | | | | | | |
| Kirby Corporation (a) | | | 160,925 | | | | 9,959,648 | |
The accompanying notes are an integral part of these financial statements.
| LKCM Small Cap Equity Fund |
| Schedule of Investments, Continued |
December 31, 2012
| COMMON STOCKS | | Shares | | | Value | |
| | | | | | | |
| Media - 1.2% | | | | | | |
| Cinemark Holdings, Inc. | | | 403,475 | | | $ | 10,482,280 | |
| | | | | | | | | |
| Metals & Mining - 3.2% | | | | | | | | |
| Carpenter Technology Corporation | | | 192,675 | | | | 9,947,810 | |
| Commercial Metals Company | | | 717,450 | | | | 10,661,307 | |
| Walter Energy, Inc. | | | 192,770 | | | | 6,916,588 | |
| | | | | | | | 27,525,705 | |
| Oil & Gas & Consumable Fuels - 6.7% | | | | | | | | |
| Approach Resources Inc. (a) | | | 441,003 | | | | 11,029,485 | |
| Comstock Resources, Inc. (a) | | | 513,470 | | | | 7,768,801 | |
| Gulfport Energy Corporation (a) | | | 356,920 | | | | 13,641,482 | |
| Kodiak Oil & Gas Corporation (a) (b) | | | 949,775 | | | | 8,405,509 | |
| Oasis Petroleum Inc. (a) | | | 274,470 | | | | 8,728,146 | |
| Rosetta Resources, Inc. (a) | | | 176,273 | | | | 7,995,743 | |
| | | | | | | | 57,569,166 | |
| Pharmaceuticals - 2.4% | | | | | | | | |
| Akorn, Inc. (a) | | | 836,234 | | | | 11,172,086 | |
| IMPAX Laboratories, Inc. (a) | | | 457,205 | | | | 9,368,131 | |
| | | | | | | | 20,540,217 | |
| Real Estate - 0.5% | | | | | | | | |
| FirstService Corporation (a) (b) | | | 143,210 | | | | 4,047,115 | |
| | | | | | | | | |
| Semiconductor Equipment & Products - 0.9% | | | | | | | | |
| Cirrus Logic, Inc. (a) | | | 270,270 | | | | 7,829,722 | |
| | | | | | | | | |
| Software - 6.4% | | | | | | | | |
| ACI Worldwide, Inc. (a) | | | 270,835 | | | | 11,832,781 | |
| Aspen Technology, Inc. (a) | | | 612,730 | | | | 16,935,857 | |
| Interactive Intelligence Group, Inc. (a) | | | 330,600 | | | | 11,088,324 | |
| MicroStrategy Incorporated - Class A (a) | | | 79,187 | | | | 7,394,482 | |
| Pegasystems Inc. | | | 333,683 | | | | 7,567,931 | |
| | | | | | | | 54,819,375 | |
| Specialty Retail - 6.0% | | | | | | | | |
| bebe stores, inc. | | | 408,800 | | | | 1,631,112 | |
| DSW Inc. - Class A | | | 183,800 | | | | 12,073,822 | |
| Genesco Inc. (a) | | | 167,725 | | | | 9,224,875 | |
| GNC Holdings, Inc. - Class A | | | 189,310 | | | | 6,300,237 | |
| Monro Muffler Brake, Inc. | | | 223,933 | | | | 7,830,937 | |
| Sonic Automotive, Inc. - Class A | | | 687,950 | | | | 14,371,275 | |
| | | | | | | | 51,432,258 | |
| Textiles, Apparel & Luxury Goods - 4.8% | | | | | | | | |
| The Children’s Place Retail Stores, Inc. (a) | | | 170,470 | | | | 7,550,116 | |
| Crocs, Inc. (a) | | | 531,400 | | | | 7,646,846 | |
| Fifth & Pacific Companies, Inc. (a) | | | 943,700 | | | | 11,749,065 | |
| Oxford Industries, Inc. | | | 123,015 | | | | 5,702,976 | |
| Wolverine World Wide, Inc. | | | 207,050 | | | | 8,484,909 | |
| | | | | | | | 41,133,912 | |
| Thrifts & Mortgage Finance - 1.1% | | | | | | | | |
| Capitol Federal Financial Inc. | | | 850,050 | | | | 9,937,085 | |
| | | | | | | | | |
| Trading Companies & Distributors - 3.8% | | | | | | | | |
| Beacon Roofing Supply, Inc. (a) | | | 329,155 | | | | 10,954,278 | |
| | | | | | | | | |
| | | | | | | | | |
| Trading Companies & | | | | | | | | |
| Distributors - 3.8, Continued | | | | | | | | |
| Kaman Corporation | | | 260,225 | | | | 9,576,280 | |
| WESCO International, Inc. (a) | | | 176,200 | | | | 11,881,166 | |
| | | | | | | | 32,411,724 | |
| Wireless Telecommunication Services - 0.6% | | | | | | | | |
| Leap Wireless International, Inc. (a) | | | 824,400 | | | | 5,482,260 | |
| | | | | | | | | |
| TOTAL COMMON STOCKS | | | | | | | | |
| (Cost $672,127,332) | | | | | | | 840,197,148 | |
| | | | | | | | | |
| | | | | | | | | |
| SHORT-TERM INVESTMENT - 1.9% | | | | | | | | |
| | | | | | | | | |
| Money Market Fund (c) - 1.9% | | | | | | | | |
| Federated Government Obligations Fund - | | | | | | | | |
| Institutional Shares, 0.01% | | | 16,166,526 | | | | 16,166,526 | |
| | | | | | | | | |
| TOTAL SHORT-TERM INVESTMENT | | | | | | | | |
| (Cost $16,166,526) | | | | | | | 16,166,526 | |
| | | | | | | | | |
| Total Investments - 99.5% | | | | | | | 856,363,674 | |
| (Cost $688,293,858) | | | | | | | | |
| Other Assets in Excess of Liabilities - 0.5% | | | | | | | 4,358,368 | |
| TOTAL NET ASSETS - 100.0% | | | | | | $ | 860,722,042 | |
ADR American Depository Receipt.
| (a) | Non-income producing security. |
| (b) | U.S. Dollar-denominated foreign security. |
| (c) | The rate quoted is the annualized seven-day yield of the fund at period end. |
The Global Industry Classification Standard (GICS®) was developed by and/or is the exclusive property of MSCI, Inc. and Standard & Poor Financial Services LLC (“S&P”). GICS is a service mark of MSCI and S&P and has been licensed for use by U.S. Bancorp Fund Services, LLC.
The accompanying notes are an integral part of these financial statements.
| LKCM Small-Mid Cap Equity Fund |
| Schedule of Investments |
December 31, 2012
| COMMON STOCKS - 96.1% | | Shares | | | Value | |
| | | | | | | |
| Aerospace & Defense - 4.4% | | | | | | |
| BE Aerospace, Inc. (a) | | | 107,560 | | | $ | 5,313,464 | |
| Hexcel Corporation (a) | | | 206,400 | | | | 5,564,544 | |
| | | | | | | | 10,878,008 | |
| Auto Components - 1.6% | | | | | | | | |
| Group 1 Automotive, Inc. | | | 66,100 | | | | 4,097,539 | |
| | | | | | | | | |
| Banks - 9.6% | | | | | | | | |
| Comerica Incorporated | | | 168,030 | | | | 5,098,031 | |
| First Horizon National Corporation | | | 375,200 | | | | 3,718,232 | |
| Prosperity Bancshares, Inc. | | | 106,945 | | | | 4,491,690 | |
| Texas Capital Bancshares, Inc. (a) | | | 63,905 | | | | 2,864,222 | |
| UMB Financial Corporation | | | 102,750 | | | | 4,504,560 | |
| Umpqua Holdings Corporation | | | 275,055 | | | | 3,242,898 | |
| | | | | | | | 23,919,633 | |
| Capital Markets - 2.1% | | | | | | | | |
| Affiliated Managers Group, Inc. (a) | | | 41,210 | | | | 5,363,482 | |
| | | | | | | | | |
| Chemicals - 1.6% | | | | | | | | |
| FMC Corporation | | | 68,395 | | | | 4,002,475 | |
| | | | | | | | | |
| Communications Equipment - 2.9% | | | | | | | | |
| Ciena Corporation (a) | | | 325,350 | | | | 5,107,995 | |
| NICE Systems Limited - ADR (a) (b) | | | 65,780 | | | | 2,202,314 | |
| | | | | | | | 7,310,309 | |
| Construction Materials - 1.7% | | | | | | | | |
| Vulcan Materials Company | | | 83,720 | | | | 4,357,626 | |
| | | | | | | | | |
| Consumer Finance - 1.7% | | | | | | | | |
| First Cash Financial Services, Inc. (a) | | | 87,765 | | | | 4,354,899 | |
| | | | | | | | | |
| Distributors - 2.6% | | | | | | | | |
| LKQ Corporation (a) | | | 312,320 | | | | 6,589,952 | |
| | | | | | | | | |
| Electrical Equipment & Instruments - 5.1% | | | | | | | | |
| AMETEK, Inc. | | | 154,275 | | | | 5,796,112 | |
| Belden Inc. | | | 153,045 | | | | 6,885,494 | |
| | | | | | | | 12,681,606 | |
| Electronic Equipment & Instruments - 3.3% | | | | | | | | |
| National Instruments Corporation | | | 99,270 | | | | 2,562,159 | |
| Trimble Navigation Limited (a) | | | 96,305 | | | | 5,757,113 | |
| | | | | | | | 8,319,272 | |
| Food & Drug Retailing - 1.6% | | | | | | | | |
| United Natural Foods, Inc. (a) | | | 76,520 | | | | 4,100,707 | |
| | | | | | | | | |
| Health Care Equipment & Supplies - 6.0% | | | | | | | | |
| Cyberonics, Inc. (a) | | | 49,775 | | | | 2,614,681 | |
| DENTSPLY International Inc. | | | 105,360 | | | | 4,173,310 | |
| IDEXX Laboratories, Inc. (a) | | | 49,405 | | | | 4,584,783 | |
| MWI Veterinary Supply, Inc. (a) | | | 32,225 | | | | 3,544,750 | |
| | | | | | | | 14,917,524 | |
| Health Care Providers & Services - 3.2% | | | | | | | | |
| HMS Holdings Corporation (a) | | | 95,430 | | | | 2,473,546 | |
| Team Health Holdings, Inc. (a) | | | 189,010 | | | | 5,437,817 | |
| | | | | | | | 7,911,363 | |
| Household Durables - 0.9% | | | | | | | | |
| Select Comfort Corporation (a) | | | 88,430 | | | | 2,314,213 | |
| | | | | | | | | |
| Insurance - 2.3% | | | | | | | | |
| AmTrust Financial Services, Inc. | | | 202,312 | | | | 5,804,331 | |
| | | | | | | | | |
| Internet Software & Services - 2.1% | | | | | | | | |
| Akamai Technologies, Inc. (a) | | | 127,810 | | | | 5,228,707 | |
| | | | | | | | | |
| Leisure Equipment & Products - 2.7% | | | | | | | | |
| Polaris Industries Inc. | | | 80,800 | | | | 6,799,320 | |
| | | | | | | | | |
| Machinery - 6.7% | | | | | | | | |
| Actuant Corporation - Class A | | | 151,445 | | | | 4,226,830 | |
| The Middleby Corporation (a) | | | 32,780 | | | | 4,202,724 | |
| Valmont Industries, Inc. | | | 46,025 | | | | 6,284,714 | |
| Westport Innovations Inc. (a) (b) | | | 79,950 | | | | 2,135,465 | |
| | | | | | | | 16,849,733 | |
| Marine - 1.7% | | | | | | | | |
| Kirby Corporation (a) | | | 67,425 | | | | 4,172,933 | |
| | | | | | | | | |
| Media - 1.6% | | | | | | | | |
| Cinemark Holdings, Inc. | | | 150,900 | | | | 3,920,382 | |
| | | | | | | | | |
| Metals & Mining - 3.1% | | | | | | | | |
| Carpenter Technology Corporation | | | 77,390 | | | | 3,995,646 | |
| Cliffs Natural Resources Inc. | | | 94,430 | | | | 3,641,221 | |
| | | | | | | | 7,636,867 | |
| Oil & Gas & Consumable Fuels - 4.8% | | | | | | | | |
| Kodiak Oil & Gas Corporation (a) (b) | | | 440,880 | | | | 3,901,787 | |
| Oasis Petroleum Inc. (a) | | | 96,195 | | | | 3,059,001 | |
| Rosetta Resources, Inc. (a) | | | 61,805 | | | | 2,803,475 | |
| WPX Energy Inc. (a) | | | 149,845 | | | | 2,229,694 | |
| | | | | | | | 11,993,957 | |
| Pharmaceuticals - 3.2% | | | | | | | | |
| Akorn, Inc. (a) | | | 375,500 | | | | 5,016,680 | |
| IMPAX Laboratories, Inc. (a) | | | 140,040 | | | | 2,869,420 | |
| | | | | | | | 7,886,100 | |
| Semiconductor Equipment & Products - 1.6% | | | | | | | | |
| Cirrus Logic, Inc. (a) | | | 136,730 | | | | 3,961,068 | |
| | | | | | | | | |
| Software - 8.9% | | | | | | | | |
| ACI Worldwide, Inc. (a) | | | 117,730 | | | | 5,143,624 | |
| ANSYS, Inc. (a) | | | 76,250 | | | | 5,134,675 | |
| Aspen Technology, Inc. (a) | | | 156,490 | | | | 4,325,384 | |
| Nuance Communications, Inc. (a) | | | 106,950 | | | | 2,387,124 | |
| TIBCO Software Inc. (a) | | | 234,445 | | | | 5,160,134 | |
| | | | | | | | 22,150,941 | |
| Specialty Retail - 3.6% | | | | | | | | |
| GNC Holdings, Inc. - Class A | | | 118,851 | | | | 3,955,362 | |
| Tractor Supply Company | | | 28,595 | | | | 2,526,654 | |
| Ulta Salon, Cosmetics & Fragrance, Inc. | | | 25,490 | | | | 2,504,647 | |
| | | | | | | | 8,986,663 | |
The accompanying notes are an integral part of these financial statements.
| LKCM Small-Mid Cap Equity Fund |
| Schedule of Investments, Continued |
December 31, 2012
| COMMON STOCKS | | Shares | | | Value | |
| | | | | | | |
| Textiles, Apparel & Luxury Goods - 2.3% | | | | | | |
| Fifth & Pacific Companies, Inc. (a) | | | 281,690 | | | $ | 3,507,040 | |
| Wolverine World Wide, Inc. | | | 56,465 | | | | 2,313,936 | |
| | | | | | | | 5,820,976 | |
| Trading Companies & Distributors - 3.2% | | | | | | | | |
| Beacon Roofing Supply, Inc. (a) | | | 111,245 | | | | 3,702,234 | |
| WESCO International, Inc. (a) | | | 63,680 | | | | 4,293,942 | |
| | | | | | | | 7,996,176 | |
| TOTAL COMMON STOCKS | | | | | | | | |
| (Cost $223,830,114) | | | | | | | 240,326,762 | |
| | | | | | | | | |
| | | | | | | | | |
| SHORT-TERM INVESTMENTS - 3.8% | | | | | | | | |
| | | | | | | | | |
| Money Market Funds (c) - 3.8% | | | | | | | | |
| Dreyfus Government Cash Management | | | | | | | | |
| Fund - Institutional Shares, 0.01% | | | 2,419,422 | | | | 2,419,422 | |
| Federated Government Obligations | | | | | | | | |
| Fund - Institutional Shares, 0.01% | | | 7,233,985 | | | | 7,233,985 | |
| | | | | | | | | |
| TOTAL SHORT-TERM INVESTMENTS | | | | | | | | |
| (Cost $9,653,407) | | | | | | | 9,653,407 | |
| Total Investments - 99.9% | | | | | | | | |
| (Cost $233,483,521) | | | | | | | 249,980,169 | |
| Other Assets in Excess of Liabilities - 0.1% | | | | | | | 183,702 | |
| TOTAL NET ASSETS - 100.0% | | | | | | $ | 250,163,871 | |
| | | | | | | | | |
ADR American Depository Receipt.
| (a) | Non-income producing security. |
| (b) | U.S. Dollar-denominated foreign security. |
| (c) | The rate quoted is the annualized seven-day yield of the fund at period end. |
The Global Industry Classification Standard (GICS®) was developed by and/or is the exclusive property of MSCI, Inc. and Standard & Poor Financial Services LLC (“S&P”). GICS is a service mark of MSCI and S&P and has been licensed for use by U.S. Bancorp Fund Services, LLC.
The accompanying notes are an integral part of these financial statements.
| LKCM Equity Fund |
| Schedule of Investments |
December 31, 2012
| COMMON STOCKS - 89.8% | | Shares | | | Value | |
| | | | | | | |
| Aerospace & Defense - 2.5% | | | | | | |
| Honeywell International Inc. | | | 40,000 | | | $ | 2,538,800 | |
| Rockwell Collins, Inc. | | | 25,400 | | | | 1,477,518 | |
| | | | | | | | 4,016,318 | |
| Auto Components - 1.8% | | | | | | | | |
| Gentex Corporation | | | 150,000 | | | | 2,823,000 | |
| | | | | | | | | |
| Banks - 9.2% | | | | | | | | |
| Bank of America Corporation | | | 155,000 | | | | 1,798,000 | |
| Comerica Incorporated | | | 63,000 | | | | 1,911,420 | |
| Cullen/Frost Bankers, Inc. | | | 38,350 | | | | 2,081,254 | |
| Glacier Bancorp, Inc. | | | 60,000 | | | | 882,600 | |
| Hancock Holding Company | | | 70,000 | | | | 2,221,800 | |
| Prosperity Bancshares, Inc. | | | 35,000 | | | | 1,470,000 | |
| SunTrust Banks, Inc. | | | 45,000 | | | | 1,275,750 | |
| Texas Capital Bancshares, Inc. (a) | | | 18,000 | | | | 806,760 | |
| Wells Fargo & Company | | | 70,000 | | | | 2,392,600 | |
| | | | | | | | 14,840,184 | |
| Beverages - 2.0% | | | | | | | | |
| The Coca-Cola Company | | | 45,000 | | | | 1,631,250 | |
| PepsiCo, Inc. | | | 24,000 | | | | 1,642,320 | |
| | | | | | | | 3,273,570 | |
| Biotechnology - 2.3% | | | | | | | | |
| Amgen Inc. | | | 20,000 | | | | 1,726,400 | |
| Celgene Corporation (a) | | | 25,000 | | | | 1,968,000 | |
| | | | | | | | 3,694,400 | |
| Chemicals - 5.3% | | | | | | | | |
| Airgas, Inc. | | | 13,000 | | | | 1,186,770 | |
| E. I. du Pont de Nemours and Company | | | 45,000 | | | | 2,023,650 | |
| FMC Corporation | | | 52,000 | | | | 3,043,040 | |
| Monsanto Company | | | 24,000 | | | | 2,271,600 | |
| | | | | | | | 8,525,060 | |
| Commercial Services & Supplies - 0.6% | | | | | | | | |
| Waste Connections, Inc. | | | 30,000 | | | | 1,013,700 | |
| | | | | | | | | |
| Communication Equipment - 0.7% | | | | | | | | |
| QUALCOMM, Inc. | | | 18,000 | | | | 1,116,360 | |
| | | | | | | | | |
| Computers & Peripherals - 5.6% | | | | | | | | |
| Apple Inc. | | | 4,000 | | | | 2,132,120 | |
| EMC Corporation (a) | | | 75,000 | | | | 1,897,500 | |
| International Business Machines Corporation | | | 20,000 | | | | 3,831,000 | |
| NetApp, Inc. (a) | | | 37,000 | | | | 1,241,350 | |
| | | | | | | | 9,101,970 | |
| Construction Materials - 1.6% | | | | | | | | |
| Martin Marietta Materials, Inc. | | | 27,000 | | | | 2,545,560 | |
| | | | | | | | | |
| Containers & Packaging - 1.0% | | | | | | | | |
| Ball Corporation | | | 36,550 | | | | 1,635,612 | |
| | | | | | | | | |
| Diversified Telecommunication Services - 0.7% | | | | | | | | |
| Verizon Communications Inc. | | | 25,000 | | | | 1,081,750 | |
| | | | | | | | | |
| Electrical Equipment & Instruments - 3.4% | | | | | | | | |
| Emerson Electric Co. | | | 37,600 | | | | 1,991,296 | |
| Franklin Electric Co., Inc. | | | 27,000 | | | | 1,678,590 | |
| Roper Industries, Inc. | | | 15,990 | | | | 1,782,565 | |
| | | | | | | | 5,452,451 | |
| Electronic Equipment & Instruments - 2.1% | | | | | | | | |
| National Instruments Corporation | | | 49,300 | | | | 1,272,433 | |
| Trimble Navigation Limited (a) | | | 35,000 | | | | 2,092,300 | |
| | | | | | | | 3,364,733 | |
| Energy Equipment & Services - 0.3% | | | | | | | | |
| National Oilwell Varco Inc. | | | 8,000 | | | | 546,800 | |
| | | | | | | | | |
| Food & Drug Retailing - 0.9% | | | | | | | | |
| Walgreen Co. | | | 40,000 | | | | 1,480,400 | |
| | | | | | | | | |
| Food Products - 0.7% | | | | | | | | |
| Mondelez International Inc. - Class A | | | 42,000 | | | | 1,069,740 | |
| | | | | | | | | |
| Health Care Equipment & Supplies - 3.6% | | | | | | | | |
| Covidien plc (b) | | | 33,000 | | | | 1,905,420 | |
| DENTSPLY International Inc. | | | 40,000 | | | | 1,584,400 | |
| Thermo Fisher Scientific, Inc. | | | 35,000 | | | | 2,232,300 | |
| | | | | | | | 5,722,120 | |
| Hotels, Restaurants & Leisure - 0.6% | | | | | | | | |
| Yum! Brands, Inc. | | | 14,000 | | | | 929,600 | |
| | | | | | | | | |
| Household Durables - 2.8% | | | | | | | | |
| Jarden Corporation (a) | | | 60,000 | | | | 3,102,000 | |
| Whirlpool Corporation | | | 14,600 | | | | 1,485,550 | |
| | | | | | | | 4,587,550 | |
| Household Products - 3.7% | | | | | | | | |
| Colgate-Palmolive Company | | | 8,600 | | | | 899,044 | |
| Kimberly-Clark Corporation | | | 30,000 | | | | 2,532,900 | |
| The Procter & Gamble Company | | | 36,810 | | | | 2,499,031 | |
| | | | | | | | 5,930,975 | |
| Industrial Conglomerates - 0.5% | | | | | | | | |
| Raven Industries, Inc. | | | 32,868 | | | | 866,401 | |
| | | | | | | | | |
| Insurance - 0.8% | | | | | | | | |
| Prudential Financial, Inc. | | | 24,000 | | | | 1,279,920 | |
| | | | | | | | | |
| Internet Catalog & Retail - 1.2% | | | | | | | | |
| Amazon.com, Inc. (a) | | | 7,500 | | | | 1,883,550 | |
| | | | | | | | | |
| Internet Software & Services - 2.9% | | | | | | | | |
| Akamai Technologies, Inc. (a) | | | 45,000 | | | | 1,840,950 | |
| Google Inc. - Class A (a) | | | 4,000 | | | | 2,837,480 | |
| | | | | | | | 4,678,430 | |
| Machinery - 3.7% | | | | | | | | |
| Danaher Corporation | | | 35,000 | | | | 1,956,500 | |
| Pall Corporation | | | 27,000 | | | | 1,627,020 | |
| Valmont Industries, Inc. | | | 17,000 | | | | 2,321,350 | |
| | | | | | | | 5,904,870 | |
The accompanying notes are an integral part of these financial statements.
| LKCM Equity Fund |
| Schedule of Investments, Continued |
December 31, 2012
| COMMON STOCKS | | Shares | | | Value | |
| | | | | | | |
| Marine - 1.7% | | | | | | |
| Kirby Corporation (a) | | | 45,000 | | | $ | 2,785,050 | |
| | | | | | | | | |
| Media - 1.9% | | | | | | | | |
| Cinemark Holdings, Inc. | | | 25,000 | | | | 649,500 | |
| Liberty Media Corporation (a) | | | 9,800 | | | | 1,136,898 | |
| Time Warner Inc. | | | 27,200 | | | | 1,300,976 | |
| | | | | | | | 3,087,374 | |
| Oil & Gas & Consumable Fuels - 9.9% | | | | | | | | |
| Cabot Oil & Gas Corporation | | | 32,000 | | | | 1,591,680 | |
| Chevron Corporation | | | 18,000 | | | | 1,946,520 | |
| ConocoPhillips | | | 33,700 | | | | 1,954,263 | |
| Devon Energy Corporation | | | 29,000 | | | | 1,509,160 | |
| EOG Resources, Inc. | | | 19,000 | | | | 2,295,010 | |
| Exxon Mobil Corporation | | | 43,000 | | | | 3,721,650 | |
| Noble Energy, Inc. | | | 10,000 | | | | 1,017,400 | |
| Range Resources Corporation | | | 30,000 | | | | 1,884,900 | |
| | | | | | | | 15,920,583 | |
| Pharmaceuticals - 6.2% | | | | | | | | |
| Abbott Laboratories | | | 40,000 | | | | 2,620,000 | |
| Allergan, Inc. | | | 12,000 | | | | 1,100,760 | |
| Eli Lilly and Company | | | 28,000 | | | | 1,380,960 | |
| Johnson & Johnson | | | 35,000 | | | | 2,453,500 | |
| Pfizer Inc. | | | 100,000 | | | | 2,508,000 | |
| | | | | | | | 10,063,220 | |
| Road & Rail - 1.8% | | | | | | | | |
| Kansas City Southern | | | 8,500 | | | | 709,580 | |
| Union Pacific Corporation | | | 18,000 | | | | 2,262,960 | |
| | | | | | | | 2,972,540 | |
| Software - 2.5% | | | | | | | | |
| Adobe Systems Incorporated (a) | | | 45,000 | | | | 1,695,600 | |
| Microsoft Corporation | | | 43,000 | | | | 1,149,390 | |
| Nuance Communications, Inc. (a) | | | 50,000 | | | | 1,116,000 | |
| | | | | | | | 3,960,990 | |
| Specialty Retail - 4.4% | | | | | | | | |
| The Home Depot, Inc. | | | 28,000 | | | | 1,731,800 | |
| PetSmart, Inc. | | | 32,000 | | | | 2,186,880 | |
| Tiffany & Co. | | | 25,000 | | | | 1,433,500 | |
| Tractor Supply Company | | | 20,000 | | | | 1,767,200 | |
| | | | | | | | 7,119,380 | |
| Textiles, Apparel & Luxury Goods - 0.9% | | | | | | | | |
| VF Corporation | | | 10,000 | | | | 1,509,700 | |
| | | | | | | | | |
| TOTAL COMMON STOCKS | | | | | | | | |
| (Cost $111,260,076) | | | | | | | 144,783,861 | |
| | | | | | | | | |
| SHORT-TERM INVESTMENTS - 10.3% | | Shares | | | Value | |
| | | | | | | | | |
| Money Market Funds (c) - 10.3% | | | | | | | | |
| Dreyfus Government Cash Management | | | | | | | | |
| Fund - Institutional Shares, 0.01% | | | 4,750,000 | | | $ | 4,750,000 | |
| Federated Government Obligations | | | | | | | | |
| Fund - Institutional Shares, 0.01% | | | 4,750,752 | | | | 4,750,752 | |
| Federated Treasury Obligations | | | | | | | | |
| Fund - Institutional Shares, 0.01% | | | 2,316,732 | | | | 2,316,732 | |
| Invesco Short Term Investments Trust - | | | | | | | | |
| Treasury Portfolio - Institutional | | | | | | | | |
| Shares, 0.02% | | | 4,750,000 | | | | 4,750,000 | |
| | | | | | | | | |
| TOTAL SHORT-TERM INVESTMENTS | | | | | | | | |
| (Cost $16,567,484) | | | | | | | 16,567,484 | |
| Total Investments - 100.1% | | | | | | | | |
| (Cost $127,827,560) | | | | | | | 161,351,345 | |
| Liabilities in Excess of Other Assets - (0.1)% | | | | | | | (221,990 | ) |
| TOTAL NET ASSETS - 100.0% | | | | | | $ | 161,129,355 | |
| (a) | Non-income producing security. |
| (b) | U.S. Dollar-denominated foreign security. |
| (c) | The rate quoted is the annualized seven-day yield of the fund at period end. |
The Global Industry Classification Standard (GICS®) was developed by and/or is the exclusive property of MSCI, Inc. and Standard & Poor Financial Services LLC (“S&P”). GICS is a service mark of MSCI and S&P and has been licensed for use by U.S. Bancorp Fund Services, LLC.
The accompanying notes are an integral part of these financial statements.
| LKCM Balanced Fund |
| Schedule of Investments |
December 31, 2012
| COMMON STOCKS - 70.6% | | Shares | | | Value | |
| | | | | | | |
| Aerospace & Defense - 1.4% | | | | | | |
| General Dynamics Corporation | | | 1,400 | | | $ | 96,978 | |
| Rockwell Collins, Inc. | | | 3,600 | | | | 209,412 | |
| | | | | | | | 306,390 | |
| Air Freight & Logistics - 0.9% | | | | | | | | |
| United Parcel Service, Inc. - Class B | | | 2,600 | | | | 191,698 | |
| | | | | | | | | |
| Banks - 4.4% | | | | | | | | |
| Comerica Incorporated | | | 9,500 | | | | 288,230 | |
| Cullen/Frost Bankers, Inc. | | | 3,900 | | | | 211,653 | |
| Wells Fargo & Company | | | 8,471 | | | | 289,539 | |
| Zions Bancorporation | | | 7,500 | | | | 160,500 | |
| | | | | | | | 949,922 | |
| Beverages - 2.1% | | | | | | | | |
| The Coca-Cola Company | | | 5,800 | | | | 210,250 | |
| PepsiCo, Inc. | | | 3,600 | | | | 246,348 | |
| | | | | | | | 456,598 | |
| Biotechnology - 1.2% | | | | | | | | |
| Celgene Corporation (a) | | | 3,400 | | | | 267,648 | |
| | | | | | | | | |
| Chemicals - 4.8% | | | | | | | | |
| Air Products and Chemicals, Inc. | | | 1,900 | | | | 159,638 | |
| Airgas, Inc. | | | 3,000 | | | | 273,870 | |
| E. I. du Pont de Nemours and Company | | | 3,200 | | | | 143,904 | |
| FMC Corporation | | | 4,800 | | | | 280,896 | |
| Monsanto Company | | | 1,900 | | | | 179,835 | |
| | | | | | | | 1,038,143 | |
| Commercial Services & Supplies - 0.9% | | | | | | | | |
| Waste Management, Inc. | | | 6,100 | | | | 205,814 | |
| | | | | | | | | |
| Communications Equipment - 0.5% | | | | | | | | |
| Harris Corporation | | | 2,200 | | | | 107,712 | |
| | | | | | | | | |
| Computers & Peripherals - 5.0% | | | | | | | | |
| Apple Inc. | | | 875 | | | | 466,401 | |
| EMC Corporation (a) | | | 7,400 | | | | 187,220 | |
| International Business Machines Corporation | | | 1,300 | | | | 249,015 | |
| NetApp, Inc. (a) | | | 5,500 | | | | 184,525 | |
| | | | | | | | 1,087,161 | |
| Construction Materials - 1.2% | | | | | | | | |
| Martin Marietta Materials, Inc. | | | 2,700 | | | | 254,556 | |
| | | | | | | | | |
| Containers & Packaging - 1.2% | | | | | | | | |
| Ball Corporation | | | 5,700 | | | | 255,075 | |
| | | | | | | | | |
| Diversified Financial Services - 1.1% | | | | | | | | |
| JPMorgan Chase & Co. | | | 5,500 | | | | 241,835 | |
| | | | | | | | | |
| Diversified Telecommunication Services - 1.1% | | | | | | | | |
| AT&T Inc. | | | 7,400 | | | | 249,454 | |
| | | | | | | | | |
| Electrical Equipment & Instruments - 0.8% | | | | | | | | |
| Emerson Electric Co. | | | 3,200 | | | | 169,472 | |
| | | | | | | | | |
| Electronic Equipment & Instruments - 0.9% | | | | | | | | |
| National Instruments Corporation | | | 7,500 | | | | 193,575 | |
| | | | | | | | | |
| Energy Equipment & Services - 0.9% | | | | | | | | |
| Schlumberger Limited (b) | | | 2,700 | | | | 187,083 | |
| | | | | | | | | |
| Food & Drug Retailing - 3.3% | | | | | | | | |
| CVS Caremark Corporation | | | 4,700 | | | | 227,245 | |
| Walgreen Co. | | | 5,500 | | | | 203,555 | |
| Wal-Mart Stores, Inc. | | | 4,300 | | | | 293,389 | |
| | | | | | | | 724,189 | |
| Health Care Equipment & Supplies - 2.1% | | | | | | | | |
| Covidien plc (b) | | | 4,600 | | | | 265,604 | |
| Thermo Fisher Scientific Inc. | | | 3,100 | | | | 197,718 | |
| | | | | | | | 463,322 | |
| Health Care Providers & Services - 2.2% | | | | | | | | |
| Catamaran Corporation (a) (b) | | | 5,944 | | | | 280,022 | |
| Express Scripts Holding Co (a) | | | 3,800 | | | | 205,200 | |
| | | | | | | | 485,222 | |
| Hotels, Restaurants & Leisure - 0.5% | | | | | | | | |
| Yum! Brands, Inc. | | | 1,500 | | | | 99,600 | |
| | | | | | | | | |
| Household Products - 2.8% | | | | | | | | |
| Colgate-Palmolive Company | | | 2,200 | | | | 229,988 | |
| Kimberly-Clark Corporation | | | 2,100 | | | | 177,303 | |
| The Procter & Gamble Company | | | 3,100 | | | | 210,459 | |
| | | | | | | | 617,750 | |
| Industrial Conglomerates - 0.6% | | | | | | | | |
| General Electric Company | | | 5,900 | | | | 123,841 | |
| | | | | | | | | |
| Insurance - 0.6% | | | | | | | | |
| Prudential Financial, Inc. | | | 2,600 | | | | 138,658 | |
| | | | | | | | | |
| Internet Catalog & Retail - 1.5% | | | | | | | | |
| Amazon.com, Inc. (a) | | | 1,300 | | | | 326,482 | |
| | | | | | | | | |
| Internet Software & Services - 2.1% | | | | | | | | |
| Akamai Technologies, Inc. (a) | | | 5,100 | | | | 208,641 | |
| Google Inc. - Class A (a) | | | 350 | | | | 248,279 | |
| | | | | | | | 456,920 | |
| IT Consulting & Services - 1.9% | | | | | | | | |
| Accenture plc - Class A (b) | | | 3,200 | | | | 212,800 | |
| Automatic Data Processing, Inc. | | | 3,700 | | | | 210,937 | |
| | | | | | | | 423,737 | |
| Machinery - 2.3% | | | | | | | | |
| Danaher Corporation | | | 4,900 | | | | 273,910 | |
| Pall Corporation | | | 3,800 | | | | 228,988 | |
| | | | | | | | 502,898 | |
| Media - 4.0% | | | | | | | | |
| CBS Corporation - Class B | | | 6,200 | | | | 235,910 | |
| DIRECTV (a) | | | 3,300 | | | | 165,528 | |
| Time Warner Inc. | | | 5,800 | | | | 277,414 | |
| The Walt Disney Company | | | 4,000 | | | | 199,160 | |
| | | | | | | | 878,012 | |
The accompanying notes are an integral part of these financial statements.
| LKCM Balanced Fund |
Schedule of Investments, Continued |
December 31, 2012
| COMMON STOCKS | | Shares | | | Value | |
| | | | | | | |
| Metals & Mining - 0.6% | | | | | | |
| Commercial Metals Company | | | 9,500 | | | $ | 141,170 | |
| | | | | | | | | |
| Multiline Retail - 0.6% | | | | | | | | |
| Kohl’s Corporation | | | 3,100 | | | | 133,238 | |
| | | | | | | | | |
| Oil & Gas & Consumable Fuels - 9.1% | | | | | | | | |
| Cabot Oil & Gas Corporation | | | 5,000 | | | | 248,700 | |
| Chevron Corporation | | | 2,095 | | | | 226,553 | |
| Devon Energy Corporation | | | 1,700 | | | | 88,468 | |
| EOG Resources, Inc. | | | 1,900 | | | | 229,501 | |
| Exxon Mobil Corporation | | | 3,732 | | | | 323,005 | |
| Pioneer Natural Resources Company | | | 2,200 | | | | 234,498 | |
| Range Resources Corporation | | | 2,500 | | | | 157,075 | |
| SM Energy Company | | | 4,200 | | | | 219,282 | |
| The Williams Companies, Inc. | | | 7,700 | | | | 252,098 | |
| | | | | | | | 1,979,180 | |
| Pharmaceuticals - 1.7% | | | | | | | | |
| Abbott Laboratories | | | 4,100 | | | | 268,550 | |
| Teva Pharmaceutical Industries Ltd. - ADR (b) | | | 2,500 | | | | 93,350 | |
| | | | | | | | 361,900 | |
| Software - 2.1% | | | | | | | | |
| Adobe Systems Incorporated (a) | | | 6,700 | | | | 252,456 | |
| Nuance Communications, Inc. (a) | | | 9,000 | | | | 200,880 | |
| | | | | | | | 453,336 | |
| Specialty Retail - 2.2% | | | | | | | | |
| The Home Depot, Inc. | | | 4,400 | | | | 272,140 | |
| O’Reilly Automotive, Inc. (a) | | | 2,300 | | | | 205,666 | |
| | | | | | | | 477,806 | |
| Textiles, Apparel & Luxury Goods - 1.0% | | | | | | | | |
| VF Corporation | | | 1,400 | | | | 211,358 | |
| | | | | | | | | |
| Thrifts & Mortgage Finance - 1.0% | | | | | | | | |
| Capitol Federal Financial Inc. | | | 19,500 | | | | 227,955 | |
| | | | | | | | | |
| TOTAL COMMON STOCKS | | | | | | | | |
| (Cost $10,235,934) | | | | | | | 15,388,710 | |
| | | | | | | | | |
| | | Principal | | | | | |
| CORPORATE BONDS - 28.5% | | Amount | | | Value | |
| | | | | | | | | |
| Banks - 1.9% | | | | | | | | |
| BB&T Corporation | | | | | | | | |
| 2.050%, 04/28/2014 | | | | | | | | |
| Callable 03/28/2014 | | $ | 200,000 | | | | 203,843 | |
| Wells Fargo & Company: | | | | | | | | |
| 3.750%, 10/01/2014 | | | 100,000 | | | | 105,483 | |
| 2.625%, 12/15/2016 | | | 100,000 | | | | 105,636 | |
| | | | | | | | 414,962 | |
| Beverages - 1.0% | | | | | | | | |
| Anheuser-Busch InBev Worldwide Inc. | | | | | | | | |
| 1.375%, 07/15/2017 | | | 100,000 | | | | 101,164 | |
| The Coca-Cola Company | | | | | | | | |
| 5.350%, 11/15/2017 | | | 100,000 | | | | 119,869 | |
| | | | | | | | 221,033 | |
| Biotechnology - 1.9% | | | | | | | | |
| Amgen Inc. | | | | | | | | |
| 1.875%, 11/15/2014 | | | 135,000 | | | | 138,124 | |
| Celgene Corporation | | | | | | | | |
| 2.450%, 10/15/2015 | | | 200,000 | | | | 207,681 | |
| Gilead Sciences, Inc. | | | | | | | | |
| 2.400%, 12/01/2014 | | | 63,000 | | | | 64,998 | |
| | | | | | | | 410,803 | |
| Capital Markets - 1.0% | | | | | | | | |
| The Bank of New York Mellon Corporation | | | | | | | | |
| 3.100%, 01/15/2015 | | | 175,000 | | | | 183,442 | |
| The Goldman Sachs Group, Inc. | | | | | | | | |
| 5.500%, 11/15/2014 | | | 35,000 | | | | 37,752 | |
| | | | | | | | 221,194 | |
| Chemicals - 1.9% | | | | | | | | |
| Airgas, Inc. | | | | | | | | |
| 3.250%, 10/01/2015 | | | | | | | | |
| Callable 09/01/2015 | | | 125,000 | | | | 132,853 | |
| E. I. du Pont de Nemours and Company | | | | | | | | |
| 3.250%, 01/15/2015 | | | 75,000 | | | | 78,985 | |
| Eastman Chemical Company | | | | | | | | |
| 3.000%, 12/15/2015 | | | 200,000 | | | | 210,546 | |
| | | | | | | | 422,384 | |
| Computers & Peripherals - 1.8% | | | | | | | | |
| Dell Inc. | | | | | | | | |
| 2.300%, 09/10/2015 | | | 200,000 | | | | 205,657 | |
| Hewlett-Packard Company | | | | | | | | |
| 3.000%, 09/15/2016 | | | 175,000 | | | | 176,273 | |
| | | | | | | | 381,930 | |
| Consumer Finance - 1.1% | | | | | | | | |
| American Express Credit Corporation | | | | | | | | |
| 2.750%, 09/15/2015 | | | 225,000 | | | | 236,040 | |
| | | | | | | | | |
| Consumer Services - 0.5% | | | | | | | | |
| The Western Union Company | | | | | | | | |
| 2.875%, 12/10/2017 | | | 100,000 | | | | 99,198 | |
| | | | | | | | | |
| Containers & Packaging - 0.4% | | | | | | | | |
| Ball Corporation | | | | | | | | |
| 7.125%, 09/01/2016 | | | | | | | | |
| Callable 09/01/2013 | | | 75,000 | | | | 80,625 | |
| | | | | | | | | |
| Diversified Financial Services - 0.3% | | | | | | | | |
| JPMorgan Chase & Co. | | | | | | | | |
| 2.050%, 01/24/2014 | | | 75,000 | | | | 76,193 | |
| | | | | | | | | |
| Diversified Telecommunication Services - 1.1% | | | | | | | | |
| AT&T Inc. | | | | | | | | |
| 5.100%, 09/15/2014 | | | 125,000 | | | | 134,330 | |
| Verizon Communications Inc. | | | | | | | | |
| 3.000%, 04/01/2016 | | | 100,000 | | | | 106,564 | |
| | | | | | | | 240,894 | |
| Electric Utilities - 0.9% | | | | | | | | |
| Duke Energy Corporation | | | | | | | | |
| 3.950%, 09/15/2014 | | | 185,000 | | | | 194,896 | |
The accompanying notes are an integral part of these financial statements.
| LKCM Balanced Fund |
| Schedule of Investments, Continued |
December 31, 2012
| | | Principal | | | | |
| CORPORATE BONDS | | Amount | | | Value | |
| | | | | | | |
| Food & Drug Retailing - 1.6% | | | | | | |
| CVS Caremark Corporation: | | | | | | |
| 3.250%, 05/18/2015 | | $ | 50,000 | | | $ | 53,039 | |
| 5.750%, 06/01/2017 | | | 100,000 | | | | 119,676 | |
| Walgreen Co. | | | | | | | | |
| 1.000%, 03/13/2015 | | | 175,000 | | | | 175,242 | |
| | | | | | | | 347,957 | |
| Health Care Equipment & Supplies - 1.4% | | | | | | | | |
| Covidien International Finance S.A. (b) | | | | | | | | |
| 2.800%, 06/15/2015 | | | 140,000 | | | | 146,514 | |
| Thermo Fisher Scientific Inc.: | | | | | | | | |
| 2.050%, 02/21/2014 | | | 50,000 | | | | 50,717 | |
| 3.200%, 05/01/2015 | | | 110,000 | | | | 115,851 | |
| | | | | | | | 313,082 | |
| Health Care Providers & Services - 1.5% | | | | | | | | |
| Express Scripts Holding Co | | | | | | | | |
| 3.125%, 05/15/2016 | | | 200,000 | | | | 211,028 | |
| McKesson Corporation | | | | | | | | |
| 3.250%, 03/01/2016 | | | 100,000 | | | | 107,271 | |
| | | | | | | | 318,299 | |
| Insurance - 1.2% | | | | | | | | |
| Berkshire Hathaway Inc. | | | | | | | | |
| 4.850%, 01/15/2015 | | | 100,000 | | | | 108,542 | |
| Prudential Financial, Inc. | | | | | | | | |
| 3.000%, 05/12/2016 | | | 150,000 | | | | 158,499 | |
| | | | | | | | 267,041 | |
| Machinery - 0.5% | | | | | | | | |
| Caterpillar Inc. | | | | | | | | |
| 1.375%, 05/27/2014 | | | 100,000 | | | | 101,253 | |
| | | | | | | | | |
| Media - 1.3% | | | | | | | | |
| DIRECTV Holdings LLC | | | | | | | | |
| 3.550%, 03/15/2015 | | | 100,000 | | | | 105,251 | |
| Time Warner Inc. | | | | | | | | |
| 3.150%, 07/15/2015 | | | 175,000 | | | | 185,175 | |
| | | | | | | | 290,426 | |
| Oil & Gas & Consumable Fuels - 3.0% | | | | | | | | |
| Apache Corporation | | | | | | | | |
| 5.625%, 01/15/2017 | | | 75,000 | | | | 87,928 | |
| Devon Energy Corporation | | | | | | | | |
| 1.875%, 05/15/2017 | | | | | | | | |
| Callable 04/15/2017 | | | 100,000 | | | | 102,048 | |
| Enterprise Products Operating LLC | | | | | | | | |
| 1.250%, 08/13/2015 | | | 191,000 | | | | 192,296 | |
| Noble Drilling Corporation (b) | | | | | | | | |
| 3.050%, 03/01/2016 | | | 160,000 | | | | 167,066 | |
| Noble Energy, Inc. | | | | | | | | |
| 5.250%, 04/15/2014 | | | 100,000 | | | | 104,778 | |
| | | | | | | | 654,116 | |
| Pharmaceuticals - 1.1% | | | | | | | | |
| Teva Pharmaceutical Industries Ltd. (b): | | | | | | | | |
| 3.000%, 06/15/2015 | | | 125,000 | | | | 131,499 | |
| 2.400%, 11/10/2016 | | | 100,000 | | | | 104,308 | |
| | | | | | | | 235,807 | |
| Semiconductor Equipment & Products - 0.5% | | | | | | | | |
| National Semiconductor Corporation | | | | | | | | |
| 3.950%, 04/15/2015 | | | 100,000 | | | | 107,761 | |
| | | | | | | | | |
| Software - 2.6% | | | | | | | | |
| Adobe Systems Incorporated | | | | | | | | |
| 3.250%, 02/01/2015 | | | 200,000 | | | | 209,543 | |
| Oracle Corporation | | | | | | | | |
| 3.750%, 07/08/2014 | | | 150,000 | | | | 157,539 | |
| Symantec Corporation | | | | | | | | |
| 2.750%, 09/15/2015 | | | 200,000 | | | | 206,987 | |
| | | | | | | | 574,069 | |
| TOTAL CORPORATE BONDS | | | | | | | | |
| (Cost $6,043,411) | | | | | | | 6,209,963 | |
| | | | | | | | | |
| SHORT-TERM INVESTMENT - 0.8% | | Shares | | | | | |
| | | | | | | | | |
| Money Market Fund (c) - 0.8% | | | | | | | | |
| Federated Government Obligations | | | | | | | | |
| Fund - Institutional Shares, 0.01% | | | 174,462 | | | | 174,462 | |
| | | | | | | | | |
| TOTAL SHORT-TERM INVESTMENT | | | | | | | | |
| (Cost $174,462) | | | | | | | 174,462 | |
| | | | | | | | | |
| Total Investments - 99.9% | | | | | | | | |
| (Cost $16,453,807) | | | | | | | 21,773,135 | |
| Other Assets in Excess of Liabilities - 0.1% | | | | | | | 27,349 | |
| TOTAL NET ASSETS - 100.0% | | | | | | $ | 21,800,484 | |
ADR American Depository Receipt.
| (a) | Non-income producing security. |
| (b) | U.S. Dollar-denominated foreign security. |
| (c) | The rate quoted is the annualized seven-day yield of the fund at period end. |
The Global Industry Classification Standard (GICS®) was developed by and/or is the exclusive property of MSCI, Inc. and Standard & Poor Financial Services LLC (“S&P”). GICS is a service mark of MSCI and S&P and has been licensed for use by U.S. Bancorp Fund Services, LLC.
The accompanying notes are an integral part of these financial statements.
| LKCM Fixed Income Fund |
| Schedule of Investments |
December 31, 2012
| | | Principal | | | | |
| CORPORATE BONDS - 92.2% | | Amount | | | Value | |
| | | | | | | |
| Aerospace & Defense - 1.2% | | | | | | |
| Lockheed Martin Corporation: | | | | | | |
| 7.650%, 05/01/2016 | | $ | 1,250,000 | | | $ | 1,514,909 | |
| 3.350%, 09/15/2021 | | | 525,000 | | | | 555,846 | |
| Rockwell Collins, Inc. | | | | | | | | |
| 4.750%, 12/01/2013 | | | 430,000 | | | | 445,497 | |
| | | | | | | | 2,516,252 | |
| Banks - 6.6% | | | | | | | | |
| Bank of America Corporation: | | | | | | | | |
| 7.375%, 05/15/2014 | | | 1,000,000 | | | | 1,083,205 | |
| 5.375%, 06/15/2014 | | | 1,025,000 | | | | 1,083,638 | |
| BB&T Corporation | | | | | | | | |
| 3.200%, 03/15/2016 | | | | | | | | |
| Callable 02/16/2016 | | | 3,080,000 | | | | 3,280,631 | |
| Branch Banking & Trust Company (b): | | | | | | | | |
| 0.862%, 09/13/2016 | | | 1,775,000 | | | | 1,748,979 | |
| 0.793%, 05/23/2017 | | | 1,284,000 | | | | 1,256,413 | |
| Wells Fargo & Company: | | | | | | | | |
| 4.625%, 04/15/2014 | | | 456,000 | | | | 479,691 | |
| 1.250%, 02/13/2015 | | | 1,500,000 | | | | 1,514,856 | |
| 2.625%, 12/15/2016 | | | 3,000,000 | | | | 3,169,077 | |
| | | | | | | | 13,616,490 | |
| Beverages - 1.0% | | | | | | | | |
| The Coca-Cola Company | | | | | | | | |
| 5.350%, 11/15/2017 | | | 1,500,000 | | | | 1,798,034 | |
| PepsiCo, Inc. | | | | | | | | |
| 7.900%, 11/01/2018 | | | 214,000 | | | | 289,137 | |
| | | | | | | | 2,087,171 | |
| Biotechnology - 6.4% | | | | | | | | |
| Amgen Inc.: | | | | | | | | |
| 2.500%, 11/15/2016 | | | 1,815,000 | | | | 1,908,734 | |
| 2.125%, 05/15/2017 | | | 2,350,000 | | | | 2,437,002 | |
| Celgene Corporation | | | | | | | | |
| 2.450%, 10/15/2015 | | | 5,279,000 | | | | 5,481,756 | |
| Gilead Sciences, Inc. | | | | | | | | |
| 2.400%, 12/01/2014 | | | 3,300,000 | | | | 3,404,646 | |
| | | | | | | | 13,232,138 | |
| Building Products - 0.8% | | | | | | | | |
| Masco Corporation | | | | | | | | |
| 7.125%, 03/15/2020 | | | 1,350,000 | | | | 1,572,892 | |
| | | | | | | | | |
| Capital Markets - 1.4% | | | | | | | | |
| The Bank of New York Mellon Corporation | | | | | | | | |
| 3.100%, 01/15/2015 | | | 738,000 | | | | 773,604 | |
| The Goldman Sachs Group, Inc. | | | | | | | | |
| 5.125%, 01/15/2015 | | | 1,000,000 | | | | 1,074,808 | |
| Morgan Stanley | | | | | | | | |
| 4.500%, 08/30/2015 | | | 1,000,000 | | | | 1,002,760 | |
| | | | | | | | 2,851,172 | |
| Chemicals - 4.2% | | | | | | | | |
| Airgas, Inc.: | | | | | | | | |
| 3.250%, 10/01/2015 | | | | | | | | |
| Callable 09/01/2015 | | | 2,794,000 | | | | 2,969,530 | |
| 2.950%, 06/15/2016 | | | | | | | | |
| Callable 05/15/2016 | | | 950,000 | | | | 1,003,009 | |
| Eastman Chemical Company | | | | | | | | |
| 3.000%, 12/15/2015 | | | 2,625,000 | | | | 2,763,414 | |
| The Lubrizol Corporation | | | | | | | | |
| 5.500%, 10/01/2014 | | | 1,579,000 | | | | 1,712,299 | |
| Praxair, Inc. | | | | | | | | |
| 5.250%, 11/15/2014 | | | 200,000 | | | | 217,487 | |
| | | | | | | | 8,665,739 | |
| Commercial Services & Supplies - 0.6% | | | | | | | | |
| Republic Services, Inc. | | | | | | | | |
| 5.500%, 09/15/2019 | | | 1,000,000 | | | | 1,185,939 | |
| | | | | | | | | |
| Communications Equipment - 2.0% | | | | | | | | |
| Cisco Systems, Inc.: | | | | | | | | |
| 5.500%, 02/22/2016 | | | 1,000,000 | | | | 1,143,892 | |
| 4.950%, 02/15/2019 | | | 700,000 | | | | 829,788 | |
| Harris Corporation: | | | | | | | | |
| 5.000%, 10/01/2015 | | | 1,088,000 | | | | 1,193,813 | |
| 6.375%, 06/15/2019 | | | 900,000 | | | | 1,065,266 | |
| | | | | | | | 4,232,759 | |
| Computers & Peripherals - 4.0% | | | | | | | | |
| Dell Inc. | | | | | | | | |
| 5.625%, 04/15/2014 | | | 750,000 | | | | 796,340 | |
| Hewlett-Packard Company: | | | | | | | | |
| 1.550%, 05/30/2014 | | | 1,000,000 | | | | 998,110 | |
| 2.200%, 12/01/2015 | | | 1,000,000 | | | | 1,002,070 | |
| 3.000%, 09/15/2016 | | | 3,675,000 | | | | 3,701,732 | |
| International Business | | | | | | | | |
| Machines Corporation | | | | | | | | |
| 5.700%, 09/14/2017 | | | 1,500,000 | | | | 1,813,398 | |
| | | | | | | | 8,311,650 | |
| Consumer Finance - 1.3% | | | | | | | | |
| American Express Credit Corporation | | | | | | | | |
| 2.750%, 09/15/2015 | | | 2,485,000 | | | | 2,606,932 | |
| | | | | | | | | |
| Consumer Services - 1.8% | | | | | | | | |
| The Western Union Company: | | | | | | | | |
| 5.930%, 10/01/2016 | | | 1,000,000 | | | | 1,099,602 | |
| 3.650%, 08/22/2018 | | | 2,500,000 | | | | 2,558,692 | |
| | | | | | | | 3,658,294 | |
The accompanying notes are an integral part of these financial statements.
| LKCM Fixed Income Fund |
| Schedule of Investments, Continued |
December 31, 2012
| | | Principal | | | | |
| CORPORATE BONDS | | Amount | | | Value | |
| | | | | | | |
| Containers & Packaging - 2.0% | | | | | | |
| Ball Corporation: | | | | | | |
| 7.125%, 09/01/2016 | | | | | | |
| Callable 09/01/2013 | | $ | 1,825,000 | | | $ | 1,961,875 | |
| 5.750%, 05/15/2021 | | | | | | | | |
| Callable 11/15/2015 | | | 2,000,000 | | | | 2,175,000 | |
| | | | | | | | 4,136,875 | |
| Diversified Financial Services - 3.6% | | | | | | | | |
| JPMorgan Chase & Co.: | | | | | | | | |
| 3.450%, 03/01/2016 | | | 3,525,000 | | | | 3,746,402 | |
| 4.250%, 10/15/2020 | | | 3,325,000 | | | | 3,704,010 | |
| | | | | | | | 7,450,412 | |
| Diversified Telecommunication Services - 5.1% | | | | | | | | |
| AT&T Inc. | | | | | | | | |
| 5.100%, 09/15/2014 | | | 1,750,000 | | | | 1,880,623 | |
| CenturyLink, Inc.: | | | | | | | | |
| 5.150%, 06/15/2017 | | | 2,000,000 | | | | 2,157,000 | |
| 6.150%, 09/15/2019 | | | 1,402,000 | | | | 1,541,136 | |
| 6.450%, 06/15/2021 | | | 2,000,000 | | | | 2,213,640 | |
| Verizon Communications Inc.: | | | | | | | | |
| 5.550%, 02/15/2016 | | | 1,000,000 | | | | 1,139,564 | |
| 3.000%, 04/01/2016 | | | 490,000 | | | | 522,160 | |
| 5.500%, 02/15/2018 | | | 875,000 | | | | 1,051,961 | |
| | | | | | | | 10,506,084 | |
| Electric Utilities - 0.6% | | | | | | | | |
| Southern Power Co. | | | | | | | | |
| 4.875%, 07/15/2015 | | | 1,050,000 | | | | 1,150,805 | |
| | | | | | | | | |
| Energy Equipment & Services - 1.9% | | | | | | | | |
| Weatherford International, Inc. | | | | | | | | |
| 6.350%, 06/15/2017 | | | 1,550,000 | | | | 1,775,826 | |
| Weatherford International Ltd (a) | | | | | | | | |
| 4.500%, 04/15/2022 | | | | | | | | |
| Callable 01/15/2022 | | | 2,000,000 | | | | 2,126,468 | |
| | | | | | | | 3,902,294 | |
| Food & Drug Retailing - 3.9% | | | | | | | | |
| CVS Caremark Corporation: | | | | | | | | |
| 3.250%, 05/18/2015 | | | 1,000,000 | | | | 1,060,782 | |
| 5.750%, 06/01/2017 | | | 2,750,000 | | | | 3,291,096 | |
| Walgreen Co.: | | | | | | | | |
| 1.000%, 03/13/2015 | | | 725,000 | | | | 726,003 | |
| 1.800%, 09/15/2017 | | | 2,925,000 | | | | 2,944,603 | |
| | | | | | | | 8,022,484 | |
| Health Care Equipment & Supplies - 1.2% | | | | | | | | |
| DENTSPLY International Inc. | | | | | | | | |
| 2.750%, 08/15/2016 | | | 1,446,000 | | | | 1,501,555 | |
| Thermo Fisher Scientific, Inc. | | | | | | | | |
| 3.250%, 11/20/2014 | | | 900,000 | | | | 941,484 | |
| | | | | | | | 2,443,039 | |
| Health Care Providers & Services - 3.3% | | | | | | | | |
| Express Scripts Holding Co: | | | | | | | | |
| 6.250%, 06/15/2014 | | | 1,000,000 | | | | 1,077,256 | |
| 3.125%, 05/15/2016 | | | 225,000 | | | | 237,406 | |
| 2.650%, 02/15/2017 (c) | | | | | | | | |
| (Acquired 11/20/2012, | | | | | | | | |
| Cost $3,124,897) | | | 3,000,000 | | | | 3,121,209 | |
| McKesson Corporation | | | | | | | | |
| 3.250%, 03/01/2016 | | | 2,275,000 | | | | 2,440,422 | |
| | | | | | | | 6,876,293 | |
| Hotels, Restaurants & Leisure - 0.6% | | | | | | | | |
| McDonald’s Corporation | | | | | | | | |
| 5.350%, 03/01/2018 | | | 1,000,000 | | | | 1,207,571 | |
| | | | | | | | | |
| Household Durables - 1.2% | | | | | | | | |
| Jarden Corporation: | | | | | | | | |
| 8.000%, 05/01/2016 | | | | | | | | |
| Callable 05/01/2013 | | | 1,000,000 | | | | 1,067,500 | |
| 7.500%, 01/15/2020 | | | | | | | | |
| Callable 01/15/2015 | | | 1,340,000 | | | | 1,477,350 | |
| | | | | | | | 2,544,850 | |
| Household Products - 0.6% | | | | | | | | |
| The Procter & Gamble Company | | | | | | | | |
| 8.000%, 09/01/2024 | | | | | | | | |
| Putable 09/01/2014 | | | 775,000 | | | | 1,161,590 | |
| Insurance - 1.9% | | | | | | | | |
| Berkshire Hathaway Inc. | | | | | | | | |
| 4.850%, 01/15/2015 | | | 1,225,000 | | | | 1,329,641 | |
| Prudential Financial, Inc. | | | | | | | | |
| 3.000%, 05/12/2016 | | | 2,393,000 | | | | 2,528,582 | |
| | | | | | | | 3,858,223 | |
| Internet Catalog & Retail - 0.8% | | | | | | | | |
| Amazon.com, Inc. | | | | | | | | |
| 1.200%, 11/29/2017 | | | 1,545,000 | | | | 1,538,333 | |
| | | | | | | | | |
| Media - 3.1% | | | | | | | | |
| DIRECTV Holdings LLC | | | | | | | | |
| 3.550%, 03/15/2015 | | | 1,265,000 | | | | 1,331,431 | |
| Time Warner Inc. | | | | | | | | |
| 3.150%, 07/15/2015 | | | 3,175,000 | | | | 3,359,601 | |
| The Walt Disney Company | | | | | | | | |
| 5.625%, 09/15/2016 | | | 1,500,000 | | | | 1,746,536 | |
| | | | | | | | 6,437,568 | |
| Metals & Mining - 0.3% | | | | | | | | |
| Alcoa Inc. | | | | | | | | |
| 5.550%, 02/01/2017 | | | 500,000 | | | | 541,766 | |
| | | | | | | | | |
| Multiline Retail - 2.5% | | | | | | | | |
| Family Dollar Stores, Inc. | | | | | | | | |
| 5.000%, 02/01/2021 | | | 4,500,000 | | | | 4,865,625 | |
The accompanying notes are an integral part of these financial statements.
LKCM Fixed Income Fund |
| Schedule of Investments, Continued |
December 31, 2012
| | | Principal | | | | |
| CORPORATE BONDS | | Amount | | | Value | |
| | | | | | | |
| Multiline Retail - 2.5%, Continued | | | | | | |
| Kohl’s Corporation | | | | | | |
| 6.250%, 12/15/2017 | | $ | 282,000 | | | $ | 338,345 | |
| | | | | | | | 5,203,970 | |
| Oil & Gas & Consumable Fuels - 18.1% | | | | | | | | |
| Anadarko Petroleum Corporation: | | | | | | | | |
| 5.950%, 09/15/2016 | | | 2,000,000 | | | | 2,304,204 | |
| 6.375%, 09/15/2017 | | | 2,000,000 | | | | 2,391,470 | |
| Devon Energy Corporation | | | | | | | | |
| 2.400%, 07/15/2016 | | | | | | | | |
| Callable 06/15/2016 | | | 1,830,000 | | | | 1,897,013 | |
| Enterprise Products Operating LLC: | | | | | | | | |
| 3.200%, 02/01/2016 | | | 2,229,000 | | | | 2,356,978 | |
| 4.050%, 02/15/2022 | | | 2,000,000 | | | | 2,214,982 | |
| EOG Resources, Inc. | | | | | | | | |
| 2.950%, 06/01/2015 | | | 1,200,000 | | | | 1,262,192 | |
| Kinder Morgan Energy Partners, L.P. | | | | | | | | |
| 4.150%, 03/01/2022 | | | 2,000,000 | | | | 2,171,118 | |
| Linn Energy LLC / Linn Energy | | | | | | | | |
| Finance Corporation (c) | | | | | | | | |
| 6.250%, 11/01/2019 | | | | | | | | |
| Callable 11/01/2015 | | | | | | | | |
| (Acquired 05/11/2012, | | | | | | | | |
| Cost $1,985,000) | | | 2,000,000 | | | | 2,020,000 | |
| Nabors Industries Inc. | | | | | | | | |
| 4.625%, 09/15/2021 | | | 3,500,000 | | | | 3,773,623 | |
| Noble Energy, Inc.: | | | | | | | | |
| 5.250%, 04/15/2014 | | | 1,500,000 | | | | 1,571,668 | |
| 4.150%, 12/15/2021 | | | | | | | | |
| Callable 09/15/2021 | | | 1,000,000 | | | | 1,105,975 | |
| Noble Holding International Ltd. (a) | | | | | | | | |
| 3.450%, 08/01/2015 | | | 4,855,000 | | | | 5,119,248 | |
| Peabody Energy Corporation | | | | | | | | |
| 6.500%, 09/15/2020 | | | 4,000,000 | | | | 4,310,000 | |
| Range Resources Corporation: | | | | | | | | |
| 8.000%, 05/15/2019 | | | | | | | | |
| Callable 05/15/2014 | | | 500,000 | | | | 556,250 | |
| 5.000%, 08/15/2022 | | | | | | | | |
| Callable 02/15/2017 | | | 4,100,000 | | | | 4,305,000 | |
| | | | | | | | 37,359,721 | |
| Pharmaceuticals - 2.5% | | | | | | | | |
| Teva Pharmaceutical Industries Ltd. (a): | | | | | | | | |
| 3.000%, 06/15/2015 | | | 2,830,000 | | | | 2,977,134 | |
| 5.550%, 02/01/2016 | | | 1,860,000 | | | | 2,106,703 | |
| | | | | | | | 5,083,837 | |
| Road & Rail - 0.5% | | | | | | | | |
| Burlington Northern Santa Fe Corporation | | | | | | | | |
| 5.650%, 05/01/2017 | | | 185,000 | | | | 217,978 | |
| Norfolk Southern Corporation | | | | | | | | |
| 5.257%, 09/17/2014 | | | 750,000 | | | | 808,157 | |
| | | | | | | | 1,026,135 | |
| Semiconductor Equipment & Products - 2.6% | | | | | | | | |
| Analog Devices, Inc. | | | | | | | | |
| 3.000%, 04/15/2016 | | | 1,050,000 | | | | 1,114,465 | |
| Applied Materials, Inc. | | | | | | | | |
| 2.650%, 06/15/2016 | | | 1,717,000 | | | | 1,807,386 | |
| National Semiconductor Corporation | | | | | | | | |
| 3.950%, 04/15/2015 | | | 2,275,000 | | | | 2,451,554 | |
| | | | | | | | 5,373,405 | |
| Software - 3.8% | | | | | | | | |
| Adobe Systems Incorporated | | | | | | | | |
| 3.250%, 02/01/2015 | | | 2,175,000 | | | | 2,278,774 | |
| Microsoft Corporation | | | | | | | | |
| 2.950%, 06/01/2014 | | | 1,910,000 | | | | 1,981,050 | |
| Symantec Corporation: | | | | | | | | |
| 2.750%, 09/15/2015 | | | 2,300,000 | | | | 2,380,350 | |
| 2.750%, 06/15/2017 | | | | | | | | |
| Callable 05/15/2017 | | | 1,160,000 | | | | 1,194,196 | |
| | | | | | | | 7,834,370 | |
| Specialty Retail - 0.8% | | | | | | | | |
| Lowe’s Companies, Inc. | | | | | | | | |
| 5.000%, 10/15/2015 | | | 525,000 | | | | 586,865 | |
| O’Reilly Automotive, Inc. | | | | | | | | |
| 4.875%, 01/14/2021 | | | | | | | | |
| Callable 10/14/2020 | | | 1,000,000 | | | | 1,109,428 | |
| | | | | | | | 1,696,293 | |
| TOTAL CORPORATE BONDS | | | | | | | | |
| (Cost $178,982,067) | | | | | | | 189,893,346 | |
| | | | | | | | | |
| PREFERRED STOCKS - 3.5% | | Shares | | | | | |
| | | | | | | | | |
| Banks - 1.2% | | | | | | | | |
| BB&T Corporation: | | | | | | | | |
| Callable 08/01/2017 | | | 40,000 | | | | 1,019,200 | |
| Callable 11/01/2017 | | | 40,000 | | | | 982,800 | |
| Wells Fargo & Company | | | | | | | | |
| Callable 09/15/2017 | | | 20,000 | | | | 503,600 | |
| | | | | | | | 2,505,600 | |
| Capital Markets - 1.3% | | | | | | | | |
| The Goldman Sachs Group, Inc. | | | | | | | | |
| Callable 02/19/2013 | | | 40,000 | | | | 827,600 | |
| Merrill Lynch Preferred Capital Trust III | | | | | | | | |
| Callable 02/19/2013 | | | 75,000 | | | | 1,874,250 | |
| | | | | | | | 2,701,850 | |
| Diversified Financial Services - 1.0% | | | | | | | | |
| JPMorgan Chase Capital XIV | | | | | | | | |
| Callable 02/19/2013 | | | 75,000 | | | | 1,908,000 | |
| | | | | | | | | |
| TOTAL PREFERRED STOCKS | | | | | | | | |
| (Cost $7,201,733) | | | | | | | 7,115,450 | |
The accompanying notes are an integral part of these financial statements.
| LKCM Fixed Income Fund |
| Schedule of Investments, Continued |
December 31, 2012
| U.S. GOVERNMENT & | | Principal | | | | |
| AGENCY ISSUES - 2.5% | | Amount | | | Value | |
| Fannie Mae - 0.6% | | | | | | |
| 5.000%, 03/15/2016 | | $ | 1,000,000 | | | $ | 1,145,212 | |
| | | | | | | | | |
| Federal Home Loan Bank - 0.8% | | | | | | | | |
| 5.500%, 08/13/2014 | | | 500,000 | | | | 543,027 | |
| 4.875%, 05/17/2017 | | | 1,000,000 | | | | 1,179,629 | |
| | | | | | | | 1,722,656 | |
| Freddie Mac - 0.3% | | | | | | | | |
| 5.125%, 11/17/2017 | | | 500,000 | | | | 603,229 | |
| | | | | | | | | |
| U.S. Treasury Notes - 0.8% | | | | | | | | |
| 4.250%, 11/15/2014 | | | 500,000 | | | | 537,207 | |
| 4.250%, 08/15/2015 | | | 500,000 | | | | 550,977 | |
| 4.500%, 02/15/2016 | | | 500,000 | | | | 563,633 | |
| | | | | | | | 1,651,817 | |
| TOTAL U.S. GOVERNMENT & | | | | | | | | |
| AGENCY ISSUES | | | | | | | | |
| (Cost $4,520,688) | | | | | | | 5,122,914 | |
| | | | | | | | | |
| | | | | | | | | |
| SHORT-TERM INVESTMENT - 1.0% | | Shares | | | | |
| Money Market Fund (d) - 1.0% | | | | | | | | |
| Federated Government Obligations | | | | | | | | |
| Fund - Institutional Shares, 0.01% | | | 2,152,774 | | | | 2,152,774 | |
| | | | | | | | | |
| TOTAL SHORT-TERM INVESTMENT | | | | | | | | |
| (Cost $2,152,774) | | | | | | | 2,152,774 | |
| | | | | | | | | |
| Total Investments - 99.2% | | | | | | | | |
| (Cost $192,857,262) | | | | | | | 204,284,484 | |
| Other Assets in Excess of Liabilities - 0.8% | | | | | | | 1,595,225 | |
| TOTAL NET ASSETS - 100.0% | | | | | | $ | 205,879,709 | |
| | | | | | | | | |
| (a) | U.S. Dollar-denominated foreign security. |
| (c) | Rule 144A security. Resale to the public may require registration or may extend only to qualified institutional buyers. The fair market value of the securities was $5,141,209 representing 2.50% of the Fund’s total net assets. |
| (d) | The rate quoted is the annualized seven-day yield of the fund at period end. |
The Global Industry Classification Standard (GICS®) was developed by and/or is the exclusive property of MSCI, Inc. and Standard & Poor Financial Services LLC (“S&P”). GICS is a service mark of MSCI and S&P and has been licensed for use by U.S. Bancorp Fund Services, LLC.
The accompanying notes are an integral part of these financial statements.
| Statement of Assets and Liabilities |
| December 31, 2012 |
| | | LKCM | | | LKCM | | | LKCM | | | LKCM | | | LKCM | |
| | | Small Cap | | | Small-Mid Cap | | | Equity | | | Balanced | | | Fixed | |
| | | Equity Fund | | | Equity Fund | | | Fund | | | Fund | | | Income Fund | |
| Assets: | | | | | | | | | | | | | | | |
| Investments, at value* | | $ | 856,363,674 | | | $ | 249,980,169 | | | $ | 161,351,345 | | | $ | 21,773,135 | | | $ | 204,284,484 | |
| Dividends and interest receivable | | | 180,708 | | | | 60,794 | | | | 84,138 | | | | 58,354 | | | | 1,900,173 | |
| Receivable for fund shares sold | | | 7,133,446 | | | | 841,028 | | | | 165,451 | | | | 2,500 | | | | 63,500 | |
| Other assets | | | 71,971 | | | | 36,968 | | | | 19,021 | | | | 4,224 | | | | 19,936 | |
| Total assets | | | 863,749,799 | | | | 250,918,959 | | | | 161,619,955 | | | | 21,838,213 | | | | 206,268,093 | |
| Liabilities: | | | | | | | | | | | | | | | | | | | | |
| Payable for investment advisory fees | | | 1,610,566 | | | | 351,013 | | | | 198,341 | | | | 19,986 | | | | 230,979 | |
| Payable for fund shares redeemed | | | 1,121,066 | | | | 205,445 | | | | 235,671 | | | | 600 | | | | 85,277 | |
| Payable for administrative fees | | | 113,329 | | | | 35,640 | | | | 22,529 | | | | 3,423 | | | | 27,968 | |
| Payable for accounting and transfer | | | | | | | | | | | | | | | | | | | | |
| agent fees and expenses | | | 50,424 | | | | 106,119 | | | | 15,110 | | | | 7,137 | | | | 17,036 | |
| Payable for distribution expense (Note B) | | | 22,367 | | | | — | | | | — | | | | — | | | | — | |
| Accrued expenses and other liabilities | | | 110,005 | | | | 56,871 | | | | 18,949 | | | | 6,583 | | | | 27,124 | |
| Total liabilities | | | 3,027,757 | | | | 755,088 | | | | 490,600 | | | | 37,729 | | | | 388,384 | |
| Net assets | | $ | 860,722,042 | | | $ | 250,163,871 | | | $ | 161,129,355 | | | $ | 21,800,484 | | | $ | 205,879,709 | |
| Net assets consist of: | | | | | | | | | | | | | | | | | | | | |
| Paid in capital | | $ | 686,205,617 | | | $ | 239,661,829 | | | $ | 127,147,303 | | | $ | 16,753,575 | | | $ | 193,881,753 | |
| Accumulated net investment income | | | 120,236 | | | | — | | | | 41,852 | | | | 96 | | | | — | |
| Accumulated net realized gain (loss) on securities | | | 6,326,373 | | | | (5,994,606 | ) | | | 416,415 | | | | (272,515 | ) | | | 570,734 | |
| Net unrealized appreciation on investments | | | 168,069,816 | | | | 16,496,648 | | | | 33,523,785 | | | | 5,319,328 | | | | 11,427,222 | |
| Net assets | | $ | 860,722,042 | | | $ | 250,163,871 | | | $ | 161,129,355 | | | $ | 21,800,484 | | | $ | 205,879,709 | |
| | | | | | | | | | | | | | | | | | | | | |
| INSTITUTIONAL CLASS** | | | | | | | | | | | | | | | | | | | | |
| Net assets | | $ | 819,984,564 | | | $ | 250,163,871 | | | $ | 161,129,355 | | | $ | 21,800,484 | | | $ | 205,879,709 | |
| Shares of beneficial interest outstanding | | | | | | | | | | | | | | | | | | | | |
| (unlimited shares of no par value authorized) | | | 36,144,306 | | | | 25,845,750 | | | | 9,143,706 | | | | 1,353,478 | | | | 18,325,921 | |
| Net asset value per share | | | | | | | | | | | | | | | | | | | | |
| (offering and redemption price) | | $ | 22.69 | | | $ | 9.68 | | | $ | 17.62 | | | $ | 16.11 | | | $ | 11.23 | |
| | | | | | | | | | | | | | | | | | | | | |
| ADVISER CLASS | | | | | | | | | | | | | | | | | | | | |
| Net assets | | $ | 40,737,478 | | | | | | | | | | | | | | | | | |
| Shares of beneficial interest outstanding | | | | | | | | | | | | | | | | | | | | |
| (unlimited shares of no par value authorized) | | | 1,845,755 | | | | | | | | | | | | | | | | | |
| Net asset value per share | | | | | | | | | | | | | | | | | | | | |
| (offering and redemption price) | | $ | 22.07 | | | | | | | | | | | | | | | | | |
| | | | | | | | | | | | | | | | | | | | | |
| * Cost of Investments | | $ | 688,293,858 | | | $ | 233,483,521 | | | $ | 127,827,560 | | | $ | 16,453,807 | | | $ | 192,857,262 | |
**Currently, only the Small Cap Equity, Small-Mid Cap Equity and Equity Funds offer a second class.
The accompanying notes are an integral part of these financial statements.
| Statement of Operations |
| For the Year Ended December 31, 2012 |
| | | | | | | | | | | | | | | | |
| | | LKCM | | | LKCM | | | LKCM | | | LKCM | | | LKCM | |
| | | Small Cap | | | Small-Mid Cap | | | Equity | | | Balanced | | | Fixed | |
| | | Equity Fund | | | Equity Fund | | | Fund | | | Fund | | | Income Fund | |
| Investment Income: | | | | | | | | | | | | | | | |
| Dividends* | | $ | 12,921,480 | | | $ | 1,017,678 | | | $ | 2,124,154 | | | $ | 282,693 | | | $ | 308,595 | |
| Interest | | | 3,753 | | | | 1,446 | | | | 900 | | | | 135,740 | | | | 6,990,736 | |
| Total income | | | 12,925,233 | | | | 1,019,124 | | | | 2,125,054 | | | | 418,433 | | | | 7,299,331 | |
| | | | | | | | | | | | | | | | | | | | | |
| Expenses: | | | | | | | | | | | | | | | | | | | | |
| Investment advisory fees | | | 6,566,837 | | | | 1,122,052 | | | | 904,398 | | | | 135,253 | | | | 989,911 | |
| Distribution expense - Adviser Class (Note B) | | | 113,400 | | | | — | | | | — | | | | — | | | | — | |
| Administrative fees | | | 694,805 | | | | 136,175 | | | | 116,664 | | | | 20,430 | | | | 159,736 | |
| Accounting and transfer agent fees and expenses | | | 323,492 | | | | 295,223 | | | | 81,714 | | | | 42,613 | | | | 100,246 | |
| Professional fees | | | 146,816 | | | | 22,729 | | | | 23,415 | | | | 7,022 | | | | 35,199 | |
| Trustees’ fees | | | 120,866 | | | | 8,000 | | | | 14,671 | | | | 2,914 | | | | 26,519 | |
| Custody fees and expenses | | | 110,916 | | | | 26,930 | | | | 14,176 | | | | 4,190 | | | | 21,065 | |
| Federal and state registration | | | 93,447 | | | | 113,299 | | | | 56,296 | | | | 11,580 | | | | 40,820 | |
| Reports to shareholders | | | 32,319 | | | | 23,019 | | | | 3,985 | | | | 1,048 | | | | 3,980 | |
| Other | | | 176,510 | | | | 12,617 | | | | 23,160 | | | | 3,976 | | | | 36,662 | |
| Total expenses | | | 8,379,408 | | | | 1,760,044 | | | | 1,238,479 | | | | 229,026 | | | | 1,414,138 | |
| Less, expense waiver and/or | | | | | | | | | | | | | | | | | | | | |
| reimbursement (Note B) | | | — | | | | (263,974 | ) | | | (204,881 | ) | | | (62,559 | ) | | | (127,253 | ) |
| Net expenses | | | 8,379,408 | | | | 1,496,070 | | | | 1,033,598 | | | | 166,467 | | | | 1,286,885 | |
| Net investment income (loss) | | | 4,545,825 | | | | (476,946 | ) | | | 1,091,456 | | | | 251,966 | | | | 6,012,446 | |
| | | | | | | | | | | | | | | | | | | | | |
| Realized and Unrealized Gain (Loss) on Investments: | | | | | | | | | | | | | | | | | | | | |
| Net realized gain (loss) on investments | | | 71,291,554 | | | | (5,294,736 | ) | | | 416,504 | | | | 207,068 | | | | 1,628,044 | |
| Net change in unrealized | | | | | | | | | | | | | | | | | | | | |
| appreciation/depreciation on investments | | | 1,660,006 | | | | 15,449,619 | | | | 16,294,358 | | | | 1,829,984 | | | | 2,747,190 | |
| | | | | | | | | | | | | | | | | | | | | |
| Net realized and unrealized gain on investments | | | 72,951,560 | | | | 10,154,883 | | | | 16,710,862 | | | | 2,037,052 | | | | 4,375,234 | |
| | | | | | | | | | | | | | | | | | | | | |
| Net Increase in Net Assets | | | | | | | | | | | | | | | | | | | | |
| Resulting from Operations | | $ | 77,497,385 | | | $ | 9,677,937 | | | $ | 17,802,318 | | | $ | 2,289,018 | | | $ | 10,387,680 | |
| | | | | | | | | | | | | | | | | | | | | |
| * Net of foreign taxes withheld | | $ | — | | | $ | 1,725 | | | $ | — | | | $ | 559 | | | $ | — | |
The accompanying notes are an integral part of these financial statements.
| Statements of Changes in Net Assets |
| | | | | | | | | | | | | |
| | | | | | | | | | | | | |
| | | LKCM | | | LKCM | |
| | | Small Cap | | | Small-Mid Cap | |
| | | Equity Fund | | | Equity Fund | |
| | | | | | May 2, 2011(1) | | | | | | | |
| | | Year Ended | | | Year Ended | | | Year Ended | | | through | |
| | | December 31, | | | December 31, | | | December 31, | | | December 31, | |
| | | 2012 | | | 2011 | | | 2012 | | | 2011 | |
| Operations: | | | | | | | | | | | | |
| Net investment income (loss) | | $ | 4,545,825 | | | $ | (2,783,986 | ) | | $ | (476,946 | ) | | $ | (37,460 | ) |
| Net realized gain (loss) on investments | | | 71,291,554 | | | | 69,601,456 | | | | (5,294,736 | ) | | | (699,870 | ) |
| Net change in unrealized | | | | | | | | | | | | | | | | |
| appreciation/depreciation on investments | | | 1,660,006 | | | | (35,091,526 | ) | | | 15,449,619 | | | | 1,047,029 | |
| Net increase in net assets resulting from operations | | | 77,497,385 | | | | 31,725,944 | | | | 9,677,937 | | | | 309,699 | |
| | | | | | | | | | | | | | | | | |
| Dividends and Distributions | | | | | | | | | | | | | | | | |
| to Institutional Class Shareholders: | | | | | | | | | | | | | | | | |
| Net investment income | | | (4,320,888 | ) | | | — | | | | — | | | | — | |
| Net realized gain on investments | | | (59,944,714 | ) | | | — | | | | — | | | | — | |
| | | | (64,265,602 | ) | | | — | | | | — | | | | — | |
| | | | | | | | | | | | | | | | | |
| Dividends and Distributions | | | | | | | | | | | | | | | | |
| to Adviser Class Shareholders: | | | | | | | | | | | | | | | | |
| Net investment income | | | (104,701 | ) | | | — | | | | — | | | | — | |
| Net realized gain on investments | | | (3,026,087 | ) | | | — | | | | — | | | | — | |
| | | | (3,130,788 | ) | | | — | | | | — | | | | — | |
| Net increase in net assets resulting from | | | | | | | | | | | | | | | | |
| Fund share transactions (Note C) | | | 22,217,530 | | | | 62,042,933 | | | | 216,731,428 | | | | 23,444,807 | |
| | | | | | | | | | | | | | | | | |
| Total increase in net assets | | | 32,318,525 | | | | 93,768,877 | | | | 226,409,365 | | | | 23,754,506 | |
| | | | | | | | | | | | | | | | | |
| Net Assets: | | | | | | | | | | | | | | | | |
| Beginning of period | | | 828,403,517 | | | | 734,634,640 | | | | 23,754,506 | | | | — | |
| End of period* | | $ | 860,722,042 | | | $ | 828,403,517 | | | $ | 250,163,871 | | | $ | 23,754,506 | |
| | | | | | | | | | | | | | | | | |
| * Including accumulated net investment income of | | $ | 120,236 | | | $ | — | | | $ | — | | | | $— | |
(1) Commencement of operations.
The accompanying notes are an integral part of these financial statements.
| Statements of Changes in Net Assets |
| | | LKCM | | | LKCM | |
| | | Equity Fund | | | Balanced Fund | |
| | | Year Ended | | | Year Ended | | | Year Ended | | | Year Ended | |
| | | December 31, | | | December 31, | | | December 31, | | | December 31, | |
| | | 2012 | | | 2011 | | | 2012 | | | 2011 | |
| Operations: | | | | | | | | | | | | |
| Net investment income | | $ | 1,091,456 | | | $ | 636,785 | | | $ | 251,966 | | | $ | 223,658 | |
| Net realized gain (loss) on investments | | | 416,504 | | | | 847,915 | | | | 207,068 | | | | (4,518 | ) |
| Net change in unrealized | | | | | | | | | | | | | | | | |
| appreciation/depreciation on investments | | | 16,294,358 | | | | 1,370,417 | | | | 1,829,984 | | | | 271,728 | |
| Net increase in net assets resulting from operations | | | 17,802,318 | | | | 2,855,117 | | | | 2,289,018 | | | | 490,868 | |
| | | | | | | | | | | | | | | | | |
| Dividends and Distributions to Shareholders: | | | | | | | | | | | | | | | | |
| Net investment income | | | (1,050,235 | ) | | | (636,154 | ) | | | (251,963 | ) | | | (223,616 | ) |
| Net realized gain on investments | | | (95,025 | ) | | | (1,598,383 | ) | | | — | | | | — | |
| | | | (1,145,260 | ) | | | (2,234,537 | ) | | | (251,963 | ) | | | (223,616 | ) |
| | | | | | | | | | | | | | | | | |
| Net increase in net assets resulting from | | | | | | | | | | | | | | | | |
| Fund share transactions (Note C) | | | 41,924,696 | | | | 29,557,371 | | | | 1,203,679 | | | | 1,806,145 | |
| | | | | | | | | | | | | | | | | |
| Total increase in net assets | | | 58,581,754 | | | | 30,177,951 | | | | 3,240,734 | | | | 2,073,397 | |
| | | | | | | | | | | | | | | | | |
| Net Assets: | | | | | | | | | | | | | | | | |
| Beginning of period | | | 102,547,601 | | | | 72,369,650 | | | | 18,559,750 | | | | 16,486,353 | |
| End of period* | | $ | 161,129,355 | | | $ | 102,547,601 | | | $ | 21,800,484 | | | $ | 18,559,750 | |
| | | | | | | | | | | | | | | | | |
| * Including accumulated net investment income of | | $ | 41,852 | | | $ | 631 | | | $ | 96 | | | $ | 107 | |
| | | | | | | | | | | | | | | | | |
The accompanying notes are an integral part of these financial statements.
| Statements of Changes in Net Assets |
| | | LKCM | |
| | | Fixed Income Fund | |
| | | Year Ended | | | Year Ended | |
| | | December 31, | | | December 31, | |
| | | 2012 | | | 2011 | |
| Operations: | | | | | | |
| Net investment income | | $ | 6,012,446 | | | $ | 5,703,042 | |
| Net realized gain on investments | | | 1,628,044 | | | | 917,718 | |
| Net change in unrealized | | | | | | | | |
| appreciation/depreciation on investments | | | 2,747,190 | | | | 230,560 | |
| Net increase in net assets resulting from operations | | | 10,387,680 | | | | 6,851,320 | |
| | | | | | | | | |
| Dividends and Distributions to Shareholders: | | | | | | | | |
| Net investment income | | | (6,031,076 | ) | | | (5,721,525 | ) |
| Net realized gain on investments | | | (1,152,139 | ) | | | (1,206,565 | ) |
| | | | (7,183,215 | ) | | | (6,928,090 | ) |
| | | | | | | | | |
| Net increase in net assets resulting from | | | | | | | | |
| Fund share transactions (Note C) | | | 24,559,400 | | | | 15,840,038 | |
| | | | | | | | | |
| Total increase in net assets | | | 27,763,865 | | | | 15,763,268 | |
| | | | | | | | | |
| Net Assets: | | | | | | | | |
| Beginning of period | | | 178,115,844 | | | | 162,352,576 | |
| End of period | | $ | 205,879,709 | | | $ | 178,115,844 | |
The accompanying notes are an integral part of these financial statements.
| Financial Highlights |
| Selected Data for Each Share of Capital Stock Outstanding | |
| | | LKCM Small Cap Equity Fund – Institutional Class | |
| | | Year | | | Year | | | Year | | | Year | | | Year | |
| | | Ended | | | Ended | | | Ended | | | Ended | | | Ended | |
| | | December 31, | | | December 31, | | | December 31, | | | December 31, | | | December 31, | |
| | | 2012 | | | 2011 | | | 2010 | | | 2009 | | | 2008 | |
| Net Asset Value - Beginning of Period | | $ | 22.45 | | | $ | 21.49 | | | $ | 16.16 | | | $ | 12.24 | | | $ | 20.03 | |
Net investment income (loss)(1) | | | 0.13 | | | | (0.08 | ) | | | (0.07 | ) | | | (0.05 | ) | | | (0.03 | ) |
| Net realized and unrealized gain (loss) on investments | | | 2.01 | | | | 1.04 | | | | 5.40 | | | | 3.97 | | | | (7.75 | ) |
| Total from investment operations | | | 2.14 | | | | 0.96 | | | | 5.33 | | | | 3.92 | | | | (7.78 | ) |
| Dividends from net investment income | | | (0.13 | ) | | | — | | | | — | | | | — | | | | — | |
| Distributions from net realized gains | | | (1.77 | ) | | | — | | | | — | | | | — | | | | (0.01 | ) |
| Total dividends and distributions | | | (1.90 | ) | | | — | | | | — | | | | — | | | | (0.01 | ) |
| Net Asset Value - End of Period | | $ | 22.69 | | | $ | 22.45 | | | $ | 21.49 | | | $ | 16.16 | | | $ | 12.24 | |
| Total Return | | | 9.74 | % | | | 4.47 | % | | | 32.98 | % | | | 32.03 | % | | | (38.87 | )% |
| | | | | | | | | | | | | | | | | | | | | |
| Ratios and Supplemental Data: | | | | | | | | | | | | | | | | | | | | |
| Net assets, end of period (thousands) | | $ | 819,985 | | | $ | 785,280 | | | $ | 690,511 | | | $ | 529,166 | | | $ | 385,223 | |
| Ratio of expenses to average net assets | | | 0.94 | % | | | 0.95 | % | | | 0.96 | % | | | 1.00 | % | | | 0.97 | % |
| Ratio of net investment income (loss) to average net assets | | | 0.53 | % | | | (0.33 | )% | | | (0.38 | )% | | | (0.35 | )% | | | (0.17 | )% |
Portfolio turnover rate(2) | | | 49 | % | | | 50 | % | | | 57 | % | | | 59 | % | | | 61 | % |
| | | | | | | | | | | | | | | | | | | | | |
(1) Net investment income (loss) per share represents net investment income (loss) divided by the average shares outstanding throughout the period.
(2) Portfolio turnover is calculated on the basis of the Fund as a whole without distinguishing between the classes of shares issued.
| | | LKCM Small Cap Equity Fund – Adviser Class | |
| | | Year | | | Year | | | Year | | | Year | | | Year | |
| | | Ended | | | Ended | | | Ended | | | Ended | | | Ended | |
| | | December 31, | | | December 31, | | | December 31, | | | December 31, | | | December 31, | |
| | | 2012 | | | 2011 | | | 2010 | | | 2009 | | | 2008 | |
| Net Asset Value - Beginning of Period | | $ | 21.88 | | | $ | 21.00 | | | $ | 15.83 | | | $ | 12.02 | | | $ | 19.72 | |
Net investment income (loss)(1) | | | 0.07 | | | | (0.13 | ) | | | (0.11 | ) | | | (0.08 | ) | | | (0.07 | ) |
| Net realized and unrealized gain (loss) on investments | | | 1.95 | | | | 1.01 | | | | 5.28 | | | | 3.89 | | | | (7.62 | ) |
| Total from investment operations | | | 2.02 | | | | 0.88 | | | | 5.17 | | | | 3.81 | | | | (7.69 | ) |
| Dividends from net investment income | | | (0.06 | ) | | | — | | | | — | | | | — | | | | — | |
| Distributions from net realized gains | | | (1.77 | ) | | | — | | | | — | | | | — | | | | (0.01 | ) |
| Total dividends and distributions | | | (1.83 | ) | | | — | | | | — | | | | — | | | | (0.01 | ) |
| Net Asset Value - End of Period | | $ | 22.07 | | | $ | 21.88 | | | $ | 21.00 | | | $ | 15.83 | | | $ | 12.02 | |
| Total Return | | | 9.45 | % | | | 4.19 | % | | | 32.66 | % | | | 31.70 | % | | | (39.02 | )% |
| | | | | | | | | | | | | | | | | | | | | |
| Ratios and Supplemental Data: | | | | | | | | | | | | | | | | | | | | |
| Net assets, end of period (thousands) | | $ | 40,737 | | | $ | 43,124 | | | $ | 44,124 | | | $ | 35,725 | | | $ | 24,925 | |
| Ratio of expenses to average net assets | | | 1.19 | % | | | 1.20 | % | | | 1.21 | % | | | 1.25 | % | | | 1.22 | % |
| Ratio of net investment income (loss) to average net assets | | | 0.28 | % | | | (0.58 | )% | | | (0.63 | )% | | | (0.60 | )% | | | (0.42 | )% |
Portfolio turnover rate(2) | | | 49 | % | | | 50 | % | | | 57 | % | | | 59 | % | | | 61 | % |
(1) Net investment income (loss) per share represents net investment income (loss) divided by the average shares outstanding throughout the period.
(2) Portfolio turnover is calculated on the basis of the Fund as a whole without distinguishing between the classes of shares issued.
The accompanying notes are an integral part of these financial statements.
| Financial Highlights |
| Selected Data for Each Share of Capital Stock Outstanding | |
| | | LKCM | | |
| | | Small-Mid Cap Equity Fund | | |
| | | Year | | | May 2, 2011(1) | | |
| | | Ended | | | through | | |
| | | December 31, | | | December 31, | | |
| | | 2012 | | | 2011 | | |
| Net Asset Value - Beginning of Period | | $ | 8.86 | | | $ | 10.00 | | |
Net investment loss(2) | | | (0.03 | ) | | | (0.02 | ) | |
| Net realized and unrealized gain (loss) on investments | | | 0.85 | | | | (1.12 | ) | |
| Total from investment operations | | | 0.82 | | | | (1.14 | ) | |
| Net Asset Value - End of Period | | $ | 9.68 | | | $ | 8.86 | | |
| Total Return | | | 9.26 | % | | | (11.40 | )%(3) | |
| | | | | | | | | | |
| Ratios and Supplemental Data: | | | | | | | | | |
| Net assets, end of period (thousands) | | $ | 250,164 | | | $ | 23,755 | | |
| Ratio of expenses to average net assets: | | | | | | | | | |
| Before expense waiver and/or reimbursement | | | 1.18 | % | | | 2.14 | %(4) | |
| After expense waiver and/or reimbursement | | | 1.00 | % | | | 1.00 | %(4) | |
| Ratio of net investment loss to average net assets: | | | | | | | | | |
| Before expense waiver and/or reimbursement | | | (0.50 | )% | | | (1.55 | )%(4) | |
| After expense waiver and/or reimbursement | | | (0.32 | )% | | | (0.41 | )%(4) | |
| Portfolio turnover rate | | | 56 | % | | | 36 | % | |
(1) Commencement of operations.
(2) Net investment loss per share represents net investment loss divided by the average shares outstanding throughout the period.
(3) Not annualized.
(4) Annualized.
| | | LKCM Equity Fund | |
| | | Year | | | Year | | | Year | | | Year | | | Year | |
| | | Ended | | | Ended | | | Ended | | | Ended | | | Ended | |
| | | December 31, | | | December 31, | | | December 31, | | | December 31, | | | December 31, | |
| | | 2012 | | | 2011 | | | 2010 | | | 2009 | | | 2008 | |
| Net Asset Value - Beginning of Period | | $ | 15.34 | | | $ | 15.18 | | | $ | 13.02 | | | $ | 10.33 | | | $ | 15.38 | |
| Net investment income | | | 0.14 | (1) | | | 0.11 | (1) | | | 0.08 | | | | 0.10 | | | | 0.16 | |
| Net realized and unrealized gain (loss) on investments | | | 2.27 | | | | 0.39 | | | | 2.24 | | | | 2.69 | | | | (5.05 | ) |
| Total from investment operations | | | 2.41 | | | | 0.50 | | | | 2.32 | | | | 2.79 | | | | (4.89 | ) |
| Dividends from net investment income | | | (0.12 | ) | | | (0.10 | ) | | | (0.08 | ) | | | (0.10 | ) | | | (0.16 | ) |
| Distributions from net realized gains | | | (0.01 | ) | | | (0.24 | ) | | | (0.08 | ) | | | — | | | | — | |
| Total dividends and distributions | | | (0.13 | ) | | | (0.34 | ) | | | (0.16 | ) | | | (0.10 | ) | | | (0.16 | ) |
| Net Asset Value - End of Period | | $ | 17.62 | | | $ | 15.34 | | | $ | 15.18 | | | $ | 13.02 | | | $ | 10.33 | |
| Total Return | | | 15.69 | % | | | 3.30 | % | | | 17.77 | % | | | 27.01 | % | | | (31.80 | )% |
| | | | | | | | | | | | | | | | | | | | | |
| Ratios and Supplemental Data: | | | | | | | | | | | | | | | | | | | | |
| Net assets, end of period (thousands) | | $ | 161,129 | | | $ | 102,548 | | | $ | 72,370 | | | $ | 49,157 | | | $ | 36,677 | |
| Ratio of expenses to average net assets: | | | | | | | | | | | | | | | | | | | | |
| Before expense waiver and/or reimbursement | | | 0.96 | % | | | 0.99 | % | | | 1.04 | % | | | 1.13 | % | | | 1.06 | % |
| After expense waiver and/or reimbursement | | | 0.80 | % | | | 0.80 | % | | | 0.80 | % | | | 0.80 | % | | | 0.80 | % |
| Ratio of net investment income to average net assets: | | | | | | | | | | | | | | | | | | | | |
| Before expense waiver and/or reimbursement | | | 0.69 | % | | | 0.54 | % | | | 0.39 | % | | | 0.62 | % | | | 0.85 | % |
| After expense waiver and/or reimbursement | | | 0.85 | % | | | 0.73 | % | | | 0.63 | % | | | 0.95 | % | | | 1.11 | % |
| Portfolio turnover rate | | | 12 | % | | | 20 | % | | | 23 | % | | | 26 | % | | | 31 | % |
(1) Net investment income per share represents net investment income divided by the average shares outstanding throughout the period.
The accompanying notes are an integral part of these financial statements.
| Financial Highlights |
| Selected Data for Each Share of Capital Stock Outstanding | |
| | | LKCM Balanced Fund | |
| | | Year | | | Year | | | Year | | | Year | | | Year | |
| | | Ended | | | Ended | | | Ended | | | Ended | | | Ended | |
| | | December 31, | | | December 31, | | | December 31, | | | December 31, | | | December 31, | |
| | | 2012 | | | 2011 | | | 2010 | | | 2009 | | | 2008 | |
| Net Asset Value - Beginning of Period | | $ | 14.53 | | | $ | 14.25 | | | $ | 13.09 | | | $ | 10.85 | | | $ | 13.84 | |
| Net investment income | | | 0.19 | | | | 0.17 | | | | 0.18 | | | | 0.22 | | | | 0.26 | |
| Net realized and unrealized gain (loss) on investments | | | 1.58 | | | | 0.28 | | | | 1.16 | | | | 2.24 | | | | (2.96 | ) |
| Total from investment operations | | | 1.77 | | | | 0.45 | | | | 1.34 | | | | 2.46 | | | | (2.70 | ) |
| Dividends from net investment income | | | (0.19 | ) | | | (0.17 | ) | | | (0.18 | ) | | | (0.22 | ) | | | (0.28 | ) |
| Distributions from net realized gains | | | — | | | | — | | | | — | | | | — | | | | (0.01 | ) |
| Total dividends and distributions | | | (0.19 | ) | | | (0.17 | ) | | | (0.18 | ) | | | (0.22 | ) | | | (0.29 | ) |
| Net Asset Value - End of Period | | $ | 16.11 | | | $ | 14.53 | | | $ | 14.25 | | | $ | 13.09 | | | $ | 10.85 | |
| Total Return | | | 12.20 | % | | | 3.16 | % | | | 10.31 | % | | | 22.90 | % | | | (19.70 | )% |
| | | | | | | | | | | | | | | | | | | | | |
| Ratios and Supplemental Data: | | | | | | | | | | | | | | | | | | | | |
| Net assets, end of period (thousands) | | $ | 21,800 | | | $ | 18,560 | | | $ | 16,486 | | | $ | 13,476 | | | $ | 10,156 | |
| Ratio of expenses to average net assets: | | | | | | | | | | | | | | | | | | | | |
| Before expense waiver and/or reimbursement | | | 1.10 | % | | | 1.14 | % | | | 1.25 | % | | | 1.41 | % | | | 1.38 | % |
| After expense waiver and/or reimbursement | | | 0.80 | % | | | 0.80 | % | | | 0.80 | % | | | 0.80 | % | | | 0.80 | % |
| Ratio of net investment income to average net assets: | | | | | | | | | | | | | | | | | | | | |
| Before expense waiver and/or reimbursement | | | 0.91 | % | | | 0.83 | % | | | 0.89 | % | | | 1.28 | % | | | 1.51 | % |
| After expense waiver and/or reimbursement | | | 1.21 | % | | | 1.17 | % | | | 1.34 | % | | | 1.89 | % | | | 2.09 | % |
| Portfolio turnover rate | | | 15 | % | | | 34 | % | | | 13 | % | | | 22 | % | | | 38 | % |
| | | LKCM Fixed Income Fund | |
| | | Year | | | Year | | | Year | | | Year | | | Year | |
| | | Ended | | | Ended | | | Ended | | | Ended | | | Ended | |
| | | December 31, | | | December 31, | | | December 31, | | | December 31, | | | December 31, | |
| | | 2012 | | | 2011 | | | 2010 | | | 2009 | | | 2008 | |
| Net Asset Value - Beginning of Period | | $ | 11.04 | | | $ | 11.03 | | | $ | 10.85 | | | $ | 10.20 | | | $ | 10.33 | |
| Net investment income | | | 0.34 | | | | 0.37 | | | | 0.40 | | | | 0.43 | | | | 0.43 | |
| Net realized and unrealized gain (loss) on investments | | | 0.25 | | | | 0.09 | | | | 0.22 | | | | 0.65 | | | | (0.13 | ) |
| Total from investment operations | | | 0.59 | | | | 0.46 | | | | 0.62 | | | | 1.08 | | | | 0.30 | |
| Dividends from net investment income | | | (0.34 | ) | | | (0.37 | ) | | | (0.40 | ) | | | (0.43 | ) | | | (0.43 | ) |
| Distributions from net realized gains | | | (0.06 | ) | | | (0.08 | ) | | | (0.04 | ) | | | — | | | | — | |
| Total dividends and distributions | | | (0.40 | ) | | | (0.45 | ) | | | (0.44 | ) | | | (0.43 | ) | | | (0.43 | ) |
| Net Asset Value - End of Period | | $ | 11.23 | | | $ | 11.04 | | | $ | 11.03 | | | $ | 10.85 | | | $ | 10.20 | |
| Total Return | | | 5.44 | % | | | 4.22 | % | | | 5.82 | % | | | 10.77 | % | | | 2.99 | % |
| | | | | | | | | | | | | | | | | | | | | |
| Ratios and Supplemental Data: | | | | | | | | | | | | | | | | | | | | |
| Net assets, end of period (thousands) | | $ | 205,880 | | | $ | 178,116 | | | $ | 162,353 | | | $ | 149,218 | | | $ | 120,674 | |
| Ratio of expenses to average net assets: | | | | | | | | | | | | | | | | | | | | |
| Before expense waiver and/or reimbursement | | | 0.71 | % | | | 0.72 | % | | | 0.73 | % | | | 0.76 | % | | | 0.73 | % |
| After expense waiver and/or reimbursement | | | 0.65 | % | | | 0.65 | % | | | 0.65 | % | | | 0.65 | % | | | 0.65 | % |
| Ratio of net investment income to average net assets: | | | | | | | | | | | | | | | | | | | | |
| Before expense waiver and/or reimbursement | | | 2.98 | % | | | 3.31 | % | | | 3.55 | % | | | 4.00 | % | | | 4.15 | % |
| After expense waiver and/or reimbursement | | | 3.04 | % | | | 3.38 | % | | | 3.63 | % | | | 4.11 | % | | | 4.23 | % |
| Portfolio turnover rate | | | 31 | % | | | 24 | % | | | 20 | % | | | 30 | % | | | 23 | % |
The accompanying notes are an integral part of these financial statements.
| LKCM Funds |
| Notes to the Financial Statements | |
A. Organization and Significant Accounting Policies: LKCM Funds (the “Trust”) is registered under the Investment Company Act of 1940 (“1940 Act”) as an open-end, management investment company. The Trust was organized as a Delaware business trust on February 10, 1994 and consists of eight diversified series, five of which are presented herein and include the LKCM Small Cap Equity Fund, LKCM Small-Mid Cap Equity Fund, LKCM Equity Fund, LKCM Balanced Fund and LKCM Fixed Income Fund (collectively, the “Funds”), the assets of which are invested in separate, independently managed portfolios. Investment operations of the Funds began on July 14, 1994 (LKCM Small Cap Equity Fund), January 3, 1996 (LKCM Equity Fund), December 30, 1997 (LKCM Balanced Fund and LKCM Fixed Income Fund), and May 2, 2011 (LKCM Small-Mid Cap Equity Fund). The Small Cap Equity Fund and the Equity Fund issued a second class of shares, Adviser Class Shares, and renamed the initial class as Institutional Class Shares on May 1, 2003. The Small Cap Equity Adviser Class Shares were initially sold on June 5, 2003 and are subject to expenses pursuant to the Rule 12b-1 plan described in Note B. The Equity Fund and Small-Mid Cap Equity Fund Adviser Class Shares have not yet commenced sales. Each Fund charges a 1% redemption fee for redemptions on Fund shares held for less than 30 days.
The LKCM Small Cap Equity Fund seeks to maximize long-term capital appreciation by investing under normal circumstances at least 80% of its net assets in equity securities of smaller companies (those with market capitalizations at the time of investment between $400 million and $2.5 billion) which Luther King Capital Management Corporation (the “Adviser”) believes are likely to have above-average growth in revenue and/or earnings and potential for above-average capital appreciation. The LKCM Small-Mid Cap Equity Fund seeks to maximize long-term capital appreciation by investing under normal circumstances at least 80% of its net assets in equity securities of small-mid capitalization companies (those with market capitalizations at the time of investment between $1 billion and $7 billion) which the Adviser believes are likely to have above-average growth in revenue and/or earnings and potential for above average capital appreciation. The LKCM Equity Fund seeks to maximize long-term capital appreciation by investing under normal circumstances at least 80% of its net assets in equity securities of companies which the Adviser believes are likely to have above-average growth in revenue and/or earnings, above-average returns on shareholders’ equity and under-leveraged balance sheets, and potential for above-average capital appreciation. The LKCM Balanced Fund seeks to provide investors with current income and long-term capital appreciation by investing under normal circumstances primarily in a portfolio of equity and fixed income securities with at least 25% of the Fund’s total assets invested in fixed income securities. The LKCM Fixed Income Fund seeks to provide investors with current income by investing under normal circumstances at least 80% of its net assets in a portfolio of investment grade corporate and government fixed income securities.
The following is a summary of significant accounting policies followed by the Funds in preparation of the financial statements.
1. Security Valuation: Securities listed on a U.S. securities exchange for which market quotations are readily available are valued at the last quoted sale price taken from the exchange where the security is primarily traded. Nasdaq National Market securities are valued at the Nasdaq Official Closing Price (“NOCP”). Unlisted U.S. securities and listed U.S. securities not traded on the valuation date for which market quotations are readily available are valued at the mean of the most recent quoted bid and asked price. Securities listed on a foreign exchange for which market quotations are readily available are valued at the last quoted sales price available before the time when assets are valued. Debt securities (other than obligations having a maturity of 60 days or less) are normally valued at the mean of the bid and ask price and/or by using a combination of daily quotes or matrix evaluations provided by an independent pricing service. Debt securities purchased with remaining maturities of 60 days or less are valued at amortized cost which approximates fair value. Other assets and securities for which no quotations are readily available (including restricted securities) are valued in good faith at fair value using methods determined by the Board of Trustees. The Board has adopted specific procedures for valuing portfolio securities and delegated the implementation of these procedures to the Adviser. The procedures authorize the Adviser to make all determinations regarding the fair value of a portfolio security and to report such determinations to the Board of Trustees. The Funds may also use independent pricing services to assist in pricing portfolio securities.
The Trust has adopted accounting standards which establish an authoritative definition of fair value and set out a hierarchy for measuring fair value. These standards require additional disclosures about the various inputs and valuation techniques used to develop the measurements of fair value and a discussion of changes in valuation techniques and related inputs during the period. These standards define fair value as the price that would be received to sell an asset or paid to transfer a liability in an orderly transaction between market participants at the measurement date. The fair value hierarchy is organized into three levels based upon the assumptions (referred to as “inputs”) used in pricing the asset or liability. These standards state that “observable inputs” reflect the assumptions market participants would use in pricing the asset or liability based on market data obtained from independent sources and “unobservable inputs” reflect an entity’s own assumptions about the assumptions market participants would use in pricing the asset or liability. These inputs are summarized in the three broad levels listed below.
| Level 1 - | Quoted unadjusted prices for identical instruments in active markets to which the Trust has access at the date of measurement. |
| Level 2 - | Quoted prices for similar instruments in active markets; quoted prices for identical or similar instruments in markets that are not active; and model-derived valuations in which all significant inputs and significant value drivers are observable in active markets. Level 2 inputs are those in markets for which there are few transactions, the prices are not current, little public information exists or instances where prices vary substantially over time or among brokered market makers. |
| Level 3 - | Model derived valuations in which one or more significant inputs or significant value drivers are unobservable. Unobservable inputs are those inputs that reflect the Trust’s own assumptions that market participants would use to price the asset or liability based on the best available information. |
The inputs or methodology used for valuing securities are not necessarily an indication of the risk associated with investing in those securities. The following is a summary of the inputs used to value the Funds’ investments as of December 31, 2012:
| | LKCM Small Cap Equity Fund | | | | | | | | | | | | |
| | Description | | Level 1 | | | Level 2 | | | Level 3 | | | Total | |
| | Common Stocks | | $ | 840,197,148 | | | $ | — | | | $ | — | | | $ | 840,197,148 | |
| | Money Market Fund | | | 16,166,526 | | | | — | | | | — | | | | 16,166,526 | |
| | Total Investments* | | $ | 856,363,674 | | | $ | — | | | $ | — | | | $ | 856,363,674 | |
| | | | | | | | | | | | | | | | | | |
| | LKCM Small-Mid Cap Equity Fund | | | | | | | | | | | | | | | | |
| | Description | | Level 1 | | | Level 2 | | | Level 3 | | | Total | |
| | Common Stocks | | $ | 240,326,762 | | | $ | — | | | $ | — | | | $ | 240,326,762 | |
| | Money Market Funds | | | 9,653,407 | | | | — | | | | — | | | | 9,653,407 | |
| | Total Investments* | | $ | 249,980,169 | | | $ | — | | | $ | — | | | $ | 249,980,169 | |
| | | | | | | | | | | | | | | | | | |
| | LKCM Equity Fund | | | | | | | | | | | | | | | | |
| | Description | | Level 1 | | | Level 2 | | | Level 3 | | | Total | |
| | Common Stocks | | $ | 144,783,861 | | | $ | — | | | $ | — | | | $ | 144,783,861 | |
| | Money Market Funds | | | 16,567,484 | | | | — | | | | — | | | | 16,567,484 | |
| | Total Investments* | | $ | 161,351,345 | | | $ | — | | | $ | — | | | $ | 161,351,345 | |
| | | | | | | | | | | | | | | | | | |
| | LKCM Balanced Fund | | | | | | | | | | | | | | | | |
| | Description | | Level 1 | | | Level 2 | | | Level 3 | | | Total | |
| | Common Stocks | | $ | 15,388,710 | | | $ | — | | | $ | — | | | $ | 15,388,710 | |
| | Corporate Bonds | | | — | | | | 6,209,963 | | | | — | | | | 6,209,963 | |
| | Money Market Fund | | | 174,462 | | | | — | | | | — | | | | 174,462 | |
| | Total Investments* | | $ | 15,563,172 | | | $ | 6,209,963 | | | $ | — | | | $ | 21,773,135 | |
| | | | | | | | | | | | | | | | | | |
| | LKCM Fixed Income Fund | | | | | | | | | | | | | | | | |
| | Description | | Level 1 | | | Level 2 | | | Level 3 | | | Total | |
| | Preferred Stocks | | $ | 7,115,450 | | | $ | — | | | $ | — | | | $ | 7,115,450 | |
| | Corporate Bonds | | | — | | | | 189,893,346 | | | | — | | | | 189,893,346 | |
| | U.S. Government & Agency Issues | | | — | | | | 5,122,914 | | | | — | | | | 5,122,914 | |
| | Money Market Fund | | | 2,152,774 | | | | — | | | | — | | | | 2,152,774 | |
| | Total Investments* | | $ | 9,268,224 | | | $ | 195,016,260 | | | $ | — | | | $ | 204,284,484 | |
*Additional information regarding the industry classifications of these investments is disclosed in the Schedule of Investments.
There were no significant transfers into or out of Level 1, Level 2 or Level 3 fair value measurements during the reporting period, as compared to their classification from the previous annual report.
In May 2011, the FASB issued ASU No. 2011-04 “Amendments to Achieve Common Fair Value Measurements and Disclosure Requirements” in GAAP and the International Financial Reporting Standards (“IFRS”). ASU No. 2011-04 amends FASB ASC Topic 820, Fair Value Measurements and Disclosures, to establish common requirements for measuring fair value and for disclosing information about fair value measurements in accordance with GAAP and IFRS. ASU No. 2011-04 is effective for fiscal years beginning after December 15, 2011 and for interim periods within those fiscal years. The Funds have disclosed the applicable requirements of this accounting standard in their financial statements.
2. Federal Income Taxes: The Funds have elected to be treated as “regulated investment companies” under Subchapter M of the Internal Revenue Code and each Fund intends to distribute all of its investment company net taxable income and net capital gains to shareholders. Therefore, no federal income tax provision is recorded.
3. Distributions to Shareholders: The LKCM Small Cap Equity, LKCM Small-Mid Cap Equity and LKCM Equity Funds generally intend to pay dividends and net capital gain distributions, if any, at least on an annual basis. The LKCM Balanced and LKCM Fixed Income Funds generally intend to pay dividends on a quarterly basis and net capital gain distributions, if any, at least on an annual basis.
4. Foreign Securities: Investing in securities of foreign companies and foreign governments involves special risks and considerations not typically associated with investing in U.S. companies and securities of the U.S. government. These risks include devaluation of currencies and future adverse political and economic developments. Moreover, securities of many foreign companies and foreign governments and their markets may be less liquid and their prices more volatile than those of securities of comparable U.S. companies and securities of the U.S. government.
5. Expense Allocation: Expenses incurred by the Funds are allocated among the Funds based upon (i) relative average net assets, (ii) a specific identification basis as incurred, or (iii) evenly among the Funds, depending on the nature of the expense. Expenses that are directly attributable to a class of shares, such as Rule 12b-1 distribution fees, are charged to that class. For multi-class Funds, income, unrealized and realized gains/losses are generally allocated between the Fund’s classes in proportion to their respective net assets.
6. Use of Estimates: The preparation of financial statements in conformity with accounting principles generally accepted in the United States of America requires management to make estimates and assumptions that affect the reported amounts of assets and liabilities and disclosure of contingent assets and liabilities at the date of the financial statements and the reported amounts of revenues and expenses during the reporting period. Actual results could differ from those estimates.
7. Guarantees and Indemnifications: In the normal course of business, the Funds enter into contracts with service providers that contain general indemnification clauses. The Funds’ maximum exposure under these arrangements is unknown as this would involve future claims against the Funds that have not yet occurred. Based on experience, the Funds expect the risk of loss to be remote.
8. Other: Security and shareholder transactions are recorded on the trade date. Realized gains and losses on sales of investments are calculated on the identified cost basis. Dividend income and dividends and distributions to shareholders are recorded on the ex-dividend date. Interest income is recognized on the accrual basis. All discounts and premiums are amortized on the effective interest method for tax and financial reporting purposes.
Generally accepted accounting principles require that certain components of net assets be adjusted to reflect permanent differences between financial and tax reporting. These reclassifications have no effect on net assets or net asset values per share.
Accordingly, at December 31, 2012, reclassifications were recorded as follows:
| | | LKCM | | | LKCM | | | LKCM | | | LKCM | | | LKCM | |
| | | Small Cap | | | Small-Mid Cap | | | Equity | | | Balanced | | | Fixed | |
| | | Equity Fund | | | Equity Fund | | | Fund | | | Fund | | | Income Fund | |
| Accumulated net investment | | | | | | | | | | | | | | | |
| income (loss) | | $ | — | | | $ | 476,946 | | | $ | — | | | $ | (14 | ) | | $ | 18,630 | |
| Accumulated gains (loss) | | | — | | | | — | | | | — | | | | 14 | | | | (18,630 | ) |
| Capital stock | | | — | | | | (476,946 | ) | | | — | | | | — | | | | — | |
9. Restricted and Illiquid Securities: The Funds are permitted to invest in securities that are subject to legal or contractual restrictions on resale or are illiquid. Restricted securities generally may be resold in transactions exempt from registration. A security may be considered illiquid if it lacks a readily available market or if its valuation has not changed for a certain period of time. Disposal of these securities may involve time-consuming negotiations and expense, and prompt sale at the current valuation may be difficult.
B. Investment Advisory and Other Agreements: Luther King Capital Management Corporation (the “Adviser”) serves as the investment adviser to the Funds under an Investment Advisory Agreement (the “Agreement”). The Adviser receives a fee, computed daily and payable quarterly, at the annual rates presented below as applied to each Fund’s average daily net assets. The Adviser has contractually agreed to waive all or a portion of its management fee and/or reimburse the Funds through April 30, 2013 in order to limit each Fund’s operating expenses to the annual cap rates presented below. For the year ended December 31, 2012, the Adviser waived the following management fees to meet its expense cap obligations:
| | LKCM | LKCM | LKCM | LKCM | LKCM |
| | Small Cap | Small-Mid Cap | Equity | Balanced | Fixed |
| | Equity Fund | Equity Fund | Fund | Fund | Income Fund |
| Annual Advisory Rate | 0.75% | 0.75% | 0.70% | 0.65% | 0.50% |
| Annual Cap on Expenses | 1.00% (Inst.) | 1.00% | 0.80% | 0.80% | 0.65% |
| | 1.25% (Adviser) | | | | |
| Fees Waived in 2012 | — | $263,974 | $204,881 | $62,559 | $127,253 |
U.S. Bancorp Fund Services, LLC serves as transfer agent and administrator for the Trust and serves as accounting services agent for the Trust. U.S. Bank, N.A. serves as custodian for the Trust.
Distribution services are performed pursuant to a distribution contract with Quasar Distributors, LLC, the Trust’s principal underwriter.
The Small Cap Equity Fund, Small-Mid Cap Equity and the Equity Fund have adopted a Rule 12b-1 plan under which the Adviser Class of each Fund may pay up to 1.00% of its average daily net assets for distribution and other services. However, the Board of Trustees has currently only authorized a fee of 0.25% of each Fund’s average daily net assets. For the year ended December 31, 2012, fees accrued by the Small Cap Equity Fund pursuant to the 12b-1 Plan were $113,400.
C. Fund Shares: At December 31, 2012, there was an unlimited number of shares of beneficial interest, no par value, authorized. The following table summarizes the activity in shares of each Fund:
Small Cap Equity Fund
| | | Year Ended | | | Year Ended | |
| | | December 31, 2012 | | | December 31, 2011 | |
| | | Institutional Class | | | Institutional Class | |
| | | Shares | | | Amount | | | Shares | | | Amount | |
| Shares sold | | | 8,100,091 | | | $ | 196,206,366 | | | | 8,832,325 | | | $ | 201,191,471 | |
| Shares issued to shareholders in | | | | | | | | | | | | | | | | |
| reinvestment of distributions | | | 2,352,426 | | | | 52,200,325 | | | | — | | | | — | |
| Shares redeemed | | | (9,289,328 | ) | | | (223,028,143 | ) | | | (5,987,585 | ) | | | (135,600,658 | ) |
| Redemption fee | | | | | | | 16,577 | | | | | | | | 7,239 | |
| Net increase | | | 1,163,189 | | | $ | 25,395,125 | | | | 2,844,740 | | | $ | 65,598,052 | |
| Shares Outstanding: | | | | | | | | | | | | | | | | |
| Beginning of period | | | 34,981,117 | | | | | | | | 32,136,377 | | | | | |
| End of period | | | 36,144,306 | | | | | | | | 34,981,117 | | | | | |
| | | | | | | | | | | | | | | | | |
| | | Year Ended | | | Year Ended | |
| | | December 31, 2012 | | | December 31, 2011 | |
| | | Adviser Class | | | Adviser Class | |
| | | Shares | | | Amount | | | Shares | | | Amount | |
| Shares sold | | | 354,133 | | | $ | 8,367,217 | | | | 818,200 | | | $ | 17,753,894 | |
| Shares issued to shareholders in | | | | | | | | | | | | | | | | |
| reinvestment of distributions | | | 144,448 | | | | 3,118,634 | | | | — | | | | — | |
| Shares redeemed | | | (623,689 | ) | | | (14,664,514 | ) | | | (948,884 | ) | | | (21,309,344 | ) |
| Redemption fee | | | | | | | 1,068 | | | | | | | | 331 | |
| Net decrease | | | (125,108 | ) | | $ | (3,177,595 | ) | | | (130,684 | ) | | $ | (3,555,119 | ) |
| Shares Outstanding: | | | | | | | | | | | | | | | | |
| Beginning of period | | | 1,970,863 | | | | | | | | 2,101,547 | | | | | |
| End of period | | | 1,845,755 | | | | | | | | 1,970,863 | | | | | |
| Total Net Increase | | | | | | $ | 22,217,530 | | | | | | | $ | 62,042,933 | |
Small-Mid Cap Equity Fund
| | | Year Ended | | | May 2, 2011(1) through | |
| | | December 31, 2012 | | | December 31, 2011 | |
| | | Shares | | | Amount | | | Shares | | | Amount | |
| Shares sold | | | 25,719,580 | | | $ | 241,058,436 | | | | 2,908,059 | | | $ | 25,500,659 | |
| Shares redeemed | | | (2,555,855 | ) | | | (24,343,804 | ) | | | (226,034 | ) | | | (2,055,865 | ) |
| Redemption fee | | | | | | | 16,796 | | | | | | | | 13 | |
| Net increase | | | 23,163,725 | | | $ | 216,731,428 | | | | 2,682,025 | | | $ | 23,444,807 | |
| Shares Outstanding: | | | | | | | | | | | | | | | | |
| Beginning of period | | | 2,682,025 | | | | | | | | — | | | | | |
| End of period | | | 25,845,750 | | | | | | | | 2,682,025 | | | | | |
(1) Commencement of operations.
Equity Fund
| | | Year Ended | | | Year Ended | |
| | | December 31, 2012 | | | December 31, 2011 | |
| | | Shares | | | Amount | | | Shares | | | Amount | |
| Shares sold | | | 3,492,239 | | | $ | 59,271,200 | | | | 2,438,054 | | | $ | 37,526,183 | |
| Shares issued to shareholders in | | | | | | | | | | | | | | | | |
| reinvestment of distributions | | | 55,498 | | | | 964,550 | | | | 141,992 | | | | 2,188,102 | |
| Shares redeemed | | | (1,089,491 | ) | | | (18,316,158 | ) | | | (663,144 | ) | | | (10,157,406 | ) |
| Redemption fee | | | | | | | 5,104 | | | | | | | | 492 | |
| Net increase | | | 2,458,246 | | | $ | 41,924,696 | | | | 1,916,902 | | | $ | 29,557,371 | |
| | | | | | | | | | | | | | | | | |
| Shares Outstanding: | | | | | | | | | | | | | | | | |
| Beginning of period | | | 6,685,460 | | | | | | | | 4,768,558 | | | | | |
| End of period | | | 9,143,706 | | | | | | | | 6,685,460 | | | | | |
| | | | | | | | | | | | | | | | | |
| Balanced Fund | | | | | | | | | | | | | | | | |
| | | | | | | | | | | | | | | | | |
| | | | | | | | | | | | | | | | | |
| | | Year Ended | | | Year Ended | |
| | | December 31, 2012 | | | December 31, 2011 | |
| | | Shares | | | Amount | | | Shares | | | Amount | |
| Shares sold | | | 119,962 | | | $ | 1,887,652 | | | | 387,905 | | | $ | 5,695,753 | |
| Shares issued to shareholders in | | | | | | | | | | | | | | | | |
| reinvestment of distributions | | | 15,738 | | | | 248,897 | | | | 15,313 | | | | 221,650 | |
| Shares redeemed | | | (59,493 | ) | | | (932,870 | ) | | | (282,945 | ) | | | (4,111,314 | ) |
| Redemption fee | | | | | | | — | | | | | | | | 56 | |
| Net increase | | | 76,207 | | | $ | 1,203,679 | | | | 120,273 | | | $ | 1,806,145 | |
| | | | | | | | | | | | | | | | | |
| Shares Outstanding: | | | | | | | | | | | | | | | | |
| Beginning of period | | | 1,277,271 | | | | | | | | 1,156,998 | | | | | |
| End of period | | | 1,353,478 | | | | | | | | 1,277,271 | | | | | |
| | | | | | | | | | | | | | | | | |
| | | | | | | | | | | | | | | | | |
| Fixed Income Fund | | | | | | | | | | | | | | | | |
| | | Year Ended | | | | | | | Year Ended | | | | | |
| | | December 31, 2012 | | | | | | | December 31, 2011 | | | | | |
| | | Shares | | | Amount | | | Shares | | | Amount | |
| Shares sold | | | 3,756,490 | | | $ | 42,295,000 | | | | 2,238,192 | | | $ | 24,941,740 | |
| Shares issued to shareholders in | | | | | | | | | | | | | | | | |
| reinvestment of distributions | | | 565,654 | | | | 6,353,109 | | | | 557,529 | | | | 6,158,736 | |
| Shares redeemed | | | (2,132,409 | ) | | | (24,088,709 | ) | | | (1,372,672 | ) | | | (15,260,453 | ) |
| Redemption fee | | | | | | | — | | | | | | | | 15 | |
| Net increase | | | 2,189,735 | | | $ | 24,559,400 | | | | 1,423,049 | | | $ | 15,840,038 | |
| | | | | | | | | | | | | | | | | |
| Shares Outstanding: | | | | | | | | | | | | | | | | |
| Beginning of period | | | 16,136,186 | | | | | | | | 14,713,137 | | | | | |
| End of period | | | 18,325,921 | | | | | | | | 16,136,186 | | | | | |
D. Security Transactions: Purchases and sales of investment securities, other than short-term investments, for the year ended December 31, 2012 were as follows:
| | | Purchases | | | Sales | |
| | | U.S. | | | | | | U.S. | | | | |
| | | Government | | | Other | | | Government | | | Other | |
| LKCM Small Cap Equity Fund | | $ | — | | | $ | 412,289,257 | | | $ | — | | | $ | 432,048,417 | |
| LKCM Small-Mid Cap Equity Fund | | | — | | | | 286,901,528 | | | | — | | | | 78,399,228 | |
| LKCM Equity Fund | | | — | | | | 43,011,893 | | | | — | | | | 14,276,776 | |
| LKCM Balanced Fund | | | — | | | | 4,237,210 | | | | — | | | | 3,030,779 | |
| LKCM Fixed Income Fund | | | — | | | | 83,803,299 | | | | 1,274,660 | | | | 57,799,768 | |
E. Tax Information: At December 31, 2012, the components of accumulated earnings (losses) on a tax basis were as follows:
| | | LKCM | | | LKCM | | | LKCM | | | LKCM | | | LKCM | |
| | | Small Cap | | | Small-Mid Cap | | | Equity | | | Balanced | | | Fixed | |
| | | Equity Fund | | | Equity Fund | | | Fund | | | Fund | | | Income Fund | |
| Cost of Investments | | $ | 688,341,596 | | | $ | 234,230,250 | | | $ | 127,827,560 | | | $ | 16,453,807 | | | $ | 192,857,262 | |
| Gross Unrealized Appreciation | | | 192,757,843 | | | | 21,914,404 | | | | 35,317,824 | | | | 5,409,583 | | | | 11,743,865 | |
| Gross Unrealized Depreciation | | | (24,735,765 | ) | | | (6,164,485 | ) | | | (1,794,039 | ) | | | (90,255 | ) | | | (316,643 | ) |
| Net Unrealized Appreciation | | $ | 168,022,078 | | | $ | 15,749,919 | | | $ | 33,523,785 | | | $ | 5,319,328 | | | $ | 11,427,222 | |
| Undistributed Ordinary Income | | | 120,236 | | | | — | | | | 41,852 | | | | 96 | | | | — | |
| Undistributed Long-Term Capital Gain | | | 6,374,111 | | | | — | | | | 416,415 | | | | — | | | | 570,734 | |
| Total Distributable Earnings | | $ | 6,494,347 | | | $ | — | | | $ | 458,267 | | | $ | 96 | | | $ | 570,734 | |
| Other Accumulated Losses | | $ | — | | | $ | (5,247,877 | ) | | $ | — | | | $ | (272,515 | ) | | $ | — | |
| Total Accumulated Gains | | $ | 174,516,425 | | | $ | 10,502,042 | | | $ | 33,982,052 | | | $ | 5,046,909 | | | $ | 11,997,956 | |
The difference between book-basis and tax-basis unrealized appreciation is attributable primarily to the tax deferral of losses on wash sales and partnerships.
At December 31, 2012, the capital loss carryforwards were as follows:
| | Month/Year Realized | Month/Year Expiring | Short-Term |
| LKCM Small-Mid Cap Equity Fund | Unexpiring Losses | | $5,247,877 |
| LKCM Balanced Fund | 12/2009 | 12/2017 | $ 180,429 |
To the extent the Funds realize future net capital gains, taxable distributions will be reduced by any unused capital loss carryforwards as permitted by the Internal Revenue Code.
During the year ended December 31, 2012, the LKCM Balanced Fund utilized capital loss carryforwards of $239,865.
At December 31, 2012, the LKCM Balanced Fund deferred, on a tax basis, post-October capital losses of $92,086.
The tax components of dividends paid during the periods shown below were as follows:
| | | Year Ended December 31, 2012 | | | Year Ended December 31, 2011 | |
| | | Ordinary | | | Long-Term | | | Ordinary | | | Long-Term | |
| | | Income | | | Capital Gains | | | Income | | | Capital Gains | |
| LKCM Small Cap Equity Fund | | $ | 4,425,589 | | | $ | 62,970,801 | | | $ | — | | | $ | — | |
| LKCM Small-Mid Cap Equity Fund | | | — | | | | — | | | | — | | | | — | |
| LKCM Equity Fund | | | 1,050,235 | | | | 95,025 | | | | 636,154 | | | | 1,598,383 | |
| LKCM Balanced Fund | | | 251,963 | | | | — | | | | 223,616 | | | | — | |
| LKCM Fixed Income Fund | | | 6,096,109 | | | | 1,087,106 | | | | 5,739,348 | | | | 1,188,742 | |
The Trust has adopted financial reporting rules regarding recognition and measurement of tax positions taken or expected to be taken on a tax return. The Trust has reviewed all open tax years and major jurisdictions and concluded that there is no impact on the Funds’ financial position or results of operations. Tax years that remain open to examination by major tax jurisdictions include tax years ended December 31, 2009 through December 31, 2012. There is no tax liability resulting from unrecognized tax benefits relating to uncertain income tax positions taken or expected to be taken on tax returns as of December 31, 2012. The Funds are not aware of any tax positions for which it is reasonably possible that the total amounts of unrecognized tax benefits will significantly change in the next twelve months. If applicable, the Funds would recognize interest accrued related to unrecognized tax benefits in “interest expense” and penalties in “other expense” on the statement of operations.
F. Election of Trustees: On February 21, 2013, the Trust held a Special Meeting of Shareholders to elect Trustees to the Board of Trustees of the Trust. In connection with the Special Meeting of Shareholders, the Trust’s shareholders elected J. Luther King, Jr., H. Kirk Downey, Earle A. Shields, Jr., Richard J. Howell, Steven Purvis and Larry J. Lockwood to serve as trustees to the Board of Trustees of the Trust.
The following table illustrates the results of the voting with respect to the election of Trustees:
| Trustee | For | Withheld |
| J. Luther King Jr. | 83,209,072 | 2,032,811 |
| H. Kirk Downey | 83,238,239 | 2,003,646 |
| Earle A. Shields, Jr. | 83,208,667 | 2,033,217 |
| Richard J. Howell | 83,248,488 | 1,993,396 |
| Steven R. Purvis | 80,694,422 | 4,547,461 |
| Larry J. Lockwood | 84,999,777 | 242,107 |
G. Subsequent Events: In preparing these financial statements, the Trust has evaluated events after December 31, 2012 that would require adjustment to or additional disclosure in these financial statements.
The Board of Trustees of the Trust and the Board of Directors of Armstrong Associates, Inc. (“Armstrong”) have approved an agreement and plan of reorganization and dissolution between Armstrong and the Trust, on behalf of the LKCM Equity Fund (the “Plan”). Under the Plan, Armstrong would transfer all of its assets to the LKCM Equity Fund, and the LKCM Equity Fund would assume all of the liabilities of Armstrong, in exchange solely for Institutional Class shares of the LKCM Equity Fund, following which Armstrong would distribute those LKCM Equity Fund shares pro rata to its shareholders and dissolve. The Plan must be approved by the shareholders of Armstrong. The Trust currently expects that Armstrong will hold a special meeting of its shareholders to consider the Plan during the second quarter of 2013.
| Report of Independent Registered Public Accounting Firm |
To the Shareholders and Board of Trustees of LKCM Funds:
We have audited the accompanying statements of assets and liabilities, including the schedules of investments, of LKCM Funds (the “Funds”) comprising the LKCM Small Cap Equity Fund, LKCM Equity Fund, LKCM Balanced Fund, LKCM Fixed Income Fund, and LKCM Small-Mid Cap Equity Fund as of December 31, 2012, and the related statements of operations, statements of changes in net assets, and financial highlights for the periods presented. These financial statements and financial highlights are the responsibility of the Funds’ management. Our responsibility is to express an opinion on these financial statements and financial highlights based on our audits.
We conducted our audits in accordance with the standards of the Public Company Accounting Oversight Board (United States). Those standards require that we plan and perform the audit to obtain reasonable assurance about whether the financial statements and financial highlights are free of material misstatement. The Funds are not required to have, nor were we engaged to perform, an audit of their internal control over financial reporting. Our audits included consideration of internal control over financial reporting as a basis for designing audit procedures that are appropriate in the circumstances, but not for the purpose of expressing an opinion on the effectiveness of the Funds’ internal control over financial reporting. Accordingly, we express no such opinion. An audit also includes examining, on a test basis, evidence supporting the amounts and disclosures in the financial statements, assessing the accounting principles used and significant estimates made by management, as well as evaluating the overall financial statement presentation. Our procedures included confirmation of securities owned as of December 31, 2012, by correspondence with the custodian and brokers. We believe that our audits provide a reasonable basis for our opinion.
In our opinion, the financial statements and financial highlights referred to above present fairly, in all material respects, the financial position of each of the portfolios constituting the LKCM Funds as of December 31, 2012, and the results of their operations, the changes in their net assets, and the financial highlights for the periods indicated in the first paragraph, in conformity with accounting principles generally accepted in the United States of America.
Milwaukee, Wisconsin
February 27, 2013
| LKCM Funds |
| Additional Information | |
December 31, 2012
Availability of Proxy Voting Information: A description of the policies and procedures that the Funds use to determine how to vote proxies relating to their portfolio securities, as well as the proxy voting record, is available without charge, upon request, by calling toll-free 1-800-688-LKCM or on the SEC website at http://www.sec.gov.
The actual voting records relating to portfolio securities during the twelve month period ended June 30 (as filed with the SEC on Form
N-PX) are available without charge, upon request, by calling the Funds toll free at 1-800-688-LKCM or by accessing the SEC’s website at www.sec.gov.
Availability of Quarterly Portfolio Schedule: The Funds’ are required to file complete schedules of portfolio holdings with the SEC for the first and third fiscal quarters on Form N-Q. Once filed, the Funds’ Form N-Q is available without charge upon request on the SEC’s website(http://www.sec.gov) and may be available by calling 1-800-688-LKCM. You can also obtain copies of Form N-Q by (i) visiting the SEC’s Public Reference Room in Washington, DC (information on the operation of the Public Reference Room may be obtained by calling 1-800-SEC-0330); (ii) sending your request and a duplicating fee to the SEC’s Public Reference Room, Washington, DC 20549; or (iii) sending your request electronically to publicinfosec.gov.
Information about the Funds’ Trustees:
The business and affairs of the Funds are managed under the direction of the Funds’ Board of Trustees. Information pertaining to the Trustees of the Funds is set forth below. The Statement of Additional Information includes additional information about the Funds’ Trustees and officers and is available, without charge, upon request by calling 1-800-688-LKCM.
| | | | | | |
| | | Term of | | Number of | |
| | | Office & | | Portfolios in | |
| | Position(s) | Length | | Fund Complex | Other |
| Name, Address | Held with | of Time | Principal Occupation | Overseen | Directorships |
| and Age | the Trust | Served(1) | During Past Five Years | by Trustee | Held by Trustee |
| Disinterested Trustees: | | | | | |
| H. Kirk Downey | Chairman of | Since 2005 | President and CEO, Texas | 8 | Non-Executive Chairman |
| 301 Commerce Street | the Board | | Systems, LLC and CEO, Texas | | of the Board of AZZ |
| Suite 1600 | of Trustees | | learning systems LLC since 1999; | | Incorporated, |
| Fort Worth, TX 76102 | | | Dean, M.J. Neeley School of | | (a manufacturing |
| Year of Birth: 1942 | Trustee | Since 1994 | Business, Texas Christian University | | company). |
| | | | School from 1987 to 1999. | | |
| | | | | | |
| Earle A. Shields, Jr. | Trustee | Since 1994 | Consultant; formerly Consultant | 8 | Priests Pension Fund |
| 301 Commerce Street | | | for NASDAQ Corp. and Vice | | of the Catholic Diocese |
| Suite 1600 | | | President, Merrill Lynch & Co., Inc. | | of Fort Worth, Lay |
| Fort Worth, TX 76102 | | | | | Workers Pension Fund |
| Year of Birth: 1920 | | | | | of the Catholic Diocese |
| | | | | | of Fort Worth, St. Joseph |
| | | | | | Health Care Trust, Catholic |
| | | | | | Schools Trust and Catholic |
| | | | | | Foundation of North Texas. |
| | | | | | |
| Richard J. Howell | Trustee | Since 2005 | CPA; Adjunct Faculty at SMU | 8 | Red Robin Gourmet |
| 301 Commerce Street | | | Cox School of Business from | | Burgers, Inc. |
| Suite 1600 | Chairman of | Since 2008 | 2004 to 2009; Consulting Services, | | |
| Fort Worth, TX 76102 | the Audit and | | since 2002; Audit Partner, Arthur | | |
| Year of Birth: 1942 | Compliance | | Andersen LLP from 1974 to 2002. | | |
| | Committee | | | | |
| | | | | | |
| Larry J. Lockwood | Trustee | Since 2013 | C.R. Williams Professor of Finance, | 8 | N/A |
| 301 Commerce Street | | | Stan Block Endowed Chair in | | |
| Suite 1600 | | | Finance, Department of Finance, | | |
| Fort Worth, TX 76102 | | | Neeley School of Business, Texas | | |
| Year of Birth: 1953 | | | Christian University since 1994. | | |
| | | | | | |
| Interested Trustees: | | | | | |
J. Luther King, Jr.(2) | Trustee, | Since 1994 | Chairman, President and Director, | 8 | 4K Land & Cattle |
| 301 Commerce Street | President and | | Luther King Capital Management | | Company (ranching), |
| Suite 1600 | Chief Executive | | Corporation since 1979. | | Hunt Forest Products |
| Fort Worth, TX 76102 | Officer | | | | (lumber), Southwestern |
| Year of Birth: 1940 | | | | | Exposition & Livestock |
| | | | | | (livestock), Southwest |
| | | | | | JLK Corporation |
| | | | | | (management company), |
| | | | | | Texas Christian |
| | | | | | University, Texas |
| | | | | | Southwestern Cattleraisers |
| | | | | | Foundation (livestock), |
| | | | | | Tyler Technologies |
| | | | | | (information management |
| | | | | | company for government |
| | | | | | agencies), King Ranch, |
| | | | | | Inc. (ranching), and Amon |
| | | | | | Carter Museum of |
| | | | | | American Art. |
(1) Each Trustee holds office during the lifetime of the Trust until that individual resigns, retires or is otherwise removed or replaced.
(2) Mr. King and Mr. Purvis are “interested persons” of the Trust (as defined in the 1940 Act) because of their affiliation with the Adviser.
Information about the Funds’ Trustees, Continued
| | | | | | |
| | | Term of | | Number of | |
| | | Office & | | Portfolios in | |
| | Position(s) | Length | | Fund Complex | Other |
| Name, Address | Held with | of Time | Principal Occupation | Overseen | Directorships |
| and Age | the Trust | Served(1) | During Past Five Years | by Trustee | Held by Trustee |
| Interested Trustees, Continued: | | | | | |
Steve R. Purvis(2) | Trustee | Since 2013 | Principal, Luther King Capital | 8 | N/A |
| 301 Commerce Street | | | Management since 2003, Vice | | |
| Suite 1600 | Vice President | Since 2000 | President and Portfolio Adviser | | |
| Fort Worth, TX 76102 | | | Luther King Capital Management | | |
| Year of Birth: 1964 | | | since 1996. | | |
| | | | | | |
| | | | | | |
| | | Term of | |
| | | Office & | |
| | Position(s) | Length | |
| Name, Address | Held with | of Time | Principal Occupation |
| and Age | the Trust | Served(1) | During Past Five Years |
| Officers: | | | |
| J. Luther King, Jr. | Trustee, | Since 1994 | Chairman, President and Director, Luther King Capital Management |
| 301 Commerce Street | President and | | Corporation since 1979. |
| Suite 1600 | Chief Executive | | |
| Fort Worth, TX 76102 | Officer | | |
| Year of Birth: 1940 | | | |
| | | | |
| Paul W. Greenwell | Vice President | Since 1996 | Principal, Luther King Capital Management since 1986, |
| 301 Commerce Street | | | Vice President and Portfolio Manager, Luther King Capital |
| Suite 1600 | | | Management since 1983. |
| Fort Worth, TX 76102 | | | |
| Year of Birth: 1950 | | | |
| | | | |
| Richard Lenart | Secretary and | Since 2006 | Luther King Capital Management since 2005. |
| 301 Commerce Street | Treasurer | | |
| Suite 1600 | | | |
| Fort Worth, TX 76102 | | | |
| Year of Birth: 1966 | | | |
| | | | |
| Steven R. Purvis | Trustee | Since 2013 | Principal, Luther King Capital Management since 2003, |
| 301 Commerce Street | | | Vice President and Portfolio Manager, Luther King Capital |
| Suite 1600 | Vice President | Since 2000 | Management since 1996. |
| Fort Worth, TX 76102 | | | |
| Year of Birth: 1964 | | | |
| | | | |
| Jacob D. Smith | Chief | Since 2010 | Vice President, General Counsel and Chief Compliance |
| 301 Commerce Street | Financial | | Officer, Luther King Capital Management since 2006. |
| Suite 1600 | Officer | | |
| Fort Worth, TX 76102 | | | |
| Year of Birth: 1974 | Chief | Since 2006 | |
| | Compliance | | |
| | Officer | | |
(1) Each Trustee holds office during the lifetime of the Trust until that individual resigns, retires or is otherwise removed or replaced.
(2) Mr. King and Mr. Purvis are “interested persons” of the Trust (as defined in the 1940 Act) because of their affiliation with the Adviser.
PRIVACY NOTICE
Our Commitment to Your Privacy
At LKCM Funds, we are committed to safeguarding the confidentiality and privacy of personal information about our shareholders. This privacy notice describes the policies and procedures we have implemented to protect the privacy of your personal information as well as the sources through which we may obtain personal information about you.
How We Protect Your Personal Information
Protecting your personal information is an important priority at LKCM Funds. Accordingly, we have implemented policies and procedures designed to safeguard your personal information, such as your social security number, portfolio and investment history, account numbers, account balances, and contact information from unauthorized access. Pursuant to these policies and procedures, we maintain various physical, technological, and administrative safeguards to protect the security and confidentiality of your personal information, and we adapt these safeguards to respond to evolving technological and other standards.
We do not disclose nonpublic personal information about you to nonaffiliated third parties, except as authorized by you or your representatives, as required or permitted by law, or to certain nonaffiliated third parties, such as custodians, brokers, auditors, attorneys, or proxy administrators, that assist us in providing investment management services to you or on your behalf.
How We Obtain Your Personal Information
We collect nonpublic personal information about you from various sources, including documents and other information that you or your representatives provide to us, communications that we have with you or your representatives, and documents and other information related to your investments or portfolio experience with us.
Please do not hesitate to contact our Chief Compliance Officer if you have any questions regarding the measures we have implemented to protect the privacy of your personal information.
U.S. Bancorp Fund Services, LLC
P.O. Box 701
Milwaukee, WI 53201-0701
LKCM FUNDS
P.O. Box 701
Milwaukee, WI 53201-0701
Officers and Trustees
| J. Luther King, Jr., CFA, CIC | H. Kirk Downey | Larry J. Lockwood |
| Trustee, President | Chairman of the Board | Trustee |
| | | |
| Paul W. Greenwell | Richard J. Howell | Richard Lenart |
| Vice President | Trustee | Secretary & Treasurer |
| | | |
| Steven R. Purvis, CFA | Earle A. Shields, Jr. | Jacob D. Smith |
| Trustee, Vice President | Trustee | Chief Financial Officer |
| | Chief Compliance Officer | |
Investment Adviser
Luther King Capital Management Corporation
301 Commerce Street, Suite 1600
Fort Worth, TX 76102
Administrator, Transfer Agent, Dividend
Paying Agent & Shareholder Servicing Agent
U.S. Bancorp Fund Services, LLC
P.O. Box 701
Milwaukee, WI 53201-0701
Custodian
U.S. Bank, N.A.
1555 N. River Center Drive, Suite 302
Milwaukee, WI 53212
Independent Registered Public Accounting Firm
Deloitte & Touche LLP
555 E. Wells St., Suite 1400
Milwaukee, WI 53202
Distributor
Quasar Distributors, LLC
615 E. Michigan Street
Milwaukee, WI 53202
LKCM Aquinas Value Fund
LKCM Aquinas Growth Fund
LKCM Aquinas Small Cap Fund
Annual Report
December 31, 2012
Dear Fellow Shareholders:
We report the following performance information for the LKCM Aquinas Funds:
| | | | | | | Five Year | |
| | | | | | One Year | Average | Avg. Annual |
| | | | Net | Gross | Total | Annualized | Total Return |
| | Inception | NAV @ | Expense | Expense | Return Ended | Return Ended | Since |
| Funds | Dates | 12/31/12 | Ratio*, ** | Ratio** | 12/31/12 | 12/31/12 | Incept.*** |
| LKCM Aquinas Value Fund | 7/11/05 | $14.18 | 1.51% | 1.56% | 12.01% | 1.90% | 4.79% |
Russell 1000 Value Index(1) | | | | | 17.51% | 0.59% | 3.58% |
| LKCM Aquinas Growth Fund | 7/11/05 | $18.53 | 1.51% | 1.61% | 10.52% | 2.62% | 3.71% |
Russell 1000 Growth Index(2) | | | | | 15.26% | 3.12% | 5.49% |
| LKCM Aquinas Small Cap Fund | 7/11/05 | $7.34 | 1.51% | 2.45% | 8.16% | 4.23% | 5.03% |
Russell 2000 Index(3) | | | | | 16.35% | 3.56% | 4.79% |
Performance data quoted represents past performance and does not guarantee future results. The investment return and principal value of an investment will fluctuate so that an investor’s shares, when redeemed, may be worth more or less than the original cost. Current performance of the Fund may be lower or higher than the performance quoted. Performance data current to the most recent month end may be obtained by calling 1-800-423-6369. The Funds impose a 1.00% redemption fee on shares held less than 30 days. If reflected, the fee would reduce performance shown.
| * | The Adviser has contractually agreed to waive all or a portion of its management fee and/or reimburse the Fund to maintain designated expense ratios through April 30, 2013. Investment performance reflects fee waivers, if any, in effect. In the absence of such waivers, total return would be reduced. Investment performance is based upon the net expense ratio. |
| ** | Expense ratios above are as of December 31, 2011, the Funds’ prior fiscal year end, as reported in the Funds’ most recent prospectus. Expense ratios reported for other periods in the financial highlights of this report may differ. |
| *** | On July 11, 2005, the Aquinas Funds merged into the LKCM Aquinas Funds. Due to the change in adviser and investment technique, performance is being quoted for the period after the merger. |
| (1) | The Russell 1000 Value Index is an unmanaged index which measures the performance of those Russell 1000 companies with lower price-to-book ratios and lower forecasted growth values. |
| (2) | The Russell 1000 Growth Index is an unmanaged index which measures the performance of those Russell 1000 companies with higher price-to-book ratios and higher forecasted growth values. |
| (3) | The Russell 2000 Index is an unmanaged index which measures the performance of the 2000 smallest companies in the Russell 3000 Index. |
Note: These indices defined above are not available for direct investment.
2012 Review
In many ways, the storyline of 2012 was the myopic focus on “tail risk,” which generally refers to events that are not likely, but are possible. A year ago the list of tail risks included a hard economic landing in China, countries being expelled from the European Monetary Union, war in the Middle East and a disastrous domestic fiscal crunch. While none of these events came to pass, there was continuous concern of calamity around the next corner. Not unexpectedly, a pattern developed in the equity market where a relief rally ensued as the specter of each crisis faded. With the looming debt ceiling debate and sequestration onset scheduled in the first quarter of 2013, this pattern appears likely to continue in the short-run.
Early in 2012, global manufacturing data were better than expected, which helped fuel a strong equity market rally during the first quarter. The second quarter of 2012 was marked by a stall in manufacturing data, a cut in Chinese economic growth expectations and an increasing probability that Greece would exit the European Economic and Monetary Union. Last year marked the third consecutive year in which the equity market weakened during the summer over concern of sagging economic growth. A combination of further monetary easing by the Federal Reserve Bank and the European Central Bank in the third quarter of 2012 helped increase equity prices.
Beginning in the fall, our research revealed an increasing tendency for companies to delay significant capital decisions until resolution of the “fiscal cliff”. Although the most recent readings of manufacturing data are mixed, our research indicates we may see positive signs that manufacturing activity is improving early in 2013. We believe there are already early signs of a potential mini-renaissance in U.S. manufacturing as companies begin to bring many of these jobs back onshore. The shift to Asian manufacturing in the 1990’s was driven by cheaper labor and occurred at a time when oil was closer to $25 per barrel rather than $100 per barrel. Companies are citing time to market, quality, high energy costs and lower labor contribution to products as the impetus to bring manufacturing back to the United States.
We believe the quasi-resolution of the fiscal cliff reflected the current Washington D.C. model to reach for the lowest common denominator while deferring substantive progress. While a bevy of tax changes prevented an increase in tax rates across the board, Congress fell short of addressing spending cuts including sequestration. We believe these crucial items may instead be held hostage to the federal debt ceiling debate, which is expected to occur over the first few months of 2013.
2013 Outlook
We believe the global economy is entering 2013 with a slight increase in momentum. The increased activity appears to be driven by the corporate sector, which slowed in the middle of 2012 as concerns over the EuroZone and China intensified. Domestically, the corporate sector has been gripped by uncertainty around the Presidential election, fiscal cliff and tax issues. Policy actions in China have bolstered its economic growth forecast for 2013 and the European Central Bank’s actions in the second half of last year appear to have temporarily arrested further deterioration in the economic outlook for the EuroZone. Offsetting the benefit of the modest uptick in global growth are the home-grown issues of higher payroll taxes and a patchwork of additional tax increases. Our current forecast suggests that real Gross Domestic Product will grow between 2.0% and 2.4% in 2013, although we expect the growth to be back-end loaded.
We expect the negative real interest rate environment will remain an economic tailwind in 2013. Our base case is that the Federal Reserve’s conditional thresholds for higher interest rates of unemployment below 6.5% and inflation above 2.5% will not be met in 2013. This is not a deviation from the consensus forecast of many market observers. However, we stand apart from consensus in that we would not be surprised if capital markets began to focus more intently on this issue and discount higher rates towards the end of 2013. Current data such as average hourly earnings, excess manufacturing capacity and low velocity of the money stock suggest that inflation is not a near-term threat. With global growth accelerating, particularly with better economic data from China, we believe inflation expectations could rise in the marketplace during 2013 even though there are few indications of inflationary pressure today.
Although we have previously mentioned housing as a positive force for economic growth, we remain in the early stages of this development. We believe home prices have stabilized and begun to move higher. The monthly supply of new homes was approximately 4.9 months at year-end, well below the long-term average. The 30-year conventional mortgage rate rests at all-time lows. In our view, housing has the potential to add 1.0% growth to Gross Domestic Product in 2013. While this may represent a best case scenario, we believe there is little question that housing will positively impact the economy in 2013 to a greater degree than 2012.
Housing continues to positively impact consumer sentiment, and the wealth effect of housing helps sustain our continued outlook for positive consumer spending. Examining the domestic economy, we find that there has been little net deleveraging. However, there has been a significant shift of leverage from the private to the public sector. This has contributed to robust consumer spending, although the 2% payroll tax cut expiration on January 1, 2013, translates directly into a tax increase on discretionary income for a majority of paycheck earners in the country. Consistent with the nation’s approach to many difficult issues, Congress opted to bolster the consumer at the expense of the nation’s fiscal situation. However, this is largely an exercise in semantics. The private sector remains on the hook for public debt and ultimately pays the price through a combination of higher taxes, reduced services or inflation.
Although corporate profits registered a new high in 2012, we believe that it was valuation expansion which drove the equity market return. Earnings for the Standard & Poor’s 500 Index grew an estimated 3.0% in 2012 compared to the index return of 16.0% for the year. Although the Standard & Poor’s 500 Index’s earnings multiple of approximately 13.8X at year-end, based on trailing twelve month earnings, represents some multiple expansion in 2012, we are comfortable with the current market valuation. Our forecast for 2013 is for higher earnings growth, but less multiple expansion compared with 2012. The greatest risk to our outlook would be disappointing corporate earnings resulting from a combination of weaker consumer spending than expected, follow-on effects of the fiscal cliff debate and a surge in inflation.
We continue to anticipate a significant reallocation from bond funds into equity funds. Over the past four years, investors have plowed more than $1 trillion into bond mutual funds while withdrawing $500 billion from domestically oriented equity mutual funds. We believe this action is simply a reflection of stock price action from October 2007 through the March 2009 low in the equity market. However, since January 2009, the Standard & Poor’s 500 Index has posted a 14% compounded annual return, or roughly double the average of the past fifty years. In contrast, the compounded annual return on 10-Year U.S. Treasury bonds is 4.0% over this same time period. Given our view that equity valuations are attractive and bond valuations are less attractive, we maintain our cautious stance on the bond market. When rates begin to rise, there is likely to be a large asset allocation shift from bonds to equities. This may not be a 2013 event, but if our view on growing inflationary concerns unfolds in 2013 we think the markets will move meaningfully closer to reversing the equities-to-bonds money flow.
Catholic Values Investing
The LKCM Aquinas Funds practice socially responsible investing within the framework provided by the United States Conference of Catholic Bishop’s (“USCCB”) Socially Responsible Investing Guidelines. The LKCM Aquinas Funds follow these guidelines by using an approach that focuses on Catholic values screening of portfolio companies, proactive dialogue with those companies whose practices conflict with the guidelines, and potential exclusion of those companies that are unwilling to alter their practices over time. We exclude a number of companies from possible investment that do not meet our standards for Catholic values investing. We monitor portfolio companies selected for the LKCM Aquinas Funds for policies on various issues set out in the USCCB guidelines. If investments are made in companies whose policies are inconsistent with the USCCB guidelines, we may attempt to influence the company’s policies through proactive dialogue and other efforts.
LKCM Aquinas Small Cap Fund
The LKCM Aquinas Small Cap Fund underperformed the Russell 2000 Index during the year ended December 31, 2012. The Fund’s underperformance relative to the benchmark primarily resulted from our stock selection decisions. Stock selection in the Consumer Discretionary, Financials, Materials and Industrials sectors detracted from the Fund’s relative performance, while our stock selection in the Healthcare sector benefited the Fund’s relative performance. Our decision to overweight the Consumer Discretionary sector benefited the Fund’s relative performance, while our underweight position in the Financials sector and overweight position in the Information Technology sector detracted from the Fund’s relative performance. Overall, we believe 2012 was a year in which the market was not interested in the companies identified by our small-cap investment strategy, as our investments did not appreciate to the same degree as the benchmark.
| | Total Return Year Ended |
| | December 31, 2012 |
| LKCM Aquinas Small Cap Fund | 8.16% |
| Russell 2000 Index | 16.35% |
LKCM Aquinas Growth Fund
The LKCM Aquinas Growth Fund underperformed its benchmark, the Russell 1000 Growth Index, during the year ended December 31, 2012. The Fund’s relative performance benefited from stock selection in the Materials and Consumer Discretionary sectors, although stock selection in the Information Technology, Energy and Healthcare sectors detracted from relative performance. Our decision to overweight the Energy sector benefited the Fund’s relative performance, while our decision to underweight the Healthcare sector detracted from the Fund’s relative performance. We believe the Fund maintains a diversified portfolio of quality growth companies that have the Fund well-positioned during the upcoming year.
| | Total Return Year Ended |
| | December 31, 2012 |
| LKCM Aquinas Growth Fund | 10.52% |
| Russell 1000 Growth Index | 15.26% |
LKCM Aquinas Value Fund
The LKCM Aquinas Value Fund underperformed its benchmark, the Russell 1000 Value Index, during the year ended December 31, 2012. The Fund’s relative performance benefited from stock selection in the Energy and Materials sectors, while stock selection in the Financials, Industrials and Healthcare sectors detracted from relative performance. Our decision to overweight the Consumer Discretionary sector enhanced the Fund’s relative performance, while our decisions to underweight the Financials sector and overweight the Information Technology sector detracted the Fund’s relative performance. We continue to believe the Fund is well-positioned with a strong emphasis on high quality companies with reasonable valuations relative to their earnings growth rates, which we believe can provide an opportunity to add value for the Fund and its shareholders during the upcoming year.
| | Total Return Year Ended |
| | December 31, 2012 |
| LKCM Aquinas Value Fund | 12.01% |
| Russell 1000 Value Index | 17.51% |
| | |
J. Luther King, Jr., CFA, CIC
February 1, 2013
The information provided herein represents the opinion of J. Luther King, Jr., CFA, CIC and is not intended to be a forecast of future events, a guarantee of future results, nor investment advice.
Please refer to the Schedule of Investments found on pages 11-16 of the report for more information on Fund holdings. Fund holdings and sector allocations are subject to change and are not recommendations to buy or sell any securities.
Mutual fund investing involves risk. Principal loss is possible. Past performance is not a guarantee of future results. Small and medium capitalization funds typically carry additional risks, since smaller companies generally have a higher risk of failure, and, historically, their stocks have experienced a greater degree of market volatility than stocks on average. Since the Funds practice socially responsible investing within the framework provided by the United States Conference of Catholic Bishop’s socially responsible investment guidelines, the Funds may forego a profitable investment opportunity or sell a security when it may be disadvantageous to do so.
Current and future portfolio holdings are subject to risk.
Diversification does not assure a profit or protect against a loss in a declining market.
Earnings growth is not a measure of the Fund’s future performance.
The S&P 500 Index is an unmanaged capitalization-weighted index of 500 stocks designed to measure performance of the broad domestic economy through change in the aggregate market value of 500 stocks representing all major industries. You cannot invest directly in an index.
Earnings multiple: The earnings multiple of a stock, also called the price/earnings (P/E) ratio, is the share price divided by the earnings per share. The earnings multiple is often based on the prior twelve months of earnings data.
Must be preceded or accompanied by a prospectus.
Quasar Distributors, LLC, distributor.
PERFORMANCE:
The following information illustrates the historical performance of LKCM Aquinas Value Fund as of December 31, 2012 compared to the Fund’s representative market indices.
Performance data quoted represents past performance; past performance does not guarantee future results. The graph and table do not reflect the deduction of taxes that a shareholder would pay on Fund distributions or the redemption of Fund shares. The investment return and principal value of an investment will fluctuate so that an investor’s shares, when redeemed, may be worth more or less than their original cost. Current performance of the Fund may be lower or higher than the performance quoted. Performance data current to the most recent month end may be obtained by calling 1-800-423-6369.
An index is an unmanaged portfolio and does not trade or incur any expenses. One can not invest in an unmanaged index.
AVERAGE ANNUAL TOTAL RETURN (Periods Ended December 31, 2012)
| | Past | Past | Past | Since |
| | 1 Year | 3 Years(1) | 5 Years(1) | Inception(1)(2) |
| LKCM Aquinas Value Fund | 12.01% | 9.68% | 1.90% | 4.79% |
| Russell 1000 Value Index | 17.51% | 10.86% | 0.59% | 3.58% |
| Lipper Large-Cap Value Funds Index | 15.87% | 8.61% | 0.17% | 3.49% |
| (2) | The assets of the Aquinas Value Fund were acquired by the LKCM Aquinas Value Fund on July 11, 2005. At the time of the reorganization, the Adviser also changed from Aquinas Investment Advisers, Inc. to Luther King Capital Management Corporation. |
A HYPOTHETICAL $10,000 INVESTMENT IN LKCM AQUINAS VALUE FUND
(for the period from July 11, 2005 through December 31, 2012)
The Russell 1000 Value Index is an unmanaged index consisting of those Russell 1000 companies with lower price-to-book ratios and lower forecasted growth values.
The Lipper Large-Cap Value Funds Index is an index of large cap value mutual funds tracked by Lipper, Inc.
PERFORMANCE:
The following information illustrates the historical performance of LKCM Aquinas Growth Fund as of December 31, 2012 compared to the Fund’s representative market indices.
Performance data quoted represents past performance; past performance does not guarantee future results. The graph and table do not reflect the deduction of taxes that a shareholder would pay on Fund distributions or the redemption of Fund shares. The investment return and principal value of an investment will fluctuate so that an investor’s shares, when redeemed, may be worth more or less than their original cost. Current performance of the Fund may be lower or higher than the performance quoted. Performance data current to the most recent month end may be obtained by calling 1-800-423-6369.
An index is an unmanaged portfolio and does not trade or incur any expenses. One can not invest in an unmanaged index.
AVERAGE ANNUAL TOTAL RETURN (Periods Ended December 31, 2012)
| | Past | Past | Past | Since |
| | 1 Year | 3 Years(1) | 5 Years(1) | Inception(1)(2) |
| LKCM Aquinas Growth Fund | 10.52% | 9.35% | 2.62% | 3.71% |
| Russell 1000 Growth Index | 15.26% | 11.35% | 3.12% | 5.49% |
| Lipper Large-Cap Growth Funds Index | 15.92% | 9.02% | 1.01% | 4.40% |
| (2) | The assets of the Aquinas Growth Fund were acquired by the LKCM Aquinas Growth Fund on July 11, 2005. At the time of the reorganization, the Adviser also changed from Aquinas Investment Advisers, Inc. to Luther King Capital Management Corporation. |
A HYPOTHETICAL $10,000 INVESTMENT IN LKCM AQUINAS GROWTH FUND
(for the period from July 11, 2005 through December 31, 2012)
The Russell 1000 Growth Index consists of those Russell 1000 companies with higher price-to-book ratios and higher forecasted growth values.
The Lipper Large-Cap Growth Funds Index is an index of large cap growth mutual funds tracked by Lipper, Inc.
PERFORMANCE:
The following information illustrates the historical performance of LKCM Aquinas Small Cap Fund as of December 31, 2012 compared to the Fund’s representative market indices.
Performance data quoted represents past performance; past performance does not guarantee future results. The graph and table do not reflect the deduction of taxes that a shareholder would pay on Fund distributions or the redemption of Fund shares. The investment return and principal value of an investment will fluctuate so that an investor’s shares, when redeemed, may be worth more or less than their original cost. Current performance of the Fund may be lower or higher than the performance quoted. Performance data current to the most recent month end may be obtained by calling 1-800-423-6369.
An index is an unmanaged portfolio and does not trade or incur any expenses. One can not invest in an unmanaged index.
AVERAGE ANNUAL TOTAL RETURN (Periods Ended December 31, 2012)
| | Past | Past | Past | Since |
| | 1 Year | 3 Years(1) | 5 Years(1) | Inception(1)(2) |
| LKCM Aquinas Small Cap Fund | 8.16% | 14.83% | 4.23% | 5.03% |
| Russell 2000 Index | 16.35% | 12.25% | 3.56% | 4.79% |
| Lipper Small-Cap Core Funds Index | 15.94% | 11.92% | 3.96% | 5.72% |
| (2) | The assets of the Aquinas Small-Cap Fund were acquired by the LKCM Aquinas Small Cap Fund on July 11, 2005. At the time of the reorganization, the Adviser also changed from Aquinas Investment Advisers, Inc. to Luther King Capital Management Corporation. |
A HYPOTHETICAL $10,000 INVESTMENT IN LKCM AQUINAS SMALL CAP FUND
(for the period from July 11, 2005 through December 31, 2012)
The Russell 2000 Index is an unmanaged index consisting of the 2,000 smallest companies in the Russell 3000 Index.
The Lipper Small-Cap Core Funds Index is an index of small cap core mutual funds tracked by Lipper, Inc.
LKCM Aquinas Funds Expense Example — December 31, 2012
As a shareholder of the Funds, you incur two types of costs: (1) transaction costs, including redemption fees; and (2) ongoing costs, including management fees, distribution and/or service (12b-1) fees and other Fund expenses. This Example is intended to help you understand your ongoing costs (in dollars) of investing in the Funds and to compare these costs with the ongoing costs of investing in other mutual funds. The Example is based on an investment of $1,000 invested at the beginning of the period and held for the entire period (7/1/12 - 12/31/12).
ACTUAL EXPENSES
The first line of the tables below provides information about actual account values and actual expenses. Although the Funds charge no sales load, you will be assessed fees for outgoing wire transfers, returned checks and stop payment orders at prevailing rates charged by U.S. Bancorp Fund Services, LLC, the Funds’ transfer agent. If you request that a redemption be made by wire transfer, currently a $15 fee is charged by the Funds’ transfer agent. You will be charged a redemption fee equal to 1.00% of the net amount of the redemption if you redeem your shares of the LKCM Aquinas Value, Aquinas Growth and Aquinas Small Cap Funds within 30 days of purchase. To the extent the Funds invest in shares of other investment companies as part of their investment strategies, you will indirectly bear your proportionate share of any fees and expenses charged by the underlying funds in which the Funds invest in addition to the expenses of the Funds. Actual expenses of the underlying funds are expected to vary among the various underlying funds. These expenses are not included in the example below. The example below includes management fees, registration fees and other expenses. However, the example below does not include portfolio trading commissions and related expenses and other extraordinary expenses as determined under generally accepted accounting principles. You may use the information in this line, together with the amount you invested, to estimate the expenses that you paid over the period. Simply divide your account value by $1,000 (for example, an $8,600 account value divided by $1,000 = 8.6), then multiply the result by the number in the first line under the heading entitled “Expenses Paid During Period” to estimate the expenses you paid on your account during this period.
HYPOTHETICAL EXAMPLES FOR COMPARISON PURPOSES
The second line of the tables below provides information about hypothetical account values and hypothetical expenses based on the Funds’ actual expense ratios and an assumed rate of return of 5% per year before expenses, which are not the Funds’ actual returns. The hypothetical account values and expenses may not be used to estimate the actual ending account balance or expenses you paid for the period. You may use this information to compare the ongoing costs of investing in the Funds and other funds. To do so, compare this 5% hypothetical example with the 5% hypothetical examples that appear in the shareholder reports of the other funds. Please note that the expenses shown in the table are meant to highlight your ongoing costs only and do not reflect any transactional costs, such as redemption fees. Therefore, the second line of the table is useful in comparing ongoing costs only, and will not help you determine the relative total costs of owning different funds. In addition, if these transactions costs were included, your costs would have been higher.
| | LKCM Aquinas Value Fund |
| | Beginning | Ending | Expenses Paid |
| | Account Value | Account Value | During Period* |
| | 7/1/12 | 12/31/12 | 7/1/12 – 12/31/12 |
| Actual | $1,000.00 | $1,093.40 | $7.89 |
| Hypothetical (5% return before expense) | $1,000.00 | $1,017.60 | $7.61 |
| * | Expenses are equal to the Fund’s annualized net expense ratio of 1.50%, multiplied by the average account value over the period, multiplied by 184/366 to reflect the one-half year period. |
| | LKCM Aquinas Growth Fund |
| | Beginning | Ending | Expenses Paid |
| | Account Value | Account Value | During Period* |
| | 7/1/12 | 12/31/12 | 7/1/12 – 12/31/12 |
| Actual | $1,000.00 | $1,052.80 | $7.74 |
| Hypothetical (5% return before expense) | $1,000.00 | $1,017.60 | $7.61 |
| * | Expenses are equal to the Fund’s annualized net expense ratio of 1.50%, multiplied by the average account value over the period, multiplied by 184/366 to reflect the one-half year period. |
| | LKCM Aquinas Small Cap Fund |
| | Beginning | Ending | Expenses Paid |
| | Account Value | Account Value | During Period* |
| | 7/1/12 | 12/31/12 | 7/1/12 – 12/31/12 |
| Actual | $1,000.00 | $1,037.80 | $7.68 |
| Hypothetical (5% return before expense) | $1,000.00 | $1,017.60 | $7.61 |
| * | Expenses are equal to the Fund’s annualized net expense ratio of 1.50%, multiplied by the average account value over the period, multiplied by 184/366 to reflect the one-half year period. |
ALLOCATION OF PORTFOLIO HOLDINGS — LKCM Aquinas Funds — December 31, 2012
Percentages represent market value as a percentage of total investments.
| LKCM Aquinas Value Fund | LKCM Aquinas Growth Fund |
| | |
 |  |
| | |
| | |
| LKCM Aquinas Small Cap Fund | |
| | |
 | |
| LKCM Aquinas Value Fund |
| Schedule of Investments | |
December 31, 2012
| | | | | | | |
| COMMON STOCKS - 98.4% | | Shares | | | Value | |
| Aerospace & Defense - 2.0% | | | | | | |
| Honeywell International Inc. | | | 15,000 | | | $ | 952,050 | |
| | | | | | | | | |
| Auto Components - 1.5% | | | | | | | | |
| The Goodyear Tire & Rubber Company (a) | | | 50,000 | | | | 690,500 | |
| | | | | | | | | |
| Banks - 8.4% | | | | | | | | |
| BOK Financial Corporation | | | 20,000 | | | | 1,089,200 | |
| Cullen/Frost Bankers, Inc. | | | 17,500 | | | | 949,725 | |
| SunTrust Banks, Inc. | | | 30,000 | | | | 850,500 | |
| Zions Bancorporation | | | 50,000 | | | | 1,070,000 | |
| | | | | | | | 3,959,425 | |
| Beverages - 2.6% | | | | | | | | |
| The Coca-Cola Company | | | 20,000 | | | | 725,000 | |
| PepsiCo, Inc. | | | 7,500 | | | | 513,225 | |
| | | | | | | | 1,238,225 | |
| Building Products - 1.0% | | | | | | | | |
| Masco Corporation | | | 27,500 | | | | 458,150 | |
| | | | | | | | | |
| Chemicals - 5.5% | | | | | | | | |
| FMC Corporation | | | 24,000 | | | | 1,404,480 | |
| Monsanto Company | | | 12,500 | | | | 1,183,125 | |
| | | | | | | | 2,587,605 | |
| Commercial Services & Supplies - 1.6% | | | | | | | | |
| Waste Management, Inc. | | | 22,500 | | | | 759,150 | |
| | | | | | | | | |
| Communications Equipment - 1.0% | | | | | | | | |
| Brocade Communications Systems, Inc. (a) | | | 85,000 | | | | 453,050 | |
| | | | | | | | | |
| Computers & Peripherals - 3.8% | | | | | | | | |
| EMC Corporation (a) | | | 40,000 | | | | 1,012,000 | |
| International Business Machines Corporation | | | 4,020 | | | | 770,031 | |
| | | | | | | | 1,782,031 | |
| Construction Materials - 2.5% | | | | | | | | |
| Martin Marietta Materials, Inc. | | | 12,500 | | | | 1,178,500 | |
| | | | | | | | | |
| Distributors - 1.8% | | | | | | | | |
| LKQ Corporation (a) | | | 40,000 | | | | 844,000 | |
| | | | | | | | | |
| Diversified Financial Services - 2.3% | | | | | | | | |
| JPMorgan Chase & Co. | | | 25,000 | | | | 1,099,250 | |
| | | | | | | | | |
| Diversified Telecommunication Services - 3.1% | | | | | | | | |
| AT&T Inc. | | | 27,500 | | | | 927,025 | |
| Verizon Communications Inc. | | | 12,500 | | | | 540,875 | |
| | | | | | | | 1,467,900 | |
| Electrical Equipment & Instruments - 2.4% | | | | | | | | |
| Roper Industries, Inc. | | | 10,000 | | | | 1,114,800 | |
| | | | | | | | | |
| Energy Equipment & Services - 1.2% | | | | | | | | |
| Schlumberger Limited (b) | | | 8,400 | | | | 582,036 | |
| | | | | | | | | |
| Food & Drug Retailing - 2.1% | | | | | | | | |
| CVS Caremark Corporation | | | 20,000 | | | | 967,000 | |
| | | | | | | | | |
| Food Products - 1.5% | | | | | | | | |
| Kraft Foods Group, Inc. | | | 15,000 | | | | 682,050 | |
| | | | | | | | | |
| Health Care Equipment & Supplies - 4.2% | | | | | | | | |
| Covidien plc (b) | | | 20,000 | | | | 1,154,800 | |
| DENTSPLY International Inc. | | | 20,000 | | | | 792,200 | |
| | | | | | | | 1,947,000 | |
| Household Durables - 2.9% | | | | | | | | |
| Whirlpool Corporation | | | 13,500 | | | | 1,373,625 | |
| | | | | | | | | |
| Industrial Power Producers | | | | | | | | |
| & Energy Traders - 2.0% | | | | | | | | |
| Duke Energy Corporation | | | 15,000 | | | | 957,000 | |
| | | | | | | | | |
| Insurance - 6.8% | | | | | | | | |
| HCC Insurance Holdings, Inc. | | | 30,000 | | | | 1,116,300 | |
| MetLife, Inc. | | | 35,000 | | | | 1,152,900 | |
| Prudential Financial, Inc. | | | 17,500 | | | | 933,275 | |
| | | | | | | | 3,202,475 | |
| Internet Software & Services - 2.2% | | | | | | | | |
| Akamai Technologies, Inc. (a) | | | 25,000 | | | | 1,022,750 | |
| | | | | | | | | |
| Machinery - 3.0% | | | | | | | | |
| Barnes Group Inc. | | | 25,000 | | | | 561,500 | |
| Danaher Corporation | | | 15,000 | | | | 838,500 | |
| | | | | | | | 1,400,000 | |
| Media - 2.6% | | | | | | | | |
| Cinemark Holdings, Inc. | | | 20,000 | | | | 519,600 | |
| Time Warner Inc. | | | 15,000 | | | | 717,450 | |
| | | | | | | | 1,237,050 | |
| Metals & Mining - 1.7% | | | | | | | | |
| Commercial Metals Company | | | 55,000 | | | | 817,300 | |
| | | | | | | | | |
| Multiline Retail - 1.7% | | | | | | | | |
| Kohl’s Corporation | | | 18,000 | | | | 773,640 | |
| | | | | | | | | |
| Oil & Gas & Consumable Fuels - 14.6% | | | | | | | | |
| Cabot Oil & Gas Corporation | | | 20,000 | | | | 994,800 | |
| ConocoPhillips | | | 11,000 | | | | 637,890 | |
| Denbury Resources Inc. (a) | | | 35,000 | | | | 567,000 | |
| Exxon Mobil Corporation | | | 4,000 | | | | 346,200 | |
| Gulfport Energy Corporation (a) | | | 30,800 | | | | 1,177,176 | |
| Noble Energy, Inc. | | | 7,000 | | | | 712,180 | |
| Range Resources Corporation | | | 10,000 | | | | 628,300 | |
| SM Energy Company | | | 15,000 | | | | 783,150 | |
| The Williams Companies, Inc. | | | 30,000 | | | | 982,200 | |
| | | | | | | | 6,828,896 | |
| Pharmaceuticals - 1.8% | | | | | | | | |
| Abbott Laboratories | | | 12,500 | | | | 818,750 | |
| | | | | | | | | |
| Software - 4.5% | | | | | | | | |
| Adobe Systems Incorporated (a) | | | 32,500 | | | | 1,224,600 | |
| Nuance Communications, Inc. (a) | | | 40,000 | | | | 892,800 | |
| | | | | | | | 2,117,400 | |
The accompanying notes are an integral part of these financial statements.
| LKCM Aquinas Value Fund |
| Schedule of Investments, Continued | |
December 31, 2012
| | | | | | | |
| COMMON STOCKS | | Shares | | | Value | |
| Specialty Retail - 4.5% | | | | | | |
| Foot Locker, Inc. | | | 15,000 | | | $ | 481,800 | |
| The Home Depot, Inc. | | | 10,000 | | | | 618,500 | |
| Tiffany & Co. | | | 17,500 | | | | 1,003,450 | |
| | | | | | | | 2,103,750 | |
| Thrifts & Mortgage Finance - 1.6% | | | | | | | | |
| Capitol Federal Financial Inc. | | | 65,000 | | | | 759,850 | |
| | | | | | | | | |
| TOTAL COMMON STOCKS | | | | | | | | |
| (Cost $34,366,212) | | | | | | | 46,175,208 | |
| | | | | | | | | |
| SHORT-TERM INVESTMENT - 1.3% | | | | | | | | |
| Money Market Fund (c) - 1.3% | | | | | | | | |
| Federated Government Obligations | | | | | | | | |
| Fund - Institutional Shares, 0.01% | | | 596,253 | | | | 596,253 | |
| | | | | | | | | |
| TOTAL SHORT-TERM INVESTMENT | | | | | | | | |
| (Cost $596,253) | | | | | | | 596,253 | |
| | | | | | | | | |
| Total Investments - 99.7% | | | | | | | | |
| (Cost $34,962,465) | | | | | | | 46,771,461 | |
| Other Assets in Excess of Liabilities - 0.3% | | | | | | | 130,424 | |
| TOTAL NET ASSETS - 100.0% | | | | | | $ | 46,901,885 | |
(a)Non-income producing security.
(b)U.S. Dollar-denominated foreign security.
(c)The rate quoted is the annualized seven-day yield of the fund at period end.
The Global Industry Classification Standard (GICS®) was developed by and/or is the exclusive property of MSCI, Inc. and Standard & Poor Financial Services LLC (“S&P”). GICS is a service mark of MSCI and S&P and has been licensed for use by U.S. Bancorp Fund Services, LLC.
The accompanying notes are an integral part of these financial statements.
| LKCM Aquinas Growth Fund |
| Schedule of Investments | |
December 31, 2012
| | | | | | | |
| COMMON STOCKS - 98.4% | | Shares | | | Value | |
| Aerospace & Defense - 1.6% | | | | | | |
| Rockwell Collins, Inc. | | | 10,000 | | | $ | 581,700 | |
| | | | | | | | | |
| Air Freight & Logistics - 2.6% | | | | | | | | |
| C.H. Robinson Worldwide, Inc. | | | 7,000 | | | | 442,540 | |
| FedEx Corp. | | | 5,000 | | | | 458,600 | |
| | | | | | | | 901,140 | |
| Banks - 5.0% | | | | | | | | |
| BOK Financial Corporation | | | 10,000 | | | | 544,600 | |
| Cullen/Frost Bankers, Inc. | | | 10,000 | | | | 542,700 | |
| Texas Capital Bancshares, Inc. (a) | | | 15,000 | | | | 672,300 | |
| | | | | | | | 1,759,600 | |
| Beverages - 2.1% | | | | | | | | |
| The Coca-Cola Company | | | 20,000 | | | | 725,000 | |
| | | | | | | | | |
| Chemicals - 3.3% | | | | | | | | |
| FMC Corporation | | | 10,000 | | | | 585,200 | |
| Monsanto Company | | | 6,000 | | | | 567,900 | |
| | | | | | | | 1,153,100 | |
| Communications Equipment - 1.7% | | | | | | | | |
| F5 Networks, Inc. (a) | | | 6,000 | | | | 582,900 | |
| | | | | | | | | |
| Computers & Peripherals - 7.5% | | | | | | | | |
| Apple Inc. | | | 1,800 | | | | 959,454 | |
| EMC Corporation (a) | | | 30,000 | | | | 759,000 | |
| International Business Machines Corporation | | | 3,500 | | | | 670,425 | |
| NetApp, Inc. (a) | | | 8,000 | | | | 268,400 | |
| | | | | | | | 2,657,279 | |
| Consumer Finance - 1.6% | | | | | | | | |
| American Express Company | | | 10,000 | | | | 574,800 | |
| | | | | | | | | |
| Distributors - 1.8% | | | | | | | | |
| LKQ Corporation (a) | | | 30,000 | | | | 633,000 | |
| | | | | | | | | |
| Electrical Equipment & Instruments - 5.3% | | | | | | | | |
| AMETEK, Inc. | | | 15,000 | | | | 563,550 | |
| Emerson Electric Co. | | | 12,000 | | | | 635,520 | |
| Roper Industries, Inc. | | | 6,000 | | | | 668,880 | |
| | | | | | | | 1,867,950 | |
| Electronic Equipment & Instruments - 3.2% | | | | | | | | |
| National Instruments Corporation | | | 18,000 | | | | 464,580 | |
| Trimble Navigation Limited (a) | | | 11,000 | | | | 657,580 | |
| | | | | | | | 1,122,160 | |
| Energy Equipment & Services - 1.5% | | | | | | | | |
| National Oilwell Varco Inc. | | | 8,000 | | | | 546,800 | |
| | | | | | | | | |
| Food & Drug Retailing - 3.7% | | | | | | | | |
| Casey’s General Stores, Inc. | | | 10,000 | | | | 531,000 | |
| Costco Wholesale Corporation | | | 8,000 | | | | 790,160 | |
| | | | | | | | 1,321,160 | |
| Food Products - 1.6% | | | | | | | | |
| Whole Foods Market, Inc. | | | 6,000 | | | | 547,980 | |
| | | | | | | | | |
| Health Care Equipment & Supplies - 3.2% | | | | | | | | |
| Covidien plc (b) | | | 10,000 | | | | 577,400 | |
| DENTSPLY International Inc. | | | 14,000 | | | | 554,540 | |
| | | | | | | | 1,131,940 | |
| Health Care Providers & Services - 1.2% | | | | | | | | |
| Express Scripts Holding Co (a) | | | 8,000 | | | | 432,000 | |
| | | | | | | | | |
| Hotels, Restaurants & Leisure - 1.9% | | | | | | | | |
| Yum! Brands, Inc. | | | 10,000 | | | | 664,000 | |
| | | | | | | | | |
| Household Products - 3.7% | | | | | | | | |
| Colgate-Palmolive Company | | | 6,000 | | | | 627,240 | |
| The Procter & Gamble Company | | | 10,000 | | | | 678,900 | |
| | | | | | | | 1,306,140 | |
| Internet Catalog & Retail - 2.1% | | | | | | | | |
| Amazon.com, Inc. (a) | | | 3,000 | | | | 753,420 | |
| | | | | | | | | |
| Internet Software & Services - 4.6% | | | | | | | | |
| Akamai Technologies, Inc. (a) | | | 22,000 | | | | 900,020 | |
| Google Inc. - Class A (a) | | | 1,000 | | | | 709,370 | |
| | | | | | | | 1,609,390 | |
| Machinery - 3.7% | | | | | | | | |
| Danaher Corporation | | | 11,000 | | | | 614,900 | |
| Valmont Industries, Inc. | | | 5,000 | | | | 682,750 | |
| | | | | | | | 1,297,650 | |
| Media - 0.8% | | | | | | | | |
| Sirius XM Radio Inc. | | | 100,000 | | | | 289,000 | |
| | | | | | | | | |
| Metals & Mining - 3.2% | | | | | | | | |
| Carpenter Technology Corporation | | | 10,000 | | | | 516,300 | |
| Reliance Steel & Aluminum Co. | | | 10,000 | | | | 621,000 | |
| | | | | | | | 1,137,300 | |
| Oil & Gas & Consumable Fuels - 8.5% | | | | | | | | |
| Cabot Oil & Gas Corporation | | | 20,000 | | | | 994,800 | |
| Gulfport Energy Corporation (a) | | | 10,000 | | | | 382,200 | |
| Oasis Petroleum Inc. (a) | | | 15,000 | | | | 477,000 | |
| Range Resources Corporation | | | 10,000 | | | | 628,300 | |
| SM Energy Company | | | 10,000 | | | | 522,100 | |
| | | | | | | | 3,004,400 | |
| Pharmaceuticals - 3.0% | | | | | | | | |
| Abbott Laboratories | | | 8,000 | | | | 524,000 | |
| Allergan, Inc. | | | 6,000 | | | | 550,380 | |
| | | | | | | | 1,074,380 | |
| Semiconductor Equipment & Products - 1.2% | | | | | | | | |
| Cirrus Logic, Inc. (a) | | | 15,000 | | | | 434,550 | |
| | | | | | | | | |
| Software - 10.6% | | | | | | | | |
| ACI Worldwide, Inc. (a) | | | 15,000 | | | | 655,350 | |
| Adobe Systems Incorporated (a) | | | 10,000 | | | | 376,800 | |
| Aspen Technology, Inc. (a) | | | 30,000 | | | | 829,200 | |
| Citrix Systems, Inc. (a) | | | 7,000 | | | | 460,250 | |
| TIBCO Software Inc. (a) | | | 30,000 | | | | 660,300 | |
| VMware, Inc. - Class A (a) | | | 8,000 | | | | 753,120 | |
| | | | | | | | 3,735,020 | |
The accompanying notes are an integral part of these financial statements.
| LKCM Aquinas Growth Fund |
| Schedule of Investments, Continued | |
December 31, 2012
| | | | | | | |
| COMMON STOCKS | | Shares | | | Value | |
| Specialty Retail - 8.2% | | | | | | |
| The Home Depot, Inc. | | | 6,000 | | | $ | 371,100 | |
| O’Reilly Automotive, Inc. (a) | | | 8,000 | | | | 715,360 | |
| PetSmart, Inc. | | | 5,000 | | | | 341,700 | |
| Tractor Supply Company | | | 9,000 | | | | 795,240 | |
| Ulta Salon, Cosmetics & Fragrance, Inc. | | | 7,000 | | | | 687,820 | |
| | | | | | | | 2,911,220 | |
| TOTAL COMMON STOCKS | | | | | | | | |
| (Cost $23,440,384) | | | | | | | 34,754,979 | |
| | | | | | | | | |
| SHORT-TERM INVESTMENT - 2.0% | | | | | | | | |
| Money Market Fund (c) - 2.0% | | | | | | | | |
| Federated Government Obligations | | | | | | | | |
| Fund - Institutional Shares, 0.01% | | | 689,721 | | | | 689,721 | |
| | | | | | | | | |
| TOTAL SHORT-TERM INVESTMENT | | | | | | | | |
| (Cost $689,721) | | | | | | | 689,721 | |
| | | | | | | | | |
| Total Investments - 100.4% | | | | | | | | |
| (Cost $24,130,105) | | | | | | | 35,444,700 | |
| Liabilities in Excess of Other Assets - (0.4)% | | | | | | | (129,437 | ) |
| TOTAL NET ASSETS - 100.0% | | | | | | $ | 35,315,263 | |
(a)Non-income producing security.
(b)U.S. Dollar-denominated foreign security.
(c)The rate quoted is the annualized seven-day yield of the fund at period end.
The Global Industry Classification Standard (GICS®) was developed by and/or is the exclusive property of MSCI, Inc. and Standard & Poor Financial Services LLC (“S&P”). GICS is a service mark of MSCI and S&P and has been licensed for use by U.S. Bancorp Fund Services, LLC.
The accompanying notes are an integral part of these financial statements.
| LKCM Aquinas Small Cap Fund |
| Schedule of Investments | |
December 31, 2012
| | | | | | | |
| COMMON STOCKS - 96.6% | | Shares | | | Value | |
| Aerospace & Defense - 2.7% | | | | | | |
| Hexcel Corporation (a) | | | 7,175 | | | $ | 193,438 | |
| Teledyne Technologies Incorporated (a) | | | 1,840 | | | | 119,729 | |
| | | | | | | | 313,167 | |
| Auto Components - 1.2% | | | | | | | | |
| Group 1 Automotive, Inc. | | | 2,365 | | | | 146,606 | |
| | | | | | | | | |
| Automobiles - 0.8% | | | | | | | | |
| Thor Industries, Inc. | | | 2,400 | | | | 89,832 | |
| | | | | | | | | |
| Banks - 9.3% | | | | | | | | |
| Community Bank System, Inc. | | | 5,250 | | | | 143,640 | |
| First Horizon National Corporation | | | 16,550 | | | | 164,011 | |
| Hancock Holding Company | | | 3,760 | | | | 119,342 | |
| Home Bancshares Inc. | | | 3,600 | | | | 118,872 | |
| Prosperity Bancshares, Inc. | | | 3,125 | | | | 131,250 | |
| Texas Capital Bancshares, Inc. (a) | | | 3,650 | | | | 163,593 | |
| UMB Financial Corporation | | | 2,775 | | | | 121,656 | |
| Umpqua Holdings Corporation | | | 10,775 | | | | 127,037 | |
| | | | | | | | 1,089,401 | |
| Biotechnology - 1.0% | | | | | | | | |
| Exact Sciences Corp. (a) | | | 10,630 | | | | 112,572 | |
| | | | | | | | | |
| Building Products - 1.0% | | | | | | | | |
| Armstrong World Industries, Inc. | | | 2,200 | | | | 111,606 | |
| | | | | | | | | |
| Capital Markets - 1.4% | | | | | | | | |
| Greenhill & Co., Inc. | | | 3,075 | | | | 159,869 | |
| | | | | | | | | |
| Commercial Services & Supplies - 1.1% | | | | | | | | |
| Insperity, Inc. | | | 3,865 | | | | 125,845 | |
| | | | | | | | | |
| Communications Equipment - 3.7% | | | | | | | | |
| Ciena Corporation (a) | | | 9,200 | | | | 144,440 | |
| IXIA (a) | | | 8,350 | | | | 141,783 | |
| Loral Space & Communications Inc. | | | 1,600 | | | | 87,456 | |
| NICE Systems Limited - ADR (a) (b) | | | 1,875 | | | | 62,775 | |
| | | | | | | | 436,454 | |
| Consumer Finance - 1.3% | | | | | | | | |
| First Cash Financial Services, Inc. (a) | | | 3,025 | | | | 150,101 | |
| | | | | | | | | |
| Containers & Packaging - 1.1% | | | | | | | | |
| Silgan Holdings Inc. | | | 3,000 | | | | 124,770 | |
| | | | | | | | | |
| Electrical Equipment & Instruments - 4.9% | | | | | | | | |
| Belden Inc. | | | 4,000 | | | | 179,960 | |
| Franklin Electric Co., Inc. | | | 2,625 | | | | 163,196 | |
| Thermon Group Holdings Inc. (a) | | | 5,245 | | | | 118,170 | |
| Woodward Inc. | | | 2,970 | | | | 113,246 | |
| | | | | | | | 574,572 | |
| Electronic Equipment & Instruments - 1.8% | | | | | | | | |
| FARO Technologies, Inc. (a) | | | 3,350 | | | | 119,528 | |
| National Instruments Corporation | | | 3,650 | | | | 94,206 | |
| | | | | | | | 213,734 | |
| Energy Equipment & Services - 0.8% | | | | | | | | |
| Atwood Oceanics, Inc. (a) | | | 2,125 | | | | 97,304 | |
| | | | | | | | | |
| Food & Drug Retailing - 0.7% | | | | | | | | |
| Casey’s General Stores, Inc. | | | 1,455 | | | | 77,260 | |
| | | | | | | | | |
| Health Care Equipment & Supplies - 8.6% | | | | | | | | |
| Cyberonics, Inc. (a) | | | 4,075 | | | | 214,060 | |
| DexCom Inc. (a) | | | 12,050 | | | | 164,000 | |
| Endologix, Inc. (a) | | | 10,825 | | | | 154,148 | |
| Integra LifeSciences Holdings (a) | | | 3,700 | | | | 144,189 | |
| MWI Veterinary Supply, Inc. (a) | | | 1,820 | | | | 200,200 | |
| The Spectranetics Corporation (a) | | | 8,608 | | | | 127,140 | |
| | | | | | | | 1,003,737 | |
| Health Care Providers & Services - 4.3% | | | | | | | | |
| Computer Programs and Systems, Inc. | | | 2,720 | | | | 136,925 | |
| HMS Holdings Corporation (a) | | | 5,750 | | | | 149,040 | |
| Team Health Holdings, Inc. (a) | | | 7,500 | | | | 215,775 | |
| | | | | | | | 501,740 | |
| Household Durables - 2.0% | | | | | | | | |
| Select Comfort Corporation (a) | | | 5,325 | | | | 139,355 | |
| Tempur-Pedic International Inc. (a) | | | 3,150 | | | | 99,194 | |
| | | | | | | | 238,549 | |
| Industrial Conglomerates - 1.5% | | | | | | | | |
| Raven Industries, Inc. | | | 3,600 | | | | 94,896 | |
| Rexnord Corp. (a) | | | 3,610 | | | | 76,893 | |
| | | | | | | | 171,789 | |
| Insurance - 1.6% | | | | | | | | |
| AmTrust Financial Services, Inc. | | | 6,600 | | | | 189,354 | |
| | | | | | | | | |
| Internet Software & Services - 1.7% | | | | | | | | |
| LivePerson, Inc. (a) | | | 6,915 | | | | 90,863 | |
| LogMeIn, Inc. (a) | | | 4,800 | | | | 107,568 | |
| | | | | | | | 198,431 | |
| IT Consulting & Services - 1.0% | | | | | | | | |
| Acxiom Corporation (a) | | | 6,525 | | | | 113,927 | |
| | | | | | | | | |
| Machinery - 6.4% | | | | | | | | |
| Actuant Corporation - Class A | | | 5,100 | | | | 142,341 | |
| Barnes Group Inc. | | | 5,050 | | | | 113,423 | |
| Chart Industries, Inc. (a) | | | 1,450 | | | | 96,672 | |
| CLARCOR Inc. | | | 2,000 | | | | 95,560 | |
| The Middleby Corporation (a) | | | 1,500 | | | | 192,315 | |
| Westport Innovations Inc. (a) (b) | | | 3,950 | | | | 105,504 | |
| | | | | | | | 745,815 | |
| Marine - 1.1% | | | | | | | | |
| Kirby Corporation (a) | | | 2,125 | | | | 131,516 | |
| | | | | | | | | |
| Media - 1.2% | | | | | | | | |
| Cinemark Holdings, Inc. | | | 5,575 | | | | 144,838 | |
| | | | | | | | | |
| Metals & Mining - 3.5% | | | | | | | | |
| Carpenter Technology Corporation | | | 2,675 | | | | 138,110 | |
| Commercial Metals Company | | | 10,075 | | | | 149,715 | |
| Walter Energy, Inc. | | | 3,260 | | | | 116,969 | |
| | | | | | | | 404,794 | |
The accompanying notes are an integral part of these financial statements.
| LKCM Aquinas Small Cap Fund |
| Schedule of Investments, Continued | |
December 31, 2012
| | | | | | | |
| COMMON STOCKS - 96.6% | | Shares | | | Value | |
| Oil & Gas & Consumable Fuels - 6.8% | | | | | | |
| Approach Resources Inc. (a) | | | 6,050 | | | $ | 151,311 | |
| Comstock Resources, Inc. (a) | | | 7,170 | | | | 108,482 | |
| Gulfport Energy Corporation (a) | | | 4,825 | | | | 184,411 | |
| Kodiak Oil & Gas Corporation (a) (b) | | | 13,350 | | | | 118,147 | |
| Oasis Petroleum Inc. (a) | | | 3,830 | | | | 121,794 | |
| Rosetta Resources, Inc. (a) | | | 2,460 | | | | 111,586 | |
| | | | | | | | 795,731 | |
| Pharmaceuticals - 2.4% | | | | | | | | |
| Akorn, Inc. (a) | | | 11,626 | | | | 155,323 | |
| IMPAX Laboratories, Inc. (a) | | | 6,325 | | | | 129,599 | |
| | | | | | | | 284,922 | |
| Real Estate - 0.5% | | | | | | | | |
| FirstService Corporation (a) (b) | | | 2,041 | | | | 57,679 | |
| | | | | | | | | |
| Semiconductor Equipment & Products - 1.0% | | | | | | | | |
| Cirrus Logic, Inc. (a) | | | 3,775 | | | | 109,362 | |
| | | | | | | | | |
| Software - 5.6% | | | | | | | | |
| ACI Worldwide, Inc. (a) | | | 3,725 | | | | 162,745 | |
| Aspen Technology, Inc. (a) | | | 8,585 | | | | 237,289 | |
| Interactive Intelligence Group, Inc. (a) | | | 4,575 | | | | 153,446 | |
| Pegasystems Inc. | | | 4,620 | | | | 104,782 | |
| | | | | | | | 658,262 | |
| Specialty Retail - 5.8% | | | | | | | | |
| DSW Inc. - Class A | | | 2,404 | | | | 157,919 | |
| Genesco Inc. (a) | | | 2,325 | | | | 127,875 | |
| GNC Holdings, Inc. - Class A | | | 2,645 | | | | 88,026 | |
| Monro Muffler Brake, Inc. | | | 3,225 | | | | 112,778 | |
| Sonic Automotive, Inc. - Class A | | | 9,125 | | | | 190,621 | |
| | | | | | | | 677,219 | |
| Textiles, Apparel & Luxury Goods - 3.2% | | | | | | | | |
| The Children’s Place Retail Stores, Inc. (a) | | | 2,375 | | | | 105,189 | |
| Fifth & Pacific Companies, Inc. (a) | | | 5,885 | | | | 73,268 | |
| Oxford Industries, Inc. | | | 1,715 | | | | 79,507 | |
| Wolverine World Wide, Inc. | | | 2,875 | | | | 117,818 | |
| | | | | | | | 375,782 | |
| Thrifts & Mortgage Finance - 1.2% | | | | | | | | |
| Capitol Federal Financial Inc. | | | 11,900 | | | | 139,111 | |
| | | | | | | | | |
| Trading Companies & Distributors - 3.8% | | | | | | | | |
| Beacon Roofing Supply, Inc. (a) | | | 4,565 | | | | 151,923 | |
| Kaman Corporation | | | 3,650 | | | | 134,320 | |
| WESCO International, Inc. (a) | | | 2,425 | | | | 163,518 | |
| | | | | | | | 449,761 | |
| Wireless Telecommunication Services - 0.6% | | | | | | | | |
| Leap Wireless International, Inc. (a) | | | 11,125 | | | | 73,981 | |
| | | | | | | | | |
| TOTAL COMMON STOCKS | | | | | | | | |
| (Cost $10,169,358) | | | | | | | 11,289,393 | |
| | | | | | | | | |
| SHORT-TERM INVESTMENTS - 3.1% | | | | | | | | |
| Money Market Funds (c) - 3.1% | | | | | | | | |
| Dreyfus Government Cash Management | | | | | | | | |
| Fund - Institutional Shares, 0.01% | | | 18,507 | | | | 18,507 | |
| Federated Government Obligations | | | | | | | | |
| Fund - Institutional Shares, 0.01% | | | 336,683 | | | | 336,683 | |
| | | | | | | | | |
| TOTAL SHORT-TERM INVESTMENTS | | | | | | | | |
| (Cost $355,190) | | | | | | | 355,190 | |
| | | | | | | | | |
| Total Investments - 99.7% | | | | | | | | |
| (Cost $10,524,548) | | | | | | | 11,644,583 | |
| Other Assets in Excess of Liabilities - 0.3% | | | | | | | 39,330 | |
| TOTAL NET ASSETS - 100.0% | | | | | | $ | 11,683,913 | |
ADR American Depository Receipt
(a)Non-income producing security.
(b)U.S. Dollar-denominated foreign security.
(c)The rate quoted is the annualized seven-day yield of the fund at period end.
The Global Industry Classification Standard (GICS®) was developed by and/or is the exclusive property of MSCI, Inc. and Standard & Poor Financial Services LLC (“S&P”). GICS is a service mark of MSCI and S&P and has been licensed for use by U.S. Bancorp Fund Services, LLC.
The accompanying notes are an integral part of these financial statements.
| Statement of Assets and Liabilities |
| December 31, 2012 | |
| | | LKCM | | | LKCM | | | LKCM | |
| | | Aquinas | | | Aquinas | | | Aquinas Small | |
| | | Value Fund | | | Growth Fund | | | Cap Fund | |
| Assets: | | | | | | | | | |
| Investments, at value* | | $ | 46,771,461 | | | $ | 35,444,700 | | | $ | 11,644,583 | |
| Dividends and interest receivable | | | 28,734 | | | | 3,253 | | | | 2,517 | |
| Receivable for fund shares sold | | | 313,519 | | | | 27,663 | | | | 58,937 | |
| Other assets | | | 12,257 | | | | 10,773 | | | | 12,534 | |
| Total assets | | | 47,125,971 | | | | 35,486,389 | | | | 11,718,571 | |
| | | | | | | | | | | | | |
| Liabilities: | | | | | | | | | | | | |
| Payable for investment advisory fees | | | 101,194 | | | | 73,749 | | | | 6,426 | |
| Payable for distribution expense (Note B) | | | 63,589 | | | | 62,124 | | | | 6,684 | |
| Payable for fund shares redeemed | | | 27,977 | | | | 8,164 | | | | 1,130 | |
| Payable for accounting and transfer agent fees and expenses | | | 12,354 | | | | 11,313 | | | | 7,511 | |
| Payable for administrative fees | | | 7,149 | | | | 5,680 | | | | 3,959 | |
| Payable for reports to shareholders | | | 3,101 | | | | 2,265 | | | | 1,067 | |
| Accrued expenses and other liabilities | | | 8,722 | | | | 7,831 | | | | 7,881 | |
| Total liabilities | | | 224,086 | | | | 171,126 | | | | 34,658 | |
| Net Assets | | $ | 46,901,885 | | | $ | 35,315,263 | | | $ | 11,683,913 | |
| | | | | | | | | | | | | |
| Net Assets Consist of: | | | | | | | | | | | | |
| Paid in capital | | $ | 34,692,410 | | | $ | 23,676,287 | | | $ | 10,609,006 | |
| Accumulated net investment income | | | 5,438 | | | | — | | | | — | |
| Accumulated net realized gain (loss) on securities | | | 395,041 | | | | 324,381 | | | | (45,128 | ) |
| Net unrealized appreciation on investments | | | 11,808,996 | | | | 11,314,595 | | | | 1,120,035 | |
| Net Assets | | $ | 46,901,885 | | | $ | 35,315,263 | | | $ | 11,683,913 | |
| | | | | | | | | | | | | |
| Net Assets | | $ | 46,901,885 | | | $ | 35,315,263 | | | $ | 11,683,913 | |
| Shares of beneficial interest outstanding | | | | | | | | | | | | |
| (unlimited shares of no par value authorized) | | | 3,306,794 | | | | 1,905,432 | | | | 1,591,504 | |
| Net asset value per share | | | | | | | | | | | | |
| (offering and redemption price) | | $ | 14.18 | | | $ | 18.53 | | | $ | 7.34 | |
| | | | | | | | | | | | | |
| * Cost of Investments | | $ | 34,962,465 | | | $ | 24,130,105 | | | $ | 10,524,548 | |
The accompanying notes are an integral part of these financial statements.
| Statement of Operations |
| For the year ended December 31, 2012 | |
| | | LKCM | | | LKCM | | | LKCM | |
| | | Aquinas | | | Aquinas | | | Aquinas Small | |
| | | Value Fund | | | Growth Fund | | | Cap Fund | |
| Investment Income: | | | | | | | | | |
| Dividends | | $ | 894,849 | | | $ | 414,755 | | | $ | 173,687 | |
| Interest | | | 93 | | | | 129 | | | | 59 | |
| Total income | | | 894,942 | | | | 414,884 | | | | 173,746 | |
| | | | | | | | | | | | | |
| Expenses: | | | | | | | | | | | | |
| Investment advisory fees | | | 406,307 | | | | 327,688 | | | | 117,703 | |
| Distribution expense (Note B) | | | 112,863 | | | | 91,025 | | | | 29,426 | |
| Accounting and transfer agent fees and expenses | | | 71,231 | | | | 67,856 | | | | 44,470 | |
| Administrative fees | | | 42,094 | | | | 34,440 | | | | 23,410 | |
| Federal and state registration | | | 24,631 | | | | 23,613 | | | | 22,625 | |
| Professional fees | | | 10,892 | | | | 9,574 | | | | 5,555 | |
| Reports to shareholders | | | 6,965 | | | | 5,453 | | | | 2,574 | |
| Trustees’ fees | | | 6,427 | | | | 4,950 | | | | 1,619 | |
| Custody fees and expenses | | | 5,532 | | | | 4,795 | | | | 23,490 | |
| Other | | | 8,800 | | | | 7,150 | | | | 2,305 | |
| Total expenses | | | 695,742 | | | | 576,544 | | | | 273,177 | |
| Less, expense waiver and/or reimbursement (Note B) | | | (18,564 | ) | | | (30,397 | ) | | | (96,622 | ) |
| Net expenses | | | 677,178 | | | | 546,147 | | | | 176,555 | |
| Net investment income (loss) | | | 217,764 | | | | (131,263 | ) | | | (2,809 | ) |
| | | | | | | | | | | | | |
| Realized and Unrealized Gain (Loss) on Investments: | | | | | | | | | | | | |
| Net realized gain on investments | | | 1,326,430 | | | | 673,619 | | | | 890,642 | |
| Net change in unrealized appreciation/depreciation on investments | | | 3,495,779 | | | | 2,988,753 | | | | (51,171 | ) |
| Net Realized and Unrealized Gain on Investments | | | 4,822,209 | | | | 3,662,372 | | | | 839,471 | |
| | | | | | | | | | | | | |
| Net Increase in Net Assets Resulting from Operations | | $ | 5,039,973 | | | $ | 3,531,109 | | | $ | 836,662 | |
The accompanying notes are an integral part of these financial statements.
| Statements of Changes in Net Assets |
| | | LKCM Aquinas | | | LKCM Aquinas | |
| | | Value Fund | | | Growth Fund | |
| | | Year Ended | | | Year Ended | | | Year Ended | | | Year Ended | |
| | | December 31, | | | December 31, | | | December 31, | | | December 31, | |
| | | 2012 | | | 2011 | | | 2012 | | | 2011 | |
| Operations: | | | | | | | | | | | | |
| Net investment income (loss) | | $ | 217,764 | | | $ | 65,817 | | | $ | (131,263 | ) | | $ | (195,606 | ) |
| Net realized gain (loss) on investments | | | 1,326,430 | | | | (58,553 | ) | | | 673,619 | | | | 182,390 | |
| Net change in unrealized | | | | | | | | | | | | | | | | |
| appreciation/depreciation on investments | | | 3,495,779 | | | | 88,730 | | | | 2,988,753 | | | | 395,083 | |
| | | | | | | | | | | | | | | | | |
| Net increase in net assets resulting from operations | | | 5,039,973 | | | | 95,994 | | | | 3,531,109 | | | | 381,867 | |
| | | | | | | | | | | | | | | | | |
| Dividends and Distributions to Shareholders: | | | | | | | | | | | | | | | | |
| Net investment income | | | (217,662 | ) | | | (60,353 | ) | | | — | | | | — | |
| Net realized gain on investments | | | — | | | | — | | | | (193,245 | ) | | | — | |
| | | | (217,662 | ) | | | (60,353 | ) | | | (193,245 | ) | | | — | |
| Net increase (decrease) in net assets resulting from | | | | | | | | | | | | | | | | |
| Fund share transactions (Note C) | | | 23,488 | | | | 3,666,838 | | | | (1,720,497 | ) | | | 2,216,937 | |
| | | | | | | | | | | | | | | | | |
| Total increase in net assets | | | 4,845,799 | | | | 3,702,479 | | | | 1,617,367 | | | | 2,598,804 | |
| | | | | | | | | | | | | | | | | |
| Net Assets: | | | | | | | | | | | | | | | | |
| Beginning of period | | | 42,056,086 | | | | 38,353,607 | | | | 33,697,896 | | | | 31,099,092 | |
| End of period* | | $ | 46,901,885 | | | $ | 42,056,086 | | | $ | 35,315,263 | | | $ | 33,697,896 | |
| * Including accumulated net investment income of | | $ | 5,438 | | | $ | 5,464 | | | $ | — | | | $ | — | |
| | | | | | | | | | | | | | | | | |
| | | LKCM Aquinas | | |
| | | Small Cap Fund | | |
| | | Year Ended | | | Year Ended | | |
| | | December 31, | | | December 31, | | |
| | | 2012 | | | 2011 | | |
| Operations: | | | | | | | |
| Net investment loss | | $ | (2,809 | ) | | $ | (91,849 | ) | |
| Net realized gain on investments | | | 890,642 | | | | 355,513 | | |
| Net change in unrealized | | | | | | | | | |
| appreciation/depreciation on investments | | | (51,171 | ) | | | (410,794 | ) | |
| | | | | | | | | | |
| Net increase (decrease) in net assets resulting from operations | | | 836,662 | | | | (147,130 | ) | |
| | | | | | | | | | |
| Dividends and Distributions to Shareholders: | | | | | | | | | |
| Net realized gain on investments | | | (881,020 | ) | | | — | | |
| | | | | | | | | | |
| Net increase in net assets resulting from | | | | | | | | | |
| Fund share transactions (Note C) | | | 691,086 | | | | 4,679,534 | | |
| | | | | | | | | | |
| Total increase in net assets | | | 646,728 | | | | 4,532,404 | | |
| | | | | | | | | | |
| Net Assets: | | | | | | | | | |
| Beginning of period | | | 11,037,185 | | | | 6,504,781 | | |
| End of period | | $ | 11,683,913 | | | $ | 11,037,185 | | |
The accompanying notes are an integral part of these financial statements.
| Financial Highlights |
| Selected Data for Each Share of Capital Stock Outstanding | |
| | | LKCM Aquinas Value Fund | |
| | | Year | | | Year | | | Year | | | Year | | | Year | |
| | | Ended | | | Ended | | | Ended | | | Ended | | | Ended | |
| | | December 31, | | | December 31, | | | December 31, | | | December 31, | | | December 31, | |
| | | 2012 | | | 2011 | | | 2010 | | | 2009 | | | 2008 | |
| | | | | | | | | | | | | | | | |
| Net Asset Value - Beginning of Period | | $ | 12.72 | | | $ | 12.68 | | | $ | 10.82 | | | $ | 8.15 | | | $ | 13.07 | |
| Net investment income | | | 0.07 | | | | 0.02 | | | | 0.00 | (1) | | | 0.02 | | | | 0.04 | |
| Net realized and unrealized gain (loss) on investments | | | 1.46 | | | | 0.04 | | | | 1.87 | | | | 2.67 | | | | (4.92 | ) |
| Total from investment operations | | | 1.53 | | | | 0.06 | | | | 1.87 | | | | 2.69 | | | | (4.88 | ) |
| Dividends from net investment income | | | (0.07 | ) | | | (0.02 | ) | | | (0.01 | ) | | | (0.02 | ) | | | (0.04 | ) |
| Net Asset Value - End of Period | | $ | 14.18 | | | $ | 12.72 | | | $ | 12.68 | | | $ | 10.82 | | | $ | 8.15 | |
| Total Return | | | 12.01 | % | | | 0.46 | % | | | 17.25 | % | | | 32.94 | % | | | (37.34 | )% |
| Ratios and Supplemental Data: | | | | | | | | | | | | | | | | | | | | |
| Net assets, end of period (thousands) | | $ | 46,902 | | | $ | 42,056 | | | $ | 38,354 | | | $ | 36,536 | | | $ | 25,184 | |
| Ratio of expenses to average net assets: | | | | | | | | | | | | | | | | | | | | |
| Before expense waiver and/or reimbursement | | | 1.54 | % | | | 1.55 | % | | | 1.57 | % | | | 1.65 | % | | | 1.58 | % |
| After expense waiver and/or reimbursement | | | 1.50 | % | | | 1.50 | % | | | 1.50 | % | | | 1.50 | % | | | 1.50 | % |
| Ratio of net investment income (loss) to average net assets: | | | | | | | | | | | | | | | | | | | | |
| Before expense waiver and/or reimbursement | | | 0.44 | % | | | 0.11 | % | | | (0.06 | )% | | | 0.04 | % | | | 0.28 | % |
| After expense waiver and/or reimbursement | | | 0.48 | % | | | 0.16 | % | | | 0.01 | % | | | 0.19 | % | | | 0.36 | % |
| Portfolio turnover rate | | | 28 | % | | | 29 | % | | | 31 | % | | | 29 | % | | | 70 | % |
| | | | | | | | | | | | | | | | | | | | | |
(1) Amount is less than $0.005.
| | | LKCM Aquinas Growth Fund | |
| | | Year | | | Year | | | Year | | | Year | | | Year | |
| | | Ended | | | Ended | | | Ended | | | Ended | | | Ended | |
| | | December 31, | | | December 31, | | | December 31, | | | December 31, | | | December 31, | |
| | | 2012 | | | 2011 | | | 2010 | | | 2009 | | | 2008 | |
| | | | | | | | | | | | | | | | |
| Net Asset Value - Beginning of Period | | $ | 16.86 | | | $ | 16.61 | | | $ | 14.25 | | | $ | 10.96 | | | $ | 16.38 | |
Net investment loss(1) | | | (0.07 | ) | | | (0.10 | ) | | | (0.08 | ) | | | (0.04 | ) | | | (0.05 | ) |
| Net realized and unrealized gain (loss) on investments | | | 1.84 | | | | 0.35 | | | | 2.44 | | | | 3.33 | | | | (5.37 | ) |
| Total from investment operations | | | 1.77 | | | | 0.25 | | | | 2.36 | | | | 3.29 | | | | (5.42 | ) |
| Dividends from net investment income | | | — | | | | — | | | | — | | | | — | | | | (0.00 | )(2) |
| Distributions from net realized gains | | | (0.10 | ) | | | — | | | | — | | | | — | | | | — | |
| Total dividends and distributions | | | (0.10 | ) | | | — | | | | — | | | | — | | | | (0.00 | )(2) |
| Net Asset Value - End of Period | | $ | 18.53 | | | $ | 16.86 | | | $ | 16.61 | | | $ | 14.25 | | | $ | 10.96 | |
| Total Return | | | 10.52 | % | | | 1.51 | % | | | 16.56 | % | | | 30.02 | % | | | (33.07 | )% |
| Ratios and Supplemental Data: | | | | | | | | | | | | | | | | | | | | |
| Net assets, end of period (thousands) | | $ | 35,315 | | | $ | 33,698 | | | $ | 31,099 | | | $ | 34,071 | | | $ | 26,944 | |
| Ratio of expenses to average net assets: | | | | | | | | | | | | | | | | | | | | |
| Before expense waiver and/or reimbursement | | | 1.58 | % | | | 1.60 | % | | | 1.63 | % | | | 1.66 | % | | | 1.56 | % |
| After expense waiver and/or reimbursement | | | 1.50 | % | | | 1.50 | % | | | 1.50 | % | | | 1.50 | % | | | 1.50 | % |
| Ratio of net investment loss to average net assets: | | | | | | | | | | | | | | | | | | | | |
| Before expense waiver and/or reimbursement | | | (0.44 | )% | | | (0.71 | )% | | | (0.65 | )% | | | (0.46 | )% | | | (0.40 | )% |
| After expense waiver and/or reimbursement | | | (0.36 | )% | | | (0.61 | )% | | | (0.52 | )% | | | (0.30 | )% | | | (0.34 | )% |
| Portfolio turnover rate | | | 42 | % | | | 50 | % | | | 46 | % | | | 47 | % | | | 67 | % |
| (1) | Net investment loss per share is calculated using the ending balance of accumulated net investment loss prior to considerations of adjustments for permanent book and tax differences. |
The accompanying notes are an integral part of these financial statements.
| Financial Highlights |
| Selected Data for Each Share of Capital Stock Outstanding | |
| | | LKCM Aquinas Small Cap Fund | |
| | | Year | | | Year | | | Year | | | Year | | | Year | |
| | | Ended | | | Ended | | | Ended | | | Ended | | | Ended | |
| | | December 31, | | | December 31, | | | December 31, | | | December 31, | | | December 31, | |
| | | 2012 | | | 2011 | | | 2010 | | | 2009 | | | 2008 | |
| | | | | | | | | | | | | | | | |
| Net Asset Value - Beginning of Period | | $ | 7.35 | | | $ | 7.07 | | | $ | 5.25 | | | $ | 4.03 | | | $ | 6.47 | |
| Net investment loss | | | (0.00 | )(1)(2) | | | (0.06 | )(1) | | | (0.05 | )(1) | | | (0.04 | )(3) | | | (0.04 | )(3) |
| Net realized and unrealized gain (loss) on investments | | | 0.59 | | | | 0.34 | | | | 1.87 | | | | 1.26 | | | | (2.40 | ) |
| Total from investment operations | | | 0.59 | | | | 0.28 | | | | 1.82 | | | | 1.22 | | | | (2.44 | ) |
| Distributions from net realized gains | | | (0.60 | ) | | | — | | | | — | | | | — | | | | (0.00 | )(2) |
| Net Asset Value - End of Period | | $ | 7.34 | | | $ | 7.35 | | | $ | 7.07 | | | $ | 5.25 | | | $ | 4.03 | |
| Total Return | | | 8.16 | % | | | 3.96 | % | | | 34.67 | % | | | 30.27 | % | | | (37.64 | )% |
| Ratios and Supplemental Data: | | | | | | | | | | | | | | | | | | | | |
| Net assets, end of period (thousands) | | $ | 11,684 | | | $ | 11,037 | | | $ | 6,505 | | | $ | 5,265 | | | $ | 3,403 | |
| Ratio of expenses to average net assets: | | | | | | | | | | | | | | | | | | | | |
| Before expense waiver and/or reimbursement | | | 2.32 | % | | | 2.44 | % | | | 3.26 | % | | | 3.68 | % | | | 2.91 | % |
| After expense waiver and/or reimbursement | | | 1.50 | % | | | 1.50 | % | | | 1.50 | % | | | 1.50 | % | | | 1.50 | % |
| Ratio of net investment loss to average net assets: | | | | | | | | | | | | | | | | | | | | |
| Before expense waiver and/or reimbursement | | | (0.84 | )% | | | (1.81 | )% | | | (2.70 | )% | | | (3.03 | )% | | | (2.11 | )% |
| After expense waiver and/or reimbursement | | | (0.02 | )% | | | (0.87 | )% | | | (0.94 | )% | | | (0.85 | )% | | | (0.70 | )% |
| Portfolio turnover rate | | | 82 | % | | | 70 | % | | | 84 | % | | | 66 | % | | | 91 | % |
| (1) | Net investment loss per share is calculated using the ending balance of accumulated net investment loss prior to considerations of adjustments for permanent book and tax differences. |
| (3) | Net investment loss per share represents net investment loss divided by the average shares outstanding throughout the period. |
The accompanying notes are an integral part of these financial statements.
| LKCM Funds |
| Notes to the Financial Statements | |
A. Organization and Significant Accounting Policies: LKCM Funds (the “Trust”) is registered under the Investment Company Act of 1940 (“1940 Act”) as an open-end, management investment company. The Trust was organized as a Delaware business trust on February 10, 1994 and consists of eight diversified series of shares, three of which are the LKCM Aquinas Value, LKCM Aquinas Growth and LKCM Aquinas Small Cap Funds (collectively, the “Funds”) and are reported here. On July 11, 2005, the Funds acquired the assets and assumed the liabilities of the Aquinas Funds. The LKCM Aquinas Value, LKCM Aquinas Growth and LKCM Aquinas Small Cap Funds are subject to expenses pursuant to the Rule 12b-1 plan described in Note B. Each Fund charges a 1% redemption fee for redemptions on Fund shares held for less than 30 days.
The LKCM Aquinas Value Fund seeks to maximize long-term capital appreciation, while incorporating Catholic values investing principles in the investment process. The LKCM Aquinas Value Fund seeks to achieve its investment objective by investing under normal circumstances in equity securities of companies that Luther King Capital Management Corporation (the “Adviser”) believes to be undervalued relative to a company’s earnings. The LKCM Aquinas Growth Fund seeks to maximize long-term capital appreciation, while incorporating Catholic values investing principles in the investment process. The LKCM Aquinas Growth Fund seeks to achieve its investment objective by investing under normal circumstances in equity securities of companies that the Adviser believes generally have above-average growth in revenue and/or earnings, above-average returns on shareholders’ equity, underleveraged balance sheets and potential for above-average capital appreciation. The LKCM Aquinas Small Cap Fund seeks to maximize long-term capital appreciation, while incorporating Catholic values investing principles in the investment process. The LKCM Aquinas Small Cap Fund seeks to achieve its investment objective by investing under normal circumstances at least 80% of its net assets in equity securities of smaller companies (those with market capitalizations at the time of investment between $400 million and $2.5 billion) that the Adviser believes are likely to have above-average growth in revenue and/or earnings and potential for above-average capital appreciation.
The LKCM Aquinas Funds practice socially responsible investing within the framework provided by the United States Conference of Catholic Bishops’ Socially Responsible Investing Guidelines (“Guidelines”). Each Fund’s investment approach incorporates the Guidelines through a combination of screening portfolio companies based on criteria set forth in the Guidelines, dialogue with companies whose policies and practices conflict with the Guidelines, and potentially excluding from each Fund’s portfolio the securities of those companies that are unwilling to alter their policies and practices over a reasonable period of time. The Adviser monitors companies selected for the Funds for policies on various issues contemplated by the Guidelines. If a Fund invests in a company whose policies and practices are inconsistent with the Guidelines, the Adviser may attempt to influence the company, sell the company’s securities or otherwise exclude future investments in such company.
The following is a summary of significant accounting policies followed by the Funds in preparation of the financial statements.
1. Security Valuation: Securities listed on a U.S. securities exchange for which market quotations are readily available are valued at the last quoted sale price, taken from the exchange where the security is primarily traded. Nasdaq National Market securities are valued at the Nasdaq Official Closing Price (“NOCP”). Unlisted U.S. securities and listed U.S. securities not traded on the valuation date for which market quotations are readily available are valued at the mean of the most recent quoted bid and asked price. Securities listed on a foreign exchange for which market quotations are readily available are valued at the last quoted sales price available before the time when assets are valued. Debt securities (other than obligations having a maturity of 60 days or less) are normally valued at the mean of bid and ask price and/or by using a combination of daily quotes or matrix evaluations provided by an independent pricing service. Debt securities purchased with remaining maturities of 60 days or less are valued at amortized cost which approximates fair value. Other assets and securities for which no quotations are readily available (including restricted securities) are valued in good faith at fair value using methods determined by the Board of Trustees. The Board has adopted specific procedures for valuing portfolio securities and delegated the implementation of these procedures to the Adviser. The procedures authorize the Adviser to make all determinations regarding the fair value of a portfolio security and to report such determinations to the Board of Trustees. The Funds may also use independent pricing services to assist in pricing portfolio securities.
The Trust has adopted accounting standards which establish an authoritative definition of fair value and set out a hierarchy for measuring fair value. These standards require additional disclosures about the various inputs and valuation techniques used to develop the measurements of fair value and a discussion of changes in valuation techniques and related inputs during the period. These standards define fair value as the price that would be received to sell an asset or paid to transfer a liability in an orderly transaction between market participants at the measurement date. The fair value hierarchy is organized into three levels based upon the assumptions (referred to as “inputs”) used in pricing the asset or liability. These standards state that “observable inputs” reflect the assumptions market participants would use in pricing the asset or liability based on market data obtained from independent sources and “unobservable inputs” reflect an entity’s own assumptions about the assumptions market participants would use in pricing the asset or liability. These inputs are summarized in the three broad levels listed below.
| Level 1 - | Quoted unadjusted prices for identical instruments in active markets to which the Trust has access at the date of measurement. |
| Level 2 - | Quoted prices for similar instruments in active markets; quoted prices for identical or similar instruments in markets that are not active; and model-derived valuations in which all significant inputs and significant value drivers are observable in active markets. Level 2 inputs are those in markets for which there are few transactions, the prices are not current, little public information exists or instances where prices vary substantially over time or among brokered market makers. |
| Level 3 - | Model derived valuations in which one or more significant inputs or significant value drivers are unobservable. Unobservable inputs are those inputs that reflect the Trust’s own assumptions that market participants would use to price the asset or liability based on the best available information. |
The inputs or methodology used for valuing securities are not necessarily an indication of the risk associated with investing in those securities. The following is a summary of the inputs used to value the Funds’ net assets as of December 31, 2012:
| | LKCM Aquinas Value Fund | | | | | | | | | | | | |
| | Description | | Level 1 | | | Level 2 | | | Level 3 | | | Total | |
| | Common Stocks | | $ | 46,175,208 | | | $ | — | | | $ | — | | | $ | 46,175,208 | |
| | Money Market Fund | | | 596,253 | | | | — | | | | — | | | | 596,253 | |
| | Total Investments* | | $ | 46,771,461 | | | $ | — | | | $ | — | | | $ | 46,771,461 | |
| | | | | | | | | | | | | | | | | | |
| | LKCM Aquinas Growth Fund | | | | | | | | | | | | | | | | |
| | Description | | Level 1 | | | Level 2 | | | Level 3 | | | Total | |
| | Common Stocks | | $ | 34,754,979 | | | $ | — | | | $ | — | | | $ | 34,754,979 | |
| | Money Market Fund | | | 689,721 | | | | — | | | | — | | | | 689,721 | |
| | Total Investments* | | $ | 35,444,700 | | | $ | — | | | $ | — | | | $ | 35,444,700 | |
| | | | | | | | | | | | | | | | | | |
| | LKCM Aquinas Small Cap Fund | | | | | | | | | | | | | | | | |
| | Description | | Level 1 | | | Level 2 | | | Level 3 | | | Total | |
| | Common Stocks | | $ | 11,289,393 | | | $ | — | | | $ | — | | | $ | 11,289,393 | |
| | Money Market Funds | | | 355,190 | | | | — | | | | — | | | | 355,190 | |
| | Total Investments* | | $ | 11,644,583 | | | $ | — | | | $ | — | | | $ | 11,644,583 | |
* Additional information regarding the industry classifications of these investments is disclosed in the Schedule of Investments.
There were no transfers into or out of Level 1, Level 2 or Level 3 fair value measurements during the reporting period, as compared to their classification from the previous annual report.
2. Federal Income Taxes: The Funds have elected to be treated as “regulated investment companies” under Subchapter M of the Internal Revenue Code and each Fund intends to distribute all of its investment company net taxable income and net capital gains to shareholders. Therefore, no federal income tax provision is recorded.
3. Distributions to Shareholders: The LKCM Aquinas Value, LKCM Aquinas Growth and LKCM Aquinas Small Cap Funds generally intend to pay dividends and net capital gain distributions, if any, at least on an annual basis.
4. Foreign Securities: Investing in securities of foreign companies and foreign governments involves special risks and considerations not typically associated with investing in U.S. companies and securities of the U.S. government. These risks include devaluation of currencies and future adverse political and economic developments. Moreover, securities of many foreign companies and foreign governments and their markets may be less liquid and their prices more volatile than those of securities of comparable U.S. companies and securities of the U.S. government.
5. Expense Allocation: Expenses incurred by the Funds are allocated among the Funds based upon (i) relative average net assets, (ii) a specific identification basis as incurred, or (iii) evenly among the Funds, depending on the nature of the expense.
6. Use of Estimates: The preparation of financial statements in conformity with accounting principles generally accepted in the United States of America requires management to make estimates and assumptions that affect the reported amounts of assets and liabilities and disclosure of contingent assets and liabilities at the date of the financial statements and the reported amounts of revenues and expenses during the reporting period. Actual results could differ from those estimates.
7. Guarantees and Indemnifications: In the normal course of business, the Funds enter into contracts with service providers that contain general indemnification clauses. The Funds’ maximum exposure under these arrangements is unknown as this would involve future claims against the Funds that have not yet occurred. Based on experience, the Funds expect the risk of loss to be remote.
8. Other: Security and shareholder transactions are recorded on the trade date. Realized gains and losses on sales of investments are calculated on the identified cost basis. Dividend income and dividends and distributions to shareholders are recorded on the ex-dividend date. Interest income is recognized on the accrual basis. All discounts and premiums are amortized based on the effective interest method for tax and financial reporting purposes.
Generally accepted accounting principles require that certain components of net assets be adjusted to reflect permanent differences between financial and tax reporting. These reclassifications have no effect on net assets or net asset values per share.
Accordingly, at December 31, 2012, reclassifications were recorded as follows:
| | | LKCM | | | LKCM | | | LKCM | |
| | | Aquinas | | | Aquinas | | | Aquinas Small | |
| | | Value Fund | | | Growth Fund | | | Cap Fund | |
| Accumulated net investment income (loss) | | $ | (128 | ) | | $ | 131,263 | | | $ | 2,809 | |
| Accumulated gain (loss) | | | 128 | | | | — | | | | (799 | ) |
| Paid in capital | | | — | | | | (131,263 | ) | | | (2,010 | ) |
B. Investment Advisory and Other Agreements: Luther King Capital Management Corporation serves as the investment adviser to the Funds under an Investment Advisory Agreement (the “Agreement”). The Adviser receives a fee, computed daily and payable quarterly, at the annual rates presented below as applied to each Fund’s average daily net assets. The Adviser has contractually agreed to waive all or a portion of its management fee and/or reimburse the Funds through April 30, 2013 in order to limit each Fund’s operating expenses to the annual cap rates identified below. For the year ended December 31, 2012, the Adviser waived the following management fees to meet its expense cap obligations:
| | LKCM | LKCM | LKCM |
| | Aquinas | Aquinas | Aquinas Small |
| | Value Fund | Growth Fund | Cap Fund |
| Annual Advisory Rate | 0.90% | 0.90% | 1.00% |
| Annual Cap on Expenses | 1.50% | 1.50% | 1.50% |
| Fees Waived in 2012 | $18,564 | $30,397 | $96,622 |
U.S. Bancorp Fund Services, LLC serves as transfer agent and administrator for the Trust and serves as accounting services agent for the Funds. U.S. Bank, N.A. serves as custodian for the Funds.
Distribution services are performed pursuant to a distribution contract with Quasar Distributors, LLC, the Trust’s principal underwriter.
The LKCM Funds have adopted a Rule 12b-1 plan for the LKCM Aquinas Value, LKCM Aquinas Growth and LKCM Aquinas Small Cap Funds, under which each Fund may pay up to 1.00% of its average daily net assets for distribution and other services. However, the Board of Trustees has currently only authorized a fee of 0.25% of the average daily net assets for the LKCM Aquinas Value, LKCM Aquinas Growth and LKCM Aquinas Small Cap Funds. For the year ended December 31, 2012, fees accrued by the LKCM Aquinas Value, LKCM Aquinas Growth and LKCM Aquinas Small Cap Funds pursuant to the 12b-1 Plan were $112,863, $91,025 and $29,426, respectively.
C. Fund Shares: At December 31, 2012, there was an unlimited number of shares of beneficial interest, no par value, authorized. The following table summarizes the activity in shares of each Fund:
Aquinas Value Fund
| | | Year Ended | | | Year Ended | |
| | | December 31, 2012 | | | December 31, 2011 | |
| | | Shares | | | Amount | | | Shares | | | Amount | |
| Shares sold | | | 577,271 | | | $ | 7,824,828 | | | | 1,018,388 | | | $ | 13,031,092 | |
| Shares issued to shareholders in | | | | | | | | | | | | | | | | |
| reinvestment of distributions | | | 12,532 | | | | 174,693 | | | | 3,722 | | | | 47,530 | |
| Shares redeemed | | | (589,420 | ) | | | (7,976,206 | ) | | | (740,074 | ) | | | (9,413,349 | ) |
| Redemption fee | | | | | | | 173 | | | | | | | | 1,565 | |
| Net increase | | | 383 | | | $ | 23,488 | | | | 282,036 | | | $ | 3,666,838 | |
| Shares Outstanding: | | | | | | | | | | | | | | | | |
| Beginning of period | | | 3,306,411 | | | | | | | | 3,024,375 | | | | | |
| End of period | | | 3,306,794 | | | | | | | | 3,306,411 | | | | | |
| Aquinas Growth Fund | | | | | | | | | | | | |
| | | Year Ended | | | Year Ended | |
| | | December 31, 2012 | | | December 31, 2011 | |
| | | Shares | | | Amount | | | Shares | | | Amount | |
| Shares sold | | | 253,717 | | | $ | 4,583,853 | | | | 415,153 | | | $ | 7,065,876 | |
| Shares issued to shareholders in | | | | | | | | | | | | | | | | |
| reinvestment of distributions | | | 10,439 | | | | 189,988 | | | | — | | | | — | |
| Shares redeemed | | | (357,597 | ) | | | (6,494,565 | ) | | | (288,699 | ) | | | (4,849,520 | ) |
| Redemption fee | | | | | | | 227 | | | | | | | | 581 | |
| Net increase (decrease) | | | (93,441 | ) | | $ | (1,720,497 | ) | | | 126,454 | | | $ | 2,216,937 | |
| Shares Outstanding: | | | | | | | | | | | | | | | | |
| Beginning of period | | | 1,998,873 | | | | | | | | 1,872,419 | | | | | |
| End of period | | | 1,905,432 | | | | | | | | 1,998,873 | | | | | |
| | | | | | | | | | | | | | | | | |
| Aquinas Small Cap Fund | | | | | | | | | | | | | | | | |
| | | Year Ended | | | Year Ended | |
| | | December 31, 2012 | | | December 31, 2011 | |
| | | Shares | | | Amount | | | Shares | | | Amount | |
| Shares sold | | | 921,819 | | | $ | 7,462,341 | | | | 1,723,026 | | | $ | 13,044,564 | |
| Shares issued to shareholders in | | | | | | | | | | | | | | | | |
| reinvestment of distributions | | | 117,087 | | | | 840,682 | | | | — | | | | — | |
| Shares redeemed | | | (948,412 | ) | | | (7,613,540 | ) | | | (1,142,587 | ) | | | (8,370,923 | ) |
| Redemption fee | | | | | | | 1,603 | | | | | | | | 5,893 | |
| Net increase | | | 90,494 | | | $ | 691,086 | | | | 580,439 | | | $ | 4,679,534 | |
| Shares Outstanding: | | | | | | | | | | | | | | | | |
| Beginning of period | | | 1,501,010 | | | | | | | | 920,571 | | | | | |
| End of period | | | 1,591,504 | | | | | | | | 1,501,010 | | | | | |
D. Security Transactions: Purchases and sales of investment securities, other than short-term investments, for the year ended December 31, 2012 were as follows:
| | | Purchases | | | Sales | |
| | | U.S. | | | | | | U.S. | | | | |
| | | Government | | | Other | | | Government | | | Other | |
| LKCM Aquinas Value Fund | | $ | — | | | $ | 12,610,802 | | | $ | — | | | $ | 12,720,232 | |
| LKCM Aquinas Growth Fund | | | — | | | | 14,728,496 | | | | — | | | | 15,185,231 | |
| LKCM Aquinas Small Cap Fund | | | — | | | | 9,382,820 | | | | — | | | | 9,427,171 | |
E. Tax Information: At December 31, 2012, the components of accumulated earnings (losses) on a tax basis were as follows:
| | | LKCM | | | LKCM | | | LKCM | |
| | | Aquinas | | | Aquinas | | | Aquinas Small | |
| | | Value Fund | | | Growth Fund | | | Cap Fund | |
| Cost of Investments | | $ | 34,962,465 | | | $ | 24,130,105 | | | $ | 10,543,058 | |
| Gross Unrealized Appreciation | | $ | 12,250,764 | | | $ | 11,446,334 | | | $ | 1,486,475 | |
| Gross Unrealized Depreciation | | | (441,768 | ) | | | (131,739 | ) | | | (384,950 | ) |
| Net Unrealized Appreciation | | $ | 11,808,996 | | | $ | 11,314,595 | | | $ | 1,101,525 | |
| Undistributed Ordinary Income | | $ | 5,438 | | | $ | — | | | $ | — | |
| Undistributed Long-Term Capital Gain | | | 395,041 | | | | 324,381 | | | | — | |
| Total Distributable Earnings | | $ | 400,479 | | | $ | 324,381 | | | $ | — | |
| Other Accumulated Losses | | $ | — | | | $ | — | | | $ | (26,618 | ) |
| Total Accumulated Gains | | $ | 12,209,475 | | | $ | 11,638,976 | | | $ | 1,074,907 | |
The difference between book-basis and tax-basis unrealized appreciation, if any, is attributable primarily to the tax deferral of losses on wash sales and partnership adjustments.
To the extent the Funds realize future net capital gains, taxable distributions will be reduced by any unused capital loss carryforwards as permitted by the Internal Revenue Code. During the year ended December 31, 2012, the LKCM Aquinas Value Fund and LKCM Aquinas Growth Fund utilized capital loss carryforwards of $720,778 and $103,330, respectively.
At December 31, 2012, the LKCM Aquinas Small Cap Fund deferred, on a tax basis, post-October capital losses of $26,618.
The tax components of dividends paid during the periods shown below were as follows:
| | | Year Ended December 31, 2012 | | | Year Ended December 31, 2011 | |
| | | Ordinary | | | Long-Term | | | Ordinary | | | Long-Term | |
| | | Income | | | Capital Gain | | | Income | | | Capital Gain | |
| LKCM Aquinas Value Fund | | $ | 217,662 | | | $ | — | | | $ | 60,353 | | | $ | — | |
| LKCM Aquinas Growth Fund | | | — | | | | 193,245 | | | | — | | | | — | |
| LKCM Aquinas Small Cap Fund | | | — | | | | 881,020 | | | | — | | | | — | |
The Trust has adopted financial reporting rules regarding recognition and measurement of tax positions taken or expected to be taken on a tax return. The Trust has reviewed all open tax years and major jurisdictions and concluded that there is no impact on the Funds’ financial position or results of operations. Tax years that remain open to examination by major tax jurisdictions include tax years ended December 31, 2009 through December 31, 2012. There is no tax liability resulting from unrecognized tax benefits relating to uncertain income tax positions taken or expected to be taken on tax returns as of December 31, 2012. The Funds are not aware of any tax positions for which it is reasonably possible that the total amounts of unrecognized tax benefits will significantly change in the next twelve months. If applicable, the Funds would recognize interest accrued related to unrecognized tax benefits in “interest expenses” and penalties in “other expenses” on the statement of operations.
F. Election of Trustees: On February 21, 2013, the Trust held a Special Meeting of Shareholders to elect Trustees to the Board of Trustees of the Trust. In connection with the Special Meeting of Shareholders, the Trust’s shareholders elected J. Luther King, Jr., H. Kirk Downey, Earle A. Shields, Jr., Richard J. Howell, Steven Purvis and Larry J. Lockwood to serve as trustees to the Board of Trustees of the Trust.
The following table illustrates the results of the voting with respect to the election of Trustees:
| Trustee | For | Withheld |
| J. Luther King Jr. | 83,209,072 | 2,032,811 |
| H. Kirk Downey | 83,238,239 | 2,003,646 |
| Earle A. Shields, Jr. | 83,208,667 | 2,033,217 |
| Richard J. Howell | 83,248,488 | 1,993,396 |
| Steven R. Purvis | 80,694,422 | 4,547,461 |
| Larry J. Lockwood | 84,999,777 | 242,107 |
G. Subsequent Events: In preparing these financial statements, the Trust has evaluated events after December 31, 2012 that would require adjustment to or additional disclosure in these financial statements. See Note F.
| Report of Independent Registered Public Accounting Firm |
To the Shareholders and Board of Trustees of LKCM Funds:
We have audited the accompanying statements of assets and liabilities, including the schedules of investments, of LKCM Aquinas Funds (the “Funds”) comprising the LKCM Aquinas Value Fund, LKCM Aquinas Growth Fund, and LKCM Aquinas Small Cap Fund as of December 31, 2012, and the related statements of operations for the year then ended, the statements of changes in net assets for each of the two years in the period then ended, and the financial highlights for each of the five years in the period then ended. These financial statements and financial highlights are the responsibility of the Funds’ management. Our responsibility is to express an opinion on these financial statements and financial highlights based on our audits.
We conducted our audits in accordance with the standards of the Public Company Accounting Oversight Board (United States). Those standards require that we plan and perform the audit to obtain reasonable assurance about whether the financial statements and financial highlights are free of material misstatement. The Funds are not required to have, nor were we engaged to perform, an audit of their internal control over financial reporting. Our audits included consideration of internal control over financial reporting as a basis for designing audit procedures that are appropriate in the circumstances, but not for the purpose of expressing an opinion on the effectiveness of the Funds’ internal control over financial reporting. Accordingly, we express no such opinion. An audit also includes examining, on a test basis, evidence supporting the amounts and disclosures in the financial statements, assessing the accounting principles used and significant estimates made by management, as well as evaluating the overall financial statement presentation. Our procedures included confirmation of securities owned as of December 31, 2012, by correspondence with the custodian and brokers. We believe that our audits provide a reasonable basis for our opinion.
In our opinion, the financial statements and financial highlights referred to above present fairly, in all material respects, the financial position of each of the portfolios constituting the LKCM Aquinas Funds as of December 31, 2012, the results of their operations for the year then ended, the changes in their net assets for each of the two years in the period then ended, and the financial highlights for each of the five years in the period then ended in conformity with accounting principles generally accepted in the United States of America.
Milwaukee, Wisconsin
February 27, 2013
| LKCM Funds |
| Additional Information | |
December 31, 2012
Availability of Proxy Voting Information: A description of the policies and procedures that the Funds use to determine how to vote proxies relating to their portfolio securities, as well as the proxy voting record, is available without charge, upon request, by calling toll-free 1-800-423-6369 or on the SEC website at http://www.sec.gov. The actual voting records relating to portfolio securities during the twelve month periods ended June 30 (as filed with the SEC on Form N-PX) are available without charge, upon request, by calling the Funds toll free at 1-800-423-6369 or by accessing the SEC’s website at www.sec.gov.
Availability of Quarterly Portfolio Schedule: The Funds’ are required to file complete schedules of portfolio holdings with the SEC for the first and third fiscal quarters on Form N-Q. Once filed, the Funds’ Form N-Q is available without charge upon request on the SEC’s website (http://www.sec.gov) and may be available by calling 1-800-423-6369. You can also obtain copies of Form N-Q by (i) visiting the SEC’s Public Reference Room in Washington, DC (information on the operation of the Public Reference Room may be obtained by calling 1-800-SEC-0330); (ii) sending your request and a duplicating fee to the SEC’s Public Reference Room, Washington, DC 20549; or (iii) sending your request electronically to publicinfosec.gov.
Information about the Funds’ Trustees:
The business and affairs of the Funds are managed under the direction of the Funds’ Board of Trustees. Information pertaining to the Trustees of the Funds is set forth below. The Statement of Additional Information includes additional information about the Funds’ Trustees and officers and is available, without charge, upon request by calling 1-800-688-LKCM.
| | | | | | |
| | | Term of | | Number of | |
| | | Office & | | Portfolios in | |
| | Position(s) | Length | | Fund Complex | Other |
| Name, Address | Held with | of Time | Principal Occupation | Overseen | Directorships |
| and Age | the Trust | Served(1) | During Past Five Years | by Trustee | Held by Trustee |
| Disinterested Trustees: | | | | | |
| H. Kirk Downey | Chairman of | Since 2005 | President and CEO, Texas | 8 | Non-Executive Chairman |
| 301 Commerce Street | the Board | | Systems, LLC and CEO, Texas | | of the Board of AZZ |
| Suite 1600 | of Trustees | | learning systems LLC since 1999; | | Incorporated, |
| Fort Worth, TX 76102 | | | Dean, M.J. Neeley School of | | (a manufacturing |
| Year of Birth: 1942 | Trustee | Since 1994 | Business, Texas Christian University | | company). |
| | | | Business School from 1987 to 1999. | | |
| | | | | | |
| Earle A. Shields, Jr. | Trustee | Since 1994 | Consultant; formerly Consultant | 8 | Priests Pension Fund |
| 301 Commerce Street | | | for NASDAQ Corp. and Vice | | of the Catholic Diocese |
| Suite 1600 | | | President, Merrill Lynch & Co., Inc. | | of Fort Worth, Lay |
| Fort Worth, TX 76102 | | | | | Workers Pension Fund |
| Year of Birth: 1920 | | | | | of the Catholic Diocese |
| | | | | | of Fort Worth, St. Joseph |
| | | | | | Health Care Trust, Catholic |
| | | | | | Schools Trust and Catholic |
| | | | | | Foundation of North Texas. |
| | | | | | |
| Richard J. Howell | Trustee | Since 2005 | CPA; Adjunct Faculty at SMU | 8 | Red Robin Gourmet |
| 301 Commerce Street | | | Cox School of Business from | | Burgers, Inc. |
| Suite 1600 | Chairman of | Since 2008 | 2004 to 2009; Consulting Services, | | |
| Fort Worth, TX 76102 | the Audit and | | since 2002; Audit Partner, Arthur | | |
| Year of Birth: 1942 | Compliance | | Andersen LLP from 1974 to 2002. | | |
| | Committee | | | | |
| | | | | | |
| Larry J. Lockwood | Trustee | Since 2013 | C.R. Williams Professor of Finance, | 8 | N/A |
| 301 Commerce Street | | | Stan Block Endowed Chair in | | |
| Suite 1600 | | | Finance, Department of Finance, | | |
| Fort Worth, TX 76102 | | | Neeley School of Business, Texas | | |
| Year of Birth: 1953 | | | Christian University since 1994. | | |
| | | | | | |
| Interested Trustees: | | | | | |
J. Luther King, Jr.(2) | Trustee, | Since 1994 | Chairman, President and Director, | 8 | 4K Land & Cattle |
| 301 Commerce Street | President and | | Luther King Capital Management | | Company (ranching), |
| Suite 1600 | Chief Executive | | Corporation since 1979. | | Hunt Forest Products |
| Fort Worth, TX 76102 | Officer | | | | (lumber), Southwestern |
| Year of Birth: 1940 | | | | | Exposition & Livestock |
| | | | | | (livestock), Southwest |
| | | | | | JLK Corporation |
| | | | | | (management company), |
| | | | | | Texas Christian |
| | | | | | University, Texas |
| | | | | | Southwestern Cattleraisers |
| | | | | | Foundation (livestock), |
| | | | | | Tyler Technologies |
| | | | | | (information management |
| | | | | | company for government |
| | | | | | agencies), King Ranch, |
| | | | | | Inc. (ranching), and Amon |
| | | | | | Carter Museum of |
| | | | | | American Art. |
(1) Each Trustee holds office during the lifetime of the Trust until that individual resigns, retires or is otherwise removed or replaced.
(2) Mr. King and Mr. Purvis are “interested persons” of the Trust (as defined in the 1940 Act) because of their affiliation with the Adviser.
Information about the Funds’ Trustees, Continued
| | | | | | |
| | | Term of | | Number of | |
| | | Office & | | Portfolios in | |
| | Position(s) | Length | | Fund Complex | Other |
| Name, Address | Held with | of Time | Principal Occupation | Overseen | Directorships |
| and Age | the Trust | Served(1) | During Past Five Years | by Trustee | Held by Trustee |
| Interested Trustees, Continued: | | | | | |
Steve R. Purvis(2) | Trustee | Since 2013 | Principal, Luther King Capital | 8 | N/A |
| 301 Commerce Street | | | Management since 2003, Vice | | |
| Suite 1600 | Vice President | Since 2000 | President and Portfolio Adviser | | |
| Fort Worth, TX 76102 | | | Luther King Capital Management | | |
| Year of Birth: 1964 | | | since 1996. | | |
| | | | |
| | | Term of | |
| | | Office & | |
| | Position(s) | Length | |
| Name, Address | Held with | of Time | Principal Occupation |
| and Age | the Trust | Served(1) | During Past Five Years |
| Officers: | | | |
| J. Luther King, Jr. | Trustee, | Since 1994 | Chairman, President and Director, Luther King Capital Management |
| 301 Commerce Street | President and | | Corporation since 1979. |
| Suite 1600 | Chief Executive | | |
| Fort Worth, TX 76102 | Officer | | |
| Year of Birth: 1940 | | | |
| | | | |
| Paul W. Greenwell | Vice President | Since 1996 | Principal, Luther King Capital Management since 1986, |
| 301 Commerce Street | | | Vice President and Portfolio Manager, Luther King Capital |
| Suite 1600 | | | Management since 1983. |
| Fort Worth, TX 76102 | | | |
| Year of Birth: 1950 | | | |
| | | | |
| Richard Lenart | Secretary and | Since 2006 | Luther King Capital Management since 2005. |
| 301 Commerce Street | Treasurer | | |
| Suite 1600 | | | |
| Fort Worth, TX 76102 | | | |
| Year of Birth: 1966 | | | |
| | | | |
| Steven R. Purvis | Trustee | Since 2013 | Principal, Luther King Capital Management since 2003, |
| 301 Commerce Street | | | Vice President and Portfolio Manager, Luther King Capital |
| Suite 1600 | Vice President | Since 2000 | Management since 1996. |
| Fort Worth, TX 76102 | | | |
| Year of Birth: 1964 | | | |
| | | | |
| Jacob D. Smith | Chief | Since 2010 | Vice President, General Counsel and Chief Compliance |
| 301 Commerce Street | Financial | | Officer, Luther King Capital Management since 2006. |
| Suite 1600 | Officer | | |
| Fort Worth, TX 76102 | | | |
| Year of Birth: 1974 | Chief | Since 2006 | |
| | Compliance | | |
| | Officer | | |
(1) Each Trustee holds office during the lifetime of the Trust until that individual resigns, retires or is otherwise removed or replaced.
(2) Mr. King and Mr. Purvis are “interested persons” of the Trust (as defined in the 1940 Act) because of their affiliation with the Adviser.
LKCM FUNDS
PRIVACY NOTICE
Our Commitment to Your Privacy
At LKCM Funds, we are committed to safeguarding the confidentiality and privacy of personal information about our shareholders. This privacy notice describes the policies and procedures we have implemented to protect the privacy of your personal information as well as the sources through which we may obtain personal information about you.
How We Protect Your Personal Information
Protecting your personal information is an important priority at LKCM Funds. Accordingly, we have implemented policies and procedures designed to safeguard your personal information, such as your social security number, portfolio and investment history, account numbers, account balances, and contact information from unauthorized access. Pursuant to these policies and procedures, we maintain various physical, technological, and administrative safeguards to protect the security and confidentiality of your personal information, and we adapt these safeguards to respond to evolving technological and other standards.
We do not disclose nonpublic personal information about you to nonaffiliated third parties, except as authorized by you or your representatives, as required or permitted by law, or to certain nonaffiliated third parties, such as custodians, brokers, auditors, attorneys, or proxy administrators, that assist us in providing investment management services to you or on your behalf.
How We Obtain Your Personal Information
We collect nonpublic personal information about you from various sources, including documents and other information that you or your representatives provide to us, communications that we have with you or your representatives, and documents and other information related to your investments or portfolio experience with us.
Please do not hesitate to contact our Chief Compliance Officer if you have any questions regarding the measures we have implemented to protect the privacy of your personal information.
U.S. Bancorp Fund Services, LLC
P.O. Box 701
Milwaukee, WI 53201-0701
LKCM FUNDS
P.O. Box 701
Milwaukee, WI 53201-0701
Officers and Trustees
| J. Luther King, Jr., CFA, CIC | H. Kirk Downey | Larry J. Lockwood |
| Trustee, President | Chairman of the Board | Trustee |
| | | |
| Paul W. Greenwell | Richard J. Howell | Secretary & Treasurer |
| Vice President | Trustee | Richard Lenart |
| | | |
| Steven R. Purvis, CFA | Earle A. Shields, Jr. | Jacob D. Smith |
| Trustee, Vice President | Trustee | Chief Financial Officer |
| | Chief Compliance Officer | |
Investment Adviser
Luther King Capital Management Corporation
301 Commerce Street, Suite 1600
Fort Worth, TX 76102
Administrator, Transfer Agent, Dividend
Paying Agent & Shareholder Servicing Agent
U.S. Bancorp Fund Services, LLC
P.O. Box 701
Milwaukee, WI 53201-0701
Custodian
U.S. Bank, N.A.
1555 N. River Center Drive, Suite 302
Milwaukee, WI 53212
Independent Registered Public Accounting Firm
Deloitte & Touche LLP
555 E. Wells St., Suite 1400
Milwaukee, WI 53202
Distributor
Quasar Distributors, LLC
615 E. Michigan Street
Milwaukee, WI 53202
Item 2. Code of Ethics.
The registrant has adopted a code of ethics that applies to the registrant’s principal executive officer and principal financial officer. The registrant has not made any amendments to its code of ethics during the period covered by this report. The registrant has not granted any waivers from any provisions of the code of ethics during the period covered by this report.
A copy of the registrant’s Code of Ethics is filed herewith.
Item 3. Audit Committee Financial Expert.
The registrant’s board of trustees has determined that there is at least one audit committee financial expert serving on its audit committee. Richard J. Howell is the “audit committee financial expert” and is considered to be “independent” as each term is defined in Item 3 of Form N-CSR.
Item 4. Principal Accountant Fees and Services.
The registrant has engaged its principal accountant to perform audit services, audit-related services, tax services and other services during the past two fiscal years. “Audit services” refer to performing an audit of the registrant's annual financial statements or services that are normally provided by the accountant in connection with statutory and regulatory filings or engagements for those fiscal years. “Audit-related services” refer to the assurance and related services by the principal accountant that are reasonably related to the performance of the audit. “Tax services” refer to professional services rendered by the principal accountant for tax compliance, tax advice, and tax planning. The following table details the aggregate fees billed or expected to be billed for each of the last two fiscal years for audit fees, audit-related fees, tax fees and other fees by the principal accountant.
| | FYE 12/31/2012 | FYE 12/31/2011 |
| Audit Fees | $132,500 | $134,000 |
| Audit-Related Fees | $0 | $0 |
| Tax Fees | $29,000 | $32,600 |
| All Other Fees | $0 | $0 |
The audit committee has adopted pre-approval policies and procedures that require the audit committee to pre-approve all audit and non-audit services of the registrant, including services provided to any entity affiliated with the registrant.
The percentage of fees billed by Deloitte & Touche LLP applicable to non-audit services pursuant to waiver of pre-approval requirement were as follows:
| | FYE 12/31/2012 | FYE 12/31/2011 |
| Audit-Related Fees | 0% | 0% |
| Tax Fees | 0% | 0% |
| All Other Fees | 0% | 0% |
All of the principal accountant’s hours spent on auditing the registrant’s financial statements were attributed to work performed by full-time permanent employees of the principal accountant.
The following table indicates the non-audit fees billed or expected to be billed by the registrant’s accountant for services to the registrant and to the registrant’s investment adviser (including any entity controlling, controlled by, or under common control with the adviser) for the last two years. The audit committee of the board of trustees has considered whether the provision of non-audit services that were rendered to the registrant's investment adviser is compatible with maintaining the principal accountant's independence and has concluded that the provision of such non-audit services by the accountant has not compromised the accountant’s independence.
| Non-Audit Related Fees | FYE 12/31/2012 | FYE 12/31/2011 |
| Registrant | $29,000 | $32,600 |
| Registrant’s Investment Adviser | $0 | $0 |
Item 5. Audit Committee of Listed Registrants.
Not applicable to registrants who are not listed issuers (as defined in Rule 10A-3 under the Securities Exchange Act of 1934).
Item 6. Investments.
Schedule of Investments is included as part of the report to shareholders filed under Item 1 of this Form.
Item 7. Disclosure of Proxy Voting Policies and Procedures for Closed-End Management Investment Companies.
Not applicable to open-end investment companies.
Item 8. Portfolio Managers of Closed-End Management Investment Companies.
Not applicable to open-end investment companies.
Item 9. Purchases of Equity Securities by Closed-End Management Investment Company and Affiliated Purchasers.
Not applicable to open-end investment companies.
Item 10. Submission of Matters to a Vote of Security Holders.
There have been no material changes to the procedures by which shareholders may recommend nominees to the registrant’s board of trustees.
Item 11. Controls and Procedures.
(a) The registrant’s Chief Executive Officer and Chief Financial Officer have reviewed the registrant's disclosure controls and procedures (as defined in Rule 30a-3(c) under the Investment Company Act of 1940 (the “Act”)) as of a date within 90 days of the filing of this report, as required by Rule 30a-3(b) under the Act and Rules 13a-15(b) or 15d-15(b) under the Securities Exchange Act of 1934. Based on their review, such officers have concluded that the disclosure controls and procedures are reasonably designed to ensure that information required to be disclosed in this report is recorded, processed, summarized and reported within the required time periods and that information required to be disclosed by the registrant in reports that it files or submits on Form N-CSR is accumulated and communicated to the registrant’s management, including its principal executive and financial officers, as appropriate to allow timely decisions regarding required disclosure.
(b) There were no changes in the registrant's internal control over financial reporting (as defined in Rule 30a-3(d) under the Act) that occurred during the second fiscal quarter of the period covered by this report that have materially affected, or are reasonably likely to materially affect, the registrant's internal control over financial reporting.
Item 12. Exhibits.
| (a) | (1) Any code of ethics or amendment thereto, that is the subject of the disclosure required by Item 2, to the extent that the registrant intends to satisfy Item 2 requirements through filing an exhibit. Filed herewith. |
(2) A separate certification for each principal executive and principal financial officer pursuant to Section 302 of the Sarbanes-Oxley Act of 2002. Filed herewith.
(3) Any written solicitation to purchase securities under Rule 23c-1 under the Act sent or given during the period covered by the report by or on behalf of the registrant to 10 or more persons. Not applicable to open-end investment companies.
| (b) | Certifications pursuant to Section 906 of the Sarbanes-Oxley Act of 2002. Furnished herewith. |
SIGNATURES
Pursuant to the requirements of the Securities Exchange Act of 1934 and the Investment Company Act of 1940, the registrant has duly caused this report to be signed on its behalf by the undersigned, thereunto duly authorized.
(Registrant) LKCM Funds
By (Signature and Title) /s/ J. Luther King, Jr.
J. Luther King, Jr., President
Date 2/27/2013
Pursuant to the requirements of the Securities Exchange Act of 1934 and the Investment Company Act of 1940, this report has been signed below by the following persons on behalf of the registrant and in the capacities and on the dates indicated.
By (Signature and Title) /s/ J. Luther King, Jr.
J. Luther King, Jr., President
Date 2/27/2013
By (Signature and Title) /s/ Jacob D. Smith
Jacob D. Smith, Chief Financial Officer
Date 2/27/2013