As filed with the Securities and Exchange Commission on 2/29/2016
UNITED STATES
SECURITIES AND EXCHANGE COMMISSION
Washington, D.C. 20549
FORM N-CSR
CERTIFIED SHAREHOLDER REPORT OF REGISTERED
MANAGEMENT INVESTMENT COMPANIES
Investment Company Act file number 811-8352
LKCM Funds
(Exact name of registrant as specified in charter)
c/o Luther King Capital Management Corporation
301 Commerce Street, Suite 1600
Fort Worth, TX 76102
(Address of principal executive offices) (Zip code)
K&L Gates LLP
1601 K Street, NW
Washington, DC 20006
(Name and address of agent for service)
1-800-688-LKCM and 1-800-423-6369
Registrant’s telephone number, including area code
Date of fiscal year end: December 31
Date of reporting period: December 31, 2015
Item 1. Reports to Stockholders.
1
LKCM
FUNDS
LKCM Small Cap Equity Fund
LKCM Small-Mid Cap Equity Fund
LKCM Equity Fund
LKCM Balanced Fund
LKCM Fixed Income Fund
Annual Report
December 31, 2015
Dear Fellow Shareholders:
We report the following performance information for the LKCM Funds:
| | | | | | | | | | | | | | | | | | | | | | | | | | | | | | | | |
Funds | | Inception
Dates | | | NAV @
12/31/15 | | | Net
Expense
Ratio*, ** | | | Gross
Expense
Ratio** | | | One Year
Total
Return
Ended
12/31/15 | | | Five Year
Average
Annualized
Return
Ended
12/31/15 | | | Ten Year
Average
Annualized
Return
Ended
12/31/15 | | | Avg.
Annual
Total
Return
Since
Incept. | |
LKCM Equity Fund - | | | | | | | | | | | | | | | | | | | | | | | | | | | | | | | | |
Institutional Class | | | 1/3/96 | | | $ | 21.40 | | | | 0.80% | | | | 0.92% | | | | -3.54% | | | | 9.90% | | | | 7.41% | | | | 7.88% | |
S&P 500® Index1 | | | | | | | | | | | | | | | | | | | 1.38% | | | | 12.57% | | | | 7.31% | | | | 8.14% | |
LKCM Small Cap Equity Fund - | | | | | | | | | | | | | | | | | | | | | | | | | | | | | | | | |
Institutional Class | | | 7/14/94 | | | $ | 19.86 | | | | 0.94% | | | | 0.94% | | | | -5.58% | | | | 7.22% | | | | 5.67% | | | | 10.23% | |
Russell 2000® Index2 | | | | | | | | | | | | | | | | | | | -4.41% | | | | 9.19% | | | | 6.80% | | | | 8.85% | |
LKCM Small Cap Equity Fund - | | | | | | | | | | | | | | | | | | | | | | | | | | | | | | | | |
Adviser Class | | | 6/5/03 | | | $ | 18.93 | | | | 1.19% | | | | 1.19% | | | | -5.81% | | | | 6.95% | | | | 5.40% | | | | 8.72% | |
Russell 2000® Index2 | | | | | | | | | | | | | | | | | | | -4.41% | | | | 9.19% | | | | 6.80% | | | | 8.94% | |
LKCM Small-Mid Cap Equity Fund - | | | | | | | | | | | | | | | | | | | | | | | | | | | | | | | | |
Institutional Class | | | 5/2/11 | | | $ | 11.15 | | | | 1.00% | | | | 1.20% | | | | -1.41% | | | | N/A | | | | N/A | | | | 4.39% | |
Russell 2500® Index3 | | | | | | | | | | | | | | | | | | | -2.90% | | | | N/A | | | | N/A | | | | 8.45% | |
LKCM Balanced Fund | | | 12/30/97 | | | $ | 19.60 | | | | 0.80% | | | | 0.99% | | | | 0.91% | | | | 8.81% | | | | 7.17% | | | | 6.14% | |
S&P 500® Index1 | | | | | | | | | | | | | | | | | | | 1.38% | | | | 12.57% | | | | 7.31% | | | | 6.18% | |
Barclays U.S. Intermediate | | | | | | | | | | | | | | | | | | | | | | | | | | | | | | | | |
Government/Credit Bond Index4 | | | | | | | | | | | | | | | | | | | 1.07% | | | | 2.58% | | | | 4.04% | | | | 4.82% | |
LKCM Fixed Income Fund | | | 12/30/97 | | | $ | 10.50 | | | | 0.50% | | | | 0.70% | | | | -0.27% | | | | 2.21% | | | | 4.02% | | | | 4.49% | |
Barclays U.S. Intermediate | | | | | | | | | | | | | | | | | | | | | | | | | | | | | | | | |
Government/Credit Bond Index4 | | | | | | | | | | | | | | | | | | | 1.07% | | | | 2.58% | | | | 4.04% | | | | 4.82% | |
Performance data quoted represents past performance and does not guarantee future results. The investment return and principal value of an investment will fluctuate so that an investor’s shares, when redeemed, may be worth more or less than the original cost. Current performance of the Fund may be lower or higher than the performance quoted. Performance data current to the most recent month end may be obtained by calling 1-800-688-LKCM. The Funds impose a 1.00% redemption fee on shares held less than 30 days. If reflected, the fee would reduce performance shown.
| * | Luther King Capital Management Corporation, the Funds’ adviser, has contractually agreed to waive all or a portion of its management fee and/or reimburse expenses of the Fund to maintain designated expense ratios through April 30, 2016, other than the LKCM Fixed Income Fund, for which Luther King Capital Management Corporation has agreed to waive its management fee and/or reimburse expenses of the Fund to maintain such designated expense ratio through May 31, 2016. This expense limitation excludes interest, taxes, brokerage commissions, indirect fees and expenses related to investments in other investment companies, including money market funds, and extraordinary expenses. Investment performance reflects fee waivers, if any, in effect. In the absence of such waivers, total return would be reduced. Investment performance is based upon the net expense ratio. LKCM waived management fees and/or reimbursed expenses for each Fund, other than the LKCM Small Cap Equity Fund, during the fiscal year ended December 31, 2015. |
| ** | Expense ratios above are as of December 31, 2014, the Funds’ prior fiscal year end, as reported in the Funds’ current prospectus as supplemented on May 22, 2015. Expense ratios reported for other periods in the financial highlights of this report for the Funds’ fiscal year ended December 31, 2015 may differ due to the inclusion of acquired fund fees and expenses. |
| 1 | The S&P 500® Index is an unmanaged capitalization-weighted index of 500 selected stocks that is generally representative of the performance of large capitalization companies in the U.S. stock market. |
| 2 | The Russell 2000® Index is an unmanaged index which measures the performance of the 2,000 smallest companies in the Russell 3000® Index. |
| 3 | The Russell 2500® Index is an unmanaged index which measures the performance of the 2,500 smallest companies in the Russell 3000® Index. |
| 4 | The Barclays U.S. Intermediate Government/Credit Bond Index is an unmanaged market value weighted index measuring both the principal price changes of, and income provided by, the underlying universe of securities that comprise the index. Securities included in the index must meet the following criteria: fixed as opposed to variable rate; remaining maturity of one to ten years; minimum outstanding par value of $250 million; rated investment grade or higher by Moody’s Investors Service or equivalent; must be dollar denominated and non-convertible; and must be publicly issued. |
Note: These indices defined above are not available for direct investment and the index performance therefore does not include expenses.
2015 Review
2015 proved to be an unkind year for nearly all asset classes. Commodities were especially weak due to the downturn in global manufacturing activity, most notably in China. The story of global oversupply of crude oil is well known at this point. Technological innovation in shale oil production domestically and the unwillingness of the Organization of Petroleum Exporting Countries, or OPEC, to curtail production, in conjunction with a rising U.S. dollar, contributed to an approximate 31% decline in the price of West Texas Intermediate crude oil in 2015. This price decline occurred on the back of an approximate 46% decline in West Texas Intermediate crude oil in 2014. Domestic intermediate-term investment grade bond returns were slightly positive during the year, while domestic high yield bonds and emerging market bonds posted negative returns for 2015.
2
We believe that there were two key divergences within the domestic equity market during the year. First, growth stocks outpaced value stocks, which typically is characteristic of the mature stage of an equity market cycle. We believe it is common to see the equity market leadership narrow during this phase, as it did in 2015. Second, large capitalization stocks outperformed small capitalization stocks, as reflected by the Standard & Poor’s 500 Index, or S&P 500® Index, outperformance of the Russell 2000® Index. Thus, we believe the U.S. equity market in 2015 can best be characterized as one in which a narrow group of larger capitalization companies performed best. For example, if the market-capitalization weighted S&P 500® Index was instead equal weighted, the S&P 500® Index would have declined approximately 4.1%, not including dividends, for 2015, versus the 1.38% return posted by the S&P 500® Index during 2015.
In December 2015, the Federal Reserve raised the federal funds target interest rate 0.25% for the first time since June 2006, bringing to a close a seven-year chapter of zero percent interest rates. When the Federal Reserve raises interest rates, it is typically an important marker in the business cycle. In our view, the first such interest rate hike is often seen as conviction by the Federal Reserve that an economic expansion is intensifying. We believe capital markets generally are sanguine about the first couple of interest rate increases by the Federal Reserve. Historically, the tenor typically changes once inflation readings become sufficiently strong that capital markets perceive the Federal Reserve may quicken its pace of restricting monetary policy. We believe this often results in slowing economic growth, inflationary declines, and a resetting of the business cycle. We believe we are in the early stages of monetary policy normalization, and market expectations are for interest rates to rise gradually. If the Federal Reserve were to raise interest rates at each consecutive meeting in 2016, it would be a negative surprise to capital markets in our view. We believe such action would be concerning unless such steps were in response to significantly stronger economic data than current trend. Our forecast is for a very gradual rise in interest rates commensurate with very moderate inflation readings and modest real economic growth in 2016.
The Federal Reserve appears to be charting a new course this cycle. We believe the Federal Reserve most often raises interest rates in response to an uncomfortable pace of rising inflation. Inflation is generally a lagging economic indicator, meaning the Federal Reserve typically acts well after the economic growth is in full bloom. Given the lack of inflationary pressures we have seen to date, we believe the Federal Reserve is attempting to normalize monetary policy coincident with what it perceives could be increasing price pressures as domestic economic and labor economy slack appear to continue to decline.
2016 Outlook
At any given time, there are both structural and cyclical forces at work on the economy. Structural forces typically include trends in demographics, fiscal debt burdens, tax regimes, and pace of innovation. Cyclical forces generally are shorter-term in nature, such as changes in monetary or fiscal policy, inflation, and trade balances. We believe the sweet spot of economic growth occurs in periods when both structural and cyclical forces provide tailwinds; this occurred in Japan in the 1980s, the United States in the 1990s, and China in the 2000s. In our view, when structural and cyclical forces collide, cyclical forces often prevail for a period of time before structural forces again win the day. Structural forces weighed on the global economy in 2015. In our view, the repeated possibilities of a Greek exit from the European Union and the United Kingdom’s upcoming referendum on European Union membership are proxy battles for the structural challenges of a monetary union without a fiscal union. In China household consumption as a percentage of Gross Domestic Product (GDP) remains stagnant and well below the rate of developed economies and presents another structural headwind. Domestically, the United States is facing a continuous rise in the number of aging baby boomers and the corresponding strain that imposes on fiscal resources from entitlement programs. These are all examples of structural challenges that continue to weigh on key contributors to aggregate global GDP.
To ease these structural issues, governments have looked first to cyclical forces such as monetary policy. Unfortunately, we believe monetary policy has now achieved much of what it can in terms of bolstering economic growth and, globally, there appears to be scant room for interest rates to fall further. The remaining two forms of monetary transmission, supporting asset prices through quantitative easing and currency depreciation, are less effective in our view. There are inherent risks to both of these channels, including creating asset valuation bubbles and currency wars. Although structural challenges appear to impair potential economic growth rates around the globe, the growth path for the United States appears higher than for Japan or Europe where structural challenges seem greatest and economies appear less dynamic.
With cyclical tailwinds in the United States losing some of their intensity, we believe that domestic economic growth is again likely to remain muted in 2016, although stronger than in 2015. Consequently, we forecast corporate profit growth will resume in 2016 following a hiatus in 2015. Earnings within the Energy sector declined approximately 60% in 2015, which contributed to virtually no corporate earnings growth for the S&P 500® Index during 2015. Although we anticipate earnings in the Energy sector will decline again this year in aggregate, the sector now represents only approximately 3.8% of S&P 500® Index earnings, down from approximately 11.7% in the summer of 2014. We believe corporate profits, as measured by S&P 500® Index earnings, should grow 4-6% for 2016 with the negative impact of a strong U.S. dollar on firms’ income statements being less in 2016. Overall, we think corporate balance sheets remain healthy with near record levels of cash and reasonable debt burdens. Interest rates for lower quality balance sheets have risen recently, influenced in part by deterioration in the prospects for select energy companies. While we believe this phenomenon has been largely contained to the Energy sector, we remain vigilant with regard to rising credit spreads outside of the Energy sector, as credit spreads are often harbingers of future economic stress.
Although the equity market displayed characteristics of a mature equity market in 2015, our forecast is for the current bull market to remain in place. We note, however, that real GDP growth has been sub-par during this expansion, averaging just approximately 1.8%
3
annually compared with approximately 4.2% for previous expansions since 1960. We think the longevity of this economic cycle and accompanying bull market in equities is consistent with a benign inflation outlook. The two shortest economic cycles since 1960 both began in the highly inflationary 1970s. If our forecast for modest inflation is accurate, then we believe it is reasonable to expect that this current economic cycle has multiple years remaining to grow. Unfortunately, history teaches that when economic growth is less robust, capital market volatility is typically higher. Finally, there always remains the possibility of significant exogenous events such as terrorist acts, an expanding Middle Eastern conflict, or escalating tensions on the Korean Peninsula or Crimea. These events are impossible to predict in scope or magnitude, but any of which could negatively impact our forecast.
In our view, the base case for 2016 is that investors must continue to adjust to a lower expected return environment, as slow growth and deflationary pressures are the result of structural forces rather than simply residue from the financial crisis. We are likely to witness the continued struggle between governments’ need to address long-run structural issues and mollifying current issues of the day such as preventing deflation and propping-up job growth. As we enter a Presidential election year, it is a reminder of our view that simulative fiscal policy has largely been absent in recent years and always possesses the promise to be a catalyst for growth in the future.
LKCM Equity Fund
The LKCM Equity Fund declined 3.54% for the year ended December 31, 2015 against the 1.38% return for the Fund’s benchmark, the S&P 500® Index. Stock selection in the Industrials, Consumer Discretionary and Information Technology sectors contributed to underperformance relative to the benchmark, along with the Fund’s overweight positions in the Materials and Industrials sectors and underweight position in the Information Technology sector relative to the benchmark. We remain committed to our investment strategy and stock selection process for the Fund, and we believe the Fund is well positioned for 2016 with a portfolio of high quality companies that we believe have solid balance sheets, are reasonably valued, and otherwise meet our investment criteria.
LKCM Small Cap Equity Fund
The LKCM Small Cap Equity Fund—Institutional Class declined 5.58% for the year ended December 31, 2015 against the 4.41% decline for the Fund’s benchmark, the Russell 2000® Index. Stock selection was solid in the Energy and Information Technology sectors relative to the benchmark, while the Fund experienced relative weakness in stock selection in the Healthcare sector. The Fund benefited from overweight positions in the Healthcare and Information Technology sectors relative to the benchmark, while the Fund’s overweight position in the Industrials sector detracted from relative performance. During the year, two of the Fund’s portfolio companies were acquired at significant premiums to the Fund’s cost basis in those companies. As a core manager that focuses on high quality companies that meet our stringent investment criteria, we continue to have the Fund tilted towards growth companies as we believe this area provides the most attractive investment opportunities for the Fund in the current market environment.
LKCM Small-Mid Cap Equity Fund
The LKCM Small-Mid Cap Equity Fund outperformed its benchmark, the Russell 2500® Index, during the year ended December 31, 2015, declining 1.41% against the 2.90% decline for the benchmark. Stock selection and sector allocation decisions contributed to the Fund’s outperformance relative to the benchmark. Stock selection was solid in the Energy and Industrials sectors relative to the benchmark, while the Fund experienced relative weakness in stock selection in the Healthcare sector. The Fund benefited from an underweight position in the Materials sector and an overweight position in the Healthcare sector relative to the benchmark. During the year, two of the Fund’s portfolio companies were acquired at significant premiums to the Fund’s cost basis in those companies. As a core manager that focuses on high quality companies that meet our stringent investment criteria, we continue to have the Fund tilted towards growth companies as we believe this area provides the most attractive investment opportunities for the Fund in the current market environment.
LKCM Fixed Income Fund
The LKCM Fixed Income Fund declined 0.27% for the year ended December 31, 2015 against the 1.07% return for the Fund’s benchmark, the Barclays U.S. Intermediate Government/Credit Bond Index. The Fund’s overweight position in corporate bonds relative to the benchmark, specifically BBB-rated corporate bonds, was the primary detractor from relative performance as credit spreads widened substantially with the sharp decline in commodity prices and the challenged growth in the manufacturing sector. In this flight-to-quality environment, government and agency bonds outperformed their lower quality counterparts in the corporate bond sector. The Fund’s defensive average duration posture of 3.2 years, versus an average duration of 4.0 years for the benchmark, contributed to relative performance ahead of the much-anticipated tightening of monetary policy by the Federal Reserve in December as shorter duration securities generally outperformed their longer duration counterparts. The Fund remains largely focused on short-to-intermediate investment grade corporate bonds in an effort to manage risk during this challenging slow growth, low interest rate environment.
LKCM Balanced Fund
The LKCM Balanced Fund advanced 0.91% for the year ended December 31, 2015 against the 1.38% return for the S&P 500 Index® and the 1.07% return for the Barclays U.S. Intermediate Government/Credit Bond Index. Both the equity and the fixed income sectors
4
detracted from the Fund’s performance relative to the benchmark. The Fund’s fixed income sector’s focus on short-to-intermediate high quality corporate bonds benefited the Fund’s relative performance as lower quality, longer maturity bonds underperformed during the year. We believe the Fund is well-positioned to meet the challenges and opportunities the financial markets are expected to present in the upcoming year.
J. Luther King, Jr., CFA, CIC
February 1, 2016
The information provided herein represents the opinion of J. Luther King, Jr., CFA, CIC and is not intended to be a forecast of future events, a guarantee of future results, nor investment advice.
Please refer to the Schedule of Investments found on pages 15-27 of the report for more information on Fund holdings. Fund holdings and sector allocations are subject to change and are not recommendations to buy or sell any securities.
Mutual fund investing involves risk. Principal loss is possible. Past performance is not a guarantee of future results. Small and medium capitalization funds typically carry additional risks, since smaller companies generally have a higher risk of failure, and, historically, their stocks have experienced a greater degree of market volatility than stocks on average. Investments in debt securities typically decrease in value when interest rates rise. This risk is greater for longer-term debt securities. Investments in mortgage backed securities include additional risks that investors should be aware of such as credit risk, prepayment risk, possible illiquidity and default, as well as increased susceptibility to adverse economic developments. These risks are discussed in the Funds’ summary and statutory prospectuses.
Earnings growth is not a measure of future performance.
Duration is a commonly used measure of the potential volatility of the price of a debt security, or the aggregate market value of a portfolio of debt securities, prior to maturity. Securities with a longer duration generally have more volatile prices than securities of comparable quality with a shorter duration.
Spread is the percentage point difference between yields of various classes of bonds compared to treasury bonds.
BBB refers to bond ratings. Bond ratings are grades given to bonds that indicate their credit quality as determined by private independent rating services such as Standard & Poor’s, Moody’s and Fitch. These firms evaluate a bond issuer’s financial strength, or its ability to pay a bond’s principal and interest in a timely fashion. Ratings are expressed as letters ranging from ‘AAA’, which is the highest grade, to ‘D’, which is the lowest grade.
Must be preceded or accompanied by a prospectus.
Quasar Distributors, LLC, distributor.
5
PERFORMANCE:
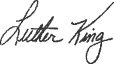
The following information illustrates the historical performance of LKCM Small Cap Equity Fund as of December 31, 2015 compared to the Fund’s representative benchmark and peer group indices.
Performance data quoted represents past performance; past performance does not guarantee future results. The graph and table reflect the reinvestment of dividends and other distributions, if any, but do not reflect the deduction of taxes that a shareholder would pay on Fund distributions or the redemption of Fund shares. The investment return and principal value of an investment will fluctuate so that an investor’s shares, when redeemed, may be worth more or less than their original cost. Current performance of the Fund may be lower or higher than the performance quoted. Performance data current to the most recent month end may be obtained by calling 1-800-688-LKCM.
An index is an unmanaged portfolio and does not trade or incur any expenses. One can not invest in an unmanaged index.
AVERAGE ANNUAL TOTAL RETURN (Periods Ended December 31, 2015)
| | | | | | | | | | | | | | | | |
| | | Past
1 Year | | | Past
5 Years(1) | | | Past
10 Years(1) | | | Since
Inception(1)(2) | |
LKCM Small Cap Equity Fund – Institutional Class | | | -5.58% | | | | 7.22% | | | | 5.67% | | | | 10.23% | |
Russell 2000® Index | | | -4.41% | | | | 9.19% | | | | 6.80% | | | | 8.85% | |
Lipper Small-Cap Core Funds Index | | | -4.23% | | | | 8.64% | | | | 6.69% | | | | 9.71% | |
A HYPOTHETICAL $10,000 INVESTMENT IN LKCM SMALL CAP EQUITY FUND – INSTITUTIONAL CLASS
(for the ten years ended December 31, 2015)
The Russell 2000® Index is an unmanaged index consisting of the 2,000 smallest companies in the Russell 3000® Index.
The Lipper Small-Cap Core Funds Index is an index of small cap core mutual funds tracked by Lipper, Inc.
6
AVERAGE ANNUAL TOTAL RETURN (Periods Ended December 31, 2015)
| | | | | | | | | | | | | | | | |
| | | Past
1 Year | | | Past
5 Years(1) | | | Past
10 Years(1) | | | Since
Inception(1)(2) | |
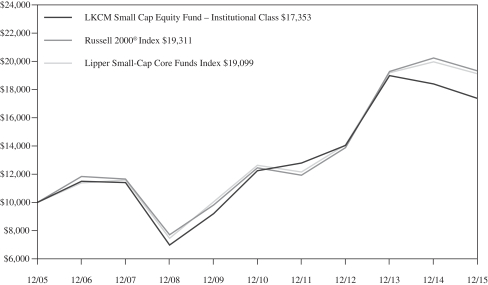
LKCM Small Cap Equity Fund – Adviser Class | | | -5.81% | | | | 6.95% | | | | 5.40% | | | | 8.72% | |
Russell 2000® Index | | | -4.41% | | | | 9.19% | | | | 6.80% | | | | 8.94% | |
Lipper Small-Cap Core Funds Index | | | -4.23% | | | | 8.64% | | | | 6.69% | | | | 9.32% | |
A HYPOTHETICAL $10,000 INVESTMENT IN LKCM SMALL CAP EQUITY FUND – ADVISER CLASS
(for the ten years ended December 31, 2015)
The Russell 2000® Index is an unmanaged index consisting of the 2,000 smallest companies in the Russell 3000® Index.
The Lipper Small-Cap Core Funds Index is an index of small cap core mutual funds tracked by Lipper, Inc.
7
PERFORMANCE:
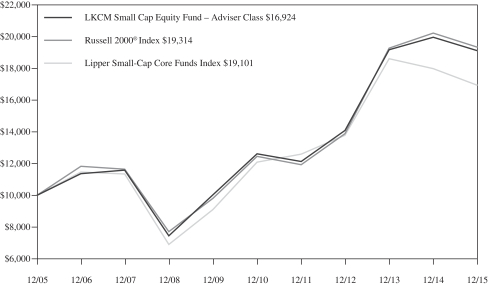
The following information illustrates the historical performance of LKCM Small-Mid Cap Equity Fund as of December 31, 2015 compared to the Fund’s benchmark and peer group indices.
Performance data quoted represents past performance; past performance does not guarantee future results. The graph and table reflect the reinvestment of dividends and other distributions, if any, but do not reflect the deduction of taxes that a shareholder would pay on Fund distributions or the redemption of Fund shares. The investment return and principal value of an investment will fluctuate so that an investor’s shares, when redeemed, may be worth more or less than their original cost. Current performance of the Fund may be lower or higher than the performance quoted. Performance data current to the most recent month end may be obtained by calling 1-800-688-LKCM.
An index is an unmanaged portfolio and does not trade or incur any expenses. One can not invest in an unmanaged index.
AVERAGE ANNUAL TOTAL RETURN (Periods Ended December 31, 2015)
| | | | | | | | | | | | |
| | | Past
1 Year | | | Past
3 Years | | | Since
Inception(1)(2) | |
LKCM Small-Mid Cap Equity Fund – Institutional Class | | | -1.41% | | | | 8.10% | | | | 4.39% | |
Russell 2500® Index | | | -2.90% | | | | 12.46% | | | | 8.45% | |
Lipper Small-Cap Core Funds Index | | | -4.23% | | | | 10.71% | | | | 7.01% | |
A HYPOTHETICAL $10,000 INVESTMENT IN LKCM SMALL-MID CAP EQUITY FUND – INSTITUTIONAL CLASS
(for the period from May 2, 2011 to December 31, 2015)
The Russell 2500® Index is an unmanaged index consisting of the 2,500 smallest companies in the Russell 3000® Index.
The Lipper Small-Cap Core Funds Index is an index of small cap core mutual funds tracked by Lipper, Inc.
8
PERFORMANCE:
The following information illustrates the historical performance of LKCM Equity Fund as of December 31, 2015 compared to the Fund’s benchmark and peer group indices.
Performance data quoted represents past performance; past performance does not guarantee future results. The graph and table reflect the reinvestment of dividends and other distributions, if any, but do not reflect the deduction of taxes that a shareholder would pay on Fund distributions or the redemption of Fund shares. The investment return and principal value of an investment will fluctuate so that an investor’s shares, when redeemed, may be worth more or less than their original cost. Current performance of the Fund may be lower or higher than the performance quoted. Performance data current to the most recent month end may be obtained by calling 1-800-688-LKCM.
An index is an unmanaged portfolio and does not trade or incur any expenses. One can not invest in an unmanaged index.
AVERAGE ANNUAL TOTAL RETURN (Periods Ended December 31, 2015)
| | | | | | | | | | | | | | | | |
| | | Past
1 Year | | | Past
5 Years(1) | | | Past
10 Years(1) | | | Since
Inception(1)(2) | |
LKCM Equity Fund – Institutional Class | | | -3.54% | | | | 9.90% | | | | 7.41% | | | | 7.88% | |
S&P 500® Index | | | 1.38% | | | | 12.57% | | | | 7.31% | | | | 8.14% | |
Lipper Large-Cap Core Funds Index | | | -0.67% | | | | 10.97% | | | | 6.35% | | | | 7.10% | |
A HYPOTHETICAL $10,000 INVESTMENT IN LKCM EQUITY FUND – INSTITUTIONAL CLASS
(for the ten years ended December 31, 2015)
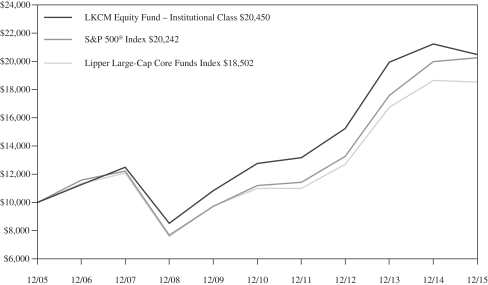
The S&P 500® Index is an unmanaged capitalization-weighted index of 500 selected stocks that is generally representative of the performance of large capitalization companies in the U.S. stock market.
The Lipper Large-Cap Core Funds Index is an index of large cap core mutual funds tracked by Lipper, Inc.
9
PERFORMANCE:
The following information illustrates the historical performance of LKCM Balanced Fund as of December 31, 2015 compared to the Fund’s benchmark and peer group indices.
Performance data quoted represents past performance; past performance does not guarantee future results. The graph and table reflect the reinvestment of dividends and other distributions, if any, but do not reflect the deduction of taxes that a shareholder would pay on Fund distributions or the redemption of Fund shares. The investment return and principal value of an investment will fluctuate so that an investor’s shares, when redeemed, may be worth more or less than their original cost. Current performance of the Fund may be lower or higher than the performance quoted. Performance data current to the most recent month end may be obtained by calling 1-800-688-LKCM.
An index is an unmanaged portfolio and does not trade or incur any expenses. One can not invest in an unmanaged index.
AVERAGE ANNUAL TOTAL RETURN (Periods Ended December 31, 2015)
| | | | | | | | | | | | | | | | |
| | | Past
1 Year | | | Past
5 Years(1) | | | Past
10 Years(1) | | | Since
Inception(1)(2) | |
LKCM Balanced Fund | | | 0.91% | | | | 8.81% | | | | 7.17% | | | | 6.14% | |
Barclays U.S. Intermediate Government/Credit Bond Index | | | 1.07% | | | | 2.58% | | | | 4.04% | | | | 4.82% | |
S&P 500® Index | | | 1.38% | | | | 12.57% | | | | 7.31% | | | | 6.18% | |
Lipper Mixed-Asset Target Allocation Growth Funds Index | | | -0.54% | | | | 7.69% | | | | 5.85% | | | | 5.84% | |
A HYPOTHETICAL $10,000 INVESTMENT IN LKCM BALANCED FUND
(for the ten years ended December 31, 2015)
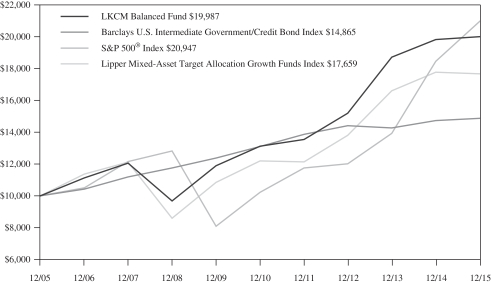
The Barclays U.S. Intermediate Government/Credit Bond Index is an unmanaged market value weighted index measuring both the principal price changes of, and income provided by, the underlying universe of securities that comprise the index. Securities included in the index must meet the following criteria; fixed as opposed to variable rate; remaining maturity of one to ten years; minimum outstanding par value of $250 million; rated investment grade or higher by Moody’s Investors Service or equivalent; must be dollar denominated and non-convertible; and must be publicly issued.
The Lipper Mixed-Asset Target Allocation Growth Funds Index is an unmanaged index consisting of funds tracked by Lipper, Inc. that, by portfolio practice, maintain a mix of between 60%-80% equity securities, with the remainder invested in bonds, cash and cash equivalents.
The S&P 500® Index is an unmanaged capitalization-weighted index of 500 selected stocks that is generally representative of the performance of large capitalization companies in the U.S. stock market.
10
PERFORMANCE:
The following information illustrates the historical performance of LKCM Fixed Income Fund as of December 31, 2015 compared to the Fund’s benchmark and peer group indices.
Performance data quoted represents past performance; past performance does not guarantee future results. The graph and table reflect the reinvestment of dividends and other distributions, if any, but do not reflect the deduction of taxes that a shareholder would pay on Fund distributions or the redemption of Fund shares. The investment return and principal value of an investment will fluctuate so that an investor’s shares, when redeemed, may be worth more or less than their original cost. Current performance of the Fund may be lower or higher than the performance quoted. Performance data current to the most recent month end may be obtained by calling 1-800-688-LKCM.
An index is an unmanaged portfolio and does not trade or incur any expenses. One can not invest in an unmanaged index.
AVERAGE ANNUAL TOTAL RETURN (Periods Ended December 31, 2015)
| | | | | | | | | | | | | | | | |
| | | Past
1 Year | | | Past
5 Years(1) | | | Past
10 Years(1) | | | Since
Inception(1)(2) | |
LKCM Fixed Income Fund | | | -0.27% | | | | 2.21% | | | | 4.02% | | | | 4.49% | |
Barclays U.S. Intermediate Government/Credit Bond Index | | | 1.07% | | | | 2.58% | | | | 4.04% | | | | 4.82% | |
Lipper Short Intermediate Investment-Grade Debt Funds Index | | | 0.15% | | | | 2.21% | | | | 3.50% | | | | 4.18% | |
A HYPOTHETICAL $10,000 INVESTMENT IN LKCM FIXED INCOME FUND
(for the ten years ended December 31, 2015)
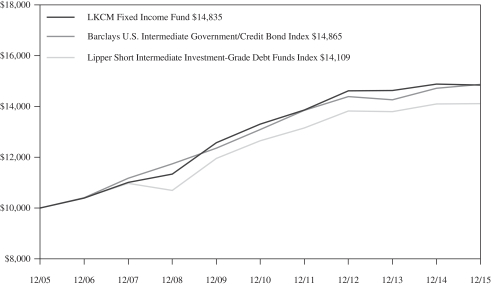
The Barclays U.S. Intermediate Government/Credit Bond Index is an unmanaged market value weighted index measuring both the principal price changes of, and income provided by, the underlying universe of securities that comprise the index. Securities included in the index must meet the following criteria: fixed as opposed to variable rate; remaining maturity of one to ten years; minimum outstanding par value of $250 million; rated investment grade or higher by Moody’s Investors Service or equivalent; must be dollar denominated and non-convertible; and must be publicly issued.
The Lipper Short Intermediate Investment-Grade Debt Funds Index is an index of short intermediate investment grade mutual funds tracked by Lipper, Inc.
11
LKCM Funds Expense Example — December 31, 2015
As a shareholder of the Funds, you incur two types of costs: (1) transaction costs, including redemption fees; and (2) ongoing costs, including management fees, distribution and/or service (12b-1) fees and other Fund expenses. This Example is intended to help you understand your ongoing costs (in dollars) of investing in the Funds and to compare these costs with the ongoing costs of investing in other mutual funds. The Example is based on an investment of $1,000 invested at the beginning of the period and held for the entire period (7/1/15-12/31/15).
ACTUAL EXPENSES
The first line of the tables below provides information about actual account values and actual expenses. You may use the information in this line, together with the amount you invested, to estimate the expenses that you paid over the period. Simply divide your account value by $1,000 (for example, an $8,600 account value divided by $1,000 = 8.6), then multiply the result by the number in the first line under the heading entitled “Expenses Paid During Period” to estimate the expenses you paid on your account during this period. Although the Funds charge no sales load, you will be assessed fees for outgoing wire transfers, returned checks and stop payment orders at prevailing rates charged by U.S. Bancorp Fund Services, LLC, the Funds’ transfer agent. If you request that a redemption be made by wire transfer, currently a $15.00 fee is charged by the Funds’ transfer agent. You will be charged a redemption fee equal to 1.00% of the net amount of the redemption if you redeem your shares of the LKCM Small Cap Equity, Small-Mid Cap Equity, Equity, Balanced and Fixed Income Funds within 30 days of purchase, unless otherwise determined by the Funds in their discretion. To the extent the Funds invest in shares of other investment companies as part of their investment strategies, you will indirectly bear your proportionate share of any fees and expenses charged by the underlying funds in which the Funds invest in addition to the expenses of the Funds. Actual expenses of the underlying funds are expected to vary among the various underlying funds. These expenses are not included in the example below. The example below includes management fees, registration fees and other expenses. However, the example below does not include portfolio trading commissions and related expenses and other extraordinary expenses as determined under generally accepted accounting principles.
HYPOTHETICAL EXAMPLES FOR COMPARISON PURPOSES
The second line of the tables below provides information about hypothetical account values and hypothetical expenses based on the Funds’ actual expense ratios and an assumed rate of return of 5% per year before expenses, which are not the Funds’ actual returns. The hypothetical account values and expenses may not be used to estimate the actual ending account balance or expenses you paid for the period. You may use this information to compare the ongoing costs of investing in the Funds and other funds. To do so, compare this 5% hypothetical example with the 5% hypothetical examples that appear in the shareholder reports of the other funds. Please note that the expenses shown in the table are meant to highlight your ongoing costs only and do not reflect any transactional costs, such as redemption fees. Therefore, the second line of the table is useful in comparing ongoing costs only, and will not help you determine the relative total costs of owning different funds. In addition, if these transactions costs were included, your costs would have been higher.
| | | | | | | | | | | | |
| | | LKCM Small Cap Equity Fund – Institutional Class | |
| | | Beginning
Account Value
7/1/2015 | | | Ending
Account Value
12/31/15 | | | Expenses Paid
During Period*
7/1/15–12/31/15 | |
Actual | | $ | 1,000.00 | | | $ | 881.80 | | | $ | 4.65 | |
Hypothetical (5% return before expense) | | $ | 1,000.00 | | | $ | 1,020.27 | | | $ | 4.99 | |
| * | Expenses are equal to the Fund’s annualized net expense ratio of 0.98%, multiplied by the average account value over the period, multiplied by 184/365 to reflect the one-half year period. |
| | | | | | | | | | | | |
| | | LKCM Small Cap Equity Fund – Adviser Class | |
| | | Beginning
Account Value
7/1/15 | | | Ending
Account Value
12/31/15 | | | Expenses Paid
During Period*
7/1/15–12/31/15 | |
Actual | | $ | 1,000.00 | | | $ | 880.90 | | | $ | 5.83 | |
Hypothetical (5% return before expense) | | $ | 1,000.00 | | | $ | 1,019.00 | | | $ | 6.26 | |
| * | Expenses are equal to the Fund’s annualized net expense ratio of 1.23%, multiplied by the average account value over the period, multiplied by 184/365 to reflect the one-half year period. |
| | | | | | | | | | | | |
| | | LKCM Small-Mid Cap Equity Fund | |
| | | Beginning
Account Value
7/1/15 | | | Ending
Account Value
12/31/15 | | | Expenses Paid
During Period*
7/1/15–12/31/15 | |
Actual | | $ | 1,000.00 | | | $ | 904.50 | | | $ | 4.80 | |
Hypothetical (5% return before expense) | | $ | 1,000.00 | | | $ | 1,020.16 | | | $ | 5.09 | |
| * | Expenses are equal to the Fund’s annualized net expense ratio of 1.00%, multiplied by the average account value over the period, multiplied by 184/365 to reflect the one-half year period. |
12
| | | | | | | | | | | | |
| | | LKCM Equity Fund | |
| | | Beginning
Account Value
7/1/15 | | | Ending
Account Value
12/31/15 | | | Expenses Paid
During Period*
7/1/15–12/31/15 | |
Actual | | $ | 1,000.00 | | | $ | 959.90 | | | $ | 3.95 | |
Hypothetical (5% return before expense) | | $ | 1,000.00 | | | $ | 1,021.17 | | | $ | 4.08 | |
| * | Expenses are equal to the Fund’s annualized net expense ratio of 0.80%, multiplied by the average account value over the period, multiplied by 184/365 to reflect the one-half year period. |
| | | | | | | | | | | | |
| | | LKCM Balanced Fund | |
| | | Beginning
Account Value
7/1/15 | | | Ending
Account Value
12/31/15 | | | Expenses Paid
During Period*
7/1/15–12/31/15 | |
Actual | | $ | 1,000.00 | | | $ | 987.00 | | | $ | 4.01 | |
Hypothetical (5% return before expense) | | $ | 1,000.00 | | | $ | 1,021.17 | | | $ | 4.08 | |
| * | Expenses are equal to the Fund’s annualized net expense ratio of 0.80%, multiplied by the average account value over the period, multiplied by 184/365 to reflect the one-half year period. |
| | | | | | | | | | | | |
| | | LKCM Fixed Income Fund | |
| | | Beginning
Account Value
7/1/15 | | | Ending
Account Value
12/31/15 | | | Expenses Paid
During Period*
7/1/15–12/31/15 | |
Actual | | $ | 1,000.00 | | | $ | 994.30 | | | $ | 2.51 | |
Hypothetical (5% return before expense) | | $ | 1,000.00 | | | $ | 1,022.68 | | | $ | 2.55 | |
| * | Expenses are equal to the Fund’s annualized net expense ratio of 0.50%, multiplied by the average account value over the period, multiplied by 184/365 to reflect the one-half year period. |
13
ALLOCATION OF PORTFOLIO HOLDINGS — LKCM Funds — December 31, 2015
Percentages represent market value as a percentage of total investments.
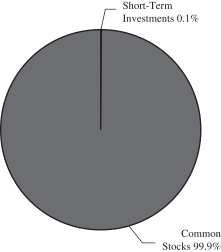
LKCM Small Cap Equity Fund
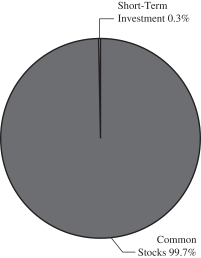
LKCM Equity Fund
LKCM Fixed Income Fund

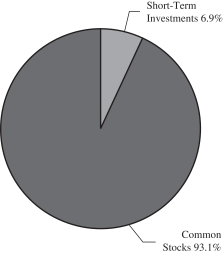
LKCM Small-Mid Cap Equity Fund
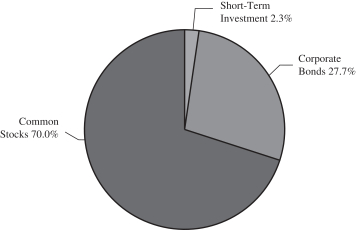
LKCM Balanced Fund
14
|
| LKCM SMALL CAP EQUITY FUND |
| SCHEDULEOF INVESTMENTS |
| December 31, 2015 |
| | | | | | | | |
| COMMON STOCKS - 99.9% | | Shares | | | Value | |
Aerospace & Defense - 1.2% | |
Hexcel Corporation | | | 152,385 | | | $ | 7,078,283 | |
| | | | | | | | |
Automobiles - 2.3% | | | | | | | | |
Lithia Motors, Inc. - Class A | | | 124,625 | | | | 13,293,749 | |
| | | | | | | | |
Banks - 10.3% | | | | | | | | |
BancorpSouth, Inc. | | | 412,104 | | | | 9,886,375 | |
Bank of the Ozarks, Inc. | | | 249,385 | | | | 12,334,582 | |
Columbia Banking System, Inc. | | | 366,405 | | | | 11,911,827 | |
Hanmi Financial Corporation | | | 350,485 | | | | 8,313,504 | |
PrivateBancorp, Inc. | | | 228,145 | | | | 9,358,508 | |
Texas Capital Bancshares, Inc. (a) | | | 149,075 | | | | 7,367,286 | |
| | | | | | | | |
| | | | | | | 59,172,082 | |
| | | | | | | | |
Biotechnology - 4.0% | | | | | | | | |
Charles River Laboratories International, Inc. (a) | | | 140,270 | | | | 11,276,305 | |
EXACT Sciences Corporation (a) | | | 335,605 | | | | 3,097,634 | |
Neogen Corporation (a) | | | 149,330 | | | | 8,440,132 | |
| | | | | | | | |
| | | | | | | 22,814,071 | |
| | | | | | | | |
Building Products - 2.1% | | | | | | | | |
Apogee Enterprises, Inc. | | | 82,825 | | | | 3,603,716 | |
PGT, Inc. (a) | | | 760,166 | | | | 8,658,291 | |
| | | | | | | | |
| | | | | | | 12,262,007 | |
| | | | | | | | |
Capital Markets - 0.9% | | | | | | | | |
BGC Partners Inc - Class A | | | 533,155 | | | | 5,230,251 | |
| | | | | | | | |
Commercial Services & Supplies - 4.4% | | | | | |
Healthcare Services Group, Inc. | | | 370,705 | | | | 12,926,483 | |
Multi-Color Corporation | | | 43,455 | | | | 2,599,044 | |
Ritchie Bros. Auctioneers Incorporated (b) | | | 414,970 | | | | 10,004,927 | |
| | | | | | | | |
| | | | | | | 25,530,454 | |
| | | | | | | | |
Communications Equipment - 2.6% | | | | | | | | |
Ciena Corporation (a) | | | 227,505 | | | | 4,707,078 | |
Infinera Corporation (a) | | | 573,565 | | | | 10,392,998 | |
| | | | | | | | |
| | | | | | | 15,100,076 | |
| | | | | | | | |
Construction & Engineering - 0.7% | | | | | | | | |
MasTec Inc. (a) | | | 230,750 | | | | 4,010,435 | |
| | | | | | | | |
Construction Materials - 2.1% | | | | | | | | |
Headwaters Incorporated (a) | | | 390,900 | | | | 6,594,483 | |
Summit Materials, Inc. - Class A (a) | | | 282,261 | | | | 5,656,517 | |
| | | | | | | | |
| | | | | | | 12,251,000 | |
| | | | | | | | |
Diversified Financials - 1.4% | | | | | | | | |
HFF, Inc. - Class A | | | 260,787 | | | | 8,102,652 | |
| | | | | | | | |
Food & Staples Retailing - 0.5% | | | | | | | | |
Sprouts Farmers Market Inc. (a) | | | 114,655 | | | | 3,048,676 | |
| | | | | | | | |
Food Products - 3.2% | | | | | | | | |
Post Holdings Inc. (a) | | | 182,230 | | | | 11,243,591 | |
TreeHouse Foods, Inc. (a) | | | 94,665 | | | | 7,427,416 | |
| | | | | | | | |
| | | | | | | 18,671,007 | |
| | | | | | | | |
| | | | | | | | |
| COMMON STOCKS | | Shares | | | Value | |
Health Care Equipment & Supplies - 7.2% | | | | | |
Cantel Medical Corp. | | | 66,695 | | | $ | 4,144,427 | |
Cynosure, Inc. - Class A (a) | | | 275,588 | | | | 12,310,516 | |
LDR Holding Corporation (a) | | | 250,000 | | | | 6,277,500 | |
PRA Health Sciences, Inc. (a) | | | 127,577 | | | | 5,775,411 | |
VWR Corporation (a) | | | 469,925 | | | | 13,303,577 | |
| | | | | | | | |
| | | | | | | 41,811,431 | |
| | | | | | | | |
Health Care Providers & Services - 4.4% | | | | | |
Acadia Healthcare Company, Inc. (a) | | | 141,508 | | | | 8,838,590 | |
Aceto Corporation | | | 346,143 | | | | 9,338,938 | |
Omnicell, Inc. (a) | | | 223,215 | | | | 6,937,522 | |
| | | | | | | | |
| | | | | | | 25,115,050 | |
| | | | | | | | |
Hotels, Restaurants & Leisure - 2.2% | | | | | | | | |
La Quinta Holdings Inc (a) | | | 138,681 | | | | 1,887,448 | |
Popeyes Louisiana Kitchen, Inc. (a) | | | 138,240 | | | | 8,087,040 | |
Zoe’s Kitchen Inc (a) | | | 98,950 | | | | 2,768,621 | |
| | | | | | | | |
| | | | | | | 12,743,109 | |
| | | | | | | | |
Internet Software & Services - 8.3% | | | | | | | | |
Criteo SA - ADR (a)(b) | | | 211,515 | | | | 8,375,994 | |
Demandware Inc. (a) | | | 95,115 | | | | 5,133,357 | |
Euronet Worldwide, Inc. (a) | | | 205,130 | | | | 14,857,566 | |
LogMeIn, Inc. (a) | | | 136,070 | | | | 9,130,297 | |
SPS Commerce, Inc. (a) | | | 144,090 | | | | 10,116,559 | |
| | | | | | | | |
| | | | | | | 47,613,773 | |
| | | | | | | | |
Leisure Equipment & Products - 2.1% | | | | | |
Pool Corporation | | | 153,165 | | | | 12,372,669 | |
| | | | | | | | |
Machinery - 1.1% | | | | | | | | |
Barnes Group Inc. | | | 173,355 | | | | 6,135,033 | |
| | | | | | | | |
Media - 1.8% | | | | | | | | |
The E.W. Scripps Company - Class A | | | 558,115 | | | | 10,604,185 | |
| | | | | | | | |
Multiline Retail - 1.0% | | | | | | | | |
Burlington Stores, Inc. (a) | | | 127,465 | | | | 5,468,249 | |
| | | | | | | | |
Oil & Gas & Consumable Fuels - 2.5% | | | | | |
Diamondback Energy Inc. (a) | | | 105,470 | | | | 7,055,943 | |
PDC Energy, Inc. (a) | | | 83,345 | | | | 4,448,956 | |
Synergy Resources Corporation (a) | | | 336,635 | | | | 2,868,130 | |
| | | | | | | | |
| | | | | | | 14,373,029 | |
| | | | | | | | |
Paper & Forest Products - 0.5% | | | | | | | | |
KapStone Paper and Packaging Corporation | | | 134,715 | | | | 3,043,212 | |
| | | | | | | | |
Pharmaceuticals - 3.6% | | | | | | | | |
Akorn, Inc. (a) | | | 326,173 | | | | 12,169,515 | |
Cambrex Corp. (a) | | | 185,260 | | | | 8,723,893 | |
| | | | | | | | |
| | | | | | | 20,893,408 | |
| | | | | | | | |
Professional Services - 2.5% | | | | | | | | |
The Advisory Board Company (a) | | | 162,340 | | | | 8,053,687 | |
FTI Consulting, Inc. (a) | | | 177,200 | | | | 6,141,752 | |
| | | | | | | | |
| | | | | | | 14,195,439 | |
| | | | | | | | |
The accompanying notes are an integral part of these financial statements.
15
|
| LKCM SMALL CAP EQUITY FUND |
| SCHEDULEOF INVESTMENTS, CONTINUED |
| December 31, 2015 |
| | | | | | | | |
| COMMON STOCKS | | Shares | | | Value | |
Real Estate Investment Trusts - 7.5% | | | | | | | | |
CubeSmart | | | 344,685 | | | $ | 10,554,255 | |
Kennedy-Wilson Holdings Inc. | | | 327,842 | | | | 7,894,435 | |
LaSalle Hotel Properties | | | 135,590 | | | | 3,411,444 | |
Sovran Self Storage, Inc. | | | 131,890 | | | | 14,153,116 | |
Stag Industrial, Inc. | | | 401,155 | | | | 7,401,310 | |
| | | | | | | | |
| | | | | | | 43,414,560 | |
| | | | | | | | |
Semiconductor Equipment & Products - 1.6% | | | | | |
Rambus Inc. (a) | | | 785,125 | | | | 9,099,599 | |
| | | | | | | | |
Software - 11.8% | | | | | | | | |
ACI Worldwide, Inc. (a) | | | 524,015 | | | | 11,213,921 | |
Callidus Software, Inc. (a) | | | 264,975 | | | | 4,920,586 | |
Fair Isaac Corporation | | | 122,595 | | | | 11,545,997 | |
Guidewire Software Inc. (a) | | | 98,005 | | | | 5,895,981 | |
Interactive Intelligence Group,
Inc. (a) | | | 94,050 | | | | 2,955,051 | |
Manhattan Associates, Inc. (a) | | | 141,620 | | | | 9,370,995 | |
Proofpoint, Inc. (a) | | | 145,205 | | | | 9,439,777 | |
Take-Two Interactive Software,
Inc. (a) | | | 372,375 | | | | 12,973,545 | |
| | | | | | | | |
| | | | | | | 68,315,853 | |
| | | | | | | | |
Specialty Retail - 1.9% | | | | | | | | |
Monro Muffler Brake, Inc. | | | 163,555 | | | | 10,830,612 | |
| | | | | | | | |
Thrifts & Mortgage Finance - 2.1% | | | | | | | | |
Home Bancshares Inc. | | | 291,448 | | | | 11,809,473 | |
| | | | | | | | |
Trading Companies & Distributors - 2.1% | | | | | |
Watsco, Inc. | | | 101,855 | | | | 11,930,276 | |
| | | | | | | | |
TOTAL COMMON STOCKS | | | | | | | | |
(Cost $465,079,111) | | | | | | | 576,333,703 | |
| | | | | | | | |
| | | | | | | | |
| SHORT-TERM INVESTMENT - 0.3% | | | | |
Money Market Fund (c) - 0.3% | | | | | | | | |
Federated Government Obligations
Fund - Institutional Shares, 0.01% | | | 1,836,907 | | | | 1,836,907 | |
| | | | | | | | |
TOTAL SHORT-TERM INVESTMENT | |
(Cost $1,836,907) | | | | | | | 1,836,907 | |
| | | | | | | | |
Total Investments - 100.2% | | | | | | | | |
(Cost $466,916,018) | | | | | | | 578,170,610 | |
Liabilities in Excess of Other Assets - (0.2)% | | | | (1,151,191 | ) |
| | | | | | | | |
TOTAL NET ASSETS - 100.0% | | | | | | $ | 577,019,419 | |
| | | | | | | | |
ADR American Depository Receipt.
| (a) | Non-income producing security. |
| (b) | Security issued by non-U.S. incorporated company. |
| (c) | The rate quoted is the annualized seven-day yield of the fund at period end. |
Investments are classified by asset class and industry pursuant to the Global Industry Classification Standard (GICS®) which was developed by and/or is the exclusive property of MSCI, Inc. and Standard & Poor Financial Services LLC (“S&P”). GICS is a service mark of MSCI and S&P and has been licensed for use by U.S. Bancorp Fund Services, LLC.
The accompanying notes are an integral part of these financial statements.
16
|
| LKCM SMALL-MID CAP EQUITY FUND |
| SCHEDULEOF INVESTMENTS |
| December 31, 2015 |
| | | | | | | | |
| COMMON STOCKS - 93.2% | | Shares | | | Value | |
Aerospace & Defense - 1.3% | |
Hexcel Corporation | | | 94,685 | | | $ | 4,398,118 | |
| | | | | | | | |
Automobiles - 2.1% | | | | | | | | |
Lithia Motors, Inc. - Class A | | | 63,920 | | | | 6,818,346 | |
| | | | | | | | |
Banks - 9.0% | | | | | | | | |
BancorpSouth, Inc. | | | 216,710 | | | | 5,198,873 | |
Bank of the Ozarks, Inc. | | | 134,640 | | | | 6,659,294 | |
PrivateBancorp, Inc. | | | 169,950 | | | | 6,971,349 | |
Signature Bank (a) | | | 48,300 | | | | 7,407,770 | |
Texas Capital Bancshares, Inc. (a) | | | 76,405 | | | | 3,775,935 | |
| | | | | | | | |
| | | | | | | 30,013,221 | |
| | | | | | | | |
Biotechnology - 2.5% | | | | | | | | |
Charles River Laboratories International, Inc. (a) | | | 102,575 | | | | 8,246,004 | |
| | | | | | | | |
Building Products - 2.3% | | | | | | | | |
Fortune Brands Home & Security Inc. | | | 137,885 | | | | 7,652,618 | |
| | | | | | | | |
Capital Markets - 2.9% | | | | | | | | |
E*Trade Financial Corporation (a) | | | 319,695 | | | | 9,475,760 | |
| | | | | | | | |
Commercial Services & Supplies - 2.4% | | | | | |
Healthcare Services Group, Inc. | | | 224,295 | | | | 7,821,167 | |
| | | | | | | | |
Communications Equipment - 2.4% | | | | | | | | |
Ciena Corporation (a) | | | 139,960 | | | | 2,895,772 | |
Infinera Corporation (a) | | | 281,930 | | | | 5,108,572 | |
| | | | | | | | |
| | | | | | | 8,004,344 | |
| | | | | | | | |
Construction Materials - 2.1% | | | | | | | | |
Martin Marietta Materials, Inc. | | | 51,125 | | | | 6,982,652 | |
| | | | | | | | |
Containers & Packaging - 1.6% | | | | | | | | |
Ball Corporation | | | 71,405 | | | | 5,193,286 | |
| | | | | | | | |
Diversified Financials - 1.7% | | | | | | | | |
Jones Lang LaSalle Incorporated | | | 34,460 | | | | 5,508,776 | |
| | | | | | | | |
Electrical Equipment & Instruments - 2.5% | |
Acuity Brands, Inc. | | | 35,840 | | | | 8,379,392 | |
| | | | | | | | |
Energy Equipment & Services - 0.9% | | | | | | | | |
Core Laboratories N.V. (b) | | | 28,920 | | | | 3,144,761 | |
| | | | | | | | |
Food Products - 3.0% | | | | | | | | |
TreeHouse Foods, Inc. (a) | | | 74,080 | | | | 5,812,317 | |
The WhiteWave Foods Company (a) | | | 107,240 | | | | 4,172,708 | |
| | | | | | | | |
| | | | | | | 9,985,025 | |
| | | | | | | | |
Health Care Equipment & Supplies - 7.7% | | | | | |
Align Technology, Inc. (a) | | | 60,055 | | | | 3,954,622 | |
DexCom Inc. (a) | | | 92,740 | | | | 7,595,405 | |
PerkinElmer, Inc. | | | 121,775 | | | | 6,523,487 | |
VWR Corporation (a) | | | 260,950 | | | | 7,387,495 | |
| | | | | | | | |
| | | | | | | 25,461,009 | |
| | | | | | | | |
Health Care Providers & Services - 2.0% | | | | | |
Acadia Healthcare Company, Inc. (a) | | | 108,200 | | | | 6,758,172 | |
| | | | | | | | |
| | | | | | | | |
| COMMON STOCKS | | Shares | | | Value | |
Hotels, Restaurants & Leisure - 1.0% | | | | | | | | |
La Quinta Holdings Inc (a) | | | 245,735 | | | $ | 3,344,453 | |
| | | | | | | | |
Household Durables - 1.5% | | | | | | | | |
Lennar Corporation - Class A | | | 103,300 | | | | 5,052,403 | |
| | | | | | | | |
Internet Software & Services - 4.7% | | | | | | | | |
Criteo SA - ADR (a) (b) | | | 137,745 | | | | 5,454,702 | |
Euronet Worldwide, Inc. (a) | | | 141,955 | | | | 10,281,801 | |
| | | | | | | | |
| | | | | | | 15,736,503 | |
| | | | | | | | |
Leisure Equipment & Products - 2.3% | | | | | | | | |
Pool Corporation | | | 92,845 | | | | 7,500,019 | |
| | | | | | | | |
Machinery - 1.8% | | | | | | | | |
The Middleby Corporation (a) | | | 56,470 | | | | 6,091,419 | |
| | | | | | | | |
Media - 2.1% | | | | | | | | |
TEGNA Inc. | | | 278,610 | | | | 7,110,127 | |
| | | | | | | | |
Multiline Retail - 1.3% | | | | | | | | |
Burlington Stores, Inc. (a) | | | 97,715 | | | | 4,191,974 | |
| | | | | | | | |
Oil & Gas & Consumable Fuels - 3.8% | | | | | | | | |
Diamondback Energy Inc. (a) | | | 94,900 | | | | 6,348,809 | |
Matador Resources Company (a) | | | 166,015 | | | | 3,282,117 | |
Memorial Resource Development Corp. (a) | | | 172,985 | | | | 2,793,708 | |
| | | | | | | | |
| | | | | | | 12,424,634 | |
| | | | | | | | |
Pharmaceuticals - 2.7% | | | | | | | | |
Akorn, Inc. (a) | | | 236,405 | | | | 8,820,271 | |
| | | | | | | | |
Professional Services - 0.9% | | | | | | | | |
FTI Consulting, Inc. (a) | | | 84,280 | | | | 2,921,145 | |
| | | | | | | | |
Real Estate Investment Trusts - 6.0% | | | | | | | | |
CubeSmart | | | 193,610 | | | | 5,928,338 | |
Kennedy-Wilson Holdings Inc. | | | 148,145 | | | | 3,567,332 | |
LaSalle Hotel Properties | | | 68,300 | | | | 1,718,428 | |
Sovran Self Storage, Inc. | | | 81,740 | | | | 8,771,519 | |
| | | | | | | | |
| | | | | | | 19,985,617 | |
| | | | | | | | |
Semiconductor Equipment & Products - 1.2% | | | | | |
Rambus Inc. (a) | | | 350,492 | | | | 4,062,202 | |
| | | | | | | | |
Software - 10.9% | | | | | | | | |
ACI Worldwide, Inc. (a) | | | 362,715 | | | | 7,762,101 | |
Fair Isaac Corporation | | | 70,330 | | | | 6,623,679 | |
Fortinet Inc. (a) | | | 242,125 | | | | 7,547,036 | |
Manhattan Associates, Inc. (a) | | | 96,575 | | | | 6,390,368 | |
Take-Two Interactive Software, Inc. (a) | | | 226,055 | | | | 7,875,757 | |
| | | | | | | | |
| | | | | | | 36,198,941 | |
| | | | | | | | |
Specialty Retail - 4.8% | | | | | | | | |
Monro Muffler Brake, Inc. | | | 62,405 | | | | 4,132,459 | |
Tractor Supply Company | | | 62,570 | | | | 5,349,735 | |
Ulta Salon, Cosmetics & Fragrance, Inc. (a) | | | 35,320 | | | | 6,534,201 | |
| | | | | | | | |
| | | | | | | 16,016,395 | |
| | | | | | | | |
The accompanying notes are an integral part of these financial statements.
17
|
| LKCM SMALL-MID CAP EQUITY FUND |
| SCHEDULEOF INVESTMENTS, CONTINUED |
| December 31, 2015 |
| | | | | | | | |
| COMMON STOCKS | | Shares | | | Value | |
Trading Companies & Distributors - 1.8% | | | | | |
Watsco, Inc. | | | 51,380 | | | $ | 6,018,139 | |
| | | | | | | | |
TOTAL COMMON STOCKS | | | | | | | | |
(Cost $259,480,350) | | | | | | | 309,316,893 | |
| | | | | | | | |
| | | | | | | | |
| SHORT-TERM INVESTMENTS - 6.9% | | | | |
Money Market Funds (c) - 6.9% | | | | | | | | |
Dreyfus Government Cash Management Fund - Institutional Shares, 0.01% | | | 10,029,886 | | | | 10,029,886 | |
Federated Government Obligations Fund - Institutional Shares, 0.01% | | | 10,022,732 | | | | 10,022,732 | |
Invesco Short Term Investments Trust - Treasury Portfolio - Institutional Shares, 0.02% | | | 2,751,648 | | | | 2,751,648 | |
| | | | | | | | |
| | | | | | | 22,804,266 | |
| | | | | | | | |
TOTAL SHORT-TERM INVESTMENTS | |
(Cost $22,804,266) | | | | | | | 22,804,266 | |
| | | | | | | | |
Total Investments - 100.1% | | | | | | | | |
(Cost $282,284,616) | | | | | | | 332,121,159 | |
Liabilities in Excess of Other Assets - (0.1)% | | | | (167,293 | ) |
| | | | | | | | |
TOTAL NET ASSETS - 100.0% | | | | | | $ | 331,953,866 | |
| | | | | | | | |
ADR American Depository Receipt.
| (a) | Non-income producing security. |
| (b) | Security issued by non-U.S. incorporated company. |
| (c) | The rate quoted is the annualized seven-day yield of the fund at period end. |
Investments are classified by asset class and industry pursuant to the Global Industry Classification Standard (GICS®) which was developed by and/or is the exclusive property of MSCI, Inc. and Standard & Poor Financial Services LLC (“S&P”). GICS is a service mark of MSCI and S&P and has been licensed for use by U.S. Bancorp Fund Services, LLC.
The accompanying notes are an integral part of these financial statements.
18
|
| LKCM EQUITY FUND |
| SCHEDULEOF INVESTMENTS |
| December 31, 2015 |
| | | | | | | | |
| COMMON STOCKS - 99.9% | | Shares | | | Value | |
Aerospace & Defense - 3.5% | |
Honeywell International Inc. | | | 60,000 | | | $ | 6,214,200 | |
Rockwell Collins, Inc. | | | 40,000 | | | | 3,692,000 | |
| | | | | | | | |
| | | | | | | 9,906,200 | |
| | | | | | | | |
Auto Components - 1.3% | | | | | | | | |
Gentex Corporation | | | 230,000 | | | | 3,682,300 | |
| | | | | | | | |
Banks - 9.3% | | | | | | | | |
Bank of America Corporation | | | 290,000 | | | | 4,880,700 | |
Comerica Incorporated | | | 108,000 | | | | 4,517,640 | |
Cullen/Frost Bankers, Inc. | | | 65,000 | | | | 3,900,000 | |
Glacier Bancorp, Inc. | | | 60,000 | | | | 1,591,800 | |
SunTrust Banks, Inc. | | | 109,604 | | | | 4,695,435 | |
Wells Fargo & Company | | | 120,000 | | | | 6,523,200 | |
| | | | | | | | |
| | | | | | | 26,108,775 | |
| | | | | | | | |
Beverages - 3.0% | | | | | | | | |
The Coca-Cola Company | | | 65,000 | | | | 2,792,400 | |
PepsiCo, Inc. | | | 55,000 | | | | 5,495,600 | |
| | | | | | | | |
| | | | | | | 8,288,000 | |
| | | | | | | | |
Biotechnology - 4.4% | | | | | | | | |
Amgen Inc. | | | 40,000 | | | | 6,493,200 | |
Celgene Corporation (a) | | | 50,000 | | | | 5,988,000 | |
| | | | | | | | |
| | | | | | | 12,481,200 | |
| | | | | | | | |
Chemicals - 5.9% | | | | | | | | |
E. I. du Pont de Nemours and Company | | | 60,000 | | | | 3,996,000 | |
ECOLAB INC. | | | 30,000 | | | | 3,431,400 | |
FMC Corporation | | | 110,000 | | | | 4,304,300 | |
Monsanto Company | | | 50,000 | | | | 4,926,000 | |
| | | | | | | | |
| | | | | | | 16,657,700 | |
| | | | | | | | |
Commercial Services & Supplies - 2.7% | | | | | |
Copart, Inc. (a) | | | 100,000 | | | | 3,801,000 | |
Waste Connections, Inc. | | | 65,000 | | | | 3,660,800 | |
| | | | | | | | |
| | | | | | | 7,461,800 | |
| | | | | | | | |
Computers & Peripherals - 2.3% | | | | | | | | |
Apple Inc. | | | 60,000 | | | | 6,315,600 | |
| | | | | | | | |
Construction Materials - 1.2% | | | | | | | | |
Martin Marietta Materials, Inc. | | | 25,000 | | | | 3,414,500 | |
| | | | | | | | |
Containers & Packaging - 1.9% | | | | | | | | |
Ball Corporation | | | 75,000 | | | | 5,454,750 | |
| | | | | | | | |
Diversified Financials - 1.5% | | | | | | | | |
JPMorgan Chase & Co. | | | 65,000 | | | | 4,291,950 | |
| | | | | | | | |
Electrical Equipment & Instruments - 2.4% | | | | | |
Franklin Electric Co., Inc. | | | 85,000 | | | | 2,297,550 | |
Roper Industries, Inc. | | | 23,000 | | | | 4,365,170 | |
| | | | | | | | |
| | | | | | | 6,662,720 | |
| | | | | | | | |
Electronic Equipment & Instruments - 1.1% | | | | | |
National Instruments Corporation | | | 55,000 | | | | 1,577,950 | |
Trimble Navigation Limited (a) | | | 70,000 | | | | 1,501,500 | |
| | | | | | | | |
| | | | | | | 3,079,450 | |
| | | | | | | | |
| | | | | | | | |
| COMMON STOCKS | | Shares | | | Value | |
Energy Equipment & Services - 1.0% | | | | | | | | |
Schlumberger Limited (b) | | | 39,500 | | | $ | 2,755,125 | |
| | | | | | | | |
Food & Drug Retailing - 1.5% | | | | | | | | |
Walgreens Boots Alliance, Inc. | | | 50,000 | | | | 4,257,750 | |
| | | | | | | | |
Food Products - 1.2% | | | | | | | | |
The WhiteWave Foods Company (a) | | | 90,000 | | | | 3,501,900 | |
| | | | | | | | |
Health Care Equipment & Supplies - 6.4% | | | | | |
Medtronic, PLC (b) | | | 73,000 | | | | 5,615,160 | |
PerkinElmer, Inc. | | | 100,000 | | | | 5,357,000 | |
Thermo Fisher Scientific Inc. | | | 50,000 | | | | 7,092,500 | |
| | | | | | | | |
| | | | | | | 18,064,660 | |
| | | | | | | | |
Household Durables - 2.9% | | | | | | | | |
Jarden Corporation (a) | | | 142,500 | | | | 8,139,600 | |
| | | | | | | | |
Household Products - 2.7% | | | | | | | | |
Kimberly-Clark Corporation | | | 45,000 | | | | 5,728,500 | |
The Procter & Gamble Company | | | 23,750 | | | | 1,885,988 | |
| | | | | | | | |
| | | | | | | 7,614,488 | |
| | | | | | | | |
Internet Software & Services - 3.3% | | | | | | | | |
Akamai Technologies, Inc. (a) | | | 90,000 | | | | 4,736,700 | |
Sabre Corporation | | | 160,000 | | | | 4,475,200 | |
| | | | | | | | |
| | | | | | | 9,211,900 | |
| | | | | | | | |
IT Consulting & Services - 1.0% | | | | | | | | |
PayPal Holdings, Inc. (a) | | | 75,000 | | | | 2,715,000 | |
| | | | | | | | |
Machinery - 6.9% | | | | | | | | |
Danaher Corporation | | | 75,000 | | | | 6,966,000 | |
Generac Holdings, Inc. (a) | | | 108,000 | | | | 3,215,160 | |
The Gorman-Rupp Company | | | 67,500 | | | | 1,804,275 | |
The Toro Company | | | 37,000 | | | | 2,703,590 | |
Valmont Industries, Inc. | | | 45,000 | | | | 4,770,900 | |
| | | | | | | | |
| | | | | | | 19,459,925 | |
| | | | | | | | |
Marine - 0.8% | | | | | | | | |
Kirby Corporation (a) | | | 45,000 | | | | 2,367,900 | |
| | | | | | | | |
Media - 2.3% | | | | | | | | |
Time Warner Inc. | | | 27,200 | | | | 1,759,024 | |
The Walt Disney Company | | | 43,385 | | | | 4,558,896 | |
| | | | | | | | |
| | | | | | | 6,317,920 | |
| | | | | | | | |
Metals & Mining - 0.5% | | | | | | | | |
Carpenter Technology Corporation | | | 48,000 | | | | 1,452,960 | |
| | | | | | | | |
Oil & Gas & Consumable Fuels - 7.8% | | | | | |
Cabot Oil & Gas Corporation | | | 140,000 | | | | 2,476,600 | |
ConocoPhillips | | | 115,000 | | | | 5,369,350 | |
EOG Resources, Inc. | | | 60,000 | | | | 4,247,400 | |
Exxon Mobil Corporation | | | 70,000 | | | | 5,456,500 | |
Occidental Petroleum Corporation | | | 65,000 | | | | 4,394,650 | |
| | | | | | | | |
| | | | | | | 21,944,500 | |
| | | | | | | | |
Personal Products - 0.8% | | | | | | | | |
The Estee Lauder Companies Inc. - Class A | | | 25,000 | | | | 2,201,500 | |
| | | | | | | | |
The accompanying notes are an integral part of these financial statements.
19
|
| LKCM EQUITY FUND |
| SCHEDULEOF INVESTMENTS, CONTINUED |
| December 31, 2015 |
| | | | | | | | |
| COMMON STOCKS | | Shares | | | Value | |
Pharmaceuticals - 7.0% | | | | | | | | |
Abbott Laboratories | | | 90,000 | | | $ | 4,041,900 | |
AbbVie Inc. | | | 65,000 | | | | 3,850,600 | |
Johnson & Johnson | | | 38,000 | | | | 3,903,360 | |
Merck & Co., Inc. | | | 80,000 | | | | 4,225,600 | |
Pfizer Inc. | | | 115,000 | | | | 3,712,200 | |
| | | | | | | | |
| | | | | | | 19,733,660 | |
| | | | | | | | |
Road & Rail - 2.5% | | | | | | | | |
Kansas City Southern | | | 20,000 | | | | 1,493,400 | |
Union Pacific Corporation | | | 70,000 | | | | 5,474,000 | |
| | | | | | | | |
| | | | | | | 6,967,400 | |
| | | | | | | | |
Software - 3.5% | | | | | | | | |
Adobe Systems Incorporated (a) | | | 45,000 | | | | 4,227,300 | |
Microsoft Corporation | | | 100,000 | | | | 5,548,000 | |
| | | | | | | | |
| | | | | | | 9,775,300 | |
| | | | | | | | |
Specialty Retail - 4.5% | | | | | | | | |
The Home Depot, Inc. | | | 50,000 | | | | 6,612,500 | |
Tiffany & Co. | | | 35,000 | | | | 2,670,150 | |
Tractor Supply Company | | | 40,000 | | | | 3,420,000 | |
| | | | | | | | |
| | | | | | | 12,702,650 | |
| | | | | | | | |
Textiles, Apparel & Luxury Goods - 2.8% | | | | | |
NIKE, Inc. - Class B | | | 67,000 | | | | 4,187,500 | |
V.F. Corporation | | | 60,000 | | | | 3,735,000 | |
| | | | | | | | |
| | | | | | | 7,922,500 | |
| | | | | | | | |
TOTAL COMMON STOCKS | | | | | | | | |
(Cost $195,406,832) | | | | | | | 280,911,583 | |
| | | | | | | | |
| | | | | | | | |
| SHORT-TERM INVESTMENT - 0.1% | | | | |
Money Market Fund (c) - 0.1% | | | | | | | | |
Federated Government Obligations Fund - Institutional Shares, 0.01% | | | 322,887 | | | | 322,887 | |
| | | | | | | | |
TOTAL SHORT-TERM INVESTMENT | |
(Cost $322,887) | | | | | | | 322,887 | |
| | | | | | | | |
Total Investments - 100.0% | | | | | | | | |
(Cost $195,729,719) | | | | | | | 281,234,470 | |
Liabilities in Excess of Other Assets - 0.0% | | | | (34,747 | ) |
| | | | | | | | |
TOTAL NET ASSETS - 100.0% | | | | | | $ | 281,199,723 | |
| | | | | | | | |
| (a) | Non-income producing security. |
| (b) | Security issued by non-U.S. incorporated company. |
| (c) | The rate quoted is the annualized seven-day yield of the fund at period end. |
Investments are classified by asset class and industry pursuant to the Global Industry Classification Standard (GICS®) which was developed by and/or is the exclusive property of MSCI, Inc. and Standard & Poor Financial Services LLC (“S&P”). GICS is a service mark of MSCI and S&P and has been licensed for use by U.S. Bancorp Fund Services, LLC.
The accompanying notes are an integral part of these financial statements.
20
|
| LKCM BALANCED FUND |
| SCHEDULEOF INVESTMENTS |
| December 31, 2015 |
| | | | | | | | |
| COMMON STOCKS - 69.4% | | Shares | | | Value | |
Aerospace & Defense - 2.4% | |
General Dynamics Corporation | | | 1,400 | | | $ | 192,304 | |
Honeywell International Inc. | | | 3,400 | | | | 352,138 | |
Rockwell Collins, Inc. | | | 4,400 | | | | 406,120 | |
| | | | | | | | |
| | | | | | | 950,562 | |
| | | | | | | | |
Air Freight & Logistics - 0.6% | | | | | | | | |
United Parcel Service, Inc. - Class B | | | 2,600 | | | | 250,198 | |
| | | | | | | | |
Banks - 5.6% | | | | | | | | |
Bank of America Corporation | | | 17,000 | | | | 286,110 | |
Comerica Incorporated | | | 9,500 | | | | 397,385 | |
Cullen/Frost Bankers, Inc. | | | 3,900 | | | | 234,000 | |
SunTrust Banks, Inc. | | | 10,300 | | | | 441,252 | |
Wells Fargo & Company | | | 7,571 | | | | 411,560 | |
Zions Bancorporation | | | 15,100 | | | | 412,230 | |
| | | | | | | | |
| | | | | | | 2,182,537 | |
| | | | | | | | |
Beverages - 1.9% | | | | | | | | |
The Coca-Cola Company | | | 8,600 | | | | 369,456 | |
PepsiCo, Inc. | | | 3,600 | | | | 359,712 | |
| | | | | | | | |
| | | | | | | 729,168 | |
| | | | | | | | |
Biotechnology - 1.7% | | | | | | | | |
Celgene Corporation (a) | | | 5,400 | | | | 646,704 | |
| | | | | | | | |
Chemicals - 3.8% | | | | | | | | |
Air Products and Chemicals, Inc. | | | 2,500 | | | | 325,275 | |
Airgas, Inc. | | | 3,000 | | | | 414,960 | |
E. I. du Pont de Nemours and Company | | | 4,200 | | | | 279,720 | |
ECOLAB INC. | | | 1,400 | | | | 160,132 | |
Monsanto Company | | | 2,900 | | | | 285,708 | |
| | | | | | | | |
| | | | | | | 1,465,795 | |
| | | | | | | | |
Commercial Services & Supplies - 1.9% | | | | | | | | |
Copart, Inc. (a) | | | 11,000 | | | | 418,110 | |
Waste Management, Inc. | | | 6,100 | | | | 325,557 | |
| | | | | | | | |
| | | | | | | 743,667 | |
| | | | | | | | |
Communications Equipment - 0.3% | | | | | | | | |
QUALCOMM Incorporated | | | 2,000 | | | | 99,970 | |
| | | | | | | | |
Computers & Peripherals - 2.8% | | | | | | | | |
Apple Inc. | | | 5,950 | | | | 626,297 | |
EMC Corporation | | | 9,400 | | | | 241,392 | |
International Business Machines Corporation | | | 1,500 | | | | 206,430 | |
| | | | | | | | |
| | | | | | | 1,074,119 | |
| | | | | | | | |
Construction Materials - 0.9% | | | | | | | | |
Martin Marietta Materials, Inc. | | | 2,700 | | | | 368,766 | |
| | | | | | | | |
Containers & Packaging - 1.0% | | | | | | | | |
Ball Corporation | | | 5,400 | | | | 392,742 | |
| | | | | | | | |
Diversified Financial Services - 1.0% | | | | | | | | |
Moody’s Corporation | | | 4,000 | | | | 401,360 | |
| | | | | | | | |
Diversified Financials - 0.8% | | | | | | | | |
JPMorgan Chase & Co. | | | 4,800 | | | | 316,944 | |
| | | | | | | | |
| | | | | | | | |
| COMMON STOCKS | | Shares | | | Value | |
Diversified Telecommunication Services - 1.6% | | | | | |
AT&T Inc. | | | 13,832 | | | $ | 475,959 | |
Verizon Communications, Inc. | | | 2,841 | | | | 131,311 | |
| | | | | | | | |
| | | | | | | 607,270 | |
| | | | | | | | |
Electrical Equipment & Instruments - 0.4% | | | | | |
Emerson Electric Co. | | | 3,000 | | | | 143,490 | |
| | | | | | | | |
Electronic Equipment & Instruments - 1.4% | | | | | |
National Instruments Corporation | | | 7,500 | | | | 215,175 | |
Trimble Navigation Limited (a) | | | 16,000 | | | | 343,200 | |
| | | | | | | | |
| | | | | | | 558,375 | |
| | | | | | | | |
Energy Equipment & Services - 0.6% | | | | | | | | |
Schlumberger Limited (b) | | | 3,395 | | | | 236,801 | |
| | | | | | | | |
Food & Drug Retailing - 2.6% | | | | | | | | |
CVS Health Corporation | | | 3,700 | | | | 361,749 | |
Wal-Mart Stores, Inc. | | | 4,100 | | | | 251,330 | |
Walgreens Boots Alliance, Inc. | | | 4,900 | | | | 417,259 | |
| | | | | | | | |
| | | | | | | 1,030,338 | |
| | | | | | | | |
Health Care Equipment & Supplies - 5.1% | | | | | |
Medtronic, PLC (b) | | | 6,100 | | | | 469,212 | |
PerkinElmer, Inc. | | | 11,600 | | | | 621,412 | |
Thermo Fisher Scientific Inc. | | | 3,100 | | | | 439,735 | |
VWR Corporation (a) | | | 17,000 | | | | 481,270 | |
| | | | | | | | |
| | | | | | | 2,011,629 | |
| | | | | | | | |
Household Durables - 2.0% | | | | | | | | |
Jarden Corporation (a) | | | 7,900 | | | | 451,248 | |
Whirlpool Corporation | | | 2,300 | | | | 337,801 | |
| | | | | | | | |
| | | | | | | 789,049 | |
| | | | | | | | |
Household Products - 2.8% | | | | | | | | |
Colgate-Palmolive Company | | | 5,500 | | | | 366,410 | |
Kimberly-Clark Corporation | | | 3,600 | | | | 458,280 | |
The Procter & Gamble Company | | | 3,500 | | | | 277,935 | |
| | | | | | | | |
| | | | | | | 1,102,625 | |
| | | | | | | | |
Industrial Conglomerates - 1.0% | | | | | | | | |
General Electric Company | | | 12,400 | | | | 386,260 | |
| | | | | | | | |
Insurance - 1.5% | | | | | | | | |
MetLife, Inc. | | | 6,300 | | | | 303,723 | |
Prudential Financial, Inc. | | | 3,400 | | | | 276,794 | |
| | | | | | | | |
| | | | | | | 580,517 | |
| | | | | | | | |
Internet Catalog & Retail - 1.7% | | | | | | | | |
Amazon.com, Inc. (a) | | | 1,000 | | | | 675,890 | |
| | | | | | | | |
Internet Software & Services - 3.5% | | | | | | | | |
Akamai Technologies, Inc. (a) | | | 5,400 | | | | 284,202 | |
Alphabet, Inc. - Class A (a) | | | 350 | | | | 272,304 | |
Alphabet, Inc. - Class C (a) | | | 350 | | | | 265,608 | |
eBay Inc. (a) | | | 6,000 | | | | 164,880 | |
Sabre Corporation | | | 14,000 | | | | 391,580 | |
| | | | | | | | |
| | | | | | | 1,378,574 | |
| | | | | | | | |
The accompanying notes are an integral part of these financial statements.
21
|
| LKCM BALANCED FUND |
| SCHEDULEOF INVESTMENTS, CONTINUED |
| December 31, 2015 |
| | | | | | | | |
| COMMON STOCKS | �� | Shares | | | Value | |
IT Consulting & Services - 2.1% | | | | | | | | |
Accenture PLC - Class A (b) | | | 3,200 | | | $ | 334,400 | |
Automatic Data Processing, Inc. | | | 3,200 | | | | 271,104 | |
PayPal Holdings, Inc. (a) | | | 6,000 | | | | 217,200 | |
| | | | | | | | |
| | | | | | | 822,704 | |
| | | | | | | | |
Machinery - 1.2% | | | | | | | | |
Danaher Corporation | | | 4,900 | | | | 455,112 | |
| | | | | | | | |
Media - 2.6% | | | | | | | | |
CBS Corporation - Class B | | | 5,600 | | | | 263,928 | |
Time Warner Inc. | | | 5,100 | | | | 329,817 | |
The Walt Disney Company | | | 4,000 | | | | 420,320 | |
| | | | | | | | |
| | | | | | | 1,014,065 | |
| | | | | | | | |
Oil & Gas & Consumable Fuels - 3.4% | | | | | | | | |
Cabot Oil & Gas Corporation | | | 10,200 | | | | 180,438 | |
Chevron Corporation | | | 2,695 | | | | 242,442 | |
EOG Resources, Inc. | | | 3,800 | | | | 269,002 | |
Exxon Mobil Corporation | | | 3,227 | | | | 251,545 | |
Memorial Resource Development Corp. (a) | | | 7,500 | | | | 121,125 | |
Pioneer Natural Resources Company | | | 1,400 | | | | 175,532 | |
Range Resources Corporation | | | 4,000 | | | | 98,440 | |
| | | | | | | | |
| | | | | | | 1,338,524 | |
| | | | | | | | |
Pharmaceuticals - 4.2% | | | | | | | | |
Abbott Laboratories | | | 11,000 | | | | 494,010 | |
AbbVie Inc. | | | 6,300 | | | | 373,212 | |
Merck & Co., Inc. | | | 8,900 | | | | 470,098 | |
Pfizer Inc. | | | 10,000 | | | | 322,800 | |
| | | | | | | | |
| | | | | | | 1,660,120 | |
| | | | | | | | |
Real Estate Investment Trusts - 0.6% | | | | | |
American Tower Corporation | | | 2,600 | | | | 252,070 | |
| | | | | | | | |
Road & Rail - 0.6% | | | | | | | | |
Union Pacific Corporation | | | 3,000 | | | | 234,600 | |
| | | | | | | | |
Software - 1.7% | | | | | | | | |
Adobe Systems Incorporated (a) | | | 3,900 | | | | 366,366 | |
Citrix Systems, Inc. (a) | | | 4,000 | | | | 302,600 | |
| | | | | | | | |
| | | | | | | 668,966 | |
| | | | | | | | |
Specialty Retail - 2.6% | | | | | | | | |
The Home Depot, Inc. | | | 4,000 | | | | 529,000 | |
O’Reilly Automotive, Inc. (a) | | | 1,900 | | | | 481,498 | |
| | | | | | | | |
| | | | | | | 1,010,498 | |
| | | | | | | | |
Textiles, Apparel & Luxury Goods - 0.9% | | | | | |
V.F. Corporation | | | 5,700 | | | | 354,825 | |
| | | | | | | | |
Thrifts & Mortgage Finance - 0.6% | | | | | | | | |
Capitol Federal Financial Inc. | | | 17,500 | | | | 219,800 | |
| | | | | | | | |
TOTAL COMMON STOCKS | | | | | | | | |
(Cost $16,733,386) | | | | | | | 27,154,634 | |
| | | | | | | | |
| | | | | | | | |
| CORPORATE BONDS - 27.4% | | Principal
Amount | | | Value | |
Banks - 3.8% | | | | | | | | |
Bank of America Corporation | | | | | | | | |
2.625%, 10/19/2020 | | $ | 250,000 | | | $ | 247,131 | |
BB&T Corporation: | | | | | | | | |
2.150%, 03/22/2017 | | | | | | | | |
Callable 02/22/2017 | | | 200,000 | | | | 201,576 | |
2.250%, 02/01/2019 | | | | | | | | |
Callable 01/02/2019 | | | 115,000 | | | | 115,502 | |
Comerica Incorporated | | | | | | | | |
2.125%, 05/23/2019 | | | | | | | | |
Callable 04/23/2019 | | | 310,000 | | | | 307,980 | |
SunTrust Banks, Inc. | | | | | | | | |
3.500%, 01/20/2017 | | | | | | | | |
Callable 12/20/2016 | | | 300,000 | | | | 305,250 | |
Wells Fargo & Company: | | | | | | | | |
2.625%, 12/15/2016 | | | 100,000 | | | | 101,372 | |
2.150%, 01/15/2019 | | | 200,000 | | | | 201,205 | |
| | | | | | | | |
| | | | | | | 1,480,016 | |
| | | | | | | | |
Beverages - 0.9% | | | | | | | | |
Anheuser-Busch InBev Worldwide Inc. | | | | | | | | |
1.375%, 07/15/2017 | | | 100,000 | | | | 99,690 | |
PepsiCo, Inc. | | | | | | | | |
3.000%, 08/25/2021 | | | 250,000 | | | | 257,831 | |
| | | | | | | | |
| | | | | | | 357,521 | |
| | | | | | | | |
Biotechnology - 2.2% | | | | | | | | |
Amgen Inc.: | | | | | | | | |
2.125%, 05/15/2017 | | | 225,000 | | | | 226,448 | |
2.200%, 05/22/2019 | | | | | | | | |
Callable 04/22/2019 | | | 100,000 | | | | 99,955 | |
Celgene Corporation | | | | | | | | |
1.900%, 08/15/2017 | | | 175,000 | | | | 175,722 | |
Gilead Sciences, Inc. | | | | | | | | |
2.050%, 04/01/2019 | | | 335,000 | | | | 335,776 | |
| | | | | | | | |
| | | | | | | 837,901 | |
| | | | | | | | |
Chemicals - 2.2% | | | | | | | | |
Air Products and Chemicals, Inc. | | | | | | | | |
1.200%, 10/15/2017 | | | 150,000 | | | | 149,180 | |
Eastman Chemical Company | | | | | | | | |
2.400%, 06/01/2017 | | | 160,000 | | | | 160,928 | |
ECOLAB INC. | | | | | | | | |
1.450%, 12/08/2017 | | | 250,000 | | | | 247,748 | |
The Sherwin-Williams Company | | | | | | | | |
1.350%, 12/15/2017 | | | 300,000 | | | | 297,522 | |
| | | | | | | | |
| | | | | | | 855,378 | |
| | | | | | | | |
Communications Equipment - 0.9% | | | | | | | | |
QUALCOMM Incorporated | | | | | | | | |
2.250%, 05/20/2020 | | | 350,000 | | | | 346,813 | |
| | | | | | | | |
The accompanying notes are an integral part of these financial statements.
22
|
| LKCM BALANCED FUND |
| SCHEDULEOF INVESTMENTS, CONTINUED |
| December 31, 2015 |
| | | | | | | | |
| CORPORATE BONDS | | Principal
Amount | | | Value | |
Computers & Peripherals - 1.6% | | | | | | | | |
Apple Inc. | | | | | | | | |
2.850%, 05/06/2021 | | $ | 300,000 | | | $ | 307,457 | |
NetApp, Inc. | | | | | | | | |
2.000%, 12/15/2017 | | | 300,000 | | | | 298,130 | |
| | | | | | | | |
| | | | | | | 605,587 | |
| | | | | | | | |
Consumer Finance - 0.7% | | | | | | | | |
American Express Credit Corporation: | | | | | | | | |
2.375%, 03/24/2017 | | | 175,000 | | | | 176,932 | |
2.600%, 09/14/2020 | | | | | | | | |
Callable 04/14/2020 | | | 100,000 | | | | 100,296 | |
| | | | | | | | |
| | | | | | | 277,228 | |
| | | | | | | | |
Consumer Services - 0.6% | | | | | | | | |
The Western Union Company | | | | | | | | |
2.875%, 12/10/2017 | | | 225,000 | | | | 227,781 | |
| | | | | | | | |
Diversified Financials - 0.8% | | | | | | | | |
JPMorgan Chase & Co. | | | | | | | | |
2.000%, 08/15/2017 | | | 300,000 | | | | 301,088 | |
| | | | | | | | |
Diversified Telecommunication Services - 0.7% | | | | | |
AT&T Inc. | | | | | | | | |
2.450%, 06/30/2020 | | | | | | | | |
Callable 05/30/2020 | | | 300,000 | | | | 295,758 | |
| | | | | | | | |
Electrical Equipment - 0.7% | | | | | | | | |
Rockwell Automation Inc. | | | | | | | | |
2.050%, 03/01/2020 | | | | | | | | |
Callable 02/01/2020 | | | 288,000 | | | | 285,679 | |
| | | | | | | | |
Electrical Equipment & Instruments - 0.8% | | | | | |
Roper Technologies, Inc. | | | | | | | | |
1.850%, 11/15/2017 | | | 300,000 | | | | 298,558 | |
| | | | | | | | |
Energy Equipment & Services - 0.5% | | | | | | | | |
National Oilwell Varco, Inc. | | | | | | | | |
1.350%, 12/01/2017 | | | 200,000 | | | | 195,755 | |
| | | | | | | | |
Food & Drug Retailing - 1.3% | | | | | | | | |
CVS Health Corporation: | | | | | | | | |
5.750%, 06/01/2017 | | | 100,000 | | | | 105,916 | |
2.250%, 12/05/2018 | | | | | | | | |
Callable 11/05/2018 | | | 175,000 | | | | 175,965 | |
Walgreens Boots Alliance, Inc. | | | | | | | | |
3.300%, 11/18/2021 | | | | | | | | |
Callable 09/18/2021 | | | 250,000 | | | | 245,505 | |
| | | | | | | | |
| | | | | | | 527,386 | |
| | | | | | | | |
Food Products - 0.2% | | | | | | | | |
Kraft Foods Group, Inc. | | | | | | | | |
2.250%, 06/05/2017 | | | 75,000 | | | | 75,568 | |
| | | | | | | | |
Health Care Equipment & Supplies - 0.8% | | | | | |
Thermo Fisher Scientific Inc. | | | | | | | | |
1.850%, 01/15/2018 | | | 325,000 | | | | 324,118 | |
| | | | | | | | |
Health Care Providers & Services - 0.1% | | | | | |
Express Scripts Holding Co. | | | | | | | | |
2.650%, 02/15/2017 | | | 45,000 | | | | 45,454 | |
| | | | | | | | |
| | | | | | | | |
| CORPORATE BONDS | | Principal
Amount | | | Value | |
Internet Catalog & Retail - 0.7% | | | | | | | | |
Amazon.com, Inc. | | | | | | | | |
1.200%, 11/29/2017 | | $ | 295,000 | | | $ | 294,224 | |
| | | | | | | | |
Internet Software & Services - 0.3% | | | | | | | | |
eBay Inc. | | | | | | | | |
1.350%, 07/15/2017 | | | 125,000 | | | | 124,057 | |
| | | | | | | | |
Media - 0.8% | | | | | | | | |
DIRECTV Holdings LLC | | | | | | | | |
2.400%, 03/15/2017 | | | 300,000 | | | | 302,502 | |
| | | | | | | | |
Oil & Gas & Consumable Fuels - 1.9% | | | | | |
EOG Resources, Inc. | | | | | | | | |
2.450%, 04/01/2020 | | | | | | | | |
Callable 03/01/2020 | | | 200,000 | | | | 197,956 | |
Kinder Morgan Inc. | | | | | | | | |
2.000%, 12/01/2017 | | | 200,000 | | | | 192,787 | |
Noble Holding International Limited (b) | | | | | | | | |
2.500%, 03/15/2017 | | | 150,000 | | | | 141,554 | |
Occidental Petroleum Corporation | | | | | | | | |
1.750%, 02/15/2017 | | | 200,000 | | | | 200,433 | |
| | | | | | | | |
| | | | | | | 732,730 | |
| | | | | | | | |
Pharmaceuticals - 2.1% | | | | | | | | |
Abbott Laboratories | | | | | | | | |
2.000%, 03/15/2020 | | | 250,000 | | | | 249,315 | |
AbbVie Inc. | | | | | | | | |
2.000%, 11/06/2018 | | | 134,000 | | | | 133,495 | |
AbbVie Inc. | | | | | | | | |
2.500%, 05/14/2020 | | | | | | | | |
Callable 04/14/2020 | | | 175,000 | | | | 173,418 | |
Merck & Co., Inc. | | | | | | | | |
1.100%, 01/31/2018 | | | 275,000 | | | | 273,566 | |
| | | | | | | | |
| | | | | | | 829,794 | |
| | | | | | | | |
Real Estate Investment Trusts - 0.8% | | | | | |
American Tower Corporation: | | | | | | | | |
3.400%, 02/15/2019 | | | 200,000 | | | | 205,309 | |
2.800%, 06/01/2020 | | | | | | | | |
Callable 05/01/2020 | | | 100,000 | | | | 98,951 | |
| | | | | | | | |
| | | | | | | 304,260 | |
| | | | | | | | |
Semiconductor Equipment & Products - 1.5% | | | | | |
Broadcom Corporation | | | | | | | | |
2.700%, 11/01/2018 | | | 300,000 | | | | 301,297 | |
Intel Corporation | | | | | | | | |
1.350%, 12/15/2017 | | | 300,000 | | | | 300,485 | |
| | | | | | | | |
| | | | | | | 601,782 | |
| | | | | | | | |
Software - 0.5% | | | | | | | | |
Oracle Corporation | | | | | | | | |
1.200%, 10/15/2017 | | | 200,000 | | | | 200,159 | |
| | | | | | | | |
TOTAL CORPORATE BONDS | | | | | | | | |
(Cost $10,786,344) | | | | | | | 10,727,097 | |
| | | | | | | | |
The accompanying notes are an integral part of these financial statements.
23
|
| LKCM BALANCED FUND |
| SCHEDULEOF INVESTMENTS, CONTINUED |
| December 31, 2015 |
| | | | | | | | |
| SHORT-TERM INVESTMENT - 2.3% | | Shares | | | Value | |
Money Market Fund (c) - 2.3% | | | | | | | | |
Federated Government Obligations Fund - Institutional Shares, 0.01% | | | 909,995 | | | $ | 909,995 | |
| | | | | | | | |
TOTAL SHORT-TERM INVESTMENT | |
(Cost $909,995) | | | | | | | 909,995 | |
| | | | | | | | |
Total Investments - 99.1% | | | | | | | | |
(Cost $28,429,725) | | | | | | | 38,791,726 | |
Other Assets in Excess of Liabilities - 0.9% | | | | 361,406 | |
| | | | | | | | |
TOTAL NET ASSETS - 100.0% | | | | | | $ | 39,153,132 | |
| | | | | | | | |
| (a) | Non-income producing security. |
| (b) | Security issued by non-U.S. incorporated company. |
| (c) | The rate quoted is the annualized seven-day yield of the fund at period end. |
Investments are classified by asset class and industry pursuant to the Global Industry Classification Standard (GICS®) which was developed by and/or is the exclusive property of MSCI, Inc. and Standard & Poor Financial Services LLC (“S&P”). GICS is a service mark of MSCI and S&P and has been licensed for use by U.S. Bancorp Fund Services, LLC.
The accompanying notes are an integral part of these financial statements.
24
|
| LKCM FIXED INCOME FUND |
| SCHEDULEOF INVESTMENTS |
| December 31, 2015 |
| | | | | | | | |
| CORPORATE BONDS - 75.8% | | Principal
Amount | | | Value | |
Aerospace & Defense - 0.6% | | | | | | | | |
Lockheed Martin Corporation | | | | | | | | |
7.650%, 05/01/2016 | | $ | 1,250,000 | | | $ | 1,277,853 | |
| | | | | | | | |
Air Freight & Logistics - 1.2% | | | | | | | | |
FedEx Corp. | | | | | | | | |
3.200%, 02/01/2025 | | | 2,500,000 | | | | 2,436,332 | |
| | | | | | | | |
Banks - 10.5% | | | | | | | | |
Bank of America Corporation: | | | | | | | | |
1.317%, 03/22/2018 (a) | | | 2,000,000 | | | | 2,007,504 | |
4.200%, 08/26/2024 | | | 4,000,000 | | | | 3,975,840 | |
Branch Banking & Trust Company: | | | | | | | | |
0.862%, 09/13/2016 (a) | | | 2,325,000 | | | | 2,320,280 | |
0.793%, 05/23/2017 (a) | | | 2,534,000 | | | | 2,522,711 | |
1.350%, 10/01/2017 | | | | | | | | |
Callable 09/01/2017 | | | 500,000 | | | | 499,220 | |
Comerica Incorporated | | | | | | | | |
2.125%, 05/23/2019 | | | | | | | | |
Callable 04/23/2019 | | | 1,000,000 | | | | 993,484 | |
SunTrust Banks, Inc. | | | | | | | | |
3.500%, 01/20/2017 | | | | | | | | |
Callable 12/20/2016 | | | 875,000 | | | | 890,312 | |
Wells Fargo & Company: | | | | | | | | |
0.863%, 04/23/2018 (a) | | | 2,500,000 | | | | 2,499,890 | |
4.125%, 08/15/2023 | | | 5,000,000 | | | | 5,197,930 | |
| | | | | | | | |
| | | | | | | 20,907,171 | |
| | | | | | | | |
Beverages - 0.1% | | | | | | | | |
PepsiCo, Inc. | | | | | | | | |
7.900%, 11/01/2018 | | | 214,000 | | | | 250,853 | |
| | | | | | | | |
Biotechnology - 2.1% | | | | | | | | |
Celgene Corporation | | | | | | | | |
4.000%, 08/15/2023 | | | 4,000,000 | | | | 4,110,908 | |
| | | | | | | | |
Building Products - 0.8% | | | | | | | | |
Masco Corporation | | | | | | | | |
7.125%, 03/15/2020 | | | 1,350,000 | | | | 1,562,625 | |
| | | | | | | | |
Capital Markets - 3.0% | | | | | | | | |
Morgan Stanley (a): | | | | | | | | |
1.514%, 04/25/2018 | | | 2,500,000 | | | | 2,528,125 | |
1.083%, 01/24/2019 | | | 3,500,000 | | | | 3,493,620 | |
| | | | | | | | |
| | | | | | | 6,021,745 | |
| | | | | | | | |
Chemicals - 1.4% | | | | | | | | |
Airgas, Inc. | | | | | | | | |
2.950%, 06/15/2016 | | | | | | | | |
Callable 05/15/2016 | | | 950,000 | | | | 955,466 | |
ECOLAB INC. | | | | | | | | |
3.000%, 12/08/2016 | | | 1,760,000 | | | | 1,785,670 | |
| | | | | | | | |
| | | | | | | 2,741,136 | |
| | | | | | | | |
Commercial Services & Supplies - 0.6% | | | | | |
Republic Services, Inc. | | | | | | | | |
5.500%, 09/15/2019 | | | 1,000,000 | | | | 1,101,131 | |
| | | | | | | | |
| | | | | | | | |
| CORPORATE BONDS | | Principal
Amount | | | Value | |
Communications Equipment - 0.9% | | | | | |
Cisco Systems, Inc.: | | | | | | | | |
5.500%, 02/22/2016 | | $ | 1,000,000 | | | $ | 1,006,395 | |
4.950%, 02/15/2019 | | | 700,000 | | | | 765,291 | |
| | | | | | | | |
| | | | | | | 1,771,686 | |
| | | | | | | | |
Computers & Peripherals - 2.8% | | | | | | | | |
Hewlett-Packard Company: | | | | | | | | |
4.650%, 12/09/2021 | | | 2,000,000 | | | | 1,994,992 | |
4.050%, 09/15/2022 | | | 2,000,000 | | | | 1,907,830 | |
International Business Machines Corporation | | | | | | | | |
5.700%, 09/14/2017 | | | 1,500,000 | | | | 1,609,266 | |
| | | | | | | | |
| | | | | | | 5,512,088 | |
| | | | | | | | |
Consumer Finance - 2.7% | | | | | | | | |
American Express Company | | | | | | | | |
0.823%, 05/22/2018 (a) | | | 3,533,000 | | | | 3,513,169 | |
American Express Credit Corporation | | | | | | | | |
2.800%, 09/19/2016 | | | 1,900,000 | | | | 1,924,402 | |
| | | | | | | | |
| | | | | | | 5,437,571 | |
| | | | | | | | |
Consumer Services - 3.0% | | | | | | | | |
The Western Union Company: | | | | | | | | |
5.930%, 10/01/2016 | | | 1,000,000 | | | | 1,031,941 | |
2.875%, 12/10/2017 | | | 2,250,000 | | | | 2,277,808 | |
3.650%, 08/22/2018 | | | 2,500,000 | | | | 2,564,195 | |
| | | | | | | | |
| | | | | | | 5,873,944 | |
| | | | | | | | |
Containers & Packaging - 2.6% | | | | | | | | |
Ball Corporation: | | | | | | | | |
5.000%, 03/15/2022 | | | 2,000,000 | | | | 2,050,000 | |
5.250%, 07/01/2025 | | | 3,000,000 | | | | 3,078,750 | |
| | | | | | | | |
| | | | | | | 5,128,750 | |
| | | | | | | | |
Diversified Financials - 3.6% | | | | | | | | |
JPMorgan Chase & Co.: | | | | | | | | |
3.450%, 03/01/2016 | | | 2,125,000 | | | | 2,133,914 | |
1.134%, 01/25/2018 (a) | | | 3,000,000 | | | | 3,007,689 | |
3.875%, 09/10/2024 | | | 2,000,000 | | | | 1,993,126 | |
| | | | | | | | |
| | | | | | | 7,134,729 | |
| | | | | | | | |
Diversified Telecommunication Services - 8.0% | | | | | |
AT&T Inc. (a): | | | | | | | | |
1.146%, 11/27/2018 | | | 3,000,000 | | | | 3,004,737 | |
0.909%, 03/11/2019 | | | 1,500,000 | | | | 1,490,401 | |
CenturyLink, Inc.: | | | | | | | | |
6.150%, 09/15/2019 | | | 1,402,000 | | | | 1,437,050 | |
5.800%, 03/15/2022 | | | 2,500,000 | | | | 2,300,625 | |
Verizon Communications Inc. (a): | | | | | | | | |
1.771%, 09/15/2016 | | | 4,000,000 | | | | 4,025,180 | |
1.991%, 09/14/2018 | | | 2,000,000 | | | | 2,049,208 | |
4.150%, 03/15/2024 | | | | | | | | |
Callable 12/15/2023 | | | 1,500,000 | | | | 1,544,093 | |
| | | | | | | | |
| | | | | | | 15,851,294 | |
| | | | | | | | |
The accompanying notes are an integral part of these financial statements.
25
|
| LKCM FIXED INCOME FUND |
| SCHEDULEOF INVESTMENTS, CONTINUED |
| December 31, 2015 |
| | | | | | | | |
| CORPORATE BONDS | | Principal
Amount | | | Value | |
Energy Equipment & Services - 0.7% | | | | | |
Weatherford International Ltd. (b) | | | | | | | | |
4.500%, 04/15/2022 | | | | | | | | |
Callable 01/15/2022 | | $ | 2,000,000 | | | $ | 1,442,500 | |
| | | | | | | | |
Food & Drug Retailing - 4.5% | | | | | | | | |
CVS Health Corporation: | | | | | | | | |
1.200%, 12/05/2016 | | | 2,000,000 | | | | 2,000,808 | |
5.750%, 06/01/2017 | | | 2,750,000 | | | | 2,912,698 | |
4.125%, 05/15/2021 | | | | | | | | |
Callable 02/15/2021 | | | 2,000,000 | | | | 2,118,230 | |
Walgreens Boots Alliance, Inc. | | | | | | | | |
3.800%, 11/18/2024 | | | | | | | | |
Callable 08/18/2024 | | | 2,000,000 | | | | 1,943,946 | |
| | | | | | | | |
| | | | | | | 8,975,682 | |
| | | | | | | | |
Food Products - 0.3% | | | | | | | | |
Kraft Foods Group, Inc. | | | | | | | | |
2.250%, 06/05/2017 | | | 555,000 | | | | 559,205 | |
| | | | | | | | |
Health Care Equipment & Supplies - 3.7% | | | | | |
DENTSPLY International Inc. | | | | | | | | |
2.750%, 08/15/2016 | | | 1,446,000 | | | | 1,456,885 | |
PerkinElmer, Inc. | | | | | | | | |
5.000%, 11/15/2021 | | | | | | | | |
Callable 08/15/2021 | | | 1,094,000 | | | | 1,156,644 | |
Thermo Fisher Scientific, Inc. | | | | | | | | |
4.150%, 02/01/2024 | | | | | | | | |
Callable 11/01/2023 | | | 4,500,000 | | | | 4,681,859 | |
| | | | | | | | |
| | | | | | | 7,295,388 | |
| | | | | | | | |
Health Care Providers & Services - 2.5% | | | | | |
Express Scripts Holding Co | | | | | | | | |
3.125%, 05/15/2016 | | | 2,760,000 | | | | 2,778,668 | |
McKesson Corporation | | | | | | | | |
3.250%, 03/01/2016 | | | 2,275,000 | | | | 2,283,254 | |
| | | | | | | | |
| | | | | | | 5,061,922 | |
| | | | | | | | |
Hotels, Restaurants & Leisure - 0.5% | | | | | |
McDonald’s Corporation | | | | | | | | |
5.350%, 03/01/2018 | | | 1,000,000 | | | | 1,071,317 | |
| | | | | | | | |
Household Products - 0.5% | | | | | | | | |
The Procter & Gamble Company | | | | | | | | |
8.000%, 09/01/2024 | | | 775,000 | | | | 1,038,148 | |
| | | | | | | | |
Insurance - 1.5% | | | | | | | | |
Prudential Financial, Inc. | | | | | | | | |
3.000%, 05/12/2016 | | | 3,023,000 | | | | 3,040,007 | |
| | | | | | | | |
Media - 0.8% | | | | | | | | |
The Walt Disney Company | | | | | | | | |
5.625%, 09/15/2016 | | | 1,500,000 | | | | 1,550,136 | |
| | | | | | | | |
Metals & Mining - 0.3% | | | | | | | | |
Alcoa Inc. | | | | | | | | |
5.550%, 02/01/2017 | | | 500,000 | | | | 514,375 | |
| | | | | | | | |
| | | | | | | | |
| CORPORATE BONDS | | Principal
Amount | | | Value | |
Multiline Retail - 2.3% | | | | | | | | |
Family Dollar Stores, Inc. | | | | | | | | |
5.000%, 02/01/2021 | | $ | 4,500,000 | | | $ | 4,612,338 | |
| | | | | | | | |
Oil & Gas & Consumable Fuels - 9.4% | | | | | |
Anadarko Petroleum Corporation: | | | | | | | | |
5.950%, 09/15/2016 | | | 2,000,000 | | | | 2,055,466 | |
6.375%, 09/15/2017 | | | 2,000,000 | | | | 2,098,088 | |
Enterprise Products Operating LLC: | | | | | | | | |
3.200%, 02/01/2016 | | | 2,229,000 | | | | 2,229,751 | |
3.750%, 02/15/2025 | | | | | | | | |
Callable 11/15/2024 | | | 4,000,000 | | | | 3,665,736 | |
Kinder Morgan Energy Partners, L.P. | | | | | | | | |
4.250%, 09/01/2024 | | | | | | | | |
Callable 06/01/2024 | | | 3,000,000 | | | | 2,556,360 | |
Noble Holding International Ltd. (b) | | | | | |
3.950%, 03/15/2022 | | | 2,500,000 | | | | 1,655,520 | |
Range Resources Corporation | | | | | | | | |
5.000%, 08/15/2022 | | | | | | | | |
Callable 02/15/2017 | | | 5,850,000 | | | | 4,402,125 | |
| | | | | | | | |
| | | | | | | 18,663,046 | |
| | | | | | | | |
Pharmaceuticals - 0.5% | | | | | | | | |
Allergan, Inc. | | | | | | | | |
1.350%, 03/15/2018 | | | 1,017,000 | | | | 999,745 | |
| | | | | | | | |
Real Estate Investment Trusts - 2.0% | | | | | |
American Tower Corporation: | | | | | | | | |
5.050%, 09/01/2020 | | | 1,250,000 | | | | 1,350,862 | |
5.000%, 02/15/2024 | | | 2,500,000 | | | | 2,650,713 | |
| | | | | | | | |
| | | | | | | 4,001,575 | |
| | | | | | | | |
Road & Rail - 0.1% | | | | | | | | |
Burlington Northern Santa Fe Corporation | | | | | | | | |
5.650%, 05/01/2017 | | | 185,000 | | | | 194,621 | |
| | | | | | | | |
Semiconductor Equipment & Products - 0.5% | | | | | |
Texas Instruments Incorporated | | | | | | | | |
2.375%, 05/16/2016 | | | 1,000,000 | | | | 1,005,589 | |
| | | | | | | | |
Software & Services - 1.3% | | | | | | | | |
Sabre GLBL Inc. (c) | | | | | | | | |
5.375%, 04/15/2023 | | | | | | | | |
Callable 04/15/2018 (Acquired 04/08/2015, Cost $2,548,100) | | | 2,500,000 | | | | 2,500,000 | |
| | | | | | | | |
Specialty Retail - 0.5% | | | | | | | | |
O’Reilly Automotive, Inc. | | | | | | | | |
4.875%, 01/14/2021 | | | | | | | | |
Callable 10/14/2020 | | | 1,000,000 | | | | 1,082,878 | |
| | | | | | | | |
TOTAL CORPORATE BONDS | | | | | | | | |
(Cost $153,320,906) | | | | | | | 150,728,288 | |
| | | | | | | | |
The accompanying notes are an integral part of these financial statements.
26
|
| LKCM FIXED INCOME FUND |
| SCHEDULEOF INVESTMENTS, CONTINUED |
| December 31, 2015 |
| | | | | | | | |
| PREFERRED STOCKS - 0.9% | | Shares | | | Value | |
Capital Markets - 0.9% | | | | | | | | |
Merrill Lynch Preferred Capital Trust III | | | 75,000 | | | $ | 1,883,250 | |
| | | | | | | | |
TOTAL PREFERRED STOCKS | | | | | | | | |
(Cost $1,820,339) | | | | | | | 1,883,250 | |
| | | | | | | | |
| | | | | | | | |
U.S. GOVERNMENT
ISSUES - 8.3% | | Principal
Amount | | | | |
U.S. Treasury Notes - 8.3% | | | | | | | | |
4.500%, 02/15/2016 | | $ | 500,000 | | | | 502,380 | |
2.000%, 07/31/2020 | | | 2,000,000 | | | | 2,023,282 | |
2.250%, 07/31/2021 | | | 2,000,000 | | | | 2,037,774 | |
2.000%, 11/30/2022 | | | 2,000,000 | | | | 1,989,296 | |
2.000%, 02/15/2023 | | | 2,000,000 | | | | 1,988,750 | |
2.500%, 08/15/2023 | | | 2,000,000 | | | | 2,052,344 | |
2.250%, 11/15/2024 | | | 3,000,000 | | | | 2,998,944 | |
2.000%, 02/15/2025 | | | 3,000,000 | | | | 2,933,085 | |
| | | | | | | | |
TOTAL U.S. GOVERNMENT ISSUES | | | | | | | | |
(Cost $16,552,530) | | | | | | | 16,525,855 | |
| | | | | | | | |
| | | | | | | | |
U.S. GOVERNMENT SPONSORED
ENTITIES - 11.8% | | | | | | |
Fannie Mae - 3.5% | | | | | | | | |
5.000%, 03/15/2016 | | | 1,000,000 | | | | 1,009,348 | |
2.625%, 09/06/2024 | | | 2,000,000 | | | | 2,023,460 | |
2.000%, 07/12/2027 | | | | | | | | |
Callable 07/12/2016 | | | 2,000,000 | | | | 1,996,832 | |
2.500%, 09/30/2030 | | | | | | | | |
Callable 09/30/2016 | | | 2,000,000 | | | | 1,982,068 | |
| | | | | | | | |
| | | | | | | 7,011,708 | |
| | | | | | | | |
Federal Home Loan Banks - 8.0% | | | | | | | | |
4.875%, 05/17/2017 | | | 1,000,000 | | | | 1,052,413 | |
1.000%, 03/30/2020 | | | | | | | | |
Callable 03/30/2016 | | | 2,500,000 | | | | 2,501,713 | |
1.000%, 09/30/2021 | | | | | | | | |
Callable 09/30/2016 | | | 5,000,000 | | | | 4,994,995 | |
1.500%, 11/25/2022 | | | | | | | | |
Callable 02/25/2016 | | | 2,900,000 | | | | 2,884,473 | |
1.000%, 03/26/2025 | | | | | | | | |
Callable 03/26/2016 | | | 2,500,000 | | | | 2,500,445 | |
1.000%, 05/13/2030 | | | | | | | | |
Callable 05/13/2016 | | | 2,000,000 | | | | 1,988,728 | |
| | | | | | | | |
| | | | | | | 15,922,767 | |
| | | | | | | | |
Freddie Mac - 0.3% | | | | | | | | |
5.125%, 11/17/2017 | | | 500,000 | | | | 537,074 | |
| | | | | | | | |
TOTAL U.S. GOVERNMENT SPONSORED ENTITIES | | | | | | | | |
(Cost $23,424,797) | | | | | | | 23,471,549 | |
| | | | | | | | |
| | | | | | | | |
SHORT-TERM
INVESTMENT - 2.3% | | Shares | | | Value | |
Money Market Fund (d) - 2.3% | | | | | | | | |
Federated Government Obligations Fund - Institutional Shares, 0.01% | | | 4,521,549 | | | $ | 4,521,549 | |
| | | | | | | | |
TOTAL SHORT-TERM INVESTMENT | | | | | | | | |
(Cost $4,521,549) | | | | | | | 4,521,549 | |
| | | | | | | | |
Total Investments - 99.1% | | | | | | | | |
(Cost $199,640,121) | | | | | | | 197,130,491 | |
Other Assets in Excess of Liabilities - 0.9% | | | | | | | 1,710,372 | |
| | | | | | | | |
TOTAL NET ASSETS - 100.0% | | | | | | $ | 198,840,863 | |
| | | | | | | | |
| (b) | Security issued by non-U.S. incorporated company. |
| (c) | Restricted security. Resale to the public may require registration or may extend only to qualified institutional buyers. The fair market value of the security was $2,500,000 representing 1.3% of the Fund’s total net assets. |
| (d) | The rate quoted is the annualized seven-day yield of the fund at period end. |
Investments are classified by asset class and industry pursuant to the Global Industry Classification Standard (GICS®) which was developed by and/or is the exclusive property of MSCI, Inc. and Standard & Poor Financial Services LLC (“S&P”). GICS is a service mark of MSCI and S&P and has been licensed for use by U.S. Bancorp Fund Services, LLC.
The accompanying notes are an integral part of these financial statements.
27
|
| STATEMENTOF ASSETSAND LIABILITIES |
| December 31, 2015 |
| | | | | | | | | | | | | | | | | | | | | | | | | | | | | | |
| | | | | LKCM Small Cap Equity Fund | | | | | LKCM Small-Mid Cap Equity Fund | | | | | LKCM Equity
Fund | | | | | LKCM Balanced Fund | | | | | LKCM Fixed Income Fund | |
| | | | | | | | | | | | | | | | | | | | | | | | | | | | | | |
Assets: | | | | | | | | | | | | | | | | | | | | | | | | | | | | | | |
Investments, at value* | | | | $ | 578,170,610 | | | | | $ | 332,121,159 | | | | | $ | 281,234,470 | | | | | $ | 38,791,726 | | | | | $ | 197,130,491 | |
Receivable for Fund shares sold | | | | | 240,237 | | | | | | 489,924 | | | | | | 255,648 | | | | | | 341,984 | | | | | | 100,000 | |
Dividends and interest receivable | | | | | 375,059 | | | | | | 144,486 | | | | | | 374,575 | | | | | | 82,113 | | | | | | 1,817,881 | |
Other assets | | | | | 91,721 | | | | | | 30,442 | | | | | | 31,452 | | | | | | 8,532 | | | | | | 20,776 | |
| | | | | | | | | | | | | | | | | | | | | | | | | | | | | | |
Total assets | | | | | 578,877,627 | | | | | | 332,786,011 | | | | | | 281,896,145 | | | | | | 39,224,355 | | | | | | 199,069,148 | |
| | | | | | | | | | | | | | | | | | | | | | | | | | | | | | |
Liabilities: | | | | | | | | | | | | | | | | | | | | | | | | | | | | | | |
Payable for Fund shares redeemed | | | | | 205,600 | | | | | | 123,723 | | | | | | 167,541 | | | | | | 4,000 | | | | | | — | |
Payable for investment advisory fees (Note B) | | | | | 1,273,220 | | | | | | 539,382 | | | | | | 413,011 | | | | | | 41,944 | | | | | | 145,979 | |
Payable for administrative fees | | | | | 84,114 | | | | | | 45,586 | | | | | | 40,109 | | | | | | 5,249 | | | | | | 29,491 | |
Payable for accounting and
transfer agent fees and expenses | | | | | 79,525 | | | | | | 52,724 | | | | | | 35,144 | | | | | | 11,392 | | | | | | 22,646 | |
Payable for custody fees and expenses | | | | | 14,106 | | | | | | 6,200 | | | | | | 5,497 | | | | | | 919 | | | | | | 4,032 | |
Payable for reports to shareholders | | | | | 16,345 | | | | | | 31,111 | | | | | | 5,268 | | | | | | 641 | | | | | | 3,868 | |
Payable for distribution expense (Note B) | | | | | 7,052 | | | | | | — | | | | | | — | | | | | | — | | | | | | — | |
Payable for professional expense | | | | | 48,101 | | | | | | 24,305 | | | | | | 21,686 | | | | | | 6,060 | | | | | | 16,662 | |
Payable for trustees’ expense | | | | | 14,182 | | | | | | 5,657 | | | | | | 5,263 | | | | | | 664 | | | | | | 3,508 | |
Distribution payable | | | | | 108,543 | | | | | | — | | | | | | — | | | | | �� | — | | | | | | — | |
Accrued expenses and other liabilities | | | | | 7,420 | | | | | | 3,457 | | | | | | 2,903 | | | | | | 354 | | | | | | 2,099 | |
| | | | | | | | | | | | | | | | | | | | | | | | | | | | | | |
Total liabilities | | | | | 1,858,208 | | | | | | 832,145 | | | | | | 696,422 | | | | | | 71,223 | | | | | | 228,285 | |
| | | | | | | | | | | | | | | | | | | | | | | | | | | | | | |
Net assets | | | | $ | 577,019,419 | | | | | $ | 331,953,866 | | | | | $ | 281,199,723 | | | | | $ | 39,153,132 | | | | | $ | 198,840,863 | |
| | | | | | | | | | | | | | | | | | | | | | | | | | | | | | |
Net assets consist of: | | | | | | | | | | | | | | | | | | | | | | | | | | | | | | |
Paid in capital | | | | $ | 466,081,780 | | | | | $ | 283,606,340 | | | | | $ | 195,794,705 | | | | | $ | 28,787,833 | | | | | $ | 201,503,073 | |
Accumulated net investment income | | | | | 63,219 | | | | | | — | | | | | | — | | | | | | 84 | | | | | | — | |
Accumulated net realized gain (loss) on investments | | | | | (380,172 | ) | | | | | (1,489,017 | ) | | | | | (99,733 | ) | | | | | 3,214 | | | | | | (152,580 | ) |
Net unrealized appreciation (depreciation) on investments | | | | | 111,254,592 | | | | | | 49,836,543 | | | | | | 85,504,751 | | | | | | 10,362,001 | | | | | | (2,509,630 | ) |
| | | | | | | | | | | | | | | | | | | | | | | | | | | | | | |
Net assets | | | | $ | 577,019,419 | | | | | $ | 331,953,866 | | | | | $ | 281,199,723 | | | | | $ | 39,153,132 | | | | | $ | 198,840,863 | |
| | | | | | | | | | | | | | | | | | | | | | | | | | | | | | |
| | | | | | | | | | |
INSTITUTIONAL CLASS | | | | | | | | | | | | | | | | | | | | | | | | | | | | | | |
Net assets | | | | $ | 568,421,373 | | | | | $ | 331,953,866 | | | | | $ | 281,199,723 | | | | | $ | 39,153,132 | | | | | $ | 198,840,863 | |
Shares of beneficial interest outstanding
(unlimited shares of no par value authorized) | | | | | 28,624,201 | | | | | | 29,779,774 | | | | | | 13,140,555 | | | | | | 1,998,060 | | | | | | 18,932,619 | |
Net asset value per share
(offering and redemption price) | | | | $ | 19.86 | | | | | $ | 11.15 | | | | | $ | 21.40 | | | | | $ | 19.60 | | | | | $ | 10.50 | |
| | | | | | | | | | | | | | | | | | | | | | | | | | | | | | |
| | | | | | | | | | |
ADVISER CLASS** | | | | | | | | | | | | | | | | | | | | | | | | | | | | | | |
Net assets | | | | $ | 8,598,046 | | | | | | | | | | | | | | | | | | | | | | | | | |
Shares of beneficial interest outstanding
(unlimited shares of no par value authorized) | | | | | 454,162 | | | | | | | | | | | | | | | | | | | | | | | | | |
Net asset value per share
(offering and redemption price) | | | | $ | 18.93 | | | | | | | | | | | | | | | | | | | | | | | | | |
| | | | | | | | | | | | | | | | | | | | | | | | | | | | | | |
| | | | | | | | | | |
* Cost of Investments | | | | $ | 466,916,018 | | | | | $ | 282,284,616 | | | | | $ | 195,729,719 | | | | | $ | 28,429,725 | | | | | $ | 199,640,121 | |
| | | | | | | | | | | | | | | | | | | | | | | | | | | | | | |
| ** | Currently, Adviser Class shares are authorized only for the Small Cap Equity, Small-Mid Cap Equity and Equity Funds and are offered only by the Small Cap Equity Fund. |
The accompanying notes are an integral part of these financial statements.
28
|
| STATEMENTOF OPERATIONS |
| For the Year Ended December 31, 2015 |
| | | | | | | | | | | | | | | | | | | | | | | | | | | | | | |
| | | | | LKCM Small Cap Equity Fund | | | | | LKCM Small-Mid Cap Equity Fund | | | | | LKCM
Equity
Fund | | | | | LKCM Balanced Fund | | | | | LKCM
Fixed Income Fund | |
| | | | | | | | | | | | | | | | | | | | | | | | | | | | | | |
Investment Income: | | | | | | | | | | | | | | | | | | | | | | | | | | | | | | |
Dividends* | | | | $ | 7,814,917 | | | | | $ | 1,797,762 | | | | | $ | 5,022,881 | | | | | $ | 478,609 | | | | | $ | 131,250 | |
Interest | | | | | 2,043 | | | | | | 2,554 | | | | | | 1,103 | | | | | | 176,937 | | | | | | 6,305,504 | |
| | | | | | | | | | | | | | | | | | | | | | | | | | | | | | |
Total income | | | | | 7,816,960 | | | | | | 1,800,316 | | | | | | 5,023,984 | | | | | | 655,546 | | | | | | 6,436,754 | |
| | | | | | | | | | | | | | | | | | | | | | | | | | | | | | |
Expenses: | | | | | | | | | | | | | | | | | | | | | | | | | | | | | | |
Investment advisory fees (Note B) | | | | | 5,757,215 | | | | | | 2,683,053 | | | | | | 2,175,798 | | | | | | 244,255 | | | | | | 1,107,208 | |
Distribution expense – Adviser Class (Note B) | | | | | 28,903 | | | | | | — | | | | | | — | | | | | | — | | | | | | — | |
Administrative fees | | | | | 567,204 | | | | | | 296,277 | | | | | | 249,909 | | | | | | 30,149 | | | | | | 180,513 | |
Accounting and transfer agent fees and expenses | | | | | 427,776 | | | | | | 652,142 | | | | | | 181,117 | | | | | | 59,451 | | | | | | 123,099 | |
Professional fees | | | | | 139,402 | | | | | | 68,011 | | | | | | 58,177 | | | | | | 10,258 | | | | | | 42,352 | |
Trustees’ fees | | | | | 131,392 | | | | | | 55,951 | | | | | | 47,057 | | | | | | 5,297 | | | | | | 32,234 | |
Custody fees and expenses | | | | | 93,953 | | | | | | 40,312 | | | | | | 32,792 | | | | | | 5,486 | | | | | | 24,064 | |
Federal and state registration | | | | | 81,451 | | | | | | 59,587 | | | | | | 55,305 | | | | | | 15,578 | | | | | | 29,970 | |
Reports to shareholders | | | | | 45,121 | | | | | | 110,736 | | | | | | 15,584 | | | | | | 1,980 | | | | | | 17,816 | |
Other | | | | | 208,886 | | | | | | 96,715 | | | | | | 82,391 | | | | | | 9,400 | | | | | | 56,914 | |
| | | | | | | | | | | | | | | | | | | | | | | | | | | | | | |
Total expenses | | | | | 7,481,303 | | | | | | 4,062,784 | | | | | | 2,898,130 | | | | | | 381,854 | | | | | | 1,614,170 | |
Less, expense waiver and/or
reimbursement (Note B) | | | | | — | | | | | | (485,380 | ) | | | | | (411,504 | ) | | | | | (81,232 | ) | | | | | (377,915 | ) |
| | | | | | | | | | | | | | | | | | | | | | | | | | | | | | |
Net expenses | | | | | 7,481,303 | | | | | | 3,577,404 | | | | | | 2,486,626 | | | | | | 300,622 | | | | | | 1,236,255 | |
| | | | | | | | | | | | | | | | | | | | | | | | | | | | | | |
Net investment income (loss) | | | | | 335,657 | | | | | | (1,777,088 | ) | | | | | 2,537,358 | | | | | | 354,924 | | | | | | 5,200,499 | |
| | | | | | | | | | | | | | | | | | | | | | | | | | | | | | |
| | | | | | | | | | |
Realized and Unrealized Gain (Loss) on Investments: | | | | | | | | | | | | | | | | | | | | | | | | | | | | | | |
Net realized gain on investments | | | | | 68,905,500 | | | | | | 21,067,361 | | | | | | 5,946,987 | | | | | | 1,005,163 | | | | | | 529,547 | |
Net change in unrealized
appreciation/depreciation on investments | | | | | (101,306,129 | ) | | | | | (22,958,355 | ) | | | | | (18,969,032 | ) | | | | | (956,345 | ) | | | | | (6,384,631 | ) |
| | | | | | | | | | | | | | | | | | | | | | | | | | | | | | |
| | | | | | | | | | |
Net realized and unrealized
gain (loss) on investments | | | | | (32,400,629 | ) | | | | | (1,890,994 | ) | | | | | (13,022,045 | ) | | | | | 48,818 | | | | | | (5,855,084 | ) |
| | | | | | | | | | | | | | | | | | | | | | | | | | | | | | |
| | | | | | | | | | |
Net Increase (Decrease) in Net Assets Resulting
from Operations | | | | $ | (32,064,972 | ) | | | | $ | (3,668,082 | ) | | | | $ | (10,484,687 | ) | | | | $ | 403,742 | | | | | $ | (654,585 | ) |
| | | | | | | | | | | | | | | | | | | | | | | | | | | | | | |
| | | | | | | | | | |
* Net of foreign taxes withheld | | | | $ | 28,633 | | | | | $ | — | | | | | $ | — | | | | | $ | — | | | | | $ | — | |
| | | | | | | | | | | | | | | | | | | | | | | | | | | | | | |
The accompanying notes are an integral part of these financial statements.
29
|
| STATEMENTSOF CHANGESIN NET ASSETS |
| | | | | | | | | | | | | | | | | | | | | | | | |
| | | | | LKCM
Small Cap
Equity Fund | | | | | LKCM
Small-Mid Cap
Equity Fund | |
| | | | | | | | | | | | | | | | | | | | | | | | |
| | | | | Year Ended
December 31,
2015 | | | | | Year Ended
December 31,
2014 | | | | | Year Ended
December 31,
2015 | | | | | Year Ended
December 31,
2014 | |
Operations: | | | | | | | | | | | | | | | | | | | | | | | | |
Net investment income (loss) | | | | $ | 335,657 | | | | | $ | (2,268,621 | ) | | | | $ | (1,777,088 | ) | | | | $ | (2,328,956 | ) |
Net realized gain on investments | | | | | 68,905,500 | | | | | | 116,963,656 | | | | | | 21,067,361 | | | | | | 21,926,334 | |
Net change in unrealized
appreciation/depreciation on investments | | | | | (101,306,129 | ) | | | | | (152,665,777 | ) | | | | | (22,958,355 | ) | | | | | (35,932,810 | ) |
| | | | | | | | | | | | | | | | | | | | | | | | |
Net decrease in net assets resulting from operations | | | | | (32,064,972 | ) | | | | | (37,970,742 | ) | | | | | (3,668,082 | ) | | | | | (16,335,432 | ) |
| | | | | | | | | | | | | | | | | | | | | | | | |
| | | | | | | | |
Dividends and Distributions to
Institutional Class Shareholders: | | | | | | | | | | | | | | | | | | | | | | | | |
Net investment income | | | | | (272,438 | ) | | | | | — | | | | | | — | | | | | | — | |
Net realized gain on investments | | | | | (74,954,483 | ) | | | | | (111,270,982 | ) | | | | | (22,188,977 | ) | | | | | (9,716,281 | ) |
| | | | | | | | | | | | | | | | | | | | | | | | |
| | | | | (75,226,921 | ) | | | | | (111,270,982 | ) | | | | | (22,188,977 | ) | | | | | (9,716,281 | ) |
| | | | | | | | | | | | | | | | | | | | | | | | |
| | | | | | | | |
Dividends and Distributions
to Adviser Class Shareholders: | | | | | | | | | | | | | | | | | | | | | | | | |
Net investment income | | | | | — | | | | | | — | | | | | | — | | | | | | — | |
Net realized gain on investments | | | | | (1,148,479 | ) | | | | | (1,943,645 | ) | | | | | — | | | | | | — | |
| | | | | | | | | | | | | | | | | | | | | | | | |
| | | | | (1,148,479 | ) | | | | | (1,943,645 | ) | | | | | — | | | | | | — | |
| | | | | | | | | | | | | | | | | | | | | | | | |
| | | | | | | | |
Net increase (decrease) in net assets resulting from
Fund share transactions (Note C) | | | | | (169,836,141 | ) | | | | | (82,278,249 | ) | | | | | (33,856,876 | ) | | | | | 51,296,819 | |
| | | | | | | | | | | | | | | | | | | | | | | | |
| | | | | | | | |
Total increase (decrease) in net assets | | | | | (278,276,513 | ) | | | | | (233,463,618 | ) | | | | | (59,713,935 | ) | | | | | 25,245,106 | |
| | | | | | | | |
Net Assets: | | | | | | | | | | | | | | | | | | | | | | | | |
Beginning of period | | | | | 855,295,932 | | | | | | 1,088,759,550 | | | | | | 391,667,801 | | | | | | 366,422,695 | |
| | | | | | | | | | | | | | | | | | | | | | | | |
End of period* | | | | $ | 577,019,419 | | | | | $ | 855,295,932 | | | | | $ | 331,953,866 | | | | | $ | 391,667,801 | |
| | | | | | | | | | | | | | | | | | | | | | | | |
| | | | | | | | |
* Including accumulated net investment income of | | | | $ | 63,219 | | | | | $ | — | | | | | $ | — | | | | | $ | — | |
| | | | | | | | | | | | | | | | | | | | | | | | |
The accompanying notes are an integral part of these financial statements.
30
|
| STATEMENTSOF CHANGESIN NET ASSETS |
| | | | | | | | | | | | | | | | | | | | | | | | |
| | | | | LKCM
Equity Fund | | | | | LKCM
Balanced Fund | |
| | | | | | | | | | | | | | | | | | | | | | | | |
| | | | | Year Ended
December 31,
2015 | | | | | Year Ended
December 31,
2014 | | | | | Year Ended
December 31,
2015 | | | | | Year Ended
December 31,
2014 | |
Operations: | | | | | | | | | | | | | | | | | | | | | | | | |
Net investment income | | | | $ | 2,537,358 | | | | | $ | 2,335,783 | | | | | $ | 354,924 | | | | | $ | 440,532 | |
Net realized gain on investments | | | | | 5,946,987 | | | | | | 13,262,162 | | | | | | 1,005,163 | | | | | | 921,573 | |
Net change in unrealized
appreciation/depreciation on investments | | | | | (18,969,032 | ) | | | | | 5,085,860 | | | | | | (956,345 | ) | | | | | 777,601 | |
| | | | | | | | | | | | | | | | | | | | | | | | |
Net increase (decrease) in net assets resulting from operations | | | | | (10,484,687 | ) | | | | | 20,683,805 | | | | | | 403,742 | | | | | | 2,139,706 | |
| | | | | | | | | | | | | | | | | | | | | | | | |
| | | | | | | | |
Dividends and Distributions to Shareholders: | | | | | | | | | | | | | | | | | | | | | | | | |
Net investment income | | | | | (2,560,056 | ) | | | | | (2,313,547 | ) | | | | | (355,959 | ) | | | | | (439,413 | ) |
Net realized gain on investments | | | | | (5,283,852 | ) | | | | | (12,862,260 | ) | | | | | (957,923 | ) | | | | | (835,323 | ) |
| | | | | | | | | | | | | | | | | | | | | | | | |
| | | | | (7,843,908 | ) | | | | | (15,175,807 | ) | | | | | (1,313,882 | ) | | | | | (1,274,736 | ) |
| | | | | | | | | | | | | | | | | | | | | | | | |
| | | | | | | | |
Net increase (decrease) in net assets resulting from
Fund share transactions (Note C) | | | | | (34,163,801 | ) | | | | | 4,252,493 | | | | | | 3,035,605 | | | | | | 830,413 | |
| | | | | | | | | | | | | | | | | | | | | | | | |
| | | | | | | | |
Total increase (decrease) in net assets | | | | | (52,492,396 | ) | | | | | 9,760,491 | | | | | | 2,125,465 | | | | | | 1,695,383 | |
| | | | | | | | |
Net Assets: | | | | | | | | | | | | | | | | | | | | | | | | |
Beginning of period | | | | | 333,692,119 | | | | | | 323,931,628 | | | | | | 37,027,667 | | | | | | 35,332,284 | |
| | | | | | | | | | | | | | | | | | | | | | | | |
End of period* | | | | $ | 281,199,723 | | | | | $ | 333,692,119 | | | | | $ | 39,153,132 | | | | | $ | 37,027,667 | |
| | | | | | | | | | | | | | | | | | | | | | | | |
| | | | | | | | |
* Including accumulated net investment income of | | | | $ | — | | | | | $ | 22,236 | | | | | $ | 84 | | | | | $ | 1,119 | |
| | | | | | | | | | | | | | | | | | | | | | | | |
The accompanying notes are an integral part of these financial statements.
31
|
| STATEMENTSOF CHANGESIN NET ASSETS |
| | | | | | | | | | | | |
| | | | | LKCM
Fixed Income Fund | |
| | | | | | | | | | | | |
| | | | | Year Ended
December 31,
2015 | | | | | Year Ended
December 31,
2014 | |
Operations: | | | | | | | | | | | | |
Net investment income | | | | $ | 5,200,499 | | | | | $ | 4,364,854 | |
Net realized gain on investments | | | | | 529,547 | | | | | | 1,423,528 | |
Net change in unrealized
appreciation/depreciation on investments | | | | | (6,384,631 | ) | | | | | (2,042,637 | ) |
| | | | | | | | | | | | |
Net increase (decrease) in net assets resulting from operations | | | | | (654,585 | ) | | | | | 3,745,745 | |
| | | | | | | | | | | | |
| | | | |
Dividends and Distributions to Shareholders: | | | | | | | | | | | | |
Net investment income | | | | | (5,211,497 | ) | | | | | (4,405,305 | ) |
Return of capital | | | | | — | | | | | | (17,185 | ) |
Net realized gain on investments | | | | | (607,274 | ) | | | | | (1,154,873 | ) |
| | | | | | | | | | | | |
| | | | | (5,818,771 | ) | | | | | (5,577,363 | ) |
| | | | | | | | | | | | |
| | | | |
Net increase (decrease) in net assets resulting from
Fund share transactions (Note C) | | | | | (17,390,017 | ) | | | | | 3,431,422 | |
| | | | | | | | | | | | |
| | | | |
Total increase (decrease) in net assets | | | | | (23,863,373 | ) | | | | | 1,599,804 | |
| | | | |
Net Assets: | | | | | | | | | | | | |
Beginning of period | | | | | 222,704,236 | | | | | | 221,104,432 | |
| | | | | | | | | | | | |
End of period* | | | | $ | 198,840,863 | | | | | $ | 222,704,236 | |
| | | | | | | | | | | | |
The accompanying notes are an integral part of these financial statements.
32
|
| FINANCIAL HIGHLIGHTS |
| SELECTED DATAFOR EACH SHAREOF CAPITAL STOCK OUTSTANDING |
| | | | | | | | | | | | | | | | | | | | | | | | | | | | | | |
| | | | | LKCM Small Cap Equity Fund – Institutional Class | |
| | | | | | | | | | | | | | | | | | | | | | | | | | | | | | |
| | | | | Year
Ended
December 31,
2015 | | | | | Year
Ended
December 31,
2014 | | | | | Year
Ended
December 31,
2013 | | | | | Year
Ended
December 31,
2012 | | | | | Year
Ended
December 31,
2011 | |
Net Asset Value – Beginning of Period | | | | $ | 24.05 | | | | | $ | 28.33 | | | | | $ | 22.69 | | | | | $ | 22.45 | | | | | $ | 21.49 | |
| | | | | | | | | | | | | | | | | | | | | | | | | | | | | | |
Net investment income (loss) | | | | | 0.01 | | | | | | (0.06 | )(1) | | | | | (0.06 | )(2) | | | | | 0.13 | (1) | | | | | (0.08 | )(1) |
Net realized and unrealized gain (loss) on investments | | | | | (1.29 | ) | | | | | (0.77 | ) | | | | | 8.02 | | | | | | 2.01 | | | | | | 1.04 | |
| | | | | | | | | | | | | | | | | | | | | | | | | | | | | | |
Total from investment operations | | | | | (1.28 | ) | | | | | (0.83 | ) | | | | | 7.96 | | | | | | 2.14 | | | | | | 0.96 | |
| | | | | | | | | | | | | | | | | | | | | | | | | | | | | | |
Dividends from net investment income | | | | | (0.01 | ) | | | | | — | | | | | | — | | | | | | (0.13 | ) | | | | | — | |
Distributions from net realized gains | | | | | (2.90 | ) | | | | | (3.45 | ) | | | | | (2.32 | ) | | | | | (1.77 | ) | | | | | — | |
| | | | | | | | | | | | | | | | | | | | | | | | | | | | | | |
Total dividends and distributions | | | | | (2.91 | ) | | | | | (3.45 | ) | | | | | (2.32 | ) | | | | | (1.90 | ) | | | | | — | |
| | | | | | | | | | | | | | | | | | | | | | | | | | | | | | |
Net Asset Value – End of Period | | | | $ | 19.86 | | | | | $ | 24.05 | | | | | $ | 28.33 | | | | | $ | 22.69 | | | | | $ | 22.45 | |
| | | | | | | | | | | | | | | | | | | | | | | | | | | | | | |
Total Return | | | | | -5.58% | | | | | | -3.11% | | | | | | 35.11% | | | | | | 9.74% | | | | | | 4.47% | |
| | | | | | | | | | |
Ratios and Supplemental Data: | | | | | | | | | | | | | | | | | | | | | | | | | | | | | | |
Net assets, end of period (thousands) | | | | $ | 568,421 | | | | | $ | 840,631 | | | | | $ | 1,047,607 | | | | | $ | 819,985 | | | | | $ | 785,280 | |
Ratio of expenses to average net assets: | | | | | 0.97% | | | | | | 0.94% | | | | | | 0.95% | | | | | | 0.94% | | | | | | 0.95% | |
Ratio of net investment income (loss) to average net assets: | | | | | 0.05% | | | | | | (0.21)% | | | | | | (0.23)% | | | | | | 0.53% | | | | | | (0.33)% | |
Portfolio turnover rate(3) | | | | | 62% | | | | | | 60% | | | | | | 47% | | | | | | 49% | | | | | | 50% | |
| (1) | Net investment income (loss) per share represents net investment income (loss) divided by the average shares outstanding throughout the period. |
| (2) | Net investment loss per share is calculated using the ending balance of undistributed net investment loss prior to considerations of adjustments for permanent book and tax differences. |
| (3) | Portfolio turnover is calculated on the basis of the Fund as a whole without distinguishing between the classes of shares issued. |
| | | | | | | | | | | | | | | | | | | | | | | | | | | | | | |
| | | | | LKCM Small Cap Equity Fund – Adviser Class | |
| | | | | | | | | | | | | | | | | | | | | | | | | | | | | | |
| | | | | Year
Ended
December 31,
2015 | | | | | Year
Ended
December 31,
2014 | | | | | Year
Ended
December 31,
2013 | | | | | Year
Ended
December 31,
2012 | | | | | Year
Ended
December 31,
2011 | |
Net Asset Value – Beginning of Period | | | | $ | 23.11 | | | | | $ | 27.43 | | | | | $ | 22.07 | | | | | $ | 21.88 | | | | | $ | 21.00 | |
| | | | | | | | | | | | | | | | | | | | | | | | | | | | | | |
Net investment income (loss) | | | | | (0.05 | ) | | | | | (0.12 | )(1) | | | | | (0.13 | )(2) | | | | | 0.07 | (1) | | | | | (0.13 | )(1) |
Net realized and unrealized gain (loss) on investments | | | | | (1.23 | ) | | | | | (0.75 | ) | | | | | 7.81 | | | | | | 1.95 | | | | | | 1.01 | |
| | | | | | | | | | | | | | | | | | | | | | | | | | | | | | |
Total from investment operations | | | | | (1.28 | ) | | | | | (0.87 | ) | | | | | 7.68 | | | | | | 2.02 | | | | | | 0.88 | |
| | | | | | | | | | | | | | | | | | | | | | | | | | | | | | |
Dividends from net investment income | | | | | — | | | | | | — | | | | | | — | | | | | | (0.06 | ) | | | | | — | |
Distributions from net realized gains | | | | | (2.90 | ) | | | | | (3.45 | ) | | | | | (2.32 | ) | | | | | (1.77 | ) | | | | | — | |
| | | | | | | | | | | | | | | | | | | | | | | | | | | | | | |
Total dividends and distributions | | | | | (2.90 | ) | | | | | (3.45 | ) | | | | | (2.32 | ) | | | | | (1.83 | ) | | | | | — | |
| | | | | | | | | | | | | | | | | | | | | | | | | | | | | | |
Net Asset Value – End of Period | | | | $ | 18.93 | | | | | $ | 23.11 | | | | | $ | 27.43 | | | | | $ | 22.07 | | | | | $ | 21.88 | |
| | | | | | | | | | | | | | | | | | | | | | | | | | | | | | |
Total Return | | | | | -5.81% | | | | | | -3.35% | | | | | | 34.81% | | | | | | 9.45% | | | | | | 4.19% | |
| | | | | | | | | | |
Ratios and Supplemental Data: | | | | | | | | | | | | | | | | | | | | | | | | | | | | | | |
Net assets, end of period (thousands) | | | | $ | 8,598 | | | | | $ | 14,665 | | | | | $ | 41,153 | | | | | $ | 40,737 | | | | | $ | 43,124 | |
Ratio of expenses to average net assets: | | | | | 1.22% | | | | | | 1.19% | | | | | | 1.20% | | | | | | 1.19% | | | | | | 1.20% | |
Ratio of net investment income (loss) to average net assets: | | | | | (0.20)% | | | | | | (0.46)% | | | | | | (0.48)% | | | | | | 0.28% | | | | | | (0.58)% | |
Portfolio turnover rate(3) | | | | | 62% | | | | | | 60% | | | | | | 47% | | | | | | 49% | | | | | | 50% | |
| (1) | Net investment income (loss) per share represents net investment income (loss) divided by the average shares outstanding throughout the period. |
| (2) | Net investment loss per share is calculated using the ending balance of undistributed net investment loss prior to considerations of adjustments for permanent book and tax differences. |
| (3) | Portfolio turnover is calculated on the basis of the Fund as a whole without distinguishing between the classes of shares issued. |
The accompanying notes are an integral part of these financial statements.
33
|
| FINANCIAL HIGHLIGHTS |
| SELECTED DATAFOR EACH SHAREOF CAPITAL STOCK OUTSTANDING |
| | | | | | | | | | | | | | | | | | | | | | | | | | | | | | |
| | | | | LKCM Small-Mid Cap Equity Fund | |
| | | | | | | | | | | | | | | | | | | | | | | | | | | | | | |
| | | | | Year
Ended
December 31,
2015 | | | | | Year
Ended
December 31,
2014 | | | | | Year
Ended
December 31,
2013 | | | | | Year
Ended
December 31,
2012 | | | | | May 2, 2011(1)
through
December 31,
2011 | |
Net Asset Value – Beginning of Period | | | | $ | 12.10 | | | | | $ | 12.97 | | | | | $ | 9.68 | | | | | $ | 8.86 | | | | | $ | 10.00 | |
| | | | | | | | | | | | | | | | | | | | | | | | | | | | | | |
Net investment loss | | | | | (0.06 | )(2) | | | | | (0.08 | )(3) | | | | | (0.06 | )(2) | | | | | (0.03 | )(3) | | | | | (0.02 | )(3) |
Net realized and unrealized gain (loss) on investments | | | | | (0.10 | ) | | | | | (0.48 | ) | | | | | 3.35 | | | | | | 0.85 | | | | | | (1.12 | ) |
| | | | | | | | | | | | | | | | | | | | | | | | | | | | | | |
Total from investment operations | | | | | (0.16 | ) | | | | | (0.56 | ) | | | | | 3.29 | | | | | | 0.82 | | | | | | (1.14 | ) |
| | | | | | | | | | | | | | | | | | | | | | | | | | | | | | |
Distributions from net realized gains | | | | | (0.79 | ) | | | | | (0.31 | ) | | | | | — | | | | | | — | | | | | | �� | |
| | | | | | | | | | | | | | | | | | | | | | | | | | | | | | |
Net Asset Value – End of Period | | | | $ | 11.15 | | | | | $ | 12.10 | | | | | $ | 12.97 | | | | | $ | 9.68 | | | | | $ | 8.86 | |
| | | | | | | | | | | | | | | | | | | | | | | | | | | | | | |
Total Return | | | | | -1.41% | | | | | | -4.39% | | | | | | 33.99% | | | | | | 9.26% | | | | | | -11.40% | (4) |
| | | | | | | | | | |
Ratios and Supplemental Data: | | | | | | | | | | | | | | | | | | | | | | | | | | | | | | |
Net assets, end of period (thousands) | | | | $ | 331,954 | | | | | $ | 391,668 | | | | | $ | 366,423 | | | | | $ | 250,164 | | | | | $ | 23,755 | |
Ratio of expenses to average net assets: | | | | | | | | | | | | | | | | | | | | | | | | | | | | | | |
Before expense waiver and/or reimbursement | | | | | 1.14% | | | | | | 1.20% | | | | | | 1.18% | | | | | | 1.18% | | | | | | 2.14% | (5) |
After expense waiver and/or reimbursement | | | | | 1.00% | | | | | | 1.00% | | | | | | 1.00% | | | | | | 1.00% | | | | | | 1.00% | (5) |
Ratio of net investment loss to average net assets: | | | | | | | | | | | | | | | | | | | | | | | | | | | | | | |
Before expense waiver and/or reimbursement | | | | | (0.63)% | | | | | | (0.82)% | | | | | | (0.77)% | | | | | | (0.50)% | | | | | | (1.55)% | (5) |
After expense waiver and/or reimbursement | | | | | (0.49)% | | | | | | (0.62)% | | | | | | (0.59)% | | | | | | (0.32)% | | | | | | (0.41)% | (5) |
Portfolio turnover rate | | | | | 70% | | | | | | 72% | | | | | | 49% | | | | | | 56% | | | | | | 36% | |
| (1) | Commencement of operations. |
| (2) | Net investment loss per share is calculated using the ending balance of undistributed net investment loss prior to considerations of adjustments for permanent book and tax differences. |
| (3) | Net investment loss per share represents net investment loss divided by the average shares outstanding throughout the period. |
| | | | | | | | | | | | | | | | | | | | | | | | | | | | | | |
| | | | | LKCM Equity Fund | |
| | | | | | | | | | | | | | | | | | | | | | | | | | | | | | |
| | | | | Year
Ended
December 31,
2015 | | | | | Year
Ended
December 31,
2014 | | | | | Year
Ended
December 31,
2013(1) | | | | | Year
Ended
December 31,
2012 | | | | | Year
Ended
December 31,
2011 | |
Net Asset Value – Beginning of Period | | | | $ | 22.81 | | | | | $ | 22.44 | | | | | $ | 17.62 | | | | | $ | 15.34 | | | | | $ | 15.18 | |
| | | | | | | | | | | | | | | | | | | | | | | | | | | | | | |
Net investment income | | | | | 0.18 | (2) | | | | | 0.17 | (3) | | | | | 0.14 | (2) | | | | | 0.14 | (2) | | | | | 0.11 | (2) |
Net realized and unrealized gain (loss) on investments | | | | | (0.98 | ) | | | | | 1.28 | | | | | | 5.27 | | | | | | 2.27 | | | | | | 0.39 | |
| | | | | | | | | | | | | | | | | | | | | | | | | | | | | | |
Total from investment operations | | | | | (0.80 | ) | | | | | 1.45 | | | | | | 5.41 | | | | | | 2.41 | | | | | | 0.50 | |
| | | | | | | | | | | | | | | | | | | | | | | | | | | | | | |
Dividends from net investment income | | | | | (0.20 | ) | | | | | (0.16 | ) | | | | | (0.12 | ) | | | | | (0.12 | ) | | | | | (0.10 | ) |
Distributions from net realized gains | | | | | (0.41 | ) | | | | | (0.92 | ) | | | | | (0.47 | ) | | | | | (0.01 | ) | | | | | (0.24 | ) |
| | | | | | | | | | | | | | | | | | | | | | | | | | | | | | |
Total dividends and distributions | | | | | (0.61 | ) | | | | | (1.08 | ) | | | | | (0.59 | ) | | | | | (0.13 | ) | | | | | (0.34 | ) |
| | | | | | | | | | | | | | | | | | | | | | | | | | | | | | |
Net Asset Value – End of Period | | | | $ | 21.40 | | | | | $ | 22.81 | | | | | $ | 22.44 | | | | | $ | 17.62 | | | | | $ | 15.34 | |
| | | | | | | | | | | | | | | | | | | | | | | | | | | | | | |
Total Return | | | | | -3.54% | | | | | | 6.40% | | | | | | 30.74% | | | | | | 15.69% | | | | | | 3.30% | |
| | | | | | | | | | |
Ratios and Supplemental Data: | | | | | | | | | | | | | | | | | | | | | | | | | | | | | | |
Net assets, end of period (thousands) | | | | $ | 281,200 | | | | | $ | 333,692 | | | | | $ | 323,932 | | | | | $ | 161,129 | | | | | $ | 102,548 | |
Ratio of expenses to average net assets: | | | | | | | | | | | | | | | | | | | | | | | | | | | | | | |
Before expense waiver and/or reimbursement | | | | | 0.93% | | | | | | 0.92% | | | | | | 0.93% | | | | | | 0.96% | | | | | | 0.99% | |
After expense waiver and/or reimbursement | | | | | 0.80% | | | | | | 0.80% | | | | | | 0.80% | | | | | | 0.80% | | | | | | 0.80% | |
Ratio of net investment income to average net assets: | | | | | | | | | | | | | | | | | | | | | | | | | | | | | | |
Before expense waiver and/or reimbursement | | | | | 0.68% | | | | | | 0.59% | | | | | | 0.53% | | | | | | 0.69% | | | | | | 0.54% | |
After expense waiver and/or reimbursement | | | | | 0.81% | | | | | | 0.71% | | | | | | 0.66% | | | | | | 0.85% | | | | | | 0.73% | |
Portfolio turnover rate | | | | | 13% | | | | | | 14% | | | | | | 17% | | | | | | 12% | | | | | | 20% | |
| (1) | On May 10, 2013, the Armstrong Fund was reorganized into the LKCM Equity Fund. Activity after May 10, 2013 reflects the Funds’ combined operations. |
| (2) | Net investment income per share represents net investment income divided by the average shares outstanding throughout the period. |
| (3) | Net investment income per share is calculated using the ending balance of undistributed net investment income prior to considerations of adjustments for permanent book and tax differences. |
The accompanying notes are an integral part of these financial statements.
34
|
| FINANCIAL HIGHLIGHTS |
| SELECTED DATAFOR EACH SHAREOF CAPITAL STOCK OUTSTANDING |
| | | | | | | | | | | | | | | | | | | | | | | | | | | | | | |
| | | | | LKCM Balanced Fund | |
| | | | | | | | | | | | | | | | | | | | | | | | | | | | | | |
| | | | | Year
Ended
December 31,
2015 | | | | | Year
Ended
December 31,
2014 | | | | | Year
Ended
December 31,
2013 | | | | | Year
Ended
December 31,
2012 | | | | | Year
Ended
December 31,
2011 | |
Net Asset Value – Beginning of Period | | | | $ | 20.10 | | | | | $ | 19.63 | | | | | $ | 16.11 | | | | | $ | 14.53 | | | | | $ | 14.25 | |
| | | | | | | | | | | | | | | | | | | | | | | | | | | | | | |
Net investment income | | | | | 0.19 | | | | | | 0.24 | | | | | | 0.17 | | | | | | 0.19 | | | | | | 0.17 | |
Net realized and unrealized gain (loss) on investments | | | | | (0.00 | )(1) | | | | | 0.94 | | | | | | 3.55 | | | | | | 1.58 | | | | | | 0.28 | |
| | | | | | | | | | | | | | | | | | | | | | | | | | | | | | |
Total from investment operations | | | | | 0.19 | | | | | | 1.18 | | | | | | 3.72 | | | | | | 1.77 | | | | | | 0.45 | |
| | | | | | | | | | | | | | | | | | | | | | | | | | | | | | |
Dividends from net investment income | | | | | (0.19 | ) | | | | | (0.24 | ) | | | | | (0.17 | ) | | | | | (0.19 | ) | | | | | (0.17 | ) |
Distributions from net realized gains | | | | | (0.50 | ) | | | | | (0.47 | ) | | | | | (0.03 | ) | | | | | — | | | | | | — | |
| | | | | | | | | | | | | | | | | | | | | | | | | | | | | | |
Total dividends and distributions | | | | | (0.69 | ) | | | | | (0.71 | ) | | | | | (0.20 | ) | | | | | (0.19 | ) | | | | | (0.17 | ) |
| | | | | | | | | | | | | | | | | | | | | | | | | | | | | | |
Net Asset Value – End of Period | | | | $ | 19.60 | | | | | $ | 20.10 | | | | | $ | 19.63 | | | | | $ | 16.11 | | | | | $ | 14.53 | |
| | | | | | | | | | | | | | | | | | | | | | | | | | | | | | |
Total Return | | | | | 0.91% | | | | | | 5.99% | | | | | | 23.18% | | | | | | 12.20% | | | | | | 3.16% | |
| | | | | | | | | | |
Ratios and Supplemental Data: | | | | | | | | | | | | | | | | | | | | | | | | | | | | | | |
Net assets, end of period (thousands) | | | | $ | 39,153 | | | | | $ | 37,028 | | | | | $ | 35,332 | | | | | $ | 21,800 | | | | | $ | 18,560 | |
Ratio of expenses to average net assets: | | | | | | | | | | | | | | | | | | | | | | | | | | | | | | |
Before expense waiver and/or reimbursement | | | | | 1.02% | | | | | | 0.99% | | | | | | 1.04% | | | | | | 1.10% | | | | | | 1.14% | |
After expense waiver and/or reimbursement | | | | | 0.80% | | | | | | 0.80% | | | | | | 0.80% | | | | | | 0.80% | | | | | | 0.80% | |
Ratio of net investment income to average net assets: | | | | | | | | | | | | | | | | | | | | | | | | | | | | | | |
Before expense waiver and/or reimbursement | | | | | 0.73% | | | | | | 1.02% | | | | | | 0.72% | | | | | | 0.91% | | | | | | 0.83% | |
After expense waiver and/or reimbursement | | | | | 0.95% | | | | | | 1.21% | | | | | | 0.96% | | | | | | 1.21% | | | | | | 1.17% | |
Portfolio turnover rate | | | | | 16% | | | | | | 20% | | | | | | 10% | | | | | | 15% | | | | | | 34% | |
| (1) | Amount is less than $0.005. |
| | | | | | | | | | | | | | | | | | | | | | | | | | | | | | |
| | | | | LKCM Fixed Income Fund | |
| | | | | | | | | | | | | | | | | | | | | | | | | | | | | | |
| | | | | Year
Ended
December 31,
2015 | | | | | Year
Ended
December 31,
2014 | | | | | Year
Ended
December 31,
2013 | | | | | Year
Ended
December 31,
2012 | | | | | Year
Ended
December 31,
2011 | |
Net Asset Value – Beginning of Period | | | | $ | 10.82 | | | | | $ | 10.91 | | | | | $ | 11.23 | | | | | $ | 11.04 | | | | | $ | 11.03 | |
| | | | | | | | | | | | | | | | | | | | | | | | | | | | | | |
Net investment income | | | | | 0.25 | (2) | | | | | 0.22 | | | | | | 0.27 | | | | | | 0.34 | | | | | | 0.37 | |
Net realized and unrealized gain (loss) on investments | | | | | (0.28 | ) | | | | | (0.03 | ) | | | | | (0.26 | ) | | | | | 0.25 | | | | | | 0.09 | |
| | | | | | | | | | | | | | | | | | | | | | | | | | | | | | |
Total from investment operations | | | | | (0.03 | ) | | | | | 0.19 | | | | | | 0.01 | | | | | | 0.59 | | | | | | 0.46 | |
| | | | | | | | | | | | | | | | | | | | | | | | | | | | | | |
Dividends from net investment income | | | | | (0.26 | ) | | | | | (0.22 | ) | | | | | (0.27 | ) | | | | | (0.34 | ) | | | | | (0.37 | ) |
Distributions from net realized gains | | | | | (0.03 | ) | | | | | (0.06 | ) | | | | | (0.06 | ) | | | | | (0.06 | ) | | | | | (0.08 | ) |
| | | | | | | | | | | | | | | | | | | | | | | | | | | | | | |
Total dividends and distributions | | | | | (0.29 | ) | | | | | (0.28 | ) | | | | | (0.33 | ) | | | | | (0.40 | ) | | | | | (0.45 | ) |
| | | | | | | | | | | | | | | | | | | | | | | | | | | | | | |
Net Asset Value – End of Period | | | | $ | 10.50 | | | | | $ | 10.82 | | | | | $ | 10.91 | | | | | $ | 11.23 | | | | | $ | 11.04 | |
| | | | | | | | | | | | | | | | | | | | | | | | | | | | | | |
Total Return | | | | | -0.27% | | | | | | 1.72% | | | | | | 0.07% | | | | | | 5.44% | | | | | | 4.22% | |
| | | | | | | | | | |
Ratios and Supplemental Data: | | | | | | | | | | | | | | | | | | | | | | | | | | | | | | |
Net assets, end of period (thousands) | | | | $ | 198,841 | | | | | $ | 222,704 | | | | | $ | 221,104 | | | | | $ | 205,880 | | | | | $ | 178,116 | |
Ratio of expenses to average net assets: | | | | | | | | | | | | | | | | | | | | | | | | | | | | | | |
Before expense waiver and/or reimbursement | | | | | 0.73% | (1) | | | | | 0.70% | | | | | | 0.72% | | | | | | 0.71% | | | | | | 0.72% | |
After expense waiver and/or reimbursement | | | | | 0.56% | (1) | | | | | 0.65% | | | | | | 0.65% | | | | | | 0.65% | | | | | | 0.65% | |
Ratio of net investment income to average net assets: | | | | | | | | | | | | | | | | | | | | | | | | | | | | | | |
Before expense waiver and/or reimbursement | | | | | 2.18% | (1) | | | | | 1.92% | | | | | | 2.34% | | | | | | 2.98% | | | | | | 3.31% | |
After expense waiver and/or reimbursement | | | | | 2.35% | (1) | | | | | 1.97% | | | | | | 2.41% | | | | | | 3.04% | | | | | | 3.38% | |
Portfolio turnover rate | | | | | 29% | | | | | | 46% | | | | | | 30% | | | | | | 31% | | | | | | 24% | |
| (1) | Effective May 22, 2015, the Adviser contractually agreed to lower the expense cap for the Fund from 0.65% to 0.50% of the Fund’s average daily net assets (Note B). |
| (2) | Net investment income per share represents net investment income divided by the average shares outstanding during the period. |
The accompanying notes are an integral part of these financial statements.
35
|
| LKCM FUNDS |
| NOTESTOTHE FINANCIAL STATEMENTS |
A. Organization and Significant Accounting Policies: LKCM Funds (the “Trust”) is registered under the Investment Company Act of 1940 (“1940 Act”) as an open-end, management investment company. The Trust was organized as a Delaware statutory trust on February 10, 1994 and consists of eight diversified series, five of which are presented herein and include the LKCM Small Cap Equity Fund, LKCM Small-Mid Cap Equity Fund, LKCM Equity Fund, LKCM Balanced Fund and LKCM Fixed Income Fund (collectively, the “Funds”), the assets of which are invested in separate, independently managed portfolios. Investment operations of the Funds began on July 14, 1994 (LKCM Small Cap Equity Fund), January 3, 1996 (LKCM Equity Fund), December 30, 1997 (LKCM Balanced Fund and LKCM Fixed Income Fund), and May 2, 2011 (LKCM Small-Mid Cap Equity Fund—Institutional and Adviser Class Shares). The Small Cap Equity Fund and the Equity Fund created a second class of shares, Adviser Class Shares, and renamed the initial class as Institutional Class Shares on May 1, 2003. The Small Cap Equity Adviser Class Shares were initially sold on June 5, 2003 and are subject to expenses pursuant to the Rule 12b-1 plan described in Note B. The Equity Fund and Small-Mid Cap Equity Fund Adviser Class Shares have not yet commenced operations. Each Fund charges a 1% redemption fee for redemptions on Fund shares held for less than 30 days, unless otherwise determined by a Fund in its discretion.
The LKCM Small Cap Equity Fund seeks to maximize long-term capital appreciation by investing under normal circumstances at least 80% of its net assets in equity securities of smaller companies (those with market capitalizations at the time of investment between $600 million and $4.5 billion) which Luther King Capital Management Corporation (the “Adviser”) believes are likely to have above-average growth in revenue and/or earnings and potential for above-average capital appreciation. The LKCM Small-Mid Cap Equity Fund seeks to maximize long-term capital appreciation by investing under normal circumstances at least 80% of its net assets in equity securities of small-mid capitalization companies (those with market capitalizations at the time of investment between $1.25 billion and $10 billion) which the Adviser believes are likely to have above-average growth in revenue and/or earnings and potential for above average capital appreciation. The LKCM Equity Fund seeks to maximize long-term capital appreciation by investing under normal circumstances at least 80% of its net assets in equity securities of companies which the Adviser believes are likely to have above-average growth in revenue and/or earnings, above-average returns on shareholders’ equity, and/or potential for above-average capital appreciation. The LKCM Balanced Fund seeks to provide investors with current income and long-term capital appreciation by investing primarily in a portfolio of equity and fixed income securities and cash equivalent securities with at least 25% of the Fund’s total assets invested in fixed income securities under normal circumstances. The LKCM Fixed Income Fund seeks current income by investing under normal circumstances at least 80% of its net assets in a portfolio of investment grade corporate and U.S. government fixed income securities.
The following is a summary of significant accounting policies followed by the Funds in preparation of the financial statements. The Funds are investment companies and, accordingly, follow the investment company accounting and reporting guidance of the Financial Accounting Standards Board Accounting Standards Codification Topic 946, Investment Companies.
1. Security Valuation: Equity securities listed or traded on a U.S. securities exchange for which market quotations are readily available are valued at the last quoted sale price on the exchange on which the security is primarily traded. Nasdaq Global Market securities are valued at the Nasdaq Official Closing Price (“NOCP”). Unlisted U.S. securities and listed U.S. securities not traded on a particular valuation date are valued at the mean of the most recent quoted bid and ask price on the relevant exchanges or markets. Equity securities listed on a foreign exchange for which market quotations are readily available are valued at the last quoted sales price on the exchange on which the security is primarily traded. Debt securities are normally valued at the mean of the closing bid and ask price and/or by using a combination of broker quotations or evaluated prices provided by an independent pricing service. Other assets and securities for which no market or broker quotations or evaluated prices are readily available (including restricted securities) are valued in good faith at fair value using guidelines approved by the Board of Trustees. The Board has adopted specific guidelines and procedures for valuing portfolio securities and delegated their implementation to the Adviser. The guidelines and procedures authorize the Adviser to make determinations regarding the fair value of a portfolio security and to report such determinations to the Board of Trustees. The Funds may use prices provided by independent pricing services to assist in the fair valuation of the Funds’ portfolio securities.
The Trust has adopted accounting standards which establish an authoritative definition of fair value and set out a hierarchy for measuring fair value. These standards require additional disclosures about the various inputs and valuation techniques used to develop the measurements of fair value and a discussion of changes in valuation techniques and related inputs during the period. These standards define fair value as the price that would be received to sell an asset or paid to transfer a liability in an orderly transaction between market participants at the measurement date. The fair value hierarchy is organized into three levels based upon the assumptions (referred to as “inputs”) used in pricing the asset or liability. These standards state that “observable inputs” reflect the assumptions market participants would use in pricing the asset or liability based on market data obtained from independent sources and “unobservable inputs” reflect an entity’s own assumptions about the assumptions market participants would use in pricing the asset or liability. These inputs are summarized in the three broad levels listed below.
36
| | | | |
| Level 1 | | – | | Quoted unadjusted prices for identical instruments in active markets to which the Trust has access at the date of measurement. |
| Level 2 | | – | | Quoted prices for similar instruments in active markets; quoted prices for identical or similar instruments in markets that are not active; and model-derived valuations in which all significant inputs and significant value drivers are observable in active markets. Level 2 inputs are those in markets for which there are few transactions, the prices are not current, little public information exists or instances where prices vary substantially over time or among brokered market makers. |
| Level 3 | | – | | Model derived valuations in which one or more significant inputs or significant value drivers are unobservable. Unobservable inputs are those inputs that reflect the Trust’s own assumptions that market participants would use to price the asset or liability based on the best available information. |
The inputs or methodology used for valuing securities are not necessarily an indication of the risk associated with investing in those securities. As of December 31, 2015, the Funds’ assets carried at fair value were classified as follows:
| | | | | | | | | | | | | | | | |
| LKCM Small Cap Equity Fund | | | | | | | | | | | | |
Description | | Level 1 | | | Level 2 | | | Level 3 | | | Total | |
Common Stocks | | $ | 576,333,703 | | | $ | — | | | $ | — | | | $ | 576,333,703 | |
Money Market Fund | | | 1,836,907 | | | | — | | | | — | | | | 1,836,907 | |
| | | | | | | | | | | | | | | | |
Total Investments* | | $ | 578,170,610 | | | $ | — | | | $ | — | | | $ | 578,170,610 | |
| | | | | | | | | | | | | | | | |
| | | | |
| LKCM Small-Mid Cap Equity Fund | | | | | | | | | | | | |
Description | | Level 1 | | | Level 2 | | | Level 3 | | | Total | |
Common Stocks | | $ | 309,316,893 | | | $ | — | | | $ | — | | | $ | 309,316,893 | |
Money Market Funds | | | 22,804,266 | | | | — | | | | — | | | | 22,804,266 | |
| | | | | | | | | | | | | | | | |
Total Investments* | | $ | 332,121,159 | | | $ | — | | | $ | — | | | $ | 332,121,159 | |
| | | | | | | | | | | | | | | | |
| | | | |
| LKCM Equity Fund | | | | | | | | | | | | |
Description | | Level 1 | | | Level 2 | | | Level 3 | | | Total | |
Common Stocks | | $ | 280,911,583 | | | $ | — | | | $ | — | | | $ | 280,911,583 | |
Money Market Fund | | | 322,887 | | | | — | | | | — | | | | 322,887 | |
| | | | | | | | | | | | | | | | |
Total Investments* | | $ | 281,234,470 | | | $ | — | | | $ | — | | | $ | 281,234,470 | |
| | | | | | | | | | | | | | | | |
| | | | |
| LKCM Balanced Fund | | | | | | | | | | | | |
Description | | Level 1 | | | Level 2 | | | Level 3 | | | Total | |
Common Stocks | | $ | 27,154,634 | | | $ | — | | | $ | — | | | $ | 27,154,634 | |
Corporate Bonds | | | — | | | | 10,727,097 | | | | — | | | | 10,727,097 | |
Money Market Fund | | | 909,995 | | | | — | | | | — | | | | 909,995 | |
| | | | | | | | | | | | | | | | |
Total Investments* | | $ | 28,064,629 | | | $ | 10,727,097 | | | $ | — | | | $ | 38,791,726 | |
| | | | | | | | | | | | | | | | |
| | | | |
| LKCM Fixed Income Fund | | | | | | | | | | | | |
Description | | Level 1 | | | Level 2 | | | Level 3 | | | Total | |
Preferred Stock | | $ | 1,883,250 | | | $ | — | | | $ | — | | | $ | 1,883,250 | |
Corporate Bonds | | | — | | | | 150,728,288 | | | | — | | | | 150,728,288 | |
U.S. Government Issues | | | — | | | | 16,525,855 | | | | — | | | | 16,525,855 | |
U.S. Government Sponsored Entities | | | — | | | | 23,471,549 | | | | — | | | | 23,471,549 | |
Money Market Fund | | | 4,521,549 | | | | — | | | | — | | | | 4,521,549 | |
| | | | | | | | | | | | | | | | |
Total Investments* | | $ | 6,404,799 | | | $ | 190,725,692 | | | $ | — | | | $ | 197,130,491 | |
| | | | | | | | | | | | | | | | |
| | * | Additional information regarding the industry classifications of these investments is disclosed in the Schedule of Investments. |
There were no transfers into or out of Level 1, Level 2 or Level 3 fair value measurements during the reporting period. Transfers between levels are recognized at the end of the reporting period.
2. Federal Income Taxes: The Funds have elected to be treated as “regulated investment companies” under Subchapter M of the Internal Revenue Code and each Fund intends to distribute all of its investment company net taxable income and net capital gains to shareholders. Therefore, no federal income tax provision is recorded.
3. Distributions to Shareholders: The LKCM Small Cap Equity, LKCM Small-Mid Cap Equity and LKCM Equity Funds generally intend to pay dividends and net capital gain distributions, if any, at least on an annual basis. The LKCM Balanced and LKCM Fixed Income Funds generally intend to pay dividends on a quarterly basis and net capital gain distributions, if any, at least on an annual basis.
37
4. Foreign Securities: Investing in securities of foreign companies and foreign governments involves special risks and considerations not typically associated with investing in U.S. companies and securities of the U.S. government. These risks include devaluation of currencies and future adverse political and economic developments. Moreover, securities of many foreign companies and foreign governments and their markets may be less liquid and their prices more volatile than those of securities of comparable U.S. companies and securities of the U.S. government.
5. Expense Allocation: Expenses incurred by the Funds are allocated among the Funds based upon (i) relative average net assets, (ii) a specific identification basis as incurred, or (iii) evenly among the Funds, depending on the nature of the expense. Expenses that are directly attributable to a class of shares, such as Rule 12b-1 distribution fees, are charged to that class. For multi-class Funds, income, unrealized and realized gains/losses are generally allocated between the Fund’s classes in proportion to their respective net assets.
6. Use of Estimates: The preparation of financial statements in conformity with accounting principles generally accepted in the United States of America requires management to make estimates and assumptions that affect the reported amounts of assets and liabilities and disclosure of contingent assets and liabilities at the date of the financial statements and the reported amounts of revenues and expenses during the reporting period. Actual results could differ from those estimates.
7. Guarantees and Indemnifications: In the normal course of business, the Funds enter into contracts with service providers that contain general indemnification clauses. The Funds’ maximum exposure under these arrangements is unknown as this would involve future claims against the Funds that have not yet occurred. Based on experience, the Funds expect the risk of loss to be remote.
8. Security Transactions and Investment Income: Security and shareholder transactions are recorded on the trade date. Realized gains and losses on sales of investments are calculated on the identified cost basis. Dividend income and dividends and distributions to shareholders are recorded on the ex-dividend date. Withholding taxes on foreign dividends have been provided for in accordance with the Funds’ understanding of the applicable country’s tax rules and rates. Interest income is recognized on the accrual basis. All discounts and premiums are amortized based on the effective interest method for tax and financial reporting purposes. The Funds may hold the securities of real estate investment trusts (“REITs”). Distributions from such investments may include income, capital gains and return of capital.
9. Other: Generally accepted accounting principles require that certain components of net assets be adjusted to reflect permanent differences between financial and tax reporting. These reclassifications have no effect on net assets or net asset values per share.
Accordingly, at December 31, 2015, reclassifications were recorded as follows:
| | | | | | | | | | | | | | | | | | | | |
| | | LKCM
Small Cap
Equity Fund | | | LKCM
Small-Mid Cap
Equity Fund | | | LKCM
Equity
Fund | | | LKCM
Balanced
Fund | | | LKCM
Fixed
Income Fund | |
Accumulated net
investment income | | | $— | | | | $1,777,088 | | | | $462 | | | | $— | | | | $10,998 | |
Accumulated loss | | | (24,189,894 | ) | | | (6,945,182 | ) | | | (768,527 | ) | | | (97,057 | ) | | | (72,330 | ) |
Capital stock | | | 24,189,894 | | | | 5,168,094 | | | | 768,065 | | | | 97,057 | | | | 61,332 | |
10. Restricted and Illiquid Securities: The Funds are permitted to invest in securities that are subject to legal or contractual restrictions on resale or are illiquid. Restricted securities generally may be resold in transactions exempt from registration. A security may be considered illiquid if it lacks a readily available market or if its valuation has not changed for a certain period of time. Disposal of these securities may involve time-consuming negotiations and expense, and prompt sale at the current valuation may be difficult.
B. Investment Advisory and Other Agreements: Luther King Capital Management Corporation (the “Adviser”) serves as the investment adviser to the Funds under an Investment Advisory Agreement (the “Agreement”). The Adviser receives a fee, computed daily and payable quarterly, at the annual rates presented below as applied to each Fund’s average daily net assets. The Adviser has contractually agreed to waive all or a portion of its management fee and/or reimburse expenses of the Funds through April 30, 2016 in order to limit each Fund’s operating expenses to the annual cap rates presented below, other than the LKCM Fixed Income Fund, for which the Adviser has contractually agreed to waive such management fees and/or reimburse expenses of the Fund to maintain such designated expense ratio through May 31, 2016. This expense limitation excludes interest, taxes, brokerage commissions, indirect fees and expenses relating to investments in other investment companies, including money market funds, and extraordinary expenses. For the year ended December 31, 2015, the Adviser waived the following management fees to meet its expense cap obligations:
| | | | | | | | | | | | | | | | | | | | |
| | | LKCM
Small Cap
Equity Fund | | | LKCM
Small-Mid Cap
Equity Fund | | | LKCM
Equity
Fund | | | LKCM
Balanced
Fund | | | LKCM
Fixed
Income Fund | |
Annual Management Fee Rate | | | 0.75% | | | | 0.75% | | | | 0.70% | | | | 0.65% | | | | 0.50% | |
Annual Cap on Expenses | | | 1.00% | (Inst.) | | | 1.00% | | | | 0.80% | | | | 0.80% | | | | 0.50% | * |
| | | 1.25% | (Adviser) | | | | | | | | | | | | | | | | |
Fees Waived in 2015 | | | — | | | | $485,380 | | | | $411,504 | | | | $81,232 | | | | $377,915 | |
| * | Effective May 22, 2015, the Adviser contractually agreed to lower the expense cap for the Fund from 0.65% to 0.50% of the Fund’s average daily net assets. |
38
U.S. Bancorp Fund Services, LLC serves as transfer agent and administrator for the Trust and serves as accounting services agent for the Trust. U.S. Bank, N.A. serves as custodian for the Funds.
Distribution services are performed pursuant to a distribution contract with Quasar Distributors, LLC, the Trust’s principal underwriter.
The Small Cap Equity Fund, Small-Mid Cap Equity and the Equity Fund have adopted a Rule 12b-1 plan under which the Adviser Class of each Fund may pay up to 1.00% of its average daily net assets for distribution and other services. However, the Board of Trustees has currently only authorized a fee of 0.25% of each Fund’s average daily net assets. For the year ended December 31, 2015, fees incurred by the Small Cap Equity Fund pursuant to the 12b-1 Plan were $28,903. The Adviser Class shares of the Equity Fund and the Small-Mid Cap Equity Fund have not yet commenced operations. The Funds have also adopted an Institutional Class Distribution Plan, under which each Fund may pay up to 0.75% of its average daily net assets for distribution and other services. Currently, the Board of Trustees has not authorized payments under this plan and, as a result, the Funds currently neither accrue nor pay any fees under the plan.
C. Fund Shares: At December 31, 2015, there was an unlimited number of shares of beneficial interest, no par value, authorized. The following table summarizes the activity in shares of each Fund:
| | | | | | | | | | | | | | | | |
| LKCM Small Cap Equity Fund | |
| | | Year Ended
December 31, 2015 | | | Year Ended
December 31, 2014 | |
| | Institutional Class | | | Institutional Class | |
| | | Shares | | | Amount | | | Shares | | | Amount | |
Shares sold | | | 2,997,132 | | | $ | 72,867,416 | | | | 5,090,394 | | | $ | 137,885,561 | |
Shares issued to shareholders in reinvestment of distributions | | | 3,306,174 | | | | 67,148,391 | | | | 3,894,617 | | | | 95,145,501 | |
Shares redeemed | | | (12,636,846 | ) | | | (305,284,952 | ) | | | (11,007,819 | ) | | | (292,497,239 | ) |
Redemption fee | | | | | | | 6,506 | | | | | | | | 1,665 | |
| | | | | | | | | | | | | | | | |
Net decrease | | | (6,333,540 | ) | | $ | (165,262,639 | ) | | | (2,022,808 | ) | | $ | (59,464,512 | ) |
| | | | | | | | | | | | | | | | |
Shares Outstanding: | | | | | | | | | | | | | | | | |
Beginning of period | | | 34,957,741 | | | | | | | | 36,980,549 | | | | | |
| | | | | | | | | | | | | | | | |
End of period | | | 28,624,201 | | | | | | | | 34,957,741 | | | | | |
| | | | | | | | | | | | | | | | |
| | |
| | | Year Ended
December 31, 2015 | | | Year Ended
December 31, 2014 | |
| | | Adviser Class | | | Adviser Class | |
| | | Shares | | | Amount | | | Shares | | | Amount | |
Shares sold | | | 37,553 | | | $ | 879,930 | | | | 90,701 | | | $ | 2,387,553 | |
Shares issued to shareholders in reinvestment of distributions | | | 58,116 | | | | 1,125,135 | | | | 82,216 | | | | 1,929,605 | |
Shares redeemed | | | (276,218 | ) | | | (6,578,572 | ) | | | (1,038,683 | ) | | | (27,132,211 | ) |
Redemption fee | | | | | | | 5 | | | | | | | | 1,316 | |
| | | | | | | | | | | | | | | | |
Net decrease | | | (180,549 | ) | | $ | (4,573,502 | ) | | | (865,766 | ) | | $ | (22,813,737 | ) |
| | | | | | | | | | | | | | | | |
Shares Outstanding: | | | | | | | | | | | | | | | | |
Beginning of period | | | 634,711 | | | | | | | | 1,500,477 | | | | | |
| | | | | | | | | | | | | | | | |
End of period | | | 454,162 | | | | | | | | 634,711 | | | | | |
| | | | | | | | | | | | | | | | |
Total Net Decrease | | | | | | $ | (169,836,141 | ) | | | | | | $ | (82,278,249 | ) |
| | | | | | | | | | | | | | | | |
| | | | |
| LKCM Small-Mid Cap Equity Fund | | | | | | | | | | | | |
| | |
| | | Year Ended
December 31, 2015 | | | Year Ended
December 31, 2014 | |
| | | Shares | | | Amount | | | Shares | | | Amount | |
Shares sold | | | 6,196,826 | | | $ | 77,641,362 | | | | 9,234,059 | | | $ | 115,420,906 | |
Shares issued to shareholders in reinvestment of distributions | | | 1,880,563 | | | | 21,343,975 | | | | 746,263 | | | | 9,164,107 | |
Shares redeemed | | | (10,664,162 | ) | | | (132,842,460 | ) | | | (5,856,919 | ) | | | (73,288,257 | ) |
Redemption fee | | | | | | | 247 | | | | | | | | 63 | |
| | | | | | | | | | | | | | | | |
Net increase (decrease) | | | (2,586,773 | ) | | $ | (33,856,876 | ) | | | 4,123,403 | | | $ | 51,296,819 | |
| | | | | | | | | | | | | | | | |
Shares Outstanding: | | | | | | | | | | | | | | | | |
Beginning of period | | | 32,366,547 | | | | | | | | 28,243,144 | | | | | |
| | | | | | | | | | | | | | | | |
End of period | | | 29,779,774 | | | | | | | | 32,366,547 | | | | | |
| | | | | | | | | | | | | | | | |
39
| | | | | | | | | | | | | | | | |
| LKCM Equity Fund | |
| | | Year Ended
December 31, 2015 | | | Year Ended
December 31, 2014 | |
| | Shares | | | Amount | | | Shares | | | Amount | |
Shares sold | | | 1,221,990 | | | $ | 27,628,704 | | | | 3,761,309 | | | $ | 85,328,023 | |
Shares issued to shareholders in reinvestment of distributions | | | 344,143 | | | | 7,485,106 | | | | 610,212 | | | | 14,126,415 | |
Shares redeemed | | | (3,055,836 | ) | | | (69,278,705 | ) | | | (4,176,956 | ) | | | (95,202,980 | ) |
Redemption fee | | | | | | | 1,094 | | | | | | | | 1,035 | |
| | | | | | | | | | | | | | | | |
Net increase (decrease) | | | (1,489,703 | ) | | $ | (34,163,801 | ) | | | 194,565 | | | $ | 4,252,493 | |
| | | | | | | | | | | | | | | | |
Shares Outstanding: | | | | | | | | | | | | | | | | |
Beginning of period | | | 14,630,258 | | | | | | | | 14,435,693 | | | | | |
| | | | | | | | | | | | | | | | |
End of period | | | 13,140,555 | | | | | | | | 14,630,258 | | | | | |
| | | | | | | | | | | | | | | | |
| | | | |
| LKCM Balanced Fund | | | | | | | | | | | | |
| | |
| | | Year Ended
December 31, 2015 | | | Year Ended
December 31, 2014 | |
| | | Shares | | | Amount | | | Shares | | | Amount | |
Shares sold | | | 412,913 | | | $ | 8,327,748 | | | | 305,782 | | | $ | 6,086,579 | |
Shares issued to shareholders in reinvestment of distributions | | | 64,253 | | | | 1,273,898 | | | | 60,084 | | | | 1,218,695 | |
Shares redeemed | | | (321,117 | ) | | | (6,567,767 | ) | | | (324,088 | ) | | | (6,475,021 | ) |
Redemption fee | | | | | | | 1,726 | | | | | | | | 160 | |
| | | | | | | | | | | | | | | | |
Net increase | | | 156,049 | | | $ | 3,035,605 | | | | 41,778 | | | $ | 830,413 | |
| | | | | | | | | | | | | | | | |
Shares Outstanding: | | | | | | | | | | | | | | | | |
Beginning of period | | | 1,842,011 | | | | | | | | 1,800,233 | | | | | |
| | | | | | | | | | | | | | | | |
End of period | | | 1,998,060 | | | | | | | | 1,842,011 | | | | | |
| | | | | | | | | | | | | | | | |
| | | | |
| LKCM Fixed Income Fund | | | | | | | | | | | | |
| | |
| | | Year Ended
December 31, 2015 | | | Year Ended
December 31, 2014 | |
| | | Shares | | | Amount | | | Shares | | | Amount | |
Shares sold | | | 1,816,505 | | | $ | 19,700,563 | | | | 3,038,338 | | | $ | 33,371,642 | |
Shares issued to shareholders in reinvestment of distributions | | | 494,647 | | | | 5,274,361 | | | | 468,864 | | | | 5,108,498 | |
Shares redeemed | | | (3,952,618 | ) | | | (42,364,956 | ) | | | (3,194,984 | ) | | | (35,048,778 | ) |
Redemption fee | | | | | | | 15 | | | | | | | | 60 | |
| | | | | | | | | | | | | | | | |
Net increase (decrease) | | | (1,641,466 | ) | | $ | (17,390,017 | ) | | | 312,218 | | | $ | 3,431,422 | |
| | | | | | | | | | | | | | | | |
Shares Outstanding: | | | | | | | | | | | | | | | | |
Beginning of period | | | 20,574,085 | | | | | | | | 20,261,867 | | | | | |
| | | | | | | | | | | | | | | | |
End of period | | | 18,932,619 | | | | | | | | 20,574,085 | | | | | |
| | | | | | | | | | | | | | | | |
D. Security Transactions: Purchases and sales of investment securities, other than short-term investments, for the year ended December 31, 2015 were as follows:
| | | | | | | | | | | | | | | | |
| | | Purchases | | | Sales | |
| | | U.S.
Government | | | Other | | | U.S.
Government | | | Other | |
LKCM Small Cap Equity Fund | | $ | — | | | $ | 459,469,119 | | | $ | — | | | $ | 719,682,441 | |
LKCM Small-Mid Cap Equity Fund | | | — | | | | 236,379,808 | | | | — | | | | 289,023,894 | |
LKCM Equity Fund | | | — | | | | 39,090,179 | | | | — | | | | 73,816,683 | |
LKCM Balanced Fund | | | — | | | | 7,228,462 | | | | — | | | | 5,753,449 | |
LKCM Fixed Income Fund | | | 28,412,627 | | | | 37,403,686 | | | | 22,250,000 | | | | 62,100,811 | |
40
E. Tax Information: At December 31, 2015, the components of accumulated earnings (losses) on a tax basis were as follows:
As of December 31, 2015, the components of accumulated earnings (losses) for income tax purposes were as follows:
| | | | | | | | | | | | | | | | | | | | |
| | | LKCM
Small Cap
Equity | | | LKCM
Small-Mid Cap
Equity | | | LKCM
Equity | | | LKCM
Balanced | | | LKCM
Fixed Income | |
Cost of Investments | | $ | 467,296,190 | | | $ | 282,628,031 | | | $ | 195,729,719 | | | $ | 28,429,725 | | | $ | 199,640,121 | |
| | | | | | | | | | | | | | | | | | | | |
Gross Unrealized Appreciation | | $ | 124,355,050 | | | $ | 57,370,140 | | | $ | 94,010,393 | | | $ | 10,874,339 | | | $ | 2,040,408 | |
Gross Unrealized Depreciation | | | (13,480,630 | ) | | | (7,877,012 | ) | | | (8,505,642 | ) | | | (512,338 | ) | | | (4,550,038 | ) |
| | | | | | | | | | | | | | | | | | | | |
Net Unrealized Appreciation | | $ | 110,874,420 | | | $ | 49,493,128 | | | $ | 85,504,751 | | | $ | 10,362,001 | | | $ | (2,509,630 | ) |
| | | | | | | | | | | | | | | | | | | | |
Undistributed Ordinary Income | | $ | 63,219 | | | $ | — | | | $ | — | | | $ | 84 | | | $ | — | |
Undistributed Long-Term Capital Gain | | | — | | | | — | | | | — | | | | 3,214 | | | | — | |
| | | | | | | | | | | | | | | | | | | | |
Total Distributable Earnings | | $ | 63,219 | | | $ | — | | | $ | — | | | $ | 3,298 | | | $ | — | |
| | | | | | | | | | | | | | | | | | | | |
Other Accumulated Losses | | $ | — | | | $ | (1,145,602 | ) | | $ | (99,733 | ) | | $ | — | | | $ | (152,580 | ) |
| | | | | | | | | | | | | | | | | | | | |
Total Accumulated Gains (Losses) | | $ | 110,937,639 | | | $ | 48,347,526 | | | $ | 85,405,018 | | | $ | 10,365,299 | | | $ | (2,662,210 | ) |
| | | | | | | | | | | | | | | | | | | | |
The difference between book-basis and tax-basis unrealized appreciation is attributable primarily to the tax deferral of losses on wash sales.
At December 31, 2015, the LKCM Small-Mid Cap Equity Fund, the LKCM Equity Fund and the LKCM Fixed Income Fund deferred, on a tax basis, post-October capital losses of $1,145,602, $99,733 and $152,580, respectively.
The tax components of dividends paid during the periods shown below were as follows:
| | | | | | | | | | | | | | | | | | | | |
| | | Year Ended December 31, 2015 | | | Year Ended December 31, 2014 | |
| | | Ordinary
Income | | | Long-Term
Capital Gains | | | Ordinary
Income | | | Return
of
Capital | | | Long-Term
Capital Gains | |
LKCM Small Cap Equity Fund | | $ | 272,438 | | | $ | 76,102,962 | | | $ | — | | | $ | — | | | $ | 113,214,627 | |
LKCM Small-Mid Cap Equity Fund | | | — | | | | 22,188,977 | | | | — | | | | — | | | | 9,716,281 | |
LKCM Equity Fund | | | 2,565,253 | | | | 5,278,655 | | | | 2,482,075 | | | | — | | | | 12,693,732 | |
LKCM Balanced Fund | | | 355,959 | | | | 957,923 | | | | 439,413 | | | | — | | | | 835,323 | |
LKCM Fixed Income Fund | | | 5,204,601 | | | | 614,170 | | | | 4,492,614 | | | | 17,185 | | | | 1,067,564 | |
The Funds designated as long-term capital gain dividend, pursuant to Internal Revenue Code Section 852(b)(3), the amount necessary to reduce earnings and profits of the Funds related to net capital gain to zero for the tax years ended December 31, 2015 and 2014. The Funds designated earnings and profits distributed to shareholders upon the redemption of shares during 2015 in determining undistributed net capital gains as of December 31, 2015.
The Trust has adopted financial reporting rules regarding recognition and measurement of tax positions taken or expected to be taken on a tax return. The Trust has reviewed all open tax years and major jurisdictions and concluded that there is no impact on the Funds’ financial position or results of operations. Tax years that remain open to examination by major tax jurisdictions include tax years ended December 31, 2012 through December 31, 2015. There is no tax liability resulting from unrecognized tax benefits relating to uncertain income tax positions taken or expected to be taken on tax returns as of December 31, 2015. The Funds are not aware of any tax positions for which it is reasonably possible that the total amounts of unrecognized tax benefits will significantly change in the next twelve months. If applicable, the Funds would recognize interest accrued related to unrecognized tax benefits in “interest expense” and penalties in “other expense” on the statement of operations.
F. Recent Accounting Pronouncement: In May 2015, the Financial Accounting Standards Board (“FASB”) issued Accounting Standards Update (“ASU”) No. 2015-07 “Disclosure for Investments in Certain Entities that Calculate Net Asset Value per Share (or Its Equivalent)”. The amendments in ASU No. 2015-07 remove the requirement to categorize within the fair value hierarchy investments measured using the NAV practical expedient. The ASU also removes certain disclosure requirements for investments that qualify, but do not utilize, the NAV practical expedient. The amendments in the ASU are effective for fiscal years beginning after December 15, 2015, and interim periods within those fiscal years. Management is currently evaluating the impact these changes will have on the Fund’s financial statements and related disclosures.
G. Subsequent Events: In preparing these financial statements, the Trust has evaluated events after December 31, 2015 and determined that there were no significant subsequent events that would require adjustment to or additional disclosure in these financial statements.
41
|
| REPORTOF INDEPENDENT REGISTERED PUBLIC ACCOUNTING FIRM |
To the Shareholders and Board of Trustees of LKCM Funds:
We have audited the accompanying statements of assets and liabilities, including the schedules of investments, of LKCM Funds (the “Funds”) comprising the LKCM Small Cap Equity Fund, LKCM Equity Fund, LKCM Balanced Fund, LKCM Fixed Income Fund, and LKCM Small-Mid Cap Equity Fund as of December 31, 2015, and the related statements of operations for the year then ended, the statements of changes in net assets for each of the two years in the period then ended, and the financial highlights for each of the five years in the period then ended. These financial statements and financial highlights are the responsibility of the Funds’ management. Our responsibility is to express an opinion on these financial statements and financial highlights based on our audits.
We conducted our audits in accordance with the standards of the Public Company Accounting Oversight Board (United States). Those standards require that we plan and perform the audit to obtain reasonable assurance about whether the financial statements and financial highlights are free of material misstatement. The Funds are not required to have, nor were we engaged to perform, an audit of their internal control over financial reporting. Our audits included consideration of internal control over financial reporting as a basis for designing audit procedures that are appropriate in the circumstances, but not for the purpose of expressing an opinion on the effectiveness of the Funds’ internal control over financial reporting. Accordingly, we express no such opinion. An audit also includes examining, on a test basis, evidence supporting the amounts and disclosures in the financial statements, assessing the accounting principles used and significant estimates made by management, as well as evaluating the overall financial statement presentation. Our procedures included confirmation of securities owned as of December 31, 2015, by correspondence with the custodian and brokers; when replies were not received from brokers, we performed other auditing procedures. We believe that our audits provide a reasonable basis for our opinion.
In our opinion, the financial statements and financial highlights referred to above present fairly, in all material respects, the financial position of each of the portfolios constituting the LKCM Funds as of December 31, 2015, and the results of their operations for the year then ended, the changes in their net assets for each of the two years in the period then ended, and the financial highlights for each of the five years in the period then ended, in conformity with accounting principles generally accepted in the United States of America.

Milwaukee, Wisconsin
February 19, 2016
42
|
| LKCM FUNDS |
| ADDITIONAL INFORMATION |
| December 31, 2015 |
Availability of Proxy Voting Information: A description of the policies and procedures that the Funds use to determine how to vote proxies relating to their portfolio securities, as well as information regarding how the Funds voted proxies relating to portfolio securities during the most recent 12-month period ended June 30, is available without charge, upon request, by calling toll-free 1-800-688-LKCM or on the SEC website at http://www.sec.gov.
The actual voting records relating to portfolio securities during the twelve month period ended June 30 (as filed with the SEC on Form N-PX) are available without charge, upon request, by calling the Funds toll free at 1-800-688-LKCM or by accessing the SEC’s website at www.sec.gov.
Availability of Quarterly Portfolio Schedule: The Funds’ are required to file complete schedules of portfolio holdings with the SEC for the first and third fiscal quarters on Form N-Q. Once filed, the Funds’ Form N-Q is available without charge upon request on the SEC’s website (http://www.sec.gov) and is also available by calling 1-800-688-LKCM. You can also review and copy the Funds’ Form N-Q by visiting the SEC’s Public Reference Room in Washington, DC (information on the operation of the Public Reference Room may be obtained by calling 1-800-SEC-0330).
43
Information about the Funds’ Trustees and Officers:
The business and affairs of the Funds are managed under the direction of the Funds’ Board of Trustees. Information pertaining to the Trustees of the Funds is set forth below. The Statement of Additional Information includes additional information about the Funds’ Trustees and officers and is available, without charge, upon request by calling 1-800-688-LKCM.
| | | | | | | | | | |
Name, Address
and Age | | Position(s)
Held with
the Trust | | Term of
Office &
Length of Time Served(1) | | Principal Occupation
During Past Five Years | | Number of
Portfolios in
Fund Complex
Overseen
by Trustee | | Other Directorships Held by Trustee |
| Disinterested Trustees: | | | | | | | | | | |
H. Kirk Downey 301 Commerce Street Suite 1600 Fort Worth, TX 76102 Year of Birth: 1942 | | Chairman of the Board of Trustees Trustee | | Since 2005 Since 1994 | | President and CEO, Texas Systems, LLC and CEO, Texas learning systems LLC since 1999 (education companies); Dean, M.J. Neeley School of Business, Texas Christian University Business School from 1987 to 1999. | | 8 | | AZZ Incorporated |
Earle A. Shields, Jr. 301 Commerce Street Suite 1600 Fort Worth, TX 76102 Year of Birth: 1920 | | Trustee | | Since 1994 | | Consultant; formerly Consultant for NASDAQ Corp. and Vice President, Merrill Lynch & Co., Inc. | | 8 | | None |
Richard J. Howell 301 Commerce Street Suite 1600 Fort Worth, TX 76102 Year of Birth: 1942 | | Trustee Chairman of the Audit and Compliance Committee | | Since 2005 Since 2008 | | CPA; Adjunct Faculty at SMU Cox School of Business from 2004 to 2009; Consulting Services, since 2002; Audit Partner, Arthur Andersen LLP from 1974 to 2002. | | 8 | | Red Robin Gourmet
Burgers, Inc. |
Larry J. Lockwood 301 Commerce Street Suite 1600 Fort Worth, TX 76102 Year of Birth: 1953 | | Trustee | | Since 2013 | | C.R. Williams Professor of Finance, Stan Block Endowed Chair in Finance, Department of Finance, Neeley School of Business, Texas Christian University since 1994. | | 8 | | None |
| Interested Trustees: | | | | | | | | | | |
J. Luther King, Jr.(2) 301 Commerce Street Suite 1600 Fort Worth, TX 76102 Year of Birth: 1940 | | Trustee, President and Chief Executive Officer | | Since 1994 | | Chairman, President and Director, Luther King Capital Management Corporation since 1979. | | 8 | | Tyler Technologies, Inc. |
Steve R. Purvis(2) 301 Commerce Street Suite 1600 Fort Worth, TX 76102 Year of Birth: 1964 | | Trustee Vice President | | Since 2013 Since 2000 | | Principal, Luther King Capital Management since 2004, Vice President and Portfolio Manager Luther King Capital Management since 1996. | | 8 | | AZZ Incorporated |
| (1) | Each Trustee holds office during the lifetime of the Trust until that individual resigns, retires or is otherwise removed or replaced. |
| (2) | Messrs. King and Purvis are each considered an “interested person” of the Trust (as defined in the 1940 Act) because of their affiliation with the Adviser. |
44
Information about the Funds’ Trustees and Officers, Continued
| | | | | | |
Name, Address
and Age | | Position(s) Held with the Trust | | Term of
Office &
Length of Time
Served(1) | | Principal Occupation
During Past Five Years |
| Officers: | | | | | | |
J. Luther King, Jr.(2) 301 Commerce Street Suite 1600 Fort Worth, TX 76102 Year of Birth: 1940 | | Trustee, President and Chief Executive Officer | | Since 1994 | | Chairman, President and Director, Luther King Capital Management Corporation since 1979. |
Steven R. Purvis(2) 301 Commerce Street Suite 1600 Fort Worth, TX 76102 Year of Birth: 1964 | | Trustee Vice President | | Since 2013 Since 2000 | | Principal, Luther King Capital Management since 2004, Vice President and Portfolio Manager, Luther King Capital Management since 1996. |
Paul W. Greenwell 301 Commerce Street Suite 1600 Fort Worth, TX 76102 Year of Birth: 1950 | | Vice President | | Since 1996 | | Principal, Luther King Capital Management since 1986, Vice President and Portfolio Manager, Luther King Capital Management since 1983. |
Richard Lenart 301 Commerce Street Suite 1600 Fort Worth, TX 76102 Year of Birth: 1966 | | Secretary and Treasurer | | Since 2006 | | Luther King Capital Management since 2005. |
Jacob D. Smith 301 Commerce Street Suite 1600 Fort Worth, TX 76102 Year of Birth: 1974 | | Chief Financial Officer Chief Compliance Officer | | Since 2010 Since 2006 | | Chief Financial Officer since 2010, General Counsel and Chief Compliance Officer, Luther King Capital Management since 2006. Principal, Luther King Capital Management since 2013. |
| (1) | Each Trustee holds office during the lifetime of the Trust until that individual resigns, retires or is otherwise removed or replaced. |
| (2) | Messrs. King and Purvis are each considered an “interested person” of the Trust (as defined in the 1940 Act) because of their affiliation with the Adviser. |
45
(This page intentionally left blank.)
LKCM FUNDS
PRIVACY NOTICE
Our Commitment to Your Privacy
At LKCM Funds, we are committed to safeguarding the confidentiality and privacy of nonpublic personal information about our current and former shareholders. This privacy notice describes the policies and procedures we have implemented to protect the privacy of your nonpublic personal information as well as the sources through which we may obtain nonpublic personal information about you.
How We Protect Your Nonpublic Personal Information
Protecting your nonpublic personal information is an important priority at LKCM Funds. Accordingly, we have implemented policies and procedures designed to safeguard your nonpublic personal information, such as your tax identification number, account and investment history, account numbers, account balances and nonpublic contact information, from unauthorized access. Pursuant to these policies and procedures, we maintain various physical, technological, and administrative safeguards to protect the security and confidentiality of your nonpublic personal information, and we adapt these safeguards to respond to evolving technological and other standards.
We do not disclose nonpublic personal information about you to outside firms, organizations or individuals except as authorized by you or your representatives or as required or permitted by law. We may disclose nonpublic personal information about you to nonaffiliated third parties, such as custodians, brokers, auditors, accountants, and systems and administrative service providers, in connection with the services we provide to you or on your behalf. When we provide nonpublic personal information about you to nonaffiliated third parties for these purposes, we expect them to safeguard your nonpublic personal information, use your nonpublic personal information only for the intended purposes and otherwise abide by applicable law.
How We Obtain Your Nonpublic Personal Information
We collect nonpublic personal information about you from various sources, including documents, new account applications and other information that you or your representatives, custodians, attorneys, accountants or similar parties provide to us, communications that we have with you or your representatives, custodians, attorneys, accountants or similar parties, and documents and other information related to your accounts or investment experience with us.
Please do not hesitate to contact Jacob D. Smith, our Chief Compliance Officer, if you have any questions regarding the measures we have implemented to protect the privacy of your nonpublic personal information.
U.S. Bancorp Fund Services, LLC
P.O. Box 701
Milwaukee, WI 53201-0701
LKCM FUNDS
P.O. Box 701
Milwaukee, WI 53201-0701
| | | | |
Officers and Trustees | | | | |
J. Luther King, Jr., CFA, CIC | | H. Kirk Downey | | Larry J. Lockwood |
Trustee, President | | Chairman of the Board | | Trustee |
| | |
Paul W. Greenwell | | Richard J. Howell | | Richard Lenart |
Vice President | | Trustee | | Secretary & Treasurer |
| | |
Steven R. Purvis, CFA | | Earle A. Shields, Jr. | | Jacob D. Smith |
Trustee, Vice President | | Trustee | | Chief Financial Officer |
| | | | | Chief Compliance Officer |
Investment Adviser | | | | |
Luther King Capital Management Corporation | | |
301 Commerce Street, Suite 1600 | | | | |
Fort Worth, TX 76102 | | | | |
Administrator, Transfer Agent, Dividend Paying Agent & Shareholder Servicing Agent | | |
U.S. Bancorp Fund Services, LLC | | | | |
P.O. Box 701 | | | | |
Milwaukee, WI 53201-0701 | | | | |
Custodian | | | | |
U.S. Bank, N.A. | | | | |
1555 N. River Center Drive, Suite 302 | | | | |
Milwaukee, WI 53212 | | | | |
Independent Registered Public Accounting Firm | | |
Deloitte & Touche LLP | | | | |
555 E. Wells St., Suite 1400 | | | | |
Milwaukee, WI 53202 | | | | |
Distributor | | | | |
Quasar Distributors, LLC | | | | |
615 E. Michigan Street | | | | |
Milwaukee, WI 53202 | | | | |

LKCM Aquinas Value Fund
LKCM Aquinas Growth Fund
LKCM Aquinas Small Cap Fund
Annual Report
December 31, 2015
Dear Fellow Shareholders:
We report the following performance information for the LKCM Aquinas Funds:
| | | | | | | | | | | | | | | | | | | | | | | | | | | | | | | | |
Funds | | Inception
Date | | | NAV @
12/31/15 | | | Net
Expense
Ratio*, ** | | | Gross
Expense
Ratio** | | | One Year
Total
Return
Ended
12/31/15 | | | Five Year
Average
Annualized
Return
Ended
12/31/15 | | | Ten Year
Average
Annualized
Return
Ended
12/31/15 | | | Avg.
Annual
Total
Return
Since
Incept.*** | |
LKCM Aquinas Value Fund | | | 7/11/05 | | | $ | 15.17 | | | | 1.50 | % | | | 1.50 | % | | | -3.28 | % | | | 8.36 | % | | | 6.27 | % | | | 6.23 | % |
Russell 1000 Value® Index(1) | | | | | | | | | | | | | | | | | | | -3.83 | % | | | 11.27 | % | | | 6.16 | % | | | 6.21 | % |
LKCM Aquinas Growth Fund | | | 7/11/05 | | | $ | 16.52 | | | | 1.50 | % | | | 1.60 | % | | | 2.19 | % | | | 8.03 | % | | | 5.32 | % | | | 5.32 | % |
Russell 1000 Growth® Index(2) | | | | | | | | | | | | | | | | | | | 5.67 | % | | | 13.53 | % | | | 8.53 | % | | | 8.62 | % |
LKCM Aquinas Small Cap Fund | | | 7/11/05 | | | $ | 6.11 | | | | 1.50 | % | | | 2.27 | % | | | -4.74 | % | | | 6.24 | % | | | 5.30 | % | | | 5.42 | % |
Russell 2000® Index(3) | | | | | | | | | | | | | | | | | | | -4.41 | % | | | 9.19 | % | | | 6.80 | % | | | 6.71 | % |
Performance data quoted represents past performance and does not guarantee future results. The investment return and principal value of an investment will fluctuate so that an investor’s shares, when redeemed, may be worth more or less than the original cost. Current performance of the Fund may be lower or higher than the performance quoted. Performance data current to the most recent month end may be obtained by calling 1-800-423-6369. The Funds impose a 1.00% redemption fee on shares held less than 30 days. If reflected, the fee would reduce performance shown.
| * | Luther King Capital Management Corporation, the Funds’ adviser, has contractually agreed to waive all or a portion of its management fee and/or reimburse expenses of the Fund to maintain designated expense ratios through April 30, 2016. This expense limitation excludes interest, taxes, brokerage commissions, indirect fees and expenses relating to investments in other investment companies, including money market funds, and extraordinary expenses. Investment performance reflects fee waivers, if any, in effect. In the absence of such waivers, total return would be reduced. Investment performance is based upon the net expense ratio. LKCM waived management fees and/or reimbursed expenses for each Fund, during the fiscal year ended December 31, 2015. |
| ** | Expense ratios above are as of December 31, 2014, the Funds’ prior fiscal year end, as reported in the Funds’ current prospectus. Expense ratios reported for other periods in the financial highlights of this report for the Funds’ fiscal year ended December 31, 2015 may differ due to the inclusion of acquired fund fees and expenses. |
| *** | On July 11, 2005, the Aquinas Funds merged into the LKCM Aquinas Funds. Due to the change in adviser and investment technique, performance is being quoted for the period after the merger. |
| (1) | The Russell 1000 Value® Index is an unmanaged index which measures the performance of those Russell 1000® companies with lower price-to-book ratios and lower forecasted growth values. |
| (2) | The Russell 1000 Growth® Index is an unmanaged index which measures the performance of those Russell 1000® companies with higher price-to-book ratios and higher forecasted growth values. |
| (3) | The Russell 2000® Index is an unmanaged index which measures the performance of the 2000 smallest companies in the Russell 3000® Index. |
Note: These indices defined above are not available for direct investment and the index performance therefore does not include expenses.
2015 Review
2015 proved to be an unkind year for nearly all asset classes. Commodities were especially weak due to the downturn in global manufacturing activity, most notably in China. The story of global oversupply of crude oil is well known at this point. Technological innovation in shale oil production domestically and the unwillingness of the Organization of Petroleum Exporting Countries, or OPEC, to curtail production, in conjunction with a rising U.S. dollar, contributed to an approximate 31% decline in the price of West Texas Intermediate crude oil in 2015. This price decline occurred on the back of an approximate 46% decline in West Texas Intermediate crude oil in 2014. Domestic intermediate-term investment grade bond returns were slightly positive during the year, while domestic high yield bonds and emerging market bonds posted negative returns for 2015.
We believe that there were two key divergences within the domestic equity market during the year. First, growth stocks outpaced value stocks, which typically is characteristic of the mature stage of an equity market cycle. We believe it is common to see the equity market leadership narrow during this phase, as it did in 2015. Second, large capitalization stocks outperformed small capitalization stocks, as reflected by the Standard & Poor’s 500 Index, or S&P 500® Index, outperformance of the Russell 2000® Index. Thus, we believe the U.S. equity market in 2015 can best be characterized as one in which a narrow group of larger capitalization companies performed best. For example, if the market-capitalization weighted S&P 500® Index was instead equal weighted, the S&P 500® Index would have declined approximately 4.1%, not including dividends, for 2015, versus the 1.38% return posted by the S&P 500® Index during 2015.
In December 2015 the Federal Reserve raised the federal funds target interest rate 0.25% for the first time since June 2006, bringing to a close a seven-year chapter of zero percent interest rates. When the Federal Reserve raises interest rates, it is typically an important marker in the business cycle. In our view, the first such interest rate hike is often seen as conviction by the Federal Reserve that an economic expansion is intensifying. We believe capital markets generally are sanguine about the first couple of interest rate increases by the Federal Reserve. Historically, the tenor typically changes once inflation readings become sufficiently strong that capital markets perceive the Federal Reserve may quicken its pace of restricting monetary policy. We believe this often results in slowing economic growth, inflationary declines, and a resetting of the business cycle. We believe we are in the early stages of monetary policy normalization, and market expectations are for interest rates to rise gradually. If the Federal Reserve were to raise interest rates at each
2
consecutive meeting in 2016, it would be a negative surprise to capital markets in our view. We believe such action would be concerning unless such steps were in response to significantly stronger economic data than current trend. Our forecast is for a very gradual rise in interest rates commensurate with very moderate inflation readings and modest real economic growth in 2016.
The Federal Reserve appears to be charting a new course this cycle. We believe the Federal Reserve most often raises interest rates in response to an uncomfortable pace of rising inflation. Inflation is generally a lagging economic indicator, meaning the Federal Reserve typically acts well after the economic growth is in full bloom. Given the lack of inflationary pressures we have seen to date, we believe the Federal Reserve is attempting to normalize monetary policy coincident with what it perceives could be increasing price pressures as domestic economic and labor economy slack appear to continue to decline.
2016 Outlook
At any given time, there are both structural and cyclical forces at work on the economy. Structural forces typically include trends in demographics, fiscal debt burdens, tax regimes, and pace of innovation. Cyclical forces generally are shorter-term in nature, such as changes in monetary or fiscal policy, inflation, and trade balances. We believe the sweet spot of economic growth occurs in periods when both structural and cyclical forces provide tailwinds; this occurred in Japan in the 1980s, the United States in the 1990s, and China in the 2000s. In our view, when structural and cyclical forces collide, cyclical forces often prevail for a period of time before structural forces again win the day. Structural forces weighed on the global economy in 2015. In our view, the repeated possibilities of a Greek exit from the European Union and the United Kingdom’s upcoming referendum on European Union membership are proxy battles for the structural challenges of a monetary union without a fiscal union. In China household consumption as a percentage of Gross Domestic Product (GDP) remains stagnant and well below the rate of developed economies and presents another structural headwind. Domestically, the United States is facing a continuous rise in the number of aging baby boomers and the corresponding strain that imposes on fiscal resources from entitlement programs. These are all examples of structural challenges that continue to weigh on key contributors to aggregate global GDP.
To ease these structural issues, governments have looked first to cyclical forces such as monetary policy. Unfortunately, we believe monetary policy has now achieved much of what it can in terms of bolstering economic growth and, globally, there appears to be scant room for interest rates to fall further. The remaining two forms of monetary transmission, supporting asset prices through quantitative easing and currency depreciation, are less effective in our view. There are inherent risks to both of these channels, including creating asset valuation bubbles and currency wars. Although structural challenges appear to impair potential economic growth rates around the globe, the growth path for the United States appears higher than for Japan or Europe where structural challenges seem greatest and economies appear less dynamic.
With cyclical tailwinds in the United States losing some of their intensity, we believe that domestic economic growth is again likely to remain muted in 2016, although stronger than in 2015. Consequently, we forecast corporate profit growth will resume in 2016 following a hiatus in 2015. Earnings within the Energy sector declined approximately 60% in 2015, which contributed to virtually no corporate earnings growth for the S&P 500® Index during 2015. Although we anticipate earnings in the Energy sector will decline again this year in aggregate, the sector now represents only approximately 3.8% of S&P 500® Index earnings, down from approximately 11.7% in the summer of 2014. We believe corporate profits, as measured by S&P 500® Index earnings, should grow 4-6% for 2016 with the negative impact of a strong U.S. dollar on firms’ income statements being less in 2016. Overall, we think corporate balance sheets remain healthy with near record levels of cash and reasonable debt burdens. Interest rates for lower quality balance sheets have risen recently, influenced in part by deterioration in the prospects for select energy companies. While we believe this phenomenon has been largely contained to the Energy sector, we remain vigilant with regard to rising credit spreads outside of the Energy sector, as credit spreads are often harbingers of future economic stress.
Although the equity market displayed characteristics of a mature equity market in 2015, our forecast is for the current bull market to remain in place. We note, however, that real GDP growth has been sub-par during this expansion, averaging just approximately 1.8% annually compared with approximately 4.2% for previous expansions since 1960. We think the longevity of this economic cycle and accompanying bull market in equities is consistent with a benign inflation outlook. The two shortest economic cycles since 1960 both began in the highly inflationary 1970s. If our forecast for modest inflation is accurate, then we believe it is reasonable to expect that this current economic cycle has multiple years remaining to grow. Unfortunately, history teaches that when economic growth is less robust, capital market volatility is typically higher. Finally, there always remains the possibility of significant exogenous events such as terrorist acts, an expanding Middle Eastern conflict, or escalating tensions on the Korean Peninsula or Crimea. These events are impossible to predict in scope or magnitude, but any of which could negatively impact our forecast.
In our view, the base case for 2016 is that investors must continue to adjust to a lower expected return environment, as slow growth and deflationary pressures are the result of structural forces rather than simply residue from the financial crisis. We are likely to witness the continued struggle between governments’ need to address long-run structural issues and mollifying current issues of the day such as preventing deflation and propping-up job growth. As we enter a Presidential election year, it is a reminder of our view that simulative fiscal policy has largely been absent in recent years and always possesses the promise to be a catalyst for growth in the future.
3
LKCM Aquinas Value Fund
The LKCM Aquinas Value Fund declined 3.28% for the year ended December 31, 2015, outpacing the Fund’s benchmark, the Russell 1000® Value Index, which declined 3.83% for the year. During the year the Fund’s performance benefited from strong stock selection, which was somewhat offset by sector allocation decisions for the Fund. The Fund’s overweight position in the Industrials sector benefitted the Fund’s relative performance, along with its underweight positions in the Energy and Utilities sectors. The Fund’s relative performance was negatively impacted by overweight positions in the Consumer Discretionary and Materials sectors and an underweight position in the Healthcare sector. The Fund’s underweight position in the Healthcare sector was primarily the result of the Fund’s Catholic values investing mandate, which limits the Fund’s ability to invest in a number of companies in this sector. Stock selection in the Information Technology, Industrials, and Consumer Staples sectors helped the Fund’s relative results during the year, which was offset somewhat by stock selection in the Consumer Discretionary sector.
Entering 2016, we believe the Fund is well positioned with a strong emphasis on companies that we believe have solid balance sheets and are reasonably valued relative to their earnings growth rates, which we believe can provide an opportunity to add value for the Fund and its shareholders in the upcoming year. We continue to emphasize holdings in which we believe that continued dividend increases or share buybacks during 2016 are probable.
LKCM Aquinas Small Cap Fund
The LKCM Aquinas Small Cap Fund declined 4.74% for the year ended December 31, 2015 against the 4.41% decline for the Fund’s benchmark, the Russell 2000® Index. Stock selection was solid in the Energy and Information Technology sectors relative to the benchmark, while the Fund experienced relative weakness in stock selection in the Healthcare sector. The Fund benefited from overweight positions in the Healthcare and Information Technology sectors relative to the benchmark, while the Fund’s overweight position in the Industrials sector detracted from relative performance. During the year, two of the Fund’s portfolio companies were acquired at significant premiums to the Fund’s cost basis in those companies. As a core manager that focuses on high quality companies that meet our stringent investment criteria, we continue to have the Fund tilted towards growth companies as we believe this area provides the most attractive investment opportunities for the Fund in the current market environment.
LKCM Aquinas Growth Fund
The LKCM Aquinas Growth Fund returned 2.19% for the year ended December 31, 2015 compared to the 5.67% return for the Fund’s benchmark, the Russell 1000® Growth Index. The Fund’s underweight position in the Materials sector benefited the Fund’s relative performance, but was offset by the Fund’s overweight position in the Energy sector. Stock selection in the Consumer Discretionary and Industrials sectors benefited the Fund’s relative performance, which was offset by weakness in stock selection in the Consumer Staples, Financials Healthcare and Information Technology sectors. We remain committed to our investment strategy and stock selection process for the Fund and believe we have the Fund well-positioned for the upcoming year.

J. Luther King, Jr., CFA, CIC
February 1, 2016
4
The information provided herein represents the opinion of J. Luther King, Jr., CFA, CIC and is not intended to be a forecast of future events, a guarantee of future results, nor investment advice.
Please refer to the Schedule of Investments found on pages 11-15 of the report for more information on Fund holdings. Fund holdings and sector allocations are subject to change and are not recommendations to buy or sell any securities.
Mutual fund investing involves risk. Principal loss is possible. Past performance is not a guarantee of future results. Small and medium capitalization funds typically carry additional risks, since smaller companies generally have a higher risk of failure, and, historically, their stocks have experienced a greater degree of market volatility than stocks on average. These risks are discussed in the Funds’ summary and statutory prospectuses. Since the Funds practice socially responsible investing within the framework provided by the United States Conference of Catholic Bishop’s Socially Responsible Investing Guidelines, the Funds may forego a profitable investment opportunity or sell a security when it may be disadvantageous to do so.
Earnings growth is not a measure of future performance.
The Standard & Poor’s 500® Index is an unmanaged capitalization-weighted index of 500 selected stocks that is generally representative of the performance of large capitalization companies in the U.S. stock market. One cannot invest directly in an index.
Spread is the percentage point difference between yields of various classes of bonds compared to treasury bonds.
Must be preceded or accompanied by a prospectus.
Quasar Distributors, LLC, distributor.
5
PERFORMANCE:
The following information illustrates the historical performance of LKCM Aquinas Value Fund as of December 31, 2015 compared to the Fund’s benchmark and peer group indices.
Performance data quoted represents past performance; past performance does not guarantee future results. The graph and table reflect the reinvestment of dividends and other distributions, if any, but do not reflect the deduction of taxes that a shareholder would pay on Fund distributions or the redemption of Fund shares. The investment return and principal value of an investment will fluctuate so that an investor’s shares, when redeemed, may be worth more or less than their original cost. Current performance of the Fund may be lower or higher than the performance quoted. Performance data current to the most recent month end may be obtained by calling 1-800-423-6369.
An index is an unmanaged portfolio and does not trade or incur any expenses. One can not invest in an unmanaged index.
AVERAGE ANNUAL TOTAL RETURN (Periods Ended December 31, 2015)
| | | | | | | | | | | | | | | | |
| | | Past
1 Year | | | Past
5 Years(1) | | | Past
10 Years(1) | | | Since
Inception(1)(2) | |
LKCM Aquinas Value Fund | | | -3.28% | | | | 8.36% | | | | 6.27% | | | | 6.23% | |
Russell 1000® Value Index | | | -3.83% | | | | 11.27% | | | | 6.16% | | | | 6.21% | |
Lipper Large-Cap Value Funds Index | | | -3.65% | | | | 10.07% | | | | 5.71% | | | | 6.00% | |
| (2) | The assets of the Aquinas Value Fund were acquired by the LKCM Aquinas Value Fund on July 11, 2005. At the time of the reorganization, the Adviser also changed from Aquinas Investment Advisers, Inc. to Luther King Capital Management Corporation. |
A HYPOTHETICAL $10,000 INVESTMENT IN LKCM AQUINAS VALUE FUND
(for the ten years ended December 31, 2015)
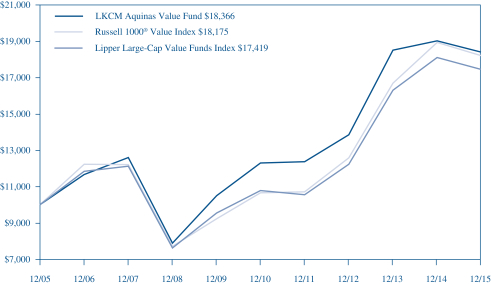
The Russell 1000® Value Index is an unmanaged index consisting of those Russell 1000® companies with lower price-to-book ratios and lower forecasted growth values.
The Lipper Large-Cap Value Funds Index is an index of large cap value mutual funds tracked by Lipper, Inc.
6
PERFORMANCE:
The following information illustrates the historical performance of LKCM Aquinas Growth Fund as of December 31, 2015 compared to the Fund’s benchmark and peer group indices.
Performance data quoted represents past performance; past performance does not guarantee future results. The graph and table reflect the reinvestment of dividends and other distributions, if any, but do not reflect the deduction of taxes that a shareholder would pay on Fund distributions or the redemption of Fund shares. The investment return and principal value of an investment will fluctuate so that an investor’s shares, when redeemed, may be worth more or less than their original cost. Current performance of the Fund may be lower or higher than the performance quoted. Performance data current to the most recent month end may be obtained by calling 1-800-423-6369.
An index is an unmanaged portfolio and does not trade or incur any expenses. One can not invest in an unmanaged index.
AVERAGE ANNUAL TOTAL RETURN (Periods Ended December 31, 2015)
| | | | | | | | | | | | | | | | |
| | | Past
1 Year | | | Past
5 Years(1) | | | Past
10 Years(1) | | | Since
Inception(1)(2) | |
LKCM Aquinas Growth Fund | | | 2.19% | | | | 8.03% | | | | 5.32% | | | | 5.32% | |
Russell 1000® Growth Index | | | 5.67% | | | | 13.53% | | | | 8.53% | | | | 8.62% | |
Lipper Large-Cap Growth Funds Index | | | 5.61% | | | | 12.17% | | | | 7.17% | | | | 7.71% | |
| (2) | The assets of the Aquinas Growth Fund were acquired by the LKCM Aquinas Growth Fund on July 11, 2005. At the time of the reorganization, the Adviser also changed from Aquinas Investment Advisers, Inc. to Luther King Capital Management Corporation. |
A HYPOTHETICAL $10,000 INVESTMENT IN LKCM AQUINAS GROWTH FUND
(for the ten years ended December 31, 2015)
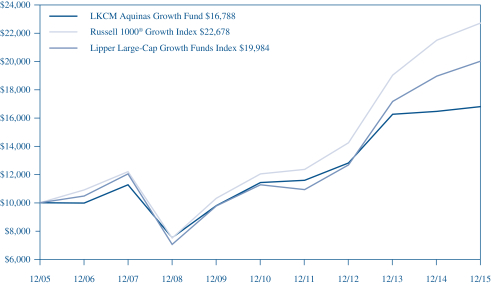
The Russell 1000® Growth Index consists of those Russell 1000® companies with higher price-to-book ratios and higher forecasted growth values.
The Lipper Large-Cap Growth Funds Index is an index of large cap growth mutual funds tracked by Lipper, Inc.
7
PERFORMANCE:
The following information illustrates the historical performance of LKCM Aquinas Small Cap Fund as of December 31, 2015 compared to the Fund’s benchmark and peer group indices.
Performance data quoted represents past performance; past performance does not guarantee future results. The graph and table reflect the reinvestment of dividends and other distributions, if any, but do not reflect the deduction of taxes that a shareholder would pay on Fund distributions or the redemption of Fund shares. The investment return and principal value of an investment will fluctuate so that an investor’s shares, when redeemed, may be worth more or less than their original cost. Current performance of the Fund may be lower or higher than the performance quoted. Performance data current to the most recent month end may be obtained by calling 1-800-423-6369.
An index is an unmanaged portfolio and does not trade or incur any expenses. One can not invest in an unmanaged index.
AVERAGE ANNUAL TOTAL RETURN (Periods Ended December 31, 2015)
| | | | | | | | | | | | | | | | |
| | | Past
1 Year | | | Past
5 Years(1) | | | Past
10 Years(1) | | | Since
Inception(1)(2) | |
LKCM Aquinas Small Cap Fund | | | -4.74% | | | | 6.24% | | | | 5.30% | | | | 5.42% | |
Russell 2000® Index | | | -4.41% | | | | 9.19% | | | | 6.80% | | | | 6.71% | |
Lipper Small-Cap Core Funds Index | | | -4.23% | | | | 8.64% | | | | 6.69% | | | | 7.13% | |
| (2) | The assets of the Aquinas Small Cap Fund were acquired by the LKCM Aquinas Small Cap Fund on July 11, 2005. At the time of the reorganization, the Adviser also changed from Aquinas Investment Advisers, Inc. to Luther King Capital Management Corporation. |
A HYPOTHETICAL $10,000 INVESTMENT IN LKCM AQUINAS SMALL CAP FUND
(for the ten years ended December 31, 2015)
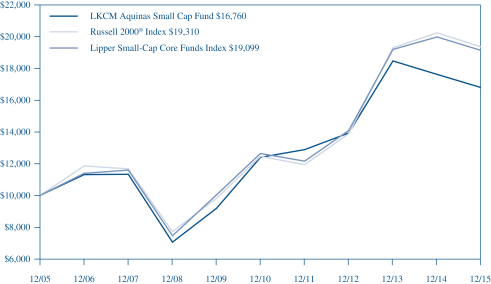
The Russell 2000® Index is an unmanaged index consisting of the 2,000 smallest companies in the Russell 3000® Index.
The Lipper Small-Cap Core Funds Index is an index of small cap core mutual funds tracked by Lipper, Inc.
8
LKCM Aquinas Funds Expense Example — December 31, 2015
As a shareholder of the Funds, you incur two types of costs: (1) transaction costs, including redemption fees; and (2) ongoing costs, including management fees, distribution and/or service (12b-1) fees and other Fund expenses. This Example is intended to help you understand your ongoing costs (in dollars) of investing in the Funds and to compare these costs with the ongoing costs of investing in other mutual funds. The Example is based on an investment of $1,000 invested at the beginning of the period and held for the entire period (7/1/15 - 12/31/15).
ACTUAL EXPENSES
The first line of the tables below provides information about actual account values and actual expenses. You may use the information in this line, together with the amount you invested, to estimate the expenses that you paid over the period. Simply divide your account value by $1,000 (for example, an $8,600 account value divided by $1,000 = 8.6), then multiply the result by the number in the first line under the heading entitled “Expenses Paid During Period” to estimate the expenses you paid on your account during this period. Although the Funds charge no sales load, you will be assessed fees for outgoing wire transfers, returned checks and stop payment orders at prevailing rates charged by U.S. Bancorp Fund Services, LLC, the Funds’ transfer agent. If you request that a redemption be made by wire transfer, currently a $15 fee is charged by the Funds’ transfer agent. You will be charged a redemption fee equal to 1.00% of the net amount of the redemption if you redeem your shares of the LKCM Aquinas Value, Aquinas Growth and Aquinas Small Cap Funds within 30 days of purchase, unless otherwise determined by the Funds in their discretion. To the extent the Funds invest in shares of other investment companies as part of their investment strategies, you will indirectly bear your proportionate share of any fees and expenses charged by the underlying funds in which the Funds invest in addition to the expenses of the Funds. Actual expenses of the underlying funds are expected to vary among the various underlying funds. These expenses are not included in the example below. The example below includes management fees, registration fees and other expenses. However, the example below does not include portfolio trading commissions and related expenses and other extraordinary expenses as determined under generally accepted accounting principles.
HYPOTHETICAL EXAMPLES FOR COMPARISON PURPOSES
The second line of the tables below provides information about hypothetical account values and hypothetical expenses based on the Funds’ actual expense ratios and an assumed rate of return of 5% per year before expenses, which are not the Funds’ actual returns. The hypothetical account values and expenses may not be used to estimate the actual ending account balance or expenses you paid for the period. You may use this information to compare the ongoing costs of investing in the Funds and other funds. To do so, compare this 5% hypothetical example with the 5% hypothetical examples that appear in the shareholder reports of the other funds. Please note that the expenses shown in the table are meant to highlight your ongoing costs only and do not reflect any transactional costs, such as redemption fees. Therefore, the second line of the table is useful in comparing ongoing costs only, and will not help you determine the relative total costs of owning different funds. In addition, if these transactions costs were included, your costs would have been higher.
| | | | | | | | | | | | |
| | | LKCM Aquinas Value Fund | |
| | | Beginning
Account Value
7/1/15 | | | Ending
Account Value
12/31/15 | | | Expenses Paid
During Period*
7/1/15 – 12/31/15 | |
Actual . . . . . . . . . . . . . . . . . . . . . . . . . . . . . . | | $ | 1,000.00 | | | $ | 938.80 | | | $ | 7.33 | |
Hypothetical (5% return before expense) . . . . . . | | $ | 1,000.00 | | | $ | 1,017.64 | | | $ | 7.63 | |
| * | Expenses are equal to the Fund's annualized net expense ratio of 1.50%, multiplied by the average account value over the period, |
| | multiplied | by 184/365 to reflect the one-half year period. |
| | | | | | | | | | | | |
| | | LKCM Aquinas Growth Fund | |
| | | Beginning
Account Value
7/1/15 | | | Ending
Account Value
12/31/15 | | | Expenses Paid
During Period*
7/1/15 – 12/31/15 | |
Actual . . . . . . . . . . . . . . . . . . . . . . . . . . . . . . | | $ | 1,000.00 | | | $ | 991.40 | | | $ | 7.53 | |
Hypothetical (5% return before expense) . . . . . . | | $ | 1,000.00 | | | $ | 1,017.64 | | | $ | 7.63 | |
| * | Expenses are equal to the Fund's annualized net expense ratio of 1.50%, multiplied by the average account value over the period, |
| | multiplied | by 184/365 to reflect the one-half year period. |
| | | | | | | | | | | | |
| | | LKCM Aquinas Small Cap Fund | |
| | | Beginning
Account Value
7/1/15 | | | Ending
Account Value
12/31/15 | | | Expenses Paid
During Period*
7/1/15 – 12/31/15 | |
Actual . . . . . . . . . . . . . . . . . . . . . . . . . . . . . . | | $ | 1,000.00 | | | $ | 886.60 | | | $ | 7.13 | |
Hypothetical (5% return before expense) . . . . . . | | $ | 1,000.00 | | | $ | 1,017.64 | | | $ | 7.63 | |
| * | Expenses are equal to the Fund's annualized net expense ratio of 1.50%, multiplied by the average account value over the period, |
| | multiplied | by 184/365 to reflect the one-half year period. |
9
ALLOCATION OF PORTFOLIO HOLDINGS — LKCM Aquinas Funds — December 31, 2015
Percentages represent market value as a percentage of total investments.
LKCM Aquinas Value Fund
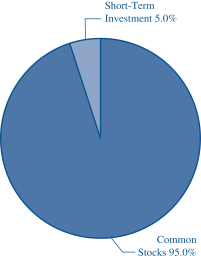
LKCM Aquinas Small Cap Fund
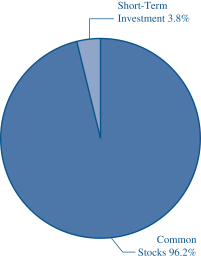
LKCM Aquinas Growth Fund
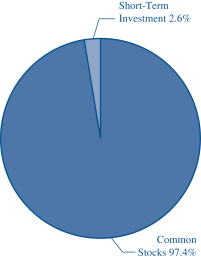
10
|
| LKCM AQUINAS VALUE FUND |
| SCHEDULEOF INVESTMENTS |
| December 31, 2015 |
| | | | | | | | |
| COMMON STOCKS - 95.2% | | Shares | | | Value | |
Aerospace & Defense - 3.5% | |
Honeywell International Inc. | | | 15,000 | | | $ | 1,553,550 | |
| | | | | | | | |
Auto Components - 3.6% | |
The Goodyear Tire & Rubber Company | | | 50,000 | | | | 1,633,500 | |
| | | | | | | | |
Banks - 11.8% | |
BOK Financial Corporation | | | 17,500 | | | | 1,046,325 | |
Cullen/Frost Bankers, Inc. | | | 15,000 | | | | 900,000 | |
SunTrust Banks, Inc. | | | 40,000 | | | | 1,713,600 | |
Zions Bancorporation | | | 60,000 | | | | 1,638,000 | |
| | | | | | | | |
| | | | | | | 5,297,925 | |
| | | | | | | | |
Beverages - 4.5% | |
The Coca-Cola Company | | | 17,500 | | | | 751,800 | |
PepsiCo, Inc. | | | 12,500 | | | | 1,249,000 | |
| | | | | | | | |
| | | | | | | 2,000,800 | |
| | | | | | | | |
Chemicals - 1.6% | |
Monsanto Company | | | 7,500 | | | | 738,900 | |
| | | | | | | | |
Commercial Services & Supplies - 1.5% | |
Copart, Inc. (a) | | | 17,500 | | | | 665,175 | |
| | | | | | | | |
Construction Materials - 3.8% | |
Martin Marietta Materials, Inc. | | | 12,500 | | | | 1,707,250 | |
| | | | | | | | |
Diversified Financials - 3.7% | |
JPMorgan Chase & Co. | | | 25,000 | | | | 1,650,750 | |
| | | | | | | | |
Electrical Equipment & Instruments - 3.4% | |
Roper Technologies, Inc. | | | 8,000 | | | | 1,518,320 | |
| | | | | | | | |
Electronic Equipment & Instruments - 0.2% | |
Trimble Navigation Limited (a) | | | 5,000 | | | | 107,250 | |
| | | | | | | | |
Energy Equipment & Services - 1.3% | |
Schlumberger Limited (b) | | | 8,400 | | | | 585,900 | |
| | | | | | | | |
Food & Drug Retailing - 3.8% | |
CVS Health Corporation | | | 17,500 | | | | 1,710,975 | |
| | | | | | | | |
Food Products - 4.5% | |
The Kraft Heinz Company | | | 9,700 | | | | 705,772 | |
Mondelez International Inc. - Class A | | | 29,700 | | | | 1,331,748 | |
| | | | | | | | |
| | | | | | | 2,037,520 | |
| | | | | | | | |
Health Care Equipment & Supplies - 5.1% | |
DENTSPLY International Inc. | | | 20,000 | | | | 1,217,000 | |
Medtronic, PLC (b) | | | 14,200 | | | | 1,092,264 | |
| | | | | | | | |
| | | | | | | 2,309,264 | |
| | | | | | | | |
Household Durables - 2.5% | |
Whirlpool Corporation | | | 7,500 | | | | 1,101,525 | |
| | | | | | | | |
Insurance - 6.7% | |
MetLife, Inc. | | | 33,000 | | | | 1,590,930 | |
Prudential Financial, Inc. | | | 17,500 | | | | 1,424,675 | |
| | | | | | | | |
| | | | | | | 3,015,605 | |
| | | | | | | | |
Internet Software & Services - 7.9% | |
Akamai Technologies, Inc. (a) | | | 20,000 | | | | 1,052,600 | |
Alphabet, Inc. - Class A (a) | | | 1,400 | | | | 1,089,214 | |
Sabre Corporation | | | 50,000 | | | | 1,398,500 | |
| | | | | | | | |
| | | | | | | 3,540,314 | |
| | | | | | | | |
| | | | | | | | |
| COMMON STOCKS | | Shares | | | Value | |
IT Consulting & Services - 2.2% | |
PayPal Holdings, Inc. (a) | | | 27,500 | | | $ | 995,500 | |
| | | | | | | | |
Machinery - 6.0% | |
Barnes Group Inc. | | | 30,000 | | | | 1,061,700 | |
Danaher Corporation | | | 17,500 | | | | 1,625,400 | |
| | | | | | | | |
| | | | | | | 2,687,100 | |
| | | | | | | | |
Multiline Retail - 1.9% | |
Kohl's Corporation | | | 18,000 | | | | 857,340 | |
| | | | | | | | |
Oil & Gas & Consumable Fuels - 3.9% | |
Cabot Oil & Gas Corporation | | | 30,000 | | | | 530,700 | |
ConocoPhillips | | | 11,000 | | | | 513,590 | |
Exxon Mobil Corporation | | | 4,000 | | | | 311,800 | |
Gulfport Energy Corporation (a) | | | 15,000 | | | | 368,550 | |
| | | | | | | | |
| | | | | | | 1,724,640 | |
| | | | | | | | |
Professional Services - 1.9% | |
Verisk Analytics, Inc. (a) | | | 11,000 | | | | 845,680 | |
| | | | | | | | |
Software - 3.8% | |
Adobe Systems Incorporated (a) | | | 18,000 | | | | 1,690,920 | |
| | | | | | | | |
Specialty Retail - 6.1% | |
The Home Depot, Inc. | | | 8,500 | | | | 1,124,125 | |
Party City Holdco Inc. (a) | | | 55,000 | | | | 710,050 | |
Tiffany & Co. | | | 12,000 | | | | 915,480 | |
| | | | | | | | |
| | | | | | | 2,749,655 | |
| | | | | | | | |
TOTAL COMMON STOCKS | | | | | |
(Cost $26,282,002) | | | | 42,725,358 | |
| | | | | | | | |
| | | | | | | | |
| SHORT-TERM INVESTMENTS - 5.0% | |
Money Market Funds (c) - 5.0% | |
Dreyfus Government Cash Management Fund - Institutional Shares, 0.01% | | | 933,960 | | | | 933,960 | |
Federated Government Obligations Fund - Institutional Shares, 0.01% | | | 1,300,853 | | | | 1,300,853 | |
| | | | | | | | |
| | | | | | | 2,234,813 | |
| | | | | | | | |
TOTAL SHORT-TERM INVESTMENTS | | | | | |
(Cost $2,234,813) | | | | 2,234,813 | |
| | | | | | | | |
Total Investments - 100.2% | | | | | |
(Cost $28,516,815) | | | | 44,960,171 | |
Liabilities in Excess of Other Assets - (0.2)% | | | | (92,181 | ) |
| | | | | | | | |
TOTAL NET ASSETS - 100.0% | | | | | | $ | 44,867,990 | |
| | | | | | | | |
| (a) | Non-income producing security. |
| (b) | Security issued by non-U.S. incorporated company. |
| (c) | The rate quoted is the annualized seven-day yield of the fund at period end. |
Investments are classified by asset class and industry pursuant to the Global Industry Classification Standard (GICS®) which was developed by and/or is the exclusive property of MSCI, Inc. and Standard & Poor Financial Services LLC (“S&P”). GICS is a service mark of MSCI and S&P and has been licensed for use by U.S. Bancorp Fund Services, LLC.
The accompanying notes are an integral part of these financial statements.
11
|
| LKCM AQUINAS GROWTH FUND |
| SCHEDULEOF INVESTMENTS |
| December 31, 2015 |
| | | | | | | | |
| COMMON STOCKS - 97.7% | | Shares | | | Value | |
Aerospace & Defense - 3.0% | |
Honeywell International Inc. | | | 7,675 | | | $ | 794,900 | |
| | | | | | | | |
Banks - 1.1% | |
Cullen/Frost Bankers, Inc. | | | 3,000 | | | | 180,000 | |
Texas Capital Bancshares, Inc. (a) | | | 2,000 | | | | 98,840 | |
| | | | | | | | |
| | | | | | | 278,840 | |
| | | | | | | | |
Beverages - 1.6% | |
The Coca-Cola Company | | | 10,000 | | | | 429,600 | |
| | | | | | | | |
Biotechnology - 2.0% | |
Amgen Inc. | | | 3,275 | | | | 531,631 | |
| | | | | | | | |
Building Products - 1.3% | |
Masco Corporation | | | 12,000 | | | | 339,600 | |
| | | | | | | | |
Chemicals - 0.9% | |
FMC Corporation | | | 6,000 | | | | 234,780 | |
| | | | | | | | |
Computers & Peripherals - 7.1% | |
Apple Inc. | | | 10,500 | | | | 1,105,230 | |
EMC Corporation | | | 30,000 | | | | 770,400 | |
| | | | | | | | |
| | | | | | | 1,875,630 | |
| | | | | | | | |
Consumer Finance - 2.3% | |
American Express Company | | | 8,750 | | | | 608,562 | |
| | | | | | | | |
Containers & Packaging - 1.2% | |
Ball Corporation | | | 4,250 | | | | 309,103 | |
| | | | | | | | |
Diversified Telecommunication Services - 1.1% | |
AT&T Inc. | | | 8,250 | | | | 283,882 | |
| | | | | | | | |
Electrical Equipment & Instruments - 4.3% | |
Roper Technologies, Inc. | | | 6,000 | | | | 1,138,740 | |
| | | | | | | | |
Electronic Equipment & Instruments - 3.8% | |
National Instruments Corporation | | | 18,000 | | | | 516,420 | |
Trimble Navigation Limited (a) | | | 22,000 | | | | 471,900 | |
| | | | | | | | |
| | | | | | | 988,320 | |
| | | | | | | | |
Food & Drug Retailing - 3.5% | |
CVS Health Corporation | | | 9,375 | | | | 916,594 | |
| | | | | | | | |
Health Care Equipment & Supplies - 1.8% | |
Medtronic, PLC (b) | | | 6,000 | | | | 461,520 | |
| | | | | | | | |
Health Care Providers & Services - 1.0% | |
Express Scripts Holding Co (a) | | | 3,000 | | | | 262,230 | |
| | | | | | | | |
Hotels, Restaurants & Leisure - 2.4% | |
Yum! Brands, Inc. | | | 8,800 | | | | 642,840 | |
| | | | | | | | |
Household Durables - 1.1% | |
Whirlpool Corporation | | | 2,000 | | | | 293,740 | |
| | | | | | | | |
Household Products - 4.0% | |
Colgate-Palmolive Company | | | 12,000 | | | | 799,440 | |
The Procter & Gamble Company | | | 3,000 | | | | 238,230 | |
| | | | | | | | |
| | | | | | | 1,037,670 | |
| | | | | | | | |
Internet Catalog & Retail - 4.9% | |
Amazon.com, Inc. (a) | | | 1,900 | | | | 1,284,191 | |
| | | | | | | | |
Internet Software & Services - 13.6% | |
Akamai Technologies, Inc. (a) | | | 15,000 | | | | 789,450 | |
Alphabet, Inc. - Class A (a) | | | 1,000 | | | | 778,010 | |
| | | | | | | | |
| COMMON STOCKS | | Shares | | | Value | |
Internet Software & Services - 13.6%, Continued | |
Alphabet, Inc. - Class C (a) | | | 1,002 | | | $ | 760,398 | |
Facebook, Inc. - Class A (a) | | | 12,000 | | | | 1,255,920 | |
| | | | | | | | |
| | | | | | | 3,583,778 | |
| | | | | | | | |
IT Consulting & Services - 2.7% | |
PayPal Holdings, Inc. (a) | | | 10,000 | | | | 362,000 | |
Visa Inc. - Class A | | | 4,500 | | | | 348,975 | |
| | | | | | | | |
| | | | | | | 710,975 | |
| | | | | | | | |
Machinery - 3.9% | |
Danaher Corporation | | | 11,000 | | | | 1,021,680 | |
| | | | | | | | |
Media - 1.8% | |
The Walt Disney Company | | | 4,500 | | | | 472,860 | |
| | | | | | | | |
Oil & Gas & Consumable Fuels - 1.0% | |
Cabot Oil & Gas Corporation | | | 15,000 | | | | 265,350 | |
| | | | | | | | |
Personal Products - 1.3% | |
The Estee Lauder Companies Inc. - Class A | | | 4,000 | | | | 352,240 | |
| | | | | | | | |
Pharmaceuticals - 1.8% | |
Zoetis Inc | | | 10,000 | | | | 479,200 | |
| | | | | | | | |
Real Estate Investment Trusts - 1.8% | |
American Tower Corporation | | | 5,000 | | | | 484,750 | |
| | | | | | | | |
Software - 6.3% | |
ACI Worldwide, Inc. (a) | | | 24,000 | | | | 513,600 | |
Manhattan Associates, Inc. (a) | | | 6,000 | | | | 397,020 | |
Microsoft Corporation | | | 13,625 | | | | 755,915 | |
| | | | | | | | |
| | | | | | | 1,666,535 | |
| | | | | | | | |
Specialty Retail - 9.9% | |
The Home Depot, Inc. | | | 6,000 | | | | 793,500 | |
O'Reilly Automotive, Inc. (a) | | | 3,000 | | | | 760,260 | |
Tractor Supply Company | | | 8,000 | | | | 684,000 | |
Ulta Salon, Cosmetics & Fragrance, Inc. (a) | | | 2,000 | | | | 370,000 | |
| | | | | | | | |
| | | | | | | 2,607,760 | |
| | | | | | | | |
Textiles, Apparel & Luxury Goods - 5.2% | |
NIKE, Inc. - Class B | | | 12,000 | | | | 750,000 | |
V.F. Corporation | | | 10,000 | | | | 622,500 | |
| | | | | | | | |
| | | | | | | 1,372,500 | |
| | | | | | | | |
TOTAL COMMON STOCKS | | | | | |
(Cost $15,571,144) | | | | 25,730,001 | |
| | | | | | | | |
The accompanying notes are an integral part of these financial statements.
12
|
| LKCM AQUINAS GROWTH FUND |
| SCHEDULEOF INVESTMENTS, CONTINUED |
| December 31, 2015 |
| | | | | | | | |
| SHORT-TERM INVESTMENTS - 2.6% | | Shares | | | Value | |
Money Market Funds (c) - 2.6% | |
Dreyfus Government Cash Management Fund - Institutional Shares, 0.01% | | | 86,991 | | | $ | 86,991 | |
Federated Government Obligations Fund - Institutional Shares, 0.01% | | | 600,681 | | | | 600,681 | |
| | | | | | | | |
| | | | | | | 687,672 | |
| | | | | | | | |
TOTAL SHORT-TERM INVESTMENTS | | | | | |
(Cost $687,672) | | | | 687,672 | |
| | | | | | | | |
Total Investments - 100.3% | | | | | |
(Cost $16,258,816) | | | | 26,417,673 | |
Liabilities in Excess of Other Assets - (0.3)% | | | | (81,870 | ) |
| | | | | | | | |
TOTAL NET ASSETS - 100.0% | | | $ | 26,335,803 | |
| | | | | | | | |
| (a) | Non-income producing security. |
| (b) | Security issued by non-U.S. incorporated company. |
| (c) | The rate quoted is the annualized seven-day yield of the fund at period end. |
Investments are classified by asset class and industry pursuant to the Global Industry Classification Standard (GICS®) which was developed by and/or is the exclusive property of MSCI, Inc. and Standard & Poor Financial Services LLC (“S&P”). GICS is a service mark of MSCI and S&P and has been licensed for use by U.S. Bancorp Fund Services, LLC.
The accompanying notes are an integral part of these financial statements.
13
|
| LKCM AQUINAS SMALL CAP FUND |
| SCHEDULEOF INVESTMENTS |
| December 31, 2015 |
| | | | | | | | |
| COMMON STOCKS - 96.2% | | Shares | | | Value | |
Aerospace & Defense - 1.1% | |
Hexcel Corporation | | | 1,565 | | | $ | 72,694 | |
| | | | | | | | |
Auto Components - 0.1% | |
Asbury Automotive Group Inc. (a) | | | 55 | | | | 3,709 | |
| | | | | | | | |
Automobiles - 2.2% | |
Lithia Motors, Inc. - Class A | | | 1,305 | | | | 139,204 | |
| | | | | | | | |
Banks - 9.4% | |
BancorpSouth, Inc. | | | 4,183 | | | | 100,350 | |
Bank of the Ozarks, Inc. | | | 2,425 | | | | 119,941 | |
Columbia Banking System, Inc. | | | 3,470 | | | | 112,810 | |
Hanmi Financial Corporation | | | 3,575 | | | | 84,799 | |
PrivateBancorp, Inc. | | | 2,405 | | | | 98,653 | |
Texas Capital Bancshares, Inc. (a) | | | 1,610 | | | | 79,566 | |
| | | | | | | | |
| | | | | | | 596,119 | |
| | | | | | | | |
Biotechnology - 4.3% | |
Charles River Laboratories International, Inc. (a) | | | 1,475 | | | | 118,575 | |
EXACT Sciences Corporation (a) | | | 5,715 | | | | 52,749 | |
Neogen Corporation (a) | | | 1,840 | | | | 103,997 | |
| | | | | | | | |
| | | | | | | 275,321 | |
| | | | | | | | |
Building Products - 2.2% | |
Apogee Enterprises, Inc. | | | 1,420 | | | | 61,784 | |
PGT, Inc. (a) | | | 6,879 | | | | 78,352 | |
| | | | | | | | |
| | | | | | | 140,136 | |
| | | | | | | | |
Capital Markets - 0.9% | |
BGC Partners Inc - Class A | | | 5,675 | | | | 55,672 | |
| | | | | | | | |
Commercial Services & Supplies - 4.0% | |
Healthcare Services Group, Inc. | | | 4,150 | | | | 144,710 | |
Multi-Color Corporation | | | 280 | | | | 16,747 | |
Ritchie Bros. Auctioneers Incorporated (b) | | | 3,935 | | | | 94,873 | |
| | | | | | | | |
| | | | | | | 256,330 | |
| | | | | | | | |
Communications Equipment - 2.4% | |
Ciena Corporation (a) | | | 2,300 | | | | 47,587 | |
Infinera Corporation (a) | | | 5,975 | | | | 108,267 | |
| | | | | | | | |
| | | | | | | 155,854 | |
| | | | | | | | |
Construction & Engineering - 0.7% | |
MasTec Inc. (a) | | | 2,460 | | | | 42,755 | |
| | | | | | | | |
Construction Materials - 1.2% | |
Headwaters Incorporated (a) | | | 4,130 | | | | 69,673 | |
Summit Materials, Inc. - Class A (a) | | | 356 | | | | 7,126 | |
| | | | | | | | |
| | | | | | | 76,799 | |
| | | | | | | | |
Diversified Financials - 1.3% | |
HFF, Inc. - Class A | | | 2,675 | | | | 83,112 | |
| | | | | | | | |
Electronic Equipment & Instruments - 0.4% | |
Belden Inc. | | | 510 | | | | 24,317 | |
| | | | | | | | |
Food & Staples Retailing - 0.5% | |
Sprouts Farmers Market Inc. (a) | | | 1,275 | | | | 33,902 | |
| | | | | | | | |
| | | | | | | | |
| COMMON STOCKS | | Shares | | | Value | |
Food Products - 3.4% | |
Post Holdings Inc. (a) | | | 1,910 | | | $ | 117,847 | |
TreeHouse Foods, Inc. (a) | | | 1,295 | | | | 101,606 | |
| | | | | | | | |
| | | | | | | 219,453 | |
| | | | | | | | |
Health Care Equipment & Supplies - 8.2% | |
Cantel Medical Corp. | | | 1,675 | | | | 104,085 | |
Cynosure, Inc. - Class A (a) | | | 2,815 | | | | 125,746 | |
LDR Holding Corporation (a) | | | 3,395 | | | | 85,248 | |
PRA Health Sciences, Inc. (a) | | | 1,160 | | | | 52,513 | |
VWR Corporation (a) | | | 5,405 | | | | 153,016 | |
| | | | | | | | |
| | | | | | | 520,608 | |
| | | | | | | | |
Health Care Providers & Services - 3.3% | |
Aceto Corporation | | | 3,880 | | | | 104,683 | |
Omnicell, Inc. (a) | | | 2,505 | | | | 77,855 | |
Team Health Holdings, Inc. (a) | | | 625 | | | | 27,431 | |
| | | | | | | | |
| | | | | | | 209,969 | |
| | | | | | | | |
Hotels, Restaurants & Leisure - 2.3% | |
La Quinta Holdings Inc (a) | | | 2,305 | | | | 31,371 | |
Popeyes Louisiana Kitchen, Inc. (a) | | | 1,415 | | | | 82,778 | |
Zoe's Kitchen Inc (a) | | | 1,050 | | | | 29,379 | |
| | | | | | | | |
| | | | | | | 143,528 | |
| | | | | | | | |
Internet Software & Services - 8.5% | |
Criteo SA - ADR (a) (b) | | | 2,570 | | | | 101,772 | |
Demandware Inc. (a) | | | 1,295 | | | | 69,891 | |
Euronet Worldwide, Inc. (a) | | | 2,150 | | | | 155,724 | |
LogMeIn, Inc. (a) | | | 1,465 | | | | 98,302 | |
SPS Commerce, Inc. (a) | | | 1,650 | | | | 115,847 | |
| | | | | | | | |
| | | | | | | 541,536 | |
| | | | | | | | |
Leisure Equipment & Products - 2.0% | |
Pool Corporation | | | 1,605 | | | | 129,652 | |
| | | | | | | | |
Machinery - 1.0% | |
Barnes Group Inc. | | | 1,850 | | | | 65,471 | |
| | | | | | | | |
Media - 1.7% | |
The E.W. Scripps Company - Class A | | | 5,750 | | | | 109,250 | |
| | | | | | | | |
Multiline Retail - 1.2% | |
Burlington Stores, Inc. (a) | | | 1,735 | | | | 74,432 | |
| | | | | | | | |
Oil & Gas & Consumable Fuels - 2.3% | |
Diamondback Energy Inc. (a) | | | 145 | | | | 9,701 | |
Memorial Resource Development Corp. (a) | | | 3,935 | | | | 63,550 | |
PDC Energy, Inc. (a) | | | 885 | | | | 47,241 | |
Synergy Resources Corporation (a) | | | 3,175 | | | | 27,051 | |
| | | | | | | | |
| | | | | | | 147,543 | |
| | | | | | | | |
Paper & Forest Products - 1.4% | |
KapStone Paper and Packaging Corporation | | | 3,815 | | | | 86,181 | |
| | | | | | | | |
Pharmaceuticals - 3.8% | |
Akorn, Inc. (a) | | | 3,756 | | | | 140,136 | |
Cambrex Corp. (a) | | | 2,150 | | | | 101,244 | |
| | | | | | | | |
| | | | | | | 241,380 | |
| | | | | | | | |
The accompanying notes are an integral part of these financial statements.
14
|
| LKCM AQUINAS SMALL CAP FUND |
| SCHEDULEOF INVESTMENTS, CONTINUED |
| December 31, 2015 |
| | | | | | | | |
| COMMON STOCKS | | Shares | | | Value | |
Professional Services - 2.4% | |
The Advisory Board Company (a) | | | 1,750 | | | $ | 86,818 | |
FTI Consulting, Inc. (a) | | | 1,885 | | | | 65,334 | |
| | | | | | | | |
| | | | | | | 152,152 | |
| | | | | | | | |
Real Estate Investment Trusts - 7.3% | |
CubeSmart | | | 3,520 | | | | 107,782 | |
Kennedy-Wilson Holdings Inc. | | | 3,455 | | | | 83,196 | |
LaSalle Hotel Properties | | | 2,250 | | | | 56,610 | |
Sovran Self Storage, Inc. | | | 1,355 | | | | 145,405 | |
Stag Industrial, Inc. | | | 3,835 | | | | 70,756 | |
| | | | | | | | |
| | | | | | | 463,749 | |
| | | | | | | | |
Semiconductor Equipment & Products - 1.5% | |
Rambus Inc. (a) | | | 8,060 | | | | 93,415 | |
| | | | | | | | |
Software - 9.4% | |
ACI Worldwide, Inc. (a) | | | 6,120 | | | | 130,968 | |
Callidus Software, Inc. (a) | | | 4,170 | | | | 77,437 | |
Fair Isaac Corporation | | | 1,475 | | | | 138,916 | |
Guidewire Software Inc. (a) | | | 1,030 | | | | 61,965 | |
Manhattan Associates, Inc. (a) | | | 1,460 | | | | 96,608 | |
Proofpoint, Inc. (a) | | | 1,435 | | | | 93,289 | |
| | | | | | | | |
| | | | | | | 599,183 | |
| | | | | | | | |
Specialty Retail - 1.8% | |
Monro Muffler Brake, Inc. | | | 1,710 | | | | 113,236 | |
| | | | | | | | |
Thrifts & Mortgage Finance - 1.9% | |
Home Bancshares Inc. | | | 2,950 | | | | 119,534 | |
| | | | | | | | |
Trading Companies & Distributors - 2.1% | |
Watsco, Inc. | | | 1,130 | | | | 132,357 | |
| | | | | | | | |
TOTAL COMMON STOCKS | | | | | |
(Cost $5,124,580) | | | | | | | 6,118,553 | |
| | | | | | | | |
| | | | | | | | |
| SHORT-TERM INVESTMENTS - 3.8% | | Shares | | | Value | |
Money Market Funds (c) - 3.8% | |
Dreyfus Government Cash Management Fund - Institutional Shares, 0.01% | | | 91,316 | | | $ | 91,316 | |
Federated Government Obligations Fund - Institutional Shares, 0.01% | | | 151,630 | | | | 151,630 | |
| | | | | | | | |
| | | | | | | 242,946 | |
| | | | | | | | |
TOTAL SHORT-TERM INVESTMENTS | | | | | |
(Cost $242,946) | | | | 242,946 | |
| | | | | | | | |
Total Investments - 100.0% | | | | | | | | |
(Cost $5,367,526) | | | | 6,361,499 | |
Other Assets in Excess of Liabilities - 0.0% | | | | 3,103 | |
| | | | | | | | |
TOTAL NET ASSETS - 100.0% | | | | | | $ | 6,364,602 | |
| | | | | | | | |
ADR American Depository Receipt.
| (a) | Non-income producing security. |
| (b) | Security issued by non-U.S. incorporated company. |
| (c) | The rate quoted is the annualized seven-day yield of the fund at period end. |
Investments are classified by asset class and industry pursuant to the Global Industry Classification Standard (GICS®) which was developed by and/or is the exclusive property of MSCI, Inc. and Standard & Poor Financial Services LLC (“S&P”). GICS is a service mark of MSCI and S&P and has been licensed for use by U.S. Bancorp Fund Services, LLC.
The accompanying notes are an integral part of these financial statements.
15
|
| STATEMENTOF ASSETS AND LIABILITIES |
| December 31, 2015 |
| | | | | | | | | | | | | | | | | | |
| | | | | LKCM
Aquinas
Value Fund | | | | | LKCM
Aquinas
Growth Fund | | | | | LKCM Aquinas Small Cap Fund | |
| | | | | | | | | | | | | | | | | | |
Assets: | | | | | | | | | | | | | | | | | | |
Investments, at value* | | | | $ | 44,960,171 | | | | | $ | 26,417,673 | | | | | $ | 6,361,499 | |
Receivable for Fund shares sold | | | | | 62,816 | | | | | | 4,982 | | | | | | 9,763 | |
Dividends and interest receivable | | | | | 37,697 | | | | | | 15,801 | | | | | | 3,945 | |
Other assets | | | | | 13,658 | | | | | | 11,708 | | | | | | 12,124 | |
| | | | | | | | | | | | | | | | | | |
Total assets | | | | | 45,074,342 | | | | | | 26,450,164 | | | | | | 6,387,331 | |
| | | | | | | | | | | | | | | | | | |
Liabilities: | | | | | | | | | | | | | | | | | | |
Payable for investment advisory fees (Note B) | | | | | 96,325 | | | | | | 49,797 | | | | | | 47 | |
Payable for distribution expense (Note B) | | | | | 61,711 | | | | | | 37,633 | | | | | | 4,971 | |
Payable for Fund shares redeemed | | | | | 13,895 | | | | | | 103 | | | | | | 34 | |
Payable for accounting and
transfer agent fees and expenses | | | | | 11,648 | | | | | | 10,416 | | | | | | 7,295 | |
Payable for reports to shareholders | | | | | 13,331 | | | | | | 4,161 | | | | | | 994 | |
Payable for administrative fees | | | | | 6,901 | | | | | | 4,742 | | | | | | 3,412 | |
Payable for custody fees and expenses | | | | | 1,099 | | | | | | 1,003 | | | | | | 1,340 | |
Accrued expenses and other liabilities | | | | | 1,442 | | | | | | 6,506 | | | | | | 4,636 | |
| | | | | | | | | | | | | | | | | | |
Total liabilities | | | | | 206,352 | | | | | | 114,361 | | | | | | 22,729 | |
| | | | | | | | | | | | | | | | | | |
Net Assets | | | | $ | 44,867,990 | | | | | $ | 26,335,803 | | | | | $ | 6,364,602 | |
| | | | | | | | | | | | | | | | | | |
Net Assets Consist of: | | | | | | | | | | | | | | | | | | |
Paid in capital | | | | $ | 28,617,960 | | | | | $ | 16,035,772 | | | | | $ | 5,394,560 | |
Accumulated net investment income | | | | | 6,270 | | | | | | — | | | | | | — | |
Accumulated net realized gain on securities | | | | | (199,596 | ) | | | | | 141,174 | | | | | | (23,931 | ) |
Net unrealized appreciation on investments | | | | | 16,443,356 | | | | | | 10,158,857 | | | | | | 993,973 | |
| | | | | | | | | | | | | | | | | | |
Net Assets | | | | $ | 44,867,990 | | | | | $ | 26,335,803 | | | | | $ | 6,364,602 | |
| | | | | | | | | | | | | | | | | | |
Net Assets | | | | $ | 44,867,990 | | | | | $ | 26,335,803 | | | | | $ | 6,364,602 | |
Shares of beneficial interest outstanding
(unlimited shares of no par value authorized) | | | | | 2,957,210 | | | | | | 1,593,949 | | | | | | 1,042,328 | |
Net asset value per share
(offering and redemption price) | | | | $ | 15.17 | | | | | $ | 16.52 | | | | | $ | 6.11 | |
| | | | | | | | | | | | | | | | | | |
| | | | | | |
* Cost of Investments | | | | $ | 28,516,815 | | | | | $ | 16,258,816 | | | | | $ | 5,367,526 | |
| | | | | | | | | | | | | | | | | | |
The accompanying notes are an integral part of these financial statements.
16
|
| STATEMENTOF OPERATIONS |
| For the Year Ended December 31, 2015 |
| | | | | | | | | | | | | | | | | | |
| | | | | LKCM
Aquinas
Value Fund | | | | | LKCM
Aquinas
Growth Fund | | | | | LKCM
Aquinas Small
Cap Fund | |
| | | | | | | | | | | | | | | | | | |
Investment Income: | | | | | | | | | | | | | | | | | | |
Dividends* | | | | $ | 842,174 | | | | | $ | 355,982 | | | | | $ | 76,739 | |
Interest | | | | | 128 | | | | | | 84 | | | | | | 38 | |
| | | | | | | | | | | | | | | | | | |
Total income | | | | | 842,302 | | | | | | 356,066 | | | | | | 76,777 | |
| | | | | | | | | | | | | | | | | | |
Expenses: | | | | | | | | | | | | | | | | | | |
Investment advisory fees (Note B) | | | | | 447,834 | | | | | | 263,038 | | | | | | 73,961 | |
Distribution expense (Note B) | | | | | 124,398 | | | | | | 73,066 | | | | | | 18,490 | |
Accounting and transfer agent fees and expenses | | | | | 70,279 | | | | | | 61,013 | | | | | | 42,758 | |
Administrative fees | | | | | 42,522 | | | | | | 27,705 | | | | | | 19,775 | |
Federal and state registration | | | | | 25,152 | | | | | | 21,954 | | | | | | 16,657 | |
Reports to shareholders | | | | | 18,701 | | | | | | 10,967 | | | | | | 2,808 | |
Professional fees | | | | | 12,882 | | | | | | 8,981 | | | | | | 5,066 | |
Trustees’ fees | | | | | 8,280 | | | | | | 5,072 | | | | | | 1,570 | |
Custody fees and expenses | | | | | 6,382 | | | | | | 5,957 | | | | | | 8,514 | |
Other | | | | | 13,558 | | | | | | 7,776 | | | | | | 1,896 | |
| | | | | | | | | | | | | | | | | | |
Total expenses | | | | | 769,988 | | | | | | 485,529 | | | | | | 191,495 | |
Less, expense waiver and/or
reimbursement (Note B) | | | | | (23,599 | ) | | | | | (47,134 | ) | | | | | (80,554 | ) |
| | | | | | | | | | | | | | | | | | |
Net expenses | | | | | 746,389 | | | | | | 438,395 | | | | | | 110,941 | |
| | | | | | | | | | | | | | | | | | |
Net investment income (loss) | | | | | 95,913 | | | | | | (82,329 | ) | | | | | (34,164 | ) |
| | | | | | | | | | | | | | | | | | |
| | | | | | |
Realized and Unrealized Gain (Loss) on Investments: | | | | | | | | | | | | | | | | | | |
Net realized gain on investments | | | | | 2,840,203 | | | | | | 1,882,599 | | | | | | 301,906 | |
Net change in unrealized
appreciation/depreciation on investments | | | | | (4,331,225 | ) | | | | | (1,010,548 | ) | | | | | (601,687 | ) |
| | | | | | | | | | | | | | | | | | |
| | | | | | |
Net realized and unrealized
gain (loss) on investments | | | | | (1,491,022 | ) | | | | | 872,051 | | | | | | (299,781 | ) |
| | | | | | | | | | | | | | | | | | |
| | | | | | |
Net Increase (Decrease) in Net Assets Resulting
from Operations | | | | $ | (1,395,109 | ) | | | | $ | 789,722 | | | | | $ | (333,945 | ) |
| | | | | | | | | | | | | | | | | | |
| | | | | | |
* Net of foreign taxes withheld | | | | $ | — | | | | | $ | — | | | | | $ | 268 | |
| | | | | | | | | | | | | | | | | | |
The accompanying notes are an integral part of these financial statements.
17
|
| STATEMENTSOF CHANGESIN NET ASSETS |
| | | | | | | | | | | | | | | | | | | | | | | | |
| | | | | LKCM Aquinas Value Fund | | | | | LKCM Aquinas Growth Fund | |
| | | | | | | | | | | | | | | | | | | | | | | | |
| | | | | Year Ended
December 31,
2015 | | | | | Year Ended
December 31,
2014 | | | | | Year Ended
December 31,
2015 | | | | | Year Ended
December 31,
2014 | |
Operations: | | | | | | | | | | | | | | | | | | | | | | | | |
Net investment income (loss) | | | | $ | 95,913 | | | | | $ | 558,967 | | | | | $ | (82,329 | ) | | | | $ | (154,305 | ) |
Net realized gain on investments | | | | | 2,840,203 | | | | | | 4,786,797 | | | | | | 1,882,599 | | | | | | 6,691,524 | |
Net change in unrealized
appreciation/depreciation on investments | | | | | (4,331,225 | ) | | | | | (3,575,491 | ) | | | | | (1,010,548 | ) | | | | | (6,149,001 | ) |
| | | | | | | | | | | | | | | | | | | | | | | | |
Net increase (decrease) in net assets resulting from operations | | | | | (1,395,109 | ) | | | | | 1,770,273 | | | | | | 789,722 | | | | | | 388,218 | |
| | | | | | | | | | | | | | | �� | | | | | | | | | |
| | | | | | | | |
Dividends and Distributions to Shareholders: | | | | | | | | | | | | | | | | | | | | | | | | |
Net investment income | | | | | (100,679 | ) | | | | | (547,931 | ) | | | | | — | | | | | | — | |
Net realized gain on investments | | | | | (3,123,858 | ) | | | | | (4,148,241 | ) | | | | | (1,641,652 | ) | | | | | (6,673,458 | ) |
| | | | | | | | | | | | | | | | | | | | | | | | |
| | | | | (3,224,537 | ) | | | | | (4,696,172 | ) | | | | | (1,641,652 | ) | | | | | (6,673,458 | ) |
| | | | | | | | | | | | | | | | | | | | | | | | |
| | | | | | | | |
Net decrease in net assets resulting from
Fund share transactions (Note C) | | | | | (3,164,344 | ) | | | | | (3,482,797 | ) | | | | | (3,895,863 | ) | | | | | (6,567,812 | ) |
| | | | | | | | | | | | | | | | | | | | | | | | |
| | | | | | | | |
Total decrease in net assets | | | | | (7,783,990 | ) | | | | | (6,408,696 | ) | | | | | (4,747,793 | ) | | | | | (12,853,052 | ) |
| | | | | | | | |
Net Assets: | | | | | | | | | | | | | | | | | | | | | | | | |
Beginning of period | | | | | 52,651,980 | | | | | | 59,060,676 | | | | | | 31,083,596 | | | | | | 43,936,648 | |
| | | | | | | | | | | | | | | | | | | | | | | | |
End of period* | | | | $ | 44,867,990 | | | | | $ | 52,651,980 | | | | | $ | 26,335,803 | | | | | $ | 31,083,596 | |
| | | | | | | | | | | | | | | | | | | | | | | | |
| | | | | | | | |
* Including accumulated net investment income of | | | | $ | 6,270 | | | | | $ | 11,036 | | | | | $ | — | | | | | $ | — | |
| | | | | | | | | | | | | | | | | | | | | | | | |
The accompanying notes are an integral part of these financial statements.
18
|
| STATEMENTSOF CHANGESIN NET ASSETS |
| | | | | | | | | | | | |
| | | | | LKCM Aquinas Small Cap Fund | |
| | | | | | | | | | | | |
| | | | | Year Ended
December 31,
2015 | | | | | Year Ended
December 31,
2014 | |
Operations: | | | | | | | | | | | | |
Net investment loss | | | | $ | (34,164 | ) | | | | $ | (104,580 | ) |
Net realized gain on investments | | | | | 301,906 | | | | | | 1,754,393 | |
Net change in unrealized
appreciation/depreciation on investments | | | | | (601,687 | ) | | | | | (2,448,267 | ) |
| | | | | | | | | | | | |
Net decrease in net assets resulting from operations | | | | | (333,945 | ) | | | | | (798,454 | ) |
| | | | | | | | | | | | |
| | | | |
Dividends and Distributions to Shareholders: | | | | | | | | | | | | |
Net realized gain on investments | | | | | (1,106,020 | ) | | | | | (1,153,966 | ) |
| | | | | | | | | | | | |
| | | | |
Net increase (decrease) in net assets resulting from
Fund share transactions (Note C) | | | | | 375,658 | | | | | | (5,292,103 | ) |
| | | | | | | | | | | | |
| | | | |
Total decrease in net assets | | | | | (1,064,307 | ) | | | | | (7,244,523 | ) |
| | | | |
Net Assets: | | | | | | | | | | | | |
Beginning of period | | | | | 7,428,909 | | | | | | 14,673,432 | |
| | | | | | | | | | | | |
End of period | | | | $ | 6,364,602 | | | | | $ | 7,428,909 | |
| | | | | | | | | | | | |
The accompanying notes are an integral part of these financial statements.
19
|
| FINANCIAL HIGHLIGHTS |
| SELECTED DATAFOR EACH SHAREOF CAPITAL STOCK OUTSTANDING |
| | | | | | | | | | | | | | | | | | | | | | | | | | | | | | |
| | | | | LKCM Aquinas Value Fund | |
| | | | | | | | | | | | | | | | | | | | | | | | | | | | | | |
| | | | | Year
Ended
December 31,
2015 | | | | | Year
Ended
December 31,
2014 | | | | | Year
Ended
December 31,
2013 | | | | | Year
Ended
December 31,
2012 | | | | | Year
Ended
December 31,
2011 | |
Net Asset Value – Beginning of Period | | | | $ | 16.87 | | | | | $ | 17.99 | | | | | $ | 14.18 | | | | | $ | 12.72 | | | | | $ | 12.68 | |
| | | | | | | | | | | | | | | | | | | | | | | | | | | | | | |
Net investment income | | | | | 0.03 | | | | | | 0.17 | (2) | | | | | 0.04 | (1) | | | | | 0.07 | (1) | | | | | 0.02 | (1) |
Net realized and unrealized gain (loss) on investments | | | | | (0.56 | ) | | | | | 0.34 | | | | | | 4.72 | | | | | | 1.46 | | | | | | 0.04 | |
| | | | | | | | | | | | | | | | | | | | | | | | | | | | | | |
Total from investment operations | | | | | (0.53 | ) | | | | | 0.51 | | | | | | 4.76 | | | | | | 1.53 | | | | | | 0.06 | |
| | | | | | | | | | | | | | | | | | | | | | | | | | | | | | |
Dividends from net investment income | | | | | (0.04 | ) | | | | | (0.19 | ) | | | | | (0.04 | ) | | | | | (0.07 | ) | | | | | (0.02 | ) |
Distributions from net realized gains | | | | | (1.13 | ) | | | | | (1.44 | ) | | | | | (0.91 | ) | | | | | — | | | | | | — | |
| | | | | | | | | | | | | | | | | | | | | | | | | | | | | | |
Total dividends and distributions | | | | | (1.17 | ) | | | | | (1.63 | ) | | | | | (0.95 | ) | | | | | (0.07 | ) | | | | | (0.02 | ) |
| | | | | | | | | | | | | | | | | | | | | | | | | | | | | | |
Net Asset Value – End of Period | | | | $ | 15.17 | | | | | $ | 16.87 | | | | | $ | 17.99 | | | | | $ | 14.18 | | | | | $ | 12.72 | |
| | | | | | | | | | | | | | | | | | | | | | | | | | | | | | |
Total Return | | | | | -3.28% | | | | | | 2.73% | | | | | | 33.60% | | | | | | 12.01% | | | | | | 0.46% | |
| | | | | | | | | | |
Ratios and Supplemental Data: | | | | | | | | | | | | | | | | | | | | | | | | | | | | | | |
Net assets, end of period (thousands) | | | | $ | 44,868 | | | | | $ | 52,652 | | | | | $ | 59,061 | | | | | $ | 46,902 | | | | | $ | 42,056 | |
Ratio of expenses to average net assets: | | | | | | | | | | | | | | | | | | | | | | | | | | | | | | |
Before expense waiver and/or reimbursement | | | | | 1.55% | | | | | | 1.49% | | | | | | 1.52% | | | | | | 1.54% | | | | | | 1.55% | |
After expense waiver and/or reimbursement | | | | | 1.50% | | | | | | 1.49% | | | | | | 1.50% | | | | | | 1.50% | | | | | | 1.50% | |
Ratio of net investment income to average net assets: | | | | | | | | | | | | | | | | | | | | | | | | | | | | | | |
Before expense waiver and/or reimbursement | | | | | 0.14% | | | | | | 0.95% | | | | | | 0.21% | | | | | | 0.44% | | | | | | 0.11% | |
After expense waiver and/or reimbursement | | | | | 0.19% | | | | | | 0.95% | | | | | | 0.23% | | | | | | 0.48% | | | | | | 0.16% | |
Portfolio turnover rate | | | | | 11% | | | | | | 23% | | | | | | 9% | | | | | | 28% | | | | | | 29% | |
| (1) | Net investment income per share is calculated using the ending balance of accumulated net investment income prior to considerations of adjustments for permanent book and tax differences. |
| (2) | Net investment income per share represents net investment income divided by the average shares outstanding throughout the period. |
| | | | | | | | | | | | | | | | | | | | | | | | | | | | | | |
| | | | | LKCM Aquinas Growth Fund | |
| | | | | | | | | | | | | | | | | | | | | | | | | | | | | | |
| | | | | Year
Ended
December 31,
2015 | | | | | Year
Ended
December 31,
2014 | | | | | Year
Ended
December 31,
2013 | | | | | Year
Ended
December 31,
2012 | | | | | Year
Ended
December 31,
2011 | |
Net Asset Value – Beginning of Period | | | | $ | 17.21 | | | | | $ | 21.44 | | | | | $ | 18.53 | | | | | $ | 16.86 | | | | | $ | 16.61 | |
| | | | | | | | | | | | | | | | | | | | | | | | | | | | | | |
Net investment loss | | | | | (0.05 | )(1) | | | | | (0.09 | )(1) | | | | | (0.13 | )(2) | | | | | (0.07 | )(1) | | | | | (0.10 | )(1) |
Net realized and unrealized gain on investments | | | | | 0.45 | | | | | | 0.43 | | | | | | 5.07 | | | | | | 1.84 | | | | | | 0.35 | |
| | | | | | | | | | | | | | | | | | | | | | | | | | | | | | |
Total from investment operations | | | | | 0.40 | | | | | | 0.34 | | | | | | 4.94 | | | | | | 1.77 | | | | | | 0.25 | |
| | | | | | | | | | | | | | | | | | | | | | | | | | | | | | |
Distributions from net realized gains | | | | | (1.09 | ) | | | | | (4.57 | ) | | | | | (2.03 | ) | | | | | (0.10 | ) | | | | | — | |
| | | | | | | | | | | | | | | | | | | | | | | | | | | | | | |
Net Asset Value – End of Period | | | | $ | 16.52 | | | | | $ | 17.21 | | | | | $ | 21.44 | | | | | $ | 18.53 | | | | | $ | 16.86 | |
| | | | | | | | | | | | | | | | | | | | | | | | | | | | | | |
Total Return | | | | | 2.19% | | | | | | 1.25% | | | | | | 26.74% | | | | | | 10.52% | | | | | | 1.51% | |
| | | | | | | | | | |
Ratios and Supplemental Data: | | | | | | | | | | | | | | | | | | | | | | | | | | | | | | |
Net assets, end of period (thousands) | | | | $ | 26,336 | | | | | $ | 31,084 | | | | | $ | 43,937 | | | | | $ | 35,315 | | | | | $ | 33,698 | |
Ratio of expenses to average net assets: | | | | | | | | | | | | | | | | | | | | | | | | | | | | | | |
Before expense waiver and/or reimbursement | | | | | 1.66% | | | | | | 1.60% | | | | | | 1.58% | | | | | | 1.58% | | | | | | 1.60% | |
After expense waiver and/or reimbursement | | | | | 1.50% | | | | | | 1.50% | | | | | | 1.50% | | | | | | 1.50% | | | | | | 1.50% | |
Ratio of net investment loss to average net assets: | | | | | | | | | | | | | | | | | | | | | | | | | | | | | | |
Before expense waiver and/or reimbursement | | | | | (0.44)% | | | | | | (0.51)% | | | | | | (0.69)% | | | | | | (0.44)% | | | | | | (0.71)% | |
After expense waiver and/or reimbursement | | | | | (0.28)% | | | | | | (0.41)% | | | | | | (0.61)% | | | | | | (0.36)% | | | | | | (0.61)% | |
Portfolio turnover rate | | | | | 21% | | | | | | 30% | | | | | | 44% | | | | | | 42% | | | | | | 50% | |
| (1) | Net investment loss per share is calculated using the ending balance of accumulated net investment loss prior to considerations of adjustments for permanent book and tax differences. |
| (2) | Net investment loss per share represents net investment loss divided by the average shares outstanding throughout the period. |
The accompanying notes are an integral part of these financial statements.
20
|
| FINANCIAL HIGHLIGHTS |
| SELECTED DATAFOR EACH SHAREOF CAPITAL STOCK OUTSTANDING |
| | | | | | | | | | | | | | | | | | | | | | | | | | | | | | |
| | | | | LKCM Aquinas Small Cap Fund | |
| | | | | | | | | | | | | | | | | | | | | | | | | | | | | | |
| | | | | Year
Ended
December 31,
2015 | | | | | Year
Ended
December 31,
2014 | | | | | Year
Ended
December 31,
2013 | | | | | Year
Ended
December 31,
2012 | | | | | Year
Ended
December 31,
2011 | |
Net Asset Value – Beginning of Period | | | | $ | 7.66 | | | | | $ | 9.39 | | | | | $ | 7.34 | | | | | $ | 7.35 | | | | | $ | 7.07 | |
| | | | | | | | | | | | | | | | | | | | | | | | | | | | | | |
Net investment loss | | | | | (0.04 | )(2) | | | | | (0.07 | )(2) | | | | | (0.07 | )(1) | | | | | (0.00 | )(1)(3) | | | | | (0.06 | )(1) |
Net realized and unrealized gain (loss) on investments | | | | | (0.30 | ) | | | | | (0.33 | ) | | | | | 2.45 | | | | | | 0.59 | | | | | | 0.34 | |
| | | | | | | | | | | | | | | | | | | | | | | | | | | | | | |
Total from investment operations | | | | | (0.34 | ) | | | | | (0.40 | ) | | | | | 2.38 | | | | | | 0.59 | | | | | | 0.28 | |
| | | | | | | | | | | | | | | | | | | | | | | | | | | | | | |
Distributions from net realized gains | | | | | (1.21 | ) | | | | | (1.33 | ) | | | | | (0.33 | ) | | | | | (0.60 | ) | | | | | — | |
| | | | | | | | | | | | | | | | | | | | | | | | | | | | | | |
Net Asset Value – End of Period | | | | $ | 6.11 | | | | | $ | 7.66 | | | | | $ | 9.39 | | | | | $ | 7.34 | | | | | $ | 7.35 | |
| | | | | | | | | | | | | | | | | | | | | | | | | | | | | | |
Total Return | | | | | -4.74% | | | | | | -4.54% | | | | | | 32.41% | | | | | | 8.16% | | | | | | 3.96% | |
| | | | | | | | | | |
Ratios and Supplemental Data: | | | | | | | | | | | | | | | | | | | | | | | | | | | | | | |
Net assets, end of period (thousands) | | | | $ | 6,365 | | | | | $ | 7,429 | | | | | $ | 14,673 | | | | | $ | 11,684 | | | | | $ | 11,037 | |
Ratio of expenses to average net assets: | | | | | | | | | | | | | | | | | | | | | | | | | | | | | | |
Before expense waiver and/or reimbursement | | | | | 2.59% | | | | | | 2.27% | | | | | | 2.25% | | | | | | 2.32% | | | | | | 2.44% | |
After expense waiver and/or reimbursement | | | | | 1.50% | | | | | | 1.50% | | | | | | 1.50% | | | | | | 1.50% | | | | | | 1.50% | |
Ratio of net investment loss to average net assets: | | | | | | | | | | | | | | | | | | | | | | | | | | | | | | |
Before expense waiver and/or reimbursement | | | | | (1.55)% | | | | | | (1.55)% | | | | | | (1.54)% | | | | | | (0.84)% | | | | | | (1.81)% | |
After expense waiver and/or reimbursement | | | | | (0.46)% | | | | | | (0.78)% | | | | | | (0.79)% | | | | | | (0.02)% | | | | | | (0.87)% | |
Portfolio turnover rate | | | | | 72% | | | | | | 66% | | | | | | 60% | | | | | | 82% | | | | | | 70% | |
| (1) | Net investment loss per share is calculated using the ending balance of accumulated net investment loss prior to considerations of adjustments for permanent book and tax differences. |
| (2) | Net investment loss per share represents net investment loss divided by the average shares outstanding throughout the period. |
The accompanying notes are an integral part of these financial statements.
21
|
| LKCM FUNDS |
| NOTESTOTHE FINANCIAL STATEMENTS |
A. Organization and Significant Accounting Policies: LKCM Funds (the “Trust”) is registered under the Investment Company Act of 1940 (“1940 Act”) as an open-end, management investment company. The Trust was organized as a Delaware statutory trust on February 10, 1994 and consists of eight diversified series, three of which are presented herein and include the LKCM Aquinas Value Fund, LKCM Aquinas Growth Fund and LKCM Aquinas Small Cap Fund (collectively, the “Funds”), the assets of which are invested in separate, independently managed portfolios. On July 11, 2005, the Funds acquired the assets and assumed the liabilities of the Aquinas Funds. The Funds are subject to expenses pursuant to the Rule 12b-1 plan described in Note B. Each Fund charges a 1% redemption fee for redemptions on Fund shares held for less than 30 days, unless otherwise determined by the Funds in their discretion.
The LKCM Aquinas Value Fund seeks to maximize long-term capital appreciation, while incorporating Catholic values investing principles in the investment process. The LKCM Aquinas Value Fund seeks to achieve its investment objective by investing under normal circumstances in equity securities of companies that Luther King Capital Management Corporation (the “Adviser”) believes to be undervalued relative to a company’s earnings. The LKCM Aquinas Growth Fund seeks to maximize long-term capital appreciation, while incorporating Catholic values investing principles in the investment process. The LKCM Aquinas Growth Fund seeks to achieve its investment objective by investing under normal circumstances in equity securities of companies that the Adviser believes generally have above-average growth in revenue and/or earnings, above-average returns on shareholders’ equity, and/or potential for above-average capital appreciation. The LKCM Aquinas Small Cap Fund seeks to maximize long-term capital appreciation, while incorporating Catholic values investing principles in the investment process. The LKCM Aquinas Small Cap Fund seeks to achieve its investment objective by investing under normal circumstances at least 80% of its net assets in equity securities of smaller companies (those with market capitalizations at the time of investment between $600 million and $4.5 billion) that the Adviser believes are likely to have above-average growth in revenue and/or earnings and potential for above-average capital appreciation.
The Funds practice socially responsible investing within the framework provided by the United States Conference of Catholic Bishops’ Socially Responsible Investing Guidelines (the “Guidelines”). Each Fund’s investment approach incorporates the Guidelines through a combination of screening portfolio companies based on criteria set forth in the Guidelines, dialogue with companies whose policies and practices may conflict with the Guidelines, and/or potentially excluding from each Fund’s portfolio the securities of those companies that are unwilling to alter their policies and practices over a reasonable period of time. The Adviser monitors companies selected for the Funds for policies on various issues contemplated by the Guidelines. If a Fund invests in a company whose policies and practices are inconsistent with the Guidelines, the Adviser may attempt to influence the company, sell the company’s securities or otherwise exclude future investments in such company.
The following is a summary of significant accounting policies followed by the Funds in preparation of the financial statements. The Funds are investment companies and, accordingly, follow the investment company accounting and reporting guidance of the Financial Accounting Standards Board Accounting Standards Codification Topic 946, Investment Companies.
1. Security Valuation: Equity securities listed or traded on a U.S. securities exchange for which market quotations are readily available are valued at the last quoted sale price on the exchange on which the security is primarily traded. Nasdaq Global Market securities are valued at the Nasdaq Official Closing Price (“NOCP”). Unlisted U.S. securities and listed U.S. securities not traded on a particular valuation date are valued at the mean of the most recent quoted bid and ask price on the relevant exchanges or markets. Equity securities listed on a foreign exchange for which market quotations are readily available are valued at the last quoted sales price on the exchange on which the security is primarily traded. Debt securities are normally valued at the mean of the closing bid and ask price and/or by using a combination of broker quotations or evaluated prices provided by an independent pricing service. Other assets and securities for which no market or broker quotations or evaluated prices are readily available (including restricted securities) are valued in good faith at fair value using guidelines approved by the Board of Trustees. The Board has adopted specific guidelines and procedures for valuing portfolio securities and delegated their implementation to the Adviser. The guidelines and procedures authorize the Adviser to make determinations regarding the fair value of a portfolio security and to report such determinations to the Board of Trustees. The Funds may use prices provided by independent pricing services to assist in the fair valuation of the Funds’ portfolio securities.
The Trust has adopted accounting standards which establish an authoritative definition of fair value and set out a hierarchy for measuring fair value. These standards require additional disclosures about the various inputs and valuation techniques used to develop the measurements of fair value and a discussion of changes in valuation techniques and related inputs during the period. These standards define fair value as the price that would be received to sell an asset or paid to transfer a liability in an orderly transaction between market participants at the measurement date. The fair value hierarchy is organized into three levels based upon the assumptions (referred to as “inputs”) used in pricing the asset or liability. These standards state that “observable inputs” reflect the assumptions market participants would use in pricing the asset or liability based on market data obtained from independent sources and “unobservable inputs” reflect an entity’s own assumptions about the assumptions market participants would use in pricing the asset or liability. These inputs are summarized in the three broad levels listed below.
22
| | | | |
| Level 1 | | – | | Quoted unadjusted prices for identical instruments in active markets to which the Trust has access at the date of measurement. |
| Level 2 | | – | | Quoted prices for similar instruments in active markets; quoted prices for identical or similar instruments in markets that are not active; and model-derived valuations in which all significant inputs and significant value drivers are observable in active markets. Level 2 inputs are those in markets for which there are few transactions, the prices are not current, little public information exists or instances where prices vary substantially over time or among brokered market makers. |
| Level 3 | | – | | Model derived valuations in which one or more significant inputs or significant value drivers are unobservable. Unobservable inputs are those inputs that reflect the Trust’s own assumptions that market participants would use to price the asset or liability based on the best available information. |
The inputs or methodology used for valuing securities are not necessarily an indication of the risk associated with investing in those securities. As of December 31, 2015, the Funds’ assets carried at fair value were classified as follows:
| | | | | | | | | | | | | | | | |
| LKCM Aquinas Value Fund | | | | | | | | | | | | |
Description | | Level 1 | | | Level 2 | | | Level 3 | | | Total | |
Common Stocks | | $ | 42,725,358 | | | $ | — | | | $ | — | | | $ | 42,725,358 | |
Money Market Funds | | | 2,234,813 | | | | — | | | | — | | | | 2,234,813 | |
| | | | | | | | | | | | | | | | |
Total Investments* | | $ | 44,960,171 | | | $ | — | | | $ | — | | | $ | 44,960,171 | |
| | | | | | | | | | | | | | | | |
| | | | |
| LKCM Aquinas Growth Fund | | | | | | | | | | | | |
Description | | Level 1 | | | Level 2 | | | Level 3 | | | Total | |
Common Stocks | | $ | 25,730,001 | | | $ | — | | | $ | — | | | $ | 25,730,001 | |
Money Market Funds | | | 687,672 | | | | — | | | | — | | | | 687,672 | |
| | | | | | | | | | | | | | | | |
Total Investments* | | $ | 26,417,673 | | | $ | — | | | $ | — | | | $ | 26,417,673 | |
| | | | | | | | | | | | | | | | |
| | | | |
| LKCM Aquinas Small Cap Fund | | | | | | | | | | | | |
Description | | Level 1 | | | Level 2 | | | Level 3 | | | Total | |
Common Stocks | | $ | 6,118,553 | | | $ | — | | | $ | — | | | $ | 6,118,553 | |
Money Market Funds | | | 242,946 | | | | — | | | | — | | | | 242,946 | |
| | | | | | | | | | | | | | | | |
Total Investments* | | $ | 6,361,499 | | | $ | — | | | $ | — | | | $ | 6,361,499 | |
| | | | | | | | | | | | | | | | |
| | * | Additional information regarding the industry classifications of these investments is disclosed in the Schedule of Investments. |
There were no transfers into or out of Level 1, Level 2 or Level 3 fair value measurements during the reporting period. Transfers between levels are recognized at the end of the reporting period.
2. Federal Income Taxes: The Funds have elected to be treated as “regulated investment companies” under Subchapter M of the Internal Revenue Code and each Fund intends to distribute all of its investment company net taxable income and net capital gains to shareholders. Therefore, no federal income tax provision is recorded.
3. Distributions to Shareholders: The LKCM Aquinas Value, LKCM Aquinas Growth and LKCM Aquinas Small Cap Funds generally intend to pay dividends and net capital gain distributions, if any, at least on an annual basis.
4. Foreign Securities: Investing in securities of foreign companies and foreign governments involves special risks and considerations not typically associated with investing in U.S. companies and securities of the U.S. government. These risks include devaluation of currencies and future adverse political and economic developments. Moreover, securities of many foreign companies and foreign governments and their markets may be less liquid and their prices more volatile than those of securities of comparable U.S. companies and securities of the U.S. government.
5. Expense Allocation: Expenses incurred by the Funds are allocated among the Funds based upon (i) relative average net assets, (ii) a specific identification basis as incurred, or (iii) evenly among the Funds, depending on the nature of the expense.
6. Use of Estimates: The preparation of financial statements in conformity with accounting principles generally accepted in the United States of America requires management to make estimates and assumptions that affect the reported amounts of assets and liabilities and disclosure of contingent assets and liabilities at the date of the financial statements and the reported amounts of revenues and expenses during the reporting period. Actual results could differ from those estimates.
7. Guarantees and Indemnifications: In the normal course of business, the Funds enter into contracts with service providers that contain general indemnification clauses. The Funds’ maximum exposure under these arrangements is unknown as this would involve future claims against the Funds that have not yet occurred. Based on experience, the Funds expect the risk of loss to be remote.
23
8. Security Transactions and Investment Income: Security and shareholder transactions are recorded on the trade date. Realized gains and losses on sales of investments are calculated on the identified cost basis. Dividend income and dividends and distributions to shareholders are recorded on the ex-dividend date. Withholding taxes on foreign dividends have been provided for in accordance with the Funds’ understanding of the applicable country’s tax rules and rates. Interest income is recognized on the accrual basis. All discounts and premiums are amortized based on the effective interest method for tax and financial reporting purposes. The Funds may hold the securities of real estate investment trusts (“REITs”). Distributions from such investments may include income, capital gains and return of capital.
9. Other: Generally accepted accounting principles require that certain components of net assets be adjusted to reflect permanent differences between financial and tax reporting. These reclassifications have no effect on net assets or net asset values per share.
Accordingly, at December 31, 2015, reclassifications were as follows:
| | | | | | | | | | | | |
| | | LKCM
Aquinas
Value Fund | | | LKCM
Aquinas
Growth Fund | | | LKCM
Aquinas Small
Cap Fund | |
Accumulated net investment income | | $ | — | | | $ | 82,329 | | | $ | 34,164 | |
Accumulated Loss | | | (557,131 | ) | | | (246,019 | ) | | | (321,757 | ) |
Paid in capital | | | 557,131 | | | | 163,690 | | | | 287,593 | |
10. Restricted and Illiquid Securities: The Funds are permitted to invest in securities that are subject to legal or contractual restrictions on resale or are illiquid. Restricted securities generally may be resold in transactions exempt from registration. A security may be considered illiquid if it lacks a readily available market or if its valuation has not changed for a certain period of time. Disposal of these securities may involve time-consuming negotiations and expense, and prompt sale at the current valuation may be difficult.
B. Investment Advisory and Other Agreements: Luther King Capital Management Corporation (the “Adviser”) serves as the investment adviser to the Funds under an Investment Advisory Agreement (the “Agreement”). The Adviser receives a fee, computed daily and payable quarterly, at the annual rates presented below as applied to each Fund’s average daily net assets. The Adviser has contractually agreed to waive all or a portion of its management fee and/or reimburse expenses of the Funds through April 30, 2016 in order to limit each Fund’s operating expenses to the annual cap rates identified below. This expense limitation excludes interest, taxes, brokerage commissions, indirect fees and expenses relating to investments in other investment companies, including money market funds, and extraordinary expenses. For the year ended December 31, 2015, the Adviser waived the following management fees and/or reimbursed expenses to meet its expense cap obligations:
| | | | | | | | | | | | |
| | | LKCM
Aquinas
Value Fund | | | LKCM
Aquinas
Growth Fund | | | LKCM
Aquinas Small
Cap Fund | |
Annual Management Fee Rate | | | 0.90% | | | | 0.90% | | | | 1.00% | |
Annual Cap on Expenses | | | 1.50% | | | | 1.50% | | | | 1.50% | |
Fees Waived and/or Expenses Reimbursed in 2015 | | | $23,599 | | | | $47,134 | | | | $80,554 | |
U.S. Bancorp Fund Services, LLC serves as transfer agent and administrator for the Trust and serves as accounting services agent for the Funds. U.S. Bank, N.A. serves as custodian for the Funds.
Distribution services are performed pursuant to a distribution contract with Quasar Distributors, LLC, the Trust’s principal underwriter.
The LKCM Funds have adopted a Rule 12b-1 plan for the LKCM Aquinas Value, LKCM Aquinas Growth and LKCM Aquinas Small Cap Funds, under which each Fund may pay up to 1.00% of its average daily net assets for distribution and other services. However, the Board of Trustees has currently only authorized a fee of 0.25% of the average daily net assets for the LKCM Aquinas Value, LKCM Aquinas Growth and LKCM Aquinas Small Cap Funds. For the year ended December 31, 2015, fees incurred by the LKCM Aquinas Value, LKCM Aquinas Growth and LKCM Aquinas Small Cap Funds pursuant to the 12b-1 Plan were $124,398, $73,066, and $18,490, respectively.
24
C. Fund Shares: At December 31, 2015, there was an unlimited number of shares of beneficial interest, no par value, authorized. The following table summarizes the activity in shares of each Fund:
| | | | | | | | | | | | | | | | |
| Aquinas Value Fund | | | | | | | | | | | | |
| | | Year Ended
December 31, 2015 | | | Year Ended
December 31, 2014 | |
| | | Shares | | | Amount | | | Shares | | | Amount | |
Shares sold | | | 565,895 | | | $ | 9,525,123 | | | | 481,234 | | | $ | 8,649,355 | |
Shares issued to shareholders in
reinvestment of distributions | | | 191,725 | | | | 2,958,315 | | | | 251,947 | | | | 4,303,201 | |
Shares redeemed | | | (921,665 | ) | | | (15,647,910 | ) | | | (895,608 | ) | | | (16,435,642 | ) |
Redemption fee | | | | | | | 128 | | | | | | | | 289 | |
| | | | | | | | | | | | | | | | |
Net decrease | | | (164,045 | ) | | $ | (3,164,344 | ) | | | (162,427 | ) | | $ | (3,482,797 | ) |
| | | | | | | | | | | | | | | | |
Shares Outstanding: | | | | | | | | | | | | | | | | |
Beginning of period | | | 3,121,255 | | | | | | | | 3,283,682 | | | | | |
| | | | | | | | | | | | | | | | |
End of period | | | 2,957,210 | | | | | | | | 3,121,255 | | | | | |
| | | | | | | | | | | | | | | | |
| | | | |
| Aquinas Growth Fund | | | | | | | | | | | | |
| | | Year Ended
December 31, 2015 | | | Year Ended
December 31, 2014 | |
| | | Shares | | | Amount | | | Shares | | | Amount | |
Shares sold | | | 161,029 | | | $ | 2,800,797 | | | | 141,239 | | | $ | 2,972,887 | |
Shares issued to shareholders in reinvestment of distributions | | | 86,945 | | | | 1,464,551 | | | | 353,769 | | | | 6,183,269 | |
Shares redeemed | | | (460,277 | ) | | | (8,161,230 | ) | | | (737,779 | ) | | | (15,724,066 | ) |
Redemption fee | | | | | | | 19 | | | | | | | | 98 | |
| | | | | | | | | | | | | | | | |
Net decrease | | | (212,303 | ) | | $ | (3,895,863 | ) | | | (242,771 | ) | | $ | (6,567,812 | ) |
| | | | | | | | | | | | | | | | |
Shares Outstanding: | | | | | | | | | | | | | | | | |
Beginning of period | | | 1,806,252 | | | | | | | | 2,049,023 | | | | | |
| | | | | | | | | | | | | | | | |
End of period | | | 1,593,949 | | | | | | | | 1,806,252 | | | | | |
| | | | | | | | | | | | | | | | |
| | | | |
| Aquinas Small Cap Fund | | | | | | | | | | | | |
| | | Year Ended
December 31, 2015 | | | Year Ended
December 31, 2014 | |
| | | Shares | | | Amount | | | Shares | | | Amount | |
Shares sold | | | 298,922 | | | $ | 2,369,397 | | | | 238,715 | | | $ | 2,172,452 | |
Shares issued to shareholders in reinvestment of distributions | | | 167,677 | | | | 1,046,300 | | | | 135,998 | | | | 1,060,787 | |
Shares redeemed | | | (393,895 | ) | | | (3,040,051 | ) | | | (967,697 | ) | | | (8,525,990 | ) |
Redemption fee | | | | | | | 12 | | | | | | | | 648 | |
| | | | | | | | | | | | | | | | |
Net increase (decrease) | | | 72,704 | | | $ | 375,658 | | | | (592,984 | ) | | $ | (5,292,103 | ) |
| | | | | | | | | | | | | | | | |
Shares Outstanding: | | | | | | | | | | | | | | | | |
Beginning of period | | | 969,624 | | | | | | | | 1,562,608 | | | | | |
| | | | | | | | | | | | | | | | |
End of period | | | 1,042,328 | | | | | | | | 969,624 | | | | | |
| | | | | | | | | | | | | | | | |
D. Security Transactions: Purchases and sales of investment securities, other than short-term investments, for the year ended December 31, 2015 were as follows:
| | | | | | | | | | | | | | | | |
| | | Purchases | | | Sales | |
| | | U.S.
Government | | | Other | | | U.S.
Government | | | Other | |
LKCM Aquinas Value Fund | | $ | — | | | $ | 5,250,858 | | | $ | — | | | $ | 12,966,356 | |
LKCM Aquinas Growth Fund | | | — | | | | 6,036,105 | | | | — | | | | 12,331,929 | |
LKCM Aquinas Small Cap Fund | | | — | | | | 5,056,585 | | | | — | | | | 6,084,962 | |
25
E. Tax Information: At December 31, 2015, the components of accumulated earnings (losses) on a tax basis were as follows:
| | | | | | | | | | | | |
| | | LKCM
Aquinas
Value
Fund | | | LKCM
Aquinas
Growth
Fund | | | LKCM
Aquinas
Small Cap
Fund | |
Cost of Investments | | $ | 28,516,815 | | | $ | 16,259,715 | | | $ | 5,367,526 | |
| | | | | | | | | | | | |
Gross Unrealized Appreciation | | $ | 16,845,859 | | | $ | 10,221,144 | | | $ | 1,137,124 | |
Gross Unrealized Depreciation | | | (402,503 | ) | | | (63,186 | ) | | | (143,151 | ) |
| | | | | | | | | | | | |
Net Unrealized Appreciation | | $ | 16,443,356 | | | $ | 10,157,958 | | | $ | 993,973 | |
| | | | | | | | | | | | |
Undistributed Ordinary Income | | $ | 6,270 | | | $ | — | | | $ | — | |
Undistributed Long-Term Capital Gain | | | — | | | | 142,073 | | | | — | |
| | | | | | | | | | | | |
Total Distributable Earnings | | $ | 6,270 | | | $ | 142,073 | | | $ | — | |
| | | | | | | | | | | | |
Other Accumulated Loss | | $ | (199,596 | ) | | $ | — | | | $ | (23,931 | ) |
| | | | | | | | | | | | |
Total Accumulated Gains | | $ | 16,250,030 | | | $ | 10,300,031 | | | $ | 970,042 | |
| | | | | | | | | | | | |
The difference between book-basis and tax-basis unrealized appreciation, if any, is attributable primarily to the tax deferral of losses on wash sales.
To the extent the Funds realize future net capital gains, taxable distributions will be reduced by any unused capital loss carryforwards as permitted by the Internal Revenue Code. The Funds currently have no unused capital loss carryforwards.
At December 31, 2015, the LKCM Aquinas Value Fund and the LKCM Aquinas Small Cap Fund deferred, on a tax basis, post-October capital losses of $199,596 and $23,931, respectively.
The tax components of dividends paid during the periods shown below were as follows:
| | | | | | | | | | | | | | | | |
| | | Year Ended December 31, 2015 | | | Year Ended December 31, 2014 | |
| | | Ordinary
Income | | | Long-Term
Capital Gains | | | Ordinary
Income | | | Long-Term
Capital Gains | |
LKCM Aquinas Value Fund | | $ | 100,679 | | | $ | 3,123,858 | | | $ | 550,565 | | | $ | 4,145,607 | |
LKCM Aquinas Growth Fund | | | — | | | | 1,641,652 | | | | — | | | | 6,673,458 | |
LKCM Aquinas Small Cap Fund | | | — | | | | 1,106,020 | | | | — | | | | 1,153,966 | |
The Funds designated as long-term capital gain dividend, pursuant to Internal Revenue Code Section 852(b)(3), the amount necessary to reduce earnings and profits of the Funds related to net capital gain to zero for the tax years ended December 31, 2015 and 2014. The Funds designated earnings and profits distributed to shareholders upon the redemption of shares during 2015 in determining undistributed net capital gains as of December 31, 2015.
The Trust has adopted financial reporting rules regarding recognition and measurement of tax positions taken or expected to be taken on a tax return. The Trust has reviewed all open tax years and major jurisdictions and concluded that there is no impact on the Funds’ financial position or results of operations. Tax years that remain open to examination by major tax jurisdictions include tax years ended December 31, 2012 through December 31, 2015. There is no tax liability resulting from unrecognized tax benefits relating to uncertain income tax positions taken or expected to be taken on tax returns as of December 31, 2015. The Funds are not aware of any tax positions for which it is reasonably possible that the total amounts of unrecognized tax benefits will significantly change in the next twelve months. If applicable, the Funds would recognize interest accrued related to unrecognized tax benefits in “interest expense” and penalties in “other expense” on the statement of operations.
F. Recent Accounting Pronouncements: In May 2015, the Financial Accounting Standards Board (“FASB”) issued Accounting Standards Update (“ASU”) No. 2015-07 “Disclosure for Investments in Certain Entities that Calculate Net Asset Value per Share (or Its Equivalent)”. The amendments in ASU No. 2015-07 remove the requirement to categorize within the fair value hierarchy investments measured using the NAV practical expedient. The ASU also removes certain disclosure requirements for investments that qualify, but do not utilize, the NAV practical expedient. The amendments in the ASU are effective for fiscal years beginning after December 15, 2015, and interim periods within those fiscal years. Management is currently evaluating the impact these changes will have on the Fund’s financial statements and related disclosures.
G. Subsequent Events: In preparing these financial statements, the Trust has evaluated events after December 31, 2015 and determined that there were no significant subsequent events that would require adjustment to or additional disclosure in these financial statements.
26
|
| REPORTOF INDEPENDENT REGISTERED PUBLIC ACCOUNTING FIRM |
To the Shareholders and Board of Trustees of LKCM Funds:
We have audited the accompanying statements of assets and liabilities, including the schedules of investments, of LKCM Aquinas Funds (the “Funds”) comprising the LKCM Aquinas Value Fund, LKCM Aquinas Growth Fund, and LKCM Aquinas Small Cap Fund as of December 31, 2015, and the related statements of operations for the year then ended, the statements of changes in net assets for each of the two years in the period then ended, and the financial highlights for each of the five years in the period then ended. These financial statements and financial highlights are the responsibility of the Funds’ management. Our responsibility is to express an opinion on these financial statements and financial highlights based on our audits.
We conducted our audits in accordance with the standards of the Public Company Accounting Oversight Board (United States). Those standards require that we plan and perform the audit to obtain reasonable assurance about whether the financial statements and financial highlights are free of material misstatement. The Funds are not required to have, nor were we engaged to perform, an audit of their internal control over financial reporting. Our audits included consideration of internal control over financial reporting as a basis for designing audit procedures that are appropriate in the circumstances, but not for the purpose of expressing an opinion on the effectiveness of the Funds’ internal control over financial reporting. Accordingly, we express no such opinion. An audit also includes examining, on a test basis, evidence supporting the amounts and disclosures in the financial statements, assessing the accounting principles used and significant estimates made by management, as well as evaluating the overall financial statement presentation. Our procedures included confirmation of securities owned as of December 31, 2015, by correspondence with the custodian and brokers; when replies were not received from brokers, we performed other auditing procedures. We believe that our audits provide a reasonable basis for our opinion.
In our opinion, the financial statements and financial highlights referred to above present fairly, in all material respects, the financial position of each of the portfolios constituting the LKCM Aquinas Funds as of December 31, 2015, the results of their operations for the year then ended, the changes in their net assets for each of the two years in the period then ended, and the financial highlights for each of the five years in the period then ended in conformity with accounting principles generally accepted in the United States of America.

Milwaukee, Wisconsin
February 19, 2016
27
|
| LKCM FUNDS |
| ADDITIONAL INFORMATION |
December 31, 2015 |
Availability of Proxy Voting Information: A description of the policies and procedures that the Funds use to determine how to vote proxies relating to their portfolio securities, as well as information regarding how the Funds voted proxies relating to portfolio securities during the most recent 12-month period ended June 30, is available without charge, upon request, by calling toll-free 1-800-688-LKCM or on the SEC website at http://www.sec.gov.
The actual voting records relating to portfolio securities during the twelve month period ended June 30 (as filed with the SEC on Form N-PX) are available without charge, upon request, by calling the Funds toll free at 1-800-688-LKCM or by accessing the SEC’s website at www.sec.gov.
Availability of Quarterly Portfolio Schedule: The Funds’ are required to file complete schedules of portfolio holdings with the SEC for the first and third fiscal quarters on Form N-Q. Once filed, the Funds’ Form N-Q is available without charge upon request on the SEC’s website (http://www.sec.gov) and is also available by calling 1-800-688-LKCM. You can also review and copy the Funds’ Form N-Q by visiting the SEC’s Public Reference Room in Washington, DC (information on the operation of the Public Reference Room may be obtained by calling 1-800-SEC-0330).
28
Information about the Funds’ Trustees and Officers:
The business and affairs of the Funds are managed under the direction of the Funds’ Board of Trustees. Information pertaining to the Trustees of the Funds is set forth below. The Statement of Additional Information includes additional information about the Funds’ Trustees and officers and is available, without charge, upon request by calling 1-800-688-LKCM.
| | | | | | | | | | |
Name, Address and Age | | Position(s) Held with the Trust | | Term of Office & Length of Time Served(1) | | Principal Occupation During Past Five Years | | Number of
Portfolios in
Fund Complex
Overseen by Trustee | | Other Directorships Held by Trustee |
| Disinterested Trustees: | | | | | | | | | | |
H. Kirk Downey 301 Commerce Street Suite 1600 Fort Worth, TX 76102 Year of Birth: 1942 | | Chairman of the Board of Trustees Trustee | | Since 2005 Since 1994 | | President and CEO, Texas Systems, LLC and CEO, Texas learning systems LLC since 1999 (education companies); Dean, M.J. Neeley School of Business, Texas Christian University Business School from 1987 to 1999. | | 8 | | AZZ Incorporated |
Earle A. Shields, Jr. 301 Commerce Street Suite 1600 Fort Worth, TX 76102 Year of Birth: 1920 | | Trustee | | Since 1994 | | Consultant; formerly Consultant for NASDAQ Corp. and Vice President, Merrill Lynch & Co., Inc. | | 8 | | None |
Richard J. Howell 301 Commerce Street Suite 1600 Fort Worth, TX 76102 Year of Birth: 1942 | | Trustee Chairman of the Audit and Compliance Committee | | Since 2005 Since 2008 | | CPA; Adjunct Faculty at SMU Cox School of Business from 2004 to 2009; Consulting Services, since 2002; Audit Partner, Arthur Andersen LLP from 1974 to 2002. | | 8 | | Red Robin Gourmet Burgers, Inc. |
Larry J. Lockwood 301 Commerce Street Suite 1600 Fort Worth, TX 76102 Year of Birth: 1953 | | Trustee | | Since 2013 | | C.R. Williams Professor of Finance, Stan Block Endowed Chair in Finance, Department of Finance, Neeley School of Business, Texas Christian University since 1994. | | 8 | | None |
| Interested Trustees: | | | | | | | | | | |
J. Luther King, Jr.(2) 301 Commerce Street Suite 1600 Fort Worth, TX 76102 Year of Birth: 1940 | | Trustee, President and Chief Executive Officer | | Since 1994 | | Chairman, President and Director, Luther King Capital Management Corporation since 1979. | | 8 | | Tyler Technologies, Inc. |
Steve R. Purvis(2) 301 Commerce Street Suite 1600 Fort Worth, TX 76102 Year of Birth: 1964 | | Trustee Vice President | | Since 2013
Since 2000 | | Principal, Luther King Capital Management since 2004, Vice President and Portfolio Manager, Luther King Capital Management since 1996. | | 8 | | AZZ Incorporated |
| (1) | Each Trustee holds office during the lifetime of the Trust until that individual resigns, retires or is otherwise removed or replaced. |
| (2) | Messrs. King and Purvis are each considered an “interested person” of the Trust (as defined in the 1940 Act) because of their affiliation with the Adviser. |
29
Information about the Funds’ Trustees and Officers, Continued
| | | | | | |
Name, Address and Age | | Position(s) Held with the Trust | | Term of Office & Length of Time Served(1) | | Principal Occupation During Past Five Years |
| Officers: | | | | | | |
J. Luther King, Jr.(2) 301 Commerce Street Suite 1600 Fort Worth, TX 76102 Year of Birth: 1940 | | Trustee, President and Chief Executive Officer | | Since 1994 | | Chairman, President and Director, Luther King Capital Management Corporation since 1979. |
Steven R. Purvis(2) 301 Commerce Street Suite 1600 Fort Worth, TX 76102 Year of Birth: 1964 | | Trustee Vice President | | Since 2013 Since 2000 | | Principal, Luther King Capital Management since 2004, Vice President and Portfolio Manager, Luther King Capital Management since 1996. |
Paul W. Greenwell 301 Commerce Street Suite 1600 Fort Worth, TX 76102 Year of Birth: 1950 | | Vice President | | Since 1996 | | Principal, Luther King Capital Management since 1986, Vice President and Portfolio Manager, Luther King Capital Management since 1983. |
Richard Lenart 301 Commerce Street Suite 1600 Fort Worth, TX 76102 Year of Birth: 1966 | | Secretary and Treasurer | | Since 2006 | | Luther King Capital Management since 2005. |
Jacob D. Smith 301 Commerce Street Suite 1600 Fort Worth, TX 76102 Year of Birth: 1974 | | Chief Financial Officer Chief Compliance Officer | | Since 2010 Since 2006 | | Chief Financial Officer since 2010, General Counsel and Chief Compliance Officer, Luther King Capital Management since 2006. Principal, Luther King Capital Management since 2013. |
| (1) | Each Trustee holds office during the lifetime of the Trust until that individual resigns, retires or is otherwise removed or replaced. |
| (2) | Messrs. King and Purvis are each considered an “interested person” of the Trust (as defined in the 1940 Act) because of their affiliation with the Adviser. |
30
LKCM FUNDS
PRIVACY NOTICE
Our Commitment to Your Privacy
At LKCM Funds, we are committed to safeguarding the confidentiality and privacy of nonpublic personal information about our current and former shareholders. This privacy notice describes the policies and procedures we have implemented to protect the privacy of your nonpublic personal information as well as the sources through which we may obtain nonpublic personal information about you.
How We Protect Your Nonpublic Personal Information
Protecting your nonpublic personal information is an important priority at LKCM Funds. Accordingly, we have implemented policies and procedures designed to safeguard your nonpublic personal information, such as your tax identification number, account and investment history, account numbers, account balances and nonpublic contact information, from unauthorized access. Pursuant to these policies and procedures, we maintain various physical, technological, and administrative safeguards to protect the security and confidentiality of your nonpublic personal information, and we adapt these safeguards to respond to evolving technological and other standards.
We do not disclose nonpublic personal information about you to outside firms, organizations or individuals except as authorized by you or your representatives or as required or permitted by law. We may disclose nonpublic personal information about you to nonaffiliated third parties, such as custodians, brokers, auditors, accountants, and systems and administrative service providers, in connection with the services we provide to you or on your behalf. When we provide nonpublic personal information about you to nonaffiliated third parties for these purposes, we expect them to safeguard your nonpublic personal information, use your nonpublic personal information only for the intended purposes and otherwise abide by applicable law.
How We Obtain Your Nonpublic Personal Information
We collect nonpublic personal information about you from various sources, including documents, new account applications and other information that you or your representatives, custodians, attorneys, accountants or similar parties provide to us, communications that we have with you or your representatives, custodians, attorneys, accountants or similar parties, and documents and other information related to your accounts or investment experience with us.
Please do not hesitate to contact Jacob D. Smith, our Chief Compliance Officer, if you have any questions regarding the measures we have implemented to protect the privacy of your nonpublic personal information.
U.S. Bancorp Fund Services, LLC
P.O. Box 701
Milwaukee, WI 53201-0701
LKCM FUNDS
P.O. Box 701
Milwaukee, WI 53201-0701
| | | | |
Officers and Trustees | | | | |
J. Luther King, Jr., CFA, CIC | | H. Kirk Downey | | Larry J. Lockwood |
Trustee, President | | Chairman of the Board | | Trustee |
| | |
Paul W. Greenwell | | Richard J. Howell | | Richard Lenart |
Vice President | | Trustee | | Secretary & Treasurer |
| | |
Steven R. Purvis, CFA | | Earle A. Shields, Jr. | | Jacob D. Smith |
Trustee, Vice President | | Trustee | | Chief Financial Officer |
| | | | | Chief Compliance Officer |
Investment Adviser | | | | |
Luther King Capital Management Corporation | | |
301 Commerce Street, Suite 1600 | | | | |
Fort Worth, TX 76102 | | | | |
Administrator, Transfer Agent, Dividend Paying Agent & Shareholder Servicing Agent | | |
U.S. Bancorp Fund Services, LLC | | | | |
P.O. Box 701 | | | | |
Milwaukee, WI 53201-0701 | | | | |
Custodian | | | | |
U.S. Bank, N.A. | | | | |
1555 N. River Center Drive, Suite 302 | | | | |
Milwaukee, WI 53212 | | | | |
Independent Registered Public Accounting Firm | | |
Deloitte & Touche LLP | | | | |
555 E. Wells St., Suite 1400 | | | | |
Milwaukee, WI 53202 | | | | |
Distributor | | | | |
Quasar Distributors, LLC | | | | |
615 E. Michigan Street | | | | |
Milwaukee, WI 53202 | | | | |
Item 2. Code of Ethics.
The registrant has adopted a code of ethics that applies to the registrant’s principal executive officer and principal financial officer. The registrant has not made any amendments to its code of ethics during the period covered by this report. The registrant has not granted any waivers from any provisions of the code of ethics during the period covered by this report.
A copy of the registrant’s Code of Ethics is filed herewith.
Item 3. Audit Committee Financial Expert.
The registrant’s board of trustees has determined that there is at least one audit committee financial expert serving on its audit committee. Richard J. Howell is the “audit committee financial expert” and is considered to be “independent” as each term is defined in Item 3 of Form N-CSR.
Item 4. Principal Accountant Fees and Services.
The registrant has engaged its principal accountant to perform audit services, audit-related services, tax services and other services during the past two fiscal years. “Audit services” refer to performing an audit of the registrant’s annual financial statements or services that are normally provided by the accountant in connection with statutory and regulatory filings or engagements for those fiscal years. “Audit-related services” refer to the assurance and related services by the principal accountant that are reasonably related to the performance of the audit. “Tax services” refer to professional services rendered by the principal accountant for tax compliance, tax advice, and tax planning. The following table details the aggregate fees billed or expected to be billed for each of the last two fiscal years for audit fees, audit-related fees, tax fees and other fees by the principal accountant.
| | | | | | | | |
| | | FYE 12/31/2015 | | | FYE 12/31/2014 | |
Audit Fees | | $ | 146,700 | | | $ | 147,000 | |
Audit-Related Fees | | $ | 0 | | | $ | 0 | |
Tax Fees | | $ | 34,550 | | | $ | 30,625 | |
All Other Fees | | $ | 0 | | | $ | 0 | |
The audit committee has adopted pre-approval policies and procedures that require the audit committee to pre-approve all audit and non-audit services of the registrant, including services provided to any entity affiliated with the registrant.
The percentage of fees billed by Deloitte & Touche LLP applicable to non-audit services pursuant to waiver of pre-approval requirement were as follows:
| | | | | | | | |
| | | FYE 12/31/2015 | | | FYE 12/31/2014 | |
Audit-Related Fees | | | 0 | % | | | 0 | % |
Tax Fees | | | 0 | % | | | 0 | % |
All Other Fees | | | 0 | % | | | 0 | % |
1
All of the principal accountant’s hours spent on auditing the registrant’s financial statements were attributed to work performed by full-time permanent employees of the principal accountant. The following table indicates the non-audit fees billed or expected to be billed by the registrant’s accountant for services to the registrant and to the registrant’s investment adviser (including any entity controlling, controlled by, or under common control with the adviser) for the last two years. The audit committee of the board of trustees has considered whether the provision of non-audit services that were rendered to the registrant’s investment adviser is compatible with maintaining the principal accountant’s independence and has concluded that the provision of such non-audit services by the accountant has not compromised the accountant’s independence.
| | | | | | | | |
Non-Audit Related Fees | | FYE 12/31/2015 | | | FYE 12/31/2014 | |
Registrant | | $ | 34,550 | | | $ | 30,625 | |
Registrant’s Investment Adviser | | $ | 0 | | | $ | 0 | |
Item 5. Audit Committee of Listed Registrants.
Not applicable to registrants who are not listed issuers (as defined in Rule 10A-3 under the Securities Exchange Act of 1934).
Item 6. Investments.
| | (a) | Schedule of Investments is included as part of the report to shareholders filed under Item 1 of this Form. |
Item 7. Disclosure of Proxy Voting Policies and Procedures for Closed-End Management Investment Companies.
Not applicable to open-end investment companies.
Item 8. Portfolio Managers of Closed-End Management Investment Companies.
Not applicable to open-end investment companies.
Item 9. Purchases of Equity Securities by Closed-End Management Investment Company and Affiliated Purchasers.
Not applicable to open-end investment companies.
Item 10. Submission of Matters to a Vote of Security Holders.
There have been no material changes to the procedures by which shareholders may recommend nominees to the registrant’s board of trustees.
2
Item 11. Controls and Procedures.
(a) The registrant’s Chief Executive Officer and Chief Financial Officer have reviewed the registrant’s disclosure controls and procedures (as defined in Rule 30a-3(c) under the Investment Company Act of 1940 (the “Act”)) as of a date within 90 days of the filing of this report, as required by Rule 30a-3(b) under the Act and Rules 13a-15(b) or 15d-15(b) under the Securities Exchange Act of 1934. Based on their review, such officers have concluded that the disclosure controls and procedures are reasonably designed to ensure that information required to be disclosed in this report is recorded, processed, summarized and reported within the required time periods and that information required to be disclosed by the registrant in reports that it files or submits on Form N-CSR is accumulated and communicated to the registrant’s management, including its principal executive and financial officers, as appropriate to allow timely decisions regarding required disclosure.
(b) There were no changes in the registrant’s internal control over financial reporting (as defined in Rule 30a-3(d) under the Act) that occurred during the second fiscal quarter of the period covered by this report that have materially affected, or are reasonably likely to materially affect, the registrant’s internal control over financial reporting.
Item 12. Exhibits.
| (a) | (1) Any code of ethics or amendment thereto, that is the subject of the disclosure required by Item 2, to the extent that the registrant intends to satisfy Item 2 requirements through filing an exhibit. Filed herewith. |
(2) A separate certification for each principal executive and principal financial officer pursuant to Section 302 of the Sarbanes-Oxley Act of 2002. Filed herewith.
(3) Any written solicitation to purchase securities under Rule 23c-1 under the Act sent or given during the period covered by the report by or on behalf of the registrant to 10 or more persons. Not applicable to open-end investment companies.
| (b) | Certifications pursuant to Section 906 of the Sarbanes-Oxley Act of 2002. Furnished herewith. |
3
SIGNATURES
Pursuant to the requirements of the Securities Exchange Act of 1934 and the Investment Company Act of 1940, the registrant has duly caused this report to be signed on its behalf by the undersigned, thereunto duly authorized.
| | |
| (Registrant) LKCM Funds |
| |
| By (Signature and Title | | /s/ Luther King |
| | J. Luther King, Jr., President |
Pursuant to the requirements of the Securities Exchange Act of 1934 and the Investment Company Act of 1940, this report has been signed below by the following persons on behalf of the registrant and in the capacities and on the dates indicated.
| | |
| By (Signature and Title) | | /s/ Luther King |
| | J. Luther King, Jr., President |
| | |
| |
| By (Signature and Title) | | /s/ Jacob D. Smith |
| | Jacob D. Smith, Chief Financial Officer |
4