LKCM
FUNDS
LKCM Small Cap Equity Fund
LKCM Small-Mid Cap Equity Fund
LKCM Equity Fund
LKCM Balanced Fund
LKCM Fixed Income Fund
Annual Report
December 31, 2011
Dear Fellow Shareholders:
We report the following performance information for the LKCM Funds:
| | | | | | | | | | | | | | | | | | | | | | | | | | | | | | | | |
Funds | | Inception
Dates | | | NAV @
12/31/11 | | | Net
Expense
Ratio*, ** | | | Gross
Expense
Ratio** | | | One Year
Total
Return
Ended
12/31/11 | | | Five Year
Average
Annualized
Return
Ended
12/31/11 | | | Ten Year
Average
Annualized
Return
Ended
12/31/11 | | | Avg.
Annual
Total
Return
Since
Incept. | |
LKCM Equity Fund - | | | | | | | | | | | | | | | | | | | | | | | | | | | | | | | | |
Institutional Class | | | 1/3/96 | | | $ | 15.34 | | | | 0.80 | % | | | 1.05 | % | | | 3.30 | % | | | 3.18 | % | | | 4.60 | % | | | 6.97 | % |
S&P 500 Index1 | | | | | | | | | | | | | | | | | | | 2.11 | % | | | -0.25 | % | | | 2.92 | % | | | 6.41 | % |
LKCM Small Cap Equity Fund - | | | | | | | | | | | | | | | | | | | | | | | | | | | | | | | | |
Institutional Class | | | 7/14/94 | | | $ | 22.45 | | | | 0.96 | % | | | 0.97 | % | | | 4.47 | % | | | 2.16 | % | | | 7.82 | % | | | 10.76 | % |
Russell 2000 Index2 | | | | | | | | | | | | | | | | | | | -4.18 | % | | | 0.15 | % | | | 5.62 | % | | | 7.96 | % |
LKCM Small Cap Equity Fund - | | | | | | | | | | | | | | | | | | | | | | | | | | | | | | | | |
Adviser Class | | | 6/5/03 | | | $ | 21.88 | | | | 1.21 | % | | | 1.22 | % | | | 4.19 | % | | | 1.89 | % | | | N/A | | | | 9.22 | % |
Russell 2000 Index2 | | | | | | | | | | | | | | | | | | | -4.18 | % | | | 0.15 | % | | | N/A | | | | 7.18 | % |
LKCM Small-Mid Cap Equity Fund - | | | | | | | | | | | | | | | | | | | | | | | | | | | | | | | | |
Institutional Class | | | 5/2/11 | | | $ | 8.86 | | | | 1.00 | % | | | 1.42 | % | | | N/A | | | | N/A | | | | N/A | | | | -11.40 | %# |
Russell 2500 Index3 | | | | | | | | | | | | | | | | | | | N/A | | | | N/A | | | | N/A | | | | -12.83 | %# |
LKCM Balanced Fund | | | 12/30/97 | | | $ | 14.53 | | | | 0.80 | % | | | 1.26 | % | | | 3.16 | % | | | 3.98 | % | | | 4.64 | % | | | 4.99 | % |
S&P 500 Index1 | | | | | | | | | | | | | | | | | | | 2.11 | % | | | -0.25 | % | | | 2.92 | % | | | 3.69 | % |
Barclays Capital U.S. Intermediate
Government/Credit Bond Index4 | | | | | | | | | | | | | | | | | | | 5.80 | % | | | 5.88 | % | | | 5.20 | % | | | 5.70 | % |
LKCM Fixed Income Fund | | | 12/30/97 | | | $ | 11.04 | | | | 0.65 | % | | | 0.73 | % | | | 4.22 | % | | | 5.92 | % | | | 4.76 | % | | | 5.29 | % |
Barclays Capital U.S. Intermediate
Government/Credit Bond Index4 | | | | | | | | | | | | | | | | | | | 5.80 | % | | | 5.88 | % | | | 5.20 | % | | | 5.70 | % |
Performance data quoted represents past performance and does not guarantee future results. The investment return and principal value of an investment will fluctuate so that an investor’s shares, when redeemed, may be worth more or less than the original cost. Current performance of the Fund may be lower or higher than the performance quoted. Performance data current to the most recent month end may be obtained by calling 1-800-688-LKCM. The Funds impose a 1.00% redemption fee on shares held less than 30 days. If reflected, the fee would reduce performance shown.
| * | Excludes acquired fund fees and expenses. The Adviser has contractually agreed to waive all or a portion of its management fee and/or reimburse the Fund to maintain designated expense ratios through April 30, 2012. Investment performance reflects fee waivers, if any, in effect. In the absence of such waivers, total return would be reduced. Investment performance is based upon the net expense ratio. |
| ** | Expense ratios above are as of December 31, 2010, the Funds’ prior fiscal year end, as reported in the Funds’ most recent prospectus. Expense ratios reported for other periods in the financial highlights of this report may differ. |
| # | Cumulative return since inception date of May 2, 2011. |
| 1 | The S&P 500 Index is an unmanaged capitalization-weighted index of 500 stocks designed to measure performance of the broad domestic economy through changes in the aggregate market value of 500 stocks representing all major industries. |
| 2 | The Russell 2000 Index is an unmanaged index which measures the performance of the 2,000 smallest companies in the Russell 3000 Index. |
| 3 | The Russell 2500 Index is an unmanaged index which measures the performance of the 2,500 smallest companies in the Russell 3000 Index. |
| 4 | The Barclays Capital U.S. Intermediate Government/Credit Bond Index is an unmanaged market value weighted index measuring both the principal price changes of, and income provided by, the underlying universe of securities that comprise the index. Securities included in the index must meet the following criteria: fixed as opposed to variable rate; remaining maturity of one to ten years; minimum outstanding par value of $250 million; rated investment grade or higher by Moody’s Investors Service or equivalent; must be dollar denominated and non-convertible; and must be publicly issued. |
Note: These indices defined above are not available for direct investment.
Economic Review and Outlook
The U.S. equity market, as measured by the S&P 500 Index, advanced 2.1% for the year ended December 31, 2011. Volatility was central to the story line of 2011. The Washington D.C. gridlock, U.S. debt downgrade, European sovereign debt issues and other geopolitical events weighed on the U.S. equity market. The offset to these headwinds was strong U.S. corporate balance sheets, lower equity valuations, higher corporate earnings, and improving economic data towards the end of the year.
The economy continued the expansion it began in the middle of 2009, and thus far economic growth has averaged 2.4% annually since the recovery began. In 2011, just as in 2010, markets experienced a scare over lack of growth prompting the U.S. Federal Reserve (Fed) to take action. Economic output continues to move up, particularly due to the strength in capital spending. In our view, investment in other areas of the economy, such as housing, remains well below a sustainable long-term rate. We believe that as the housing market continues to work through excess inventory and pricing seeks an appropriate level, construction related spending should increase later this year.
2
Europe continues to be a focal point for markets as leaders attempt to address both monetary and fiscal issues with an incomplete complement of solutions. We may not have seen the worst from Europe, as our view remains the European Central Bank (ECB) will be pressed to directly monetize sovereign debt, which it has thus far stridently resisted. While Europe will likely enter a recession in 2012, our view is that the U.S. will not experience a recession in 2012, although our forecast calls for tepid domestic economic growth.
A prominent event of 2012 will be the U.S. Presidential election. The bond rating agency, Standard & Poor’s, downgraded the U.S. this past year from AAA in part due to the political impasse in Washington D.C. and poor outcome of the national debt-ceiling debate. Interestingly, 2012 marks an election year in countries representing almost half of global GDP, including China, France, Russia, South Korea, Taiwan, Egypt, Greece, Slovakia, Finland, and Venezuela. This sets an interesting political backdrop for 2012.
The discussion of economics has devolved into a discussion of politics. In a revival of this summer’s debt-ceiling debate in our nation’s capital, Congress and the Administration were again recently embroiled, this time over how to address a Social Security tax break and unemployment benefits. Not to be outdone, European leaders continue to dash from one economic summit to another publishing communiqué after communiqué in a feverish attempt to placate markets and instill confidence.
The European Union, ECB and International Monetary Fund (IMF) have continued to offer incremental approaches in response to demands of sovereign debt investors for higher yields. It appears European stakeholders are attempting a supreme balancing act – provide that which the capital markets demand or face the inability to fund current spending. However, we believe that central European authorities must not alleviate the acute pressure being felt by member nations, lest their ability to extract concessions be compromised.
There lies ahead a great debate among all the European stakeholders. The question is whether or not austerity can unwind fiscal imbalances, or should leaders focus on pro-growth policies. The early indication is a heavy dose of austerity as the European nucleus of Germany and France appear to seek this course of action. However, austerity alone appears incapable of returning the continental economy to health.
Domestically, we believe economic data continue to remain favorable. The economy is currently expanding around 2% in real terms, which in our view is neither strong enough to buffer a global economic shock or weak enough to grow overly concerned of recession. We now find ourselves more optimistic about certain areas of the economy since prior to the recession, including housing and autos. We believe that the data are finally beginning to suggest 2012 could see a meaningful upgrade in the outlook for both sectors. Manufacturing data, both domestically and abroad, signaled strength at the end of the year, and corporate earnings are closely aligned with manufacturing activity.
The U.S. equity market endured a barrage of global shocks and ended the year up slightly. While emerging markets, particularly China, have received a great deal of attention recently, many of these markets declined significantly in 2011. We believe the ability of the U.S. equity market to absorb extraneous shocks is a testament to the underlying strength of corporate profits.
We remain positive in our outlook for the domestic equity market in 2012. It appears that core inflation remains tame with little pressure from wages. Low inflation allows the Fed to retain an extremely easy monetary stance, which has primed the economy with credit and liquidity. Unfortunately, while the money supply has risen sharply, the velocity of money, or rate at which money trades hands, has yet to increase meaningfully. We believe that favorable monetary policy will continue to lubricate the economy for some period and a pick-up in the velocity of money would be a welcome sign that the economy is responding.
The equity market is closely correlated with corporate earnings and while economic activity is not robust, GDP recorded a new high in the fourth quarter of 2011. We characterized the market decline in the summer of 2010 as a growth scare, but corporate earnings continued to grow, eventually leading the market higher. The summer of 2011 witnessed a similar growth scare, from which the market began recovering prior to the U.S. debt downgrade and concerns over European sovereign debt intensified. Although we expect corporate earnings growth to be tepid in the coming year, we do not anticipate compression in the market’s price/earnings multiple – rather, we expect the market’s price/earnings multiple will expand once the growth outlook is more favorable.
We believe we are beginning to see the stabilization of housing on the horizon. Several recent data points support our view that 2012 could bring a significant upgrade in the prospect for housing. Building permits reached a three-year high in October 2011. The National Association of Home Builders published Homebuilder Sentiment Index reached a four-year high in November 2011. The vacancy rate of homes recently fell to the lowest level since mid-2006. We may initially see a bifurcated housing market with some markets, such as Nevada and California, continuing to struggle, while other areas, such as Washington D.C./Virginia and Boston, experience home price appreciation.
We remain positive on the domestic economic outlook. We believe employment is showing early signs of improvement, with the unemployment rate continuing to drop in recent readings. Consumers continue to reduce their debt loads, while also continuing to increase spending year-over-year. Corporate profit margins remain extremely high, which we believe provide traction for incremental capital spending. The wide output gap between what the economy is currently producing and its capacity to produce suggests to us that broad-based inflation will continue to be held at bay.
3
We remain positive with regard to corporate profit growth and anticipate the equity market to continue to follow the trend of corporate profits. Given the historically high levels of cash on corporate balance sheets and fewer reinvestment opportunities, we expect many companies to remain focused on returning cash to shareholders through both dividends and share repurchases. We also would not be surprised to see an increase in merger activity. We believe the rate of corporate profit growth will be hampered by sluggish global demand and the potential reversal of domestic tailwinds which have included accelerated capital spending incentives and incremental fiscal stimulus.
We believe that the market volatility we experienced in 2011 will most likely remain a part of the environment in 2012. As investors this can be frustrating in the short-run, particularly when it is accompanied by high correlation among stocks. However, experience has taught us that patience can be a significant advantage when investing in such an environment. We continue to identify companies which we believe have the ability to reinvest internally generated cash flow back into the business at increasing rates of return. We believe the current environment is allowing us to build positions in high quality companies at attractive valuations.
LKCM Equity Fund
The LKCM Equity Fund outperformed the S&P 500 Index for the year ended December 31, 2011. The Fund benefited from stock selection in the Energy, Industrials, Consumer Discretionary, Information Technology and Financials sectors, while stock selection in the Healthcare and Consumer Staples sectors detracted from the Fund’s returns. Our decision to underweight the Financials sector also enhanced the Fund’s returns, but our underweight positions in the Utilities and Consumer Staples sectors and overweight position in the Materials sector detracted from the Fund’s returns. We believe the Fund is well positioned with a focus on quality companies that can continue to add value for the Fund’s shareholders in the upcoming year.
| | | | |
| | | Total Return
Year Ended
December 31, 2011 | |
LKCM Equity Fund | | | 3.30 | % |
S&P 500 Index | | | 2.11 | % |
LKCM Small Cap Equity Fund
The LKCM Small Cap Equity Fund outperformed the Russell 2000 Index during the year ended December 31, 2011. The Fund’s outperformance relative to the benchmark resulted from our stock selection decisions, while sector allocation decisions slightly detracted from the Fund’s returns. We remained optimistic about the underlying economic trends during the year and were underweight the defensive sectors, Utilities and Consumer Staples, which were the two best performing sectors during 2011. Our stock selection, particularly in the Consumer Discretionary, Energy, Industrials, Financials and Materials sectors, drove the Fund’s outperformance relative to the benchmark during the year.
| | | | |
| | | Total Return
Year Ended
December 31, 2011 | |
LKCM Small Cap Equity Fund | | | 4.47 | % |
Russell 2000 Index | | | -4.18 | % |
LKCM Small-Mid Cap Equity Fund
The LKCM Small-Mid Cap Equity Fund outperformed the Russell 2500 Index for the period from May 2, 2011, the inception date of the Fund, through December 31, 2011. The Fund benefited from stock selection decisions while sector allocation decisions detracted from the Fund’s returns. We remained optimistic about the underlying economic trends during the year and were underweight the defensive sectors, Utilities and Consumer Staples, which were the two best performing sectors during 2011. Our stock selection, particularly in the Energy and Information Technology sectors, enhanced the Fund’s returns, while our stock selection decisions in the Financials, Telecommunications and Industrials sectors detracted from the Fund’s returns.
| | | | |
| | | Total Return
Since Inception
(May 2, 2011 through December 31, 2011) | |
LKCM Small-Mid Cap Equity Fund | | | -11.40 | % |
Russell 2500 Index | | | -12.83 | % |
LKCM Balanced Fund
The LKCM Balanced Fund’s blend of equity and fixed income securities, along with stock selection, benefited the Fund during the year ended December 31, 2011. Our stock selection decisions in the Energy, Consumer Discretionary, Information Technology and Materials sectors benefited the Fund’s returns, while stock selection decisions in the Healthcare and Consumer Staples sectors detracted from the Fund’s returns. The Fund continued to focus its holdings of fixed income securities on investment grade corporate bonds, which generated income for the Fund and dampened the overall volatility of the Fund’s returns during the year.
4
| | | | |
| | | Total Return
Year Ended
December 31, 2011 | |
LKCM Balanced Fund | | | 3.16 | % |
S&P 500 Index | | | 2.11 | % |
Barclays Capital U.S. Intermediate Government/ Credit Bond Index | | | 5.80 | % |
LKCM Fixed Income Fund
The LKCM Fixed Income Fund is managed to provide current income. The Fund primarily invests in a portfolio of investment grade corporate bonds as well as government securities with short and intermediate maturities. While the Fund’s overweight position in corporate bonds relative to government securities added to the Fund’s returns during the first half of the year, it detracted from the Fund’s returns during the second half of the year as the European debt crises triggered a flight to quality that resulted in the outperformance of U.S. Treasuries across the curve despite the historic downgrade of the U.S. sovereign debt rating for the first time in history. The Fund’s defensive average duration (3.3 years) relative to the average duration of the benchmark (4.0 years) also benefited the Fund’s returns during the first half year, although it detracted from the Fund’s returns during the second half of the year. The Fund benefited from overweight positions in the Energy and Information Technology sectors and an underweight position in the Financials sector.
| | | | |
| | | Total Return
Year Ended
December 31, 2011 | |
LKCM Fixed Income Fund | | | 4.22 | % |
Barclays Capital U.S. Intermediate Government/ Credit Bond Index | | | 5.80 | % |
J. Luther King, Jr., CFA
February 8, 2012
The information provided herein represents the opinion of J. Luther King, Jr. and is not intended to be a forecast of future events, a guarantee of future results, nor investment advice.
Please refer to the Schedule of Investments found on pages 15-27 of the report for more information on Fund holdings. Fund holdings and sector allocations are subject to change and are not recommendations to buy or sell any securities.
Mutual fund investing involves risk. Principal loss is possible. Past performance is not a guarantee of future results. Small and medium capitalization funds typically carry additional risks, since smaller companies generally have a higher risk of failure, and, historically, their stocks have experienced a greater degree of market volatility than stocks on average. Investments in debt securities typically decrease in value when interest rates rise. This risk is greater for longer-term debt securities. These risks are discussed in the Fund’s summary and statutory prospectuses.
Current and future portfolio holdings are subject to risk.
Diversification does not assure a profit nor protect against loss in a declining market.
Earnings growth is not a measure of the Fund’s future performance.
Duration is a commonly used measure of the potential volatility of the price of a debt security, or the aggregate market value of a portfolio of debt securities, prior to maturity. Securities with a longer duration generally have more volatile prices than securities of comparable quality with a shorter duration.
Cash flow measures the cash generating capability of a company by adding non-cash charges (e.g. depreciation) and interest expense to pretax income.
Earnings multiple: The earnings multiple of a stock, also called the price/earnings (P/E) ratio, is the share price divided by the earnings per share. The earnings multiple is often based on the prior twelve months of earnings data.
Must be preceded or accompanied by a prospectus.
Quasar Distributors, LLC, distributor.
5
PERFORMANCE:
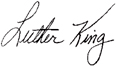
The following information illustrates the historical performance of LKCM Small Cap Equity Fund as of December 31, 2011 compared to the Fund’s representative market indices.
Performance data quoted represents past performance; past performance does not guarantee future results. The graph and table do not reflect the deduction of taxes that a shareholder would pay on Fund distributions or the redemption of Fund shares. The investment return and principal value of an investment will fluctuate so that an investor’s shares, when redeemed, may be worth more or less than their original cost. Current performance of the Fund may be lower or higher than the performance quoted. Performance data current to the most recent month end may be obtained by calling 1-800-688-LKCM.
An index is an unmanaged portfolio and does not trade or incur any expenses. One can not invest in an unmanaged index.
AVERAGE ANNUAL TOTAL RETURN
| | | | | | | | | | | | | | | | |
| | | Past
1 Year | | | Past
5 Years | | | Past
10 Years | | | Since
Inception(1) | |
LKCM Small Cap Equity Fund – Institutional Class | | | 4.47 | % | | | 2.16 | % | | | 7.82 | % | | | 10.76 | % |
Russell 2000 Index | | | -4.18 | % | | | 0.15 | % | | | 5.62 | % | | | 7.96 | % |
Lipper Small-Cap Core Funds Index | | | -3.81 | % | | | 1.32 | % | | | 5.81 | % | | | 9.20 | % |
A HYPOTHETICAL $10,000 INVESTMENT IN LKCM SMALL CAP EQUITY FUND – INSTITUTIONAL CLASS
(for the ten years ended December 31, 2011)
The Russell 2000 Index is an unmanaged index consisting of the 2,000 smallest companies in the Russell 3000 Index.
The Lipper Small-Cap Core Funds Index is an index of small cap core mutual funds tracked by Lipper, Inc.
6
AVERAGE ANNUAL TOTAL RETURN
| | | | | | | | | | | | | | | | |
| | | Past
1 Year | | | Past
3 Years | | | Past
5 Years | | | Since
Inception(1) | |
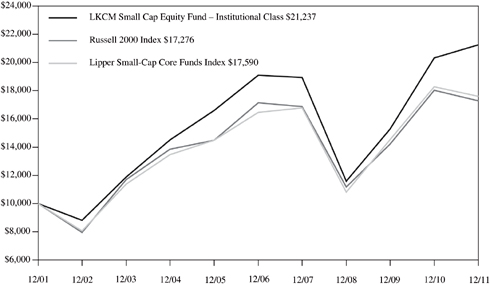
LKCM Small Cap Equity Fund – Adviser Class | | | 4.19 | % | | | 22.10 | % | | | 1.89 | % | | | 9.22 | % |
Russell 2000 Index | | | -4.18 | % | | | 15.63 | % | | | 0.15 | % | | | 7.18 | % |
Lipper Small-Cap Core Funds Index | | | -3.81 | % | | | 17.60 | % | | | 1.32 | % | | | 8.09 | % |
A HYPOTHETICAL $10,000 INVESTMENT IN LKCM SMALL CAP EQUITY FUND – ADVISER CLASS
(for the period from June 5, 2003 through December 31, 2011)
The Russell 2000 Index is an unmanaged index consisting of the 2,000 smallest companies in the Russell 3000 Index.
The Lipper Small-Cap Core Funds Index is an index of small cap core mutual funds tracked by Lipper, Inc.
7
PERFORMANCE:
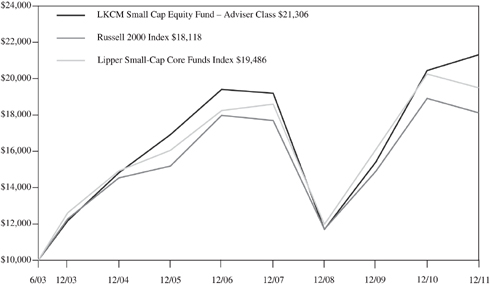
The following information illustrates the historical performance of LKCM Small-Mid Cap Equity Fund as of December 31, 2011 compared to the Fund’s representative market indices.
Performance data quoted represents past performance; past performance does not guarantee future results. The graph and table do not reflect the deduction of taxes that a shareholder would pay on Fund distributions or the redemption of Fund shares. The investment return and principal value of an investment will fluctuate so that an investor’s shares, when redeemed, may be worth more or less than their original cost. Current performance of the Fund may be lower or higher than the performance quoted. Performance data current to the most recent month end may be obtained by calling 1-800-688-LKCM.
An index is an unmanaged portfolio and does not trade or incur any expenses. One can not invest in an unmanaged index.
AVERAGE ANNUAL TOTAL RETURN
| | | | |
| | | Since
Inception(1) | |
LKCM Small-Mid Cap Equity Fund | | | -11.40 | % |
Russell 2500 Index | | | -12.83 | % |
Lipper Small-Cap Core Funds Index | | | -12.77 | % |
A HYPOTHETICAL $10,000 INVESTMENT IN LKCM SMALL-MID CAP EQUITY FUND
(for the period from May 2, 2011 to December 31, 2011)
The Russell 2500 Index is an unmanaged index consisting of the 2,500 smallest companies in the Russell 3000 Index.
The Lipper Small-Cap Core Funds Index is an index of small cap core mutual funds tracked by Lipper, Inc.
8
PERFORMANCE:
The following information illustrates the historical performance of LKCM Equity Fund as of December 31, 2011 compared to the Fund’s representative market indices.
Performance data quoted represents past performance; past performance does not guarantee future results. The graph and table do not reflect the deduction of taxes that a shareholder would pay on Fund distributions or the redemption of Fund shares. The investment return and principal value of an investment will fluctuate so that an investor’s shares, when redeemed, may be worth more or less than their original cost. Current performance of the Fund may be lower or higher than the performance quoted. Performance data current to the most recent month end may be obtained by calling 1-800-688-LKCM.
An index is an unmanaged portfolio and does not trade or incur any expenses. One can not invest in an unmanaged index.
AVERAGE ANNUAL TOTAL RETURN
| | | | | | | | | | | | | | | | |
| | | Past
1 Year | | | Past
5 Years | | | Past
10 Years | | | Since
Inception(1) | |
LKCM Equity Fund – Institutional Class | | | 3.30 | % | | | 3.18 | % | | | 4.60 | % | | | 6.97 | % |
S&P 500 Index | | | 2.11 | % | | | -0.25 | % | | | 2.92 | % | | | 6.41 | % |
Lipper Large-Cap Core Funds Index | | | 0.09 | % | | | -0.60 | % | | | 2.16 | % | | | 5.48 | % |
A HYPOTHETICAL $10,000 INVESTMENT IN LKCM EQUITY FUND – INSTITUTIONAL CLASS
(for the ten years ended December 31, 2011)
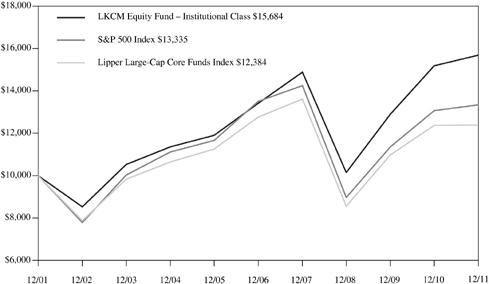
The S&P 500 Index is an unmanaged capitalization-weighted index of 500 stocks designed to measure performance of the broad domestic economy through changes in the aggregate market value of 500 stocks representing all major industries.
The Lipper Large-Cap Core Funds Index is an index of large cap core mutual funds tracked by Lipper, Inc.
9
PERFORMANCE:
The following information illustrates the historical performance of LKCM Balanced Fund as of December 31, 2011 compared to the Fund’s representative market indices.
Performance data quoted represents past performance; past performance does not guarantee future results. The graph and table do not reflect the deduction of taxes that a shareholder would pay on Fund distributions or the redemption of Fund shares. The investment return and principal value of an investment will fluctuate so that an investor’s shares, when redeemed, may be worth more or less than their original cost. Current performance of the Fund may be lower or higher than the performance quoted. Performance data current to the most recent month end may be obtained by calling 1-800-688-LKCM.
An index is an unmanaged portfolio and does not trade or incur any expenses. One can not invest in an unmanaged index.
AVERAGE ANNUAL TOTAL RETURN
| | | | | | | | | | | | | | | | |
| | | Past
1 Year | | | Past
5 Years | | | Past
10 Years | | | Since
Inception(1) | |
LKCM Balanced Fund | | | 3.16 | % | | | 3.98 | % | | | 4.64 | % | | | 4.99 | % |
Barclays Capital U.S. Intermediate Government/Credit Bond Index | | | 5.80 | % | | | 5.88 | % | | | 5.20 | % | | | 5.70 | % |
S&P 500 Index | | | 2.11 | % | | | -0.25 | % | | | 2.92 | % | | | 3.69 | % |
Lipper Mixed-Asset Target Allocation Growth Funds Index | | | -0.54 | % | | | 1.32 | % | | | 4.44 | % | | | 4.72 | % |
A HYPOTHETICAL $10,000 INVESTMENT IN LKCM BALANCED FUND
(for the ten years ended December 31, 2011)
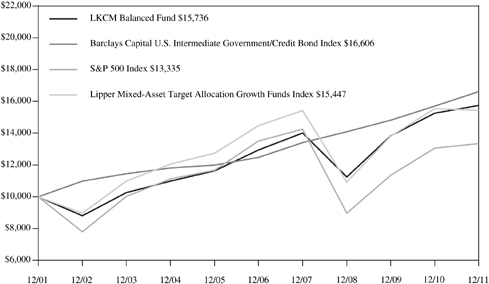
The Barclays Capital U.S. Intermediate Government/Credit Bond Index is an unmanaged market value weighted index measuring both the principal price changes of, and income provided by, the underlying universe of securities that comprise the index. Securities included in the index must meet the following criteria: fixed as opposed to variable rate; remaining maturity of one to ten years; minimum outstanding par value of $250 million; rated investment grade or higher by Moody’s Investors Service or equivalent; must be dollar denominated and non-convertible; and must be publicly issued.
The Lipper Mixed-Asset Target Allocation Growth Funds Index is an unmanaged index consisting of funds tracked by Lipper, Inc. that, by portfolio practice, maintain a mix of between 60%-80% equity securities, with the remainder invested in bonds, cash and cash equivalents.
The S&P 500 Index is an unmanaged capitalization-weighted index of 500 stocks designed to measure performance of the broad domestic economy through changes in the aggregate market value of 500 stocks representing all major industries.
10
PERFORMANCE:
The following information illustrates the historical performance of LKCM Fixed Income Fund as of December 31, 2011 compared to the Fund’s representative market indices.
Performance data quoted represents past performance; past performance does not guarantee future results. The graph and table do not reflect the deduction of taxes that a shareholder would pay on Fund distributions or the redemption of Fund shares. The investment return and principal value of an investment will fluctuate so that an investor’s shares, when redeemed, may be worth more or less than their original cost. Current performance of the Fund may be lower or higher than the performance quoted. Performance data current to the most recent month end may be obtained by calling 1-800-688-LKCM.
An index is an unmanaged portfolio and does not trade or incur any expenses. One can not invest in an unmanaged index.
AVERAGE ANNUAL TOTAL RETURN
| | | | | | | | | | | | | | | | |
| | | Past
1 Year | | | Past
5 Years | | | Past
10 Years | | | Since
Inception(1) | |
LKCM Fixed Income Fund | | | 4.22 | % | | | 5.92 | % | | | 4.76 | % | | | 5.29 | % |
Barclays Capital U.S. Intermediate Government/Credit Bond Index | | | 5.80 | % | | | 5.88 | % | | | 5.20 | % | | | 5.70 | % |
Lipper Short Intermediate Investment-Grade Debt Funds Index | | | 3.99 | % | | | 4.80 | % | | | 4.29 | % | | | 4.87 | % |
A HYPOTHETICAL $10,000 INVESTMENT IN LKCM FIXED INCOME FUND
(for the ten years ended December 31, 2011)
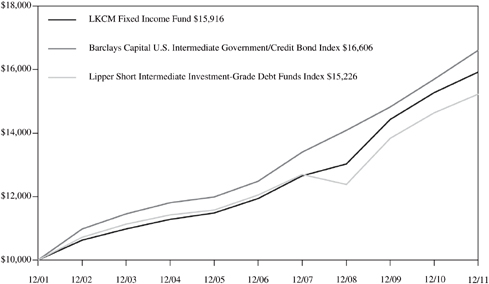
The Barclays Capital U.S. Intermediate Government/Credit Bond Index is an unmanaged market value weighted index measuring both the principal price changes of, and income provided by, the underlying universe of securities that comprise the index. Securities included in the index must meet the following criteria: fixed as opposed to variable rate; remaining maturity of one to ten years; minimum outstanding par value of $250 million; rated investment grade or higher by Moody’s Investors Service or equivalent; must be dollar denominated and non-convertible; and must be publicly issued.
The Lipper Short Intermediate Investment-Grade Debt Funds Index is an index of short intermediate investment grade mutual funds tracked by Lipper, Inc.
11
LKCM Funds Expense Example — December 31, 2011
As a shareholder of the Funds, you incur two types of costs: (1) transaction costs, including redemption fees; and (2) ongoing costs, including management fees, distribution and/or service (12b-1) fees and other Fund expenses. This Example is intended to help you understand your ongoing costs (in dollars) of investing in the Funds and to compare these costs with the ongoing costs of investing in other mutual funds. The Example is based on an investment of $1,000 invested at the beginning of the period and held for the entire period (7/1/11-12/31/11).
ACTUAL EXPENSES
The first line of the tables below provides information about actual account values and actual expenses. Although the Funds charge no sales load, you will be assessed fees for outgoing wire transfers, returned checks and stop payment orders at prevailing rates charged by U.S. Bancorp Fund Services, LLC, the Funds’ transfer agent. If you request that a redemption be made by wire transfer, currently a $15.00 fee is charged by the Funds’ transfer agent. You will be charged a redemption fee equal to 1.00% of the net amount of the redemption if you redeem your shares of the LKCM Small Cap Equity, Small-Mid Cap Equity, Equity, Balanced and Fixed Income Funds within 30 days of purchase. To the extent the Funds invest in shares of other investment companies as part of their investment strategies, you will indirectly bear your proportionate share of any fees and expenses charged by the underlying funds in which the Funds invest in addition to the expenses of the Funds. Actual expenses of the underlying funds are expected to vary among the various underlying funds. These expenses are not included in the example below. The example below includes management fees, registration fees and other expenses. However, the example below does not include portfolio trading commissions and related expenses and other extraordinary expenses as determined under generally accepted accounting principles. You may use the information in this line, together with the amount you invested, to estimate the expenses that you paid over the period. Simply divide your account value by $1,000 (for example, an $8,600 account value divided by $1,000 = 8.6), then multiply the result by the number in the first line under the heading entitled “Expenses Paid During Period” to estimate the expenses you paid on your account during this period.
HYPOTHETICAL EXAMPLES FOR COMPARISON PURPOSES
The second line of the tables below provides information about hypothetical account values and hypothetical expenses based on the Funds’ actual expense ratios and an assumed rate of return of 5% per year before expenses, which are not the Funds’ actual returns. The hypothetical account values and expenses may not be used to estimate the actual ending account balance or expenses you paid for the period. You may use this information to compare the ongoing costs of investing in the Funds and other funds. To do so, compare this 5% hypothetical example with the 5% hypothetical examples that appear in the shareholder reports of the other funds. Please note that the expenses shown in the table are meant to highlight your ongoing costs only and do not reflect any transactional costs, such as redemption fees. Therefore, the second line of the table is useful in comparing ongoing costs only, and will not help you determine the relative total costs of owning different funds. In addition, if these transactions costs were included, your costs would have been higher.
| | | | | | | | | | | | |
| | | LKCM Small Cap Equity Fund – Institutional Class | |
| | | Beginning
Account Value
7/1/11 | | | Ending
Account Value
12/31/11 | | | Expenses Paid
During Period*
7/1/11 – 12/31/11 | |
Actual | | $ | 1,000.00 | | | $ | 905.20 | | | $ | 4.56 | |
Hypothetical (5% return before expense) | | $ | 1,000.00 | | | $ | 1,020.42 | | | $ | 4.84 | |
| * | Expenses are equal to the Fund’s annualized net expense ratio of 0.95%, multiplied by the average account value over the period, multiplied by 184/365 to reflect the one-half year period. |
| | | | | | | | | | | | | | |
| | | LKCM Small Cap Equity Fund – Adviser Class | |
| | | Beginning
Account Value
7/1/11 | | | Ending
Account Value
12/31/11 | | | Expenses Paid
During Period*
7/1/11 – 12/31/11 | |
Actual | | $ | 1,000.00 | | | $ | 904.10 | | | | | $ | 5.76 | |
Hypothetical (5% return before expense) | | $ | 1,000.00 | | | $ | 1,019.16 | | | | | $ | 6.11 | |
| * | Expenses are equal to the Fund’s annualized net expense ratio of 1.20%, multiplied by the average account value over the period, multiplied by 184/365 to reflect the one-half year period. |
12
| | | | | | | | | | | | |
| | | LKCM Small-Mid Cap Equity Fund | |
| | | Beginning
Account Value
7/1/11 | | | Ending
Account Value
12/31/11 | | | Expenses Paid
During Period*
7/1/11 – 12/31/11 | |
Actual | | $ | 1,000.00 | | | $ | 898.60 | | | $ | 4.79 | |
Hypothetical (5% return before expense) | | $ | 1,000.00 | | | $ | 1,020.16 | | | $ | 5.09 | |
* Expenses are equal to the Fund’s annualized net expense ratio of 1.00%, multiplied by the average account value over the period, multiplied by 184/365 to reflect the one-half year period.
| | | | | | | | | | | | |
| | | LKCM Equity Fund | |
| | | Beginning
Account Value
7/1/11 | | | Ending
Account Value
12/31/11 | | | Expenses Paid
During Period*
7/1/11 – 12/31/11 | |
Actual | | $ | 1,000.00 | | | $ | 963.80 | | | $ | 3.96 | |
Hypothetical (5% return before expense) | | $ | 1,000.00 | | | $ | 1,021.17 | | | $ | 4.08 | |
* Expenses are equal to the Fund’s annualized net expense ratio of 0.80%, multiplied by the average account value over the period, multiplied by 184/365 to reflect the one-half year period.
| | | | | | | | | | | | |
| | | LKCM Balanced Fund | |
| | | Beginning
Account Value
7/1/11 | | | Ending
Account Value
12/31/11 | | | Expenses Paid
During Period*
7/1/11 – 12/31/11 | |
Actual | | $ | 1,000.00 | | | $ | 975.70 | | | $ | 3.98 | |
Hypothetical (5% return before expense) | | $ | 1,000.00 | | | $ | 1,021.17 | | | $ | 4.08 | |
* Expenses are equal to the Fund’s annualized net expense ratio of 0.80%, multiplied by the average account value over the period, multiplied by 184/365 to reflect the one-half year period.
| | | | | | | | | | | | |
| | | LKCM Fixed Income Fund | |
| | | Beginning
Account Value
7/1/11 | | | Ending
Account Value
12/31/11 | | | Expenses Paid
During Period*
7/1/11 – 12/31/11 | |
Actual | | $ | 1,000.00 | | | $ | 1,018.70 | | | $ | 3.31 | |
Hypothetical (5% return before expense) | | $ | 1,000.00 | | | $ | 1,021.93 | | | $ | 3.31 | |
| * | Expenses are equal to the Fund’s annualized net expense ratio of 0.65%, multiplied by the average account value over the period, multiplied by 184/365 to reflect the one-half year period. |
13
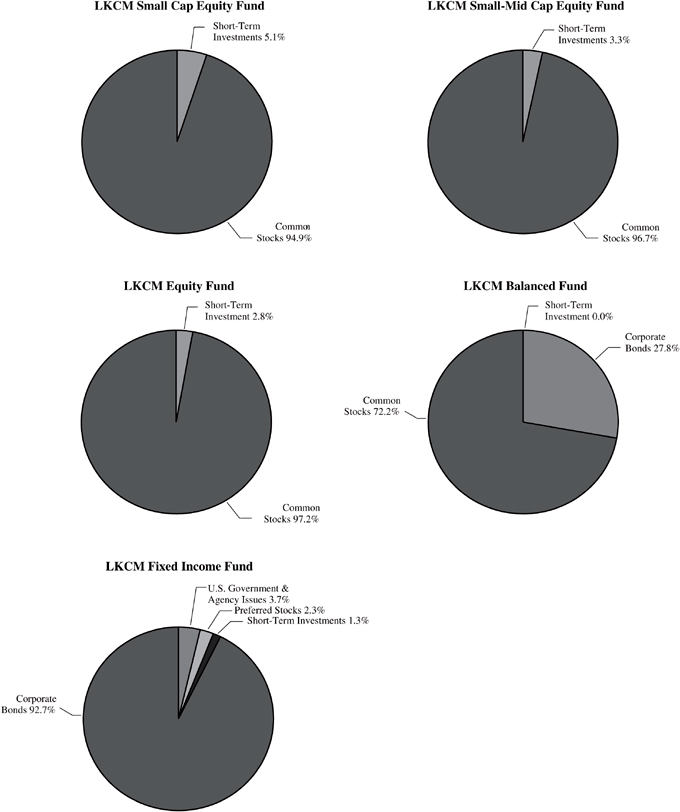
ALLOCATION OF PORTFOLIO HOLDINGS — LKCM Funds — December 31, 2011
Percentages represent market value as a percentage of total investments.
14
LKCM SMALL CAP EQUITY FUND
SCHEDULEOF INVESTMENTS
December 31, 2011
| | | | | | | | |
| | | Shares | | | Value | |
COMMON STOCKS - 95.0% | | | | | | | | |
Aerospace & Defense - 1.7% | | | | | | | | |
Hexcel Corporation (a) | | | 596,250 | | | $ | 14,435,213 | |
| | | | | | | | |
Air Freight & Logistics - 0.9% | | | | | | | | |
UTI Worldwide, Inc. (b) | | | 586,625 | | | | 7,796,246 | |
| | | | | | | | |
Auto Components - 1.6% | | | | | | | | |
Group 1 Automotive, Inc. | | | 256,550 | | | | 13,289,290 | |
| | | | | | | | |
Banks - 4.5% | | | | | | | | |
Home Bancshares Inc. | | | 278,725 | | | | 7,221,765 | |
Prosperity Bancshares, Inc. | | | 249,700 | | | | 10,075,395 | |
Texas Capital Bancshares, Inc. (a) | | | 320,975 | | | | 9,825,045 | |
Umpqua Holdings Corporation | | | 812,550 | | | | 10,067,494 | |
| | | | | | | | |
| | | | | | | 37,189,699 | |
| | | | | | | | |
Capital Markets - 1.2% | | | | | | | | |
Greenhill & Co., Inc. | | | 275,900 | | | | 10,034,483 | |
| | | | | | | | |
Commercial Services & Supplies - 2.0% | | | | | | | | |
Insperity, Inc. | | | 371,525 | | | | 9,418,159 | |
Interface, Inc. - Class A | | | 623,975 | | | | 7,200,671 | |
| | | | | | | | |
| | | | | | | 16,618,830 | |
| | | | | | | | |
Communications Equipment - 5.8% | | | | | | | | |
Brocade Communications Systems, Inc. (a) | | | 1,875,275 | | | | 9,732,677 | |
Ciena Corporation (a) | | | 617,800 | | | | 7,475,380 | |
Infinera Corporation (a) | | | 1,004,375 | | | | 6,307,475 | |
Ixia (a) | | | 601,575 | | | | 6,322,553 | |
Loral Space & Communications Inc. (a) | | | 116,150 | | | | 7,535,812 | |
NICE Systems Limited - ADR (a) (b) | | | 306,450 | | | | 10,557,203 | |
| | | | | | | | |
| | | | | | | 47,931,100 | |
| | | | | | | | |
Consumer Finance - 2.4% | | | | | | | | |
Cash America International, Inc. | | | 224,625 | | | | 10,474,264 | |
First Cash Financial Services, Inc. (a) | | | 279,151 | | | | 9,795,408 | |
| | | | | | | | |
| | | | | | | 20,269,672 | |
| | | | | | | | |
Containers & Packaging - 1.0% | | | | | | | | |
Silgan Holdings Inc. | | | 216,725 | | | | 8,374,254 | |
| | | | | | | | |
Distributors - 0.8% | | | | | | | | |
LKQ Corporation (a) | | | 219,100 | | | | 6,590,528 | |
| | | | | | | | |
Diversified Consumer Services - 0.9% | | | | | | | | |
American Public Education Inc. (a) | | | 180,900 | | | | 7,829,352 | |
| | | | | | | | |
Electrical Equipment & Instruments - 4.6% | | | | | | | | |
Belden Inc. | | | 287,725 | | | | 9,575,488 | |
Franklin Electric Co., Inc. | | | 203,840 | | | | 8,879,270 | |
II-VI, Incorporated (a) | | | 532,950 | | | | 9,784,962 | |
Woodward Inc. | | | 250,275 | | | | 10,243,756 | |
| | | | | | | | |
| | | | | | | 38,483,476 | |
| | | | | | | | |
Electronic Equipment & Instruments - 2.7% | | | | | | | | |
Anixter International Inc. (a) | | | 128,950 | | |
| 7,690,578
|
|
National Instruments Corporation | | | 323,025 | | | | 8,382,499 | |
Rofin-Sinar Technologies, Inc. (a) | | | 274,700 | | | | 6,276,895 | |
| | | | | | | | |
| | | | | | | 22,349,972 | |
| | | | | | | | |
| | | | | | | | |
| | | Shares | | | Value | |
COMMON STOCKS | | | | | | | | |
Energy Equipment & Services - 2.5% | | | | | | | | |
Atwood Oceanics, Inc. (a) | | | 151,800 | | | $ | 6,040,122 | |
CARBO Ceramics Inc. | | | 60,925 | | | | 7,513,880 | |
Dril-Quip, Inc. (a) | | | 104,075 | | | | 6,850,217 | |
| | | | | | | | |
| | | | | | | 20,404,219 | |
| | | | | | | | |
Food & Drug Retailing - 1.2% | | | | | | | | |
Ruddick Corporation | | | 224,000 | | | | 9,551,360 | |
| | | | | | | | |
Health Care Equipment & Supplies - 7.7% | | | | | | | | |
Cyberonics, Inc. (a) | | | 120,473 | | | | 4,035,845 | |
DexCom Inc. (a) | | | 964,500 | | | | 8,979,495 | |
Endologix, Inc. (a) | | | 625,900 | | | | 7,185,332 | |
GNC Holdings, Inc. - Class A (a) | | | 375,925 | | | | 10,883,029 | |
MWI Veterinary Supply, Inc. (a) | | | 187,200 | | | | 12,437,568 | |
PerkinElmer, Inc. | | | 340,025 | | | | 6,800,500 | |
Zoll Medical Corporation (a) | | | 211,700 | | | | 13,375,206 | |
| | | | | | | | |
| | | | | | | 63,696,975 | |
| | | | | | | | |
Health Care Providers & Services - 6.1% | | | | | | | | |
Catalyst Health Solutions, Inc. (a) | | | 178,120 | | | | 9,262,240 | |
Computer Programs and Systems, Inc. | | | 91,700 | | | | 4,686,787 | |
Health Management Associates Inc. - Class A (a) | | | 843,400 | | | | 6,215,858 | |
HMS Holdings Corporation (a) | | | 426,150 | | | | 13,628,277 | |
PSS World Medical, Inc. (a) | | | 290,625 | | | | 7,030,219 | |
Team Health Holdings, Inc. (a) | | | 445,975 | | | | 9,842,668 | |
| | | | | | | | |
| | | | | | | 50,666,049 | |
| | | | | | | | |
Hotels, Restaurants & Leisure - 0.5% | | | | | | | | |
BJ’s Restaurants, Inc. (a) | | | 89,525 | | | | 4,057,273 | |
| | | | | | | | |
Household Durables - 1.5% | | | | | | | | |
Select Comfort Corporation (a) | | | 385,525 | | | | 8,362,037 | |
Tempur-Pedic International Inc. (a) | | | 70,550 | | | | 3,705,992 | |
| | | | | | | | |
| | | | | | | 12,068,029 | |
| | | | | | | | |
Industrial Conglomerates - 1.0% | | | | | | | | |
Raven Industries, Inc. | | | 131,725 | | | | 8,153,778 | |
| | | | | | | | |
Insurance - 1.3% | | | | | | | | |
AmTrust Financial Services, Inc. | | | 445,139 | | | | 10,572,051 | |
| | | | | | | | |
Internet Software & Services - 2.6% | | | | | | | | |
The Active Network, Inc. (a) | | | 485,270 | | | | 6,599,672 | |
LivePerson, Inc. (a) | | | 523,700 | | | | 6,572,435 | |
LogMeIn, Inc. (a) | | | 210,625 | | | | 8,119,594 | |
| | | | | | | | |
| | | | | | | 21,291,701 | |
| | | | | | | | |
Machinery - 8.5% | | | | | | | | |
Actuant Corporation - Class A | | | 368,975 | | | | 8,372,043 | |
Albany International Corporation - Class A | | | 343,375 | | | | 7,938,830 | |
Astec Industries, Inc. (a) | | | 273,025 | | | | 8,794,135 | |
Chart Industries, Inc. (a) | | | 116,300 | | | | 6,288,341 | |
CLARCOR Inc. | | | 198,050 | | | | 9,900,519 | |
EnPro Industries, Inc. (a) | | | 237,125 | | | | 7,820,383 | |
The Middleby Corporation (a) | | | 109,550 | | | | 10,302,082 | |
The accompanying notes are an integral part of these financial statements.
15
LKCM SMALL CAP EQUITY FUND
SCHEDULEOF INVESTMENTS, CONTINUED
December 31, 2011
| | | | | | | | |
| | | Shares | | | Value | |
COMMON STOCKS | | | | | | | | |
Machinery - 8.5%, Continued | | | | | | | | |
Westport Innovations Inc. (a) (b) | | | 338,146 | | | $ | 11,239,973 | |
| | | | | | | | |
| | | | | | | 70,656,306 | |
| | | | | | | | |
Marine - 1.2% | | | | | | | | |
Kirby Corporation (a) | | | 154,600 | | | | 10,178,864 | |
| | | | | | | | |
Media - 1.0% | | | | | | | | |
Cinemark Holdings, Inc. | | | 427,150 | | | | 7,898,003 | |
| | | | | | | | |
Metals & Mining - 2.9% | | | | | | | | |
Carpenter Technology Corporation | | | 278,725 | | | | 14,348,763 | |
Haynes International, Inc. | | | 184,728 | | | | 10,086,149 | |
| | | | | | | | |
| | | | | | | 24,434,912 | |
| | | | | | | | |
Oil & Gas & Consumable Fuels - 6.6% | | | | | | | | |
Approach Resources Inc. (a) | | | 457,578 | | | | 13,457,369 | |
Gulfport Energy Corporation (a) | | | 310,095 | | | | 9,132,298 | |
Kodiak Oil & Gas Corporation (a) (b) | | | 453,975 | | | | 4,312,762 | |
Northern Oil & Gas, Inc. (a) | | | 276,275 | | | | 6,625,074 | |
Oasis Petroleum Inc. (a) | | | 300,950 | | | | 8,754,636 | |
Rosetta Resources, Inc. (a) | | | 276,228 | | | | 12,015,918 | |
| | | | | | | | |
| | | | | | | 54,298,057 | |
| | | | | | | | |
Pharmaceuticals - 0.8% | | | | | | | | |
Endo Pharmaceuticals Holdings Inc. (a) | | | 187,750 | | | | 6,483,007 | |
| | | | | | | | |
Real Estate - 0.8% | | | | | | | | |
FirstService Corporation (a) (b) | | | 256,684 | | | | 6,799,559 | |
| | | | | | | | |
Semiconductor Equipment & Products - 1.1% | | | | | | | | |
Cirrus Logic, Inc. (a) | | | 556,600 | | | | 8,822,110 | |
| | | | | | | | |
Software - 4.4% | | | | | | | | |
Aspen Technology, Inc. (a) | | | 624,200 | | | | 10,829,870 | |
Interactive Intelligence Group, Inc. (a) | | | 186,975 | | | | 4,285,467 | |
MicroStrategy Incorporated - Class A (a) | | | 81,062 | | | | 8,780,636 | |
Pegasystems Inc. | | | 303,233 | | | | 8,915,050 | |
TIBCO Software Inc. (a) | | | 155,650 | | | | 3,721,592 | |
| | | | | | | | |
| | | | | | | 36,532,615 | |
| | | | | | | | |
Specialty Retail - 7.8% | | | | | | | | |
bebe stores, inc. | | | 274,738 | | | | 2,288,567 | |
DSW Inc. - Class A | | | 224,200 | | | | 9,911,882 | |
Genesco Inc. (a) | | | 173,900 | | | | 10,736,586 | |
Hibbett Sports Inc. (a) | | | 241,753 | | | | 10,922,401 | |
Monro Muffler Brake, Inc. | | | 256,783 | | | | 9,960,613 | |
Sonic Automotive, Inc. - Class A | | | 672,125 | | | | 9,954,171 | |
Ulta Salon, Cosmetics & Fragrance, Inc. (a) | | | 62,525 | | | | 4,059,123 | |
Vera Bradley, Inc. (a) | | | 206,600 | | | | 6,662,850 | |
| | | | | | | | |
| | | | | | | 64,496,193 | |
| | | | | | | | |
Textiles, Apparel & Luxury Goods - 1.7% | | | | | | | | |
Crocs, Inc. (a) | | | 513,750 | | | | 7,588,087 | |
The Warnaco Group, Inc. (a) | | | 125,825 | | | | 6,296,283 | |
| | | | | | | | |
| | | | | | | 13,884,370 | |
| | | | | | | | |
Thrifts & Mortgage Finance - 1.2% | | | | | | | | |
Capitol Federal Financial Inc. | | | 879,900 | | | | 10,154,046 | |
| | | | | | | | |
| | | | | | | | |
| | | Shares | | | Value | |
COMMON STOCKS | | | | | | | | |
Trading Companies & Distributors - 1.6% | | | | | | | | |
WESCO International, Inc. (a) | | | 249,600 | | | $ | 13,231,296 | |
| | | | | | | | |
Wireless Telecommunication Services - 0.9% | | | | | | | | |
Leap Wireless International, Inc. (a) | | | 848,975 | | | | 7,886,978 | |
| | | | | | | | |
TOTAL COMMON STOCKS
(Cost $621,000,056) | | | | | | | 787,409,866 | |
| | | | | | | | |
SHORT-TERM INVESTMENTS - 5.2% | | | | | | | | |
Money Market Funds (c) - 5.2% | | | | | | | | |
Dreyfus Government Cash Management Fund - Institutional Shares - 0.00% | | | 19,130,969 | | | | 19,130,969 | |
Federated Government Obligations Fund - Institutional Shares - 0.01% | | | 23,576,179 | | | | 23,576,179 | |
| | | | | | | | |
TOTAL SHORT-TERM INVESTMENTS
(Cost $42,707,148) | | | | | | | 42,707,148 | |
| | | | | | | | |
Total Investments - 100.2%
(Cost $663,707,204) | | | | | | | 830,117,014 | |
Liabilities in Excess of Other Assets - (0.2)% | | | | | | | (1,713,497 | ) |
| | | | | | | | |
TOTAL NET ASSETS - 100.0% | | | | | | $ | 828,403,517 | |
| | | | | | | | |
ADR American Depository Receipt.
| (a) | Non-income producing security. |
| (b) | U.S. Dollar-denominated foreign security. |
| (c) | The rate quoted is the annualized seven-day yield of the fund at period end. |
The Global Industry Classification Standard (GICS®) was developed by and/or is the exclusive property of MSCI, Inc. and Standard & Poor Financial Services LLC (“S&P”). GICS is a service mark of MSCI and S&P and has been licensed for use by U.S. Bancorp Fund Services, LLC.
The accompanying notes are an integral part of these financial statements.
16
LKCM SMALL-MID CAP EQUITY FUND
SCHEDULEOF INVESTMENTS
December 31, 2011
| | | | | | | | |
| | | Shares | | | Value | |
COMMON STOCKS - 96.8% | | | | | | | | |
Aerospace & Defense - 4.7% | | | | | | | | |
BE Aerospace, Inc. (a) | | | 15,120 | | | $ | 585,295 | |
Hexcel Corporation (a) | | | 21,955 | | | | 531,531 | |
| | | | | | | | |
| | | | | | | 1,116,826 | |
| | | | | | | | |
Air Freight & Logistics - 1.6% | | | | | | | | |
UTI Worldwide, Inc. (b) | | | 27,825 | | | | 369,794 | |
| | | | | | | | |
Auto Components - 2.1% | | | | | | | | |
Gentex Corporation | | | 16,510 | | | | 488,531 | |
| | | | | | | | |
Banks - 3.7% | | | | | | | | |
Comerica Incorporated | | | 16,200 | | | | 417,960 | |
Prosperity Bancshares, Inc. | | | 11,675 | | | | 471,086 | |
| | | | | | | | |
| | | | | | | 889,046 | |
| | | | | | | | |
Capital Markets - 2.1% | | | | | | | | |
Affiliated Managers Group, Inc. (a) | | | 5,175 | | | | 496,541 | |
| | | | | | | | |
Chemicals - 2.0% | | | | | | | | |
FMC Corporation | | | 5,400 | | | | 464,616 | |
| | | | | | | | |
Commercial Services & Supplies - 1.6% | | | | | | | | |
Waste Connections, Inc. | | | 11,825 | | | | 391,881 | |
| | | | | | | | |
Communications Equipment - 4.3% | | | | | | | | |
Brocade Communications | | | | | | | | |
Systems, Inc. (a) | | | 94,820 | | | | 492,116 | |
F5 Networks, Inc. (a) | | | 4,925 | | | | 522,641 | |
| | | | | | | | |
| | | | | | | 1,014,757 | |
| | | | | | | | |
Consumer Finance - 1.7% | | | | | | | | |
Cash America International, Inc. | | | 8,675 | | | | 404,515 | |
| | | | | | | | |
Containers & Packaging - 1.7% | | | | | | | | |
Silgan Holdings Inc. | | | 10,575 | | | | 408,618 | |
| | | | | | | | |
Distributors - 2.6% | | | | | | | | |
LKQ Corporation (a) | | | 20,840 | | | | 626,867 | |
| | | | | | | | |
Diversified Financials - 1.8% | | | | | | | | |
The NASDAQ OMX Group, Inc. (a) | | | 17,700 | | | | 433,827 | |
| | | | | | | | |
Electrical Equipment & Instruments - 2.4% | | | | | | | | |
AMETEK, Inc. | | | 13,520 | | | | 569,192 | |
| | | | | | | | |
Electronic Equipment & Instruments - 5.3% | | | | | | | | |
Anixter International Inc. (a) | | | 6,850 | | | | 408,534 | |
National Instruments Corporation | | | 15,750 | | | | 408,713 | |
Trimble Navigation Limited (a) | | | 10,125 | | | | 439,425 | |
| | | | | | | | |
| | | | | | | 1,256,672 | |
| | | | | | | | |
Energy Equipment & Services - 3.4% | | | | | | | | |
CARBO Ceramics Inc. | | | 2,975 | | | | 366,907 | |
Core Laboratories N.V. (b) | | | 3,890 | | | | 443,265 | |
| | | | | | | | |
| | | | | | | 810,172 | |
| | | | | | | | |
Health Care Equipment & Supplies - 3.2% | | | | | | | | |
IDEXX Laboratories, Inc. (a) | | | 5,350 | | | | 411,736 | |
PerkinElmer, Inc. | | | 17,425 | | | | 348,500 | |
| | | | | | | | |
| | | | | | | 760,236 | |
| | | | | | | | |
| | | | | | | | |
| | | Shares | | | Value | |
COMMON STOCKS | | | | | | | | |
Health Care Providers & Services - 7.4% | | | | | | | | |
Allscripts Healthcare Solutions, Inc. (a) | | | 20,900 | | | $ | 395,846 | |
Catalyst Health Solutions, Inc. (a) | | | 8,800 | | | | 457,600 | |
Health Management Associates Inc. - Class A (a) | | | 42,350 | | | | 312,119 | |
HMS Holdings Corporation (a) | | | 18,400 | | | | 588,432 | |
| | | | | | | | |
| | | | | | | 1,753,997 | |
| | | | | | | | |
Household Durables - 2.0% | | | | | | | | |
Williams-Sonoma, Inc. | | | 12,450 | | | | 479,325 | |
| | | | | | | | |
Insurance - 1.8% | | | | | | | | |
AmTrust Financial Services, Inc. | | | 17,700 | | | | 420,375 | |
| | | | | | | | |
Leisure Equipment & Products - 2.0% | | | | | | | | |
Polaris Industries Inc. | | | 8,415 | | | | 471,072 | |
| | | | | | | | |
Machinery - 5.8% | | | | | | | | |
Actuant Corporation - Class A | | | 17,700 | | | | 401,613 | |
Gardner Denver Inc. | | | 6,885 | | | | 530,558 | |
Valmont Industries, Inc. | | | 4,890 | | | | 443,963 | |
| | | | | | | | |
| | | | | | | 1,376,134 | |
| | | | | | | | |
Marine - 2.0% | | | | | | | | |
Kirby Corporation (a) | | | 7,150 | | | | 470,756 | |
| | | | | | | | |
Metals & Mining - 1.8% | | | | | | | | |
Carpenter Technology Corporation | | | 8,275 | | | | 425,997 | |
| | | | | | | | |
Oil & Gas & Consumable Fuels - 6.2% | | | | | | | | |
Oasis Petroleum Inc. (a) | | | 13,975 | | | | 406,533 | |
Rosetta Resources, Inc. (a) | | | 12,260 | | | | 533,310 | |
SM Energy Company | | | 7,425 | | | | 542,767 | |
| | | | | | | | |
| | | | | | | 1,482,610 | |
| | | | | | | | |
Pharmaceuticals - 1.9% | | | | | | | | |
Endo Pharmaceuticals Holdings Inc. (a) | | | 13,125 | | | | 453,206 | |
| | | | | | | | |
Semiconductor Equipment & Products - 2.1% | | | | | | | | |
Cirrus Logic, Inc. (a) | | | 31,405 | | | | 497,769 | |
| | | | | | | | |
Software - 7.0% | | | | | | | | |
ANSYS, Inc. (a) | | | 8,025 | | | | 459,672 | |
Nuance Communications, Inc. (a) | | | 28,325 | | | | 712,657 | |
TIBCO Software Inc. (a) | | | 20,445 | | | | 488,840 | |
| | | | | | | | |
| | | | | | | 1,661,169 | |
| | | | | | | | |
Specialty Retail - 8.1% | | | | | | | | |
Dick’s Sporting Goods, Inc. (a) | | | 13,780 | | | | 508,206 | |
DSW Inc. - Class A | | | 10,560 | | | | 466,858 | |
Tractor Supply Company | | | 8,145 | | | | 571,372 | |
Ulta Salon, Cosmetics & Fragrance, Inc. (a) | | | 5,950 | | | | 386,274 | |
| | | | | | | | |
| | | | | | | 1,932,710 | |
| | | | | | | | |
Textiles, Apparel & Luxury Goods - 1.3% | | | | | | | | |
Deckers Outdoor Corporation (a) | | | 3,950 | | | | 298,502 | |
| | | | | | | | |
Trading Companies & Distributors - 2.4% | | | | | | | | |
WESCO International, Inc. (a) | | | 10,600 | | | | 561,906 | |
| | | | | | | | |
The accompanying notes are an integral part of these financial statements.
17
LKCM SMALL-MID CAP EQUITY FUND
SCHEDULEOF INVESTMENTS, CONTINUED
December 31, 2011
| | | | | | | | |
| | | Shares | | | Value | |
COMMON STOCKS | | | | | | | | |
Wireless Telecommunication Services - 0.8% | | | | | | | | |
MetroPCS Communications, Inc. (a) | | | 22,000 | | | $ | 190,960 | |
| | | | | | | | |
TOTAL COMMON STOCKS
(Cost $21,931,550) | | | | | | | 22,978,579 | |
| | | | | | | | |
SHORT-TERM INVESTMENTS - 3.3% | | | | | | | | |
Money Market Funds (c) - 3.3% | | | | | | | | |
Dreyfus Government Cash Management Fund - Institutional Shares, 0.00% | | | 80,358 | | | | 80,358 | |
Federated Government Obligations Fund - Institutional Shares, 0.01% | | | 711,000 | | | | 711,000 | |
| | | | | | | | |
TOTAL SHORT-TERM INVESTMENTS
(Cost $791,358) | | | | 791,358 | |
| | | | | | | | |
Total Investments - 100.1%
(Cost $22,722,908) | | | | | | | 23,769,937 | |
Liabilities in Excess of Other Assets - (0.1)% | | | | | | | (15,431 | ) |
| | | | | | | | |
TOTAL NET ASSETS - 100.0% | | | | | | $ | 23,754,506 | |
| | | | | | | | |
| (a) | Non-income producing security. |
| (b) | U.S. Dollar-denominated foreign security. |
| (c) | The rate quoted is the annualized seven-day yield of the fund at period end. |
The Global Industry Classification Standard (GICS®) was developed by and/or is the exclusive property of MSCI, Inc. and Standard & Poor Financial Services LLC (“S&P”). GICS is a service mark of MSCI and S&P and has been licensed for use by U.S. Bancorp Fund Services, LLC.
The accompanying notes are an integral part of these financial statements.
18
LKCM EQUITY FUND
SCHEDULEOF INVESTMENTS
December 31, 2011
| | | | | | | | |
| | | Shares | | | Value | |
COMMON STOCKS - 96.9% | | | | | | | | |
Aerospace & Defense - 3.2% | | | | | | | | |
Honeywell International Inc. | | | 34,400 | | | $ | 1,869,640 | |
Rockwell Collins, Inc. | | | 25,400 | | | | 1,406,398 | |
| | | | | | | | |
| | | | | | | 3,276,038 | |
| | | | | | | | |
Auto Components - 0.8% | | | | | | | | |
Gentex Corporation | | | 26,000 | | | | 769,340 | |
| | | | | | | | |
Banks - 8.0% | | | | | | | | |
Comerica Incorporated | | | 47,100 | | | | 1,215,180 | |
Cullen/Frost Bankers, Inc. | | | 38,350 | | | | 2,029,099 | |
Glacier Bancorp, Inc. | | | 28,000 | | | | 336,840 | |
Hancock Holding Company | | | 47,830 | | | | 1,529,125 | |
Prosperity Bancshares, Inc. | | | 26,000 | | | | 1,049,100 | |
Texas Capital Bancshares, Inc. (a) | | | 18,000 | | | | 550,980 | |
Wells Fargo & Company | | | 56,050 | | | | 1,544,738 | |
| | | | | | | | |
| | | | | | | 8,255,062 | |
| | | | | | | | |
Beverages - 2.9% | | | | | | | | |
The Coca-Cola Company | | | 20,000 | | | | 1,399,400 | |
PepsiCo, Inc. | | | 24,000 | | | | 1,592,400 | |
| | | | | | | | |
| | | | | | | 2,991,800 | |
| | | | | | | | |
Biotechnology - 1.6% | | | | | | | | |
Celgene Corporation (a) | | | 25,000 | | | | 1,690,000 | |
| | | | | | | | |
Chemicals - 6.4% | | | | | | | | |
Airgas, Inc. | | | 13,000 | | | | 1,015,040 | |
E. I. du Pont de Nemours and Company | | | 35,000 | | | | 1,602,300 | |
FMC Corporation | | | 26,000 | | | | 2,237,040 | |
Monsanto Company | | | 24,000 | | | | 1,681,680 | |
| | | | | | | | |
| | | | | | | 6,536,060 | |
| | | | | | | | |
Commercial Services & Supplies - 1.0% | | | | | |
Waste Connections, Inc. | | | 30,000 | | | | 994,200 | |
| | | | | | | | |
Computers & Peripherals - 4.3% | | | | | | | | |
Apple Inc. (a) | | | 3,090 | | | | 1,251,450 | |
EMC Corporation (a) | | | 59,400 | | | | 1,279,476 | |
International Business Machines Corporation | | | 10,000 | | | | 1,838,800 | |
| | | | | | | | |
| | | | | | | 4,369,726 | |
| | | | | | | | |
Construction & Engineering - 0.5% | | | | | |
Foster Wheeler AG (a) (b) | | | 29,000 | | | | 555,060 | |
| | | | | | | | |
Construction Materials - 1.7% | | | | | | | | |
Martin Marietta Materials, Inc. | | | 23,260 | | | | 1,754,037 | |
| | | | | | | | |
Containers & Packaging - 1.3% | | | | | | | | |
Ball Corporation | | | 36,550 | | | | 1,305,200 | |
| | | | | | | | |
Diversified Financial Services - 1.5% | | | | | | | | |
JPMorgan Chase & Co. | | | 45,630 | | | | 1,517,197 | |
| | | | | | | | |
Electrical Equipment & Instruments - 4.1% | | | | | | | | |
Emerson Electric Co. | | | 37,600 | | | | 1,751,784 | |
Franklin Electric Co., Inc. | | | 24,000 | | | | 1,045,440 | |
Roper Industries, Inc. | | | 15,990 | | | | 1,389,051 | |
| | | | | | | | |
| | | | | | | 4,186,275 | |
| | | | | | | | |
| | | | | | | | |
| | | Shares | | | Value | |
COMMON STOCKS | | | | | | | | |
Electronic Equipment & Instruments - 2.7% | | | | | | | | |
National Instruments Corporation | | | 49,300 | | | $ | 1,279,335 | |
Trimble Navigation Limited (a) | | | 35,000 | | | | 1,519,000 | |
| | | | | | | | |
| | | | | | | 2,798,335 | |
| | | | | | | | |
Energy Equipment & Services - 0.5% | | | | | | | | |
National Oilwell Varco Inc. | | | 8,000 | | | | 543,920 | |
| | | | | | | | |
Food & Drug Retailing - 1.1% | | | | | | | | |
Walgreen Company | | | 33,000 | | | | 1,090,980 | |
| | | | | | | | |
Health Care Equipment & Supplies - 5.0% | | | | | | | | |
Covidien plc (b) | | | 30,000 | | | | 1,350,300 | |
DENTSPLY International Inc. | | | 40,000 | | | | 1,399,600 | |
PerkinElmer, Inc. | | | 65,920 | | | | 1,318,400 | |
Thermo Fisher Scientific, Inc. (a) | | | 23,000 | | | | 1,034,310 | |
| | | | | | | | |
| | | | | | | 5,102,610 | |
| | | | | | | | |
Hotels, Restaurants & Leisure - 0.8% | | | | | |
Yum! Brands, Inc. | | | 14,000 | | | | 826,140 | |
| | | | | | | | |
Household Durables - 1.5% | | | | | | | | |
Jarden Corporation | | | 50,440 | | | | 1,507,147 | |
| | | | | | | | |
Household Products - 4.9% | | | | | | | | |
Colgate-Palmolive Company | | | 8,600 | | | | 794,554 | |
Kimberly-Clark Corporation | | | 24,460 | | | | 1,799,278 | |
The Procter & Gamble Company | | | 36,810 | | | | 2,455,595 | |
| | | | | | | | |
| | | | | | | 5,049,427 | |
| | | | | | | | |
Industrial Conglomerates - 0.8% | | | | | | | | |
Raven Industries, Inc. | | | 13,000 | | | | 804,700 | |
| | | | | | | | |
Insurance - 0.6% | | | | | | | | |
Prudential Financial, Inc. | | | 12,000 | | | | 601,440 | |
| | | | | | | | |
Internet Catalog & Retail - 1.0% | | | | | | | | |
Amazon.com, Inc. (a) | | | 6,000 | | | | 1,038,600 | |
| | | | | | | | |
Internet Software & Services - 2.9% | | | | | |
Akamai Technologies, Inc. (a) | | | 45,000 | | | | 1,452,600 | |
Google Inc. - Class A (a) | | | 2,300 | | | | 1,485,570 | |
| | | | | | | | |
| | | | | | | 2,938,170 | |
| | | | | | | | |
Machinery - 4.1% | | | | | | | | |
Danaher Corporation | | | 35,000 | | | | 1,646,400 | |
Pall Corporation | | | 18,300 | | | | 1,045,845 | |
Valmont Industries, Inc. | | | 17,000 | | | | 1,543,430 | |
| | | | | | | | |
| | | | | | | 4,235,675 | |
| | | | | | | | |
Marine - 2.2% | | | | | | | | |
Kirby Corporation (a) | | | 34,000 | | | | 2,238,560 | |
| | | | | | | | |
Media - 1.4% | | | | | | | | |
Cinemark Holdings, Inc. | | | 25,000 | | | | 462,250 | |
Time Warner Inc. | | | 27,200 | | | | 983,008 | |
| | | | | | | | |
| | | | | | | 1,445,258 | |
| | | | | | | | |
Metals & Mining - 1.6% | | | | | | | | |
Newmont Mining Corporation | | | 13,000 | | | | 780,130 | |
| | | | | | | | |
The accompanying notes are an integral part of these financial statements.
19
LKCM EQUITY FUND
SCHEDULEOF INVESTMENTS, CONTINUED
December 31, 2011
| | | | | | | | |
| | | Shares | | | Value | |
COMMON STOCKS | | | | | | | | |
Metals & Mining - 1.6%, Continued | | | | | | | | |
Titanium Metals Corporation | | | 60,000 | | | $ | 898,800 | |
| | | | | | | | |
| | | | | | | 1,678,930 | |
| | | | | | | | |
Oil & Gas & Consumable Fuels - 11.1% | | | | | | | | |
Cabot Oil & Gas Corporation | | | 19,650 | | | | 1,491,435 | |
ConocoPhillips | | | 27,010 | | | | 1,968,219 | |
Encana Corporation (b) | | | 40,000 | | | | 741,200 | |
EOG Resources, Inc. | | | 13,000 | | | | 1,280,630 | |
Exxon Mobil Corporation | | | 30,070 | | | | 2,548,733 | |
Noble Energy, Inc. | | | 10,000 | | | | 943,900 | |
Range Resources Corporation | | | 18,000 | | | | 1,114,920 | |
SM Energy Company | | | 8,000 | | | | 584,800 | |
The Williams Companies, Inc. | | | 20,000 | | | | 660,400 | |
| | | | | | | | |
| | | | | | | 11,334,237 | |
| | | | | | | | |
Pharmaceuticals - 6.0% | | | | | | | | |
Abbott Laboratories | | | 25,000 | | | | 1,405,750 | |
Allergan, Inc. | | | 9,300 | | | | 815,982 | |
Johnson & Johnson | | | 29,820 | | | | 1,955,596 | |
Pfizer Inc. | | | 93,530 | | | | 2,023,989 | |
| | | | | | | | |
| | | | | | | 6,201,317 | |
| | | | | | | | |
Road & Rail - 1.7% | | | | | | | | |
Kansas City Southern (a) | | | 8,500 | | | | 578,085 | |
Union Pacific Corporation | | | 11,000 | | | | 1,165,340 | |
| | | | | | | | |
| | | | | | | 1,743,425 | |
| | | | | | | | |
Software - 4.1% | | | | | | | | |
Adobe Systems Incorporated (a) | | | 45,000 | | | | 1,272,150 | |
Microsoft Corporation | | | 22,000 | | | | 571,120 | |
Nuance Communications, Inc. (a) | | | 45,000 | | | | 1,132,200 | |
Oracle Corporation | | | 48,900 | | | | 1,254,285 | |
| | | | | | | | |
| | | | | | | 4,229,755 | |
| | | | | | | | |
Specialty Retail - 4.5% | | | | | | | | |
PetSmart, Inc. | | | 32,000 | | | | 1,641,280 | |
Tiffany & Co. | | | 18,000 | | | | 1,192,680 | |
Tractor Supply Company | | | 25,000 | | | | 1,753,750 | |
| | | | | | | | |
| | | | | | | 4,587,710 | |
| | | | | | | | |
Textiles, Apparel & Luxury Goods - 1.1% | | | | | | | | |
VF Corporation | | | 9,000 | | | | 1,142,910 | |
| | | | | | | | |
TOTAL COMMON STOCKS (Cost $82,109,814) | | | | | | | 99,339,241 | |
| | | | | | | | |
| | | | | | | | |
| | | Shares | | | Value | |
SHORT-TERM INVESTMENT - 2.7% | | | | | |
Money Market Fund (c) - 2.7% | | | | | |
Federated Government Obligations Fund - Institutional Shares, 0.01% | | | 2,820,015 | | | $ | 2,820,015 | |
| | | | | | | | |
TOTAL SHORT-TERM INVESTMENT (Cost $2,820,015) | | | | | | | 2,820,015 | |
| | | | | | | | |
Total Investments - 99.6% (Cost $84,929,829) | | | | | | | 102,159,256 | |
Other Assets in Excess of Liabilities - 0.4% | | | | | | | 388,345 | |
| | | | | | | | |
TOTAL NET ASSETS - 100.0% | | | | | | $ | 102,547,601 | |
| | | | | | | | |
| (a) | Non-income producing security. |
| (b) | U.S. Dollar-denominated foreign security. |
| (c) | The rate quoted is the annualized seven-day yield of the fund at period end. |
The Global Industry Classification Standard (GICS®) was developed by and/or is the exclusive property of MSCI, Inc. and Standard & Poor Financial Services LLC (“S&P”). GICS is a service mark of MSCI and S&P and has been licensed for use by U.S. Bancorp Fund Services, LLC.
The accompanying notes are an integral part of these financial statements.
20
LKCM BALANCED FUND
SCHEDULEOF INVESTMENTS
December 31, 2011
| | | | | | | | |
| | | Shares | | | Value | |
COMMON STOCKS - 72.1% | | | | | | | | |
Aerospace & Defense - 1.6% | | | | | | | | |
General Dynamics Corporation | | | 1,400 | | | $ | 92,974 | |
Rockwell Collins, Inc. | | | 3,600 | | | | 199,332 | |
| | | | | | | | |
| | | | | | | 292,306 | |
| | | | | | | | |
Air Freight & Logistics - 1.0% | | | | | | | | |
United Parcel Service, Inc. - Class B | | | 2,600 | | | | 190,294 | |
| | | | | | | | |
Banks - 3.7% | | | | | | | | |
Comerica Incorporated | | | 9,500 | | | | 245,100 | |
Cullen/Frost Bankers, Inc. | | | 3,900 | | | | 206,349 | |
Wells Fargo & Company | | | 8,471 | | | | 233,461 | |
| | | | | | | | |
| | | | | | | 684,910 | |
| | | | | | | | |
Beverages - 2.4% | | | | | | | | |
The Coca-Cola Company | | | 2,900 | | | | 202,913 | |
PepsiCo, Inc. | | | 3,600 | | | | 238,860 | |
| | | | | | | | |
| | | | | | | 441,773 | |
| | | | | | | | |
Biotechnology - 1.7% | | | | | | | | |
Celgene Corporation (a) | | | 3,800 | | | | 256,880 | |
Charles River Laboratories International, Inc. (a) | | | 2,000 | | | | 54,660 | |
| | | | | | | | |
| | | | | | | 311,540 | |
| | | | | | | | |
Chemicals - 4.8% | | | | | | | | |
Air Products and Chemicals, Inc. | | | 1,900 | | | | 161,861 | |
Airgas, Inc. | | | 3,000 | | | | 234,240 | |
E. I. du Pont de Nemours and Company | | | 3,200 | | | | 146,496 | |
FMC Corporation | | | 2,400 | | | | 206,496 | |
Monsanto Company | | | 1,900 | | | | 133,133 | |
| | | | | | | | |
| | | | | | | 882,226 | |
| | | | | | | | |
Commercial Services & Supplies - 1.1% | | | | | | | | |
Waste Management, Inc. | | | 6,100 | | | | 199,531 | |
| | | | | | | | |
Communications Equipment - 0.4% | | | | | | | | |
Harris Corporation | | | 2,200 | | | | 79,288 | |
| | | | | | | | |
Computers & Peripherals - 4.4% | | | | | | | | |
Apple Inc. (a) | | | 875 | | | | 354,375 | |
EMC Corporation (a) | | | 8,600 | | | | 185,244 | |
International Business Machines Corporation | | | 1,500 | | | | 275,820 | |
| | | | | | | | |
| | | | | | | 815,439 | |
| | | | | | | | |
Construction Materials - 1.1% | | | | | | | | |
Martin Marietta Materials, Inc. | | | 2,700 | | | | 203,607 | |
| | | | | | | | |
Containers & Packaging - 1.1% | | | | | | | | |
Ball Corporation | | | 5,700 | | | | 203,547 | |
| | | | | | | | |
Diversified Financial Services - 0.6% | | | | | | | | |
JPMorgan Chase & Co. | | | 3,500 | | | | 116,375 | |
| | | | | | | | |
Diversified Telecommunication Services - 1.2% | | | | | |
AT&T Inc. | | | 7,400 | | | | 223,776 | |
| | | | | | | | |
Electrical Equipment & Instruments - 0.8% | | | | | | | | |
Emerson Electric Co. | | | 3,200 | | | | 149,088 | |
| | | | | | | | |
| | | | | | | | |
| | | Shares | | | Value | |
COMMON STOCKS | | | | | | | | |
Electronic Equipment & Instruments - 1.1% | |
National Instruments Corporation | | | 7,500 | | | $ | 194,625 | |
| | | | | | | | |
Energy Equipment & Services - 1.0% | | | | | | | | |
Schlumberger Limited (b) | | | 2,700 | | | | 184,437 | |
| | | | | | | | |
Food & Drug Retailing - 3.1% | | | | | | | | |
CVS Caremark Corporation | | | 4,700 | | | | 191,666 | |
Walgreen Company | | | 4,100 | | | | 135,546 | |
Wal-Mart Stores, Inc. | | | 4,300 | | | | 256,968 | |
| | | | | | | | |
| | | | | | | 584,180 | |
| | | | | | | | |
Health Care Equipment & Supplies - 2.2% | | | | | | | | |
Covidien plc (b) | | | 4,600 | | | | 207,046 | |
PerkinElmer, Inc. | | | 3,400 | | | | 68,000 | |
Thermo Fisher Scientific, Inc. (a) | | | 3,100 | | | | 139,407 | |
| | | | | | | | |
| | | | | | | 414,453 | |
| | | | | | | | |
Health Care Providers & Services - 2.2% | | | | | | | | |
Catalyst Health Solutions, Inc. (a) | | | 4,500 | | | | 234,000 | |
Express Scripts, Inc. (a) | | | 3,800 | | | | 169,822 | |
| | | | | | | | |
| | | | | | | 403,822 | |
| | | | | | | | |
Household Products - 3.0% | | | | | | | | |
Colgate-Palmolive Company | | | 2,200 | | | | 203,258 | |
Kimberly-Clark Corporation | | | 2,100 | | | | 154,476 | |
The Procter & Gamble Company | | | 3,100 | | | | 206,801 | |
| | | | | | | | |
| | | | | | | 564,535 | |
| | | | | | | | |
Industrial Conglomerates - 0.6% | | | | | | | | |
General Electric Company | | | 5,900 | | | | 105,669 | |
| | | | | | | | |
Insurance - 0.7% | | | | | | | | |
Prudential Financial, Inc. | | | 2,600 | | | | 130,312 | |
| | | | | | | | |
Internet Catalog & Retail - 1.2% | | | | | | | | |
Amazon.com, Inc. (a) | | | 1,300 | | | | 225,030 | |
| | | | | | | | |
Internet Software & Services - 2.1% | | | | | | | | |
Akamai Technologies, Inc. (a) | | | 5,100 | | | | 164,628 | |
Google Inc. - Class A (a) | | | 350 | | | | 226,065 | |
| | | | | | | | |
| | | | | | | 390,693 | |
| | | | | | | | |
IT Consulting & Services - 2.0% | | | | | | | | |
Accenture plc - Class A (b) | | | 3,200 | | | | 170,336 | |
Automatic Data Processing, Inc. | | | 3,700 | | | | 199,837 | |
| | | | | | | | |
| | | | | | | 370,173 | |
| | | | | | | | |
Machinery - 2.4% | | | | | | | | |
Danaher Corporation | | | 4,900 | | | | 230,496 | |
Pall Corporation | | | 3,800 | | | | 217,170 | |
| | | | | | | | |
| | | | | | | 447,666 | |
| | | | | | | | |
Media - 3.9% | | | | | | | | |
CBS Corporation - Class B | | | 8,500 | | | | 230,690 | |
DIRECTTV - Class A (a) | | | 3,300 | | | | 141,108 | |
Time Warner Inc. | | | 5,800 | | | | 209,612 | |
The Walt Disney Company | | | 4,000 | | | | 150,000 | |
| | | | | | | | |
| | | | | | | 731,410 | |
| | | | | | | | |
The accompanying notes are an integral part of these financial statements.
21
LKCM BALANCED FUND
SCHEDULEOF INVESTMENTS, CONTINUED
December 31, 2011
| | | | | | | | |
| | | Shares | | | Value | |
COMMON STOCKS | | | | | | | | |
Multiline Retail - 0.8% | | | | | | | | |
Kohl’s Corporation | | | 3,100 | | | $ | 152,985 | |
| | | | | | | | |
Oil & Gas & Consumable Fuels - 9.9% | | | | | | | | |
Cabot Oil & Gas Corporation | | | 2,500 | | | | 189,750 | |
Chevron Corporation | | | 2,095 | | | | 222,908 | |
Devon Energy Corporation | | | 2,400 | | | | 148,800 | |
EOG Resources, Inc. | | | 1,900 | | | | 187,169 | |
Exxon Mobil Corporation | | | 3,732 | | | | 316,324 | |
Pioneer Natural Resources Company | | | 2,200 | | | | 196,856 | |
Range Resources Corporation | | | 2,500 | | | | 154,850 | |
SM Energy Company | | | 2,400 | | | | 175,440 | |
The Williams Companies, Inc. | | | 7,700 | | | | 254,254 | |
| | | | | | | | |
| | | | | | | 1,846,351 | |
| | | | | | | | |
Personal Products - 0.9% | | | | | | | | |
Avon Products, Inc. | | | 9,700 | | | | 169,459 | |
| | | | | | | | |
Pharmaceuticals - 1.8% | | | | | | | | |
Abbott Laboratories | | | 4,100 | | | | 230,543 | |
Teva Pharmaceutical Industries Ltd. - ADR (b) | | | 2,500 | | | | 100,900 | |
| | | | | | | | |
| | | | | | | 331,443 | |
| | | | | | | | |
Software - 3.1% | | | | | | | | |
Adobe Systems Incorporated (a) | | | 6,700 | | | | 189,409 | |
Nuance Communications, Inc. (a) | | | 9,400 | | | | 236,504 | |
Oracle Corporation | | | 5,500 | | | | 141,075 | |
| | | | | | | | |
| | | | | | | 566,988 | |
| | | | | | | | |
Specialty Retail - 2.0% | | | | | | | | |
The Home Depot, Inc. | | | 4,400 | | | | 184,976 | |
O’Reilly Automotive, Inc. (a) | | | 2,300 | | | | 183,885 | |
| | | | | | | | |
| | | | | | | 368,861 | |
| | | | | | | | |
Textiles, Apparel & Luxury Goods - 1.0% | | | | | | | | |
VF Corporation | | | 1,400 | | | | 177,786 | |
| | | | | | | | |
Thrifts & Mortgage Finance - 1.2% | | | | | | | | |
Capitol Federal Financial Inc. | | | 19,500 | | | | 225,030 | |
| | | | | | | | |
TOTAL COMMON STOCKS (Cost $10,063,470) | | | | | | | 13,379,608 | |
| | | | | | | | |
| | | Principal
Amount | | | | |
CORPORATE BONDS - 27.7% | | | | | | | | |
Air Freight & Logistics - 0.3% | | | | | | | | |
United Parcel Service, Inc. | | | | | | | | |
3.875%, 04/01/2014 | | $ | 50,000 | | | | 53,378 | |
| | | | | | | | |
Banks - 0.6% | | | | | | | | |
Wells Fargo & Company | | | | | | | | |
3.75%, 10/01/2014 | | | 100,000 | | | | 105,641 | |
| | | | | | | | |
Beverages - 1.2% | | | | | | | | |
The Coca-Cola Company | | | | | | | | |
5.35%, 11/15/2017 | | | 100,000 | | | | 120,206 | |
| | | | | | | | |
| | | | | | | | |
| | | Principal
Amount | | | Value | |
CORPORATE BONDS | | | | | | | | |
Beverages - 1.2%, Continued | | | | | | | | |
PepsiCo, Inc. | | | | | | | | |
4.65%, 02/15/2013 | | $ | 100,000 | | | $ | 104,654 | |
| | | | | | | | |
| | | | | | | 224,860 | |
| | | | | | | | |
Biotechnology - 1.1% | | | | | | | | |
Celgene Corporation | | | | | | | | |
2.45%, 10/15/2015 | | | 200,000 | | | | 202,798 | |
| | | | | | | | |
Capital Markets - 1.2% | | | | | | | | |
The Bank of New York Mellon Corporation | | | | | | | | |
3.10%, 01/15/2015 | | | 175,000 | | | | 182,666 | |
The Goldman Sachs Group, Inc. | | | | | | | | |
5.50%, 11/15/2014 | | | 35,000 | | | | 36,083 | |
| | | | | | | | |
| | | | | | | 218,749 | |
| | | | | | | | |
Chemicals - 2.2% | | | | | | | | |
Airgas, Inc. | | | | | | | | |
3.25%, 10/01/2015 | | | 125,000 | | | | 128,719 | |
E. I. du Pont de Nemours and Company | | | | | | | | |
3.25%, 01/15/2015 | | | 75,000 | | | | 80,041 | |
Eastman Chemical Company | | | | | | | | |
3.00%, 12/15/2015 | | | 100,000 | | | | 102,121 | |
Praxair, Inc. | | | | | | | | |
2.125%, 06/14/2013 | | | 100,000 | | | | 102,035 | |
| | | | | | | | |
| | | | | | | 412,916 | |
| | | | | | | | |
Computers & Peripherals - 1.4% | | | | | | | | |
Hewlett-Packard Company | | | | | | | | |
4.50%, 03/01/2013 | | | 100,000 | | | | 102,874 | |
International Business Machines Corporation | | | | | | | | |
2.10%, 05/06/2013 | | | 150,000 | | | | 153,145 | |
| | | | | | | | |
| | | | | | | 256,019 | |
| | | | | | | | |
Containers & Packaging - 0.4% | | | | | | | | |
Ball Corporation | | | | | | | | |
7.125%, 09/01/2016 | | | | | | | | |
Callable 09/01/2013 | | | 75,000 | | | | 81,937 | |
| | | | | | | | |
Diversified Financial Services - 0.9% | | | | | | | | |
JPMorgan Chase & Co.: | | | | | | | | |
1.65%, 09/30/2013 | | | 100,000 | | | | 100,761 | |
2.05%, 01/24/2014 | | | 75,000 | | | | 75,094 | |
| | | | | | | | |
| | | | | | | 175,855 | |
| | | | | | | | |
Diversified Telecommunication Services - 1.3% | | | | | | | | |
AT&T Inc. | | | | | | | | |
5.10%, 09/15/2014 | | | 125,000 | | | | 137,768 | |
Verizon Communications Inc. | | | | | | | | |
3.00%, 04/01/2016 | | | 100,000 | | | | 104,824 | |
| | | | | | | | |
| | | | | | | 242,592 | |
| | | | | | | | |
Electric Utilities - 1.3% | | | | | | | | |
Duke Energy Corporation | | | | | | | | |
3.95%, 09/15/2014 | | | 185,000 | | | | 197,507 | |
The accompanying notes are an integral part of these financial statements.
22
LKCM BALANCED FUND
SCHEDULEOF INVESTMENTS, CONTINUED
December 31, 2011
| | | | | | | | |
| | | Principal
Amount | | | Value | |
CORPORATE BONDS | | | | | | | | |
Electric Utilities - 1.3%, Continued | |
Georgia Power Company | | | | | | | | |
1.30%, 09/15/2013 | | $ | 50,000 | | | $ | 50,483 | |
| | | | | | | | |
| | | | | | | 247,990 | |
| | | | | | | | |
Electrical Equipment & Instruments - 0.4% | |
Emerson Electric Co. | | | | | | | | |
4.50%, 05/01/2013 | | | 75,000 | | | | 78,461 | |
| | | | | | | | |
Electronic Equipment & Instruments - 1.0% | |
Agilent Technologies, Inc. | | | | | | | | |
2.50%, 07/15/2013 | | | 180,000 | | | | 181,768 | |
| | | | | | | | |
Food & Drug Retailing - 1.5% | |
CVS Caremark Corporation: | | | | | | | | |
3.25%, 05/18/2015 | | | 50,000 | | | | 52,760 | |
5.75%, 06/01/2017 | | | 100,000 | | | | 116,822 | |
Wal-Mart Stores, Inc. | | | | | | | | |
4.55%, 05/01/2013 | | | 100,000 | | | | 105,580 | |
| | | | | | | | |
| | | | | | | 275,162 | |
| | | | | | | | |
Food Products - 1.3% | |
Kraft Foods Inc. | | | | | | | | |
2.625%, 05/08/2013 | | | 175,000 | | | | 178,844 | |
McCormick & Company, Incorporated | | | | | | | | |
5.25%, 09/01/2013 | | | 50,000 | | | | 53,556 | |
| | | | | | | | |
| | | | | | | 232,400 | |
| | | | | | | | |
Health Care Equipment & Supplies - 0.9% | |
Covidien International Finance S.A. (b) | | | | | | | | |
2.80%, 06/15/2015 | | | 50,000 | | | | 51,948 | |
Thermo Fisher Scientific, Inc. | | | | | | | | |
3.20%, 05/01/2015 | | | 110,000 | | | | 116,361 | |
| | | | | | | | |
| | | | | | | 168,309 | |
| | | | | | | | |
Health Care Providers & Services - 0.6% | |
McKesson Corporation | | | | | | | | |
3.25%, 03/01/2016 | | | 100,000 | | | | 105,936 | |
| | | | | | | | |
Industrial Conglomerates - 0.6% | |
General Electric Company | | | | | | | | |
5.00%, 02/01/2013 | | | 100,000 | | | | 104,237 | |
| | | | | | | | |
Insurance - 1.0% | |
Berkshire Hathaway Inc. | | | | | | | | |
4.85%, 01/15/2015 | | | 100,000 | | | | 110,853 | |
Prudential Financial, Inc. | | | | | | | | |
2.75%, 01/14/2013 | | | 75,000 | | | | 75,665 | |
| | | | | | | | |
| | | | | | | 186,518 | |
| | | | | | | | |
Machinery - 0.7% | |
Danaher Corporation | | | | | | | | |
1.30%, 06/23/2014 | | | 125,000 | | | | 126,873 | |
| | | | | | | | |
Media - 1.5% | |
DIRECTTV Holdings LLC | | | | | | | | |
3.55%, 03/15/2015 | | | 100,000 | | | | 104,166 | |
| | | | | | | | |
| | | Principal
Amount | | | Value | |
CORPORATE BONDS | | | | | | | | |
Media - 1.5%, Continued | |
Time Warner Inc. | | | | | | | | |
3.15%, 07/15/2015 | | $ | 175,000 | | | $ | 182,173 | |
| | | | | | | | |
| | | | | | | 286,339 | |
| | | | | | | | |
Oil & Gas & Consumable Fuels - 2.6% | |
Apache Corporation | | | | | | | | |
5.625%, 01/15/2017 | | | 75,000 | | | | 89,004 | |
ConocoPhillips | | | | | | | | |
5.50%, 04/15/2013 | | | 100,000 | | | | 105,940 | |
EOG Resources, Inc. | | | | | | | | |
6.125%, 10/01/2013 | | | 100,000 | | | | 108,596 | |
Noble Energy, Inc. | | | | | | | | |
5.25%, 04/15/2014 | | | 100,000 | | | | 108,157 | |
Occidental Petroleum Corporation | | | | | | | | |
1.45%, 12/13/2013 | | | 75,000 | | | | 76,337 | |
| | | | | | | | |
| | | | | | | 488,034 | |
| | | | | | | | |
Pharmaceuticals - 1.1% | |
Teva Pharmaceutical Industries Ltd. (b): | | | | | | | | |
1.70%, 03/21/2014 | | | 75,000 | | | | 75,427 | |
3.00%, 06/15/2015 | | | 125,000 | | | | 130,277 | |
| | | | | | | | |
| | | | | | | 205,704 | |
| | | | | | | | |
Semiconductor Equipment & Products - 0.6% | |
National Semiconductor Corporation | | | | | | | | |
3.95%, 04/15/2015 | | | 100,000 | | | | 108,103 | |
| | | | | | | | |
Software - 2.0% | |
Adobe Systems Incorporated | | | | | | | | |
3.25%, 02/01/2015 | | | 200,000 | | | | 210,089 | |
Oracle Corporation | | | | | | | | |
3.75%, 07/08/2014 | | | 150,000 | | | | 161,419 | |
| | | | | | | | |
| | | | | | | 371,508 | |
| | | | | | | | |
TOTAL CORPORATE BONDS
(Cost $4,968,881) | | | | | | | 5,142,087 | |
| | | | | | | | |
| | | Shares | | | | |
SHORT-TERM INVESTMENT - 0.0% | |
Money Market Fund (c) - 0.0% | |
Federated Government Obligations Fund - Institutional Shares, 0.01% | | | 2,038 | | | | 2,038 | |
| | | | | | | | |
TOTAL SHORT-TERM INVESTMENT
(Cost $2,038) | | | | | | | 2,038 | |
| | | | | | | | |
Total Investments - 99.8%
(Cost $15,034,389) | | | | | | | 18,523,733 | |
Other Assets in Excess of Liabilities - 0.2% | | | | | | | 36,017 | |
| | | | | | | | |
TOTAL NET ASSETS - 100.0% | | | | | | $ | 18,559,750 | |
| | | | | | | | |
ADR American Depository Receipt.
| (a) | Non-income producing security. |
| (b) | U.S. Dollar-denominated foreign security. |
| (c) | The rate quoted is the annualized seven-day yield of the fund at period end. |
The Global Industry Classification Standard (GICS®) was developed by and/or is the exclusive property of MSCI, Inc. and Standard & Poor Financial Services LLC (“S&P”). GICS is a service mark of MSCI and S&P and has been licensed for use by U.S. Bancorp Fund Services, LLC.
The accompanying notes are an integral part of these financial statements.
23
LKCM FIXED INCOME FUND
SCHEDULEOF INVESTMENTS
December 31, 2011
| | | | | | | | |
| | | Principal
Amount | | | Value | |
CORPORATE BONDS - 91.6% | | | | | | | | |
Aerospace & Defense - 3.2% | | | | | | | | |
General Dynamics Corporation: | | | | | | | | |
4.25%, 05/15/2013 | | $ | 250,000 | | | $ | 262,284 | |
5.25%, 02/01/2014 | | | 225,000 | | | | 245,626 | |
5.375%, 08/15/2015 | | | 1,375,000 | | | | 1,573,052 | |
Honeywell International Inc.: | | | | | | | | |
4.25%, 03/01/2013 | | | 1,300,000 | | | | 1,356,599 | |
3.875%, 02/15/2014 | | | 270,000 | | | | 288,214 | |
Lockheed Martin Corporation | | | | | | | | |
7.65%, 05/01/2016 | | | 1,250,000 | | | | 1,529,940 | |
Rockwell Collins, Inc. | | | | | | | | |
4.75%, 12/01/2013 | | | 430,000 | | | | 456,222 | |
| | | | | | | | |
| | | | | | | 5,711,937 | |
| | | | | | | | |
Air Freight & Logistics - 0.4% | | | | | | | | |
United Parcel Service, Inc. | | | | | | | | |
3.875%, 04/01/2014 | | | 625,000 | | | | 667,221 | |
| | | | | | | | |
Banks - 1.2% | | | | | | | | |
Bank of America Corporation: | | | | | | | | |
7.375%, 05/15/2014 | | | 1,000,000 | | | | 1,037,418 | |
5.375%, 06/15/2014 | | | 1,025,000 | | | | 1,020,796 | |
| | | | | | | | |
| | | | | | | 2,058,214 | |
| | | | | | | | |
Beverages - 3.2% | | | | | | | | |
Anheuser-Busch Inbev Worldwide Inc. | | | | | | | | |
3.00%, 10/15/2012 | | | 2,000,000 | | | | 2,031,698 | |
The Coca-Cola Company: | | | | | | | | |
3.625%, 03/15/2014 | | | 400,000 | | | | 426,034 | |
5.35%, 11/15/2017 | | | 1,500,000 | | | | 1,803,096 | |
PepsiCo, Inc.: | | | | | | | | |
4.65%, 02/15/2013 | | | 1,035,000 | | | | 1,083,169 | |
7.90%, 11/01/2018 | | | 214,000 | | | | 289,317 | |
| | | | | | | | |
| | | | | | | 5,633,314 | |
| | | | | | | | |
Biotechnology - 2.7% | | | | | | | | |
Celgene Corporation | | | | | | | | |
2.45%, 10/15/2015 | | | 3,619,000 | | | | 3,669,630 | |
Gilead Sciences, Inc. | | | | | | | | |
4.50%, 04/01/2021 | | | 1,000,000 | | | | 1,062,247 | |
| | | | | | | | |
| | | | | | | 4,731,877 | |
| | | | | | | | |
Building Products - 1.7% | | | | | | | | |
Masco Corporation: | | | | | | | | |
5.875%, 07/15/2012 | | | 1,645,000 | | | | 1,669,630 | |
7.125%, 03/15/2020 | | | 1,350,000 | | | | 1,364,548 | |
| | | | | | | | |
| | | | | | | 3,034,178 | |
| | | | | | | | |
Capital Markets - 2.6% | | | | | | | | |
The Bank of New York Mellon Corporation | | | | | | | | |
3.10%, 01/15/2015 | | | 738,000 | | | | 770,328 | |
Goldman Sachs Group, Inc. | | | | | | | | |
5.125%, 01/15/2015 | | | 1,000,000 | | | | 1,022,822 | |
| | | | | | | | |
| | | Principal
Amount | | | Value | |
CORPORATE BONDS | | | | | | | | |
Capital Markets - 2.6%, Continued | | | | | |
Morgan Stanley: | | | | | | | | |
4.50%, 08/30/2015 | | $ | 1,000,000 | | | $ | 933,208 | |
5.00%, 08/31/2025 | | | | | | | | |
Callable 02/29/2012 | | | 2,000,000 | | | | 1,834,164 | |
| | | | | | | | |
| | | | | | | 4,560,522 | |
| | | | | | | | |
Chemicals - 5.3% | | | | | | | | |
Airgas, Inc.: | | | | | | | | |
2.85%, 10/01/2013 | | | 1,160,000 | | | | 1,182,258 | |
3.25%, 10/01/2015 | | | 1,669,000 | | | | 1,718,653 | |
E. I. du Pont de Nemours and Company | | | | | | | | |
3.25%, 01/15/2015 | | | 1,775,000 | | | | 1,894,305 | |
Eastman Chemical Company | | | | | | | | |
3.00%, 12/15/2015 | | | 2,625,000 | | | | 2,680,671 | |
The Lubrizol Corporation | | | | | | | | |
5.50%, 10/01/2014 | | | 1,579,000 | | | | 1,759,871 | |
Praxair, Inc. | | | | | | | | |
5.25%, 11/15/2014 | | | 200,000 | | | | 224,619 | |
| | | | | | | | |
| | | | | | | 9,460,377 | |
| | | | | | | | |
Commercial Services & Supplies - 0.6% | | | | | | | | |
Republic Services, Inc. | | | | | | | | |
5.50%, 09/15/2019 | | | 1,000,000 | | | | 1,155,917 | |
| | | | | | | | |
Communications Equipment - 2.6% | | | | | | | | |
Cisco Systems, Inc.: | | | | | | | | |
2.90%, 11/17/2014 | | | 340,000 | | | | 359,944 | |
5.50%, 02/22/2016 | | | 1,000,000 | | | | 1,164,825 | |
4.95%, 02/15/2019 | | | 700,000 | | | | 812,701 | |
Harris Corporation: | | | | | | | | |
5.00%, 10/01/2015 | | | 1,088,000 | | | | 1,181,984 | |
6.375%, 06/15/2019 | | | 900,000 | | | | 1,027,261 | |
| | | | | | | | |
| | | | | | | 4,546,715 | |
| | | | | | | | |
Computers & Peripherals - 2.7% | | | | | | | | |
Dell Inc. | | | | | | | | |
5.625%, 04/15/2014 | | | 750,000 | | | | 822,872 | |
Hewlett-Packard Company: | | | | | | | | |
4.25%, 02/24/2012 | | | 200,000 | | | | 200,908 | |
6.50%, 07/01/2012 | | | 700,000 | | | | 719,130 | |
4.50%, 03/01/2013 | | | 1,295,000 | | | | 1,332,218 | |
International Business Machines Corporation | | | | | | | | |
5.70%, 09/14/2017 | | | 1,500,000 | | | | 1,818,579 | |
| | | | | | | | |
| | | | | | | 4,893,707 | |
| | | | | | | | |
Containers & Packaging - 4.3% | | | | | | | | |
Ball Corporation: | | | | | | | | |
7.125%, 09/01/2016 | | | | | | | | |
Callable 09/01/2013 | | | 1,825,000 | | | | 1,993,812 | |
6.625%, 03/15/2018 | | | | | | | | |
Callable 02/13/2012 | | | 1,900,000 | | | | 1,957,000 | |
5.75%, 05/15/2021 | | | | | | | | |
Callable 11/15/2015 | | | 2,000,000 | | | | 2,105,000 | |
The accompanying notes are an integral part of these financial statements.
24
LKCM FIXED INCOME FUND
SCHEDULEOF INVESTMENTS, CONTINUED
December 31, 2011
| | | | | | | | |
| | | Principal
Amount | | | Value | |
CORPORATE BONDS | | | | | | | | |
Containers & Packaging - 4.3%, Continued | | | | | | | | |
Packaging Corp. of America | | | | | | | | |
5.75%, 08/01/2013 | | $ | 1,500,000 | | | $ | 1,581,338 | |
| | | | | | | | |
| | | | | | | 7,637,150 | |
| | | | | | | | |
Diversified Financial Services - 1.3% | | | | | | | | |
JPMorgan Chase & Co. | | | | | | | | |
4.25%, 10/15/2020 | | | 2,325,000 | | | | 2,345,590 | |
| | | | | | | | |
Diversified Telecommunication Services - 5.8% | | | | | | | | |
AT&T Inc. | | | | | | | | |
5.10%, 09/15/2014 | | | 1,750,000 | | | | 1,928,755 | |
CenturyLink, Inc.: | | | | | | | | |
5.15%, 06/15/2017 | | | 2,000,000 | | | | 1,984,692 | |
6.15%, 09/15/2019 | | | 1,402,000 | | | | 1,410,544 | |
6.45%, 06/15/2021 | | | 2,000,000 | | | | 2,007,194 | |
Verizon Communications Inc.: | | | | | | | | |
5.25%, 04/15/2013 | | | 275,000 | | | | 290,280 | |
5.55%, 02/15/2016 | | | 1,000,000 | | | | 1,145,339 | |
3.00%, 04/01/2016 | | | 490,000 | | | | 513,635 | |
5.50%, 02/15/2018 | | | 875,000 | | | | 1,021,433 | |
| | | | | | | | |
| | | | | | | 10,301,872 | |
| | | | | | | | |
Electric Utilities - 0.6% | | | | | | | | |
Southern Power Co. | | | | | | | | |
4.875%, 07/15/2015 | | | 1,050,000 | | | | 1,150,034 | |
| | | | | | | | |
Electrical Equipment & Instruments - 0.2% | | | | | | | | |
Emerson Electric Co. | | | | | | | | |
4.50%, 05/01/2013 | | | 425,000 | | | | 444,611 | |
| | | | | | | | |
Electronic Equipment & Instruments - 0.8% | | | | | | | | |
Agilent Technologies, Inc. | | | | | | | | |
2.50%, 07/15/2013 | | | 1,400,000 | | | | 1,413,751 | |
| | | | | | | | |
Energy Equipment & Services - 1.0% | | | | | | | | |
Weatherford International, Inc. | | | | | | | | |
6.35%, 06/15/2017 | | | 1,550,000 | | | | 1,733,658 | |
| | | | | | | | |
Food & Drug Retailing - 5.3% | | | | | | | | |
CVS Caremark Corporation: | | | | | | | | |
4.875%, 09/15/2014 | | | 330,000 | | | | 361,099 | |
3.25%, 05/18/2015 | | | 1,000,000 | | | | 1,055,194 | |
5.75%, 06/01/2017 | | | 2,750,000 | | | | 3,212,611 | |
Sysco Corporation | | | | | | | | |
4.20%, 02/12/2013 | | | 1,175,000 | | | | 1,219,222 | |
Walgreen Company | | | | | | | | |
4.875%, 08/01/2013 | | | 1,955,000 | | | | 2,086,575 | |
Wal-Mart Stores, Inc. | | | | | | | | |
4.55%, 05/01/2013 | | | 1,400,000 | | | | 1,478,117 | |
| | | | | | | | |
| | | | | | | 9,412,818 | |
| | | | | | | | |
Food Products - 1.3% | | | | | | | | |
Kraft Foods Inc. | | | | | | | | |
2.625%, 05/08/2013 | | | 750,000 | | | | 766,474 | |
McCormick & Company, Incorporated | | | | | | | | |
5.25%, 09/01/2013 | | | 1,450,000 | | | | 1,553,117 | |
| | | | | | | | |
| | | | | | | 2,319,591 | |
| | | | | | | | |
| | | | | | | | |
| | | Principal
Amount | | | Value | |
CORPORATE BONDS | | | | | | | | |
Health Care Equipment & Supplies - 2.7% | | | | | |
Covidien International Finance S.A. (a) | | | | | | | | |
1.875%, 06/15/2013 | | $ | 1,550,000 | | | $ | 1,565,275 | |
DENTSPLY International Inc. | | | | | | | | |
2.75%, 08/15/2016 | | | 1,270,000 | | | | 1,283,573 | |
Medtronic, Inc. | | | | | | | | |
4.50%, 03/15/2014 | | | 900,000 | | | | 969,975 | |
Thermo Fisher Scientific, Inc. | | | | | | | | |
3.25%, 11/20/2014 | | | 900,000 | | | | 953,683 | |
| | | | | | | | |
| | | | | | | 4,772,506 | |
| | | | | | | | |
Health Care Providers & Services - 2.5% | | | | | | | | |
Express Scripts, Inc.: | | | | | | | | |
5.25%, 06/15/2012 | | | 1,000,000 | | | | 1,019,019 | |
6.25%, 06/15/2014 | | | 1,000,000 | | | | 1,090,559 | |
McKesson Corporation | | | | | | | | |
3.25%, 03/01/2016 | | | 2,275,000 | | | | 2,410,033 | |
| | | | | | | | |
| | | | | | | 4,519,611 | |
| | | | | | | | |
Hotels, Restaurants & Leisure - 0.7% | | | | | | | | |
McDonald’s Corporation | | | | | | | | |
5.35%, 03/01/2018 | | | 1,000,000 | | | | 1,196,500 | |
| | | | | | | | |
Household Durables - 2.5% | | | | | | | | |
Jarden Corporation: | | | | | | | | |
8.00%, 05/01/2016 | | | | | | | | |
Callable 05/01/2013 | | | 1,000,000 | | | | 1,085,000 | |
7.50%, 05/01/2017 | | | 1,900,000 | | | | 2,023,500 | |
7.50%, 01/15/2020 | | | | | | | | |
Callable 01/15/2015 | | | 1,340,000 | | | | 1,433,800 | |
| | | | | | | | |
| | | | | | | 4,542,300 | |
| | | | | | | | |
Household Products - 0.6% | | | | | | | | |
The Procter & Gamble Company | | | | | | | | |
8.00%, 09/01/2024 | | | | | | | | |
Putable 09/1/2014 | | | 775,000 | | | | 1,151,612 | |
| | | | | | | | |
Industrial Conglomerates - 1.8% | | | | | | | | |
3M Co. | | | | | | | | |
4.375%, 08/15/2013 | | | 1,500,000 | | | | 1,595,093 | |
General Electric Company | | | | | | | | |
5.00%, 02/01/2013 | | | 1,600,000 | | | | 1,667,792 | |
| | | | | | | | |
| | | | | | | 3,262,885 | |
| | | | | | | | |
Insurance - 2.5% | | | | | | | | |
Berkshire Hathaway Inc. | | | | | | | | |
4.85%, 01/15/2015 | | | 1,225,000 | | | | 1,357,944 | |
Prudential Financial, Inc.: | | | | | | | | |
3.625%, 09/17/2012 | | | 1,375,000 | | | | 1,396,559 | |
2.75%, 01/14/2013 | | | 1,700,000 | | | | 1,715,081 | |
| | | | | | | | |
| | | | | | | 4,469,584 | |
| | | | | | | | |
IT Consulting & Services - 0.6% | | | | | | | | |
Western Union Company | | | | | | | | |
5.93%, 10/01/2016 | | | 1,000,000 | | | | 1,127,938 | |
| | | | | | | | |
The accompanying notes are an integral part of these financial statements.
25
LKCM FIXED INCOME FUND
SCHEDULEOF INVESTMENTS, CONTINUED
December 31, 2011
| | | | | | | | |
| | | Principal
Amount | | | Value | |
CORPORATE BONDS | | | | | | | | |
Media - 3.6% | | | | | | | | |
DIRECTTV Holdings LLC | | | | | | | | |
3.55%, 03/15/2015 | | $ | 1,265,000 | | | $ | 1,317,696 | |
Time Warner Inc. | | | | | | | | |
3.15%, 07/15/2015 | | | 3,175,000 | | | | 3,305,140 | |
The Walt Disney Company | | | | | | | | |
5.625%, 09/15/2016 | | | 1,500,000 | | | | 1,778,616 | |
| | | | | | | | |
| | | | | | | 6,401,452 | |
| | | | | | | | |
Metals & Mining - 0.3% | | | | | | | | |
Alcoa Inc. | | | | | | | | |
5.55%, 02/01/2017 | | | 500,000 | | | | 533,770 | |
| | | | | | | | |
Multiline Retail - 2.8% | | | | | | | | |
Family Dollar Stores, Inc. | | | | | | | | |
5.00%, 02/01/2021 | | | 4,500,000 | | | | 4,639,572 | |
Kohl’s Corporation | | | | | | | | |
6.25%, 12/15/2017 | | | 282,000 | | | | 336,436 | |
| | | | | | | | |
| | | | | | | 4,976,008 | |
| | | | | | | | |
Oil & Gas & Consumable Fuels - 12.2% | | | | | | | | |
Anadarko Petroleum Corporation: | | | | | | | | |
5.95%, 09/15/2016 | | | 2,000,000 | | | | 2,269,452 | |
6.375%, 09/15/2017 | | | 2,000,000 | | | | 2,321,086 | |
Apache Corporation | | | | | | | | |
6.25%, 04/15/2012 | | | 1,593,000 | | | | 1,616,975 | |
ConocoPhillips | | | | | | | | |
4.75%, 10/15/2012 | | | 875,000 | | | | 901,300 | |
Devon Energy Corporation | | | | | | | | |
2.40%, 07/15/2016 | | | | | | | | |
Callable 6/15/2016 | | | 1,630,000 | | | | 1,670,711 | |
Enterprise Products Operating LLC: | | | | | | | | |
4.60%, 08/01/2012 | | | 1,525,000 | | | | 1,547,657 | |
3.20%, 02/01/2016 | | | 1,845,000 | | | | 1,911,914 | |
EOG Resources, Inc.: | | | | | | | | |
6.125%, 10/01/2013 | | | 1,500,000 | | | | 1,628,936 | |
2.95%, 06/01/2015 | | | 1,200,000 | | | | 1,255,025 | |
Noble Energy, Inc. | | | | | | | | |
5.25%, 04/15/2014 | | | 1,500,000 | | | | 1,622,358 | |
Noble Holding International Ltd (a) | | | | | | | | |
3.45%, 08/01/2015 | | | 3,665,000 | | | | 3,816,115 | |
Peabody Energy Corporation | | | | | | | | |
6.50%, 09/15/2020 | | | 500,000 | | | | 527,500 | |
Range Resources Corporation | | | | | | | | |
8.00%, 05/15/2019 | | | | | | | | |
Callable 5/15/2014 | | | 500,000 | | | | 560,000 | |
| | | | | | | | |
| | | | | | | 21,649,029 | |
| | | | | | | | |
Pharmaceuticals - 3.2% | | | | | | | | |
Eli Lilly & Company | | | | | | | | |
4.20%, 03/06/2014 | | | 950,000 | | | | 1,018,429 | |
Teva Pharmaceutical Industries Ltd. (a): | | | | | | | | |
1.70%, 03/21/2014 | | | 425,000 | | | | 427,424 | |
3.00%, 06/15/2015 | | | 2,030,000 | | | | 2,115,694 | |
5.55%, 02/01/2016 | | | 1,860,000 | | | | 2,104,432 | |
| | | | | | | | |
| | | | | | | 5,665,979 | |
| | | | | | | | |
| | | | | | | | |
| | | Principal
Amount | | | Value | |
CORPORATE BONDS | | | | | | | | |
Road & Rail - 0.6% | | | | | | | | |
Burlington Northern | | | | | | | | |
Santa Fe Corporation | | | | | | | | |
5.65%, 05/01/2017 | | $ | 185,000 | | | $ | 213,749 | |
Norfolk Southern Corporation | | | | | | | | |
5.257%, 09/17/2014 | | | 750,000 | | | | 827,772 | |
| | | | | | | | |
| | | | | | | 1,0 41,521 | |
| | | | | | | | |
Semiconductor Equipment & Products - 3.0% | | | | | | | | |
Analog Devices, Inc. | | | | | | | | |
3.00%, 04/15/2016 | | | 1,050,000 | | | | 1,107,756 | |
Applied Materials, Inc. | | | | | | | | |
2.65%, 06/15/2016 | | | 1,717,000 | | | | 1,759,607 | |
National Semiconductor Corporation | | | | | | | | |
3.95%, 04/15/2015 | | | 2,275,000 | | | | 2,459,348 | |
| | | | | | | | |
| | | | | | | 5,326,711 | |
| | | | | | | | |
Software - 3.4% | | | | | | | | |
Adobe Systems Incorporated | | | | | | | | |
3.25%, 02/01/2015 | | | 2,175,000 | | | | 2,284,724 | |
Microsoft Corporation | | | | | | | | |
2.95%, 06/01/2014 | | | 1,910,000 | | | | 2,030,128 | |
Oracle Corporation | | | | | | | | |
3.75%, 07/08/2014 | | | 1,650,000 | | | | 1,775,606 | |
| | | | | | | | |
| | | | | | | 6,090,458 | |
| | | | | | | | |
Specialty Retail - 1.8% | | | | | | | | |
Lowe’s Companies, Inc. | | | | | | | | |
5.00%, 10/15/2015 | | | 525,000 | | | | 588,923 | |
O’Reilly Automotive, Inc. | | | | | | | | |
4.875%, 01/14/2021 | | | | | | | | |
Callable 10/14/2020 | | | 1,000,000 | | | | 1,065,943 | |
The Sherwin-Williams Company | | | | | | | | |
3.125%, 12/15/2014 | | | 1,450,000 | | | | 1,528,984 | |
| | | | | | | | |
| | | | | | | 3,183,850 | |
| | | | | | | | |
TOTAL CORPORATE BONDS
(Cost $154,501,026) | | | | | | | 163,124,768 | |
| | | | | | | | |
| | | Shares | | | | |
PREFERRED STOCKS - 2.3% | | | | | | | | |
Capital Markets - 1.2% | | | | | | | | |
The Goldman Sachs Group, Inc. | | | 40,000 | | | | 666,800 | |
Merrill Lynch Preferred Capital Trust III | | | | | | | | |
Callable 02/10/2012 | | | 75,000 | | | | 1,494,000 | |
| | | | | | | | |
| | | | | | | 2,160,800 | |
| | | | | | | | |
Diversified Financial Services - 1.1% | | | | | | | | |
JPMorgan Chase Capital XIV | | | | | | | | |
Callable 02/10/2012 | | | 75,000 | | | | 1,903,500 | |
| | | | | | | | |
TOTAL PREFERRED STOCKS
(Cost $4,701,733) | | | | | | | 4,064,300 | |
| | | | | | | | |
The accompanying notes are an integral part of these financial statements.
26
LKCM FIXED INCOME FUND
SCHEDULEOF INVESTMENTS, CONTINUED
December 31, 2011
| | | | | | | | |
| | | Principal
Amount | | | Value | |
U.S. GOVERNMENT & AGENCY ISSUES - 3.6% | |
Fannie Mae - 0.6% | | | | | | | | |
5.00%, 03/15/2016 | | $ | 1,000,000 | | | $ | 1,166,448 | |
| | | | | | | | |
Federal Home Loan Bank - 1.0% | | | | | | | | |
5.50%, 08/13/2014 | | | 500,000 | | | | 563,874 | |
4.875%, 05/17/2017 | | | 1,000,000 | | | | 1,187,849 | |
| | | | | | | | |
| | | | | | | 1,751,723 | |
| | | | | | | | |
Freddie Mac - 0.3% | | | | | | | | |
5.125%, 11/17/2017 | | | 500,000 | | | | 602,827 | |
| | | | | | | | |
U.S. Treasury Inflation Indexed Bonds - 0.7% | |
3.375%, 01/15/2012 | | | 1,275,150 | | | | 1,276,346 | |
| | | | | | | | |
U.S. Treasury Notes - 1.0% | | | | | | | | |
4.25%, 11/15/2014 | | | 500,000 | | | | 555,235 | |
4.25%, 08/15/2015 | | | 500,000 | | | | 566,680 | |
4.50%, 02/15/2016 | | | 500,000 | | | | 578,164 | |
| | | | | | | | |
| | | | | | | 1,700,079 | |
| | | | | | | | |
TOTAL U.S. GOVERNMENT & AGENCY ISSUES
(Cost $5,805,774) | | | | 6,497,423 | |
| | | | | | | | |
SHORT-TERM INVESTMENTS - 1.3% | | | | | | | | |
Corporate Bonds - 0.7% | | | | | | | | |
Enterprise Products Operating LLC | | | | | | | | |
4.60%, 08/01/2012 | | | 300,000 | | | | 304,457 | |
Goldman Sachs Group, Inc. | | | | | | | | |
5.70%, 09/01/2012 | | | 1,000,000 | | | | 1,017,770 | |
| | | | | | | | |
| | | | | | | 1,322,227 | |
| | | | | | | | |
| | | Shares | | | | |
Money Market Fund (b) - 0.6% | | | | | | | | |
Federated Government Obligations Fund - Institutional Shares, 0.01% | | | 1,024,156 | | | | 1,024,156 | |
| | | | | | | | |
TOTAL SHORT-TERM INVESTMENTS
(Cost $2,344,309) | | | | 2,346,383 | |
| | | | | | | | |
Total Investments - 98.8%
(Cost $167,352,842) | | | | | | | 176,032,874 | |
Other Assets in Excess of Liabilities - 1.2% | | | | | | | 2,082,970 | |
| | | | | | | | |
TOTAL NET ASSETS - 100.0% | | | | | | $ | 178,115,844 | |
| | | | | | | | |
| (a) | U.S. Dollar-denominated foreign security. |
| (b) | The rate quoted is the annualized seven-day yield of the fund at period end. |
The Global Industry Classification Standard (GICS®) was developed by and/or is the exclusive property of MSCI, Inc. and Standard & Poor Financial Services LLC (“S&P”). GICS is a service mark of MSCI and S&P and has been licensed for use by U.S. Bancorp Fund Services, LLC.
The accompanying notes are an integral part of these financial statements.
27
STATEMENTOF ASSETSAND LIABILITIES
December 31, 2011
| | | | | | | | | | | | | | | | | | | | |
| | | LKCM | | | LKCM | | | LKCM | | | LKCM | | | LKCM | |
| | | Small Cap | | | Small-Mid Cap | | | Equity | | | Balanced | | | Fixed | |
| | | Equity Fund | | | Equity Fund | | | Fund | | | Fund | | | Income Fund | |
Assets: | | | | | | | | | | | | | | | | | | | | |
Investments, at value* | | $ | 830,117,014 | | | $ | 23,769,937 | | | $ | 102,159,256 | | | $ | 18,523,733 | | | $ | 176,032,874 | |
Cash | | | — | | | | — | | | | 6,800 | | | | — | | | | — | |
Dividends and interest receivable | | | 275,586 | | | | 7,184 | | | | 68,564 | | | | 63,409 | | | | 2,047,568 | |
Receivable from Adviser | | | — | | | | 5,349 | | | | — | | | | — | | | | — | |
Receivable for fund shares sold | | | 1,144,537 | | | | 12,500 | | | | 467,398 | | | | 1,280 | | | | 275,282 | |
Other assets | | | 57,489 | | | | 30 | | | | 15,175 | | | | 4,686 | | | | 22,618 | |
| | | | | | | | | | | | | | | | | | | | |
Total assets | | | 831,594,626 | | | | 23,795,000 | | | | 102,717,193 | | | | 18,593,108 | | | | 178,378,342 | |
| | | | | | | | | | | | | | | | | | | | |
Liabilities: | | | | | | | | | | | | | | | | | | | | |
Payable for investment advisory fees | | | 1,521,121 | | | | — | | | | 126,368 | | | | 15,660 | | | | 194,884 | |
Payable for investments purchased | | | 1,080,867 | | | | — | | | | — | | | | — | | | | — | |
Payable for fund shares redeemed | | | 276,208 | | | | 77 | | | | 95 | | | | 76 | | | | 74 | |
Administration expense payable | | | 110,296 | | | | 7,580 | | | | 14,657 | | | | 3,441 | | | | 23,662 | |
Professional fees payable | | | 69,745 | | | | 4,487 | | | | 10,783 | | | | 5,185 | | | | 17,943 | |
Distribution expense payable | | | 23,909 | | | | — | | | | — | | | | — | | | | — | |
Accrued expenses and other liabilities | | | 108,963 | | | | 28,350 | | | | 17,689 | | | | 8,996 | | | | 25,935 | |
| | | | | | | | | | | | | | | | | | | | |
Total liabilities | | | 3,191,109 | | | | 40,494 | | | | 169,592 | | | | 33,358 | | | | 262,498 | |
| | | | | | | | | | | | | | | | | | | | |
Net assets | | $ | 828,403,517 | | | $ | 23,754,506 | | | $ | 102,547,601 | | | $ | 18,559,750 | | | $ | 178,115,844 | |
| | | | | | | | | | | | | | | | | | | | |
Net assets consist of: | | | | | | | | | | | | | | | | | | | | |
Paid in capital | | $ | 663,988,087 | | | $ | 23,407,347 | | | $ | 85,222,607 | | | $ | 15,549,896 | | | $ | 169,322,353 | |
Undistributed net investment income | | | — | | | | — | | | | 631 | | | | 107 | | | | — | |
Accumulated net realized gain (loss) on securities | | | (1,994,380 | ) | | | (699,870 | ) | | | 94,936 | | | | (479,597 | ) | | | 113,459 | |
Net unrealized appreciation on investments | | | 166,409,810 | | | | 1,047,029 | | | | 17,229,427 | | | | 3,489,344 | | | | 8,680,032 | |
| | | | | | | | | | | | | | | | | | | | |
Net assets | | $ | 828,403,517 | | | $ | 23,754,506 | | | $ | 102,547,601 | | | $ | 18,559,750 | | | $ | 178,115,844 | |
| | | | | | | | | | | | | | | | | | | | |
INSTITUTIONAL CLASS** | | | | | | | | | | | | | | | | | | | | |
Net assets | | $ | 785,279,919 | | | $ | 23,754,506 | | | $ | 102,547,601 | | | $ | 18,559,750 | | | $ | 178,115,844 | |
Shares of beneficial interest outstanding (unlimited shares of no par value authorized) | | | 34,981,117 | | | | 2,682,025 | | | | 6,685,460 | | | | 1,277,271 | | | | 16,136,186 | |
Net asset value per share (offering and redemption price) | | $ | 22.45 | | | $ | 8.86 | | | $ | 15.34 | | | $ | 14.53 | | | $ | 11.04 | |
| | | | | | | | | | | | | | | | | | | | |
ADVISER CLASS | | | | | | | | | | | | | | | | | | | | |
Net assets | | $ | 43,123,598 | | | | | | | | | | | | | | | | | |
Shares of beneficial interest outstanding (unlimited shares of no par value authorized) | | | 1,970,863 | | | | | | | | | | | | | | | | | |
Net asset value per share (offering and redemption price) | | $ | 21.88 | | | | | | | | | | | | | | | | | |
| | | | | | | | | | | | | | | | | | | | |
| | | | | |
* Cost of Investments | | $ | 663,707,204 | | | $ | 22,722,908 | | | $ | 84,929,829 | | | $ | 15,034,389 | | | $ | 167,352,842 | |
| | | | | | | | | | | | | | | | | | | | |
| ** | Currently, only the Small Cap Equity , Small-Mid Cap Equity and Equity Funds offer a second class. |
The accompanying notes are an integral part of these financial statements.
28
STATEMENTOF OPERATIONS
For the Year Ended December 31, 2011
| | | | | | | | | | | | | | | | | | | | |
| | | LKCM
Small Cap
Equity Fund | | | LKCM
Small-Mid Cap
Equity Fund(1) | | | LKCM
Equity
Fund | | | LKCM
Balanced
Fund | | | LKCM
Fixed
Income Fund | |
Investment Income: | | | | | | | | | | | | | | | | | | | | |
Dividends* | | $ | 4,891,144 | | | $ | 53,857 | | | $ | 1,330,247 | | | $ | 221,509 | | | $ | 182,208 | |
Interest | | | 2,348 | | | | 91 | | | | 465 | | | | 154,365 | | | | 6,617,989 | |
| | | | | | | | | | | | | | | | | | | | |
Total income | | | 4,893,492 | | | | 53,948 | | | | 1,330,712 | | | | 375,874 | | | | 6,800,197 | |
| | | | | | | | | | | | | | | | | | | | |
Expenses: | | | | | | | | | | | | | | | | | | | | |
Investment advisory fees | | | 5,981,096 | | | | 68,556 | | | | 607,186 | | | | 123,676 | | | | 843,965 | |
Distribution expense - Adviser Class (Note B) | | | 100,358 | | | | — | | | | — | | | | — | | | | — | |
Administrative fees | | | 658,074 | | | | 29,706 | | | | 80,627 | | | | 20,325 | | | | 135,595 | |
Accounting and transfer agent fees and expenses | | | 313,193 | | | | 46,071 | | | | 73,021 | | | | 43,138 | | | | 94,272 | |
Professional fees | | | 160,798 | | | | 5,072 | | | | 20,344 | | | | 7,201 | | | | 36,333 | |
Custody fees and expenses | | | 100,283 | | | | 13,781 | | | | 12,100 | | | | 5,855 | | | | 17,749 | |
Trustees’ fees | | | 91,210 | | | | 280 | | | | 8,800 | | | | 2,150 | | | | 22,058 | |
Federal and state registration | | | 87,136 | | | | 30,095 | | | | 41,242 | | | | 10,840 | | | | 26,754 | |
Reports to shareholders | | | 41,115 | | | | 1,506 | | | | 3,678 | | | | 1,034 | | | | 4,078 | |
Other | | | 144,215 | | | | 905 | | | | 14,852 | | | | 3,314 | | | | 30,138 | |
| | | | | | | | | | | | | | | | | | | | |
Total expenses | | | 7,677,478 | | | | 195,972 | | | | 861,850 | | | | 217,533 | | | | 1,210,942 | |
Less, expense waiver and/or reimbursement (Note B) | | | — | | | | (104,564 | ) | | | (167,923 | ) | | | (65,317 | ) | | | (113,787 | ) |
| | | | | | | | | | | | | | | | | | | | |
Net expenses | | | 7,677,478 | | | | 91,408 | | | | 693,927 | | | | 152,216 | | | | 1,097,155 | |
| | | | | | | | | | | | | | | | | | | | |
Net investment income (loss) | | | (2 ,783,986 | ) | | | (37,460 | ) | | | 636,785 | | | | 223,658 | | | | 5,703,042 | |
| | | | | | | | | | | | | | | | | | | | |
Realized and Unrealized Gain (Loss) on Investments: | | | | | | | | | | | | | | | | | | | | |
Net realized gain (loss) on investments | | | 69,601,456 | | | | (699,870 | ) | | | 847,915 | | | | (4,518 | ) | | | 917,718 | |
Net change in unrealized appreciation/depreciation on investments | | | (35,091,526 | ) | | | 1,047,029 | | | | 1,370,417 | | | | 271,728 | | | | 230,560 | |
| | | | | | | | | | | | | | | | | | | | |
Net Realized and Unrealized Gain on Investments | | | 34,509,930 | | | | 347,159 | | | | 2,218,332 | | | | 267,210 | | | | 1,148,278 | |
| | | | | | | | | | | | | | | | | | | | |
Net Increase in Net Assets Resulting from Operations | | $ | 31,725,944 | | | $ | 309,699 | | | $ | 2,855,117 | | | $ | 490,868 | | | $ | 6,851,320 | |
| | | | | | | | | | | | | | | | | | | | |
| | | | | |
* Net of foreign taxes withheld | | $ | 5,861 | | | $ | 213 | | | $ | 2,400 | | | $ | 391 | | | $ | — | |
| | | | | | | | | | | | | | | | | | | | |
| (1) | For the period May 2, 2011 (commencement of operations) through December 31, 2011. |
The accompanying notes are an integral part of these financial statements.
29
STATEMENTSOF CHANGESIN NET ASSETS
| | | | | | | | | | | | |
| | | LKCM | | | LKCM | |
| | | Small Cap | | | Small-Mid Cap | |
| | | Equity Fund | | | Equity Fund | |
| | | | | | | | | May 2, 2011(1) | |
| | | Year Ended | | | Year Ended | | | through | |
| | | December 31, | | | December 31, | | | December 31, | |
| | | 2011 | | | 2010 | | | 2011 | |
Operations: | | | | | | | | | | | | |
Net investment loss | | $ | (2,783,986 | ) | | $ | (2,412,517 | ) | | $ | (37,460 | ) |
Net realized gain (loss) on investments | | | 69,601,456 | | | | 61,883,308 | | | | (699,870 | ) |
Net change in unrealized appreciation/depreciation on investments | | | (35,091,526 | ) | | | 123,384,121 | | | | 1,047,029 | |
| | | | | | | | | | | | |
Net increase in net assets resulting from operations | | | 31,725,944 | | | | 182,854,912 | | | | 309,699 | |
| | | | | | | | | | | | |
Net increase (decrease) in net assets from Fund share transactions (Note C) | | | 62,042,933 | | | | (13,111,435 | ) | | | 23,444,807 | |
| | | | | | | | | | | | |
Total increase in net assets | | | 93,768,877 | | | | 169,743,477 | | | | 23,754,506 | |
| | | |
Net Assets: | | | | | | | | | | | | |
Beginning of period | | | 734,634,640 | | | | 564,891,163 | | | | — | |
| | | | | | | | | | | | |
End of period | | $ | 828,403,517 | | | $ | 734,634,640 | | | $ | 23,754,506 | |
| | | | | | | | | | | | |
| (1) | Commencement of operations. |
| | | | | | | | | | | | | | | | |
| | | LKCM
Equity Fund | | | LKCM
Balanced Fund | |
| | | Year Ended | | | Year Ended | | | Year Ended | | | Year Ended | |
| | | December 31, | | | December 31, | | | December 31, | | | December 31, | |
| | | 2011 | | | 2010 | | | 2011 | | | 2010 | |
Operations: | | | | | | | | | | | | | | | | |
Net investment income | | $ | 636,785 | | | $ | 356,369 | | | $ | 223,658 | | | $ | 193,174 | |
Net realized gain (loss) on investments | | | 847,915 | | | | 2,560,907 | | | | (4,518 | ) | | | 241,576 | |
Net change in unrealized appreciation/depreciation on investments | | | 1,370,417 | | | | 7,275,495 | | | | 271,728 | | | | 1,014,807 | |
| | | | | | | | | | | | | | | | |
Net increase in net assets resulting from operations | | | 2,855,117 | | | | 10,192,771 | | | | 490,868 | | | | 1,449,557 | |
| | | | | | | | | | | | | | | | |
Dividends and Distributions to Shareholders: | | | | | | | | | | | | | | | | |
Net investment income | | | (636,154 | ) | | | (363,260 | ) | | | (223,616 | ) | | | (194,657 | ) |
Net realized gain on investments | | | (1,598,383 | ) | | | (361,522 | ) | | | — | | | | — | |
| | | | | | | | | | | | | | | | |
| | | (2,234,537 | ) | | | (724,782 | ) | | | (223,616 | ) | | | (194,657 | ) |
| | | | | | | | | | | | | | | | |
Net increase in net assets from Fund share transactions (Note C) | | | 29,557,371 | | | | 13,744,831 | | | | 1,806,145 | | | | 1,755,123 | |
| | | | | | | | | | | | | | | | |
Total increase in net assets | | | 30,177,951 | | | | 23,212,820 | | | | 2,073,397 | | | | 3,010,023 | |
| | | | |
Net Assets: | | | | | | | | | | | | | | | | |
Beginning of period | | | 72,369,650 | | | | 49,156,830 | | | | 16,486,353 | | | | 13,476,330 | |
| | | | | | | | | | | | | | | | |
End of period* | | $ | 102,547,601 | | | $ | 72,369,650 | | | $ | 18,559,750 | | | $ | 16,486,353 | |
| | | | | | | | | | | | | | | | |
| | | | |
* Including undistributed net investment income of | | $ | 631 | | | $ | — | | | $ | 107 | | | $ | 2,456 | |
| | | | | | | | | | | | | | | | |
The accompanying notes are an integral part of these financial statements.
30
STATEMENTSOF CHANGESIN NET ASSETS
| | | | | | | | |
| | | LKCM | |
| | | Fixed Income Fund | |
| | | Year Ended | | | Year Ended | |
| | | December 31, | | | December 31, | |
| | | 2011 | | | 2010 | |
Operations: | | | | | | | | |
Net investment income | | $ | 5,703,042 | | | $ | 5,688,502 | |
Net realized gain on investments | | | 917,718 | | | | 989,099 | |
Net change in unrealized appreciation/depreciation | | | 230,560 | | | | 2,215,990 | |
| | | | | | | | |
Net increase in net assets resulting from operations | | | 6,851,320 | | | | 8,893,591 | |
| | | | | | | | |
Dividends and Distributions to Shareholders: | | | | | | | | |
Net investment income | | | (5,721,525 | ) | | | (5,707,218 | ) |
Net realized gain on investments | | | (1,206,565 | ) | | | (636,805 | ) |
| | | | | | | | |
| | | (6,928,090 | ) | | | (6,344,023 | ) |
| | | | | | | | |
Net increase in net assets from Fund share transactions (Note C) | | | 15,840,038 | | | | 10,584,768 | |
| | | | | | | | |
Total increase in net assets | | | 15,763,268 | | | | 13,134,336 | |
| | |
Net Assets: | | | | | | | | |
Beginning of period | | | 162,352,576 | | | | 149,218,240 | |
| | | | | | | | |
End of period | | $ | 178,115,844 | | | $ | 162,352,576 | |
| | | | | | | | |
The accompanying notes are an integral part of these financial statements.
31
FINANCIAL HIGHLIGHTS
SELECTED DATAFOR EACH SHAREOF CAPITAL STOCK OUTSTANDING
| | | | | | | | | | | | | | | | | | | | |
| | | LKCM Small Cap Equity Fund – Institutional Class | |
| | | Year | | | Year | | | Year | | | Year | | | Year | |
| | | Ended | | | Ended | | | Ended | | | Ended | | | Ended | |
| | | December 31, | | | December 31, | | | December 31, | | | December 31, | | | December 31, | |
| | | 2011 | | | 2010 | | | 2009 | | | 2008 | | | 2007 | |
Net Asset Value - Beginning of Period | | $ | 21.49 | | | $ | 16.16 | | | $ | 12.24 | | | $ | 20.03 | | | $ | 21.98 | |
| | | | | | | | | | | | | | | | | | | | |
Net investment income (loss)(1) | | | (0.08 | ) | | | (0.07 | ) | | | (0.05 | ) | | | (0.03 | ) | | | 0.01 | |
Net realized and unrealized gain (loss) on investments | | | 1.04 | | | | 5.40 | | | | 3.97 | | | | (7.75 | ) | | | (0.17 | ) |
| | | | | | | | | | | | | | | | | | | | |
Total from investment operations | | | 0.96 | | | | 5.33 | | | | 3.92 | | | | (7.78 | ) | | | (0.16 | ) |
| | | | | | | | | | | | | | | | | | | | |
Dividends from net investment income | | | — | | | | — | | | | — | | | | — | | | | (0.00 | )(2) |
Distributions from net realized gains | | | — | | | | — | | | | — | | | | (0.01 | ) | | | (1.79 | ) |
| | | | | | | | | | | | | | | | | | | | |
Total dividends and distributions | | | — | | | | — | | | | — | | | | (0.01 | ) | | | (1.79 | ) |
| | | | | | | | | | | | | | | | | | | | |
Net Asset Value - End of Period | | $ | 22.45 | | | $ | 21.49 | | | $ | 16.16 | | | $ | 12.24 | | | $ | 20.03 | |
| | | | | | | | | | | | | | | | | | | | |
Total Return | | | 4.47 | % | | | 32.98 | % | | | 32.03 | % | | | (38.87 | )% | | | (0.76 | )% |
| | | | | |
Ratios and Supplemental Data: | | | | | | | | | | | | | | | | | | | | |
Net assets, end of period (thousands) | | $ | 785,280 | | | $ | 690,511 | | | $ | 529,166 | | | $ | 385,223 | | | $ | 595,175 | |
Ratio of expenses to average net assets: | | | 0.95 | % | | | 0.96 | % | | | 1.00 | % | | | 0.97 | % | | | 0.94 | % |
Ratio of net investment income (loss) to average net assets: | | | (0.33 | )% | | | (0.38 | )% | | | (0.35 | )% | | | (0.17 | )% | | | 0.04 | % |
Portfolio turnover rate(3) | | | 50 | % | | | 57 | % | | | 59 | % | | | 61 | % | | | 60 | % |
| (1) | Net investment income (loss) per share represents net investment income (loss) divided by the average shares outstanding throughout the period. |
| (3) | Portfolio turnover is calculated on the basis of the Fund as a whole without distinguishing between the classes of shares issued. |
| | | | | | | | | | | | | | | | | | | | |
| | | LKCM Small Cap Equity Fund – Adviser Class | |
| | | Year | | | Year | | | Year | | | Year | | | Year | |
| | | Ended | | | Ended | | | Ended | | | Ended | | | Ended | |
| | | December 31, | | | December 31, | | | December 31, | | | December 31, | | | December 31, | |
| | | 2011 | | | 2010 | | | 2009 | | | 2008 | | | 2007 | |
Net Asset Value - Beginning of Period | | $ | 21.00 | | | $ | 15.83 | | | $ | 12.02 | | | $ | 19.72 | | | $ | 21.73 | |
| | | | | | | | | | | | | | | | | | | | |
Net investment loss(1) | | | (0.13 | ) | | | (0.11 | ) | | | (0.08 | ) | | | (0.07 | ) | | | (0.05 | ) |
Net realized and unrealized gain (loss) on investments | | | 1.01 | | | | 5.28 | | | | 3.89 | | | | (7.62 | ) | | | (0.17 | ) |
| | | | | | | | | | | | | | | | | | | | |
Total from investment operations | | | 0.88 | | | | 5.17 | | | | 3.81 | | | | (7.69 | ) | | | (0.22 | ) |
| | | | | | | | | | | | | | | | | | | | |
Distributions from net realized gains | | | — | | | | — | | | | — | | | | (0.01 | ) | | | (1.79 | ) |
| | | | | | | | | | | | | | | | | | | | |
Net Asset Value - End of Period | | $ | 21.88 | | | $ | 21.00 | | | $ | 15.83 | | | $ | 12.02 | | | $ | 19.72 | |
| | | | | | | | | | | | | | | | | | | | |
Total Return | | | 4.19 | % | | | 32.66 | % | | | 31.70 | % | | | (39.02 | )% | | | (1.06 | )% |
| | | | | |
Ratios and Supplemental Data: | | | | | | | | | | | | | | | | | | | | |
Net assets, end of period (thousands) | | $ | 43,124 | | | $ | 44,124 | | | $ | 35,725 | | | $ | 24,925 | | | $ | 40,465 | |
Ratio of expenses to average net assets: | | | 1.20 | % | | | 1.21 | % | | | 1.25 | % | | | 1.22 | % | | | 1.19 | % |
Ratio of net investment loss to average net assets: | | | (0.58 | )% | | | (0.63 | )% | | | (0.60 | )% | | | (0.42 | )% | | | (0.21 | )% |
Portfolio turnover rate(2) | | | 50 | % | | | 57 | % | | | 59 | % | | | 61 | % | | | 60 | % |
| (1) | Net investment loss per share represents net investment loss divided by the average shares outstanding throughout the period. |
| (2) | Portfolio turnover is calculated on the basis of the Fund as a whole without distinguishing between the classes of shares issued. |
The accompanying notes are an integral part of these financial statements.
32
FINANCIAL HIGHLIGHTS
SELECTED DATAFOR EACH SHAREOF CAPITAL STOCK OUTSTANDING
| | | | |
| | | LKCM | |
| | | Small-Mid Cap | |
| | | Equity Fund | |
| | | May 2, 2011 (1) | |
| | | through | |
| | | December 31, | |
| | | 2011 | |
Net Asset Value - Beginning of Period | | $ | 10.00 | |
| | | | |
Net investment loss(2) | | | (0.02 | ) |
Net realized and unrealized loss on investments(3) | | | (1.12 | ) |
| | | | |
Total from investment operations | | | (1.14 | ) |
| | | | |
Net Asset Value - End of Period | | $ | 8.86 | |
| | | | |
Total Return | | | (11.40 | )%(4) |
| |
Ratios and Supplemental Data: | | | | |
Net assets, end of period (thousands) | | $ | 23,755 | |
Ratio of expenses to average net assets: | | | | |
Before expense waiver and/or reimbursement | | | 2.14 | %(5) |
After expense waiver and/or reimbursement | | | 1.00 | %(5) |
Ratio of net investment loss to average net assets: | | | | |
Before expense waiver and/or reimbursement | | | (1.55 | )%(5) |
After expense waiver and/or reimbursement | | | (0.41 | )%(5) |
Portfolio turnover rate | | | 36 | % |
| (1) | Commencement of operations. |
| (2) | Net investment loss per share represents net investment loss divided by the average shares outstanding throughout the period. |
| (3) | Due to the timing of capital share transactions, the per share amount of net realized and unrealized loss on investments varies from the amounts shown in the statement of operations. |
| | | | | | | | | | | | | | | | | | | | |
| | | LKCM Equity Fund | |
| | | Year | | | Year | | | Year | | | Year | | | Year | |
| | | Ended | | | Ended | | | Ended | | | Ended | | | Ended | |
| | | December 31, | | | December 31, | | | December 31, | | | December 31, | | | December 31, | |
| | | 2011 | | | 2010 | | | 2009 | | | 2008 | | | 2007 | |
Net Asset Value - Beginning of Period | | $ | 15.18 | | | $ | 13.02 | | | $ | 10.33 | | | $ | 15.38 | | | $ | 14.43 | |
| | | | | | | | | | | | | | | | | | | | |
Net investment income | | | 0.11 | (1) | | | 0.08 | | | | 0.10 | | | | 0.16 | | | | 0.16 | |
Net realized and unrealized gain (loss) on investments | | | 0.39 | | | | 2.24 | | | | 2.69 | | | | (5.05 | ) | | | 1.42 | |
| | | | | | | | | | | | | | | | | | | | |
Total from investment operations | | | 0.50 | | | | 2.32 | | | | 2.79 | | | | (4.89 | ) | | | 1.58 | |
| | | | | | | | | | | | | | | | | | | | |
Dividends from net investment income | | | (0.10 | ) | | | (0.08 | ) | | | (0.10 | ) | | | (0.16 | ) | | | (0.16 | ) |
Distributions from net realized gains | | | (0.24 | ) | | | (0.08 | ) | | | — | | | | — | | | | (0.47 | ) |
| | | | | | | | | | | | | | | | | | | | |
Total dividends and distributions | | | (0.34 | ) | | | (0.16 | ) | | | (0.10 | ) | | | (0.16 | ) | | | (0.63 | ) |
| | | | | | | | | | | | | | | | | | | | |
Net Asset Value - End of Period | | $ | 15.34 | | | $ | 15.18 | | | $ | 13.02 | | | $ | 10.33 | | | $ | 15.38 | |
| | | | | | | | | | | | | | | | | | | | |
Total Return | | | 3.30 | % | | | 17.77 | % | | | 27.01 | % | | | (31.80 | )% | | | 10.96 | % |
| | | | | |
Ratios and Supplemental Data: | | | | | | | | | | | | | | | | | | | | |
Net assets, end of period (thousands) | | $ | 102,548 | | | $ | 72,370 | | | $ | 49,157 | | | $ | 36,677 | | | $ | 53,743 | |
Ratio of expenses to average net assets: | | | | | | | | | | | | | | | | | | | | |
Before expense waiver and/or reimbursement | | | 0.99 | % | | | 1.04 | % | | | 1.13 | % | | | 1.06 | % | | | 1.01 | % |
After expense waiver and/or reimbursement | | | 0.80 | % | | | 0.80 | % | | | 0.80 | % | | | 0.80 | % | | | 0.80 | % |
Ratio of net investment income to average net assets: | | | | | | | | | | | | | | | | | | | | |
Before expense waiver and/or reimbursement | | | 0.54 | % | | | 0.39 | % | | | 0.62 | % | | | 0.85 | % | | | 0.82 | % |
After expense waiver and/or reimbursement | | | 0.73 | % | | | 0.63 | % | | | 0.95 | % | | | 1.11 | % | | | 1.03 | % |
Portfolio turnover rate | | | 20 | % | | | 23 | % | | | 26 | % | | | 31 | % | | | 26 | % |
| (1) | Net investment income per share represents net investment income divided by the average shares outstanding throughout the period. |
The accompanying notes are an integral part of these financial statements.
33
FINANCIAL HIGHLIGHTS
SELECTED DATAFOR EACH SHAREOF CAPITAL STOCK OUTSTANDING
| | | | | | | | | | | | | | | | | | | | |
| | | LKCM Balanced Fund | |
| | | Year | | | Year | | | Year | | | Year | | | Year | |
| | | Ended | | | Ended | | | Ended | | | Ended | | | Ended | |
| | | December 31, | | | December 31, | | | December 31, | | | December 31, | | | December 31, | |
| | | 2011 | | | 2010 | | | 2009 | | | 2008 | | | 2007 | |
Net Asset Value - Beginning of Period | | $ | 14.25 | | | $ | 13.09 | | | $ | 10.85 | | | $ | 13.84 | | | $ | 13.36 | |
| | | | | | | | | | | | | | | | | | | | |
Net investment income | | | 0.17 | | | | 0.18 | | | | 0.22 | | | | 0.26 | | | | 0.28 | |
Net realized and unrealized gain (loss) on investments | | | 0.28 | | | | 1.16 | | | | 2.24 | | | | (2.96 | ) | | | 0.82 | |
| | | | | | | | | | | | | | | | | | | | |
Total from investment operations | | | 0.45 | | | | 1.34 | | | | 2.46 | | | | (2.70 | ) | | | 1.10 | |
| | | | | | | | | | | | | | | | | | | | |
Dividends from net investment income | | | (0.17 | ) | | | (0.18 | ) | | | (0.22 | ) | | | (0.28 | ) | | | (0.28 | ) |
Distributions from net realized gains | | | — | | | | — | | | | — | | | | (0.01 | ) | | | (0.34 | ) |
| | | | | | | | | | | | | | | | | | | | |
Total dividends and distributions | | | (0.17 | ) | | | (0.18 | ) | | | (0.22 | ) | | | (0.29 | ) | | | (0.62 | ) |
| | | | | | | | | | | | | | | | | | | | |
Net Asset Value - End of Period | | $ | 14.53 | | | $ | 14.25 | | | $ | 13.09 | | | $ | 10.85 | | | $ | 13.84 | |
| | | | | | | | | | | | | | | | | | | | |
Total Return | | | 3.16 | % | | | 10.31 | % | | | 22.90 | % | | | (19.70 | )% | | | 8.25 | % |
| | | | | |
Ratios and Supplemental Data: | | | | | | | | | | | | | | | | | | | | |
Net assets, end of period (thousands) | | $ | 18,560 | | | $ | 16,486 | | | $ | 13,476 | | | $ | 10,156 | | | $ | 12,191 | |
Ratio of expenses to average net assets: | | | | | | | | | | | | | | | | | | | | |
Before expense waiver and/or reimbursement | | | 1.14 | % | | | 1.25 | % | | | 1.41 | % | | | 1.38 | % | | | 1.35 | % |
After expense waiver and/or reimbursement | | | 0.80 | % | | | 0.80 | % | | | 0.80 | % | | | 0.80 | % | | | 0.80 | % |
Ratio of net investment income to average net assets: | | | | | | | | | | | | | | | | | | | | |
Before expense waiver and/or reimbursement | | | 0.83 | % | | | 0.89 | % | | | 1.28 | % | | | 1.51 | % | | | 1.51 | % |
After expense waiver and/or reimbursement | | | 1.17 | % | | | 1.34 | % | | | 1.89 | % | | | 2.09 | % | | | 2.06 | % |
Portfolio turnover rate | | | 34 | % | | | 13 | % | | | 22 | % | | | 38 | % | | | 27 | % |
| | | | | | | | | | | | | | | | | | | | |
| | | LKCM Fixed Income Fund | |
| | | Year | | | Year | | | Year | | | Year | | | Year | |
| | | Ended | | | Ended | | | Ended | | | Ended | | | Ended | |
| | | December 31, | | | December 31, | | | December 31, | | | December 31, | | | December 31, | |
| | | 2011 | | | 2010 | | | 2009 | | | 2008 | | | 2007 | |
Net Asset Value - Beginning of Period | | $ | 11.03 | | | $ | 10.85 | | | $ | 10.20 | | | $ | 10.33 | | | $ | 10.19 | |
| | | | | | | | | | | | | | | | | | | | |
Net investment income | | | 0.37 | | | | 0.40 | | | | 0.43 | | | | 0.43 | | | | 0.46 | |
Net realized and unrealized gain (loss) on investments | | | 0.09 | | | | 0.22 | | | | 0.65 | | | | (0.13 | ) | | | 0.14 | |
| | | | | | | | | | | | | | | | | | | | |
Total from investment operations | | | 0.46 | | | | 0.62 | | | | 1.08 | | | | 0.30 | | | | 0.60 | |
| | | | | | | | | | | | | | | | | | | | |
Dividends from net investment income | | | (0.37 | ) | | | (0.40 | ) | | | (0.43 | ) | | | (0.43 | ) | | | (0.46 | ) |
Distributions from net realized gains | | | (0.08 | ) | | | (0.04 | ) | | | — | | | | — | | | | — | |
| | | | | | | | | | | | | | | | | | | | |
Total dividends and distributions | | | (0.45 | ) | | | (0.44 | ) | | | (0.43 | ) | | | (0.43 | ) | | | (0.46 | ) |
| | | | | | | | | | | | | | | | | | | | |
Net Asset Value - End of Period | | $ | 11.04 | | | $ | 11.03 | | | $ | 10.85 | | | $ | 10.20 | | | $ | 10.33 | |
| | | | | | | | | | | | | | | | | | | | |
Total Return | | | 4.22 | % | | | 5.82 | % | | | 10.77 | % | | | 2.99 | % | | | 5.96 | % |
| | | | | |
Ratios and Supplemental Data: | | | | | | | | | | | | | | | | | | | | |
Net assets, end of period (thousands) | | $ | 178,116 | | | $ | 162,353 | | | $ | 149,218 | | | $ | 120,674 | | | $ | 113,032 | |
Ratio of expenses to average net assets: | | | | | | | | | | | | | | | | | | | | |
Before expense waiver and/or reimbursement | | �� | 0.72 | % | | | 0.73 | % | | | 0.76 | % | | | 0.73 | % | | | 0.72 | % |
After expense waiver and/or reimbursement | | | 0.65 | % | | | 0.65 | % | | | 0.65 | % | | | 0.65 | % | | | 0.65 | % |
Ratio of net investment income to average net assets: | | | | | | | | | | | | | | | | | | | | |
Before expense waiver and/or reimbursement | | | 3.31 | % | | | 3.55 | % | | | 4.00 | % | | | 4.15 | % | | | 4.39 | % |
After expense waiver and/or reimbursement | | | 3.38 | % | | | 3.63 | % | | | 4.11 | % | | | 4.23 | % | | | 4.46 | % |
Portfolio turnover rate | | | 24 | % | | | 20 | % | | | 30 | % | | | 23 | % | | | 31 | % |
The accompanying notes are an integral part of these financial statements.
34
LKCM FUNDS
NOTESTOTHE FINANCIAL STATEMENTS
A. Organization and Significant Accounting Policies: LKCM Funds (the “Trust”) is registered under the Investment Company Act of 1940 (“1940 Act”) as an open-end, management investment company. The Trust was organized as a Delaware business trust on February 10, 1994 and consists of eight diversified series, five of which are presented herein and include the LKCM Small Cap Equity Fund, LKCM Small-Mid Cap Equity Fund, LKCM Equity Fund, LKCM Balanced Fund and LKCM Fixed Income Fund (collectively, the “Funds”), the assets of which are invested in separate, independently managed portfolios. Investment operations of the Funds began on July 14, 1994 (LKCM Small Cap Equity Fund), January 3, 1996 (LKCM Equity Fund), December 30, 1997 (LKCM Balanced Fund and LKCM Fixed Income Fund), and May 2, 2011 (LKCM Small-Mid Cap Equity Fund). The Small Cap Equity Fund and the Equity Fund issued a second class of shares, Adviser Class Shares, and renamed the initial class as Institutional Class Shares on May 1, 2003. The Small Cap Equity Adviser Class Shares were initially sold on June 5, 2003 and are subject to expenses pursuant to the Rule 12b-1 plan described in Note B. The Equity Fund and Small-Mid Cap Equity Fund Adviser Class Shares have not yet commenced sales. Each Fund charges a 1% redemption fee for redemptions on Fund shares held for less than 30 days.
The LKCM Small Cap Equity Fund seeks to maximize long-term capital appreciation by investing under normal circumstances at least 80% of its net assets in equity securities of smaller companies (those with market capitalizations at the time of investment between $400 million and $2.5 billion) which Luther King Capital Management Corporation (the “Adviser”) believes are likely to have above-average growth in revenue and/or earnings and potential for above-average capital appreciation. The LKCM Small-Mid Cap Equity Fund seeks to maximize long-term capital appreciation by investing under normal circumstances at least 80% of its net assets in equity securities of small-mid capitalization companies (those with market capitalizations at the time of investment between $1 billion and $7 billion) which the Adviser believes are likely to have above-average growth in revenue and/or earnings and potential for above average capital appreciation. The LKCM Equity Fund seeks to maximize long-term capital appreciation by investing under normal circumstances at least 80% of its net assets in equity securities of companies which the Adviser believes are likely to have above-average growth in revenue and/or earnings, above-average returns on shareholders’ equity and under-leveraged balance sheets, and potential for above-average capital appreciation. The LKCM Balanced Fund seeks to provide investors with current income and long-term capital appreciation by investing under normal circumstances primarily in a portfolio of equity and fixed income securities with at least 25% of the Fund’s total assets invested in fixed income securities. The LKCM Fixed Income Fund seeks to provide investors with current income by investing under normal circumstances at least 80% of its net assets in a portfolio of investment grade corporate and government fixed income securities.
The following is a summary of significant accounting policies followed by the Funds in preparation of the financial statements.
1. Security Valuation: Securities listed on a U.S. securities exchange for which market quotations are readily available are valued at the last quoted sale price taken from the exchange where the security is primarily traded. Nasdaq National Market securities are valued at the Nasdaq Official Closing Price (“NOCP”). Unlisted U.S. securities and listed U.S. securities not traded on the valuation date for which market quotations are readily available are valued at the mean of the most recent quoted bid and asked price. Securities listed on a foreign exchange for which market quotations are readily available are valued at the last quoted sales price available before the time when assets are valued. Debt securities (other than obligations having a maturity of 60 days or less) are normally valued at the mean of the bid and ask price and/or by using a combination of daily quotes or matrix evaluations provided by an independent pricing service. Debt securities purchased with remaining maturities of 60 days or less are valued at amortized cost which approximates fair value. Other assets and securities for which no quotations are readily available (including restricted securities) are valued in good faith at fair value using methods determined by the Board of Trustees. The Board has adopted specific procedures for valuing portfolio securities and delegated the implementation of these procedures to the Adviser. The procedures authorize the Adviser to make all determinations regarding the fair value of a portfolio security and to report such determinations to the Board of Trustees. The Funds may also use independent pricing services to assist in pricing portfolio securities.
The Trust has adopted accounting standards which establish an authoritative definition of fair value and set out a hierarchy for measuring fair value. These standards require additional disclosures about the various inputs and valuation techniques used to develop the measurements of fair value and a discussion of changes in valuation techniques and related inputs during the period. These standards define fair value as the price that would be received to sell an asset or paid to transfer a liability in an orderly transaction between market participants at the measurement date. The fair value hierarchy is organized into three levels based upon the assumptions (referred to as “inputs”) used in pricing the asset or liability. These standards state that “observable inputs” reflect the assumptions market participants would use in pricing the asset or liability based on market data obtained from independent sources and “unobservable inputs” reflect an entity’s own assumptions about the assumptions market participants would use in pricing the asset or liability. These inputs are summarized in the three broad levels listed below.
35
Level 1 - | Quoted unadjusted prices for identical instruments in active markets to which the Trust has access at the date of measurement. |
Level 2 - | Quoted prices for similar instruments in active markets; quoted prices for identical or similar instruments in markets that are not active; and model-derived valuations in which all significant inputs and significant value drivers are observable in active markets. Level 2 inputs are those in markets for which there are few transactions, the prices are not current, little public information exists or instances where prices vary substantially over time or among brokered market makers. |
Level 3 - | Model derived valuations in which one or more significant inputs or significant value drivers are unobservable. Unobservable inputs are those inputs that reflect the Trust’s own assumptions that market participants would use to price the asset or liability based on the best available information. |
The inputs or methodology used for valuing securities are not necessarily an indication of the risk associated with investing in those securities. The following is a summary of the inputs used to value the Funds’ investments as of December 31, 2011:
| | | | | | | | | | | | | | | | |
| LKCM Small Cap Equity Fund | | | | | | | | | | | | | | | | |
| | | | |
Description | | Level 1 | | | Level 2 | | | Level 3 | | | Total | |
Common Stocks | | $ | 787,409,866 | | | $ | — | | | $ | — | | | $ | 787,409,866 | |
Money Market Funds | | | 42,707,148 | | | | — | | | | — | | | | 42,707,148 | |
| | | | | | | | | | | | | | | | |
Total Investments* | | $ | 830,117,014 | | | $ | — | | | $ | — | | | $ | 830,117,014 | |
| | | | | | | | | | | | | | | | |
| | | | |
| LKCM Small-Mid Cap Equity Fund | | | | | | | | | | | | | | | | |
| | | | |
Description | | Level 1 | | | Level 2 | | | Level 3 | | | Total | |
Common Stocks | | $ | 22,978,579 | | | $ | — | | | $ | — | | | $ | 22,978,579 | |
Money Market Funds | | | 791,358 | | | | — | | | | — | | | | 791,358 | |
| | | | | | | | | | | | | | | | |
Total Investments* | | $ | 23,769,937 | | | $ | — | | | $ | — | | | $ | 23,769,937 | |
| | | | | | | | | | | | | | | | |
| | | | |
| LKCM Equity Fund | | | | | | | | | | | | | | | | |
| | | | |
Description | | Level 1 | | | Level 2 | | | Level 3 | | | Total | |
Common Stocks | | $ | 99,339,241 | | | $ | — | | | $ | — | | | $ | 99,339,241 | |
Money Market Fund | | | 2,820,015 | | | | — | | | | — | | | | 2,820,015 | |
| | | | | | | | | | | | | | | | |
Total Investments* | | $ | 102,159,256 | | | $ | — | | | $ | — | | | $ | 102,159,256 | |
| | | | | | | | | | | | | | | | |
| | | | |
| LKCM Balanced Fund | | | | | | | | | | | | | | | | |
| | | | |
Description | | Level 1 | | | Level 2 | | | Level 3 | | | Total | |
Common Stocks | | $ | 13,379,608 | | | $ | — | | | $ | — | | | $ | 13,379,608 | |
Corporate Bonds | | | — | | | | 5,142,087 | | | | — | | | | 5,142,087 | |
Money Market Fund | | | 2,038 | | | | — | | | | — | | | | 2,038 | |
| | | | | | | | | | | | | | | | |
Total Investments* | | $ | 13,381,646 | | | $ | 5,142,087 | | | $ | — | | | $ | 18,523,733 | |
| | | | | | | | | | | | | | | | |
| | | | |
| LKCM Fixed Income Fund | | | | | | | | | | | | | | | | |
| | | | |
Description | | Level 1 | | | Level 2 | | | Level 3 | | | Total | |
Preferred Stocks | | $ | 4,064,300 | | | $ | — | | | $ | — | | | $ | 4,064,300 | |
Corporate Bonds | | | — | | | | 164,446,995 | | | | — | | | | 164,446,995 | |
U.S. Government & Agency Issues | | | — | | | | 6,497,423 | | | | — | | | | 6,497,423 | |
Money Market Fund | | | 1,024,156 | | | | — | | | | — | | | | 1,024,156 | |
| | | | | | | | | | | | | | | | |
Total Investments* | | $ | 5,088,456 | | | $ | 170,944,418 | | | $ | — | | | $ | 176,032,874 | |
| | | | | | | | | | | | | | | | |
| * | Additional information regarding the industry and/or geographical classifications of these investments is disclosed in the Schedule of Investments. |
There were no significant transfers into or out of Level 1, Level 2 or Level 3 fair value measurements during the reporting period, as compared to their classification from the previous annual report.
In May 2011, the FASB issued ASU No. 2011-04 “Amendments to Achieve Common Fair Value Measurements and Disclosure Requirements” in GAAP and the International Financial Reporting Standards (“ IFRS”). ASU No. 2011-04 amends FASB ASC Topic 820, Fair Value Measurements and Disclosures, to establish common requirements for measuring fair value and for disclosing information about fair value measurements in accordance with GAAP and IFRS. ASU No. 2011-04 is effective for fiscal years beginning after December 15, 2011 and for interim periods within those fiscal years. Management is currently evaluating the impact these amendments may have on the Funds’ financial statements.
In preparing these financial statements, the Trust has evaluated events after December 31, 2011 and determined that there were no significant subsequent events that would require adjustment to or additional disclosure in these financial statements.
36
2. Federal Income Taxes: The Funds have elected to be treated as “regulated investment companies” under Subchapter M of the Internal Revenue Code and each Fund intends to distribute all of its investment company net taxable income and net capital gains to shareholders. Therefore, no federal income tax provision is recorded.
3. Distributions to Shareholders: The LKCM Small Cap Equity, LKCM Small-Mid Cap Equity and LKCM Equity Funds generally intend to pay dividends and net capital gain distributions, if any, at least on an annual basis. The LKCM Balanced and LKCM Fixed Income Funds generally intend to pay dividends on a quarterly basis and net capital gain distributions, if any, at least on an annual basis.
4. Foreign Securities: Investing in securities of foreign companies and foreign governments involves special risks and considerations not typically associated with investing in U.S. companies and securities of the U.S. government. These risks include devaluation of currencies and future adverse political and economic developments. Moreover, securities of many foreign companies and foreign governments and their markets may be less liquid and their prices more volatile than those of securities of comparable U.S. companies and securities of the U.S. government.
5. Expense Allocation: Expenses incurred by the Funds are allocated among the Funds based upon (i) relative average net assets, (ii) a specific identification basis as incurred, or (iii) evenly among the Funds, depending on the nature of the expense. Expenses that are directly attributable to a class of shares, such as Rule 12b-1 distribution fees, are charged to that class. For multi- class Funds, income, unrealized and realized gains/losses are generally allocated between the Fund’s classes in proportion to their respective net assets.
6. Use of Estimates: The preparation of financial statements in conformity with accounting principles generally accepted in the United States of America requires management to make estimates and assumptions that affect the reported amounts of assets and liabilities and disclosure of contingent assets and liabilities at the date of the financial statements and the reported amounts of revenues and expenses during the reporting period. Actual results could differ from those estimates.
7. Guarantees and Indemnifications: In the normal course of business, the Funds enter into contracts with service providers that contain general indemnification clauses. The Funds’ maximum exposure under these arrangements is unknown as this would involve future claims against the Funds that have not yet occurred. Based on experience, the Funds expect the risk of loss to be remote.
8. Other: Security and shareholder transactions are recorded on the trade date. Realized gains and losses on sales of investments are calculated on the identified cost basis. Dividend income and dividends and distributions to shareholders are recorded on the ex-dividend date. Interest income is recognized on the accrual basis. All discounts and premiums are amortized on the effective interest method for tax and financial reporting purposes.
Generally accepted accounting principles require that certain components of net assets be adjusted to reflect permanent differences between financial and tax reporting. These reclassifications have no effect on net assets or net asset values per share. Accordingly, at December 31, 2011, reclassifications were recorded as follows.
| | | | | | | | | | | | | | | | | | | | |
| | | LKCM | | | LKCM | | | LKCM | | | LKCM | | | LKCM | |
| | | Small Cap | | | Small-Mid Cap | | | Equity | | | Balanced | | | Fixed | |
| | | Equity Fund | | | Equity Fund | | | Fund | | | Fund | | | Income Fund | |
Undistributed net investment income (loss) | | $ | 2,783,986 | | | $ | 37,460 | | | $ | — | | | $ | (2,391 | ) | | $ | 18,483 | |
Accumulated gain (loss) | | | 143,708 | | | | — | | | | — | | | | 85 | | | | (18,483 | ) |
Paid in capital | | | (2,927,694 | ) | | | (37,460 | ) | | | — | | | | 2,306 | | | | — | |
B. Investment Advisory and Other Agreements: Luther King Capital Management Corporation (the “Adviser”) serves as the investment adviser to the Funds under an Investment Advisory Agreement (the “Agreement”). The Adviser receives a fee, computed daily and payable quarterly , at the annual rates presented below as applied to each Fund’s average daily net assets. The Adviser has contractually agreed to waive all or a portion of its management fee and/or reimburse the Funds through April 30, 2012 in order to limit each Fund’s operating expenses to the annual cap rates presented below. For the year ended December 31, 2011, the Adviser reimbursed the following expenses:
| | | | | | | | | | | | | | | | | | | | |
| | | LKCM | | | LKCM | | | LKCM | | | LKCM | | | LKCM | |
| | | Small Cap | | | Small-Mid Cap | | | Equity | | | Balanced | | | Fixed | |
| | | Equity Fund | | | Equity Fund | | | Fund | | | Fund | | | Income Fund | |
Annual Advisory Rate | | | 0.75 | % | | | 0.75 | % | | | 0.70 | % | | | 0.65 | % | | | 0.50 | % |
Annual Cap on Expenses | | | 1.00 | % (Inst.) | | | 1.00 | % | | | 0.80 | % | | | 0.80 | % | | | 0.65 | % |
| | | 1.25 | % (Adviser) | | | | | | | | | | | | | | | | |
Expenses Reimbursed in 2011 | | | — | | | $ | 104,564 | | | $ | 167,923 | | | $ | 65,317 | | | $ | 113,787 | |
37
U.S. Bancorp Fund Services, LLC serves as transfer agent and administrator for the Trust and serves as accounting services agent for the Trust. U.S. Bank, N.A. serves as custodian for the Trust.
Distribution services are performed pursuant to a distribution contract with Quasar Distributors, LLC, the Trust’s principal underwriter.
The Small Cap Equity Fund, Small-Mid Cap Equity and the Equity Fund have adopted a Rule 12b-1 plan under which the Adviser Class of each Fund may pay up to 1.00% of its average daily net assets for distribution and other services. However, the Board of Trustees has currently only authorized a fee of 0.25% of each Fund’s average daily net assets. For the year ended December 31, 2011, fees accrued by the Small Cap Equity Fund pursuant to the 12b-1 Plan were $100,358.
C. Fund Shares: At December 31, 2011, there was an unlimited number of shares of beneficial interest, no par value, authorized. The following table summarizes the activity in shares of each Fund:
Small Cap Equity Fund
| | | | | | | | | | | | | | | | |
| | | Year Ended | | | Year Ended | |
| | | December 31, 2011 | | | December 31, 2010 | |
| | | Institutional Class | | | Institutional Class | |
| | | Shares | | | Amount | | | Shares | | | Amount | |
Shares sold | | | 8,832,325 | | | $ | 201,191,471 | | | | 5,489,377 | | | $ | 98,476,894 | |
Shares redeemed | | | (5,987,585 | ) | | | (135,600,658 | ) | | | (6,092,221 | ) | | | (108,506,942 | ) |
Redemption fee | | | | | | | 7,239 | | | | | | | | 5,068 | |
| | | | | | | | | | | | | | | | |
Net increase (decrease) | | | 2,844,740 | | | $ | 65,598,052 | | | | (602,844 | ) | | $ | (10,024,980 | ) |
| | | | | | | | | | | | | | | | |
Shares Outstanding: | | | | | | | | | | | | | | | | |
Beginning of period | | | 32,136,377 | | | | | | | | 32,739,221 | | | | | |
| | | | | | | | | | | | | | | | |
End of period | | | 34,981,117 | | | | | | | | 32,136,377 | | | | | |
| | | | | | | | | | | | | | | | |
| | |
| | | Year Ended | | | Year Ended | |
| | | December 31, 2011 | | | December 31, 2010 | |
| | | Adviser Class | | | Adviser Class | |
| | | Shares | | | Amount | | | Shares | | | Amount | |
Shares sold | | | 818,200 | | | $ | 17,753,894 | | | | 475,776 | | | $ | 8,259,757 | |
Shares redeemed | | | (948,884 | ) | | | (21,309,344 | ) | | | (630,622 | ) | | | (11,346,214 | ) |
Redemption fee | | | | | | | 331 | | | | | | | | 2 | |
| | | | | | | | | | | | | | | | |
Net decrease | | | (130,684 | ) | | $ | (3,555,119 | ) | | | (154,846 | ) | | $ | (3,086,455 | ) |
| | | | | | | | | | | | | | | | |
Shares Outstanding: | | | | | | | | | | | | | | | | |
Beginning of period | | | 2,101,547 | | | | | | | | 2,256,393 | | | | | |
| | | | | | | | | | | | | | | | |
End of period | | | 1,970,863 | | | | | | | | 2,101,547 | | | | | |
| | | | | | | | | | | | | | | | |
Total Net Increase (Decrease) | | | | | | $ | 62,042,933 | | | | | | | $ | (13,111,435 | ) |
| | | | | | | | | | | | | | | | |
Small-Mid Cap Equity Fund
| | | | | | | | |
| | | May 2, 2011(1) through | |
| | | December 31, 2011 | |
| | | Shares | | | Amount | |
Shares sold | | | 2,908,059 | | | $ | 25,500,659 | |
Shares redeemed | | | (226,034 | ) | | | (2,055,865 | ) |
Redemption fee | | | | | | | 13 | |
| | | | | | | | |
Net increase | | | 2,682,025 | | | $ | 23,444,807 | |
| | | | | | | | |
Shares Outstanding: | | | | | | | | |
Beginning of period | | | — | | | | | |
| | | | | | | | |
End of period | | | 2,682,025 | | | | | |
| | | | | | | | |
| (1) | Commencement of operations. |
38
Equity Fund
| | | | | | | | | | | | | | | | |
| | | Year Ended | | | Year Ended | |
| | | December 31, 2011 | | | December 31, 2010 | |
| | | Shares | | | Amount | | | Shares | | | Amount | |
Shares sold | | | 2,438,054 | | | $ | 37,526,183 | | | | 1,367,810 | | | $ | 18,874,012 | |
Shares issued to shareholders in reinvestment of distributions | | | 141,992 | | | | 2,188,102 | | | | 46,790 | | | | 711,682 | |
Shares redeemed | | | (663,144 | ) | | | (10,157,406 | ) | | | (422,222 | ) | | | (5,841,007 | ) |
Redemption fee | | | | | | | 492 | | | | | | | | 144 | |
| | | | | | | | | | | | | | | | |
Net increase | | | 1,916,902 | | | $ | 29,557,371 | | | | 992,378 | | | $ | 13,744,831 | |
| | | | | | | | | | | | | | | | |
Shares Outstanding: | | | | | | | | | | | | | | | | |
Beginning of period | | | 4,768,558 | | | | | | | | 3,776,180 | | | | | |
| | | | | | | | | | | | | | | | |
End of period | | | 6,685,460 | | | | | | | | 4,768,558 | | | | | |
| | | | | | | | | | | | | | | | |
Balanced Fund
| | | | | | | | | | | | | | | | |
| | | Year Ended | | | Year Ended | |
| | | December 31, 2011 | | | December 31, 2010 | |
| | | Shares | | | Amount | | | Shares | | | Amount | |
Shares sold | | | 387,905 | | | $ | 5,695,753 | | | | 190,039 | | | $ | 2,590,842 | |
Shares issued to shareholders in reinvestment of distributions | | | 15,313 | | | | 221,650 | | | | 14,372 | | | | 192,811 | |
Shares redeemed | | | (282,945 | ) | | | (4,111,314 | ) | | | (76,967 | ) | | | (1,028,530 | ) |
Redemption fee | | | | | | | 56 | | | | | | | | — | |
| | | | | | | | | | | | | | | | |
Net increase | | | 120,273 | | | $ | 1,806,145 | | | | 127,444 | | | $ | 1,755,123 | |
| | | | | | | | | | | | | | | | |
Shares Outstanding: | | | | | | | | | | | | | | | | |
Beginning of period | | | 1,156,998 | | | | | | | | 1,029,554 | | | | | |
| | | | | | | | | | | | | | | | |
End of period | | | 1,277,271 | | | | | | | | 1,156,998 | | | | | |
| | | | | | | | | | | | | | | | |
Fixed Income Fund
| | | | | | | | | | | | | | | | |
| | | Year Ended | | | Year Ended | |
| | | December 31, 2011 | | | December 31, 2010 | |
| | | Shares | | | Amount | | | Shares | | | Amount | |
Shares sold | | | 2,238,192 | | | $ | 24,941,740 | | | | 1,586,241 | | | $ | 17,619,726 | |
Shares issued to shareholders in reinvestment of distributions | | | 557,529 | | | | 6,158,736 | | | | 498,201 | | | | 5,506,025 | |
Shares redeemed | | | (1,372,672 | ) | | | (15,260,453 | ) | | | (1,129,134 | ) | | | (12,541,025 | ) |
Redemption fee | | | | | | | 15 | | | | | | | | 42 | |
| | | | | | | | | | | | | | | | |
Net increase | | | 1,423,049 | | | $ | 15,840,038 | | | | 955,308 | | | $ | 10,584,768 | |
| | | | | | | | | | | | | | | | |
Shares Outstanding: | | | | | | | | | | | | | | | | |
Beginning of period | | | 14,713,137 | | | | | | | | 13,757,829 | | | | | |
| | | | | | | | | | | | | | | | |
End of period | | | 16,136,186 | | | | | | | | 14,713,137 | | | | | |
| | | | | | | | | | | | | | | | |
D. Security Transactions: Purchases and sales of investment securities, other than short-term investments, for the year (since inception for Small-Mid Cap Equity Fund) ended December 31, 2011 were as follows:
| | | | | | | | | | | | | | | | |
| | | Purchases | | | Sales | |
| | | U.S. | | | | | | U.S. | | | | |
| | | Government | | | Other | | | Government | | | Other | |
LKCM Small Cap Equity Fund | | $ | — | | | $ | 427,411,473 | | | $ | — | | | $ | 389,760,903 | |
LKCM Small-Mid Cap Equity Fund | | | — | | | | 27,116,379 | | | | — | | | | 4,484,959 | |
LKCM Equity Fund | | | — | | | | 47,032,547 | | | | — | | | | 16,329,917 | |
LKCM Balanced Fund | | | — | | | | 8,471,957 | | | | — | | | | 6,276,516 | |
LKCM Fixed Income Fund | | | — | | | | 57,930,885 | | | | 2,000,427 | | | | 38,076,564 | |
39
E. Tax Information: At December 31, 2011, the components of accumulated earnings (losses) on a tax basis were as follows:
| | | | | | | | | | | | | | | | | | | | |
| | | LKCM
Small Cap
Equity Fund | | | LKCM
Small-Mid Cap
Equity
Fund | | | LKCM
Equity Fund | | | LKCM
Balanced
Fund | | | LKCM
Fixed
Income Fund | |
Cost of Investments | | $ | 663,781,561 | | | $ | 22,767,967 | | | $ | 84,929,829 | | | $ | 15,034,389 | | | $ | 167,352,842 | |
| | | | | | | | | | | | | | | | | | | | |
Gross Unrealized Appreciation | | | 186,051,505 | | | | 1,858,150 | | | | 20,428,967 | | | | 3,693,501 | | | | 9,654,854 | |
Gross Unrealized Depreciation | | | (19,716,052 | ) | | | (856,180 | ) | | | (3,199,540 | ) | | | (204,157 | ) | | | (974,822 | ) |
| | | | | | | | | | | | | | | | | | | | |
Net Unrealized Appreciation | | $ | 166,335,453 | | | $ | 1,001,970 | | | $ | 17,229,427 | | | $ | 3,489,344 | | | $ | 8,680,032 | |
| | | | | | | | | | | | | | | | | | | | |
Undistributed Ordinary Income | | | — | | | | — | | | | 631 | | | | 107 | | | | 1,992 | |
Undistributed Long-Term Capital Gain | | | — | | | | — | | | | 94,936 | | | | — | | | | 111,467 | |
| | | | | | | | | | | | | | | | | | | | |
Total Distributable Earnings | | $ | — | | | $ | — | | | $ | 95,567 | | | $ | 107 | | | $ | 113,459 | |
| | | | | | | | | | | | | | | | | | | | |
Other Accumulated Losses | | $ | (1,920,023 | ) | | $ | (654,811 | ) | | $ | — | | | $ | (479,597 | ) | | $ | — | |
| | | | | | | | | | | | | | | | | | | | |
Total Accumulated Gains | | $ | 164,415,430 | | | $ | 347,159 | | | $ | 17,324,994 | | | $ | 3,009,854 | | | $ | 8,793,491 | |
| | | | | | | | | | | | | | | | | | | | |
The difference between book-basis and tax-basis unrealized appreciation is attributable primarily to the tax deferral of losses on wash sales and partnerships.
At December 31, 2011, the capital loss carryforwards were as follows:
| | | | | | | | | | |
| | | Month/Year Realized | | | Month/Year Expiring | | Short-Term | |
LKCM Small-Mid Cap Equity Fund | | | Unexpiring Losses | | | | | $ | 411,663 | |
| | | | | | | | | | |
LKCM Balanced Fund | | | 12/2009 | | | 12/2017 | | $ | 420,308 | |
| | | | | | | | | | |
To the extent the Funds realize future net capital gains, taxable distributions will be reduced by any unused capital loss carryforwards as permitted by the Internal Revenue Code.
During the year ended December 31, 2011, the LKCM Small Cap Equity Fund and the LKCM Balanced Fund utilized capital loss carryforwards of $71,739,544 and $54,856, respectively.
At December 31, 2011, the following Funds deferred, on a tax basis, post-October losses of:
| | | | |
LKCM Small Cap Equity Fund | | $ | 1,920,023 | |
LKCM Small-Mid Cap Equity Fund | | $ | 243,148 | |
LKCM Balanced Fund | | $ | 59,289 | |
On December 22, 2010, the Regulated Investment Modernization Act of 2010 (the “RIC Act”) was enacted, and the provisions within the RIC Act are effective for the Fund for the year ended December 31, 2011. The RIC Act modernized several of the federal income and excise tax provisions related to regulated investments companies (“RICs”). Under the RIC Act, new capital losses may be carried forward indefinitely with the character of the original loss retained. Prior to the RIC Act, capital losses could be carried forward for eight years, and were carried forward as short-term capital losses regardless of the character of the original loss. The RIC Act also contains simplification provisions, which are aimed at preventing disqualification of a RIC for inadvertent failures to comply with asset diversification and/or qualifying income tests. The RIC Act exempts RICs from the preferential dividend rule and repeals the 60-day designation requirement for certain types of pay-through income and gains. In addition, the RIC Act contains provisions aimed at preserving the character of distributions made by a RIC during the portion of its taxable year ending after October 31 or December 31.
The tax components of dividends paid during the periods shown below were as follows:
| | | | | | | | | | | | | | | | |
| | | Year Ended December 31, 2011 | | | Year Ended December 31, 2010 | |
| | | Ordinary
Income | | | Long-Term
Capital Gains | | | Ordinary
Income | | | Long-Term
Capital Gains | |
LKCM Small Cap Equity Fund | | $ | — | | | $ | — | | | $ | — | | | $ | — | |
LKCM Small-Mid Cap Equity Fund | | | — | | | | — | | | | N/A | | | | N/A | |
LKCM Equity Fund | | | 636,154 | | | | 1,598,383 | | | | 358,806 | | | | 365,976 | |
LKCM Balanced Fund | | | 223,616 | | | | — | | | | 194,657 | | | | — | |
LKCM Fixed Income Fund | | | 5,739,348 | | | | 1,188,742 | | | | 5,783,428 | | | | 560,595 | |
40
The Funds designated as long-term capital gain dividend, pursuant to Internal Revenue Code Section 852(b)(3), the amount necessary to reduce the earnings and profits of the Funds related to net capital gain to zero for the tax years ended December 31, 2011 and December 31, 2010.
The Trust has adopted financial reporting rules regarding recognition and measurement of tax positions taken or expected to be taken on a tax return. The Trust has reviewed all open tax years and major jurisdictions and concluded that there is no impact on the Funds’ financial position or results of operations. Tax years that remain open to examination by major tax jurisdictions include tax years ended December 31, 2008 through December 31, 2011. There is no tax liability resulting from unrecognized tax benefits relating to uncertain income tax positions taken or expected to be taken on tax returns as of December 31, 2011. The Funds are not aware of any tax positions for which it is reasonably possible that the total amounts of unrecognized tax benefits will significantly change in the next twelve months. If applicable, the Funds would recognize interest accrued related to unrecognized tax benefits in “interest expense” and penalties in “other expense” on the statement of operations.
41
REPORTOF INDEPENDENT REGISTERED PUBLIC ACCOUNTING FIRM
To the Shareholders and Board of Trustees of LKCM Funds:
We have audited the accompanying statements of assets and liabilities, including the schedules of investments, of the LKCM Funds (the “Funds”) comprising the LKCM Small Cap Equity Fund, LKCM Equity Fund, LKCM Balanced Fund, LKCM Fixed Income Fund, and LKCM Small-Mid Cap Equity Fund as of December 31, 2011, and the related statements of operations for the year then ended, the statements of changes in net assets for each of the two years in the period then ended, and the financial highlights for each of the five years in the period then ended of LKCM Small Cap Equity Fund, LKCM Equity Fund, LKCM Balanced Fund, and LKCM Fixed Income Fund; and the statements of operations, changes in net assets and financial highlights for the period from inception (May 2, 2011) to December 31, 2011 of the LKCM Small- Mid Cap Equity Fund. These financial statements and financial highlights are the responsibility of the Funds’ management. Our responsibility is to express an opinion on these financial statements and financial highlights based on our audits.
We conducted our audits in accordance with the standards of the Public Company Accounting Oversight Board (United States). Those standards require that we plan and perform the audit to obtain reasonable assurance about whether the financial statements and financial highlights are free of material misstatement. The Funds are not required to have, nor were we engaged to perform, an audit of their internal control over financial reporting. Our audits included consideration of internal control over financial reporting as a basis for designing audit procedures that are appropriate in the circumstances, but not for the purpose of expressing an opinion on the effectiveness of the Funds’ internal control over financial reporting. Accordingly, we express no such opinion. An audit also includes examining, on a test basis, evidence supporting the amounts and disclosures in the financial statements, assessing the accounting principles used and significant estimates made by management, as well as evaluating the overall financial statement presentation. Our procedures included confirmation of securities owned as of December 31, 2011, by correspondence with the custodian and brokers. We believe that our audits provide a reasonable basis for our opinion.
In our opinion, the financial statements and financial highlights referred to above present fairly, in all material respects, the financial position of each of the portfolios constituting the LKCM Funds as of December 31, 2011, and the results of their operations, the changes in their net assets, and the financial highlights for the periods indicated in the first paragraph, in conformity with accounting principles generally accepted in the United States of America.

Milwaukee, Wisconsin
February 28, 2012
42
LKCM FUNDS
ADDITIONAL INFORMATION
December 31, 2011
Availability of Proxy Voting Information: A description of the policies and procedures that the Funds use to determine how to vote proxies relating to their portfolio securities, as well as the proxy voting record, is available without charge, upon request, by calling toll-free 1-800-688-LKCM or on the SEC website at http://www.sec.gov.
The actual voting records relating to portfolio securities during the twelve month period ended June 30 (as filed with the SEC on Form N-PX) are available without charge, upon request, by calling the Funds toll free at 1-800-688-LKCM or by accessing the SEC’s website at www.sec.gov.
Availability of Quarterly Portfolio Schedule: The Funds’ are required to file complete schedules of portfolio holdings with the SEC for the first and third fiscal quarters on Form N-Q. Once filed, the Funds’ Form N-Q is available without charge upon request on the SEC’s website(http://www.sec.gov) and may be available by calling 1-800-688-LKCM. You can also obtain copies of Form N-Q by (i) visiting the SEC’s Public Reference Room in Washington, DC (information on the operation of the Public Reference Room may be obtained by calling 1-800-SEC-0330); (ii) sending your request and a duplicating fee to the SEC’s Public Reference Room, Washington, DC 20549; or (iii) sending your request electronically to publicinfosec.gov.
43
Information about the Funds’ Trustees:
The business and affairs of the Funds are managed under the direction of the Funds’ Board of Trustees. Information pertaining to the Trustees of the Funds is set forth below. The Statement of Additional Information includes additional information about the Funds’ Trustees and officers and is available, without charge, upon request by calling 1-800-688-LKCM.
| | | | | | | | | | |
Name, Address and Age | | Position(s) Held
with the Trust | | Term of
Office &
Length of
Time
Served(1) | | Principal Occupation
During Past Five Years | | Number of
Portfolios
in Fund
Complex
Overseen
by Trustee | | Other Directorships Held
by Trustee |
Disinterested Trustees: | | | | | | | | | | |
H. Kirk Downey 301 Commerce Street Suite 1600 Fort Worth, TX 76102 Age: 69 | | Chairman of the Board
of Trustees Trustee | | Since 2005 Since 1994 | | President and CEO, Texas Systems, LLC and CEO, Texas learning systems LLC since 1999; Dean, M.J. Neeley School of Business, Texas Christian University Business School from 1987 to 1999. | | 8 | | Non-Executive Chairman of the Board of AZZ Incorporated, a manufacturing company. |
| | | | | |
Earle A. Shields, Jr. 301 Commerce Street Suite 1600 Fort Worth, TX 76102 Age: 91 | | Trustee | | Since 1994 | | Consultant; formerly Consultant for NASDAQ Corp. and Vice President, Merrill Lynch & Co., Inc. | | 8 | | Priests Pension Fund of the Catholic Diocese of Fort Worth, Lay Workers Pension Fund of the Catholic Diocese of Fort Worth, St. Joseph Health Care Trust, Catholic Schools Trust and Catholic Foundation of North Texas. |
| | | | | |
Richard J. Howell 301 Commerce Street Suite 1600 Fort Worth, TX 76102 Age: 69 | | Trustee Chairman of the Audit and Compliance Committee | | Since 2005 Since 2008 | | CPA, Adjunct Faculty at SMU Cox School of Business from 2004 to 2009; Consulting Services, since 2002; Audit Partner, Arthur Andersen LLP from 1974-2002. | | 8 | | Red Robin Gourmet Burgers, Inc. |
| | | | | |
Interested Trustee: | | | | | | | | | | |
J. Luther King, Jr.(2) 301 Commerce Street Suite 1600 Fort Worth, TX 76102 Age: 71 | | Trustee, President and Chief Executive Officer | | Since 1994 | | Chairman, President and Director, Luther King Capital Management Corporation since 1979. | | 8 | | Employee Retirement Systems of Texas, 4K Land & Cattle Company (ranching), Hunt Forest Products (lumber), Southwestern Exposition & Livestock (livestock), Southwest JLK Corporation (management company), Texas Christian University, Texas Southwestern Cattleraisers Foundation (livestock), Tyler Technologies (information management company for government agencies), and King Ranch, Inc. (ranching). |
| (1) | Each Trustee holds office during the lifetime of the Trust until that individual resigns, retires or is otherwise removed or replaced. |
| (2) | Mr. King is an “interested person” of the Trust (as defined in the 1940 Act) because of his affiliation with the Adviser. |
44
| | | | | | |
Name, Address and Age | | Position(s)
Held with
the Trust | | Term of
Office &
Length of
Time
Served(1) | | Principal Occupation During Past Five Years |
Officers: | | | | | | |
J. Luther King, Jr. 301 Commerce Street Suite 1600 Fort Worth, TX 76102 Age: 71 | | Trustee, President and Chief Executive Officer | | Since 1994 | | Chairman, President and Director, Luther King Capital Management
Corporation since 1979. |
| | | |
Paul W. Greenwell 301 Commerce Street Suite 1600 Fort Worth, TX 76102 Age: 61 | | Vice President | | Since 1996 | | Principal, Luther King Capital Management since 1986, Vice President and Portfolio Manager, Luther King Capital Management since 1983. |
| | | |
Richard Lenart 301 Commerce Street Suite 1600 Fort Worth, TX 76102 Age: 45 | | Secretary and Treasurer | | Since 2006 | | Luther King Capital Management since 2005. |
| | | |
Steven R. Purvis 301 Commerce Street Suite 1600 Fort Worth, TX 76102 Age: 46 | | Vice President | | Since 2000 | | Principal, Luther King Capital Management since 2003, Vice President and Portfolio Manager, Luther King Capital Management since 1996. |
| | | |
Jacob D. Smith 301 Commerce Street Suite 1600 Fort Worth, TX 76102 Age: 37 | | Chief Financial Officer Chief Compliance Officer | | Since 2010 Since 2006 | | Chief Financial Officer since 2010, General Counsel and Chief Compliance Officer, Luther King Capital Management since 2006. |
45
(This Page Intentionally Left Blank.)
U.S. Bancorp Fund Services, LLC
P.O. Box 701
Milwaukee, WI 53201-0701
LKCM FUNDS
P.O. Box 701
Milwaukee, WI 53201-0701
| | | | |
Officers and Trustees | | |
J. Luther King, Jr., CFA Trustee, President | | H. Kirk Downey Chairman of the Board | | Richard Lenart
Secretary & Treasurer |
| | |
Paul W. Greenwell Vice President | | Richard J. Howell Trustee | | Jacob D. Smith
Chief Financial Officer Chief Compliance Officer |
| | |
Steven R. Purvis, CFA Vice President | | Earle A. Shields, Jr. Trustee | | |
| | |
Investment Adviser | | | | |
Luther King Capital Management Corporation 301 Commerce Street, Suite 1600 Fort Worth , TX 76102 | | |
| |
Administrator, Transfer Agent, Dividend | | |
Paying Agent & Shareholder Servicing Agent | | |
U.S. Bancorp Fund Services, LLC P.O. Box 701 Milwaukee, WI 53201- 0701 | | |
| |
Custodian | | |
U.S. Bank, N.A. 1555 N. River Center Drive, Suite 302 Milwaukee, WI 53212 | | |
| |
Independent Registered Public Accounting Firm | | |
Deloitte & Touche LLP 555 E. Wells St., Suite 14000 Milwaukee, WI 53202 | | |
| |
Distributor | | |
Quasar Distributors, LLC 615 E. Michigan Street Milwaukee, WI 53202 | | |