
Prospectus
October 29, 2012
Table of Contents

Investment Objective
The investment objective of the Fund is capital growth.
Fees and Expenses
The following table describes the fees and expenses you would pay if you buy and hold shares of the Fund.
Shareholder Fees (fees paid directly from your investment)
| | | | |
Sales Charge (Load) Imposed on Purchases: | | | None | |
Deferred Sales Charge (Load): | | | None | |
Sales Charge (Load) Imposed on Reinvested Dividends: | | | None | |
Redemption Fee: | | | None | |
Annual Fund Operating Expenses
(expenses that you pay each year as a percentage of the value of your investment)
| | | | |
Management Fees: | | | 0.80 | % |
Distribution Fees: | | | None | |
Other Expenses: | | | 0.48 | % |
TOTAL ANNUAL OPERATING EXPENSES: | | | 1.28 | % |
Expense Example
The following example is intended to help you compare the cost of investing in Armstrong with the cost of investing in other mutual funds. It illustrates the hypothetical expenses that you would incur over various periods if you invest $10,000 in the Fund. This example assumes that the Fund provides a return of 5% per year, and that the operating expenses remain the same. The results apply whether or not you redeem your investment at the end of each period.
| | | | | | | | | | | | | | |
| 1 Year | | | 3 Years | | | 5 Years | | | 10 Years | |
| $ | 128 | | | $ | 404 | | | $ | 707 | | | $ | 1,610 | |
This example should not be considered to represent actual expenses or performance from the past or for the future. Actual future expenses may be higher or lower than those shown.
Portfolio Turnover
The Fund pays transaction costs, such as commissions, when it buys and sells securities (or “turns over” its portfolio). A higher portfolio turnover rate may indicate higher transaction costs and may result in higher taxes when Fund shares are held in a taxable account. These costs, which are not reflected in Annual Fund Operating Expenses or in the Expense Example, affect the Fund’s performance. During the most recent fiscal year, the Fund’s portfolio turnover rate was 6.5% of the average value of its portfolio.
1
Principal Investment Strategies
Armstrong invests in common stocks traded on U. S. market exchanges which offer the prospect of growth in earnings and market value. Portfolio emphasis is on companies offering favorable long term investment opportunities. The Fund follows a flexible approach to the capitalization size of portfolio investment. High quality short-term debt investments, such as U.S. Treasury Bills, are used to adjust the Fund’s equity position.
Primary Risks of Investing
The Fund’s share price changes daily based on the value of its holdings. You could lose money by investing in the Fund because:
• Equity markets and individual stocks are inherently volatile and prices fluctuate widely which results in Market Risk.
• Selection of portfolio investments that are unsuccessful due to unanticipated events or fundamental business reasons can result in Stock Selection Risk.
• Varying the investment balance of the portfolio between equities and short-term debt can result in reduced portfolio equity exposure during up market cycles and excessive exposure during down markets resulting in Portfolio Balance Risk.
Any and all of the above factors could result in Armstrong failing to achieve its objective of capital growth. The Fund’s total return can be expected to fluctuate within a wide range and stock value declines can continue for extended periods of time.
Who Should Invest
The Fund is designed for long term investors who are seeking the opportunity for higher long term investment returns than the returns available through fixed income investments and who can accept the inherent market volatility associated with investments in common stocks selected for capital growth. While the Fund shares can be expected to fluctuate based on market conditions, Armstrong is not designed as a vehicle for playing short term market swings. Dividend and interest income from Fund investments is incidental to the primary objective of capital growth.
2
Information on Risk/Return
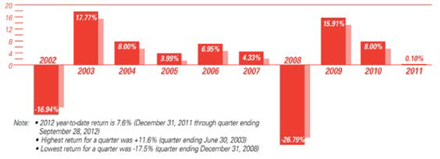
The bar chart below provides some indication of risks of investing in the Fund by showing the Fund’s performance in each calendar year over a ten-year period. The table shows how the Fund’s average annual returns for one, five, and ten calendar years compare with those of a broad-based securities market index. It is important for you to keep in mind that the Fund’s past performance does not indicate how it will perform in the future, before or after taxes.
Calendar Year Total Returns
| | | | | | | | | | | | |
Average Annual Total Returns (for year ending 12/31/2011) | | 1 Year | | | 5 Years | | | 10 Years | |
Armstrong Associates, Inc. | | | | | | | | | | | | |
Return Before Taxes | | | 0.10 | % | | | -0.87 | % | | | 1.18 | % |
Return After Taxes on Distributions | | | -0.13 | % | | | -1.38 | % | | | 0.73 | % |
Return After Taxes on Distributions and Sale of Fund Shares | | | -0.14 | % | | | -0.98 | % | | | 0.72 | % |
Standard & Poor’s 500 (reflects no deductions for fees, expenses or taxes) | | | 0.00 | % | | | 0.26 | % | | | 2.99 | % |
After-tax returns are calculated using the historical highest individual federal marginal income tax rates and do not reflect the impact of state and local taxes. Actual after-tax returns depend on an investor’s tax situation and may differ from those shown, and after-tax returns shown are not relevant to investors who hold their Fund shares through tax-deferred arrangements, such as 401(k) plans or individual retirement accounts.
3
Investment Management of the Fund
Investment Adviser
Portfolios, Inc., is the Fund’s Investment Advisor
Portfolio Manager
C. K. Lawson is the individual primarily responsible for the day to day management of the Fund’s portfolio. Mr. Lawson has been responsible for the management of the Fund’s portfolio since the Adviser’s formation in 1971. Mr. Lawson has been the President, Treasurer and a director of the Fund and Portfolios since 1971.
Purchase and Sale of Fund Shares
Minimum Initial Investment:
$250
Minimum Subsequent Investment:
$50
General Information:
You may purchase or redeem (sell) shares of the Fund on each day that the New York Stock Exchange is open for business. Transactions may be initiated by written request.
Tax Information
The Fund’s distributions are generally taxed as ordinary income or capital gains unless you are investing through a tax-deferred arrangement, such as 401K plans or individual retirement accounts.
Investment Objective, Strategies and Risks
The investment objective of Armstrong is capital growth. The Fund seeks to obtain its investment objective through emphasis on investments in common stocks and by varying the proportions of common stocks and short term debt investments in its portfolio.
4
The Fund normally invests in common stocks which offer strong long term growth potential and that are judged to be attractively valued relative to the market and to their prospects. The Fund follows a flexible approach to the capitalization size of portfolio investment. Investments are selected through fundamental research on individual companies that take into consideration industry, economic, political and marketplace factors that are expected to play a role in the success of an investment. After purchase, investments are monitored closely to gauge actual developments versus expectations.
The Fund’s fundamental approach to growth investments is not short term oriented and, as a result, the Fund’s portfolio turnover ratio is usually relatively low. Nevertheless, the Fund may sell a security within a relatively short period of time if changes in investment prospects indicate a sale would be advisable.
The general market environment and level of perceived valuation risk in the market as well as the availability of reasonably valued investment opportunities all play a role in decisions to adjust the Fund’s exposure to common stocks. Short-term debt investments (typically U.S. government obligations or high grade commercial paper with a life to maturity at the time of acquisition of less than one year) are utilized to adjust portfolio exposure to equity markets as a mechanism to moderate or expand market participation. Over the past five years, through the most recent June 30 fiscal year-end, the portion of the portfolio invested in common stocks ranged from a high of 91.17% to a low of 62.49%. The percentage of the Fund’s portfolio invested in common stocks can be expected to continue to fluctuate in the future and may at any time be higher or lower than the historical range reported for the past five years. As of September 28, 2012, common stocks represented 92.14% of the total net assets of the Fund’s portfolio.
The investment objective of the Fund will not be changed unless authorized by a vote of the majority of the outstanding shares of the Fund. The policies and techniques used in seeking to attain the objective of the Fund may be changed without shareholder approval.
Discussion of Primary Risks
Market Risk
Armstrong is managed with the objective of capital growth. Dividend income is incidental to the primary objective. Common stocks, the primary investment vehicle of the Fund, have a high level of price volatility that results in broad swings in the price level of individual stocks and equity markets. Stock values fluctuate in response to the activities of individual companies and general market and economic conditions. These fluctuations have a direct impact on Armstrong’s per share price and the total return to shareholders.
5
Stock Selection Risk
The Fund’s portfolio at any time will hold a relatively limited number of stock issues when compared to the market overall. In addition, many broad market equity indices are market-value weighted, giving large-cap stocks included in a specific index a disproportionate impact on the overall performance of such index. Importantly, Fund portfolio investments are selected based on the investment prospects seen over a time horizon of from one to three years which can result in a timing risk between year-to-year market results and the timing of the investment returns expected to be seen for investment in individual stocks. In addition, market indices do not reflect the various expenses incurred by a mutual fund. These factors can result in the Fund underperforming specific broad market indices as well as other funds with similar investment objectives.
Portfolio Balance Risk
The Fund invests in high quality short term debt in varying amounts when a reduced level of exposure to equity investments is desired to lower market risk and to enhance portfolio liquidity for market timing purposes. The use of short term debt in the Fund’s portfolio can restrain asset growth in periods of rising markets and cushion asset declines in negative markets.
Any of the above factors could result in Armstrong failing to achieve its objective of capital growth. The Fund’s total return can be expected to fluctuate within a wide range, so an investor could lose money with an investment in Armstrong.
Disclosure of Portfolio Holdings
A description of the Fund’s policies and procedures with respect to the disclosure of the Fund’s portfolio securities is available in the Fund’s Statement of Additional Information which is available on request without charge.
Investment Management Information
Compensation of Investment Advisor
The investments of the Fund are managed by Portfolios, Inc. Portfolios was incorporated in 1971 and is engaged in the business of providing investment management services to individual and institutional investors. As compensation for its investment management services to the Fund, Portfolios is paid monthly a fee at the annual rate of 0.8% of the Fund’s average daily net assets. Portfolios furnishes to the Fund, without additional charge, office space, telephone service and utilities.
Portfolios also performs certain accounting, filing and pricing services for the Fund under an administrative services agreement for which the Fund compensates Portfolios at a rate of $16,000 per year. In addition, Portfolios is the Fund’s transfer agent. As the transfer agent Portfolios receives a fee of $8,400 per year from the Fund.
Portfolio’s address is 750 N. St. Paul, Suite 1300, Dallas, Texas 75201-3250. It is a wholly owned subsidiary of Lawson Investments, Inc., a corporation controlled by C. K. Lawson, whose business relates primarily to Portfolios, Inc.
6
Disclosure regarding approval of the Investment Advisory Contract
A discussion regarding the Board of Director’s basis for approving the most recent continuance of the investment advisory contract for the Fund is available in the Fund’s semi-annual report to shareholders for the period ended December 31, 2011. You may obtain a copy of the semi-annual report, free of charge, upon request to the Fund.
Portfolio Manager
C. K. Lawson is the individual primarily responsible for the day to day management of the Fund’s portfolio. Mr. Lawson has been responsible for the management of the Fund’s portfolio since the Adviser’s formation in 1971. Mr. Lawson has been the President, Treasurer and a director of the Fund and Portfolios since 1971.
Investing in the Fund
Pricing of Fund Shares
The purchase and redemption price of the Fund’s shares is equal to the Fund’s net asset value per share next calculated after the order is received in proper form. The Fund determines its net asset value per share by subtracting the Fund’s liabilities (including accrued expenses and dividends payable) from its total assets (the market value of the securities the Fund holds plus cash and other assets, including interest accrued but not yet received and dividends “ex” but not paid) and dividing the result by the total number of shares outstanding.
The net asset value per share of the Fund is calculated following the close of trading on the New York Stock Exchange (usually 4:00 p.m., New York time) each day the Exchange is open for business. The Fund shares will not be priced on any days that the New York Stock Exchange does not open. A security quoted on the New York Stock Exchange Composite Tape or on the NASDAQ National Market shall be valued at its last sale price as reported thereon prior to the time as of which assets are valued. A security not quoted on the New York Stock Exchange Composite Tape or the NASDAQ National Market shall be valued (i), in the case of an exchange listed security, at the last reported sale price on that exchange where it is quoted prior to the time as of which assets are valued and (ii), in the case of securities which are not traded or did not trade on an exchange or for which over-the-counter last sale market quotations are not readily available, on the basis of the last current bid price prior to the time the assets are valued.
When market quotations are not available, a security shall be valued at the fair market value determined in line with procedures established by the Board of Directors of the Fund. In the event that the Fund should have other assets, they would also be valued at fair market value as determined in good faith by the Board of Directors. Using fair market value to price securities may result in a value that is different from a security’s most recent closing price and from the prices used by other mutual funds to calculate their net asset values.
7
Information on the Purchase and Redemption of Shares
How to Purchase Shares of the Fund
INITIAL INVESTMENTS:
To purchase shares of Armstrong for an account which does not currently own Armstrong shares, complete the Purchase Application on page 12 and mail it together with a check made payable to Armstrong Associates, Inc., 750 N. St. Paul, Suite 1300, Dallas, Texas 75201-3250. There is a $250 minimum on initial investments in Armstrong.
SUBSEQUENT INVESTMENTS:
To purchase additional Armstrong shares for an existing account, send a check made payable to Armstrong Associates, Inc., including the Armstrong shareholder account name and number and mail to Armstrong Associates, Inc., 750 N. St. Paul, Suite 1300, Dallas, Texas 75201-3250.
PURCHASE PRICE AND EFFECTIVE DATE:
Shares purchased will be priced at the net asset value per share next determined after the check and, if applicable, other required information has been received by the Fund. The Transfer Agent will mail a confirmation of the purchase to the account’s address of record. The Fund reserves the right to refuse any order for the purchase of its shares.
STOCK CERTIFICATES:
Stock certificates for shares will not be issued unless requested. Certificates for fractional shares will not be issued. In order to facilitate redemptions and transfers, most shareholders elect not to receive certificates. If a certificate is lost, an insurance bond will be required to replace it.
Redemption of Fund Shares
IF A STOCK CERTIFICATE HAS NOT BEEN ISSUED
If no certificate for your shares has been issued, redemption can normally be accomplished by your written request to the Fund with the appropriate shareholder signature guarantee. Under certain circumstances additional documentation may be required.
IF A STOCK CERTIFICATE HAS BEEN ISSUED
You can redeem shares for which a certificate has been issued by written request to the Fund accompanied by the certificate representing the shares being redeemed, properly endorsed for transfer, with the appropriate shareholder signature guarantee. Under certain circumstances additional documentation may be required.
8
TIMING OF REDEMPTION
Shares are redeemed at the net asset value next determined after the receipt of your written request for redemption accompanied by all necessary documentation properly completed.
DISTRIBUTION OF PROCEEDS
Proceeds are normally mailed within four days of receipt of the written redemption request along with the proper documentation. Redemption proceeds will not be mailed, however, until sufficient time has passed to provide reasonable assurance that checks or drafts (including certified or cashier’s checks) associated with share purchases have cleared (which may take up to 15 calendar days from the purchase date). Proceeds are mailed to the shareholder’s address of record unless specific written instructions are received from the shareholder to the contrary.
SIGNATURE GUARANTEES
To ensure that you are the person who has authorized a redemption from your account, the Fund may require that the signatures of the appropriate persons signing or endorsing any redemption request or stock certificate be duly guaranteed by a commercial bank, a member firm of a national securities exchange or another eligible guarantor institution.
TRANSACTIONS THROUGH BROKERS
Investors who purchase or redeem shares of the Fund through broker dealers may be subject to service fees imposed by the broker-dealer with respect to the services they provide. The Fund has no control over or involvement with any charges which any broker dealer may impose. There are no fees charged by the Fund if shares are purchased or redeemed directly from the Fund.
Dividends and Distributions
Armstrong earns income from dividends and interest on its investments. The Fund also realizes capital gains or losses from the sale of securities. It is the policy of the Fund to distribute substantially all of its net income and net capital gains each year. Unless you elect otherwise, dividends and capital gains distributions will be reinvested. They will be paid to you in the form of additional shares of the Fund which will be credited to your account.
Frequent Purchases and Redemptions of Fund Shares
Armstrong does not encourage the short term trading of its shares due to the potential negative effect such trading could have on the Fund and its shareholders. As a preventive measure, the Board of Directors of Armstrong has adopted policies and procedures to be followed with respect to the handling of purchases that are likely to be quickly redeemed. All purchase orders are reviewed prior to their acceptance. If, on evaluation, the purchase seems likely to be redeemed within a timeframe that would be detrimental to the Fund and its shareholders, the purchase will be declined.
Tax Information on Fund Distributions
Fund distributions ordinarily will be taxable, although shareholders not subject to Federal income tax will not be required to pay taxes on distributions from the Fund. Information as to the Federal income tax status of dividends and distributions will be mailed annually to each shareholder.
9
Condensed Financial Information
The financial highlights table is intended to help you understand the Fund’s financial performance for the past 38 years. Certain information reflects financial results for a single Fund share. The total returns in the table represent the rate that an investor would have earned (or lost) on an investment in the Fund (assuming reinvestment of all dividends and distributions). The information has been audited by Travis Wolff, LLP, beginning with the year ended June 30, 2009, whose report, along with the Fund’s financial statements, are included in the Statement of Additional Information which is available upon request. The information for years prior to 2009 had been audited by other independent auditors.
| | | | | | | | | | | | | | | | | | | | | | | | | | | | |
Selected per Share Data and Ratios | | Per share income and capital changes for a share outstanding throughout the year ended June 30 (a) | |
| | | 2012 | | | 2011 | | | 2010 | | | 2009 | | | 2008 | | | 2007 | | | 2006 | |
Net asset value, Beginning of year | | $ | 11.25 | | | $ | 9.27 | | | $ | 8.69 | | | $ | 11.85 | | | $ | 13.34 | | | $ | 12.46 | | | $ | 12.13 | |
Income (loss) from investment operations | | | | | | | | | | | | | | | | | | | | | | | | | | | | |
Net investment income (loss) | | | (.04 | ) | | | .05 | | | | .02 | | | | .04 | | | | .06 | | | | .04 | | | | .02 | |
Net realized and unrealized gains (losses) on investments | | | (.16 | ) | | | 1.97 | | | | .58 | | | | (2.72 | ) | | | (.62 | ) | | | 1.27 | | | | .67 | |
| | | | | | | | | | | | | | | | | | | | | | | | | | | | |
Total from investment operations | | | (.20 | ) | | | 2.02 | | | | .60 | | | | (2.68 | ) | | | (.56 | ) | | | 1.31 | | | | .69 | |
Less distributions | | | | | | | | | | | | | | | | | | | | | | | | | | | | |
Dividends from net investment income | | | .07 | | | | .04 | | | | .02 | | | | .05 | | | | .07 | | | | .02 | | | | .03 | |
Distributions from net realized gains | | | — | | | | — | | | | — | | | | .43 | | | | .86 | | | | .41 | | | | .33 | |
| | | | | | | | | | | | | | | | | | | | | | | | | | | | |
Net asset value, end of year | | $ | 10.98 | | | $ | 11.25 | | | $ | 9.27 | | | $ | 8.69 | | | $ | 11.85 | | | $ | 13.34 | | | $ | 12.46 | |
| | | | | | | | | | | | | | | | | | | | | | | | | | | | |
Total return | | | -1.75 | % | | | 21.82 | % | | | 6.89 | | | | -22.39 | | | | -4.55 | | | | 10.44 | | | | 5.69 | |
Ratios/supplemental data | | | | | | | | | | | | | | | | | | | | | | | | | | | | |
Net assets, end of period (000’s) | | $ | 14,112 | | | $ | 14,837 | | | $ | 12,205 | | | | 12,271 | | | | 16,777 | | | | 18,406 | | | | 17,506 | |
Ratio of expenses to average net assets | | | 1.28 | | | | 1.30 | | | | 1.32 | | | | 1.30 | | | | 1.17 | | | | 1.2 | | | | 1.2 | |
Ratio of net investment income to average net assets | | | .7 | | | | .5 | | | | .3 | | | | .4 | | | | .5 | | | | .3 | | | | .2 | |
Portfolio turnover rate | | | 6.5 | % | | | 10 | % | | | 4 | | | | 5 | | | | 2 | | | | 4 | | | | 11 | |
| | | | | | | | | | | | | | | | | | | | | | | | | | | | | | | | | | | | | | | | |
Selected per Share Data and Ratios | | Per share income and capital changes for a share outstanding throughout the year ended June 30 (a) | |
| | | 2005 | | | 2004 | | | 2003 | | | 2002 | | | 2001 | | | 2000 | | | 1999 | | | 1998 | | | 1997 | | | 1996 | |
Net asset value, Beginning of year | | $ | 12.20 | | | $ | 10.85 | | | $ | 10.43 | | | $ | 12.56 | | | $ | 15.70 | | | $ | 13.53 | | | $ | 12.14 | | | $ | 11.61 | | | $ | 10.45 | | | $ | 9.70 | |
Income (loss) from investment operations | | | | | | | | | | | | | | | | | | | | | | | | | | | | | | | | | | | | | | | | |
Net investment income (loss) | | | .02 | | | | — | | | | (.01 | ) | | | (.05 | ) | | | .05 | | | | .01 | | | | (.01 | ) | | | .03 | | | | .06 | | | | .05 | |
Net realized and unrealized gains (losses) on investments | | | .54 | | | | 1.43 | | | | .44 | | | | (1.92 | ) | | | (2.00 | ) | | | 2.64 | | | | 1.89 | | | | 1.38 | | | | 1.64 | | | | 1.10 | |
| | | | | | | | | | | | | | | | | | | | | | | | | | | | | | | | | | | | | | | | |
Total from investment operations | | | .56 | | | | 1.43 | | | | .43 | | | | (1.97 | ) | | | (1.95 | ) | | | 2.65 | | | | 1.88 | | | | 1.41 | | | | 1.70 | | | | 1.15 | |
Less distributions | | | | | | | | | | | | | | | | | | | | | | | | | | | | | | | | | | | | | | | | |
Dividends from net investment income | | | — | | | | — | | | | .01 | | | | .05 | | | | — | | | | — | | | | .04 | | | | .05 | | | | .07 | | | | .02 | |
Distributions from net realized gains | | | .63 | | | | .08 | | | | — | | | | .11 | | | | 1.19 | | | | .48 | | | | .45 | | | | .83 | | | | .47 | | | | .38 | |
| | | | | | | | | | | | | | | | | | | | | | | | | | | | | | | | | | | | | | | | |
Net asset value, end of year | | $ | 12.13 | | | $ | 12.20 | | | $ | 10.85 | | | $ | 10.43 | | | $ | 12.56 | | | $ | 15.70 | | | $ | 13.53 | | | $ | 12.14 | | | $ | 11.61 | | | $ | 10.45 | |
| | | | | | | | | | | | | | | | | | | | | | | | | | | | | | | | | | | | | | | | |
Total return | | | 4.64 | | | | 13.22 | | | | 4.13 | | | | (15.85 | ) | | | (12.99 | ) | | | 20.38 | | | | 16.26 | | | | 13.31 | | | | 17.19 | | | | 12.09 | |
Ratios/supplemental data | | | | | | | | | | | | | | | | | | | | | | | | | | | | | | | | | | | | | | | | |
Net assets, end of period (000’s) | | | 17,043 | | | | 16,227 | | | | 14,148 | | | | 13,875 | | | | 17,565 | | | | 20,126 | | | | 17,214 | | | | 15,213 | | | | 14,300 | | | | 13,100 | |
Ratio of expenses to average net assets | | | 1.3 | | | | 1.2 | | | | 1.3 | | | | 1.2 | | | | 1.2 | | | | 1.2 | | | | 1.2 | | | | 1.3 | | | | 1.4 | | | | 1.4 | |
Ratio of net investment income to average net assets | | | .2 | | | | — | | | | — | | | | — | | | | .4 | | | | .1 | | | | (.1 | ) | | | .2 | | | | .5 | | | | .5 | |
Portfolio turnover rate | | | 7 | | | | 5 | | | | 4 | | | | 7 | | | | 9 | | | | 6 | | | | 3 | | | | 20 | | | | 7 | | | | 19 | |
| (a) | For a share outstanding throughout the year. Per share data has been rounded to nearest cent and adjusted to give effect to a 2-for-1 stock split, effective October 16, 1978, by means of a stock distribution. |
| (b) | The Fund had no senior securities or outstanding debt during the thirty-eight year period ended June 30, 2012. |
10
| | | | | | | | | | | | | | | | | | | | | | | | | | | | | | | | | | | | | | | | | | | | |
Selected per Share Data and Ratios | | Per share income and capital changes for a share outstanding throughout the year ended June 30 (a) | |
| | | 1995 | | | 1994 | | | 1993 | | | 1992 | | | 1991 | | | 1990 | | | 1989 | | | 1988 | | | 1987 | | | 1986 | | | 1985 | |
Net asset value, Beginning of year | | $ | 8.19 | | | $ | 8.26 | | | $ | 7.08 | | | $ | 6.87 | | | $ | 7.38 | | | $ | 7.74 | | | $ | 7.17 | | | $ | 9.66 | | | $ | 8.72 | | | $ | 7.65 | | | $ | 7.29 | |
Income (loss) from investment operations | | | | | | | | | | | | | | | | | | | | | | | | | | | | | | | | | | | | | | | | | | | | |
Net investment income (loss) | | | .02 | | | | — | | | | .02 | | | | .06 | | | | .16 | | | | .23 | | | | .24 | | | | .09 | | | | .10 | | | | .14 | | | | .24 | |
Net realized and unrealized gains (losses) on investments | | | 2.12 | | | | .10 | | | | 1.19 | | | | .33 | | | | (.27 | ) | | | .19 | | | | .67 | | | | (.53 | ) | | | 1.51 | | | | 1.17 | | | | 1.02 | |
| | | | | | | | | | | | | | | | | | | | | | | | | | | | | | | | | | | | | | | | | | | | |
Total from investment operations | | | 2.14 | | | | .10 | | | | 1.21 | | | | .39 | | | | (.11 | ) | | | .42 | | | | .91 | | | | (.44 | ) | | | 1.61 | | | | 1.31 | | | | 1.26 | |
Less distributions | | | | | | | | | | | | | | | | | | | | | | | | | | | | | | | | | | | | | | | | | | | | |
Dividends from net investment income | | | .04 | | | | — | | | | .02 | | | | .15 | | | | .23 | | | | .24 | | | | .11 | | | | .14 | | | | .16 | | | | .24 | | | | .14 | |
Distributions from net realized gains | | | .59 | | | | .17 | | | | .01 | | | | .03 | | | | .17 | | | | .54 | | | | .23 | | | | 1.91 | | | | .51 | | | | — | | | | .76 | |
| | | | | | | | | | | | | | | | | | | | | | | | | | | | | | | | | | | | | | | | | | | | |
Net asset value, end of year | | $ | 9.70 | | | $ | 8.19 | | | $ | 8.26 | | | $ | 7.08 | | | $ | 6.87 | | | $ | 7.38 | | | $ | 7.74 | | | $ | 7.17 | | | $ | 9.66 | | | $ | 8.72 | | | $ | 7.65 | |
| | | | | | | | | | | | | | | | | | | | | | | | | | | | | | | | | | | | | | | | | | | | |
Total return | | | 27.32 | | | | 1.13 | | | | 17.12 | | | | 5.79 | | | | (.92 | ) | | | 5.93 | | | | 13.23 | | | | (6.27 | ) | | | 20.00 | | | | 17.80 | | | | 19.10 | |
Ratios/supplemental data | | | | | | | | | | | | | | | | | | | | | | | | | | | | | | | | | | | | | | | | | | | | |
Net assets, end of period (000’s) | | | 11,961 | | | | 9,255 | | | | 9,680 | | | | 9,366 | | | | 9,228 | | | | 9,770 | | | | 9,887 | | | | 10,435 | | | | 12,294 | | | | 11,714 | | | | 10,957 | |
Ratio of expenses to average net assets | | | 1.8 | | | | 1.8 | | | | 1.8 | | | | 1.9 | | | | 1.9 | | | | 1.8 | | | | 1.9 | | | | 2.0 | | | | 1.7 | | | | 1.6 | | | | 1.7 | |
Ratio of net investment income to average net assets | | | .2 | | | | — | | | | .2 | | | | .8 | | | | 2.3 | | | | 2.9 | | | | 3.0 | | | | 1.3 | | | | 1.0 | | | | 1.6 | | | | 3.1 | |
Portfolio turnover rate | | | 12 | | | | 21 | | | | 17 | | | | 36 | | | | 24 | | | | 44 | | | | 46 | | | | 20 | | | | 51 | | | | 54 | | | | 53 | |
| | | | | | | | | | | | | | | | | | | | | | | | | | | | | | | | | | | | | | | | |
Selected per Share Data and Ratios | | Per share income and capital changes for a share outstanding throughout the year ended June 30 (a) | |
| | | 1984 | | | 1983 | | | 1982 | | | 1981 | | | 1980 | | | 1979 | | | 1978 | | | 1977 | | | 1976 | | | 1975 | |
Net asset value, Beginning of year | | $ | 10.22 | | | $ | 7.10 | | | $ | 9.37 | | | $ | 7.74 | | | $ | 7.06 | | | $ | 6.50 | | | $ | 5.68 | | | $ | 5.30 | | | $ | 3.81 | | | $ | 2.74 | |
Income (loss) from investment operations | | | | | | | | | | | | | | | | | | | | | | | | | | | | | | | | | | | | | | | | |
Net investment income (loss) | | | .16 | | | | .21 | | | | .41 | | | | .24 | | | | .23 | | | | .16 | | | | .08 | | | | .04 | | | | .03 | | | | .07 | |
Net realized and unrealized gains (losses) on investments | | | (2.51 | ) | | | 3.72 | | | | (1.28 | ) | | | 2.62 | | | | 1.40 | | | | .84 | | | | .78 | | | | .38 | | | | 1.53 | | | | 1.04 | |
| | | | | | | | | | | | | | | | | | | | | | | | | | | | | | | | | | | | | | | | |
Total from investment operations | | | (2.35 | ) | | | 3.93 | | | | (.87 | ) | | | 2.86 | | | | 1.63 | | | | 1.00 | | | | .86 | | | | .42 | | | | 1.56 | | | | 1.11 | |
Less distributions | | | | | | | | | | | | | | | | | | | | | | | | | | | | | | | | | | | | | | | | |
Dividends from net investment income | | | .20 | | | | .43 | | | | .19 | | | | .23 | | | | .13 | | | | .11 | | | | .04 | | | | .04 | | | | .07 | | | | .04 | |
Distributions from net realized gains | | | .38 | | | | .38 | | | | 1.21 | | | | 1.00 | | | | .82 | | | | .33 | | | | — | | | | — | | | | — | | | | — | |
| | | | | | | | | | | | | | | | | | | | | | | | | | | | | | | | | | | | | | | | |
Net asset value, end of year | | $ | 7.29 | | | $ | 10.22 | | | $ | 7.10 | | | $ | 9.37 | | | $ | 7.74 | | | $ | 7.06 | | | $ | 6.50 | | | $ | 5.68 | | | $ | 5.30 | | | $ | 3.81 | |
| | | | | | | | | | | | | | | | | | | | | | | | | | | | | | | | | | | | | | | | |
Total return | | | (24.01 | ) | | | 61.27 | | | | (9.87 | ) | | | 38.04 | | | | 24.08 | | | | 15.17 | | | | 15.31 | | | | 8.05 | | | | 42.06 | | | | 41.46 | % |
Ratios/supplemental data | | | | | | | | | | | | | | | | | | | | | | | | | | | | | | | | | | | | | | | | |
Net assets, end of period (000’s) | | | 9,788 | | | | 12,869 | | | | 7,669 | | | | 8,277 | | | | 5,777 | | | | 4,538 | | | | 3,886 | | | | 3,649 | | | | 3,785 | | | $ | 2,892 | |
Ratio of expenses to average net assets | | | 1.6 | | | | 1.6 | | | | 1.7 | | | | 1.5 | | | | 1.6 | | | | 1.5 | | | | 1.5 | | | | 1.5 | | | | 1.5 | | | | 1.5 | |
Ratio of net investment income to average net assets | | | 1.9 | | | | 2.4 | | | | 5.6 | | | | 2.7 | | | | 3.2 | | | | 2.3 | | | | 1.6 | | | | 1.9 | | | | .8 | | | | 2.7 | |
Portfolio turnover rate | | | 96 | | | | 59 | | | | 34 | | | | 60 | | | | 131 | | | | 97 | | | | 151 | | | | 113 | | | | 113 | | | | 210 | % |
11
Purchase Application See page 13 for instructions
To Open Account
My check for $ (minimum $250 on initial investment) made payable to Armstrong Associates, Inc. is enclosed to purchase shares of Armstrong Associates, Inc. at the net asset value applicable when my order is received and accepted.
Registration
Please register my shares as follows (see page 13 for registration instructions):
| | |
| Mailing Address (If P.O. Box, a street address is also necessary) | | |
| | |
| Home Telephone (including area code) | | |
| | |
| Business Telephone (including area code) | | |
| | | | | | |
| Citizenship of Owner: | | [ ] U.S Citizen | | [ ] Resident Alien | | [ ] Non-resident Alien |
| | |
| Country of Residence (for non-resident alien) | | |
| | |
| Social Security or Tax Identification Number | | |
Dividend Reinvestment
Reinvest all my dividends and capital gains distributions in full and fractional shares.
Reinvest all my capital gains distributions in full and fractional shares but send my dividends to me in cash.
Remit all dividends and distributions to me in cash.
Stock Certificates
All shares purchased will be credited to the shareholder’s account at the Fund. A certificate for any number of full shares in the account may be obtained at any time by written request to the Fund. No fractional shares will be issued.
Signature Information
Your signature should correspond to the name used in registration. If there are co-owners, both must sign.
Certification and Acknowledgement
I acknowledge that I have received a copy of the current prospectus of Armstrong Associates, Inc.
I certify, under penalties of perjury, that the Tax Identification/Social Security number given above is correct and I am not subject to back-up withholding (see page 13).
The Internal Revenue Service does not require your consent to any provision of this document other than the certifications required to avoid backup withholding.
| | | | |
Signature of applicant | | | | Signature of co-owner (if applicable) |
Date | | | | |
12
Instructions for Purchase Application
Instructions for Opening Account
Complete the Purchase Application on page 12 and mail it, together with your check made payable to Armstrong Associates, Inc., to:
Armstrong Associates, Inc.
750 N. St. Paul
Suite 1300
Dallas, Texas 75201-3250
Call Armstrong at (214) 720-9101 if you have any questions on completing the Purchase Application.
Do not use the Purchase Application on page 12 to open an IRA account. Appropriate forms for an IRA are available on request.
Registration Instructions (Purchase by one individual)
State applicant’s full name. A married woman must use her own given name.
Example: Jane S. Jones (NOT Mrs. John R. Jones)
Joint Registrants
1. Joint tenants with rights of survivorship and not as tenants in common. When two persons register shares jointly with the desire that the survivor receive total holdings on the death of the other, shares should be registered in this manner. Example: “John R. Jones and Jane S. Jones, JT.TEN.WROS.”
2. Tenants in Common. Where each registrant wants his position to go to his estate in the event of his death, shares should be registered in this manner. Example: “John R. Jones and Jane S. Jones, ATIC.”
Joint tenants with rights of survivorship will be assumed if shares are registered jointly and no specification is made.
Custodian for a Minor
The following form of registration should be used: “Robert Smith (one adult only) as custodian for Nancy Smith (one minor only) under (state of residence of minor) Uniform Gifts to Minors Act.” The tax identification number provided should be that of the minor.
Partnerships
Accounts may be registered in the name of a partnership. The application must be signed by a duly authorized partner.
Corporations
Shares to be registered in the name of a corporation must be registered in the exact legal title of the organization and the application must be signed by a duly authorized officer.
Backup Withholding
You are not subject to backup withholding if the Internal Revenue Service (a) has not notified you that you are subject to such withholding or (b) has notified you that you are no longer subject to such withholding. If you are subject to backup withholding, cross out the words “and that I am not subject to backup withholding” on page 12 (Purchase Application) above the signature, and the appropriate withholding instructions will be applied to your account.
13
..
Information on Armstrong
A No-Load Mutual Fund
Armstrong Associates, Inc. is a no-load mutual fund. There are no sales commissions charged by the Fund when you buy or redeem shares.
Investment Objective
Armstrong’s investment objective is capital growth. The Fund seeks this objective through investments in common stocks and by varying the proportions of common stocks and short-term debt investments in its portfolio.
Prospectus Information
This Prospectus contains information an investor should know about the Fund before investing. Please retain it for future reference.
Additional Information
Armstrong’s Statement of Additional Information includes additional information about the Fund. Information about Armstrong’s investments is available in its annual and semi-annual reports to shareholders. In Armstrong’s annual shareholders report you will also find a discussion of the market conditions and investment considerations that relate to the Fund’s performance and investment activity during its last fiscal year. Armstrong does not currently have a website available; however, all of these documents, as well as other information, is available upon request, without charge, by writing or calling collect:
Armstrong Associates, Inc.
750 N. St. Paul
Suite 1300
Dallas, Texas 75201-3250
(214) 720-9101
(214) 871-8948 FAX
Information about the Fund, including the Statement of Additional Information, annual and semi-annual reports to shareholders, can be reviewed and copied at the SEC’s Public Reference Room in Washington D.C. (call 1-202-942-8090 for information on how to use the Public Reference Room). Reports and other information about the Fund are also available on the EDGAR database at the SEC’s website (http://www.sec.gov) and copies may be obtained, upon payment of a duplicating fee, by electronic request at the following e-mail address: publicinfo@sec.gov, or by writing the Public Reference Section of the SEC, Washington D.C. 20549-0102. Armstrong’s Investment Company Act file number is 811-1548.

750 N. St. Paul Suite 1300 Dallas, Texas 75201-3250
(214)720-9101 (214)871-8948 FAX