LKCM
FUNDS
LKCM Small Cap Equity Fund
LKCM Small-Mid Cap Equity Fund
LKCM Equity Fund
LKCM Balanced Fund
LKCM Fixed Income Fund
Semi-Annual Report
June 30, 2012
Dear Fellow Shareholders:
We report the following performance information for the LKCM Funds:
| | | | | | | | | | | | | | | | | | | | | | | | | | | | | | | | | | | | |
| | | | | | | | | | | | | | | | | | | | | Five Year | | | Ten Year | | | Avg. | |
| | | | | | | | | | | | | | | Six Month | | | One Year | | | Average | | | Average | | | Annual | |
| | | | | | | | | | | | | | | Total | | | Total | | | Annualized | | | Annualized | | | Total | |
| | | | | | | | | Net | | | Gross | | | Return | | | Return | | | Return | | | Return | | | Return | |
| | | Inception | | | NAV @ | | | Expense | | | Expense | | | Ended | | | Ended | | | Ended | | | Ended | | | Since | |
Funds | | Dates | | | 6/30/12 | | | Ratio*,** | | | Ratio** | | | 6/30/12 | | | 6/30/12 | | | 6/30/12 | | | 6/30/12 | | | Incept. | |
LKCM Equity Fund – | | | | | | | | | | | | | | | | | | | | | | | | | | | | | | | | | | | | |
Institutional Class | | | 1/3/96 | | | $ | 16.37 | | | | 0.81 | % | | | 1.00 | % | | | 6.71 | % | | | 2.85 | % | | | 2.49 | % | | | 6.05 | % | | | 7.18 | % |
S&P 500 Index1 | | | | | | | | | | | | | | | | | | | 9.49 | % | | | 5.45 | % | | | 0.22 | % | | | 5.33 | % | | | 6.80 | % |
LKCM Small Cap Equity Fund – | | | | | | | | | | | | | | | | | | | | | | | | | | | | | | | | | | | | |
Institutional Class | | | 7/14/94 | | | $ | 23.64 | | | | N/A | | | | 0.96 | % | | | 5.30 | % | | | -4.68 | % | | | 1.78 | % | | | 8.02 | % | | | 10.77 | % |
Russell 2000 Index2 | | | | | | | | | | | | | | | | | | | 8.53 | % | | | -2.08 | % | | | 0.54 | % | | | 7.00 | % | | | 8.23 | % |
LKCM Small Cap Equity Fund – | | | | | | | | | | | | | | | | | | | | | | | | | | | | | | | | | | | | |
Adviser Class | | | 6/5/03 | | | $ | 23.01 | | | | N/A | | | | 1.21 | % | | | 5.16 | % | | | -4.92 | % | | | 1.52 | % | | | N/A | | | | 9.30 | % |
Russell 2000 Index2 | | | | | | | | | | | | | | | | | | | 8.53 | % | | | -2.08 | % | | | 0.54 | % | | | N/A | | | | 7.74 | % |
LKCM Small-Mid Cap Equity Fund – | | | | | | | | | | | | | | | | | | | | | | | | | | | | | | | | | | | | |
Institutional Class | | | 5/2/11 | | | $ | 9.36 | | | | 1.01 | % | | | 2.15 | % | | | 5.64 | % | | | -5.07 | % | | | N/A | | | | N/A | | | | -5.50 | % |
Russell 2500 Index3 | | | | | | | | | | | | | | | | | | | 8.31 | % | | | -2.29 | % | | | N/A | | | | N/A | | | | -4.80 | % |
LKCM Balanced Fund | | | 12/30/97 | | | $ | 15.49 | | | | 0.80 | % | | | 1.14 | % | | | 7.20 | % | | | 4.59 | % | | | 3.96 | % | | | 6.08 | % | | | 5.32 | % |
S&P 500 Index1 | | | | | | | | | | | | | | | | | | | 9.49 | % | | | 5.45 | % | | | 0.22 | % | | | 5.33 | % | | | 4.21 | % |
Barclays Capital U.S. Intermediate Government/Credit Bond Index4 | | | | | | | | | | | | | | | | | | | 2.10 | % | | | 5.42 | % | | | 6.01 | % | | | 5.08 | % | | | 5.65 | % |
LKCM Fixed Income Fund | | | 12/30/97 | | | $ | 11.18 | | | | 0.65 | % | | | 0.72 | % | | | 2.83 | % | | | 4.75 | % | | | 6.19 | % | | | 4.83 | % | | | 5.31 | % |
Barclays Capital U.S. Intermediate Government/Credit Bond Index4 | | | | | | | | | | | | | | | | | | | 2.10 | % | | | 5.42 | % | | | 6.01 | % | | | 5.08 | % | | | 5.65 | % |
Performance data quoted represents past performance and does not guarantee future results. The investment return and principal value of an investment will fluctuate so that an investor’s shares, when redeemed, may be worth more or less than the original cost. Current performance of the Fund may be lower or higher than the performance quoted. Performance data current to the most recent month end may be obtained by calling 1-800-688-LKCM. The Funds impose a 1.00% redemption fee on shares held less than 30 days. If reflected, the fee would reduce performance shown.
| * | The Adviser has contractually agreed to waive all or a portion of its management fee and/or reimburse the Fund to maintain designated expense ratios through April 30, 2013. Investment performance reflects fee waivers, if any, in effect. In the absence of such waivers, total return would be reduced. Investment performance is based upon the net expense ratio. |
| ** | Expense ratios above are as of December 31, 2011, the Funds’ prior fiscal year end, as reported in the Funds’ most recent prospectus. Expense ratios reported for other periods in the financial highlights of this report may differ. |
| 1 | The S&P 500 Index is an unmanaged capitalization-weighted index of 500 stocks designed to measure performance of the broad domestic economy through changes in the aggregate market value of 500 stocks representing all major industries. |
| 2 | The Russell 2000 Index is an unmanaged index which measures the performance of the 2,000 smallest companies in the Russell 3000 Index. |
| 3 | The Russell 2500 Index is an unmanaged index which measures the performance of the 2,500 smallest companies in the Russell 3000 Index. |
| 4 | The Barclays Capital U.S. Intermediate Government/Credit Bond Index is an unmanaged market value weighted index measuring both the principal price changes of, and income provided by, the underlying universe of securities that comprise the index. Securities included in the index must meet the following criteria: fixed as opposed to variable rate; remaining maturity of one to ten years; minimum outstanding par value of $250 million; rated investment grade or higher by Moody’s Investors Service or equivalent; must be dollar denominated and non-convertible; and must be publicly issued. |
Note: These indices defined above are not available for direct investment.
Economic Review and Outlook
The U.S. equity market has been under pressure during 2012, reflecting concerns over the inability of European leaders to provide a reasonable path to mutualizing sovereign debt risk. Coincident with the downbeat headlines from Europe, domestic economic data began to soften. With below-trend economic growth, the U.S. economy could be vulnerable to shocks such as a spike in energy prices or inflation. Although we do not believe either will occur in the near-term, the anticipated changes in fiscal policy at year-end could represent a significant negative for the economy. It is our view that the majority of the fiscal change awaiting the country will be absorbed by retroactive actions taken by the new Congress next year.
We continue to believe the equity market is undervalued, primarily due to the earnings multiple compression that has occurred over the past three years. Over time the equity market typically follows the trajectory of corporate earnings. However, we believe the level of macro concerns in recent years has led to a temporary disconnect, as corporate earnings have continued to grow faster than the rise in the level of the equity market. As a result, the earnings multiple on the equity market, as measured by the Standard & Poor’s 500 Index, has compressed, while equivalent earnings multiples for U.S. treasury and corporate debt obligations have expanded. We believe this divergence in equity and bond market valuations will revert over time, and we continue to favor equities over fixed income as an asset class.
2
We anticipate the current U.S. economic expansion will continue at a tepid pace. We believe bond yields should remain very low this year and rise progressively next year as Congress moves to remedy the drag of the fiscal cliff. The dollar is likely to remain strong in the current environment. We also expect that Europe is likely to move further towards fiscal unification which should gradually reduce European concerns from a boil to a simmer, although the challenges facing the Eurozone will likely continue for years.
The elections this Fall represent a great deal of uncertainty, and the market generally views uncertainty with disdain. However, with only months remaining before the elections, we are moving quickly toward the post-election world, which should be a relief to the markets. Aside from the elections, we continue to see steady progress in the improvement of household balance sheets, while corporate profits continue to rise. Falling energy and commodity prices act as a tailwind to the economy. Bank lending is once again expanding which acts as a critical link between savings and investment for the economy. We continue to remain positive on equity valuations and believe the market continues to afford opportunities to purchase competitively advantaged companies at attractive prices.
LKCM Equity Fund
The LKCM Equity Fund advanced 6.71% during the first half of 2012 versus the 9.49% return for the Fund’s benchmark, the S&P 500 Index. Stock selection in the Consumer Discretionary and Materials sectors and an overweight allocation to the Energy sector benefited the Fund’s performance during the first half of 2012, while stock selection in the Information Technology and Industrials sectors detracted from the Fund’s performance. We continue to believe the Fund is positioned with a strong emphasis on high quality companies with internal growth prospects that should experience solid improvement from an anticipated economic expansion.
LKCM Small Cap Equity Fund
The LKCM Small Cap Equity Fund – Institutional Class advanced 5.30% during the first half of 2012, while the Fund’s benchmark, the Russell 2000 Index, returned 8.53% during the same period. The Fund benefited from solid stock selection in the Healthcare and Technology sectors but it was not enough to offset weakness in stock selection in other sectors, especially the Consumer Discretionary and Energy sectors. Our sector allocation decisions were a drag to the Fund’s results as our economic growth outlook had us overweight sectors that lagged the market, namely the Technology and Energy sectors. Being underweight the better performing Financials sector and being underweight the defensive sectors, Consumer Staples and Utilities, also detracted from the Fund’s performance during the first half of 2012. Energy investments have been a big winner for the Fund the past few years, but with the recent pullback in oil prices, we have reduced the Fund’s weighting in this sector to roughly in line with the benchmark.
LKCM Small-Mid Cap Equity Fund
The LKCM Small-Mid Cap Equity Fund advanced 5.64% during the first half of 2012, while the Fund’s benchmark, the Russell 2500 Index, returned 8.31% during the same period. The Fund benefited from solid stock selection in the Healthcare and Technology sectors but it was not enough to offset weakness in stock selection in other sectors, especially the Energy sector. Our sector allocation decisions were a drag to the Fund’s results as our economic growth outlook had us overweight sectors that lagged the market, namely the Technology and Energy sectors. Being underweight the better performing Financials sector and being underweight the defensive sectors, Consumer Staples and Utilities, also detracted from the Fund’s performance during the first half of 2012.
LKCM Fixed Income Fund
The LKCM Fixed Income Fund outperformed its benchmark, the Barclays Capital Intermediate Government/Credit Bond Index, during the first half of 2012, advancing 2.83% versus the 2.10% return for the benchmark. The Fund outperformed the benchmark during the first half of the year as the corporate bond market was bolstered by strong corporate balance sheets and cash flow metrics and investors search for yield. The Fund’s corporate bond focus was additive to performance during the first half of the year as U.S. Treasuries were buffeted by the evolving European sovereign and bank debt crisis. The Fund’s defensive duration posture, 3.7 years versus 3.9 years for the benchmark, detracted from performance during the first half of 2012 as longer duration issues outperformed their shorter duration counterparts. We believe our investment emphasis on a diversified portfolio of high-quality, short-to-intermediate duration corporate bonds well positions the Fund in this increasingly dynamic market environment.
LKCM Balanced Fund
The LKCM Balanced Fund returned 7.20% during the first half of 2012 versus the 9.49% and 2.10% returns of the S&P 500 Index and Barclays Capital Intermediate Government/Credit Bond Index, respectively. The Fund’s blend of equity and fixed income securities benefited the Fund’s performance during the first half of 2012. The Fund’s equity investments generated most of the Fund’s returns during the first half of 2012, while investments in fixed income securities provided some downside protection during the stock market sell-off in the second quarter. Stock selection in the Healthcare, Materials and Consumer Discretionary sectors benefited the Fund’s performance, while stock selection in the Information Technology sector detracted from the Fund’s performance.
J. Luther King, Jr., CFA
August 1, 2012
3
The information provided herein represents the opinion of J. Luther King, Jr. and is not intended to be a forecast of future events, a guarantee of future results, nor investment advice.
Please refer to the Schedule of Investments found on pages 8-20 of the report for more information on Fund holdings. Fund holdings and sector allocations are subject to change and are not recommendations to buy or sell any securities.
Mutual fund investing involves risk. Principal loss is possible. Past performance is not a guarantee of future results. Small and medium capitalization funds typically carry additional risks, since smaller companies generally have a higher risk of failure, and, historically, their stocks have experienced a greater degree of market volatility than stocks on average. Investments in debt securities typically decrease in value when interest rates rise. This risk is greater for longer-term debt securities. These risks are discussed in the Fund’s summary and statutory prospectuses.
Current and future portfolio holdings are subject to risk.
Diversification does not assure a profit nor protect against loss in a declining market.
Earnings growth is not a measure of the Fund’s future performance.
Duration is a commonly used measure of the potential volatility of the price of a debt security, or the aggregate market value of a portfolio of debt securities, prior to maturity. Securities with a longer duration generally have more volatile prices than securities of comparable quality with a shorter duration.
Cash flow measures the cash generating capability of a company by adding non-cash charges (e.g. depreciation) and interest expense to pretax income.
Earnings multiple: The earnings multiple of a stock, also called the price/earnings (P/E) ratio, is the share price divided by the earnings per share. The earnings multiple is often based on the prior twelve months of earnings data.
Must be preceded or accompanied by a prospectus.
Quasar Distributors, LLC, distributor.
4
LKCM Funds Expense Example — June 30, 2012 (Unaudited)
As a shareholder of the Funds, you incur two types of costs: (1) transaction costs, including redemption fees; and (2) ongoing costs, including management fees, distribution and/or service (12b-1) fees and other Fund expenses. This Example is intended to help you understand your ongoing costs (in dollars) of investing in the Funds and to compare these costs with the ongoing costs of investing in other mutual funds. The Example is based on an investment of $1,000 invested at the beginning of the period and held for the entire period (1/1/12-6/30/12).
ACTUAL EXPENSES
The first line of the tables below provides information about actual account values and actual expenses. Although the Funds charge no sales load, you will be assessed fees for outgoing wire transfers, returned checks and stop payment orders at prevailing rates charged by U.S. Bancorp Fund Services, LLC, the Funds’ transfer agent. If you request that a redemption be made by wire transfer, currently a $15.00 fee is charged by the Funds’ transfer agent. You will be charged a redemption fee equal to 1.00% of the net amount of the redemption if you redeem your shares of the LKCM Small Cap Equity, Small-Mid Cap Equity, Equity, Balanced and Fixed Income Funds within 30 days of purchase. To the extent the Funds invest in shares of other investment companies as part of their investment strategies, you will indirectly bear your proportionate share of any fees and expenses charged by the underlying funds in which the Funds invest in addition to the expenses of the Funds. Actual expenses of the underlying funds are expected to vary among the various underlying funds. These expenses are not included in the example below. The example below includes management fees, registration fees and other expenses. However, the example below does not include portfolio trading commissions and related expenses and other extraordinary expenses as determined under generally accepted accounting principles. You may use the information in this line, together with the amount you invested, to estimate the expenses that you paid over the period. Simply divide your account value by $1,000 (for example, an $8,600 account value divided by $1,000 = 8.6), then multiply the result by the number in the first line under the heading entitled “Expenses Paid During Period” to estimate the expenses you paid on your account during this period.
HYPOTHETICAL EXAMPLES FOR COMPARISON PURPOSES
The second line of the tables below provides information about hypothetical account values and hypothetical expenses based on the Funds’ actual expense ratios and an assumed rate of return of 5% per year before expenses, which are not the Funds’ actual returns. The hypothetical account values and expenses may not be used to estimate the actual ending account balance or expenses you paid for the period. You may use this information to compare the ongoing costs of investing in the Funds and other funds. To do so, compare this 5% hypothetical example with the 5% hypothetical examples that appear in the shareholder reports of the other funds. Please note that the expenses shown in the table are meant to highlight your ongoing costs only and do not reflect any transactional costs, such as redemption fees. Therefore, the second line of the table is useful in comparing ongoing costs only, and will not help you determine the relative total costs of owning different funds. In addition, if these transactions costs were included, your costs would have been higher.
| | | | | | | | | | | | |
| | | LKCM Small Cap Equity Fund – Institutional Class | |
| | | Beginning | | | Ending | | | Expenses Paid | |
| | | Account Value | | | Account Value | | | During Period* | |
| | | 1/1/12 | | | 6/30/12 | | | 1/1/12 - 6/30/12 | |
Actual | | $ | 1,000.00 | | | $ | 1,053.00 | | | $ | 4.80 | |
Hypothetical (5% return before expense) | | $ | 1,000.00 | | | $ | 1,020.19 | | | $ | 4.72 | |
| * | Expenses are equal to the Fund’s annualized net expense ratio of 0.94%, multiplied by the average account value over the period, multiplied by 182/366 to reflect the one-half year period. |
| | | | | | | | | | | | |
| | | LKCM Small Cap Equity Fund – Adviser Class | |
| | | Beginning | | | Ending | | | Expenses Paid | |
| | | Account Value | | | Account Value | | | During Period* | |
| | | 1/1/12 | | | 6/30/12 | | | 1/1/12 - 6/30/12 | |
Actual | | $ | 1,000.00 | | | $ | 1,051.60 | | | $ | 6.07 | |
Hypothetical (5% return before expense) | | $ | 1,000.00 | | | $ | 1,018.95 | | | $ | 5.97 | |
| * | Expenses are equal to the Fund’s annualized net expense ratio of 1.19%, multiplied by the average account value over the period, multiplied by 182/366 to reflect the one-half year period. |
5
| | | | | | | | | | | | |
| | | LKCM Small-Mid Cap Equity Fund | |
| | | Beginning | | | Ending | | | Expenses Paid | |
| | | Account Value | | | Account Value | | | During Period* | |
| | | 1/1/12 | | | 6/30/12 | | | 1/1/12 - 6/30/12 | |
Actual | | $ | 1,000.00 | | | $ | 1,056.40 | | | $ | 5.11 | |
Hypothetical (5% return before expense) | | $ | 1,000.00 | | | $ | 1,019.89 | | | $ | 5.02 | |
| * | Expenses are equal to the Fund’s annualized net expense ratio of 1.00%, multiplied by the average account value over the period, multiplied by 182/366 to reflect the one-half year period. |
| | | | | | | | | | | | |
| | | LKCM Equity Fund | |
| | | Beginning | | | Ending | | | Expenses Paid | |
| | | Account Value | | | Account Value | | | During Period* | |
| | | 1/1/12 | | | 6/30/12 | | | 1/1/12 - 6/30/12 | |
Actual | | $ | 1,000.00 | | | $ | 1,067.10 | | | $ | 4.11 | |
Hypothetical (5% return before expense) | | $ | 1,000.00 | | | $ | 1,020.89 | | | $ | 4.02 | |
| * | Expenses are equal to the Fund’s annualized net expense ratio of 0.80%, multiplied by the average account value over the period, multiplied by 182/366 to reflect the one-half year period. |
| | | | | | | | | | | | |
| | | LKCM Balanced Fund | |
| | | Beginning | | | Ending | | | Expenses Paid | |
| | | Account Value | | | Account Value | | | During Period* | |
| | | 1/1/12 | | | 6/30/12 | | | 1/1/12 - 6/30/12 | |
Actual | | $ | 1,000.00 | | | $ | 1,072.00 | | | $ | 4.12 | |
Hypothetical (5% return before expense) | | $ | 1,000.00 | | | $ | 1,020.89 | | | $ | 4.02 | |
| * | Expenses are equal to the Fund’s annualized net expense ratio of 0.80%, multiplied by the average account value over the period, multiplied by 182/366 to reflect the one-half year period. |
| | | | | | | | | | | | |
| | | LKCM Fixed Income Fund | |
| | | Beginning | | | Ending | | | Expenses Paid | |
| | | Account Value | | | Account Value | | | During Period* | |
| | | 1/1/12 | | | 6/30/12 | | | 1/1/12 - 6/30/12 | |
Actual | | $ | 1,000.00 | | | $ | 1,028.30 | | | $ | 3.28 | |
Hypothetical (5% return before expense) | | $ | 1,000.00 | | | $ | 1,021.63 | | | $ | 3.27 | |
| * | Expenses are equal to the Fund’s annualized net expense ratio of 0.65%, multiplied by the average account value over the period, multiplied by 182/366 to reflect the one-half year period. |
6
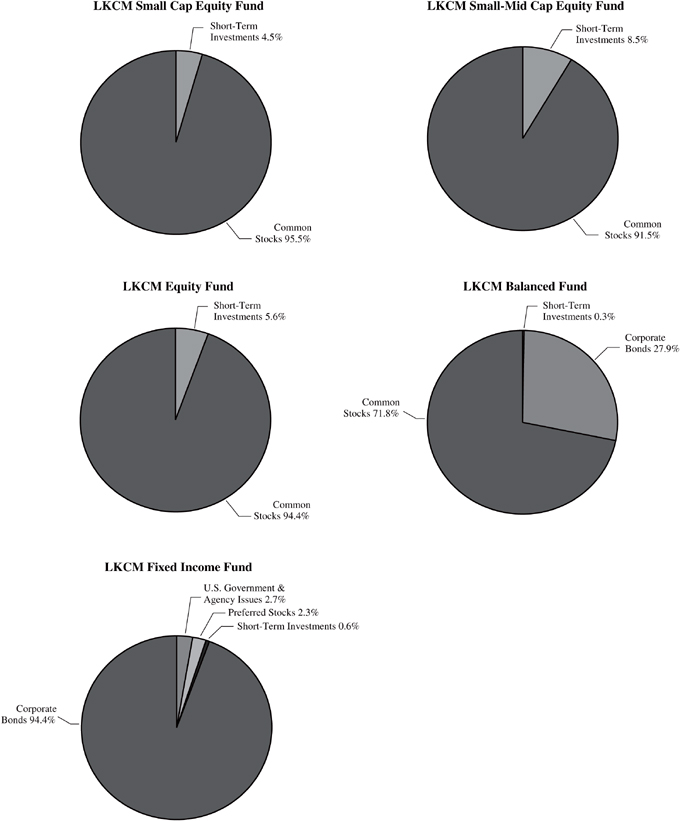
ALLOCATION OF PORTFOLIO HOLDINGS — LKCM Funds — June 30, 2012 (Unaudited)
Percentages represent market value as a percentage of total investments.
7
LKCM SMALL CAP EQUITY FUND
SCHEDULEOF INVESTMENTS
June 30, 2012 (Unaudited)
| | | | | | | | |
| | | Shares | | | Value | |
| COMMON STOCKS - 95.6% | |
Aerospace & Defense - 1.8% | |
Hexcel Corporation (a) | | | 574,650 | | | $ | 14,820,224 | |
| | | | | | | | |
Air Freight & Logistics - 0.5% | |
UTI Worldwide, Inc. (b) | | | 279,525 | | | | 4,083,860 | |
| | | | | | | | |
Auto Components - 1.4% | |
Group 1 Automotive, Inc. | | | 246,250 | | | | 11,231,462 | |
| | | | | | | | |
Banks - 8.7% | |
Community Bank System, Inc. | | | 367,700 | | | | 9,972,024 | |
First Horizon National Corporation | | | 1,153,375 | | | | 9,976,694 | |
Home Bancshares Inc. | | | 289,575 | | | | 8,855,203 | |
Prosperity Bancshares, Inc. | | | 232,425 | | | | 9,768,823 | |
Texas Capital Bancshares, Inc. (a) | | | 312,800 | | | | 12,633,992 | |
UMB Financial Corporation | | | 195,593 | | | | 10,020,229 | |
Umpqua Holdings Corporation | | | 812,550 | | | | 10,693,158 | |
| | | | | | | | |
| | | | | | | 71,920,123 | |
| | | | | | | | |
Capital Markets - 1.2% | |
Greenhill & Co., Inc. | | | 281,550 | | | | 10,037,258 | |
| | | | | | | | |
Commercial Services & Supplies - 1.0% | |
Insperity, Inc. | | | 323,025 | | | | 8,737,826 | |
| | | | | | | | |
Communications Equipment - 6.4% | |
Brocade Communications | | | | | | | | |
Systems, Inc. (a) | | | 1,722,400 | | | | 8,491,432 | |
Ciena Corporation (a) | | | 654,225 | | | | 10,709,663 | |
Infinera Corporation (a) | | | 1,043,500 | | | | 7,137,540 | |
Ixia (a) | | | 625,250 | | | | 7,515,505 | |
Loral Space & Communications Inc. | | | 120,475 | | | | 8,113,991 | |
NICE Systems Limited - ADR (a) (b) | | | 294,175 | | | | 10,766,805 | |
| | | | | | | | |
| | | | | | | 52,734,936 | |
| | | | | | | | |
Consumer Finance - 2.3% | |
Cash America International, Inc. | | | 234,275 | | | | 10,317,471 | |
First Cash Financial Services, Inc. (a) | | | 216,301 | | | | 8,688,811 | |
| | | | | | | | |
| | | | | | | 19,006,282 | |
| | | | | | | | |
Containers & Packaging - 1.2% | |
Silgan Holdings Inc. | | | 225,575 | | | | 9,629,797 | |
| | | | | | | | |
Electrical Equipment & Instruments - 4.1% | |
Belden Inc. | | | 294,325 | | | | 9,815,739 | |
Franklin Electric Co., Inc. | | | 192,015 | | | | 9,817,727 | |
Thermon Group Holdings Inc. (a) | | | 246,250 | | | | 5,099,837 | |
Woodward Inc. | | | 235,775 | | | | 9,298,966 | |
| | | | | | | | |
| | | | | | | 34,032,269 | |
| | | | | | | | |
Electronic Equipment & Instruments - 1.7% | |
Mercury Computer Systems, Inc. (a) | | | 530,200 | | | | 6,855,486 | |
National Instruments Corporation | | | 268,000 | | | | 7,198,480 | |
| | | | | | | | |
| | | | | | | 14,053,966 | |
| | | | | | | | |
Energy Equipment & Services - 0.7% | |
Atwood Oceanics, Inc. (a) | | | 160,925 | | | | 6,089,402 | |
| | | | | | | | |
Health Care Equipment & Supplies - 6.4% | |
Cyberonics, Inc. (a) | | | 227,250 | | | | 10,212,615 | |
DexCom Inc. (a) | | | 700,900 | | | | 9,083,664 | |
| | | | | | | | |
| | | Shares | | | Value | |
COMMON STOCKS | | | | | | | | |
Health Care Equipment & Supplies - 6.4%, Continued | |
Endologix, Inc. (a) | | | 699,058 | | | $ | 10,793,456 | |
MWI Veterinary Supply, Inc. (a) | | | 131,100 | | | | 13,473,147 | |
PerkinElmer, Inc. | | | 353,925 | | | | 9,131,265 | |
| | | | | | | | |
| | | | | | | 52,694,147 | |
| | | | | | | | |
Health Care Providers & Services - 4.9% | |
Computer Programs and Systems, Inc. | | | 185,675 | | | | 10,624,323 | |
Health Management Associates Inc.
- Class A (a) | | | 1,000,810 | | | | 7,856,358 | |
HMS Holdings Corporation (a) | | | 349,060 | | | | 11,627,189 | |
Team Health Holdings, Inc. (a) | | | 427,275 | | | | 10,293,055 | |
| | | | | | | | |
| | | | | | | 40,400,925 | |
| | | | | | | | |
Household Durables - 0.9% | |
Select Comfort Corporation (a) | | | 370,050 | | | | 7,741,446 | |
| | | | | | | | |
Industrial Conglomerates - 2.0% | |
Raven Industries, Inc. | | | 124,100 | | | | 8,636,119 | |
Rexnord Corp. (a) | | | 396,425 | | | | 7,944,357 | |
| | | | | | | | |
| | | | | | | 16,580,476 | |
| | | | | | | | |
Insurance - 1.6% | |
AmTrust Financial Services, Inc. | | | 427,264 | | | | 12,694,014 | |
| | | | | | | | |
Internet Software & Services - 3.4% | |
The Active Network, Inc. (a) | | | 650,445 | | | | 10,010,349 | |
LivePerson, Inc. (a) | | | 544,450 | | | | 10,377,217 | |
LogMeIn, Inc. (a) | | | 246,250 | | | | 7,515,550 | |
| | | | | | | | |
| | | | | | | 27,903,116 | |
| | | | | | | | |
Machinery - 8.8% | |
Actuant Corporation - Class A | | | 385,950 | | | | 10,482,402 | |
Astec Industries, Inc. (a) | | | 225,450 | | | | 6,916,806 | |
Barnes Group Inc. | | | 291,250 | | | | 7,074,463 | |
Chart Industries, Inc. (a) | | | 142,025 | | | | 9,765,639 | |
CLARCOR Inc. | | | 189,400 | | | | 9,121,504 | |
EnPro Industries, Inc. (a) | | | 223,350 | | | | 8,346,589 | |
The Middleby Corporation (a) | | | 103,200 | | | | 10,279,752 | |
Westport Innovations Inc. (a) (b) | | | 285,521 | | | | 10,492,897 | |
| | | | | | | | |
| | | | | | | 72,480,052 | |
| | | | | | | | |
Marine - 0.9% | |
Kirby Corporation (a) | | | 160,925 | | | | 7,576,349 | |
| | | | | | | | |
Media - 1.1% | |
Cinemark Holdings, Inc. | | | 403,475 | | | | 9,219,404 | |
| | | | | | | | |
Metals & Mining - 3.3% | |
Carpenter Technology Corporation | | | 192,675 | | | | 9,217,572 | |
Commercial Metals Company | | | 717,450 | | | | 9,068,568 | |
Haynes International, Inc. | | | 181,028 | | | | 9,221,566 | |
| | | | | | | | |
| | | | | | | 27,507,706 | |
| | | | | | | | |
Oil & Gas & Consumable Fuels - 5.2% | |
Approach Resources Inc. (a) | | | 441,003 | | | | 11,263,217 | |
Gulfport Energy Corporation (a) | | | 297,370 | | | | 6,134,743 | |
Kodiak Oil & Gas Corporation (a) (b) | | | 873,650 | | | | 7,172,667 | |
Northern Oil & Gas, Inc. (a) | | | 249,625 | | | | 3,979,022 | |
The accompanying notes are an integral part of these financial statements.
8
LKCM SMALL CAP EQUITY FUND
SCHEDULEOF INVESTMENTS, CONTINUED
June 30, 2012 (Unaudited)
| | | | | | | | |
| | | Shares | | | Value | |
COMMON STOCKS | |
Oil & Gas & Consumable Fuels - 5.2%, Continued | |
Oasis Petroleum Inc. (a) | | | 313,200 | | | $ | 7,573,176 | |
Rosetta Resources, Inc. (a) | | | 197,228 | | | | 7,226,434 | |
| | | | | | | | |
| | | | | | | 43,349,259 | |
| | | | | | | | |
Pharmaceuticals - 1.2% | |
Akorn, Inc. (a) | | | 628,924 | | | | 9,918,131 | |
| | | | | | | | |
Real Estate - 0.7% | |
FirstService Corporation (a) (b) | | | 214,859 | | | | 6,009,606 | |
| | | | | | | | |
Semiconductor Equipment & Products - 1.7% | |
Cirrus Logic, Inc. (a) | | | 458,550 | | | | 13,701,474 | |
| | | | | | | | |
Software - 6.9% | |
ACI Worldwide, Inc. (a) | | | 291,875 | | | | 12,903,794 | |
Aspen Technology, Inc. (a) | | | 601,000 | | | | 13,913,150 | |
Interactive Intelligence Group, Inc. (a) | | | 330,600 | | | | 9,326,226 | |
MicroStrategy Incorporated - Class A (a) | | | 79,187 | | | | 10,283,224 | |
Pegasystems Inc. | | | 314,533 | | | | 10,373,298 | |
| | | | | | | | |
| | | | | | | 56,799,692 | |
| | | | | | | | |
Specialty Retail - 7.5% | |
bebe stores, inc. | | | 748,975 | | | | 4,396,483 | |
DSW Inc. - Class A | | | 183,800 | | | | 9,998,720 | |
Genesco Inc. (a) | | | 167,725 | | | | 10,088,659 | |
GNC Holdings, Inc. - Class A | | | 221,750 | | | | 8,692,600 | |
Hibbett Sports Inc. (a) | | | 193,878 | | | | 11,188,699 | |
Monro Muffler Brake, Inc. | | | 247,233 | | | | 8,218,025 | |
Sonic Automotive, Inc. - Class A | | | 687,950 | | | | 9,404,277 | |
| | | | | | | | |
| | | | | | | 61,987,463 | |
| | | | | | | | |
Textiles, Apparel & Luxury Goods - 4.6% | |
The Children’s Place Retail Stores,
Inc. (a) | | | 149,555 | | | | 7,452,326 | |
Crocs, Inc. (a) | | | 531,400 | | | | 8,582,110 | |
Fifth & Pacific Companies, Inc. (a) | | | 771,825 | | | | 8,281,682 | |
The Warnaco Group, Inc. (a) | | | 165,675 | | | | 7,054,441 | |
Wolverine World Wide, Inc. | | | 168,200 | | | | 6,522,796 | |
| | | | | | | | |
| | | | | | | 37,893,355 | |
| | | | | | | | |
Thrifts & Mortgage Finance - 1.2% | |
Capitol Federal Financial Inc. | | | 833,800 | | | | 9,905,544 | |
| | | | | | | | |
Trading Companies & Distributors - 2.2% | |
Kaman Corporation | | | 260,225 | | | | 8,051,362 | |
WESCO International, Inc. (a) | | | 176,200 | | | | 10,140,310 | |
| | | | | | | | |
| | | | | | | 18,191,672 | |
| | | | | | | | |
Wireless Telecommunication Services - 0.1% | |
Leap Wireless International, Inc. (a) | | | 143,437 | | | | 922,300 | |
| | | | | | | | |
TOTAL COMMON STOCKS
(Cost $637,906,965) | | | | 789,853,536 | |
| | | | | | | | |
| | | | | | | | |
| | | Shares | | | Value | |
SHORT-TERM INVESTMENTS - 4.5% | |
Money Market Funds (c) - 4.5% | |
Dreyfus Government Cash Management Fund - Institutional Shares, 0.01% | | | 12,936,749 | | | $ | 12,936,749 | |
Federated Government Obligations Fund - Institutional Shares, 0.01% | | | 23,982,804 | | | | 23,982,804 | |
| | | | | | | | |
TOTAL SHORT-TERM INVESTMENTS
(Cost $36,919,553) | | | | 36,919,553 | |
| | | | | | | | |
Total Investments - 100.1%
(Cost $674,826,518) | | | | 826,773,089 | |
Liabilities in Excess of Other Assets - (0.1)% | | | | (312,644 | ) |
| | | | | | | | |
TOTAL NET ASSETS - 100.0% | | | $ | 826,460,445 | |
| | | | | | | | |
ADR American Depository Receipt.
| (a) | Non-income producing security. |
| (b) | U.S. Dollar-denominated foreign security. |
| (c) | The rate quoted is the annualized seven-day yield of the fund at period end. |
The Global Industry Classification Standard (GICS®) was developed by and/or is the exclusive property of MSCI, Inc. and Standard & Poor Financial Services LLC (“S&P”). GICS is a service mark of MSCI and S&P and has been licensed for use by U.S. Bancorp Fund Services, LLC.
The accompanying notes are an integral part of these financial statements.
9
LKCM SMALL-MID CAP EQUITY FUND
SCHEDULEOF INVESTMENTS
June 30, 2012 (Unaudited)
| | | | | | | | |
| | | Shares | | | Value | |
COMMON STOCKS - 91.0% | |
Aerospace & Defense - 4.6% | |
BE Aerospace, Inc. (a) | | | 124,470 | | | $ | 5,434,361 | |
Hexcel Corporation (a) | | | 180,955 | | | | 4,666,829 | |
| | | | | | | | |
| | | | | | | 10,101,190 | |
| | | | | | | | |
Air Freight & Logistics - 1.4% | |
UTI Worldwide, Inc. (b) | | | 213,600 | | | | 3,120,696 | |
| | | | | | | | |
Auto Components - 2.1% | |
Gentex Corporation | | | 140,610 | | | | 2,934,531 | |
Group 1 Automotive, Inc. | | | 36,325 | | | | 1,656,783 | |
| | | | | | | | |
| | | | | | | 4,591,314 | |
| | | | | | | | |
Banks - 8.1% | |
Comerica Incorporated | | | 131,100 | | | | 4,026,080 | |
First Horizon National Corporation | | | 220,950 | | | | 1,911,218 | |
Prosperity Bancshares, Inc. | | | 94,200 | | | | 3,959,225 | |
Texas Capital Bancshares, Inc. (a) | | | 58,100 | | | | 2,346,659 | |
UMB Financial Corporation | | | 41,450 | | | | 2,123,484 | |
Umpqua Holdings Corporation | | | 250,975 | | | | 3,302,831 | |
| | | | | | | | |
| | | | | | | 17,669,497 | |
| | | | | | | | |
Capital Markets - 1.8% | |
Affiliated Managers Group, Inc. (a) | | | 36,455 | | | | 3,990,000 | |
| | | | | | | | |
Chemicals - 2.3% | |
FMC Corporation | | | 92,400 | | | | 4,941,552 | |
| | | | | | | | |
Communications Equipment - 4.4% | |
Ciena Corporation (a) | | | 215,325 | | | | 3,524,870 | |
NICE Systems Limited - ADR (a) (b) | | | 109,800 | | | | 4,018,680 | |
Riverbed Technology, Inc. (a) | | | 126,700 | | | | 2,046,205 | |
| | | | | | | | |
| | | | | | | 9,589,755 | |
| | | | | | | | |
Consumer Finance - 1.5% | |
Cash America International, Inc. | | | 76,175 | | | | 3,354,747 | |
| | | | | | | | |
Containers & Packaging - 1.7% | |
Silgan Holdings Inc. | | | 85,675 | | | | 3,657,466 | |
| | | | | | | | |
Distributors - 2.1% | |
LKQ Corporation (a) | | | 137,100 | | | | 4,579,140 | |
| | | | | | | | |
Electrical Equipment & Instruments - 5.5% | |
AMETEK, Inc. | | | 92,070 | | | | 4,595,213 | |
Belden Inc. | | | 121,650 | | | | 4,057,027 | |
Woodward Inc. | | | 83,000 | | | | 3,273,520 | |
| | | | | | | | |
| | | | | | | 11,925,760 | |
| | | | | | | | |
Electronic Equipment & Instruments - 3.5% | |
National Instruments Corporation | | | 131,350 | | | | 3,528,061 | |
Trimble Navigation Limited (a) | | | 86,625 | | | | 3,985,616 | |
| | | | | | | | |
| | | | | | | 7,513,677 | |
| | | | | | | | |
Energy Equipment & Services - 1.6% | |
Core Laboratories N.V. (b) | | | 30,290 | | | | 3,510,611 | |
| | | | | | | | |
Health Care Equipment & Supplies - 3.6% | |
IDEXX Laboratories, Inc. (a) | | | 43,375 | | | | 4,169,639 | |
PerkinElmer, Inc. | | | 141,050 | | | | 3,639,090 | |
| | | | | | | | |
| | | | | | | 7,808,729 | |
| | | | | | | | |
| | | | | | | | |
| | | Shares | | | Value | |
COMMON STOCKS | |
Health Care Providers & Services - 5.9% | |
Catalyst Health Solutions, Inc. (a) | | | 46,750 | | | $ | 4,368,320 | |
HMS Holdings Corporation (a) | | | 134,520 | | | | 4,480,861 | |
Team Health Holdings, Inc. (a) | | | 167,180 | | | | 4,027,366 | |
| | | | | | | | |
| | | | | | | 12,876,547 | |
| | | | | | | | |
Household Durables - 0.7% | |
Select Comfort Corporation (a) | | | 72,200 | | | | 1,510,424 | |
| | | | | | | | |
Industrial Conglomerates - 0.8% | |
Rexnord Corp. (a) | | | 89,950 | | | | 1,802,598 | |
| | | | | | | | |
Insurance - 2.2% | |
AmTrust Financial Services, Inc. | | | 161,250 | | | | 4,790,738 | |
| | | | | | | | |
Internet Software & Services - 1.6% | |
Akamai Technologies, Inc. (a) | | | 112,650 | | | | 3,576,638 | |
| | | | | | | | |
Leisure Equipment & Products - 2.3% | |
Polaris Industries Inc. | | | 71,190 | | | | 5,088,661 | |
| | | | | | | | |
Machinery - 4.4% | |
The Middleby Corporation (a) | | | 19,025 | | | | 1,895,080 | |
Valmont Industries, Inc. | | | 40,535 | | | | 4,903,519 | |
Westport Innovations Inc. (a) (b) | | | 73,725 | | | | 2,709,394 | |
| | | | | | | | |
| | | | | | | 9,507,993 | |
| | | | | | | | |
Marine - 1.3% | |
Kirby Corporation (a) | | | 61,525 | | | | 2,896,597 | |
| | | | | | | | |
Metals & Mining - 1.6% | |
Carpenter Technology Corporation | | | 70,300 | | | | 3,363,152 | |
| | | | | | | | |
Oil & Gas & Consumable Fuels - 4.6% | |
Kodiak Oil & Gas Corporation (a) (b) | | | 400,875 | | | | 3,291,184 | |
Oasis Petroleum Inc. (a) | | | 124,025 | | | | 2,998,925 | |
Rosetta Resources, Inc. (a) | | | 99,400 | | | | 3,642,015 | |
| | | | | | | | |
| | | | | | | 9,932,124 | |
| | | | | | | | |
Pharmaceuticals - 0.9% | |
Akorn, Inc. (a) | | | 128,000 | | | | 2,018,560 | |
| | | | | | | | |
Semiconductor Equipment & Products - 2.5% | |
Cirrus Logic, Inc. (a) | | | 183,860 | | | | 5,493,737 | |
| | | | | | | | |
Software - 8.4% | |
ACI Worldwide, Inc. (a) | | | 77,625 | | | | 3,431,801 | |
ANSYS, Inc. (a) | | | 66,950 | | | | 4,225,215 | |
Aspen Technology, Inc. (a) | | | 87,775 | | | | 2,031,991 | |
Nuance Communications, Inc. (a) | | | 153,700 | | | | 3,661,134 | |
TIBCO Software Inc. (a) | | | 167,840 | | | | 5,021,774 | |
| | | | | | | | |
| | | | | | | 18,371,915 | |
| | | | | | | | |
Specialty Retail - 8.1% | |
Dick’s Sporting Goods, Inc. | | | 78,100 | | | | 3,748,800 | |
GNC Holdings, Inc. - Class A | | | 104,611 | | | | 4,100,751 | |
Tractor Supply Company | | | 66,935 | | | | 5,559,621 | |
Ulta Salon, Cosmetics & Fragrance, Inc. | | | 44,800 | | | | 4,183,424 | |
| | | | | | | | |
| | | | | | | 17,592,596 | |
| | | | | | | | |
The accompanying notes are an integral part of these financial statements.
10
LKCM SMALL-MID CAP EQUITY FUND
SCHEDULEOF INVESTMENTS, CONTINUED
June 30, 2012 (Unaudited)
| | | | | | | | |
| | | Shares | | | Value | |
COMMON STOCKS | |
Trading Companies & Distributors - 1.5% | |
WESCO International, Inc. (a) | | | 58,110 | | | $ | 3,344,231 | |
| | | | | | | | |
TOTAL COMMON STOCKS
(Cost $194,465,830) | | | | 198,520,645 | |
| | | | | | | | |
SHORT-TERM INVESTMENTS - 8.5% | |
Money Market Funds (c) - 8.5% | |
Dreyfus Government Cash Management
Fund - Institutional Shares, 0.01% | | | 5,494,021 | | | | 5,494,021 | |
Federated Government Obligations Fund -
Institutional Shares, 0.01% | | | 5,506,616 | | | | 5,506,616 | |
Federated Treasury Obligations Fund -
Institutional Shares, 0.01% | | | 2,050,190 | | | | 2,050,190 | |
Invesco Short Term Investments Trust -
Treasury Portfolio - Institutional
Shares, 0.02% 5,490,731 | | | | | | | 5,490,731 | |
| | | | | | | | |
TOTAL SHORT-TERM INVESTMENTS
(Cost $18,541,558) | | | | 18,541,558 | |
| | | | | | | | |
Total Investments - 99.5%
(Cost $213,007,388) | | | | 217,062,203 | |
Other Assets in Excess of Liabilities - 0.5% | | | | | | | 1,061,192 | |
| | | | | | | | |
TOTAL NET ASSETS - 100.0% | | | $ | 218,123,395 | |
| | | | | | | | |
ADR American Depository Receipt.
| (a) | Non-income producing security. |
| (b) | U.S. Dollar-denominated foreign security. |
| (c) | The rate quoted is the annualized seven-day yield of the fund at period end. |
The Global Industry Classification Standard (GICS®) was developed by and/or is the exclusive property of MSCI, Inc. and Standard & Poor Financial Services LLC (“S&P”). GICS is a service mark of MSCI and S&P and has been licensed for use by U.S. Bancorp Fund Services, LLC.
The accompanying notes are an integral part of these financial statements.
11
LKCM EQUITY FUND
SCHEDULEOF INVESTMENTS
June 30, 2012 (Unaudited)
| | | | | | | | |
| | | Shares | | | Value | |
COMMON STOCKS - 94.4% | |
Aerospace & Defense - 2.8% | |
Honeywell International Inc. | | | 40,000 | | | $ | 2,233,600 | |
Rockwell Collins, Inc. | | | 25,400 | | | | 1,253,490 | |
| | | | | | | | |
| | | | | | | 3,487,090 | |
| | | | | | | | |
Auto Components - 0.8% | |
Gentex Corporation | | | 50,000 | | | | 1,043,500 | |
| | | | | | | | |
Banks - 9.3% | |
Comerica Incorporated | | | 63,000 | | | | 1,934,730 | |
Cullen/Frost Bankers, Inc. | | | 38,350 | | | | 2,204,742 | |
Glacier Bancorp, Inc. | | | 60,000 | | | | 929,400 | |
Hancock Holding Company | | | 70,000 | | | | 2,130,800 | |
Prosperity Bancshares, Inc. | | | 35,000 | | | | 1,471,050 | |
Texas Capital Bancshares, Inc. (a) | | | 18,000 | | | | 727,020 | |
Wells Fargo & Company | | | 70,000 | | | | 2,340,800 | |
| | | | | | | | |
| | | | | | | 11,738,542 | |
| | | | | | | | |
Beverages - 2.6% | |
The Coca-Cola Company | | | 20,000 | | | | 1,563,800 | |
PepsiCo, Inc. | | | 24,000 | | | | 1,695,840 | |
| | | | | | | | |
| | | | | | | 3,259,640 | |
| | | | | | | | |
Biotechnology - 2.4% | |
Amgen Inc. | | | 20,000 | | | | 1,460,800 | |
Celgene Corporation (a) | | | 25,000 | | | | 1,604,000 | |
| | | | | | | | |
| | | | | | | 3,064,800 | |
| | | | | | | | |
Chemicals - 6.4% | |
Airgas, Inc. | | | 13,000 | | | | 1,092,130 | |
E. I. du Pont de Nemours and Company | | | 45,000 | | | | 2,275,650 | |
FMC Corporation | | | 52,000 | | | | 2,780,960 | |
Monsanto Company | | | 24,000 | | | | 1,986,720 | |
| | | | | | | | |
| | | | | | | 8,135,460 | |
| | | | | | | | |
Commercial Services & Supplies - 0.7% | |
Waste Connections, Inc. | | | 30,000 | | | | 897,600 | |
| | | | | | | | |
Communication Equipment - 0.5% | |
QUALCOMM, Inc. | | | 12,400 | | | | 690,432 | |
| | | | | | | | |
Computers & Peripherals - 6.7% | |
Apple Inc. | | | 5,000 | | | | 2,920,000 | |
EMC Corporation (a) | | | 59,400 | | | | 1,522,422 | |
International Business Machines Corporation | | | 12,000 | | | | 2,346,960 | |
NetApp, Inc. (a) | | | 52,650 | | | | 1,675,323 | |
| | | | | | | | |
| | | | | | | 8,464,705 | |
| | | | | | | | |
Construction Materials - 1.9% | |
Martin Marietta Materials, Inc. | | | 30,000 | | | | 2,364,600 | |
| | | | | | | | |
Containers & Packaging - 1.2% | |
Ball Corporation | | | 36,550 | | | | 1,500,377 | |
| | | | | | | | |
Diversified Financial Services - 1.7% | |
JPMorgan Chase & Co. | | | 60,000 | | | | 2,143,800 | |
| | | | | | | | |
Electrical Equipment & Instruments - 3.7% | |
Emerson Electric Co. | | | 37,600 | | | | 1,751,408 | |
| | | | | | | | |
| | | | | | | | |
| | | Shares | | | Value | |
COMMON STOCKS | |
Electrical Equipment & Instruments - 3.7%, Continued | |
Franklin Electric Co., Inc. | | | 27,000 | | | $ | 1,380,510 | |
Roper Industries, Inc. | | | 15,990 | | | | 1,576,294 | |
| | | | | | | | |
| | | | | | | 4,708,212 | |
| | | | | | | | |
Electronic Equipment & Instruments - 2.3% | |
National Instruments Corporation | | | 49,300 | | | | 1,324,198 | |
Trimble Navigation Limited (a) | | | 35,000 | | | | 1,610,350 | |
| | | | | | | | |
| | | | | | | 2,934,548 | |
| | | | | | | | |
Energy Equipment & Services - 0.4% | |
National Oilwell Varco Inc. | | | 8,000 | | | | 515,520 | |
| | | | | | | | |
Food & Drug Retailing - 0.8% | |
Walgreen Company | | | 33,000 | | | | 976,140 | |
| | | | | | | | |
Health Care Equipment & Supplies - 5.3% | |
Covidien plc (b) | | | 30,000 | | | | 1,605,000 | |
DENTSPLY International Inc. | | | 40,000 | | | | 1,512,400 | |
PerkinElmer, Inc. | | | 70,000 | | | | 1,806,000 | |
Thermo Fisher Scientific, Inc. | | | 35,000 | | | | 1,816,850 | |
| | | | | | | | |
| | | | | | | 6,740,250 | |
| | | | | | | | |
Hotels, Restaurants & Leisure - 0.7% | |
Yum! Brands, Inc. | | | 14,000 | | | | 901,880 | |
| | | | | | | | |
Household Durables - 2.0% | |
Jarden Corporation | | | 60,000 | | | | 2,521,200 | |
| | | | | | | | |
Household Products - 4.5% | |
Colgate-Palmolive Company | | | 8,600 | | | | 895,260 | |
Kimberly-Clark Corporation | | | 30,000 | | | | 2,513,100 | |
The Procter & Gamble Company | | | 36,810 | | | | 2,254,612 | |
| | | | | | | | |
| | | | | | | 5,662,972 | |
| | | | | | | | |
Industrial Conglomerates - 0.7% | |
Raven Industries, Inc. | | | 13,000 | | | | 904,670 | |
| | | | | | | | |
Insurance - 0.5% | |
Prudential Financial, Inc. | | | 12,000 | | | | 581,160 | |
| | | | | | | | |
Internet Catalog & Retail - 1.4% | |
Amazon.com, Inc. (a) | | | 7,500 | | | | 1,712,625 | |
| | | | | | | | |
Internet Software & Services - 2.5% | |
Akamai Technologies, Inc. (a) | | | 45,000 | | | | 1,428,750 | |
Google Inc. - Class A (a) | | | 3,000 | | | | 1,740,210 | |
| | | | | | | | |
| | | | | | | 3,168,960 | |
| | | | | | | | |
Machinery - 4.2% | |
Danaher Corporation | | | 35,000 | | | | 1,822,800 | |
Pall Corporation | | | 27,000 | | | | 1,479,870 | |
Valmont Industries, Inc. | | | 17,000 | | | | 2,056,490 | |
| | | | | | | | |
| | | | | | | 5,359,160 | |
| | | | | | | | |
Marine - 1.7% | |
Kirby Corporation (a) | | | 45,000 | | | | 2,118,600 | |
| | | | | | | | |
The accompanying notes are an integral part of these financial statements.
12
LKCM EQUITY FUND
SCHEDULEOF INVESTMENTS, CONTINUED
June 30, 2012 (Unaudited)
| | | | | | | | |
| | | Shares | | | Value | |
COMMON STOCKS | |
Media - 1.3% | |
Cinemark Holdings, Inc. | | | 25,000 | | | $ | 571,250 | |
Time Warner Inc. | | | 27,200 | | | | 1,047,200 | |
| | | | | | | | |
| | | | | | | 1,618,450 | |
| | | | | | | | |
Metals & Mining - 0.5% | |
Titanium Metals Corporation | | | 60,000 | | | | 678,600 | |
| | | | | | | | |
Oil & Gas & Consumable Fuels - 7.7% | |
Cabot Oil & Gas Corporation | | | 28,000 | | | | 1,103,200 | |
ConocoPhillips | | | 33,700 | | | | 1,883,156 | |
Devon Energy Corporation | | | 17,300 | | | | 1,003,227 | |
EOG Resources, Inc. | | | 15,100 | | | | 1,360,661 | |
Exxon Mobil Corporation | | | 30,070 | | | | 2,573,090 | |
Noble Energy, Inc. | | | 10,000 | | | | 848,200 | |
Range Resources Corporation | | | 15,000 | | | | 928,050 | |
| | | | | | | | |
| | | | | | | 9,699,584 | |
| | | | | | | | |
Pharmaceuticals - 6.4% | |
Abbott Laboratories | | | 40,000 | | | | 2,578,800 | |
Allergan, Inc. | | | 10,000 | | | | 925,700 | |
Johnson & Johnson | | | 35,000 | | | | 2,364,600 | |
Pfizer Inc. | | | 100,000 | | | | 2,300,000 | |
| | | | | | | | |
| | | | | | | 8,169,100 | |
| | | | | | | | |
Road & Rail - 1.5% | |
Kansas City Southern | | | 8,500 | | | | 591,260 | |
Union Pacific Corporation | | | 11,000 | | | | 1,312,410 | |
| | | | | | | | |
| | | | | | | 1,903,670 | |
| | | | | | | | |
Software - 3.0% | |
Adobe Systems Incorporated (a) | | | 45,000 | | | | 1,456,650 | |
Microsoft Corporation | | | 43,000 | | | | 1,315,370 | |
Nuance Communications, Inc. (a) | | | 45,000 | | | | 1,071,900 | |
| | | | | | | | |
| | | | | | | 3,843,920 | |
| | | | | | | | |
Specialty Retail - 5.2% | |
The Home Depot, Inc. | | | 28,000 | | | | 1,483,720 | |
PetSmart, Inc. | | | 32,000 | | | | 2,181,760 | |
Tiffany & Co. | | | 25,000 | | | | 1,323,750 | |
Tractor Supply Company | | | 20,000 | | | | 1,661,200 | |
| | | | | | | | |
| | | | | | | 6,650,430 | |
| | | | | | | | |
Textiles, Apparel & Luxury Goods - 1.1% | |
VF Corporation | | | 10,000 | | | | 1,334,500 | |
| | | | | | | | |
TOTAL COMMON STOCKS
(Cost $96,466,619) | | | | | | | 119,494,697 | |
| | | | | | | | |
| | | | | | | | |
| | | Shares | | | Value | |
SHORT-TERM INVESTMENTS - 5.5% | |
Money Market Funds (c) - 5.5% | |
Dreyfus Government Cash Management Fund - Institutional Shares, 0.01% | | | 3,443,444 | | | $ | 3,443,444 | |
Federated Government Obligations Fund - Institutional Shares, 0.01% | | | 3,590,269 | | | | 3,590,269 | |
| | | | | | | | |
TOTAL SHORT-TERM INVESTMENTS
(Cost $7,033,713) | | | | | | | 7,033,713 | |
| | | | | | | | |
Total Investments - 99.9%
(Cost $103,500,332) | | | | | | | 126,528,410 | |
Other Assets in Excess of Liabilities - 0.1% | | | | | | | 85,024 | |
| | | | | | | | |
TOTAL NET ASSETS - 100.0% | | | | | | $ | 126,613,434 | |
| | | | | | | | |
| (a) | Non-income producing security. |
| (b) | U.S. Dollar-denominated foreign security. |
| (c) | The rate quoted is the annualized seven-day yield of the fund at period end. |
The Global Industry Classification Standard (GICS®) was developed by and/or is the exclusive property of MSCI, Inc. and Standard & Poor Financial Services LLC (“S&P”). GICS is a service mark of MSCI and S&P and has been licensed for use by U.S. Bancorp Fund Services, LLC.
The accompanying notes are an integral part of these financial statements.
13
LKCM BALANCED FUND
SCHEDULEOF INVESTMENTS
June 30, 2012 (Unaudited)
| | | | | | | | |
| | | Shares | | | Value | |
COMMON STOCKS - 71.6% | |
Aerospace & Defense - 1.3% | |
General Dynamics Corporation | | | 1,400 | | | $ | 92,344 | |
Rockwell Collins, Inc. | | | 3,600 | | | | 177,660 | |
| | | | | | | | |
| | | | | | | 270,004 | |
| | | | | | | | |
Air Freight & Logistics - 1.0% | |
United Parcel Service, Inc. - Class B | | | 2,600 | | | | 204,776 | |
| | | | | | | | |
Banks - 4.6% | |
Comerica Incorporated | | | 9,500 | | | | 291,745 | |
Cullen/Frost Bankers, Inc. | | | 3,900 | | | | 224,211 | |
Wells Fargo & Company | | | 8,471 | | | | 283,270 | |
Zions Bancorporation | | | 7,500 | | | | 145,650 | |
| | | | | | | | |
| | | | | | | 944,876 | |
| | | | | | | | |
Beverages - 2.3% | |
The Coca-Cola Company | | | 2,900 | | | | 226,751 | |
PepsiCo, Inc. | | | 3,600 | | | | 254,376 | |
| | | | | | | | |
| | | | | | | 481,127 | |
| | | | | | | | |
Biotechnology - 1.1% | |
Celgene Corporation (a) | | | 3,400 | | | | 218,144 | |
| | | | | | | | |
Chemicals - 4.7% | |
Air Products and Chemicals, Inc. | | | 1,900 | | | | 153,387 | |
Airgas, Inc. | | | 3,000 | | | | 252,030 | |
E. I. du Pont de Nemours and Company | | | 3,200 | | | | 161,824 | |
FMC Corporation | | | 4,800 | | | | 256,704 | |
Monsanto Company | | | 1,900 | | | | 157,282 | |
| | | | | | | | |
| | | | | | | 981,227 | |
| | | | | | | | |
Commercial Services & Supplies - 1.0% | |
Waste Management, Inc. | | | 6,100 | | | | 203,740 | |
| | | | | | | | |
Communications Equipment - 0.4% | |
Harris Corporation | | | 2,200 | | | | 92,070 | |
| | | | | | | | |
Computers & Peripherals - 5.4% | |
Apple Inc. | | | 875 | | | | 511,000 | |
EMC Corporation (a) | | | 7,400 | | | | 189,662 | |
International Business Machines Corporation | | | 1,300 | | | | 254,254 | |
NetApp, Inc. (a) | | | 5,500 | | | | 175,010 | |
| | | | | | | | |
| | | | | | | 1,129,926 | |
| | | | | | | | |
Construction Materials - 1.0% | |
Martin Marietta Materials, Inc. | | | 2,700 | | | | 212,814 | |
| | | | | | | | |
Containers & Packaging - 1.1% | |
Ball Corporation | | | 5,700 | | | | 233,985 | |
| | | | | | | | |
Diversified Financial Services - 0.9% | |
JPMorgan Chase & Co. | | | 5,500 | | | | 196,515 | |
| | | | | | | | |
Diversified Telecommunication Services - 1.3% | |
AT&T Inc. | | | 7,400 | | | | 263,884 | |
| | | | | | | | |
Electrical Equipment & Instruments - 0.7% | |
Emerson Electric Co. | | | 3,200 | | | | 149,056 | |
| | | | | | | | |
| | | | | | | | |
| | | Shares | | | Value | |
COMMON STOCKS | |
Electronic Equipment & Instruments - 1.0% | |
National Instruments Corporation | | | 7,500 | | | $ | 201,450 | |
| | | | | | | | |
Energy Equipment & Services - 0.8% | |
Schlumberger Limited (b) | | | 2,700 | | | | 175,257 | |
| | | | | | | | |
Food & Drug Retailing - 3.3% | |
CVS Caremark Corporation | | | 4,700 | | | | 219,631 | |
Walgreen Company | | | 5,500 | | | | 162,690 | |
Wal-Mart Stores, Inc. | | | 4,300 | | | | 299,796 | |
| | | | | | | | |
| | | | | | | 682,117 | |
| | | | | | | | |
Health Care Equipment & Supplies - 2.4% | |
Covidien plc (b) | | | 4,600 | | | | 246,100 | |
PerkinElmer, Inc. | | | 3,400 | | | | 87,720 | |
Thermo Fisher Scientific, Inc. | | | 3,100 | | | | 160,921 | |
| | | | | | | | |
| | | | | | | 494,741 | |
| | | | | | | | |
Health Care Providers & Services - 3.1% | |
Catalyst Health Solutions, Inc. (a) | | | 4,500 | | | | 420,480 | |
Express Scripts Holding Company (a) | | | 3,800 | | | | 212,154 | |
| | | | | | | | |
| | | | | | | 632,634 | |
| | | | | | | | |
Household Products - 2.9% | |
Colgate-Palmolive Company | | | 2,200 | | | | 229,020 | |
Kimberly-Clark Corporation | | | 2,100 | | | | 175,917 | |
The Procter & Gamble Company | | | 3,100 | | | | 189,875 | |
| | | | | | | | |
| | | | | | | 594,812 | |
| | | | | | | | |
Industrial Conglomerates - 0.6% | |
General Electric Company | | | 5,900 | | | | 122,956 | |
| | | | | | | | |
Insurance - 0.6% | |
Prudential Financial, Inc. | | | 2,600 | | | | 125,918 | |
| | | | | | | | |
Internet Catalog & Retail - 1.4% | |
Amazon.com, Inc. (a) | | | 1,300 | | | | 296,855 | |
| | | | | | | | |
Internet Software & Services - 2.5% | |
Akamai Technologies, Inc. (a) | | | 5,100 | | | | 161,925 | |
Facebook, Inc. - Class A (a) | | | 5,000 | | | | 155,600 | |
Google Inc. - Class A (a) | | | 350 | | | | 203,025 | |
| | | | | | | | |
| | | | | | | 520,550 | |
| | | | | | | | |
IT Consulting & Services - 1.9% | |
Accenture plc - Class A (b) | | | 3,200 | | | | 192,288 | |
Automatic Data Processing, Inc. | | | 3,700 | | | | 205,942 | |
| | | | | | | | |
| | | | | | | 398,230 | |
| | | | | | | | |
Machinery - 2.2% | |
Danaher Corporation | | | 4,900 | | | | 255,192 | |
Pall Corporation | | | 3,800 | | | | 208,278 | |
| | | | | | | | |
| | | | | | | 463,470 | |
| | | | | | | | |
Media - 3.8% | |
CBS Corporation - Class B | | | 6,200 | | | | 203,236 | |
DIRECTTV - Class A (a) | | | 3,300 | | | | 161,106 | |
Time Warner Inc. | | | 5,800 | | | | 223,300 | |
The Walt Disney Company | | | 4,000 | | | | 194,000 | |
| | | | | | | | |
| | | | | | | 781,642 | |
| | | | | | | | |
The accompanying notes are an integral part of these financial statements.
14
LKCM BALANCED FUND
SCHEDULEOF INVESTMENTS, CONTINUED
June 30, 2012 (Unaudited)
| | | | | | | | |
| | |
Shares | | | Value | |
COMMON STOCKS | |
Metals & Mining - 0.6% | |
Commercial Metals Company | | | 9,500 | | | $ | 120,080 | |
| | | | | | | | |
Multiline Retail - 0.7% | |
Kohl’s Corporation | | | 3,100 | | | | 141,019 | |
| | | | | | | | |
Oil & Gas & Consumable Fuels - 8.4% | |
Cabot Oil & Gas Corporation | | | 5,000 | | | | 197,000 | |
Chevron Corporation | | | 2,095 | | | | 221,023 | |
Devon Energy Corporation | | | 2,400 | | | | 139,176 | |
EOG Resources, Inc. | | | 1,900 | | | | 171,209 | |
Exxon Mobil Corporation | | | 3,732 | | | | 319,347 | |
Pioneer Natural Resources Company | | | 2,200 | | | | 194,062 | |
Range Resources Corporation | | | 2,500 | | | | 154,675 | |
SM Energy Company | | | 2,400 | | | | 117,864 | |
The Williams Companies, Inc. | | | 7,700 | | | | 221,914 | |
| | | | | | | | |
| | | | | | | 1,736,270 | |
| | | | | | | | |
Personal Products - 0.7% | |
Avon Products, Inc. | | | 8,500 | | | | 137,785 | |
| | | | | | | | |
Pharmaceuticals - 1.7% | |
Abbott Laboratories | | | 4,100 | | | | 264,327 | |
Teva Pharmaceutical Industries Ltd. - ADR (b) | | | 2,500 | | | | 98,600 | |
| | | | | | | | |
| | | | | | | 362,927 | |
| | | | | | | | |
Software - 2.1% | |
Adobe Systems Incorporated (a) | | | 6,700 | | | | 216,879 | |
Nuance Communications, Inc. (a) | | | 9,000 | | | | 214,380 | |
| | | | | | | | |
| | | | | | | 431,259 | |
| | | | | | | | |
Specialty Retail - 2.1% | |
The Home Depot, Inc. | | | 4,400 | | | | 233,156 | |
O’Reilly Automotive, Inc. (a) | | | 2,300 | | | | 192,671 | |
| | | | | | | | |
| | | | | | | 425,827 | |
| | | | | | | | |
Textiles, Apparel & Luxury Goods - 0.9% | |
VF Corporation | | | 1,400 | | | | 186,830 | |
| | | | | | | | |
Thrifts & Mortgage Finance - 1.1% | |
Capitol Federal Financial Inc. | | | 19,500 | | | | 231,660 | |
| | | | | | | | |
TOTAL COMMON STOCKS
(Cost $10,477,109) | | | | | | | 14,846,433 | |
| | | | | | | | |
| | |
| | | Principal
Amount | | | Value | |
CORPORATE BONDS - 27.8% | |
Air Freight & Logistics - 0.3% | |
United Parcel Service, Inc. | | | | | | | | |
3.875%, 04/01/2014 | | $ | 50,000 | | | | 52,776 | |
| | | | | | | | |
Banks - 2.0% | |
BB&T Corporation | | | | | | | | |
2.05%, 04/28/2014 | | | | | | | | |
Callable, 03/28/2014 | | | 200,000 | | | | 204,180 | |
| | | | | | | | |
| | | | | | | | |
| | | Principal
Amount | | | Value | |
CORPORATE BONDS | |
Banks - 2.0%, Continued | |
Wells Fargo & Company: | | | | | | | | |
3.75%, 10/01/2014 | | $ | 100,000 | | | $ | 105,635 | |
2.625%, 12/15/2016 | | | 100,000 | | | | 102,877 | |
| | | | | | | | |
| | | | | | | 412,692 | |
| | | | | | | | |
Beverages - 0.6% | |
The Coca-Cola Company | | | | | | | | |
5.35%, 11/15/2017 | | | 100,000 | | | | 120,182 | |
| | | | | | | | |
Biotechnology - 1.5% | |
Amgen Inc. | | | | | | | | |
1.875%, 11/15/2014 | | | 100,000 | | | | 101,611 | |
Celgene Corporation | | | | | | | | |
2.45%, 10/15/2015 | | | 200,000 | | | | 205,024 | |
| | | | | | | | |
| | | | | | | 306,635 | |
| | | | | | | | |
Capital Markets - 1.1% | |
The Bank of New York Mellon Corporation | | | | | | | | |
3.10%, 01/15/2015 | | | 175,000 | | | | 184,290 | |
The Goldman Sachs Group, Inc. | | | | | | | | |
5.50%, 11/15/2014 | | | 35,000 | | | | 36,986 | |
| | | | | | | | |
| | | | | | | 221,276 | |
| | | | | | | | |
Chemicals - 3.0% | |
Airgas, Inc.: | | | | | | | | |
2.85%, 10/01/2013 | | | 100,000 | | | | 102,183 | |
3.25%, 10/01/2015 | | | 125,000 | | | | 130,358 | |
E. I. du Pont de Nemours and Company | | | | | | | | |
3.25%, 01/15/2015 | | | 75,000 | | | | 79,824 | |
Eastman Chemical Company | | | | | | | | |
3.00%, 12/15/2015 | | | 200,000 | | | | 207,443 | |
Praxair, Inc. | | | | | | | | |
2.125%, 06/14/2013 | | | 100,000 | | | | 101,369 | |
| | | | | | | | |
| | | | | | | 621,177 | |
| | | | | | | | |
Computers & Peripherals - 1.3% | |
Dell Inc. | | | | | | | | |
1.40%, 09/10/2013 | | | 100,000 | | | | 100,749 | |
Hewlett-Packard Company | | | | | | | | |
3.00%, 09/15/2016 | | | 175,000 | | | | 180,180 | |
| | | | | | | | |
| | | | | | | 280,929 | |
| | | | | | | | |
Consumer Finance - 1.0% | |
American Express Credit Corporation | | | | | | | | |
2.75%, 09/15/2015 | | | 200,000 | | | | 208,858 | |
| | | | | | | | |
Containers & Packaging - 0.4% | |
Ball Corporation | | | | | | | | |
7.125%, 09/01/2016 | | | | | | | | |
Callable 09/01/2013 | | | 75,000 | | | | 82,031 | |
| | | | | | | | |
Diversified Financial Services - 0.8% | |
JPMorgan Chase & Co.: | | | | | | | | |
1.65%, 09/30/2013 | | | 100,000 | | | | 100,659 | |
2.05%, 01/24/2014 | | | 75,000 | | | | 75,849 | |
| | | | | | | | |
| | | | | | | 176,508 | |
| | | | | | | | |
The accompanying notes are an integral part of these financial statements.
15
LKCM BALANCED FUND
SCHEDULEOF INVESTMENTS, CONTINUED
June 30, 2012 (Unaudited)
| | | | | | | | |
| | | Principal
Amount | | | Value | |
CORPORATE BONDS | |
Diversified Telecommunication Services - 1.2% | |
AT&T Inc. | | | | | | | | |
5.10%, 09/15/2014 | | $ | 125,000 | | | $ | 136,550 | |
Verizon Communications Inc. | | | | | | | | |
3.00%, 04/01/2016 | | | 100,000 | | | | 106,387 | |
| | | | | | | | |
| | | | | | | 242,937 | |
| | | | | | | | |
Electric Utilities - 1.2% | |
Duke Energy Corporation | | | | | | | | |
3.95%, 09/15/2014 | | | 185,000 | | | | 196,478 | |
Georgia Power Company | | | | | | | | |
1.30%, 09/15/2013 | | | 50,000 | | | | 50,421 | |
| | | | | | | | |
| | | | | | | 246,899 | |
| | | | | | | | |
Electronic Equipment & Instruments - 0.9% | |
Agilent Technologies, Inc. | | | | | | | | |
2.50%, 07/15/2013 | | | 180,000 | | | | 182,504 | |
| | | | | | | | |
Food & Drug Retailing - 0.8% | |
CVS Caremark Corporation: | | | | | | | | |
3.25%, 05/18/2015 | | | 50,000 | | | | 52,666 | |
5.75%, 06/01/2017 | | | 100,000 | | | | 118,227 | |
| | | | | | | | |
| | | | | | | 170,893 | |
| | | | | | | | |
Food Products - 0.2% | |
McCormick & Company, Incorporated | | | | | | | | |
5.25%, 09/01/2013 | | | 50,000 | | | | 52,452 | |
| | | | | | | | |
Health Care Equipment & Supplies - 0.8% | |
Covidien International Finance S.A. (b) | | | | | | | | |
2.80%, 06/15/2015 | | | 50,000 | | | | 52,073 | |
Thermo Fisher Scientific, Inc. | | | | | | | | |
3.20%, 05/01/2015 | | | 110,000 | | | | 117,037 | |
| | | | | | | | |
| | | | | | | 169,110 | |
| | | | | | | | |
Health Care Providers & Services - 0.5% | |
McKesson Corporation | | | | | | | | |
3.25%, 03/01/2016 | | | 100,000 | | | | 107,436 | |
| | | | | | | | |
Insurance - 1.3% | |
Berkshire Hathaway Inc. | | | | | | | | |
4.85%, 01/15/2015 | | | 100,000 | | | | 110,091 | |
Prudential Financial, Inc. | | | | | | | | |
3.00%, 05/12/2016 | | | 150,000 | | | | 154,429 | |
| | | | | | | | |
| | | | | | | 264,520 | |
| | | | | | | | |
Machinery - 0.6% | |
Danaher Corporation | | | | | | | | |
1.30%, 06/23/2014 | | | 125,000 | | | | 126,361 | |
| | | | | | | | |
Media - 1.4% | | | | | | | | |
DIRECTV Holdings LLC | | | | | | | | |
3.55%, 03/15/2015 | | | 100,000 | | | | 105,368 | |
Time Warner Inc. | | | | | | | | |
3.15%, 07/15/2015 | | | 175,000 | | | | 184,693 | |
| | | | | | | | |
| | | | | | | 290,061 | |
| | | | | | | | |
| | | | | | | | |
| | | Principal
Amount | | | Value | |
CORPORATE BONDS | |
Oil & Gas & Consumable Fuels - 2.6% | |
Apache Corporation | | | | | | | | |
5.625%, 01/15/2017 | | $ | 75,000 | | | $ | 88,688 | |
EOG Resources, Inc. | | | | | | | | |
6.125%, 10/01/2013 | | | 100,000 | | | | 106,459 | |
Noble Drilling Corporation (b) | | | | | | | | |
3.05%, 03/01/2016 | | | 160,000 | | | | 165,742 | |
Noble Energy, Inc. | | | | | | | | |
5.25%, 04/15/2014 | | | 100,000 | | | | 106,023 | |
Occidental Petroleum Corporation | | | | | | | | |
1.45%, 12/13/2013 | | | 75,000 | | | | 75,922 | |
| | | | | | | | |
| | | | | | | 542,834 | |
| | | | | | | | |
Pharmaceuticals - 1.0% | |
Teva Pharmaceutical Industries Ltd. (b): | | | | | | | | |
1.70%, 03/21/2014 | | | 75,000 | | | | 76,093 | |
3.00%, 06/15/2015 | | | 125,000 | | | | 131,642 | |
| | | | | | | | |
| | | | | | | 207,735 | |
| | | | | | | | |
Semiconductor Equipment & Products - 0.5% | |
National Semiconductor Corporation | | | | | | | | |
3.95%, 04/15/2015 | | | 100,000 | | | | 108,408 | |
| | | | | | | | |
Software - 2.8% | |
Adobe Systems Incorporated | | | | | | | | |
3.25%, 02/01/2015 | | | 200,000 | | | | 210,306 | |
Oracle Corporation | | | | | | | | |
3.75%, 07/08/2014 | | | 150,000 | | | | 159,353 | |
Symantec Corporation | | | | | | | | |
2.75%, 09/15/2015 | | | 200,000 | | | | 205,688 | |
| | | | | | | | |
| | | | | | | 575,347 | |
| | | | | | | | |
TOTAL CORPORATE BONDS
(Cost $5,602,957) | | | | | | | 5,770,561 | |
| | | | | | | | |
| | |
| | | Shares | | | | |
SHORT-TERM INVESTMENT - 0.3% | |
Money Market Fund (c) - 0.3% | |
Federated Government Obligations Fund - Institutional Shares, 0.01% | | | 73,230 | | | | 73,230 | |
| | | | | | | | |
TOTAL SHORT-TERM INVESTMENT
(Cost $73,230) | | | | 73,230 | |
| | | | | | | | |
Total Investments - 99.7%
(Cost $16,153,296) | | | | | | | 20,690,224 | |
Other Assets in Excess of Liabilities - 0.3% | | | | 54,424 | |
| | | | | | | | |
TOTAL NET ASSETS - 100.0% | | | | | | $ | 20,744,648 | |
| | | | | | | | |
ADR American Depository Receipt.
| (a) | Non-income producing security. |
| (b) | U.S. Dollar-denominated foreign security. |
| (c) | The rate quoted is the annualized seven-day yield of the fund at period end. |
The Global Industry Classification Standard (GICS®) was developed by and/or is the exclusive property of MSCI, Inc. and Standard & Poor Financial Services LLC (“S&P”). GICS is a service mark of MSCI and S&P and has been licensed for use by U.S. Bancorp Fund Services, LLC.
The accompanying notes are an integral part of these financial statements.
16
LKCM FIXED INCOME FUND
SCHEDULEOF INVESTMENTS
June 30, 2012 (Unaudited)
| | | | | | | | |
| | | Principal
Amount | | | Value | |
CORPORATE BONDS - 92.4% | |
Aerospace & Defense - 2.2% | |
General Dynamics Corporation: | | | | | | | | |
5.25%, 02/01/2014 | | $ | 225,000 | | | $ | 241,380 | |
5.375%, 08/15/2015 | | | 1,375,000 | | | | 1,562,025 | |
Lockheed Martin Corporation: | | | | | | | | |
7.65%, 05/01/2016 | | | 1,250,000 | | | | 1,509,819 | |
3.35%, 09/15/2021 | | | 525,000 | | | | 543,717 | |
Rockwell Collins, Inc. | | | | | | | | |
4.75%, 12/01/2013 | | | 430,000 | | | | 453,123 | |
| | | | | | | | |
| | | | | | | 4,310,064 | |
| | | | | | | | |
Air Freight & Logistics - 0.3% | |
United Parcel Service, Inc. | | | | | | | | |
3.875%, 04/01/2014 | | | 625,000 | | | | 659,699 | |
| | | | | | | | |
Banks - 6.7% | |
Bank of America Corporation: | | | | | | | | |
7.375%, 05/15/2014 | | | 1,000,000 | | | | 1,075,905 | |
5.375%, 06/15/2014 | | | 1,025,000 | | | | 1,069,819 | |
BB&T Capital Trust IV | | | | | | | | |
6.82%, 06/12/2057 | | | | | | | | |
Callable 06/12/2037 | | | 2,000,000 | | | | 2,020,000 | |
BB&T Corporation | | | | | | | | |
3.20%, 03/15/2016 | | | | | | | | |
Callable 02/16/2016 | | | 3,080,000 | | | | 3,262,826 | |
Branch Banking & Trust Company (b): | | | | | | | | |
0.86175%, 09/13/2016 | | | 1,775,000 | | | | 1,679,675 | |
0.7926%, 05/23/2017 | | | 500,000 | | | | 463,358 | |
Wells Fargo & Company: | | | | | | | | |
4.625%, 04/15/2014 | | | 456,000 | | | | 477,273 | |
2.625%, 12/15/2016 | | | 3,000,000 | | | | 3,086,310 | |
| | | | | | | | |
| | | | | | | 13,135,166 | |
| | | | | | | | |
Beverages - 1.3% | |
The Coca-Cola Company: | | | | | | | | |
3.625%, 03/15/2014 | | | 400,000 | | | | 420,568 | |
5.35%, 11/15/2017 | | | 1,500,000 | | | | 1,802,728 | |
PepsiCo, Inc. | | | | | | | | |
7.90%, 11/01/2018 | | | 214,000 | | | | 286,277 | |
| | | | | | | | |
| | | | | | | 2,509,573 | |
| | | | | | | | |
Biotechnology - 4.6% | |
Amgen Inc. | | | | | | | | |
2.50%, 11/15/2016 | | | 1,815,000 | | | | 1,887,734 | |
Celgene Corporation | | | | | | | | |
2.45%, 10/15/2015 | | | 4,494,000 | | | | 4,606,894 | |
Gilead Sciences, Inc. | | | | | | | | |
2.40%, 12/01/2014 | | | 2,500,000 | | | | 2,578,080 | |
| | | | | | | | |
| | | | | | | 9,072,708 | |
| | | | | | | | |
Building Products - 1.6% | |
Masco Corporation: | | | | | | | | |
5.875%, 07/15/2012 | | | 1,645,000 | | | | 1,646,246 | |
7.125%, 03/15/2020 | | | 1,350,000 | | | | 1,491,766 | |
| | | | | | | | |
| | | | | | | 3,138,012 | |
| | | | | | | | |
| | | | | | | | |
| | | Principal
Amount | | | Value | |
CORPORATE BONDS | |
Capital Markets - 2.4% | |
The Bank of New York Mellon Corporation | | | | | | | | |
3.10%, 01/15/2015 | | $ | 738,000 | | | $ | 777,176 | |
The Goldman Sachs Group, Inc. | | | | | | | | |
5.125%, 01/15/2015 | | | 1,000,000 | | | | 1,044,669 | |
Morgan Stanley: | | | | | | | | |
4.50%, 08/30/2015 | | | 1,000,000 | | | | 980,673 | |
5.00%, 08/31/2025 | | | | | | | | |
Callable 08/31/2012 | | | 2,000,000 | | | | 1,990,702 | |
| | | | | | | | |
| | | | | | | 4,793,220 | |
| | | | | | | | |
Chemicals - 5.4% | |
Airgas, Inc.: | | | | | | | | |
2.85%, 10/01/2013 | | | 1,160,000 | | | | 1,185,319 | |
3.25%, 10/01/2015 | | | 2,794,000 | | | | 2,913,771 | |
E. I. du Pont de Nemours and Company | | | | | | | | |
3.25%, 01/15/2015 | | | 1,775,000 | | | | 1,889,177 | |
Eastman Chemical Company | | | | | | | | |
3.00%, 12/15/2015 | | | 2,625,000 | | | | 2,722,684 | |
The Lubrizol Corporation | | | | | | | | |
5.50%, 10/01/2014 | | | 1,579,000 | | | | 1,746,646 | |
Praxair, Inc. | | | | | | | | |
5.25%, 11/15/2014 | | | 200,000 | | | | 220,570 | |
| | | | | | | | |
| | | | | | | 10,678,167 | |
| | | | | | | | |
Commercial Services & Supplies - 0.6% | |
Republic Services, Inc. | | | | | | | | |
5.50%, 09/15/2019 | | | 1,000,000 | | | | 1,158,896 | |
| | | | | | | | |
Communications Equipment - 2.3% | |
Cisco Systems, Inc.: | | | | | | | | |
2.90%, 11/17/2014 | | | 340,000 | | | | 357,764 | |
5.50%, 02/22/2016 | | | 1,000,000 | | | | 1,161,361 | |
4.95%, 02/15/2019 | | | 700,000 | | | | 826,557 | |
Harris Corporation: | | | | | | | | |
5.00%, 10/01/2015 | | | 1,088,000 | | | | 1,185,227 | |
6.375%, 06/15/2019 | | | 900,000 | | | | 1,060,990 | |
| | | | | | | | |
| | | | | | | 4,591,899 | |
| | | | | | | | |
Computers & Peripherals - 3.8% | |
Dell Inc. | | | | | | | | |
5.625%, 04/15/2014 | | | 750,000 | | | | 811,777 | |
Hewlett-Packard Company: | | | | | | | | |
1.55%, 05/30/2014 | | | 1,000,000 | | | | 1,005,789 | |
2.20%, 12/01/2015 | | | 1,000,000 | | | | 1,003,950 | |
3.00%, 09/15/2016 | | | 2,825,000 | | | | 2,908,612 | |
International Business
Machines Corporation | | | | | | | | |
5.70%, 09/14/2017 | | | 1,500,000 | | | | 1,805,508 | |
| | | | | | | | |
| | | | | | | 7,535,636 | |
| | | | | | | | |
Consumer Finance - 1.3% | |
American Express Credit Corporation | | | | | | | | |
2.75%, 09/15/2015 | | | 2,485,000 | | | | 2,595,056 | |
| | | | | | | | |
The accompanying notes are an integral part of these financial statements.
17
LKCM FIXED INCOME FUND
SCHEDULEOF INVESTMENTS, CONTINUED
June 30, 2012 (Unaudited)
| | | | | | | | |
| | | Principal
Amount | | | Value | |
CORPORATE BONDS | |
Containers & Packaging - 2.9% | |
Ball Corporation: | | | | | | | | |
7.125%, 09/01/2016 | | | | | | | | |
Callable 09/01/2013 | | $ | 1,825,000 | | | $ | 1,996,094 | |
5.75%, 05/15/2021 | | | | | | | | |
Callable 11/15/2015 | | | 2,000,000 | | | | 2,160,000 | |
Packaging Corp. of America | | | | | | | | |
5.75%, 08/01/2013 | | | 1,500,000 | | | | 1,582,582 | |
| | | | | | | | |
| | | | | | | 5,738,676 | |
| | | | | | | | |
Diversified Financial Services - 3.6% | |
JPMorgan Chase & Co.: | | | | | | | | |
3.45%, 03/01/2016 | | | 3,525,000 | | | | 3,656,729 | |
4.25%, 10/15/2020 | | | 3,325,000 | | | | 3,499,061 | |
| | | | | | | | |
| | | | | | | 7,155,790 | |
| | | | | | | | |
Diversified Telecommunication Services - 5.3% | |
AT&T Inc. | | | | | | | | |
5.10%, 09/15/2014 | | | 1,750,000 | | | | 1,911,698 | |
CenturyLink, Inc.: | | | | | | | | |
5.15%, 06/15/2017 | | | 2,000,000 | | | | 2,048,454 | |
6.15%, 09/15/2019 | | | 1,402,000 | | | | 1,448,266 | |
6.45%, 06/15/2021 | | | 2,000,000 | | | | 2,084,684 | |
Verizon Communications Inc.: | | | | | | | | |
5.25%, 04/15/2013 | | | 275,000 | | | | 284,984 | |
5.55%, 02/15/2016 | | | 1,000,000 | | | | 1,148,825 | |
3.00%, 04/01/2016 | | | 490,000 | | | | 521,296 | |
5.50%, 02/15/2018 | | | 875,000 | | | | 1,036,970 | |
| | | | | | | | |
| | | | | | | 10,485,177 | |
| | | | | | | | |
Electric Utilities - 0.6% | |
Southern Power Co. | | | | | | | | |
4.875%, 07/15/2015 | | | 1,050,000 | | | | 1,150,289 | |
| | | | | | | | |
Electrical Equipment & Instruments - 0.2% | |
Emerson Electric Co. | | | | | | | | |
4.50%, 05/01/2013 | | | 425,000 | | | | 438,609 | |
| | | | | | | | |
Electronic Equipment & Instruments - 0.7% | |
Agilent Technologies, Inc. | | | | | | | | |
2.50%, 07/15/2013 | | | 1,400,000 | | | | 1,419,474 | |
| | | | | | | | |
Energy Equipment & Services - 0.9% | |
Weatherford International, Inc. | | | | | | | | |
6.35%, 06/15/2017 | | | 1,550,000 | | | | 1,791,859 | |
| | | | | | | | |
Food & Drug Retailing - 3.4% | |
CVS Caremark Corporation: | | | | | | | | |
4.875%, 09/15/2014 | | | 330,000 | | | | 357,149 | |
3.25%, 05/18/2015 | | | 1,000,000 | | | | 1,053,319 | |
5.75%, 06/01/2017 | | | 2,750,000 | | | | 3,251,256 | |
Walgreen Company | | | | | | | | |
4.875%, 08/01/2013 | | | 1,955,000 | | | | 2,042,221 | |
| | | | | | | | |
| | | | | | | 6,703,945 | |
| | | | | | | | |
Food Products - 1.2% | |
Kraft Foods, Inc. | | | | | | | | |
2.625%, 05/08/2013 | | | 750,000 | | | | 761,257 | |
| | | | | | | | |
| | | Principal
Amount | | | Value | |
CORPORATE BONDS | |
Food Products - 1.2%, Continued | |
McCormick & Company, Incorporated | | | | | | | | |
5.25%, 09/01/2013 | | $ | 1,450,000 | | | $ | 1,521,105 | |
| | | | | | | | |
| | | | | | | 2,282,362 | |
| | | | | | | | |
Health Care Equipment & Supplies - 1.7% | |
DENTSPLY International Inc. | | | | | | | | |
2.75%, 08/15/2016 | | | 1,446,000 | | | | 1,471,594 | |
Medtronic, Inc. | | | | | | | | |
4.50%, 03/15/2014 | | | 900,000 | | | | 957,642 | |
Thermo Fisher Scientific, Inc. | | | | | | | | |
3.25%, 11/20/2014 | | | 900,000 | | | | 948,906 | |
| | | | | | | | |
| | | | | | | 3,378,142 | |
| | | | | | | | |
Health Care Providers & Services - 1.9% | |
Express Scripts Holding Company: | | | | | | | | |
6.25%, 06/15/2014 | | | 1,000,000 | | | | 1,093,898 | |
3.125%, 05/15/2016 | | | 225,000 | | | | 234,476 | |
McKesson Corporation | | | | | | | | |
3.25%, 03/01/2016 | | | 2,275,000 | | | | 2,444,167 | |
| | | | | | | | |
| | | | | | | 3,772,541 | |
| | | | | | | | |
Hotels, Restaurants & Leisure - 0.6% | |
McDonald’s Corporation | | | | | | | | |
5.35%, 03/01/2018 | | | 1,000,000 | | | | 1,202,217 | |
| | | | | | | | |
Household Durables - 1.3% | |
Jarden Corporation: | | | | | | | | |
8.00%, 05/01/2016 | | | | | | | | |
Callable 05/01/2013 | | | 1,000,000 | | | | 1,095,000 | |
7.50%, 01/15/2020 | | | | | | | | |
Callable 01/15/2015 | | | 1,340,000 | | | | 1,470,650 | |
| | | | | | | | |
| | | | | | | 2,565,650 | |
| | | | | | | | |
Household Products - 0.6% | |
The Procter & Gamble Company | | | | | | | | |
8.00%, 09/01/2024 | | | | | | | | |
Putable 09/01/2014 | | | 775,000 | | | | 1,160,641 | |
| | | | | | | | |
Insurance - 1.1% | |
Berkshire Hathaway Inc. | | | | | | | | |
4.85%, 01/15/2015 | | | 1,225,000 | | | | 1,348,610 | |
Prudential Financial, Inc. | | | | | | | | |
3.00%, 05/12/2016 | | | 775,000 | | | | 797,886 | |
| | | | | | | | |
| | | | | | | 2,146,496 | |
| | | | | | | | |
IT Consulting & Services - 0.6% | |
Western Union Company | | | | | | | | |
5.93%, 10/01/2016 | | | 1,000,000 | | | | 1,161,312 | |
| | | | | | | | |
Media - 3.3% | |
DIRECTV Holdings LLC | | | | | | | | |
3.55%, 03/15/2015 | | | 1,265,000 | | | | 1,332,901 | |
Time Warner Inc. | | | | | | | | |
3.15%, 07/15/2015 | | | 3,175,000 | | | | 3,350,867 | |
The Walt Disney Company | | | | | | | | |
5.625%, 09/15/2016 | | | 1,500,000 | | | | 1,765,575 | |
| | | | | | | | |
| | | | | | | 6,449,343 | |
| | | | | | | | |
The accompanying notes are an integral part of these financial statements.
18
LKCM FIXED INCOME FUND
SCHEDULEOF INVESTMENTS, CONTINUED
June 30, 2012 (Unaudited)
| | | | | | | | |
| | | Principal
Amount | | | Value | |
CORPORATE BONDS | |
Metals & Mining - 0.3% | |
Alcoa Inc. | | | | | | | | |
5.55%, 02/01/2017 | | $ | 500,000 | | | $ | 546,349 | |
| | | | | | | | |
Multiline Retail - 2.6% | |
Family Dollar Stores, Inc. | | | | | | | | |
5.00%, 02/01/2021 | | | 4,500,000 | | | | 4,842,333 | |
Kohl’s Corporation | | | | | | | | |
6.25%, 12/15/2017 | | | 282,000 | | | | 338,756 | |
| | | | | | | | |
| | | | | | | 5,181,089 | |
| | | | | | | | |
Oil & Gas & Consumable Fuels - 16.8% | |
Anadarko Petroleum Corporation: | | | | | | | | |
5.95%, 09/15/2016 | | | 2,000,000 | | | | 2,271,688 | |
6.375%, 09/15/2017 | | | 2,000,000 | | | | 2,325,882 | |
Devon Energy Corporation | | | | | | | | |
2.40%, 07/15/2016 | | | | | | | | |
Callable 06/15/2016 | | | 1,830,000 | | | | 1,883,204 | |
Enterprise Products Operating LLC: | | | | | | | | |
3.20%, 02/01/2016 | | | 2,229,000 | | | | 2,336,794 | |
4.05%, 02/15/2022 | | | 2,000,000 | | | | 2,125,168 | |
EOG Resources, Inc.: | | | | | | | | |
6.125%, 10/01/2013 | | | 1,500,000 | | | | 1,596,878 | |
2.95%, 06/01/2015 | | | 1,200,000 | | | | 1,260,520 | |
Kinder Morgan Energy Partners, L.P. | | | | | | | | |
4.15%, 03/01/2022 | | | 2,000,000 | | | | 2,060,134 | |
Linn Energy LLC / Linn Energy
Finance Corporation (c) | | | | | | | | |
6.25%, 11/01/2019 | | | | | | | | |
Callable 11/01/2015
(Acquired 05/11/2012,
Cost $1,985,000) | | | 2,000,000 | | | | 1,962,500 | |
Noble Energy, Inc.: | | | | | | | | |
5.25%, 04/15/2014 | | | 1,500,000 | | | | 1,590,346 | |
4.15%, 12/15/2021 | | | | | | | | |
Callable 09/15/2021 | | | 1,000,000 | | | | 1,053,557 | |
Noble Holding International Ltd. (a) | | | | | |
3.45%, 08/01/2015 | | | 3,665,000 | | | | 3,860,784 | |
Peabody Energy Corporation | | | | | | | | |
6.50%, 09/15/2020 | | | 4,000,000 | | | | 4,070,000 | |
Range Resources Corporation: | | | | | | | | |
8.00%, 05/15/2019 | | | | | | | | |
Callable 05/15/2014 | | | 500,000 | | | | 548,750 | |
5.00%, 08/15/2022 | | | | | | | | |
Callable 02/15/2017 | | | 4,100,000 | | | | 4,053,875 | |
| | | | | | | | |
| | | | | | | 33,000,080 | |
| | | | | | | | |
Pharmaceuticals - 2.1% | |
Teva Pharmaceutical Industries Ltd. (a): | | | | | |
3.00%, 06/15/2015 | | | 2,030,000 | | | | 2,137,868 | |
5.55%, 02/01/2016 | | | 1,860,000 | | | | 2,111,652 | |
| | | | | | | | |
| | | | | | | 4,249,520 | |
| | | | | | | | |
Road & Rail - 0.5% | |
Burlington Northern Santa Fe Corporation | | | | | |
5.65%, 05/01/2017 | | | 185,000 | | | | 217,135 | |
| | | | | | | | |
| | | Principal
Amount | | | Value | |
CORPORATE BONDS | |
Road & Rail - 0.5%, Continued | |
Norfolk Southern Corporation | | | | | | | | |
5.257%, 09/17/2014 | | $ | 750,000 | | | $ | 819,962 | |
| | | | | | | | |
| | | | | | | 1,037,097 | |
| | | | | | | | |
Semiconductor Equipment & Products - 2.7% | |
Analog Devices, Inc. | | | | | | | | |
3.00%, 04/15/2016 | | | 1,050,000 | | | | 1,118,948 | |
Applied Materials, Inc. | | | | | | | | |
2.65%, 06/15/2016 | | | 1,717,000 | | | | 1,799,345 | |
National Semiconductor Corporation | | | | | | | | |
3.95%, 04/15/2015 | | | 2,275,000 | | | | 2,466,280 | |
| | | | | | | | |
| | | | | | | 5,384,573 | |
| | | | | | | | |
Software - 3.4% | |
Adobe Systems Incorporated | | | | | | | | |
3.25%, 02/01/2015 | | | 2,175,000 | | | | 2,287,082 | |
Microsoft Corporation | | | | | | | | |
2.95%, 06/01/2014 | | | 1,910,000 | | | | 1,997,478 | |
Symantec Corporation | | | | | | | | |
2.75%, 09/15/2015 | | | 2,300,000 | | | | 2,365,405 | |
| | | | | | | | |
| | | | | | | 6,649,965 | |
| | | | | | | | |
Specialty Retail - 1.6% | |
Lowe’s Companies, Inc. | | | | | | | | |
5.00%, 10/15/2015 | | | 525,000 | | | | 591,111 | |
O’Reilly Automotive, Inc. | | | | | | | | |
4.875%, 01/14/2021 | | | | | | | | |
Callable 10/14/2020 | | | 1,000,000 | | | | 1,076,852 | |
The Sherwin-Williams Company | | | | | | | | |
3.125%, 12/15/2014 | | | 1,450,000 | | | | 1,522,742 | |
| | | | | | | | |
| | | | | | | 3,190,705 | |
| | | | | | | | |
TOTAL CORPORATE BONDS
(Cost $172,878,744) | | | | 182,419,997 | |
| | | | | | | | |
| | |
| | | Shares | | | | |
PREFERRED STOCKS - 2.3% | |
Capital Markets - 1.3% | |
The Goldman Sachs Group, Inc. | | | | | | | | |
Callable 9/10/2012 | | | 40,000 | | | | 714,000 | |
Merrill Lynch Preferred Capital Trust III | | | | | |
Callable 9/10/2012 | | | 75,000 | | | | 1,864,500 | |
| | | | | | | | |
| | | | | | | 2,578,500 | |
| | | | | | | | |
Diversified Financial Services - 1.0% | |
JPMorgan Chase Capital XIV | | | | | | | | |
Callable 9/10/2012 | | | 75,000 | | | | 1,910,250 | |
| | | | | | | | |
TOTAL PREFERRED STOCKS
(Cost $4,701,733) | | | | 4,488,750 | |
| | | | | | | | |
The accompanying notes are an integral part of these financial statements.
19
LKCM FIXED INCOME FUND
SCHEDULEOF INVESTMENTS, CONTINUED
June 30, 2012 (Unaudited)
| | | | | | | | |
| | | Principal
Amount | | | Value | |
U.S. GOVERNMENT & AGENCY ISSUES - 2.6% | |
Fannie Mae - 0.6% | |
5.00%, 03/15/2016 | | $ | 1,000,000 | | | $ | 1,157,244 | |
| | | | | | | | |
Federal Home Loan Bank - 0.9% | |
5.50%, 08/13/2014 | | | 500,000 | | | | 554,582 | |
4.875%, 05/17/2017 | | | 1,000,000 | | | | 1,195,090 | |
| | | | | | | | |
| | | | | | | 1,749,672 | |
| | | | | | | | |
Freddie Mac - 0.3% | |
5.125%, 11/17/2017 | | | 500,000 | | | | 606,345 | |
| | | | | | | | |
U.S. Treasury Notes - 0.8% | |
4.25%, 11/15/2014 | | | 500,000 | | | | 545,781 | |
4.25%, 08/15/2015 | | | 500,000 | | | | 558,672 | |
4.50%, 02/15/2016 | | | 500,000 | | | | 571,211 | |
| | | | | | | | |
| | | | | | | 1,675,664 | |
| | | | | | | | |
TOTAL U.S. GOVERNMENT & AGENCY ISSUES
(Cost $4,523,440) | | | | 5,188,925 | |
| | | | | | | | |
| | | | | | | | |
| | | Principal
Amount | | | Value | |
SHORT-TERM INVESTMENTS - 1.5% | |
Corporate Bonds - 0.9% | |
Prudential Financial, Inc. | | | | | | | | |
2.75%, 01/14/2013 | | $ | 1,750,000 | | | $ | 1,767,496 | |
| | | | | | | | |
| | |
| | | Shares | | | | |
Money Market Fund (d) - 0.6% | |
Federated Government Obligations Fund - Institutional Shares, 0.01% | | | 1,157,725 | | | | 1,157,725 | |
| | | | | | | | |
TOTAL SHORT-TERM INVESTMENTS
(Cost $2,925,605) | | | | 2,925,221 | |
| | | | | | | | |
Total Investments - 98.8%
(Cost $185,029,522) | | | | | | | 195,022,893 | |
Other Assets in Excess of Liabilities - 1.2% | | | | 2,290,408 | |
| | | | | | | | |
TOTAL NET ASSETS - 100.0% | | | | | | $ | 197,313,301 | |
| | | | | | | | |
| (a) | U.S. Dollar-denominated foreign security. |
| (c) | Rule 144A security. Resale to the public may require registration or may extend only to qualified institutional buyers. The fair market value of the security was $1,962,500, representing 0.99% of the Fund’s total net assets. |
| (d) | The rate quoted is the annualized seven-day yield of the fund at period end. |
The Global Industry Classification Standard (GICS®) was developed by and/or is the exclusive property of MSCI, Inc. and Standard & Poor Financial Services LLC (“S&P”). GICS is a service mark of MSCI and S&P and has been licensed for use by U.S. Bancorp Fund Services, LLC.
The accompanying notes are an integral part of these financial statements.
20
STATEMENTOF ASSETSAND LIABILITIES
June 30, 2012 (Unaudited)
| | | | | | | | | | | | | | | | | | | | |
| | | LKCM | | | LKCM | | | LKCM | | | LKCM | | | LKCM | |
| | | Small Cap | | | Small-Mid Cap | | | Equity | | | Balanced | | | Fixed | |
| | | Equity Fund | | | Equity Fund | | | Fund | | | Fund | | | Income Fund | |
Assets: | | | | | | | | | | | | | | | | | | | | |
Investments, at value * | | $ | 826,773,089 | | | $ | 217,062,203 | | | $ | 126,528,410 | | | $ | 20,690,224 | | | $ | 195,022,893 | |
Dividends and interest receivable | | | 426,115 | | | | 96,567 | | | | 81,152 | | | | 58,556 | | | | 2,092,341 | |
Receivable for fund shares sold | | | 1,216,528 | | | | 1,870,264 | | | | 171,406 | | | | 23,284 | | | | 428,980 | |
Other assets | | | 147,312 | | | | 25,608 | | | | 43,196 | | | | 8,603 | | | | 44,514 | |
| | | | | | | | | | | | | | | | | | | | |
Total assets | | | 828,563,044 | | | | 219,054,642 | | | | 126,824,164 | | | | 20,780,667 | | | | 197,588,728 | |
| | | | | | | | | | | | | | | | | | | | |
Liabilities: | | | | | | | | | | | | | | | | | | | | |
Payable for investment advisory fees | | | 1,628,389 | | | | 163,783 | | | | 165,313 | | | | 17,709 | | | | 213,608 | |
Payable for investments purchased | | | — | | | | 691,130 | | | | — | | | | — | | | | — | |
Payable for fund shares redeemed | | | 199,522 | | | | 30,682 | | | | 193 | | | | — | | | | — | |
Payable for administrative expense | | | 112,022 | | | | 18,407 | | | | 17,916 | | | | 3,249 | | | | 25,173 | |
Payable for accounting and transfer agent and expenses . | | | 50,697 | | | | 12,273 | | | | 12,051 | | | | 7,185 | | | | 15,615 | |
Payable for distribution expense | | | 26,544 | | | | — | | | | — | | | | — | |
Accrued expenses and other liabilities | | | 85,425 | | | | 14,972 | | | | 15,257 | | | | 7,876 | | | | 21,031 | |
| | | | | | | | | | | | | | | | | | | | |
Total liabilities | | | 2,102,599 | | | | 931,247 | | | | 210,730 | | | | 36,019 | | | | 275,427 | |
| | | | | | | | | | | | | | | | | | | | |
Net assets | | $ | 826,460,445 | | | $ | 218,123,395 | | | $ | 126,613,434 | | | $ | 20,744,648 | | | $ | 197,313,301 | |
| | | | | | | | | | | | | | | | | | | | |
Net assets consist of: | | | | | | | | | | | | | | | | | | | | |
Paid in capital | | $ | 618,880,191 | | | $ | 216,059,120 | | | $ | 102,599,851 | | | $ | 16,527,952 | | | $ | 186,292,495 | |
Undistributed net investment income | | | 522,845 | | | | — | | | | 449,977 | | | | 1,042 | | | | 49,641 | |
Accumulated net realized gain (loss) on securities | | | 55,110,838 | | | | (1,990,540 | ) | | | 535,528 | | | | (321,274 | ) | | | 977,794 | |
Net unrealized appreciation on investments | | | 151,946,571 | | | | 4,054,815 | | | | 23,028,078 | | | | 4,536,928 | | | | 9,993,371 | |
| | | | | | | | | | | | | | | | | | | | |
Net assets | | $ | 826,460,445 | | | $ | 218,123,395 | | | $ | 126,613,434 | | | $ | 20,744,648 | | | $ | 197,313,301 | |
| | | | | | | | | | | | | | | | | | | | |
INSTITUTIONAL CLASS** | | | | | | | | | | | | | | | | | | | | |
Net assets | | $ | 779,426,781 | | | $ | 218,123,395 | | | $ | 126,613,434 | | | $ | 20,744,648 | | | $ | 197,313,301 | |
Shares of beneficial interest outstanding (unlimited shares of no par value authorized) | | | 32,968,933 | | | | 23,306,501 | | | | 7,736,687 | | | | 1,339,519 | | | | 17,650,860 | |
Net asset value per share
(offering and redemption price) | | $ | 23.64 | | | $ | 9.36 | | | $ | 16.37 | | | $ | 15.49 | | | $ | 11.18 | |
| | | | | | | | | | | | | | | | | | | | |
ADVISER CLASS | | | | | | | | | | | | | | | | | | | | |
Net assets | | $ | 47,033,664 | | | | | | | | | | | | | | | | | |
Shares of beneficial interest outstanding (unlimited shares of no par value authorized) | | | 2,043,723 | | | | | | | | | | | | | | | | | |
Net asset value per share
(offering and redemption price) | | $ | 23.01 | | | | | | | | | | | | | | | | | |
| | | | | | | | | | | | | | | | | | | | |
* Cost of Investments | | $ | 674,826,518 | | | $ | 213,007,388 | | | $ | 103,500,332 | | | $ | 16,153,296 | | | $ | 185,029,522 | |
| | | | | | | | | | | | | | | | | | | | |
| ** | Currently, only the Small Cap Equity, Small-Mid Cap Equity and Equity Funds offer a second class. |
The accompanying notes are an integral part of these financial statements.
21
STATEMENTOF OPERATIONS
For the Six Months Ended June 30, 2012 (Unaudited)
| | | | | | | | | | | | | | | | | | | | |
| | | LKCM | | | LKCM | | | LKCM | | | LKCM | | | LKCM | |
| | | Small Cap | | | Small-Mid Cap | | | Equity | | | Balanced | | | Fixed | |
| | | Equity Fund | | | Equity Fund | | | Fund | | | Fund | | | Income Fund | |
Investment Income: | | | | | | | | | | | | | | | | | | | | |
Dividends * | | $ | 4,802,281 | | | $ | 316,124 | | | $ | 927,041 | | | $ | 124,616 | | | $ | 142,708 | |
Interest | | | 1,376 | | | | 315 | | | | 315 | | | | 68,856 | | | | 3,465,298 | |
| | | | | | | | | | | | | | | | | | | | |
Total income | | | 4,803,657 | | | | 316,439 | | | | 927,356 | | | | 193,472 | | | | 3,608,006 | |
| | | | | | | | | | | | | | | | | | | | |
Expenses: | | | | | | | | | | | | | | | | | | | | |
Investment advisory fees | | | 3,352,641 | | | | 238,197 | | | | 418,259 | | | | 65,024 | | | | 470,154 | |
Distribution expense - Adviser Class (Note B) | | | 59,593 | | | | — | | | | — | | | | — | | | | — | |
Administrative fees | | | 356,290 | | | | 31,849 | | | | 53,717 | | | | 10,260 | | | | 74,994 | |
Accounting and transfer agent fees and expenses | | | 172,102 | | | | 34,593 | | | | 38,643 | | | | 21,290 | | | | 48,015 | |
Professional fees | | | 77,994 | | | | 4,796 | | | | 11,262 | | | | 3,640 | | | | 17,450 | |
Custody fees and expenses | | | 56,093 | | | | 6,917 | | | | 6,900 | | | | 2,344 | | | | 10,287 | |
Trustees’ fees | | | 57,283 | | | | 1,381 | | | | 6,472 | | | | 1,374 | | | | 12,239 | |
Federal and state registration | | | 47,057 | | | | 35,887 | | | | 24,995 | | | | 5,742 | | | | 18,931 | |
Reports to shareholders | | | 19,435 | | | | 1,001 | | | | 1,961 | | | | 596 | | | | 2,143 | |
Other | | | 82,324 | | | | 3,286 | | | | 10,095 | | | | 1,888 | | | | 16,647 | |
| | | | | | | | | | | | | | | | | | | | |
Total expenses | | | 4,280,812 | | | | 357,907 | | | | 572,304 | | | | 112,158 | | | | 670,860 | |
Less, expense waiver and/or reimbursement (Note B) | | | — | | | | (40,311 | ) | | | (94,294 | ) | | | (32,126 | ) | | | (59,660 | ) |
| | | | | | | | | | | | | | | | | | | | |
Net expenses | | | 4,280,812 | | | | 317,596 | | | | 478,010 | | | | 80,032 | | | | 611,200 | |
| | | | | | | | | | | | | | | | | | | | |
Net investment income (loss) | | | 522,845 | | | | (1,157 | ) | | | 449,346 | | | | 113,440 | | | | 2,996,806 | |
| | | | | | | | | | | | | | | | | | | | |
Realized and Unrealized Gain (Loss) on Investments: | | | | | | | | | | | | | | | | | | | | |
Net realized gain (loss) on investments | | | 57,105,218 | | | | (1,290,670 | ) | | | 440,592 | | | | 158,323 | | | | 864,335 | |
Net change in unrealized appreciation/depreciation on investments | | | (14,463,239 | ) | | | 3,007,786 | | | | 5,798,651 | | | | 1,047,584 | | | | 1,313,339 | |
| | | | | | | | | | | | | | | | | | | | |
Net Realized and Unrealized Gain on Investments | | | 42,641,979 | | | | 1,717,116 | | | | 6,239,243 | | | | 1,205,907 | | | | 2,177,674 | |
| | | | | | | | | | | | | | | | | | | | |
Net Increase in Net Assets Resulting from Operations | | $ | 43,164,824 | | | $ | 1,715,959 | | | $ | 6,688,589 | | | $ | 1,319,347 | | | $ | 5,174,480 | |
| | | | | | | | | | | | | | | | | | | | |
* Net of foreign taxes withheld | | $ | — | | | $ | 453 | | | $ | — | | | $ | 328 | | | $ | — | |
| | | | | | | | | | | | | | | | | | | | |
The accompanying notes are an integral part of these financial statements.
22
STATEMENTSOF CHANGESIN NET ASSETS
| | | | | | | | | | | | | | | | |
| | | LKCM | | | LKCM | |
| | | Small Cap | | | Small-Mid Cap | |
| | | Equity Fund | | | Equity Fund | |
| | | | | | | | | | | | May 2, 2011(1) | |
| | | Six Months Ended | | | Year Ended | | | Six Months Ended | | | through | |
| | | June 30, 2012 | | | December 31, | | | June 30, 2012 | | | December 31, | |
| | | (Unaudited) | | | 2011 | | | (Unaudited) | | | 2011 | |
Operations: | | | | | | | | | | | | | | | | |
Net investment income (loss) | | $ | 522,845 | | | $ | (2,783,986 | ) | | $ | (1,157 | ) | | $ | (37,460 | ) |
Net realized gain (loss) on investments | | | 57,105,218 | | | | 69,601,456 | | | | (1,290,670 | ) | | | (699,870 | ) |
Net change in unrealized appreciation/depreciation on investments | | | (14,463,239 | ) | | | (35,091,526 | ) | | | 3,007,786 | | | | 1,047,029 | |
| | | | | | | | | | | | | | | | |
Net increase in net assets resulting from operations | | | 43,164,824 | | | | 31,725,944 | | | | 1,715,959 | | | | 309,699 | |
| | | | | | | | | | | | | | | | |
Net increase (decrease) in net assets from Fund share transactions (Note C) | | | (45,107,896 | ) | | | 62,042,933 | | | | 192,652,930 | | | | 23,444,807 | |
| | | | | | | | | | | | | | | | |
Total increase (decrease) in net assets | | | (1,943,072 | ) | | | 93,768,877 | | | | 194,368,889 | | | | 23,754,506 | |
Net Assets: | | | | | | | | | | | | | | | | |
Beginning of period | | | 828,403,517 | | | | 734,634,640 | | | | 23,754,506 | | | | — | |
| | | | | | | | | | | | | | | | |
End of period * | | $ | 826,460,445 | | | $ | 828,403,517 | | | $ | 218,123,395 | | | $ | 23,754,506 | |
| | | | | | | | | | | | | | | | |
* Including undistributed net investment income of | | $ | 522,845 | | | $ | — | | | $ | — | | | $ | — | |
| | | | | | | | | | | | | | | | |
| (1) | Commencement of operations. |
| | | | | | | | | | | | | | | | |
| | | LKCM | | | LKCM | |
| | | Equity Fund | | | Balanced Fund | |
| | | Six Months Ended | | | Year Ended | | | Six Months Ended | | | Year Ended | |
| | | June 30, 2012 | | | December 31, | | | June 30, 2012 | | | December 31, | |
| | | (Unaudited) | | | 2011 | | | (Unaudited) | | | 2011 | |
Operations: | | | | | | | | | | | | | | | | |
Net investment income | | $ | 449,346 | | | $ | 636,785 | | | $ | 113,440 | | | $ | 223,658 | |
Net realized gain (loss) on investments | | | 440,592 | | | | 847,915 | | | | 158,323 | | | | (4,518 | ) |
Net change in unrealized appreciation/depreciation on investments | | | 5,798,651 | | | | 1,370,417 | | | | 1,047,584 | | | | 271,728 | |
| | | | | | | | | | | | | | | | |
Net increase in net assets resulting from operations | | | 6,688,589 | | | | 2,855,117 | | | | 1,319,347 | | | | 490,868 | |
| | | | | | | | | | | | | | | | |
Dividends and Distributions to Shareholders: | | | | | | | | | | | | | | | | |
Net investment income | | | — | | | | (636,154 | ) | | | (112,505 | ) | | | (223,616 | ) |
Net realized gain on investments | | | — | | | | (1,598,383 | ) | | | — | | | | — | |
| | | | | | | | | | | | | | | | |
| | | — | | | | (2,234,537 | ) | | | (112,505 | ) | | | (223,616 | ) |
| | | | | | | | | | | | | | | | |
Net increase in net assets from Fund share transactions (Note C) | | | 17,377,244 | | | | 29,557,371 | | | | 978,056 | | | | 1,806,145 | |
| | | | | | | | | | | | | | | | |
Total increase in net assets | | | 24,065,833 | | | | 30,177,951 | | | | 2,184,898 | | | | 2,073,397 | |
Net Assets: | | | | | | | | | | | | | | | | |
Beginning of period | | | 102,547,601 | | | | 72,369,650 | | | | 18,559,750 | | | | 16,486,353 | |
| | | | | | | | | | | | | | | | |
End of period * | | $ | 126,613,434 | | | $ | 102,547,601 | | | $ | 20,744,648 | | | $ | 18,559,750 | |
| | | | | | | | | | | | | | | | |
* Including undistributed net investment income of | | $ | 449,977 | | | $ | 631 | | | $ | 1,042 | | | $ | 107 | |
| | | | | | | | | | | | | | | | |
The accompanying notes are an integral part of these financial statements.
23
STATEMENTSOF CHANGESIN NET ASSETS
| | | | | | | | |
| | | LKCM | |
| | | Fixed Income Fund | |
| | | Six Months Ended | | | Year Ended | |
| | | June 30, 2012 | | | December 31, | |
| | | (Unaudited) | | | 2011 | |
Operations: | | | | | | | | |
Net investment income | | $ | 2,996,806 | | | $ | 5,703,042 | |
Net realized gain on investments | | | 864,335 | | | | 917,718 | |
Net change in unrealized appreciation/depreciation on investments | | | 1,313,339 | | | | 230,560 | �� |
| | | | | | | | |
Net increase in net assets resulting from operations | | | 5,174,480 | | | | 6,851,320 | |
| | | | | | | | |
Dividends and Distributions to Shareholders: | | | | | | | | |
Net investment income | | | (2,947,165 | ) | | | (5,721,525 | ) |
Net realized gain on investments | | | — | | | | (1,206,565 | ) |
| | | | | | | | |
| | | (2,947,165 | ) | | | (6,928,090 | ) |
| | | | | | | | |
Net increase in net assets from Fund share transactions (Note C) | | | 16,970,142 | | | | 15,840,038 | |
| | | | | | | | |
Total increase in net assets | | | 19,197,457 | | | | 15,763,268 | |
Net Assets: | | | | | | | | |
Beginning of period | | | 178,115,844 | | | | 162,352,576 | |
| | | | | | | | |
End of period * | | $ | 197,313,301 | | | $ | 178,115,844 | |
| | | | | | | | |
* Including undistributed net investment income of | | $ | 49,641 | | | $ | — | |
| | | | | | | | |
The accompanying notes are an integral part of these financial statements.
24
FINANCIAL HIGHLIGHTS
SELECTED DATAFOR EACH SHAREOF CAPITAL STOCK OUTSTANDING
| | | | | | | | | | | | | | | | | | | | | | | | |
| | | LKCM Small Cap Equity Fund – Institutional Class | |
| | | Six Months | | | Year | | | Year | | | Year | | | Year | | | Year | |
| | | Ended | | | Ended | | | Ended | | | Ended | | | Ended | | | Ended | |
| | | June 30, 2012 | | | December 31, | | | December 31, | | | December 31, | | | December 31, | | | December 31, | |
| | | (Unaudited) | | | 2011 | | | 2010 | | | 2009 | | | 2008 | | | 2007 | |
Net Asset Value - Beginning of Period | | $ | 22.45 | | | $ | 21.49 | | | $ | 16.16 | | | $ | 12.24 | | | $ | 20.03 | | | $ | 21.98 | |
| | | | | | | | | | | | | | | | | | | | | | | | |
Net investment income (loss)(1) | | | 0.02 | | | | (0.08 | ) | | | (0.07 | ) | | | (0.05 | ) | | | (0.03 | ) | | | 0.01 | |
Net realized and unrealized gain (loss) on investments | | | 1.17 | | | | 1.04 | | | | 5.40 | | | | 3.97 | | | | (7.75 | ) | | | (0.17 | ) |
| | | | | | | | | | | | | | | | | | | | | | | | |
Total from investment operations | | | 1.19 | | | | 0.96 | | | | 5.33 | | | | 3.92 | | | | (7.78 | ) | | | (0.16 | ) |
| | | | | | | | | | | | | | | | | | | | | | | | |
Dividends from net investment income | | | — | | | | — | | | | — | | | | — | | | | — | | | | (0.00 | )(2) |
Distributions from net realized gains | | | — | | | | — | | | | — | | | | — | | | | (0.01 | ) | | | (1.79 | ) |
| | | | | | | | | | | | | | | | | | | | | | | | |
Total dividends and distributions | | | — | | | | — | | | | — | | | | — | | | | (0.01 | ) | | | (1.79 | ) |
| | | | | | | | | | | | | | | | | | | | | | | | |
Net Asset Value - End of Period | | $ | 23.64 | | | $ | 22.45 | | | $ | 21.49 | | | $ | 16.16 | | | $ | 12.24 | | | $ | 20.03 | |
| | | | | | | | | | | | | | | | | | | | | | | | |
Total Return | | | 5.30 | %(3) | | | 4.47 | % | | | 32.98 | % | | | 32.03 | % | | | (38.87 | )% | | | (0.76 | )% |
Ratios and Supplemental Data: | | | | | | | | | | | | | | | | | | | | | | | | |
Net assets, end of period (thousands) | | $ | 779,427 | | | $ | 785,280 | | | $ | 690,511 | | | $ | 529,166 | | | $ | 385,223 | | | $ | 595,175 | |
Ratio of expenses to average net assets | | | 0.94 | %(4) | | | 0.95 | % | | | 0.96 | % | | | 1.00 | % | | | 0.97 | % | | | 0.94 | % |
Ratio of net investment income (loss) to average net assets | | | 0.13 | %(4) | | | (0.33 | )% | | | (0.38 | )% | | | (0.35 | )% | | | (0.17 | )% | | | 0.04 | % |
Portfolio turnover rate(5) | | | 28 | % | | | 50 | % | | | 57 | % | | | 59 | % | | | 61 | % | | | 60 | % |
| (1) | Net investment income (loss) per share represents net investment income (loss) divided by the average shares outstanding throughout the period. |
| (5) | Portfolio turnover is calculated on the basis of the Fund as a whole without distinguishing between the classes of shares issued. |
| | | | | | | | | | | | | | | | | | | | | | | | |
| | | LKCM Small Cap Equity Fund - Adviser Class | |
| | | Six Months | | | Year | | | Year | | | Year | | | Year | | | Year | |
| | | Ended | | | Ended | | | Ended | | | Ended | | | Ended | | | Ended | |
| | | June 30, 2012 | | | December 31, | | | December 31, | | | December 31, | | | December 31, | | | December 31, | |
| | | (Unaudited) | | | 2011 | | | 2010 | | | 2009 | | | 2008 | | | 2007 | |
Net Asset Value - Beginning of Period | | $ | 21.88 | | | $ | 21.00 | | | $ | 15.83 | | | $ | 12.02 | | | $ | 19.72 | | | $ | 21.73 | |
| | | | | | | | | | | | | | | | | | | | | | | | |
Net investment loss(1) | | | (0.01 | ) | | | (0.13 | ) | | | (0.11 | ) | | | (0.08 | ) | | | (0.07 | ) | | | (0.05 | ) |
Net realized and unrealized gain (loss) on investments | | | 1.14 | | | | 1.01 | | | | 5.28 | | | | 3.89 | | | | (7.62 | ) | | | (0.17 | ) |
| | | | | | | | | | | | | | | | | | | | | | | | |
Total from investment operations | | | 1.13 | | | | 0.88 | | | | 5.17 | | | | 3.81 | | | | (7.69 | ) | | | (0.22 | ) |
| | | | | | | | | | | | | | | | | | | | | | | | |
Distributions from net realized gains | | | — | | | | — | | | | — | | | | — | | | | (0.01 | ) | | | (1.79 | ) |
| | | | | | | | | | | | | | | | | | | | | | | | |
Net Asset Value - End of Period | | $ | 23.01 | | | $ | 21.88 | | | $ | 21.00 | | | $ | 15.83 | | | $ | 12.02 | | | $ | 19.72 | |
| | | | | | | | | | | | | | | | | | | | | | | | |
Total Return | | | 5.16 | %(2) | | | 4.19 | % | | | 32.66 | % | | | 31.70 | % | | | (39.02 | )% | | | (1.06 | )% |
Ratios and Supplemental Data: | | | | | | | | | | | | | | | | | | | | | | | | |
Net assets, end of period (thousands) | | $ | 47,033 | | | $ | 43,124 | | | $ | 44,124 | | | $ | 35,725 | | | $ | 24,925 | | | $ | 40,465 | |
Ratio of expenses to average net assets | | | 1.19 | %(3) | | | 1.20 | % | | | 1.21 | % | | | 1.25 | % | | | 1.22 | % | | | 1.19 | % |
Ratio of net investment loss to average net assets | | | (0.12 | )%(3) | | | (0.58 | )% | | | (0.63 | )% | | | (0.60 | )% | | | (0.42 | )% | | | (0.21 | )% |
Portfolio turnover rate(4) | | | 28 | % | | | 50 | % | | | 57 | % | | | 59 | % | | | 61 | % | | | 60 | % |
| (1) | Net investment loss per share represents net investment loss divided by the average shares outstanding throughout the period. |
| (4) | Portfolio turnover is calculated on the basis of the Fund as a whole without distinguishing between the classes of shares issued. |
The accompanying notes are an integral part of these financial statements.
25
FINANCIAL HIGHLIGHTS
SELECTED DATAFOR EACH SHAREOF CAPITAL STOCK OUTSTANDING
| | | | | | | | |
| | | LKCM | |
| | | Small-Mid Cap | |
| | | Equity Fund | |
| | | Six Months | | | May 2, 2011(1) | |
| | | Ended | | | through | |
| | | June 30, 2012 | | | December 31, | |
| | | (Unaudited) | | | 2011 | |
Net Asset Value - Beginning of Period | | $ | 8.86 | | | $ | 10.00 | |
| | | | | | | | |
Net investment loss(2) | | | (0.00 | )(3) | | | (0.02 | ) |
Net realized and unrealized gain (loss) on investments | | | 0.50 | | | | (1.12 | )(4) |
| | | | | | | | |
Total from investment operations | | | 0.50 | | | | (1.14 | ) |
| | | | | | | | |
Net Asset Value - End of Period | | $ | 9.36 | | | $ | 8.86 | |
| | | | | | | | |
Total Return | | | 5.64 | %(5) | | | (11.40 | )%(5) |
Ratios and Supplemental Data: | | | | | | | | |
Net assets, end of period (thousands) | | $ | 218,123 | | | $ | 23,755 | |
Ratio of expenses to average net assets: | | | | |
Before expense waiver and/or reimbursement | | | 1.13 | %(6) | | | 2.14 | %(6) |
After expense waiver and/or reimbursement | | | 1.00 | %(6) | | | 1.00 | %(6) |
Ratio of net investment loss to average net assets: | | | | |
Before expense waiver and/or reimbursement | | | (0.13 | )%(6) | | | (1.55 | )%(6) |
After expense waiver and/or reimbursement | | | (0.00 | )%(6) | | | (0.41 | )%(6) |
Portfolio turnover rate | | | 23 | % | | | 36 | % |
| (1) | Commencement of operations. |
| (2) | Net investment loss per share represents net investment loss divided by the average shares outstanding throughout the period. |
| (4) | Due to the timing of capital share transactions, the per share amount of net realized and unrealized loss on investments varies from the amounts shown in the statement of operations. |
| | | | | | | | | | | | | | | | | | | | | | | | |
| | | LKCM Equity Fund | |
| | | Six Months | | | Year | | | Year | | | Year | | | Year | | | Year | |
| | | Ended | | | Ended | | | Ended | | | Ended | | | Ended | | | Ended | |
| | | June 30, 2012 | | | December 31, | | | December 31, | | | December 31, | | | December 31, | | | December 31, | |
| | | (Unaudited) | | | 2011 | | | 2010 | | | 2009 | | | 2008 | | | 2007 | |
Net Asset Value - Beginning of Period | | $ | 15.34 | | | $ | 15.18 | | | $ | 13.02 | | | $ | 10.33 | | | $ | 15.38 | | | $ | 14.43 | |
| | | | | | | | | | | | | | | | | | | | | | | | |
Net investment income | | | 0.06 | | | | 0.11 | (1) | | | 0.08 | | | | 0.10 | | | | 0.16 | | | | 0.16 | |
Net realized and unrealized gain (loss) on investments | | | 0.97 | | | | 0.39 | | | | 2.24 | | | | 2.69 | | | | (5.05 | ) | | | 1.42 | |
| | | | | | | | | | | | | | | | | | | | | | | | |
Total from investment operations | | | 1.03 | | | | 0.50 | | | | 2.32 | | | | 2.79 | | | | (4.89 | ) | | | 1.58 | |
| | | | | | | | | | | | | | | | | | | | | | | | |
Dividends from net investment income | | | — | | | | (0.10 | ) | | | (0.08 | ) | | | (0.10 | ) | | | (0.16 | ) | | | (0.16 | ) |
Distributions from net realized gains | | | — | | | | (0.24 | ) | | | (0.08 | ) | | | — | | | | — | | | | (0.47 | ) |
| | | | | | | | | | | | | | | | | | | | | | | | |
Total dividends and distributions | | | — | | | | (0.34 | ) | | | (0.16 | ) | | | (0.10 | ) | | | (0.16 | ) | | | (0.63 | ) |
| | | | | | | | | | | | | | | | | | | | | | | | |
Net Asset Value - End of Period | | $ | 16.37 | | | $ | 15.34 | | | $ | 15.18 | | | $ | 13.02 | | | $ | 10.33 | | | $ | 15.38 | |
| | | | | | | | | | | | | | | | | | | | | | | | |
Total Return | | | 6.71 | %(2) | | | 3.30 | % | | | 17.77 | % | | | 27.01 | % | | | (31.80 | )% | | | 10.96 | % |
Ratios and Supplemental Data: | | | | | | | | | | | | | | | | | | | | | | | | |
Net assets, end of period (thousands) | | $ | 126,613 | | | $ | 102,548 | | | $ | 72,370 | | | $ | 49,157 | | | $ | 36,677 | | | $ | 53,743 | |
Ratio of expenses to average net assets: | | | | | | | | | | | | | | | | | | | | | | | | |
Before expense waiver and/or reimbursement | | | 0.96 | %(3) | | | 0.99 | % | | | 1.04 | % | | | 1.13 | % | | | 1.06 | % | | | 1.01 | % |
After expense waiver and/or reimbursement | | | 0.80 | %(3) | | | 0.80 | % | | | 0.80 | % | | | 0.80 | % | | | 0.80 | % | | | 0.80 | % |
Ratio of net investment income to average net assets: | | | | | | | | | | | | | | | | | | | | | | | | |
Before expense waiver and/or reimbursement | | | 0.59 | %(3) | | | 0.54 | % | | | 0.39 | % | | | 0.62 | % | | | 0.85 | % | | | 0.82 | % |
After expense waiver and/or reimbursement | | | 0.75 | %(3) | | | 0.73 | % | | | 0.63 | % | | | 0.95 | % | | | 1.11 | % | | | 1.03 | % |
Portfolio turnover rate | | | 6 | % | | | 20 | % | | | 23 | % | | | 26 | % | | | 31 | % | | | 26 | % |
| (1) | Net investment income per share represents net investment income divided by the average shares outstanding throughout the period. |
The accompanying notes are an integral part of these financial statements.
26
FINANCIAL HIGHLIGHTS
SELECTED DATAFOR EACH SHAREOF CAPITAL STOCK OUTSTANDING
| | | | | | | | | | | | | | | | | | | | | | | | |
| | | LKCM Balanced Fund | |
| | | Six Months | | | Year | | | Year | | | Year | | | Year | | | Year | |
| | | Ended | | | Ended | | | Ended | | | Ended | | | Ended | | | Ended | |
| | | June 30, 2012 | | | December 31, | | | December 31, | | | December 31, | | | December 31, | | | December 31, | |
| | | (Unaudited) | | | 2011 | | | 2010 | | | 2009 | | | 2008 | | | 2007 | |
Net Asset Value - Beginning of Period | | $ | 14.53 | | | $ | 14.25 | | | $ | 13.09 | | | $ | 10.85 | | | $ | 13.84 | | | $ | 13.36 | |
| | | | | | | | | | | | | | | | | | | | | | | | |
Net investment income | | | 0.09 | | | | 0.17 | | | | 0.18 | | | | 0.22 | | | | 0.26 | | | | 0.28 | |
Net realized and unrealized gain (loss) on investments | | | 0.96 | | | | 0.28 | | | | 1.16 | | | | 2.24 | | | | (2.96 | ) | | | 0.82 | |
| | | | | | | | | | | | | | | | | | | | | | | | |
Total from investment operations | | | 1.05 | | | | 0.45 | | | | 1.34 | | | | 2.46 | | | | (2.70 | ) | | | 1.10 | |
| | | | | | | | | | | | | | | | | | | | | | | | |
Dividends from net investment income | | | (0.09 | ) | | | (0.17 | ) | | | (0.18 | ) | | | (0.22 | ) | | | (0.28 | ) | | | (0.28 | ) |
Distributions from net realized gains | | | — | | | | — | | | | — | | | | — | | | | (0.01 | ) | | | (0.34 | ) |
| | | | | | | | | | | | | | | | | | | | | | | | |
Total dividends and distributions | | | (0.09 | ) | | | (0.17 | ) | | | (0.18 | ) | | | (0.22 | ) | | | (0.29 | ) | | | (0.62 | ) |
| | | | | | | | | | | | | | | | | | | | | | | | |
Net Asset Value - End of Period | | $ | 15.49 | | | $ | 14.53 | | | $ | 14.25 | | | $ | 13.09 | | | $ | 10.85 | | | $ | 13.84 | |
| | | | | | | | | | | | | | | | | | | | | | | | |
Total Return | | | 7.20 | %(1) | | | 3.16 | % | | | 10.31 | % | | | 22.90 | % | | | (19.70 | )% | | | 8.25 | % |
Ratios and Supplemental Data: | | | | | | | | | | | | | | | | | | | | | | | | |
Net assets, end of period (thousands) | | $ | 20,745 | | | $ | 18,560 | | | $ | 16,486 | | | $ | 13,476 | | | $ | 10,156 | | | $ | 12,191 | |
Ratio of expenses to average net assets: | | | | | | | | | | | | | | | | | | | | | | | | |
Before expense waiver and/or reimbursement | | | 1.12 | %(2) | | | 1.14 | % | | | 1.25 | % | | | 1.41 | % | | | 1.38 | % | | | 1.35 | % |
After expense waiver and/or reimbursement | | | 0.80 | %(2) | | | 0.80 | % | | | 0.80 | % | | | 0.80 | % | | | 0.80 | % | | | 0.80 | % |
Ratio of net investment income to average net assets: | | | | | | | | | | | | | | | | | | | | | | | | |
Before expense waiver and/or reimbursement | | | 0.81 | %(2) | | | 0.83 | % | | | 0.89 | % | | | 1.28 | % | | | 1.51 | % | | | 1.51 | % |
After expense waiver and/or reimbursement | | | 1.13 | %(2) | | | 1.17 | % | | | 1.34 | % | | | 1.89 | % | | | 2.09 | % | | | 2.06 | % |
Portfolio turnover rate | | | 8 | % | | | 34 | % | | | 13 | % | | | 22 | % | | | 38 | % | | | 27 | % |
| | | | | | | | | | | | | | | | | | | | | | | | |
| | | LKCM Fixed Income Fund | |
| | | Six Months | | | Year | | | Year | | | Year | | | Year | | | Year | |
| | | Ended | | | Ended | | | Ended | | | Ended | | | Ended | | | Ended | |
| | | June 30, 2012 | | | December 31, | | | December 31, | | | December 31, | | | December 31, | | | December 31, | |
| | | (Unaudited) | | | 2011 | | | 2010 | | | 2009 | | | 2008 | | | 2007 | |
Net Asset Value - Beginning of Period | | $ | 11.04 | | | $ | 11.03 | | | $ | 10.85 | | | $ | 10.20 | | | $ | 10.33 | | | $ | 10.19 | |
| | | | | | | | | | | | | | | | | | | | | | | | |
Net investment income | | | 0.17 | | | | 0.37 | | | | 0.40 | | | | 0.43 | | | | 0.43 | | | | 0.46 | |
Net realized and unrealized gain (loss) on investments | | | 0.14 | | | | 0.09 | | | | 0.22 | | | | 0.65 | | | | (0.13 | ) | | | 0.14 | |
| | | | | | | | | | | | | | | | | | | | | | | | |
Total from investment operations | | | 0.31 | | | | 0.46 | | | | 0.62 | | | | 1.08 | | | | 0.30 | | | | 0.60 | |
| | | | | | | | | | | | | | | | | | | | | | | | |
Dividends from net investment income | | | (0.17 | ) | | | (0.37 | ) | | | (0.40 | ) | | | (0.43 | ) | | | (0.43 | ) | | | (0.46 | ) |
Distributions from net realized gains | | | — | | | | (0.08 | ) | | | (0.04 | ) | | | — | | | | — | | | | — | |
| | | | | | | | | | | | | | | | | | | | | | | | |
Total dividends and distributions | | | (0.17 | ) | | | (0.45 | ) | | | (0.44 | ) | | | (0.43 | ) | | | (0.43 | ) | | | (0.46 | ) |
| | | | | | | | | | | | | | | | | | | | | | | | |
Net Asset Value - End of Period | | $ | 11.18 | | | $ | 11.04 | | | $ | 11.03 | | | $ | 10.85 | | | $ | 10.20 | | | $ | 10.33 | |
| | | | | | | | | | | | | | | | | | | | | | | | |
Total Return | | | 2.83 | %(1) | | | 4.22 | % | | | 5.82 | % | | | 10.77 | % | | | 2.99 | % | | | 5.96 | % |
Ratios and Supplemental Data: | | | | | | | | | | | | | | | | | | | | | | | | |
Net assets, end of period (thousands) | | $ | 197,313 | | | $ | 178,116 | | | $ | 162,353 | | | $ | 149,218 | | | $ | 120,674 | | | $ | 113,032 | |
Ratio of expenses to average net assets: | | | | | | | | | | | | | | | | | | | | | | | | |
Before expense waiver and/or reimbursement | | | 0.71 | %(2) | | | 0.72 | % | | | 0.73 | % | | | 0.76 | % | | | 0.73 | % | | | 0.72 | % |
After expense waiver and/or reimbursement | | | 0.65 | %(2) | | | 0.65 | % | | | 0.65 | % | | | 0.65 | % | | | 0.65 | % | | | 0.65 | % |
Ratio of net investment income to average net assets: | | | | | | | | | | | | | | | | | | | | | | | | |
Before expense waiver and/or reimbursement | | | 3.13 | %(2) | | | 3.31 | % | | | 3.55 | % | | | 4.00 | % | | | 4.15 | % | | | 4.39 | % |
After expense waiver and/or reimbursement | | | 3.19 | %(2) | | | 3.38 | % | | | 3.63 | % | | | 4.11 | % | | | 4.23 | % | | | 4.46 | % |
Portfolio turnover rate | | | 19 | % | | | 24 | % | | | 20 | % | | | 30 | % | | | 23 | % | | | 31 | % |
The accompanying notes are an integral part of these financial statements.
27
LKCM FUNDS
NOTESTOTHE FINANCIAL STATEMENTS (UNAUDITED)
A. Organization and Significant Accounting Policies: LKCM Funds (the “Trust”) is registered under the Investment Company Act of 1940 (“1940 Act”) as an open-end, management investment company. The Trust was organized as a Delaware business trust on February 10, 1994 and consists of eight diversified series, five of which are presented herein and include the LKCM Small Cap Equity Fund, LKCM Small-Mid Cap Equity Fund, LKCM Equity Fund, LKCM Balanced Fund and LKCM Fixed Income Fund (collectively, the “Funds”), the assets of which are invested in separate, independently managed portfolios. Investment operations of the Funds began on July 14, 1994 (LKCM Small Cap Equity Fund), January 3, 1996 (LKCM Equity Fund), December 30, 1997 (LKCM Balanced Fund and LKCM Fixed Income Fund), and May 2, 2011 (LKCM Small-Mid Cap Equity Fund). The Small Cap Equity Fund and the Equity Fund issued a second class of shares, Adviser Class Shares, and renamed the initial class as Institutional Class Shares on May 1, 2003. The Small Cap Equity Adviser Class Shares were initially sold on June 5, 2003 and are subject to expenses pursuant to the Rule 12b-1 plan described in Note B. The Equity Fund and Small-Mid Cap Equity Fund Adviser Class Shares have not yet commenced sales. Each Fund charges a 1% redemption fee for redemptions on Fund shares held for less than 30 days.
The LKCM Small Cap Equity Fund seeks to maximize long-term capital appreciation by investing under normal circumstances at least 80% of its net assets in equity securities of smaller companies (those with market capitalizations at the time of investment between $400 million and $2.5 billion) which Luther King Capital Management Corporation (the “Adviser”) believes are likely to have above-average growth in revenue and/or earnings and potential for above-average capital appreciation. The LKCM Small-Mid Cap Equity Fund seeks to maximize long-term capital appreciation by investing under normal circumstances at least 80% of its net assets in equity securities of small-mid capitalization companies (those with market capitalizations at the time of investment between $1 billion and $7 billion) which the Adviser believes are likely to have above-average growth in revenue and/or earnings and potential for above average capital appreciation. The LKCM Equity Fund seeks to maximize long-term capital appreciation by investing under normal circumstances at least 80% of its net assets in equity securities of companies which the Adviser believes are likely to have above-average growth in revenue and/or earnings, above-average returns on shareholders’ equity and under-leveraged balance sheets, and potential for above-average capital appreciation. The LKCM Balanced Fund seeks to provide investors with current income and long-term capital appreciation by investing under normal circumstances primarily in a portfolio of equity and fixed income securities with at least 25% of the Fund’s total assets invested in fixed income securities. The LKCM Fixed Income Fund seeks to provide investors with current income by investing under normal circumstances at least 80% of its net assets in a portfolio of investment grade corporate and government fixed income securities.
The following is a summary of significant accounting policies followed by the Funds in preparation of the financial statements.
1. Security Valuation: Securities listed on a U.S. securities exchange for which market quotations are readily available are valued at the last quoted sale price taken from the exchange where the security is primarily traded. Nasdaq National Market securities are valued at the Nasdaq Official Closing Price (“NOCP”). Unlisted U.S. securities and listed U.S. securities not traded on the valuation date for which market quotations are readily available are valued at the mean of the most recent quoted bid and asked price. Securities listed on a foreign exchange for which market quotations are readily available are valued at the last quoted sales price available before the time when assets are valued. Debt securities (other than obligations having a maturity of 60 days or less) are normally valued at the mean of the bid and ask price and/or by using a combination of daily quotes or matrix evaluations provided by an independent pricing service. Debt securities purchased with remaining maturities of 60 days or less are valued at amortized cost which approximates fair value. Other assets and securities for which no quotations are readily available (including restricted securities) are valued in good faith at fair value using methods determined by the Board of Trustees. The Board has adopted specific procedures for valuing portfolio securities and delegated the implementation of these procedures to the Adviser. The procedures authorize the Adviser to make all determinations regarding the fair value of a portfolio security and to report such determinations to the Board of Trustees. The Funds may also use independent pricing services to assist in pricing portfolio securities.
The Trust has adopted accounting standards which establish an authoritative definition of fair value and set out a hierarchy for measuring fair value. These standards require additional disclosures about the various inputs and valuation techniques used to develop the measurements of fair value and a discussion of changes in valuation techniques and related inputs during the period. These standards define fair value as the price that would be received to sell an asset or paid to transfer a liability in an orderly transaction between market participants at the measurement date. The fair value hierarchy is organized into three levels based upon the assumptions (referred to as “inputs”) used in pricing the asset or liability. These standards state that “observable inputs” reflect the assumptions market participants would use in pricing the asset or liability based on market data obtained from independent sources and “unobservable inputs” reflect an entity’s own assumptions about the assumptions market participants would use in pricing the asset or liability. These inputs are summarized in the three broad levels listed below.
28
| | |
| |
| Level 1 - | | Quoted unadjusted prices for identical instruments in active markets to which the Trust has access at the date of measurement. |
| |
| Level 2 - | | Quoted prices for similar instruments in active markets; quoted prices for identical or similar instruments in markets that are not active; and model-derived valuations in which all significant inputs and significant value drivers are observable in active markets. Level 2 inputs are those in markets for which there are few transactions, the prices are not current, little public information exists or instances where prices vary substantially over time or among brokered market makers. |
| |
| Level 3 - | | Model derived valuations in which one or more significant inputs or significant value drivers are unobservable. Unobservable inputs are those inputs that reflect the Trust’s own assumptions that market participants would use to price the asset or liability based on the best available information. |
The inputs or methodology used for valuing securities are not necessarily an indication of the risk associated with investing in those securities. The following is a summary of the inputs used to value the Funds’ investments as of June 30, 2012:
| | | | | | | | | | | | | | | | |
| LKCM Small Cap Equity Fund | | | | | | | | | | | | |
Description | | Level 1 | | | Level 2 | | | Level 3 | | | Total | |
Common Stocks | | $ | 789,853,536 | | | $ | — | | | $ | — | | | $ | 789,853,536 | |
Money Market Funds | | | 36,919,553 | | | | — | | | | — | | | | 36,919,553 | |
| | | | | | | | | | | | | | | | |
Total Investments * | | $ | 826,773,089 | | | $ | — | | | $ | — | | | $ | 826,773,089 | |
| | | | | | | | | | | | | | | | |
| | | | |
| LKCM Small-Mid Cap Equity Fund | | | | | | | | | | | | |
Description | | Level 1 | | | Level 2 | | | Level 3 | | | Total | |
Common Stocks | | $ | 198,520,645 | | | $ | — | | | $ | — | | | $ | 198,520,645 | |
Money Market Funds | | | 18,541,558 | | | | — | | | | — | | | | 18,541,558 | |
| | | | | | | | | | | | | | | | |
Total Investments * | | $ | 217,062,203 | | | $ | — | | | $ | — | | | $ | 217,062,203 | |
| | | | | | | | | | | | | | | | |
| | | | |
| LKCM Equity Fund | | | | | | | | | | | | |
Description | | Level 1 | | | Level 2 | | | Level 3 | | | Total | |
Common Stocks | | $ | 119,494,697 | | | $ | — | | | $ | — | | | $ | 119,494,697 | |
Money Market Funds | | | 7,033,713 | | | | — | | | | — | | | | 7,033,713 | |
| | | | | | | | | | | | | | | | |
Total Investments * | | $ | 126,528,410 | | | $ | — | | | $ | — | | | $ | 126,528,410 | |
| | | | | | | | | | | | | | | | |
| | | | |
| LKCM Balanced Fund | | | | | | | | | | | | |
Description | | Level 1 | | | Level 2 | | | Level 3 | | | Total | |
Common Stocks | | $ | 14,846,433 | | | $ | — | | | $ | — | | | $ | 14,846,433 | |
Corporate Bonds | | | — | | | | 5,770,561 | | | | — | | | | 5,770,561 | |
Money Market Fund | | | 73,230 | | | | — | | | | — | | | | 73,230 | |
| | | | | | | | | | | | | | | | |
Total Investments * | | $ | 14,919,663 | | | $ | 5,770,561 | | | $ | — | | | $ | 20,690,224 | |
| | | | | | | | | | | | | | | | |
| | | | |
| LKCM Fixed Income Fund | | | | | | | | | | | | |
Description | | Level 1 | | | Level 2 | | | Level 3 | | | Total | |
Preferred Stocks | | $ | 4,488,750 | | | $ | — | | | $ | — | | | $ | 4,488,750 | |
Corporate Bonds | | | — | | | | 184,187,493 | | | | — | | | | 184,187,493 | |
U.S. Government & Agency Issues | | | — | | | | 5,188,925 | | | | — | | | | 5,188,925 | |
Money Market Fund | | | 1,157,725 | | | | — | | | | — | | | | 1,157,725 | |
| | | | | | | | | | | | | | | | |
Total Investments * | | $ | 5,646,475 | | | $ | 189,376,418 | | | $ | — | | | $ | 195,022,893 | |
| | | | | | | | | | | | | | | | |
| * | Additional information regarding the industry classifications of these investments is disclosed in the Schedule of Investments. |
There were no significant transfers into or out of Level 1, Level 2 or Level 3 fair value measurements during the reporting period, as compared to their classification from the previous annual report.
In May 2011, the FASB issued ASU No. 2011-04 “Amendments to Achieve Common Fair Value Measurements and Disclosure Requirements” in GAAP and the International Financial Reporting Standards (“IFRS”). ASU No. 2011-04 amends FASB ASC Topic 820, Fair Value Measurements and Disclosures, to establish common requirements for measuring fair value and for disclosing information about fair value measurements in accordance with GAAP and IFRS. ASU No. 2011-04 is effective for fiscal years beginning after December 15, 2011 and for interim periods within those fiscal years. The Funds have disclosed the applicable requirements of this accounting standard in their financial statements.
In preparing these financial statements, the Trust has evaluated events after June 30, 2012 and determined that there were no significant subsequent events that would require adjustment to or additional disclosure in these financial statements.
29
2. Federal Income Taxes: The Funds have elected to be treated as “regulated investment companies” under Subchapter M of the Internal Revenue Code and each Fund intends to distribute all of its investment company net taxable income and net capital gains to shareholders. Therefore, no federal income tax provision is recorded.
3. Distributions to Shareholders: The LKCM Small Cap Equity, LKCM Small-Mid Cap Equity and LKCM Equity Funds generally intend to pay dividends and net capital gain distributions, if any, at least on an annual basis. The LKCM Balanced and LKCM Fixed Income Funds generally intend to pay dividends on a quarterly basis and net capital gain distributions, if any, at least on an annual basis.
4. Foreign Securities: Investing in securities of foreign companies and foreign governments involves special risks and considerations not typically associated with investing in U.S. companies and securities of the U.S. government. These risks include devaluation of currencies and future adverse political and economic developments. Moreover, securities of many foreign companies and foreign governments and their markets may be less liquid and their prices more volatile than those of securities of comparable U.S. companies and securities of the U.S. government.
5. Expense Allocation: Expenses incurred by the Funds are allocated among the Funds based upon (i) relative average net assets, (ii) a specific identification basis as incurred, or (iii) evenly among the Funds, depending on the nature of the expense. Expenses that are directly attributable to a class of shares, such as Rule 12b-1 distribution fees, are charged to that class. For multi-class Funds, income, unrealized and realized gains/losses are generally allocated between the Fund’s classes in proportion to their respective net assets.
6. Use of Estimates: The preparation of financial statements in conformity with accounting principles generally accepted in the United States of America requires management to make estimates and assumptions that affect the reported amounts of assets and liabilities and disclosure of contingent assets and liabilities at the date of the financial statements and the reported amounts of revenues and expenses during the reporting period. Actual results could differ from those estimates.
7. Guarantees and Indemnifications: In the normal course of business, the Funds enter into contracts with service providers that contain general indemnification clauses. The Funds’ maximum exposure under these arrangements is unknown as this would involve future claims against the Funds that have not yet occurred. Based on experience, the Funds expect the risk of loss to be remote.
8. Other: Security and shareholder transactions are recorded on the trade date. Realized gains and losses on sales of investments are calculated on the identified cost basis. Dividend income and dividends and distributions to shareholders are recorded on the ex-dividend date. Interest income is recognized on the accrual basis. All discounts and premiums are amortized on the effective interest method for tax and financial reporting purposes.
Generally accepted accounting principles require that certain components of net assets be adjusted to reflect permanent differences between financial and tax reporting. These reclassifications have no effect on net assets or net asset values per share.
9. Restricted and Illiquid Securities: The Funds are permitted to invest in securities that are subject to legal or contractual restrictions on resale or are illiquid. Restricted securities generally may be resold in transactions exempt from registration. A security may be considered illiquid if it lacks a readily available market or if its valuation has not changed for a certain period of time. Disposal of these securities may involve time-consuming negotiations and expense, and prompt sale at the current valuation may be difficult.
B. Investment Advisory and Other Agreements: Luther King Capital Management Corporation (the “Adviser”) serves as the investment adviser to the Funds under an Investment Advisory Agreement (the “Agreement”). The Adviser receives a fee, computed daily and payable quarterly, at the annual rates presented below as applied to each Fund’s average daily net assets. The Adviser has contractually agreed to waive all or a portion of its management fee and/or reimburse the Funds through April 30, 2013 in order to limit each Fund’s operating expenses to the annual cap rates presented below. For the six months ended June 30, 2012, the Adviser waived the following management fees to meet its expense cap obligations:
| | | | | | | | | | | | | | | | | | | | |
| | | LKCM | | | LKCM | | | LKCM | | | LKCM | | | LKCM | |
| | | Small Cap | | | Small-Mid Cap | | | Equity | | | Balanced | | | Fixed | |
| | | Equity Fund | | | Equity Fund | | | Fund | | | Fund | | | Income Fund | |
Annual Advisory Rate | | | 0.75 | % | | | 0.75 | % | | | 0.70 | % | | | 0.65 | % | | | 0.50 | % |
Annual Cap on Expenses | | | 1.00 | % (Inst.) | | | 1.00 | % | | | 0.80 | % | | | 0.80 | % | | | 0.65 | % |
| | | 1.25 | % (Adviser) | | | | | | | | | | | | | | | | |
Fees Waived in 2012 | | | — | | | $ | 40,311 | | | $ | 94,294 | | | $ | 32,126 | | | $ | 59,660 | |
U.S. Bancorp Fund Services, LLC serves as transfer agent and administrator for the Trust and serves as accounting services agent for the Trust. U.S. Bank, N.A. serves as custodian for the Trust.
Distribution services are performed pursuant to a distribution contract with Quasar Distributors, LLC, the Trust’s principal underwriter.
30
The Small Cap Equity Fund, Small-Mid Cap Equity and the Equity Fund have adopted a Rule 12b-1 plan under which the Adviser Class of each Fund may pay up to 1.00% of its average daily net assets for distribution and other services. However, the Board of Trustees has currently only authorized a fee of 0.25% of each Fund’s average daily net assets. For the six months ended June 30, 2012, fees accrued by the Small Cap Equity Fund pursuant to the 12b-1 Plan were $59,593.
C. Fund Shares: At June 30, 2012, there was an unlimited number of shares of beneficial interest, no par value, authorized. The following table summarizes the activity in shares of each Fund:
Small Cap Equity Fund
| | | | | | | | | | | | | | | | |
| | | Six Months Ended | | | Year Ended | |
| | | June 30, 2012 | | | December 31, 2011 | |
| | | Institutional Class | | | Institutional Class | |
| | | Shares | | | Amount | | | Shares | | | Amount | |
Shares sold | | | 3,830,564 | | | $ | 93,215,001 | | | | 8,832,325 | | | $ | 201,191,471 | |
Shares redeemed | | | (5,842,748 | ) | | | (140,120,813 | ) | | | (5,987,585 | ) | | | (135,600,658 | ) |
Redemption fee | | | | | | | 15,339 | | | | | | | | 7,239 | |
| | | | | | | | | | | | | | | | |
Net increase (decrease) | | | (2,012,184 | ) | | $ | (46,890,473 | ) | | | 2,844,740 | | | $ | 65,598,052 | |
| | | | | | | | | | | | | | | | |
Shares Outstanding: | | | | | | | | | | | | | | | | |
Beginning of period | | | 34,981,117 | | | | | | | | 32,136,377 | | | | | |
| | | | | | | | | | | | | | | | |
End of period | | | 32,968,933 | | | | | | | | 34,981,117 | | | | | |
| | | | | | | | | | | | | | | | |
| | | | | | | | | | | | | | | | |
| | | Six Months Ended | | | Year Ended | |
| | | June 30, 2012 | | | December 31, 2011 | |
| | | Adviser Class | | | Adviser Class | |
| | | Shares | | | Amount | | | Shares | | | Amount | |
Shares sold | | | 230,284 | | | $ | 5,475,866 | | | | 818,200 | | | $ | 17,753,894 | |
Shares redeemed | | | (157,424 | ) | | | (3,693,470 | ) | | | (948,884 | ) | | | (21,309,344 | ) |
Redemption fee | | | | | | | 181 | | | | | | | | 331 | |
| | | | | | | | | | | | | | | | |
Net increase (decrease) | | | 72,860 | | | $ | 1,782,577 | | | | (130,684 | ) | | $ | (3,555,119 | ) |
| | | | | | | | | | | | | | | | |
Shares Outstanding: | | | | | | | | | | | | | | | | |
Beginning of period | | | 1,970,863 | | | | | | | | 2,101,547 | | | | | |
| | | | | | | | | | | | | | | | |
End of period | | | 2,043,723 | | | | | | | | 1,970,863 | | | | | |
| | | | | | | | | | | | | | | | |
Total Net Increase (Decrease) | | | | | | $ | (45,107,896 | ) | | | | | | $ | 62,042,933 | |
| | | | | | | | | | | | | | | | |
Small-Mid Cap Equity Fund
| | | | | | | | | | | | | | | | |
| | | Six Months Ended | | | May 2, 2011(1) through | |
| | | June 30, 2012 | | | December 31, 2011 | |
| | | Shares | | | Amount | | | Shares | | | Amount | |
Shares sold | | | 21,371,913 | | | $ | 199,782,601 | | | | 2,908,059 | | | $ | 25,500,659 | |
Shares redeemed | | | (747,437 | ) | | | (7,139,512 | ) | | | (226,034 | ) | | | (2,055,865 | ) |
Redemption fee | | | | | | | 9,841 | | | | | | | | 13 | |
| | | | | | | | | | | | | | | | |
Net increase | | | 20,624,476 | | | $ | 192,652,930 | | | | 2,682,025 | | | $ | 23,444,807 | |
| | | | | | | | | | | | | | | | |
Shares Outstanding: | | | | | | | | | | | | | | | | |
Beginning of period | | | 2,682,025 | | | | | | | | — | | | | | |
| | | | | | | | | | | | | | | | |
End of period | | | 23,306,501 | | | | | | | | 2,682,025 | | | | | |
| | | | | | | | | | | | | | | | |
| (1) | Commencement of operations. |
31
Equity Fund
| | | | | | | | | | | | | | | | |
| | | Six Months Ended | | | Year Ended | |
| | | June 30, 2012 | | | December 31, 2011 | |
| | | Shares | | | Amount | | | Shares | | | Amount | |
Shares sold | | | 1,558,021 | | | $ | 25,708,758 | | | | 2,438,054 | | | $ | 37,526,183 | |
Shares issued to shareholders in reinvestment of distributions | | | — | | | | — | | | | 141,992 | | | | 2,188,102 | |
Shares redeemed | | | (506,794 | ) | | | (8,334,263 | ) | | | (663,144 | ) | | | (10,157,406 | ) |
Redemption fee | | | | | | | 2,749 | | | | | | | | 492 | |
| | | | | | | | | | | | | | | | |
Net increase | | | 1,051,227 | | | $ | 17,377,244 | | | | 1,916,902 | | | $ | 29,557,371 | |
| | | | | | | | | | | | | | | | |
Shares Outstanding: | | | | | | | | | | | | | | | | |
Beginning of period | | | 6,685,460 | | | | | | | | 4,768,558 | | | | | |
| | | | | | | | | | | | | | | | |
End of period | | | 7,736,687 | | | | | | | | 6,685,460 | | | | | |
| | | | | | | | | | | | | | | | |
Balanced Fund
| | | | | | | | | | | | | | | | |
| | | Six Months Ended | | | Year Ended | |
| | | June 30, 2012 | | | December 31, 2011 | |
| | | Shares | | | Amount | | | Shares | | | Amount | |
Shares sold | | | 84,695 | | | $ | 1,322,983 | | | | 387,905 | | | $ | 5,695,753 | |
Shares issued to shareholders in reinvestment of distributions | | | 7,196 | | | | 111,357 | | | | 15,313 | | | | 221,650 | |
Shares redeemed | | | (29,643 | ) | | | (456,284 | ) | | | (282,945 | ) | | | (4,111,314 | ) |
Redemption fee | | | | | | | — | | | | | | | | 56 | |
| | | | | | | | | | | | | | | | |
Net increase | | | 62,248 | | | $ | 978,056 | | | | 120,273 | | | $ | 1,806,145 | |
| | | | | | | | | | | | | | | | |
Shares Outstanding: | | | | | | | | | | | | | | | | |
Beginning of period | | | 1,277,271 | | | | | | | | 1,156,998 | | | | | |
| | | | | | | | | | | | | | | | |
End of period | | | 1,339,519 | | | | | | | | 1,277,271 | | | | | |
| | | | | | | | | | | | | | | | |
Fixed Income Fund
| | | | | | | | | | | | | | | | |
| | | Six Months Ended | | | Year Ended | |
| | | June 30, 2012 | | | December 31, 2011 | |
| | | Shares | | | Amount | | | Shares | | | Amount | |
Shares sold | | | 2,200,570 | | | $ | 24,665,810 | | | | 2,238,192 | | | $ | 24,941,740 | |
Shares issued to shareholders in reinvestment of distributions | | | 235,122 | | | | 2,627,526 | | | | 557,529 | | | | 6,158,736 | |
Shares redeemed | | | (921,018 | ) | | | (10,323,194 | ) | | | (1,372,672 | ) | | | (15,260,453 | ) |
Redemption fee | | | | | | | — | | | | | | | | 15 | |
| | | | | | | | | | | | | | | | |
Net increase | | | 1,514,674 | | | $ | 16,970,142 | | | | 1,423,049 | | | $ | 15,840,038 | |
| | | | | | | | | | | | | | | | |
Shares Outstanding: | | | | | | | | | | | | | | | | |
Beginning of period | | | 16,136,186 | | | | | | | | 14,713,137 | | | | | |
| | | | | | | | | | | | | | | | |
End of period | | | 17,650,860 | | | | | | | | 16,136,186 | | | | | |
| | | | | | | | | | | | | | | | |
D. Security Transactions: Purchases and sales of investment securities, other than short-term investments, for the six months ended June 30, 2012 were as follows:
| | | | | | | | | | | | | | | | |
| | | Purchases | | | Sales | |
| | | U.S. | | | | | | U.S. | | | | |
| | | Government | | | Other | | | Government | | | Other | |
LKCM Small Cap Equity Fund | | $ | — | | | $ | 241,511,292 | | | $ | — | | | $ | 281,708,359 | |
LKCM Small-Mid Equity Fund | | | — | | | | 189,516,513 | | | | — | | | | 15,691,562 | |
LKCM Equity Fund | | | — | | | | 21,090,373 | | | | — | | | | 7,174,035 | |
LKCM Balanced Fund | | | — | | | | 2,467,866 | | | | — | | | | 1,560,540 | |
LKCM Fixed Income Fund | | | — | | | | 51,324,451 | | | | 1,274,660 | | | | 33,506,257 | |
32
E. Tax Information: At December 31, 2011, the components of accumulated earnings (losses) on a tax basis were as follows:
| | | | | | | | | | | | | | | | | | | | |
| | | LKCM
Small Cap
Equity Fund | | | LKCM
Small-Mid Cap
Equity Fund | | | LKCM
Equity
Fund | | | LKCM
Balanced
Fund | | | LKCM
Fixed
Income Fund | |
Cost of Investments | | $ | 663,781,561 | | | $ | 22,767,967 | | | $ | 84,929,829 | | | $ | 15,034,389 | | | $ | 167,352,842 | |
| | | | | | | | | | | | | | | | | | | | |
Gross Unrealized Appreciation | | | 186,051,505 | | | | 1,858,150 | | | | 20,428,967 | | | | 3,693,501 | | | | 9,654,854 | |
Gross Unrealized Depreciation | | | (19,716,052 | ) | | | (856,180 | ) | | | (3,199,540 | ) | | | (204,157 | ) | | | (974,822 | ) |
| | | | | | | | | | | | | | | | | | | | |
Net Unrealized Appreciation | | $ | 166,335,453 | | | $ | 1,001,970 | | | $ | 17,229,427 | | | $ | 3,489,344 | | | $ | 8,680,032 | |
| | | | | | | | | | | | | | | | | | | | |
Undistributed Ordinary Income | | | — | | | | — | | | | 631 | | | | 107 | | | | 1,992 | |
Undistributed Long-Term Capital Gain | | | — | | | | — | | | | 94,936 | | | | — | | | | 111,467 | |
| | | | | | | | | | | | | | | | | | | | |
Total Distributable Earnings | | $ | — | | | $ | — | | | $ | 95,567 | | | $ | 107 | | | $ | 113,459 | |
| | | | | | | | | | | | | | | | | | | | |
Other Accumulated Losses | | $ | (1,920,023 | ) | | $ | (654,811 | ) | | $ | — | | | $ | (479,597 | ) | | $ | — | |
| | | | | | | | | | | | | | | | | | | | |
Total Accumulated Gains | | $ | 164,415,430 | | | $ | 347,159 | | | $ | 17,324,994 | | | $ | 3,009,854 | | | $ | 8,793,491 | |
| | | | | | | | | | | | | | | | | | | | |
The difference between book-basis and tax-basis unrealized appreciation is attributable primarily to the tax deferral of losses on wash sales and partnerships.
At December 31, 2011, the capital loss carryforwards were as follows:
| | | | | | | | |
| | | Month/Year Realized | | Month/Year Expiring | | Short-Term | |
LKCM Small-Mid Cap Equity Fund | | Unexpiring Losses | | | | $ | 411,663 | |
| | | | | | | | |
LKCM Balanced Fund | | 12/2009 | | 12/2017 | | $ | 420,308 | |
| | | | | | | | |
To the extent the Funds realize future net capital gains, taxable distributions will be reduced by any unused capital loss carryforwards as permitted by the Internal Revenue Code.
During the year ended December 31, 2011, the LKCM Small Cap Equity Fund and the LKCM Balanced Fund utilized capital loss carryforwards of $71,739,544 and $54,856, respectively.
At December 31, 2011, the following Funds deferred, on a tax basis, post-October losses of:
| | | | |
LKCM Small Cap Equity Fund | | $ | 1,920,023 | |
LKCM Small-Mid Cap Equity Fund | | $ | 243,148 | |
LKCM Balanced Fund | | $ | 59,289 | |
On December 22, 2010, the Regulated Investment Company Modernization Act of 2010 (the “RIC Act”) was enacted, and the provisions within the RIC Act are effective for the Fund for the year ended December 31, 2011. The RIC Act modernized several of the federal income and excise tax provisions related to regulated investment companies (“RICs”). Under the RIC Act, new capital losses may be carried forward indefinitely with the character of the original loss retained. Prior to the RIC Act, capital losses only could be carried forward for eight years, and were carried forward as short-term capital losses regardless of the character of the original loss. The RIC Act also contains simplification provisions, which are aimed at preventing disqualification of a RIC for inadvertent failures to comply with asset diversification and/or qualifying income tests. The RIC Act exempts RICs from the preferential dividend rule and repeals the 60-day designation requirement for certain types of pay-through income and gains. In addition, the RIC Act contains provisions aimed at preserving the character of distributions made by a RIC during the portion of its taxable year ending after October 31 or December 31.
The tax components of dividends paid during the periods shown below were as follows:
| | | | | | | | | | | | | | | | |
| | | Six Months Ended June 30, 2012 | | | Year Ended December 31, 2011 | |
| | | Ordinary | | | Long-Term | | | Ordinary | | | Long-Term | |
| | | Income | | | Capital Gains | | | Income | | | Capital Gains | |
LKCM Small Cap Equity Fund | | $ | — | | | $ | — | | | $ | — | | | $ | — | |
LKCM Small-Mid Equity Fund | | | — | | | | — | | | | — | | | | — | |
LKCM Equity Fund | | | — | | | | — | | | | 636,154 | | | | 1,598,383 | |
LKCM Balanced Fund | | | 112,505 | | | | — | | | | 223,616 | | | | — | |
LKCM Fixed Income Fund | | | 2,947,165 | | | | — | | | | 5,739,348 | | | | 1,188,742 | |
33
The Funds designated as long-term capital gain dividend, pursuant to Internal Revenue Code Section 852(b)(3), the amount necessary to reduce the earnings and profits of the Funds related to net capital gain to zero for the tax year ended December 31, 2011.
The Trust has adopted financial reporting rules regarding recognition and measurement of tax positions taken or expected to be taken on a tax return. The Trust has reviewed all open tax years and major jurisdictions and concluded that there is no impact on the Funds’ financial position or results of operations. Tax years that remain open to examination by major tax jurisdictions include tax years ended December 31, 2008 through December 31, 2011. There is no tax liability resulting from unrecognized tax benefits relating to uncertain income tax positions taken or expected to be taken on tax returns as of December 31, 2011. The Funds are not aware of any tax positions for which it is reasonably possible that the total amounts of unrecognized tax benefits will significantly change in the next twelve months. If applicable, the Funds would recognize interest accrued related to unrecognized tax benefits in “interest expense” and penalties in “other expense” on the statement of operations.
34
LKCM FUNDS
ADDITIONAL INFORMATION
June 30, 2012 (Unaudited)
Availability of Proxy Voting Information: A description of the policies and procedures that the Funds use to determine how to vote proxies relating to their portfolio securities, as well as the proxy voting record, is available without charge, upon request, by calling toll-free 1-800-688-LKCM or on the SEC website at http://www.sec.gov.
The actual voting records relating to portfolio securities during the twelve month period ended June 30 (as filed with the SEC on Form N-PX) are available without charge, upon request, by calling the Funds toll free at 1-800-688-LKCM or by accessing the SEC’s website at www.sec.gov.
Availability of Quarterly Portfolio Schedule: The Funds’ are required to file complete schedules of portfolio holdings with the SEC for the first and third fiscal quarters on Form N-Q. Once filed, the Funds’ Form N-Q is available without charge upon request on the SEC’s website(http://www.sec.gov) and may be available by calling 1-800-688-LKCM. You can also obtain copies of Form N-Q by (i) visiting the SEC’s Public Reference Room in Washington, DC (information on the operation of the Public Reference Room may be obtained by calling 1-800-SEC-0330); (ii) sending your request and a duplicating fee to the SEC’s Public Reference Room, Washington, DC 20549; or (iii) sending your request electronically to publicinfosec.gov.
RENEWAL OF INVESTMENT ADVISORY AGREEMENT WITH RESPECT TO LKCM FUNDS
Introduction. At a meeting held on February 28, 2012, the Board of Trustees of LKCM Funds, including the independent Trustees (the “Board”), approved the renewal of the Investment Advisory Agreement (the “Agreement”) between Luther King Capital Management Corporation (“LKCM”) and LKCM Funds (the “Trust”), on behalf of the LKCM Small Cap Equity Fund, LKCM Small-Mid Cap Equity Fund, LKCM Equity Fund, LKCM Balanced Fund, and LKCM Fixed Income Fund (each, a “Fund” and collectively, the “Funds”).
In voting to approve the renewal of the Agreement, the Board considered the overall fairness of the Agreement and factors it deemed relevant with respect to each Fund including, but not limited to: (1) the nature, extent and quality of the services provided to each Fund; (2) the performance of each Fund as compared to a relevant benchmark and other similar funds; (3) the level of the fees and the overall expenses of each Fund and how those compared to other similar funds and other institutional accounts; (4) the costs of services provided to the Funds and the profitability of LKCM; and (5) the effect of, as applicable, the growth or decline of fund assets on the advisory fee (i.e., economies of scale) and whether the fee levels reflect economies of scale for the benefit of investors. The Board did not identify any single factor or item of information as all-important or controlling.
In considering the approval of the Agreement, the Board considered a broad range of information provided by LKCM, including but not limited to, reports relating to each Fund’s performance and expenses, information on other clients, certain portfolio compliance policies and the background and experience of the portfolio managers. In addition, the Board considered a memorandum from its legal counsel regarding the Board’s fiduciary duties in considering the renewal of the Agreement. The Board also meets each quarter to review various aspects of the Funds.
Nature, Extent and Quality of Services. The Board reviewed and considered the nature, extent and quality of the advisory services provided by LKCM to each Fund under the Agreement. The Board considered that LKCM has provided investment management services to individuals, foundations, endowments and corporations since 1979 and these long-standing relationships have been responsible for a significant portion of the assets in the Funds. The Board noted LKCM’s representation that its financial condition does not raise concerns that it would be unable to continue to provide the same scope and quality of services to the Funds, or impair its ability to meet its expense cap and reimbursement obligations to the Funds. The Board considered that LKCM has reinvested considerable resources into the firm and its personnel to augment investment management and client service. The Board also reviewed and considered the qualifications of the portfolio managers and other key personnel who provide services to each Fund. LKCM also represented that the firm offers an attractive compensation structure designed to attract and retain highly qualified investment professionals. The Board determined that the portfolio managers at LKCM are well-qualified by education, training and experience to manage the Funds in an efficient and professional manner.
In addition, the Board considered LKCM’s best execution practices. The Board also noted LKCM’s representation that its soft dollar and commission sharing arrangements for client transactions (including those for the Funds) comply with the safe harbor provided by Section 28(e) of the Securities Exchange Act of 1934, as amended.
Performance of the LKCM Funds. The Board considered the performance of each Fund compared to a benchmark index (“Benchmark”) and/or peer group funds compiled by Lipper, Inc. (“Lipper Index”) for various time periods ended December 31, 2011.
The Board considered the performance of the Institutional Class of the Small Cap Equity Fund because the Institutional Class has been in existence for the longest period of time of any other Class and has the longest performance history. The Board noted that the Institutional Class of the Small Cap Equity Fund outperformed its Benchmark and the Lipper Index for all periods presented.
35
The Board noted that the Small-Mid Cap Equity Fund, which had its inception on May 2, 2011, outperformed its Benchmark and the Lipper Index for all periods presented.
The Board noted that the Equity Fund outperformed its Benchmark and the Lipper Index for all periods presented.
The Board noted that the Balanced Fund outperformed its Benchmark for the one-year, five-year, ten-year, and since inception periods, but underperformed the Benchmark for the three-year period. The Board also noted that the Balanced Fund outperformed the Lipper Index for the one-year, five-year, ten-year, and since inception periods, but underperformed the Lipper Index for the three-year period.
The Board noted that the Fixed Income Fund outperformed its Benchmark for the three-year and five-year periods, but underperformed its Benchmark for the one-year, ten-year and since inception periods. The Board also noted that the Fixed Income Fund outperformed the Lipper Index for the one-year, five-year, ten-year, and since inception periods, but underperformed the Lipper Index for the three-year period.
Fees and Expenses. The Board considered the advisory fee rates of each Fund and the total expense ratios of each Fund relative to similar funds and LKCM’s other clients. The Board also considered that LKCM contractually agreed to continue its fee waivers and expense caps for each Fund’s 2012 fiscal year. The Board compared the contractual advisory fee rate and the total expense ratio (after fee waivers and/or expense reimbursements) of each Fund to a category of similar funds compiled by Lipper, Inc. (“Lipper Category”). The first quartile in the Lipper Category represents those funds with the lowest fees or expenses. The Board considered that, although the Funds’ contractual advisory fee rates are generally higher than those of their peers, the expense cap arrangements cause the Funds’ overall total expense ratios to be generally lower than those of their peers. As such, the Trustees gave less weight to the contractual advisory fee rate for each Fund and more weight to each Fund’s total expense ratio.
In this regard, the Board noted that the contractual advisory fee rate and the total expense ratio for the Small Cap Equity Fund’s Institutional Class were both in the second quartile of the Lipper Category. In this case, the advisory fee rate and the total expense ratio were lower than the average of the Lipper Category.
The Board noted that the contractual advisory fee rate and the total expense ratio for the Small-Mid Cap Equity Fund were in the second and first quartiles of the Lipper Category, respectively. In this case, the advisory fee rate and the total expense ratio were lower than the average of the Lipper Category.
The Board noted that the contractual advisory fee rate and the total expense ratio for the Equity Fund were in the third and first quartiles of the Lipper Category, respectively. In this case, the advisory fee rate was higher than the average of the Lipper Category and the total expense ratio was lower than the average of the Lipper Category.
The Board noted that the contractual advisory fee rate and the total expense ratio for the Balanced Fund were in the second and first quartiles of the Lipper Category, respectively. In this case, the advisory fee rate was higher than the average of the Lipper Category and the total expense ratio was lower than the average of the Lipper Category.
The Board noted that the contractual advisory fee rate and the total expense ratio for the Fixed Income Fund were in the third and second quartiles of the Lipper Category, respectively. In this case, the advisory fee rate was higher than the average of the Lipper Category and the total expense ratio was lower than the average of the Lipper Category.
The Board considered the advisory fee rates charged by LKCM to the other mutual funds it subadvises and LKCM’s other separately managed accounts. The Board noted that the fee rates charged by LKCM to the Funds and clients with separately managed accounts differ primarily as a result of the greater compliance costs and other expenses incurred by LKCM in managing the Funds. The Board also noted LKCM’s representation that the subadvisory fee rates it charges these other funds are slightly lower than the advisory fee rates charged to the Funds due to the different obligations that LKCM has serving as subadviser (rather than the investment adviser) to these funds.
Costs, Profitability and Economies of Scale. The Board considered the costs to operate the Funds and the profitability of LKCM. The Board noted LKCM’s representation that it is well capitalized and that its investment philosophy does not require investments in derivatives or other high risk instruments. The Board reviewed the fees paid by each Fund to LKCM for the last three calendar years. The Board also reviewed the profit and loss statement provided by LKCM on a fund-by-fund basis. In this regard, the Board noted that LKCM made a profit on the Small Cap Equity Fund and the Equity Fund, but it did not make a profit of the other Funds.
With respect to economies of scale, the Board considered that net subscriptions and assets in each Fund increased during the last calendar year. In this connection, LKCM indicated that assets are expected to grow given the Funds’ performance and competitive expense structure. The Board noted that, based on the relatively low total expense ratios of the Funds (after fee waivers and expense reimbursements), LKCM believes Fund shareholders currently enjoy substantial economies of scale, which may increase if assets grow.
Conclusion. Based on its evaluation of these and other factors, the Board concluded with respect to each Fund that (1) each Fund was reasonably likely to benefit from the nature, quality and extent of services provided by LKCM; (2) each Fund’s performance was satisfactory in light of all the factors considered by the Board; (3) the profits, where applicable, and fees payable to LKCM were reasonable in the context of all the factors considered by the Board; and (4) the current advisory fee rate structure provides Fund shareholders with reasonable benefits associated with economies of scale. In light of these conclusions, the Board determined, in its business judgment, to renew the Agreement.
36
(This Page Intentionally Left Blank.)
U.S. Bancorp Fund Services, LLC
P.O. Box 701
Milwaukee, WI 53201-0701
LKCM FUNDS
P.O. Box 701
Milwaukee, WI 53201-0701
| | | | |
Officers and Trustees | | | | |
J. Luther King, Jr., CFA | | H. Kirk Downey | | Richard Lenart |
Trustee, | | Chairman of the Board | | Secretary & Treasurer |
President | | | | |
Paul W. Greenwell | | Richard J. Howell | | Jacob D. Smith |
Vice President | | Trustee | | Chief Financial Officer |
| | | | Chief Compliance Officer |
Steven R. Purvis, CFA | | Earle A. Shields, Jr. | | |
Vice President | | Trustee | | |
| | |
Investment Adviser | | | | |
Luther King Capital Management Corporation | | | | |
301 Commerce Street, Suite 1600 | | | | |
Fort Worth, TX 76102 | | | | |
| | |
Administrator, Transfer Agent, Dividend | | | | |
Paying Agent & Shareholder Servicing Agent | | | | |
U.S. Bancorp Fund Services, LLC | | | | |
P.O. Box 701 | | | | |
Milwaukee, WI 53201-0701 | | | | |
| | |
Custodian | | | | |
U.S. Bank, N.A. | | | | |
1555 N. River Center Drive, Suite 302 | | | | |
Milwaukee, WI 53212 | | | | |
| | |
Independent Registered Public Accounting Firm | | | | |
Deloitte & Touche LLP | | | | |
555 E. Wells St., Suite 1400 | | | | |
Milwaukee, WI 53202 | | | | |
| | |
Distributor | | | | |
Quasar Distributors, LLC | | | | |
615 E. Michigan Street | | | | |
Milwaukee, WI 53202 | | | | |