As filed with the Securities and Exchange Commission on September 8, 2009
UNITED STATES
SECURITIES AND EXCHANGE COMMISSION
Washington, D.C. 20549
FORM N-CSR
CERTIFIED SHAREHOLDER REPORT OF REGISTERED
MANAGEMENT INVESTMENT COMPANIES
Investment Company Act file number | 811-08360 |
|
GUINNESS ATKINSON FUNDS |
(Exact name of registrant as specified in charter) |
|
21550 Oxnard Street, Suite 750, Woodland Hills, CA | | 91367 |
(Address of principal executive offices) | | (Zip code) |
|
James J. Atkinson, Jr. 21550 Oxnard Street, Suite 750, Woodland Hills, CA 91367 |
(Name and address of agent for service) |
|
Registrant’s telephone number, including area code: | (800) 915-6566 | |
|
Date of fiscal year end: | December 31 | |
|
Date of reporting period: | June 30, 2009 | |
| | | | | | | | |
Item 1. Reports to Stockholders.
Guinness Atkinson Funds
Semi-Annual Report
June 30, 2009
TABLE OF CONTENTS
| | 3 | | | Letter to Shareholders | |
|
| | 6 | | | Expense Example | |
|
| | 7 | | | Alternative Energy Fund | |
|
| | 13 | | | Asia Focus Fund | |
|
| | 20 | | | Asia Pacific Dividend Fund | |
|
| | 26 | | | China & Hong Kong Fund | |
|
| | 33 | | | Global Energy Fund | |
|
| | 39 | | | Global Innovators Fund | |
|
| | 45 | | | Statements of Assets and Liabilities | |
|
| | 47 | | | Statements of Operations | |
|
| | 49 | | | Statements of Changes in Net Assets | |
|
| | 51 | | | Financial Highlights | |
|
| | 57 | | | Notes to Financial Statements | |
|
| | 68 | | | Additional Information | |
|
| | 71 | | | Privacy Notice | |
|
| | 75 | | | Guinness Atkinson Funds Information | |
|
2
Dear Guinness Atkinson Funds Shareholders,
We're still optimists. In the previous two shareholder letters (December 31, 2008 annual report and June 30, 2008 semi-annual report) we noted that we were looking optimistically toward the future. That doesn't mean we weren't experiencing shock and awe at the performance of the global financial markets. In fact, we used the word "dismal" in describing the returns for the six Guinness Atkinson Funds for calendar year 2008. (Some may think dismal is an understatement, and we wouldn't argue that point.) Notwithstanding our optimism, we are a bit surprised at the magnitude of the market recovery to date and the year to date performance of each of the Guinness Atkinson Funds. But, as readers of our previous letters will remember, our optimism is more structural and based on longer term fundamentals than the recent, albeit impressive, market rally might suggest.
While we don't mean to imply that the recent past wasn't – and possibly the near term won't be – painful, we continue to believe in a rapidly changing global landscape that will continue to improve the lives of billions of people over the coming decades. Technology and innovation, the continued growth of Asia, China and other developing countries, and the transition from increasingly expensive fossil fuels to clean alternative energy sources are some of the global themes that drive our thinking and, incidentally, the Guinness Atkinson Fund family. We're cognizant of the negatives and potential threats to our future, but we're also mindful that the loudest of voices tend to be associated with a more negative view. Many, if not all, of the cataclysmic predictions from the past have simply been swept aside in the march of progress. The threat of communism, the cold war, nuclear war, global freezing, over population/Malthusian disaster , and a host of other worries long forgotten have given way to generally (much) higher standards of living and higher quality of life for most of the world. In our view, we will continue to make progress but at an increasingly rapid rate. This isn't to say that we're without serious issues or that life doesn't remain harsh for a very large number. Rather, it is a recognition that the world and the human condition have progressed dramatically over the last, say, 50 years and that, in our view, the best is yet to come.
We make these points because it is so very easy to get caught up in the difficulties of the moment and to forget the big picture. There is also a tendency to extrapolate our personal experience onto the rest of the planet. The U.S. represents approximately 5% of the world's population and while we really made a mess of our own economy and triggered a global slowdown, the rest of the world isn't going to wait for us to get our act together. In particular, China, whose economy was thought to be doomed along with the decline in the U.S. consumer, looks like it will experience economic growth of around 8% for the year. In short, the immediate view out one's window may not be representative of the view from a similar window in, say, Shanghai.
Fund Performance
A number of milestones were achieved at the end of the period. The China & Hong Kong Fund marked its 15th anniversary on June 30, 2009. Despite at least two major periods of decline over the last 15 years the Fund has a lifetime total return of 7.54%. The Global Energy Fund celebrated its five year anniversary on June 30 as well, and it did so in fine fashion as the number one fund in the Morningstar equity energy category (out of 40 funds) over its five year life, based on total returns. (Note, it was number 5 of 71 for the one year period, and number 10 of 65 for the three year period).
In looking at these performance figures it is remarkable to note the magnitude of the 2009 year-to-date returns juxtaposed against the 12 month returns. The fact that the rather impressive year-to-date returns have not been sufficient to keep the one year returns from looking dismal is testament to the magnitude of the decline in global equity markets. These last 12 to 18 months have been among the most interesting of our careers. As usual, we continue to look forward with interest, and as we've indicated, optimism.
3
Below are performance figures for each of the six Guinness Atkinson Funds through June 30, 2009.
| Fund (inception date) | | Year-to-Date
June 30, 2009 | | 1-year | | 3-year | | 5-year | | 10-year | | From Inception | | Expense Ratio | |
| Alternative Energy Fund (March 31, 2006) | | | 20.04 | % | | | -51.83 | % | | | -15.79 | % | | | N/A | | | | N/A | | | | -17.58 | % | | | 1.69 | % | |
| Asia Focus Fund (April 29, 1996) | | | 45.27 | % | | | -27.63 | % | | | 3.49 | % | | | 11.84 | % | | | 6.20 | % | | | 1.78 | % | | | 1.75 | % | |
| Asia Pacific Dividend Fund (March 31, 2006) | | | 34.29 | % | | | -32.44 | % | | | -0.77 | % | | | N/A | | | | N/A | | | | -3.02 | % | | | 2.33% gross;
2.10% net | | |
| China & Hong Kong Fund (June 30, 1994) | | | 39.88 | % | | | -19.65 | % | | | 9.45 | % | | | 12.84 | % | | | 8.69 | % | | | 7.64 | % | | | 1.53 | % | |
| Global Energy Fund (June 30, 2004) | | | 30.99 | % | | | -42.89 | % | | | -3.60 | % | | | 15.23 | % | | | N/A | | | | 15.23 | % | | | 1.31 | % | |
| Global Innovators Fund (December 15, 1998) | | | 16.15 | % | | | -23.90 | % | | | -4.72 | % | | | 1.89 | % | | | -1.73 | % | | | 1.56 | % | | | 1.40 | % | |
Periods of greater than one year are average annualized returns; one year or less are actual returns. All returns are for the periods ending June 30, 2009.
All of the Guinness Atkinson Funds have an expense cap in place and the advisor is contractually obligated to cap the total expenses at least through June 30, 2010.
Performance data quoted represents past performance and does not guarantee future results. The investment return and principal value of an investment will fluctuate so that an investor's shares, when redeemed, may be worth more or less than the original cost. Current performance of the Funds may be lower or higher than the performance quoted. Performance data current to the most recent month end may be obtained by visiting www.gafunds.com.
Expense ratios are from the most recent prospectus (dated May 1, 2009) and are from the most recent audited financials (period ending December 31, 2008).
As usual, our portfolio managers provide commentary for each of the six Guinness Atkinson Funds adjacent to each Fund's financial report, and Morningstar rankings data can be found immediately after this letter.
It is fair to say that this last year has been among the most trying of our careers and we would be remiss if we didn't offer our thanks to the very many Guinness Atkinson Funds shareholders that stayed the course or have had the foresight to join us in recent months. We haven't forgotten for one second that the decline over the last year meant the decline in real wealth for Fund investors. And we haven't forgotten how bleak things looked just a few months ago. The commitment to long term investing requires just that and we recognize that you've chosen to make a commitment to the Guinness Atkinson Funds. We appreciate the opportunity to continue to serve you.
Sincerely,


Timothy Guinness James Atkinson
4
Below is a table listing the Morningstar star ratings for each of the six Guinness Atkinson Funds as of June 30, 2009. Parenthetical numbers after the star rating indicate the number of funds in the comparison group.
| Fund | | Category | | Overall | | 3-year | | 5-year | | 10-year | |
Alternative Energy
Fund | | Equity Energy | | 1*
(65 funds) | | 1*
(65 funds) | | N/A | | N/A | |
Asia Focus
Fund | | Pacific/Asia
Ex-Japan Stk | | 2**
(105 funds) | | 2**
(105 funds) | | 2**
(79 funds) | | 1*
(65 funds) | |
Asia Pacific Dividend
Fund | | Pacific/Asia
Ex-Japan Stk | | 2**
(105 funds) | | 2**
(105 funds) | | N/A | | N/A | |
China & Hong Kong
Fund | | Pacific/Asia
Ex-Japan Stk | | 3***
(105 funds) | | 3***
(105 funds) | | 2**
(79 funds) | | 3***
(65 funds) | |
Global Energy
Fund | | Equity Energy | | 4****
(65 funds) | | 3***
(65 funds) | | 4****
(40 funds) | | N/A | |
Global Innovators
Fund | | Large Growth | | 3***
(1,565 funds) | | 3***
(1,565 funds) | | 4****
(1,294 funds) | | 2**
(663 funds) | |
©2009 Morningstar, Inc. All Rights Reserved. The information contained herein: (1) is proprietary to Morningstar and/or its content providers; (2) may not be copied or distributed; and (3) is not warranted to be accurate, complete or timely. Neither Morningstar nor its content providers are responsible for any damages or losses arising from any use of this information. Past performance is no guarantee of future results.
The Funds invest in foreign securities which involves greater volatility and political, economic and currency risks and differences in accounting methods. The Funds are non-diversified meaning their assets may be concentrated in fewer individual holdings than diversified funds. Therefore, the Funds are more exposed to individual stock volatility than diversified funds. The Funds invest in smaller companies, which will involve additional risks such as limited liquidity and greater volatility.
Morningstar Rankings represent a fund's total-return rank relative to all funds that have the same Morningstar Category. The highest rank is 1 and the lowest is based on the total number of funds ranked in the category. It is based on Morningstar total return, which includes both income and capital gains or losses and is not adjusted for sales charges or redemption fees.
For each fund with at least a three-year history, Morningstar calculates a Morningstar RatingTM based on a Morningstar Risk-Adjusted Return measure that accounts for variation in a fund's monthly performance (including the effects of sales charges, loads, and redemption fees), placing more emphasis on downward variations and rewarding consistent performance. The top 10% of funds in each category receive 5 stars, the next 22.5% receive 4 stars the next 35% receive 3 stars, the next 22.5% receive 2 stars and the bottom 10% receive 1 star. (Each share class is counted as a fraction of one fund within this scale and rated separately, which may cause slight variations in distribution percentages.)
5
GUINNESS ATKINSON FUNDS
Expense Examples (Unaudited)
As a shareholder of the Funds, you incur two types of costs: (1) redemption fees; and (2) ongoing costs, including advisory fees; and other Fund expenses. The examples below are intended to help you understand your ongoing costs (in dollars) of investing in the Funds and to compare these costs with the ongoing costs of investing in other mutual funds.
The examples are based on an investment of $1,000 invested at the beginning of the period shown and held for the entire period from January 1, 2009 to June 30, 2009.
Actual Expenses
For each Fund, the first line of the table below provides information about actual account values and actual expenses. You may use the information in this line, together with the amount you invested, to estimate the expenses that you paid over the period. Simply divide your account value by $1,000 (for example, an $8,600 account value divided by $1,000 = 8.6), then multiply the result by the number in the first line under the heading entitled "Expenses Paid During Period" to estimate the expenses you paid on your account during this period.
Hypothetical Example for Comparison Purposes
For each Fund, the second line of the table below provides information about hypothetical account values and hypothetical expenses based on the Fund's actual expense ratio and an assumed rate of return of 5% per year before expenses, which is not the Fund's actual return. The hypothetical account values and expenses may not be used to estimate the actual ending account balance or expenses you paid for the period. You may use this information to compare the ongoing costs of investing in the Fund and other funds. To do so, compare this 5% hypothetical example with the 5% hypothetical examples that appear in the shareholder reports of the other funds.
Please note that the expenses shown in the table are meant to highlight your ongoing costs only and do not reflect any redemption fees. Therefore, the second line for each Fund of the table is useful in comparing ongoing costs only, and will not help you determine the relative total costs of owning different funds. In addition, if these redemption fees were included, your costs would have been higher.
| | | Beginning
Account
Value
(01/01/09) | | Ending
Account
Value
(06/30/09) | | Expenses Paid
During Period*
(01/01/09 to
06/30/09) | | Expense Ratio
During Period*
(01/01/09 to
06/30/09) | |
| Guinness Atkinson Alternative Energy Fund Actual | | $ | 1,000.00 | | | $ | 1,200.40 | | | $ | 10.53 | | | | 1.93 | % | |
Guinness Atkinson Alternative Energy Fund Hypothetical
(5% return before expenses) | | $ | 1,000.00 | | | $ | 1,015.22 | | | $ | 9.64 | | | | 1.93 | % | |
| Guinness Atkinson Asia Focus Fund Actual | | $ | 1,000.00 | | | $ | 1,452.70 | | | $ | 12.03 | | | | 1.98 | %+ | |
Guinness Atkinson Asia Focus Fund Hypothetical
(5% return before expenses) | | $ | 1,000.00 | | | $ | 1,014.99 | | | $ | 9.88 | | | | 1.98 | %+ | |
| Guinness Atkinson Asia Pacific Dividend Fund Actual | | $ | 1,000.00 | | | $ | 1,342.90 | | | $ | 11.51 | | | | 1.98 | %+ | |
Guinness Atkinson Asia Pacific Dividend Fund Hypothetical
(5% return before expenses) | | $ | 1,000.00 | | | $ | 1,014.97 | | | $ | 9.90 | | | | 1.98 | %+ | |
| Guinness Atkinson China & Hong Kong Fund Actual | | $ | 1,000.00 | | | $ | 1,398.80 | | | $ | 9.61 | | | | 1.62 | % | |
Guinness Atkinson China & Hong Kong Fund Hypothetical
(5% return before expenses) | | $ | 1,000.00 | | | $ | 1,016.78 | | | $ | 8.08 | | | | 1.62 | % | |
| Guinness Atkinson Global Energy Fund Actual | | $ | 1,000.00 | | | $ | 1,309.90 | | | $ | 8.31 | | | | 1.45 | %+ | |
Guinness Atkinson Global Energy Fund Hypothetical
(5% return before expenses) | | $ | 1,000.00 | | | $ | 1,017.61 | | | $ | 7.26 | | | | 1.45 | %+ | |
| Guinness Atkinson Global Innovators Fund Actual | | $ | 1,000.00 | | | $ | 1,161.50 | | | $ | 8.31 | | | | 1.55 | %+ | |
Guinness Atkinson Global Innovators Fund Hypothetical
(5% return before expenses) | | $ | 1,000.00 | | | $ | 1,017.11 | | | $ | 7.75 | | | | 1.55 | %+ | |
*Expenses are equal to the Funds' annualized expense ratio as indicated, multiplied by the average account value over the period, multiplied by the number of days in most recent fiscal half-year period (181), then divided by the number of days in the fiscal year (365) (to reflect the one-half year period).
†Net of fee waivers and/or expense reimbursements. If those fee waivers and/or expense reimbursements had not been in effect, the Fund's actual expenses would have been higher.
6
ALTERNATIVE ENERGY FUND for the period ended June 30, 2009
1. Performance
AVERAGE ANNUALIZED TOTAL RETURNS
| | | 6 Months
(Actual) | | 1 Year
(Actual) | | 3 Years | | Since
Inception
March 31, 2006 | |
| Fund | | | 20.04 | % | | | -51.83 | % | | | -15.79 | % | | | -17.58 | % | |
| Benchmark Indices: | |
| Wilderhill New Energy Global Innovation Index (NEX) | | | 24.76 | % | | | -43.84 | % | | | -4.21 | % | | | -5.14 | % | |
| Wilderhill Clean Energy Index (ECO) | | | 17.55 | % | | | -49.96 | % | | | -20.08 | % | | | -21.57 | % | |
| MSCI World Index | | | 6.58 | % | | | -29.95 | % | | | -7.53 | % | | | -7.06 | % | |
The Fund's gross expense ratio is 1.69% per the Prospectus dated May 1, 2009. Guinness Atkinson Asset Management has contractually agreed to waive a portion of its advisory fees so that the Fund's ratio of expenses to average daily net assets will not exceed 1.98% through at least June 30, 2010. To the extent that the Advisor waives fees it may seek repayment of a portion or all of such amounts that any time within three fiscal years after the fiscal year in which such amounts were waived, subject to the applicable cap.
Performance data quoted represents past performance and does not guarantee future results. The investment return and principal value of an investment will fluctuate so that an investor's shares, when redeemed, may be worth more or less than their original cost. Current performance of the Fund may be lower or higher than the performance quoted. Performance data current to the most recent month end may be obtained by visiting www.gafunds.com, or calling (800) 916-6566.
The Fund imposes a 2% redemption fee on shares held less than 30 days. Performance data quoted does not reflect the 2% redemption fee on shares held less than 30 days. Total returns reflect a fee waiver in effect and in the absence of this waiver, the total returns would be lower.
The Guinness Atkinson Alternative Energy Fund was up 20.04% for the first half of 2009. This compared to a rise in the Wilderhill New Energy Global Innovation Index of 24.76% and in the Wilderhill Clean Energy Index of 17.55%. The sector's performance compares well to the MSCI World Index's total return of 6.58%. After the disappointing second half of 2008, stocks have recovered from their lows, but remain at depressed levels.
2. Activity
The fund's main exposure was to solar and wind for the first half of 2009. We had moved the fund to gain additional exposure to the low cost Asian solar manufacturers in 2008, which has worked well. As polysilicon prices have fallen dramatically, the cost advantage of the Asian solar manufacturers has lead to stock outperformance. At the same time a number of the European solar companies we held have struggled with the dramatic declines in ASPs. We have sold our holdings in some of the smaller European solar players – Solar-Fabrik, Solar Millennium and Solaria, and sold our research holding in thin film new entrant Daystar. We have acquired a holding in PV Crystalox, a long standing undervalued polysilicon wafer manufacturer.
Our wind holdings have also performed well, with both turbine manufacturer and wind farm developer holdings doing well. There has been a marked underperformance by the second tier (by market capitalisation) players in the sector and we believe that consolidation in the sector will provide a good uplift to valuations. We have already seen this with the Transalta bid for Canadian Hydro.
The fund has further exposure to hydro electricity, geothermal power and efficiency stocks. We have small exposure to biomass and none to biofuels. We do not believe there are attractive investment opportunities in biofuels today, due to high feedstock prices and less government support for the industry, which has significantly reduced biofuel refining margins and are out of the control of management. We have no exposure to fuelcells, wave or tidal technologies as we do not believe these industries will reach profitability in the next few years.
7
ALTERNATIVE ENERGY FUND
3. Outlook
With the bounce back in share prices from March 2009 onwards, alternative energy stocks have moved well above their lows, but still remain a long way from the prices seen in 2007 and 2008. Reported financials for the first two quarters of 2009 have been much lower than expected for many companies in the industry. We think the outlook is, if anything, stronger than ever. We believe that the majority of companies in the sector have strong balance sheets and have reacted sensibly to the current economic conditions, reducing capital expenditure plans and trimming costs. From an investment point of view what is most exciting is that we are now moving back into a growth phase. Q2 2009 appears to have marked a lowpoint in orders and we believe that a combination of lower prices, availability of debt financing and governments starting to provide the promised subsidies are creating a good platform for several years of strong growth.
On the solar side, we expect polysilicon module prices will have fallen by around 50% from $3.60 per Watt peak to $1.80 per Watt peak at the end of 2009, and we believe this is now beginning to feed through into much higher IRRs for project investors. While for most industries a halving in price would be disastrous, for the solar value chain, most of the reduction in module prices has been matched by reductions in spot polysilicon prices (the key raw material) from over $400/kg to around $65/kg. We think lower prices should create higher demand that more than offsets the short term impact of lower prices on company P&Ls.
Wind investors have seen a slower impact, with some price reductions for turbines but not nearly as dramatic a change as in the solar sector. We attribute this to the longer lead times and contracts in the wind sector. However, prices have fallen somewhat and financing is reportedly now available for good quality sites, so we believe we will see a resurgence of orders which will allow the turbine manufacturers to keep increasing volumes at 20% plus per annum.
For the hydroelectric generators, electricity prices have fallen, but longterm power purchase agreements (PPAs) provide much insulation from that, and with expectations of increased wind and solar power being added, high quality base load power as provided by hydro remains an important part of the generation mix. Similarly the geothermal area is beginning to receive more attention as the only other low cost, proven technology source of baseload power.
Areas we are monitoring carefully for future investments include hybrid vehicles, efficiency and some of the vertically interested and second generation biofuels plays.
The fund managers see the combination of low valuations caused by the fall in the broad markets and the improving growth outlook of the sector as energy prices rise create a highly compelling investment opportunity. We believe the fund is positioned to capture the returns from long term growth of the alternative energy sector.

Tim Guinness

Edward Guinness

Matthew Page July 2009
The Fund invests in foreign securities which will involve political, economic and currency risks, greater volatility, and differences in accounting methods. The Fund is non-diversified meaning its assets may be concentrated in fewer individual holdings than diversified funds. Therefore, the Fund is more exposed to individual stock volatility than diversified funds. The Fund invests in smaller companies, which will involve additional risks such as limited liquidity and greater volatility.
8
The Wilderhill New Energy Global Innovation Index (NEX) is a modified dollar weighted index of publicly traded companies, which are active in renewable and low-carbon energy, and which stand to benefit from responses to climate change and energy security concern. The Wilderhill Clean Energy Index (ECO) is a modified equal dollar weighted index comprised of publicly traded companies whose businesses stand to benefit substantially from societal transition toward the use of cleaner energy and conservation. The MSCI World Index is a free float-adjusted market capitalization weighted index that is designed to measure the equity market performance of developed markets. These indices are unmanaged, not available for investment and do not incur expenses.
Please refer to the Schedule of Investments for details on fund holdings. Current and future portfolio holdings are subject to risk.
The information provided herein represents the opinion of Guinness Atkinson Management for the period stated and is not intended to be a forecast of future events, a guarantee of future results, nor investment advice. Opinions, fund holdings and sector allocations are subject to change at any time and are not recommendations to buy or sell any security.
9
FUND HIGHLIGHTS at June 30, 2009 (Unaudited)
GUINNESS ATKINSON ALTERNATIVE ENERGY FUND
| # of Holdings in Portfolio: | | | 46 | | |
| Portfolio Turnover: | | | 8.8 | % | |
| % of Stocks in Top 10: | | | 35.3 | % | |
| Fund Managers: | |
| Timothy W.N. Guinness | | | | | |
| Edward Guinness | | | | | |
| Matthew Page | | | | | |
| Top 10 Holdings (% of net assets) | | | | Sector Breakdown (% of Investments) | | | |
| JA Solar Holdings Co. Ltd. | | | 3.8 | % | | Solar | | | 42.5 | % | |
| Hansen Transmissions International | | | 3.7 | % | | Wind | | | 29.6 | % | |
| EDF Energies Nouvelles SA | | | 3.6 | % | | Hydro | | | 8.4 | % | |
| Wacker Chemie AG | | | 3.6 | % | | Efficiency | | | 7.3 | % | |
| Suntech Power Holdings Co. Ltd. | | | 3.6 | % | | Geothermal | | | 6.8 | % | |
| Verbund - O E AG | | | 3.5 | % | | Biomass Energy | | | 5.2 | % | |
| EDP Renovaveis SA | | | 3.4 | % | | Biofuel | | | 0.2 | % | |
| Novera Energy PLC | | | 3.4 | % | | | | | | | |
| SMA Solar Technology AG | | | 3.4 | % | | | | | | | |
| Vestas Wind Systems A/S | | | 3.3 | % | | | | | | | |
| Country Breakdown (% of net assets) | | | | | |
| United States | | | 22.2 | % | | Australia | | | 3.8 | % | |
| Germany | | | 12.6 | % | | Belgium | | | 3.7 | % | |
| China | | | 11.9 | % | | Austria | | | 3.5 | % | |
| France | | | 6.3 | % | | Portugal | | | 3.4 | % | |
| Spain | | | 6.1 | % | | Philippines | | | 3.0 | % | |
| Canada | | | 5.6 | % | | Brazil | | | 2.9 | % | |
| Denmark | | | 5.4 | % | | Norway | | | 2.7 | % | |
| Britain | | | 4.5 | % | | | | | | | |
10
SCHEDULE OF INVESTMENTS
June 30, 2009 (Unaudited)
GUINNESS ATKINSON FUNDS - ALTERNATIVE ENERGY FUND
| Shares | | COMMON STOCKS: 97.0% | | Value | |
| Biofuel: 0.2% | | | |
| | 25,000 | | | Futurefuel Corporation(b)(c) | | $ | 140,000 | | |
| Biomass Energy: 5.0% | | | |
| | 151,587 | | | Boralex, Inc.(a) | | | 1,042,596 | | |
| | 2,845,155 | | | Novera Energy PLC(a) | | | 2,156,228 | | |
| | | | 3,198,824 | | |
| Efficiency: 7.2% | | | |
| | 146,000 | | | Applied Intellectual Capital(a)(c) | | | — | | |
| | 760,987 | | | Carmanah Technologies Corporation(a)(b) | | | 549,567 | | |
| | 207,448 | | | Echelon Corporation(a) | | | 1,759,159 | | |
| | 4,445,888 | | | Thermal Energy International(a)(b) | | | 267,560 | | |
| | 488,561 | | | VRB Power Systems, Inc.(a)(c) | | | — | | |
| | 1,200,000 | | | VRB Power Systems, Inc. (Acquired August 7, 2007, cost $432,822)(a)(c)(d) | | | — | | |
| | 84,200 | | | WFI Industries Ltd. | | | 1,987,095 | | |
| | | | 4,563,381 | | |
| Geothermal: 6.7% | | | |
| | 351,369 | | | Geodynamics Ltd.(a) | | | 244,851 | | |
| | 52,119 | | | Ormat Technologies, Inc. | | | 2,100,917 | | |
| | 23,260,000 | | | PNOC Energy Development Corporation | | | 1,902,359 | | |
| | | | 4,248,127 | | |
| Hydro: 8.3% | | | |
| | 361,000 | | | Canadian Hydro Developers, Inc.(a) | | | 1,157,658 | | |
| | 137,558 | | | Cia Energetica de Minas Gerais - ADR | | | 1,848,780 | | |
| | 43,900 | | | Verbund - O E AG | | | 2,239,539 | | |
| | | | 5,245,977 | | |
| Solar: 40.8% | | | |
| | 11,000 | | | First Solar, Inc.(a) | | | 1,783,320 | | |
| | 521,800 | | | JA Solar Holdings Co., Ltd. - ADR(a) | | | 2,452,460 | | |
| | 113,100 | | | LDK Solar Co., Ltd. - ADR(a) | | | 1,275,768 | | |
| | 108,280 | | | MEMC Electronic Materials, Inc.(a) | | | 1,928,467 | | |
| | 1,504,001 | | | PV Crystalox Solar PLC | | | 2,058,772 | | |
| | 80,660 | | | Q-Cells AG | | | 1,649,244 | | |
| | 275,900 | | | Renesola, Ltd. - ADR(a) | | | 1,553,317 | | |
| | 191,090 | | | Renewable Energy Corporation AS(a) | | | 1,492,085 | | |
| | 65,893 | | | Renewable Energy Corporation AS-Rights(a) | | | 235,693 | | |
| | 28,790 | | | SMA Solar Technology AG | | | 2,136,453 | | |
| | 572,000 | | | Solar Integrated Technologies(a)(b) | | | 68,106 | | |
| | 65,854 | | | Solarworld AG | | | 1,558,510 | | |
| | 71,620 | | | SunPower Corporation(a) | | | 1,715,299 | | |
| | 126,911 | | | Suntech Power Holdings Co., Ltd. - ADR(a) | | | 2,266,630 | | |
| | 61,400 | | | Trina Solar, Ltd. - ADR(a) | | | 1,573,682 | | |
| | 19,650 | | | Wacker Chemie AG | | | 2,269,178 | | |
| | | | 26,016,984 | | |
The accompanying notes are in integral part of these financial statements.
11
| Shares | | COMMON STOCKS: 97.0% Continued | | Value | |
| Wind: 28.8% | | | |
| | 416,367 | | | Clipper Windpower PLC(a) | | $ | 823,415 | | |
| | 3,699,900 | | | Composite Technology Corporation(a) | | | 1,109,970 | | |
| | 46,620 | | | EDF Energies Nouvelles SA | | | 2,321,005 | | |
| | 210,700 | | | EDP Renovaveis SA(a) | | | 2,161,547 | | |
| | 99,782 | | | Gamesa Corporation Tecnologica SA | | | 1,902,349 | | |
| | 312,900 | | | Greentech Energy Systems(a) | | | 1,342,057 | | |
| | 936,500 | | | Hansen Transmissions International(a) | | | 2,382,872 | | |
| | 427,400 | | | Iberdrola Renovables(a) | | | 1,959,422 | | |
| | 166,980 | | | Innergex Renewable Energy, Inc.(a)(b) | | | 552,700 | | |
| | 392,347 | | | Theolia SA(a) | | | 1,723,726 | | |
| | 29,415 | | | Vestas Wind Systems A/S(a) | | | 2,110,956 | | |
| | | | 18,390,019 | | |
| | | | | Total Common Stocks
(cost $94,628,365) | | | 61,803,312 | | |
| Warrants: 0.0% | | | |
| | 25,000 | | | Futurefuel Corporation(a)(c) | | | — | | |
| | 87,842 | | | Geodynamics Ltd.(a) | | | 4,247 | | |
| | | | | Total Warrants
(cost $30,750) | | | 4,247 | | |
| Convertible Bonds: 0.6% | | | |
| | 277,500 | | | SAG Solarstrom AG(a)(b)(c) | | | 389,291 | | |
| | | | | Total Convertible Bonds
(cost $382,326) | | | 389,291 | | |
| | | | | Total Investments
(cost $95,041,441): 97.6% | | | 62,196,850 | | |
| | | | | Other Assets less Liabilities: 2.4% | | | 1,557,313 | | |
| | | | | Net Assets: 100% | | $ | 63,754,163 | | |
Percentages stated as a percentage of net assets.
Abbreviations:
ADR: American Depository Receipts
Footnotes:
(a) Non-income producing security.
(b) Illiquid. Illiquid securities represents $1,967,224 or 3.1% of net assets.
(c) Fair valued under direction of the Board of Trustees. Fair valued securities represents $529,291 or 0.8% of net assets.
(d) Restricted Security. See also Note 2 of the Notes to Financial Statements.
The accompanying notes are in integral part of these financial statements.
12
ASIA FOCUS FUND for the period ended June 30, 2009
1. Performance
AVERAGE ANNUALIZED TOTAL RETURNS
| | | 6 Months
(Actual) | | 1 Year
(Actual) | | 3 Years | | 5 Years | | 10 Years | |
| Fund | | | 45.27 | % | | | -27.63 | % | | | 3.49 | % | | | 11.84 | % | | | 6.20 | % | |
| Benchmark Index: | |
| MSCI AC Far East Free Ex Japan | | | 33.04 | % | | | -19.30 | % | | | 10.72 | % | | | 11.30 | % | | | 1.85 | % | |
| S&P 500 | | | 3.19 | % | | | -26.20 | % | | | -8.21 | % | | | -2.24 | % | | | -2.22 | % | |
The Fund's gross expense ratio is 1.75% per the Prospectus dated May 1, 2009. Guinness Atkinson Asset Management has contractually agreed to waive a portion of its advisory fees so that the Fund's ratio of expenses to average daily net assets will not exceed 1.98% through at least June 30, 2010. To the extent that the Advisor waives fees it may seek repayment of a portion or all of such amounts that any time within three fiscal years after the fiscal year in which such amounts were waived, subject to the applicable cap.
Performance data quoted represents past performance and does not guarantee future results. The investment return and principal value of an investment will fluctuate so that an investor's shares, when redeemed, may be worth more or less than their original cost. Current performance of the Fund may be lower or higher than the performance quoted. Performance data current to the most recent month end may be obtained by visiting www.gafunds.com, or calling (800) 916-6566.
The Fund imposes a 2% redemption fee on shares held less than 30 days. Performance data quoted does not reflect the 2% redemption fee on shares held less than 30 days. Total returns reflect a fee waiver in effect and in the absence of this waiver, the total returns would be lower.
The year began tentatively for global stock markets after the shock of Lehman Brothers' 2008 collapse continued to reverberate through the global financial system. Stock markets began to pick up in March as belief grew that co-ordinated government and central bank action in providing economic stimulus, extra liquidity and asset guarantees was proving effective in stabilizing the financial system.
Extra impetus came along with news that industrial production had begun to grow again. In the last quarter of 2008 the world economy almost ground to a halt as companies were forced to cut output as demand, and the availability of credit, all but disappeared. By the end of the first quarter of 2009 inventories of materials, components and finished goods had run down to historically low levels prompting a jump in output. This is the so-called 'inventory adjustment'. The question for governments, central bankers and investors is whether or not this inventory adjustment will be followed by growth in final demand to sustain a recovery.
We believe Asian stock markets have performed very strongly this year, which in part reflects the degree to which they were hit last year and the changing perceptions toward emerging markets compared to developed markets and compared to their own history. In our view, over the last ten years since the 1998 Asian financial crisis and currency crises in Mexico and Argentina, emerging markets have changed from being heavily indebted, economically unstable and often in need of financial support from the developed world. We think that for the last ten years, emerging markets have become net lenders in the global economy providing the fuel for the credit explosion of the last ten years. Much of this net lending to the US and Europe has come from Asia and we see this reflected in the growth in foreign exchange reserves across the region.
We believe blame can be assigned to the Asian region for relying on exports and making insufficient effort to boost domestic consumption; so too, blame can be laid at the door of Western banks and consumers who didn't know when to stop borrowing: it takes two sides to create an imbalance. But out of all this, we think a clear picture is emerging of an Asian region that looks better than its Western counterparts on nearly every economic measure.
National external and fiscal accounts were mostly in surplus leading into the crisis allowing stimulus packages to be implemented without recourse to ballooning debt. There was no real estate bubble in Asia and the banking system had adequate capital, modest non-performing assets and local banks, with a very few exceptions, had little exposure to 'toxic' assets (although 19 Hong Kong
13
ASIA FOCUS FUND
banks sold Lehman mini-bonds for which they must compensate investors) with the result that no Asian banks have required a government bailout or guarantee.
A final point is that across Asia (though less so in China) investment growth has been restrained. Memories of the Asian crisis are painful and still fresh. Companies have therefore been more cautious about taking on debt and have concentrated less on expansion and more on profitability which has been accompanied by rising returns on investment.
The picture just given appears a rosy one and there is no doubt that Asia has many issues to address to be sure of sustained growth over the medium or long term. In our view, right now, it is sufficient to support and justify the recovery of stock markets so far, which might otherwise be attributable to speculation. China has led the region as the size and scope of its economic stimulus far outweighs the rest. Chinese demand for raw materials and fuel has driven energy, resources, shipping and steel companies with the effects being felt globally. There has also been strong performance in countries such as Indonesia, the Philippines and Thailand which have smaller export sectors and are therefore less exposed to the global downturn. Banking stocks in Asia, which account for a large proportion of the region's market capitalization, have moved in line with the broad market but have yet to take up market leadership while consumer activity is sti ll moderate.
2. Portfolio Position
The portfolio is positioned to benefit from the current recovery in domestic economic growth in Asia which requires fuel, resources and industrial materials. This has led the fund to be overweight in these sectors in particular. The portfolio also has exposure to mobile telephony which we believe is a staple consumer proxy and the fund has increased exposure to the auto sector both to car makers and to component suppliers.
We believe that it is still early days for the stimulus efforts to translate into a full-blooded consumer recovery and this view is supported by bank lending growth across Asia which, with the exception of China, has been rising only modestly. For this reason we have maintained an under-weight position in banking stocks.
Technology too is an area where we have been cautiously adding. For some consumer-related companies there appear to be opportunities opening up, in smart-phones and consumer notebook computers. For those that are more exposed to technology commodity related products such as memory or those reliant on a recovery in corporate spending then visibility is poor and it is our view that current valuations are based more on hope than expectation.
3. Outlook
We think that in the very short term Asia's stable economic condition should be enough to attract and retain investors. Stimulus packages in the region are generating increased domestic activity as seen in China in particular and helping to offset the impact on manufacturing caused by contraction in exports. However, stimulus packages cannot be sustained indefinitely and an export boom does not appear likely any time soon, Asia needs to find some other growth driver.
The challenge for the region is to unlock the savings that have built up after years of surpluses and high savings rates because without this consumer growth will remain depressed. The problem is not such a bad one when we consider that in Asia they just need to mobilize savings while the problem in the US is that consumers now need to build them up. Incentives are being put into place, the most important of which is the appreciation of the need for a welfare safety net to reduce the need for precautionary savings, especially for health.
We believe that in China there are good grounds for optimism given recent signs of increased real estate construction and higher transaction volumes. There has also been stronger than expected growth in car sales especially those with smaller, more efficient engines. More steel production capacity is coming back on line in China, Korea and Taiwan and steel prices for both higher end and construction-related products are likely to rise further.
We believe that these early signs may lead to increased consumer spending in coming months and we note that consumer discretionary companies still appear cheaper than the broad market which suggests further opportunity. The technology sector still remains highly uncertain. Analysts have cut their profit forecasts for this year while leaving those for 2010 largely unchanged resulting in high forecast growth but with low confidence, we believe.
14
In sum, we believe that recent stock market performance can be justified by a better relative economic position. Export manufacturing is likely to remain under pressure for some time yet placing the onus squarely on domestic activity to drive growth. We believe that there are reasonable grounds for believing that this can be achieved and certainly that the region has greater flexibility to respond than the developed world.

Edmund Harriss July 2009
The Fund invests in foreign securities which will involve political, economic and currency risks, greater volatility, and differences in accounting methods. The Fund is non-diversified meaning its assets may be concentrated in fewer individual holdings than diversified funds. Therefore, the Fund is more exposed to individual stock volatility than diversified funds. The Fund invests in smaller companies, which will involve additional risks such as limited liquidity and greater volatility.
The MSCI All Country Far East Free ex-Japan Index (MSCI AC Far East Free ex-Japan Index) is a free float-adjusted, capitalization-weighted index that is designed to measure equity market performance in the Asia region excluding Japan. The Standard & Poor's 500 Index is a market-capitalization weighted index composed of 500 widely held common stocks of U.S. companies. These indices are unmanaged, not available for investment and do not incur expenses.
Please refer to the Schedule of Investments for details on fund holdings. Current and future portfolio holdings are subject to risk.
The information provided herein represents the opinion of Guinness Atkinson Management for the period stated and is not intended to be a forecast of future events, a guarantee of future results, nor investment advice. Opinions, fund holdings and sector allocations are subject to change at any time and are not recommendations to buy or sell any security.
15
FUND HIGHLIGHTS at June 30, 2009 (Unaudited)
GUINNESS ATKINSON ASIA FOCUS FUND
| # of Holdings in Portfolio: | | | 46 | | |
| Portfolio Turnover: | | | 7.9 | % | |
| % of Stocks in Top 10: | | | 29.0 | % | |
| Fund Managers: | |
| Edmund Harriss | | | | | |
| Timothy W.N. Guinness | | | | | |
| Top 10 Holdings (% of net assets) | |
| CNPC Hong Kong Ltd. | | | 3.7 | % | | Angang Steel Co. Ltd. | | | 2.7 | % | |
| Yanzhou Coal Mining Co. Ltd. | | | 3.4 | % | | China Mobile Ltd. | | | 2.7 | % | |
| Dongfang Electrical Machinery Co. Ltd. | | | 3.0 | % | | Singapore Telecommunications Ltd | | | 2.7 | % | |
| Indo Tambangray Megah PT | | | 2.9 | % | | Jiangxi Copper Co. Ltd. | | | 2.6 | % | |
| Wistron Corporation | | | 2.8 | % | | iShares FTSE/Xinhua A50 China Tracker | | | 2.5 | % | |
| Country Breakdown (% of net assets) | |
| China | | | 23.0 | % | | South Korea | | | 9.2 | % | |
| Hong Kong | | | 19.8 | % | | Indonesia | | | 8.3 | % | |
| Taiwan | | | 11.4 | % | | Malaysia | | | 1.7 | % | |
| Thailand | | | 11.3 | % | | | | | | | |
| Singapore | | | 10.0 | % | | | | | | | |
| Sector Breakdown (% of Investments) | |
| Oil & Gas | | | 9.8 | % | | Commercial Banks | | | 2.7 | % | |
| Telecommunications | | | 9.8 | % | | Auto Components | | | 2.6 | % | |
| Transportation | | | 8.2 | % | | Semiconductors | | | 2.6 | % | |
| Steel-Producers | | | 7.6 | % | | Oil Refining & Marketing | | | 2.3 | % | |
| Coal | | | 7.5 | % | | Tobacco | | | 2.3 | % | |
| Oil & Gas-Exploration & Production | | | 6.5 | % | | Auto-Cars/Light Trucks | | | 2.2 | % | |
| Computers | | | 5.3 | % | | Non-Ferrous Metals | | | 2.2 | % | |
| Metal Processors & Fabrications | | | 4.8 | % | | Food-Misc/Diversified | | | 1.8 | % | |
| Electronics | | | 4.4 | % | | Distribution/Wholesale | | | 1.6 | % | |
| Electric-Generation | | | 3.4 | % | | Entertainment Software | | | 1.4 | % | |
| Power Conversion/Supply Equipment | | | 3.2 | % | | E-Commerce/Products | | | 1.1 | % | |
| Machinery-General Industry | | | 2.8 | % | | Agricultural Operations | | | 0.9 | % | |
| Investment Companies | | | 2.7 | % | | Textiles | | | 0.3 | % | |
16
SCHEDULE OF INVESTMENTS
June 30, 2009 (Unaudited)
GUINNESS ATKINSON FUNDS - ASIA FOCUS FUND
| Shares | | COMMON STOCKS: 94.7% | | Value | |
| China: 23.0% | | | |
| | 780,000 | | | Angang Steel Co., Ltd. | | $ | 1,284,417 | | |
| | 764,000 | | | China Shipping Development Co. | | | 977,085 | | |
| | 398,000 | | | Dongfang Electrical Machinery Co., Ltd. | | | 1,416,228 | | |
| | 674,000 | | | iShares FTSE/Xinhua A50 China Tracker | | | 1,207,104 | | |
| | 756,000 | | | Jiangxi Copper Co., Ltd. | | | 1,228,284 | | |
| | 22,000 | | | Perfect World Co., Ltd. - ADR(a) | | | 629,200 | | |
| | 1,016,000 | | | PetroChina Co., Ltd. | | | 1,122,742 | | |
| | 1,952,000 | | | Shenzhen Expressway Co., Ltd. | | | 926,372 | | |
| | 7,700 | | | Sohu.com Inc.(a) | | | 483,791 | | |
| | 1,174,800 | | | Yanzhou Coal Mining Co., Ltd. | | | 1,610,987 | | |
| | | | 10,886,210 | | |
| Hong Kong: 19.8% | | | |
| | 618,000 | | | Chen Hsong Holdings | | | 154,456 | | |
| | 127,500 | | | China Mobile, Ltd. | | | 1,276,581 | | |
| | 902,000 | | | CNOOC, Ltd. | | | 1,111,130 | | |
| | 2,104,000 | | | CNPC Hong Kong, Ltd. | | | 1,729,187 | | |
| | 2,510,000 | | | Denway Motors, Ltd. | | | 998,946 | | |
| | 128,740 | | | Esprit Holdings, Ltd. | | | 715,257 | | |
| | 2,256,000 | | | Global Bio-chem Technology Group Co. Ltd. | | | 403,061 | | |
| | 144,066 | | | HSBC Holdings PLC | | | 1,202,055 | | |
| | 341,000 | | | Kingboard Chemical Holdings, Ltd. | | | 836,003 | | |
| | 1,296,000 | | | Pacific Basin Shipping, Ltd. | | | 818,882 | | |
| | 1,071,000 | | | Victory City International Holdings, Ltd. | | | 134,033 | | |
| | | | 9,379,591 | | |
| Indonesia: 8.3% | | | |
| | 3,071,000 | | | Bumi Resources Tbk PT | | | 554,739 | | |
| | 696,000 | | | Indo Tambangray Megah PT | | | 1,353,820 | | |
| | 2,464,000 | | | International Nickel Indonesia Tbk PT | | | 994,688 | | |
| | 1,398,000 | | | Telekomunikasi Indonesia Tbk PT | | | 1,034,937 | | |
| | | | 3,938,184 | | |
| Malaysia: 1.7% | | | |
| | 128,700 | | | Digi.Com BHD | | | 812,041 | | |
| Singapore: 10.0% | | | |
| | 1,175,000 | | | Ausgroup, Ltd. | | | 423,203 | | |
| | 985,000 | | | Indofood Agri Resources, Ltd.(a) | | | 824,902 | | |
| | 242,000 | | | Singapore Petroleum Co., Ltd. | | | 1,033,203 | | |
| | 608,650 | | | Singapore Telecommunications, Ltd. | | | 1,255,733 | | |
| | 999,000 | | | Straits Asia Resources, Ltd. | | | 1,198,491 | | |
| | | | 4,735,532 | | |
The accompanying notes are in integral part of these financial statements.
17
| Shares | | COMMON STOCKS: 94.7% (Continued) | | Value | |
| South Korea: 9.2% | | | |
| | 13,545 | | | Hyundai Mobis | | $ | 1,180,124 | | |
| | 18,050 | | | KT&G Corporation | | | 1,018,507 | | |
| | 3,060 | | | POSCO | | | 1,017,238 | | |
| | 2,495 | | | Samsung Electronics | | | 1,153,600 | | |
| | | | 4,369,469 | | |
| Taiwan: 11.4% | | | |
| | 1,307,335 | | | China Steel Corporation | | | 1,119,735 | | |
| | 75,000 | | | HTC Corporation | | | 1,053,901 | | |
| | 194,174 | | | Shin Zu Shing Co., Ltd. | | | 917,592 | | |
| | 497,000 | | | U-Ming Marine Transport Corporation | | | 964,802 | | |
| | 797,469 | | | Wistron Corporation | | | 1,316,600 | | |
| | | | 5,372,630 | | |
| Thailand: 11.3% | | | |
| | 234,500 | | | Electricity Generating PCL | | | 514,880 | | |
| | 1,031,000 | | | Glow Energy PCL | | | 1,028,882 | | |
| | 1,128,184 | | | Mermaid Maritime PCL(a) | | | 437,984 | | |
| | 278,000 | | | PTT Exploration & Production PCL | | | 1,101,695 | | |
| | 170,700 | | | PTT PCL | | | 1,172,404 | | |
| | 1,703,100 | | | Thoresen Thai Agencies PCL | | | 1,099,742 | | |
| | | | 5,355,587 | | |
| | | | | Total Common Stocks
(cost $50,145,421) | | | 44,849,244 | | |
| | | | | Total Investments
(cost $50,145,421): 94.7% | | | 44,849,244 | | |
| | | | | Other Assets less Liabilities: 5.3% | | | 2,521,067 | | |
| | | | | Net Assets: 100% | | $ | 47,370,311 | | |
Percentages stated as a percentage of net assets.
Abbreviations:
ADR: American Depository Receipts
Footnotes:
(a) Non-income producing security.
The accompanying notes are in integral part of these financial statements.
18
SCHEDULE OF INVESTMENTS BY INDUSTRY
June 30, 2009 (Unaudited)
GUINNESS ATKINSON FUNDS - ASIA FOCUS FUND
| Industry | | % of Net Assets | |
| Oil & Gas | | | 9.3 | % | |
| Telecommunications | | | 9.2 | | |
| Transportation | | | 7.8 | | |
| Steel-Producers | | | 7.2 | | |
| Coal | | | 7.1 | | |
| Oil & Gas - Exploration & Production | | | 6.1 | | |
| Computers | | | 5.0 | | |
| Metal Processors & Fabrications | | | 4.5 | | |
| Electronics | | | 4.2 | | |
| Electric-Generation | | | 3.3 | | |
| Power Conversion/Supply Equipment | | | 3.0 | | |
| Machinery - General Industry | | | 2.6 | | |
| Investment Companies | | | 2.6 | | |
| Commercial Banks | | | 2.5 | | |
| Auto Components | | | 2.5 | | |
| Semiconductors | | | 2.5 | | |
| Oil Refining & Marketing | | | 2.2 | | |
| Tobacco | | | 2.2 | | |
| Auto-Cars/Light Trucks | | | 2.1 | | |
| Non-Ferrous Metals | | | 2.1 | | |
| Food-Misc/Diversified | | | 1.7 | | |
| Distribution/Wholesale | | | 1.5 | | |
| Entertainment Software | | | 1.3 | | |
| E-Commerce/Products | | | 1.0 | | |
| Agricultural Operations | | | 0.9 | | |
| Textile - Products | | | 0.3 | | |
| Total Investments | | | 94.7 | | |
| Other Assets less Liabilities | | | 5.3 | | |
| Net Assets | | | 100.0 | % | |
The accompanying notes are in integral part of these financial statements.
19
ASIA PACIFIC DIVIDEND FUND for the period ended June 30, 2009
1. Performance
ANNUALIZED TOTAL RETURNS
| | | 6 Months
(Actual) | | 1 Year
(Actual) | | 3 Years | | Since
Inception
March 31, 2006 | |
| Fund | | | 34.29 | % | | | -32.44 | % | | | -0.77 | % | | | -3.02 | % | |
| Benchmark Index: | |
| MSCI AC Pacific Ex Japan | | | 30.83 | % | | | -23.35 | % | | | 2.38 | % | | | 2.48 | % | |
| S&P 500 | | | 3.19 | % | | | -26.20 | % | | | -8.21 | % | | | -8.02 | % | |
The Fund's gross expense ratio is 2.33% per the Prospectus dated May 1, 2009. Guinness Atkinson Asset Management has contractually agreed to waive a portion of its advisory fees so that the Fund's ratio of expenses to average daily net assets will not exceed 1.98% through at least June 30, 2010. To the extent that the Advisor waives fees it may seek repayment of a portion or all of such amounts that any time within three fiscal years after the fiscal year in which such amounts were waived, subject to the applicable cap.
Performance data quoted represents past performance and does not guarantee future results. The investment return and principal value of an investment will fluctuate so that an investor's shares, when redeemed, may be worth more or less than their original cost. Current performance of the Fund may be lower or higher than the performance quoted. Performance data current to the most recent month end may be obtained by visiting www.gafunds.com, or calling (800) 916-6566.
The Fund imposes a 2% redemption fee on shares held less than 30 days. Performance data quoted does not reflect the 2% redemption fee on shares held less than 30 days. Total returns reflect a fee waiver in effect and in the absence of this waiver, the total returns would be lower.
The Fund had a cautious start to the year as stock markets continued to feel the after-shocks of the Lehman Brothers' 2008 collapse and the tightness in the credit markets that followed. By the end of the first quarter stock markets moved up from their lows as stability returned to the financial system.
In our view, Asian markets recovered strongly in the second quarter once investors focused on the relative merits of Asia's economic strength and compared these to the sharp market falls in the latter part of 2008 finding them to have been over-done. Countries across the region have been in a position to launch stimulus packages and fund them from surpluses built up over the past ten years in contrast to the developed world which in many cases must fund their own efforts by additional debt that they can ill afford.
The region has also had the benefit of a stable and well-capitalized banking system that is a legacy from the disastrous 1998 financial crisis period. Since that time banks have re-built and preserved capital, they have been much more cautious in their lending policies and by and large they steered clear of the 'toxic' assets that have dragged down their larger western peers.
At the same time we should remember that moderate loan growth has been matched by modest credit demand as companies also scaled back their earlier ambitions to build market share and instead work their existing assets more efficiently. The last ten years have seen a broad improvement in balance sheets, less investment, less debt and improvement in both working capital use and cash flow generation. Of course, the performance of individual companies has varied widely but overall there has been a steady improvement in investment returns and in the level of dividends paid out.
For the most part we have seen a reduction in the absolute level of cash paid out because the common dividend policy in Asia is to link it directly to profits and to pay out a certain proportion of profits each year. In recent years many companies have seen exceptional gains from asset trading or have carried out capital restructurings which have then been paid out in the form of special dividends. Understandably, these have not been repeated in the latest results period.
Nevertheless, we think companies have on the whole had adequate resources to see them through this difficult period and while there has been some capital raising among the banks the modest extent across other sectors has been encouraging.
2. Portfolio Position
The portfolio has overweight positions in China/Hong Kong, in Singapore and in Thailand. From a sector view point the portfolio is overweight in consumer stocks, energy, telecommunications and utilities. The fund is underweight banking, real estate and
20
technology. We believe the overall position makes the fund particularly well positioned benefit from a rising market and has a strong bias toward domestic, rather than export, focused businesses.
3. Outlook
In the very short term as we described in the Asia Focus Fund letter, we believe Asia's stable economic condition should be enough to attract and retain investors. Stimulus packages in the region are generating increased domestic activity as seen in China in particular and helping to offset the impact on manufacturing caused by contraction in exports. However, we think stimulus packages cannot be sustained indefinitely and an export boom does not appear likely any time soon. Asia needs to find some other growth driver.
In our view, the challenge for the region is to unlock the savings that have built up after years of surpluses and high savings rates because without this consumer growth will remain depressed. The problem is not such a bad one when we consider that in Asia they just need to mobilize savings while the problem in the US is that consumers now need to build them up. Incentives are being put into place, the most important of which is the appreciation of the need for a welfare safety net to reduce the need for precautionary savings, especially for health.
We believe that in China there are good grounds for optimism given recent signs of increased real estate construction and higher transaction volumes. There has also been stronger than expected growth in car sales especially those with smaller, more efficient engines. More steel production capacity is coming back on line in China, Korea and Taiwan and steel prices for both higher end and construction-related products are likely to rise further.
We believe that these early signs may lead to increased consumer spending in coming months and we note that consumer discretionary companies still appear cheaper than the broad market which suggests further opportunity. The technology sector still remains highly uncertain. Analysts have cut their profit forecasts for this year while leaving those for 2010 largely unchanged resulting in high forecast growth but with low confidence, we believe.
In sum, we believe that recent stock market performance can be justified by a better relative economic position. Export manufacturing is likely to remain under pressure for some time yet placing the onus squarely on domestic activity to drive growth. We believe that there are reasonable grounds for believing that this can be achieved and certainly that the region has greater flexibility to respond than the developed world.
The dividend outlook will be determined by the profit outlook and we expect that dividend growth should move in line with profits. We do not expect companies to begin hoarding cash because there are no signs of an incipient boom in company investment and we also see much improved credit conditions. We therefore expect that the region will remain a relatively higher dividend-paying area but clearly export-related businesses are the ones likely to remain under the greatest pressure.

Edmund Harriss July 2009
The Fund invests in foreign securities which will involve political, economic and currency risks, greater volatility, and differences in accounting methods. The Fund is non-diversified meaning its assets may be concentrated in fewer individual holdings than diversified funds. Therefore, the Fund is more exposed to individual stock volatility than diversified funds. The Fund invests in smaller companies, which will involve additional risks such as limited liquidity and greater volatility.
The MSCI All Country Pacific Free ex-Japan Index (MSCI AC Pacific ex-Japan Index) is a free float-adjusted, capitalization-weighted index that is designed to measure equity market performance in the Pacific region including Japan. The Standard & Poor's 500 Index is a market-capitalization weighted index composed of 500 widely held common stocks of U.S. companies. These indices are unmanaged, not available for investment and do no incur expenses.
Please refer to the Schedule of Investments for details on fund holdings. Current and future portfolio holdings are subject to risk.
The information provided herein represents the opinion of Guinness Atkinson Management for the period stated and is not intended to be a forecast of future events, a guarantee of future results, nor investment advice. Opinions, fund holdings and sector allocations are subject to change at any time and are not recommendations to buy or sell any security.
21
FUND HIGHLIGHTS at June 30, 2009 (Unaudited)
GUINNESS ATKINSON ASIA PACIFIC DIVIDEND FUND
| # of Holdings in Portfolio: | | | 35 | | |
| Portfolio Turnover: | | | 12.1 | % | |
| % of Stocks in Top 10: | | | 32.9 | % | |
| Fund Managers: | |
| Edmund Harriss | | | | | |
| Timothy W.N. Guinness | | | | | |
| Top 10 Holdings (% of net assets) | |
| Vtech Holdings, Ltd. | | | 3.6 | % | | Angang Steel Co. Ltd. | | | 3.2 | % | |
| Industrial and Commercial Bank of China (Asia), Ltd. | | | 3.6 | % | | PTT Chemical PCL | | | 3.1 | % | |
| Yanzhou Coal Mining Co. Ltd. | | | 3.5 | % | | Telekomunikasi Indonesia Tbk PT | | | 3.1 | % | |
| Glow Energy | | | 3.4 | % | | PTT PCL | | | 3.1 | % | |
| Thoresen Thai Agencies | | | 3.2 | % | | Singapore Telecommunications Ltd. | | | 3.1 | % | |
| Country Breakdown (% of net assets) | |
| Hong Kong | | | 23.4 | % | | Indonesia | | | 3.1 | % | |
| Thailand | | | 15.5 | % | | Philippines | | | 3.0 | % | |
| Taiwan | | | 15.4 | % | | Malaysia | | | 2.7 | % | |
| China | | | 14.8 | % | | New Zealand | | | 2.4 | % | |
| South Korea | | | 8.4 | % | | Australia | | | 1.9 | % | |
| Singapore | | | 8.3 | % | | | | | | | |
| Sector Breakdown (% of Investments) | |
| Telecommunications | | | 15.8 | % | | Petrochemicals | | | 3.2 | % | |
| Commercial Banks | | | 15.0 | % | | Tobacco | | | 3.0 | % | |
| Steel-Producers | | | 9.1 | % | | Electric-Integrated | | | 3.0 | % | |
| Transportation | | | 7.8 | % | | Oil & Gas | | | 3.0 | % | |
| Semiconductors | | | 5.6 | % | | Chemicals-Plastics | | | 2.6 | % | |
| Computers | | | 5.2 | % | | Food-Meat Products | | | 2.5 | % | |
| Oil Refining & Marketing | | | 4.6 | % | | Retail | | | 2.5 | % | |
| Coal | | | 3.6 | % | | Auto/Truck Parts & Equipment Replacement | | | 2.5 | % | |
| Electric-Generation | | | 3.4 | % | | Distribution/Wholesale | | | 2.4 | % | |
| Machinery-General Industry | | | 3.3 | % | | Agricultural Chemicals | | | 1.9 | % | |
22
SCHEDULE OF INVESTMENTS
June 30, 2009 (Unaudited)
GUINNESS ATKINSON FUNDS - ASIA PACIFIC DIVIDEND FUND
| Shares | | COMMON STOCKS: 98.9% | | Value | |
| Australia: 1.9% | | | |
| | 72,194 | | | Incitec Pivot Ltd. | | $ | 137,392 | | |
| China: 14.8% | | | |
| | 141,801 | | | Angang Steel Co., Ltd. | | | 233,502 | | |
| | 150,000 | | | China Shipping Development Co., Ltd. | | | 191,836 | | |
| | 467,000 | | | People's Food Holdings Ltd. | | | 181,340 | | |
| | 196,000 | | | PetroChina Co., Ltd. | | | 216,592 | | |
| | 188,000 | | | Yanzhou Coal Mining Co., Ltd | | | 257,802 | | |
| | | | 1,081,072 | | |
| Hong Kong: 23.4% | | | |
| | 121,500 | | | BOC Hong Kong Holdings, Ltd. | | | 211,399 | | |
| | 33,000 | | | CLP Holdings, Ltd. | | | 218,664 | | |
| | 31,000 | | | Esprit Holdings, Ltd. | | | 172,231 | | |
| | 5,024 | | | HSBC Holdings, PLC - ADR | | | 209,853 | | |
| | 146,000 | | | Industrial and Commercial Bank of China (Asia), Ltd. | | | 263,600 | | |
| | 1,467,000 | | | Modern Beauty Salon Holdings, Ltd. | | | 181,234 | | |
| | 296,300 | | | Pacific Basin Shipping, Ltd. | | | 187,218 | | |
| | 39,000 | | | Vtech Holdings Ltd. | | | 265,608 | | |
| | | | 1,709,807 | | |
| Indonesia: 3.1% | | | |
| | 307,500 | | | Telekomunikasi Indonesia Tbk PT | | | 227,642 | | |
| Malaysia: 2.7% | | | |
| | 31,700 | | | Digi.Com BHD | | | 200,013 | | |
| New Zealand: 2.4% | | | |
| | 40,301 | | | New Zealand Refining Co., Ltd. | | | 178,024 | | |
| Philippines: 3.0% | | | |
| | 11,380 | | | Globe Telecom, Inc. | | | 224,226 | | |
| Singapore: 8.3% | | | |
| | 37,000 | | | Singapore Petroleum Co., Ltd. | | | 157,969 | | |
| | 109,000 | | | Singapore Telecommunications Ltd. | | | 224,883 | | |
| | 22,000 | | | United Overseas Bank Ltd. | | | 221,997 | | |
| | | | 604,849 | | |
| South Korea: 8.4% | | | |
| | 5,410 | | | KB Financial Group, Inc.(a) | | | 180,363 | | |
| | 3,890 | | | KT&G Corporation | | | 219,501 | | |
| | 640 | | | POSCO | | | 212,756 | | |
| | | | 612,620 | | |
The accompanying notes are in integral part of these financial statements.
23
| Shares | | COMMON STOCKS: 98.9% (Continued) | | Value | |
| Taiwan: 15.4% | | | |
| | 244,284 | | | China Steel Corporation | | $ | 209,230 | | |
| | 224,133 | | | Compal Electronics, Inc. | | | 181,268 | | |
| | 101,400 | | | Depo Auto Parts Industrial Co., Ltd | | | 178,703 | | |
| | 230,776 | | | Greatek Electronics, Inc. | | | 179,677 | | |
| | 14,000 | | | HTC Corporation | | | 196,728 | | |
| | 94,000 | | | U-Ming Marine Transport Corporation | | | 182,478 | | |
| | | | 1,128,084 | | |
| Thailand: 15.5% | | | |
| | 250,900 | | | Glow Energy PCL | | | 250,385 | | |
| | 149,300 | | | PTT Chemical PCL | | | 228,968 | | |
| | 32,900 | | | PTT PCL | | | 225,964 | | |
| | 383,500 | | | Thai Plastic & Chemical PCL | | | 190,230 | | |
| | 367,840 | | | Thoresen Thai Agencies PCL | | | 237,525 | | |
| | | | 1,133,072 | | |
| | | | | Total Common Stocks
(cost $10,505,659) | | | 7,236,801 | | |
| | | | | Total Investments
(cost $10,505,659): 98.9% | | | 7,236,801 | | |
| | | | | Other Assets less Liabilities: 1.1% | | | 77,607 | | |
| | | | | Net Assets: 100% | | $ | 7,314,408 | | |
Percentages stated as a percentage of net assets.
Abbreviations:
ADR: American Depository Receipts
Footnotes:
(a) Non-income producing security.
The accompanying notes are in integral part of these financial statements.
24
SCHEDULE OF INVESTMENTS BY INDUSTRY
June 30, 2009 (Unaudited)
GUINNESS ATKINSON ASIA PACIFIC DIVIDEND FUND
| Industry | | % of Net Assets | |
| Telecommunications | | | 15.6 | % | |
| Commercial Banks | | | 14.8 | | |
| Steel-Producers | | | 9.0 | | |
| Transportation | | | 7.7 | | |
| Semiconductors | | | 5.5 | | |
| Computers | | | 5.2 | | |
| Oil Refining & Marketing | | | 4.6 | | |
| Coal | | | 3.5 | | |
| Electric-Generation | | | 3.4 | | |
| Machinery-General Industry | | | 3.3 | | |
| Petrochemicals | | | 3.1 | | |
| Tobacco | | | 3.0 | | |
| Electric-Integrated | | | 3.0 | | |
| Oil & Gas | | | 3.0 | | |
| Chemicals-Plastics | | | 2.6 | | |
| Food-Meat Products | | | 2.5 | | |
| Retail-Hair Salons | | | 2.5 | | |
| Auto/Truck Parts & Equipment Replacement | | | 2.4 | | |
| Distribution/Wholesale | | | 2.4 | | |
| Agricultural Chemicals | | | 1.8 | | |
| Total Investments | | | 98.9 | | |
| Other Assets less Liabilities | | | 1.1 | | |
| Net Assets | | | 100.0 | % | |
The accompanying notes are in integral part of these financial statements.
25
CHINA & HONG KONG FUND for the period ended June 30, 2009
1. Performance
AVERAGE ANNUALIZED TOTAL RETURNS
| | | 6 Monnths
(Actual) | | 1 Year
(Actual) | | 3 Years | | 5 Years | | 10 Years | |
| Fund | | | 39.88 | % | | | -19.65 | % | | | 9.45 | % | | | 12.84 | % | | | 8.69 | % | |
| Benchmark Index: | |
| Hang Seng Composite | | | 33.53 | % | | | -12.45 | % | | | 9.62 | % | | | 14.46 | % | | | N/A | | |
| Hang Seng | | | 30.28 | % | | | -13.22 | % | | | 7.66 | % | | | 12.25 | % | | | 6.56 | % | |
| S&P 500 | | | 3.19 | % | | | -26.20 | % | | | -8.21 | % | | | -2.24 | % | | | -2.22 | % | |
The Fund's gross expense ratio is 1.53% per the Prospectus dated May 1, 2009. Guinness Atkinson Asset Management has contractually agreed to waive a portion of its advisory fees so that the Fund's ratio of expenses to average daily net assets will not exceed 1.98% through at least June 30, 2010. To the extent that the Advisor waives fees it may seek repayment of a portion or all of such amounts that any time within three fiscal years after the fiscal year in which such amounts were waived, subject to the applicable cap.
Performance data quoted represents past performance and does not guarantee future results. The investment return and principal value of an investment will fluctuate so that an investor's shares, when redeemed, may be worth more or less than their original cost. Current performance of the Fund may be lower or higher than the performance quoted. Performance data current to the most recent month end may be obtained by visiting www.gafunds.com, or calling (800) 916-6566.
The Fund imposes a 2% redemption fee on shares held less than 30 days. Performance data quoted does not reflect the 2% redemption fee on shares held less than 30 days. Total returns reflect a fee waiver in effect and in the absence of this waiver, the total returns would be lower.
Hong Kong-listed Chinese stocks began the year very cautiously as did equity markets around the world. In our view, the stimulus package that China announced in November 2008 began to be felt from March onwards but has been presaged by record bank lending which has continued throughout the first half of this year. Signs of increasing activity have been reinforced by rising imports of iron ore, coal, copper and oil which have been matched by steadily rising steel output and steel prices.
The latest data releases now point to increasing construction activity in the residential real estate sector alongside infrastructure projects. This area has been regarded by many as crucial towards rebuilding growth momentum after the government-engineered slowdown last year. As a major employer the construction sector needs to pick up at a time when export manufacturers are under significant pressure.
We believe China's consumer sector has remained remarkably strong throughout the period to judge from retail sales and car sales, although it is worth noting that the retail sales number also includes government purchases which have distorted the data. The nature of this distortion prompted an unusual official acknowledgement of the problem. Policy makers are keen to improve the accuracy and value of consumer data because of the importance of the sector to longer term growth.
Economic growth over the past twenty years has been heavily dominated by investment by government and more recently by companies. In the last ten years a significant proportion of corporate investment growth has been directed toward export manufacturing, which has been hard hit by the US and European slowdown; hence the present emphasis on government inspired domestic infrastructure spending. But during this period private consumption has signally failed to keep up and at 35% of overall gross domestic product (GDP) is now well below the broad emerging market level of around 50% never mind that of developed markets of around 60-65%.
The financial stimulus program on which China has embarked has concentrated on providing ample liquidity in the system and to begin a series of building projects to improve the nation's infrastructure. However there have also been administrative and fiscal measures to augment these spending plans to try and encourage consumer activity in the car and real estate sectors which have a material impact on both industrial production and employment. In the longer term China is seeking to unlock household savings by putting into place a basic level of universal healthcare for 90% of the population by 2001 at a cost of $125 billion.
26
Investors have responded positively to China's steps and have been heartened by a steady stream of stronger-than-expected economic data that have been broadening out from simply increased money supply to industrial production, purchasing managers indices, electricity output, construction activity and raw materials imports. For the present this has reduced concerns about the sharp contraction in exports and its impact on some of the southern and eastern provinces, most notably Guangdong just to the North of Hong Kong.
There has been a sharp recovery in stocks in the energy, materials, auto makers and real estate and banking sectors in the first half of this year. Domestic Chinese stock markets have also risen strongly and new company launches onto the Shanghai Stock Exchange are coming back. Hong Kong stocks have also benefited from China's economic strength but its high exposure to trade activity has hit the local economy hard prompting additional government support measures.
2. Portfolio Position
The portfolio is positioned toward energy, materials, shipping and transportation. We have also taken positions in alternative energy and internet-based consumer businesses with exposure to on-line gaming and advertising. There are selected positions in banking and real estate but we continue to be somewhat cautious toward these companies. We remain underweight in electricity utilities and in consumer distribution businesses which we think have yet to see a major improvement in operating conditions.
3. Outlook
As for the rest of Asia, we believe China's challenge is to mobilize consumer spending to provide an alternative to the depressed export manufacturing sector as a driver of growth. The success of the current stimulus package will depend on whether enough confidence can be generated to encourage private sector participation on a meaningful scale to follow through on the government's efforts.
We see signs that this is happening with increased construction activity being matched by record steel production and no obvious rise in steel inventories (suggesting there is real demand). In Hebei province, which alone produces no less than 8% of the world's steel, mills are working at full capacity. However, we remain cautious about the nature of this investment boom and whether China is now on a capacity-creation binge which will destroy capital and risk the banks' capital base with rising non-performing assets in the future.
This is clearly a risk. It is a risk that has been discussed time and again throughout China's 30-year period of industrial reform and growth. What we can say is that there are substantial challenges that need to be overcome to reduce the wealth gap, to develop a consumer economy, to provide adequate healthcare and to repair the environmental damage that breakneck industrial growth has wrought. There is also a political system to deal with that seems unlikely to be flexible enough to cope with the challenge of a rising middle class whose numbers continue to swell at an astonishing pace. We can also say they have done a surprisingly good job so far and observe that it was the free-market system rather than the Chinese system that came closest to failure in 2008.
The portfolio will continue to invest in those companies that we believe offer the best combination of returns on investment, value and earnings momentum.

Edmund Harriss July 2009
The Fund invests in foreign securities which will involve political, economic and currency risks, greater volatility, and differences in accounting methods. The Fund is non-diversified meaning its assets may be concentrated in fewer individual holdings than diversified funds. Therefore, the Fund is more exposed to individual stock volatility than diversified funds. The Fund invests in smaller companies, which will involve additional risks such as limited liquidity and greater volatility.
The Hang Seng Composite Index is a market-capitalization weighted index that comprises the top 200 companies listed on the Hong Kong Stock Exchange, based on the average market-capitalization for the past twelve months. The Hang Seng Composite Index commenced on January 3, 2000 and therefore does not have returns since the Fund's inception. The Hang Seng Index is a barometer of the Hong Kong Stock Market whose aggregate market capitalization accounts for about 70% of the total market-capitalization of the Stock Exchange of Hong Kong Limited. The Standard and Poor's 500 Index is a market capitalization
27
CHINA & HONG KONG FUND
weighted index composed of 500 widely held common stocks of U.S. companies. These indices are unmanaged, not available for investment and do not incur expenses.
Please refer to the Schedule of Investments for details on fund holdings. Current and future portfolio holdings are subject to risk.
The information provided herein represents the opinion of Guinness Atkinson Management for the period stated and is not intended to be a forecast of future events, a guarantee of future results, nor investment advice. Opinions, fund holdings and sector allocations are subject to change at any time and are not recommendations to buy or sell any security.
28
FUND HIGHLIGHTS at June 30, 2009 (Unaudited)
GUINNESS ATKINSON CHINA & HONG KONG FUND
| # of Holdings in Portfolio: | | | 46 | | |
| Portfolio Turnover: | | | 1.1 | % | |
| % of Stocks in Top 10: | | | 42.7 | % | |
| Fund Managers: | |
| Edmund Harriss | |
| Timothy W.N. Guinness | |
| Top 10 Holdings (% of net assets) | |
| China Mobile Ltd. | | | 5.8 | % | | iShares FTSE/Xinhua A50 China Tracker | | | 4.3 | % | |
| BYD Co. Ltd. | | | 5.5 | % | | Soho China Ltd. | | | 3.4 | % | |
| CNOOC Ltd. | | | 5.4 | % | | Vtech Holdings, Ltd. | | | 3.2 | % | |
| Yanzhou Coal Mining Co. Ltd. | | | 4.7 | % | | Beijing Enterprises Holdings | | | 3.1 | % | |
| PetroChina Co. Ltd. | | | 4.3 | % | | Hang Seng Bank | | | 3.0 | % | |
| Country Breakdown (% of net assets) | |
| Hong Kong | | | 47.4 | % | | United States | | | 3.7 | % | |
| China | | | 45.0 | % | | Cayman Islands | | | 0.9 | % | |
| Sector Breakdown (% of Investments) | |
| Commercial Banks | | | 13.2 | % | | Auto-Cars/Light Trucks | | | 2.2 | % | |
| Oil & Gas | | | 13.0 | % | | Metal Processors & Fabrication | | | 2.2 | % | |
| Telecommunications | | | 9.3 | % | | Agricultural Operations | | | 2.1 | % | |
| Coal | | | 6.6 | % | | Airlines | | | 2.1 | % | |
| Transportation | | | 6.0 | % | | Computers | | | 2.0 | % | |
| Batteries/Battery System | | | 5.6 | % | | E-Commerce/Products | | | 1.7 | % | |
| Real Estate | | | 5.3 | % | | Diversified Operations | | | 1.4 | % | |
| Investment Companies | | | 4.4 | % | | Distribution/Wholesale | | | 1.4 | % | |
| Internet | | | 3.5 | % | | Steel-Producers | | | 1.3 | % | |
| Solar | | | 3.3 | % | | Entertainment Software | | | 0.9 | % | |
| Industrials | | | 3.2 | % | | Machinery-General Industry | | | 0.5 | % | |
| Power Conversion/Supply Equipment | | | 3.0 | % | | Textiles | | | 0.4 | % | |
| Auto/Truck Parts & Equipment-Replacement | | | 2.8 | % | | Retail | | | 0.3 | % | |
| Electronics | | | 2.3 | % | | | | | | | |
29
SCHEDULE OF INVESTMENTS
June 30, 2009 (Unaudited)
GUINNESS ATKINSON FUNDS - CHINA & HONG KONG FUND
| Shares | | COMMON STOCKS: 92.7% | | Value | |
| Agricultural Operations: 2.1% | | | |
| | 3,496,272 | | | Chaoda Modern Agriculture | | $ | 2,044,537 | | |
| | 8,762,000 | | | Global Bio-chem Technology Group Co. Ltd. | | | 1,565,434 | | |
| | | | 3,609,971 | | |
| Airlines: 2.0% | | | |
| | 2,556,000 | | | Cathay Pacific Airways | | | 3,493,344 | | |
| Auto - Cars/Light Trucks: 2.1% | | | |
| | 9,314,000 | | | Denway Motors, Ltd. | | | 3,706,847 | | |
| Auto/Truck Parts & Equipment: 2.7% | | | |
| | 1,428,800 | | | Weichai Power Co., Ltd. | | | 4,728,128 | | |
| Batteries/Battery System: 5.5% | | | |
| | 2,417,600 | | | BYD Co., Ltd.(a) | | | 9,529,329 | | |
| Coal: 6.4% | | | |
| | 2,615,000 | | | China Coal Energy Co. | | | 3,066,524 | | |
| | 5,953,200 | | | Yanzhou Coal Mining Co., Ltd. | | | 8,163,544 | | |
| | | | 11,230,068 | | |
| Commercial Banks: 12.8% | | | |
| | 2,577,000 | | | BOC Hong Kong Holdings Ltd. | | | 4,483,741 | | |
| | 3,492,000 | | | China Construction Bank Corporation | | | 2,686,259 | | |
| | 244,650 | | | Dah Sing Financial Holdings Ltd. | | | 993,891 | | |
| | 377,000 | | | Hang Seng Bank | | | 5,276,551 | | |
| | 614,691 | | | HSBC Holdings PLC | | | 5,128,847 | | |
| | 3,000,000 | | | Industrial and Commercial Bank of China (Asia), Ltd. | | | 2,081,908 | | |
| | 188,400 | | | Wing Hang Bank, Ltd. | | | 1,644,541 | | |
| | | | 22,295,738 | | |
| Computers: 2.0% | | | |
| | 9,310,000 | | | Lenovo Group, Ltd. | | | 3,474,100 | | |
| Distribution/Wholesale: 1.3% | | | |
| | 421,571 | | | Esprit Holdings, Ltd. | | | 2,342,175 | | |
| Diversified Operations: 1.4% | | | |
| | 556,298 | | | Wharf Holdings, Ltd. | | | 2,345,502 | | |
| E-Commerce/Products: 1.6% | | | |
| | 45,400 | | | Sohu.com Inc.(a) | | | 2,852,482 | | |
| Electronics: 2.2% | | | |
| | 2,835,000 | | | Digital China Holdings, Ltd. | | | 1,968,114 | | |
| | 793,000 | | | Kingboard Chemical Holdings, Ltd. | | | 1,944,135 | | |
| | | | 3,912,249 | | |
The accompanying notes are in integral part of these financial statements.
30
| Shares | | COMMON STOCKS: 92.7% (Continued) | | Value | |
| Entertainment Software: 0.9% | | | |
| | 53,000 | | | Perfect World Co., Ltd. - ADR(a) | | $ | 1,515,800 | | |
| Industrials: 3.1% | | | |
| | 1,080,000 | | | Beijing Enterprises Holdings | | | 5,382,523 | | |
| Internet: 3.4% | | | |
| | 89,000 | | | NetEase.com, Inc. - ADR(a) | | | 3,131,020 | | |
| | 242,000 | | | Tencent Holdings, Ltd. | | | 2,796,963 | | |
| | | | 5,927,983 | | |
| Machinery-General Industry: 0.5% | | | |
| | 3,510,000 | | | Chen Hsong Holdings | | | 877,251 | | |
| Metal - Processors & Fabrications: 2.1% | | | |
| | 2,270,000 | | | Jiangxi Copper Co., Ltd. | | | 3,688,102 | | |
| Oil & Gas: 12.6% | | | |
| | 7,602,000 | | | CNOOC Ltd. | | | 9,364,534 | | |
| | 6,210,000 | | | CNPC Hong Kong, Ltd. | | | 5,103,732 | | |
| | 6,796,000 | | | PetroChina Co., Ltd. | | | 7,509,992 | | |
| | | | 21,978,258 | | |
| Power Conversion/Supply Equipment: 2.9% | | | |
| | 1,426,000 | | | Dongfang Electrical Machinery Co., Ltd. | | | 5,074,224 | | |
| Real Estate: 5.1% | | | |
| | 4,822,000 | | | Midland Holdings, Ltd. | | | 2,919,605 | | |
| | 9,879,000 | | | Soho China, Ltd. | | | 6,018,774 | | |
| | | | 8,938,379 | | |
| Retail: 0.3% | | | |
| | 698,000 | | | Glorious Sun Enterprises, Ltd. | | | 183,433 | | |
| | 2,560,000 | | | Modern Beauty Salon Holdings, Ltd. | | | 316,265 | | |
| | | | 499,698 | | |
| Solar: 3.2% | | | |
| | 510,800 | | | Renesola, Ltd. - ADR(a) | | | 2,875,804 | | |
| | 107,700 | | | Trina Solar, Ltd. - ADR(a) | | | 2,760,351 | | |
| | | | 5,636,155 | | |
| Steel Producers: 1.3% | | | |
| | 1,341,000 | | | Angang Steel Co., Ltd. | | | 2,208,209 | | |
| Telecommunications: 9.0% | | | |
| | 1,018,000 | | | China Mobile, Ltd. | | | 10,192,621 | | |
| | 819,000 | | | Vtech Holdings, Ltd. | | | 5,577,772 | | |
| | | | 15,770,393 | | |
| Textiles: 0.4% | | | |
| | 5,512,000 | | | Victory City International Holdings, Ltd. | | | 689,815 | | |
| Transportation: 5.8% | | | |
| | 3,852,000 | | | China Shipping Development Co., Ltd. | | | 4,926,348 | | |
| | 4,240,000 | | | Pacific Basin Shipping, Ltd. | | | 2,679,060 | | |
| | 5,204,000 | | | Shenzhen Expressway Co., Ltd. | | | 2,469,692 | | |
| | | | 10,075,100 | | |
| | Total Common Stocks
(cost $149,395,037) | | | | | | 161,781,823 | | |
The accompanying notes are in integral part of these financial statements.
31
| Shares | | COMMON STOCKS: 92.7% (Continued) | | Value | |
| Investment Companies: 4.3% | |
| | 4,146,000 | | | iShares FTSE/Xinhua A50 China Tracker | | $ | 7,425,304 | | |
Total Investment Companies
(cost $6,493,707) | | | | | 7,425,304 | | |
| Warrants: 0.0% | |
| | 100 | | | Surface Mount Technology Holdings, Ltd.(a)(b)(c) | | | — | | |
Total Warrants
(cost $0) | | | | | — | | |
Total Investments
(cost $155,888,744): 97.0% | | | | | 169,207,127 | | |
| | | Other Assets less Liabilities: 3.0% | | | 5,311,484 | | |
| | | Net Assets: 100% | | $ | 174,518,611 | | |
Percentages stated as a percentage of net assets.
Abbreviations:
ADR: American Depository Receipts
Footnotes:
(a) Non-income producing security.
(b) Illiquid. Illiquid securities represents $0 or 0.0% of net assets.
(c) Fair valued under direction of the Board of Trustees. Fair valued securities represents $0 or 0.0% of net assets.
The accompanying notes are in integral part of these financial statements.
32
GLOBAL ENERGY FUND for the period ended June 30th 2009
1. Performance
AVERAGE ANNUALIZED TOTAL RETURNS
| | | 6 Months
(Actual) | | 1 Year
(Actual) | | 3 Years | | 5 Years | | Since
Inception
June 30, 2004 | |
| Fund | | | 30.99 | % | | | -42.89 | % | | | -3.60 | % | | | 15.23 | % | | | 15.23 | % | |
| Benchmark Index: | |
| MSCI World Energy Index | | | 6.68 | % | | | -39.50 | % | | | -3.11 | % | | | 9.30 | % | | | 9.30 | % | |
| S&P 500 | | | 3.19 | % | | | -26.20 | % | | | -8.21 | % | | | -2.24 | % | | | -2.24 | % | |
The Fund's gross expense ratio is 1.31% per the Prospectus dated May 1, 2009. Guinness Atkinson Asset Management has contractually agreed to waive a portion of its advisory fees so that the Fund's ratio of expenses to average daily net assets will not exceed 1.45% through at least June 30, 2010. To the extent that the Advisor waives fees it may seek repayment of a portion or all of such amounts that any time within three fiscal years after the fiscal year in which such amounts were waived, subject to the applicable cap.
Performance data quoted represents past performance and does not guarantee future results. The investment return and principal value of an investment will fluctuate so that an investor's shares, when redeemed, may be worth more or less than their original cost. Current performance of the Fund may be lower or higher than the performance quoted. Performance data current to the most recent month end may be obtained by visiting www.gafunds.com, or calling (800) 916-6566.
The Fund imposes a 2% redemption fee on shares held less than 30 days. Performance data quoted does not reflect the 2% redemption fee on shares held less than 30 days. Total returns reflect a fee waiver in effect and in the absence of this waiver, the total returns would be lower.
The Global Energy Fund in the first six months of 2009 produced a total return of 30.99%. This compares favourably to the price return of the MSCI World Energy Index of 6.68%, and is also well ahead of the broad U.S. market which was up a little, as exemplified by the S&P 500 Index's total return of 3.16%.
2. Activity
Portfolio activity during the period was relatively light. During April we sold our position in Chevron and replaced it with a position in Unit. Chevron had become the most expensive 'super major' we held and a rotation into Unit gave us exposure to a U.S. exploration & production (E&P) company with good value reserves. Unit also has a land drilling business which could perform well when the services business cycle begins to recover.
In April we also sold our position in Peabody, the U.S. coal company, and bought a position in Whiting, an 'oily' E&P company with acreage in the U.S. The outlook for U.S. coal remains weak in light of the supply/demand imbalance and lower international exports and we are cautious on the ability for the coal group to maintain their long-term pricing contracts at current levels. Whiting has good value reserves, a long reserve life and should benefit from any move up in the oil price.
During May we bought one new research position, Falkland Oil and Gas. Falkland is an oil exploration company with offshore acreage to the south of the Falkland Islands. Whilst Falkland has not yet drilled any of its prospects, we believe that given its farm in agreement with BHP Billiton there should be good opportunity over the next 12-24 months for the company to accelerate its development plans.
3. Portfolio Position
The invested fund at June 30th 2009 was on a Price Earnings Ratio (2008) of 4.7x (7.7x 2007) with a median PER (2008) of stocks held of 6.7x. By comparison the S&P 500 Index at 919.3 was on a PER of 18.6x (2008) (based on S&P 500 'operating' earnings per share estimates of 49.51 for 2008).
The star performers over the first six months of 2009 have been spread across all sectors. Singapore Petroleum (refining) was up 172.0%, Dragon Oil and Addax (both emerging market exploration and production) were up 154.8% and 150.3% respectively,
33
GLOBAL ENERGY FUND
Petro-Canada (Canadian Integrated) was up 72.4% and Newfield (U.S. exploration and production) was up 65.8%. The worst performing holdings have been ConocoPhillips, Apache, Royal Dutch Shell, Hess and Swift, with performance ranging from -18.8% (ConocoPhillips) to +0.2% (Swift).
4. Market Background
2009 has been a year of recovery for the oil price. Having ended 2008 at $44 it fell back to $35 in mid-January and threatened to retest the December low ($31). However, it has since moved up handsomely and went through $70 in June. It is currently trading in the low $60's and to the end of June averaged $51.51 for the year to date. Having averaged $99.90 for 2008 we are targeting a 2009 average of $55.
The reasons for this recovery are well-documented. First and foremost, OPEC's combined quota cuts of 4.2m barrels in October and December 2008, and the 70-80% compliance with the new quotas, have done enough to balance the market. Added to this the increasing signs of economic recovery, strong imports from China, and index buying combined with a weaker dollar and the animal spirits of traders have moved the oil price back up to a level which remunerates oil producing nations and encourages investment without disrupting the world economy. We now think of the oil price trading range as $50-75.
The longer term outlook points to a steadily rising oil price. Non-OPEC supply, which was 50.6m b/day in 2008, is forecast to peak in 2011 at 51.1m b/day and fall to 50.2m b/day by 2014 (IEA Medium Term Oil Market Report July 2009) and even this might be optimistic. At the same time, global demand is forecast to move up from 85.8m b/day in 2008 to 89.0m b/day in 2014. Growth in supply from Brazil, the Caspian and the Canadian Oil Sands will not be enough to replace the shortfall from Mexico, Russia and the North Sea.
Equally important to our investment thesis at the moment is the U.S. natural gas price which we believe is currently very depressed. The Henry Hub price has fallen from around $13 at 30 June 2008 to below $4 today. Again, there is no great mystery to this: the U.S. natural gas market has always been one of boom and bust and this represents a bust in every sense. The market is over supplied, recessionary demand is weak, and the storage level is nearly 20% above the five-year average. However, the number of rigs drilling for natural gas has fallen from 1,606 to 687 in ten months and when this begins to eat into supply we expect to see a recovery in the gas price. We think the reduction in operating rigs could bring supply down by 3–3.5 Bcf/day by September 2009 and by 5–6 Bcf/day by year end which would set us up for a stronger gas price in 2010.
5. Outlook
So where does all of this leave us? We believe that in a $60 oil and $6 natural gas price world our stocks can make good profits. We continue to think that OPEC will support an oil price around that level and will cut effectively if oil falls and remains below $50, and as mentioned above, the U.S. natural gas market will rebalance itself over time as it has done before.
In terms of the broader economy, and specifically the U.S., my judgment is that quite a useful economic recovery is likely as vehicle sales and housing starts retrace from very depressed levels.
Overall, the Fund continues to seek to be well placed to benefit from the commodity price environment described above and to give investors exposure to a long-run rising oil price.

Tim Guinness 22 July 2009
The Fund invests in foreign securities which will involve political, economic and currency risks, greater volatility, and differences in accounting methods. The Fund is non-diversified meaning its assets may be concentrated in fewer individual holdings than diversified funds. Therefore, the Fund is more exposed to individual stock volatility than diversified funds. The Fund invests in smaller companies, which will involve additional risks such as limited liquidity and greater volatility.
The MSCI World Energy Index is an unmanaged index composed of more than 1, 400 stocks listed on exchanges in the U.S., Europe, Canada, Australia, New Zealand, and the Far East. The S&P 500 Index is a broad based unmanaged index of 500 stocks,
34
which is widely recognized as representative of the equity market in general. These indices are unmanaged, not available for investment and do not incur expenses.
Price to earnings ratio (PER) is calculated by dividing current price of the stocks by the company's trailing months' earnings per share. Earnings per share (EPS) is calculated by taking the total earnings divided by the number of shares outstanding.
Please refer to the Schedule of Investments for details on fund holdings. Current and future portfolio holdings are subject to risk.
The information provided herein represents the opinion of Guinness Atkinson Management for the period stated and is not intended to be a forecast of future events, a guarantee of future results, nor investment advice. Opinions, fund holdings and sector allocations are subject to change at any time and are not recommendations to buy or sell any security.
35
FUND HIGHLIGHTS at June 30, 2009 (Unaudited)
GUINNESS ATKINSON GLOBAL ENERGY FUND
| # of Holdings in Portfolio: | | | 41 | | |
| Portfolio Turnover: | | | 19.2 | % | |
| % of Stocks in Top 10: | | | 35.0 | % | |
| Fund Managers: | |
| Timothy W.N. Guinness | | | | | |
| Edmund Harriss | | | | | |
| Top 10 Holdings (% of net assets) | |
| Singapore Petroleum Co. Ltd. | | | 3.7 | % | | Petroleo Brasileiro SA | | | 3.5 | % | |
| Noble Energy, Inc. | | | 3.6 | % | | Imperial Oil Ltd. | | | 3.4 | % | |
| Occidental Petroleum Corporation | | | 3.6 | % | | Marathon Oil Corporation | | | 3.4 | % | |
| Repsol YPF SA | | | 3.5 | % | | Transocean Ltd. | | | 3.4 | % | |
| Eni SPA | | | 3.5 | % | | BP PLC | | | 3.4 | % | |
| Country Breakdown (% of net assets) | |
| United States | | | 41.7 | % | | Norway | | | 3.4 | % | |
| Canada | | | 17.1 | % | | Austria | | | 3.3 | % | |
| Britain | | | 4.6 | % | | France | | | 3.3 | % | |
| Singapore | | | 3.7 | % | | Netherlands | | | 3.2 | % | |
| Spain | | | 3.5 | % | | Hong Kong | | | 3.1 | % | |
| Italy | | | 3.5 | % | | Ireland | | | 2.0 | % | |
| Brazil | | | 3.5 | % | | China | | | 0.3 | % | |
| Switzerland | | | 3.4 | % | | | | | | | |
| Sector Breakdown (% of Investments) | |
| Oil/Integrated | | | 48.7 | % | | Oil Refining & Marketing | | | 3.7 | % | |
| Oil & Gas-Exploration & Production | | | 32.2 | % | | Machinery-General Industry | | | 0.3 | % | |
| Oil & Gas-Drilling | | | 8.6 | % | | | | | | | |
| Oil & Gas-Field Services | | | 6.5 | % | | | | | | | |
36
SCHEDULE OF INVESTMENTS
June 30, 2009 (Unaudited)
GUINNESS ATKINSON FUNDS - GLOBAL ENERGY FUND
| Shares | | COMMON STOCKS: 99.6% | | Value | |
| Machinery – General Industry: 0.3% | | | |
| | 914,780 | | | Shandong Molong Petroleum Machinery Co., Ltd. | | $ | 130,560 | | |
| Oil & Gas – Drilling: 8.5% | | | |
| | 68,070 | | | Patterson-UTI Energy, Inc. | | | 875,380 | | |
| | 18,391 | | | Transocean, Ltd.(a) | | | 1,366,267 | | |
| | 43,697 | | | Unit Corporation(a) | | | 1,204,726 | | |
| | | | 3,446,373 | | |
| Oil & Gas – Exploration & Production: 32.0% | | | |
| | 22,100 | | | Addax Petroleum Corporation | | | 937,276 | | |
| | 99,000 | | | Afren PLC(a) | | | 86,672 | | |
| | 20,370 | | | Anadarko Petroleum Corporation | | | 924,594 | | |
| | 11,609 | | | Apache Corporation | | | 837,589 | | |
| | 1,022,000 | | | CNOOC Ltd. | | | 1,258,952 | | |
| | 91,089 | | | Coastal Energy Co.(a) | | | 210,660 | | |
| | 135,659 | | | Dragon Oil PLC(a) | | | 814,357 | | |
| | 17,636 | | | EnCana Corporation | | | 874,408 | | |
| | 114,155 | | | Falkland Oil & Gas, Ltd.(a) | | | 173,408 | | |
| | 5,960 | | | Grey Wolf Exploration, Inc.(a) | | | 3,894 | | |
| | 26,986 | | | Newfield Exploration Co.(a) | | | 881,633 | | |
| | 59,121 | | | Nexen, Inc. | | | 1,284,433 | | |
| | 24,635 | | | Noble Energy | | | 1,452,726 | | |
| | 117,198 | | | OPTI Canada, Inc.(a) | | | 196,480 | | |
| | 34,720 | | | Pioneer Natural Resources Co. | | | 885,360 | | |
| | 56,400 | | | Swift Energy Co.(a) | | | 939,060 | | |
| | 62,740 | | | WesternZagros Resources Ltd.(a) | | | 86,843 | | |
| | 31,230 | | | Whiting Petroleum Corporation(a) | | | 1,098,047 | | |
| | | | 12,946,392 | | |
| Oil & Gas – Field Services: 6.5% | | | |
| | 63,800 | | | Halliburton Co. | | | 1,320,660 | | |
| | 99,880 | | | Helix Energy Solutions Group Inc.(a) | | | 1,085,696 | | |
| | 84,900 | | | Kentz Corporation | | | 215,021 | | |
| | | | 2,621,377 | | |
| Oil Refining & Marketing: 3.7% | | | |
| | 346,000 | | | Singapore Petroleum Co., Ltd. | | | 1,477,224 | | |
The accompanying notes are in integral part of these financial statements.
37
| Shares | | COMMON STOCKS: 99.6% (Continued) | | Value | |
| Oil/Integrated: 48.6% | | | |
| | 172,885 | | | BP PLC | | $ | 1,366,105 | | |
| | 31,928 | | | Conoco Phillips | | | 1,342,892 | | |
| | 59,000 | | | Eni SPA | | | 1,399,301 | | |
| | 21,943 | | | Hess Corporation | | | 1,179,436 | | |
| | 35,707 | | | Imperial Oil, Ltd. | | | 1,385,118 | | |
| | 45,900 | | | Marathon Oil Corporation | | | 1,382,967 | | |
| | 21,808 | | | Occidental Petroleum Corporation | | | 1,435,185 | | |
| | 36,033 | | | OMV AG | | | 1,354,646 | | |
| | 33,330 | | | Petro-Canada | | | 1,287,180 | | |
| | 41,860 | | | Petroleo Brasileiro SA - ADR | | | 1,396,450 | | |
| | 63,200 | | | Repsol YPF SA | | | 1,414,718 | | |
| | 52,971 | | | Royal Dutch Shell PLC | | | 1,327,299 | | |
| | 68,750 | | | Statoil ASA | | | 1,358,029 | | |
| | 20,750 | | | Suncor Energy, Inc. | | | 630,983 | | |
| | 24,800 | | | Total SA | | | 1,344,168 | | |
| | | | 19,604,477 | | |
| | | | | Total Common Stocks
(cost $44,709,088) | | | 40,226,403 | | |
| | | | | Total Investments
(cost $44,709,088): 99.6% | | | 40,226,403 | | |
| | | | | Other Assets less Liabilities: 0.4% | | | 142,450 | | |
| | | | | Net Assets: 100% | | $ | 40,368,853 | | |
Percentages stated as a percentage of net assets.
Abbreviations:
ADR: American Depository Receipts
Footnotes:
(a) Non-income producing security.
The accompanying notes are in integral part of these financial statements.
38
GLOBAL INNOVATORS FUND for the period ended June 30, 2009
1. Performance
AVERAGE ANNUALIZED TOTAL RETURNS
| | | 6 Months
(Actual) | | 1 Year
(Actual) | | 3 Years | | 5 Years | | 10 Years | |
| Fund | | | 16.15 | % | | | -23.90 | % | | | -4.72 | % | | | 1.89 | % | | | -1.73 | % | |
| Benchmark Index: | |
| S&P 500 | | | 3.19 | % | | | -26.20 | % | | | -8.21 | % | | | -2.24 | % | | | -2.22 | % | |
| NASDAQ Composite | | | 16.98 | % | | | -19.13 | % | | | -4.64 | % | | | -1.37 | % | | | -3.17 | % | |
The Fund's gross expense ratio is 1.40% per the Prospectus dated May 1, 2009. Guinness Atkinson Asset Management has contractually agreed to waive a portion of its advisory fees so that the Fund's ratio of expenses to average daily net assets will not exceed 1.98% through at least June 30, 2010. To the extent that the Advisor waives fees it may seek repayment of a portion or all of such amounts that any time within three fiscal years after the fiscal year in which such amounts were waived, subject to the applicable cap.
Performance data quoted represents past performance and does not guarantee future results. The investment return and principal value of an investment will fluctuate so that an investor's shares, when redeemed, may be worth more or less than their original cost. Current performance of the Fund may be lower or higher than the performance quoted. Performance data current to the most recent month end may be obtained by visiting www.gafunds.com, or calling (800) 916-6566.
The Fund imposes a 2% redemption fee on shares held less than 30 days. Performance data quoted does not reflect the 2% redemption fee on shares held less than 30 days. Total returns reflect a fee waiver in effect and in the absence of this waiver, the total returns would be lower.
The Global Innovators Fund in the first six months of 2009 produced a return of 16.15%. The fund outperformed the S&P 500 index which was up 3.19% and just underperformed the NASDAQ index which was up 16.98%. Over the last 5 and 10 years the total return continues to exceed that of both its benchmarks.
Performance improved in the first half of the year after what had been a difficult year in 2008. We benefited from being overweight the IT sector which recovered well. As can be seen from the following two charts we are considerably overweight the IT sector relative to the S&P 500 index and slightly underweight relative to the NASDAQ Composite index. This largely accounts for our outperformance relative to the S&P 500 index and slight underperformance relative to the NASDAQ Composite Index.
We also benefited from our positions in the energy and consumer sectors as the oil price recovered and expectations for consumer product demand stabilised somewhat.
The best performing holdings in the first half of the year were Amazon, Nvidia, Lenovo, Netflix and Samsung Electronics. The worst performing holdings have been Citigroup, AIG, Costco, Infospace and Parametric Technology.
39
GLOBAL INNOVATORS FUND
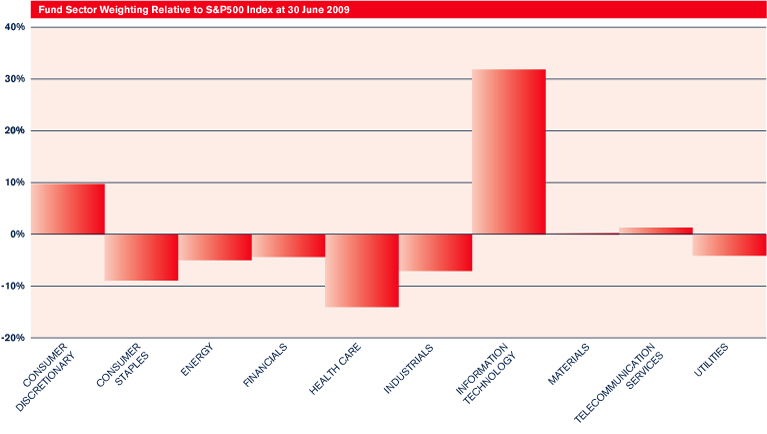

2. Activity
In the first half of 2009 our dealing was limited to dealing on flows and rebalancing.
40
3. Portfolio Position
The Portfolio consists of 30 holdings. Our largest weighting is in IT with 57.2% of the portfolio invested across hardware, software and internet focused businesses. 69.4% of the portfolio is invested in US companies, 21.3% in Asia and 9.3% in Europe.
The portfolio on the 30 June, by our calculations, had a PER (2009) of 18.7X (13% above the S&P500 at 30th June of 16.5X). Furthermore the stocks held by the portfolio were at that date on average 35% undervalued (i.e. 35% scope for appreciation) versus the market when we applied our discounted cash flow model to the individual constituents.
4. Investment Approach
In managing the Global Innovators Fund we seek companies that exhibit New Economy characteristics. Using stocks that have once been in the Wired 40 as our starting point we have created a global universe of leading innovative companies from a broad spectrum of industries that we continue to expand. We like quality companies that have innovation at the heart of their business.
Our multi-factor screening process applied to this universe to select the best 30 or so ideas and a deliberately low turnover form the basis of our investment approach. We pay close attention to four factors in screening all stocks considered for purchase. The four criteria in our screening process are: (a) value, meaning a disciplined quantitative methodology used to rank all companies on similar basis projecting their internal cash flows using consensus forecast and historic trend data and applying a common overall market determined discount rate to imply fair value and compare this to actual price); (b) business quality (quantitatively ranking companies for the attractiveness of their return on capital metrics); (c) improving results (1 and 3 month earnings estimates revisions); and (d) good recent market price performance (looking particularly for above trend momentum and rising volatility). This screening approach is supported by approp riate due diligence both on the quality of the quantitative inputs to the screening process, and of a more traditional form. Also top down "thematic" judgements will be used in the process of evaluating potential Fund purchases. and a regular sell discipline involving review of large movers in the portfolio is also employed.
We hope that over the months and years to come investors will find their faith in both our fund management and in the prospects for this fund.

Tim Guinness July 2009
The Fund invests in foreign securities which will involve political, economic and currency risks, greater volatility, and differences in accounting methods. The Fund is non-diversified meaning its assets may be concentrated in fewer individual holdings than diversified funds. Therefore, the Fund is more exposed to individual stock volatility than diversified funds. The Fund invests in smaller companies, which will involve additional risks such as limited liquidity and greater volatility.
The S&P 500 Index is a broad based unmanaged index of 500 stocks, which is widely recognized as representative of the equity market in general. The NASDAQ Composite Index is a market capitalization weighted index that is designed to represent the performance of the National Market System which includes over 5,000 stocks traded only over-the-counter and not on an exchange. These indices are unmanaged, not available for investment and do not incur expenses.
Price to earnings ratio (PER) is calculated by dividing current price of the stocks by the company's trailing months' earnings per share. Cash flow measures the cash generating capability of a company by adding non-cash charges (e.g. depreciation) and interest expense to pre-tax income.
Return on capital (ROC) is a measure of how effectively a company uses the money (borrowed or owned) invested in its operations. It is calculated by dividing net income by invested capital.
Please refer to the Schedule of Investments for details on fund holdings. Current and future portfolio holdings are subject to risk.
The information provided herein represents the opinion of Guinness Atkinson Management for the period stated and is not intended to be a forecast of future events, a guarantee of future results, nor investment advice. Opinions, fund holdings and sector allocations are subject to change at any time and are not recommendations to buy or sell any security.
41
FUND HIGHLIGHTS at June 30, 2009 (Unaudited)
GUINNESS ATKINSON GLOBAL INNOVATORS FUND
| # of Holdings in Portfolio: | | | 30 | | |
| Portfolio Turnover: | | | 4.9 | % | |
| % of Stocks in Top 10: | | | 43.5 | % | |
| Fund Managers: | |
| Timothy W.N. Guinness | | | | | |
| Edmund Harriss | | | | | |
| Top 10 Holdings (% of net assets) | |
| Lenovo Group Ltd. | | | 5.8 | % | | eBay Inc | | | 4.2 | % | |
| Wind River Systems, Inc. | | | 4.6 | % | | Parametric Technology Corporation | | | 4.0 | % | |
| Sony Corporation | | | 4.4 | % | | Schlumberger Ltd. | | | 4.0 | % | |
| Nokia Corporation | | | 4.3 | % | | TD Ameritrade Holding Corporation | | | 4.0 | % | |
| Samsung Electronics Co. Ltd. | | | 4.3 | % | | Garmin Ltd. | | | 3.9 | % | |
| Country Breakdown (% of net assets) | |
| United States | | | 72.3 | % | | South Korea | | | 4.3 | % | |
| Japan | | | 7.7 | % | | Taiwan | | | 3.5 | % | |
| Britain | | | 5.0 | % | | Israel | | | 3.0 | % | |
| Finland | | | 4.3 | % | | | | | | | |
| Sector Breakdown (% of Investments) | |
| E-Commerce/Products | | | 14.9 | % | | Computer Software | | | 4.6 | % | |
| Prepackaged Software | | | 12.8 | % | | Audio/Video Products | | | 4.4 | % | |
| Semiconductors | | | 10.7 | % | | Telecommunication Equipment | | | 4.3 | % | |
| Commercial Banks | | | 9.0 | % | | Steel-Producers | | | 3.5 | % | |
| Electronics | | | 8.1 | % | | Automobile Manufacturers | | | 3.3 | % | |
| Oil & Gas Producers | | | 7.5 | % | | Variety Store | | | 3.1 | % | |
| Computers | | | 5.8 | % | | Aerospace/Defense | | | 2.8 | % | |
| Telecommunications | | | 4.9 | % | | Multi-line Insurance | | | 0.3 | % | |
42
SCHEDULE OF INVESTMENTS
June 30, 2009 (Unaudited)
GUINNESS ATKINSON FUNDS - GLOBAL INNOVATORS FUND
| Shares | | COMMON STOCKS: 100.1% | | Value | |
| Aerospace/Defense: 2.8% | | | |
| | 13,250 | | | L-3 Communications Holdings, Inc. | | $ | 919,285 | | |
| Audio/Video Products: 4.4% | | | |
| | 56,228 | | | Sony Corporation - ADR | | | 1,454,056 | | |
| Automobile Manufacturers: 3.3% | | | |
| | 18,990 | | | Honda Motor Company - ADR | | | 519,756 | | |
| | 7,350 | | | Toyota Motor Corporation - ADR | | | 555,145 | | |
| | | | 1,074,901 | | |
| Commercial Banks: 9.0% | | | |
| | 137,850 | | | Citigroup, Inc. | | | 409,414 | | |
| | 25,984 | | | State Street Corporation | | | 1,226,445 | | |
| | 74,780 | | | TD Ameritrade Holding Corporation(a) | | | 1,311,641 | | |
| | | | 2,947,500 | | |
| Computer Software: 4.6% | | | |
| | 132,440 | | | Wind River Systems, Inc.(a) | | | 1,517,762 | | |
| Computers: 5.8% | | | |
| | 5,114,000 | | | Lenovo Group, Ltd. | | | 1,920,212 | | |
| E-Commerce/Products: 14.9% | | | |
| | 14,820 | | | Amazon.Com, Inc.(a) | | | 1,239,841 | | |
| | 80,390 | | | eBay, Inc.(a) | | | 1,377,081 | | |
| | 179,620 | | | Infospace, Inc.(a) | | | 1,190,881 | | |
| | 26,590 | | | NetFlix, Inc.(a) | | | 1,099,231 | | |
| | | | 4,907,034 | | |
| Electronics: 8.2% | | | |
| | 53,830 | | | Garmin, Ltd. | | | 1,282,231 | | |
| | 5,990 | | | Samsung Electronics Co., Ltd. - GDR | | | 1,397,168 | | |
| | | | 2,679,399 | | |
| Multi-line Insurance: 0.3% | | | |
| | 81,665 | | | American International Group, Inc. | | | 94,731 | | |
| Oil & Gas Producers: 7.5% | | | |
| | 23,850 | | | BP PLC - ADR | | | 1,137,168 | | |
| | 24,430 | | | Schlumberger, Ltd. | | | 1,321,907 | | |
| | | | 2,459,075 | | |
| Prepackaged Software: 12.8% | | | |
| | 41,950 | | | Check Point Software Technologies, Ltd.(a) | | | 984,567 | | |
| | 27,118 | | | Microsoft Corporation | | | 644,595 | | |
| | 58,460 | | | Oracle Corporation | | | 1,252,213 | | |
| | 113,480 | | | Parametric Technology Corporation(a) | | | 1,326,581 | | |
| | | | 4,207,956 | | |
The accompanying notes are in integral part of these financial statements.
43
| Shares | | COMMON STOCKS: 100.1% (Continued) | | Value | |
| Semiconductors: 10.7% | | | |
| | 98,640 | | | Applied Materials, Inc. | | $ | 1,082,081 | | |
| | 112,665 | | | Nvidia Corporation(a) | | | 1,271,988 | | |
| | 122,706 | | | Taiwan Semiconductor Manufacturing Co., Ltd. - ADR | | | 1,154,663 | | |
| | | | 3,508,732 | | |
| Steel-Producers: 3.5% | | | |
| | 26,080 | | | Nucor Corporation | | | 1,158,734 | | |
| Telecommunication Equipment: 4.3% | | | |
| | 96,222 | | | Nokia Corporation - ADR | | | 1,402,917 | | |
| Telecommunications: 4.9% | | | |
| | 262,490 | | | Qwest Communications International, Inc. | | | 1,089,334 | | |
| | 26,355 | | | Vodafone Group PLC - ADR | | | 513,659 | | |
| | | | 1,602,993 | | |
| Variety Store: 3.1% | | | |
| | 22,450 | | | Costco Wholesale Corporation | | | 1,025,965 | | |
| | | | | Total Common Stocks
(cost $47,872,294) | | | 32,881,252 | | |
| | | | | Total Investments
(cost $47,872,294): 100.1% | | | 32,881,252 | | |
| | | | | Liabilities in Excess of Other Assets: (0.1)% | | | (27,648 | ) | |
| | | | | Net Assets: 100% | | $ | 32,853,604 | | |
Percentages stated as a percentage of net assets.
Abbreviations:
ADR: American Depository Receipts
GDR: Global Depository Receipts
Footnotes:
(a) Non-income producing security.
The accompanying notes are in integral part of these financial statements.
44
STATEMENTS OF ASSETS AND LIABILITIES
at June 30, 2009 (Unaudited)
| | | Alternative
Energy
Fund | | Asia
Focus
Fund | | Asia Pacific
Dividend
Fund | |
| Assets | |
| Investments in securities, at cost | | $ | 95,041,441 | | | $ | 50,145,421 | | | $ | 10,505,659 | | |
| Investments in securities, at value | | $ | 62,196,850 | | | $ | 44,849,244 | | | $ | 7,236,801 | | |
| Cash | | | 1,571,109 | | | | 1,715,702 | | | | 71,179 | | |
Cash denominated in foreign currency
(cost of $63, $824,558, $42,815 respectively) | | | 63 | | | | 821,857 | | | | 42,675 | | |
| Receivables: | |
| Fund shares sold | | | 56,394 | | | | 6,054 | | | | 1,900 | | |
| Dividends and interest | | | 99,930 | | | | 110,154 | | | | 17,630 | | |
| Tax Reclaim | | | 18,398 | | | | 5,297 | | | | — | | |
| Prepaid expenses | | | 14,001 | | | | 5,831 | | | | 10,704 | | |
| Total assets | | | 63,956,745 | | | | 47,514,139 | | | | 7,380,889 | | |
| Liabilities | |
| Payables: | |
| Fund shares redeemed | | | 32,030 | | | | 9,742 | | | | 3,031 | | |
| Due to advisor | | | 60,193 | | | | 52,004 | | | | 6,732 | | |
| Accrued administration expense | | | 5,404 | | | | 3,850 | | | | 1,584 | | |
| Accrued shareholder servicing plan fees | | | 8,208 | | | | 5,340 | | | | 1,111 | | |
| Other accrued expenses | | | 85,912 | | | | 45,416 | | | | 47,927 | | |
| Deferred trustees' compensation (Note 3) | | | 10,835 | | | | 27,476 | | | | 6,096 | | |
| Total liabilities | | | 202,582 | | | | 143,828 | | | | 66,481 | | |
| Net Assets | | $ | 63,754,163 | | | $ | 47,370,311 | | | $ | 7,314,408 | | |
| Number of shares issued and outstanding (unlimited shares authorized no par value) | | | 10,332,644 | | | | 3,425,262 | | | | 785,181 | | |
| Net asset value per share | | $ | 6.17 | | | $ | 13.83 | | | $ | 9.32 | | |
| Components of Net Assets | |
| Paid-in capital | | $ | 143,553,714 | | | $ | 56,139,307 | | | $ | 13,659,061 | | |
| Accumulated net investment income (loss) | | | (1,776,951 | ) | | | 213,989 | | | | 386,214 | | |
Accumulated net realized loss on investments
and foreign currency | | | (45,179,150 | ) | | | (3,683,693 | ) | | | (3,461,938 | ) | |
| Net unrealized appreciation (depreciation) on: | |
| Investments | | | (32,844,591 | ) | | | (5,296,177 | ) | | | (3,268,858 | ) | |
| Foreign Currency | | | 1,141 | | | | (3,115 | ) | | | (71 | ) | |
| Net Assets | | $ | 63,754,163 | | | $ | 47,370,311 | | | $ | 7,314,408 | | |
The accompanying notes are an integral part of these financial statements.
45
STATEMENTS OF ASSETS AND LIABILITIES
at June 30, 2009 (Unaudited)
| | | China &
Hong Kong
Fund | | Global
Energy
Fund | | Global
Innovators
Fund | |
| Assets | |
| Investments in securities, at cost | | $ | 155,888,744 | | | $ | 44,709,088 | | | $ | 47,872,294 | | |
| Investments in securities, at value | | $ | 169,207,127 | | | $ | 40,226,403 | | | $ | 32,881,252 | | |
| Cash | | | 4,674,498 | | | | 42,283 | | | | 150,131 | | |
| Receivables: | |
| Fund shares sold | | | 352,090 | | | | 104,171 | | | | 13,452 | | |
| Dividends and interest | | | 690,240 | | | | 67,907 | | | | 35,323 | | |
| Tax Reclaim | | | — | | | | 13,139 | | | | — | | |
| Prepaid expenses | | | 25,654 | | | | 17,173 | | | | 7,478 | | |
| Total assets | | | 174,949,609 | | | | 40,471,076 | | | | 33,087,636 | | |
| Liabilities | |
| Payables: | |
| Fund shares redeemed | | | 68,507 | | | | 3,798 | | | | 124,814 | | |
| Due to advisor | | | 145,059 | | | | 34,289 | | | | 21,613 | | |
| Accrued administration expense | | | 11,422 | | | | 2,164 | | | | 1,740 | | |
| Accrued shareholder servicing plan fees | | | 18,774 | | | | 5,121 | | | | 4,025 | | |
| Other accrued expenses | | | 131,943 | | | | 42,747 | | | | 43,167 | | |
| Deferred trustees' compensation (Note 3) | | | 55,293 | | | | 14,104 | | | | 38,673 | | |
| Total liabilities | | | 430,998 | | | | 102,223 | | | | 234,032 | | |
| Net Assets | | $ | 174,518,611 | | | $ | 40,368,853 | | | $ | 32,853,604 | | |
| Number of shares issued and outstanding (unlimited shares authorized no par value) | | | 6,573,219 | | | | 1,965,704 | | | | 2,522,924 | | |
| Net asset value per share | | $ | 26.55 | | | $ | 20.54 | | | $ | 13.02 | | |
| Components of Net Assets | |
| Paid-in capital | | $ | 159,168,298 | | | $ | 47,421,046 | | | $ | 93,309,133 | | |
| Accumulated net investment income (loss) | | | 2,818,080 | | | | (82,410 | ) | | | 57,792 | | |
Accumulated net realized loss on investments
and foreign currency | | | (785,677 | ) | | | (2,486,311 | ) | | | (45,522,279 | ) | |
| Net unrealized appreciation (depreciation) on: | |
| Investments | | | 13,318,383 | | | | (4,482,685 | ) | | | (14,991,042 | ) | |
| Foreign Currency | | | (473 | ) | | | (787 | ) | | | — | | |
| Net Assets | | $ | 174,518,611 | | | $ | 40,368,853 | | | $ | 32,853,604 | | |
The accompanying notes are an integral part of these financial statements.
46
STATEMENTS OF OPERATIONS
For the six months ended June 30, 2009 (Unaudited)
| | | Alternative
Energy
Fund | | Asia
Focus
Fund | | Asia Pacific
Dividend
Fund | |
| Investment Income | |
| Income | |
| Dividends * | | $ | 324,321 | | | $ | 451,313 | | | $ | 109,696 | | |
| Interest | | | 11,708 | | | | 2,548 | | | | 1,538 | | |
| Total income | | | 336,029 | | | | 453,861 | | | | 111,234 | | |
| Expenses | |
| Advisory fees (Note 3) | | | 252,299 | | | | 130,986 | | | | 28,001 | | |
| Administration fees | | | 26,030 | | | | 12,698 | | | | 10,417 | | |
| Transfer agent fees | | | 50,495 | | | | 22,720 | | | | 10,464 | | |
| Custody fees | | | 12,690 | | | | 7,680 | | | | 4,022 | | |
| Fund accounting fees | | | 22,110 | | | | 17,094 | | | | 13,699 | | |
| Audit fees | | | 8,740 | | | | 11,136 | | | | 8,526 | | |
| Legal fees | | | 12,520 | | | | 5,977 | | | | 1,454 | | |
| Trustees' fees | | | 9,250 | | | | 10,855 | | | | 4,929 | | |
| Shareholder servicing plan fees (Note 4) | | | 45,621 | | | | 17,366 | | | | 5,269 | | |
| Reports to shareholders | | | 20,800 | | | | 8,050 | | | | 3,963 | | |
| Registration expense | | | 12,313 | | | | 9,194 | | | | 8,037 | | |
| Insurance expense | | | 3,987 | | | | 1,738 | | | | 479 | | |
| Miscellaneous | | | 9,975 | | | | 3,971 | | | | 1,338 | | |
| Total expenses | | | 486,830 | | | | 259,465 | | | | 100,598 | | |
| Less: Fees waived and expenses absorbed (Note 3) | | | — | | | | (564 | ) | | | (45,156 | ) | |
| Interest expense | | | 106 | | | | 105 | | | | 51 | | |
| Net expenses | | | 486,936 | | | | 259,006 | | | | 55,493 | | |
| Net investment income (loss) | | | (150,907 | ) | | | 194,855 | | | | 55,741 | | |
| Realized and unrealized gain (loss) on investments and foreign currency | |
| Net realized gain (loss) on: | |
| Investments | | | (6,656,333 | ) | | | 50,294 | | | | (668,272 | ) | |
| Foreign currency | | | (1,133,600 | ) | | | (117,072 | ) | | | (167,591 | ) | |
| Change in unrealized appreciation (depreciation) on: | |
| Investments | | | 18,022,756 | | | | 9,240,730 | | | | 2,473,603 | | |
| Foreign currency | | | 1,248 | | | | (2,921 | ) | | | 119 | | |
| Net realized and unrealized gain on investments and foreign currency | | | 10,234,071 | | | | 9,171,031 | | | | 1,637,859 | | |
| Net increase in net assets resulting from operations | | $ | 10,083,164 | | | $ | 9,365,886 | | | $ | 1,693,600 | | |
* Net of foreign tax withheld of $51,998 for Alternative Energy Fund, $36,640 for Asia Focus Fund and $11,574 for the Asia Pacific Dividend Fund.
The accompanying notes are an integral part of these financial statements.
47
STATEMENTS OF OPERATIONS
For the six months ended June 30, 2009 (Unaudited)
| | | China &
Hong Kong
Fund | | Global
Energy
Fund | | Global
Innovators
Fund | |
| Investment Income | |
| Income | |
| Dividends * | | $ | 1,993,473 | | | $ | 469,907 | | | $ | 229,973 | | |
| Interest | | | 84 | | | | 2,242 | | | | — | | |
| Total income | | | 1,993,557 | | | | 472,149 | | | | 229,973 | | |
| Expenses | |
| Advisory fees (Note 3) | | | 664,076 | | | | 125,516 | | | | 109,972 | | |
| Administration fees | | | 58,399 | | | | 9,558 | | | | 9,917 | | |
| Transfer agent fees | | | 60,870 | | | | 23,215 | | | | 36,975 | | |
| Custody fees | | | 23,115 | | | | 5,890 | | | | 2,690 | | |
| Fund accounting fees | | | 38,125 | | | | 15,659 | | | | 14,661 | | |
| Audit fees | | | 11,936 | | | | 10,786 | | | | 11,236 | | |
| Legal fees | | | 30,625 | | | | 7,504 | | | | 7,036 | | |
| Trustees' fees | | | 25,006 | | | | 8,065 | | | | 14,005 | | |
| Shareholder servicing plan fees (Note 4) | | | 99,115 | | | | 23,134 | | | | 21,696 | | |
| Reports to shareholders | | | 19,585 | | | | 8,547 | | | | 12,299 | | |
| Registration expense | | | 11,452 | | | | 10,013 | | | | 9,419 | | |
| Insurance expense | | | 9,895 | | | | 2,186 | | | | 2,300 | | |
| Miscellaneous | | | 21,170 | | | | 5,726 | | | | 5,099 | | |
| Total expenses | | | 1,073,369 | | | | 255,799 | | | | 257,305 | | |
| Less: Fees waived and expenses absorbed (Note 3) | | | — | | | | (13,243 | ) | | | (30,029 | ) | |
| Interest expense | | | — | | | | 152 | | | | 34 | | |
| Net expenses | | | 1,073,369 | | | | 242,708 | | | | 227,310 | | |
| Net investment income | | | 920,188 | | | | 229,441 | | | | 2,663 | | |
| Realized and unrealized gain (loss) on investments and foreign currency | |
| Net realized gain (loss) on: | |
| Investments | | | 5,961 | | | | 450,232 | | | | (394,930 | ) | |
| Foreign currency | | | (1,677 | ) | | | (35,417 | ) | | | 47 | | |
| Change in unrealized appreciation (depreciation) on: | |
| Investments | | | 46,955,288 | | | | 8,362,849 | | | | 4,870,243 | | |
| Foreign currency | | | (473 | ) | | | 120 | | | | — | | |
| Net realized and unrealized gain on investments and foreign currency | | | 46,959,099 | | | | 8,777,784 | | | | 4,475,360 | | |
| Net increase in net assets resulting from operations | | $ | 47,879,287 | | | $ | 9,007,225 | | | $ | 4,478,023 | | |
* Net of foreign tax withheld of $134,012 for China & Hong Kong Fund, $50,135 for Global Energy Fund and $15,554 for the Global Innovators Fund.
The accompanying notes are an integral part of these financial statements.
48
STATEMENTS OF CHANGES IN NET ASSETS
| | | Alternative Energy Fund | | Asia Focus Fund | | Asia Pacific Dividend Fund | |
| | | Six Months Ended
June 30, 2009 * | | Year Ended
December 31, 2008 | | Six Months Ended
June 30, 2009 * | | Year Ended
December 31, 2008 | | Six Months Ended
June 30, 2009 * | | Year Ended
December 31, 2008 | |
Increase (decrease) in
net assets from: | |
| Operations | |
| Net investment income (loss) | | $ | (150,907 | ) | | $ | (906,620 | ) | | $ | 194,855 | | | $ | 1,175,470 | | | $ | 55,741 | | | $ | 750,995 | | |
| Net realized gain (loss) on: | |
| Investments | | | (6,656,333 | ) | | | (35,114,839 | ) | | | 50,294 | | | | 466,697 | | | | (668,272 | ) | | | (2,626,075 | ) | |
| Foreign currency | | | (1,133,600 | ) | | | (705,005 | ) | | | (117,072 | ) | | | 365,724 | | | | (167,591 | ) | | | 606,552 | | |
Change in net unrealized
appreciation (depreciation) on: | |
| Investments | | | 18,022,756 | | | | (68,104,600 | ) | | | 9,240,730 | | | | (37,029,047 | ) | | | 2,473,603 | | | | (6,558,377 | ) | |
| Foreign currency | | | 1,248 | | | | 3,911 | | | | (2,921 | ) | | | (392 | ) | | | 119 | | | | 526 | | |
Net increase (decrease) in net
assets resulting from
operations | | | 10,083,164 | | | | (104,827,153 | ) | | | 9,365,886 | | | | (35,021,548 | ) | | | 1,693,600 | | | | (7,826,379 | ) | |
| Distributions to shareholders | |
| From net investment income | | | — | | | | (56,152 | ) | | | — | | | | (1,481,421 | ) | | | (52,816 | ) | | | (618,757 | ) | |
| From net realized gain | | | — | | | | (3,209,321 | ) | | | — | | | | — | | | | — | | | | (538,081 | ) | |
Decrease in net assets
from distributions | | | — | | | | (3,265,473 | ) | | | — | | | | (1,481,421 | ) | | | (52,816 | ) | | | (1,156,838 | ) | |
| Capital share transactions | |
| Proceeds from shares sold | | | 12,862,147 | | | | 80,171,434 | | | | 17,947,563 | | | | 4,969,746 | | | | 1,316,649 | | | | 9,399,423 | | |
| Proceeds from shares reinvested | | | — | | | | 3,123,216 | | | | — | | | | 1,393,044 | | | | 50,756 | | | | 1,118,185 | | |
| Cost of shares redeemed | | | (6,338,555 | ) | | | (89,824,819 | ) | | | (1,723,471 | ) | | | (26,261,994 | ) | | | (963,238 | ) | | | (28,022,013 | ) | |
| Redemption fee proceeds | | | 2,476 | | | | 47,017 | | | | 1,161 | | | | 7,441 | | | | 1,682 | | | | 4,518 | | |
Net increase (decrease) from
capital share transactions | | | 6,526,068 | | | | (6,483,152 | ) | | | 16,225,253 | | | | (19,891,763 | ) | | | 405,849 | | | | (17,499,887 | ) | |
Total increase (decrease) in
net assets | | | 16,609,232 | | | | (114,575,778 | ) | | | 25,591,139 | | | | (56,394,732 | ) | | | 2,046,633 | | | | (26,483,104 | ) | |
| Net assets | |
| Beginning of period | | | 47,144,931 | | | | 161,720,709 | | | | 21,779,172 | | | | 78,173,904 | | | | 5,267,775 | | | | 31,750,879 | | |
| End of period | | $ | 63,754,163 | | | $ | 47,144,931 | | | $ | 47,370,311 | | | $ | 21,779,172 | | | $ | 7,314,408 | | | $ | 5,267,775 | | |
Accumulated net investment
income (loss) | | $ | (1,776,951 | ) | | $ | (1,626,044 | ) | | $ | 213,989 | | | $ | 19,134 | | | $ | 386,214 | | | $ | 383,289 | | |
| Capital share activity | |
| Shares sold | | | 2,445,378 | | | | 6,652,487 | | | | 1,304,865 | | | | 264,117 | | | | 153,645 | | | | 583,170 | | |
| Shares issued on reinvestment | | | — | | | | 606,398 | | | | — | | | | 147,255 | | | | 6,213 | | | | 116,776 | | |
| Shares redeemed | | | (1,282,093 | ) | | | 8,040,199 | | | | (167,728 | ) | | | (1,386,566 | ) | | | (126,922 | ) | | | (1,843,327 | ) | |
Net increase (decrease) in
shares outstanding | | | 1,163,285 | | | | 15,299,084 | | | | 1,137,137 | | | | (975,194 | ) | | | 32,936 | | | | (1,143,381 | ) | |
* Unaudited.
The accompanying notes are an integral part of these financial statements.
49
STATEMENTS OF CHANGES IN NET ASSETS
| | | China & Hong Kong Fund | | Global Energy Fund | | Global Innovators Fund | |
| | | Six Months Ended
June 30, 2009 * | | Year Ended
December 31, 2008 | | Six Months Ended
June 30, 2009 * | | Year Ended
December 31, 2008 | | Six Months Ended
June 30, 2009 * | | Year Ended
December 31, 2008 | |
Increase (decrease) in
net assets from: | |
| Operations | |
| Net investment income | | $ | 920,188 | | | $ | 4,290,824 | | | $ | 229,441 | | | $ | 482,874 | | | $ | 2,663 | | | $ | 1,551,304 | | |
| Net realized gain (loss) on: | |
| Investments | | | 5,961 | | | | 7,590,319 | | | | 450,232 | | | | (1,301,999 | ) | | | (394,930 | ) | | | 2,723,192 | | |
| Foreign currency | | | (1,677 | ) | | | 213,150 | | | | (35,417 | ) | | | (730,032 | ) | | | 47 | | | | 91,507 | | |
Change in net unrealized
appreciation (depreciation) on: | |
| Investments | | | 46,955,288 | | | | (159,421,621 | ) | | | 8,362,849 | | | | (33,526,117 | ) | | | 4,870,243 | | | | (33,161,655 | ) | |
| Foreign currency | | | (473 | ) | | | (20 | ) | | | 120 | | | | (1,629 | ) | | | — | | | | 1,195 | | |
Net increase (decrease) in net
assets resulting from
operations | | | 47,879,287 | | | | (147,327,348 | ) | | | 9,007,225 | | | | (35,076,903 | ) | | | 4,478,023 | | | | (28,794,457 | ) | |
| Distributions to shareholders | |
| From net investment income | | | — | | | | (3,332,293 | ) | | | — | | | | — | | | | — | | | | (1,527,390 | ) | |
| From net realized gain | | | — | | | | (477,128 | ) | | | — | | | | (1,305,040 | ) | | | — | | | | — | | |
Decrease in net assets
from distributions | | | — | | | | (3,809,421 | ) | | | — | | | | (1,305,040 | ) | | | — | | | | (1,527,390 | ) | |
| Capital share transactions | |
| Proceeds from shares sold | | | 17,617,809 | | | | 77,708,161 | | | | 7,269,123 | | | | 29,358,452 | | | | 1,623,676 | | | | 9,332,518 | | |
| Proceeds from shares reinvested | | | 588 | | | | 3,730,751 | | | | — | | | | 1,191,223 | | | | 108 | | | | 1,488,756 | | |
| Cost of shares redeemed | | | (14,311,659 | ) | | | (100,248,518 | ) | | | (6,068,853 | ) | | | (33,735,772 | ) | | | (2,861,895 | ) | | | (23,720,926 | ) | |
| Redemption fee proceeds | | | 18,032 | | | | 96,461 | | | | 5,173 | | | | 19,088 | | | | 100 | | | | 1,594 | | |
Net increase (decrease) from
capital share transactions | | | 3,324,770 | | | | (18,713,145 | ) | | | 1,205,443 | | | | (3,167,009 | ) | | | (1,238,011 | ) | | | (12,898,058 | ) | |
Total increase (decrease)
in net assets | | | 51,204,057 | | | | (169,849,914 | ) | | | 10,212,668 | | | | (39,548,952 | ) | | | 3,240,012 | | | | (43,219,905 | ) | |
| Net assets | |
| Beginning of period | | | 123,314,554 | | | | 293,164,468 | | | | 30,156,185 | | | | 69,705,137 | | | | 29,613,592 | | | | 72,833,497 | | |
| End of period | | $ | 174,518,611 | | | $ | 123,314,554 | | | $ | 40,368,853 | | | $ | 30,156,185 | | | $ | 32,853,604 | | | $ | 29,613,592 | | |
Accumulated net investment
income (loss) | | $ | 2,818,080 | | | $ | 1,897,892 | | | $ | (82,410 | ) | | $ | (311,851 | ) | | $ | 57,792 | | | $ | 55,129 | | |
| Capital share activity | |
| Shares sold | | | 767,134 | | | | 2,576,016 | | | | 391,835 | | | | 929,313 | | | | 133,989 | | | | 516,472 | | |
| Shares issued on reinvestment | | | 32 | | | | 198,652 | | | | — | | | | 76,803 | | | | 10 | | | | 134,729 | | |
| Shares redeemed | | | (691,308 | ) | | | (3,092,551 | ) | | | (349,553 | ) | | | (1,270,482 | ) | | | (252,963 | ) | | | (1,368,355 | ) | |
Net increase (decrease) in
shares outstanding | | | 75,858 | | | | (317,883 | ) | | | 42,282 | | | | (264,366 | ) | | | (118,964 | ) | | | (717,154 | ) | |
* Unaudited.
The accompanying notes are an integral part of these financial statements.
50
FINANCIAL HIGHLIGHTS
For a capital share outstanding throughout the period
| | | Six Months
Ended | | Year Ended December 31, | | March 31, 2006(2)
Through | |
| Alternative Energy Fund | | June 30, 2009(1) | | 2008 | | 2007 | | December 31, 2006 | |
| Net asset value, beginning of period | | $ | 5.14 | | | $ | 16.25 | | | $ | 11.47 | | | $ | 12.50 | | |
| Income from investment operations: | |
| Net investment income (loss) | | | 0.01 | | | | (0.10 | ) | | | (0.05 | ) | | | (0.11 | ) | |
Net realized and unrealized gain (loss)
on investments and foreign currency | | | 1.02 | | | | (10.64 | ) | | | 4.93 | | | | (0.93 | ) | |
| Total from investment operations | | | 1.03 | | | | (10.74 | ) | | | 4.88 | | | | (1.04 | ) | |
| Less distributions: | |
| From net investment income | | | — | | | | (0.01 | ) | | | — | | | | — | | |
| From net realized gain | | | — | | | | (0.37 | ) | | | (0.11 | ) | | | — | | |
| Total distributions | | | — | | | | (0.38 | ) | | | (0.11 | ) | | | — | | |
| Redemption fee proceeds | | | — | (3) | | | 0.01 | | | | 0.01 | | | | 0.01 | | |
| Net asset value, end of period | | $ | 6.17 | | | $ | 5.14 | | | $ | 16.25 | | | $ | 11.47 | | |
| Total return | | | 20.04 | %(4) | | | (66.05 | )% | | | 42.68 | % | | | (8.24 | )%(4) | |
| Ratios/supplemental data: | |
| Net assets, end of period (millions) | | $ | 63.8 | | | $ | 47.1 | | | $ | 161.7 | | | $ | 15.7 | | |
| Ratio of expenses to average net assets: | |
| Before fees waived | | | 1.93 | % | | | 1.69 | % | | | 1.64 | % | | | 2.60 | %(5) | |
| After fees waived | | | 1.93 | % | | | 1.69 | % | | | 1.64 | % | | | 1.98 | %(5) | |
| After fees waived excluding interest expense(6) | | | 1.93 | % | | | 1.67 | % | | | 1.62 | % | | | 1.97 | %(5) | |
| Ratio of net investment loss to average net assets: | |
| Before fees waived | | | (0.60 | )% | | | (0.80 | )% | | | (0.90 | )% | | | (2.18 | )%(5) | |
| After fees waived | | | (0.60 | )% | | | (0.80 | )% | | | (0.90 | )% | | | (1.56 | )%(5) | |
| Portfolio turnover rate | | | 8.77 | %(4) | | | 94.76 | % | | | 47.41 | % | | | 21.71 | %(4) | |
(1) Unaudited
(2) Commencement of Operations.
(3) Amount represents less than $0.01 per share.
(4) Not annualized.
(5) Annualized.
(6) The Advisor has contractually agreed to limit the operating expenses of the Fund to 1.98%, excluding interest expense, expenses related to dividends on short positions, brokerage commissions, taxes and other extraordinary expenses. See Note 3.
The accompanying notes are an integral part of these financial statements.
51
FINANCIAL HIGHLIGHTS
For a capital share outstanding throughout the period
| | | Six Months
Ended | | Year Ended December 31, | |
| Asia Focus Fund | | June 30, 2009(1) | | 2008 | | 2007 | | 2006 | | 2005 | | 2004 | |
| Net asset value, beginning of period | | $ | 9.52 | | | $ | 23.96 | | | $ | 16.60 | | | $ | 12.38 | | | $ | 10.40 | | | $ | 9.51 | | |
| Income from investment operations: | |
| Net investment income | | | 0.05 | | | | 0.55 | | | | 0.27 | | | | 0.24 | | | | 0.16 | | | | 0.06 | | |
Net realized and unrealized gain (loss)
on investments and foreign currency | | | 4.26 | | | | (14.30 | ) | | | 7.35 | | | | 4.18 | | | | 2.00 | | | | 0.89 | | |
| Total from investment operations | | | 4.31 | | | | (13.75 | ) | | | 7.62 | | | | 4.42 | | | | 2.16 | | | | 0.95 | | |
| Less distributions: | |
| From net investment income | | | — | | | | (0.69 | ) | | | (0.28 | ) | | | (0.24 | ) | | | (0.18 | ) | | | (0.06 | ) | |
| Total distributions | | | — | | | | (0.69 | ) | | | (0.28 | ) | | | (0.24 | ) | | | (0.18 | ) | | | (0.06 | ) | |
| Redemption fee proceeds | | | — | (2) | | | — | (2) | | | 0.02 | | | | 0.04 | | | | — | (2) | | | — | (2) | |
| Net asset value, end of period | | $ | 13.83 | | | $ | 9.52 | | | $ | 23.96 | | | $ | 16.60 | | | $ | 12.38 | | | $ | 10.40 | | |
| Total return | | | 45.27 | %(3) | | | (57.38 | )% | | | 46.00 | % | | | 36.15 | % | | | 20.83 | % | | | 10.01 | % | |
| Ratios/supplemental data: | |
| Net assets, end of period (millions) | | $ | 47.4 | | | $ | 21.8 | | | $ | 78.2 | | | $ | 49.3 | | | $ | 36.5 | | | $ | 30.6 | | |
| Ratio of expenses to average net assets: | |
| Before fees waived | | | 1.98 | % | | | 1.75 | % | | | 1.69 | % | | | 1.84 | % | | | 1.87 | % | | | 2.04 | % | |
| After fees waived | | | 1.98 | % | | | 1.75 | % | | | 1.69 | % | | | 1.84 | % | | | 1.87 | % | | | 1.98 | % | |
| After fees waived excluding interest expense(4) | | | 1.98 | % | | | 1.70 | % | | | 1.63 | % | | | 1.81 | % | | | 1.86 | % | | | 1.96 | % | |
| Ratio of net investment income to average net assets: | |
| Before fees waived | | | 1.49 | % | | | 2.55 | % | | | 1.34 | % | | | 1.48 | % | | | 1.41 | % | | | 0.51 | % | |
| After fees waived | | | 1.49 | % | | | 2.55 | % | | | 1.34 | % | | | 1.48 | % | | | 1.41 | % | | | 0.57 | % | |
| Portfolio turnover rate | | | 7.93 | %(3) | | | 28.89 | % | | | 31.17 | % | | | 95.68 | % | | | 18.25 | % | | | 32.41 | % | |
(1) Unaudited
(2) Amount represents less than $0.01 per share.
(3) Not annualized.
(4) The Advisor has contractually agreed to limit the operating expenses of the Fund to 1.98%, excluding interest expense, expenses related to dividends on short positions, borkerage commissions, taxes and other extraordinary expenses. See Note 3.
The accompanying notes are an integral part of these financial statements.
52
FINANCIAL HIGHLIGHTS
For a capital share outstanding throughout the period
| | | Six Months
Ended | | Year Ended December 31, | | March 31, 2006(2)
Through | |
| Asia Pacific Dividend Fund | | June 30, 2009(1) | | 2008 | | 2007 | | December 31, 2006 | |
| Net asset value, beginning of period | | $ | 7.00 | | | $ | 16.75 | | | $ | 13.56 | | | $ | 12.50 | | |
| Income from investment operations: | |
| Net investment income | | | 0.05 | | | | 0.75 | | | | 0.24 | | | | 0.25 | | |
Net realized and unrealized gain (loss)
on investments and foreign currency | | | 2.34 | | | | (9.22 | ) | | | 3.32 | | | | 1.03 | | |
| Total from investment operations | | | 2.39 | | | | (8.47 | ) | | | 3.56 | | | | 1.28 | | |
| Less distributions: | |
| From net investment income | | | (0.07 | ) | | | (0.51 | ) | | | (0.27 | ) | | | (0.23 | ) | |
| From net realized gain | | | — | | | | (0.78 | ) | | | (0.11 | ) | | | — | | |
| Total distributions | | | (0.07 | ) | | | (1.29 | ) | | | (0.38 | ) | | | (0.23 | ) | |
| Redemption fee proceeds | | | — | (3) | | | 0.01 | | | | 0.01 | | | | 0.01 | | |
| Net asset value, end of period | | $ | 9.32 | | | $ | 7.00 | | | $ | 16.75 | | | $ | 13.56 | | |
| Total return | | | 34.29 | %(4) | | | (51.74 | )% | | | 26.30 | % | | | 10.59 | %(4) | |
| Ratios/supplemental data: | |
| Net assets, end of period (millions) | | $ | 7.3 | | | $ | 5.3 | | | $ | 31.8 | | | $ | 1.1 | | |
| Ratio of expenses to average net assets: | |
| Before fees waived | | | 3.59 | % | | | 2.33 | % | | | 2.09 | % | | | 17.86 | %(5) | |
| After fees waived | | | 1.98 | % | | | 2.10 | % | | | 1.98 | % | | | 1.98 | %(5) | |
| After fees waived excluding interest expense(6) | | | 1.98 | % | | | 1.98 | % | | | 1.92 | % | | | 1.96 | %(5) | |
| Ratio of net investment income (loss) to average net assets: | |
| Before fees waived | | | 0.38 | % | | | 3.71 | % | | | 2.14 | % | | | (13.02 | )%(5) | |
| After fees waived | | | 1.99 | % | | | 3.94 | % | | | 2.25 | % | | | 2.86 | %(5) | |
| Portfolio turnover rate | | | 12.05 | %(4) | | | 48.02 | % | | | 40.38 | % | | | 34.12 | %(4) | |
(1) Unaudited
(2) Commencement of Operations.
(3) Amount represents less than $0.01 per share.
(4) Not annualized.
(5) Annualized.
(6) The Advisor has contractually agreed to limit the operating expenses of the Fund to 1.98%, excluding interest expense, expenses related to dividends on short positions, brokerage commissions, taxes and other extraordinary expenses. See Note 3.
The accompanying notes are an integral part of these financial statements.
53
FINANCIAL HIGHLIGHTS
For a capital share outstanding throughout the period
| | | Six Months
Ended | | Year Ended December 31, | |
| China & Hong Kong Fund | | June 30, 2009(1) | | 2008 | | 2007 | | 2006 | | 2005 | | 2004 | |
| Net asset value, beginning of period | | $ | 18.98 | | | $ | 43.02 | | | $ | 26.48 | | | $ | 18.97 | | | $ | 18.57 | | | $ | 16.81 | | |
| Income from investment operations: | |
| Net investment income | | | 0.14 | | | | 0.68 | | | | 0.28 | | | | 0.43 | | | | 0.37 | | | | 0.25 | | |
Net realized and unrealized gain (loss)
on investments and foreign currency | | | 7.43 | | | | (24.13 | ) | | | 16.91 | | | | 7.09 | | | | 0.86 | | | | 1.78 | | |
| Total from investment operations | | | 7.57 | | | | (23.45 | ) | | | 17.19 | | | | 7.52 | | | | 1.23 | | | | 2.03 | | |
| Less distributions: | |
| From net investment income | | | — | | | | (0.53 | ) | | | (0.59 | ) | | | (0.01 | ) | | | (0.83 | ) | | | (0.27 | ) | |
| From net realized gain | | | — | | | | (0.07 | ) | | | (0.10 | ) | | | — | | | | — | | | | — | | |
| Total distributions | | | — | | | | (0.60 | ) | | | (0.69 | ) | | | (0.01 | ) | | | (0.83 | ) | | | (0.27 | ) | |
| Redemption fee proceeds | | | — | (2) | | | 0.01 | | | | 0.04 | | | | — | (2) | | | — | (2) | | | — | (2) | |
| Net asset value, end of period | | $ | 26.55 | | | $ | 18.98 | | | $ | 43.02 | | | $ | 26.48 | | | $ | 18.97 | | | $ | 18.57 | | |
| Total return | | | 39.88 | %(3) | | | (54.47 | )% | | | 65.06 | % | | | 39.65 | % | | | 6.61 | % | | | 12.16 | % | |
| Ratios/supplemental data: | |
| Net assets, end of period (millions) | | $ | 174.5 | | | $ | 123.3 | | | $ | 293.2 | | | $ | 143.0 | | | $ | 111.0 | | | $ | 112.3 | | |
| Ratio of expenses to average net assets: | |
| Before fees waived | | | 1.62 | % | | | 1.52 | % | | | 1.44 | % | | | 1.59 | % | | | 1.63 | % | | | 1.67 | % | |
| After fees waived | | | 1.62 | % | | | 1.52 | % | | | 1.44 | % | | | 1.59 | % | | | 1.63 | % | | | 1.67 | % | |
| After fees waived excluding interest expense(4) | | | 1.62 | % | | | 1.51 | % | | | 1.44 | % | | | 1.59 | % | | | 1.63 | % | | | 1.67 | % | |
| Ratio of net investment income to average net assets | | | 1.39 | % | | | 2.22 | % | | | 1.17 | % | | | 2.01 | % | | | 1.74 | % | | | 1.26 | % | |
| Portfolio turnover rate | | | 1.08 | %(3) | | | 26.62 | % | | | 10.00 | % | | | 64.81 | % | | | 12.51 | % | | | 15.37 | % | |
(1) Unaudited
(2) Amount represents less than $0.01 per share.
(3) Not annualized.
(4) The Advisor has contractually agreed to limit the operating expenses of the Fund to 1.98%, excluding interest expense, expenses related to dividends on short positions, borkerage commissions, taxes and other extraordinary expenses. See Note 3.
The accompanying notes are an integral part of these financial statements.
54
FINANCIAL HIGHLIGHTS
For a capital share outstanding throughout the period
Six Months
Ended | | Year Ended December 31, | | June 30, 2004(2)
Through | |
| Global Energy Fund | | June 30, 2009(1) | | 2008 | | 2007 | | 2006 | | 2005 | | December 31, 2004 | |
| Net asset value, beginning of period | | $ | 15.68 | | | $ | 31.86 | | | $ | 25.54 | | | $ | 24.62 | | | $ | 15.25 | | | $ | 12.50 | | |
| Income from investment operations: | |
| Net investment income (loss) | | | 0.12 | | | | 0.22 | | | | 0.05 | | | | 0.01 | | | | (0.02 | ) | | | — | (3) | |
Net realized and unrealized gain (loss)
on investments and foreign currency | | | 4.74 | | | | (15.71 | ) | | | 9.50 | | | | 2.44 | | | | 9.75 | | | | 2.70 | | |
| Total from investment operations | | | 4.86 | | | | (15.49 | ) | | | 9.55 | | | | 2.45 | | | | 9.73 | | | | 2.70 | | |
| Less distributions: | |
| From net investment income | | | — | | | | — | | | | (0.27 | ) | | | (0.21 | ) | | | — | | | | — | | |
| From net realized gain | | | — | | | | (0.70 | ) | | | (2.96 | ) | | | (1.34 | ) | | | (0.39 | ) | | | — | | |
| Total distributions | | | — | | | | (0.70 | ) | | | (3.23 | ) | | | (1.55 | ) | | | (0.39 | ) | | | — | | |
| Redemption fee proceeds | | | — | (3) | | | 0.01 | | | | — | (3) | | | 0.02 | | | | 0.03 | | | | 0.05 | | |
| Net asset value, end of period | | $ | 20.54 | | | $ | 15.68 | | | $ | 31.86 | | | $ | 25.54 | | | $ | 24.62 | | | $ | 15.25 | | |
| Total return | | | 30.99 | %(4) | | | (48.56 | )% | | | 37.25 | % | | | 9.85 | % | | | 63.92 | % | | | 22.00 | % | |
| Ratios/supplemental data: | |
| Net assets, end of period (millions) | | $ | 40.4 | | | $ | 30.2 | | | $ | 69.7 | | | $ | 65.0 | | | $ | 98.7 | | | $ | 1.6 | | |
| Ratio of expenses to average net assets: | |
| Before fees waived | | | 1.53 | % | | | 1.31 | % | | | 1.37 | % | | | 1.45 | % | | | 1.50 | % | | | 17.36 | %(5) | |
| After fees waived | | | 1.45 | % | | | 1.31 | % | | | 1.37 | % | | �� | 1.45 | % | | | 1.45 | % | | | 1.45 | %(5) | |
| After fees waived excluding interest expense(4) | | | 1.45 | % | | | 1.30 | % | | | 1.35 | % | | | 1.41 | % | | | 1.42 | % | | | 1.45 | %(5) | |
Ratio of net investment income (loss) to
average net assets: | | | | | |
| Before fees waived | | | 1.29 | % | | | 0.76 | % | | | 0.22 | % | | | 0.04 | % | | | (0.24 | )% | | | (15.84 | )%(5) | |
| After fees waived | | | 1.37 | % | | | 0.76 | % | | | 0.22 | % | | | 0.04 | % | | | (0.19 | )% | | | 0.07 | % | |
| Portfolio turnover rate | | | 19.15 | %(4) | | | 74.90 | % | | | 31.13 | % | | | 47.22 | % | | | 89.24 | % | | | 9.96 | %(4) | |
(1) Unaudited
(2) Commencement of Operations.
(3) Amount represents less than $0.01 per share.
(4) Not annualized.
(5) Annualized.
(6) The Advisor has contractually agreed to limit the operating expenses of the Fund to 1.45%, excluding interest expense, expenses related to dividends on short positions, brokerage commissions, taxes and other extraordinary expenses. See Note 3.
The accompanying notes are an integral part of these financial statements.
55
FINANCIAL HIGHLIGHTS
For a capital share outstanding throughout the period
| | | Six Months
Ended | | Year Ended December 31, | |
| Global Innovators Fund | | June 30, 2009(1) | | 2008 | | 2007 | | 2006 | | 2005 | | 2004 | |
| Net asset value, beginning of period | | $ | 11.21 | | | $ | 21.68 | | | $ | 17.98 | | | $ | 15.14 | | | $ | 13.54 | | | $ | 12.21 | | |
| Income from investment operations: | |
| Net investment income (loss) | | | — | | | | 0.62 | | | | 0.08 | | | | 0.01 | | | | (0.05 | ) | | | (0.02 | ) | |
Net realized and unrealized gain (loss)
on investments | | | 1.81 | | | | (10.48 | ) | | | 3.72 | | | | 2.83 | | | | 1.65 | | | | 1.35 | | |
| Total from investment operations | | | 1.81 | | | | (9.86 | ) | | | 3.80 | | | | 2.84 | | | | 1.60 | | | | 1.33 | | |
| Less distributions: | |
| From net investment income | | | — | | | | (0.61 | ) | | | (0.11 | ) | | | — | | | | — | | | | — | | |
| Total distributions | | | — | | | | (0.61 | ) | | | (0.11 | ) | | | — | | | | — | | | | — | | |
| Redemption fee proceeds | | | — | (2) | | | — | (2) | | | 0.01 | | | | — | (2) | | | — | (2) | | | — | (2) | |
| Net asset value, end of period | | $ | 13.02 | | | $ | 11.21 | | | $ | 21.68 | | | $ | 17.98 | | | $ | 15.14 | | | $ | 13.54 | | |
| Total return | | | 16.15 | %(4) | | | (45.42 | )% | | | 21.17 | % | | | 18.76 | % | | | 11.82 | %(3) | | | 10.89 | % | |
| Ratios/supplemental data: | |
| Net assets, end of period (millions) | | $ | 32.9 | | | $ | 29.6 | | | $ | 72.8 | | | $ | 39.3 | | | $ | 36.4 | | | $ | 42.1 | | |
| Ratio of expenses to average net assets: | |
| Before fees waived | | | 1.76 | % | | | 1.40 | % | | | 1.44 | % | | | 1.64 | % | | | 1.66 | % | | | 1.68 | % | |
| After fees waived | | | 1.55 | % | | | 1.40 | % | | | 1.44 | % | | | 1.55 | % | | | 1.66 | %(3) | | | 1.68 | %(3) | |
| After fees waived excluding interest expense(5) | | | 1.55 | % | | | 1.39 | % | | | 1.43 | % | | | 1.53 | % | | | 1.63 | %(3) | | | 1.67 | %(3) | |
| Ratio of net investment income (loss) to average net assets: | |
| Before fees waived | | | (0.19 | )% | | | 3.07 | % | | | 0.49 | % | | | 0.00 | % | | | (0.32 | )% | | | (0.17 | )% | |
| After fees waived | | | 0.02 | % | | | 3.07 | % | | | 0.49 | % | | | 0.09 | % | | | (0.32 | )% | | | (0.17 | )% | |
| Portfolio turnover rate | | | 4.87 | %(4) | | | 36.49 | % | | | 25.54 | % | | | 36.53 | % | | | 27.75 | % | | | 50.57 | % | |
(1) Unaudited
(2) Amount represents less than $0.01 per share.
(3) The Fund's total operating expense was limited at 1.88% from 4/23/03 to 10/31/05. It was limited to 1.35% prior to 4/26/03.
(4) Not annualized.
(5) The Advisor has contractually agreed to limit the operating expenses of the Fund to 1.55%, excluding interest expense, expenses related to dividends on short positions, borkerage commissions, taxes and other extraordinary expenses. See Note 3.
The accompanying notes are an integral part of these financial statements.
56
NOTES TO FINANCIAL STATEMENTS
Note 1
Organization
Guinness Atkinson Funds (the "Trust"), was organized on April 28, 1997 as a Delaware business trust and registered under the Investment Company Act of 1940, as amended (the "1940 Act"), as a non-diversified, open-end management investment company. Currently, the Trust offers six separate series: Guinness Atkinson Alternative Energy Fund (the "Alternative Energy Fund"), Guinness Atkinson Asia Focus Fund (the "Asia Focus Fund"), Guinness Atkinson Asia Pacific Dividend Fund (the "Asia Pacific Dividend Fund"), Guinness Atkinson China & Hong Kong Fund (the "China & Hong Kong Fund"), Guinness Atkinson Global Energy Fund (the "Global Energy Fund"), and Guinness Atkinson Global Innovators Fund (the "Global Innovators Fund"), all of which (each a "Fund" and collectively, the "Funds") are covered by this report. The China & Hong Kong Fund began operations on June 30, 1994, the Asia Focus Fund began operations on April 29, 1996, the Global Innovators Fund began operations on December 15, 1998, the Global Energy Fund began operations on June 30, 2004, and the Alternative Energy Fund and the Asia Pacific Dividend Fund began operations on March 31, 2006.
The Alternative Energy Fund and Asia Focus Fund's investment objective is long-term capital appreciation. The Asia Pacific Dividend Fund's investment objective is to provide investors with dividend income and long-term capital growth. The China & Hong Kong Fund's investment objective is long-term capital appreciation primarily through investments in securities of China and Hong Kong. The Global Energy Fund and Global Innovators Fund's investment objective is long-term capital appreciation.
Note 2
Significant accounting policies
The following is a summary of significant accounting policies consistently followed by the Funds. These policies are in conformity with accounting principles generally accepted in the United States of America.
A. Security Valuation. Securities of the Funds that are traded on a principal exchange (U.S. or foreign) or NASDAQ are valued at the official closing price on each day that the exchanges are open for trading. Securities traded on an exchange for which there have been no sales, and other over-the-counter securities are valued at the mean between the bid and asked prices. Securities for which quotations are not readily available are valued at their respective fair values as determined in good faith by the Investment Advisor in accordance with procedures established by the Board of Trustees. In determining fair value, the Funds take into account all relevant factors and available information. Consequently, the price of the security used to calculate its Net Asset Value may differ from quoted or published prices for the same security. Fair value pricing inv olves subjective judgments and there is no single standard for determining a security's fair value. As a result, different mutual funds could reasonably arrive at different fair value for the same security. It is possible that the fair value determined for a security is materially different from the value that could be realized upon the sale of that security or from the values that other mutual funds may determine. Short-term investments are stated at cost, combined with accrued interest, which approximates market value. Realized gains and losses from securities transactions are calculated using the identified cost method.
Foreign securities are recorded in the financial statements after translation to U.S. dollars based on the applicable exchange rate at the end of the period. The Funds do not isolate that portion of the results of operations resulting from changes in the currency exchange rate from the fluctuations resulting from changes in the market prices of investments.
Foreign exchange gain or loss resulting from holding of a foreign currency, expiration of a currency exchange contract, difference in exchange rates between the trade date and settlement date of an investment purchased or sold, and the difference between dividends actually received compared to the amount shown in a Fund's accounting records on the date of receipt are shown as net realized gains or losses on foreign currency transactions in the respective Fund's statement of operations.
The Funds adopted the provisions of Statement of Financial Accounting Standards No. 157, "Fair Value Measurements" ("SFAS 157"), effective with the beginning of the Portfolios' fiscal year. SFAS 157 establishes a hierarchy that prioritizes the inputs to valuation techniques giving the highest priority to readily available unadjusted quoted prices in unobservable inputs (level 3 measurements) when market prices are not readily available or reliable. See Note 6 - Fair Value of Financial Instruments for further disclosure.
B. Forward Foreign Currency Exchange Contracts. The Funds may utilize forward foreign currency exchange contracts ("forward contracts") to hedge against foreign exchange fluctuations on foreign denominated investments under which they are obligated to exchange currencies at specific future dates and at specified rates. All commitments are "marked-to-market"
57
daily and any resulting unrealized gains or losses are included as unrealized appreciation (depreciation) on foreign currency denominated assets and liabilities. The Funds record realized gains or losses at the time the forward contract is settled. Risks may arise upon entering these contracts from the potential inability of a counter party to meet the terms of their contracts and from unanticipated movements in the value of a foreign currency relative to the U.S. dollar or other currencies. Counterparties to these contracts are major U.S. financial institutions. Please refer to Note 7 for further information on Forward Contracts in each Fund.
C. Restricted Securities. A restricted security cannot be resold to the general public without prior registration under the Securities Act of 1933. If the security is subsequently registered and resold, the issuers would typically bear the expense of all registrations at no cost to the Fund. Restricted securities are valued according to the guidelines and procedures adopted by the Funds' Board of Trustees. The Alternative Energy Fund held one restricted security with a fair market value of $0 (0.00% of net assets) at June 30, 2009.
D. Security Transactions, Dividend Income and Distributions. Security transactions are accounted for on the trade date. Dividend income and distributions to shareholders are recorded on the ex-dividend date. Realized gains and losses from securities transactions are calculated using the identified cost method.
E. Allocation of Expenses. Each Fund is charged for those expenses directly attributable to it. Expenses that are not directly attributable to a Fund are allocated among the Funds in proportion to their respective assets or another appropriate method.
F. Concentration of Risk. The Alternative Energy Fund invests substantially in the alternative energy or energy technology sectors. The Asia Focus Fund invests substantially all of its assets in the Asian continent. The Asia Pacific Dividend Fund invests primarily in dividend-producing equity securities of Asia Pacific companies. The China & Hong Kong Fund invests substantially all of its assets in securities that are traded in China or Hong Kong or that are issued by companies that do a substantial part of their business in China. The Global Energy Fund invests substantially in energy companies; the changes in the prices and supplies of oil and other energy fuels may affect the Funds' investments. The consequences of political, social, or economic changes in the countries or business sectors in which the securities are offered or the issuers conduc t their operations may affect the market prices of the Funds' investments and any income generated, as well as the Funds' ability to repatriate such amounts.
G. Use of Estimates. The preparation of financial statements in conformity with accounting principles generally accepted in the United States requires management to make estimates and assumptions that affect the reported amounts of assets and liabilities and the disclosure of contingent assets and liabilities at the date of the financial statements. Actual results could differ from those estimates. In preparing these financial statements, the Trust has evaluated events and transactions for potential recognition or disclosure through August 27, 2009, the date the financial statements were available to be issued.
H. Indemnifications. Under the Funds' organizational documents, its current and former officers and trustees are indemnified against certain liabilities arising out of the performance of their duties to the Funds. In addition, in the normal course of business, the Funds enter into contracts that contain a variety of representations and warranties that provide general indemnifications. The Funds' maximum exposure under these arrangements is unknown as this would involve future claims that may be made against the Funds that have not yet occurred or that would be covered by other parties.
I. Federal Income Taxes. The Funds intend to comply with the requirements of Subchapter M of the Internal Revenue Code applicable to regulated investment companies, and to distribute all of their taxable income to their shareholders. Therefore, no federal income tax provision is required.
On July 13, 2006, the Financial Accounting Standards Board (FASB) released FASB Interpretation No. 48 "Accounting for Uncertainty in Income Taxes" (FIN 48). FIN 48 provides guidance for how uncertain tax positions should be recognized, measured, presented and disclosed in the financial statements. FIN 48 requires the evaluation of tax positions taken or expected to be taken in the course of preparing the funds' tax returns to determine whether the tax positions are "more likely than not" of being sustained by the applicable tax authority. Tax positions not deemed to meet the more-likely-than-not threshold would be recorded as a tax benefit or expense in the current year. On June 29, 2007, the Funds implemented the provision of FIN 48. Management of the Funds has reviewed the tax positions for each of the open tax years 2005 through 2008 and has determined that the implementation of FIN 48 did not have a material impact on the Fun ds' financial statements.
58
Note 3
Investment Advisory and Other Agreements
The Trust, on behalf of each Fund, entered into an Investment Advisory Agreement with Guinness Atkinson Asset Management, Inc. (the "Advisor"), which provided the Funds with investment management services under an investment advisory agreement. The Advisor furnishes all investment advice, office space, facilities, and most of the personnel needed by the Funds. As compensation for its services, the Advisor is entitled to a monthly fee at the following annual rates based upon the average daily net assets of the Funds:
| Alternative Energy Fund | | | 1.00 | % | |
| Asia Pacific Dividend Fund | | | 1.00 | % | |
| Asia Focus Fund | | | 1.00 | % | |
| China & Hong Kong Fund | | | 1.00 | % | |
| Global Energy Fund | | | 0.75 | % | |
| Global Innovators Fund | | | 0.75 | % | |
The Funds are responsible for their own operating expenses. The Advisor has contractually agreed to limit the Funds' total operating expenses (excluding interest, dividends on short positions, taxes and extraordinary expenses) by reducing all or a portion of their fees and reimbursing the Funds' for expenses so that its ratio of expenses to average daily net assets will not exceed the following levels:
| Alternative Energy Fund | | | 1.98 | % | |
| Asia Pacific Dividend Fund | | | 1.98 | % | |
| Asia Focus Fund | | | 1.98 | % | |
| China & Hong Kong Fund | | | 1.98 | % | |
| Global Energy Fund | | | 1.45 | % | |
| Global Innovators Fund | | | 1.55 | % | |
The expense ratios shown in the financial highlights may exceed these levels due to expenses incurred, but not covered by the expense limitation agreement.
To the extent that the Advisor waives fees and/or absorbs expenses it may seek repayment of a portion or all of such amounts at any time within three fiscal years after the fiscal year in which such amounts were waived or absorbed, subject to the applicable cap. For the six months ended June 30, 2009, the Advisor waived fees and absorbed expenses of $45,156 from the Asia Pacific Dividend Fund, $564 from the Asia Focus Fund, $13,243 from the Global Energy Fund and $30,029 from the Global Innovators Fund.
At June 30, 2009 the Advisor may recapture a portion of the following amounts that has been paid and/or waived on behalf of the Funds no later than the dates as stated below:
| Funds: | | December 31, 2009 | | December 31, 2010 | | December 31, 2011 | | December 31, 2012 | | Total | |
| Asia Pacific Dividend Fund | | $ | 95,970 | | | $ | 7,946 | | | $ | 45,959 | | | $ | 45,156 | | | $ | 195,031 | | |
| Asia Focus Fund | | | — | | | | — | | | | — | | | $ | 564 | | | $ | 564 | | |
| Global Energy Fund | | | — | | | | — | | | | — | | | $ | 13,243 | | | $ | 13,243 | | |
| Global Innovators Fund | | | — | | | | — | | | | — | | | $ | 30,029 | | | $ | 30,029 | | |
59
U.S. Bancorp Fund Services, LLC (the "Administrator") acts as the Funds' administrator under an administration agreement.
Quasar Distributors, LLC (the "Distributor") acts as the Funds' principal underwriter in a continuous public offering of the Funds' shares. The Distributor is an affiliate of the Administrator.
State Street Bank & Trust is the Funds' Custodian and Fund Accounting Agent. U.S. Bancorp Fund Services, LLC is the Funds' Transfer agent.
On August 14, 1998, the Trust approved a Deferred Compensation Plan for Trustees (the "Plan"). Trustees can elect to receive payment in cash or defer payments provided for in the Plan. If a trustee elects to defer payment, the Plan provides for the creation of a deferred payment account (Phantom Share Account). This account accumulates the deferred fees earned, and the value of the account is adjusted at the end of each quarter to reflect the value that would have been earned if the account had been invested in designated investments. The Funds recognize as trustee expense amounts accrued as meetings are attended plus the change in value of the Phantom Share Account.
The change in the value of the phantom share account during the six months ended June 30, 2009 is shown in the table below. These amounts include any additional contributions to the deferred compensation plan and unrealized appreciation on the underlying investments.
| Alternative Energy Fund | | $ | 3,662 | | |
| Asia Focus Fund | | $ | 6,737 | | |
| Asia Pacific Dividend Fund | | $ | 2,017 | | |
| China & Hong Kong Fund | | $ | 14,138 | | |
| Global Energy Fund | | $ | 4,085 | | |
| Global Innovators Fund | | $ | 9,171 | | |
Certain officers of the Funds are also officers and/or Directors of the Advisor, Administrator and another party providing the services of the Funds' Chief Compliance Officer ("CCO"). None of these officers are compensated directly by the Funds.
Note 4
Shareholder Servicing Plan
Each Fund has adopted a Shareholder Servicing Plan to pay a fee at an annual rate of up to 0.25% of its daily average net assets of shares serviced by shareholder servicing agents who provide administrative and support services to their customers.
During the six months ended June 30, 2009, the following fees were paid under the shareholder servicing plan:
| Alternative Energy Fund | | $ | 45,621 | | |
| Asia Focus Fund | | $ | 17,366 | | |
| Asia Pacific Dividend Fund | | $ | 5,269 | | |
| China & Hong Kong Fund | | $ | 99,115 | | |
| Global Energy Fund | | $ | 23,134 | | |
| Global Innovators Fund | | $ | 21,696 | | |
60
Note 5
Investment Transactions
The following table presents purchases and sales of securities during the six months ended June 30, 2009, excluding short-term investments, to indicate the volume of transactions in each Fund.
| Fund | | Purchases | | Sales | |
| Alternative Energy Fund | | $ | 8,331,670 | | | $ | 4,339,344 | | |
| Asia Focus Fund | | $ | 15,836,174 | | | $ | 2,045,653 | | |
| Asia Pacific Dividend Fund | | $ | 933,863 | | | $ | 679,351 | | |
| China & Hong Kong Fund | | $ | 17,461,967 | | | $ | 1,331,830 | | |
| Global Energy Fund | | $ | 7,482,984 | | | $ | 6,331,013 | | |
| Global Innovators Fund | | $ | 1,415,179 | | | $ | 2,167,604 | | |
The Funds did not purchase U.S. Government securities as a part of the long-term investment strategy during the six months ended June 30, 2009.
Note 6
Fair Value of Financial Instruments
In September 2006, the Financial Accounting Standards Board issued Standard No. 157, "Fair Value Measurements" effective for fiscal years beginning after November 15, 2007. SFAS 157 clarifies the definition of fair value for financial reporting, establishes a framework for measuring fair value and requires additional disclosure about the use of fair value measurements in an effort to make the measurement of fair value more consistent and comparable. The Funds adopted SFAS 157 effective January 1, 2008. A summary of the fair value hierarchy under SFAS 157 is described below.
Various inputs are used in determining the value of the Funds' investments. These inputs are summarized in the three broad levels listed below:
Level 1 — Quoted prices in active markets for identical securities.
Level 2 — Other significant observable inputs (including quoted prices for similar securities, interest rates, prepayment speeds, credit risk, etc.).
Level 3 — Significant unobservable inputs (including the Fund's own assumptions in determining the fair value of investments).
61
The following tables provide the fair value measurements of applicable Fund assets by level within the fair value hierarchy for each Fund as of June 30, 2009. These assets are measured on a recurring basis.
| Alternative Energy Fund | |
| Description | | Total | | Level 1 - Quoted prices
in active markets for
identical assets | | Level 2 - Significant
other observable
inputs | | Level 3 - Significant
unobservable inputs | |
| Equity | |
| Consumer Discretionary | | $ | 1,109,970 | | | $ | 1,109,970 | | | $ | — | | | $ | — | | |
| Energy | | | 10,912,025 | | | | 2,076,934 | | | | 8,695,091 | | | | 140,000 | | |
| Industrials | | | 24,170,796 | | | | 8,864,367 | | | | 15,306,429 | | | | — | | |
| Information Technology | | | 6,022,362 | | | | 5,954,256 | | | | 68,106 | | | | — | | |
| Materials | | | 4,721,638 | | | | 2,452,460 | | | | 2,269,178 | | | | — | | |
| Utilities | | | 14,866,521 | | | | 6,702,651 | | | | 8,163,870 | | | | — | | |
| Total Equity | | $ | 61,803,312 | | | $ | 27,160,638 | | | $ | 34,502,674 | | | $ | 140,000 | | |
| Warrants | |
| Utilities | | $ | 4,247 | | | $ | 4,247 | | | $ | — | | | $ | — | | |
| Fixed Income | |
| Corporate Bond | | $ | 389,291 | | | $ | — | | | $ | — | | | $ | 389,291 | | |
| Total Investments in Securities | | $ | 62,196,850 | | | $ | 27,164,885 | | | $ | 34,502,674 | | | $ | 529,291 | | |
| Other Financial Instruments* | | $ | — | | | $ | — | | | $ | — | | | $ | — | | |
Following is a reconciliation of Level 3 assets for which significant unobservable inputs were used to determine fair value.
| Alternative Energy Fund | | Investments
in
Securities | | Other
Financial
Instruments* | |
| Balance as of 12/31/08 | | $ | 385,739 | | | $ | — | | |
| Realized gain (loss) | | | — | | | | — | | |
| Change in unrealized appreciation (depreciation) | | | (25,698 | ) | | | — | | |
| Net purchases (sales) | | | — | | | | — | | |
| Transfers in and/or out of level 3 | | | 169,250 | | | | — | | |
| Balance as of 06/30/09 | | $ | 529,291 | | | $ | — | | |
62
| Asia Focus Fund | |
| Description | | Total | | Level 1 — Quoted prices
in active markets for
identical assets | | Level 2 — Significant
other observable
inputs | | Level 3 — Significant
unobservable inputs | |
| Equity | |
| Commingled Fund | | $ | 1,207,104 | | | $ | 1,207,104 | | | $ | — | | | $ | — | | |
| Consumer Discretionary | | | 3,028,360 | | | | — | | | | 3,028,360 | | | | — | | |
| Consumer Staples | | | 1,843,409 | | | | — | | | | 1,843,409 | | | | — | | |
| Energy | | | 9,461,576 | | | | 1,172,404 | | | | 8,289,172 | | | | — | | |
| Financials | | | 1,202,055 | | | | — | | | | 1,202,055 | | | | — | | |
| Healh Care | | | 403,061 | | | | — | | | | 403,061 | | | | — | | |
| Industrials | | | 6,357,567 | | | | 1,099,742 | | | | 5,257,825 | | | | — | | |
| Information Technology | | | 6,813,889 | | | | 1,112,991 | | | | 5,700,898 | | | | — | | |
| Materials | | | 8,609,170 | | | | 1,017,238 | | | | 7,591,932 | | | | — | | |
| Telecommunication Services | | | 4,379,292 | | | | — | | | | 4,379,292 | | | | — | | |
| Utilities | | | 1,543,761 | | | | 1,028,881 | | | | 514,880 | | | | — | | |
| Total Equity | | $ | 44,849,244 | | | $ | 6,638,360 | | | $ | 38,210,884 | | | $ | — | | |
| Total Investments in Securities | | $ | 44,849,244 | | | $ | 6,638,360 | | | $ | 38,210,884 | | | $ | — | | |
| Other Financial Instruments* | | $ | — | | | $ | — | | | $ | — | | | $ | — | | |
| Asia Pacific Dividend Fund | |
| Description | | Total | | Level 1 — Quoted prices
in active markets for
identical assets | | Level 2 — Significant
other observable
inputs | | Level 3 — Significant
unobservable inputs | |
| Equity | |
| Consumer Discretionary | | $ | 532,168 | | | $ | — | | | $ | 532,168 | | | $ | — | | |
| Consumer Staples | | | 400,841 | | | | — | | | | 400,841 | | | | — | | |
| Energy | | | 778,549 | | | | 225,964 | | | | 552,585 | | | | — | | |
| Financials | | | 1,087,211 | | | | 209,852 | | | | 877,359 | | | | — | | |
| Industrials | | | 799,057 | | | | 237,525 | | | | 561,532 | | | | — | | |
| Information Technology | | | 823,282 | | | | — | | | | 823,282 | | | | — | | |
| Materials | | | 1,469,880 | | | | 631,954 | | | | 837,926 | | | | — | | |
| Telecommunication Services | | | 876,764 | | | | — | | | | 876,764 | | | | — | | |
| Utilities | | | 469,049 | | | | 250,385 | | | | 218,664 | | | | — | | |
| Total Equity | | $ | 7,236,801 | | | $ | 1,555,680 | | | $ | 5,681,121 | | | $ | — | | |
| Total Investments in Securities | | $ | 7,236,801 | | | $ | 1,555,680 | | | $ | 5,681,121 | | | $ | — | | |
| Other Financial Instruments* | | $ | — | | | $ | — | | | $ | — | | | $ | — | | |
63
| China & Hong Kong Fund | |
| Description | | Total | | Level 1 — Quoted prices
in active markets for
identical assets | | Level 2 — Significant
other observable
inputs | | Level 3 — Significant
unobservable inputs | |
| Equity | |
| Commingled Fund | | $ | 7,425,304 | | | $ | 7,425,304 | | | $ | — | | | $ | — | | |
| Consumer Discretionary | | | 7,238,535 | | | | — | | | | 7,238,535 | | | | — | | |
| Consumer Staples | | | 2,044,537 | | | | — | | | | 2,044,537 | | | | — | | |
| Energy | | | 24,738,609 | | | | 2,760,351 | | | | 21,978,258 | | | | — | | |
| Financials | | | 33,579,619 | | | | — | | | | 33,579,619 | | | | — | | |
| Health Care | | | 1,565,434 | | | | — | | | | 1,565,434 | | | | — | | |
| Industrials | | | 42,035,703 | | | | 2,875,804 | | | | 39,159,899 | | | | — | | |
| Information Technology | | | 23,260,387 | | | | 7,499,303 | | | | 15,761,084 | | | | — | | |
| Materials | | | 17,126,378 | | | | — | | | | 17,126,378 | | | | — | | |
| Telecommunication Services | | | 10,192,621 | | | | — | | | | 10,192,621 | | | | — | | |
| Total Equity | | $ | 169,207,127 | | | $ | 20,560,762 | | | $ | 148,646,365 | | | $ | — | | |
| Total Investments in Securities | | $ | 169,207,127 | | | $ | 20,560,762 | | | $ | 148,646,365 | | | $ | — | | |
| Other Financial Instruments* | | $ | — | | | $ | — | | | $ | — | | | $ | — | | |
| Global Energy Fund: | |
| Description | | Total | | Level 1 — Quoted prices
in active markets for
identical assets | | Level 2 — Significant
other observable
inputs | | Level 3 — Significant
unobservable inputs | |
| Equity | |
| Energy | | $ | 40,226,403 | | | $ | 28,686,405 | | | $ | 11,539,998 | | | $ | — | | |
| Total Investments in Securities | | $ | 40,226,403 | | | $ | 28,686,405 | | | $ | 11,539,998 | | | $ | — | | |
| Other Financial Instruments* | | $ | — | | | $ | — | | | $ | — | | | $ | — | | |
64
| Global Innovators Fund: | |
| Description | | Total | | Level 1 — Quoted prices
in active markets for
identical assets | | Level 2 — Significant
other observable
inputs | | Level 3 — Significant
unobservable inputs | |
| Equity | |
| Consumer Discretionary | | $ | 7,176,225 | | | $ | 7,176,225 | | | $ | — | | | $ | — | | |
| Energy | | | 2,459,075 | | | | 2,459,075 | | | | — | | | | — | | |
| Financials | | | 3,042,232 | | | | 3,042,232 | | | | — | | | | — | | |
| Industrials | | | 919,285 | | | | 919,285 | | | | — | | | | — | | |
| Information Technology | | | 15,119,791 | | | | 15,119,791 | | | | — | | | | — | | |
| Materials | | | 1,158,735 | | | | 1,158,735 | | | | — | | | | — | | |
| Telecommunication Services | | | 3,005,909 | | | | 3,005,909 | | | | — | | | | — | | |
| Total Equity | | $ | 32,881,252 | | | $ | 32,881,252 | | | $ | — | | | $ | — | | |
| Total Investments in Securities | | $ | 32,881,252 | | | $ | 32,881,252 | | | $ | — | | | $ | — | | |
| Other Financial Instruments* | | $ | — | | | $ | — | | | $ | — | | | $ | — | | |
* Other financial instruments are derivative instruments not reflected in the Schedule of Investments, such as futures, forwards, swaps contracts, and written options. Futures, forwards, and swap contracts are valued at the unrealized appreciation (depreciation) on the instrument while written options are valued at market value.
Note 7
Forward foreign currency contracts
In order to hedge their portfolio and to protect them against possible fluctuations in foreign exchange rates pending the settlement of securities transactions, the Funds may enter into forward currency contracts which obligate them to exchange currencies at specified future dates. At the maturity of a forward contract, the Funds may either make delivery of the foreign currency from currency held, if any, or from the proceeds of the portfolio securities sold. It may also terminate its obligation to deliver the foreign currency at any time by purchasing an offsetting contract. The forward value of amounts due are netted against the forward value of the currency to be delivered, and the net amount is shown as a receivable or payable in the financial statements.
The funds did not have any outstanding forward contracts as of June 30, 2009.
65
Note 8
Income Taxes and Distributions to Shareholders
As of December 31, 2008, the tax basis of investments and the components of distributable earnings on a tax basis were as follows:
| | Alternative
Energy Fund | | Asia Focus
Fund | | Asia Pacific
Dividend
Fund | | China &
Hong Kong
Fund | | Global
Energy
Fund | | Global
Innovators
Fund | |
| Cost of investment for tax purposes | | $ | 100,344,591 | | | $ | 36,372,461 | | | $ | 11,430,836 | | | $ | 139,752,645 | | | $ | 45,596,632 | | | $ | 49,897,221 | | |
| Gross tax unrealized appreciation | | | 1,212,657 | | | | 821,926 | | | | 5,870 | | | | 11,132,206 | | | | 2,394,121 | | | | 431,657 | | |
| Gross tax unrealized (depreciation) | | | (53,601,702 | ) | | | (15,358,833 | ) | | | (6,093,247 | ) | | | (44,769,111 | ) | | | (17,692,778 | ) | | | (21,157,261 | ) | |
Net tax unrealized (depreciation)
on investment | | | (52,389,045 | ) | | | (14,536,907 | ) | | | (6,087,377 | ) | | | (33,636,905 | ) | | | (15,298,657 | ) | | | (20,725,604 | ) | |
Net tax appreciation (depreciation)
on derivatives and foreign-currency
denominated assets and liabilities | | | (107) | | | | (194 | ) | | | (190 | ) | | | — | | | | (907 | ) | | | — | | |
| Net tax unrealized (depreciation)* | | $ | (52,389,152 | ) | | $ | (14,537,101 | ) | | $ | (6,087,567 | ) | | $ | (33,636,905 | ) | | $ | (15,299,564 | ) | | $ | (20,725,604 | ) | |
| Undistributed net ordinary income** | | | 2,158,948 | | | | 38,967 | | | | 453,685 | | | | 1,937,146 | | | | — | | | | 83,448 | | |
| Post October loss*** | | | (25,634,363 | ) | | | (37,191 | ) | | | (275,540 | ) | | | — | | | | (750,436 | ) | | | (157,641 | ) | |
| Capital loss carryforward | | | (14,004,637 | ) | | | (3,362,581 | ) | | | (2,065,260 | ) | | | — | | | | — | | | | (43,546,321 | ) | |
| Capital loss carryforward limitation | | | — | | | | (217,143 | ) | | | — | | | | (789,961 | ) | | | — | | | | (559,122 | ) | |
| Other accumulated gain/(loss) | | | (13,511 | ) | | | (19,833 | ) | | | (10,755 | ) | | | (39,254 | ) | | | (9,418 | ) | | | (28,312 | ) | |
| Total accumulated gain/(loss) | | $ | (89,882,715 | ) | | $ | (18,134,882 | ) | | $ | (7,985,437 | ) | | $ | (32,528,974 | ) | | $ | (16,059,418 | ) | | $ | (64,933,552 | ) | |
* The differences between book-basis and tax-basis unrealized appreciation/(depreciation) is attributable primary to the tax deferral of losses on wash sales and passive foreign investment company (PFIC) mark to market adjustments.
** The differences between book-basis and tax basis undistributed net ordinary income is attributed to deferred compensation.
*** Under the current tax law, capital and currency losses realized after October 31 and prior to the Fund's fiscal year end may be deferred as occurring on the first day of the following year.
Because tax adjustments are calculated annually, the above table reflects the components of distributable earning at the Fund's previous fiscal year end.
Each Fund's capital loss carryforwards have the following expirations.
| | | Alternative
Energy Fund | | Asia Focus
Fund | | Asia Pacific
Dividend
Fund | | China &
Hong Kong
Fund | | Global
Energy
Fund | | Global
Innovators
Fund | |
| 2009 | | $ | — | | | $ | 2,941,671 | | | $ | — | | | $ | 425,792 | | | $ | — | | | $ | 10,999,180 | | |
| 2010 | | | — | | | | 638,053 | | | | — | | | | 364,169 | | | | — | | | | 19,915,748 | | |
| 2011 | | | — | | | | — | | | | — | | | | — | | | | — | | | | 8,376,172 | | |
| 2012 | | | — | | | | — | | | | — | | | | — | | | | — | | | | 4,814,343 | | |
| 2013 | | | — | | | | — | | | | — | | | | — | | | | — | | | | — | | |
| 2014 | | | — | | | | — | | | | — | | | | — | | | | — | | | | — | | |
| 2015 | | | — | | | | — | | | | — | | | | — | | | | — | | | | — | | |
| 2016 | | | 14,004,637 | | | | — | | | | 2,065,260 | | | | — | | | | — | | | | — | | |
| Total | | $ | 14,004,637 | | | $ | 3,579,724 | | | $ | 2,065,260 | | | $ | 789,961 | | | $ | — | | | $ | 44,105,443 | | |
For the Asia Focus Fund, of the $2,941,671 of capital loss carryover, $217,143 is related to the acquisition of the Asia New Economy Fund and is remaining to be recognized over the next year.
66
For the Global Innovators Fund, of the $10,999,180 capital loss carryover, $559,122 of capital loss carryover is related to the acquisition of the Investec Internet.com Fund and the Wireless World Fund on January 25, 2002. The remaining losses will be recognized over the next two years. The amount is subject to an annual limitation of $838,362 over the next year and $559,122 on the second year under tax rules.
The tax character of distributions paid during the six months ended June 30, 2009 and year ended December 31, 2008 are as follows:
| | | Six months ended June 30,
2009 | | 2008 | |
| | | Oridinary
Income | | Long -term
Capital Gain | | Ordinary
Income | | Long-term
Capital Gain | |
| Alternative Energy Fund | | $ | — | | | $ | — | | | $ | 3,265,473 | | | $ | — | | |
| Asia Focus Fund | | $ | — | | | $ | — | | | $ | 1,481,421 | | | $ | — | | |
| Asia Pacific Dividend Fund | | $ | 52,816 | | | $ | — | | | $ | 1,026,186 | | | $ | 130,652 | | |
| China & Hong Kong Fund | | $ | — | | | $ | — | | | $ | 3,332,293 | | | $ | 477,128 | | |
| Global Energy Fund | | $ | — | | | $ | — | | | $ | — | | | $ | 1,305,040 | | |
| Global Innovators Fund | | $ | — | | | $ | — | | | $ | 1,527,390 | | | $ | — | | |
Note 9
Line of Credit
The Trust has a secured $5,000,000 line of credit with its custodian. Borrowings under this arrangement bear interest at the federal funds rate plus 0.75% per annum. As compensation for holding available the lending commitment, the Trust pays a 0.10% per annum fee on the unused portion of the commitment, which is allocated among the Funds based on their relative net assets. The fee is payable quarterly in arrears. The average interest rate charged and the average outstanding loan payable to State Street Bank for the six months ended June 30, 2009 was as follows:
| Fund | | Average Interest Rate | | Average Outstanding Loan Payable | | Interest Expense | |
| Alternative Energy Fund | | | 1.00 | % | | $ | 21,045 | | | $ | 106 | | |
| Asia Focus Fund | | | 1.00 | % | | $ | 20,768 | | | $ | 105 | | |
| Asia Pacific Dividend Fund | | | 1.00 | % | | $ | 10,186 | | | $ | 51 | | |
| China & Hong Kong Fund | | | 1.00 | % | | $ | — | | | $ | — | | |
| Global Energy Fund | | | 1.00 | % | | $ | 30,277 | | | $ | 152 | | |
| Global Innovators Fund | | | 1.00 | % | | $ | 6,669 | | | $ | 34 | | |
Note 10
Accounting Pronoucements
In March 2008, Statement of Financial Accounting Standards No. 161, "Disclosures about Derivative Instruments and Hedging Activities" ("SFAS 161") was issued and is effective for fiscal years beginning after November 15, 2008. SFAS 161 is intended to improve financial reporting for derivative instruments by requiring enhanced disclosure that enables investors to understand how and why an entity uses derivatives, how derivatives are accounted for, and how derivative instruments affect an entity's results of operations and financial position. Management is currently evaluating the implications of SFAS 161. The impact on the Funds' financial statement disclosures, if any, is currently being assessed.
67
Additional Information (Unaudited)
Proxy Voting Procedures
The Advisor of the Funds votes proxies relating to portfolio securities in accordance with procedures that have been approved by the Board. You may obtain a description of these procedures, free of charge, by calling "toll-free" 1-800-915-6565. This information is also available through the Securities and Exchange Commission's website at http://www.sec.gov.
Proxy Voting Records
Information regarding how the advisor of the Funds voted proxies relating to portfolio securities during the latest 12-month period ended June 30 is available, without charge, by calling toll-free, 1-800-915-6565. This information is also available through the Securities and Exchange Commission's website at http://www.sec.gov.
Form N-Q Disclosure
The Funds file their complete schedule of portfolio holdings with the Securities and Exchange Commission for the first and third quarters of each fiscal year on Form N-Q. The Funds' Form N-Q is available on the Securities and Exchange Commission's website at http://www.sec.gov. The Funds' Form N-Q may be reviewed and copied at the Commission's Public Reference Room in Washington, DC, and information on the operation of the Public Reference Room may be obtained by calling 1-800-SEC-0330. This information is also available, without charge, by calling toll-free, 1-800-915-6565.
Board Consideration of and Continuation of the Trust's Investment Advisory Agreement
At an in-person meeting held on May 11, 2009, the Board of Trustees (the "Trustees" or the "Board") of the Trust considered the annual approval of the continuation of the investment advisory agreement (the "Agreement") between the Trust, on behalf of the Alternative Energy Fund, the Asia Focus Fund, Asia Pacific Dividend Fund, the China & Hong Kong Fund, the Global Energy Fund and the Global Innovators Fund, and the Advisor.
At the meeting, the Trustees discussed with counsel to the Trust and independent legal counsel to the Trustees who are not "interested persons" (as defined by the 1940 Act), of the Trust (the "Independent Trustees"), their fiduciary duties under the 1940 Act in reviewing the Agreement and their obligation to obtain and review information relevant and necessary to their consideration of the Agreement. The Trustees received a memorandum summarizing the duties of the Trustees under, and the fiduciary standards established by, Section 36(b) of the 1940 Act, the legislative history of the amendments to the 1940 Act, the history of management fee standards and regulations, positions taken thereon by the Securities and Exchange Commission and Congress, the criteria generally considered in evaluating the reasonableness of fees, and lawsuits illustrating the courts' application and interpretation of the applicable fiduciary standards.
The Board discussed the fees payable by each Fund under the Agreement, the services provided by the Advisor to each Fund, and the The Trustees considered that they receive from the Advisor and review on a regular basis over the course of the year, information regarding the Funds' performance, including information about the Funds' performance in comparison to peers and benchmarks and analyses by the Advisor of the Funds' performance. The Trustees also considered information about the nature, extent and quality of the services provided by the Advisor, including the background and experience of the Advisor's senior management and portfolio managers, and their special knowledge about the areas in which the Funds invest. The Trustees also considered information gained from their experience as Trustees of the Funds, in addition to the overall reputation and capabilities of the Advisor and its investment professionals, the Advisor's commitment to providing high quality services to the Funds, the Trustees' overall confidence in the Advisor's integrity and responsiveness to Trustee concerns, the Advisor's integrity as reflected in its adherence to compliance practices, and the Advisor's willingness and initiative in implementing changes designed to improve services to the Funds or reduce Fund expenses. The Trustees also considered the size of each Fund in comparison to its peers, including whether peer funds were part of a larger fund complex. The Trustees also considered the general market performance in the prior year across market sectors and specifically in respect of each Fund's specific sector or region focus, including the particular challenges or strengths of the markets in responding to global market events during the period.
The Trustees also considered the performance and expense information compiled by Lipper, Inc., an independent provider of data to mutual fund boards. The Trustees reviewed, on a fund-by-fund basis, information concerning the historical performance of each Fund and each Fund's comparison funds, the annualized expense ratios as a percentage of average net assets of each fund in the comparison group, historical expense ratio comparisons, and information provided by the Advisor to explain each Fund's performance. The Trustees also discussed certain financial information about the Advisor, including the profitability of these Funds to the Advisor, the Advisor's profitability in general and the firm's retention of key personnel. The Trustees also discussed with counsel to the Trust and independent legal counsel the comparability criteria for the Funds and the peer funds comprising the comparison groups as identified by Lipper, Inc.
68
After the Independent Trustees had met with their independent legal counsel in executive session, the full Board determined that the overall arrangement between the Funds and the Advisor was fair and reasonable and that continuance of the Agreement was in the best interests of each Fund and its shareholders. The Trustees considered and discussed the matters summarized below, in making their determinations with respect to each Fund:
Alternative Energy Fund. The Board compared the Alternative Energy Fund's 1.00% annual advisory fee to comparable fees charged to an independently-selected peer group of twenty-one similar mutual funds and considered the fact that the fee was higher than the median and average fees.. The Board also considered that the Fund's total annual expense ratio of 1.67% was higher than the peer group median and average, and considered the fact that the Advisor was willing to waive its fees and reimburse expenses if the Fund's expenses exceeded 1.98% through June 30, 2010. The Board also considered the fact that, at approximately $113 million in assets, the Fund was still smaller than many of the funds in its peer group, which ranged from approximately $1.8 million in assets to $12.7 billion in assets, with an average of $1.2 billion, and significantly smaller than the avera ge of peer funds. The Board then compared the Fund's performance for the three-months, six-months, nine-months and one-year ended March 31, 2009 to that of the peer group for the same periods and noted the fact that the Fund underperformed the median and average performance of the peer group of similarly managed funds for the respective periods.
The Board concluded that: (1) the Alternative Energy Fund's advisory fees were within the range of fees charged to similar mutual funds, due to the Fund's smaller size; (2) the Fund's higher total expenses were attributable to the Fund's smaller size; (3) the Advisor's willingness to limit the Fund's expense ratio through June 30, 2010 would provide stability to the Fund's expenses during that period; and (4) although the Fund had underperformed its peers for the period, it was in the best interests of the Alternative Energy Fund's shareholders for the Board to approve the continuation of the Agreement.
Asia Focus Fund. The Board compared the Asia Focus Fund's 1.00% annual advisory fee to comparable fees charged to an independently-selected peer group of seven similar mutual funds and considered the fact that the fee was higher than the median advisory fee for the peer group but lower than the peer group's average fee. The Board also considered that the Fund's total annual expense ratio of 1.70% was higher than the peer group median and average, but that the Advisor was willing to waive its fees and reimburse expenses if the Fund's expenses exceeded 1.98% through June 30, 2010. The Board also considered the fact that, at approximately $46 million in assets, the Fund was smaller than all but two of the funds in its peer group, which ranged from approximately $5.5 million in assets to $4.1 billion in assets, with an average of $1.9 billion. The Board then compared the Fund's performance for the one-year, three-years, five-years and ten-years ended March 31, 2009 to that of the peer group for the same periods and considered the fact that the Fund underperformed the median and average performance of its peer group of similarly managed funds for the one-year, three-year, five-year, and ten-year periods.
The Board concluded that: (1) the Asia Focus Fund's advisory fees were within the range of fees charged to comparable mutual funds; (2) the Fund's somewhat higher total expenses were attributable to the Fund's relatively smaller size; (3) the Advisor's willingness to limit the Fund's expense ratio through June 30, 2010 would provide stability to the Fund's expenses during that period; and (4) although the Fund had underperformed the median and average performance of its peers during the one-year, three-year periods, five-year period and ten-year periods, it was in the best interests of the Asia Focus Fund's shareholders to approve the continuation of the Agreement.
Asia Pacific Dividend Fund. The Board compared the Asia Pacific Dividend Fund's 1.00% annual advisory fee to comparable fees charged to an independently-selected peer group of nine similar mutual funds and considered the fact that the fee was higher than the median advisory fee for the peer group and slightly higher than the average fee. The Board also considered that the Fund's total annual expense ratio of 1.98% was higher than the peer group median and average, but the Advisor was willing to waive its fees and reimburse expenses if the Fund's expenses exceeded 1.98% through June 30, 2010. The Board also considered the fact that, at approximately $19 million in assets, the Fund was one of the smallest funds in its peer group, which ranged from approximately $5.5 million in assets to $4.1 billion in assets, with an average of $1.5 billion. The Board then compared the Fund's performance for the three-months, six-months, nine-months and one-year ended March 31, 2009 to that of the peer group for the same periods and considered the fact that the Fund underperformed the median and average performance of the peer group for all of the periods.
The Board concluded that: (1) the Asia Pacific Dividend Fund's advisory fees were within the range of fees charged to comparable mutual funds; (2) the Fund's somewhat higher total expenses were attributable to the Fund's relatively smaller size; (3) the Advisor's willingness to limit the Fund's expense ratio through June 30, 2010 would provide stability to the Fund's expenses during that period; and (4) although the Fund had underperformed the median and average performance of its peers during the three-months, six-months, nine-months and one-year periods, it was in the best interests of the Asia Pacific Dividend Fund's shareholders to approve the continuation of the Agreement.
69
China & Hong Kong Fund. The Board compared the China & Hong Kong Fund's 1.00% annual advisory fee to comparable fees charged to an independently-selected peer group of seven similar mutual funds and considered the fact that the fee was equal to the median advisory fee and slightly lower than the average fee. The Board also considered that the Fund's total annual expense ratio of 1.51% was equal to the peer group median and slightly above the peer group average, but the Advisor was willing, through June 30, 2010, to waive its fees or reimburse expenses if the Fund's expense ratio exceeded 1.98%. The Board also considered the fact that, at approximately $193 million in assets, the Fund's assets are equal to the median of the funds in its peer group, which ranged from approximately $35 million in assets to $1.6 billion in assets, with a median of $193 million . The Board then compared the Fund's performance for the one-year, three-years, five-years and ten-years ended March 31, 2009 to that of the peer group for the same periods and considered the fact that the Fund underperformed the median and average performance of the peer group funds for the same periods.
The Board concluded that: (1) the China & Hong Kong Fund's advisory fees were within the range of fees charged to comparable mutual funds; (2) the Fund's total expenses were also within the range of its peers; (3) the Advisor's willingness to limit the Fund's expense ratio through June 30, 2010 would provide stability to the Fund's expenses during that period; and (4) although the Fund had underperformed the median and average performance of its peers during the one-year, three-year periods, five-year period and ten-year periods, it was in the best interests of the China & Hong Kong Fund's shareholders to approve the continuation of the Agreement.
Global Energy Fund. The Board compared the Global Energy Fund's 0.75% annual advisory fee to comparable fees charged to an independently-selected peer group of nine similar mutual funds and considered the fact that the fee was equal to the median advisory fee and higher than the average fee. The Board also considered that the Fund's total annual expense ratio of 1.30% was equal to the peer group median and higher than the peer group average, but the Advisor was willing, through June 30, 2010, to waive its fees or reimburse expenses if the Fund's expense ratio exceeded 1.45%. The Board also considered the fact that, at approximately $63 million in assets, the Fund was relatively considerably smaller than most in its peer group, which ranged from approximately $6.3 million in assets to $12.7 billion in assets, with an average of $1.9 billion. The Board then compared the Fund's performance for the three-months, six-months, nine-months and one-year ended March 31, 2009 to that of the peer group for the same periods and considered the fact that the Fund had outperformed the median and average performance of the peer group of similarly-managed funds for the three-month, six month and one-year periods and outperformed the average and equaled the median for the nine-month period.
The Board concluded that: (1) the Global Energy Fund's advisory fees were within the range of fees charged to comparable mutual funds; (2) the Fund's total expenses were equal to the median and slightly higher than the average of the funds in its peer group; (3) the Advisor's willingness to limit the Fund's expense ratio through June 30, 2010 would provide stability to the Fund's expenses during that period; and (4) the Fund had outperformed or equaled its peers, and it was in the best interest of the Global Energy Fund's shareholders to approve the continuation of the Agreement.
Global Innovators Fund. The Board then compared the Global Innovators Fund's 0.75% annual advisory fee to comparable fees charged to an independently-selected peer group of seventeen similar mutual funds and considered the fact that the fee was higher than the median and average advisory fees. The Board also considered that the Fund's total annual expense ratio of 1.39% was higher than the peer group median and average, but the Advisor was willing, through June 30, 2010, to waive its fees or reimburse expenses if the Fund's expense ratio exceeded 1.55%. The Board also considered the fact that, at approximately $51 million in assets, the Fund was smaller than the median asset size of the peer funds of $82 million and the average asset size of the peer funds of $1.4 billion. The Board then compared the Fund's performance for the three-months, one-year, three-years a nd five-years ended March 31, 2009 to that of the peer group for the same periods and considered the fact that the Fund outperformed the median and average performance of the peer group of similarly-managed funds for the three-month, three-year and five-year periods and underperformed the peer group for the one-year period.
The Board concluded that: (1) the Global Innovators Fund's advisory fees were within the range of fees charged to comparable mutual funds; (2) the Fund's total expenses were higher than the range of funds in its peer group; (3) the Advisor's willingness to limit the Fund's expense ratio through June 30, 2010 would provide stability to the Fund's expenses during that period; and (4) the Fund had outperformed its peers during the three-month, three-year and five-year periods and underperformed for the one-year period, and it was in the best interests of the Global Innovators Fund's shareholders to approve the continuation of the Agreement.
70
Privacy Notice
Guinness Atkinson Funds and Guinness Atkinson Asset Management, Inc. may collect non-public information about you from the following sources:
• Information we receive about you on applications or other forms;
• Information you give us orally; and
• Information about your transactions with us.
We do not disclose any non-public personal information about our shareholders or former shareholders without the shareholder's authorization, except as required by law or in response to inquiries from governmental authorities. We restrict access to your personal and account information to those employees who need to know that information to provide products and services to you. We also may disclose that information to unaffiliated third parties (such as to brokers or custodians) only as permitted by law and only as needed for us to provide agreed services to you. We maintain physical, electronic and procedural safeguards to guard your non-public personal information.
71
72
73
74
Guinness Atkinson Funds Information
Board of Trustees
| J. Brooks Reece, Jr., Chairman | |
|
| Dr. Gunter Dufey | |
|
| James I. Fordwood | |
|
| Timothy W.N. Guinness | |
|
| Dr. Bret A. Herscher | |
|
Contact Guinness Atkinson Funds
| P.O. Box 701 | |
|
| Milwaukee, WI 53201-0701 | |
|
| Shareholder Services: 800-915-6566 | |
|
| Literature Request: 800-915-6565 | |
|
| Website: www.gafunds.com | |
|
| Email: mail@gafunds.com | |
|
| Guinness Atkinson Funds | |
| Fund | | Cusip | | Ticker | | Fund# | |
| Alternative Energy Fund | | | 402031 50 4 | | | GAAEX | | | 1298 | | |
| Asia Focus Fund | | | 402031 10 8 | | | IASMX | | | 1096 | | |
| Asia Pacific Dividend Fund | | | 402031 60 3 | | | GAADX | | | 1299 | | |
| China & Hong Kong Fund | | | 402031 20 7 | | | ICHKX | | | 1094 | | |
| Global Energy Fund | | | 402031 40 5 | | | GAGEX | | | 1098 | | |
| Global Innovators Fund | | | 402031 30 6 | | | IWIRX | | | 1095 | | |
Distributed by Quasar Distributors, LLC, Milwaukee, WI 53202
This report is intended for shareholders of the Guinness Atkinson Funds and may not be used as literature unless preceded or accompanied by a current prospectus.
75
Guinness Atkinson Funds
c/o U.S. Bancorp Fund Services, LLC
P.O. Box 701
Milwaukee, WI 53201-0701
123S0204--P
Item 2. Code of Ethics.
Not applicable for semi-annual report.
Item 3. Audit Committee Financial Expert.
Not applicable for semi-annual report.
Item 4. Principal Accountant Fees and Services.
Not applicable for semi-annual report.
Item 5. Audit Committee of Listed Registrants.
Not applicable to registrants who are not listed issuers (as defined in Rule 10A-3 under the Securities Exchange Act of 1934).
Item 6. Investments.
Schedules of Investments are included as part of the report to shareholders filed under Item 1 of this Form.
Item 7. Disclosure of Proxy Voting Policies and Procedures for Closed-End Management Investment Companies.
Not applicable to open-end investment companies.
Item 8. Portfolio Managers of Closed-End Management Investment Companies.
Not applicable to open-end investment companies.
Item 9. Purchases of Equity Securities by Closed-End Management Investment Company and Affiliated Purchasers.
Not applicable to open-end investment companies.
Item 10. Submission of Matters to a Vote of Security Holders.
There have been no material changes to the procedures by which shareholders may recommend nominees to the registrant’s board of trustees.
1
Item 11. Controls and Procedures.
(a) The Registrant’s President and Treasurer have reviewed the Registrant’s disclosure controls and procedures (as defined in Rule 30a-3(c) under the Investment Company Act of 1940 (the “Act”)) as of a date within 90 days of the filing of this report, as required by Rule 30a-3(b) under the Act and Rules 13a-15(b) or 15d-15(b) under the Securities Exchange Act of 1934. Based on their review, such officers have concluded that the disclosure controls and procedures are effective in ensuring that information required to be disclosed in this report is appropriately recorded, processed, summarized and reported and made known to them by others within the Registrant and by the Registrant’s service provider.
(b) There were no changes in the Registrant’s internal control over financial reporting (as defined in Rule 30a-3(d) under the Act) that occurred during the second fiscal quarter of the period covered by this report that has materially affected, or is reasonably likely to materially affect, the Registrant’s internal control over financial reporting.
Item 12. Exhibits.
(a) (1) Any code of ethics or amendment thereto, that is the subject of the disclosure required by Item 2, to the extent that the registrant intends to satisfy Item 2 requirements through filing an exhibit. Not Applicable.
(2) A separate certification for each principal executive and principal financial officer pursuant to Section 302 of the Sarbanes-Oxley Act of 2002. Filed herewith.
(3) Any written solicitation to purchase securities under Rule 23c-1 under the Act sent or given during the period covered by the report by or on behalf of the registrant to 10 or more persons. Not applicable to open-end investment companies.
(b) Certifications pursuant to Section 906 of the Sarbanes-Oxley Act of 2002. Furnished herewith.
2
SIGNATURES
Pursuant to the requirements of the Securities Exchange Act of 1934 and the Investment Company Act of 1940, the registrant has duly caused this report to be signed on its behalf by the undersigned, thereunto duly authorized.
(Registrant) | Guinness Atkinson Funds | |
| |
By | /s/ James J. Atkinson_Jr. | |
| James J. Atkinson, Jr., President | |
| |
Date | 9/4/09 | |
| | | |
Pursuant to the requirements of the Securities Exchange Act of 1934 and the Investment Company Act of 1940, this report has been signed below by the following persons on behalf of the registrant and in the capacities and on the dates indicated.
By | /s/ James J. Atkinson_Jr. | |
| James J. Atkinson, Jr., President | |
| |
| |
Date | 9/4/09 | |
By | /s/ Michael Ricks | |
| Michael Ricks, Treasurer | |
| |
| |
Date | 9/4/09 | |
3