UNITED STATES
SECURITIES AND EXCHANGE COMMISSION
Washington, D.C. 20549
FORM N-CSR
CERTIFIED SHAREHOLDER REPORT OF REGISTERED
MANAGEMENT INVESTMENT COMPANIES
Investment Company Act file number | 811-08360 |
|
GUINNESS ATKINSON FUNDS |
(Exact name of registrant as specified in charter) |
|
21550 Oxnard Street, Suite 850
Woodland Hills, CA | | 91367 |
(Address of principal executive offices) | | (Zip code) |
|
James J. Atkinson, Jr.
21550 Oxnard Street, Suite 850
Woodland Hills, CA 91367 |
(Name and address of agent for service) |
|
Registrant’s telephone number, including area code: | (800-915-6566) - | |
|
Date of fiscal year end: | December 31 | |
|
Date of reporting period: | June 30, 2010 | |
| | | | | | | | |
Item 1. Reports to Stockholders.
The registrant’s annual report transmitted to shareholders pursuant to Rule 30e-1 under the Investment Company Act of 1940, as amended (the “Investment Company Act”), is as follows:
Guinness Atkinson Funds
Semi-Annual Report
June 30, 2010
TABLE OF CONTENTS
| | 3 | | | Letter to Shareholders | |
|
| | 6 | | | Expense Example | |
|
| | 7 | | | Alternative Energy Fund | |
|
| | 13 | | | Asia Focus Fund | |
|
| | 19 | | | Asia Pacific Dividend Fund | |
|
| | 25 | | | China & Hong Kong Fund | |
|
| | 32 | | | Global Energy Fund | |
|
| | 38 | | | Global Innovators Fund | |
|
| | 45 | | | Statements of Assets and Liabilities | |
|
| | 47 | | | Statements of Operations | |
|
| | 49 | | | Statements of Changes in Net Assets | |
|
| | 51 | | | Financial Highlights | |
|
| | 57 | | | Notes to Financial Statements | |
|
| | 66 | | | Additional Information | |
|
| | 68 | | | Privacy Notice | |
|
| | 71 | | | Guinness Atkinson Funds Information | |
|
2
Dear Guinness Atkinson Funds Shareholders,
We're undaunted by the weak first half of 2010. We continue to be optimistic about the global economy, the markets and, most importantly, the themes that underpin the Guinness Atkinson Funds. We're not surprised about the volatility in the markets of late – investors globally seem to be especially uncertain regarding the course of the global economy and markets. But aren't they always? We noticed a headline recently that read, "Markets Decline on Uncertainty." We don't consider such a headline "news" as that could be said rather regularly. Virtually daily some market pundit will remark that "...we'll know a lot more next week after the (fill in the blank here) report (or statistic or earnings announcement) is issued." By then, of course, the markets will be looking ahead to the next event to clarify things. And so it goes. Investing is always about uncertainty. That is the nature of the exercise.
One way to overcome this uncertainty is to lengthen your view. We don't know any more about what will happen next week than the writer of the uncertain headline. It is easier to think about the long-term and to contemplate the big themes of the century. We believe China will continue to grow and will, at some point in the next decade or so, become the world's largest economy – and Asia will become the dominant economic region. We believe energy demand will continue to grow globally and that petroleum will continue to be more difficult and expensive to find and extract. (And this difficulty may be the larger lesson of the Gulf oil spill.) We believe that the development of alternative forms of energy is inevitable. And, we believe that the rate of change and innovation will continue to increase.
Given the economic environment the last couple of years it is understandable that investors may be a little more sensitive to uncertainty. But we'll repeat what we said in our report six months ago, "Our view is that we're just at the foothills of...great change and that the best is yet to come." We continue to be optimists and, as we mentioned, undaunted by the bumpy ride the first half of 2010.
Fund Performance
Not much positive can be said about the performance of any of the Guinness Atkinson Funds for the first half of 2010. All six of the Funds produced a negative total return over the period. On the positive side, five of the six have a positive return for the 12-month period ending June 30, 2010 and the four Funds with five-year track records (or longer) have positive returns over the last five years, led by the China & Hong Kong Fund with an average annualized five year total return of 13.35%.
3
Guinness Atkinson Funds Total Returns For Periods Ending June 30, 2010
| Fund (inception date) | | 6-months | | 1-year | | 3-year | | 5-year | | 10-year | | From Inception | | Expense Ratio | |
| Alternative Energy Fund (March 31, 2006) | | | -30.82 | % | | | -23.10 | % | | | -30.13 | % | | | | | | | | | | | -18.91 | % | | | 1.85 | % | |
| Asia Focus Fund (April 29, 1996) | | | -10.83 | % | | | 14.19 | % | | | -6.58 | % | | | 9.46 | % | | | 8.52 | % | | | 2.61 | % | | | 1.68 | % | |
| Asia Pacific Dividend Fund (March 31, 2006) | | | -5.81 | % | | | 15.61 | % | | | -7.46 | % | | | | | | | | | | | 1.07 | % | | | 2.93% gross;
1.98% net* | | |
| China & Hong Kong Fund (June 30, 1994) | | | -9.22 | % | | | 25.09 | % | | | 1.08 | % | | | 13.35 | % | | | 8.68 | % | | | 8.66 | % | | | 1.58 | % | |
| Global Energy Fund (June 30, 2004) | | | -13.52 | % | | | 7.79 | % | | | -5.99 | % | | | 6.43 | % | | | | | | | 13.96 | % | | | 1.42 | % | |
| Global Innovators Fund (December 15, 1998) | | | -10.28 | % | | | 12.16 | % | | | -9.56 | % | | | 3.11 | % | | | -4.11 | % | | | 2.44 | % | | | 1.69% gross;
1.56% net* | | |
Periods of greater than one year are average annualized returns; one year or less are actual returns. All returns are for the periods ending June 30, 2010.
Performance data quoted represents past performance and does not guarantee future results. The investment return and principal value of an investment will fluctuate so that an investor's shares, when redeemed, may be worth more or less than the original cost. Current performance of the Funds may be lower or higher than the performance quoted. Performance data current to the most recent month end may be obtained by visiting www.gafunds.com. The funds impose a 2% redemption fee on shares held less than 30 days. Performance data quoted does not reflect this fee. If it had, total return would be lower.
*All of the Guinness Atkinson Funds have an expense cap in place and the advisor is contractually obligated to cap the total expenses at least through June 30, 2011.
Expense ratios are from the most recent prospectus (dated May 1, 2010) and are from the most recent audited financials (period ending December 31, 2009) at the time that prospectus was completed.
As with our previous report, our portfolio managers provide commentary for each of the Guinness Atkinson Funds adjacent to each Fund's financial report, and Morningstar ratings data can be found immediately after this letter.
Thank you for your investment in the Guinness Atkinson Funds; we appreciate the confidence you have placed in us and hope to continue to serve you.
Sincerely,
 | |  | |
|
| Timothy Guinness | | James Atkinson | |
|
4
Morningstar Ratings
Below is a table listing the Morningstar star ratings as of June 30, 2010 for the four Guinness Atkinson Funds that have at least a three year history. Parenthetical numbers after the star rating indicate the number of funds in the comparison group.
| Fund | | Category | | Overall | | 3-year | | 5-year | | 10-year | |
Alternative Energy
Fund | | Equity Energy | | 1*
(69 funds) | | 1*
(69 funds) | | | | | |
Asia Focus
Fund | | Pacific/Asia
Ex-Japan Stk | | 2**
(116 funds) | | 2**
(116 funds) | | 2**
(84 funds) | | 1*
(65 funds) | |
Asia Pacific Dividend
Fund | | Pacific/Asia
Ex-Japan Stk | | 2**
(116 funds) | | 2**
(116 funds) | | | | | |
China & Hong Kong
Fund | | Pacific/Asia
Ex-Japan Stk | | 3***
(116 funds) | | 3***
(116 funds) | | 3***
(84 funds) | | 3***
(65 funds) | |
Global Energy
Fund | | Equity Energy | | 4****
(69 funds) | | 4****
(69 funds) | | 4****
(51 funds) | | | |
Global Innovators
Fund | | Large Growth | | 3***
(1,545 funds) | | 2**
(1,545 funds) | | 4****
(1,298 funds) | | 2**
(739 funds) | |
©2010 Morningstar, Inc. All Rights Reserved. The information contained herein: (1) is proprietary to Morningstar and/or its content providers; (2) may not be copied or distributed; and (3) is not warranted to be accurate, complete or timely. Neither Morningstar nor its content providers are responsible for any damages or losses arising from any use of this information. Past performance is no guarantee of future results.
The Funds invest in foreign securities which involves greater volatility and political, economic and currency risks and differences in accounting methods. Non-diversified Funds' assets may be concentrated in fewer individual holdings than diversified funds. Therefore, these Funds are more exposed to individual stock volatility than diversified funds. Investments in smaller companies involve additional risks such as limited liquidity and greater volatility.
For each fund with at least a three-year history, Morningstar calculates a Morningstar Rating(TM) based on a Morningstar Risk-Adjusted Return measure that accounts for variation in a fund's monthly performance (including the effects of sales charges, loads, and redemption fees), placing more emphasis on downward variations and rewarding consistent performance. The top 10% of funds in each category receive 5 stars, the next 22.5% receive 4 stars the next 35% receive 3 stars, the next 22.5% receive 2 stars and the bottom 10% receive 1 star. (Each share class is counted as a fraction of one fund within this scale and rated separately, which may cause slight variations in distribution percentages.)
5
GUINNESS ATKINSON FUNDS
Expense Examples (Unaudited)
As a shareholder of the Funds, you incur two types of costs: (1) redemption fees; and (2) ongoing costs, including advisory fees; and other Fund expenses. The examples below are intended to help you understand your ongoing costs (in dollars) of investing in the Funds and to compare these costs with the ongoing costs of investing in other mutual funds.
The examples are based on an investment of $1,000 invested at the beginning of the period shown and held for the entire period from January 1, 2010 to June 30, 2010.
Actual Expenses
For each Fund, the first line of the table below provides information about actual account values and actual expenses. You may use the information in this line, together with the amount you invested, to estimate the expenses that you paid over the period. Simply divide your account value by $1,000 (for example, an $8,600 account value divided by $1,000 = 8.6), then multiply the result by the number in the first line under the heading entitled "Expenses Paid during Period" to estimate the expenses you paid on your account during this period.
Hypothetical Example for Comparison Purposes
For each Fund, the second line of the table below provides information about hypothetical account values and hypothetical expenses based on the Fund's actual expense ratios and an assumed rate of return of 5% per year before expenses, which is not the Fund's actual return. The hypothetical account values and expenses may not be used to estimate the actual ending account balance or expenses you paid for the period. You may use this information to compare the ongoing costs of investing in the Fund and other funds. To do so, compare this 5% hypothetical example with the 5% hypothetical examples that appear in the shareholder reports of the other funds.
Please note that the expenses shown in the table are meant to highlight your ongoing costs only and do not reflect any redemption fees. Therefore, the second line for each Fund of the table is useful in comparing ongoing costs only, and will not help you determine the relative total costs of owning different funds. In addition, if these redemption fees were included, your costs would have been higher.
| | | Beginning
Account
Value
(01/01/10) | | Ending
Account
Value
(06/30/10) | | Expenses Paid
During Period*
(01/01/10 to
06/30/10) | | Expense Ratios
During Period*
(01/01/10 to
06/30/10) | |
| Guinness Atkinson Alternative Energy Fund Actual | | $ | 1,000.00 | | | $ | 691.80 | | | $ | 7.30 | | | | 1.74 | % | |
Guinness Atkinson Alternative Energy Fund Hypothetical
(5% return before expenses) | | $ | 1,000.00 | | | $ | 1,016.17 | | | $ | 8.70 | | | | 1.74 | % | |
| Guinness Atkinson Asia Focus Fund Actual | | $ | 1,000.00 | | | $ | 891.70 | | | $ | 7.69 | | | | 1.64 | % | |
Guinness Atkinson Asia Focus Fund Hypothetical
(5% return before expenses) | | $ | 1,000.00 | | | $ | 1,016.66 | | | $ | 8.20 | | | | 1.64 | % | |
| Guinness Atkinson Asia Pacific Dividend Fund Actual | | $ | 1,000.00 | | | $ | 941.90 | | | $ | 9.53 | | | | 2.02 | %† | |
Guinness Atkinson Asia Pacific Dividend Fund Hypothetical
(5% return before expenses) | | $ | 1,000.00 | | | $ | 1,014.98 | | | $ | 9.89 | | | | 2.02 | %† | |
| Guinness Atkinson China & Hong Kong Fund Actual | | $ | 1,000.00 | | | $ | 907.80 | | | $ | 6.91 | | | | 1.46 | % | |
Guinness Atkinson China & Hong Kong Fund Hypothetical
(5% return before expenses) | | $ | 1,000.00 | | | $ | 1,017.55 | | | $ | 7.30 | | | | 1.46 | % | |
| Guinness Atkinson Global Energy Fund Actual | | $ | 1,000.00 | | | $ | 864.80 | | | $ | 5.41 | | | | 1.17 | % | |
Guinness Atkinson Global Energy Fund Hypothetical
(5% return before expenses) | | $ | 1,000.00 | | | $ | 1,018.99 | | | $ | 5.86 | | | | 1.17 | % | |
| Guinness Atkinson Global Innovators Fund Actual | | $ | 1,000.00 | | | $ | 897.20 | | | $ | 7.27 | | | | 1.55 | % | |
Guinness Atkinson Global Innovators Fund Hypothetical
(5% return before expenses) | | $ | 1,000.00 | | | $ | 1,017.16 | | | $ | 7.73 | | | | 1.55 | % | |
*Expenses are equal to the Funds' annualized expense ratio as indicated, multiplied by the average account value over the period, multiplied by the number of days in most recent fiscal half-year period (181), then divided by the number of days in the fiscal year (365) (to reflect the one-half year period).
†Net of fee waivers and/or expense reimbursements. If those fee waivers and/or expense reimbursements had not been in effect, the Fund's actual expenses would have been higher.
6
ALTERNATIVE ENERGY FUND for the period ended June 30, 2010
1. Performance
The Guinness Atkinson Alternative Energy Fund was down -30.82% for the first half of 2010. This compared to a fall in the Wilderhill New Energy Global Innovation Index of -26.62% and in the Wilderhill Clean Energy Index of -24.55%. The fund and sector have underperformed the broad markets, partly reflecting a retrenchment from the strong performance in 2009. The sector has also underperformed the energy sector. As a pureplay fund, the fund is likely to experience higher volatility in returns, but is well positioned for the growth we are seeing in the fundamentals of the alternative energy industry.
AVERAGE ANNUALIZED TOTAL RETURNS
| | | 6 Months
(Actual) | | 1 Year
(Actual) | | 3 Years | | Since
Inception
March 31, 2006 | |
| Fund | | | -30.82 | % | | | -23.10 | % | | | -30.13 | % | | | -18.91 | % | |
| Benchmark Index: | |
| Wilderhill New Energy Global Innovation Index (NEX) | | | -26.62 | % | | | -16.99 | % | | | -20.87 | % | | | -8.07 | % | |
| Wilderhill Clean Energy Index (ECO) | | | -24.55 | % | | | -16.73 | % | | | -26.75 | % | | | -20.46 | % | |
The Fund's gross expense ratio is 1.85% per the Summary Prospectus dated May 1, 2010. Guinness Atkinson Asset Management has contractually agreed to waive a portion of its advisory fees so that the Fund's ratio of expenses to average daily net assets will not exceed 1.98% (excluding Acquired Fund Fees and Expenses, interest, taxes, dividends on short positions and extraordinary expenses) through at least June 30, 2011. To the extent that the Advisor waives fees it may seek repayment of a portion or all of such amounts at any time within the three fiscal years after the fiscal year in which such amounts were waived, subject to the applicable cap.
Performance data quoted represents past performance and does not guarantee future results. The investment return and principal value of an investment will fluctuate so that an investor's shares, when redeemed, may be worth more or less than their original cost. Current performance of the Funds may be lower or higher than the performance quoted. Performance data current to the most recent month end may be obtained by visiting www.gafunds.com, or calling (800) 916-6566.
The Fund imposes a 2% redemption fee on shares held less than 30 days. Performance data quoted does not reflect the 2% redemption fee on shares held less than 30 days. Total Returns for prior periods reflect a fee waiver in effect and in the absence of this waiver, the total returns would be lower.
2. Activity
The Fund's main exposure continued to be to solar and wind in the first half of 2010. Over the first half we made no major changes to the portfolio and have continued to rebalance the portfolio on flows and opportunistically.
We had moved the fund in 2009 to increase our solar exposure. The solar industry is having a particularly strong first half of 2010, which has not been reflected in stock prices as investors keep an eye on 2011. As companies are now able to demonstrate reasonably full 2010 order books and are filling 2011 order books, we are excited about the prospects for solar stocks to trade at multiples that reflect both the near term and long term growth and return potential of the sector. The Asian solar companies in particular have benefitted from their low cost structures and improving silicon supply chain. Notable solar outperformers were STR Holdings, who are a manufacturer of solar encapsulants and SMA Solar Technologies, who make inverters for solar installations. Both companies are good volume plays on the solar industry. Notable underperformers were Renewable Energy Corporation where management have continued to execute poorly on their construc tion of new polysilicon plant and Canadian Solar, a low cost Asian manufacturer who have had some revenue recognition irregularities.
The wind sector has had a tricky time in 2010 as the backlog of orders that sustained revenues in 2009 has not been followed by the expected increase in orders in 2010. There has been an increase in orders towards the end of the first half of 2010 and we are optimistic that the wind sector is heading towards an improvement of order flow in 2011. Notable underperformers here are Clipper Windpower who despite receiving a large investment and support from UTC Corporation have not yet turned that into significant new order flow and Greentech Energy Systems who have struggled with the challenges of commissioning wind farms
7
ALTERNATIVE ENERGY FUND
in Italy and with finalising financings. The notable outperformer was Innergex, who merged with the Innergex Power Income Fund that they managed, leading to a rerating of the company as it achieved scale.
Across the rest of the portfolio, our investments in ground source heat pump companies have performed relatively well as has our investment in Energy Development Corporation, the Philippines geothermal utility.
3. Outlook
The sector continues to be seen as unattractive to investors, which has lead to stocks trading at low valuations. The main overhangs come from concerns over government subsidies for the sector being reduced as budgets are cut and lower energy prices particularly in the electricity sector, which drives many of the long term power purchase agreements.
While we have some concerns about withdrawal of some of the direct financial support for the sector, we take comfort from the fact that the drivers of the industry remain intact and our keeping alternative energy at the top of the political agenda. In fact, two "new" drivers are providing support at the time when it is most needed – job creation and environmental concerns. In our opinion the job creation that alternative energy offers is probably not the best direct approach to increasing employment , but alternative energy is an intelligent avenue to pursue to help long term country competitiveness, which has much wider long term employment implications. The BP disaster in the Gulf of Mexico has returned environmental concerns back to the top of the political agenda. Interestingly, environmental concerns were already a high priority in China, where the impacts of heavy industrial growth and use of coal are being witnessed today.
We still see energy prices rising higher in the long term and energy security issues have not diminished. Electricity prices in Europe and the US have been weak, and there has been demand destruction as economies have been through recession. However, the existing plant is typically old and replacement requirements are increasing, notwithstanding that demand growth in the developed economies should return when the cycle has turned. Electricity prices in China are seeing structural changes, with support and subsidies being withdrawn for fossil fuel technologies and attractive rates now in place for alternative energy.
If anything, the weakest driver is climate change, with healthy scepticism providing a headwind for the industry. Because the problems caused by climate change are set a long way in the future, it is a difficult issue to remain focused on for human let alone political lifetimes. In the long term, a move away from coal and natural gas for electricity generation and the electrification of vehicle fleets provide a path that is identifiable today to help mitigate the worst effects of climate change.
The fund managers see the combination of low valuations caused by the fall in the broad markets and the improving growth outlook of the sector as energy prices rise create a highly compelling investment opportunity. We believe the fund is well-positioned to potentially benefit from long term growth of the alternative energy sector.

Edward Guinness

Matthew Page August 2010
The Fund invests in foreign securities which will involve political, economic and currency risks, greater volatility, and differences in accounting methods. The Fund is non-diversified meaning its assets may be concentrated in fewer individual holdings than diversified funds. Therefore, the Fund is more exposed to individual stock volatility than diversified funds. The Fund invests in smaller companies, which will involve additional risks such as limited liquidity and greater volatility.
The Wilderhill New Energy Global Innovation Index (NEX) is a modified dollar weighted index of publicly traded companies, which are active in renewable and low-carbon energy, and which stand to benefit from responses to climate change and energy security concern. The Wilderhill Clean Energy Index (ECO) is a modified equal dollar weighted index comprised of publicly traded
8
companies whose businesses stand to benefit substantially from societal transition toward the use of cleaner energy and conservation. These indices are unmanaged, not available for investment and do not incur expenses.
Please refer to the Schedule of Investments for details on fund holdings. Current and future portfolio holdings are subject to risk.
The information provided herein represents the opinion of Guinness Atkinson Management for the period stated and is not intended to be a forecast of future events, a guarantee of future results, nor investment advice. Opinions, fund holdings and sector allocations are subject to change at any time are not recommendations to buy or sell any security.
9
FUND HIGHLIGHTS at June 30, 2010
GUINNESS ATKINSON ALTERNATIVE ENERGY FUND
| # of Holdings in Portfolio: | | | 39 | | |
| Portfolio Turnover: | | | 12.9 | % | |
| % of Stocks in Top 10: | | | 36.8 | % | |
| Fund Managers: | |
| Edward Guinness | | | | | |
| Matthew Page | | | | | |
| Top 10 Holdings (% of net assets) | | | | Sector Breakdown (% of Investments) | | | |
| WaterFurnace Renewable Energy, Inc. | | | 4.3 | % | | Solar | | | 51.3 | % | |
| PV Crystalox Solar PLC | | | 4.3 | % | | Wind | | | 26.6 | % | |
| Phoenix Solar AG | | | 4.0 | % | | Efficiency | | | 10.5 | % | |
| Renewable Energy Corp. ASA | | | 3.6 | % | | Geothermal | | | 6.6 | % | |
| Yingli Green Energy Holding Co., Ltd. - ADR | | | 3.5 | % | | Hydro | | | 3.5 | % | |
| Acciona SA | | | 3.5 | % | | Biomass | | | 1.5 | % | |
| Solarworld AG | | | 3.4 | % | | | | | | | |
| Cia Energetica de Minas Gerais | | | 3.4 | % | | | | | | | |
| First Solar, Inc. | | | 3.4 | % | | | | | | | |
| SunPower Corp. - Class B | | | 3.4 | % | | | | | | | |
| Country Breakdown (% of net assets) | | | | | |
| United States | | | 24.6 | % | | Norway | | | 3.6 | % | |
| China | | | 15.6 | % | | Brazil | | | 3.4 | % | |
| Spain | | | 12.7 | % | | Belgium | | | 3.3 | % | |
| Germany | | | 12.2 | % | | Philippines | | | 3.0 | % | |
| Canada | | | 7.4 | % | | France | | | 2.0 | % | |
| Britain | | | 6.7 | % | | Australia | | | 0.3 | % | |
| Denmark | | | 4.4 | % | | | | | | | |
10
SCHEDULE OF INVESTMENTS
at June 30, 2010 (Unaudited)
GUINNESS ATKINSON ALTERNATIVE ENERGY FUND
| Shares | | COMMON STOCKS: 97.5% | | Value | |
| Biomass: 1.5% | | | |
| | 78,987 | | | Boralex, Inc.* | | $ | 589,129 | | |
| Efficiency: 10.4% | | | |
| | 146,000 | | | Applied Intellectual Capital Ltd.*†^ | | | - | | |
| | 760,987 | | | Carmanah Technologies Corp.*† | | | 478,945 | | |
| | 3,098,900 | | | Composite Technology Corp.* | | | 666,264 | | |
| | 77,205 | | | LSB Industries, Inc.* | | | 1,027,599 | | |
| | 4,445,888 | | | Thermal Energy International, Inc. | | | 271,460 | | |
| | 68,700 | | | WaterFurnace Renewable Energy, Inc. | | | 1,721,130 | | |
| | | | 4,165,397 | | |
| Geothermal: 6.5% | | | |
| | 12,543,000 | | | Energy Development Corp/Philippines | | | 1,179,105 | | |
| | 351,369 | | | Geodynamics Ltd.* | | | 96,739 | | |
| | 47,119 | | | Ormat Technologies, Inc. | | | 1,332,997 | | |
| | | | 2,608,840 | | |
| Hydro: 3.4% | | | |
| | 93,453 | | | Cia Energetica de Minas Gerais | | | 1,370,956 | | |
| Solar: 49.4% | | | |
| | 99,000 | | | Canadian Solar, Inc.* | | | 968,220 | | |
| | 12,000 | | | First Solar, Inc.* | | | 1,365,960 | | |
| | 232,400 | | | JA Solar Holdings Co Ltd.* | | | 1,080,660 | | |
| | 127,200 | | | LDK Solar Co., Ltd. - ADR* | | | 657,624 | | |
| | 115,680 | | | MEMC Electronic Materials, Inc.* | | | 1,142,918 | | |
| | 43,040 | | | Phoenix Solar AG | | | 1,597,022 | | |
| | 2,153,501 | | | PV Crystalox Solar PLC | | | 1,714,738 | | |
| | 109,200 | | | Renesola Ltd. - ADR* | | | 651,924 | | |
| | 619,025 | | | Renewable Energy Corp. ASA* | | | 1,454,238 | | |
| | 12,760 | | | SMA Solar Technology AG | | | 1,304,977 | | |
| | 124,154 | | | Solarworld AG | | | 1,371,895 | | |
| | 63,700 | | | STR Holdings, Inc.* | | | 1,197,560 | | |
| | 125,020 | | | SunPower Corp. - Class B * | | | 1,350,216 | | |
| | 133,311 | | | Suntech Power Holdings Co., Ltd. - ADR* | | | 1,222,462 | | |
| | 71,300 | | | Trina Solar Ltd. - ADR* | | | 1,232,064 | | |
| | 136,900 | | | Yingli Green Energy Holding Co., Ltd. - ADR* | | | 1,393,642 | | |
| | | | 19,706,120 | | |
The accompanying notes are an integral part of these financial statements.
11
| Shares | | COMMON STOCKS: 97.5% Continued | | Value | |
| Wind: 26.3% | | | |
| | 18,200 | | | Acciona SA | | $ | 1,382,228 | | |
| | 1,190,668 | | | Clipper Windpower PLC* | | | 969,541 | | |
| | 222,600 | | | EDP Renovaveis SA* | | | 1,306,282 | | |
| | 127,882 | | | Gamesa Corp Tecnologica SA | | | 1,097,515 | | |
| | 297,200 | | | Greentech Energy Systems* | | | 608,019 | | |
| | 1,182,300 | | | Hansen Transmissions International NV* | | | 1,307,190 | | |
| | 409,000 | | | Iberdrola Renovables SA | | | 1,277,742 | | |
| | 82,980 | | | Innergex Renewable Energy Inc*† | | | 653,208 | | |
| | 420,647 | | | Theolia SA* | | | 742,116 | | |
| | 27,615 | | | Vestas Wind Systems A/S* | | | 1,147,899 | | |
| | | | 10,491,740 | | |
| | | | | Total Common Stock
(cost $72,432,822) | | | 38,932,181 | | |
| | RIGHTS: 0.2% | | | |
| Wind: 0.2% | | | |
| | 420,647 | | | Theolia SA, rights* | | | 75,101 | | |
| | | | | Total Rights
(cost $0) | | | 75,101 | | |
| Par Value | | CONVERTIBLE BONDS: 1.5% | | | |
| Solar: 1.5% | | | |
| € | 277,500 | | | SAG Solarstrom, 7/30/10, 6.85%*†^ | | | 595,568 | | |
| | | | | Total Convertible Bonds
(cost $382,326) | | | 595,568 | | |
| | | | | Total Investments in Securities
(cost $72,815,148): 99.2% | | | 39,602,850 | | |
| | | | | Other Assets less Liabilities: 0.8% | | | 318,373 | | |
| | | | | Net Assets: 100% | | $ | 39,921,223 | | |
* Non-income producing security.
† Illiquid. Illiquid securities represent 3.4% of net assets.
^ Fair value under direction of the Board of Trustees. Fair valued securities represent 1.5% of net assets.
ADR - American Depository Receipt
€ Euro
The accompanying notes are an integral part of these financial statements.
12
ASIA FOCUS FUND for the period ended June 30, 2010
1. Performance
AVERAGE ANNUALIZED TOTAL RETURNS
| | | 6 Months
(Actual) | | 1 Year
(Actual) | | 3 Years | | 5 Years | | 10 Years | |
| Fund | | | -10.83 | % | | | 14.19 | % | | | -6.58 | % | | | 9.46 | % | | | 8.52 | % | |
| Benchmark Index: | |
| MSCI AC Far East Free Ex Japan | | | -4.53 | % | | | 20.97 | % | | | -2.13 | % | | | 10.74 | % | | | 4.23 | % | |
| S&P 500 | | | -6.64 | % | | | 14.43 | % | | | -9.79 | % | | | -0.79 | % | | | -1.59 | % | |
The Fund's gross expense ratio is 1.68% per the Summary Prospectus dated May 1, 2010. Guinness Atkinson Asset Management has contractually agreed to waive a portion of its advisory fees so that the Fund's ratio of expenses to average daily net assets will not exceed 1.98% (excluding Acquired Fund Fees and Expenses, interest, taxes, dividends on short positions and extraordinary expenses) through at least June 30, 2011. To the extent that the Advisor waives fees it may seek repayment of a portion or all of such amounts at any time within the three fiscal years after the fiscal year in which such amounts were waived, subject to the applicable cap.
Performance data quoted represents past performance and does not guarantee future results. The investment return and principal value of an investment will fluctuate so that an investor's shares, when redeemed, may be worth more or less than their original cost. Current performance of the Funds may be lower or higher than the performance quoted. Performance data current to the most recent month end may be obtained by visiting www.gafunds.com, or calling (800) 916-6566.
The Fund imposes a 2% redemption fee on shares held less than 30 days. Performance data quoted does not reflect the 2% redemption fee on shares held less than 30 days. Total Returns for prior periods reflect a fee waiver in effect and in the absence of this waiver, the total return would be lower
The first half of 2010 has been a mixed period for the Fund, with some weakness in the second quarter, clouding what had been a decent first quarter of the year. Investor concerns over financial weakness in the developed world have dominated otherwise attractive growth in Asia, with growth in national output in many countries remaining near long-term trend levels. At the corporate level, company earnings growth has been impressive, given the financial dislocation of recent quarters, and we remain confident that this attractive earnings growth can continue. However, analyst upgrades of corporate earnings have begun to slow, and some sectors already look fairly valued relative to their growth outlook. Some sectors with room for improvement include consumer and technology, but most may have passed their early-cycle peak of earnings upgrade activity.
For the Asia Focus Fund, we continue to look for stocks which are attractive relative to their earnings growth outlook. We are still able to find good opportunities relative to their growth outlook, but some of our holdings have underperformed on a relative basis over the last six months. Two areas of particular weakness for us have been our holdings in energy and materials companies, which are our largest overweights by sector. We remain positive on the long-term story of Chinese growth driving demand for imports of energy and metals, but there has been some slowdown of imports in the second quarter of 2010. This is partly due to the Chinese Government's attempts to cool down the property market using administrative controls, given construction is a major user of both energy and raw materials. It is also the result of some slowdown in demand as the infrastructure projects which began in 2009 moved out of their ramp-up phases, and fewer new projects were kicking-off. There was also a specific issue in the steel industry, where the Chinese Government withdrew tax rebates on exported steel. These rebates were supporting selling prices for Chinese steel; their removal means steel which was previously exported is now available for sale domestically.
Partly related to this weakness in our materials holdings was some weakness in shipping stocks in the portfolio. The earnings of some of these stocks are driven by the imports of raw materials into China, and as this has begun to slow at the margin, so these stocks have suffered. Export and container volumes have begun to recover, but still remain mixed.
Looking at the portfolio by country, the Fund's overweight positions in China and Hong Kong have been helpful to performance, although its overweight in Thailand has been a negative due to the political disruption there in the first half of 2010. However, underweight positions in both South Korea and Taiwan, which have recovered well from the disruption of 2009, have hurt relative performance. We remain overweight on our holdings in the Technology sector, and have added two new names to this sector in the first half of 2010.
13
ASIA FOCUS FUND
2. Portfolio Position
We continue to look for companies which can offer a good combination of earnings growth and attractive valuations, and which offer exposure to the Asian growth story for our investors. In our view, the development of China as a major power in global consumption, as well as production, remains central to our investment strategy. The portfolio's positioning reflects this, with overweight positions in Energy, Materials and Industrials, and by country, China and Hong Kong are almost half of the portfolio. Although there has been some underperformance in these holdings in the first half of 2010, we have not changed stance substantially. We continue to scrutinise each holding carefully based on its growth outlook. There could be some turnaround in these stocks if the Chinese Government ends or even reverses its tightening policies with regards to the property sector, as this has been a major headwind for the construction sector which uses much of these raw materials.
The portfolio is also well underweight in Financials and Real Estate. This has also hurt performance on a relative basis, as Financials was the only sub-sector in the Fund's benchmark to finish up for the first half of the year. We have looked to increase weight in the property sector, and have considered the Chinese banks for inclusion in the portfolio, as we believe they will benefit from the ongoing pick-up in consumer demand in China.
3. Outlook
Looking ahead for the rest of 2010, we remain confident on the outlook for Asian economic growth, and feel that Asia will be the only region in the world which achieves close to its long-run trend rate of growth this year. Investor sentiment towards Asia is mixed at present, but this is likely to change as investors realize that a sovereign default in the region is very unlikely this year or next, and that economic stress is likely to remain highest elsewhere.
In our view, the turning point for Asian equities could come from two sources. Firstly, the Chinese Government may well feel that their attempts to cool price increases in the property market have been successful, and that they are prepared to stop tightening the administrative controls on this sector. This would be supportive for investor sentiment, and would also be helpful to the construction sector, which is a major consumer of energy, steel and raw materials. This may well happen in the second half of 2010, and conversely a fall in property prices in China may be taken as a positive sign by investors. Secondly, there could be a sustained pick-up in exports to the developed world markets. There have been some limited signs of an improvement already, with some growth in container traffic to the US, and some improvement in demand for technology and consumer electronics products. However, the crucial driver this year is likely to be corpora te capital expenditure, particularly in the US. In our view, many developed world corporates seem to be well-capitalised, but have continued to keep capital expenditure low to conserve cash. These firms may see capital expenditure over the next 12 month as a way to keep their future earnings power up, and to avoid requests from any shareholders to return cash in the absence of better investment opportunities. Such a pick-up in corporate capital expenditure would be very supportive for firms in Asia making capital equipment such as machine tools and electronics.
Another reason we remain positive on Asia for good investment returns is that there have already been some moves towards loosening currency controls, and this may lead to some currency appreciation, relative to developed world currencies. Good currency returns has been a feature of Indonesia and South Korea so far this year, but China and Singapore have both begun to loosen capital controls in recent months. If the decent economic growth in Asia continues, it is likely that some nations will raise interest rates to prevent inflation. This is likely to attract more capital to the region, and could be supportive of further currency appreciation relative to developed world currencies.

Edmund Harriss
The Fund invests in foreign securities which will involve political, economic and currency risks, greater volatility, and differences in accounting methods. The Fund is non-diversified meaning its assets may be concentrated in fewer individual holdings than diversified funds. Therefore, the Fund is more exposed to individual stock volatility than diversified funds. The Fund invests in smaller companies, which will involve additional risks such as limited liquidity and greater volatility.
The MSCI All Country Far East Free ex-Japan Index (MSCI AC Far East Free ex-Japan Index) is a free float-adjusted, capitalization-weighted index that is designed to measure equity market performance in the Asia region excluding Japan. The
14
Standard & Poor's 500 Index is a market-capitalization weighted index composed of 500 widely held common stocks of U.S. companies. These indices are unmanaged, not available for investment and do not incur expenses.
Please refer to the Schedule of Investments for details on fund holdings. Current and future portfolio holdings are subject to risk.
The information provided herein represents the opinion of Guinness Atkinson Management for the period stated and is not intended to be a forecast of future events, a guarantee of future results, nor investment advice. Opinions, fund holdings and sector allocations are subject to change at any time are not recommendations to buy or sell any security.
15
FUND HIGHLIGHTS at June 30, 2010
GUINNESS ATKINSON ASIA FOCUS FUND
| # of Holdings in Portfolio: | | | 46 | | |
| Portfolio Turnover: | | | 11.7 | % | |
| % of Stocks in Top 10: | | | 34.2 | % | |
| Fund Managers: | |
| Edmund Harriss | | | | | |
| James Weir | | | | | |
| Top 10 Holdings (% of net assets) | | | | Country Breakdown (% of net assets) | |
| Hyundai Mobis | | | 4.0 | % | | China | | | 27.7 | % | |
| Dongfang Electric Corp., Ltd. - H Shares | | | 3.8 | % | | Hong Kong | | | 19.7 | % | |
| HTC Corp. | | | 3.8 | % | | Taiwan | | | 16.4 | % | |
| Samsung Electronics Co., Ltd. | | | 3.5 | % | | South Korea | | | 10.6 | % | |
| PetroChina Co., Ltd. - H Shares | | | 3.5 | % | | Thailand | | | 9.5 | % | |
| Indo Tambangraya Megah PT | | | 3.3 | % | | Indonesia | | | 7.8 | % | |
| Taiwan Semiconductor Manufacturing Co., Ltd. | | | 3.3 | % | | Singapore | | | 5.6 | % | |
| POSCO | | | 3.2 | % | | Malaysia | | | 2.5 | % | |
| Indofood Agri Resources Ltd* | | | 3.0 | % | | | | | | | |
| Kunlun Energy Co., Ltd. | | | 2.8 | % | | | | | | | |
| Sector Breakdown (% of Investments) | | | |
| Coal | | | 10.6 | % | | Metal-Copper | | | 2.6 | % | |
| Oil Company - Exploration & Production | | | 7.6 | % | | Commercial Banks | | | 2.5 | % | |
| Steel-Producers | | | 7.3 | % | | ETFs | | | 2.4 | % | |
| Auto/Truck Parts & Equipment | | | 6.7 | % | | Computers-Peripheral Equipment | | | 2.4 | % | |
| Computers | | | 6.2 | % | | Auto-Cars/Light Trucks | | | 2.4 | % | |
| Semiconductor Components - Integrated Circuit | | | 5.7 | % | | Cellular Telecom | | | 2.3 | % | |
| Oil Company - Integrated | | | 5.6 | % | | Non-Ferrous Metals | | | 1.8 | % | |
| Transportation-Marine | | | 5.4 | % | | Retail-Apparel/Shoe | | | 1.6 | % | |
| Telecom Services | | | 5.2 | % | | Public Thoroughfares | | | 1.6 | % | |
| Power Conversion/Supply Equipment | | | 3.8 | % | | Web Portals/ISP | | | 1.4 | % | |
| Electronic Components-Semiconductor | | | 3.5 | % | | Agricultural Biotech | | | 1.1 | % | |
| Electric-Generation | | | 3.2 | % | | Internet Content-Entertainment | | | 1.0 | % | |
| Agricultural Operations | | | 3.0 | % | | Machinery-General Industry | | | 0.5 | % | |
| Chemicals-Other | | | 2.6 | % | | | | | | | |
16
SCHEDULE OF INVESTMENTS
at June 30, 2010 (Unaudited)
GUINNESS ATKINSON ASIA FOCUS FUND
| Shares | | COMMON STOCKS: 99.7% | | Value | |
| China: 27.7% | | | |
| | 816,000 | | | Angang Steel Co., Ltd. - H Shares | | $ | 969,466 | | |
| | 279,000 | | | China Shenhua Energy Co., Ltd. - H Shares | | | 1,011,885 | | |
| | 774,000 | | | China Shipping Development Co., Ltd. - H Shares | | | 974,415 | | |
| | 582,000 | | | Dongfang Electric Corp., Ltd. - H Shares | | | 1,797,804 | | |
| | 794,000 | | | iShares FTSE/Xinhua A50 CHINA Index ETF | | | 1,161,318 | | |
| | 670,000 | | | Jiangxi Copper Co., Ltd. - H Shares | | | 1,248,055 | | |
| | 22,250 | | | Perfect World Co., Ltd. - ADR* | | | 489,723 | | |
| | 1,490,000 | | | PetroChina Co., Ltd. - H Shares | | | 1,644,700 | | |
| | 1,714,000 | | | Shenzhen Expressway Co., Ltd. - H Shares | | | 755,329 | | |
| | 16,650 | | | Sohu.com, Inc.* | | | 684,149 | | |
| | 198,000 | | | Weichai Power Co., Ltd. - H Shares | | | 1,272,370 | | |
| | 616,800 | | | Yanzhou Coal Mining Co., Ltd. - H Shares | | | 1,186,364 | | |
| | | | 13,195,577 | | |
| Hong Kong: 19.6% | | | |
| | 618,000 | | | Chen Hsong Holdings† | | | 235,905 | | |
| | 110,500 | | | China Mobile Ltd. | | | 1,101,297 | | |
| | 715,000 | | | CNOOC Ltd. | | | 1,218,872 | | |
| | 2,478,000 | | | Denway Motors Ltd. | | | 1,162,944 | | |
| | 140,970 | | | Esprit Holdings Ltd. | | | 760,225 | | |
| | 3,306,000 | | | Global Bio-Chem Technology Group Co., Ltd. | | | 454,145 | | |
| | 129,266 | | | HSBC Holdings PLC | | | 1,184,194 | | |
| | 286,000 | | | Kingboard Chemical Holdings Ltd. | | | 1,224,238 | | |
| | 1,048,000 | | | Kunlun Energy Co., Ltd. | | | 1,322,309 | | |
| | 1,099,000 | | | Pacific Basin Shipping Ltd | | | 681,006 | | |
| | | | 9,345,137 | | |
| Indonesia: 7.8% | | | |
| | 384,000 | | | Indo Tambangraya Megah PT | | | 1,562,503 | | |
| | 2,111,000 | | | International Nickel Indonesia Tbk PT | | | 858,893 | | |
| | 1,522,000 | | | Telekomunikasi Indonesia Tbk PT | | | 1,282,998 | | |
| | | | 3,704,393 | | |
| Malaysia: 2.5% | | | |
| | 166,700 | | | DiGi.Com Bhd | | | 1,179,779 | | |
| Singapore: 5.6% | | | |
| | 956,000 | | | Indofood Agri Resources Ltd* | | | 1,428,114 | | |
| | 901,000 | | | Straits Asia Resources Ltd | | | 1,271,946 | | |
| | | | 2,700,060 | | |
The accompanying notes are an integral part of these financial statements.
17
| Shares | | COMMON STOCKS: 99.7% (Continued) | | Value | |
| South Korea: 10.6% | | | |
| | 11,255 | | | Hyundai Mobis | | $ | 1,884,949 | | |
| | 3,970 | | | POSCO | | | 1,506,769 | | |
| | 2,635 | | | Samsung Electronics Co., Ltd. | | | 1,654,484 | | |
| | | | 5,046,202 | | |
| Taiwan: 16.4% | | | |
| | 1,091,550 | | | China Steel Corp. | | | 1,005,042 | | |
| | 204,000 | | | Himax Technologies, Inc. - ADR | | | 593,640 | | |
| | 134,750 | | | HTC Corp. | | | 1,787,752 | | |
| | 1,029,000 | | | Lite-On Technology Corp. | | | 1,125,585 | | |
| | 220,000 | | | Novatek Microelectronics Corp. Ltd | | | 590,383 | | |
| | 2 | | | Shin Zu Shing Co., Ltd. | | | 6 | | |
| | 830,000 | | | Taiwan Semiconductor Manufacturing Co., Ltd. | | | 1,552,018 | | |
| | 782,844 | | | Wistron Corp. | | | 1,148,820 | | |
| | | | 7,803,245 | | |
| Thailand: 9.5% | | | |
| | 234,500 | | | Electricity Generating PCL/Foreign | | | 591,697 | | |
| | 814,000 | | | Glow Energy PCL/Foreign | | | 930,027 | | |
| | 239,000 | | | PTT Exploration & Production PCL/Foreign | | | 1,049,061 | | |
| | 130,700 | | | PTT PCL/Foreign | | | 983,969 | | |
| | 1,347,100 | | | Thoresen Thai Agencies PCL/Foreign | | | 958,180 | | |
| | | | 4,512,934 | | |
| | | | | Total Common Stocks
(cost $43,380,468) | | | 47,487,328 | | |
| | RIGHTS AND WARRANTS: 0.1% | | | |
| Hong Kong: 0.1% | | | |
| | 1,322,400 | | | Global Bio-Chem Technology Group Co., Ltd., rights* | | | 52,645 | | |
| | 28,600 | | | Kingboard Chemical Holdings Ltd., warrants 40HKD, Exp.10/31/12* | | | 11,276 | | |
| | | | 63,921 | | |
| | | | | Total Rights and Warrants
(cost $0) | | | 63,921 | | |
| | | | | Total Investments in Securities
(cost $43,380,468) | | | 47,551,249 | | |
| | | | | Other Assets Less Liabilities: 0.2% | | | 120,269 | | |
| | | | | Net Assets: 100.0% | | $ | 47,671,518 | | |
* Non-income producing security.
† Illiquid. Illiquid securities represent 0.5% of net assets.
ADR - American Depository Receipt
HKD - Hong Kong Dollar
The accompanying notes are an integral part of these financial statements.
18
ASIA PACIFIC DIVIDEND FUND for the period ended June 30, 2010
1. Performance
ANNUALIZED TOTAL RETURNS
| | | 6 Months
(Actual) | | 1 Year
(Actual) | | 3 Years | | Since
Inception
March 31, 2006 | |
| Fund | | | -5.81 | % | | | 15.61 | % | | | -7.46 | % | | | 1.07 | % | |
| Benchmark Index: | |
| MSCI AC Pacific Ex Japan | | | -6.87 | % | | | 21.58 | % | | | -2.95 | % | | | 3.44 | % | |
| S&P 500 | | | -6.64 | % | | | 14.43 | % | | | -9.79 | % | | | -3.17 | % | |
The Fund's gross expense ratio is 2.93% per the Summary Prospectus dated May 1, 2010. Guinness Atkinson Asset Management has contractually agreed to waive a portion of its advisory fees so that the Fund's ratio of expenses to average daily net assets will not exceed 1.98% (excluding Acquired Fund Fees and Expenses, interest, taxes, dividends on short positions and extraordinary expenses) through at least June 30, 2011. To the extent that the Advisor waives fees it may seek repayment of a portion or all of such amounts at any time within the three fiscal years after the fiscal year in which such amounts were waived, subject to the applicable cap.
Performance data quoted represents past performance and does not guarantee future results. The investment return and principal value of an investment will fluctuate so that an investor's shares, when redeemed, may be worth more or less than their original cost. Current performance of the Funds may be lower or higher than the performance quoted. Performance data current to the most recent month end may be obtained by visiting www.gafunds.com, or calling (800) 916-6566.
The Fund imposes a 2% redemption fee on shares held less than 30 days. Performance data quoted does not reflect the 2% redemption fee on shares held less than 30 days. Total Returns reflect a fee waiver in effect and in the absence of this waiver, the total returns would be lower.
The first half of 2010 was characterised by the slowing of the bounce in equities which began in the second quarter of 2009, and the return of investor concerns about financial dislocation. The review period began with optimism about corporate earnings from firms and market participants, which was reflected in decent earnings results for Asian firms in the first quarter. However, in the second quarter macroeconomic concerns have dominated the improvements at the company level, and this has led to some market weakness in Asia.
There are limited signs of positive economic recovery in the developed world, whilst in Asia, growth has continued to be relatively firm in the first half of 2010. This is mostly as a result of good underlying fundamentals, but the fiscal stimulus measures from 2009, and loose monetary policy also has helped. Consumer spending and retail sales growth have been robust in many Asian nations, with China and South Korea particularly strong. There have also been a number of initial public offerings in Asian in the first half of 2010, as companies now felt confident that there was investor demand for fresh equity. However, there was a change in policy direction from the Chinese authorities after Chinese New Year, and this hurt sentiment towards Asia as a whole, and reversed the gains in the Fund from the first quarter. This centred on administrative measures to slow gains in property prices in the major cities in China, and on discouraging both la nd and property speculation. Although there are superficial parallels with the US property market, these do not stand up to scrutiny, and the levels of indebtedness in the Chinese property market are much lower than the U.S.
Although Asian countries have continued to experience reasonable economic growth, and have not seen ongoing volatility in their banking systems, there have been ongoing problems in the developed world, in particular in the European Union. Financial markets remain concerned about the prospects for a sovereign debt default, where a country is unable (or unwilling) to meet its national financial obligations. Some of the same problems experienced by the USA in recent years, particularly excessive borrowing in the property market, are present in other nations, and investors are concerned that further bank restructuring and debt-reduction may be needed. In the review period, both Greece and Hungary have come under investor scrutiny, as possible candidates for a sovereign default, and this has negatively affected investor confidence in more risky assets, with emerging market equities suffering as a consequence.
19
ASIA PACIFIC DIVIDEND FUND
There has also been some country-specific weakness in Asia as a result of political instability. There has been ongoing tension in Thailand as a result of popular discontent with the current government, whilst in Australia the Prime Minister was removed, partly as a result of his support of a proposed tax on natural resources firms which was unpopular with the business community.
2. Portfolio Position
The Portfolio remains focused on finding stocks which offer decent, consistent dividends, and are also able to achieve an attractive level of earnings growth. In our view, it is possible to meet both objectives in a set of emerging markets such as Asia, against a background of good growth in national output, relative to developed countries.
By sector, the Fund remains overweight in Telecommunications and Consumer names, and underweight in Financials and Real Estate. Over the review period, we have added to our position in Technology stocks, and this is now our biggest relative overweight. The driver for this change has been an attractive combination of growth and dividend yield in Taiwanese technology stocks, and we have added one new holding, Himax Technologies. In terms of Financials, we remain positive on Hong Kong banks, which offer decent growth and attractive dividend yields, and we have some exposure to these stocks. We are not sufficiently attracted by the dividends available from the Financials stocks in other Asian countries, and so are underweight the sector as a whole.
By country, the Fund is most overweight in Taiwan and Thailand, and these are the highest dividend-yielding markets in Asia. The Fund remains well overweight on China and Hong Kong, and its biggest underweight is Australia.
3. Outlook
We remain positive on the outlook for Asian equities for the remainder of 2010, and in our view Asia remains an attractive region for dividend-focused investors.
China remains the driver of Asian economic growth, and the data from the first half of the year suggests continuing momentum in consumer spending, which is good for growth in the broader Asian economy. The consumer goods subsidies on electronics, white goods and cars which the Government put in place to support growth in 2009 have been extended and widened in scope. Many will remain in place until 2011, and this should support the establishment of a genuine consumer economy in China. This is supportive of growth in China's regional trading partners, as they supply the energy, natural resources and manufactured goods consumed by China's growing economy.
We can also see some recovery in demand from the developed world, although this is still limited and fragile. Considering our holdings in the electronics industry, there has been decent growth in mobile phone handsets, next-generation flat-panel televisions and notebook computers. Crucially, it seems that inventory levels, both at developed world clients, and at Asian suppliers, remain well under control.
For dividend-focused investors, we would highlight that monetary policy in Asia remains relatively loose still, with interest rates below the level of inflation in some countries. This suggests to us that interest rates may have to rise in the coming year, assuming that Asian economic growth remains reasonable. The possible consequence of this is that some Asian currencies may strengthen relative to the US Dollar, supporting dividend returns from these countries. Already both China and Singapore have signalled that they are likely to allow their currencies to float more freely against major international currencies, and this may lead to some limited currency appreciation. There are also some regulatory changes underway which will help banks and businesses to exchange Renminbi for international currencies, and we also see this as a positive trend.
In our view, the turning point for Asian equities is likely to come once the Chinese Government ends its current policy of administrative tightening in the domestic property market. These policies have raised concerns with some investors, anxious to avoid a repeat of the issues in the US housing market. However, the situation is radically different, given China's urban population continues to grow, and that there is a much lower level of borrowing in the Chinese housing market. The Chinese Government may reverse course once it is clear that the measures are working – that is, when house prices clearly begin to fall in the major cities. This could happen in the second half of 2010. For the rest of Asia, a sustained recovery, in exports, possibly driven by growth in corporate capital expenditure in the developed world, should be supportive to equities.

Edmund Harriss
20
The Fund invests in foreign securities which will involve political, economic and currency risks, greater volatility, and differences in accounting methods. The Fund is non-diversified meaning its assets may be concentrated in fewer individual holdings than diversified funds. Therefore, the Fund is more exposed to individual stock volatility than diversified funds. The Fund invests in smaller companies, which will involve additional risks such as limited liquidity and greater volatility.
The MSCI All Country Pacific ex-Japan Index is a free float-adjusted, capitalization-weighted index that is designed to measure equity market performance in the Pacific region excluding Japan. The Standard & Poor's 500 Index is a market-capitalization weighted index composed of 500 widely held common stocks of U.S. companies. These indices are unmanaged, not available for investment and do not incur expenses.
Please refer to the Schedule of Investments for details on fund holdings. Current and future portfolio holdings are subject to risk.
The information provided herein represents the opinion of Guinness Atkinson Management for the period stated and is not intended to be a forecast of future events, a guarantee of future results, nor investment advice. Opinions, fund holdings and sector allocations are subject to change at any time are not recommendations to buy or sell any security.
21
FUND HIGHLIGHTS at June 30, 2010
GUINNESS ATKINSON ASIA PACIFIC DIVIDEND FUND
| # of Holdings in Portfolio: | | | 34 | | |
| Portfolio Turnover: | | | 14.0 | % | |
| % of Stocks in Top 10: | | | 35.3 | % | |
| Fund Managers: | |
| Edmund Harriss | | | | | |
| James Weir | | | | | |
| Top 10 Holdings (% of net assets) | | | | Country Breakdown (% of net assets) | |
| Industrial & Commercial Bank of China Asia Ltd. | | | 4.0 | % | | Taiwan | | | 25.1 | % | |
| VTech Holdings Ltd. | | | 3.7 | % | | Hong Kong | | | 24.1 | % | |
| Telekomunikasi Indonesia Tbk PT | | | 3.6 | % | | Thailand | | | 15.4 | % | |
| St Shine Optical Co., Ltd. | | | 3.6 | % | | China | | | 12.3 | % | |
| BOC Hong Kong Holdings Ltd. | | | 3.6 | % | | South Korea | | | 8.6 | % | |
| Thai Plastic & Chemical PCL/Foreign | | | 3.4 | % | | Indonesia | | | 3.6 | % | |
| PTT PCL/Foreign | | | 3.4 | % | | Malaysia | | | 3.3 | % | |
| POSCO | | | 3.4 | % | | Philippines | | | 3.1 | % | |
| China Steel Corp. | | | 3.3 | % | | Singapore | | | 3.0 | % | |
| HTC Corp. | | | 3.3 | % | | Australia | | | 3.0 | % | |
| Sector Breakdown (% of Investments) | | | |
| Commercial Banks | | | 13.6 | % | | Tobacco | | | 3.2 | % | |
| Telecommunication Services | | | 9.9 | % | | Electric - Integrated | | | 3.2 | % | |
| Steel - Producers | | | 8.9 | % | | Electric - Generation | | | 3.1 | % | |
| Transportation - Marine | | | 7.7 | % | | Agricultural Chemicals | | | 3.0 | % | |
| Oil Company - Integrated | | | 6.5 | % | | Auto/Truck Parts & Equipment - Replacements | | | 3.0 | % | |
| Computers | | | 6.4 | % | | Retail - Apparel | | | 3.0 | % | |
| Semiconductor Components - Integrated Circuits | | | 5.2 | % | | Coal | | | 2.7 | % | |
| Telecommunication Equipment | | | 3.6 | % | | Petrochemicals | | | 2.3 | % | |
| Oil - Field Services | | | 3.6 | % | | Diversified Financial Services | | | 2.0 | % | |
| Chemicals - Plastics | | | 3.4 | % | | Food - Meat Products | | | 2.0 | % | |
| Computers - Peripheral Equipment | | | 3.2 | % | | Retail - Beauty Salons | | | 0.5 | % | |
22
SCHEDULE OF INVESTMENTS
at June 30, 2010 (Unaudited)
GUINNESS ATKINSON ASIA PACIFIC DIVIDEND FUND
| Shares | | COMMON STOCKS: 101.5% | | Value | |
| Australia: 3.0% | | | |
| | 73,351 | | | Incitec Pivot Ltd. | | $ | 166,310 | | |
| China: 12.3% | | | |
| | 107,801 | | | Angang Steel Co., Ltd. - H Shares | | | 128,075 | | |
| | 90,000 | | | China Shipping Development Co., Ltd. - H Shares | | | 113,304 | | |
| | 265,000 | | | People's Food Holdings Ltd. | | | 111,069 | | |
| | 1,560 | | | PetroChina Co., Ltd. - ADR | | | 171,179 | | |
| | 80,000 | | | Yanzhou Coal Mining Co., Ltd. - H Shares | | | 153,873 | | |
| | | | 677,500 | | |
| Hong Kong: 24.1% | | | |
| | 86,500 | | | BOC Hong Kong Holdings Ltd. | | | 196,620 | | |
| | 25,000 | | | CLP Holdings Ltd. | | | 181,007 | | |
| | 30,988 | | | Esprit Holdings Ltd. | | | 167,113 | | |
| | 3,924 | | | HSBC Holdings PLC - ADR | | | 178,895 | | |
| | 83,000 | | | Industrial & Commercial Bank of China Asia Ltd. | | | 219,279 | | |
| | 415,000 | | | Modern Beauty Salon Holdings Ltd. | | | 31,290 | | |
| | 251,300 | | | Pacific Basin Shipping Ltd. | | | 155,720 | | |
| | 19,000 | | | VTech Holdings Ltd. | | | 202,517 | | |
| | | | 1,332,440 | | |
| Indonesia: 3.6% | | | |
| | 236,500 | | | Telekomunikasi Indonesia Tbk PT | | | 199,362 | | |
| Malaysia: 3.3% | | | |
| | 25,600 | | | DiGi.Com Bhd | | | 181,178 | | |
| Philippines: 3.1% | | | |
| | 9,030 | | | Globe Telecom, Inc. | | | 171,778 | | |
| Singapore: 3.0% | | | |
| | 12,000 | | | United Overseas Bank Ltd. | | | 166,706 | | |
| South Korea: 8.6% | | | |
| | 2,900 | | | KB Financial Group, Inc. | | | 110,699 | | |
| | 3,620 | | | KT&G Corp. | | | 177,994 | | |
| | 490 | | | POSCO | | | 185,974 | | |
| | | | 474,667 | | |
| Taiwan: 25.1% | | | |
| | 199,788 | | | China Steel Corp. | | | 183,954 | | |
| | 152,388 | | | Compal Electronics, Inc. | | | 181,681 | | |
| | 73,400 | | | Depo Auto Parts Ind Co., Ltd. | | | 170,597 | | |
| | 38,200 | | | Himax Technologies, Inc. - ADR | | | 111,162 | | |
| | 13,700 | | | HTC Corp. | | | 181,760 | | |
| | 163,000 | | | Lite-On Technology Corp. | | | 178,300 | | |
| | 25,000 | | | St Shine Optical Co., Ltd. | | | 199,266 | | |
| | 95,000 | | | Taiwan Semiconductor Manufacturing Co., Ltd. | | | 177,641 | | |
| | | | 1,384,361 | | |
The accompanying notes are an integral part of these financial statements.
23
| Shares | | COMMON STOCKS: 101.5% (Continued) | | Value | |
| Thailand: 15.4% | | | |
| | 153,500 | | | Glow Energy PCL/Foreign | | $ | 175,380 | | |
| | 40,900 | | | PTT Chemical PCL/Foreign | | | 130,862 | | |
| | 25,100 | | | PTT PCL/Foreign | | | 188,964 | | |
| | 351,500 | | | Thai Plastic & Chemical PCL/Foreign | | | 190,193 | | |
| | 231,840 | | | Thoresen Thai Agencies PCL/Foreign | | | 164,906 | | |
| | | | 850,304 | | |
| | | | | Total Common Stock
(cost $6,072,369) | | | 5,604,607 | | |
| | | | | Total Investments in Securities
(cost $6,072,369) | | | 5,604,607 | | |
| | | | | Liabilities in Excess of Other Assets: (1.5%) | | | (81,344 | ) | |
| | | | | Net Assets: 100% | | $ | 5,523,263 | | |
ADR - American Depository Receipt
The accompanying notes are an integral part of these financial statements.
24
CHINA & HONG KONG FUND for the period ended June 30, 2010
1. Performance
AVERAGE ANNUALIZED TOTAL RETURNS
| | | 6 Monnths
(Actual) | | 1 Year
(Actual) | | 3 Years | | 5 Years | | 10 Years | |
| Fund | | | -9.22 | % | | | 25.09 | % | | | 1.08 | % | | | 13.35 | % | | | 8.68 | % | |
| Benchmark Index: | |
| Hang Seng Composite | | | -6.25 | % | | | 10.89 | % | | | 0.01 | % | | | 12.40 | % | | | 4.28 | % | |
| Hang Seng | | | -6.45 | % | | | 12.34 | % | | | 0.71 | % | | | 10.74 | % | | | 5.68 | % | |
| S&P 500 | | | -6.64 | % | | | 14.43 | % | | | -9.79 | % | | | -0.79 | % | | | -1.59 | % | |
The Fund's gross expense ratio is 1.58% per the Summary Prospectus dated May 1, 2010. Guinness Atkinson Asset Management has contractually agreed to waive a portion of its advisory fees so that the Fund's ratio of expenses to average daily net assets will not exceed 1.98% (excluding Acquired Fund Fees and Expenses, interest, taxes, dividends on short positions and extraordinary expenses) through at least June 30, 2011. To the extent that the Advisor waives fees it may seek repayment of a portion or all of such amounts at any time within the three fiscal years after the fiscal year in which such amounts were waived, subject to the applicable cap.
Performance data quoted represents past performance and does not guarantee future results. The investment return and principal value of an investment will fluctuate so that an investor's shares, when redeemed, may be worth more or less than their original cost. Current performance of the Funds may be lower or higher than the performance quoted. Performance data current to the most recent month end may be obtained by visiting www.gafunds.com, or calling (800) 916-6566.
The Fund imposes a 2% redemption fee on shares held less than 30 days. Performance data quoted does not reflect the 2% redemption fee on shares held less than 30 days. Total Returns for prior periods reflect a fee waiver in effect and in the absence of this waiver, the total return would be lower
China began the year well, on the back of the stimulus packages put into action in 2009. These included direct infrastructure spending and a loosening of monetary policy, and these conditions persisted into early 2010. As a consequence of these stimulative policies, loan growth and property prices were both strong in China in the first two months of the year. As a result, by the time of Chinese New Year in February, the Government had changed direction and began to tighten up on its economic stimulation. The aim was to cut down on damaging speculation, particularly in the property market, and to make a pre-emptive assault on inflation. The pick-up in property prices was focused in the largest cities, such as Beijing, Shanghai, Guangzhou and Shenzhen, and was most noticeable in the high-end, luxury developments.
There were also some signs of inflationary pressure elsewhere in the economy, notably in wages and raw materials prices. In the first half of 2010, there was some industrial action, most prominently in the automotive industry, when workers at a Japanese-owned car plant walked-out in search of higher wages. Industrial action of this kind is rare, and the fact that it was allowed to happen is perhaps an indication that the Government understood that wages needed to rise. The dispute was ultimately settled by management agreeing to offer higher wages. There was also some pressure on increasing raw materials, as steel prices increased, partly due to a pick-up in the prices of imported iron ore and coking coal.
Against this background, the Chinese authorities continued to tighten up on their policies of economic stimulation, and this has driven down the equity markets, and hurt returns to our holdings in the first half of the year. However, considering the economic data of recent months on overall economic growth, car sales and retail sales, the underlying pattern of economic activity in China remains firm. Despite the Government's attempts to cool the property market, and against a background of weak growth elsewhere in the world, China should still be able to achieve close to its long-run growth rate this year.
The Chinese Government has also made a number of confidence-boosting moves in the review period which are significant: First, it has loosened the peg of the Renminbi to the US Dollar, with the Chinese currency now priced against a basket of international currencies. Although this may not have an immediate impact on exports to the US, it should begin the process of pricing the currency closer to its fundamentals, and reduce dependence on exports. Secondly, the Government has removed export tax rebates
25
CHINA & HONG KONG FUND
on steel produced in China. This should help to control steel prices within China, given production which was previously going overseas is likely to be supplied into the domestic economy.
2. Portfolio Position
The portfolio is focused on stocks which offer an attractive blend of growth and value. Our overall philosophy for current positioning is that we prefer stocks which will benefit from China's shift to a consumption-, rather than an investment-led economy. The best way to balance these aims of attractive valuations and fitting with our macro view has been to focus on the raw materials and energy sectors. Growth in raw materials underpins growth in both the consumption and investment parts of the economy, and prices for many of these raw materials have been increasing in recent quarters. We have also been positive on electronics, automotive and consumer goods, particularly in the light of the subsidies on these products implemented by the Chinese authorities in 2009. In many cases these subsidies have been extended until 2011, so this story continues to be attractive.
3. Outlook
Looking ahead, the tightening policies currently in place to help control the property market are likely to be gradually relaxed by the Chinese authorities, and there is evidence that they have already had a significant impact on both property prices and volumes. Conversely, although some commentators are concerned about falls in property prices in China, we see this as a good sign, as it demonstrates that the policies put in place by the Government are having the desired effect. Given they are aimed at influencing the high-end of the property market, and that affordability in the broader property market remains good, this should not have a large impact on overall economic growth. Once the Chinese Government is convinced that the impact is sufficient, and that there is a reduced risk of an asset price bubble, it is likely to begin to reverse direction on tightening, and we think this will be positive for equities. Given the structure of the financial industry in China, domestic investors have limited options for their capital, and we feel that once the pressure is off property, some investors will choose to look again at equities, which have not performed well on a relative basis this year.
For international investors, there has been a fear of investing in risky assets this year, given the background of sovereign weakness in nations such as Greece and Hungary. Whilst a Government defaulting on its debt would be a negative for financial markets, in our view this is very unlikely to happen in Asia. Indeed, for some international investors, Asia looks like the most attractive region globally, given reasonable economic growth, well-capitalised banks, and low levels of Government borrowing.
The change in pricing of the Chinese currency, the Renminbi, against international currencies may also be a positive for attracting outside investment to China. Although the currency has now de-pegged against the US Dollar, there is no guarantee that it will appreciate in the near term. In fact, given it now trades against a range of currencies, it may well appreciate against other international currencies, such as the Euro or Japanese Yen, but not against the US Dollar. One potential positive for this portfolio is that the financial authorities are now setting up the infrastructure needed to trade the Renminbi against a range of international currencies in the future. It seems that the centre for this activity for international investors will be Hong Kong, which is a tremendous vote of confidence in the island as a financial and economic centre. Given our positioning of investing in Hong Kong as a window to China, this may well be of benefi t to some of our holdings.
Overall, we remain positive that China is continuing to shift to a more consumption-led economy. We think that the controls on the property market should not have too much impact on wider economic growth. We think that the Chinese economy can grow near its long-run trend in the remainder of 2010, and are confident that the Fund is well positioned to benefit from this.

Edmund Harriss
The Fund invests in foreign securities which will involve political, economic and currency risks, greater volatility, and differences in accounting methods. The Fund is non-diversified meaning its assets may be concentrated in fewer individual holdings than diversified funds. Therefore, the Fund is more exposed to individual stock volatility than diversified funds. The Fund invests in smaller companies, which will involve additional risks such as limited liquidity and greater volatility.
26
The Hang Seng Composite Index is a market-capitalization weighted index that comprises the top 200 companies listed on the Hong Kong Stock Exchange, based on the average market-capitalization for the past twelve months. The Hang Seng Composite Index commenced on January 3, 2000 and therefore does not have returns since the Fund's inception. The Hang Seng Index is a barometer of the Hong Kong Stock Market whose aggregate market capitalization accounts for about 70% of the total market-capitalization of the Stock Exchange of Hong Kong Limited. The Standard & Poor's 500 Index is a market-capitalization weighted index composed of 500 widely held common stocks of U.S. companies. These indices are unmanaged, not available for investment and do not incur expenses.
Please refer to the Schedule of Investments for details on fund holdings. Current and future portfolio holdings are subject to risk.
The information provided herein represents the opinion of Guinness Atkinson Management for the period stated and is not intended to be a forecast of future events, a guarantee of future results, nor investment advice. Opinions, fund holdings and sector allocations are subject to change at any time are not recommendations to buy or sell any security.
27
FUND HIGHLIGHTS at June 30, 2010
GUINNESS ATKINSON CHINA & HONG KONG FUND
| # of Holdings in Portfolio: | | | 45 | | |
| Portfolio Turnover: | | | 4.3 | % | |
| % of Stocks in Top 10: | | | 36.7 | % | |
| Fund Managers: | |
| Edmund Harriss | |
| James Weir | |
| Top 10 Holdings (% of net assets) | | | | Country Breakdown (% of net assets) | |
| Weichai Power Co., Ltd. - H Shares | | | 4.3 | % | | China | | | 53.4 | % | |
| Dongfang Electric Corp., Ltd. - H Shares | | | 4.1 | % | | Hong Kong | | | 46.2 | % | |
| BYD Co., Ltd. - H Shares | | | 3.7 | % | | | | | |
| CNOOC Ltd. | | | 3.6 | % | | | | | |
| PetroChina Co., Ltd. - H Shares | | | 3.6 | % | | | | | |
| Beijing Enterprises Holdings Ltd. | | | 3.6 | % | | | | | |
| VTech Holdings Ltd. | | | 3.5 | % | | | | | |
| China Mobile Ltd. | | | 3.5 | % | | | | | |
| Soho China Ltd. | | | 3.4 | % | | | | | |
| Yanzhou Coal Mining Co., Ltd. - H Shares | | | 3.4 | % | | | | | |
| Sector Breakdown (% of Investments) | | | |
| Commercial Banks | | | 13.1 | % | | Real Estate Management/Service | | | 3.0 | % | |
| Oil & Gas-Exploration & Production | | | 7.1 | % | | Internet Application Software | | | 2.8 | % | |
| Coal | | | 5.1 | % | | Chemicals - Other | | | 2.7 | % | |
| Auto-Cars/Light Trucks | | | 4.4 | % | | Airlines | | | 2.5 | % | |
| Auto/Truck Parts & Equipment - Replacements | | | 4.3 | % | | Computers | | | 2.5 | % | |
| Power Conversion/Supply Equipment | | | 4.2 | % | | Metal - Copper | | | 2.4 | % | |
| Transportation - Marine | | | 3.8 | % | | Distribution/Wholesale | | | 2.2 | % | |
| Batteries - Battery System | | | 3.7 | % | | Agricultural Operations | | | 1.7 | % | |
| Oil - Integrated | | | 3.6 | % | | Steel - Producers | | | 1.7 | % | |
| Gas - Distribution | | | 3.6 | % | | Internet Content - Entertainment | | | 1.4 | % | |
| Telecommunication Equipment | | | 3.6 | % | | Retail - Apparel | | | 1.3 | % | |
| Cellular Telecommunications | | | 3.5 | % | | Public Thoroughfares | | | 1.2 | % | |
| Real Estate | | | 3.5 | % | | Agricultural Biotech | | | 0.7 | % | |
| Energy - Alternate Sources | | | 3.4 | % | | Machinery - General Industry | | | 0.7 | % | |
| Web Portals/ISP | | | 3.1 | % | | Retail - Beauty Salons | | | 0.0 | %# | |
| ETFs | | | 3.1 | % | | | | | | | |
# Less than 0.1% of net assets.
28
SCHEDULE OF INVESTMENTS
at June 30, 2010 (Unaudited)
GUINNESS ATKINSON CHINA & HONG KONG FUND
| Shares | | COMMON STOCKS: 99.5% | | Value | |
| Agricultural Biotech: 0.6% | | | |
| | 8,762,000 | | | Global Bio-Chem Technology Group Co., Ltd. | | $ | 1,203,635 | | |
| Agricultural Operations: 1.7% | | | |
| | 3,496,272 | | | Chaoda Modern Agriculture Holdings Ltd. | | | 3,416,594 | | |
| Airlines: 2.5% | | | |
| | 2,556,000 | | | Cathay Pacific Airways Ltd. | | | 5,011,179 | | |
| Auto/Truck Parts & Equipment: 4.3% | | | |
| | 1,318,800 | | | Weichai Power Co., Ltd. - H Shares | | | 8,474,753 | | |
| Auto-Cars/Light Trucks: 4.4% | | | |
| | 9,314,000 | | | Denway Motors Ltd. | | | 4,371,131 | | |
| | 3,840,000 | | | Dongfeng Motor Group Co., Ltd. - H Shares | | | 4,369,471 | | |
| | | | 8,740,602 | | |
| Batteries – Battery System: 3.7% | | | |
| | 994,600 | | | BYD Co., Ltd. - H Shares | | | 7,331,731 | | |
| Cellular Telecom: 3.5% | | | |
| | 693,000 | | | China Mobile Ltd. | | | 6,906,774 | | |
| Chemicals – Other: 2.7% | | | |
| | 1,241,000 | | | Kingboard Chemical Holdings Ltd. | | | 5,312,167 | | |
| Coal: 5.1% | | | |
| | 2,615,000 | | | China Coal Energy Co. - H Shares | | | 3,279,316 | | |
| | 3,529,200 | | | Yanzhou Coal Mining Co., Ltd. - H Shares | | | 6,788,126 | | |
| | | | 10,067,442 | | |
| Commercial Banks: 13.1% | | | |
| | 2,577,000 | | | BOC Hong Kong Holdings Ltd. | | | 5,857,684 | | |
| | 6,824,000 | | | China Construction Bank Corp. - H Shares | | | 5,491,613 | | |
| | 192,650 | | | Dah Sing Financial Holdings Ltd. | | | 1,092,261 | | |
| | 614,691 | | | HSBC Holdings PLC | | | 5,631,130 | | |
| | 8,123,000 | | | Industrial & Commercial Bank of China - H Shares | | | 5,898,192 | | |
| | 188,400 | | | Wing Hang Bank Ltd. | | | 1,836,228 | | |
| | | | 25,807,108 | | |
| Computers: 2.5% | | | |
| | 9,310,000 | | | Lenovo Group Ltd. | | | 4,995,859 | | |
| Distribution/Wholesale: 2.2% | | | |
| | 2,835,000 | | | Digital China Holdings Ltd. | | | 4,334,282 | | |
| Energy – Alternate Sources: 3.4% | | | |
| | 510,800 | | | Renesola Ltd. - ADR* | | | 3,049,476 | | |
| | 215,400 | | | Trina Solar Ltd. - ADR* | | | 3,722,112 | | |
| | | | 6,771,588 | | |
The accompanying notes are an integral part of these financial statements.
29
| Shares | | COMMON STOCKS: 99.5% (Continued) | | Value | |
| Exchange Traded Funds (ETFs): 3.1% | | | |
| | 4,146,000 | | | iShares FTSE/Xinhua A50 CHINA Index ETF | | $ | 6,064,009 | | |
| Gas – Distribution: 3.6% | | | |
| | 1,080,000 | | | Beijing Enterprises Holdings Ltd. | | | 7,015,780 | | |
| Internet Application Software: 2.8% | | | |
| | 337,000 | | | Tencent Holdings Ltd. | | | 5,557,266 | | |
| Internet Content – Entertainment: 1.4% | | | |
| | 120,900 | | | Perfect World Co., Ltd. - ADR* | | | 2,661,009 | | |
| Machinery – General Industries: 0.7% | | | |
| | 3,510,000 | | | Chen Hsong Holdings† | | | 1,339,851 | | |
| Metal – Copper: 2.4% | | | |
| | 2,550,000 | | | Jiangxi Copper Co., Ltd. - H Shares | | | 4,750,061 | | |
| Oil – Integrated: 3.6% | | | |
| | 6,366,000 | | | PetroChina Co., Ltd. - H Shares | | | 7,026,955 | | |
| Oil & Gas – Exploration & Production: 7.0% | | | |
| | 4,184,000 | | | CNOOC Ltd. | | | 7,132,535 | | |
| | 5,354,000 | | | Kunlun Energy Co., Ltd. | | | 6,755,384 | | |
| | | | 13,887,919 | | |
| Power Conversion/Supply Equipment: 4.1% | | | |
| | 2,652,000 | | | Dongfang Electric Corp., Ltd. - H Shares | | | 8,192,053 | | |
| Public Thoroughfares: 1.2% | | | |
| | 5,204,000 | | | Shenzhen Expressway Co., Ltd. - H Shares | | | 2,293,309 | | |
| Real Estate: 3.4% | | | |
| | 11,744,000 | | | Soho China Ltd. | | | 6,796,382 | | |
| Real Estate Management/Service: 3.0% | | | |
| | 7,184,000 | | | Midland Holdings Ltd. | | | 5,890,383 | | |
| Retail – Apparel: 1.3% | | | |
| | 437,695 | | | Esprit Holdings Ltd. | | | 2,360,409 | | |
| | 698,000 | | | Glorious Sun Enterprises Ltd. | | | 258,899 | | |
| | | | 2,619,308 | | |
| Retail – Beauty Salons: 0.0%# | | | |
| | 712,000 | | | Modern Beauty Salon Holdings Ltd. | | | 53,682 | | |
| Steel – Producers: 1.7% | | | |
| | 2,755,000 | | | Angang Steel Co Ltd. - H Shares | | | 3,273,137 | | |
| Telecommunication Equipment: 3.6% | | | |
| | 657,000 | | | VTech Holdings Ltd. | | | 7,002,818 | | |
| Transportation – Marine: 3.8% | | | |
| | 3,852,000 | | | China Shipping Development Co., Ltd. - H Shares | | | 4,849,416 | | |
| | 4,240,000 | | | Pacific Basin Shipping Ltd. | | | 2,627,357 | | |
| | | | 7,476,773 | | |
| Web Portals/ISP: 3.1% | | | |
| | 104,540 | | | Netease.com - ADR* | | | 3,314,963 | | |
| | 69,900 | | | Sohu.com Inc - ADR* | | | 2,872,191 | | |
| | | | 6,187,154 | | |
| | | | | Total Common Stocks
(costs $158,589,810) | | | 196,461,565 | | |
The accompanying notes are an integral part of these financial statements.
30
| Shares | | RIGHTS AND WARRANTS: 0.1% | | Value | |
| Agricultural Biotech: 0.1% | |
| | 3,504,800 | | | Global Bio-Chem Technology Group Co., Ltd., rights* | | $ | 139,528 | | |
| Chemicals – Other: 0.0%# | |
| | 124,100 | | | Kingboard Chemical Holdings Ltd., warrants 40HKD, Exp. 10/31/12* | | | 48,926 | | |
| | | Total Rights and Warrants
(costs $0) | | | 188,454 | | |
| | | Total Investments in Securities
(costs $158,589,810) | | | 196,650,019 | | |
| | | Other Assets less Liabilities: 0.4% | | | 880,833 | | |
| | | Net Assets: 100% | | $ | 197,530,852 | | |
* Non-income producing security.
† Illiquid. Illiquid securities represent 0.7% of net assets.
# Less than 0.1% of net assets.
ADR - American Depository Receipt
HKD - Hong Kong Dollar
The accompanying notes are an integral part of these financial statements.
31
GLOBAL ENERGY FUND for the period ended June 30, 2010
1. Performance
Average Annualized Total Returns
| | | 6 Months
(Actual) | | 1 Year
(Actual) | | 3 Years | | 5 Years | | Since
Inception
June 30, 2004 | |
| Fund | | | -13.52 | % | | | 7.79 | % | | | -5.99 | % | | | 6.43 | % | | | 13.96 | % | |
| Benchmark Index: | |
| MSCI World Energy Index | | | -16.80 | % | | | -1.01 | % | | | -9.96 | % | | | 2.39 | % | | | 7.55 | % | |
| S&P 500 | | | -6.64 | % | | | 14.43 | % | | | -9.79 | % | | | -0.79 | % | | | 0.36 | % | |
The Fund's gross expense ratio is 1.42% per the Summary Prospectus dated May 1, 2010. Guinness Atkinson Asset Management has contractually agreed to waive a portion of its advisory fees so that the Fund's ratio of expenses to average daily net assets will not exceed 1.45% (excluding Acquired Fund Fees and Expenses, interest, taxes, dividends on short positions and extraordinary expenses) through at least June 30, 2011. To the extent that the Advisor waives fees it may seek repayment of a portion or all of such amounts at any time within the three fiscal years after the fiscal year in which such amounts were waived, subject to the applicable cap.
Performance data quoted represents past performance and does not guarantee future results. The investment return and principal value of an investment will fluctuate so that an investor's shares, when redeemed, may be worth more or less than their original cost. Current performance of the Funds may be lower or higher than the performance quoted. Performance data current to the most recent month end may be obtained by visiting www.gafunds.com, or calling (800) 916-6566.
The Fund imposes a 2% redemption fee on shares held less than 30 days. Performance data quoted does not reflect the 2% redemption fee on shares held less than 30 days. Total Returns for prior periods reflect a fee waiver in effect and in the absence of this waiver, the total returns would be lower.
The Global Energy Fund in the first six months of 2010 produced a total return of -13.52%. This compares favourably to the price return of the Morgan Stanley Capital International World Energy Index of -16.80%, but was behind the broad US market which was also down but less so, as exemplified by the S&P500 Index's total return of -6.64%.
2. Activity
Portfolio activity during the period was relatively light. In February we sold our position in Imperial Oil. The stock had served us well as a relatively defensive oil sands position, but had reached a valuation at which we felt there were better opportunities elsewhere. In its place we increased our positions in JKX Oil & Gas, Gazprom and Dragon Oil so that we now have a half unit in each. We originally established smaller positions in JKX and Gazprom in November 2009, and had bought back some Dragon in December 2009 having traded the stock in the final quarter of 2009 to take advantage of a takeover bid that was ultimately rejected.
In April we sold the majority of our holding in Transocean. The company had been a good performer in the 2009/10 recovery, and we took the opportunity to sell shortly after the Gulf of Mexico rig explosion was reported on April 20. In its place we established a position in Bill Barrett Group. Bill Barrett is an onshore US natural gas producer which looks particularly attractive on proven reserve and cash flow metrics. In May we sold our holding in Cenovus Energy. Cenovus, a Canadian oil sands and natural gas producer, was spun out of our holding in Encana in November 2009. In its place we completed our purchase of Bill Barrett, to take this holding to a full position in the portfolio.
3. Portfolio Position
The invested fund at June 30th 2010 was on a Price Earnings Ratio (2010) of 10.2x (14.3x 2009; 6.3x 2008) with a median PER (2010) of stocks held of 10.2x. By comparison the S&P 500 Index at 1031 was on a PER of 12.6x (2010) (Based on S&P 500 'operating' earnings per share estimates of 81.73 for 2010).
The better performers over the first six months of 2010 have been our US exploration & production stocks. Pioneer Natural Resources (+23.4%), Forest Oil (+23.0%), Swift Energy (+12.3%) and Newfield (+1.3%) were all direct beneficiaries of a strong oil price and a natural gas price which recovered temporarily in the first quarter. Valero, our only independent refiner, enjoyed an improvement in refining margins, and was up 7.3%. Three of the worst performing holdings were directly linked to the Gulf of
32
Mexico oil spill: BP was down 50.7%, Transocean was down 44.0% and Anadarko 42.2%. The other two weaker performers were European Integrated oil and gas companies OMV and Total, down 30.9% and 29.6% respectively.
The Sector and Geographic weightings of the portfolio at June 30th 2010 and December 31st 2009 were as follows:
| Sector Breakdown | |
| | | 30 June 2010 | | 31 Dec 2009 | |
| Integrated Oil & Gas | | | 45.5 | | | | 47.2 | | |
| Oil & Gas Exploration & Production | | | 38.1 | | | | 32 | | |
| Oil & Gas Drilling | | | 6.8 | | | | 8.4 | | |
| Oil & Gas Equipment & Services | | | 5.6 | | | | 5.4 | | |
| Coal & Consumable Fuels | | | 0 | | | | 0 | | |
| Oil & Gas Refining & Marketing | | | 3.5 | | | | 3.1 | | |
| Construction & Engineering | | | 0.3 | | | | 0.4 | | |
| Cash | | | 0.2 | | | | 3.5 | | |
| Total | | | 100.0 | | | | 100.0 | | |
| Geographic Breakdown | |
| | | 30 June 2010 | | 31 Dec 2009 | |
| US | | | 54.6 | | | | 50.2 | | |
| Canada | | | 12.2 | | | | 16.6 | | |
| UK | | | 6.9 | | | | 6.1 | | |
| Latin America, Hong Kong & Russia | | | 5.5 | | | | 4.2 | | |
| Europe | | | 20.6 | | | | 19.4 | | |
| Singapore | | | 0 | | | | 0 | | |
| Cash | | | 0.2 | | | | 3.5 | | |
| Total | | | 100.0 | | | | 100.0 | | |
4. Market Background
2010 has been a year of consolidation for the oil price. Having moved up from $30 to $80 in 2009 it has averaged $78 for the first half of 2010, and has been as high as $85 and as low as $66. We think that a $65-85 trading range is most likely for the rest of the year.
The longer term outlook continues to point to a steadily rising oil price, with world oil supply unlikely to keep pace with the growth in demand that we foresee. On the demand side, what we have to consider is whether demand in the next 5-10 years will grow at 1 million b/day as forecast by the International Energy Agency ("IEA"), or whether it could accelerate to the 2 million b/day growth that we saw in the two post war decades, driven by the OECD region. China currently consumes 45% as much oil as the US with a population well over 4 times the size; the Chinese vehicle fleet is 95m versus 255m in the US. The modernization of India, Russia and parts of the Middle East and Latin America will bring additional oil demands, as living conditions, infrastructure and transport all improve. If we use this growth number of 2 million b/day, we see global oil demand reaching 100 million b/day by 2017.
The non-OPEC world in particular is struggling to grow production, as illustrated by the IEA forecast of 0.2 million b/day growth per year over the next 5 years. Any small growth that is expected to derive from Canadian Oil Sands, Brazil, and the Caspian region, comes against a backdrop of quite sharp natural decline rates and an increasingly sensitive environmental and safety lobby post the BP spill. All of which brings us back to OPEC: it currently produces almost 30 million b/day (including Iraq) and will need to increase production by 5-10 million b/day in the next decade to match our forecasts for growth in demand. Optimists point to
33
GLOBAL ENERGY FUND
Iraq's enormous potential for output growth: skeptics assert that OPEC reserves, especially those of Saudi Arabia, are grossly overstated, and that such growth is a geological impossibility.
The oil price, which has historically been a result of the supply-demand balance, will increasingly be an input: we expect the medium term oil price to reach a level where it dampens demand, which is likely to be somewhere between $100 and $150 as seen in 2008. OPEC as the producer of much of the new supply will dictate prices more than ever, and will strive to achieve a level which rewards the member countries without restricting global economic growth. We envisage a world in which the average annual oil price moves up $5-$10 per year until it reaches this level.
Looking back at the shorter term, equally important to our investment thesis at present is the US natural gas price which remains depressed. The Henry Hub price at around $4.50 is well below what we consider to be the long-term marginal cost of supply (closer to $7). We expect demand for natural gas in the US to surprise to the upside, led by industrial and power generation, and when storage levels return to the middle of the five-year average we envisage a positive price reaction. We would not be surprised to see the US natural gas price average $5-$6 over the next 12 months.
5. Outlook
So where does all of this leave us? We believe that in a $70 oil and $6 natural gas price world our stocks can make good profits. We continue to think that OPEC will support an oil price around that level and will cut effectively if oil falls and remains below $50. Natural gas at below $5 is not sustainable in the medium to long term and as rejuvenated industrial and electricity demand eats into the excess inventory we expect the price to appreciate.
Our view is that the eurozone worries are overdone and that the broad market will get increasing support from recovering US housing starts and motor industry sales – both of which will recover from their current depressed levels for multiple quarters in succession. Add to this a conviction that the stock market impact of the Macondo spill on already good value energy equities is much overdone and you will not be surprised that we see this as a classic, buy when there is blood on the streets, buying opportunity for energy investors.
Overall, the Fund continues to seek to be well placed to benefit from the commodity price environment described above and to give investors exposure to long-run rising oil and natural gas prices.

Tim Guinness 2 August 2010
The Fund invests in foreign securities which will involve political, economic and currency risks, greater volatility, and differences in accounting methods. The Fund is non-diversified meaning its assets may be concentrated in fewer individual holdings than diversified funds. Therefore, the Fund is more exposed to individual stock volatility than diversified funds. The Fund invests in smaller companies, which will involve additional risks such as limited liquidity and greater volatility.
The MSCI World Energy Index is an unmanaged index composed of more than 1,400 stocks listed on exchanges in the U.S., Europe, Canada, Australia, New Zealand and the Far East. The Standard & Poor's 500 Index is a market-capitalization weighted index composed of 500 widely held common stocks of U.S. companies. These indices are unmanaged, not available for investment and do not incur expenses.
PER or P/E – Price to Earnings ratio is calculated by dividing current price of the stock by the company's trailing months' earnings per share.
Cash flow measures the cash generating capability of a company by adding non-cash charges (e.g. depreciation) and interest expense to pretax income.
Please refer to the Schedule of Investments for details on fund holdings. Current and future portfolio holdings are subject to risk.
The information provided herein represents the opinion of Guinness Atkinson Management for the period stated and is not intended to be a forecast of future events, a guarantee of future results, nor investment advice. Opinions, fund holdings and sector allocations are subject to change at any time are not recommendations to buy or sell any security.
34
FUND HIGHLIGHTS at June 30, 2010
GUINNESS ATKINSON GLOBAL ENERGY FUND
| # of Holdings in Portfolio: | | | 43 | | |
| Portfolio Turnover: | | | 15.3 | % | |
| % of Stocks in Top 10: | | | 35.5 | % | |
| Fund Managers: | |
| Timothy W. N. Guinness | | | | | |
| Ian Mortimer, Tom Nelson | | | | | |
| Will Riley | | | | | |
| Top 10 Holdings (% of net assets) | | | | Sector Breakdown (% of Investments) | |
| PetroChina Co., Ltd. - H Shares | | | 3.7 | % | | Oil & Gas-Integrated | | | 43.9 | % | |
| Unit Corp. | | | 3.6 | % | | Oil & Gas-Exploration & Production | | | 39.9 | % | |
| Marathon Oil Corp. | | | 3.6 | % | | Oil & Gas-Drilling | | | 6.7 | % | |
| Noble Energy Inc. | | | 3.6 | % | | Oil & Gas-Field Services | | | 5.9 | % | |
| Repsol YPF SA | | | 3.5 | % | | Oil Refining & Marketing | | | 3.5 | % | |
| ENI SpA | | | 3.5 | % | | Machinery-General Industries | | | 0.1 | % | |
| Newfield Exploration Co. | | | 3.5 | % | | | | | | | |
| Valero Energy Corp. | | | 3.5 | % | | | | | | | |
| Royal Dutch Shell PLC-A Shares | | | 3.5 | % | | | | | | | |
| Canadian Natural Resources Ltd. | | | 3.5 | % | | | | | | | |
| Country Breakdown (% of net assets) | | | |
| United States | | | 53.8 | % | | Norway | | | 3.4 | % | |
| Canada | | | 11.7 | % | | France | | | 3.4 | % | |
| Britain | | | 5.2 | % | | Austria | | | 3.3 | % | |
| China | | | 3.8 | % | | UAE | | | 1.8 | % | |
| Spain | | | 3.5 | % | | Russia | | | 1.7 | % | |
| Italy | | | 3.5 | % | | Switzerland | | | 0.8 | % | |
| Netherlands | | | 3.5 | % | | Ireland | | | 0.3 | % | |
35
SCHEDULE OF INVESTMENTS
at June 30, 2010 (Unaudited)
GUINNESS ATKINSON GLOBAL ENERGY FUND
| Shares | | Common Stocks: 99.7% | | Value | |
| Machinery – General Industries: 0.1% | | | |
| | 91,478 | | | Shandong Molong Petroleum Machinery Co., Ltd. - H Shares | | $ | 82,206 | | |
| Oil & Gas – Drilling: 6.7% | | | |
| | 155,470 | | | Patterson-UTI Energy, Inc. | | | 2,000,899 | | |
| | 14,930 | | | Transocean Ltd.* | | | 691,707 | | |
| | 76,997 | | | Unit Corp.* | | | 3,125,308 | | |
| | | | 5,817,914 | | |
| Oil & Gas – Exploration & Production: 39.8% | | | |
| | 99,000 | | | Afren PLC* | | | 124,994 | | |
| | 38,070 | | | Anadarko Petroleum Corp. | | | 1,373,946 | | |
| | 34,509 | | | Apache Corp. | | | 2,905,313 | | |
| | 97,618 | | | Bill Barrett Corp. | | | 3,003,706 | | |
| | 90,900 | | | Canadian Natural Resources Ltd. | | | 3,016,765 | | |
| | 142,700 | | | Chesapeake Energy Corp. | | | 2,989,565 | | |
| | 91,089 | | | Coastal Energy Co.* | | | 401,303 | | |
| | 259,950 | | | Dragon Oil Plc* | | | 1,565,280 | | |
| | 34,136 | | | EnCana Corp. | | | 1,033,812 | | |
| | 54,128 | | | Falkland Oil & Gas Ltd.* | | | 197,329 | | |
| | 59,600 | | | Forest Oil Corp.* | | | 1,630,656 | | |
| | 78,200 | | | Gazprom OAO - ADR | | | 1,470,820 | | |
| | 2,026 | | | Insignia Energy Ltd.* | | | 3,825 | | |
| | 453,542 | | | JKX Oil & Gas PLC | | | 1,637,083 | | |
| | 62,186 | | | Newfield Exploration Co.* | | | 3,038,408 | | |
| | 142,921 | | | Nexen, Inc. | | | 2,811,297 | | |
| | 51,435 | | | Noble Energy Inc. | | | 3,103,073 | | |
| | 199,198 | | | OPTI Canada, Inc.* | | | 334,944 | | |
| | 280,000 | | | Pantheon Resources PLC* | | | 100,403 | | |
| | 33,320 | | | Pioneer Natural Resources Co. | | | 1,980,874 | | |
| | 74,100 | | | Swift Energy Co.* | | | 1,994,031 | | |
| | 62,740 | | | WesternZagros Resources Ltd.* | | | 27,700 | | |
| | | | 34,745,127 | | |
The accompanying notes are an integral part of these financial statements.
36
| Shares | | COMMON STOCKS: 99.7% (Continued) | | Value | |
| Oil & Gas – Field Services: 5.9% | | | |
| | 117,500 | | | Halliburton Co. | | $ | 2,884,625 | | |
| | 180,680 | | | Helix Energy Solutions Group, Inc.* | | | 1,945,924 | | |
| | 84,900 | | | Kentz Corp Ltd. | | | 294,924 | | |
| | | | 5,125,473 | | |
| Oil & Gas – Integrated: 43.8% | | | |
| | 435,485 | | | BP PLC | | | 2,091,511 | | |
| | 42,600 | | | Chevron Corp. | | | 2,890,836 | | |
| | 60,728 | | | ConocoPhillips | | | 2,981,137 | | |
| | 166,000 | | | ENI SpA | | | 3,047,291 | | |
| | 58,143 | | | Hess Corp. | | | 2,926,919 | | |
| | 100,200 | | | Marathon Oil Corp. | | | 3,115,218 | | |
| | 96,033 | | | OMV AG | | | 2,894,294 | | |
| | 2,908,000 | | | PetroChina Co., Ltd. - H Shares | | | 3,209,925 | | |
| | 151,400 | | | Repsol YPF SA | | | 3,058,865 | | |
| | 118,971 | | | Royal Dutch Shell PLC - A Shares | | | 3,018,793 | | |
| | 155,050 | | | Statoil ASA | | | 2,990,434 | | |
| | 102,476 | | | Suncor Energy, Inc. | | | 3,015,897 | | |
| | 67,100 | | | Total SA | | | 2,986,258 | | |
| | | | 38,227,378 | | |
| Oil Refining & Marketing: 3.4% | | | |
| | 168,599 | | | Valero Energy Corp. | | | 3,031,410 | | |
| | | | | Total Common Stocks
(cost $95,574,258) | | | 87,029,508 | | |
| | | | | Total Investments in Securities
(cost $95,574,258) | | | 87,029,508 | | |
| | | | | Other Assets less Liabilities: 0.3% | | | 247,719 | | |
| | | | | Net Assets: 100% | | $ | 87,277,227 | | |
* Non-income producing security.
ADR: American Depository Receipt
The accompanying notes are an integral part of these financial statements.
37
GLOBAL INNOVATORS FUND for the period ended June 30, 2010
1. Performance
AVERAGE ANNUALIZED TOTAL RETURNS
| | | 6 Months
(Actual) | | 1 Year
(Actual) | | 3 Years | | 5 Years | | 10 Years | |
| Fund | | | -10.28 | % | | | 12.16 | % | | | -9.56 | % | | | 3.11 | % | | | -4.11 | % | |
| Benchmark Index: | |
| S&P500 | | | -6.64 | % | | | 14.43 | % | | | -9.79 | % | | | -0.79 | % | | | -1.59 | % | |
| NASDAQ Composite | | | -6.62 | % | | | 16.04 | % | | | -5.88 | % | | | 1.38 | % | | | -5.50 | % | |
The Fund's gross expense ratio is 1.69% per the Summary Prospectus dated May 1, 2010. Guinness Atkinson Asset Management has contractually agreed to waive a portion of its advisory fees so that the Fund's ratio of expenses to average daily net assets will not exceed 1.55% (excluding Acquired Fund Fees and Expenses, interest, taxes, dividends on short positions and extraordinary expenses) through at least June 30, 2011. To the extent that the Advisor waives fees it may seek repayment of a portion or all of such amounts at any time within the three fiscal years after the fiscal year in which such amounts were waived, subject to the applicable cap.
Performance data quoted represents past performance and does not guarantee future results. The investment return and principal value of an investment will fluctuate so that an investor's shares, when redeemed, may be worth more or less than their original cost. Current performance of the Funds may be lower or higher than the performance quoted. Performance data current to the most recent month end may be obtained by visiting www.gafunds.com, or calling (800) 916-6566.
The Fund imposes a 2% redemption fee on shares held less than 30 days. Performance data quoted does not reflect the 2% redemption fee on shares held less than 30 days. Total Returns reflect a fee waiver in effect and in the absence of this waiver, the total returns would be lower.
The Global Innovators Fund in the first six months of 2010 produced a return of -10.28%. While the fund underperformed both the S&P500 index and the NASDAQ index over the period the fund continues to outperform both indices over a 5 year time horizon.
After what had been relatively good performance in the first quarter of 2010 the portfolio was affected by a number of factors in the second quarter. In the second quarter global markets declined in response to sovereign debt concerns in the Euro area. We had positioned the portfolio in line with our expectation for global economic recovery and therefore our overweight positions in more cyclical sectors were affected. We also held a position in BP which fell 49.41% over the period in response to the Gulf of Mexico oil spill. However, we rebalanced this position at the end of the second quarter as we believed the extent of the sell off in BP was overdone.
Our best performing stocks for the period were Netflix, Qwest, AIG, Intercontinental Exchange and Capital One Financial. Our worst performing stocks were BP, Nokia, Nvidia, Research in Motion and Infospace.
2. Activity
We made one change to the portfolio selling our position in Microsoft and buying Best Buy.
3. Portfolio Position
The Portfolio consists of 30 holdings. Our largest weighting is in Information Technology ("IT") with 39.50% followed by Consumer Discretionary with 24.92%.
The portfolio on the 30 June, by our calculations, had a PER of 13.3X (2010) versus the S&P500 index at 12.9x (2010). Furthermore the stocks held by the portfolio were at that date on average 33% undervalued (i.e. 33% scope for appreciation) versus the market when we applied our discounted cash flow model to the individual constituents.
39.5% of the portfolio is invested in the IT sector, a decrease of 4.53% compared to 31 December 2009 due to the sale of Microsoft. Similarly our weighting in Consumer Discretionary sector increased 3.01% over the period due to our purchase of Best Buy.
38
| | | Q2 2010 | | Q4 2009 | |
| Consumer Discretionary | | | 24.92 | % | | | 21.91 | % | |
| Consumer Staples | | | 3.65 | % | | | 3.60 | % | |
| Energy | | | 3.73 | % | | | 3.75 | % | |
| Financials | | | 16.24 | % | | | 16.75 | % | |
| Health Care | | | 0.00 | % | | | 0.00 | % | |
| Industrials | | | 3.41 | % | | | 3.73 | % | |
| Information Technology | | | 39.50 | % | | | 44.03 | % | |
| Materials | | | 0.00 | % | | | 0.00 | % | |
| Telecommunication Services | | | 5.63 | % | | | 5.66 | % | |
| Utilities | | | 0.00 | % | | | 0.00 | % | |
| Cash | | | 2.92 | % | | | 0.57 | % | |
As can be seen from the following charts at 30 June 2010 the fund was overweight the Consumer Discretionary sector and underweight the Healthcare sector versus the S&P500 index and NASDAQ composite index. We are overweight the IT sector versus the S&P500 whereas we are underweight versus the NASDAQ composite index.
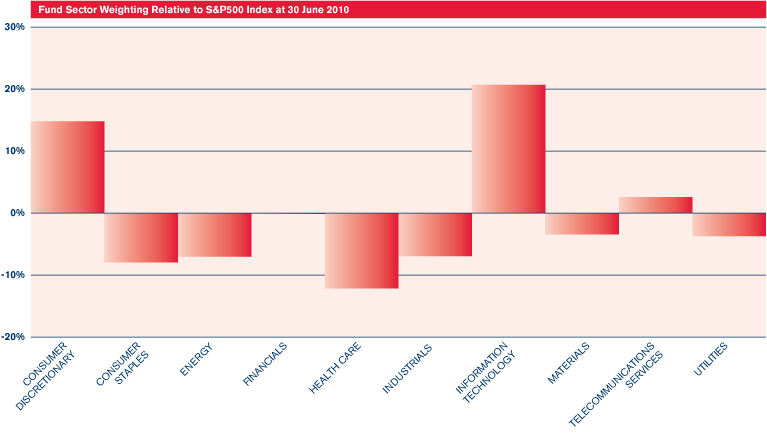
39
GLOBAL INNOVATORS FUND
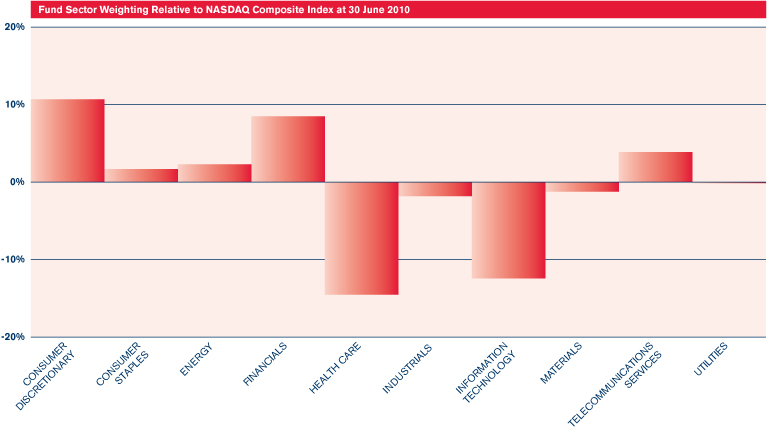
4. Investment Approach
In managing the Global Innovators Fund we seek companies that exhibit New Economy characteristics. We have created a global universe of leading innovative companies from a broad spectrum of industries that we continue to expand. We look to buy quality companies at attractive valuations that have innovation at the heart of their business.
Our multi-factor screening process is applied to this universe to select the best 30 or so ideas, and a deliberately low turnover, form the basis of our investment approach. We pay close attention to four factors in screening all stocks considered for purchase. The four criteria in our screening process are: (a) value, meaning a disciplined quantitative methodology used to rank all companies on similar basis projecting their internal cash flows using consensus forecast and historic trend data and applying a common overall market determined discount rate to imply fair value and compare this to actual price); (b) business quality (quantitatively ranking companies for the attractiveness of their return on capital metrics); (c) improving results (1 and 3 month earnings estimates revisions); and (d) good recent market price performance (looking particularly for above trend momentum). This screening approach is supported by what we believe is appr opriate due diligence both on the quality of the quantitative inputs to the screening process, and of a more traditional form. Also top down "thematic" judgements will be used in the process of evaluating potential Fund purchases, and a regular sell discipline involving review of large movers in the portfolio is also employed.
We hope that over the months and years to come investors will find their faith in our fund management and in the prospects for this fund with its focus on the future in particular will be rewarded.

Tim Guinness August 2010
40
The Fund invests in foreign securities which will involve political, economic and currency risks, greater volatility, and differences in accounting methods. The Fund is non-diversified meaning its assets may be concentrated in fewer individual holdings than diversified funds. Therefore, the Fund is more exposed to individual stock volatility than diversified funds. The Fund invests in smaller companies, which will involve additional risks such as limited liquidity and greater volatility.
The Standard & Poor's 500 Index is a market-capitalization weighted index composed of 500 widely held common stocks of U.S. companies. The NASDAQ Composite Index is a market capitalization weighted index that is designed to represent the performance of the National Market System which includes over 5,000 stocks traded only over-the-counter and not on an exchange. These indices are unmanaged, not available for investment and do not incur expenses. These indices are unmanaged, not available for investment and do not incur expenses.
PER or P/E – Price to Earnings ratio is calculated by dividing current price of the stock by the company's trailing months' earnings per share.
Cash flow measures the cash generating capability of a company by adding non-cash charges (e.g. depreciation) and interest expense to pretax income.
Please refer to the Schedule of Investments for details on fund holdings. Current and future portfolio holdings are subject to risk.
The information provided herein represents the opinion of Guinness Atkinson Management for the period stated and is not intended to be a forecast of future events, a guarantee of future results, nor investment advice. Opinions, fund holdings and sector allocations are subject to change at any time are not recommendations to buy or sell any security.
41
FUND HIGHLIGHTS at June 30, 2010
GUINNESS ATKINSON GLOBAL INNOVATORS FUND
| # of Holdings in Portfolio: | | | 30 | | |
| Portfolio Turnover: | | | 15.0 | % | |
| % of Stocks in Top 10: | | | 37.7 | % | |
| Fund Managers: | |
| Timothy W.N. Guinness | | | | | |
| Matthew Page | | | | | |
| Top 10 Holdings (% of net assets) | | | | Country Breakdown (% of net assets) | |
| Samsung Electronics Co., Ltd. - GDR | | | 3.9 | % | | United States | | | 63.7 | % | |
| Oracle Corp. | | | 3.8 | % | | Japan | | | 7.1 | % | |
| Qwest Communications International, Inc. | | | 3.8 | % | | Britain | | | 5.7 | % | |
| BP PLC | | | 3.8 | % | | South Korea | | | 3.9 | % | |
| Infospace, Inc. | | | 3.8 | % | | Taiwan | | | 3.8 | % | |
| Taiwan Semiconductor Manufacturing Co., Ltd. - ADR | | | 3.8 | % | | Finland | | | 3.7 | % | |
| Nokia OYJ | | | 3.7 | % | | Cayman Islands | | | 3.7 | % | |
| Garmin Ltd. | | | 3.7 | % | | Israel | | | 3.7 | % | |
| Comcast Corp. - Class A | | | 3.7 | % | | Canada | | | 3.3 | % | |
| Costco Wholesale Corp. | | | 3.7 | % | | | | | | | |
| Sector Breakdown (% of Investments) | | | |
| Electronics | | | 14.7 | % | | Oil & Gas Producers | | | 3.8 | % | |
| E-Commerce | | | 10.8 | % | | Wireless Equipment | | | 3.8 | % | |
| Commercial Banks | | | 8.8 | % | | Automobile Manufacturers | | | 3.7 | % | |
| Prepackaged Software | | | 7.6 | % | | Computer Aided Design | | | 3.7 | % | |
| Retail-Discount | | | 7.5 | % | | Finance-Investment Bank/Broker | | | 3.7 | % | |
| Semiconductor | | | 7.5 | % | | Finance-Other Services | | | 3.7 | % | |
| Telecommunications | | | 5.8 | % | | Audio/Video Products | | | 3.6 | % | |
| Cable/Satellite TV | | | 3.8 | % | | Computers | | | 3.3 | % | |
| Internet Content-Information | | | 3.8 | % | | Multi-line Insurance | | | 0.4 | % | |
42
SCHEDULE OF INVESTMENTS
at June 30, 2010 (Unaudited)
GUINNESS ATKINSON GLOBAL INNOVATORS FUND
| Shares | | COMMON STOCKS: 98.6% | | Value | |
| Audio/Video Products: 3.5% | | | |
| | 42,688 | | | Sony Corp. - ADR | | $ | 1,138,916 | | |
| Automobile Manufacturers: 3.6% | | | |
| | 19,830 | | | Honda Motor Co., Ltd. - ADR | | | 570,112 | | |
| | 8,740 | | | Toyota Motor Corp. - ADR | | | 599,302 | | |
| | | | 1,169,414 | | |
| Cable/Satellite TV: 3.7% | | | |
| | 69,150 | | | Comcast Corp. - Class A | | | 1,201,135 | | |
| Commercial Banks: 8.7% | | | |
| | 28,890 | | | Capital One Financial Corp. | | | 1,164,267 | | |
| | 137,850 | | | Citigroup, Inc. | | | 518,316 | | |
| | 33,594 | | | State Street Corp. | | | 1,136,149 | | |
| | | | 2,818,732 | | |
| Computer Aided Design: 3.6% | | | |
| | 74,630 | | | Parametric Technology Corp.* | | | 1,169,452 | | |
| Computers: 3.3% | | | |
| | 21,500 | | | Research In Motion Ltd.* | | | 1,059,090 | | |
| E-Commerce: 10.7% | | | |
| | 10,310 | | | Amazon.com, Inc.* | | | 1,126,471 | | |
| | 58,500 | | | eBay, Inc.* | | | 1,147,185 | | |
| | 10,830 | | | NetFlix, Inc.* | | | 1,176,680 | | |
| | | | 3,450,336 | | |
| Electronics: 14.5% | | | |
| | 41,270 | | | Garmin Ltd. | | | 1,204,259 | | |
| | 15,830 | | | L-3 Communications Holdings, Inc. | | | 1,121,397 | | |
| | 109,105 | | | NVIDIA Corp.* | | | 1,113,962 | | |
| | 3,990 | | | Samsung Electronics Co., Ltd. - GDR | | | 1,248,257 | | |
| | | | 4,687,875 | | |
| Finance – Investment Bank/Broker: 3.7% | | | |
| | 77,740 | | | TD Ameritrade Holding Corp.* | | | 1,189,422 | | |
| Finance – Other Services: 3.7% | | | |
| | 10,560 | | | IntercontinentalExchange, Inc.* | | | 1,193,597 | | |
| Internet Content – Information: 3.8% | | | |
| | 162,910 | | | Infospace, Inc.* | | | 1,225,083 | | |
| Multi-line Insurance: 0.4% | | | |
| | 4,083 | | | American International Group, Inc.* | | | 140,619 | | |
| Oil & Gas Producers: 3.8% | | | |
| | 42,490 | | | BP PLC | | | 1,227,111 | | |
The accompanying notes are an integral part of these financial statements.
43
| Shares | | COMMON STOCKS: 98.6% (Continued) | | Value | |
| Prepackaged Software: 7.5% | | | |
| | 40,220 | | | Check Point Software Technologies* | | $ | 1,185,686 | | |
| | 57,610 | | | Oracle Corp. | | | 1,236,311 | | |
| | | | 2,421,997 | | |
| Retail – Discount: 7.3% | | | |
| | 34,800 | | | Best Buy Co., Inc. | | | 1,178,328 | | |
| | 21,890 | | | Costco Wholesale Corp. | | | 1,200,229 | | |
| | | | 2,378,557 | | |
| Semiconductor: 7.4% | | | |
| | 96,570 | | | Applied Materials, Inc. | | | 1,160,771 | | |
| | 124,999 | | | Taiwan Semiconductor Manufacturing Co., Ltd. - ADR | | | 1,219,990 | | |
| | | | 2,380,761 | | |
| Telecommunications: 5.7% | | | |
| | 234,870 | | | Qwest Communications International, Inc. | | | 1,233,067 | | |
| | 29,985 | | | Vodafone Group PLC - ADR | | | 619,790 | | |
| | | | 1,852,857 | | |
| Wireless Equipment: 3.7% | | | |
| | 148,382 | | | Nokia OYJ | | | 1,209,313 | | |
| | | | | Total Common Stocks
(cost $46,947,567) | | | 31,914,267 | | |
| | | | | Total Investments in Securities
(cost $46,947,567) | | | 31,914,267 | | |
| | | | | Other Assets less Liabilities: 1.4% | | | 461,616 | | |
| | | | | Net Assets: 100% | | $ | 32,375,883 | | |
* Non-income producing security.
ADR - American Depository Receipt
GDR - Global Depository Receipt
The accompanying notes are an integral part of these financial statements.
44
STATEMENTS OF ASSETS AND LIABILITIES
at June 30, 2010 (Unaudited)
| | | Alternative
Energy
Fund | | Asia
Focus
Fund | | Asia Pacific
Dividend
Fund | |
| Assets | |
| Investments in securities, at cost | | $ | 72,815,148 | | | $ | 43,380,468 | | | $ | 6,072,369 | | |
| Investments in securities, at value | | $ | 39,602,850 | | | $ | 47,551,249 | | | $ | 5,604,607 | | |
| Cash | | | 265,631 | | | | — | | | | — | | |
Cash denominated in foreign currency
(cost of $164,400, $53,405, and $7,891, respectively) | | | 171,360 | | | | 53,563 | | | | 7,889 | | |
| Receivables: | |
| Securities sold | | | 67,573 | | | | 364,901 | | | | — | | |
| Fund shares sold | | | 15,747 | | | | 1,558 | | | | 400 | | |
| Dividends and interest | | | 118,706 | | | | 113,652 | | | | 8,162 | | |
| Due from Advisor, net | | | — | | | | — | | | | 2,676 | | |
| Prepaid expenses | | | 6,097 | | | | 13,012 | | | | 10,252 | | |
| Total assets | | | 40,247,964 | | | | 48,097,935 | | | | 5,633,986 | | |
| Liabilities | |
| Overdraft due to custodian bank | | | — | | | | 270,763 | | | | 56,976 | | |
| Payable for securities purchased | | | 165,976 | | | | — | | | | — | | |
| Payable for Fund shares redeemed | | | 4,662 | | | | 19,286 | | | | 19,362 | | |
| Due to Advisor, net | | | 35,073 | | | | 41,764 | | | | — | | |
| Accrued administration fees | | | 1,174 | | | | 145 | | | | 408 | | |
| Accrued shareholder servicing plan fees | | | 7,022 | | | | 7,439 | | | | 828 | | |
| Deferred trustees' compensation | | | 14,991 | | | | 34,435 | | | | 8,839 | | |
| Other accrued expenses | | | 97,843 | | | | 52,585 | | | | 24,310 | | |
| Total liabilities | | | 326,741 | | | | 426,417 | | | | 110,723 | | |
| Net Assets | | $ | 39,921,223 | | | $ | 47,671,518 | | | $ | 5,523,263 | | |
| Number of shares issued and outstanding (unlimited shares authorized, no par value) | | | 8,725,812 | | | | 3,032,990 | | | | 534,036 | | |
| Net asset value per share | | $ | 4.58 | | | $ | 15.72 | | | $ | 10.34 | | |
| Composition of Net Assets | |
| Paid-in capital | | $ | 129,902,189 | | | $ | 49,288,852 | | | $ | 10,204,658 | | |
| Undistributed net investment income (loss) | | | (233,460 | ) | | | (19,236 | ) | | | (22,282 | ) | |
Accumulated net realized gain (loss) on investments
and foreign currency | | | (56,526,842 | ) | | | (5,765,855 | ) | | | (4,191,295 | ) | |
| Net unrealized appreciation (depreciation) on: | |
| Investments | | | (33,212,298 | ) | | | 4,170,781 | | | | (467,762 | ) | |
| Foreign currency | | | (8,366 | ) | | | (3,024 | ) | | | (56 | ) | |
| Net Assets | | $ | 39,921,223 | | | $ | 47,671,518 | | | $ | 5,523,263 | | |
The accompanying notes are an integral part of these financial statements.
45
STATEMENTS OF ASSETS AND LIABILITIES
at June 30, 2010 (Unaudited)
| | | China &
Hong Kong
Fund | | Global
Energy
Fund | | Global
Innovators
Fund | |
| Assets | |
| Investments in securities, at cost | | $ | 158,589,810 | | | $ | 95,574,258 | | | $ | 46,947,567 | | |
| Investments in securities, at value | | $ | 196,650,019 | | | $ | 87,029,508 | | | $ | 31,914,267 | | |
| Cash | | | 326,817 | | | | 165,020 | | | | 701,689 | | |
Cash denominated in foreign currency
(cost of $138,461, $60,384, and $0, respectively) | | | 138,347 | | | | 60,384 | | | | — | | |
| Receivables: | |
| Securities sold | | | — | | | | — | | | | — | | |
| Fund shares sold | | | 240,959 | | | | 153,102 | | | | 202 | | |
| Dividends and interest | | | 701,975 | | | | 44,891 | | | | 33,489 | | |
| Due from Advisor, net | | | — | | | | — | | | | — | | |
| Prepaid expenses | | | 25,509 | | | | 21,779 | | | | 2,427 | | |
| Total assets | | | 198,083,626 | | | | 87,474,684 | | | | 32,652,074 | | |
| Liabilities | |
| Overdraft due to custodian bank | | | — | | | | — | | | | — | | |
| Payable for securities purchased | | — | | — | |
| Payable for Fund shares redeemed | | | 157,296 | | | | 71,231 | | | | 130,183 | | |
| Due to Advisor, net | | | 167,796 | | | | 56,820 | | | | 20,086 | | |
| Accrued administration fees | | | 3,347 | | | | 2,521 | | | | 1,212 | | |
| Accrued shareholder servicing plan fees | | | 23,416 | | | | 15,825 | | | | 5,313 | | |
| Deferred trustees' compensation | | | 68,797 | | | | 19,414 | | | | 46,012 | | |
| Other accrued expenses | | | 132,122 | | | | 31,646 | | | | 73,385 | | |
| Total liabilities | | | 552,774 | | | | 197,457 | | | | 276,191 | | |
| Net Assets | | $ | 197,530,852 | | | $ | 87,277,227 | | | $ | 32,375,883 | | |
| Number of shares issued and outstanding (unlimited shares authorized, no par value) | | | 6,193,232 | | | | 3,942,889 | | | | 2,222,072 | | |
| Net asset value per share | | $ | 31.89 | | | $ | 22.14 | | | $ | 14.57 | | |
| Composition of Net Assets | |
| Paid-in capital | | $ | 148,617,611 | | | $ | 99,105,555 | | | $ | 80,162,138 | | |
| Undistributed net investment income (loss) | | | 1,918,924 | | | | 228,993 | | | | (47,114 | ) | |
Accumulated net realized gain (loss) on investments
and foreign currency | | | 8,934,269 | | | | (3,510,830 | ) | | | (32,705,841 | ) | |
| Net unrealized appreciation (depreciation) on: | |
| Investments | | | 38,060,209 | | | | (8,544,750 | ) | | | (15,033,300 | ) | |
| Foreign currency | | | (161 | ) | | | (1,741 | ) | | | — | | |
| Net Assets | | $ | 197,530,852 | | | $ | 87,277,227 | | | $ | 32,375,883 | | |
The accompanying notes are an integral part of these financial statements.
46
STATEMENTS OF OPERATIONS
For the six months ended June 30, 2010 (Unaudited)
| | | Alternative
Energy
Fund | | Asia
Focus
Fund | | Asia Pacific
Dividend
Fund | |
| Investment Income | |
| Dividends* | | $ | 255,370 | | | $ | 720,145 | | | $ | 114,426 | | |
| Interest | | | 12,538 | | | | — | | | | — | | |
| Total income | | | 267,908 | | | | 720,145 | | | | 114,426 | | |
| Expenses | |
| Advisory fee | | | 256,835 | | | | 326,104 | | | | 45,962 | | |
| Shareholder servicing plan fees | | | 48,799 | | | | 56,916 | | | | 9,194 | | |
| Transfer agent fee and expenses | | | 41,160 | | | | 24,795 | | | | 9,421 | | |
| Fund accounting fee and expenses | | | 18,348 | | | | 23,307 | | | | 13,885 | | |
| Administration fee | | | 10,274 | | | | 13,044 | | | | 1,838 | | |
| Custody fees and expenses | | | 4,959 | | | | 19,836 | | | | 7,627 | | |
| Audit fee | | | 8,592 | | | | 11,846 | | | | 8,592 | | |
| Legal fee | | | 8,927 | | | | 10,868 | | | | 1,984 | | |
| Registration fees | | | 12,397 | | | | 9,917 | | | | 7,935 | | |
| Printing | | | 16,860 | | | | 7,439 | | | | 2,976 | | |
| Trustees' fees and expenses | | | 6,943 | | | | 5,431 | | | | 3,463 | | |
| Insurance | | | 2,333 | | | | 3,888 | | | | 389 | | |
| CCO fee and expenses | | | 5,511 | | | | 7,285 | | | | 3,667 | | |
| Miscellaneous | | | 892 | | | | 1,241 | | | | 496 | | |
| Total expenses | | | 442,830 | | | | 521,917 | | | | 117,429 | | |
| Less: fees (waived)/recaptured | | | — | | | | — | | | | (26,416 | ) | |
| Interest expense | | | 3,111 | | | | 10,745 | | | | 1,796 | | |
| Net expenses | | | 445,941 | | | | 532,662 | | | | 92,809 | | |
| Net investment income (loss) | | | (178,033 | ) | | | 187,483 | | | | 21,617 | | |
| Realized and unrealized gain (loss) on investments and foreign currency | |
| Net realized loss on: | |
| Investments | | | (3,517,868 | ) | | | (5,281,745 | ) | | | (1,358,867 | ) | |
| Foreign currency | | | (1,173 | ) | | | (36,307 | ) | | | (6,340 | ) | |
| | | | (3,519,041 | ) | | | (5,318,052 | ) | | | (1,365,207 | ) | |
| Net unrealized appreciation (depreciation) on: | |
| Investments | | | (14,848,312 | ) | | | (5,414,603 | ) | | | 1,052,802 | | |
| Foreign currency | | | (24,220 | ) | | | (669 | ) | | | (287 | ) | |
| | | | (14,872,532 | ) | | | (5,415,272 | ) | | | 1,052,515 | | |
| Net increase from payments by affiliates | | | — | | | | — | | | | 3,561 | | |
| Net realized and unrealized gain (loss) on investments and foreign currency | | | (18,391,573 | ) | | | (10,733,324 | ) | | | (309,131 | ) | |
| Net Increase (Decrease) in Net Assets from Operations | | $ | (18,569,606 | ) | | $ | (10,545,841 | ) | | $ | (287,514 | ) | |
* Net of foreign tax withheld of $27,777, $63,035, and $6,798, respectively.
The accompanying notes are an integral part of these financial statements.
47
STATEMENTS OF OPERATIONS
For the six months ended June 30, 2010 (Unaudited)
| | | China &
Hong Kong
Fund | | Global
Energy
Fund | | Global
Innovators
Fund | |
| Investment Income | |
| Dividends* | | $ | 2,855,494 | | | $ | 904,828 | | | $ | 291,693 | | |
| Interest | | | — | | | | — | | | | — | | |
| Total income | | | 2,855,494 | | | | 904,828 | | | | 291,693 | | |
| Expenses | |
| Advisory fee | | | 1,139,201 | | | | 346,094 | | | | 141,419 | | |
| Shareholder servicing plan fees | | | 173,880 | | | | 69,219 | | | | 29,284 | | |
| Transfer agent fee and expenses | | | 119,013 | | | | 22,315 | | | | 32,720 | | |
| Fund accounting fee and expenses | | | 34,712 | | | | 18,100 | | | | 13,885 | | |
| Administration fee | | | 45,568 | | | | 18,458 | | | | 7,542 | | |
| Custody fees and expenses | | | 27,273 | | | | 9,917 | | | | 2,480 | | |
| Audit fee | | | 11,847 | | | | 11,847 | | | | 11,846 | | |
| Legal fee | | | 34,216 | | | | 10,909 | | | | 3,455 | | |
| Registration fees | | | 12,397 | | | | 10,413 | | | | 9,917 | | |
| Printing | | | 18,348 | | | | 7,439 | | | | 9,917 | | |
| Trustees' fees and expenses | | �� | 11,628 | | | | 6,447 | | | | 4,832 | | |
| Insurance | | | 8,748 | | | | 2,720 | | | | 1,361 | | |
| CCO fee and expenses | | | 11,991 | | | | 5,966 | | | | 4,597 | | |
| Miscellaneous | | | 1,984 | | | | 992 | | | | 744 | | |
| Total expenses | | | 1,650,806 | | | | 540,836 | | | | 273,999 | | |
| Less: fees (waived)/recaptured | | | — | | | | — | | | | 14,990 | | |
| Interest expense | | | 13,203 | | | | 411 | | | | 206 | | |
| Net expenses | | | 1,664,009 | | | | 541,247 | | | | 289,195 | | |
| Net investment income (loss) | | | 1,191,485 | | | | 363,581 | | | | 2,498 | | |
| Realized and unrealized gain (loss) on investments and foreign currency | |
| Net realized loss on: | |
| Investments | | | 10,539,680 | | | | (1,158,276 | ) | | | 1,264,741 | | |
| Foreign currency | | | (4,134 | ) | | | (24,425 | ) | | | — | | |
| | | | 10,535,546 | | | | (1,182,701 | ) | | | 1,264,741 | | |
| Net unrealized appreciation (depreciation) on: | |
| Investments | | | (33,459,966 | ) | | | (13,967,081 | ) | | | (5,165,076 | ) | |
| Foreign currency | | | (127 | ) | | | (2,170 | ) | | | — | | |
| | | | (33,460,093 | ) | | | (13,969,251 | ) | | | (5,165,076 | ) | |
| Net increase from payments by affiliates | | | — | | | | — | | | | — | | |
| Net realized and unrealized gain (loss) on investments and foreign currency | | | (22,924,547 | ) | | | (15,151,952 | ) | | | (3,900,335 | ) | |
| Net Increase (Decrease) in Net Assets from Operations | | $ | (21,733,062 | ) | | $ | (14,788,371 | ) | | $ | (3,897,837 | ) | |
* Net of foreign tax withheld of $145,499, $110,366, and $8,312, respectively.
The accompanying notes are an integral part of these financial statements.
48
STATEMENTS OF CHANGES IN NET ASSETS
| | | Alternative Energy Fund | | Asia Focus Fund | | Asia Pacific Dividend Fund | |
| | | Six Months Ended
June 30, 2010* | | Year Ended
December 31, 2009 | | Six Months Ended
June 30, 2010* | | Year Ended
December 31, 2009 | | Six Months Ended
June 30, 2010* | | Year Ended
December 31, 2009 | |
Increase/(decrease) in
net assets from: | |
| Operations | |
| Net investment income (loss) | | $ | (178,033 | ) | | $ | (548,371 | ) | | $ | 187,483 | | | $ | 426,945 | | | $ | 21,617 | | | $ | 170,178 | | |
| Net realized gain (loss) on: | |
| Investments | | | (3,517,868 | ) | | | (15,487,017 | ) | | | (5,281,745 | ) | | | 2,730,063 | | | | (1,358,867 | ) | | | (888,126 | ) | |
| Foreign currency | | | (1,173 | ) | | | (62,413 | ) | | | (36,307 | ) | | | (99,870 | ) | | | (6,340 | ) | | | (2,651 | ) | |
Net change in unrealized
appreciation (depreciation) on: | |
| Investments | | | (14,848,312 | ) | | | 32,503,361 | | | | (5,414,603 | ) | | | 24,122,291 | | | | 1,052,802 | | | | 4,221,897 | | |
| Foreign currency | | | (24,220 | ) | | | 15,961 | | | | (669 | ) | | | (2,161 | ) | | | (287 | ) | | | 421 | | |
Net increase from payments
by affiliates | | | — | | | | — | | | | — | | | | — | | | | 3,561 | | | | — | | |
Net decrease in net assets
resulting from operations | | | (18,569,606 | ) | | | 16,421,521 | | | | (10,545,841 | ) | | | 27,177,268 | | | | (287,514 | ) | | | 3,501,719 | | |
| Distributions to shareholders | |
| From net investment income | | | — | | | | — | | | | — | | | | (513,961 | ) | | | (28,519 | ) | | | (171,895 | ) | |
| From net realized gains | | | — | | | | — | | | | — | | | | — | | | | — | | | | — | | |
| Return of capital | | | — | | | | (2,159,540 | ) | | | — | | | | — | | | | — | | | | (281,806 | ) | |
Total distributions to
shareholders | | | — | | | | (2,159,540 | ) | | | — | | | | (513,961 | ) | | | (28,519 | ) | | | (453,701 | ) | |
| Capital transactions | |
| Proceeds from shares sold | | | 7,159,506 | | | | 19,239,689 | | | | 5,885,120 | | | | 74,855,418 | | | | 1,058,332 | | | | 5,058,095 | | |
| Reinvestment of distributions | | | — | | | | 2,058,447 | | | | — | | | | 503,425 | | | | 27,412 | | | | 440,374 | | |
| Cost of shares repurchased | | | (10,778,425 | ) | | | (20,602,783 | ) | | | (60,127,493 | ) | | | (11,393,129 | ) | | | (6,626,172 | ) | | | (2,436,707 | ) | |
| Redemption fee proceeds | | | 1,082 | | | | 6,401 | | | | 38,443 | | | | 13,096 | | | | 382 | | | | 1,787 | | |
Net change in net assets from
capital transactions | | | (3,617,837 | ) | | | 701,754 | | | | (54,203,930 | ) | | | 63,978,810 | | | | (5,540,046 | ) | | | 3,063,549 | | |
Total increase (decrease) in
net assets | | | (22,187,443 | ) | | | 14,963,735 | | | | (64,749,771 | ) | | | 90,642,117 | | | | (5,856,079 | ) | | | 6,111,567 | | |
| Net assets | |
| Beginning of period | | | 62,108,666 | | | | 47,144,931 | | | | 112,421,289 | | | | 21,779,172 | | | | 11,379,342 | | | | 5,267,775 | | |
| End of period | | $ | 39,921,223 | | | $ | 62,108,666 | | | $ | 47,671,518 | | | $ | 112,421,289 | | | $ | 5,523,263 | | | $ | 11,379,342 | | |
| Accumulated net investment loss | | $ | (233,460 | ) | | $ | (55,427 | ) | | $ | (19,236 | ) | | $ | (206,719 | ) | | $ | (22,282 | ) | | $ | (15,380 | ) | |
| Capital share activity | |
| Shares sold | | | 1,241,669 | | | | 3,439,315 | | | | 334,148 | | | | 4,823,789 | | | | 94,367 | | | | 501,073 | | |
| Shares issued on reinvestment | | | — | | | | 311,414 | | | | — | | | | 28,734 | | | | 2,574 | | | | 41,932 | | |
| Shares redeemed | | | (1,902,231 | ) | | | (3,533,714 | ) | | | (3,678,263 | ) | | | (763,543 | ) | | | (594,826 | ) | | | (263,329 | ) | |
Net increase (decrease) in
shares outstanding | | | (660,562 | ) | | | 217,015 | | | | (3,344,115 | ) | | | 4,088,980 | | | | (497,885 | ) | | | 279,676 | | |
* Unaudited.
The accompanying notes are an integral part of these financial statements.
49
STATEMENTS OF CHANGES IN NET ASSETS
| | | China & Hong Kong Fund | | Global Energy Fund | | Global Innovators Fund | |
| | | Six Months Ended
June 30, 2010* | | Year Ended
December 31, 2009 | | Six Months Ended
June 30, 2010* | | Year Ended
December 31, 2009 | | Six Months Ended
June 30, 2010* | | Year Ended
December 31, 2009 | |
Increase/(decrease) in
net assets from: | |
| Operations | |
| Net investment income (loss) | | $ | 1,191,485 | | | $ | 1,074,857 | | | $ | 363,581 | | | $ | 364,720 | | | $ | 2,498 | | | $ | (24,136 | ) | |
| Net realized gain (loss) on: | |
| Investments | | | 10,539,680 | | | | 6,503,684 | | | | (1,158,276 | ) | | | 1,022,108 | | | | 1,264,741 | | | | 2,275,531 | | |
| Foreign currency | | | (4,134 | ) | | | (3,287 | ) | | | (24,425 | ) | | | (38,884 | ) | | | — | | | | 47 | | |
Net change in unrealized
appreciation (depreciation) on: | |
| Investments | | | (33,459,966 | ) | | | 105,157,080 | | | | (13,967,081 | ) | | | 18,267,865 | | | | (5,165,076 | ) | | | 9,993,061 | | |
| Foreign currency | | | (127 | ) | | | (34 | ) | | | (2,170 | ) | | | 1,336 | | | | — | | | | — | | |
Net decrease in net
assets resulting from
operations | | | (21,733,062 | ) | | | 112,732,300 | | | | (14,788,371 | ) | | | 19,617,145 | | | | (3,897,837 | ) | | | 12,244,503 | | |
| Distributions to shareholders | |
| From net investment income | | | — | | | | (2,242,023 | ) | | | — | | | | — | | | | — | | | | — | | |
| From net realized gain | | — | | (7,315,000) | |
| Return of capital | | | — | | | | — | | | | — | | | | — | | | | — | | | | (83,526 | ) | |
Total distributions to
shareholders | | | — | | | | (9,557,023 | ) | | | — | | | | — | | | | — | | | | (83,526 | ) | |
| Capital transactions | |
| Proceeds from shares sold | | | 29,099,645 | | | | 65,170,359 | | | | 50,229,390 | | | | 40,443,719 | | | | 4,135,402 | | | | 2,835,972 | | |
| Reinvestment of distributions | | | — | | | | 9,376,023 | | | | — | | | | — | | | | — | | | | 81,714 | | |
| Cost of shares repurchased | | | (50,878,062 | ) | | | (60,166,042 | ) | | | (23,549,987 | ) | | | (14,897,300 | ) | | | (4,583,042 | ) | | | (7,971,680 | ) | |
| Redemption fee proceeds | | | 82,188 | | | | 89,972 | | | | 26,306 | | | | 40,140 | | | | 436 | | | | 349 | | |
Net change in net assets from
capital transactions | | | (21,696,229 | ) | | | 14,470,312 | | | | 26,705,709 | | | | 25,586,559 | | | | (447,204 | ) | | | (5,053,645 | ) | |
Total increase (decrease)
in net assets | | | (43,429,291 | ) | | | 117,645,589 | | | | 11,917,338 | | | | 45,203,704 | | | | (4,345,041 | ) | | | 7,107,332 | | |
| Net assets | |
| Beginning of period | | | 240,960,143 | | | | 123,314,554 | | | | 75,359,889 | | | | 30,156,185 | | | | 36,720,924 | | | | 29,613,592 | | |
| End of period | | $ | 197,530,852 | | | $ | 240,960,143 | | | $ | 87,277,227 | | | $ | 75,359,889 | | | $ | 32,375,883 | | | $ | 36,720,924 | | |
Accumulated net investment
income (loss) | | $ | 1,918,924 | | | $ | 727,439 | | | $ | 228,993 | | | $ | (134,588 | ) | | $ | (47,114 | ) | | $ | (49,612 | ) | |
| Capital share activity | |
| Shares sold | | | 816,146 | | | | 2,210,880 | | | | 1,963,059 | | | | 1,747,556 | | | | 243,829 | | | | 214,654 | | |
| Shares issued on reinvestment | | | — | | | | 268,745 | | | | — | | | | — | | | | — | | | | 5,001 | | |
| Shares redeemed | | | (1,482,601 | ) | | | (2,117,299 | ) | | | (963,878 | ) | | | (727,270 | ) | | | (282,379 | ) | | | (600,921 | ) | |
Net increase (decrease) in
shares outstanding | | | (666,455 | ) | | | 362,326 | | | | 999,181 | | | | 1,020,286 | | | | (38,550 | ) | | | (381,266 | ) | |
* Unaudited.
The accompanying notes are an integral part of these financial statements.
50
FINANCIAL HIGHLIGHTS
For a capital share outstanding throughout the period
| | | Six Months
Ended | | Year Ended December 31, | | March 31, 2006(1)
Through | |
| Alternative Energy Fund | | June 30, 2010* | | 2009 | | 2008 | | 2007 | | December 31, 2006 | |
| Net asset value, beginning of period | | $ | 6.62 | | | $ | 5.14 | | | $ | 16.25 | | | $ | 11.47 | | | $ | 12.50 | | |
| Income from investment operations: | |
| Net investment income (loss) | | | (0.02 | ) | | | (0.05 | ) | | | (0.10 | ) | | | (0.05 | ) | | | (0.11 | ) | |
Net realized and unrealized gain (loss) on
investments and foreign currency | | | (2.02 | ) | | | 1.77 | | | | (10.64 | ) | | | 4.93 | | | | (0.93 | ) | |
| Total from investment operations | | | (2.04 | ) | | | 1.72 | | | | (10.74 | ) | | | 4.88 | | | | (1.04 | ) | |
| Less distributions: | |
| From net investment income | | | — | | | | — | | | | (0.01 | ) | | | — | | | | — | | |
| From net realized gain | | | — | | | | — | | | | (0.37 | ) | | | (0.11 | ) | | | — | | |
| Return of capital | | | — | | | | (0.24 | ) | | | — | | | | — | | | | — | | |
| Total distributions | | | — | | | | (0.24 | ) | | | (0.38 | ) | | | (0.11 | ) | | | — | | |
| Redemption fee proceeds | | | — | (2) | | | — | (2) | | | 0.01 | | | | 0.01 | | | | 0.01 | | |
| Net asset value, end of period | | $ | 4.58 | | | $ | 6.62 | | | $ | 5.14 | | | $ | 16.25 | | | $ | 11.47 | | |
| Total return | | | (30.82 | )%(3) | | | 33.42 | % | | | (66.05 | )% | | | 42.68 | % | | | (8.24 | )%(3) | |
| Ratios/supplemental data: | |
| Net assets, end of period (millions) | | $ | 39.9 | | | $ | 62.1 | | | $ | 47.1 | | | $ | 161.7 | | | $ | 15.7 | | |
| Ratio of expenses to average net assets: | |
| Before fee waived | | | 1.74 | %(4) | | | 1.85 | % | | | 1.69 | % | | | 1.64 | % | | | 2.60 | %(4) | |
| After fees waived | | | 1.74 | %(4) | | | 1.85 | % | | | 1.69 | % | | | 1.64 | % | | | 1.98 | %(4) | |
| After fees waived excluding interest expense(5) | | | 1.73 | %(4) | | | 1.85 | % | | | 1.67 | % | | | 1.62 | % | | | 1.97 | %(4) | |
| Ratio of net investment loss to average net assets: | |
| Before fees waived | | | (0.70 | )%(4) | | | (0.98 | )% | | | (0.80 | )% | | | (0.90 | )% | | | (2.18 | )%(4) | |
| After fees waived | | | (0.70 | )%(4) | | | (0.98 | )% | | | (0.80 | )% | | | (0.90 | )% | | | (1.56 | )%(4) | |
| Portfolio turnover rate | | | 12.93 | %(3) | | | 47.10 | % | | | 94.76 | % | | | 47.41 | % | | | 21.71 | %(3) | |
* Unaudited
(1) Commencement of Operations.
(2) Amount represents less than $0.01 per share.
(3) Not annualized.
(4) Annualized.
(5) The Advisor has contractually agreed to limit the operating expenses of the Fund to 1.98%, excluding interest expense, expenses related to dividends on short positions, brokerage commissions, taxes and other extraordinary expenses. See Note 3.
The accompanying notes are an integral part of these financial statements.
51
FINANCIAL HIGHLIGHTS
For a capital share outstanding throughout the period
| | | Six Months
Ended | | Year Ended December 31, | |
| Asia Focus Fund | | June 30, 2010* | | 2009 | | 2008 | | 2007 | | 2006 | | 2005 | |
| Net asset value, beginning of period | | $ | 17.63 | | | $ | 9.52 | | | $ | 23.96 | | | $ | 16.60 | | | $ | 12.38 | | | $ | 10.40 | | |
| Income from investment operations: | |
| Net investment income | | | 0.03 | | | | 0.06 | (1) | | | 0.55 | | | | 0.27 | | | | 0.24 | | | | 0.16 | | |
Net realized and unrealized gain (loss) on
investments and foreign currency | | | (1.95 | ) | | | 8.13 | | | | (14.30 | ) | | | 7.35 | | | | 4.18 | | | | 2.00 | | |
| Total from investment operations | | | (1.92 | ) | | | 8.19 | | | | (13.75 | ) | | | 7.62 | | | | 4.42 | | | | 2.16 | | |
| Less distributions: | |
| From net investment income | | | — | | | | (0.08 | ) | | | (0.69 | ) | | | (0.28 | ) | | | (0.24 | ) | | | (0.18 | ) | |
| Total distributions | | | — | | | | (0.08 | ) | | | (0.69 | ) | | | (0.28 | ) | | | (0.24 | ) | | | (0.18 | ) | |
| Redemption fee proceeds | | | 0.01 | | | | — | (2) | | | — | (2) | | | 0.02 | | | | 0.04 | | | | — | (2) | |
| Net asset value, end of period | | $ | 15.72 | | | $ | 17.63 | | | $ | 9.52 | | | $ | 23.96 | | | $ | 16.60 | | | $ | 12.38 | | |
| Total return | | | (10.83 | )%(3) | | | 86.05 | % | | | (57.38 | )% | | | 46.00 | % | | | 36.15 | % | | | 20.83 | % | |
| Ratios/supplemental data: | |
| Net assets, end of period (millions) | | $ | 47.7 | | | $ | 112.4 | | | $ | 21.8 | | | $ | 78.2 | | | $ | 49.3 | | | $ | 36.5 | | |
| Ratio of expenses to average net assets: | |
| Before fees waived | | | 1.64 | %(4) | | | 1.68 | % | | | 1.75 | % | | | 1.69 | % | | | 1.84 | % | | | 1.87 | % | |
| After fees waived | | | 1.64 | %(4) | | | 1.68 | % | | | 1.75 | % | | | 1.69 | % | | | 1.84 | % | | | 1.87 | % | |
| After fees waived excluding interest expense(5) | | | 1.61 | %(4) | | | 1.68 | % | | | 1.70 | % | | | 1.63 | % | | | 1.81 | % | | | 1.86 | % | |
| Ratio of net investment income to average net assets: | |
| Before fees waived | | | 0.58 | %(4) | | | 0.73 | % | | | 2.55 | % | | | 1.34 | % | | | 1.48 | % | | | 1.41 | % | |
| After fees waived | | | 0.58 | %(4) | | | 0.73 | % | | | 2.55 | % | | | 1.34 | % | | | 1.48 | % | | | 1.41 | % | |
| Portfolio turnover rate | | | 11.72 | %(3) | | | 31.35 | % | | | 28.89 | % | | | 31.17 | % | | | 95.68 | % | | | 18.25 | % | |
* Unaudited.
(1) Based on average shares outstanding during the period.
(2) Amount represents less than $0.01 per share.
(3) Not annualized.
(4) Annualized.
(5) The Advisor has contractually agreed to limit the operating expenses of the Fund to 1.98%, excluding interest expense, expenses related to dividends on short positions, borkerage commissions, taxes and other extraordinary expenses. See Note 3.
The accompanying notes are an integral part of these financial statements.
52
FINANCIAL HIGHLIGHTS
For a capital share outstanding throughout the period
| | | Six Months
Ended | | Year Ended December 31, | | March 31, 2006(1)
Through | |
| Asia Pacific Dividend Fund | | June 30, 2010* | | 2009 | | 2008 | | 2007 | | December 31, 2006 | |
| Net asset value, beginning of period | | $ | 11.03 | | | $ | 7.00 | | | $ | 16.75 | | | $ | 13.56 | | | $ | 12.50 | | |
| Income from investment operations: | |
| Net investment income | | | 0.01 | (2) | | | 0.18 | (2) | | | 0.75 | | | | 0.24 | | | | 0.25 | | |
Net realized and unrealized gain (loss) on
investments and foreign currency | | | (0.65 | ) | | | 4.32 | | | | (9.22 | ) | | | 3.32 | | | | 1.03 | | |
| Total from investment operations | | | (0.64 | ) | | | 4.50 | | | | (8.47 | ) | | | 3.56 | | | | 1.28 | | |
| Less distributions: | |
| From net investment income | | | (0.05 | ) | | | (0.18 | ) | | | (0.51 | ) | | | (0.27 | ) | | | (0.23 | ) | |
| From net realized gain | | | — | | | | — | | | | (0.78 | ) | | | (0.11 | ) | | | — | | |
| Return of capital | | | — | | | | (0.29 | ) | | | — | | | | — | | | | — | | |
| Total distributions | | | (0.05 | ) | | | (0.47 | ) | | | (1.29 | ) | | | (0.38 | ) | | | (0.23 | ) | |
| Redemption fee proceeds | | | 0.00 | (3) | | | — | (3) | | | 0.01 | | | | 0.01 | | | | 0.01 | | |
| Net asset value, end of period | | $ | 10.34 | | | $ | 11.03 | | | $ | 7.00 | | | $ | 16.75 | | | $ | 13.56 | | |
| Total return | | | (5.81 | )%(4) | | | 64.84 | % | | | (51.74 | )% | | | 26.30 | % | | | 10.59 | %(4) | |
| Ratios/supplemental data: | |
| Net assets, end of period (millions) | | $ | 5.5 | | | $ | 11.4 | | | $ | 5.3 | | | $ | 31.8 | | | $ | 1.1 | | |
| Ratio of expenses to average net assets: | |
| Before fees waived | | | 2.60 | %(5) | | | 2.93 | % | | | 2.33 | % | | | 2.09 | % | | | 17.86 | %(5) | |
| After fees waived | | | 2.02 | %(5) | | | 1.98 | % | | | 2.10 | % | | | 1.98 | % | | | 1.98 | %(5) | |
| After fees waived excluding interest expense(6) | | | 1.98 | %(5) | | | 1.98 | % | | | 1.98 | % | | | 1.92 | % | | | 1.96 | %(5) | |
| Ratio of net investment income (loss) to average net assets: | |
| Before fees waived | | | (0.11 | )%(5) | | | 1.23 | % | | | 3.71 | % | | | 2.14 | % | | | (13.02 | )%(5) | |
| After fees waived | | | 0.47 | %(5) | | | 2.18 | % | | | 3.94 | % | | | 2.25 | % | | | 2.86 | %(5) | |
| Portfolio turnover rate | | | 14.01 | %(4) | | | 26.03 | % | | | 48.02 | % | | | 40.38 | % | | | 34.12 | %(4) | |
* Unaudited.
(1) Commencement of Operations.
(2) Based on average shares outstanding during the period.
(3) Amount represents less than $0.01 per share.
(4) Not annualized.
(5) Annualized.
(6) The Advisor has contractually agreed to limit the operating expenses of the Fund to 1.98%, excluding interest expense, expenses related to dividends on short positions, brokerage commissions, taxes and other extraordinary expenses. See Note 3.
The accompanying notes are an integral part of these financial statements.
53
FINANCIAL HIGHLIGHTS
For a capital share outstanding throughout the period
| | | Six Months
Ended | | Year Ended December 31, | |
| China & Hong Kong Fund | | June 30, 2010* | | 2009 | | 2008 | | 2007 | | 2006 | | 2005 | |
| Net asset value, beginning of period | | $ | 35.13 | | | $ | 18.98 | | | $ | 43.02 | | | $ | 26.48 | | | $ | 18.97 | | | $ | 18.57 | | |
| Income from investment operations: | |
| Net investment income | | | 0.20 | | | | 0.15 | | | | 0.68 | | | | 0.28 | | | | 0.43 | | | | 0.37 | | |
Net realized and unrealized gain (loss) on
investments and foreign currency | | | (3.45 | ) | | | 17.44 | | | | (24.13 | ) | | | 16.91 | | | | 7.09 | | | | 0.86 | | |
| Total from investment operations | | | (3.25 | ) | | | 17.59 | | | | (23.45 | ) | | | 17.19 | | | | 7.52 | | | | 1.23 | | |
| Less distributions: | |
| From net investment income | | | — | | | | (0.34 | ) | | | (0.53 | ) | | | (0.59 | ) | | | (0.01 | ) | | | (0.83 | ) | |
| From net realized gain | | | — | | | | (1.11 | ) | | | (0.07 | ) | | | (0.10 | ) | | | — | | | | — | | |
| Total distributions | | | — | | | | (1.45 | ) | | | (0.60 | ) | | | (0.69 | ) | | | (0.01 | ) | | | (0.83 | ) | |
| Redemption fee proceeds | | | 0.01 | | | | 0.01 | | | | 0.01 | | | | 0.04 | | | | — | (1) | | | — | (1) | |
| Net asset value, end of period | | $ | 31.89 | | | $ | 35.13 | | | $ | 18.98 | | | $ | 43.02 | | | $ | 26.48 | | | $ | 18.97 | | |
| Total return | | | (9.22 | )%(2) | | | 92.76 | % | | | (54.47 | )% | | | 65.06 | % | | | 39.65 | % | | | 6.61 | % | |
| Ratios/supplemental data: | |
| Net assets, end of period (millions) | | $ | 197.5 | | | $ | 241.0 | | | $ | 123.3 | | | $ | 293.2 | | | $ | 143.0 | | | $ | 111.0 | | |
| Ratio of expenses to average net assets | |
| Before fees waived | | | 1.46 | %(3) | | | 1.58 | % | | | 1.52 | % | | | 1.44 | % | | | 1.59 | % | | | 1.63 | % | |
| After fees waived | | | 1.46 | %(3) | | | 1.58 | % | | | 1.52 | % | | | 1.44 | % | | | 1.59 | % | | | 1.63 | % | |
| After fees waived excluding interest expense(4) | | | 1.45 | %(3) | | | 1.58 | % | | | 1.51 | % | | | 1.44 | % | | | 1.59 | % | | | 1.63 | % | |
| Ratio of net investment income to average net assets | | | 1.05 | %(3) | | | 0.62 | % | | | 2.22 | % | | | 1.17 | % | | | 2.01 | % | | | 1.74 | % | |
| Portfolio turnover rate | | | 4.31 | %(2) | | | 7.87 | % | | | 26.62 | % | | | 10.00 | % | | | 64.81 | % | | | 12.51 | % | |
* Unaudited.
(1) Amount represents less than $0.01 per share.
(2) Not annualized.
(3) Annualized.
(4) The Advisor has contractually agreed to limit the operating expenses of the Fund to 1.98%, excluding interest expense, expenses related to dividends on short positions, borkerage commissions, taxes and other extraordinary expenses. See Note 3.
The accompanying notes are an integral part of these financial statements.
54
FINANCIAL HIGHLIGHTS
For a capital share outstanding throughout the period
| | | Six Months
Ended | | Year Ended December 31, | |
| Global Energy Fund | | June 30, 2010* | | 2009 | | 2008 | | 2007 | | 2006 | | 2005 | |
| Net asset value, beginning of period | | $ | 25.60 | | | $ | 15.68 | | | $ | 31.86 | | | $ | 25.54 | | | $ | 24.62 | | | $ | 15.25 | | |
| Income from investment operations: | |
| Net investment income (loss) | | | 0.10 | | | | 0.11 | | | | 0.22 | | | | 0.05 | | | | 0.01 | | | | (0.02 | ) | |
Net realized and unrealized gain (loss) on
investments and foreign currency | | | (3.57 | ) | | | 9.80 | | | | (15.71 | ) | | | 9.50 | | | | 2.44 | | | | 9.75 | | |
| Total from investment operations | | | (3.47 | ) | | | 9.91 | | | | (15.49 | ) | | | 9.55 | | | | 2.45 | | | | 9.73 | | |
| Less distributions: | |
| From net investment income | | | — | | | | — | | | | — | | | | (0.27 | ) | | | (0.21 | ) | | | — | | |
| From net realized gain | | | — | | | | — | | | | (0.70 | ) | | | (2.96 | ) | | | (1.34 | ) | | | (0.39 | ) | |
| Total distributions | | | — | | | | — | | | | (0.70 | ) | | | (3.23 | ) | | | (1.55 | ) | | | (0.39 | ) | |
| Redemption fee proceeds | | | 0.01 | | | | 0.01 | | | | 0.01 | | | | — | (1) | | | 0.02 | | | | 0.03 | | |
| Net asset value, end of period | | $ | 22.14 | | | $ | 25.60 | | | $ | 15.68 | | | $ | 31.86 | | | $ | 25.54 | | | $ | 24.62 | | |
| Total return | | | (13.52 | )%(2) | | | 63.27 | % | | | (48.56 | )% | | | 37.25 | % | | | 9.85 | % | | | 63.92 | % | |
| Ratios/supplemental data: | |
| Net assets, end of period (millions) | | $ | 87.3 | | | $ | 75.4 | | | $ | 30.2 | | | $ | 69.7 | | | $ | 65.0 | | | $ | 98.7 | | |
| Ratio of expenses to average net assets: | |
| Before fees waived | | | 1.17 | %(3) | | | 1.42 | % | | | 1.31 | % | | | 1.37 | % | | | 1.45 | % | | | 1.50 | % | |
| After fees waived | | | 1.17 | %(3) | | | 1.42 | % | | | 1.31 | % | | | 1.37 | % | | | 1.45 | % | | | 1.45 | % | |
| After fees waived excluding interest expense(4) | | | 1.17 | %(3) | | | 1.42 | % | | | 1.30 | % | | | 1.35 | % | | | 1.41 | % | | | 1.42 | % | |
| Ratio of net investment income (loss) to average net assets: | |
| Before fees waived | | | 0.79 | %(3) | | | 0.82 | % | | | 0.76 | % | | | 0.22 | % | | | 0.04 | % | | | (0.24 | %) | |
| After fees waived | | | 0.79 | %(3) | | | 0.82 | % | | | 0.76 | % | | | 0.22 | % | | | 0.04 | % | | | (0.19 | %) | |
| Portfolio turnover rate | | | 15.28 | %(2) | | | 51.74 | % | | | 74.90 | % | | | 31.13 | % | | | 47.22 | % | | | 89.24 | % | |
* Unaudited
(1) Amount represents less than $0.01 per share.
(2) Not annualized.
(3) Annualized.
(4) The Advisor has contractually agreed to limit the operating expenses of the Fund to 1.45%, excluding interest expense, expenses related to dividends on short positions, brokerage commissions, taxes and other extraordinary expenses. See Note 3.
The accompanying notes are an integral part of these financial statements.
55
FINANCIAL HIGHLIGHTS
For a capital share outstanding throughout the period
| | | Six Months
Ended | | Year Ended December 31, | |
| Global Innovators Fund | | June 30, 2010* | | 2009 | | 2008 | | 2007 | | 2006 | | 2005 | |
| Net asset value, beginning of period | | $ | 16.24 | | | $ | 11.21 | | | $ | 21.68 | | | $ | 17.98 | | | $ | 15.14 | | | $ | 13.54 | | |
| Income from investment operations: | |
| Net investment income (loss) | | | — | (1) | | | (0.01 | ) | | | 0.62 | | | | 0.08 | | | | 0.01 | | | | (0.05 | ) | |
Net realized and unrealized gain (loss) on
investments | | | (1.67 | ) | | | 5.08 | | | | (10.48 | ) | | | 3.72 | | | | 2.83 | | | | 1.65 | | |
| Total from investment operations | | | (1.67 | ) | | | 5.07 | | | | (9.86 | ) | | | 3.80 | | | | 2.84 | | | | 1.60 | | |
| Less distributions: | |
| From net investment income | | | — | | | | — | | | | (0.61 | ) | | | (0.11 | ) | | | — | | | | — | | |
| Return of capital | | | — | | | | (0.04 | ) | | | — | | | | — | | | | — | | | | — | | |
| Total distributions | | | — | | | | (0.04 | ) | | | (0.61 | ) | | | (0.11 | ) | | | — | | | | — | | |
| Redemption fee proceeds | | | — | (1) | | | — | (1) | | | — | (1) | | | 0.01 | | | | — | (1) | | | — | (1) | |
| Net asset value, end of period | | $ | 14.57 | | | $ | 16.24 | | | $ | 11.21 | | | $ | 21.68 | | | $ | 17.98 | | | $ | 15.14 | | |
| Total return | | | (10.28 | )%(3) | | | 45.20 | % | | | (45.42 | )% | | | 21.17 | % | | | 18.76 | % | | | 11.82 | %(2) | |
| Ratios/supplemental data: | |
| Net assets, end of period (millions) | | $ | 32.4 | | | $ | 36.7 | | | $ | 29.6 | | | $ | 72.8 | | | $ | 39.3 | | | $ | 36.4 | | |
| Ratio of expenses to average net assets: | |
| Before fees waived/recaptured | | | 1.47 | %(4) | | | 1.69 | % | | | 1.40 | % | | | 1.44 | % | | | 1.64 | % | | | 1.66 | % | |
| After fees waived/recaptured | | | 1.55 | %(4) | | | 1.56 | % | | | 1.40 | % | | | 1.44 | % | | | 1.55 | % | | | 1.66 | %(2) | |
| After fees waived/recaptured excluding interest expense (5) | | | 1.55 | %(4) | | | 1.55 | % | | | 1.39 | % | | | 1.43 | % | | | 1.53 | % | | | 1.63 | %(2) | |
| Ratio of net investment income (loss) to average net assets: | |
| Before fees waived/recaptured | | | 0.09 | %(4) | | | (0.20 | )% | | | 3.07 | % | | | 0.49 | % | | | 0.00 | % | | | (0.32 | )% | |
| After fees waived/recaptured | | | 0.01 | %(4) | | | (0.07 | )% | | | 3.07 | % | | | 0.49 | % | | | 0.09 | % | | | (0.32 | )% | |
| Portfolio turnover rate | | | 14.97 | %(3) | | | 50.54 | % | | | 36.49 | % | | | 25.54 | % | | | 36.53 | % | | | 27.75 | % | |
* Unaudited
(1) Amount represents less than $0.01 per share.
(2) The Fund's total operating expense was limited to 1.88% from 4/23/03 to 10/31/05.
(3) Not annualized.
(4) Annualized.
(5) The Advisor has contractually agreed to limit the operating expenses of the Fund to 1.55%, excluding interest expense, expenses related to dividends on short positions, borkerage commissions, taxes and other extraordinary expenses. See Note 3.
The accompanying notes are an integral part of these financial statements.
56
NOTES TO FINANCIAL STATEMENTS (Unaudited)
Note 1
Organization
Guinness Atkinson Funds (the "Trust"), was organized on April 28, 1997 as a Delaware business trust and registered under the Investment Company Act of 1940, as amended (the "1940 Act"), as a non-diversified, open-end management investment company. Currently, the Trust offers six separate series: Guinness Atkinson Alternative Energy Fund (the "Alternative Energy Fund"), Guinness Atkinson Asia Focus Fund (the "Asia Focus Fund"), Guinness Atkinson Asia Pacific Dividend Fund (the "Asia Pacific Dividend Fund"), Guinness Atkinson China & Hong Kong Fund (the "China & Hong Kong Fund"), Guinness Atkinson Global Energy Fund (the "Global Energy Fund"), and Guinness Atkinson Global Innovators Fund (the "Global Innovators Fund"), all of which (each a "Fund" and collectively, the "Funds") are covered by this report. The China & Hong Kong Fund began operations on June 30, 1994, the Asia Focus Fund began operations on April 29, 1996, the Global Innovators Fund began operations on December 15, 1998, the Global Energy Fund began operations on June 30, 2004, and the Alternative Energy Fund and the Asia Pacific Dividend Fund began operations on March 31, 2006.
The Alternative Energy Fund and Asia Focus Fund's investment objective is long-term capital appreciation. The Asia Pacific Dividend Fund's investment objective is to provide investors with dividend income and long-tern capital growth. The China & Hong Kong Fund's investment objective is long-term capital appreciation primarily through investments in securities of China and Hong Kong. The Global Energy Fund and Global Innovators Fund's investment objective is long-term capital appreciation.
Note 2
Significant accounting policies
The following is a summary of significant accounting policies consistently followed by the Funds. These policies are in conformity with accounting principles generally accepted in the United States of America.
A. Security Valuation. Securities of the Funds that are traded on a principal exchange (U.S. or foreign) or NASDAQ are valued at the official closing price on each day that the exchanges are open for trading. Securities traded on an exchange for which there have been no sales, and other over-the-counter securities are valued at the mean between the bid and asked prices. Securities for which quotations are not readily available are valued at their respective fair values as determined in good faith by the Investment Advisor in accordance with procedures established by the Board of Trustees. In determining fair value, the Funds take into account all relevant factors and available information. Consequently, the price of the security used to calculate its Net Asset Value may differ from quoted or published prices for the same security. Fair value pricing inv olves subjective judgments and there is no single standard for determining a security's fair value. As a result, different mutual funds could reasonably arrive at different fair value for the same security. It is possible that the fair value determined for a security is materially different from the value that could be realized upon the sale of that security or from the values that other mutual funds may determine. Short-term investments are stated at cost, combined with accrued interest, which approximates market value. Realized gains and losses from securities transactions are calculated using the identified cost method.
Foreign securities are recorded in the financial statements after translation to U.S. dollars based on the applicable exchange rate at the end of the period. The Funds do not isolate that portion of the results of operations resulting from changes in the currency exchange rate from the fluctuations resulting from changes in the market prices of investments.
Foreign exchange gain or loss resulting from holding of a foreign currency, expiration of a currency exchange contract, difference in exchange rates between the trade date and settlement date of an investment purchased or sold, and the difference between dividends actually received compared to the amount shown in a Fund's accounting records on the date of receipt are shown as net realized gains or losses on foreign currency transactions in the respective Fund's statement of operations.
B. Forward Foreign Currency Exchange Contracts. The Funds may utilize forward foreign currency exchange contracts ("forward contracts") to hedge against foreign exchange fluctuations on foreign denominated investments under which they are obligated to exchange currencies at specific future dates and at specified rates. All commitments are "marked-to-market" daily and any resulting unrealized gains or losses are included as unrealized appreciation (depreciation) on foreign currency denominated assets and liabilities. The Funds record realized gains or losses at the time the forward contract is settled. Risks may arise upon entering these contracts from the potential inability of a counter party to meet the terms of their contracts and from unanticipated movements in the value of a foreign currency relative to the U.S. dollar or other currencies. Counterp arties to these contracts are major U.S. financial institutions. Please refer to Note 7 for further information on Forward Contracts in each Fund.
57
C. Restricted Securities. A restricted security cannot be resold to the general public without prior registration under the Securities Act of 1933. If the security is subsequently registered and resold, the issuers would typically bear the expense of all registrations at no cost to the Fund. Restricted securities are valued according to the guidelines and procedures adopted by the Funds' Board of Trustees.
D. Security Transactions, Dividend Income and Distributions. Security transactions are accounted for on the trade date. Dividend income and distributions to shareholders are recorded on the ex-dividend date. Realized gains and losses from securities transactions are calculated using the identified cost method.
E. Allocation of Expenses. Each Fund is charged for those expenses directly attributable to it. Expenses that are not directly attributable to a Fund are allocated among the Funds in proportion to their respective assets or another appropriate method.
F. Concentration of Risk. The Alternative Energy Fund invests substantially in the alternative energy or energy technology sectors. The Asia Focus Fund invests substantially all of its assets in the Asian continent. The Asia Pacific Dividend Fund invests primarily in dividend-producing equity securities of Asia Pacific companies. The China & Hong Kong Fund invests substantially all of its assets in securities that are traded in China or Hong Kong or that are issued by companies that do a substantial part of their business in China. The Global Energy Fund invests substantially in energy companies; the changes in the prices and supplies of oil and other energy fuels may affect the Funds' investments. The consequences of political, social, or economic changes in the countries or business sectors in which the securities are offered or the issuers conduc t their operations may affect the market prices of the Funds' investments and any income generated, as well as the Funds' ability to repatriate such amounts.
G. Use of Estimates. The preparation of financial statements in conformity with accounting principles generally accepted in the United States requires management to make estimates and assumptions that affect the reported amounts of assets and liabilities and the disclosure of contingent assets and liabilities at the date of the financial statements. Actual results could differ from those estimates.
H. Indemnifications. Under the Funds' organizational documents, its current and former officers and trustees are indemnified against certain liabilities arising out of the performance of their duties to the Funds. In addition, in the normal course of business, the Funds enter into contracts that contain a variety of representations and warranties that provide general indemnifications. The Funds' maximum exposure under these arrangements is unknown as this would involve future claims that may be made against the Funds that have not yet occurred or that would be covered by other parties.
I. Federal Income Taxes. The Funds intend to comply with the requirements of Subchapter M of the Internal Revenue Code applicable to regulated investment companies, and to distribute all of their taxable income to their shareholders. Therefore, no federal income tax provision is required.
The Funds recognize the tax benefits of uncertain tax positions only where the position is "more likely than not" to be sustained assuming examination by tax authorities. Management has analyzed the Funds' tax positions, and has concluded that no liability for unrecognized tax benefits should be recorded related to uncertain tax positions taken on returns filed for open tax years 2006 through 2008,or expected to be taken in the Funds' 2009 tax returns. The Funds' identify their major tax jurisdiction as U.S. Federal, California State and foreign jurisdictions where the Funds make significant investments; however the Funds are not aware of any tax positions for which there are reasonably possible that the total amounts of unrecognized tax benefits will change materially in the next twelve months.
Note 3
Investment Advisory and Other Agreements
The Trust, on behalf of each Fund, entered into an Investment Advisory Agreement with Guinness Atkinson Asset Management, Inc. (the "Advisor"), which provided the Funds with investment management services under an investment advisory agreement. The Advisor furnishes all investment advice, office space, facilities, and most of the personnel needed by the Funds. As
58
compensation for its services, the Advisor is entitled to a monthly fee at the following annual rates based upon the average daily net assets of the Funds:
| Alternative Energy Fund | | | 1.00 | % | |
| Asia Focus Fund | | | 1.00 | % | |
| Asia Pacific Dividend Fund | | | 1.00 | % | |
| China & Hong Kong Fund | | | 1.00 | % | |
| Global Energy Fund | | | 0.75 | % | |
| Global Innovators Fund | | | 0.75% on the 1st $500 million, 0.60% thereafter | | |
The Funds are responsible for their own operating expenses. The Advisor has contractually agreed to limit each Fund's total operating expenses (excluding interest, dividends on short positions, taxes and extraordinary expenses) by reducing all or a portion of their fees and reimbursing the Fund for expenses so that its ratio of expenses to average daily net assets will not exceed the following levels:
| Alternative Energy Fund | | | 1.98 | % | |
| Asia Focus Fund | | | 1.98 | % | |
| Asia Pacific Dividend Fund | | | 1.98 | % | |
| China & Hong Kong Fund | | | 1.98 | % | |
| Global Energy Fund | | | 1.45 | % | |
| Global Innovators Fund | | | 1.55 | % | |
The expense ratios shown in the financial highlights may exceed these levels due to expenses incurred, but not covered by the expense limitation agreement.
To the extent that the Advisor waives fees and/or absorbs expenses it may seek repayment of a portion or all of such amounts at any time within three fiscal years after the fiscal year in which such amounts were waived or absorbed, subject to the applicable cap. For the six months ended June 30, 2010, the Advisor waived fees of $26,416 in the Asia Pacific Dividend Fund and recaptured previously waived fees of $14,990 from the Global Innovators Fund.
At June 30, 2010, the Advisor may recapture a portion of the following amounts that had been paid and/or waived on behalf of the Funds no later than the dates as stated below:
| Funds | | December 31, 2010 | | December 31, 2011 | | December 31, 2012 | | December 31, 2013 | | Total | |
| Asia Pacific Dividend Fund | | $ | 7,946 | | | $ | 45,959 | | | $ | 73,950 | | | $ | 26,416 | | | $ | 154,271 | | |
| Global Innovators Fund | | | — | | | | — | | | $ | 25,912 | | | | | | | $ | 25,912 | | |
Mutual Fund Administration Corporation (the "Administrator") acts as the Funds' administrator under an administration agreement. The fees paid to the Administrator for the six months ended June 30, 2010 are reported on the Statements of Operations.
Quasar Distributors, LLC (the "Distributor") acts as the Funds' principal underwriter in a continuous public offering of the Funds' shares.
Foreside Compliance Services, LLC provides Chief Compliance Officer ("CCO") services to the Funds. The fees paid for CCO services for the six months ended June 30, 2010 are reported on the Statements of Operations.
On August 14, 1998, the Trust approved a Deferred Compensation Plan for Trustees (the "Plan"). Trustees can elect to receive payment in cash or defer payments provided for in the Plan. If a trustee elects to defer payment, the Plan provides for the creation of a deferred payment account (Phantom Share Account). This account accumulates the deferred fees earned, and the value of the account is adjusted at the end of each quarter to reflect the value that would have been earned if the account had been invested
59
in designated investments. The Funds recognize as trustee expense amounts accrued as meetings are attended plus the change in value of the Phantom Share Account.
The change in the value of the phantom share account during the six months ended June 30, 2010 is shown in the table below. These amounts included any additional contributions to the deferred compensation plan and any appreciation (depreciation) on the underlying investments.
| Alternative Energy Fund | | $ | (1,052 | ) | |
| Asia Focus Fund | | $ | (3,309 | ) | |
| Asia Pacific Dividend Fund | | $ | (528 | ) | |
| China & Hong Kong Fund | | $ | (6,541 | ) | |
| Global Energy Fund | | $ | (1,324 | ) | |
| Global Innovators Fund | | $ | (4,845 | ) | |
The fees paid to non-interested Trustees for the six months ended June 30, 2010 are reported on the Statements of Operations.
Certain officers of the Funds are also officers and/or Directors of the Advisor and the Administrator. None of these officers are compensated directly by the Funds.
During the six months ended June 30, 2010, the Adviser reimbursed the Asia Pacific Dividend Fund $3,561 for a trade error. This amount is reported on the Statements of Operations under the caption "Net increase from payments by affiliates". The reimbursement had no impact to the Fund's performance.
Note 4
Shareholder Servicing Plan
Each Fund has adopted a Shareholder Servicing Plan to pay a fee at an annual rate of up to 0.25% of its daily average net assets of shares serviced by shareholder servicing agents who provide administrative and support services to their customers.
The fees paid under the Shareholder Servicing Plan for the six months ended June 30, 2010 are reported on the Statements of Operations.
Note 5
Investment Transactions
The following table presents purchases and sales of securities during the six months ended June 30, 2010, excluding short-term investments, to indicate the volume of transactions in each Fund.
| Fund | | Purchases | | Sales | |
| Alternative Energy Fund | | $ | 6,596,422 | | | $ | 10,403,630 | | |
| Asia Focus Fund | | $ | 8,035,490 | | | $ | 59,539,382 | | |
| Asia Pacific Dividend Fund | | $ | 1,232,733 | | | $ | 6,785,942 | | |
| China & Hong Kong Fund | | $ | 9,736,698 | | | $ | 30,893,130 | | |
| Global Energy Fund | | $ | 43,583,802 | | | $ | 13,602,994 | | |
| Global Innovators Fund | | $ | 5,464,883 | | | $ | 6,271,963 | | |
The Funds did not purchase U.S. Government securities as a part of the long-term investment strategy during the six months ended June 30, 2010.
60
Note 6
Fair Value Measurements and Disclosures
The Funds utilize various inputs in determining the value of its investments. These inputs are summarized in the three broad levels listed below:
Level 1 — Unadjusted quoted prices in active markets for identical assets or liabilities that a Fund has the ability to access.
Level 2 — Observable inputs other than quoted prices included in level 1 that are observable for the asset or liability, either directly or indirectly. These inputs may include quoted prices for the identical instrument on an inactive market, prices for similar instruments, interest rates, prepayment speeds, credit risk, yield curves, default rates and similar data.
Level 3 — Unobservable inputs for the asset or liability, to the extent relevant observable inputs are not available, representing the Fund's own assumptions about the assumptions a market participant would use in valuing the asset or liability, and would be based on the best information available.
The inputs or methodology used for valuing securities are not an indication of the risk associated with investing in those securities. The following is a summary of the inputs used, as of June 30, 2010, in valuing the Funds' assets carried at fair value:
| Alternative Energy Fund | |
| Assets Table | | Level 1 | | Level 2 | | Level 3 | | Total | |
| Investments, at Value | |
| Common Stocks: | |
| Energy | | $ | 6,034,158 | | | $ | 4,030,898 | | | $ | — | | | $ | 10,065,056 | | |
| Industrial | | | 11,604,687 | | | | 6,529,640 | | | | — | | | | 18,134,327 | | |
| Technology | | | 1,794,842 | | | | 4,540,871 | | | | — | | | | 6,335,713 | | |
| Utilities | | | 3,293,081 | | | | 1,179,105 | | | | — | | | | 4,472,186 | | |
| Convertible Bonds: | |
| Industrial | | | — | | | | — | | | | 595,568 | | | | 595,568 | | |
| Total Investments, at Value | | | 22,726,768 | | | | 16,280,514 | | | | 595,568 | | | | 39,602,850 | | |
| Other Financial Instruments* | | | — | | | | — | | | | — | | | | — | | |
| Total Assets | | $ | 22,726,768 | | | $ | 16,280,514 | | | $ | 595,568 | | | $ | 39,602,850 | | |
Following is a reconciliation of Level 3 assets for which significant unobservable inputs were used to determine fair value.
| Alternative Energy Fund | | Investments,
at value | | Other Financial
Instruments* | |
| Balance as of 12/31/09 | | $ | 397,810 | | | $ | — | | |
| Realized gain (loss) | | | — | | | | — | | |
| Change in unrealized appreciation (depreciation) | | | 197,758 | | | | — | | |
| Net purchases (sales) | | | — | | | | — | | |
| Transfers in and/or out of Level 3 | | | — | | | | — | | |
| Balance as of 06/30/10 | | | 595,568 | | | | — | | |
Net change in unrealized appreciation/(depreciation)
on Level 3 investments held as of 6/30/10* | | $ | 197,758 | | | $ | — | | |
* Included in the related amounts on the Statements of Operations
61
| Asia Focus Fund | |
| Assets Table | | Level 1 | | Level 2 | | Level 3 | | Total | |
| Investments, at Value | |
| Common Stocks: | |
| Basic Materials | | $ | — | | | $ | 6,812,463 | | | $ | — | | | $ | 6,812,463 | | |
| Communications | | | 1,173,871 | | | | 3,564,074 | | | | — | | | | 4,737,945 | | |
| Consumer, Cyclical | | | — | | | | 5,080,488 | | | | — | | | | 5,080,488 | | |
| Consumer, Non-cyclical | | | — | | | | 2,637,588 | | | | — | | | | 2,637,588 | | |
| Energy | | | — | | | | 11,251,609 | | | | — | | | | 11,251,609 | | |
| Exchange Traded Funds ("ETFs") | | | — | | | | 1,161,318 | | | | — | | | | 1,161,318 | | |
| Financial | | | — | | | | 1,184,194 | | | | — | | | | 1,184,194 | | |
| Industrial | | | — | | | | 4,647,316 | | | | — | | | | 4,647,316 | | |
| Technology | | | 593,640 | | | | 7,859,042 | | | | — | | | | 8,452,682 | | |
| Utilities | | | — | | | | 1,521,725 | | | | — | | | | 1,521,725 | | |
| Rights & Warrants: | |
| Basic Materials | | | 11,276 | | | | — | | | | — | | | | 11,276 | | |
| Consumer, Non-cyclical | | | 52,645 | | | | — | | | | — | | | | 52,645 | | |
| Total Investments, at Value | | | | | | | 1,831,432 | | | | 45,719,817 | | | | 47,551,249 | | |
| Other Financial Instruments* | | | — | | | | — | | | | — | | | | — | | |
| Total Assets | | $ | 1,831,432 | | | $ | 45,719,817 | | | $ | — | | | $ | 47,551,249 | | |
| Asia Pacific Dividend Fund | |
| Assets Table | | Level 1 | | Level 2 | | Level 3 | | Total | |
| Investments, at Value | |
| Common Stocks: | |
| Basic Materials | | $ | 185,974 | | | $ | 799,395 | | | $ | — | | | $ | 985,369 | | |
| Communications | | | — | | | | 754,835 | | | | — | | | | 754,835 | | |
| Consumer, Cyclical | | | — | | | | 368,999 | | | | — | | | | 368,999 | | |
| Consumer, Non-cyclical | | | — | | | | 488,329 | | | | — | | | | 488,329 | | |
| Energy | | | 171,179 | | | | 342,838 | | | | — | | | | 514,017 | | |
| Financial | | | 178,895 | | | | 693,303 | | | | — | | | | 872,198 | | |
| Industrial | | | — | | | | 433,930 | | | | — | | | | 433,930 | | |
| Technology | | | 111,162 | | | | 719,381 | | | | — | | | | 830,543 | | |
| Utilities | | | — | | | | 356,387 | | | | — | | | | 356,387 | | |
| Total Investments, at Value | | | 647,210 | | | | 4,957,397 | | | | — | | | | 5,604,607 | | |
| Other Financial Instruments* | | | — | | | | — | | | | — | | | | — | | |
| Total Assets | | $ | 647,210 | | | $ | 4,957,397 | | | $ | — | | | $ | 5,604,607 | | |
62
| China & Hong Kong Fund | |
| Assets Table | | Level 1 | | Level 2 | | Level 3 | | Total | |
| Investments, at Value | |
| Common Stocks: | |
| Basic Materials | | $ | 48,927 | | | $ | 13,335,365 | | | $ | — | | | $ | 13,384,292 | | |
| Communications | | | 8,848,163 | | | | 19,466,859 | | | | — | | | | 28,315,022 | | |
| Consumer, Cyclical | | | — | | | | 36,565,537 | | | | — | | | | 36,565,537 | | |
| Consumer, Non-cyclical | | | 139,527 | | | | 6,913,538 | | | | — | | | | 7,053,065 | | |
| Energy | | | 3,722,112 | | | | 30,982,316 | | | | — | | | | 34,704,428 | | |
| Exchange Traded Funds ("ETFs") | | | — | | | | 6,064,009 | | | | — | | | | 6,064,009 | | |
| Financial | | | — | | | | 38,493,874 | | | | — | | | | 38,493,874 | | |
| Industrial | | | — | | | | 17,008,677 | | | | — | | | | 17,008,677 | | |
| Technology | | | 3,049,476 | | | | 4,995,859 | | | | — | | | | 8,045,335 | | |
| Utilities | | | — | | | | 7,015,780 | | | | — | | | | 7,015,780 | | |
| Total Investments, at Value | | | 15,808,205 | | | | 180,841,814 | | | | — | | | | 196,650,019 | | |
| Other Financial Instruments* | | | — | | | | — | | | | — | | | | — | | |
| Total Assets | | $ | 15,808,205 | | | $ | 180,841,814 | | | $ | — | | | $ | 196,650,019 | | |
| Global Energy Fund | |
| Assets Table | | Level 1 | | Level 2 | | Level 3 | | Total | |
| Investments, at Value | |
| Common Stocks | | | | | | | | | | | | | | | | | |
| Energy | | $ | 64,856,804 | | | $ | 22,090,498 | | | $ | — | | | $ | 86,947,302 | | |
| Industrial | | | — | | | | 82,206 | | | | — | | | | 82,206 | | |
| Total Investments, at Value | | | 64,856,804 | | | | 22,172,704 | | | | — | | | | 87,029,508 | | |
| Other Financial Instruments* | | | — | | | | — | | | | — | | | | — | | |
| Total Assets | | $ | 64,856,804 | | | $ | 22,172,704 | | | $ | — | | | $ | 87,029,508 | | |
63
| Global Innovators Fund | |
| Assets Table | | Level 1 | | Level 2 | | Level 3 | | Total | |
| Investments, at Value | |
| Common Stocks: | | | | | | | | | | | | | | | | | |
| Communications | | $ | 8,938,725 | | | $ | — | | | $ | — | | | $ | 8,938,725 | | |
| Consumer, Cyclical | | | 4,686,887 | | | | — | | | | 4,686,887 | | | | | | |
| Energy | | | 1,227,111 | | | | — | | | | — | | | | 1,227,111 | | |
| Financial | | | 5,342,369 | | | | — | | | | — | | | | 5,342,369 | | |
| Industrial | | | 2,325,656 | | | | — | | | | — | | | | 2,325,656 | | |
| Technology | | | 8,145,262 | | | | 1,248,257 | | | | — | | | | 9,393,519 | | |
| Total Investments, at Value | | | 30,666,010 | | | | 1,248,257 | | | | — | | | | 31,914,267 | | |
| Other Financial Instruments* | | | — | | | | — | | | | — | | | | — | | |
| Total Assets | | $ | 30,666,010 | | | $ | 1,248,257 | | | $ | — | | | $ | 31,914,267 | | |
* Other financial instruments are not reflected in the Schedule of Investments, such as foreign currency exchange contracts which are valued at the unrealized appreciation/depreciation on the investments.
Note 7
Derivatives and Hedging Transactions
FASB Accounting Standards Codification 815, Derivatives and Hedging requires enhanced disclosures about the Funds' derivative and hedging activities, including how such activities are accounted for and their effects on the Funds' financial position, performance and cash flows.
Forward Foreign Currency Contracts
In order to hedge their portfolio and to protect them against possible fluctuations in foreign exchange rates pending the settlement of securities transactions, the Funds may enter into forward currency contracts which obligate them to exchange currencies at specified future dates. At the maturity of a forward contract, the Funds may either make delivery of the foreign currency from currency held, if any, or from the proceeds of the portfolio securities sold. It may also terminate its obligation to deliver the foreign currency at any time by purchasing an offsetting contract. The forward value of amounts due are netted against the forward value of the currency to be delivered, and the net amount is shown as a receivable or payable in the financial statements. The Funds did not have any outstanding forward contracts as of June 30, 2010.
Note 8
Tax Matters
As of June 30, 2010, the tax basis of investments were as follows:
| | Alternative
Energy Fund | | Asia Focus
Fund | | Asia Pacific
Dividend
Fund | | China &
Hong Kong
Fund | | Global
Energy
Fund | | Global
Innovators
Fund | |
| Cost of investments for tax purposes | | $ | 73,383,599 | | | $ | 43,826,058 | | | $ | 6,377,224 | | | $ | 160,074,322 | | | $ | 96,795,719 | | | $ | 47,811,888 | | |
| Gross tax unrealized appreciation | | | 4,069,470 | | | | 7,265,949 | | | | 315,094 | | | | 59,344,026 | | | | 4,601,750 | | | | 985,424 | | |
| Gross tax unrealized (depreciation) | | | (37,850,219 | ) | | | (3,540,758 | ) | | | (1,087,711 | ) | | | (22,768,329 | ) | | | (14,367,961 | ) | | | (16,883,045 | ) | |
Net tax unrealized appreciation
(depreciation) on investments* | | $ | (33,780,749 | ) | | $ | 3,725,191 | | | $ | (772,617 | ) | | $ | 36,575,697 | | | $ | (9,766,211 | ) | | $ | (15,897,621 | ) | |
* The differences between book-basis and tax-basis unrealized appreciation/(depreciation) is attributable primary to the tax deferral of losses on wash sales and passive foreign investment company (PFIC) mark to market adjustments.
64
As of December 31, 2009, the Funds have the following capital loss carryforwards available to offset future realized capital gains:
Capital losses
expiring in: | | Alternative
Energy Fund | | Asia Focus
Fund | | Asia Pacific
Dividend
Fund | | China &
Hong Kong
Fund | | Global
Energy
Fund | | Global
Innovators
Fund | |
| | 2010 | | | $ | — | | | $ | 395,317 | | | $ | — | | | $ | 364,169 | | | $ | — | | | $ | 19,915,748 | | |
| | 2011 | | | | — | | | | — | | | | — | | | | — | | | | — | | | | 8,376,172 | | |
| | 2012 | | | | — | | | | — | | | | — | | | | — | | | | — | | | | 4,814,343 | | |
| | 2013 | | | | — | | | | — | | | | — | | | | — | | | | — | | | | — | | |
| | 2014 | | | | — | | | | — | | | | — | | | | — | | | | — | | | | — | | |
| | 2015 | | | | — | | | | — | | | | — | | | | — | | | | — | | | | — | | |
| | 2016 | | | | 10,370,865 | | | | — | | | | 1,321,324 | | | | — | | | | — | | | | — | | |
| | 2017 | | | | 40,533,705 | | | | — | | | | 1,115,940 | | | | — | | | | 1,158,130 | | | | — | | |
| | Total | | | $ | 50,904,570 | | | $ | 395,317 | | | $ | 2,437,264 | | | $ | 364,169 | | | $ | 1,158,130 | | | $ | 33,106,263 | | |
For the China & Hong Kong Fund, the $364,169 capital loss carryover related to the acquisition of the Investec Mainland China Fund on April 23, 2003.
The tax character of distributions (other than return of capital dividends) paid during 2009 and 2008 fiscal years are as follows:
| | | 2009 | | 2008 | |
| | | Ordinary
Income | | Long-term
Capital Gain | | Ordinary
Income | | Long-term
Capital Gain | |
| Alternative Energy Fund | | $ | — | | | $ | — | | | $ | 3,265,473 | | | $ | — | | |
| Asia Focus Fund | | | 513,961 | | | | — | | | | 1,481,421 | | | | — | | |
| Asia Pacific Dividend Fund | | | 171,895 | | | | — | | | | 1,026,186 | | | | 130,652 | | |
| China & Hong Kong Fund | | | 2,242,023 | | | | 7,314,500 | | | | 3,332,293 | | | | 477,128 | | |
| Global Energy Fund | | | — | | | | — | | | | — | | | | 1,305,040 | | |
| Global Innovators Fund | | | — | | | | — | | | | 1,527,390 | | | | — | | |
Note 9
Events Subsequent to the Fiscal Period End
The Funds have adopted financial reporting rules regarding subsequent events which requires an entity to recognize in the financial statements the effects of all subsequent events that provide additional evidence about conditions that existed at the date of the balance sheet. Management has evaluated the Funds' related events and transactions and has determined that there were no events or transactions that occurred that would materially impact the amounts or disclosures in the Funds' financial statements.
65
Additional Information (Unaudited)
Proxy Voting Procedures
The Advisor of the Funds votes proxies relating to portfolio securities in accordance with procedures that have been approved by the Board. You may obtain a description of these procedures, free of charge, by calling "toll-free" 1-800-915-6565. This information is also available through the Securities and Exchange Commission's website at http://www.sec.gov.
Proxy Voting Records
Information regarding how the advisor of the Funds voted proxies relating to portfolio securities during the latest 12-month period ended June 30 is available, without charge, by calling toll-free, 1-800-915-6565. This information is also available through the Securities and Exchange Commission's website at http://www.sec.gov.
Form N-Q Disclosure
The Funds file their complete schedule of portfolio holdings with the Securities and Exchange Commission for the first and third quarters of each fiscal year on Form N-Q. The Funds' Form N-Q is available on the Securities and Exchange Commission's website at http://www.sec.gov. The Funds' Form N-Q may be reviewed and copied at the Commission's Public Reference Room in Washington, DC, and information on the operation of the Public Reference Room may be obtained by calling 1-800-SEC-0330. This information is also available, without charge, by calling toll-free, 1-800-915-6565.
Board Consideration of and Continuation of the Trust's Investment Advisory Agreement
At an in-person meeting held on May 24, 2010, the Board of Trustees (the "Trustees" or the "Board") of the Trust considered the annual approval of the continuation of the investment advisory agreement (the "Agreement") between the Trust, on behalf of the Alternative Energy Fund, the Asia Focus Fund, Asia Pacific Dividend Fund, the China & Hong Kong Fund, the Global Energy Fund and the Global Innovators Fund, and the Advisor.
At the meeting, the Trustees discussed with counsel to the Trust and independent legal counsel to the Trustees who are not "interested persons" (as defined by the 1940 Act), of the Trust (the "Independent Trustees"), their fiduciary duties under the 1940 Act in reviewing the Agreement and their obligation to obtain and review information relevant and necessary to their consideration of the Agreement. The Trustees received a memorandum summarizing the Trustees' duties under, and the fiduciary standards established by the 1940 Act and state law, legislative and regulatory guidance, and judicial precedent with respect to evaluating the reasonableness of fees and interpretation of the applicable fiduciary standards. In their deliberations, the Trustees considered the factors summarized below, and in approving the continuation of the Agreement with respect to each Fund, the Trustees did not identify any single factor, or information provided with respect to any single factor, as controlling. The Trustees evaluated all information available to them on a Fund-by-Fund basis, and their determinations were made separately with respect to each Fund.
Nature, Extent and of Quality of Services. The Board discussed the fees payable by each Fund under the Agreement, the services provided by the Advisor to each Fund, and the Trustees considered that they receive from the Advisor and review on a regular basis over the course of the year, information regarding each Fund's performance, including information about Fund performance in comparison to peers and benchmarks and analyses by the Advisor of Fund performance. The Trustees also considered information about the nature, extent and quality of the services provided by the Advisor, including the background and experience of the Advisor's senior management and portfolio managers, and their special knowledge about the areas in which the Funds invest. The Trustees also considered information gained from their experience as Trustees of the Funds, in addition to the overal l reputation and capabilities of the Advisor and its investment professionals, the Advisor's commitment to providing high quality services to the Funds, the Trustees' overall confidence in the Advisor's integrity and responsiveness to Trustee concerns, the Advisor's integrity as reflected in its adherence to compliance practices, and the Advisor's willingness and initiative in implementing changes designed to improve services to the Funds or reduce Fund expenses. The Trustees considered the impact of current market conditions on each Fund and the Fund complex. The Trustees also considered the general market performance in the prior year across market sectors and specifically in respect of each Fund's specific sector or region focus, including the particular challenges or strengths of the markets in responding to global market events during the period.
Fund Performances, Advisory Fees and Expenses. The Trustees reviewed the performance and expense information of each Fund compiled from Morningstar, Inc. data. The Trustees considered that they receive from the Advisor and review on a regular basis over the course of the year, information regarding the Funds' performance, including information about the Funds' performance in comparison to peers and benchmarks and analyses by the Advisor of the Funds' performance. The Trustees also considered the Advisor's continuing efforts to improve the Funds' performance and noting the Funds' performance has improved in the past year. The Trustees also considered each Fund's performance, advisory fee and expenses compared with its peer group.
66
The Trustees also considered the size of each Fund in comparison to its peers, including whether peer funds were part of a larger fund complex. The Trustees also considered the fee charged to one other account managed by the Advisor in a similar investment styles, and noted that the account was not subject to the same regulatory constraints as the Funds and did not offer daily transactions. With respect to each Fund, the Trustees made the following conclusions:
Alternative Energy Fund. (1) The Alternative Energy Fund's advisory fee was slightly higher than the median fees charged to comparable mutual funds in the Morningstar "Equity Energy" category, but the Trustees recognized the Fund's unique sector and that the fee would be below the median if compared strictly to the three pure alternative energy funds; (2) higher total expenses were attributable to the Fund's smaller size compared to its peer group; (3) Advisor was willing to limit the Fund's expense ratio through June 30, 2011, which would provide stability to the Fund's expenses during that period; and (4) the Fund's total return had outperformed one of its two benchmark indices for the one-year period, but had underperformed its other benchmark and its peers for the one-year and three-year periods.
Asia Focus Fund. (1) The Asia Focus Fund's advisory fee was slightly below the median fees charged to comparable mutual funds in the Morningstar "Pacific/Asia Ex-Japan Stock" category; (2) the Fund's higher total expenses were attributable to the Fund's relatively smaller size compared to its peer group; (3) the Advisor was willing to limit the Fund's expense ratio through June 30, 2011, which would provide stability to the Fund's expenses during that period; and (4) the Fund's total return had outperformed its benchmark index and peer funds for the one-year period, but had underperformed its benchmark and peers for longer periods.
Asia Pacific Dividend Fund. (1) The Asia Pacific Dividend Fund's advisory fee was slightly below the median fees charged to comparable mutual funds in the Morningstar "Pacific/Asia Ex-Japan Stock" category; (2) the Fund's higher total expenses were attributable to the Fund's relatively smaller size compared to its peer group; (3) the Advisor was willing to limit the Fund's expense ratio through June 30, 2011, which would provide stability to the Fund's expenses during that period; and (4) the Fund's total return had outperformed its benchmark index and peers for the one-year period, but had underperformed both measures for the three-year period.
China & Hong Kong Fund. (1) The China & Hong Kong Fund's advisory fee was slightly above the median but within the range of fees charged to comparable mutual funds in the Morningstar "Pacific/Asia Ex-Japan Stock" category; (2) the Fund's total expenses were also within the range of expenses incurred by its peers; (3) the Advisor was willing to limit the Fund's expense ratio through June 30, 2011, which would provide stability to the Fund's expenses during that period; and (4) the Fund's total return had outperformed its benchmark indices for all the periods reviewed, had outperformed its peers for the one-year, three-year, and five-year periods, but had underperformed its peers for the ten-year period.
Global Energy Fund. (1) The Global Energy Fund's advisory fee was slightly below the median fees charged to comparable mutual funds in the Morningstar's "Equity Energy" category; (2) the Fund's total expenses were equal to the median and slightly higher than the average of expenses incurred by the funds in its peer group; (3) the Advisor was willing to limit the Fund's expense ratio through June 30, 2011, which would provide stability to the Fund's expenses during that period; and (4) the Fund's total return had outperformed its benchmark index and its peers for the one-year, five-year, and ten-year periods.
Global Innovators Fund. (1) The Global Innovators Fund's advisory fee was equal to the median fees charged to comparable mutual funds in the Morningstar "Large Growth" category; (2) the Fund's total expenses were higher than the range of expenses incurred by the funds in its peer group; (3) the Advisor was willing to limit the Fund's expense ratio through June 30, 2011, which would provide stability to the Fund's expenses during that period; and (4) the Fund's total return had outperformed its benchmark index and peers for the one-year, three year and five-year periods, but had underperformed both measures for the ten-year period.
Costs of Services and Profitability. The Trustees considered the financial information provided by the Advisor, including the profitability of each Fund to the Advisor, the Advisor's profitability in general and the firm's retention of key personnel, including the addition of personnel with relevant portfolio management experience to the portfolio management team. The Board concluded that the profitability of each Fund to the Adviser, when positive, was not unreasonable.
Economies of Scale. The Trustees considered the size of each Fund and the Advisor's willingness to institute breakpoints in the advisory fee as individual funds reached higher asset levels.
After considering the factors described above, the Board and the independent Trustees separately determined that the overall arrangement fees between the Funds and the Advisor was fair and reasonable and that continuance of the Agreement was in the best interests of each Fund and its shareholders.
67
Privacy Notice
Guinness Atkinson Funds and Guinness Atkinson Asset Management, Inc. may collect non-public information about you from the following sources:
• Information we receive about you on applications or other forms;
• Information you give us orally; and
• Information about your transactions with us.
We do not disclose any non-public personal information about our shareholders or former shareholders without the shareholder's authorization, except as required by law or in response to inquiries from governmental authorities. We restrict access to your personal and account information to those employees who need to know that information to provide products and services to you. We also may disclose that information to unaffiliated third parties (such as to brokers or custodians) only as permitted by law and only as needed for us to provide agreed services to you. We maintain physical, electronic and procedural safeguards to guard your non-public personal information.
68
This page is Intentionally Left Blank
69
This page is Intentionally Left Blank
70
Guinness Atkinson Funds Information
Board of Trustees
| J. Brooks Reece, Jr., Chairman | |
|
| Dr. Gunter Dufey | |
|
| James I. Fordwood | |
|
| Timothy W.N. Guinness | |
|
| Dr. Bret A. Herscher | |
|
Contact Guinness Atkinson Funds
| P.O. Box 701 | |
|
| Milwaukee, WI 53201-0701 | |
|
| Shareholder Services: 800-915-6566 | |
|
| Literature Request: 800-915-6565 | |
|
| Website: www.gafunds.com | |
|
| Email: mail@gafunds.com | |
|
| Guinness Atkinson Funds | |
| Fund | | Cusip | | Ticker | | Fund# | |
| Alternative Energy Fund | | | 402031 50 4 | | | GAAEX | | | 1298 | | |
| Asia Focus Fund | | | 402031 10 8 | | | IASMX | | | 1096 | | |
| Asia Pacific Dividend Fund | | | 402031 60 3 | | | GAADX | | | 1299 | | |
| China & Hong Kong Fund | | | 402031 20 7 | | | ICHKX | | | 1094 | | |
| Global Energy Fund | | | 402031 40 5 | | | GAGEX | | | 1098 | | |
| Global Innovators Fund | | | 402031 30 6 | | | IWIRX | | | 1095 | | |
Distributed by Quasar Distributors, LLC, Milwaukee, WI 53202
This report is intended for shareholders of the Guinness Atkinson Funds and may not be used as literature unless preceded or accompanied by a current prospectus.
71
Guinness Atkinson Funds
c/o U.S. Bancorp Fund Services, LLC
P.O. Box 701
Milwaukee, WI 53201-0701
123S0204--P
Item 2. Code of Ethics.
Not applicable for semi-annual reports.
Item 3. Audit Committee Financial Expert.
Not applicable for semi-annual reports.
Item 4. Principal Accountant Fees and Services.
Not applicable for semi-annual reports.
Item 5. Audit Committee of Listed Registrants.
Not applicable to registrants who are not listed issuers (as defined in Rule 10A-3 under the Securities Exchange Act of 1934).
Item 6. Schedule of Investments.
(a) Schedule of Investments is included as part of the report to shareholders filed under Item 1 of this Form.
(b) Not Applicable.
Item 7. Disclosure of Proxy Voting Policies and Procedures for Closed-End Management Investment Companies.
Not Applicable.
Item 8. Portfolio Managers of Closed-End Management Investment Companies.
Not Applicable.
Item 9. Purchases of Equity Securities by Closed-End Management Investment Company and Affiliated Purchasers.
Not Applicable.
Item 10. Submission of Matters to a Vote of Security Holders.
The registrant has not made any material changes to the procedures by which shareholders may recommend nominees to the registrant’s Board of Trustees.
Item 11. Controls and Procedures.
(a) The registrant’s principal executive officer and principal financial officer have evaluated the registrant’s disclosure controls and procedures within 90 days of this filing and have concluded based on such evaluation that the registrant’s disclosure controls and procedures were effective, as of that date, in ensuring that information required to be disclosed by the registrant in this Form N-CSR was recorded, processed, summarized, and reported within the time periods specified in the Securities and Exchange Commission’s rules and forms.
(b) There were no changes in the registrant’s internal control over financial reporting (as defined in Rule 30a-3(d) under the Investment Company Act of 1940) that occurred during the registrant’s last fiscal quarter that have materially affected, or are reasonably likely to materially affect, the registrant’s internal control over financial reporting.
Item 12. Exhibits.
(a) (1) Any code of ethics or amendment thereto, that is subject of the disclosure required by Item 2, to the extent that the registrant intends to satisfy Item 2 requirements through filing an exhibit. Not applicable for semi-annual report.
(2) Certifications pursuant to Section 302 of the Sarbanes-Oxley Act of 2002. Filed herewith.
(3) Any written solicitation to purchase securities under Rule 23c-1 under the Act sent or given during the period covered by the report by or on behalf of the registrant to 10 or more persons. Not applicable to open-end investment companies.
(b) Certification pursuant to Section 906 of the Sarbanes-Oxley Act of 2002. Filed herewith.
SIGNATURES
Pursuant to the requirements of the Securities Exchange Act of 1934 and the Investment Company Act of 1940, the registrant has duly caused this report to be signed on its behalf by the undersigned, thereunto duly authorized.
(Registrant) Guinness Atkinson Funds
By | /s/ James J. Atkinson | |
Name: James J. Atkinson | |
Title: President | |
Date: September 7, 2010 | |
Pursuant to the requirements of the Securities Exchange Act of 1934 and the Investment Company Act of 1940, this report has been signed by the following persons on behalf of the registrant and in the capacities and on the dates indicated.
By | /s/ James J. Atkinson | |
Name: James J. Atkinson | |
Title: President | |
Date: September 7, 2010 | |
| |
| |
By | /s/ Rita Dam | |
Name: Rita Dam | |
Title: Treasurer | |
Date: September 7, 2010 | |