UNITED STATES
SECURITIES AND EXCHANGE COMMISSION
Washington, D.C. 20549
FORM N-CSR
CERTIFIED SHAREHOLDER REPORT OF REGISTERED
MANAGEMENT INVESTMENT COMPANIES
Investment Company Act file number | 811-08360 |
|
GUINNESS ATKINSON FUNDS |
(Exact name of registrant as specified in charter) |
|
21550 Oxnard Street, Suite 850 Woodland Hills, CA | | 91367 |
(Address of principal executive offices) | | (Zip code) |
|
James J. Atkinson, Jr. 21550 Oxnard Street, Suite 850 Woodland Hills, CA 91367 |
(Name and address of agent for service) |
|
Registrant’s telephone number, including area code: | (800-915-6566) | |
|
Date of fiscal year end: | December 31 | |
|
Date of reporting period: | December 31, 2013 | |
| | | | | | | | |
Item 1. Reports to Stockholders.
The registrant’s annual report transmitted to shareholders pursuant to Rule 30e-1 under the Investment Company Act of 1940, as amended (the “Investment Company Act”), is as follows:
2
Guinness AtkinsonTM Funds
Annual Report
December 31, 2013
TABLE OF CONTENTS
| | 5 | | | Letter to Shareholders | |
| | 7 | | | Expense Example | |
| | 8 | | | Alternative Energy Fund | |
| | 16 | | | Asia Focus Fund | |
| | 22 | | | Asia Pacific Dividend Fund | |
| | 28 | | | China & Hong Kong Fund | |
| | 34 | | | Global Energy Fund | |
| | 42 | | | Global Innovators Fund | |
| | 49 | | | Inflation Managed Dividend FundTM | |
| | 57 | | | Renminbi Yuan & Bond Fund | |
| | 63 | | | Statements of Assets and Liabilities | |
| | 65 | | | Statements of Operations | |
| | 67 | | | Statements of Changes in Net Assets | |
| | 70 | | | Financial Highlights | |
| | 78 | | | Notes to Financial Statements | |
| | 91 | | | Report of Independent Registered Public Accounting Firm | |
| | 92 | | | Trustee and Officer Information | |
| | 95 | | | Privacy Notice | |
| | 99 | | | Guinness Atkinson Funds Information | |
3
The table below provides total return data for each of the Funds over the one, three, five, ten and from inception periods through December 31, 2013. Also included in the table is the expense ratio data from the most recent prospectus dated May 1, 2013.
Fund (inception date) | | 1-year | | 3-year | | 5-year | | 10-year | | From Inception | | Expense Ratio | |
Alternative Energy Fund (March 31, 2006) | | | 61.54 | % | | | -7.66 | % | | | -3.88 | % | | | — | | | | -12.20 | % | | 2.32% gross; 2.02% net† | |
Asia Focus (April 29, 1996) | | | -10.38 | % | | | -6.92 | % | | | 12.56 | % | | | 7.36 | % | | | 2.58 | % | | 1.71% | |
Asia Pacific Dividend Fund (March 31, 2006) | | | -2.06 | % | | | 1.30 | % | | | 16.20 | % | | | — | | | | 4.70 | % | | 3.57% gross; 1.98% net† | |
China & Hong Kong (June 30, 1994) | | | 6.45 | % | | | -4.07 | % | | | 14.45 | % | | | 9.44 | % | | | 7.68 | % | | 1.52% | |
Global Energy Fund (June 30, 2004) | | | 24.48 | % | | | 3.83 | % | | | 16.34 | % | | | — | | | | 13.41 | % | | 1.35% | |
Global Innovators Fund (December 15, 1998) | | | 45.29 | % | | | 17.66 | % | | | 22.57 | % | | | 10.42 | % | | | 7.09 | % | | 1.51% | |
Inflation Managed Dividend FundTM (March 30, 2012) | | | 29.77 | % | | | — | | | | — | | | | — | | | | 19.24 | % | | 7.05% gross; 0.68% net† | |
Renminbi Yuan & Bond Fund (June 30, 2011) | | | 5.26 | % | | | — | | | | — | | | | — | | | | 3.70 | % | | 0.90% | |
Periods of greater than one year are average annualized returns; one year and shorter period returns are actual returns. All returns are for the periods ending December 31, 2013.
Performance data quoted represents past performance and does not guarantee future results. The investment return and principal value of an investment will fluctuate so that an investor's shares, when redeemed, may be worth more or less than the original cost. Current performance of the Funds may be lower or higher than the performance quoted. Performance data current to the most recent month end may be obtained by visiting www.gafunds.com.
Each Fund imposes a 2% redemption fee on shares held less than 30 days. Performance data quoted does not reflect this fee. If it had, total return would be lower.
Expense ratios are from the most recent prospectus (dated May 1, 2013) and are from the most recent audited financials (period ending December 31, 2012) at the time that prospectus was completed.
†All of the Guinness Atkinson Funds have an expense cap in place and the advisor is contractually obligated to cap the Funds' total expenses at least through June 30, 2014. For the Inflation Managed Dividend Fund, the advisor is contractually obligated to cap total expenses at least through March 31, 2015.
4
Dear Guinness Atkinson Funds Shareholders,
Once again we're happy to report that the world didn't end during the previous year. In fact, 2013 was a pretty good year, particularly for shareholders in most of the Guinness Atkinson Funds. Before we get to the performance details, it might be worthwhile to once again speak out for optimism and acknowledge what we find obvious: human progress is alive and well and for the majority of the planet life has never been better. As we mentioned, we find this qualitative judgment to be a matter of fact: humans are living longer, healthier lives; earning increasingly higher amounts and are on average more educated and connected to information and entertainment than ever before.
Notwithstanding that these are factual statements the majority of us believe the opposite, namely that the state of humanity is poor and declining. There is a pessimism that permeates the national and global zeitgeist. We accept that the world isn't going to come around to our point of view no matter how loud we shout the optimistic truth. But we do feel it is important to share our view and the facts about the human condition because we believe this unfounded pessimism and angst has some effect on investment behavior. Investors with a better understanding of the true state of the human condition might be in a position to make more informed investment decisions. Investing isn't just about the long term, of course and we are cognizant that economic events bring both the good and the bad. We are not blind to the fact that markets fluctuate or that bad things happen. That is part of the exercise. Our point is more that investing can benefit from a long term view and, importantly, it is helpful if that long term view is grounded in facts and empirical data rather than on subjective misinformation.
2013 Performance
We're delighted to acknowledge that the Guinness Atkinson Alternative Energy Fund had a stellar 2013, generating a total return of 61.54% for the year. This is particularly welcome news given the generally dismal performance of this Fund in recent years. In 2013 this Fund benefitted greatly from the strong performance of the sector. Previously this Fund had suffered greatly from the very weak performance of the sector. As the name of the Fund suggests, the Alternative Energy Fund invests in the alternative energy sector. Our philosophy for this Fund, and indeed in all of the Guinness Atkinson Funds, is to invest shareholder assets in the manner suggested by the Fund's name. For the Alternative Energy Fund this means investing in companies that generate at least 50% of their earnings or revenues from alternative energy. Thus, when the sector was weak in recent years the Fund produced poor results. But, maintaining the course paid off handsomely in 2013. Our view on alternative energy is simple; over time the price of alternative energy will decline while conventional energy costs will rise. This formula, coupled with increasing environmental concerns should result in a dramatic increase in alternative energy generation. Put another way, our view is that over time alternative energy will become conventional. We know the short term for this industry can be extremely volatile, but our view on the long term is optimistic.
The Global Innovators Fund also had an excellent 2013, generating a total return of 45.29%. In fact, this Fund has put together an exceptional long term track record (details are provided in the table above). The philosophy behind this Fund is simple: Companies that demonstrate an ability to innovate can achieve a competitive advantage. The Global Innovators Fund is populated with companies from a variety of industries that have found a competitive advantage through innovation. We believe the excellent long term track record for this Fund supports our view that innovation matters.
The newest Guinness Atkinson Fund, the Inflation Managed Dividend FundTM, had an excellent year, providing a total return of 29.77% in 2013. We're the first to admit that this Fund has an unusual name. The Fund seeks to offer a moderate dividend yield that importantly grows at a rate that is greater than the rate of inflation. In simple terms the Fund could be described as a growing dividend Fund. But central to the Fund is the principle that any rising dividend strategy needs to be cognizant of the rate of inflation.
The Global Energy Fund also had a standout year, generating a total return of 24.48% over the calendar year, despite the fact that the price of oil was relatively stable over the course of 2013. Notwithstanding this performance, the energy sector has actually been a bit out of favor of late and arguably undervalued versus the market as a whole. Time will tell on this point, but our view is that despite the excellent performance of 2013 the energy sector is relatively undervalued.
The China & Hong Kong Fund produced a total return of 6.45% for the year. Shareholders in this Fund will know from experience that while the long term track record is quite good, the ride can be rather bumpy. That is to be expected given the transition from emerging market into a developed world power. Our view on China is the same today as it was when this Fund launched in 1994, specifically, that China is on a path to become the world's largest economy. The transition to a modern capitalist economy is just over 30 years old and the dramatic rise in gross domestic product (GDP) (both absolute and on a per capita basis) is extremely
5
impressive. More impressive is that this economic advancement has occurred across a population base of 1.2 billion. This rapid advancement for such a large population base has never before occurred in human history. There have been setbacks along the way, and we're sure there will be some in the years ahead – hence the volatility – but there is no denying the China success story.
The Renminbi Yuan & Bond Fund finished 2013 with a total return for the year of 5.26%. The increasing adoption, globally, for the Renminbi continues and the currency is increasingly gaining the status as a major world currency. This is exactly what one should expect given that China is the world's second largest economy.
The Asia Focus Fund (-10.38%) and the Asia Pacific Dividend Fund (-2.06%) were the two Guinness Atkinson Funds that produced negative total returns for the year. And while we're not happy about these results we remain steadfast in our long term view and recognize that these markets have been – and likely will continue to be – bumpy. Over the longer term the Asian economies have been experiencing profound growth. But we know that this growth has been subject to setbacks and the markets have been subject to volatility. But these negative developments do not undermine the main story of long term growth. Our investment team has provided a detailed commentary for each of the Guinness Atkinson Funds adjacent to each Fund's financial results.
As usual, we appreciate the confidence you have placed in us and our management team and look forward to what will hopefully be a great 2014.
We encourage you to visit gafunds.com for the latest news and announcements on the Guinness Atkinson Funds. In particular, we encourage investors to subscribe to our series of topical briefs. These briefs are meant to provide investors with our current thinking about each of the themes and markets which make up the Guinness Atkinson Fund range.
Sincerely,

| | 
| |
Timothy Guinness | | James Atkinson | |
The Funds invest in foreign securities, which involves greater volatility and political, economic and currency risks and differences in accounting methods. These risks are greater for emerging markets countries. Non-diversified Funds' assets may be concentrated in fewer individual holdings than diversified funds. Therefore, these Funds are more exposed to individual stock volatility than diversified funds. Investments in smaller companies involve additional risks such as limited liquidity and greater volatility. Investments in debt securities typically decrease in value when interest rates rise, which can be greater for longer-term debt securities. Investments in derivatives involve risks different from, and in certain cases, greater than the risks presented by traditional investments. Investments focused in a single geographic region may be exposed to greater risk than investments diversified among various geographies. Investments focused on the energy sector may be exposed to greater risk than an investments diversified among various sectors.
6
Expense Examples (Unaudited)
As a shareholder of the Funds, you incur two types of costs: (1) redemption fees; and (2) ongoing costs, including advisory fees and other Fund expenses. The examples below are intended to help you understand your ongoing costs (in dollars) of investing in the Funds and to compare these costs with the ongoing costs of investing in other mutual funds.
The examples are based on an investment of $1,000 invested at the beginning of the period shown and held for the entire period from July 1, 2013 to December 31, 2013.
Actual Expenses
For each Fund, the first line of the table below provides information about actual account values and actual expenses. You may use the information in this line, together with the amount you invested, to estimate the expenses that you paid over the period. Simply divide your account value by $1,000 (for example, an $8,600 account value divided by $1,000 = 8.6), then multiply the result by the number in the first line under the heading entitled "Expenses Paid during Period" to estimate the expenses you paid on your account during this period.
Hypothetical Example for Comparison Purposes
For each Fund, the second line of the table below provides information about hypothetical account values and hypothetical expenses based on the Fund's actual expense ratios and an assumed rate of return of 5% per year before expenses, which is not the Fund's actual return. The hypothetical account values and expenses may not be used to estimate the actual ending account balance or expenses you paid for the period. You may use this information to compare the ongoing costs of investing in the Fund and other funds. To do so, compare this 5% hypothetical example with the 5% hypothetical examples that appear in the shareholder reports of the other funds.
Please note that the expenses shown in the table are meant to highlight your ongoing costs only and do not reflect any redemption fees. Therefore, the second line for each Fund of the table is useful in comparing ongoing costs only, and will not help you determine the relative total costs of owning different funds. In addition, if these redemption fees were included, your costs would have been higher.
| | | Beginning
Account
Value
(07/01/13) | | Ending
Account
Value
(12/31/13) | | Expenses Paid
During Period*
(07/01/13 to
12/31/13) | | Expense Ratios
During Period*
(07/01/13 to
12/31/13) | |
Guinness Atkinson Alternative Energy Fund Actual | | $ | 1,000.00 | | | $ | 1,278.80 | | | $ | 11.37 | | | | 1.98 | %† | |
Guinness Atkinson Alternative Energy Fund Hypothetical
(5% return before expenses) | | $ | 1,000.00 | | | $ | 1,015.22 | | | $ | 10.06 | | | | 1.98 | %† | |
Guinness Atkinson Asia Focus Fund Actual | | $ | 1,000.00 | | | $ | 1,048.70 | | | $ | 9.71 | | | | 1.88 | % | |
Guinness Atkinson Asia Focus Fund Hypothetical
(5% return before expenses) | | $ | 1,000.00 | | | $ | 1,015.73 | | | $ | 9.55 | | | | 1.88 | % | |
Guinness Atkinson Asia Pacific Dividend Fund Actual | | $ | 1,000.00 | | | $ | 977.90 | | | $ | 9.87 | | | | 1.98 | %† | |
Guinness Atkinson Asia Pacific Dividend Fund Hypothetical
(5% return before expenses) | | $ | 1,000.00 | | | $ | 1,015.22 | | | $ | 10.06 | | | | 1.98 | %† | |
Guinness Atkinson China & Hong Kong Fund Actual | | $ | 1,000.00 | | | $ | 1,191.60 | | | $ | 8.56 | | | | 1.55 | % | |
Guinness Atkinson China & Hong Kong Fund Hypothetical
(5% return before expenses) | | $ | 1,000.00 | | | $ | 1,017.39 | | | $ | 7.88 | | | | 1.55 | % | |
Guinness Atkinson Global Energy Fund Actual | | $ | 1,000.00 | | | $ | 1,215.10 | | | $ | 7.31 | | | | 1.31 | % | |
Guinness Atkinson Global Energy Fund Hypothetical
(5% return before expenses) | | $ | 1,000.00 | | | $ | 1,018.63 | | | $ | 6.67 | | | | 1.31 | % | |
Guinness Atkinson Global Innovators Fund Actual | | $ | 1,000.00 | | | $ | 1,241.30 | | | $ | 8.19 | | | | 1.45 | % | |
Guinness Atkinson Global Innovators Fund Hypothetical
(5% return before expenses) | | $ | 1,000.00 | | | $ | 1,017.90 | | | $ | 7.37 | | | | 1.45 | % | |
Guinness Atkinson Inflation Managed Dividend Fund Actual | | $ | 1,000.00 | | | $ | 1,147.60 | | | $ | 3.68 | | | | 0.68 | %† | |
Guinness Atkinson Inflation Managed Dividend Fund Hypothetical
(5% return before expenses) | | $ | 1,000.00 | | | $ | 1,021.78 | | | $ | 3.47 | | | | 0.68 | %† | |
Guinness Atkinson Renminbi Yuan & Bond Fund Actual | | $ | 1,000.00 | | | $ | 1,043.60 | | | $ | 4.64 | | | | 0.90 | %† | |
Guinness Atkinson Renminbi Yuan & Bond Fund Hypothetical
(5% return before expenses) | | $ | 1,000.00 | | | $ | 1,020.67 | | | $ | 4.58 | | | | 0.90 | %† | |
*Expenses are equal to the Funds' annualized expense ratio as indicated, multiplied by the average account value over the period, multiplied by the number of days in most recent fiscal half-year period (184), then divided by the number of days in the fiscal year (365) (to reflect the one-half year period).
†Net of fee waivers and/or expense reimbursements. If those fee waivers and/or expense reimbursements had not been in effect, the Fund's actual expenses would have been higher.
7
ALTERNATIVE ENERGY FUND for the period ended December 31, 2013
1. Performance
AVERAGE ANNUALIZED TOTAL RETURNS
| | | 1 Year
(Actual) | | 3 Years | | 5 Years | | Since
Inception
(March 31, 2006) | |
Fund | | | 61.54 | % | | | -7.66 | % | | | -3.88 | % | | | -12.20 | % | |
Benchmark Indices: | |
Wilderhill New Energy Global Innovation Index | | | 55.57 | % | | | -3.08 | % | | | 2.10 | % | | | -3.61 | % | |
Wilderhill Clean Energy Index | | | 58.54 | % | | | -13.44 | % | | | -4.33 | % | | | -14.03 | % | |
MSCI World Index | | | 27.49 | % | | | 12.25 | % | | | 15.81 | % | | | 5.78 | % | |
The Fund's gross expense ratio is 2.32% and net expense ratio is 2.02% per the Summary Prospectus dated May 1, 2013. The Advisor has contractually agreed to waive a portion of its advisory fees and/or reimburse other Fund expenses so that the Fund's ratio of expenses to average daily net assets will not exceed 1.98% (excluding Acquired Fund Fees and Expenses, interest, taxes, dividends on short positions and extraordinary expenses) through at least June 30, 2014. To the extent that the Advisor waives fees, it may seek repayment of a portion or all of such amounts at any time within the three fiscal years after the fiscal year in which such amounts were waived and/or reimbursed, subject to the applicable cap.
Performance data quoted represents past performance and does not guarantee future results. The investment return and principal value of an investment in the Fund will fluctuate so that an investor's shares, when redeemed, may be worth more or less than their original cost. Current performance of the Fund may be lower or higher than the performance quoted. Performance data current to the most recent month end may be obtained by visiting www.gafunds.com, or calling (800) 915-6565.
The Fund imposes a 2% redemption fee on the sale of shares held less than 30 days. Performance data quoted does not reflect this redemption fee. Total returns for certain periods reflect fee limitations in effect and in the absence of these limitations total returns would have been lower.
The Guinness Atkinson Alternative Energy Fund was up 61.54% in 2013. This compared to a rise in the Wilderhill New Energy Global Innovation Index of 55.57% and in the Wilderhill Clean Energy Index of 58.54%. The Fund outperformed its benchmark indices and significantly outperformed the MSCI World Index in 2013.
The Fund had a flat first quarter, with strong second and third quarters followed by retrenching in the fourth quarter.
The main drivers of performance in the year were the portfolio's solar and wind stocks. The solar industry began to recover as we saw the expected increase in demand for solar globally in response to lower installation prices. In particular we have seen a transition from Europe as the main source of global demand to China, Japan and the U.S. which provides a much broader base for demand in the future. This has resulted in solar module prices stabilising, allowing many of the solar manufacturers to return to profitability and rebuild balance sheets. Within the wind sector, the wind turbine manufacturers performed well as they saw the benefits of cost restructurings and as the U.S. market recovered allowing backlogs to recover and pricing to stabilise. The second source of wind returns were the portfolio's holdings in Chinese wind utilities, who benefitted from low turbine prices in China, improving margins as the required grid infrastructure was put in place allowing them to sell more of their output and a continued commitment by China to developing alternative energy technologies.
8
2. Portfolio
Sector | | % of Assets | |
Solar | | | 26.40 | % | |
Wind | | | 49.99 | % | |
Efficiency | | | 12.06 | % | |
Geothermal | | | 3.64 | % | |
Hydro | | | 6.61 | % | |
Biomass Energy | | | 3.72 | % | |
Cash | | | -2.42 | % | |
| | | | 100.00 | % | |
Domicile | | % of Assets | |
Europe | | | 42.27 | % | |
North America | | | 22.53 | % | |
Asia | | | 34.57 | % | |
Latin America | | | 3.04 | % | |
Australasia | | | 0.00 | % | |
Cash | | | -2.41 | % | |
| | | | 100.00 | % | |
* region is as per company domicile.
The portfolio is quite concentrated in the wind and solar sectors, with 26.40% in solar and 49.99% in wind. We believe these sectors have the best long-term growth potential of the alternative energy space.
Within the solar sector, we are invested in a mix of low cost Asian solar cell and module manufacturers and volume plays including one inverter manufacturer and a Chinese solar installer.
For our wind exposure we are invested in both turbine manufacturers and wind farm developers. The split is 28.09% in large wind utilities, 11.27% in small utilities and 10.61% in wind turbine manufacturers. In the long run there are good potential returns both from owning wind assets and investing in the turbine value chain as the wind industry becomes more mainstream and as offshore wind gains traction.
Further investments are in a hydroelectric power producer in Latin America, an Austrian hydropower utility, a ground source heat pump company, a lithium mining company and a metering company.
The Fund has 42.27% of its holdings in companies domiciled in Europe. North America accounts for 22.53% of the Fund. The Fund's 37.61% of emerging markets holdings is predominantly held in Chinese companies, which account for 31.15% of the portfolio.
Mkt Cap $m | | Positions | | % of Asset | |
>1000 | | | 17 | | | | 57.98 | % | |
500-1000 | | | 3 | | | | 11.15 | % | |
250-500 | | | 6 | | | | 13.75 | % | |
100-250 | | | 3 | | | | 11.96 | % | |
50-100 | | | 2 | | | | 7.12 | % | |
<50 | | | 2 | | | | 0.45 | % | |
9
Position size | | Positions | | % of Assets | |
Full | | | 29 | | | | 101.96 | % | |
Half | | | 0 | | | | 0.00 | % | |
Research | | | 2 | | | | 0.45 | % | |
The liquidity of the Fund has become lower as the percentage of the Fund in companies with a market capitalization over US$1,000 million has risen back to 56.96% from 49.28% at the end of the first quarter. One holding is now in a company with a market capitalisation lower than $50 million – Good Energy. The Fund now has 29 full units and two research holdings and was in the process of acquiring a 30th unit at the end of the year to return the Fund to its target 30 unit structure.
3. Activity
Over 2013 the Fund acquired holdings in Maple Energy, Jinko Solar and China Singyes. The Fund sold its positions in Power One, Suntech, Thermal Energy International and LDK Solar.
Maple Energy is a Peruvian ethanol manufacturer with one of the lowest ethanol cost bases as it produces from sugarcane irrigated in a high insolation location. Jinkosolar is the lowest cost Chinese solar module manufacturer, has good political connections and is one of the first of the Chinese solar companies to return to profitability. China Singyes are a leading installer of solar systems in China.
Power One was a manufacturer of solar inverters and was acquired by ABB. Suntech and LDK Solar were leading solar manufacturers whose balance sheets become overstretched. Thermal Energy International was a research holding who specialised in heat recover systems for manufacturing processes.
4. Outlook
The outlook for alternative energy remains challenging, with government budgets still under pressure, natural gas price weakness in the U.S. and project financing still challenging. However, it is the potential for these challenges to be overcome or to dissipate that provides us with cause for optimism for the Fund.
The area that we are most excited about for 2014 and beyond remains solar. The best in class cost of solar installations has fallen to about $1.30/Watt from about $6.00/Watt in 2008. This means that solar is now competitive without subsidies in an increasing number of countries, particularly more emerging economies with structural electricity deficits and high electricity prices from use of diesel plants. Even in Germany and the UK a consumer can earn 10%+ returns on an installation based on the avoided cost of electricity from the grid.
The industry is also much less reliant on any one country compared to the over-reliance on Spain, Italy and Germany that has been seen historically and this combined with increasing unsubsidised demand means that the risk of market volumes falling is much lower. This has been further helped by the EU imposition on a floor for prices of Chinese modules, which has made the EU a far less competitive market from a price perspective to the benefit of the manufacturers. A number of analysts are forecasting growth of the market to 40-50GW (gigawatts) and we believe that estimates are likely to be revised upwards. This means that the industry is in less of a state of oversupply. In fact we think that the potential growth in demand from current low price of modules is likely to lead to a plateau in pricing for a number of years. Solar companies are now competing against retail electricity costs for the first time and this provides extra support to solar module prices.
For the wind industry, we see potential upside to global demand from the emerging economies. Europe and China do not offer major growth opportunities although we would expect installations to continue at roughly currently levels. The U.S. is hard to predict, although past experience would lead to expectations that after an expected good year in 2014, there may be a fall in 2015 if supporting legislation is allowed to lapse at the end of 2014. However, an early extension would allow maintenance of installations. With wind costs now able to deliver electricity at 5cents/kilowatt hour (c/kWh) or less in some geographies, we see the main wind industry growth coming from developing economies, where the electricity cost is again the more important driver. We see specific opportunities in a recovery in valuations for the large cap European renewables utilities held in the portfolio and even more potential from the smaller cap utilities who are bringing assets into production at a faster rate as a result of their stage of maturity.
10
Other holdings are in more stock specific type opportunities in hydro, geothermal, efficiency and biofuels companies. These range from turnaround situations to larger cap undervalued companies.
As one of the only funds that is investing in alternative energy as a pureplay strategy, we believe we are well placed to capture the potential returns from the growth of an industry that is only now beginning to recover from 2008.
The long term outlook for alternative energy remains good. The key drivers remain in place: dwindling fossil fuel supplies; energy security concerns; environmental issues; and climate change. The reduced cost of alternative energy technologies is likely to accelerate the growth of the alternative energy sector. We continue to position the Fund to benefit from the long term growth of the sector.

Edward Guinness
The Fund invests in foreign securities, which will involve political, economic and currency risks, greater volatility, and differences in accounting methods. These risks are greater for emerging markets. The Fund is non-diversified, meaning that its assets may be concentrated in fewer individual holdings than diversified funds. Therefore, the Fund is more exposed to individual stock volatility than diversified funds. The Fund invests in smaller companies, which will involve additional risks such as limited liquidity and greater volatility. The Fund's focus on the energy sector to the exclusion of other sectors exposes the Fund to greater market risk and potential monetary losses than if the Fund's assets were diversified among various sectors.
The Wilderhill New Energy Global Innovation Index (NEX) is a modified dollar-weighted index of publicly traded companies that are active in renewable and low-carbon energy, and that stand to benefit from responses to climate change and energy security concerns. The Wilderhill Clean Energy Index (ECO) is a modified equal dollar weighted index comprised of publicly traded companies whose businesses stand to benefit substantially from societal transition toward the use of cleaner energy and conservation. The MSCI World Energy Index is an unmanaged index composed of more than 1,400 stocks listed on exchanges in the U.S. Europe, Canada, Australia, New Zealand, and the Far East. These indices are unmanaged, not available for investment and do not incur expenses.
Please refer to the Schedule of Investments for details on fund holdings. Current and future portfolio holdings are subject to risk.
The information provided herein represents the opinion of Guinness Atkinson Asset Management, Inc. for the period stated and is not intended to be a forecast of future events, a guarantee of future results, or investment advice. Opinions, fund holdings and sector allocations are subject to change at any time and are not recommendations to buy or sell any security.
11
GUINNESS ATKINSON ALTERNATIVE ENERGY FUND
Growth of $10,000

Average Annual Total Return
Periods Ended December 31, 2013
| One Year | | Five Years | | Since Inception
(03/31/06) | |
| | 61.54 | % | | | -3.88 | % | | | -12.20 | % | |
*Inception date 03/31/06.
Performance data quoted represents past performance and does not guarantee future results. The investment return and principal value of an investment will fluctuate so that an investor's shares, when redeemed, may be worth more or less than their original cost. Current performance of the Fund may be lower or higher than the performance quoted. Performance data current to the most recent month end may be obtained by visiting www.gafunds.com.
Total returns for certain periods reflect a fee waiver in effect and in the absence of this waiver, the total returns would be lower. Returns reflect the reinvestment of distributions made by the Fund, if any. The graph and the performance table above do not reflect the deduction of taxes that a shareholder would pay on Fund distribution or the redemption of Fund shares. The Fund imposes a 2% redemption fee on shares held less than 30 days.
The Wilderhill New Energy Global Innovations Index (NEX) is a modified dollar weighted index of publicly traded companies, which are active in renewable and low-carbon energy, and which stand to benefit from responses to climate change and energy security concern. The Wilderhill Clean Energy Index (ECO) is a modified equal dollar weighted index comprised of publicly traded companies whose businesses stand to benefit substantially from societal transition toward the use of cleaner energy and conservation.
12
FUND HIGHLIGHTS at December 31, 2013
GUINNESS ATKINSON ALTERNATIVE ENERGY FUND
# of Holdings in Portfolio: | | | 31 | | |
Portfolio Turnover: | | | 60.2 | % | |
% of Stocks in Top 10: | | | 39.4 | % | |
Fund Manager:
Top 10 Holdings (% of net assets) | | | | Sector Breakdown (% of net assets) | | | |
JinkoSolar Holding Co-ADR | | | 4.8 | % | | Wind | | | 49.8 | % | |
Canada Lithium Corp. | | | 4.2 | % | | Solar | | | 26.3 | % | |
WaterFurnace Renewable Energy Inc. | | | 4.0 | % | | Efficiency | | | 12.0 | % | |
Theolia SA | | | 4.0 | % | | Hydro | | | 6.6 | % | |
Gamesa Corporation Tecnologica S.A. | | | 3.9 | % | | Geothermal | | | 3.6 | % | |
Vestas Wind Systems A/S | | | 3.9 | % | | Biofuel | | | 3.6 | % | |
Enel Green Power SpA | | | 3.7 | % | | | | | | | |
Greentech Energy Systems | | | 3.7 | % | | | | | | | |
Maple Energy PLC | | | 3.6 | % | | | | | | | |
Ormat Technologies, Inc. | | | 3.6 | % | | | | | | | |
13
SCHEDULE OF INVESTMENTS
December 31, 2013
GUINNESS ATKINSON ALTERNATIVE ENERGY FUND
Shares | | COMMON STOCKS: 101.9% | | Value | |
Biofuel: 3.6% | | | |
| | 2,126,280 | | | Maple Energy PLC* | | $ | 862,652 | | |
Efficiency: 12.0% | | | |
| | 146,000 | | | Applied Intellectual Capital Ltd.*†^ | | | — | | |
| | 2,912,100 | | | Canada Lithium Corp.* | | | 1,000,627 | | |
| | 760,987 | | | Carmanah Technologies Corp.* | | | 107,459 | | |
| | 18,700 | | | Itron, Inc.* | | | 774,741 | | |
| | 42,500 | | | WaterFurnace Renewable Energy Inc. | | | 959,826 | | |
| | | | | | | | 2,842,653 | | |
Geothermal: 3.6% | | | |
| | 31,659 | | | Ormat Technologies, Inc. | | | 861,441 | | |
Hydro: 6.6% | | | |
| | 92,459 | | | Cia Energetica de Minas Gerais ADR | | | 720,256 | | |
| | 39,650 | | | Verbund AG | | | 846,292 | | |
| | | | | | | | 1,566,548 | | |
Solar: 26.3% | | | |
| | 806,000 | | | China Singyes Solar Tech | | | 810,750 | | |
| | 85,700 | | | JA Solar Holdings Co., Ltd.* | | | 785,869 | | |
| | 39,000 | | | Jinkosolar Holding Co - ADR* | | | 1,142,700 | | |
| | 191,100 | | | Renesola Ltd. - ADR* | | | 659,295 | | |
| | 20,220 | | | SMA Solar Technology AG | | | 638,673 | | |
| | 25,750 | | | SunPower Corp. - Class B * | | | 767,607 | | |
| | 55,720 | | | Trina Solar Ltd. - ADR* | | | 761,692 | | |
| | 136,500 | | | Yingli Green Energy Holding Co., Ltd. - ADR* | | | 689,325 | | |
| | | | | | | | 6,255,911 | | |
Wind: 49.8% | | | |
| | 14,200 | | | Acciona S.A. | | | 815,880 | | |
| | 83,687 | | | Boralex Inc. - Class A* | | | 852,430 | | |
| | 3,888,000 | | | China Datang Corp. Renewable Power Co. Ltd. - H Shares | | | 822,295 | | |
| | 639,000 | | | China Longyuan Power Group Corp. - H Shares | | | 823,235 | | |
| | 2,269,000 | | | China Suntien Green Energy Corp. Ltd. - H Shares | | | 851,500 | | |
| | 153,000 | | | EDP Renovaveis SA | | | 812,674 | | |
| | 350,300 | | | Enel Green Power SpA | | | 882,376 | | |
| | 89,900 | | | Gamesa Corporation Tecnologica S.A.* | | | 937,463 | | |
| | 212,941 | | | Good Energy Group PLC | | | 807,503 | | |
| | 407,600 | | | Greentech Energy Systems* | | | 879,428 | | |
| | 1,760,000 | | | Huaneng Renewables Corp. Ltd. - H Shares | | | 844,332 | | |
| | 48,900 | | | Nordex SE* | | | 645,946 | | |
| | 569,108 | | | Theolia SA* | | | 939,510 | | |
| | 31,515 | | | Vestas Wind Systems A/S* | | | 931,023 | | |
| | | | | | | | 11,845,595 | | |
| | | | | Total Common Stocks
(costs $31,714,482) | | | 24,234,800 | | |
The accompanying notes are an integral part of these financial statements.
14
| | | | | Value | |
| | | Total Investments in Securities
(costs $31,714,482): 101.9% | | $ | 24,234,800 | | |
| | | Liabilities in Excess of Other Assets: (1.9%) | | | (458,802 | ) | |
| | | Net Assets: 100.0% | | $ | 23,775,998 | | |
* Non-income producing security.
† Illiquid. Illiquid securities represent 0.0% of net assets.
^ Fair value under direction of the Board of Trustees. Fair valued securities represent 0.0% of net assets.
ADR - American Depository Receipt
The accompanying notes are an integral part of these financial statements.
15
ASIA FOCUS FUND for the period ended December 31, 2013
1. Performance
AVERAGE ANNUALIZED TOTAL RETURNS
| | | 1 Year
(actual) | | 3 Years | | 5 Years | | 10 Years | |
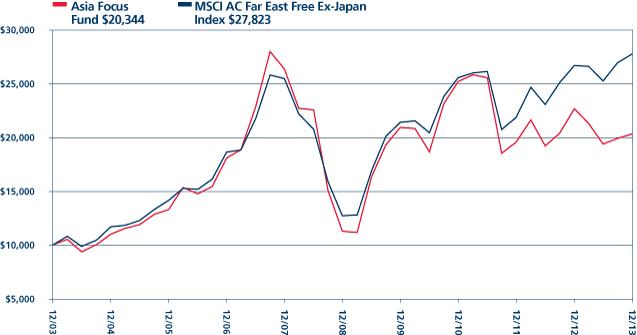
Fund | | | -10.38 | % | | | -6.92 | % | | | 12.56 | % | | | 7.36 | % | |
Benchmark Index: | |
MSCI AC Far East Free Ex Japan Index | | | 3.94 | % | | | 2.86 | % | | | 17.17 | % | | | 11.16 | % | |
S&P 500 Index | | | 32.38 | % | | | 16.16 | % | | | 17.92 | % | | | 7.40 | % | |
The Fund's gross expense ratio is 1.71% per the Summary Prospectus dated May 1, 2013. The Advisor has contractually agreed to waive a portion of its advisory fees and/or reimburse other Fund expenses so that the Fund's ratio of expenses to average daily net assets will not exceed 1.98% (excluding Acquired Fund Fees and Expenses, interest, taxes, dividends on short positions and extraordinary expenses) through at least June 30, 2014. To the extent that the Advisor waives fees and/or reimburses expenses, it may seek repayment of a portion or all of such amounts at any time within the three fiscal years after the fiscal year in which such amounts were waived and/or reimbursed, subject to the applicable cap.
Performance data quoted represents past performance and does not guarantee future results. The investment return and principal value of an investment in the Fund will fluctuate so that an investor's shares, when redeemed, may be worth more or less than their original cost. Current performance of the Fund may be lower or higher than the performance quoted. Performance data current to the most recent month-end may be obtained by visiting www.gafunds.com, or calling (800) 915-6565.
The Fund imposes a 2% redemption fee on the sale of shares held less than 30 days. Performance data quoted does not reflect this redemption fee. Total returns for certain periods reflect fee limitations in effect and, in the absence of these limitations, total returns would have been lower.
The Fund fell 10.38% during the year compared to the benchmark which rose 3.94%. We are clearly not happy to report these numbers but we do see the performance of this Fund is now starting to turn. The Fund has maintained a high exposure to China especially in energy materials and industrials which we believe were and remain undervalued. We believe that China is very cheap, that investors have been overly bearish, concerned about slower growth as well as the China's debt position. However, we also believe that China is due recovery once policy become clearer. We have not therefore, turned over the portfolio but have held our position.
China's stock market doldrums have been to the benefit of south east Asia where stock markets there have been strong. We have not been convinced by the underlying fundamentals especially of markets like Indonesia, Malaysia and the Philippines. Indonesia has come under pressure in recent months as the flows of hot money reversed. In spite of arguments offered to support Indonesia's strong stock market performance underlying weaknesses – the under-developed consumer market, bureaucratic inefficiency and the current account deficit – have not gone away.
In Thailand, political protests have paralyzed government in Bangkok, which of course has hit the stock market there. Yet companies once again have displayed their resilience and operations have continued. The most affected have been those whose investment plans hinge on government policy. However, ongoing operations of other domestic and export manufacturers have not been significantly disrupted.
2. Portfolio Position
Geographical exposure is dominated by China and Hong Kong but the Fund also has significant weightings in Taiwan and Thailand. By sector the Fund has high exposure to energy and materials, which have been reduced somewhat as stocks recovered in the second half, and has increased exposure to technology and consumer discretionary.
3. Outlook
Our views on China are more fully discussed in the China & Hong Kong Fund and the Renminbi Yuan & Bond Fund letters but we believe this is likely to be the beginning of a strong run in Chinese stocks from valuations that now languish at multi-year lows. Outside China, North Asia looks more attractive to us than south-east Asia, although we keep faith with Thailand whose export manufacturing sector is often overlooked and has sustained performance through both natural disaster and political turbulence.
16
North Asia's technology sector looks bright to us, especially in the area of consumer electronics related to smartphones and tablet computers. The main growth drivers for these products, apart from new models, are growing demand from margining markets and rollout of 4G telecom technology.
Overall, with market conditions turning more favourable toward the style we employ to manage the Fund's investments supported by low current valuations and rising momentum.

Edmund Harriss
The Fund invests in foreign securities, which involves political, economic and currency risks, greater volatility, and differences in accounting methods. These risks are greater for emerging markets. The Fund is non-diversified, meaning that its assets may be concentrated in fewer individual holdings than diversified funds. Therefore, the Fund is more exposed to individual stock volatility than diversified funds. Investments focused in a single geographic region may be exposed to greater risk and more volatility than investments diversified among various geographies. The Fund invests in smaller companies, which involves additional risks such as limited liquidity and greater volatility.
The MSCI AC (All Country) Far East ex Japan Index is a free float-adjusted market capitalization-weighted index that is designed to measure equity market performance of the Far East, excluding Japan. The Standard & Poor's 500 Index is a market capitalization-weighted index composed of 500 widely held common stocks of U.S. companies. These indices are unmanaged, not available for investment and do not incur expenses.
Please refer to the Schedule of Investments for details on Fund holdings. Current and future portfolio holdings are subject to risk.
The information provided herein represents the opinion of Guinness Atkinson Asset Management, Inc. for the period stated and is not intended to be a forecast of future events, a guarantee of future results, or investment advice. Opinions, Fund holdings and sector allocations are subject to change at any time, and are not recommendations to buy or sell any security.
17
GUINNESS ATKINSON ASIA FOCUS FUND
Growth of $10,000
Average Annual Total Return
Periods Ended December 31, 2013
| One Year | | Five Years | | Ten Years | |
| | -10.38 | % | | | 12.56 | % | | | 7.36 | % | |
Performance data quoted represents past performance and does not guarantee future results. The investment return and principal value of an investment will fluctuate so that an investor's shares, when redeemed, may be worth more or less than their original cost. Current performance of the Fund may be lower or higher than the performance quoted. Performance data current to the most recent month end may be obtained by visiting www.gafunds.com.
Total returns for certain periods reflect a fee waiver in effect and in the absence of this waiver, the total returns would be lower. Returns reflect the reinvestment of distributions made by the Fund, if any. The graph and the performance table above do not reflect the deduction of taxes that a shareholder would pay on Fund distribution or the redemption of Fund shares. The Fund imposes a 2% redemption fee on shares held less than 30 days.
The MSCI All Country Far East Free ex-Japan Index (MSCI AC Far East Free ex-Japan Index) is a free float-adjusted, capitalization-weighted index that is designed to measure equity market performance in the Asia region excluding Japan. The index referenced in this chart is not available for investment and does not incur expenses.
18
FUND HIGHLIGHTS at December 31, 2013
GUINNESS ATKINSON ASIA FOCUS FUND
# of Holdings in Portfolio: | | | 37 | | |
Portfolio Turnover: | | | 7.4 | % | |
% of Stocks in Top 10: | | | 41.3 | % | |
Fund Manager: | |
Edmund Harriss | | | |
Top 10 Holdings (% of net assets) | |
Samsung Elect Co., Ltd. | | | 5.9 | % | | Soho China, Ltd. | | | 3.7 | % | |
Galaxy Entertainment Group Ltd. | | | 5.6 | % | | CNOOC Ltd. - ADR | | | 3.6 | % | |
Taiwan Semiconductor Manufacturing Co., Ltd. | | | 4.8 | % | | HSBC Holdings PLC | | | 3.3 | % | |
Kunlun Energy Co., Ltd. | | | 3.9 | % | | Sohu.com Inc. | | | 3.3 | % | |
Hyundai Mobis | | | 3.9 | % | | Novatek Microelectronics Corp. Ltd. | | | 3.3 | % | |
Sector Breakdown (% of net assets) | | | | | | | |
Oil Company - Exploration & Production | | | 10.2 | % | | Telecommunication Services | | | 3.0 | % | |
Semiconductor Components - Integrated Circuits | | | 8.0 | % | | Auto-Cars/Light Trucks | | | 2.9 | % | |
Auto/Truck Parts & Equipment | | | 6.8 | % | | Building Products - Air & Heating | | | 2.9 | % | |
Electronic Components - Semiconductor | | | 5.9 | % | | Computers | | | 2.7 | % | |
Casino Hotels | | | 5.6 | % | | Metal - Copper | | | 2.7 | % | |
Real Estate Operations/Development | | | 5.5 | % | | Cellular Telecommunications | | | 2.6 | % | |
Electric - Generation | | | 5.2 | % | | Exchange Traded Funds | | | 2.6 | % | |
Oil Company - Integrated | | | 5.1 | % | | Electronic Component - Miscellaneous | | | 2.5 | % | |
Coal | | | 4.9 | % | | Chemicals - Other | | | 2.0 | % | |
Commercial Banks | | | 3.3 | % | | Power Conversion/Supply Equipment | | | 2.0 | % | |
Web Portals/ISP | | | 3.3 | % | | Public Thoroughfares | | | 2.0 | % | |
Building & Construction Products | | | 3.2 | % | | Non-Ferrous Metals | | | 1.1 | % | |
Photo Equipment & Supplies | | | 3.0 | % | | Machinery | | | 0.5 | % | |
19
SCHEDULE OF INVESTMENTS
December 31, 2013
GUINNESS ATKINSON ASIA FOCUS FUND
Shares | | COMMON STOCKS: 99.5% | | Value | |
China: 41.7% | | | |
| | 58,000 | | | AAC Technologies Holdings Inc. | | $ | 281,611 | | |
| | 171,000 | | | Anhui Conch Cement Co Ltd. - H Shares | | | 634,003 | | |
| | 1,014,000 | | | China Lesso Group Holdings | | | 706,137 | | |
| | 55,500 | | | China Mobile Ltd | | | 575,448 | | |
| | 173,000 | | | China Shenhua Energy Co Ltd. - H Shares | | | 545,484 | | |
| | 419,000 | | | CNOOC Ltd. - ADR | | | 779,178 | | |
| | 784,900 | | | db x-trackers CSI300 Index ETF | | | 567,851 | | |
| | 248,000 | | | Dongfang Electric Corp. Ltd. - H Shares | | | 434,959 | | |
| | 324,000 | | | Jiangxi Copper Co., Ltd. - H Shares | | | 584,966 | | |
| | 490,000 | | | Lenovo Group Ltd. | | | 595,889 | | |
| | 562,000 | | | PetroChina Co., Ltd. - H Shares | | | 616,045 | | |
| | 968,000 | | | Shenzhen Expressway Co., Ltd. - H Shares | | | 435,671 | | |
| | 939,000 | | | Soho China, Ltd. | | | 808,909 | | |
| | 9,800 | | | Sohu.com Inc.* | | | 714,714 | | |
| | 156,000 | | | Weichai Power Co., Ltd. - H Shares | | | 628,683 | | |
| | 250,800 | | | Yanzhou Coal Mining Co., Ltd. - H Shares | | | 228,991 | | |
| | | | | | | | 9,138,539 | | |
Hong Kong: 15.14% | | | |
| | 380,000 | | | Chen Hsong Holdings | | | 118,592 | | |
| | 137,000 | | | Galaxy Entertainment Group Ltd.* | | | 1,228,783 | | |
| | 67,091 | | | HSBC Holdings PLC | | | 728,074 | | |
| | 168,200 | | | Kingboard Chemical Holdings Ltd. | | | 439,247 | | |
| | 484,000 | | | Kunlun Energy Co., Ltd. | | | 852,616 | | |
| | | | | | | | 3,367,312 | | |
Indonesia: 2.5% | | | |
| | 129,000 | | | Indo Tambangraya Megah PT | | | 302,095 | | |
| | 1,133,000 | | | Vale Indonesia Tbk | | | 246,709 | | |
| | | | | | | | 548,804 | | |
Malaysia: 5.9% | | | |
| | 439,000 | | | DiGi.Com Bhd | | | 664,766 | | |
| | 170,000 | | | UMW Holdings Bhd | | | 625,920 | | |
| | | | | | | | 1,290,686 | | |
South Korea: 9.8% | | | |
| | 3,062 | | | Hyundai Mobis | | | 851,563 | | |
| | 1,001 | | | Samsung Electronics Co., Ltd. | | | 1,301,343 | | |
| | | | | | | | 2,152,906 | | |
Taiwan: 12.2% | | | |
| | 16,000 | | | Largan Precision Co | | | 652,272 | | |
| | 174,000 | | | Novatek Microelectronics Corp. Ltd. | | | 712,265 | | |
| | 2 | | | Shin Zu Shing Co., Ltd. | | | 5 | | |
| | 295,000 | | | Taiwan Semiconductor Manufacturing Co., Ltd. | | | 1,044,257 | | |
| | 44,000 | | | TPK Holding Co. Ltd. | | | 259,835 | | |
| | | | | | | | 2,668,634 | | |
The accompanying notes are an integral part of these financial statements.
20
Shares | | COMMON STOCKS: 99.5% (Continued) | | Value | |
Thailand: 12.0% | | | |
| | 137,500 | | | Electricity Generating PLC/Foreign | | $ | 512,591 | | |
| | 294,000 | | | Glow Energy PCL/Foreign | | | 630,767 | | |
| | 824,000 | | | LPN Development PCL/Foreign | | | 388,679 | | |
| | 117,198 | | | PTT Exploration & Production PCL/Foreign | | | 593,837 | | |
| | 56,700 | | | PTT PCL/Foreign | | | 493,494 | | |
| | | | | | | | 2,619,368 | | |
| | | | | Total Common Stocks
(costs $17,403,580) | | | 21,786,249 | | |
| | | | | Total Investments in Securities
(costs $17,403,580): 99.5% | | | 21,786,249 | | |
| | | | | Other Assets less Liabilities: 0.5% | | | 116,672 | | |
| | | | | Net Assets: 100.0% | | $ | 21,902,921 | | |
* Non-income producing security.
ADR - American Depository Receipt
The accompanying notes are an integral part of these financial statements.
21
ASIA PACIFIC DIVIDEND FUND for the period ended December 31, 2013
1. Performance
ANNUALIZED TOTAL RETURNS
| | | 1 Year
(Actual) | | 3 Years | | 5 Years | | Since
Launch
(March 31, 2006) | |
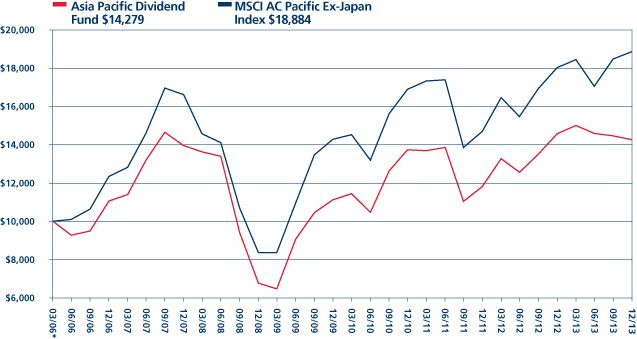
Fund | | | -2.06 | % | | | 1.30 | % | | | 16.20 | % | | | 4.70 | % | |
Benchmark Index: | |
MSCI Pacific Ex Japan Index | | | 4.58 | % | | | 3.83 | % | | | 18.01 | % | | | 8.80 | % | |
S&P 500 Index | | | 32.38 | % | | | 16.16 | % | | | 17.92 | % | | | 6.96 | % | |
The Fund's gross expense ratio is 3.57% and net expense ratio is 1.98% per the Summary Prospectus dated May 1, 2013. The Advisor has contractually agreed to waive a portion of its advisory fees and/or reimburse other Fund expenses so that the Fund's ratio of expenses to average daily net assets will not exceed 1.98% (excluding Acquired Fund Fees and Expenses, interest, taxes, dividends on short positions and extraordinary expenses) through at least June 30, 2014. To the extent that the Advisor waives fees and/or reimburses expenses, it may seek repayment of a portion or all of such amounts at any time within the three fiscal years after the fiscal year in which such amounts were waived and/or reimbursed, subject to the applicable cap.
Performance data quoted represents past performance and does not guarantee future results. The investment return and principal value of an investment in the Fund will fluctuate so that an investor's shares, when redeemed, may be worth more or less than their original cost. Current performance of the Fund may be lower or higher than the performance quoted. Performance data current to the most recent month-end may be obtained by visiting www.gafunds.com, or calling (800) 915-6565.
The Fund imposes a 2% redemption fee on the sale of shares held less than 30 days. Performance data quoted does not reflect this redemption fee. Total returns for certain periods reflect expense limitations in effect and, in the absence of these imitations, total returns would have been lower.
The Fund ended the year down 2.06% compared to the benchmark index which rose 4.58%. Having been defensive in the first half of the year the overall portfolio did not take advantage of the market recovery in the second half. The Fund's holdings in China and Hong Kong generally did well but were offset by weakness in the Thai and Taiwanese positions.
We have reviewed and made some changes to the way the portfolio is constructed and specifically to kinds of stocks in which the Fund will invest. We have refined the universe of potential investments to those stocks that have demonstrated an ability to sustain profitability through the business cycle by their competitive advantage, management efficiency, product development and distribution or a combination of those factors.
This ability is reflected in their ability to generate a real cash flow return on investment defined as cash flow divided by invested capital after stripping out the effects of inflation. We have identified all those companies in Asia, or outside Asia but who generate over 50% of profits from the region, that have generated a real return of 8% or more for 8 years or more. The companies that have achieved this are likely more often than not to repeat this the following year.
We have added further criteria in that the companies must have a market capitalization (the share price multiplied by the number of shares in issue) of over $500 million and their debt should not exceed their equity. These companies are ones we deem to have a demonstrably resilient business structure and operation. As a final criteria we look for companies that have a track record in paying dividends and whose historic dividend yield when taking the dividend paid in the prior year divided by the latest share price is 2% or more. By applying the dividend factor we are then focusing on those companies that have been able to generate excess cash flow and willing to pay out to shareholders.
This approach is one which we believe will generate a steadier performance than the broad market and that will outperform the broad market over time.
22
ASIA PACIFIC DIVIDEND FUND
2. Portfolio Position
At the year end the portfolio had 11% in Australia, 24% in China, 19% in Hong Kong, 6% in Singapore, 17% in Taiwan and 10% in Thailand. The balance was split between Japan, South Korea, Malaysia and one position in a US company. Sector exposure was also spread but with greater concentrations in Consumer discretionary, Financials, Technology and the rest split between Healthcare, Telecom services and Real Estate Investment Trusts (REITs). Possibly to the surprise of some we have little exposure to utilities which is the result of their regulated environment which caps their returns on investment.
3. Outlook
We believe this to be a portfolio that strikes a balance between growth and income. We therefore believe that these companies will participate in regional growth but with less volatility. The portfolio is positioned to benefit from rising consumption growth not only in China but also around the region.

Edmund Harriss
The Fund invests in foreign securities, which involves political, economic and currency risks, greater volatility, and differences in accounting methods. These risks are greater for emerging markets. The Fund is non-diversified, meaning that its assets may be concentrated in fewer individual holdings than diversified funds. Therefore, the Fund is more exposed to individual stock volatility than diversified funds. Investments focused in a single geographic region may be exposed to greater risk and more volatility than investments diversified among various geographies. The Fund invests in smaller companies, which involves additional risks such as limited liquidity and greater volatility.
The MSCI AC Pacific ex-Japan Index is a free float-adjusted market capitalization weighted index that is designed to measure equity market performance of the developed and emerging markets in the Pacific region, excluding Japan. The Standard & Poor's 500 Index is a market capitalization-weighted index composed of 500 widely held common stocks of U.S. companies. These indices are unmanaged and not available for investment and do not incur expenses.
Cash flow measures the cash generating capability of a company by adding non-cash charges (e.g., depreciation) and interest expense to pretax income.
Please refer to the Schedule of Investments for details on Fund holdings. Current and future portfolio holdings are subject to risk.
The information provided herein represents the opinion of Guinness Atkinson Asset Management, Inc. for the period stated and is not intended to be a forecast of future events, a guarantee of future results, or investment advice. Opinions, Fund holdings and sector allocations are subject to change at any time, and are not recommendations to buy or sell any security.
23
GUINNESS ATKINSON ASIA PACIFIC DIVIDEND FUND
Growth of $10,000
Average Annual Total Return
Periods Ended December 31, 2013
| One Year | | Five Years | | Since Inception
(03/31/06) | |
| | -2.06 | % | | | 16.20 | % | | | 4.70 | % | |
*Inception date 03/31/06.
Performance data quoted represents past performance and does not guarantee future results. The investment return and principal value of an investment will fluctuate so that an investor's shares, when redeemed, may be worth more or less than their original cost. Current performance of the Fund may be lower or higher than the performance quoted. Performance data current to the most recent month end may be obtained by visiting www.gafunds.com.
Total returns reflect a fee waiver in effect and in the absence of this waiver, the total returns would be lower. Returns reflect the reinvestment of distributions made by the Fund, if any. The graph and the performance table above do not reflect the deduction of taxes that a shareholder would pay on Fund distribution or the redemption of Fund shares. The Fund imposes a 2% redemption fee on shares held less than 30 days.
The MSCI All Country Pacific Free ex-Japan Index (MSCI AC Pacific ex-Japan Index) is a free float-adjusted, capitalization-weighted index that is designed to measure equity market performance in the Pacific region including Japan.
24
FUND HIGHLIGHTS at December 31, 2013
GUINNESS ATKINSON ASIA PACIFIC DIVIDEND FUND
# of Holdings in Portfolio: | | | 36 | | |
Portfolio Turnover: | | | 57.0 | % | |
% of Stocks in Top 10: | | | 28.6 | % | |
Fund Manager:
Top 10 Holdings (% of net assets) | | | | | | | |
Henderson Group PLC | | | 3.0 | % | | Sonic Healthcare Ltd. | | | 2.8 | % | |
JB Hi-Fi Ltd. | | | 2.9 | % | | Delta Electronics Thailand PCL/ Foreign | | | 2.8 | % | |
iiNET Ltd. | | | 2.9 | % | | CapitaMall Trust - REIT | | | 2.8 | % | |
Relo Holdings Inc. | | | 2.9 | % | | QUALCOMM Inc. | | | 2.8 | % | |
China Merchants Bank Co. Ltd. - H Shares | | | 2.9 | % | | Li & Fung Ltd. | | | 2.8 | % | |
Sector Breakdown (% of net assets) | | | | | | | |
Commercial Banks | | | 13.5 | % | | Cellular Telecommunications | | | 2.7 | % | |
Semiconductor Components - Integrated Circuits | | | 8.2 | % | | Chemicals - Specialty | | | 2.7 | % | |
REITS - Shopping Centers | | | 5.5 | % | | Metal Processors & Fabricators | | | 2.7 | % | |
Investment Management/Advisory Service | | | 3.0 | % | | Optical Supplies | | | 2.7 | % | |
Real Estate Management/Service | | | 2.9 | % | | REITS - Diversified | | | 2.7 | % | |
Retail - Consumer Electronics | | | 2.9 | % | | Telecommunication Equipment | | | 2.7 | % | |
Web Portals/ISP | | | 2.9 | % | | Telecommunication Services | | | 2.7 | % | |
Computers | | | 2.8 | % | | Textile - Apparel | | | 2.7 | % | |
Distribution/Wholesale | | | 2.8 | % | | Textile - Products | | | 2.7 | % | |
Electronic Component - Miscellaneous | | | 2.8 | % | | Tobacco | | | 2.7 | % | |
MRI/Medical Diagnostics Imaging | | | 2.8 | % | | Oil Company - Integrated | | | 2.6 | % | |
Retail - Jewelry | | | 2.8 | % | | Water | | | 2.6 | % | |
Shipbuilding | | | 2.8 | % | | Oil Company - Exploration & Production | | | 2.4 | % | |
Apparel Manufacturers | | | 2.7 | % | | Real Estate Operations/Development | | | 2.4 | % | |
Casino Hotels | | | 2.7 | % | | | | | |
25
SCHEDULE OF INVESTMENTS
December 31, 2013
GUINNESS ATKINSON ASIA PACIFIC DIVIDEND FUND
Shares | | COMMON STOCKS: 98.1% | | Value | |
Australia: 11.7% | | | |
| | 34,600 | | | Henderson Group PLC | | $ | 129,447 | | |
| | 21,300 | | | iiNET Ltd. | | | 123,812 | | |
| | 6,500 | | | JB Hi-Fi Ltd. | | | 124,782 | | |
| | 8,160 | | | Sonic Healthcare Ltd. | | | 120,803 | | |
| | | | | | | | 498,844 | | |
Cambodia: 2.7% | | | |
| | 108,000 | | | NagaCorp Ltd. | | | 113,790 | | |
China: 24.1% | | | |
| | 148,000 | | | China Construction Bank Corp. - H Shares | | | 111,654 | | |
| | 57,000 | | | China Merchants Bank Co. Ltd. - H Shares | | | 121,435 | | |
| | 11,000 | | | China Mobile Ltd. | | | 114,053 | | |
| | 550 | | | CNOOC Ltd. - ADR | | | 103,213 | | |
| | 101,500 | | | China Minsheng Banking Corp. Ltd. - H Share | | | 112,701 | | |
| | 167,000 | | | Industrial & Commercial Bank of China Ltd - H Shares | | | 112,851 | | |
| | 186,000 | | | China Lilang Ltd. | | | 114,656 | | |
| | 31,000 | | | Shenzhou Int'l Group | | | 116,335 | | |
| | 126,000 | | | Yangzijiang Shipbuilding Holdings Ltd. | | | 118,317 | | |
| | | | | | | | 1,025,215 | | |
Hong Kong: 19.0% | | | |
| | 36,000 | | | BOC Hong Kong Holdings Ltd. | | | 115,368 | | |
| | 207,000 | | | Huabao International Holdings Ltd. | | | 114,521 | | |
| | 92,000 | | | Li & Fung Ltd. | | | 118,644 | | |
| | 31,000 | | | Luk Fook Holdings International Ltd. | | | 117,935 | | |
| | 75,000 | | | Pacific Textiles Holdings Ltd. | | | 114,711 | | |
| | 23,500 | | | The Link - REIT | | | 113,950 | | |
| | 8,700 | | | Vtech Holdings Ltd. | | | 112,981 | | |
| | | | | | | | 808,110 | | |
Japan: 2.9% | | | |
| | 2,400 | | | Relo Holdings Inc. | | | 122,382 | | |
Malaysia: 2.7% | | | |
| | 75,700 | | | DiGi.Com Bhd | | | 114,630 | | |
Singapore: 5.5% | | | |
| | 67,000 | | | Ascendas - REIT | | | 116,803 | | |
| | 79,000 | | | CapitaMall Trust - REIT | | | 119,256 | | |
| | | | | | | | 236,059 | | |
South Korea: 2.7% | | | |
| | 1,610 | | | KT&G Corp. | | | 113,654 | | |
The accompanying notes are an integral part of these financial statements.
26
Shares | | COMMON STOCKS: 98.1% (Continued) | | Value | |
Taiwan: 13.6% | | | |
| | 13,000 | | | Asustek Computer Inc. | | $ | 116,899 | | |
| | 18,000 | | | Catcher Technology Co. Ltd. | | | 116,865 | | |
| | 28,000 | | | Novatek Microelectronics Corp. | | | 114,617 | | |
| | 4,000 | | | St. Shine Optical Co. Ltd. | | | 114,215 | | |
| | 33,000 | | | Taiwan Semiconductor Manufacturing Co. Ltd. | | | 116,815 | | |
| | | | | | | | 579,411 | | |
Thailand: 10.4% | | | |
| | 74,000 | | | Delta Electronics Thailand PCL/ Foreign | | | 120,481 | | |
| | 212,000 | | | LPN Development PCL/ Foreign | | | 100,000 | | |
| | 12,800 | | | PTT PCL/Foreign | | | 111,406 | | |
| | 368,000 | | | Thai Tap Water Supply PCL/Foreign | | | 111,990 | | |
| | | | | | | | 443,877 | | |
United States: 2.8% | | | |
| | 1,600 | | | QUALCOMM Inc. | | | 118,800 | | |
| | | | | Total Common Stocks
(costs $3,688,684) | | | 4,174,772 | | |
| | | | | Total Investments in Securities
(costs $3,688,684): 98.1% | | | 4,174,772 | | |
| | | | | Other Assets less Liabilities: 1.9% | | | 78,979 | | |
| | | | | Net Assets: 100.0% | | $ | 4,253,751 | | |
ADR - American Depository Receipt
REIT - Real Estate Investment Trust
The accompanying notes are an integral part of these financial statements.
27
CHINA & HONG KONG FUND for the period ended December 31, 2013
1. Performance
AVERAGE ANNUALIZED TOTAL RETURNS
| | | 1 Year
(Actual) | | 3 Years | | 5 Years | | 10 Years | |
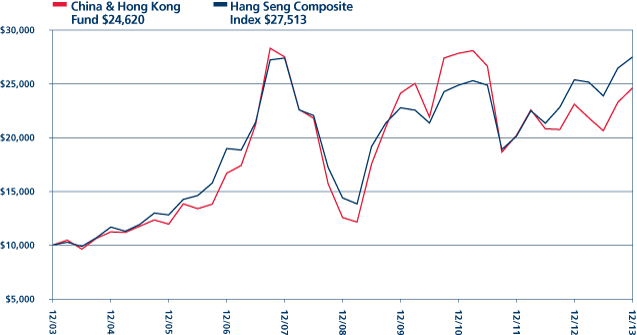
Fund | | | 6.45 | % | | | -4.07 | % | | | 14.45 | % | | | 9.44 | % | |
Benchmark Index: | |
Hang Seng Index | | | 6.52 | % | | | 4.00 | % | | | 13.80 | % | | | 9.99 | % | |
Hang Seng Composite Index | | | 8.11 | % | | | 3.39 | % | | | 13.78 | % | | | 10.66 | % | |
S&P 500 Index | | | 32.38 | % | | | 16.16 | % | | | 17.92 | % | | | 7.40 | % | |
The Fund's gross expense ratio is 1.52% per the Summary Prospectus dated May 1, 2013. The Advisor has contractually agreed to waive a portion of its advisory fees and/or reimburse other Fund expenses so that the Fund's ratio of expenses to average daily net assets will not exceed 1.98% (excluding Acquired Fund Fees and Expenses, interest, taxes, dividends on short positions and extraordinary expenses) through at least June 30, 2014. To the extent that the Advisor waives fees and/or reimburses expenses, it may seek repayment of a portion or all of such amounts at any time within the three fiscal years after the fiscal year in which such amounts were waived and/or reimbursed, subject to the applicable cap.
Performance data quoted represents past performance and does not guarantee future results. The investment return and principal value of an investment in the Fund will fluctuate so that an investor's shares, when redeemed, may be worth more or less than their original cost. Current performance of the Fund may be lower or higher than the performance quoted. Performance data current to the most recent month-end may be obtained by visiting www.gafunds.com, or calling (800) 915-6565.
The Fund imposes a 2% redemption fee on the sale of shares held less than 30 days. Performance data quoted does not reflect this redemption fee. Total returns for certain periods reflect expense limitations in effect and, in the absence of these limitations, total returns would have been lower.
The Fund ended the year up 6.45% compared to the Hang Seng index up 6.52% and the Hang Seng Composite up 8.11%. Hong Kong and China stocks had a better second half of the year as a reform framework emerged following the CCP plenum. Over the second half of 2013 the Fund rose 19.14% compared to the benchmark which rose 15.12%
Economic momentum turned positive in June and remained positive for the rest of the year. Exports and imports reached $4.16 trillion making China the world's largest trader of goods and the renminbi overtook the Euro in October to become the second most used currency in trade settlement. There was also positive momentum in manufacturing and purchasing managers indices indicated expansion. At the same time there seemed to be little inflationary pressure in producer or consumer prices.
There was a significant government meeting in November at which an economic roadmap was laid out covering the next ten years. There was of course not a great level of detail in how the goals are to be achieved but the scale and ambition are impressive. If only half is achieved China's economy will be transformed, as profoundly as it has been over the past twenty years. The program addresses governmental reform, financial sector de-regulation, energy and environmental issues, welfare, pensions, industrial planning and state-owned enterprise reform. The issues of corruption, excessive debt financed investment and environmental damage are also tackled.
Investors were impressed but as doubts once again re-emerged and market rally that followed the meeting petered out. However, as we have argued all along this is not a program that can be delivered in a neat little package in a couple of weeks but there is ample evidence that the government is set on its course. We have already seen a definitive move to rein in credit (discussed in the Renminbi Yuan & Bond Fund letter) and we have also seen high profile moves against corruption. At the time of writing we are seeing action on SOE reform in the oil and telecom sectors.
2. Portfolio Position
At the end of 2013 the portfolio was most heavily exposed to Technology, Industrials, Financials, Consumer discretionary and Energy. Since the middle of the year energy exposure has reduced in favour of consumer discretionary stocks and to industrial stocks whose weight in the portfolio increased as stock prices rebounded. Since the end of the year we have cut back exposure to
28
certain industrial and energy stocks and have cut back the positions in some of the Fund's top performers to move into banking names that trade at exceptionally low valuations.
3. Outlook
At the time of writing valuations of Chinese stocks traded internationally are at multi-year lows on an earnings, cash flow or book value basis. Clearly investors are sceptical about the quality of earnings and cash flows and we believe this is attributable to concerns about slower economic growth, debt and the integrity of China's financial system.
We believe these fears are significantly overdone: slower growth does not automatically equal lower earnings. Not all companies depend on 10% growth for profits and in any case, economic growth is still projected to above 7%. The debt burden has been a concern but closer examination suggests that the burden is manageable but it is the growth rate we should focus on. In this respect we have already seen a marked slowdown in credit growth from almost 14% in 2012 to approximately 4.5% in 2013. Moves to restrain banks further are discussed in the Renminbi Yuan & Bond Fund letter.
We therefore believe that there are significant opportunities amongst Chinese stocks. We have already increased exposures to Chinese banks which we believe have more than priced in bad debt risks. We also expect that China's reform programme and China's demographic profile which is changing inexorably will also provide opportunities. For example the declines in the population group aged 15 -39 years old will be matched by the growth in the 40-65 year old segment. The consumption patterns of the two groups are different and over the long term will likely drive the services and consumer side of China's economy.
China's economic transformation programme will take time but we believe that time is on China's side so long as that time is not squandered. The signs are there that momentum is building.

Edmund Harriss
The Fund invests in foreign securities, which involves political, economic and currency risks, greater volatility, and differences in accounting methods. These risks are greater for emerging markets. The Fund is non-diversified, meaning that its assets may be concentrated in fewer individual holdings than diversified funds. Therefore, the Fund is more exposed to individual stock volatility than diversified funds. Investments focused in a single geographic region may be exposed to greater risk and more volatility than investments diversified among various geographies. The Fund invests in smaller companies, which involves additional risks such as limited liquidity and greater volatility.
The Hang Seng Composite Index is a market capitalization-weighted index that is comprised of the top 200 companies listed on the Hong Kong Stock Exchange, based on the average market capitalization for the past twelve months. The Hang Seng Index is a barometer of the Hong Kong Stock Market, whose aggregate market capitalization accounts for about 70% of the total market-capitalization of the Stock Exchange of Hong Kong Limited. The Standard & Poor's 500 Index is a market capitalization-weighted index composed of 500 widely held common stocks of U.S. companies. These indices are unmanaged and not available for investment, and do not incur expenses.
Please refer to the Schedule of Investments for details on Fund holdings. Current and future portfolio holdings are subject to risk.
The information provided herein represents the opinion of Guinness Atkinson Asset Management, Inc. for the period stated and is not intended to be a forecast of future events, a guarantee of future results, or investment advice. Opinions, Fund holdings and sector allocations are subject to change at any time, and are not recommendations to buy or sell any security.
29
GUINNESS ATKINSON CHINA & HONG KONG FUND
Growth of $10,000
Average Annual Total Return
Periods Ended December 31, 2013
| One Year | | Five Years | | Ten Years | |
| | 6.45 | % | | | 14.45 | % | | | 9.44 | % | |
Performance data quoted represents past performance and does not guarantee future results. The investment return and principal value of an investment will fluctuate so that an investor's shares, when redeemed, may be worth more or less than their original cost. Current performance of the Fund may be lower or higher than the performance quoted. Performance data current to the most recent month end may be obtained by visiting www.gafunds.com.
Total returns for certain periods reflect a fee waiver in effect and in the absence of this waiver, the total returns would be lower. Returns reflect the reinvestment of distributions made by the Fund, if any. The graph and the performance table above do not reflect the deduction of taxes that a shareholder would pay on Fund distribution or the redemption of Fund shares. The Fund imposes a 2% redemption fee on shares held less than 30 days.
The Hang Seng Composite Index is a market-capitalization weighted index that comprises the top 200 companies listed on the Hong Kong Stock Exchange, based on the average market capitalization for the past twelve months. The index referenced in this chart is not available for investment and does not incur expenses.
30
FUND HIGHLIGHTS at December 31, 2013
GUINNESS ATKINSON CHINA & HONG KONG FUND
# of Holdings in Portfolio: | | | 33 | | |
Portfolio Turnover: | | | 6.9 | % | |
% of Stocks in Top 10: | | | 47.6 | % | |
Fund Manager: | |
Edmund Harriss | |
Top 10 Holdings (% of net assets) | |
Tencent Holdings Ltd. | | | 7.3 | % | | Soho China Ltd. | | | 4.5 | % | |
Galaxy Entertainment Group Ltd. | | | 6.2 | % | | Beijing Enterprises Holdings Ltd. | | | 4.0 | % | |
Lenovo Group Ltd. | | | 5.6 | % | | Kunlun Energy Co., Ltd. | | | 3.8 | % | |
NetEase Inc - ADR | | | 4.8 | % | | BOC Hong Kong Holdings Ltd. | | | 3.5 | % | |
CNOOC Ltd. | | | 4.5 | % | | HSBC Holdings PLC | | | 3.4 | % | |
Sector Breakdown (% of net assets) | |
Commercial Banks | | | 15.6 | % | | Web Portals/ISP | | | 2.9 | % | |
Oil Company - Exploration & Production | | | 8.3 | % | | Auto/Truck Parts & Equipment | | | 2.8 | % | |
Internet Application Software | | | 7.3 | % | | Retail - Automobile | | | 2.7 | % | |
Casino Hotels | | | 6.2 | % | | Airlines | | | 2.5 | % | |
Building Products | | | 5.8 | % | | Electronic Component - Miscellaneous | | | 2.5 | % | |
Computers | | | 5.6 | % | | Auto-Cars/Light Trucks | | | 2.4 | % | |
Internet Content - Entertainment | | | 4.8 | % | | Exchange Traded Funds | | | 2.3 | % | |
Real Estate Operations/Development | | | 4.5 | % | | Metal - Copper | | | 2.1 | % | |
Gas - Distribution | | | 4.0 | % | | Chemicals - Other | | | 1.9 | % | |
Telecommunication Equipment | | | 3.3 | % | | Power Converson/Supply Equipment | | | 1.8 | % | |
Cellular Telecommunications | | | 3.2 | % | | Public Thoroughfares | | | 1.1 | % | |
Coal | | | 3.1 | % | | Machinery - General Industries | | | 0.7 | % | |
Oil Company - Integrated | | | 3.0 | % | | | | | | | | | |
31
SCHEDULE OF INVESTMENTS
December 31, 2013
GUINNESS ATKINSON CHINA & HONG KONG FUND
Shares | | COMMON STOCKS: 100.4% | | Value | |
Airlines: 2.5% | | | |
| | 1,306,000 | | | Cathay Pacific Airways Ltd. | | $ | 2,762,132 | | |
Auto/Truck Parts & Equipment: 2.8% | | | |
| | 750,120 | | | Weichai Power Co., Ltd. - H Shares | | | 3,023,000 | | |
Auto – Cars/Light Trucks: 2.4% | | | |
| | 5,500,000 | | | Geely Automobile Holdings Ltd. | | | 2,659,815 | | |
Building Products: 5.8% | | | |
| | 733,000 | | | Anhui Conch Cement Co Ltd. - H Shares | | | 2,717,686 | | |
| | 5,256,000 | | | China Lesso Group Holdings Ltd. | | | 3,660,214 | | |
| | | | | | | | 6,377,900 | | |
Casino Hotels: 6.2% | | | |
| | 762,000 | | | Galaxy Entertainment Group Ltd.* | | | 6,834,543 | | |
Cellular Telecommunications: 3.2% | | | |
| | 344,000 | | | China Mobile Ltd. | | | 3,566,744 | | |
Chemicals – Other: 1.9% | | | |
| | 780,000 | | | Kingboard Chemical Holdings Ltd. | | | 2,036,934 | | |
Coal: 3.1% | | | |
| | 689,000 | | | China Shenhua Energy Co Ltd. - H Shares | | | 2,172,479 | | |
| | 1,366,200 | | | Yanzhou Coal Mining Co., Ltd. - H Shares | | | 1,247,398 | | |
| | | | | | | | 3,419,876 | | |
Commercial Banks: 15.6% | | | |
| | 1,192,000 | | | BOC Hong Kong Holdings Ltd. | | | 3,819,971 | | |
| | 4,763,670 | | | China Construction Bank Corp. - H Shares | | | 3,593,809 | | |
| | 113,281 | | | Dah Sing Financial Holdings Ltd. | | | 649,361 | | |
| | 347,027 | | | HSBC Holdings PLC | | | 3,765,952 | | |
| | 5,386,330 | | | Industrial & Commercial Bank of China - H Shares | | | 3,639,835 | | |
| | 108,400 | | | Wing Hang Bank Ltd. | | | 1,635,583 | | |
| | | | | | | | 17,104,510 | | |
Computers: 5.6% | | | |
| | 5,063,000 | | | Lenovo Group Ltd. | | | 6,157,112 | | |
Electronic Component – Miscellaneous: 2.5% | | | |
| | 565,000 | | | AAC Technologies Holdings Inc. | | | 2,743,284 | | |
Exchange Traded Funds (ETFs): 2.3% | | | |
| | 3,443,900 | | | db x-trackers CSI300 INDEX ETF | | | 2,491,557 | | |
Gas – Distribution: 4.0% | | | |
| | 441,000 | | | Beijing Enterprises Holdings Ltd. | | | 4,373,432 | | |
Internet Application Software: 7.3% | | | |
| | 126,500 | | | Tencent Holdings Ltd. | | | 8,068,672 | | |
The accompanying notes are an integral part of these financial statements.
32
Shares | | COMMON STOCKS: 100.4% (Continued) | | Value | |
Internet Content – Entertainment: 4.8% | | | |
| | 67,455 | | | NetEase Inc. - ADR | | $ | 5,301,963 | | |
Machinery – General Industries 0.7% | | | |
| | 2,430,000 | | | Chen Hsong Holdings | | | 758,366 | | |
Metal – Copper: 2.1% | | | |
| | 1,301,000 | | | Jiangxi Copper Co., Ltd. - H Shares | | | 2,348,890 | | |
Oil Company – Integrated: 3.0% | | | |
| | 2,994,000 | | | PetroChina Co., Ltd. - H Shares | | | 3,281,921 | | |
Oil Company – Exploration & Production: 8.3% | | | |
| | 2,683,000 | | | CNOOC Ltd. | | | 4,989,343 | | |
| | 2,362,000 | | | Kunlun Energy Co., Ltd. | | | 4,160,907 | | |
| | | | | | | | 9,150,250 | | |
Power Conversion/Supply Equipment: 1.8% | | | |
| | 1,154,000 | | | Dongfang Electric Corp., Ltd. - H Shares | | | 2,023,961 | | |
Public Thoroughfares: 1.1% | | | |
| | 2,610,000 | | | Shenzhen Expressway Co., Ltd. - H Shares | | | 1,174,690 | | |
Real Estate Operations/Development: 4.5% | | | |
| | 5,714,500 | | | Soho China Ltd. | | | 4,922,799 | | |
Retail – Automobile: 2.7% | | | |
| | 3,100,000 | | | Baoxin Auto Group Ltd. | | | 3,010,330 | | |
Telecommunication Equipment: 3.3% | | | |
| | 276,300 | | | VTech Holdings Ltd. | | | 3,588,127 | | |
Web Portals/ISP: 2.9% | | | |
| | 43,250 | | | Sohu.com Inc.* | | | 3,154,223 | | |
| | | | | Total Common Stocks
(costs $69,867,050) | | | 110,335,029 | | |
| | | | | Total Investments in Securities
(costs $69,867,050): 100.4% | | | 110,335,029 | | |
| | | | | Liabilities in Excess of Other Assets: (0.4%) | | | (481,031 | ) | |
| | | | | Net Assets: 100.0% | | $ | 109,853,998 | | |
* Non-income producing security.
ADR - American Depository Receipt
The accompanying notes are an integral part of these financial statements.
33
GLOBAL ENERGY FUND for the period ended December 31, 2013
1. Performance
AVERAGE ANNUALIZED TOTAL RETURNS
| | | 1 Year
(actual) | | 3 Years | | 5 Years | | Since
Inception
(June 30, 2004) | |
Fund | | | 24.48 | % | | | 3.83 | % | | | 16.34 | % | | | 13.41 | % | |
Benchmark Index: | |
S&P 500 Index | | | 32.38 | % | | | 16.16 | % | | | 17.92 | % | | | 7.41 | % | |
MSCI World Energy Index | | | 18.98 | % | | | 7.11 | % | | | 11.97 | % | | | 10.51 | % | |
The Fund's gross expense ratio is 1.35% per the Summary Prospectus dated May 1, 2013. The Advisor has contractually agreed to waive a portion of its advisory fees and/or reimburse other Fund expenses so that the Fund's ratio of expenses to average daily net assets will not exceed 1.45% (excluding Acquired Fund Fees and Expenses, interest, taxes, dividends on short positions and extraordinary expenses) through at least June 30, 2014. To the extent that the Advisor waives fees and/or reimburses expenses, it may seek repayment of a portion or all of such amounts at any time within the three fiscal years after the fiscal year in which such amounts were waived and/or reimbursed, subject to the applicable cap.
Performance data quoted represents past performance and does not guarantee future results. The investment return and principal value of an investment in the Fund will fluctuate so that an investor's shares, when redeemed, may be worth more or less than their original cost. Current performance of the Fund may be lower or higher than the performance quoted. Performance data current to the most recent month-end may be obtained by visiting www.gafunds.com, or calling (800) 915-6565.
The Fund imposes a 2% redemption fee on the sale of shares held less than 30 days. Performance data quoted does not reflect this redemption fee. Total returns for certain periods reflect expense limitations in effect and in the absence of these limitations, total returns would have been lower.
The Global Energy Fund in 2013 produced a total return of 24.48%. This compares to the total return of the MSCI World Energy Index of 18.98% and the S&P 500's total return of 32.38%.
Whereas 2011 and 2012 were characterised by the contrasting fortunes of energy subsectors, performance in 2013 was marked more by geographical boundaries. Simply speaking, 2013 was strong year for the US oil and gas industry and a relatively weak one for those operating outside the US. Notably, there were a swathe of restructurings (asset disposals, spin offs and corporate splits), improved capital discipline (higher dividends and share buybacks) and improved capital efficiency (lower well costs and better productivity) for the US large and mid-cap exploration and production sector. In the Fund, Carrizo (+114.0%), Penn Virginia (+113.8%) and Stone Energy (68.6%) were particular beneficiaries of these trends.
The benign environment for Exploration & Production (E&P) companies had positive knock-on effects for onshore US service companies, which fed off the higher level of productive activity. Halliburton (+48.0%) and Patterson (+37.1%) profited, in particular, from an improvement in pressure pumping margins as the oversupply issues experienced in 2012 moderated.
Meanwhile the US independent refining sector enjoyed a third year of strong refining margins helped by the wide spread between West Texas Intermediate (WTI) and Brent benchmarks, which showed up in Valero's strong returns (+65.0%).
Across the US energy sector, we also saw a much higher frequency of shareholder activism. In the Fund, activist shareholders took meaningful positions to enforce restructuring in mid cap E&Ps Chesapeake (+66.1%) and Hess Corp (+58.2%).
Outside the US, disappointing share price performance for many companies was driven by exploration disappointments in Africa, oil development projects being delayed and cancelled in the North Sea and other deeper water areas, European refining margins remaining weak, Canadian oil realisations being depressed and national oil companies suffering at the hands of their governments. The portfolio was exposed to the latter via Petrochina (-19.3%), as expensive imports of natural gas into China depressed earnings, whilst holdings in large cap integrated oil and gas companies, particularly in Europe (Statoil +2.3%, ENI +5.7%, Royal Dutch Shell +9.9%), lagged as large development projects overran.
One bright spot outside the US was the recovery in the solar industry, part of a wider revival in alternative energy seen during the year. Trina (+215.0%) and JA Solar (+114.8%) were a relatively small part of the portfolio, but both rose on the expectation that they will return to profitability in 2014 (having been loss making in 2012 and 2013) as growing domestic demand for solar in China catches up with overcapacity.
34
2. Activity
In May, we sold our position in CST Brands, a company spun out from our holding in US refining stock, Valero. CST's business is fuel retailing. The stock performed well in the few weeks after its spin off and we took the decision to take profits and reinvest in our core Valero position.
In June, we sold our half positions in Afren and Petrominerales. Afren had been a good performer since we upgraded it from a research position in late 2010 and we felt the time had come to take profits. Petrominerales has been a disappointment, with poor drilling results over the 12 months prior to sale. The prospects for the company became too unpredictable for us to maintain it in the portfolio.
We switched those funds into a position in Shawcor, a Canadian energy services company with specialism in oil and gas pipe coating materials. The company has a dominant position globally in various coating and related sectors, including the provision of corrosion protection, insulation, weighting and flow efficiency for pipes, as well as inspection and joint protection. We are attracted by a number of opportunities for growth that the company has, particularly as the number of deepwater and liquefied natural gas (LNG) projects expands. With a high free cashflow yield, we also see Shawcor as attractively priced.
In September, we upgraded our half position in Gazprom to a full position. Gazprom has underperformed the energy sector for the last 18 months, leaving the stock looking particularly good value. With positive reforms to the domestic Russian natural gas price, new gas sales contracts being signed between the Gazprom and CNPC, and demand from Europe remaining strong, we believe the company is due a re-rating.
3. Portfolio Position
The Fund at December 31, 2013 was on an average price to earnings ratio (P/E) versus the S&P 500 Index at 1,806 as set out in the table. (Based on S&P 500 'operating' earnings per share estimates of $49.5 for 2008, $56.9 for 2009, $83.8 for 2010, $96.4 for 2011, $96.8 for 2012 and $106.2 for 2013). This is shown in the following table:
| | | 2008 | | 2009 | | 2010 | | 2011 | | 2012 | | 2013 | |
Fund PER | | | 9.4 | | | | 16.3 | | | | 10.6 | | | | 10.3 | | | | 11.5 | | | | 12.1 | | |
S&P 500 PER | | | 37.3 | | | | 32.5 | | | | 22.1 | | | | 19.2 | | | | 19.1 | | | | 17.4 | | |
Premium (+)/Discount (-) | | | -75 | % | | | -50 | % | | | -52 | % | | | -46 | % | | | -40 | % | | | -30 | % | |
Average oil price (WTI $) | | $ | 99.9/ | bbl | | $ | 61.9/ | bbl | | $ | 79.5/ | bbl | | $ | 95/ | bbl | | $ | 94/ | bbl | | $ | 98/ | bbl | |
Source: Standard and Poor's; Guinness Atkinson Asset Management Ltd
The sector and geographic weightings of the portfolio at December 31, 2013 were as follows:
Sector Breakdown | |
| | | Dec. 31, 2012 | | Dec. 31, 2013 | |
Integrated | | | 39.0 | | | | 39.8 | | |
Exploration & Production | | | 41.3 | | | | 37.1 | | |
Drilling | | | 7.4 | | | | 6.9 | | |
Equipment & Services | | | 7.1 | | | | 9.0 | | |
Refining & Marketing | | | 3.4 | | | | 3.4 | | |
Solar | | | 1.2 | | | | 2.9 | | |
Coal & Consumables | | | 0.0 | | | | 0.0 | | |
Construction & Engineering | | | 0.6 | | | | 0.9 | | |
Total | | | 100.0 | | | | 100.0 | | |
35
Geographic Breakdown | |
| | | Dec. 31, 2012 | | Dec. 31, 2013 | |
US | | | 57.7 | | | | 57.2 | | |
Canada | | | 8.5 | | | | 10.0 | | |
UK | | | 11.6 | | | | 9.4 | | |
Latin America | | | — | | | | — | | |
Europe | | | 16.8 | | | | 16.9 | | |
Hong Kong | | | 3.6 | | | | 3.1 | | |
Russia | | | 1.8 | | | | 3.2 | | |
Other | | | — | | | | 0.2 | | |
Total | | | 100.0 | | | | 100.0 | | |
4. Market Background
Analysis of the oil price has been complicated by the dislocation between Brent and WTI that started at the beginning of 2010. Below we discuss both benchmarks.
Having averaged $112 in 2012, Brent oil averaged slightly lower in 2013 at $109. Bar a short-lived dip below $100 in April, Brent traded in a relatively tight band over the year between $100 and $120, a range which most Organization of the Petroleum Exporting Countries (OPEC) members seem comfortable with. WTI averaged $98 in 2012, $10 lower than Brent. The spread between WTI and Brent, driven principally by an oversupply of US domestically produced oil and a shortage of suitable refining capacity, narrowed from $18 in 2012 but looks to persist for some time to come.
On the supply side, US onshore oil production grew strongly again, up 1m b/day, whilst other non-OPEC oil production rose by just 0.3m b/day. The growth in non-OPEC supply was somewhat offset by lower OPEC production, with sanctions causing Iranian production to drift lower, Libyan production dropping as much as 1m b/day in the second half of the year as tensions rose and Iraqi supply stalled.
The weakening of several emerging market currencies against the dollar likely had a dampening effect on oil demand, with the oil price in some of those countries reaching record highs, but non-OECD demand growth was still healthy at 1.2m b/day. Perhaps more surprising was the strength of OECD demand, flat overall and the first year since 2010 that it has not declined. Total world oil demand grew to a new high of 91.2m b/day, 4m b/day higher than the pre-recession peak in 2007.
The combination of strong demand and moderate supply growth resulted in a tightening of OECD oil inventories in the middle of the year. Similar to 2012, this was addressed by higher production from Saudi, which co-ordinated an effort to keep the price high but affordable.
2013 saw a second year of good recovery for US natural gas, averaging $3.73/mcf versus $2.75 last year. The price generally traded between $3 and $4, but broke out twice above $4, pushed higher by colder than average weather at the end the 2012/13 winter and at the start of the 2013/14 winter. Onshore gas production growth, the main cause of the depressed price over the last three years, moderated, but associated gas from oil production accelerated, as did production from the prolific Marcellus field in the northeast of the country.
Outside the US, gas prices continued to remain very firm, with European and Asian prices at around $10-11/mcf and $15-17/mcf. Global natural gas demand grown by around 3% in 2013, supporting the development of new offshore gas fields which are being commercialised via LNG technology.
36
5. Outlook
The future of energy equities will continue to be determined by expectations of the likely medium to long term level of the oil and gas price.
We expect oil to remain relatively strong in 2014 and forecast a trading range of $90-$110, with Brent likely averaging towards the higher end of this range. Saudi could remain in over-production mode for as long as supply remains fairly tight, whilst their ability to put a floor under the price should Brent fall much below $100 remains strong.
The energy markets are still cautious; the Brent oil forward curve implies a price of around $80 in real terms in 2018 while our portfolio of energy equities trades on a 2014 consensus P/E ratio of just 11.2x, well below the broad market's P/E ratio of 15.9x (valuations at December 31, 2013). We believe that oil prices are more likely to be around $120 in real terms, and even higher in nominal terms, at the end of the decade. If we are right, and oil prices are nearly 50% higher than the forward curve implies, then we expect energy equities to rerate versus the broad market. We have positioned the Fund to potentially take advantage of the commodity price environment outlined above.

Tim Guinness | | January 2014 | |

| | 
| |
Will Riley | | Jonathan Waghorn | |
Fund investment team
The Fund invests in foreign securities, which involves political, economic and currency risks, greater volatility, and differences in accounting methods. These risks are greater for emerging markets. The Fund is non-diversified, meaning that its assets may be concentrated in fewer individual holdings than diversified funds. Therefore, the Fund is more exposed to individual stock volatility than diversified funds. The Fund invests in smaller companies, which involves additional risks such as limited liquidity and greater volatility. The Fund's focus on the energy sector to the exclusion of other sectors exposes the Fund to greater market risk and potential monetary losses than if the Fund's assets were diversified among various sectors.
The MSCI World Energy Index is an unmanaged index composed of more than 1,400 stocks listed on exchanges in the U.S., Europe, Canada, Australia, New Zealand and the Far East. The Standard & Poor's 500 Index is a market capitalization-weighted index composed of 500 widely held common stocks of U.S. companies. These indices are unmanaged and not available for investment, and do not incur expenses.
Price to earnings (P/E) ratio (PER) reflects the multiple of earnings at which a stock sells and is calculated by dividing current price of the stock by the company's trailing 12 months' earnings per share. Free cash flow is a measure of financial performance calculated as operating cash flow minus capital expenditures.
Please refer to the Schedule of Investments for details on Fund holdings. Current and future portfolio holdings are subject to risk.
The information provided herein represents the opinion of Guinness Atkinson Asset Management, Inc. for the period stated and is not intended to be a forecast of future events, a guarantee of future results, or investment advice. Opinions, Fund holdings and sector allocations are subject to change at any time, and are not recommendations to buy or sell any security.
37
GUINNESS ATKINSON GLOBAL ENERGY FUND
Growth of $10,000
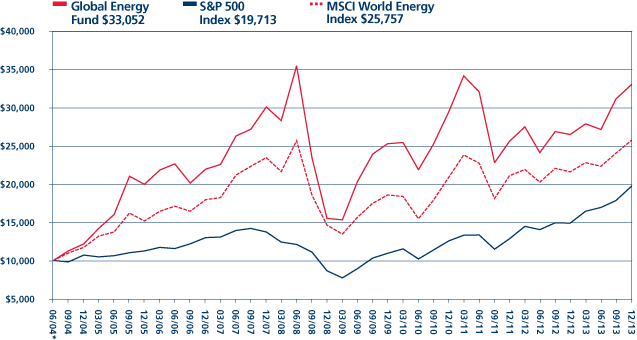
Average Annual Total Return
Periods Ended December 31, 2013
| One Year | | Five Years | | Since Inception
(06/30/04) | |
| | 24.48 | % | | | 16.34 | % | | | 13.41 | % | |
*Inception date 06/30/04.
Performance data quoted represents past performance and does not guarantee future results. The investment return and principal value of an investment will fluctuate so that an investor's shares, when redeemed, may be worth more or less than their original cost. Current performance of the Fund may be lower or higher than the performance quoted. Performance data current to the most recent month end may be obtained by visiting www.gafunds.com.
Total returns for certain periods reflect a fee waiver in effect and in the absence of this waiver, the total returns would be lower. Returns reflect the reinvestment of distributions made by the Fund, if any. The graph and the performance table above do not reflect the deduction of taxes that a shareholder would pay on Fund distribution or the redemption of Fund shares. The Fund imposes a 2% redemption fee on shares held less than 30 days.
The MSCI World Energy Index is an unmanaged index composed of more than 1,400 stocks listed on exchanges in the U.S., Europe, Canada, Australia, New Zealand and the Far East.
The S&P 500 Index is a broad based unmanaged index of 500 stocks, which is widely recognized as representative of the equity market in general. These indices are unmanaged, not available for investment and do not incur expenses.
38
FUND HIGHLIGHTS at December 31, 2013
GUINNESS ATKINSON GLOBAL ENERGY FUND
# of Holdings in Portfolio: | | | 46 | | |
Portfolio Turnover: | | | 8.2 | % | |
% of Stocks in Top 10: | | | 34.4 | % | |
Fund Managers:
Timothy W. N. Guinness | |
Will Riley | |
Jonathan Waghorn | |
Top 10 Holdings (% of net assets) | | | | | | | |
Canadian Natural Resource Ltd. | | | 3.5 | % | | Valero Energy Corp. | | | 3.4 | % | |
Total SA | | | 3.5 | % | | Statoil ASA | | | 3.4 | % | |
Unit Corp | | | 3.5 | % | | Patterson - UTI Energy, Inc. | | | 3.4 | % | |
Royal Dutch Shell PLC - Class A | | | 3.5 | % | | Chesapeake Energy Corp. | | | 3.4 | % | |
Hess Corp. | | | 3.4 | % | | Devon Energy Corp. | | | 3.4 | % | |
Sector Breakdown (% of net assets) | | | | | | | |
Oil & Gas - Integrated | | | 42.8 | % | | Oil Refining & Marketing | | | 3.4 | % | |
Oil & Gas - Exploration & Production | | | 36.7 | % | | Energy - Alternate Sources | | | 2.8 | % | |
Oil & Gas - Field Services | | | 9.8 | % | | Machinery - General Industries | | | 0.1 | % | |
Oil & Gas - Drilling | | | 3.7 | % | | | | | |
39
SCHEDULE OF INVESTMENTS
December 31, 2013
GUINNESS ATKINSON GLOBAL ENERGY FUND
Shares | | COMMON STOCKS: 99.3% | | Value | |
Energy – Alternate Sources: 2.8% | | | |
| | 111,420 | | | JA Solar Holdings Co. Ltd. - ADR* | | $ | 1,021,721 | | |
| | 75,900 | | | Trina Solar Ltd. - ADR* | | | 1,037,553 | | |
| | | | | | | | 2,059,274 | | |
Machinery – General Industries: 0.1% | | | |
| | 182,956 | | | Shandong Molong Petroleum Machinery Co., Ltd. - H Shares | | | 70,311 | | |
Oil & Gas – Drilling: 3.7% | | | |
| | 3,124,988 | | | Cluff Natural Resources PLC* | | | 226,400 | | |
| | 96,670 | | | Patterson-UTI Energy, Inc. | | | 2,447,684 | | |
| | | | | | | | 2,674,084 | | |
Oil & Gas – Exploration & Production: 36.7% | | | |
| | 26,609 | | | Apache Corp. | | | 2,286,777 | | |
| | 31,500 | | | Bill Barrett Corp.* | | | 843,570 | | |
| | 74,800 | | | Canadian Natural Resource Ltd. | | | 2,530,771 | | |
| | 27,470 | | | Carrizo Oil & Gas Inc.* | | | 1,229,832 | | |
| | 89,900 | | | Chesapeake Energy Corp. | | | 2,439,886 | | |
| | 39,200 | | | Devon Energy Corp. | | | 2,425,304 | | |
| | 120,550 | | | Dragon Oil PLC | | | 1,132,876 | | |
| | 575,230 | | | JKX Oil & Gas PLC* | | | 681,078 | | |
| | 79,486 | | | Newfield Exploration Co.* | | | 1,957,740 | | |
| | 32,170 | | | Noble Energy Inc. | | | 2,191,099 | | |
| | 46,199 | | | Ophir Energy PLC* | | | 250,779 | | |
| | 113,900 | | | Penn Virginia Corp.* | | | 1,074,077 | | |
| | 28,500 | | | QEP Resources Inc. | | | 873,525 | | |
| | 477,472 | | | Sino Gas & Energy Holdings Ltd.* | | | 85,267 | | |
| | 222,528 | | | Sino Gas & Energy Holdings Ltd. (new)* | | | 39,739 | | |
| | 169,800 | | | SOCO International PLC | | | 1,111,230 | | |
| | 37,100 | | | Stone Energy Corp.* | | | 1,283,289 | | |
| | 25,000 | | | Triangle Petroleum Corp.* | | | 208,000 | | |
| | 119,408 | | | Trinity Exploration & Production PLC* | | | 275,345 | | |
| | 39,400 | | | Ultra Petroleum Corp* | | | 853,010 | | |
| | 48,397 | | | Unit Corp* | | | 2,498,253 | | |
| | 254,740 | | | WesternZagros Resources Ltd.* | | | 232,617 | | |
| | | | | | | | 26,504,064 | | |
Oil & Gas – Field Services: 9.8% | | | |
| | 43,300 | | | Halliburton Co. | | | 2,197,475 | | |
| | 90,680 | | | Helix Energy Solutions Group, Inc.* | | | 2,101,962 | | |
| | 64,900 | | | Kentz Corp Ltd. | | | 679,221 | | |
| | 53,000 | | | ShawCor Ltd. DL | | | 2,119,501 | | |
| | | | | | | | 7,098,159 | | |
The accompanying notes are an integral part of these financial statements.
40
Shares | | COMMON STOCKS: 99.3% (Continued) | | Value | |
Oil & Gas – Integrated: 42.8% | | | |
| | 292,000 | | | BP PLC | | $ | 2,359,916 | | |
| | 18,800 | | | Chevron Corp. | | | 2,348,308 | | |
| | 33,328 | | | ConocoPhillips | | | 2,354,623 | | |
| | 98,600 | | | ENI SpA | | | 2,372,423 | | |
| | 23,800 | | | Exxon Mobil Corp. | | | 2,408,560 | | |
| | 268,000 | | | Gazprom OAO - ADR | | | 2,291,400 | | |
| | 29,943 | | | Hess Corp. | | | 2,485,269 | | |
| | 48,638 | | | OMV AG | | | 2,327,853 | | |
| | 2,013,000 | | | PetroChina Co., Ltd. - H Shares | | | 2,206,582 | | |
| | 70,020 | | | Royal Dutch Shell PLC - Class A | | | 2,495,348 | | |
| | 101,650 | | | Statoil ASA | | | 2,463,613 | | |
| | 65,776 | | | Suncor Energy, Inc. | | | 2,305,953 | | |
| | 40,900 | | | Total SA | | | 2,505,540 | | |
| | | | | | | | 30,925,388 | | |
Oil Refining & Marketing: 3.4% | | | |
| | 48,999 | | | Valero Energy Corp. | | | 2,469,550 | | |
| | | | | Total Common Stocks
(costs $61,669,279) | | | 71,800,830 | | |
Warrants: 0.0% | | | |
| | 829,161 | | | Cluff Natural Resources, Expiration 5/22/15, Excerise price £0.10*†^ | | | — | | |
| | | | | Total Warrants
(costs $0) | | | — | | |
| | | | | Total Investments in Securities
(costs $61,669,279): 99.3% | | | 71,800,830 | | |
| | | | | Other Assets less Liabilities: 0.7% | | | 518,064 | | |
| | | | | Net Assets: 100.0% | | $ | 72,318,894 | | |
* Non-income producing security.
† Illiquid. Illiquid securities represent 0.0% of net assets.
^ Fair value under direction of the Board of Trustees. Fair valued securities represent 0.0% of net assets.
ADR - American Depository Receipt
The accompanying notes are an integral part of these financial statements.
41
GLOBAL INNOVATORS FUND for the period ended December 31, 2013
1. Performance
AVERAGE ANNUALIZED TOTAL RETURNS
| | | 1 Year
(actual) | | 3 Years | | 5 Years | | 10 Years | |
Fund | | | 45.29 | % | | | 17.66 | % | | | 22.57 | % | | | 10.42 | % | |
Benchmark Index: | |
MSCI WORLD INDEX | | | 27.49 | % | | | 12.25 | % | | | 15.81 | % | | | 7.71 | % | |
S&P 500 INDEX | | | 32.38 | % | | | 16.16 | % | | | 17.92 | % | | | 7.40 | % | |
NASDAQ COMPOSITE INDEX | | | 40.17 | % | | | 17.85 | % | | | 22.95 | % | | | 8.83 | % | |
The Fund's gross expense ratio is 1.51% per the Summary Prospectus dated May 1, 2013. The Advisor has contractually agreed to waive a portion of its advisory fees and/or reimburse other Fund expenses so that the Fund's ratio of expenses to average daily net assets will not exceed 1.55% (excluding Acquired Fund Fees and Expenses, interest, taxes, dividends on short positions and extraordinary expenses) through at least June 30, 2014. To the extent that the Advisor waives fees and/or reimburses expenses, it may seek repayment of a portion or all of such amounts at any time within the three fiscal years after the fiscal year in which such amounts were waived and/or reimbursed, subject to the applicable cap.
Performance data quoted represents past performance and does not guarantee future results. The investment return and principal value of an investment in the Fund will fluctuate so that an investor's shares, when redeemed, may be worth more or less than their original cost. Current performance of the Fund may be lower or higher than the performance quoted. Performance data current to the most recent month-end may be obtained by visiting www.gafunds.com, or calling (800) 915-6565.
The Fund imposes a 2% redemption fee on the sale of shares held less than 30 days. Performance data quoted does not reflect this redemption fee. Total returns for certain periods reflect expense limitations in effect and, in the absence of these limitations, total returns would have been lower.
The Global Innovators Fund in 2013 produced a total return of 45.29%. The Fund outperformed the MSCI World Index by 17.80%; outperformed the S&P 500 Index by 12.91%; and outperformed the NASDAQ Index by 5.12% over the period.
Equity markets were very strong in 2013, and the Fund recorded a positive performance in all four individual quarters. The Fund was up 11.95%, 4.56%, 10.61%, and 12.23% in each of Q1, Q2, Q3, and Q4, respectively. The Fund only underperformed one of the indices in one quarter (the NASDAQ in Q3, and then only by 0.59%). The Fund outperformed all three indices in every other period.
Fund performance over the year was very strong. Our large overweight to the information technology sector aided performance, with good individual performances from our holdings in Applied Materials, Blucora, and PTC. However, the significant outperformance of the Fund versus its benchmarks was driven largely by stock selection in the consumer discretionary and financials sectors, neither of which was significantly overweight versus the MSCI World Index. The good recovery by BestBuy throughout the year and continued good stock price performance by H&R Block were the two companies that most added to performance in the consumer discretionary sector. All four financial companies held in the Fund throughout the year added positively to overall Fund performance; Capital One Financial, IntercontinentalExchange Group, State Street, and TD Ameritrade.
Our zero weighting to the utilities, materials, and consumer staples sectors helped performance relatively, as all three sectors underperformed in the year.
2. Activity
In the first three quarters of the year we did not make any changes to the portfolio. In the fourth quarter we made a number of sales and purchases in the portfolio; in October we sold our positions in Best Buy, Blucora, Honda Motor, Toyota Motor, Blackberry and Nokia. We replaced these companies with new holdings in Gannett, Lenovo, Qualcomm, Schneider Electric, Shire, Ubisoft, and Ultra Electronics.
The sales we made can be classified into three broad categories;
(i) taking profits in companies whose share prices had performed strongly and were no longer trading at attractive multiples compared to our expectations of future earnings growth (Best Buy, Blucora)
42
(ii) selling companies which had benefitted from a recent recovery in the economic outlook (Honda, Toyota)
(iii) selling distressed companies which had seen a recent boost in share price based on actual, or expected, M&A activity (Nokia, Blackberry)
The companies we bought all share the characteristics we look for when selecting stocks for the portfolio; good value, improving earnings expectations, innovation, low leverage and high returns on capital. A brief outline of each company is set out below.
• Ganett - US media company and publisher
• Lenovo - Hong Kong-listed computer manufacturer
• Qualcomm - US integrated circuit and system developer
• Schneider Electric - French-listed electrical component manufacturer
• Shire - UK-listed biopharmaceutical company
• Ubisoft - French-listed computer game designer
• Ultra Electronics - UK-listed electronic sensing and communications equipment manufacturer
3. Portfolio Position
The portfolio on December 31, 2013 by our calculations, had a PER of 18.2X (2013) and 17.6X (2014) versus the S&P 500 index at 17.4X (2013) and 15.4X (2014).
Due to the purchases and sales made in the fourth quarter the exposure of the Fund decreased to the consumer discretionary and IT sectors, and increased exposure to healthcare and industrials. The largest allocation in the Fund remains to the IT sector at 38%. All other sector allocations remained largely unchanged.
Sector Allocation at 12/31/13 | |
Consumer Discretionary | | | 10.7 | % | | Information Technology | | | 38.0 | % | |
Consumer Staples | | | 0.0 | % | | Materials | | | 0.0 | % | |
Energy | | | 3.7 | % | | Telecommunication Services | | | 6.6 | % | |
Financials | | | 14.4 | % | | Utilities | | | 0.0 | % | |
Health Care | | | 7.5 | % | | Cash | | | 1.8 | % | |
Industrials | | | 17.3 | % | | | | | 100.0 | % | |
4. Outlook
In the 2012 annual report last year we summarised US equities performance as:
"...providing investors with a 16% total return (including dividends). However, this belies the fact that markets did not move steadily upwards over the year, but instead swung between strongly positive months and strongly negative months as investors reacted to various economic situations...including the continuing European debt crisis; a polarizing US election; a slowdown in growth in China, combined with a once in a decade leadership change; continued unrest in the Middle East; and the looming 'fiscal cliff' debates in the US."
We then tried to look forward into 2013 and noted:
"Many of the issues outlined above remain at the fore, however, and we cannot forget we are currently in a world where governments and central banks are intervening in financial markets to an extent never seen before. With the good performance of 2012 behind us too we must believe that the bar at the start of 2013 has been set higher. However, equity valuations are not at extreme levels, and actually provide good value in many cases – suggesting there remains some healthy scepticism going forward and that we have not yet reached unsustainable levels. If the currently low levels of expected economic growth prove too cautious then we may well see continued good performance for equities going forward."
In 2013 the S&P 500 was up over 32% so even our most optimistic scenario proved overly cautious. We did see brief periods of market turmoil, in particular the sell down of emerging market equities and currencies following worries regarding liquidity deserting these regions, but overall the market moved steadily higher. This is in stark contrast to the large swings we witnessed in 2012 as the market lurched higher rather progressing smoothly upwards. What appeared to really drive equity markets was continued quantitative easing from the Federal Reserve and rates being kept at historically low levels in the US.
43
Perhaps the result of this unprecedented monetary policy was to simply raise asset prices by pushing some investors into risker positions than they would normally like to hold – if the return on cash is telegraphed to be extraordinarily low and for an extraordinarily long period of time, then it may give you no choice. This might then mean that the good performance in markets has not been entirely a result of improved sentiment and confidence, but rather helped by investors taking positions through gritted teeth. If the status quo then changes, as was hinted at the end of May, some of these 'nervous' investors might then be happy to sell down their positions, regardless of where they were invested. The start of 2014 will therefore be a particularly interesting time as all eyes will be on Janet Yellen, the new Fed Chair, and whether the Fed can adroitly extract themselves from their asset purchases without spooking the market.
In our previous years commentary quoted above we noted that despite good performance in 2012 "...equity valuations are not at extreme levels, and actually provide good value in many cases..." At the risk of becoming a broken record, we think this statement rings as true today as it did then, with the exception that equity valuations are obviously higher now than they were at the end of last year. The areas of good value are also becoming smaller so our search for good companies at reasonable valuations has meant looking further afield.
The US performed particularly well relative to world markets over the year so we took the opportunity to sell down some of our holdings that had benefited most from this trend and bought stakes in companies in other markets such as the UK, France and Asia where valuations were more compelling. We feel these changes have left the Fund more balanced and reduced the risk of holding onto companies trading at prices that reflect an unrealistically high growth rate.
Our focus remains, as ever, on quality innovative companies that have shown the ability to consistently earn high levels of return on capital over a prolonged period. We continue to believe these innovative companies can navigate the economic cycle better than the average company and therefore should be well rewarded over the long-term.


Matthew Page Ian Mortimer January 2014
The Fund invests in foreign securities, which involves political, economic and currency risks, greater volatility, and differences in accounting methods. The Fund is non-diversified, meaning that its assets may be concentrated in fewer individual holdings than diversified funds. Therefore, the Fund is more exposed to individual stock volatility than diversified funds. The Fund invests in smaller companies, which involves additional risks such as limited liquidity and greater volatility.
The MSCI World Index is a free float-adjusted market capitalization weighted index that is designed to measure the equity market performance of developed markets. The Standard & Poor's 500 Index is a market capitalization-weighted index composed of 500 widely held common stocks of U.S. companies. The NASDAQ Composite Index is a market capitalization-weighted index that is designed to represent the performance of the National Market System, which includes over 5,000 stocks traded only over-the-counter and not on an exchange. These indices are unmanaged and not available for investment, and do not incur expenses.
PER or P/E – Price to Earnings ratio is calculated by dividing current price of the stock by the company's trailing months' earnings per share.
Return on Capital (ROC) is a ratio measuring the profitability of a firm expressed as a percentage of funds acquired from investors and lenders.
Please refer to the Schedule of Investments for details on Fund holdings. Current and future portfolio holdings are subject to risk.
The information provided herein represents the opinion of Guinness Atkinson Asset Management, Inc. for the period stated and is not intended to be a forecast of future events, a guarantee of future results, or investment advice. Opinions, Fund holdings and sector allocations are subject to change at any time, and are not recommendations to buy or sell any security.
44
GUINNESS ATKINSON GLOBAL INNOVATORS FUND
Growth of $10,000

Average Annual Total Return
Periods Ended December 31, 2013
| One Year | | Five Years | | Ten Years | |
| | 45.29 | % | | | 22.57 | % | | | 10.42 | % | |
Performance data quoted represents past performance and does not guarantee future results. The investment return and principal value of an investment will fluctuate so that an investor's shares, when redeemed, may be worth more or less than their original cost. Current performance of the Fund may be lower or higher than the performance quoted. Performance data current to the most recent month end may be obtained by visiting www.gafunds.com.
Total returns for certain periods reflect a fee waiver in effect and in the absence of this waiver, the total returns would be lower. Returns reflect the reinvestment of distributions made by the Fund, if any. The graph and the performance table above do not reflect the deduction of taxes that a shareholder would pay on Fund distribution or the redemption of Fund shares. The Fund imposes a 2% redemption fee on shares held less than 30 days.
The Standard & Poor's 500 Index is an unmanaged index which is widely regarded as the standard for measuring large cap U.S. stock market performance. The NASDAQ Composite Index is a market capitalization weighted index that is designed to represent the performance of the National Market System which includes over 5,000 stocks traded only over-the-counter and not on an exchange. The indices referenced in this chart are not available for investment and do not incur expenses.
45
FUND HIGHLIGHTS at December 31, 2013
GUINNESS ATKINSON GLOBAL INNOVATORS FUND
# of Holdings in Portfolio: | | | 29 | | |
Portfolio Turnover: | | | 29.6 | % | |
% of Stocks in Top 10: | | | 36.1 | % | |
Fund Managers:
Ian Mortimer | |
Matthew Page | |
Top 10 Holdings (% of net assets) | | | | | | | |
PTC Inc. | | | 3.8 | % | | Ubisoft Enter | | | 3.6 | % | |
Lenovo Group Ltd. | | | 3.7 | % | | IntercontinentalExchange, Inc. | | | 3.6 | % | |
Comcast Corp. - Class A | | | 3.6 | % | | BP PLC - ADR | | | 3.6 | % | |
Shire PLC | | | 3.6 | % | | TD Ameritrade Holding Corp. | | | 3.5 | % | |
Gilead Sciences, Inc. | | | 3.6 | % | | Oracle Corp. | | | 3.5 | % | |
Sector Breakdown (% of net assets) | | | | | | | |
Semiconductor | | | 9.6 | % | | Finance - Investment Bank/Broker | | | 3.5 | % | |
Electronic Components - Semiconductor | | | 9.5 | % | | Publishing - Newspapers | | | 3.5 | % | |
Applications Software | | | 7.3 | % | | Commercial Banks | | | 3.4 | % | |
Electronics - Military | | | 6.8 | % | | Diversified Manufactured Operations | | | 3.4 | % | |
Cable/Satellite TV | | | 3.7 | % | | Cellular Telecommunications | | | 3.3 | % | |
Computers | | | 3.7 | % | | Fiduciary Banks | | | 3.3 | % | |
Entertainment Software | | | 3.6 | % | | Power Conversion/Supply Equipment | | | 3.3 | % | |
Finance - Other Services | | | 3.6 | % | | Commerical Services | | | 3.2 | % | |
Medical - Biomedical | | | 3.6 | % | | Machinery | | | 3.2 | % | |
Oil Company - Integrated | | | 3.6 | % | | E-Commerce/Products | | | 3.1 | % | |
Pharmaceuticals | | | 3.6 | % | | Telephone - Integrated | | | 3.0 | % | |
Enterprise Software/Services | | | 3.5 | % | | | | | | | | | |
46
SCHEDULE OF INVESTMENTS
December 31, 2013
GUINNESS ATKINSON GLOBAL INNOVATORS FUND
Shares | | COMMON STOCKS: 98.3% | | Value | |
Application Software: 7.3% | | | |
| | 55,020 | | | PTC Inc.* | | $ | 1,947,158 | | |
| | 27,130 | | | Check Point Software Technologies Ltd.* | | | 1,750,428 | | |
| | | | | | | | 3,697,586 | | |
Cable/Satellite TV: 3.7% | | | |
| | 35,570 | | | Comcast Corp. - Class A | | | 1,848,395 | | |
Cellular Telecommunications: 3.3% | | | |
| | 42,785 | | | Vodafone Group PLC ADR | | | 1,681,878 | | |
Commercial Banks: 3.4% | | | |
| | 22,730 | | | Capital One Financial Corp. | | | 1,741,345 | | |
Commercial Services: 3.2% | | | |
| | 56,380 | | | H&R Block, Inc. | | | 1,637,275 | | |
Computers: 3.7% | | | |
| | 1,540,000 | | | Lenovo Group Ltd. | | | 1,872,793 | | |
Diversified Manufactured Operations: 3.4% | | | |
| | 22,340 | | | Danaher Corp. | | | 1,724,648 | | |
E-Commerce/Products: 3.1% | | | |
| | 28,800 | | | eBay, Inc.* | | | 1,580,832 | | |
Electronic Components – Semiconductor: 9.5% | | | |
| | 65,890 | | | Intel Corp. | | | 1,710,175 | | |
| | 98,435 | | | NVIDIA Corp. | | | 1,576,929 | | |
| | 2,360 | | | Samsung Electronics Co., Ltd. - GDR | | | 1,541,080 | | |
| | | | | | | | 4,828,184 | | |
Electronics – Military: 6.8% | | | |
| | 16,390 | | | L-3 Communications | | | 1,751,435 | | |
| | 52,500 | | | Ultra Electronics | | | 1,676,161 | | |
| | | | | | | | 3,427,596 | | |
Enterprise Software/Services: 3.5% | | | |
| | 46,500 | | | Oracle Corp. | | | 1,779,090 | | |
Entertainment Software: 3.6% | | | |
| | 129,400 | | | Ubisoft Enter* | | | 1,830,007 | | |
Fiduciary Banks: 3.3% | | | |
| | 22,814 | | | State Street Corp. | | | 1,674,320 | | |
Finance – Investment Bank/Broker: 3.5% | | | |
| | 58,480 | | | TD Ameritrade Holding Corp. | | | 1,791,827 | | |
The accompanying notes are an integral part of these financial statements.
47
Shares | | COMMON STOCKS: 98.3% (Continued) | | Value | |
Finance – Other Services: 3.6% | | | |
| | 8,040 | | | IntercontinentalExchange, Inc. | | $ | 1,808,357 | | |
Machinery: 3.2% | | | |
| | 11,770 | | | Roper Industries, Inc. | | | 1,632,264 | | |
Medical – Biomedical: 3.6% | | | |
| | 24,500 | | | Gilead Sciences, Inc.* | | | 1,841,175 | | |
Oil Company – Integrated: 3.6% | | | |
| | 37,120 | | | BP PLC - ADR | | | 1,804,403 | | |
Pharmaceuticals: 3.6% | | | |
| | 39,100 | | | Shire PLC | | | 1,846,612 | | |
Power Conversion/ Supply Equipment: 3.3% | | | |
| | 19,200 | | | Schneider Electric | | | 1,674,618 | | |
Publishing – Newspapers: 3.5% | | | |
| | 59,500 | | | Gannett Co, Inc. | | | 1,760,010 | | |
Semiconductor: 9.6% | | | |
| | 87,720 | | | Applied Materials, Inc. | | | 1,551,767 | | |
| | 23,300 | | | QUALCOMM Inc. | | | 1,730,025 | | |
| | 89,429 | | | Taiwan Semiconductor Manufacturing Co., Ltd - ADR | | | 1,559,642 | | |
| | | | | | | | 4,841,434 | | |
Telephone – Integrated: 3.0% | | | |
| | 48,377 | | | CenturyLink Inc. | | | 1,540,807 | | |
| | | | | Total Common Stocks
(costs $39,033,233) | | | 49,865,456 | | |
| | | | | Total Investments in Securities
(costs $39,033,233): 98.3% | | | 49,865,456 | | |
| | | | | Other Assets less Liabilities: 1.7% | | | 865,692 | | |
| | | | | Net Assets: 100.0% | | $ | 50,731,148 | | |
* Non-income producing security.
ADR - American Depository Receipt
GDR - Global Depository Receipt
The accompanying notes are an integral part of these financial statements.
48
INFLATION MANAGED DIVIDEND FUNDTM for the period ended December 31, 2013
1. Performance
AVERAGE ANNUALIZED TOTAL RETURN
| | | 6-months
(actual) | | 1-year
(actual) | | Since
Inception
(March 30, 2012) | |
Fund | | | 14.76 | % | | | 29.77 | % | | | 19.24 | % | |
Benchmark Index: | |
MSCI World Index | | | 17.16 | % | | | 27.49 | % | | | 17.74 | % | |
The Fund's gross expense ratio is 7.05% and net expense ratio is 0.68% per the Summary Prospectus dated May 1, 2013. The Advisor has contractually agreed to waive a portion of its advisory fees and/or reimburse other Fund expenses so that the Fund's ratio of expenses to average daily net assets will not exceed 0.68% (excluding Acquired Fund Fees and Expenses, interest, taxes, dividends on short positions and extraordinary expenses) through at least March 31, 2015. To the extent that the Advisor waives fees and/or reimburses expenses, it may seek repayment of a portion or all of such amounts at any time within the three fiscal years after the fiscal year in which such amounts were waived and/or reimbursed, subject to the applicable cap.
Performance data quoted represents past performance and does not guarantee future results. The investment return and principal value of an investment in the Fund will fluctuate so that an investor's shares, when redeemed, may be worth more or less than their original cost. Current performance of the Fund may be lower or higher than the performance quoted. Performance data current to the most recent month-end may be obtained by visiting www.gafunds.com, or calling (800) 915-6565.
The Fund imposes a 2% redemption fee on the sale of shares held less than 30 days. Performance data quoted does not reflect this redemption fee. Total returns for certain periods reflect expense limitations in effect and, in the absence of these limitations, total returns would have been lower.
The Inflation Managed Dividend Fund in 2013 produced a total return of 29.77%. The Fund outperformed the MSCI World Index by 2.28% over the period.
Equity markets were very strong in 2013, and the Fund recorded a positive performance in all four individual quarters. The Fund was up 8.99%, 3.83%, 6.80%, and 7.45% in each of Q1, Q2, Q3, and Q4, respectively. The Fund outperformed the index in both Q1 and Q2, but gave back some of those gains in the second half of the year.
Our allocation to Financials (where we were a little underweight relative to the index) and Industrials (where we had been increasing our allocation over the course of the year) were the most significant contributors to performance. The majority of the contribution from these sectors came from stock selection with our holdings in ICAP and Aberdeen Asset Management being our standout performers in the Financials sector whilst Northrop Grumman, Meggitt, L-3 communications, Illinois Tool Works, and General Dynamics all performed particularly well in the Industrial sector.
The fact we had no exposure to the Materials sector was also an important contributor.
Our allocations to Consumer Staples and Health Care which we reduced over the course of the year were the main detractors from performance relative to the index and this was largely due to our bias towards some of the large companies in the sectors.
2. Activity
In January we sold Metcash, an Australian supermarket and convenience store brand. The company had acquired a number of a competitor's stores and was struggling to integrate these additional stores into the business thereby causing a drag on cash flow. The company was also struggling due to weakening pricing power relative to some of their larger competitors. We became concerned about these structural changes in the outlook for the business and concluded there were better opportunities elsewhere.
In March we sold Wal-Mart and VF Corp. We have owned both companies in the Fund since launch and each made a significant contribution to performance. They are both very different businesses and have grown in very different ways but what they share has been a remarkable ability to generate cash and a consistent approach to distributing that cash back to shareholders. However, by March neither company looked to be the bargain it once was (VF Corp traded on 15.3X P/E ratio for 2013, and Wal-Mart on 15.4X) and the share price growth of both companies had outpaced that of the dividend meaning their dividend yields were now modest. We continue to like both companies and will follow their progress in the future, but for now we are happy to have taken profits.
49
INFLATION MANAGED DIVIDEND FUNDTM
Often the most attractively valued opportunities arise in the ugliest circumstances and one area in particular we identified in early 2013 were the defence stocks. As a group they looked cheap on our screens because of the negative sentiment towards these companies following the sequestration debates in the US. To take advantage of these cheap valuations, and to replace our sales of Wal-Mart and VF Corp, we purchased two new companies for the portfolio; Northrup Grumman and BAE Systems. Northrop Grumman is a US-focused defence contractor that was trading on a 9.9X P/E ratio for 2013, and BAE Systems is a more internationally diversified supplier of defence equipment and systems that was trading on a 9.4X P/E ratio for 2013. Both companies had underperformed the broad market around the turn of 2013 and were trading on EV/EBITDA multiples at historic lows. But with free cash flow yields of 10%+ and proven track records of generating high returns on capital even in previous periods of budgetary constraints we felt these companies offered a compelling investment opportunity. Both companies have performed well since we bought them with Northrop Grumman in particularly being one of our top performing companies this year.
In October we made further changes to the portfolio to take profits on companies that had done well, and initiate new positions in companies with cheaper valuations, offering better margins of safety, and more attractive dividend yields.
We sold five companies in October and replaced them with five new purchases. Firstly we took profits on Halma and Pfizer. Halma, the UK-listed industrial safety equipment company has been one of the best performing stocks we have held in the portfolio with a total return of almost 45% from purchase to sale. It has also provided the Fund with a steadily rising dividend stream with dividend growth of around 7% per annum. The company has barely put a foot wrong with good top and bottom-line growth and consistently high returns on capital. The market had recognised this though and by October was trading on a P/E multiple of 22 times, which is very close to the maximum multiple it has achieved over the last ten years. Having reached such a rich valuation we found it difficult to justify to continue holding in the portfolio compared to other, cheaper opportunities.
Pfizer, the US-listed global pharmaceuticals company, is another holding we have owned since we launched the Fund. Pfizer, and the global pharmaceutical companies in general, were quite unloved at that time as the market sold them down because of the expected impact of patent cliffs. When we purchased the stock it was trading on a P/E multiple of around 9 times and had a share price of $23. When we sold it the stock was trading on a multiple of 13.5 times with a share price of $29. Earnings growth for the stock was limited during the period we held the company, meaning the majority of the share price performance was due to the multiple expansion. When we think about the return we might achieve from a company we note it can be split into three main components; (a) dividends, (b) earnings growth and (c) multiple expansion. In the case of Pfizer we think we have captured the majority of the multiple expansion and this combined with the relatively low dividend yield and our cautious outlook for earnings growth meant we sold the position.
We also sold our holdings in Kraft Foods Group and Mondelez International, which represent the two companies that emerged from the re-organisation of the original Kraft Foods in October 2012. The performance of both companies has been enviable with good revenue and earnings growth combined with a good tailwind from US stock market performance generally and the US consumer staple sector specifically. With P/E multiples of 19 times for Kraft Foods Group and 21 times for Mondelez, and dividend yields of 3.7% and 1.6%, respectively, we felt it an opportune time to take profits and instead buy companies offering better upside potential and that also reduced our exposure to the US and the consumer staples sector.
The final sell we made in October was that of AstraZeneca. AstraZeneca was again a company that we have owned since we launched the Fund. When we first bought the stock it was trading on a P/E of less than 8 times. Since purchase the total return for the Fund has been just under 25% as the P/E multiple has expanded to over 10 times today, despite a headwind of decreasing earnings over the period as a whole. Today we think the outlook has turned even more negative and on many indicators we follow our investment thesis no longer stands up. Analyst earnings expectations are sharply lower , the free cash flow dividend cover stands at only 1.5 times, and on the latest earnings call Pascal Soriot, the CEO, indicated that the cost cutting and reorganisation of the business he has been spearheading since he joined in 2012 will not improve margins as much as hoped. So, despite the company offering a high dividend yield and a lowly valuation, we think this might well reflect the true outlook for the business over the next few years. Indeed the cash flow return on investment is expected to fall from 10.4% to 0.7% in 2014 which means the company is very likely to fall out of our investible universe next year. The possibility of a dividend cut also looms which could be a trigger for share price weakness. With all these thoughts in mind we decided to take our profit and sell the position.
Of the five companies we bought in October four of the purchases can be classified as quality companies that we have identified as offering good value, and one is probably better classified as 'deep value' because the market sentiment is almost universally negative.
50
INFLATION MANAGED DIVIDEND FUNDTM
The four companies in the 'quality at a good price' group were;
• French-listed electrical component manufacturer Schneider Electric
• Australian-listed medical diagnostics company Sonic Healthcare
• South African-listed telecoms company Vodacom
• Hong Kong-listed Chinese state oil company CNOOC
What immediately jumped out about this group was that none were listed in the UK or US (regions that had performed well) and they were in the more cyclical sectors of the market. This was not necessarily reflective of a 'top-down' view we had but reflects our 'bottom-up' analysis which focuses purely on valuations of individual stocks regardless of which sectors or regions they are in. They all traded on valuation multiples well below their historic highs and, importantly, offer good prospects for earnings growth. The latter is something we were increasingly focussing on in the portfolio as we have seen the market multiple expand so much since the lows after the financial crisis.
The final company we purchased was Teva Pharmaceutical, the US-listed generic drug manufacturer that is based in Israel. The company has been a consolidator of generic drug manufacturers and also generates a large proportion of its revenues from a multiple sclerosis drug for which it owns the patent. Ironically it is the threat of generic competition to this drug next year, when it comes off patent, that has been a drag on the company. At just over 7 times 2014 expected earnings, however, it ranked in the bottom decile of its industry peers and almost 2 standard deviations away from its median multiple over the past 10 years. Earnings expectations have fallen over the past year but we felt this may have bottomed and the market has oversold the stock based on overly pessimistic view. Again, we cannot pinpoint when sentiment and/or the share price may start to recover but at such lowly valuations and with the sentiment at extreme levels already we feel there is good upside potential over the longer term and a lot of bad news already priced in.
3. Portfolio Position
The portfolio on December 31, 2013 by our calculations, had a PER of 14.3X (2013) and 13.6X (2014) versus the MSCI World Index at 19.0X (2013), and 14.9X (2014), a 24.8% and 8.6% discount, respectively.
The table below shows the sector allocation of the Fund at the end of the period. Over the year we have reduced our exposure to the consumer staples sector significantly – moving from a 31.9% weight at the end of 2012 to a weighting of 19.2% at the end of 2013. In its place we have upped the exposure of the Fund to the more cyclical areas of the market, specifically industrials and financials. The Fund has maintained its zero exposure to both the materials and utilities sectors.
Sector allocation at 12/31/2013 | |
Consumer Discretionary | | | 5.6 | % | | Information Technology | | | 2.9 | % | |
Consumer Staples | | | 19.2 | % | | Materials | | | 0.0 | % | |
Energy | | | 10.7 | % | | Telecommunication Services | | | 7.9 | % | |
Financials | | | 17.8 | % | | Utilities | | | 0.0 | % | |
Health Care | | | 13.3 | % | | Cash | | | 3.0 | % | |
Industrials | | | 19.8 | % | | | | | 100.0 | % | |
4. Dividend
The trailing twelve months dividend distributed by the Fund was $0.45 per share.
5. Outlook
Clearly valuations in aggregate are higher today than they have been for some time, but we are cautious about drawing too many conclusions for our investment process from looking at aggregate data like this. An average can obscure huge amounts of useful and interesting data about the spread within this average and the bias that market capitalisation can have on these weighted averages. Indeed our investment process is designed to focus on identifying companies whose valuations are at the far left of the distribution not the average, i.e. are cheap relative to their peers. We select a concentrated portfolio of 35 companies on a case by
51
INFLATION MANAGED DIVIDEND FUNDTM
case basis and will go to whichever companies look attractive irrespective of what sector or geographies they may be in. It is more important to us to find a set of companies with a proven history of high return on capital, attractive valuation, good capital budgeting discipline and scope for dividend growth, etc., than to identify companies in a sector or industry that in aggregate looks cheap relative to others. We continue to try to identify good businesses that are unloved and attractively valued, but which require an investment horizon beyond the short-term.
We believe this approach to identifying stocks is well suited to current economic conditions. The characteristics of these companies should provide a reasonable degree of downside price protection during periods of market weakness. At the same time we believe these companies have the ability to continue to generate superior economic profits if the economic environment continues to improve.


Matthew Page Ian Mortimer January 2014
The Fund invests in foreign securities, which involves political, economic and currency risks, greater volatility, and differences in accounting methods. These risks are greater for emerging markets. The Fund invests in small- or mid-cap companies, which involves additional risks such as limited liquidity and greater volatility.
The MSCI World Index is a free float-adjusted market capitalization weighted index that is designed to measure the equity market performance of developed markets.
PER or P/E – Price to Earnings ratio is calculated by dividing current price of the stock by the company's trailing months' earnings per share.
Cash flow measures the cash generating capability of a company by adding non-cash charges (e.g. depreciation) and interest expense to pretax income.
Return on Capital (ROC) is a ratio measuring the profitability of a firm expressed as a percentage of funds acquired from investors and lenders.
Free cash flow is a measure of financial performance calculated as operating cash flow minus capital expenditures.
Standard deviation is a measure of the dispersion of a set of data from its mean.
EV/EBITDA is the enterprise value of a company divided by earnings before interest, taxes, depreciation, and amortization.
Please refer to the Schedule of Investments for details on Fund holdings. Current and future portfolio holdings are subject to risk.
The information provided herein represents the opinion of Guinness Atkinson Asset Management, Inc. for the period stated and is not intended to be a forecast of future events, a guarantee of future results, or investment advice. Opinions, Fund holdings and sector allocations are subject to change at any time, and are not recommendations to buy or sell any security.
52
GUINNESS ATKINSON INFLATION MANAGED DIVIDEND FUNDTM
Growth of $10,000
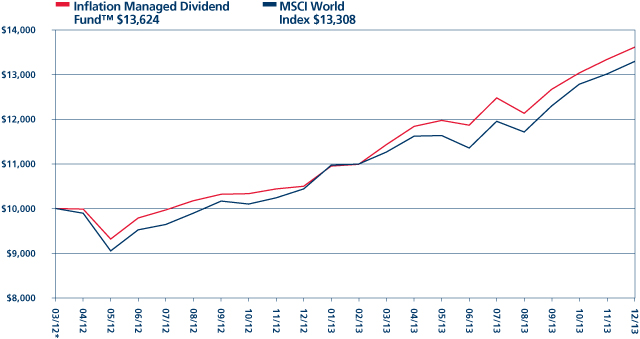
Average Annual Total Return
Periods Ended December 31, 2013
One Year | | Since Inception
(03/30/12) | |
| | 29.77 | % | | | 19.24 | % | |
*Inception date 03/30/12.
Performance data quoted represents past performance and does not guarantee future results. The investment return and principal value of an investment will fluctuate so that an investor's shares, when redeemed, may be worth more or less than their original cost. Current performance of the Fund may be lower or higher than the performance quoted. Performance data current to the most recent month end may be obtained by visiting www.gafunds.com.
Total returns reflect a fee waiver in effect and in the absence of this waiver, the total returns would be lower. Returns reflect the reinvestment of distributions made by the Fund, if any. The graph and the performance table above do not reflect the deduction of taxes that a shareholder would pay on Fund distribution or the redemption of Fund shares. The Fund imposes a 2% redemption fee on shares held less than 30 days.
The MSCI World Index is a free float-adjusted market capitalization weighted index that is designed to measure the equity market performance of developed markets.
53
FUND HIGHLIGHTS at December 31, 2013
GUINNESS ATKINSON INFLATION MANAGED DIVIDEND FUNDTM
# of Holdings in Portfolio: | | | 35 | | |
Portfolio Turnover: | | | 24.9 | % | |
% of Stocks in Top 10: | | | 25.5 | % | |
Fund Managers:
Ian Mortimer | |
Matthew Page | |
Top 10 Holdings (% of net assets) | | | | | | | |
Aberdeen Asset Management PLC | | | 2.9 | % | | Illinois Tool Works Inc. | | | 2.4 | % | |
Northrop Grumman Corp. | | | 2.8 | % | | Microsoft Corp. | | | 2.4 | % | |
ICAP PLC | | | 2.8 | % | | Coca-Cola Co/The | | | 2.4 | % | |
L-3 Communications Holdings Inc. | | | 2.5 | % | | Vodafone Group PLC | | | 2.4 | % | |
Mattel Inc. | | | 2.5 | % | | Royal Dutch Shell PLC - Class A | | | 2.4 | % | |
Sector Breakdown (% of net assets) | | | | | | | |
Aerospace/Defense | | | 9.3 | % | | Applications Software | | | 2.4 | % | |
Oil Company - Integrated | | | 6.9 | % | | Beverages - Non-alcoholic | | | 2.4 | % | |
Pharmaceuticals | | | 6.9 | % | | Diversified Manufactured Operations | | | 2.4 | % | |
Insurance Brokers | | | 6.8 | % | | Commercial Services | | | 2.3 | % | |
Cellular Telecommunications | | | 6.6 | % | | Cosmetics & Toiletries | | | 2.3 | % | |
Tobacco | | | 4.6 | % | | Finance - Other Services | | | 2.3 | % | |
Food-Misc/Diversified | | | 4.4 | % | | Power Conversion/Supply Equipment | | | 2.3 | % | |
Investment Management/Advisory Services | | | 2.9 | % | | Soap & Cleaning Products | | | 2.3 | % | |
Finance - Investment Banker/Broker | | | 2.8 | % | | Medical - Generic Drugs | | | 2.1 | % | |
Electronics - Military | | | 2.5 | % | | MRI/Medical Diagnostics Imaging | | | 2.1 | % | |
Toys | | | 2.5 | % | | Oil Company - Exploration & Production | | | 2.0 | % | |
54
SCHEDULE OF INVESTMENTS
December 31, 2013
GUINNESS ATKINSON INFLATION MANAGED DIVIDEND FUNDTM
Shares | | COMMON STOCKS: 81.1% | | Value | |
Australia: 2.1% | | | |
| | 4,480 | | | Sonic Healthcare Ltd. | | $ | 66,323 | | |
China: 2.0% | | | |
| | 330 | | | CNOOC Ltd. - ADR | | | 61,928 | | |
France: 6.7% | | | |
| | 900 | | | Danone SA | | | 64,779 | | |
| | 810 | | | Schneider Electric SA | | | 70,648 | | |
| | 1,170 | | | Total SA | | | 71,674 | | |
| | | | | | | | 207,101 | | |
Germany: 2.3% | | | |
| | 880 | | | Deutsche Boerse AG | | | 72,879 | | |
Hong Kong: 2.0% | | | |
| | 1,200 | | | China Mobile Ltd. - ADR | | | 62,748 | | |
Israel: 2.1% | | | |
| | 1,600 | | | Teva Pharmaceutical Industries Ltd. - ADR | | | 64,128 | | |
Italy: 2.2% | | | |
| | 2,900 | | | ENI SpA | | | 69,777 | | |
Netherlands: 2.4% | | | |
| | 2,070 | | | Royal Dutch Shell PLC - Class A | | | 73,770 | | |
South Africa: 2.2% | | | |
| | 5,330 | | | Vodacom Group Ltd. | | | 67,578 | | |
United Kingdom: 21.5% | | | |
| | 10,910 | | | Aberdeen Asset Management PLC | | | 90,333 | | |
| | 9,080 | | | BAE Systems PLC | | | 65,407 | | |
| | 11,426 | | | ICAP PLC | | | 85,447 | | |
| | 1,870 | | | Imperial Tobacco Group PLC | | | 72,400 | | |
| | 7,760 | | | Meggitt PLC | | | 67,785 | | |
| | 890 | | | Reckitt Benckiser | | | 70,639 | | |
| | 1,780 | | | Unilever PLC | | | 73,160 | | |
| | 18,890 | | | Vodafone Group PLC | | | 74,136 | | |
| | 1,540 | | | Willis Group Holding PLC | | | 69,007 | | |
| | | | | | | | 668,314 | | |
The accompanying notes are an integral part of these financial statements.
55
Shares | | COMMON STOCKS: 81.1% (Continued) | | Value | |
United States: 35.6% | | | |
| | 1,370 | | | AbbVie Inc. | | $ | 72,350 | | |
| | 1,070 | | | Aflac Inc. | | | 71,476 | | |
| | 1,530 | | | Arthur J Gallagher | | | 71,803 | | |
| | 1,810 | | | Coca-Cola Co/The | | | 74,771 | | |
| | 720 | | | General Dynamics Corp. | | | 68,796 | | |
| | 2,430 | | | H&R Block, Inc. | | | 70,567 | | |
| | 900 | | | Illinois Tool Works Inc. | | | 75,672 | | |
| | 780 | | | Johnson & Johnson | | | 71,440 | | |
| | 720 | | | L-3 Communications Holdings Inc. | | | 76,939 | | |
| | 1,600 | | | Mattel Inc. | | | 76,128 | | |
| | 1,400 | | | Merck & Co., Inc. | | | 70,070 | | |
| | 2,000 | | | Microsoft Corp. | | | 74,860 | | |
| | 770 | | | Northrop Grumman Corp. | | | 88,250 | | |
| | 890 | | | Procter & Gamble Co/The | | | 72,455 | | |
| | 1,380 | | | Reynolds American Inc. | | | 68,986 | | |
| | | | | | | | 1,104,563 | | |
| | | | | Total Common Stocks
(costs $2,061,269) | | | 2,519,109 | | |
| | | | | Total Investments in Securities
(costs $2,061,269): 81.1% | | | 2,519,109 | | |
| | | | | Other Assets less Liabilities: 18.9% | | | 587,212 | | |
| | | | | Net Assets: 100.0% | | $ | 3,106,321 | | |
ADR - American Depository Receipt
The accompanying notes are an integral part of these financial statements.
56
RENMINBI YUAN & BOND FUND for the period ended December 31, 2013
1. Performance
AVERAGE ANNUALIZED TOTAL RETURNS
| | | 1 Year
(actual) | | Since
Launch
(June 30, 2011) | |
Fund | | | 5.26 | % | | | 3.70 | % | |
Comparisons: | |
RMB Cash Offshore (CNH)* | | | 2.76 | % | | | 2.65 | % | |
HSBC Offshore RMB Bond Index | | | 6.80 | % | | | 5.06 | % | |
*Net change in exchange rate versus U.S. dollar.
The Fund's gross expense ratio is 0.90% per the Summary Prospectus dated May 1, 2013. The Advisor has contractually agreed to waive a portion of its advisory fees and/or reimburse other Fund expenses so that the Fund's ratio of expenses to average daily net assets will not exceed 0.90% (excluding Acquired Fund Fees and Expenses, interest, taxes, dividends on short positions and extraordinary expenses) through at least June 30, 2014. To the extent that the Advisor waives fees and/or reimburses expenses, it may seek repayment of a portion or all of such amounts at any time within the three fiscal years after the fiscal year in which such amounts were waived and/or reimbursed, subject to the applicable cap.
Performance data quoted represents past performance and does not guarantee future results. The investment return and principal value of an investment will fluctuate so that an investor's shares, when redeemed, may be worth more or less than their original cost. Current performance of the Fund may be lower or higher than the performance quoted. Performance data current to the most recent month-end may be obtained by visiting www.gafunds.com, or calling (800) 915-6565.
The Fund imposes a 2% redemption fee on the sales of shares held less than 30 days. Performance data quoted does not reflect this redemption fee. Total returns for certain periods reflect expense limitations in effect and, in the absence of these limitations, total returns would have been lower.
The Fund is designed to give dollar-based investors exposure to the Chinese renminbi by purchasing the currency in the offshore market, generally in Hong Kong (known as the CNH market). The Fund also seeks to generate an additional return by investing in renminbi-denominated bonds, often referred to as Dim Sum bonds (so named after a lunchtime favourite in Hong Kong), and certificates of deposit issued by banks. The intention is to give investors the benefit of hoped-for renminbi appreciation while adding to the return through interest and possibly some capital gain. However, the aim also is to keep credit risk and volatility low.
In 2013 the Fund returned 5.26% compared to an appreciation of the offshore renminbi (CNH) against the dollar of 2.76%.
Money markets in Mainland China were shaken in June by a liquidity squeeze in the interbank market, engineered by the central bank. For some time the central bank has been frustrated in its efforts to slow credit growth in China with commercial banks using multiple channels, but especially the interbank market, to fund loan growth. Commercial banks' increasing usage of interbank funding because they have become used the central bank stepping in with additional liquidity any time market conditions became tight. In June that changed when the normal liquidity injection did not happen and the commercial banks were given the unequivocal message that management of their liquidity is a key obligation.
The result was a rise in short term money market rates by some 2% with periodic spikes higher than that as well as a shift higher in government bond yields by some 1%. As mainland commercial banks have adjusted to these new conditions short term interest rates have drifted lower and become less volatile.
In the offshore renminbi currency and bond markets the impact of this change in the mainland money markets was both briefer and more muted. The currency moved stronger against the dollar during the final quarter of the year and bond issuance, after a quiet third quarter, registered the highest level so far of $8.5 billion. At the same time usage of the currency outside mainland China continues to grow. Renminbi deposits in Hong Kong have now passed $142 billion. In addition a greater share (13%) of Chinese trade, which hit $4.16 trillion in 2013, was settled in renminbi. In October it was reported that China's currency overtook the Euro as the second most used currency in world merchandize trade.
57
RENMINBI YUAN & BOND FUND
2. Portfolio Position
The portfolio is 95% invested in renminbi-denominated bonds and certificates of deposit issued by both Chinese and overseas corporations. Approximately 8% is invested in bonds issued by the Chinese government or by supranational issuers. At the end of the year the duration portfolio was 1.79 years and its yield to maturity was 2.93%.
3. Outlook and Strategy
We believe that the renminbi will continue to see upward pressure against the dollar driven fundamentally by improving Chinese productivity driving income growth and a rising standard of living. Trade growth and the gradual opening of China's capital account will support greater international usage and this provides another source of demand for the currency.
China's financial markets are in the process of change and reform that will be critical to achieve China's goal of developing a consumer-led economy. In this regard we continue to focus on China's overall debt levels and the exposure of government and banks to bad debt. It is noticeable that the rate of debt expansion has slowed significantly in 2013 and 2014 has begun unchanged from last year. Investors appear to be looking for decisive (for which read dramatic headline-grabbing) action. This is not the Chinese way. What we believe we are seeing is a relentless and measured drive to deleveraging which retains the goal of maintaining stability.
For the Fund we believe the outlook is for continued growth in the offshore renminbi market and for further currency appreciation against the dollar.

Edmund Harriss
The Fund invests in foreign securities, which involves political, economic and currency risks, greater volatility, and differences in accounting methods. These risks are greater for emerging markets. The Fund is non-diversified, meaning that its assets may be concentrated in fewer individual holdings than diversified funds. Therefore, the Fund is more exposed to individual stock volatility than diversified funds. The Fund invests in smaller companies, which involves additional risks such as limited liquidity and greater volatility. Investments in debt securities typically decrease in value when interest rates rise, which can be greater for longer-term debt securities. The Fund may invest in derivatives, which involves risks different from, and in certain cases, greater than the risks presented by traditional investments. Investments focused in a single geographic region may be exposed to greater risk than investments diversified among various geographic regions.
The HSBC Offshore Renminbi Bond Index tracks total return performance of renminbi-denominated and renminbi-settled bonds and certificates of deposit issued outside the People's Republic of China. This index is unmanaged and not available for investment, and does not incur expenses.
The RMB Cash Offshore (CNH) is the currency code for renminbi traded outside China in the offshore market.
Duration is a commonly used measure of the potential volatility of the price of a debt security, or the aggregate market value of a portfolio of debt securities, prior to maturity. Securities with a longer duration generally have more volatile prices than securities of comparable quality with a shorter duration.
Dim Sum Bonds are bonds denominated in Chinese yuan and issued in Hong Kong. Dim sum bonds are attractive to foreign investors who desire exposure to yuan-denominated assets, but are restricted by China's capital controls from investing in domestic Chinese debt. The issuers of dim sum bonds are largely entities based in China or Hong Kong, and occasionally foreign companies. The term is derived from the Chinese cuisine that involves serving a variety of small delicacies and is especially popular in Hong Kong.
Please refer to the Schedule of Investments for details on Fund holdings. Current and future portfolio holdings are subject to risk.
The information provided herein represents the opinion of Guinness Atkinson Asset Management, Inc. for the period stated and is not intended to be a forecast of future events, a guarantee of future results, or investment advice. Opinions, Fund holdings and sector allocations are subject to change at any time, and are not recommendations to buy or sell any security.
58
GUINNESS ATKINSON RENMINBI YUAN & BOND FUND
Growth of $10,000
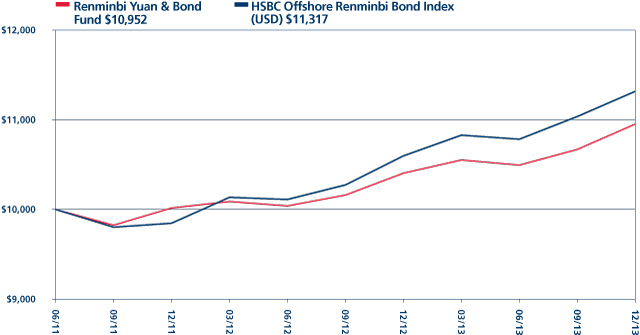
Average Annual Total Return
Periods Ended December 31, 2013
One Year | | Since Inception
(06/30/11) | |
| | 5.26 | % | | | 3.70 | % | |
*Inception date 6/30/11.
Performance data quoted represents past performance and does not guarantee future results. The investment return and principal value of an investment will fluctuate so that an investor's shares, when redeemed, may be worth more or less than their original cost. Current performance of the Fund may be lower or higher than the performance quoted. Performance data current to the most recent month end may be obtained by visiting www.gafunds.com.
Total returns for certain periods reflect a fee waiver in effect and in the absence of this waiver, the total returns would be lower. Returns reflect the reinvestment of distributions made by the Fund, if any. The graph and the performance table above do not reflect the deduction of taxes that a shareholder would pay on Fund distribution or the redemption of Fund shares. The Fund imposes a 2% redemption fee on shares held less than 30 days.
The HSBC Offshore Renminbi Bond Index tracks total return performance of renminbi-denominated and renminbi-settled bonds and certificates of deposit issued outside the Pople's Republic of China. The Fund changed its benchmark from the BOCHK Offshore RMB Bond Index to the HSBC Offshore Renminbi Bond Index. The BOCHK Offshore RMB Bond Index was discontinued on October 21, 2013. The index referenced in this chart is not available for investment and does not incur expenses.
59
FUND HIGHLIGHTS at December 31, 2013
GUINNESS ATKINSON RENMINBI YUAN & BOND FUND
# of Holdings in Portfolio: | | | 37 | | |
Portfolio Turnover: | | | 12.3 | % | |
% of Investments in Top 10: | | | 45.6 | % | |
Fund Manager:
Top 10 Holdings (% of net assets) | | | | | | | |
Air Liquide Finance SA, 3.000%, 09/19/16 | | | 10.5 | % | | ICICI Bank Ltd., 4.900%, 09/21/15 | | | 3.6 | % | |
New World China Land Ltd., 5.500%, 02/06/18 | | | 5.4 | % | | BOC Aviation Pte. Ltd., 4.500%, 11/20/18 | | | 3.6 | % | |
BP Capital Markets PLC, 1.700%, 09/15/14 | | | 5.0 | % | | HSBC Bank PLC, 2.875%, 04/30/15 | | | 3.5 | % | |
China Guangdong, 3.750%, 11/01/15 | | | 3.9 | % | | Global Logistic Properties Ltd., 3.375%, 05/11/16 3.375% | | | 3.2 | % | |
Renault S.A.,5.625%, 10/10/14 | | | 3.7 | % | | Caterpillar Financial Services Corp., 3.250%, 06/26/15 | | | 3.2 | % | |
Sector Breakdown (% of net assets) | | | | | | | |
Commerical Banks | | | 22.4 | % | | Machinery | | | 4.1 | % | |
Real Estate Operations/Development | | | 13.9 | % | | Special Purpose Banks | | | 3.0 | % | |
Industrial Gases | | | 10.5 | % | | Finance - Investment Bank/Broker | | | 2.6 | % | |
Auto-Cars/Light Trucks | | | 9.1 | % | | Life/Health Insurance | | | 2.1 | % | |
Finance - Leasing Company | | | 5.0 | % | | Supranational Bank | | | 2.1 | % | |
Oil Company - Integrated | | | 5.0 | % | | Food - Retail | | | 1.8 | % | |
Electric - Integrated | | | 4.8 | % | | Manufactures | | | 1.1 | % | |
Sovereign | | | 4.4 | % | | | | | |
60
SCHEDULE OF INVESTMENTS
December 31, 2013
GUINNESS ATKINSON RENMINBI YUAN & BOND FUND
Principal Amount (CNH) | | CORPORATE BONDS: 91.9% | | Value | |
Auto-Cars/Light Trucks: 9.1% | | | |
| | 21,000,000 | | | Renault S.A.,5.625%, 10/10/14 | | $ | 3,522,393 | | |
| | 18,000,000 | | | Volkswagen International Finance NV, 2.150%, 05/23/16 | | | 2,921,761 | | |
| | 4,000,000 | | | Volkswagen International Finance NV, 3.750%, 11/30/17 | | | 671,938 | | |
| | 9,000,000 | | | Volvo Treasury AB, 3.800%, 11/22/15 | | | 1,491,571 | | |
| | | | | | | | 8,607,663 | | |
Commercial Banks: 22.4% | | | |
| | 8,000,000 | | | Agricultural Bank Of China Ltd., 3.200%, 11/28/15 | | | 1,318,859 | | |
| | 10,000,000 | | | CCBL Funding PLC, 3.200%, 11/29/15 | | | 1,653,099 | | |
| | 20,000,000 | | | HSBC Bank PLC, 2.875%, 04/30/15 | | | 3,312,587 | | |
| | 10,000,000 | | | ICICI Bank Ltd., 4.000%, 06/25/16 | | | 1,651,131 | | |
| | 20,000,000 | | | ICICI Bank Ltd., 4.900%, 09/21/15 | | | 3,354,925 | | |
| | 12,000,000 | | | Industrial & Commercial Bank of China Ltd., 3.350%, 11/19/16 | | | 1,991,270 | | |
| | 12,000,000 | | | National Australia Bank Ltd., 2.400%, 06/18/15 | | | 1,965,928 | | |
| | 15,000,000 | | | Rabobank Nederland, 3.250%, 09/20/15 | | | 2,507,387 | | |
| | 10,000,000 | | | Societe Generale, 4.150%, 09/06/14 | | | 1,667,320 | | |
| | 10,000,000 | | | VTB Bank OJSC via VTB Capital SA, 4.500%, 10/30/15 | | | 1,676,933 | | |
| | | | | | | | 21,099,439 | | |
Electric – Integrated: 4.8% | | | |
| | 5,000,000 | | | China Datang Corp., 3.600%, 4/25/16 | | | 823,404 | | |
| | 22,000,000 | | | China Guangdong, 3.750%, 11/01/15 | | | 3,663,242 | | |
| | | | | | | | 4,486,646 | | |
Finance-Investment Bank/Broker: 2.6% | | | |
| | 15,000,000 | | | Banco BTG Pactual SA, 4.100%, 03/26/16 | | | 2,441,956 | | |
Finance – Leasing Company: 5.0% | | | |
| | 20,000,000 | | | BOC Aviation Pte. Ltd., 4.500%, 11/20/18 | | | 3,348,071 | | |
| | 8,000,000 | | | Far East Horizon Ltd., 5.450%, 12/11/16 | | | 1,318,809 | | |
| | | | | | | | 4,666,880 | | |
Food-Retail: 1.8% | | | |
| | 10,500,000 | | | Tesco PLC, 1.750%, 09/01/14 | | | 1,718,567 | | |
Industrial Gases: 10.5% | | | |
| | 60,000,000 | | | Air Liquide Finance SA, 3.000%, 09/19/16 | | | 9,930,616 | | |
Life/Health Insurance: 2.1% | | | |
| | 12,000,000 | | | Value Success International, 4.000%, 11/21/16 | | | 1,993,358 | | |
Machinery: 4.1% | | | |
| | 5,000,000 | | | Caterpillar Financial Services Corp., 2.900%, 03/16/14 | | | 826,284 | | |
| | 18,000,000 | | | Caterpillar Financial Services Corp., 3.250%, 06/26/15 | | | 2,992,206 | | |
| | | | | | | | 3,818,490 | | |
Manufacturer: 1.1% | | | |
| | 6,500,000 | | | Singamas Container Holdings Ltd, 4.750%, 04/14/14 | | | 1,073,187 | | |
The accompanying notes are an integral part of these financial statements.
61
Principal Amount (CNH) | | CORPORATE BONDS: 91.9% (Continued) | | Value | |
Oil Company – Integrated: 5.0% | | | |
| | 29,000,000 | | | BP Capital Markets PLC, 1.700%, 09/15/14 | | $ | 4,746,313 | | |
Real Estate Operations/Development: 13.9% | | | |
| | 5,000,000 | | | Central Plaza Development Ltd., 7.600%, 11/29/15 | | | 862,398 | | |
| | 15,000,000 | | | Gemdale Asia Holding Ltd., 5.625%, 03/21/18 | | | 2,393,176 | | |
| | 18,500,000 | | | Global Logistic Properties Ltd., 3.375%, 05/11/16 3.375% | | | 3,048,462 | | |
| | 30,000,000 | | | New World China Land Ltd., 5.500%, 02/06/18 | | | 5,114,579 | | |
| | 10,000,000 | | | Yanlord Land HK Co. Ltd., 5.375%, 05/23/16 | | | 1,631,148 | | |
| | | | | | | | 13,049,763 | | |
Sovereign: 4.4% | | | |
| | 15,000,000 | | | China Government Bond, 2.870%, 06/27/16 | | | 2,490,518 | | |
| | 10,000,000 | | | China Governmentt Bond, 3.020%, 6/27/18 | | | 1,646,736 | | |
| | | | | | | | 4,137,254 | | |
Special Purpose Banks: 3.0% | | | |
| | 7,000,000 | | | Export Import Bank of China/The, 3.350%, 6/18/17 | | | 1,154,803 | | |
| | 10,000,000 | | | Korea Development Bank/The, 3.300%, 06/21/15 | | | 1,659,201 | | |
| | | | | | | | 2,814,004 | | |
Supranational Bank: 2.1% | | | |
| | 12,000,000 | | | International Bank for Reconstruction & Development, 2.00%, 06/17/14 | | | 1,982,545 | | |
| | | | | Total Corporate Bonds
(costs $83,722,423): 91.9% | | | 86,566,681 | | |
| | | SHORT-TERM INVESTMENTS: | | | |
Certificates of Deposit: 2.6% | | | |
| | 15,000,000 | | | Bank of China, 3.000%, 03/14/14 | | | 2,476,241 | | |
| | | | | Total Certificate of Deposit
(costs $2,454,743): 2.6% | | | 2,476,241 | | |
| | | | | Total Investments in Securities
(costs $86,177,166): 94.5% | | | 89,042,922 | | |
| | 28,736,711 | | | China Yuan (Offshore): 5.0% | | | 4,744,224 | | |
| | | | | Other Assets less Liabilities: 0.5% | | | 414,074 | | |
| | | | | Net Assets: 100.0% | | $ | 94,201,220 | | |
The accompanying notes are an integral part of these financial statements.
62
STATEMENTS OF ASSETS AND LIABILITIES
at December 31, 2013
| | | Alternative
Energy
Fund | | Asia
Focus
Fund | | Asia Pacific
Dividend
Fund | | China &
Hong Kong
Fund | |
Assets | |
Investments in securities, at cost | | $ | 31,714,482 | | | $ | 17,403,580 | | | $ | 3,688,684 | | | $ | 69,867,050 | | |
Investments in securities, at value | | $ | 24,234,800 | | | $ | 21,786,249 | | | $ | 4,174,772 | | | $ | 110,335,029 | | |
Cash | | | — | | | | 238,292 | | | | — | | | | 74,741 | | |
Cash denominated in foreign currency (cost of $0, $33,596, $399,031
and $0, respectively) | | | — | | | | 33,423 | | | | 399,091 | | | | — | | |
Receivables: | |
Fund shares sold | | | 197,156 | | | | 18 | | | | — | | | | 2,097 | | |
Dividends and interest | | | 16,809 | | | | 7,604 | | | | 40 | | | | 9,403 | | |
Due from Advisor, net | | | — | | | | — | | | | 5,929 | | | | — | | |
Prepaid expenses | | | 9,003 | | | | 4,924 | | | | 890 | | | | 13,799 | | |
Total assets | | | 24,457,768 | | | | 22,070,510 | | | | 4,580,722 | | | | 110,435,069 | | |
Liabilities | |
Overdraft due to custodian bank | | | 564,591 | | | | — | | | | 281,729 | | | | — | | |
Payable for Fund shares redeemed | | | 32,608 | | | | 39,421 | | | | — | | | | 261,958 | | |
Due to Advisor, net | | | 19,664 | | | | 19,486 | | | | — | | | | 95,322 | | |
Accrued administration fees | | | 1,113 | | | | 672 | | | | 238 | | | | 8,877 | | |
Accrued shareholder servicing plan fees | �� | | 1,876 | | | | 3,724 | | | | 965 | | | | 16,879 | | |
Deferred trustees' compensation | | | 30,539 | | | | 57,569 | | | | 20,339 | | | | 138,797 | | |
Other accrued expenses | | | 31,379 | | | | 46,717 | | | | 23,700 | | | | 59,238 | | |
Total liabilities | | | 681,770 | | | | 167,589 | | | | 326,971 | | | | 581,071 | | |
Net Assets | | $ | 23,775,998 | | | $ | 21,902,921 | | | $ | 4,253,751 | | | $ | 109,853,998 | | |
Number of shares issued and outstanding (unlimited shares authorized,
no par value) | | | 5,961,081 | | | | 1,341,055 | | | | 328,422 | | | | 3,560,043 | | |
Net asset value per share | | $ | 3.99 | | | $ | 16.33 | | | $ | 12.95 | | | $ | 30.86 | | |
Composition of Net Assets | |
Paid-in capital | | $ | 117,957,716 | | | $ | 19,016,069 | | | $ | 7,593,327 | | | $ | 67,328,645 | | |
Undistributed net investment income (loss) | | | (41,716 | ) | | | (56,828 | ) | | | (35,676 | ) | | | 174,488 | | |
Accumulated net realized gain (loss) on investments and foreign currency | | | (86,661,265 | ) | | | (1,433,184 | ) | | | (3,790,036 | ) | | | 1,882,888 | | |
Net unrealized appreciation (depreciation) on: | |
Investments | | | (7,479,682 | ) | | | 4,382,669 | | | | 486,088 | | | | 40,467,979 | | |
Foreign currency | | | 945 | | | | (5,805 | ) | | | 48 | | | | (2 | ) | |
Net Assets | | $ | 23,775,998 | | | $ | 21,902,921 | | | $ | 4,253,751 | | | $ | 109,853,998 | | |
The accompanying notes are an integral part of these financial statements.
63
STATEMENTS OF ASSETS AND LIABILITIES
at December 31, 2013
| | | Global
Energy
Fund | | Global
Innovators
Fund | | Inflation
Managed
Dividend
FundTM | | Renminbi
Yuan & Bond
Fund | |
Assets | |
Investments in securities, at cost | | $ | 61,669,279 | | | $ | 39,033,233 | | | $ | 2,061,269 | | | $ | 86,177,166 | | |
Investments in securities, at value | | $ | 71,800,830 | | | $ | 49,865,456 | | | $ | 2,519,109 | | | $ | 89,042,922 | | |
Cash | | | 491,905 | | | | 836,261 | | | | 101,834 | | | | — | | |
Cash denominated in foreign currency (cost of $0, $0, $0 and $4,666,345 respectively) | | | — | | | | — | | | | — | | | | 4,744,224 | | |
Receivables: | |
Fund shares sold | | | 90,269 | | | | 131,375 | | | | 512,750 | | | | 231,354 | | |
Dividends and interest | | | 144,874 | | | | 60,642 | | | | 9,185 | | | | 654,971 | | |
Prepaid expenses | | | 12,274 | | | | 11,514 | | | | 1,847 | | | | 15,561 | | |
Total assets | | | 72,540,152 | | | | 50,905,248 | | | | 3,144,725 | | | | 94,689,032 | | |
Liabilities | |
Overdraft due to custodian bank | | | — | | | | — | | | | — | | | | 398,524 | | |
Payable for Fund shares redeemed | | | 39,753 | | | | 23,617 | | | | — | | | | — | | |
Due to Advisor, net | | | 44,331 | | | | 30,978 | | | | 14,370 | ‡ | | | 31,608 | | |
Accrued administration fees | | | 2,782 | | | | 1,352 | | | | 96 | | | | 2,983 | | |
Accrued shareholder servicing plan fees | | | 19,485 | | | | 5,205 | | | | 56 | | | | 10,885 | | |
Deferred trustees' compensation | | | 48,213 | | | | 70,874 | | | | 4,002 | | | | 11,201 | | |
Other accrued expenses | | | 66,694 | | | | 42,074 | | | | 19,880 | | | | 32,611 | | |
Total liabilities | | | 221,258 | | | | 174,100 | | | | 38,404 | | | | 487,812 | | |
Net Assets | | $ | 72,318,894 | | | $ | 50,731,148 | | | $ | 3,106,321 | | | $ | 94,201,220 | | |
Number of shares issued and outstanding (unlimited shares authorized,
no par value) | | | 2,228,642 | | | | 1,655,071 | | | | 198,667 | | | | 7,276,124 | | |
Net asset value per share | | $ | 32.45 | | | $ | 30.65 | | | $ | 15.64 | | | $ | 12.95 | | |
Composition of Net Assets | |
Paid-in capital | | $ | 67,000,995 | | | $ | 43,716,670 | | | $ | 2,650,070 | | | $ | 91,150,479 | | |
Undistributed net investment income (loss) | | | (143,300 | ) | | | (70,204 | ) | | | (4,002 | ) | | | 151,395 | | |
Accumulated net realized gain (loss) on investments and foreign currency | | | (4,673,819 | ) | | | (3,747,541 | ) | | | 2,237 | | | | (47,320 | ) | |
Net unrealized appreciation (depreciation) on: | |
Investments | | | 10,131,551 | | | | 10,832,223 | | | | 457,840 | | | | 2,865,756 | | |
Foreign currency | | | 3,467 | | | | — | | | | 176 | | | | 80,910 | | |
Net Assets | | $ | 72,318,894 | | | $ | 50,731,148 | | | $ | 3,106,321 | | | $ | 94,201,220 | | |
‡ Includes $23,281 of registration fees advanced by the Advisor.
The accompanying notes are an integral part of these financial statements.
64
STATEMENTS OF OPERATIONS
For the year ended December 31, 2013
| | | Alternative
Energy
Fund | | Asia
Focus
Fund | | Asia Pacific
Dividend
Fund | | China &
Hong Kong
Fund | |
Investment Income | |
Dividends * | | $ | 137,564 | | | $ | 686,281 | | | $ | 186,697 | | | $ | 3,513,830 | | |
Total income | | | 137,564 | | | | 686,281 | | | | 186,697 | | | | 3,513,830 | | |
Expenses | |
Advisory fees | | | 182,655 | | | | 264,461 | | | | 47,234 | | | | 1,255,003 | | |
Shareholder servicing plan fees | | | 34,179 | | | | 35,305 | | | | 8,502 | | | | 183,005 | | |
Transfer agent fees and expenses | | | 41,001 | | | | 33,680 | | | | 17,498 | | | | 77,000 | | |
Fund accounting fee and expenses | | | 27,533 | | | | 33,000 | | | | 23,999 | | | | 74,999 | | |
Administration fees | | | 8,234 | | | | 10,747 | | | | 1,889 | | | | 60,251 | | |
Custody fees and expenses | | | 11,551 | | | | 19,698 | | | | 9,701 | | | | 30,000 | | |
Audit fees | | | 18,498 | | | | 24,999 | | | | 18,498 | | | | 24,999 | | |
Legal fees | | | 8,098 | | | | 12,735 | | | | 2,299 | | | | 62,999 | | |
Registration fees | | | 15,752 | | | | 15,490 | | | | 16,002 | | | | 23,999 | | |
Printing | | | 16,002 | | | | 6,525 | | | | 4,501 | | | | 23,999 | | |
Trustees' fees and expenses | | | 14,001 | | | | 17,304 | | | | 10,601 | | | | 52,499 | | |
Insurance | | | 1,004 | | | | 3,814 | | | | 372 | | | | 12,410 | | |
CCO fees and expenses | | | 7,138 | | | | 9,865 | | | | 6,563 | | | | 20,918 | | |
Miscellaneous | | | 597 | | | | 1,799 | | | | 599 | | | | 4,501 | | |
Interest expense | | | 2,803 | | | | 4,267 | | | | 217 | | | | 14,113 | | |
Total expenses | | | 389,046 | | | | 493,689 | | | | 168,475 | | | | 1,920,695 | | |
Less: fees waived and expenses absorbed | | | (24,186 | ) | | | — | | | | (74,741 | ) | | | — | | |
Net expenses | | | 364,860 | | | | 493,689 | | | | 93,734 | | | | 1,920,695 | | |
Net investment income (loss) | | | (227,296 | ) | | | 192,592 | | | | 92,963 | | | | 1,593,135 | | |
Realized and unrealized gain (loss) on investments and foreign currency | |
Net realized gain (loss) on: | |
Investments | | | (3,043,284 | ) | | | 4,653,729 | | | | 415,710 | | | | 12,156,492 | | |
Foreign currency | | | (16,551 | ) | | | (42,174 | ) | | | (6,932 | ) | | | (7,035 | ) | |
| | | | (3,059,835 | ) | | | 4,611,555 | | | | 408,778 | | | | 12,149,457 | | |
Net unrealized appreciation (depreciation) on: | |
Investments | | | 10,503,778 | | | | (7,840,609 | ) | | | (582,717 | ) | | | (9,244,559 | ) | |
Foreign currency | | | 932 | | | | (1,648 | ) | | | 25 | | | | (116 | ) | |
| | | | 10,504,710 | | | | (7,842,257 | ) | | | (582,692 | ) | | | (9,244,675 | ) | |
Net realized and unrealized gain (loss) on investments and foreign currency | | | 7,444,875 | | | | (3,230,702 | ) | | | (173,914 | ) | | | 2,904,782 | | |
Net increase (decrease) in net assets from operations | | $ | 7,217,579 | | | $ | (3,038,110 | ) | | $ | (80,951 | ) | | $ | 4,497,917 | | |
* Net of foreign tax withheld of $15,378, $65,567, $17,210, and $177,510 respectively.
The accompanying notes are an integral part of these financial statements.
65
STATEMENTS OF OPERATIONS
For the year ended December 31, 2013
| | | Global
Energy
Fund | | Global
Innovators
Fund | | Inflation
Managed
Dividend
FundTM | | Renminbi
Yuan & Bond
Fund | |
Investment Income | |
Dividends * | | $ | 1,666,678 | | | $ | 689,335 | | | $ | 70,960 | | | $ | — | | |
Interest | | | — | | | | — | | | | — | | | | 2,842,174 | | |
Total income | | | 1,666,678 | | | | 689,335 | | | | 70,960 | | | | 2,842,174 | | |
Expenses | |
Advisory fees | | | 589,522 | | | | 290,196 | | | | 9,391 | | | | 506,685 | | |
Shareholder servicing plan fees | | | 155,978 | | | | 52,870 | | | | 2,602 | | | | 86,610 | | |
Transfer agent fees and expenses | | | 46,195 | | | | 56,499 | | | | 17,258 | | | | 16,002 | | |
Fund accounting fee and expenses | | | 53,873 | | | | 36,199 | | | | 24,090 | | | | 61,999 | | |
Administration fees | | | 33,441 | | | | 16,227 | | | | 916 | | | | 39,850 | | |
Custody fees and expenses | | | 11,477 | | | | 5,001 | | | | 2,050 | | | | 23,499 | | |
Audit fees | | | 24,999 | | | | 24,999 | | | | 15,002 | | | | 18,498 | | |
Legal fees | | | 42,501 | | | | 19,901 | | | | 1,000 | | | | 49,001 | | |
Registration fees | | | 24,606 | | | | 18,002 | | | | 20,076 | | | | 33,026 | | |
Printing | | | 22,171 | | | | 10,501 | | | | 3,825 | | | | 5,501 | | |
Trustees' fees and expenses | | | 25,199 | | | | 21,863 | | | | 8,695 | | | | 19,676 | | |
Insurance | | | 8,786 | | | | 2,219 | | | | 142 | | | | 7,380 | | |
CCO fees and expenses | | | 14,619 | | | | 10,214 | | | | 6,252 | | | | 18,292 | | |
Offering costs | | | — | | | | — | | | | 1,172 | | | | — | | |
Miscellaneous | | | 3,001 | | | | 1,500 | | | | 701 | | | | 3,200 | | |
Interest expense | | | 9,105 | | | | 1,708 | | | | — | | | | 2,873 | | |
Total expenses | | | 1,065,473 | | | | 567,899 | | | | 113,172 | | | | 892,092 | | |
Less: fees waived and expenses absorbed | | | — | | | | — | | | | (99,129 | ) | | | (60,089 | ) | |
Net expenses | | | 1,065,473 | | | | 567,899 | | | | 14,043 | | | | 832,003 | | |
Net investment income | | | 601,205 | | | | 121,436 | | | | 56,917 | | | | 2,010,171 | | |
Realized and unrealized gain (loss) on investments and foreign currency | |
Net realized gain (loss) on: | |
Investments | | | (1,388,787 | ) | | | (45,990 | ) | | | 75,166 | | | | 605,289 | | |
Foreign currency | | | 5,025 | | | | (4,320 | ) | | | 492 | | | | 322,413 | | |
| | | | (1,383,762 | ) | | | (50,310 | ) | | | 75,658 | | | | 927,702 | | |
Net unrealized appreciation (depreciation) on: | |
Investments | | | 17,370,899 | | | | 14,383,887 | | | | 403,742 | | | | 1,844,433 | | |
Foreign currency | | | 5,225 | | | | — | | | | 146 | | | | (79,312 | ) | |
| | | | 17,376,124 | | | | 14,383,887 | | | | 403,888 | | | | 1,765,121 | | |
Net realized and unrealized gain (loss) on investments and foreign currency | | | 15,992,362 | | | | 14,333,577 | | | | 479,546 | | | | 2,692,823 | | |
Net increase in net assets from operations | | $ | 16,593,567 | | | $ | 14,455,013 | | | $ | 536,463 | | | $ | 4,702,994 | | |
* Net of foreign tax withheld of $137,705, $10,819, $4,533, and $0, respectively.
The accompanying notes are an integral part of these financial statements.
66
STATEMENTS OF CHANGES IN NET ASSETS
| | | Alternative Energy Fund | | Asia Focus Fund | | Asia Pacific Dividend Fund | |
| | | Year Ended
December 31, 2013 | | Year Ended
December 31, 2012 | | Year Ended
December 31, 2013 | | Year Ended
December 31, 2012 | | Year Ended
December 31, 2013 | | Year Ended
December 31, 2012 | |
Increase/(decrease) in
net assets from: | |
Operations | |
Net investment income (loss) | | $ | (227,296 | ) | | $ | (121,232 | ) | | $ | 192,592 | | | $ | 701,250 | | | $ | 92,963 | | | $ | 108,127 | | |
Net realized gain (loss) on: | |
Investments | | | (3,043,284 | ) | | | (781,828 | ) | | | 4,653,729 | | | | (736,729 | ) | | | 415,710 | | | | 120,630 | | |
Foreign currency | | | (16,551 | ) | | | 2,144 | | | | (42,174 | ) | | | (6,733 | ) | | | (6,932 | ) | | | 173 | | |
Net change in unrealized
appreciation (depreciation) on: | |
Investments | | | 10,503,778 | | | | (1,661,165 | ) | | | (7,840,609 | ) | | | 6,559,009 | | | | (582,717 | ) | | | 752,656 | | |
Foreign currency | | | 932 | | | | 14,803 | | | | (1,648 | ) | | | 49 | | | | 25 | | | | (8 | ) | |
Net increase from payments
by affiliates | | | — | | | | 853 | | | | — | | | | — | | | | — | | | | — | | |
Net increase (decrease) in net
assets resulting from
operations | | | 7,217,579 | | | | (2,546,425 | ) | | | (3,038,110 | ) | | | 6,516,846 | | | | (80,951 | ) | | | 981,578 | | |
Distributions to shareholders | |
From net investment income | | | — | | | | (32,745 | ) | | | (400,182 | ) | | | (585,229 | ) | | | (101,646 | ) | | | (117,316 | ) | |
From net realized gains | | | — | | | | — | | | | — | | | | — | | | | — | | | | — | | |
Total distributions to
shareholders | | | — | | | | (32,745 | ) | | | (400,182 | ) | | | (585,229 | ) | | | (101,646 | ) | | | (117,316 | ) | |
Capital transactions | |
Proceeds from shares sold | | | 17,203,455 | | | | 2,056,290 | | | | 764,866 | | | | 2,119,393 | | | | 823,529 | | | | 559,935 | | |
Reinvestment of distributions | | | — | | | | 31,264 | | | | 351,504 | | | | 542,486 | | | | 96,502 | | | | 111,467 | | |
Cost of shares repurchased | | | (13,751,424 | ) | | | (4,030,304 | ) | | | (20,629,442 | ) | | | (9,557,136 | ) | | | (1,309,444 | ) | | | (1,242,158 | ) | |
Redemption fee proceeds | | | 65,885 | | | | 1,920 | | | | 864 | | | | 25 | | | | 299 | | | | 2 | | |
Net change in net assets from
capital transactions | | | 3,517,916 | | | | (1,940,830 | ) | | | (19,512,208 | ) | | | (6,895,232 | ) | | | (389,114 | ) | | | (570,754 | ) | |
Total increase (decrease) in
net assets | | | 10,735,495 | | | | (4,520,000 | ) | | | (22,950,500 | ) | | | (963,615 | ) | | | (571,711 | ) | | | 293,508 | | |
Net assets | |
Beginning of period | | | 13,040,503 | | | | 17,560,503 | | | | 44,853,421 | | | | 45,817,036 | | | | 4,825,462 | | | | 4,531,954 | | |
End of period | | $ | 23,775,998 | | | $ | 13,040,503 | | | $ | 21,902,921 | | | $ | 44,853,421 | | | $ | 4,253,751 | | | $ | 4,825,462 | | |
Accumulated net investment
income (loss) | | $ | (41,716 | ) | | $ | (29,155 | ) | | $ | (56,828 | ) | | $ | 192,936 | | | $ | (35,676 | ) | | $ | (20,525 | ) | |
Capital share activity | |
Shares sold | | | 4,446,514 | | | | 778,024 | | | | 42,567 | | | | 121,708 | | | | 60,475 | | | | 44,401 | | |
Shares issued on reinvestment | | | — | | | | 12,813 | | | | 21,618 | | | | 29,709 | | | | 7,239 | | | | 8,971 | | |
Shares redeemed | | | (3,756,334 | ) | | | (1,544,024 | ) | | | (1,139,424 | ) | | | (558,880 | ) | | | (96,247 | ) | | | (100,055 | ) | |
Net increase (decrease) in
shares outstanding | | | 690,180 | | | | (753,187 | ) | | | (1,075,239 | ) | | | (407,463 | ) | | | (28,533 | ) | | | (46,683 | ) | |
The accompanying notes are an integral part of these financial statements.
67
STATEMENTS OF CHANGES IN NET ASSETS
| | | China & Hong Kong Fund | | Global Energy Fund | | Global Innovators Fund | |
| | | Year Ended
December 31, 2013 | | Year Ended
December 31, 2012 | | Year Ended
December 31, 2013 | | Year Ended
December 31, 2012 | | Year Ended
December 31, 2013 | | Year Ended
December 31, 2012 | |
Increase/(decrease) in
net assets from: | |
Operations | |
Net investment income | | $ | 1,593,135 | | | $ | 2,130,902 | | | $ | 601,205 | | | $ | 791,580 | | | $ | 121,436 | | | $ | 163,455 | | |
Net realized gain (loss) on: | |
Investments | | | 12,156,492 | | | | (3,912,231 | ) | | | (1,388,787 | ) | | | 948,292 | | | | (45,990 | ) | | | 2,871,543 | | |
Foreign currency | | | (7,035 | ) | | | (283 | ) | | | 5,025 | | | | (41,881 | ) | | | (4,320 | ) | | | — | | |
Net change in unrealized
appreciation (depreciation) on: | |
Investments | | | (9,244,559 | ) | | | 22,659,307 | | | | 17,370,899 | | | | 3,019,512 | | | | 14,383,887 | | | | 2,937,143 | | |
Foreign currency | | | (116 | ) | | | 34 | | | | 5,225 | | | | 2,719 | | | | — | | | | — | | |
Net increase (decrease) in net
assets resulting from
operations | | | 4,497,917 | | | | 20,877,729 | | | | 16,593,567 | | | | 4,720,222 | | | | 14,455,013 | | | | 5,972,141 | | |
Distributions to shareholders | |
From net investment income | | | (1,501,284 | ) | | | (3,000,059 | ) | | | (338,807 | ) | | | (1,500,024 | ) | | | (200,095 | ) | | | (100,107 | ) | |
From net realized gains | | | (1,539,106 | ) | | | — | | | | — | | | | — | | | | — | | | | — | | |
Total distributions to
shareholders | | | (3,040,390 | ) | | | (3,000,059 | ) | | | (338,807 | ) | | | (1,500,024 | ) | | | (200,095 | ) | | | (100,107 | ) | |
Capital transactions | |
Proceeds from shares sold | | | 11,539,134 | | | | 20,402,275 | | | | 10,278,491 | | | | 21,843,906 | | | | 9,765,713 | | | | 959,196 | | |
Reinvestment of distributions | | | 2,931,713 | | | | 2,921,167 | | | | 328,596 | | | | 1,458,196 | | | | 195,241 | | | | 97,437 | | |
Cost of shares repurchased | | | (58,106,462 | ) | | | (42,164,990 | ) | | | (44,819,039 | ) | | | (79,375,997 | ) | | | (5,115,843 | ) | | | (7,688,122 | ) | |
Redemption fee proceeds | | | 24,920 | | | | 11,531 | | | | 3,568 | | | | 9,488 | | | | 132 | | | | 21 | | |
Net change in net assets from
capital transactions | | | (43,610,695 | ) | | | (18,830,017 | ) | | | (34,208,384 | ) | | | (56,064,407 | ) | | | 4,845,243 | | | | (6,631,468 | ) | |
Total increase (decrease) in
net assets | | | (42,153,168 | ) | | | (952,347 | ) | | | (17,953,624 | ) | | | (52,844,209 | ) | | | 19,100,161 | | | | (759,434 | ) | |
Net assets | |
Beginning of period | | | 152,007,166 | | | | 152,959,513 | | | | 90,272,518 | | | | 143,116,727 | | | | 31,630,987 | | | | 32,390,421 | | |
End of period | | $ | 109,853,998 | | | $ | 152,007,166 | | | $ | 72,318,894 | | | $ | 90,272,518 | | | $ | 50,731,148 | | | $ | 31,630,987 | | |
Accumulated net investment
income (loss) | | $ | 174,488 | | | $ | 89,672 | | | $ | (143,300 | ) | | $ | (589,492 | ) | | $ | (70,204 | ) | | $ | 12,775 | | |
Capital share activity | |
Shares sold | | | 392,079 | | | | 712,765 | | | | 362,946 | | | | 820,901 | | | | 358,498 | | | | 48,744 | | |
Shares issued on reinvestment | | | 95,403 | | | | 99,495 | | | | 10,133 | | | | 56,041 | | | | 6,418 | | | | 4,638 | | |
Shares redeemed | | | (2,026,546 | ) | | | (1,467,538 | ) | | | (1,591,419 | ) | | | (2,995,145 | ) | | | (203,029 | ) | | | (387,704 | ) | |
Net increase (decrease) in
shares outstanding | | | (1,539,064 | ) | | | (655,278 | ) | | | (1,218,340 | ) | | | (2,118,203 | ) | | | 161,887 | | | | (334,322 | ) | |
The accompanying notes are an integral part of these financial statements.
68
STATEMENTS OF CHANGES IN NET ASSETS
| | | Inflation Managed Dividend FundTM | | Renminbi Yuan & Bond Fund | |
| | | Year Ended
December 31, 2013 | | For the period
March 30, 2012+ to
December 31, 2012 | | Year Ended
December 31, 2013 | | Year Ended
December 31, 2012 | |
Increase/(decrease) in net assets from: | |
Operations | |
Net investment income | | $ | 56,917 | | | $ | 37,434 | | | $ | 2,010,171 | | | $ | 999,108 | | |
Net realized gain on: | |
Investments | | | 75,166 | | | | 3,738 | | | | 605,289 | | | | 787,616 | | |
Foreign currency | | | 492 | | | | 906 | | | | 322,413 | | | | 571,822 | | |
Net change in unrealized
appreciation (depreciation) on: | |
Investments | | | 403,742 | | | | 54,098 | | | | 1,844,433 | | | | 1,304,800 | | |
Foreign currency | | | 146 | | | | 30 | | | | (79,312 | ) | | | (243,357 | ) | |
Net increase in net assets resulting from operations | | | 536,463 | | | | 96,206 | | | | 4,702,994 | | | | 3,419,989 | | |
Distributions to shareholders | |
From net investment income | | | (63,759 | ) | | | (36,741 | ) | | | (3,012,616 | ) | | | (2,095,737 | ) | |
From net realized gain | | | (75,918 | ) | | | — | | | | — | | | | — | | |
Total distributions to shareholders | | | (139,677 | ) | | | (36,741 | ) | | | (3,012,616 | ) | | | (2,095,737 | ) | |
Capital transactions | |
Proceeds from shares sold | | | 2,138,276 | | | | 2,583,826 | | | | 15,501,499 | | | | 13,773,598 | | |
Reinvestment of distributions | | | 138,503 | | | | 36,392 | | | | 2,996,514 | | | | 2,080,658 | | |
Cost of shares repurchased | | | (1,360,879 | ) | | | (886,064 | ) | | | (15,313,968 | ) | | | (20,582,714 | ) | |
Redemption fee proceeds | | | 16 | | | | — | | | | 503 | | | | 3,167 | | |
Net change in net assets from capital transactions | | | 915,916 | | | | 1,734,154 | | | | 3,184,548 | | | | (4,725,291 | ) | |
Total increase (decrease) in net assets | | | 1,312,702 | | | | 1,793,619 | | | | 4,874,926 | | | | (3,401,039 | ) | |
Net assets | |
Beginning of period | | | 1,793,619 | | | | — | | | | 89,326,294 | | | | 92,727,333 | | |
End of period | | $ | 3,106,321 | | | $ | 1,793,619 | | | $ | 94,201,220 | | | $ | 89,326,294 | | |
Accumulated net investment income (loss) | | $ | (4,002 | ) | | $ | 1,599 | | | $ | 151,395 | | | $ | 226,138 | | |
Capital share activity | |
Shares sold | | | 142,453 | | | | 209,158 | | | | 1,202,698 | | | | 1,090,531 | | |
Shares issued on reinvestment | | | 9,127 | | | | 2,899 | | | | 234,015 | | | | 164,436 | | |
Shares redeemed | | | (93,058 | ) | | | (71,912 | ) | | | (1,190,910 | ) | | | (1,633,857 | ) | |
Net increase (decrease) in shares outstanding | | | 58,522 | | | | 140,145 | | | | 245,803 | | | | (378,890 | ) | |
+ The Inflation Managed Dividend Fund commenced operations on March 30, 2012.
The accompanying notes are an integral part of these financial statements.
69
FINANCIAL HIGHLIGHTS
For a capital share outstanding throughout the year
| | | Year Ended December 31, | |
Alternative Energy Fund | | 2013 | | 2012 | | 2011 | | 2010 | | 2009 | |
Net asset value, beginning of period | | $ | 2.47 | | | $ | 2.92 | | | $ | 5.17 | | | $ | 6.62 | | | $ | 5.14 | | |
Income from investment operations: | |
Net investment income (loss) | | | (0.04 | ) | | | (0.02 | ) | | | 0.06 | | | | (0.05 | ) | | | (0.05 | ) | |
Net realized and unrealized gain (loss)
on investments and foreign currency | | | 1.55 | | | | (0.42 | ) | | | (2.26 | ) | | | (1.40 | ) | | | 1.77 | | |
Total from investment operations | | | 1.51 | | | | (0.44 | ) | | | (2.20 | ) | | | (1.45 | ) | | | 1.72 | | |
Less distributions: | |
From net investment income | | | — | | | | (0.01 | ) | | | (0.05 | ) | | | — | | | | — | | |
Return of capital | | | — | | | | — | | | | — | | | | — | | | | (0.24 | ) | |
Total distributions | | | — | | | | (0.01 | ) | | | (0.05 | ) | | | — | | | | (0.24 | ) | |
Redemption fee proceeds | | | 0.01 | | | | — | (1) | | | — | (1) | | | — | (1) | | | — | (1) | |
Net asset value, end of period | | $ | 3.99 | | | $ | 2.47 | | | $ | 2.92 | | | $ | 5.17 | | | $ | 6.62 | | |
Total return | | | 61.54 | % | | | (15.20 | )% | | | (42.53 | )% | | | (21.90 | )% | | | 33.42 | % | |
Ratios/supplemental data: | |
Net assets, end of period (millions) | | $ | 23.8 | | | $ | 13.0 | | | $ | 17.6 | | | $ | 36.2 | | | $ | 62.1 | | |
Ratio of expenses to average net assets: | |
Before fee waived | | | 2.13 | % | | | 2.32 | % | | | 1.81 | % | | | 1.76 | % | | | 1.85 | % | |
After fees waived | | | 2.00 | % | | | 2.02 | % | | | 1.81 | % | | | 1.76 | % | | | 1.85 | % | |
| After fees waived excluding interest expense(2) | | | 1.98 | % | | | 1.98 | % | | | 1.79 | % | | | 1.73 | % | | | 1.85 | % | |
Ratio of net investment income (loss) to average net assets: | |
Before fees waived | | | (1.37 | )% | | | (1.11 | )% | | | 1.11 | % | | | (0.86 | )% | | | (0.98 | )% | |
After fees waived | | | (1.24 | )% | | | (0.81 | )% | | | 1.11 | % | | | (0.86 | )% | | | (0.98 | )% | |
Portfolio turnover rate | | | 60.20 | % | | | 7.80 | % | | | 43.10 | % | | | 24.74 | % | | | 47.10 | % | |
(1) Amount represents less than $0.01 per share.
(2) The Advisor has contractually agreed to limit the operating expenses of the Fund to 1.98%, excluding interest expense, expenses related to dividends on short positions, brokerage commissions, taxes and other extraordinary expenses. See Note 3.
The accompanying notes are an integral part of these financial statements.
70
FINANCIAL HIGHLIGHTS
For a capital share outstanding throughout the year
| | | Year Ended December 31, | |
Asia Focus Fund | | 2013 | | 2012 | | 2011 | | 2010 | | 2009 | |
Net asset value, beginning of period | | $ | 18.56 | | | $ | 16.23 | | | $ | 21.04 | | | $ | 17.63 | | | $ | 9.52 | | |
Income from investment operations: | |
Net investment income | | | 0.21 | | | | 0.30 | | | | 0.18 | | | | 0.12 | | | | 0.06 | (1) | |
Net realized and unrealized gain (loss)
on investments and foreign currency | | | (2.14 | ) | | | 2.28 | | | | (4.88 | ) | | | 3.45 | | | | 8.13 | | |
Total from investment operations | | | (1.93 | ) | | | 2.58 | | | | (4.70 | ) | | | 3.57 | | | | 8.19 | | |
Less distributions: | |
From net investment income | | | (0.30 | ) | | | (0.25 | ) | | | (0.11 | ) | | | (0.19 | ) | | | (0.08 | ) | |
Total distributions | | | (0.30 | ) | | | (0.25 | ) | | | (0.11 | ) | | | (0.19 | ) | | | (0.08 | ) | |
Redemption fee proceeds | | | — | (2) | | | — | (2) | | | — | (2) | | | 0.03 | | | | — | (2) | |
Net asset value, end of period | | $ | 16.33 | | | $ | 18.56 | | | $ | 16.23 | | | $ | 21.04 | | | $ | 17.63 | | |
Total return | | | (10.38 | )% | | | 15.89 | % | | | (22.35 | )% | | | 20.43 | % | | | 86.05 | % | |
Ratios/supplemental data: | |
Net assets, end of period (millions) | | $ | 21.9 | | | $ | 44.90 | | | $ | 45.8 | | | $ | 64.4 | | | $ | 112.4 | | |
Ratio of expenses to average net assets: | |
Before fees waived | | | 1.87 | % | | | 1.70 | % | | | 1.59 | % | | | 1.67 | % | | | 1.68 | % | |
After fees waived | | | 1.87 | % | | | 1.70 | % | | | 1.59 | % | | | 1.67 | % | | | 1.68 | % | |
| After fees waived excluding interest expense(3) | | | 1.85 | % | | | 1.69 | % | | | 1.59 | % | | | 1.65 | % | | | 1.68 | % | |
Ratio of net investment income to average net assets: | |
Before fees waived | | | 0.73 | % | | | 1.56 | % | | | 0.89 | % | | | 0.77 | % | | | 0.73 | % | |
After fees waived | | | 0.73 | % | | | 1.56 | % | | | 0.89 | % | | | 0.77 | % | | | 0.73 | % | |
Portfolio turnover rate | | | 7.43 | % | | | 10.90 | % | | | 7.79 | % | | | 25.44 | % | | | 31.35 | % | |
(1) Based on average shares outstanding during the period.
(2) Amount represents less than $0.01 per share.
(3) The Advisor has contractually agreed to limit the operating expenses of the Fund to 1.98%, excluding interest expense, expenses related to dividends on short positions, borkerage commissions, taxes and other extraordinary expenses. See Note 3.
The accompanying notes are an integral part of these financial statements.
71
FINANCIAL HIGHLIGHTS
For a capital share outstanding throughout the year
| | | Year Ended December 31, | |
Asia Pacific Dividend Fund | | 2013 | | 2012 | | 2011 | | 2010 | | 2009 | |
Net asset value, beginning of period | | $ | 13.52 | | | $ | 11.23 | | | $ | 13.41 | | | $ | 11.03 | | | $ | 7.00 | | |
Income from investment operations: | |
Net investment income | | | 0.27 | | | | 0.30 | | | | 0.30 | | | | 0.17 | | | | 0.18 | (1) | |
Net realized and unrealized gain (loss)
on investments and foreign currency | | | (0.54 | ) | | | 2.31 | | | | (2.18 | ) | | | 2.41 | | | | 4.32 | | |
Total from investment operations | | | (0.27 | ) | | | 2.61 | | | | (1.88 | ) | | | 2.58 | | | | 4.50 | | |
Less distributions: | |
From net investment income | | | (0.30 | ) | | | (0.32 | ) | | | (0.30 | ) | | | (0.20 | ) | | | (0.18 | ) | |
Return of capital | | | — | | | | — | | | | — | | | | — | | | | (0.29 | ) | |
Total distributions | | | (0.30 | ) | | | (0.32 | ) | | | (0.30 | ) | | | (0.20 | ) | | | (0.47 | ) | |
Redemption fee proceeds | | | — | (2) | | | — | (2) | | | — | | | | — | (2) | | | — | (2) | |
Net asset value, end of period | | $ | 12.95 | | | $ | 13.52 | | | $ | 11.23 | | | $ | 13.41 | | | $ | 11.03 | | |
Total return | | | (2.06 | )% | | | 23.48 | % | | | (14.04 | )% | | | 23.65 | % | | | 64.84 | % | |
Ratios/supplemental data: | |
Net assets, end of period (millions) | | $ | 4.3 | | | $ | 4.8 | | | $ | 4.5 | | | $ | 6.7 | | | $ | 11.4 | | |
Ratio of expenses to average net assets: | |
Before fees waived | | | 3.56 | % | | | 3.57 | % | | | 3.26 | % | | | 2.92 | % | | | 2.93 | % | |
After fees waived | | | 1.98 | % | | | 1.98 | % | | | 1.98 | % | | | 2.01 | % | | | 1.98 | % | |
| After fees waived excluding interest expense(3) | | | 1.98 | % | | | 1.98 | % | | | 1.98 | % | | | 1.98 | % | | | 1.98 | % | |
Ratio of net investment income to average net assets: | |
Before fees waived | | | 0.39 | % | | | 0.71 | % | | | 1.13 | % | | | 0.38 | % | | | 1.23 | % | |
After fees waived | | | 1.97 | % | | | 2.39 | % | | | 2.41 | % | | | 1.29 | % | | | 2.18 | % | |
Portfolio turnover rate | | | 56.96 | % | | | 10.19 | % | | | 10.67 | % | | | 27.20 | % | | | 26.03 | % | |
(1) Based on average shares outstanding during the period.
(2) Amount represents less than $0.01 per share.
(3) The Advisor has contractually agreed to limit the operating expenses of the Fund to 1.98%, excluding interest expense, expenses related to dividends on short positions, brokerage commissions, taxes and other extraordinary expenses. See Note 3.
The accompanying notes are an integral part of these financial statements.
72
FINANCIAL HIGHLIGHTS
For a capital share outstanding throughout the year
| | | Year Ended December 31, | |
China & Hong Kong Fund | | 2013 | | 2012 | | 2011 | | 2010 | | 2009 | |
Net asset value, beginning of period | | $ | 29.81 | | | $ | 26.58 | | | $ | 38.76 | | | $ | 35.13 | | | $ | 18.98 | | |
Income from investment operations: | |
Net investment income | | | 0.46 | | | | 0.45 | | | | 0.39 | | | | 0.27 | | | | 0.15 | | |
Net realized and unrealized gain (loss)
on investments and foreign currency | | | 1.45 | | | | 3.37 | | | | (11.06 | ) | | | 5.10 | | | | 17.44 | | |
Total from investment operations | | | 1.91 | | | | 3.82 | | | | (10.67 | ) | | | 5.37 | | | | 17.59 | | |
Less distributions: | |
From net investment income | | | (0.43 | ) | | | (0.59 | ) | | | (0.20 | ) | | | (0.38 | ) | | | (0.34 | ) | |
From net realized gain | | | (0.44 | ) | | | — | | | | (1.31 | ) | | | (1.38 | ) | | | (1.11 | ) | |
Total distributions | | | (0.87 | ) | | | (0.59 | ) | | | (1.51 | ) | | | (1.76 | ) | | | (1.45 | ) | |
Redemption fee proceeds | | | 0.01 | | | | — | (1) | | | — | (1) | | | 0.02 | | | | 0.01 | | |
Net asset value, end of period | | $ | 30.86 | | | $ | 29.81 | | | $ | 26.58 | | | $ | 38.76 | | | $ | 35.13 | | |
Total return | | | 6.45 | % | | | 14.42 | % | | | (27.52 | )% | | | 15.38 | % | | | 92.76 | % | |
Ratios/supplemental data: | |
Net assets, end of period (millions) | | $ | 109.9 | | | $ | 152.0 | | | $ | 153.0 | | | $ | 242.8 | | | $ | 241.0 | | |
Ratio of expenses to average net assets: | |
Before fees waived | | | 1.53 | % | | | 1.51 | % | | | 1.53 | % | | | 1.48 | % | | | 1.58 | % | |
After fees waived | | | 1.53 | % | | | 1.51 | % | | | 1.53 | % | | | 1.48 | % | | | 1.58 | % | |
| After fees waived excluding interest expense(2) | | | 1.52 | % | | | 1.51 | % | | | 1.52 | % | | | 1.47 | % | | | 1.58 | % | |
Ratio of net investment income to average net assets | | | 1.27 | % | | | 1.34 | % | | | 1.14 | % | | | 0.62 | % | | | 0.62 | % | |
Portfolio turnover rate | | | 6.90 | % | | | 3.85 | % | | | 7.81 | % | | | 32.35 | % | | | 7.87 | % | |
(1) Amount represents less than $0.01 per share.
(2) The Advisor has contractually agreed to limit the operating expenses of the Fund to 1.98%, excluding interest expense, expenses related to dividends on short positions, borkerage commissions, taxes and other extraordinary expenses. See Note 3.
The accompanying notes are an integral part of these financial statements.
73
FINANCIAL HIGHLIGHTS
For a capital share outstanding throughout the year
| | | Year Ended December 31, | |
Global Energy Fund | | 2013 | | 2012 | | 2011 | | 2010 | | 2009 | |
Net asset value, beginning of period | | $ | 26.19 | | | $ | 25.72 | | | $ | 29.74 | | | $ | 25.60 | | | $ | 15.68 | | |
Income from investment operations: | |
Net investment income | | | 0.18 | | | | 0.22 | | | | 0.14 | | | | 0.12 | | | | 0.11 | | |
Net realized and unrealized gain (loss)
on investments and foreign currency | | | 6.23 | | | | 0.69 | | | | (4.06 | ) | | | 4.13 | | | | 9.80 | | |
Total from investment operations | | | 6.41 | | | | 0.91 | | | | (3.92 | ) | | | 4.25 | | | | 9.91 | | |
Less distributions: | |
From net investment income | | | (0.15 | ) | | | (0.44 | ) | | | (0.11 | ) | | | (0.12 | ) | | | — | | |
Total distributions | | | (0.15 | ) | | | (0.44 | ) | | | (0.11 | ) | | | (0.12 | ) | | | — | | |
Redemption fee proceeds | | | — | (1) | | | — | (1) | | | 0.01 | | | | 0.01 | | | | 0.01 | | |
Net asset value, end of period | | $ | 32.45 | | | $ | 26.19 | | | $ | 25.72 | | | $ | 29.74 | | | $ | 25.60 | | |
Total return | | | 24.48 | % | | | 3.53 | % | | | (13.16 | )% | | | 16.63 | % | | | 63.27 | % | |
Ratios/supplemental data: | |
Net assets, end of period (millions) | | $ | 72.3 | | | $ | 90.30 | | | $ | 143.1 | | | $ | 118.0 | | | $ | 75.4 | | |
Ratio of expenses to average net assets: | |
Before fees waived | | | 1.35 | % | | | 1.35 | % | | | 1.27 | % | | | 1.25 | % | | | 1.42 | % | |
After fees waived | | | 1.35 | % | | | 1.35 | % | | | 1.27 | % | | | 1.25 | % | | | 1.42 | % | |
| After fees waived excluding interest expense(2) | | | 1.34 | % | | | 1.34 | % | | | 1.27 | % | | | 1.25 | % | | | 1.42 | % | |
Ratio of net investment income to average net assets | | | 0.77 | % | | | 0.62 | % | | | 0.43 | % | | | 0.46 | % | | | 0.82 | % | |
Portfolio turnover rate | | | 8.19 | % | | | 14.02 | % | | | 28.23 | % | | | 42.08 | % | | | 51.74 | % | |
(1) Amount represents less than $0.01 per share.
(2) The Advisor has contractually agreed to limit the operating expenses of the Fund to 1.45%, excluding interest expense, expenses related to dividends on short positions, brokerage commissions, taxes and other extraordinary expenses. See Note 3.
The accompanying notes are an integral part of these financial statements.
74
FINANCIAL HIGHLIGHTS
For a capital share outstanding throughout the year
| | | Year Ended December 31, | |
Global Innovators Fund | | 2013 | | 2012 | | 2011 | | 2010 | | 2009 | |
Net asset value, beginning of period | | $ | 21.18 | | | $ | 17.72 | | | $ | 19.00 | | | $ | 16.24 | | | $ | 11.21 | | |
Income from investment operations: | |
Net investment income (loss) | | | 0.07 | | | | 0.11 | | | | 0.04 | | | | (0.05 | ) | | | (0.01 | ) | |
Net realized and unrealized gain (loss)
on investments | | | 9.52 | | | | 3.42 | | | | (1.28 | ) | | | 2.81 | | | | 5.08 | | |
Total from investment operations | | | 9.59 | | | | 3.53 | | | | (1.24 | ) | | | 2.76 | | | | 5.07 | | |
Less distributions: | |
From net investment income | | | (0.12 | ) | | | (0.07 | ) | | | (0.04 | ) | | | — | | | | — | | |
Return of capital | | | — | | | | — | | | | — | | | | — | | | | (0.04 | ) | |
Total distributions | | | (0.12 | ) | | | (0.07 | ) | | | (0.04 | ) | | | — | | | | (0.04 | ) | |
Redemption fee proceeds | | | — | (1) | | | — | (1) | | | — | (1) | | | — | (1) | | | — | (1) | |
Net asset value, end of period | | $ | 30.65 | | | $ | 21.18 | | | $ | 17.72 | | | $ | 19.00 | | | $ | 16.24 | | |
Total return | | | 45.29 | % | | | 19.91 | % | | | (6.51 | )% | | | 17.00 | % | | | 45.20 | % | |
Ratios/supplemental data: | |
Net assets, end of period (millions) | | $ | 50.7 | | | $ | 31.6 | | | $ | 32.4 | | | $ | 38.2 | | | $ | 36.7 | | |
Ratio of expenses to average net assets: | |
Before fees waived/recaptured | | | 1.47 | % | | | 1.51 | % | | | 1.42 | % | | | 1.47 | % | | | 1.68 | % | |
After fees waived/recaptured | | | 1.47 | % | | | 1.51 | % | | | 1.44 | % | | | 1.55 | % | | | 1.56 | % | |
| After fees waived/recapture excluding interest expense(2) | | | 1.46 | % | | | 1.50 | % | | | 1.44 | % | | | 1.55 | % | | | 1.55 | % | |
Ratio of net investment income (loss) to average net assets: | |
Before fees waived/recaptured | | | 0.31 | % | | | 0.49 | % | | | 0.26 | % | | | (0.16 | )% | | | (0.20 | )% | |
After fees waived/recaptured | | | 0.31 | % | | | 0.49 | % | | | 0.24 | % | | | (0.24 | )% | | | (0.07 | )% | |
Portfolio turnover rate | | | 29.63 | % | | | 6.02 | % | | | 47.40 | % | | | 56.97 | % | | | 50.54 | % | |
(1) Amount represents less than $0.01 per share.
(2) The Advisor has contractually agreed to limit the operating expenses of the Fund to 1.55%, excluding interest expense, expenses related to dividends on short positions, borkerage commissions, taxes and other extraordinary expenses. See Note 3.
The accompanying notes are an integral part of these financial statements.
75
FINANCIAL HIGHLIGHTS
For a capital share outstanding throughout the period
Inflation Managed Dividend FundTM | | Year Ended
December 31, 2013 | | March 30, 2012(1)
Through
December 31, 2012 | |
Net asset value, beginning of period | | $ | 12.80 | | | $ | 12.50 | | |
Income from investment operations: | |
Net investment income | | | 0.41 | | | | 0.31 | | |
Net realized and unrealized gain on investments and foreign currency | | | 3.35 | | | | 0.30 | | |
Total from investment operations | | | 3.76 | | | | 0.61 | | |
Less distributions: | |
From net investment income | | | (0.45 | ) | | | (0.31 | ) | |
From net realized gain | | | (0.47 | ) | | | — | | |
Total distributions | | | (0.92 | ) | | | (0.31 | ) | |
Redemption fee proceeds | | | — | (2) | | | — | | |
Net asset value, end of period | | $ | 15.64 | | | $ | 12.80 | | |
Total return | | | 29.77 | % | | | 4.97 | %(3) | |
Ratios/supplemental data: | |
Net assets, end of period (millions) | | $ | 3.1 | | | $ | 1.8 | | |
Ratio of expenses to average net assets: | |
Before fees waived | | | 5.47 | % | | | 7.05 | %(4) | |
After fees waived | | | 0.68 | % | | | 0.68 | %(4) | |
| After fees waived excluding interest expense(5) | | | 0.68 | % | | | 0.68 | %(4) | |
Ratio of net investment income (loss) to average net assets: | |
Before fees waived/recaptured | | | (2.04 | )% | | | (3.02 | )%(4) | |
After fees waived/recaptured | | | 2.75 | % | | | 3.35 | %(4) | |
Portfolio turnover rate | | | 24.88 | % | | | 13.33 | %(3) | |
(1) Commencement of Operations.
(2) Amount represents less than $0.01 per share.
(3) Not annualized.
(4) Annualized.
(5) The Advisor has contractually agreed to limit the operating expenses of the Fund to 0.68%, excluding interest expense, expenses related to dividends on short positions, brokerage commissions, taxes and other extraordinary expenses. See Note 3.
The accompanying notes are an integral part of these financial statements.
76
FINANCIAL HIGHLIGHTS
For a capital share outstanding throughout the period
| | | Year Ended December 31, | | June 30, 2011(1)
Through | |
Renminbi Yuan & Bond Fund | | 2013 | | 2012 | | December 31, 2011 | |
Net asset value, beginning of period | | $ | 12.71 | | | $ | 12.52 | | | $ | 12.50 | | |
Income from investment operations: | |
Net investment income | | | 0.28 | | | | 0.12 | | | | — | (2) | |
Net realized and unrealized gain (loss) on investments and foreign currency | | | 0.38 | | | | 0.36 | | | | 0.02 | | |
Total from investment operations | | | 0.66 | | | | 0.48 | | | | 0.02 | | |
Less distributions: | |
From net investment income | | | (0.42 | ) | | | (0.29 | ) | | | — | | |
Total distributions | | | (0.42 | ) | | | (0.29 | ) | | | — | | |
Redemption fee proceeds | | | — | (2) | | | — | (2) | | | — | (2) | |
Net asset value, end of period | | $ | 12.95 | | | $ | 12.71 | | | $ | 12.52 | | |
Total return | | | 5.26 | % | | | 3.88 | % | | | 0.16 | %(3) | |
Ratios/supplemental data: | |
Net assets, end of period (millions) | | $ | 94.2 | | | $ | 89.3 | | | $ | 92.7 | | |
Ratio of expenses to average net assets: | |
Before fees waived/recaptured | | | 0.97 | % | | | 0.90 | % | | | 0.92 | %(4) | |
After fees waived/recaptured | | | 0.90 | % | | | 0.90 | % | | | 0.90 | %(4) | |
| After fees waived/recaptured excluding interest expense(5) | | | 0.90 | % | | | 0.90 | % | | | 0.90 | %(4) | |
Ratio of net investment income to average net assets: | |
Before fees waived/recaptured | | | 2.11 | % | | | 1.05 | % | | | 0.02 | %(4) | |
After fees waived/recaptured | | | 2.18 | % | | | 1.05 | % | | | 0.04 | %(4) | |
Portfolio turnover rate | | | 12.32 | % | | | 9.19 | % | | | 0.72 | %(3)† | |
† Restated
(1) Commencement of Operations.
(2) Amount represents less than $0.01 per share.
(3) Not annualized.
(4) Annualized.
(5) The Advisor has contractually agreed to limit the operating expenses of the Fund to 0.90%, excluding interest expense, expenses related to dividends on short positions, brokerage commissions, taxes and other extraordinary expenses. See Note 3.
The accompanying notes are an integral part of these financial statements.
77
NOTES TO FINANCIAL STATEMENTS
Note 1
Organization
Guinness AtkinsonTM Funds (the "Trust"), was organized on April 28, 1997 as a Delaware business trust and registered under the Investment Company Act of 1940, as amended (the "1940 Act"), as an open-end management investment company. Currently, the Trust offers eight separate series: Guinness Atkinson Alternative Energy Fund (the "Alternative Energy Fund"), Guinness Atkinson Asia Focus Fund (the "Asia Focus Fund"), Guinness Atkinson Asia Pacific Dividend Fund (the "Asia Pacific Dividend Fund"), Guinness Atkinson China & Hong Kong Fund (the "China & Hong Kong Fund"), Guinness Atkinson Global Energy Fund (the "Global Energy Fund"), Guinness Atkinson Global Innovators Fund (the "Global Innovators Fund"), Guinness Atkinson Inflation Managed Dividend FundTM (the "Inflation Managed Dividend FundTM") and Guinness Atkinson Renminbi Yuan & Bond Fund (the "Renminbi Yuan & Bond Fund"), all of which (each a "Fund" and collectively, the "Funds") are covered by this report. Except for the Inflation Managed Dividend FundTM, each Fund is a non-diversified Fund. The China & Hong Kong Fund began operations on June 30, 1994, the Asia Focus Fund began operations on April 29, 1996, the Global Innovators Fund began operations on December 15, 1998, the Global Energy Fund began operations on June 30, 2004, the Alternative Energy Fund and the Asia Pacific Dividend Fund began operations on March 31, 2006, the Renminbi Yuan & Bond Fund began operations on June 30, 2011, and the Inflation Managed Dividend FundTM began operations on March 30, 2012.
The Alternative Energy Fund's and Asia Focus Fund's investment objective is long-term capital appreciation. The Asia Pacific Dividend Fund's investment objective is to provide investors with dividend income and long-term capital growth. The China & Hong Kong Fund's investment objective is long-term capital appreciation primarily through investments in securities of China and Hong Kong. The Global Energy Fund's and Global Innovators Fund's investment objective is long-term capital appreciation. The Renminbi Yuan & Bond Fund's investment objective is to seek total return. Total return means the combination of capital appreciation and investment income, which includes changes in the value of the renminbi, the currency of China of which the yuan is the unit. The Inflation Managed Dividend Fund's investment objective is to seek a moderate level of current income and consistent dividend growth at a rate that exceeds inflation.
Note 2
Significant accounting policies
The following is a summary of significant accounting policies consistently followed by the Funds. These policies are in conformity with accounting principles generally accepted in the United States of America ("GAAP").
A. Security Valuation. Securities of the Funds that are traded on a principal exchange (U.S. or foreign) or NASDAQ are valued at the official closing price on each day that the exchanges are open for trading. Securities traded on an exchange for which there have been no sales, and other over-the-counter securities are valued at the mean between the bid and asked prices. Debt securities are valued based on available market quotations received from an independent pricing service approved by the Trust's Board of Trustees which may utilize both transaction data and market information such as yield, prices of securities of comparable quality, coupon rate, maturity, type of issue, trading characteristics and other market data. Securities for which quotations are not readily available are valued at their respective fair values as determined in good faith by the Funds' Valuation Committee in accordance with procedures established by the Board of Trustees. In determining fair value, the Funds' Valuation Committee take into account all relevant factors and available information. Consequently, the price of the security used to calculate its Net Asset Value may differ from quoted or published prices for the same security. Fair value pricing involves subjective judgments and there is no single standard for determining a security's fair value. As a result, different mutual funds could reasonably arrive at different fair value for the same security. It is possible that the fair value determined for a security is materially different from the value that could be realized upon the sale of that security or from the values that other mutual funds may determine. Short-term investments are stated at cost, combined with accrued interest, which approximates market value. Realized gains and losses from securities transactions are calculated using the identified cost method.
Foreign securities are recorded in the financial statements after translation to U.S. dollars based on the applicable exchange rate at the end of the period. The Funds do not isolate that portion of the results of operations resulting from changes in the currency exchange rate from the fluctuations resulting from changes in the market prices of investments.
Foreign exchange gain or loss resulting from holding of a foreign currency, expiration of a currency exchange contract, difference in exchange rates between the trade date and settlement date of an investment purchased or sold, and the difference between dividends actually received compared to the amount shown in a Fund's accounting records on the date of receipt are shown as net realized gains or losses on foreign currency transactions in the respective Fund's statement of operations.
78
B. Forward Foreign Currency Exchange Contracts. The Funds may utilize forward foreign currency exchange contracts ("forward contracts") to hedge against foreign exchange fluctuations on foreign-denominated investments under which they are obligated to exchange currencies at specific future dates and at specified rates. All commitments are "marked-to-market" daily and any resulting unrealized gains or losses are included as unrealized appreciation (depreciation) on foreign currency denominated assets and liabilities. The Funds record realized gains or losses at the time the forward contract is settled. Risks may arise upon entering these contracts from the potential inability of a counter party to meet the terms of their contracts and from unanticipated movements in the value of a foreign currency relative to the U.S. dollar or other currencies. Counterparties to these contracts are major U.S. financial institutions. Please refer to Note 7 for further information on forward foreign currency contracts held in each Fund.
C. Restricted and Illiquid Securities. A restricted security cannot be resold to the general public without prior registration under the Securities Act of 1933. If the security is subsequently registered and resold, the issuers would typically bear the expense of all registrations at no cost to the Fund. Restricted securities are valued according to the guidelines and procedures adopted by the Funds' Board of Trustees. A security may be considered illiquid if it lacks a readily available market. Securities are generally considered liquid if they can be sold or disposed of in the ordinary course of business within seven days at approximately the price at which the security is valued by a fund. Illiquid securities may be valued under methods approved by the Board of Trustees as reflecting fair value.
D. Security Transactions, Dividend Income and Distributions. Security transactions are accounted for on the trade date. Dividend income and distributions to shareholders are recorded on the ex-dividend date. Realized gains and losses from securities transactions are calculated using the identified cost method.
E. Allocation of Expenses. Each Fund is charged for those expenses directly attributable to it. Expenses that are not directly attributable to a Fund are allocated among the Funds in proportion to their respective assets or another appropriate method.
F. Cash overdraft. Throughout the year, the Funds may have cash overdraft balances. A fee is incurred on these overdrafts, calculated by multiplying the overdraft by a rate plus London Interbank Offered Rate ("LIBOR"). Payables, if any, are reflected as Due to Custodian in the Statements of Assets and Liabilities. Expenses from cash overdrafts are included in Interest Expense in the Statements of Operations.
G. Concentration of Risk. The Alternative Energy Fund invests substantially in the alternative energy or energy technology sectors. The Asia Focus Fund invests substantially all of its assets in the Asian continent. The Asia Pacific Dividend Fund invests primarily in dividend-producing equity securities of Asia Pacific companies. The China & Hong Kong Fund invests substantially all of its assets in securities that are traded in China or Hong Kong or that are issued by companies that do a substantial part of their business in China. The Global Energy Fund invests substantially in energy companies; the changes in the prices and supplies of oil and other energy fuels may affect the Fund's investments. The Renminbi Yuan & Bond Fund invests in securities issued by companies economically tied to China, which exposes the Fund to greater market risk and potential monetary losses than if the Fund's assets were diversified among other regions. The consequences of political, social, or economic changes in the countries or business sectors in which the securities are offered or the issuers conduct their operations may affect the market prices of the Funds' investments and any income generated, as well as the Funds' ability to repatriate such amounts.
H. Use of Estimates. The preparation of financial statements in conformity with accounting principles generally accepted in the United States requires management to make estimates and assumptions that affect the reported amounts of assets and liabilities and the disclosure of contingent assets and liabilities at the date of the financial statements. Actual results could differ from those estimates.
I. Reclassifications. Accounting principles generally accepted in the United States require that certain components of net assets be reclassified between financial and tax reporting. These reclassifications have no effect on net assets or net asset value per share and were primarily attributed to differences in the treatment of foreign currency and net investment losses. For the year ended December 31, 2013, permanent differences in book and tax accounting were reclassified as follows:
79
| | | Increase (Decrease) | |
| | | Paid in Capital | | Undistributed Net
Investment
Income/(Loss) | | Accumulated
Gains or
(Losses) | |
Alternative Energy Fund | | $ | (231,286 | ) | | $ | 214,735 | | | $ | 16,551 | | |
Asia Focus Fund | | | — | | | | (42,174 | ) | | | 42,174 | | |
Asia Pacific Dividend Fund | | | (464 | ) | | | (6,468 | ) | | | 6,932 | | |
China & Hong Kong Fund | | | — | | | | (7,035 | ) | | | 7,035 | | |
Global Energy Fund | | | (172,082 | ) | | | 183,794 | | | | (11,712 | ) | |
Global Innovators Fund | | | — | | | | (4,320 | ) | | | 4,320 | | |
Inflation Managed Dividend FundTM | | | — | | | | 1,241 | | | | (1,241 | ) | |
Renminbi Yuan & Bond Fund | | | — | | | | 927,702 | | | | (927,702 | ) | |
J. Indemnifications. Under the Trust's organizational documents, its current and former officers and trustees are indemnified against certain liabilities arising out of the performance of their duties to the Funds. In addition, in the normal course of business, the Funds enter into contracts that contain a variety of representations and warranties that provide general indemnifications. The Funds' maximum exposure under these arrangements is unknown as this would involve future claims that may be made against the Funds that have not yet occurred or that would be covered by other parties.
K. Federal Income Taxes. The Funds intend to comply with the requirements of Subchapter M of the Internal Revenue Code applicable to regulated investment companies, and to distribute all of their taxable income to their shareholders. Therefore, no provision is made for federal income or excise tax.
The Funds recognize the tax benefits of uncertain tax positions only where the position is "more likely than not" to be sustained assuming examination by tax authorities. Management has analyzed the Funds' tax positions, and has concluded that no liability for unrecognized tax benefits should be recorded related to uncertain tax positions taken on returns filed for open tax years 2010 through 2012, or expected to be taken in the Funds' 2013 tax returns. The Funds identify their major tax jurisdiction as U.S. Federal, California State and foreign jurisdictions where the Funds make significant investments; however the Funds are not aware of any tax positions for which it is reasonably possible that the total amounts of unrecognized tax benefits will change materially in the next twelve months.
Note 3
Investment Advisory and Other Agreements
The Trust, on behalf of each Fund, entered into an Investment Advisory Agreement with Guinness Atkinson Asset Management, Inc. (the "Advisor"), under which the Advisor provides the Funds with investment management services. The Advisor furnishes all investment advice, office space, facilities, and most of the personnel needed by the Funds. As compensation for its services, the Advisor is entitled to a monthly fee at the following annual rates based upon the average daily net assets of the Funds:
Alternative Energy Fund | | 1.00% | |
Asia Focus Fund | | 1.00% | |
Asia Pacific Dividend Fund | | 1.00% | |
China & Hong Kong Fund | | 1.00% | |
Global Energy Fund | | 0.75% | |
Global Innovators Fund | | 0.75% on the 1st $500 million, 0.60% thereafter | |
Inflation Managed Dividend FundTM | | 0.45% | |
Renminbi Yuan & Bond Fund | | 0.55% | |
80
The Funds are responsible for their own operating expenses. The Advisor has contractually agreed to limit each Fund's total operating expenses (excluding interest, dividends on short positions, taxes and extraordinary expenses) by reducing all or a portion of its fees and reimbursing the Fund for expenses so that its ratio of expenses to average daily net assets will not exceed the following levels:
Alternative Energy Fund | | | 1.98 | % | |
Asia Focus Fund | | | 1.98 | % | |
Asia Pacific Dividend Fund | | | 1.98 | % | |
China & Hong Kong Fund | | | 1.98 | % | |
Global Energy Fund | | | 1.45 | % | |
Global Innovators Fund | | | 1.55 | % | |
Inflation Managed Dividend FundTM | | | 0.68 | % | |
Renminbi Yuan & Bond Fund | | | 0.90 | % | |
The expense ratios shown in the financial highlights may exceed these levels due to expenses incurred, but not covered by the expense limitation agreement.
To the extent that the Advisor waives fees and/or absorbs expenses it may seek repayment of a portion or all of such amounts at any time within three fiscal years after the fiscal year in which such amounts were waived or absorbed, subject to the applicable cap. For the year ended December 31, 2013, the Advisor waived fees and absorbed expenses of $24,186, $74,741, $99,129 and $60,089 for the Alternative Energy Fund, the Asia Pacific Dividend Fund, the Inflation Managed Dividend FundTM and the Renminbi Yuan & Bond Fund, respectively.
At December 31, 2013, the Advisor may recapture a portion of the following amounts that had been paid and/or waived on behalf of the Funds no later than the dates as stated below:
Fund: | | December 31, 2014 | | December 31, 2015 | | December 31, 2016 | | Total | |
Alternative Energy Fund | | $ | — | | | $ | 45,850 | | | $ | 24,186 | | | $ | 70,036 | | |
Asia Pacific Dividend Fund | | | 74,834 | | | | 74,715 | | | | 74,741 | | | | 224,290 | | |
Inflation Managed Dividend FundTM | | | — | | | | 71,229 | | | | 99,129 | | | | 170,358 | | |
Renminbi Yuan & Bond Fund | | | 5,856 | | | | — | | | | 60,089 | | | | 65,945 | | |
Mutual Fund Administration Corporation (the "Administrator") acts as the Funds' administrator under an administration agreement. The fees paid to the Administrator for the year ended December 31, 2013 are reported on the Statements of Operations.
Quasar Distributors, LLC (the "Distributor") acts as the Funds' principal underwriter in a continuous public offering of the Funds' shares.
Foreside Compliance Services, LLC provides Chief Compliance Officer ("CCO") services to the Funds. The fees paid for CCO services for the year ended December 31, 2013 are reported on the Statements of Operations.
On August 14, 1998, the Trust approved a Deferred Compensation Plan for Trustees (the "Plan"). Trustees can elect to receive payment in cash or defer payments provided for in the Plan. If a trustee elects to defer payment, the Plan provides for the creation of a deferred payment account (Phantom Share Account). This account accumulates the deferred fees earned, and the value of the account is adjusted at the end of each quarter to reflect the value that would have been earned if the account had been invested in designated investments. The Funds recognize as trustee expense amounts accrued as meetings are attended plus the change in value of the Phantom Share Account.
The change in the value of the phantom share account during the year ended December 31, 2013 is shown in the table below. These amounts included any additional contributions to the deferred compensation plan and any appreciation (depreciation) on the underlying investments.
81
Alternative Energy Fund | | $ | 6,348 | | |
Asia Focus Fund | | $ | 10,034 | | |
Asia Pacific Dividend Fund | | $ | 4,500 | | |
China & Hong Kong Fund | | $ | 42,500 | | |
Global Energy Fund | | $ | 10,948 | | |
Global Innovators Fund | | $ | 12,062 | | |
Inflation Managed Dividend FundTM | | $ | 3,102 | | |
Renminbi Yuan & Bond Fund | | $ | 3,800 | | |
The fees paid to non-interested Trustees for the year ended December 31, 2013 are reported on the Statements of Operations.
Certain officers of the Trust are also officers and/or Directors of the Advisor and the Administrator. None of these officers are compensated directly by the Funds.
Note 4
Shareholder Servicing Plan
Each Fund has adopted a Shareholder Servicing Plan to pay a fee at an annual rate of up to 0.25% of its daily average net assets of shares serviced by shareholder servicing agents who provide administrative and support services to their customers.
The fees paid under the Shareholder Servicing Plan for the year ended December 31, 2013 are reported on the Statements of Operations.
Note 5
Investment Transactions
The following table presents purchases and sales of securities during the year ended December 31, 2013, excluding short-term investments, to indicate the volume of transactions in each Fund.
| | | Purchases | | Sales | |
Alternative Energy Fund | | $ | 14,653,010 | | | $ | 10,935,094 | | |
Asia Focus Fund | | | 1,989,923 | | | | 21,464,774 | | |
Asia Pacific Dividend Fund | | | 2,652,385 | | | | 3,117,670 | | |
China & Hong Kong Fund | | | 8,739,927 | | | | 54,625,253 | | |
Global Energy Fund | | | 6,381,707 | | | | 41,548,944 | | |
Global Innovators Fund | | | 14,599,665 | | | | 11,382,207 | | |
Inflation Managed Dividend FundTM | | | 785,260 | | | | 502,061 | | |
Renminbi Yuan & Bond Fund | | | 37,292,058 | | | | 9,507,692 | | |
The Funds did not purchase U.S. Government securities as a part of their long-term investment strategy during the year ended December 31, 2013.
Note 6
Fair Value Measurements and Disclosures
The Funds utilize various inputs in determining the value of its investments. These inputs are summarized in the three broad levels listed below:
Level 1 — Unadjusted quoted prices in active markets for identical assets or liabilities that a Fund has the ability to access.
82
Level 2 — Observable inputs other than quoted prices included in level 1 that are observable for the asset or liability, either directly or indirectly. These inputs may include quoted prices for the identical instrument on an inactive market, prices for similar instruments, interest rates, prepayment speeds, credit risk, yield curves, default rates and similar data.
Level 3 — Unobservable inputs for the asset or liability, to the extent relevant observable inputs are not available, representing the Fund's own assumptions about the assumptions a market participant would use in valuing the asset or liability, and would be based on the best information available.
The availability of observable inputs can vary from security to security and is affected by a wide variety of factors, including for example, the type of security, whether the security is new and not yet established in the marketplace, the liquidity of markets, and other characteristics particular to the security. To the extent that valuation is based on models or inputs that are less observable or unobservable in the market, the determination of fair value requires more judgment. Accordingly the degree of judgment exercised in determining fair value is greatest for instruments categorized in Level 3.
The inputs used to measure fair value may fall into different levels of the fair value hierarchy. In such cases, for disclosure purposes, the level in the fair value hierarchy within which the fair value measurement falls in its entirety, is determined based on the lowest level input that is significant to the fair value measurement in its entirety.
In addition, the Funds have adopted Accounting Standards Update No. 2011-04 Amendments to Achieve Common Fair Value Measurement and Disclosure Requirements in U.S. GAAP and International Financial Reporting Standards ("IFRSs") which amends Fair Value Measurements and Disclosures to establish common requirements for measuring fair value and for disclosing information about fair value measurements in accordance with U.S. GAAP and IFRSs. Enhanced disclosure is required to detail any transfers in to and out of Level 1 and Level 2 measurements and Level 2 and Level 3 measurements and the reasons for the transfers.
The inputs or methodology used for valuing securities are not an indication of the risk associated with investing in those securities. The following is a summary of the inputs used, as of December 31, 2013, in valuing the Funds' assets carried at fair value:
Alternative Energy Fund
Assets Table | | Level 1 | | Level 2 | | Level 3 | | Total | |
Investments, at Value | |
Common Stocks:1 | |
Basic Materials | | $ | 1,000,627 | | | $ | — | | | $ | — | | | $ | 1,000,627 | | |
Energy | | | 11,785,404 | | | | — | | | | — | | | | 11,785,404 | | |
Industrial | | | 6,501,724 | | | | — | | | | — | (a) | | | 6,501,724 | | |
Utilities | | | 4,947,045 | | | | — | | | | — | | | | 4,947,045 | | |
Total Investments, at Value | | | 24,234,800 | | | | — | | | | — | | | | 24,234,800 | | |
Total Assets | | $ | 24,234,800 | | | $ | — | | | $ | — | (a) | | $ | 24,234,800 | | |
(a) Applied Intellectual Capital Ltd. fair valued at zero as the company has been delisted since 2009.
83
Asia Focus Fund
Assets Table | | Level 1 | | Level 2 | | Level 3 | | Total | |
Investments, at Value | |
Common Stocks:1 | |
Basic Materials | | $ | 1,270,921 | | | $ | — | | | $ | — | | | $ | 1,270,921 | | |
Communications | | | 1,954,928 | | | | — | | | | — | | | | 1,954,928 | | |
Consumer, Cyclical | | | 3,334,949 | | | | — | | | | — | | | | 3,334,949 | | |
Consumer, Non-cyclical | | | 435,671 | | | | — | | | | — | | | | 435,671 | | |
Energy | | | 3,324,410 | | | | 1,087,330 | | | | — | | | | 4,411,740 | | |
Exchange Traded Funds ("ETFs") | | | 567,851 | | | | — | | | | — | | | | 567,851 | | |
Financial | | | 1,536,983 | | | | 388,679 | | | | — | | | | 1,925,662 | | |
Industrial | | | 3,087,416 | | | | — | | | | — | | | | 3,087,416 | | |
Technology | | | 3,653,753 | | | | — | | | | — | | | | 3,653,753 | | |
Utilities | | | — | | | | 1,143,358 | | | | — | | | | 1,143,358 | | |
Total Investments, at Value | | | 21,786,249 | | | | — | | | | — | | | | 21,786,249 | | |
Total Assets | | $ | 19,166,882 | | | $ | 2,619,367 | | | $ | — | | | $ | 21,786,249 | | |
Asia Pacific Dividend Fund
Assets Table | | Level 1 | | Level 2 | | Level 3 | | Total | |
Investments, at Value | |
Common Stocks:1 | |
Basic Materials | | $ | 114,521 | | | $ | — | | | $ | — | | | $ | 114,521 | | |
Communications | | | 465,476 | | | | — | | | | — | | | | 465,476 | | |
Consumer, Cyclical | | | 820,853 | | | | — | | | | — | | | | 820,853 | | |
Consumer, Non-cyclical | | | 348,672 | | | | — | | | | — | | | | 348,672 | | |
Energy | | | 103,213 | | | | 111,406 | | | | — | | | | 214,619 | | |
Financial | | | 1,175,846 | | | | 100,000 | | | | — | | | | 1,275,846 | | |
Industrial | | | 235,182 | | | | 120,481 | | | | — | | | | 355,663 | | |
Technology | | | 467,132 | | | | — | | | | — | | | | 467,132 | | |
Utilities | | | — | | | | 111,990 | | | | — | | | | 111,990 | | |
Total Investments, at Value | | | 4,174,772 | | | | — | | | | — | | | | 4,174,772 | | |
Total Assets | | $ | 3,842,301 | | | $ | 443,877 | | | $ | — | | | $ | 4,174,772 | | |
84
China & Hong Kong Fund
Assets Table | | Level 1 | | Level 2 | | Level 3 | | Total | |
Investments, at Value | |
Common Stocks:1 | |
Basic Materials | | $ | 4,385,825 | | | $ | — | | | $ | — | | | $ | 4,385,825 | | |
Communications | | | 23,679,727 | | | | — | | | | — | | | | 23,679,727 | | |
Consumer, Cyclical | | | 18,289,820 | | | | — | | | | — | | | | 18,289,820 | | |
Consumer, Non-cyclical | | | 1,174,690 | | | | — | | | | — | | | | 1,174,690 | | |
Energy | | | 15,852,047 | | | | — | | | | — | | | | 15,852,047 | | |
Exchange Traded Funds ("ETFs") | | | 2,491,557 | | | | — | | | | — | | | | 2,491,557 | | |
Financial | | | 22,027,309 | | | | — | | | | — | | | | 22,027,309 | | |
Industrial | | | 11,903,512 | | | | — | | | | — | | | | 11,903,512 | | |
Technology | | | 6,157,111 | | | | — | | | | — | | | | 6,157,111 | | |
Utilities | | | 4,373,431 | | | | — | | | | — | | | | 4,373,431 | | |
Total Investments, at Value | | | 110,335,029 | | | | — | | | | — | | | | 110,335,029 | | |
Total Assets | | $ | 110,335,029 | | | $ | — | | | $ | — | | | $ | 110,335,029 | | |
Global Energy Fund
Assets Table | | Level 1 | | Level 2 | | Level 3 | | Total | |
Investments, at Value | |
Common Stocks:1 | |
Energy | | $ | 71,730,519 | | | $ | — | | | $ | — | (a) | | $ | 71,730 519 | | |
Industrial | | | 70,311 | | | | — | | | | — | | | | 70,311 | | |
Total Investments, at Value | | | 71,800,830 | | | | — | | | | — | | | | 71,800,830 | | |
Total Assets | | $ | 71,800,830 | | | $ | — | | | $ | — | (a) | | $ | 71,800,830 | | |
(a) Cluff Natural Resources warrants fair valued at zero.
Following is a reconciliation of Level 3 assets for which significant unobservable inputs were used to determine fair value.
Global Energy Fund | | Common Stock | | Warrant | |
Balance as of 12/31/12 | | $ | 228,228 | | | $ | — | | |
Realized gain (loss) | | | — | | | | — | | |
Change in unrealized appreciation (depreciation) | | | (68,862 | ) | | | — | | |
Cost of purchases | | | — | | | | — | | |
Proceeds from sales | | | — | | | | — | | |
Accrued interest | | | — | | | | — | | |
Transfers into Level 3 | | | — | | | | — | | |
Transfers out of Level 3* | | | 159,366 | | | | — | | |
Balance as of 12/31/13 | | $ | — | | | $ | — | | |
Net change in unrealized depreciation on Level 3 investments held as of 12/31/13† | | $ | (68,862 | ) | | $ | — | | |
* The amount of transfers out is reflected at the securities' fair value on the date of transfer.
† Included in the related amounts on the Statements of Operations.
85
Global Innovators Fund
Assets Table | | Level 1 | | Level 2 | | Level 3 | | Total | |
Investments, at Value | |
Common Stocks: | |
Communications | | $ | 8,411,923 | | | $ | — | | | $ | — | | | $ | 8,411,923 | | |
Consumer, Non-cyclical | | | 5,325,062 | | | | — | | | | — | | | | 5,325,062 | | |
Energy | | | 1,804,403 | | | | — | | | | — | | | | 1,804,403 | | |
Financial | | | 7,015,849 | | | | — | | | | — | | | | 7,015,849 | | |
Industrial | | | 8,459,126 | | | | — | | | | — | | | | 8,459,126 | | |
Technology | | | 18,849,093 | | | | — | | | | — | | | | 18,849,093 | | |
Total Investments, at Value | | | 49,865,456 | | | | — | | | | — | | | | 49,865,456 | | |
Total Assets | | $ | 49,865,456 | | | $ | — | | | $ | — | | | $ | 49,865,456 | | |
Inflation Managed Dividend FundTM
Assets Table | | Level 1 | | Level 2 | | Level 3 | | Total | |
Investments, at Value | |
Common Stocks: | |
Communications | | $ | 204,462 | | | $ | — | | | $ | — | | | $ | 204,462 | | |
Consumer, Cyclical | | | 76,128 | | | | — | | | | — | | | | 76,128 | | |
Consumer, Non-cyclical | | | 912,068 | | | | — | | | | — | | | | 912,068 | | |
Energy | | | 277,149 | | | | — | | | | — | | | | 277,149 | | |
Financial | | | 460,945 | | | | — | | | | — | | | | 460,945 | | |
Industrial | | | 513,497 | | | | — | | | | — | | | | 513,497 | | |
Technology | | | 74,860 | | | | — | | | | — | | | | 74,860 | | |
Total Investments, at Value | | | 2,519,109 | | | | — | | | | — | | | | 2,519,109 | | |
Total Assets | | $ | 2,519,109 | | | $ | — | | | $ | — | | | $ | 2,519,109 | | |
Renminbi Yuan & Bond Fund
Assets Table | | Level 1 | | Level 2 | | Level 3 | | Total | |
Investments, at Value | |
Corporate Bonds | | $ | — | | | $ | 89,042,922 | | | $ | — | | | $ | 89,042,922 | | |
Total Investments, at Value | | | — | | | | 89,042,922 | | | | — | | | | 89,042,922 | | |
Total Assets | | $ | — | | | $ | 89,042,922 | | | $ | — | | | $ | 89,042,922 | | |
1 Foreign securities traded in foreign exchanges may be adjusted due to a significant change in the value of U.S. traded securities, as measured by the S&P 500 Index. Significant movements were deemed to have occurred at December 31, 2012 and therefore such securities were classified as Level 2. As a result, securities still held by the Alternative Energy Fund, Asia Focus Fund, Asia Pacific Dividend Fund, China & Hong Kong Fund, Global Energy Fund, Global Innovators Fund, and Inflation Managed Dividend Fund were transferred from Level 2 into Level 1 with an end of period value of $13,091,614, $16,296,476, $1,031,869, $93,405,415, $22,493,490, $1,541,080, and $740,969 respectively. There were no securities transferred between Level 1 and Level 2 in the Renminbi Yuan & Bond Fund.
Note 7
Derivatives and Hedging Transactions
FASB Accounting Standards Codification 815, Derivatives and Hedging requires enhanced disclosures about the Funds' derivative and hedging activities, including how such activities are accounted for and their effects on the Funds' financial position, performance and cash flows.
86
Forward Foreign Currency Contracts
In order to hedge their portfolio and to protect them against possible fluctuations in foreign exchange rates pending the settlement of securities transactions, the Funds may enter into forward foreign currency contracts that obligate them to exchange currencies at specified future dates. At the maturity of a forward contract, a Fund may either make delivery of the foreign currency from currency held, if any, or from the proceeds of the portfolio securities sold. It may also terminate its obligation to deliver the foreign currency at any time by purchasing an offsetting contract. The forward values of amounts due are netted against the forward value of the currency to be delivered, and the net amount is shown as a receivable or payable in the financial statements. The Funds did not enter into forward foreign currency contracts during the year ended December 31, 2013 and did not have any outstanding forward contracts as of December 31, 2013.
Note 8
Tax Matters
As of December 31, 2013, the tax bases of investments were as follows:
| | Alternative
Energy Fund | | Asia Focus
Fund | | Asia Pacific
Dividend
Fund | | China &
Hong Kong
Fund | | Global
Energy
Fund | | Global
Innovators
Fund | | Inflation
Managed
Dividend
FundTM | | Renminbi
Yuan & Bond
Fund | |
Cost of investments for
tax puroses | | $ | 31,714,482 | | | $ | 17,403,580 | | | $ | 3,718,078 | | | $ | 69,867,050 | | | $ | 63,236,396 | | | $ | 39,033,233 | | | $ | 2,061,269 | | | $ | 86,177,166 | | |
Gross tax unrealized
appreciation | | | 2,510,413 | | | | 6,230,502 | | | | 553,203 | | | | 43,959,652 | | | | 16,684,005 | | | | 11,700,477 | | | | 469,352 | | | | 2,886,873 | | |
Gross tax unrealized
(depreciation) | | | (9,990,095 | ) | | | (1,847,833 | ) | | | (96,509 | ) | | | (3,491,673 | ) | | | (8,119,571 | ) | | | (868,254 | ) | | | (11,512 | ) | | | (21,117 | ) | |
Net tax unrealized
appreciation (depreciation)
on investments | | | (7,479,682 | ) | | | 4,382,669 | | | | 456,694 | | | | 40,467,979 | | | | 8,564,434 | | | | 10,832,223 | | | | 457,840 | | | | 2,865,756 | | |
Net tax appreciation
(depreciation) on foreign-
currency denominated
assets and liabilities | | | 945 | | | | (5,805 | ) | | | 48 | | | | (2 | ) | | | 3,467 | | | | — | | | | 176 | | | | 80,910 | | |
Net tax unrealized
appreciation
(depreciation)* | | | (7,478,737 | ) | | | 4,376,864 | | | | 456,742 | | | | 40,467,977 | | | | 8,567,901 | | | | 10,832,223 | | | | 458,016 | | | | 2,946,666 | | |
Undistributed net ordinary
income** | | | — | | | | 2,791 | | | | — | | | | 313,387 | | | | — | | | | 672 | | | | 2,237 | | | | 162,596 | | |
Undistributed Long-term
Capital Gains | | | — | | | | — | | | | — | | | | 1,882,888 | | | | — | | | | — | | | | — | | | | — | | |
Post October loss*** | | | (93,182 | ) | | | (2,050 | ) | | | (6,611 | ) | | | (102 | ) | | | (613 | ) | | | (2 | ) | | | — | | | | — | | |
Capital loss carryforward | | | (86,575,210 | ) | | | (1,433,184 | ) | | | (3,765,255 | ) | | | — | | | | (3,201,119 | ) | | | (3,747,541 | ) | | | — | | | | (47,320 | ) | |
Other accumulated
gain/(loss) | | | (34,589 | ) | | | (57,569 | ) | | | (24,452 | ) | | | (138,797 | ) | | | (48,213 | ) | | | (70,874 | ) | | | (4,002 | ) | | | (11,201 | ) | |
Total accumulated
gain/(loss) | | $ | (94,181,718 | ) | | $ | 2,886,852 | | | $ | (3,339,576 | ) | | $ | 42,525,353 | | | $ | 5,317,956 | | | $ | 7,014,478 | | | $ | 456,251 | | | $ | 3,050,741 | | |
* The differences between book-basis and tax-basis unrealized appreciation/(depreciation) is attributable primary to the tax deferral of losses on wash sales and passive foreign investment company (PFIC) mark to market adjustments.
** The differences between book-basis and tax basis undistributed net ordinary income is attributed to deferred compensation.
*** Under the current tax law, capital and currency losses realized after October 31 and prior to a Fund's fiscal year end may be deferred as occurring on the first day of the following year.
87
As of December 31, 2013, the Funds have the following capital loss carryforwards available to offset future realized capital gains:
| Capital losses expiring in: | | Alternative
Energy Fund | | Asia Focus
Fund | | Asia Pacific
Dividend
Fund | | China &
Hong Kong
Fund | | Global
Energy
Fund | | Global
Innovators
Fund | | Inflation
Managed
Dividend
FundTM | | Renminbi
Yuan & Bond
Fund | |
2014 | | $ | — | | | $ | — | | | $ | — | | | $ | — | | | $ | — | | | $ | — | | | $ | — | | | $ | — | | |
2015 | | | — | | | | — | | | | — | | | | — | | | | — | | | | — | | | | — | | | | — | | |
2016 | | | 10,370,865 | | | | — | | | | 1,146,390 | | | | — | | | | — | | | | — | | | | — | | | | — | | |
2017 | | | 40,204,652 | | | | — | | | | 1,115,940 | | | | — | | | | 585,199 | | | | — | | | | — | | | | — | | |
2018 | | | 9,296,377 | | | | 1,433,184 | | | | 1,502,925 | | | | — | | | | — | | | | — | | | | — | | | | — | | |
No Expiration Long-term | | | 25,714,449 | | | | — | | | | — | | | | — | | | | 2,357,761 | | | | 3,747,541 | | | | — | | | | — | | |
No Expiration Short-term | | | 988,867 | | | | — | | | | — | | | | — | | | | 258,159 | | | | — | | | | — | | | | 47,320 | | |
Total | | $ | 86,575,210 | | | $ | 1,433,184 | | | $ | 3,765,255 | | | $ | — | | | $ | 3,201,119 | | | $ | 3,747,541 | | | $ | — | | | $ | 47,320 | | |
The Asia Focus Fund, Asia Pacific Dividend Fund, and China & Hong Kong Fund utilized capital loss carryforwards of $4,653,729, $380,055, and $8,734,498, respectively.
Under the recently enacted Regulated Investment Company Modernization Act of 2010 (the "Act"), the Funds will be permitted to carryforward capital losses incurred in taxable years beginning after December 22, 2010, for an unlimited period. However, any losses incurred during those future taxable years will be required to be utilized prior to the losses incurred in pre-enactment taxable years. As a result of this ordering rule, pre-enactment capital loss carryforwards may be more likely to expire unused. Additionally, post-enactment capital losses that are carried forward will retain their character as either short-term or long-term capital losses rather than being considered all short-term as under previous law.
The tax character of distributions paid during 2013 and 2012 fiscal years are as follows:
| | 2013 | | 2012 | |
| | Ordinary
Income | | Long-term
Capital Gain | | Ordinary
Income | | Long-term
Capital Gain | |
Alternative Energy Fund | | $ | — | | | $ | — | | | $ | 32,745 | | | $ | — | | |
Asia Focus Fund | | | 400,182 | | | | — | | | | 585,229 | | | | — | | |
Asia Pacific Dividend Fund | | | 101,646 | | | | — | | | | 117,316 | | | | — | | |
China & Hong Kong Fund | | | 1,501,284 | | | | 1,539,106 | | | | 3,000,059 | | | | — | | |
Global Energy Fund | | | 338,807 | | | | — | | | | 1,500,024 | | | | — | | |
Global Innovators Fund | | | 200,095 | | | | — | | | | 100,107 | | | | — | | |
Inflation Managed Dividend FundTM | | | 90,608 | | | | 49,069 | | | | 36,741 | | | | — | | |
Renminbi Yuan & Bond Fund | | | 3,012,616 | | | | — | | | | 2,095,737 | | | | — | | |
Note 9
Recently Issued Accounting Pronouncements
In January 2013, the Financial Accounting Standards Board ("FASB") issued Accounting Standards Update ("ASU") No. 2013-01 Clarifying the Scope of Disclosures about Offsetting Assets and Liabilities. This update gives additional clarification to the FASB ASU No. 2011-11 Disclosures about Offsetting Assets and Liabilities. The amendments in this ASU require an entity to disclose information about offsetting and related arrangements to enable users of its financial statements to understand the effect of those arrangements on its financial position. The ASU is effective for annual reporting periods beginning on or after January 1, 2013, and interim periods within those annual periods. The guidance requires retrospective application for all comparative periods presented. Management has evaluated the impact on the financial statement disclosures and determined that there is no effect.
88
Note 10
Events Subsequent to the Fiscal Period End
The Funds have adopted financial reporting rules regarding a subsequent event which requires an entity to recognize in the financial statements the effects of all subsequent events that provide additional evidence about conditions that existed at the date of the balance sheet. Management has evaluated the Funds' related events and transactions and has determined that there were no events or transactions that occurred that would materially impact the amounts or disclosures in the Funds' financial statements.
89
Additional Information (Unaudited)
Proxy Voting Procedures
The Advisor votes proxies relating to portfolio securities in accordance with procedures that have been approved by the Board. You may obtain a description of these procedures, free of charge, by calling "toll-free" 1-800-915-6565. This information is also available through the Securities and Exchange Commission's website at http://www.sec.gov.
Proxy Voting Records
Information regarding how the Advisor voted proxies relating to portfolio securities during the latest 12-month period ended June 30 is available, without charge, by calling toll-free, 1-800-915-6565. This information is also available through the Securities and Exchange Commission's website at http://www.sec.gov.
Form N-Q Disclosure
The Funds file their complete schedule of portfolio holdings with the Securities and Exchange Commission for the first and third quarters of each fiscal year on Form N-Q. The Funds' Form N-Q is available on the Securities and Exchange Commission's website at http://www.sec.gov. The Funds' Form N-Q may be reviewed and copied at the Commission's Public Reference Room in Washington, DC, and information on the operation of the Public Reference Room may be obtained by calling 1-800-SEC-0330. This information is also available, without charge, by calling toll-free, 1-800-915-6565.
Supplemental Tax Information
For the fiscal year ended December 31, 2013, certain dividends paid by the Funds may be subject to a maximum tax rate of 15%, as provided for by the Jobs and Growth Tax Relief Reconciliation Act of 2003. The percentage of dividends declared from ordinary income designated as qualified dividend income was as follows:
Alternative Energy Fund | | | N/A | | |
Asia Focus Fund | | | 93.54 | % | |
Asia Pacific Dividend Fund | | | 74.63 | % | |
China & Hong Kong Fund | | | 91.97 | % | |
Global Energy Fund | | | 100.00 | % | |
Global Innovators Fund | | | 100.00 | % | |
Inflation Managed Dividend FundTM | | | N/A | | |
Renminbi Yuan & Bond Fund | | | N/A | | |
Pursuant to Section 852(b)(3) of the Internal Revenue Code, the China & Hong Kong Fund designates $1,882,888 as long-term capital gains.
Pursuant to Section 853 of the Internal Revenue Code of 1986, as amended, the Funds designate the following income earned from foreign sources and foreign taxes paid for the year ended December 31, 2013:
| | | Foreign Sourced Income | | Foreign Taxes Paid | |
| | | Total
Amount | | Per Share
Amount | | Total
Amount | | Per Share
Amount | |
Alternative Energy Fund | | | N/A | | | | N/A | | | | N/A | | | | N/A | | |
Asia Focus Fund | | $ | 751,848 | | | $ | 0.56 | | | $ | 65,567 | | | $ | 0.05 | | |
Asia Pacific Dividend Fund | | | 203,907 | | | | 0.62 | | | | 17,210 | | | | 0.05 | | |
China & Hong Kong Fund | | | 3,691,340 | | | | 1.04 | | | | 177,510 | | | | 0.05 | | |
Global Energy Fund | | | N/A | | | | N/A | | | | N/A | | | | N/A | | |
Global Innovators Fund | | | N/A | | | | N/A | | | | N/A | | | | N/A | | |
Inflation Managed Dividend FundTM | | | 75,493 | | | | 0.38 | | | | 4,533 | | | | 0.02 | | |
Renminbi Yuan & Bond Fund | | | N/A | | | | N/A | | | | N/A | | | | N/A | | |
90
REPORT OF INDEPENDENT REGISTERED
PUBLIC ACCOUNTING FIRM
To the Shareholders and Board of Trustees
Guinness Atkinson Funds
Woodland Hills, California
We have audited the accompanying statements of assets and liabilities, including the schedules of investments, of the Alternative Energy Fund, Asia Focus Fund, Asia Pacific Dividend Fund, China & Hong Kong Fund, Global Energy Fund, Global Innovators Fund, Renminbi Yuan & Bond Fund and Inflation Managed Dividend Fund (the "Funds"), each a series of shares of the Guinness Atkinson Funds, as of December 31, 2013, the related statements of operations for the year then ended, the statements of changes in net assets for each of the two years in the period then ended, and the financial highlights for each of the five years in the period then ended, except for Renminbi Yuan & Bond Fund the related statement of operations for the year then ended, the statement of changes in net assets for each of the two years in the period then ended and the financial highlights for each of the two years then ended and for the period June 30, 2011 (commencement of operations) to December 31, 2011, and for Inflation Managed Dividend Fund the related statement of operations for the year then ended, the statement of changes in net assets and the financial highlights for the year then ended and the period March 30, 2012 (commencement of operations) to December 31, 2012. These financial statements and financial highlights are the responsibility of the Funds' management. Our responsibility is to express an opinion on these financial statements and financial highlights based on our audits.
We conducted our audits in accordance with the standards of the Public Company Accounting Oversight Board (United States). Those standards require that we plan and perform the audits to obtain reasonable assurance about whether the financial statements and financial highlights are free of material misstatement. The Funds are not required to have, nor were we engaged to perform, an audit of their internal control over financial reporting. Our audits included consideration of internal control over financial reporting as a basis for designing audit procedures that are appropriate in the circumstances, but not for the purpose of expressing an opinion on the effectiveness of the Funds' internal control over financial reporting. Accordingly, we express no such opinion. An audit includes examining, on a test basis, evidence supporting the amounts and disclosures in the financial statements. Our procedures included confirmation of securities owned as of December 31, 2013, by correspondence with the custodian. An audit also includes assessing the accounting principles used and significant estimates made by management, as well as evaluating the overall financial statement presentation. We believe that our audits provide a reasonable basis for our opinion.
In our opinion, the financial statements and financial highlights referred to above present fairly in all material respects, the financial position of the above mentioned Funds as of December 31, 2013, the results of their operations, the changes in their net assets and the financial highlights for the periods indicated above, in conformity with accounting principles generally accepted in the United States of America.
TAIT, WELLER & BAKER LLP
Philadelphia, Pennsylvania
February 25, 2014
91
TRUSTEE AND OFFICER INFORMATION (Unaudited)
Unless otherwise noted, each Trustee and officer's address is 21550 Oxnard Street, Suite 850, Woodland Hills, California 91367. Trustees and officers of the Trust serve until their resignation, removal or retirement. Additional information about the Trustees is included in the Funds' Statement of Additional Information which is available, without charge, upon request by calling toll-free, 1-800-915-6565 or by visiting the Funds' website at www.gafunds.com.
| Name and Age | | Position(s)
Held with
Trust† | | Year Elected | | Principal Occupation(s) During the
Past 5 Years | | Number of
Portfolios In
Fund Complex
Overseen by
Trustee | | Other Directorships
Held by Trustee
During the Past 5 Years | |
Non-Interested Trustees | | | | | | | | | | | | | | | | | | | | | |
Dr. Gunter Dufey
(73) | | Trustee | | | 1994 | | | Executive Director of Education Exchange Ltd., a consulting firm since 2010. Professorial Fellow, Nanyang Technological University (Singapore) since 2005. Professor (Emeritus) of Ross School at The University of Michigan, where he served from 1968 to 2002. | | | 8 | | | Independent director, various subsidiaries of Ally Financial Inc. (formerly GMAC) in the United States and Canada.
SmartX ETF Trust, a registered investment company | |
James I. Fordwood
(66) | | Trustee | | | 1994 | | | CFO and Managing Member of Prima Marketing LLC (network of convenience stores) since 1998. | | | 8 | | | SmartX ETF Trust, a registered investment company | |
Dr. Bret A. Herscher
(55) | | Trustee | | | 1994 | | | Vice President of Minnow Medical, a company that develops medical devices for treating peripheral artery disease since 2009. President of Pacific Consultants, a technical and technology management consulting company serving the electronic industry and venture capital community that he co-founded, from 1996 to 2007. | | | 8 | | | SmartX ETF Trust, a registered investment company | |
J. Brooks Reece, Jr.
(66) | | Trustee and Chairman | | | 1994 | | | Vice President of Adcole Corp., a manufacturer of precision measuring machines and sun angle sensors for space satellites since 1984. President of Adcole Far East Ltd. since 2008. Executive Director of Adcole Measuring Equipment Shanghai Co. Ltd., since 2004. | | | 8 | | | SmartX ETF Trust, a registered investment company | |
92
| Name and Age | | Position(s)
Held with
Trust† | | Year Elected | | Principal Occupation(s) During the
Past 5 Years | | Number of
Portfolios In
Fund Complex
Overseen by
Trustee | | Other Directorships
Held by Trustee
During the Past 5 Years | |
Interested Trustee | | | | | | | | | | | | | | | | | | | | | |
Timothy W.N. Guinness*
14 Queen Anne's Gate
London,
England SW1H 9AA
U.K.
(65) | | Trustee | | | 1998 | | | Chairman/CIO of Guinness AtkinsonTM Asset Management since November 2002. Chairman of Guinness Asset Management Ltd., investment advisor in London, since 2003. Director of Guinness Capital Management Ltd. since 2010. Director of SR Europe Investment Trust Plc since 2001. Director of Atlantis Japan Growth Fund Ltd., since 2002. Non-Executive Director of Quayle Munro since 2007. Non-Executive Director of Brompton Bicycle Ltd., since 2000. | | | 8 | | | SmartX ETF Trust, a registered investment company | |
Officers | | | | | | | | | | | | | | | | | |
James Atkinson
(56) | | President | | | 2003 | | | Chief Executive Officer and Director of Guinness AtkinsonTM Asset Management since November 2002. Director of Guinness Asset Management Ltd. since 2003. Principal of Orbis Marketing, a mutual fund marketing and advertising firm, since November 2001. | | N/A | | N/A | |
Ashley Atkinson
(30) | | Vice President | | | 2012 | | | Compliance Manager and Operations Manager of Guinness AtkinsonTM Asset Management since 2011. Part-time compliance assistant at Guinness AtkinsonTM Asset Management since 2010. Earned Juris Doctor degree at Southwestern University School of Law from 2006 to 2009. Volunteer at the Los Angeles City Attorney's office in 2009 and 2010. California bar member since 2010. | | N/A | | N/A | |
* "Interested person" (as defined in the 1940 Act) of the Funds because of his affiliation with the Funds' Advisor, Guinness Atkinson Asset Management, Inc.
93
| Name and Age | | Position(s)
Held with
Trust† | | Year Elected | | Principal Occupation(s) During the
Past 5 Years | | Number of
Portfolios In
Fund Complex
Overseen by
Trustee | | Other Directorships
Held by Trustee
During the Past 5 Years | |
Ann E. Edgeworth
(52) | | Chief Compliance Officer | | | 2013 | | | Director of Foreside Compliance Services, from November 2010 to present. From 2004 to 2010, Vice President, Compliance Advisory Services, State Street/Investors Bank & Trust. | | | N/A | | | N/A | |
Rita Dam
(47) | | Treasurer | | | 2009 | | | Vice President, Mutual Fund Administration Corp. since 2006. | | | N/A | | | N/A | |
Joy Ausili
(47) | | Secretary and Assistant Treasurer | | | 2009 | | | Vice President, Mutual Fund Administration Corp. since 2006. | | | N/A | | | N/A | |
Sardjono Kadiman
(38) | | Assistant Treasurer | | | 2009 | | | Assistant Vice President, Mutual Fund Administration Corp. (2008-present); Compliance Officer, U.S. Bancorp Fund Services, LLC, a mutual and hedge fund service provider (2001-2008). | | | N/A | | | N/A | |
Lyna Phan
(38) | | Assistant Treasurer | | | 2011 | | | Assistant Vice President, Mutual Fund Administration Corp. (2010-present); Compliance Officer, U.S. Bancorp Fund Services, LLC, a mutual and hedge fund service provider (2005-2010). | | | N/A | | | N/A | |
94
Privacy Notice
Guinness AtkinsonTM Funds and Guinness Atkinson Asset Management, Inc. may collect non-public information about you from the following sources:
• Information we receive about you on applications or other forms;
• Information you give us orally; and
• Information about your transactions with us.
We do not disclose any non-public personal information about our shareholders or former shareholders without the shareholder's authorization, except as required by law or in response to inquiries from governmental authorities. We restrict access to your personal and account information to those employees who need to know that information to provide products and services to you. We also may disclose that information to unaffiliated third parties (such as to brokers or custodians) only as permitted by law and only as needed for us to provide agreed services to you. We maintain physical, electronic and procedural safeguards to guard your non-public personal information.
95
This page is Intentionally Left Blank
96
This page is Intentionally Left Blank
97
This page is Intentionally Left Blank
98
Guinness AtkinsonTM Funds Information
Board of Trustees
J. Brooks Reece, Jr., Chairman | |
Dr. Gunter Dufey | |
James I. Fordwood | |
Timothy W.N. Guinness | |
Dr. Bret A. Herscher | |
Contact Guinness AtkinsonTM Funds
P.O. Box 701 | |
Milwaukee, WI 53201-0701 | |
Shareholder Services: 800-915-6566 | |
Literature Request: 800-915-6565 | |
Website: www.gafunds.com | |
Email: mail@gafunds.com | |
Guinness AtkinsonTM Funds
Fund | | Cusip | | Ticker | | Fund# | |
Alternative Energy Fund | | 402031 50 4 | | GAAEX | | | 1298 | | |
Asia Focus Fund | | 402031 10 8 | | IASMX | | | 1096 | | |
Asia Pacific Dividend Fund | | 402031 60 3 | | GAADX | | | 1299 | | |
China & Hong Kong Fund | | 402031 20 7 | | ICHKX | | | 1094 | | |
Global Energy Fund | | 402031 40 5 | | GAGEX | | | 1098 | | |
Global Innovators Fund | | 402031 30 6 | | IWIRX | | | 1095 | | |
Inflation Managed Dividend FundTM | | 402031 80 1 | | GAINX | | | 1092 | | |
Renminbi Yuan & Bond Fund | | 402031 70 2 | | GARBX | | | 1099 | | |
Distributed by Quasar Distributors, LLC, Milwaukee, WI 53202
This report is intended for shareholders of the Guinness AtkinsonTM Funds and may not be used as literature unless preceded or accompanied by a current prospectus.
99
Guinness Atkinson Funds
c/o U.S. Bancorp Fund Services, LLC
P.O. Box 701
Milwaukee, WI 53201-0701
Item 2. Code of Ethics.
The registrant has adopted a code of ethics that applies to the registrant’s principal executive officer and principal financial officer. The registrant has not made any amendments to its code of ethics during the period covered by this report. The registrant has not granted any waivers from any provisions of the code of ethics during the period covered by this report.
The registrant undertakes to provide to any person without charge, upon request, a copy of its code of ethics by mail when they call the registrant at 1-800-915-6565.
Item 3. Audit Committee Financial Expert.
The registrant’s board of trustees has determined that there is at least one audit committee financial expert serving on its audit committee. James I. Fordwood is the “audit committee financial expert” and is considered to be “independent” as each term is defined in Item 3 of Form N-CSR.
Item 4. Principal Accountant Fees and Services.
The registrant has engaged its principal accountant to perform audit services, audit-related services, tax services and other services during the past two fiscal years. “Audit services” refer to performing an audit of the registrant’s annual financial statements or services that are normally provided by the accountant in connection with statutory and regulatory filings or engagements for those fiscal years. “Audit-related services” refer to the assurance and related services by the principal accountant that are reasonably related to the performance of the audit. “Tax services” refer to professional services rendered by the principal accountant for tax compliance, tax advice, and tax planning. There were no “other services” provided by the principal accountant. The following table details the aggregate fees billed or expected to be billed for each of the last two fiscal years for audit fees, audit-related fees, tax fees and other fees by the principal accountant.
| | FYE 12/31/2013 | | FYE 12/31/2012 | |
Audit Fees | | $ | 140,900 | | $ | 140,300 | |
Audit-Related Fees | | N/A | | N/A | |
Tax Fees | | $ | 25,600 | | $ | 21,700 | |
All Other Fees | | N/A | | N/A | |
The audit committee has adopted pre-approval policies and procedures that require the audit committee to pre-approve all audit and non-audit services of the registrant, including services provided to any entity affiliated with the registrant.
The percentage of fees billed by Tait, Weller, & Baker LLP applicable to non-audit services pursuant to waiver of pre-approval requirement were as follows:
| | FYE 12/31/2013 | | FYE 12/31/2012 | |
Audit-Related Fees | | 0 | % | 0 | % |
Tax Fees | | 0 | % | 0 | % |
All Other Fees | | 0 | % | 0 | % |
All of the principal accountant’s hours spent on auditing the registrant’s financial statements were attributed to work performed by full-time permanent employees of the principal accountant.
The following table indicates the non-audit fees billed or expected to be billed by the registrant’s accountant for services to the registrant and to the registrant’s investment adviser (and any other controlling entity, etc.—not sub-adviser) for the last two years. The audit committee of the Board of Trustees has considered whether the provision of non-audit services that were rendered to the registrant’s investment adviser is compatible with maintaining the principal accountant’s independence and has concluded that the provision of such non-audit services by the accountant has not compromised the accountant’s independence.
Non-Audit Related Fees | | FYE 12/31/2013 | | FYE 12/31/2012 |
Registrant | | N/A | | N/A |
Registrant’s Investment Advisor | | N/A | | N/A |
Item 5. Audit Committee of Listed Registrants.
Not applicable to registrants who are not listed issuers (as defined in Rule 10A-3 under the Securities Exchange Act of 1934).
Item 6. Schedule of Investments.
(a) Schedule of Investments is included as part of the report to shareholders filed under Item 1 of this Form.
(b) Not Applicable.
Item 7. Disclosure of Proxy Voting Policies and Procedures for Closed-End Management Investment Companies.
Not Applicable.
Item 8. Portfolio Managers of Closed-End Management Investment Companies.
Not Applicable.
Item 9. Purchases of Equity Securities by Closed-End Management Investment Company and Affiliated Purchasers.
Not Applicable.
Item 10. Submission of Matters to a Vote of Security Holders.
The registrant has not made any material changes to the procedures by which shareholders may recommend nominees to the registrant’s Board of Trustees.
Item 11. Controls and Procedures.
(a) The registrant’s principal executive officer and principal financial officer have evaluated the registrant’s disclosure controls and procedures within 90 days of this filing and have concluded based on such evaluation that the registrant’s disclosure controls and procedures were effective, as of that
date, in ensuring that information required to be disclosed by the registrant in this Form N-CSR was recorded, processed, summarized, and reported within the time periods specified in the Securities and Exchange Commission’s rules and forms.
(b) There were no changes in the registrant’s internal control over financial reporting (as defined in Rule 30a-3(d) under the Investment Company Act of 1940) that occurred during the registrant’s last fiscal quarter that have materially affected, or are reasonably likely to materially affect, the registrant’s internal control over financial reporting.
Item 12. Exhibits.
(a) (1) Any code of ethics or amendment thereto, that is subject of the disclosure required by Item 2, to the extent that the registrant intends to satisfy Item 2 requirements through filing an exhibit. Incorporated by reference to the Registrant’s Form N-CSR filed March 10, 2011.
(b)
(2) Certifications pursuant to Section 302 of the Sarbanes-Oxley Act of 2002. Filed herewith.
(3) Any written solicitation to purchase securities under Rule 23c-1 under the Act sent or given during the period covered by the report by or on behalf of the registrant to 10 or more persons. Not applicable to open-end investment companies.
(c) Certification pursuant to Section 906 of the Sarbanes-Oxley Act of 2002. Filed herewith.
SIGNATURES
Pursuant to the requirements of the Securities Exchange Act of 1934 and the Investment Company Act of 1940, the registrant has duly caused this report to be signed on its behalf by the undersigned, thereunto duly authorized.
(Registrant) Guinness Atkinson Funds | |
| |
| |
By | /s/ James J. Atkinson | |
Name: James J. Atkinson | |
Title: President | |
Date: | 3/10/14 | |
Pursuant to the requirements of the Securities Exchange Act of 1934 and the Investment Company Act of 1940, this report has been signed by the following persons on behalf of the registrant and in the capacities and on the dates indicated.
By | /s/ James J. Atkinson | |
Name: James J. Atkinson | |
Title: President | |
Date: | 3/10/14 | |
| | |
| | |
By | /s/ Rita Dam | |
Name: Rita Dam | |
Title: Treasurer | |
Date: | 3/10/14 | |