
Second Quarter 2021 Earnings Presentation August 5, 2021
Forward-Looking Statements This presentation, including information incorporated by reference, contains forward-looking statements within the meaning of the U.S. Private Securities Litigation Reform Act of 1995. All statements other than statements of historical fact, including statements regarding guidance, industry prospects or future results of operations or financial position, expected sources of incremental margin, strategy, financing needs, future capital expenditures and the outcome or effect of ongoing litigation, are forward-looking. This Quarterly Report uses words such as "anticipate," "believe," "expect," "estimate," "forecast," "goal," "intend," "objective," "plan," "project," "seek," "strategy," "target," "will" and similar expressions to identify forward-looking statements. These forward-looking statements are based on the beliefs and assumptions of management at the time that these statements were prepared and are inherently uncertain. Forward-looking statements are subject to risks and uncertainties that could cause actual results to differ materially from those expressed or implied in the forward-looking statements. These risks and uncertainties include, but are not limited to, general economic conditions on an international, national, state and local level; weather conditions in SJI’s marketing areas; changes in commodity costs; changes in the availability of natural gas; “non-routine” or “extraordinary” disruptions in SJI’s distribution system; cybersecurity incidents and related disruptions; regulatory, legislative and court decisions; competition; the availability and cost of capital; costs and effects of legal proceedings and environmental liabilities; the failure of customers, suppliers or business partners to fulfill their contractual obligations; changes in business strategies; and public health crises and epidemics or pandemics, such as a novel coronavirus (COVID-19). These risks and uncertainties, as well as other risks and uncertainties that could cause our actual results to differ materially from those expressed in the forward-looking statements, are described in greater detail under the heading “Item 1A. Risk Factors” in this Quarterly Report, SJI’s and SJG's Annual Report on Form 10-K for the year ended December 31, 2020 and in any other SEC filings made by SJI or SJG during 2020 and 2021 and prior to the filing of this presentation. Non-GAAP Measures Management uses the non-GAAP financial measures of Economic Earnings and Economic Earnings per share when evaluating its results of operations. These non-GAAP financial measures should not be considered as an alternative to GAAP measures, such as net income, operating income, earnings per share from continuing operations or any other GAAP measure of financial performance. We define Economic Earnings as: Income from Continuing Operations, (i) less the change in unrealized gains and plus the change in unrealized losses on non-utility derivative transactions; (ii) less income and plus losses attributable to noncontrolling interest; and (iii) less the impact of transactions, contractual arrangements or other events where management believes period to period comparisons of SJI's operations could be difficult or potentially confusing. With respect to part (iii) of the definition of Economic Earnings, items excluded from Economic Earnings for the three months ended June 30, 2021 and 2020, are described in the tables in our most recently filed 10-Q. Economic Earnings is a significant financial measure used by our management to indicate the amount and timing of income from continuing operations that we expect to earn after taking into account the impact of derivative instruments on the related transactions, as well as the impact of contractual arrangements and other events that management believes make period to period comparisons of SJI's operations difficult or potentially confusing. Management uses Economic Earnings to manage its business and to determine such items as incentive/compensation arrangements and allocation of resources. Specifically regarding derivatives, we believe that this financial measure indicates to investors the profitability of the entire derivative-related transaction and not just the portion that is subject to mark-to-market valuation under GAAP. We believe that considering only the change in market value on the derivative side of the transaction can produce a false sense as to the ultimate profitability of the total transaction as no change in value is reflected for the non-derivative portion of the transaction. Forward-Looking Statements & Non-GAAP Measures 2

Second Quarter 2021 Financial Review
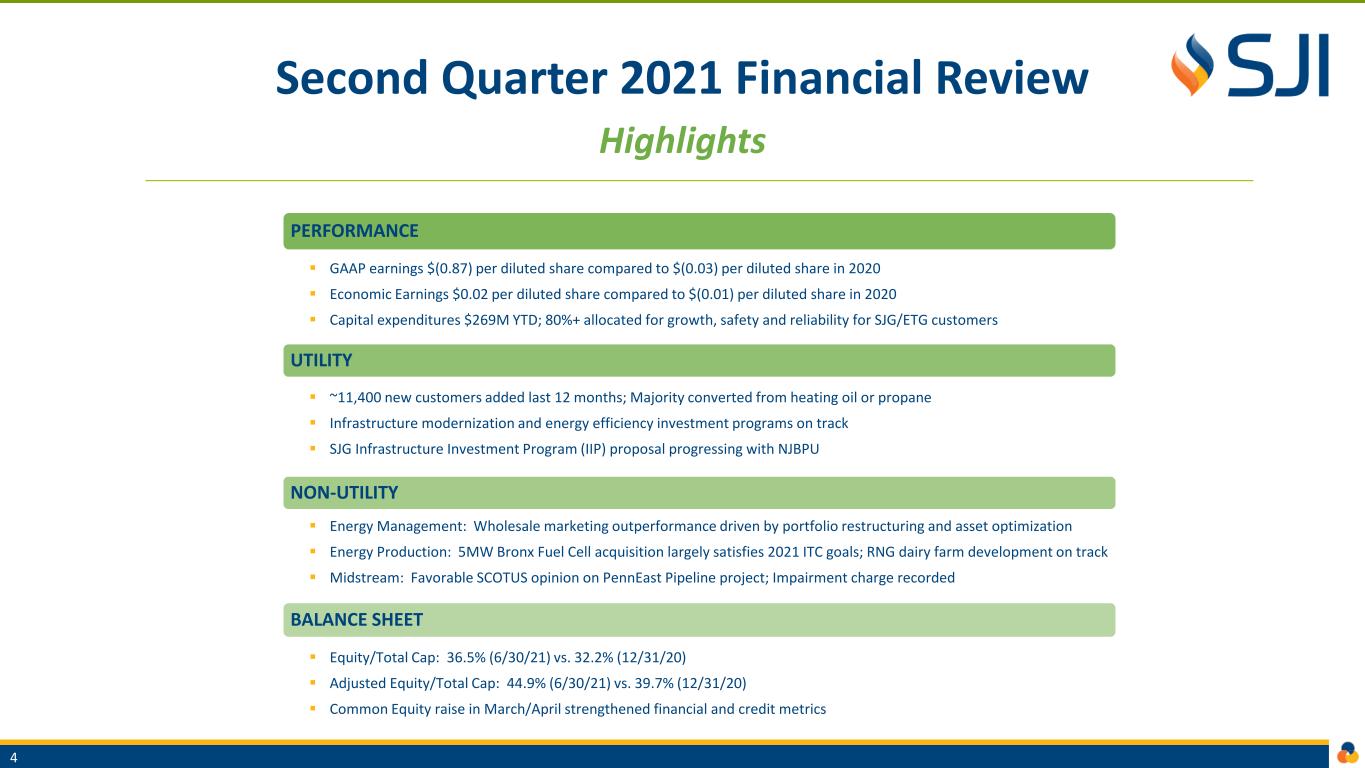
4 Second Quarter 2021 Financial Review Highlights PERFORMANCE ▪ GAAP earnings $(0.87) per diluted share compared to $(0.03) per diluted share in 2020 ▪ Economic Earnings $0.02 per diluted share compared to $(0.01) per diluted share in 2020 ▪ Capital expenditures $269M YTD; 80%+ allocated for growth, safety and reliability for SJG/ETG customers UTILITY ▪ ~11,400 new customers added last 12 months; Majority converted from heating oil or propane ▪ Infrastructure modernization and energy efficiency investment programs on track ▪ SJG Infrastructure Investment Program (IIP) proposal progressing with NJBPU NON-UTILITY ▪ Energy Management: Wholesale marketing outperformance driven by portfolio restructuring and asset optimization ▪ Energy Production: 5MW Bronx Fuel Cell acquisition largely satisfies 2021 ITC goals; RNG dairy farm development on track ▪ Midstream: Favorable SCOTUS opinion on PennEast Pipeline project; Impairment charge recorded BALANCE SHEET ▪ Equity/Total Cap: 36.5% (6/30/21) vs. 32.2% (12/31/20) ▪ Adjusted Equity/Total Cap: 44.9% (6/30/21) vs. 39.7% (12/31/20) ▪ Common Equity raise in March/April strengthened financial and credit metrics
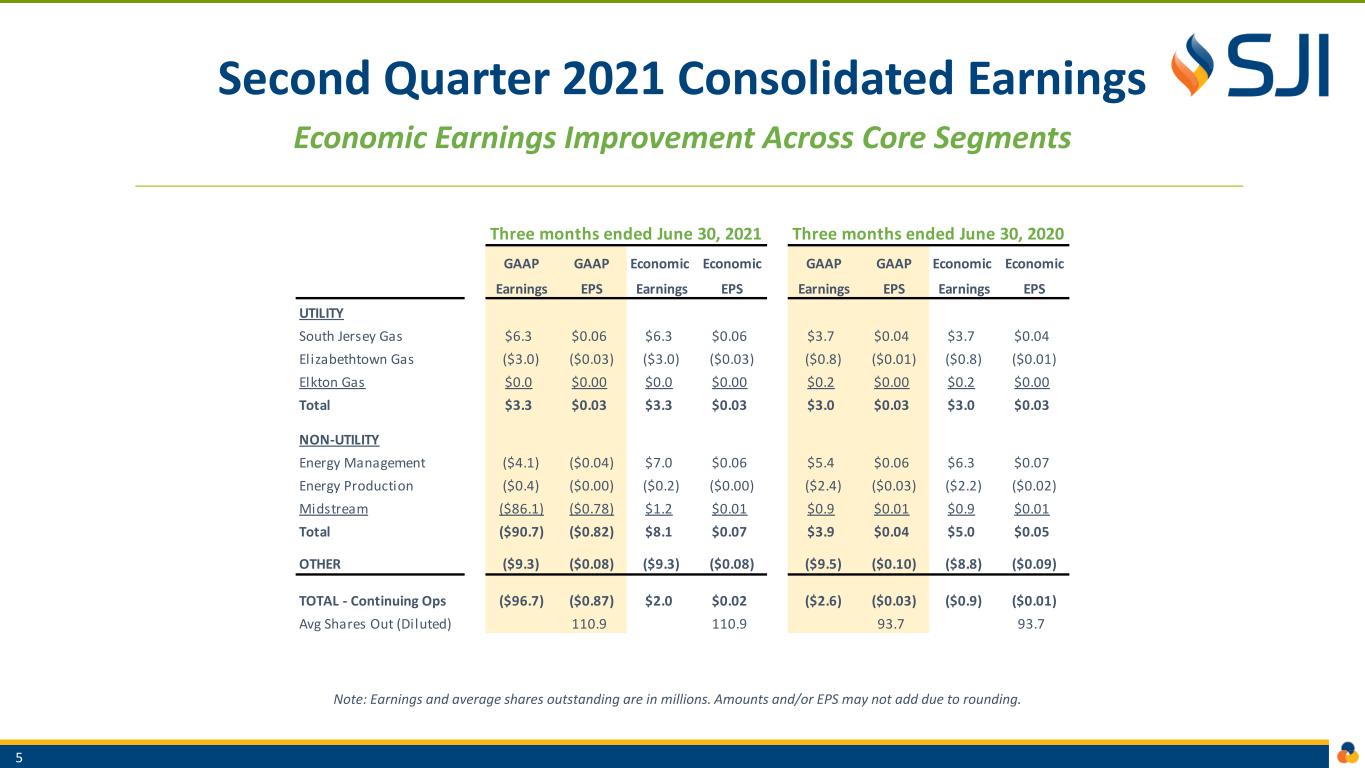
Second Quarter 2021 Consolidated Earnings Economic Earnings Improvement Across Core Segments 5 Note: Earnings and average shares outstanding are in millions. Amounts and/or EPS may not add due to rounding. GAAP GAAP Economic Economic GAAP GAAP Economic Economic Earnings EPS Earnings EPS Earnings EPS Earnings EPS UTILITY South Jersey Gas $6.3 $0.06 $6.3 $0.06 $3.7 $0.04 $3.7 $0.04 Elizabethtown Gas ($3.0) ($0.03) ($3.0) ($0.03) ($0.8) ($0.01) ($0.8) ($0.01) Elkton Gas $0.0 $0.00 $0.0 $0.00 $0.2 $0.00 $0.2 $0.00 Total $3.3 $0.03 $3.3 $0.03 $3.0 $0.03 $3.0 $0.03 NON-UTILITY Energy Management ($4.1) ($0.04) $7.0 $0.06 $5.4 $0.06 $6.3 $0.07 Energy Production ($0.4) ($0.00) ($0.2) ($0.00) ($2.4) ($0.03) ($2.2) ($0.02) Midstream ($86.1) ($0.78) $1.2 $0.01 $0.9 $0.01 $0.9 $0.01 Total ($90.7) ($0.82) $8.1 $0.07 $3.9 $0.04 $5.0 $0.05 OTHER ($9.3) ($0.08) ($9.3) ($0.08) ($9.5) ($0.10) ($8.8) ($0.09) TOTAL - Continuing Ops ($96.7) ($0.87) $2.0 $0.02 ($2.6) ($0.03) ($0.9) ($0.01) Avg Shares Out (Diluted) 110.9 110.9 93.7 93.7 Three months ended June 30, 2021 Three months ended June 30, 2020
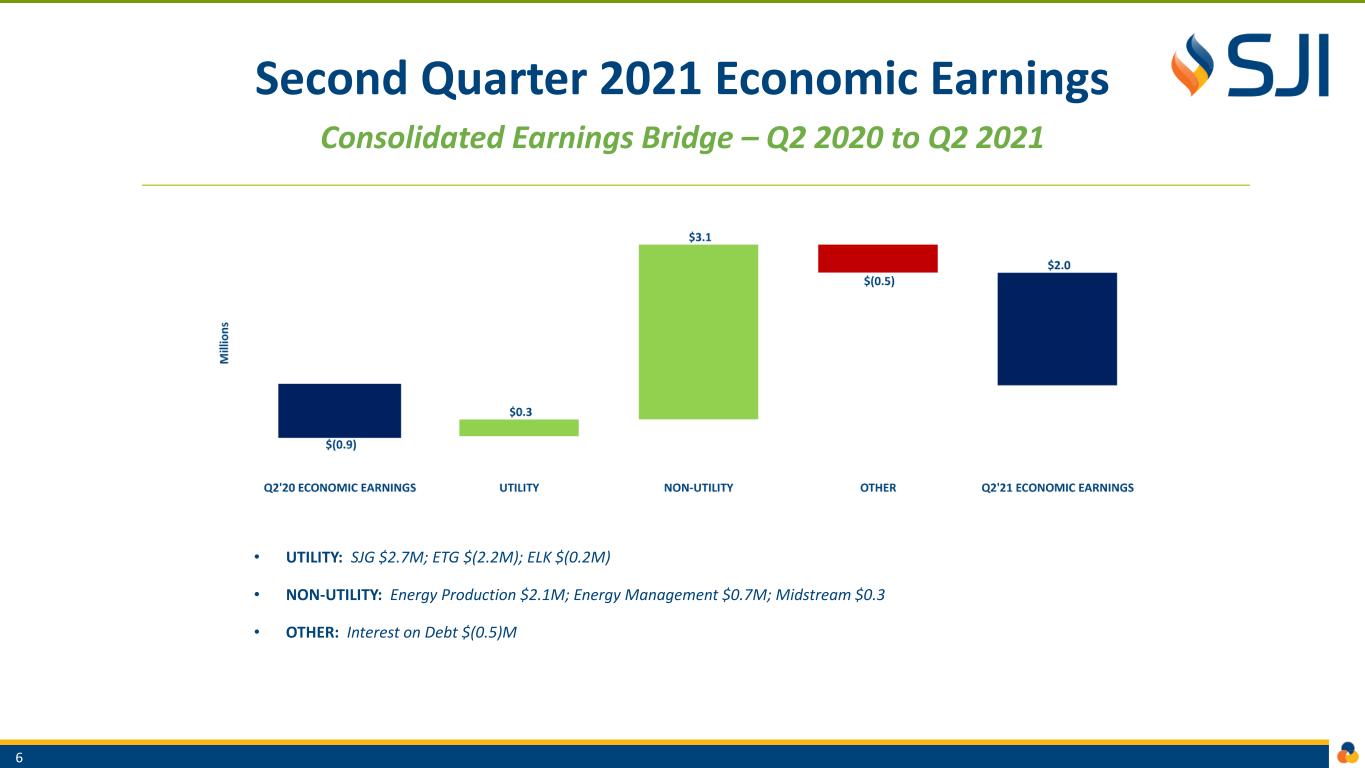
Second Quarter 2021 Economic Earnings Consolidated Earnings Bridge – Q2 2020 to Q2 2021 6 • UTILITY: SJG $2.7M; ETG $(2.2M); ELK $(0.2M) • NON-UTILITY: Energy Production $2.1M; Energy Management $0.7M; Midstream $0.3 • OTHER: Interest on Debt $(0.5)M
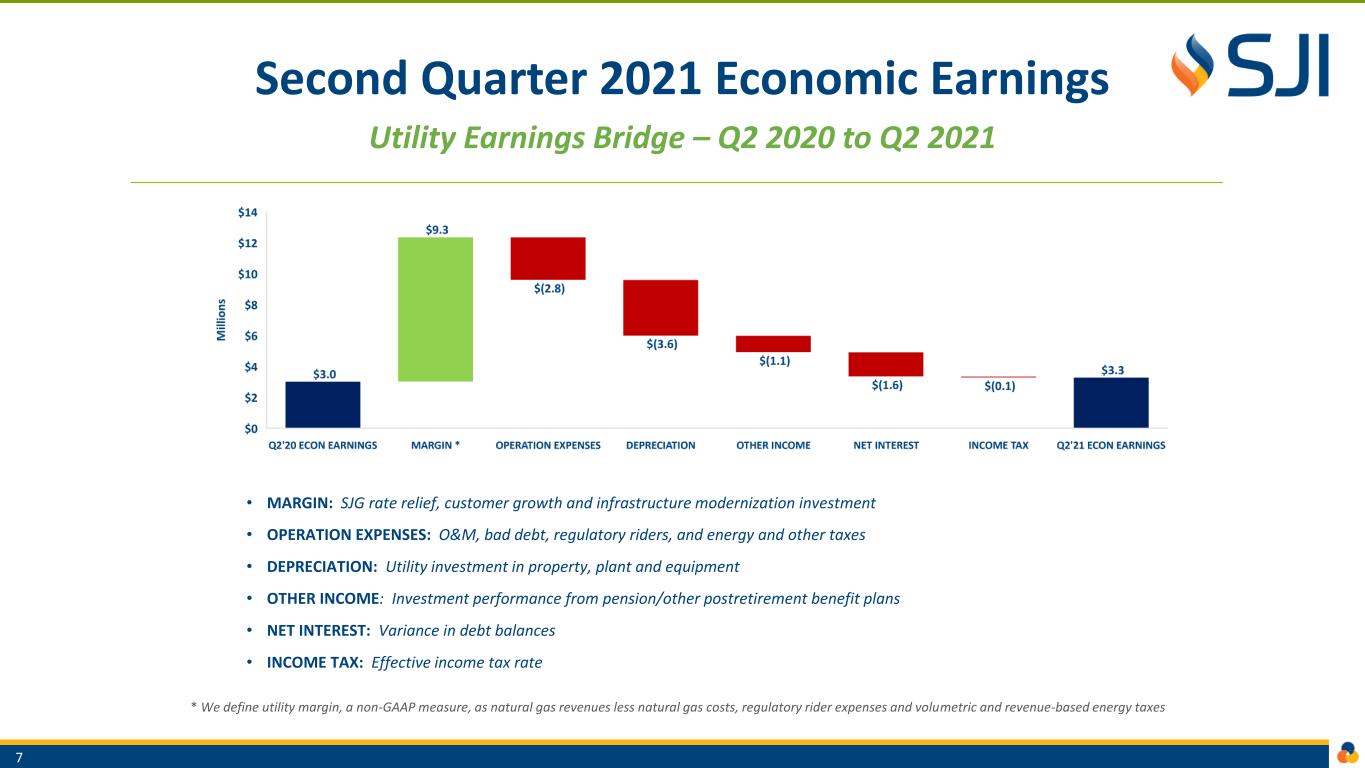
Second Quarter 2021 Economic Earnings Utility Earnings Bridge – Q2 2020 to Q2 2021 7 • MARGIN: SJG rate relief, customer growth and infrastructure modernization investment • OPERATION EXPENSES: O&M, bad debt, regulatory riders, and energy and other taxes • DEPRECIATION: Utility investment in property, plant and equipment • OTHER INCOME: Investment performance from pension/other postretirement benefit plans • NET INTEREST: Variance in debt balances • INCOME TAX: Effective income tax rate * We define utility margin, a non-GAAP measure, as natural gas revenues less natural gas costs, regulatory rider expenses and volumetric and revenue-based energy taxes
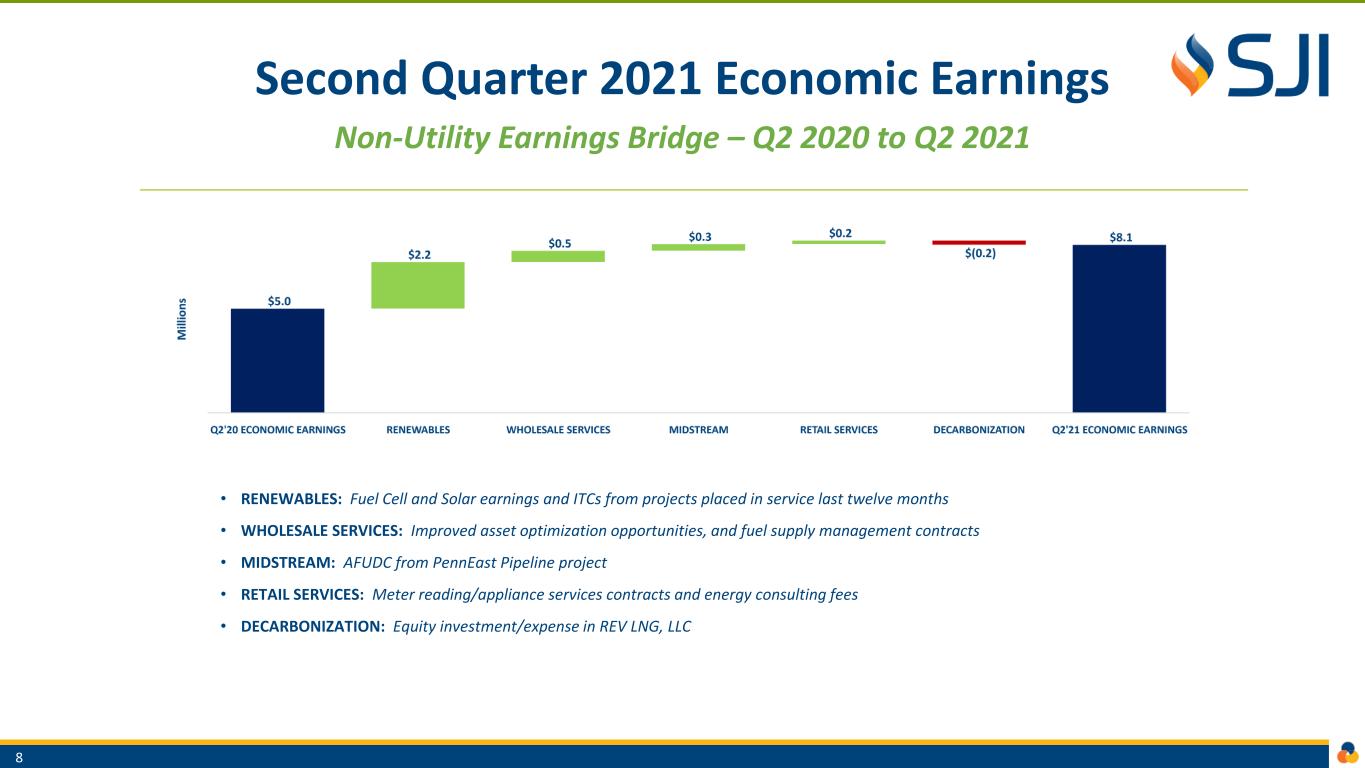
Second Quarter 2021 Economic Earnings Non-Utility Earnings Bridge – Q2 2020 to Q2 2021 8 • RENEWABLES: Fuel Cell and Solar earnings and ITCs from projects placed in service last twelve months • WHOLESALE SERVICES: Improved asset optimization opportunities, and fuel supply management contracts • MIDSTREAM: AFUDC from PennEast Pipeline project • RETAIL SERVICES: Meter reading/appliance services contracts and energy consulting fees • DECARBONIZATION: Equity investment/expense in REV LNG, LLC

Six Months 2021 Financial Review
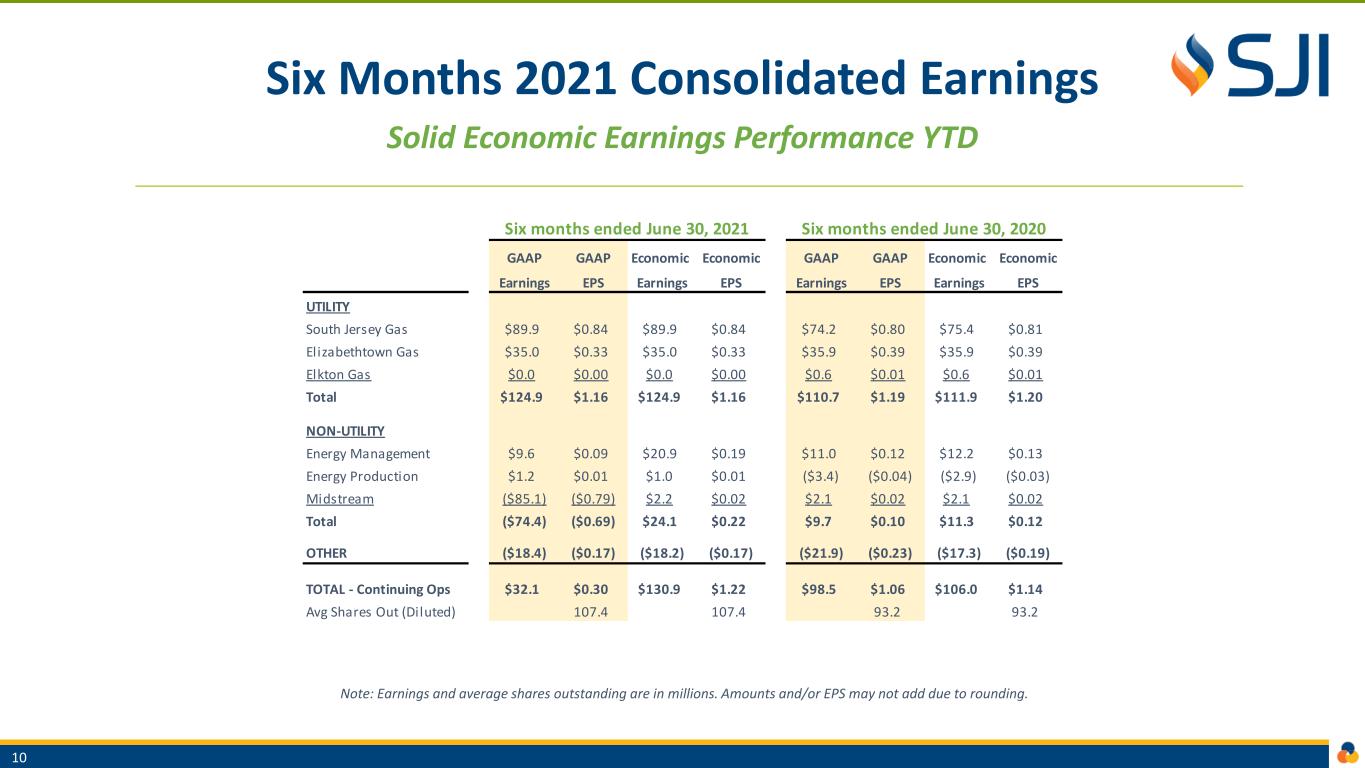
Six Months 2021 Consolidated Earnings Solid Economic Earnings Performance YTD 10 Note: Earnings and average shares outstanding are in millions. Amounts and/or EPS may not add due to rounding. GAAP GAAP Economic Economic GAAP GAAP Economic Economic Earnings EPS Earnings EPS Earnings EPS Earnings EPS UTILITY South Jersey Gas $89.9 $0.84 $89.9 $0.84 $74.2 $0.80 $75.4 $0.81 Elizabethtown Gas $35.0 $0.33 $35.0 $0.33 $35.9 $0.39 $35.9 $0.39 Elkton Gas $0.0 $0.00 $0.0 $0.00 $0.6 $0.01 $0.6 $0.01 Total $124.9 $1.16 $124.9 $1.16 $110.7 $1.19 $111.9 $1.20 NON-UTILITY Energy Management $9.6 $0.09 $20.9 $0.19 $11.0 $0.12 $12.2 $0.13 Energy Production $1.2 $0.01 $1.0 $0.01 ($3.4) ($0.04) ($2.9) ($0.03) Midstream ($85.1) ($0.79) $2.2 $0.02 $2.1 $0.02 $2.1 $0.02 Total ($74.4) ($0.69) $24.1 $0.22 $9.7 $0.10 $11.3 $0.12 OTHER ($18.4) ($0.17) ($18.2) ($0.17) ($21.9) ($0.23) ($17.3) ($0.19) TOTAL - Continuing Ops $32.1 $0.30 $130.9 $1.22 $98.5 $1.06 $106.0 $1.14 Avg Shares Out (Diluted) 107.4 107.4 93.2 93.2 Six months ended June 30, 2021 Six months ended June 30, 2020
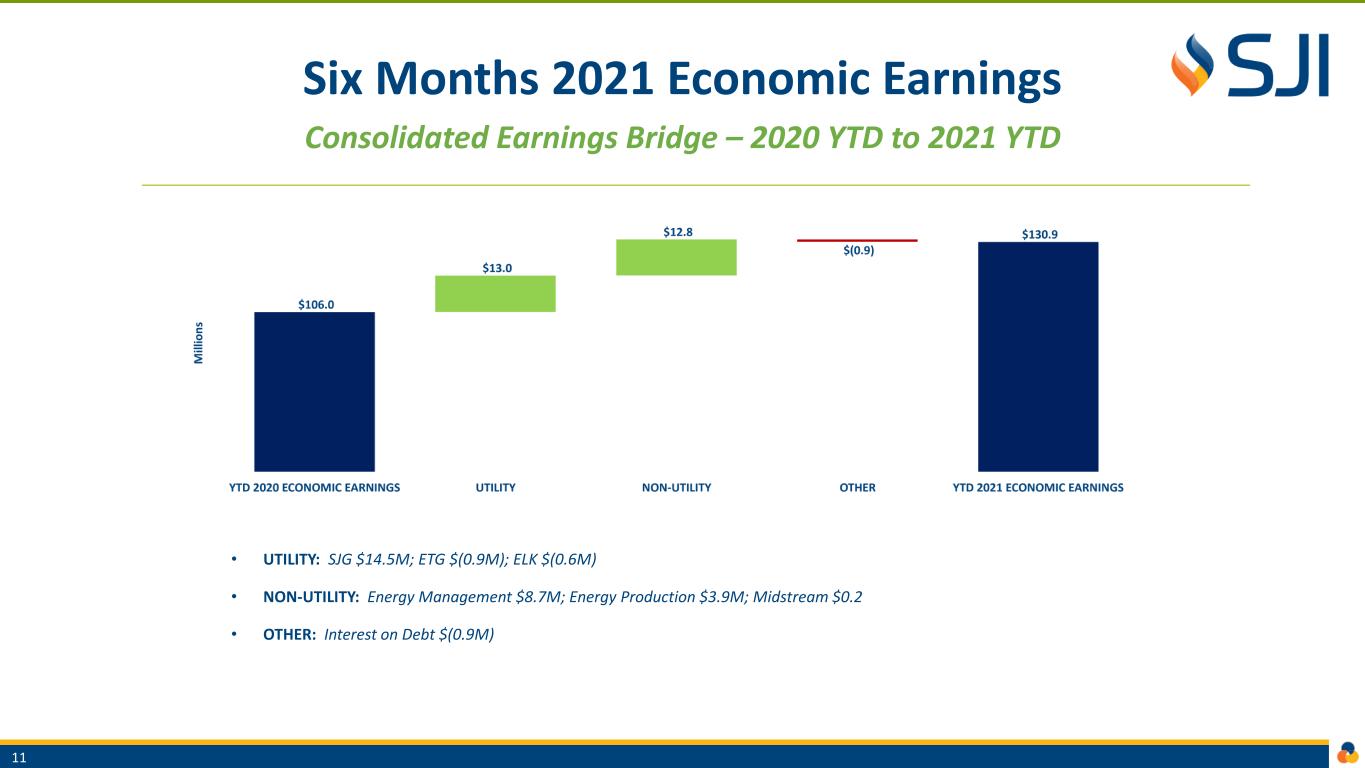
Six Months 2021 Economic Earnings Consolidated Earnings Bridge – 2020 YTD to 2021 YTD 11 • UTILITY: SJG $14.5M; ETG $(0.9M); ELK $(0.6M) • NON-UTILITY: Energy Management $8.7M; Energy Production $3.9M; Midstream $0.2 • OTHER: Interest on Debt $(0.9M)
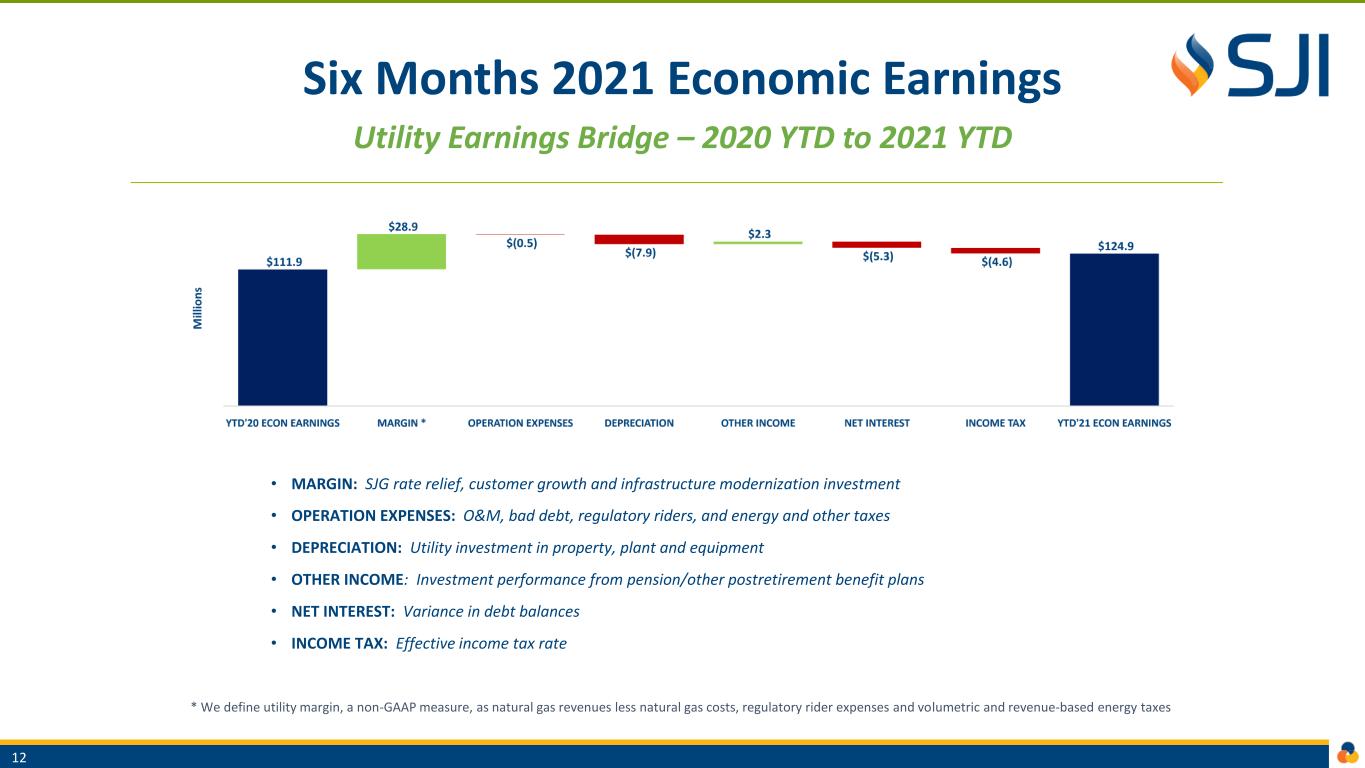
Six Months 2021 Economic Earnings Utility Earnings Bridge – 2020 YTD to 2021 YTD 12 • MARGIN: SJG rate relief, customer growth and infrastructure modernization investment • OPERATION EXPENSES: O&M, bad debt, regulatory riders, and energy and other taxes • DEPRECIATION: Utility investment in property, plant and equipment • OTHER INCOME: Investment performance from pension/other postretirement benefit plans • NET INTEREST: Variance in debt balances • INCOME TAX: Effective income tax rate * We define utility margin, a non-GAAP measure, as natural gas revenues less natural gas costs, regulatory rider expenses and volumetric and revenue-based energy taxes
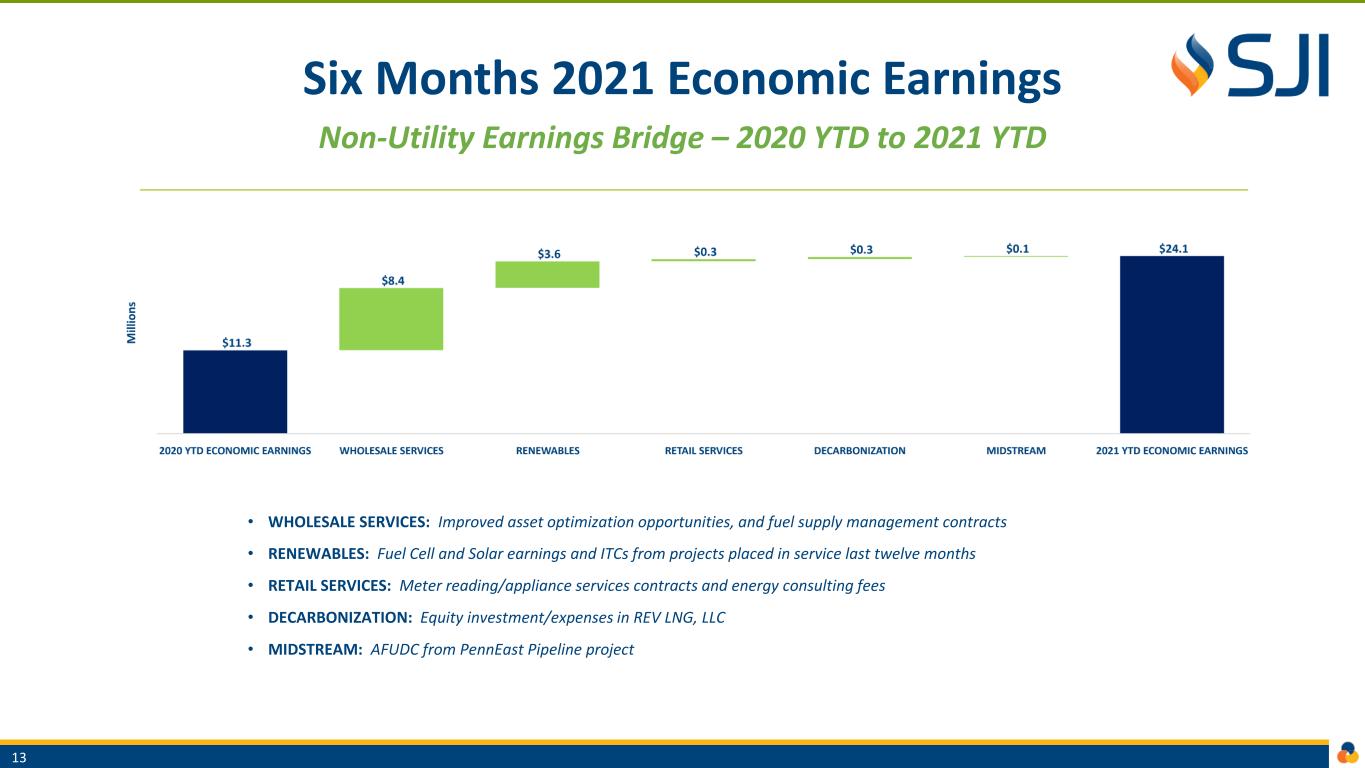
Six Months 2021 Economic Earnings Non-Utility Earnings Bridge – 2020 YTD to 2021 YTD 13 • WHOLESALE SERVICES: Improved asset optimization opportunities, and fuel supply management contracts • RENEWABLES: Fuel Cell and Solar earnings and ITCs from projects placed in service last twelve months • RETAIL SERVICES: Meter reading/appliance services contracts and energy consulting fees • DECARBONIZATION: Equity investment/expenses in REV LNG, LLC • MIDSTREAM: AFUDC from PennEast Pipeline project

Financial Metrics
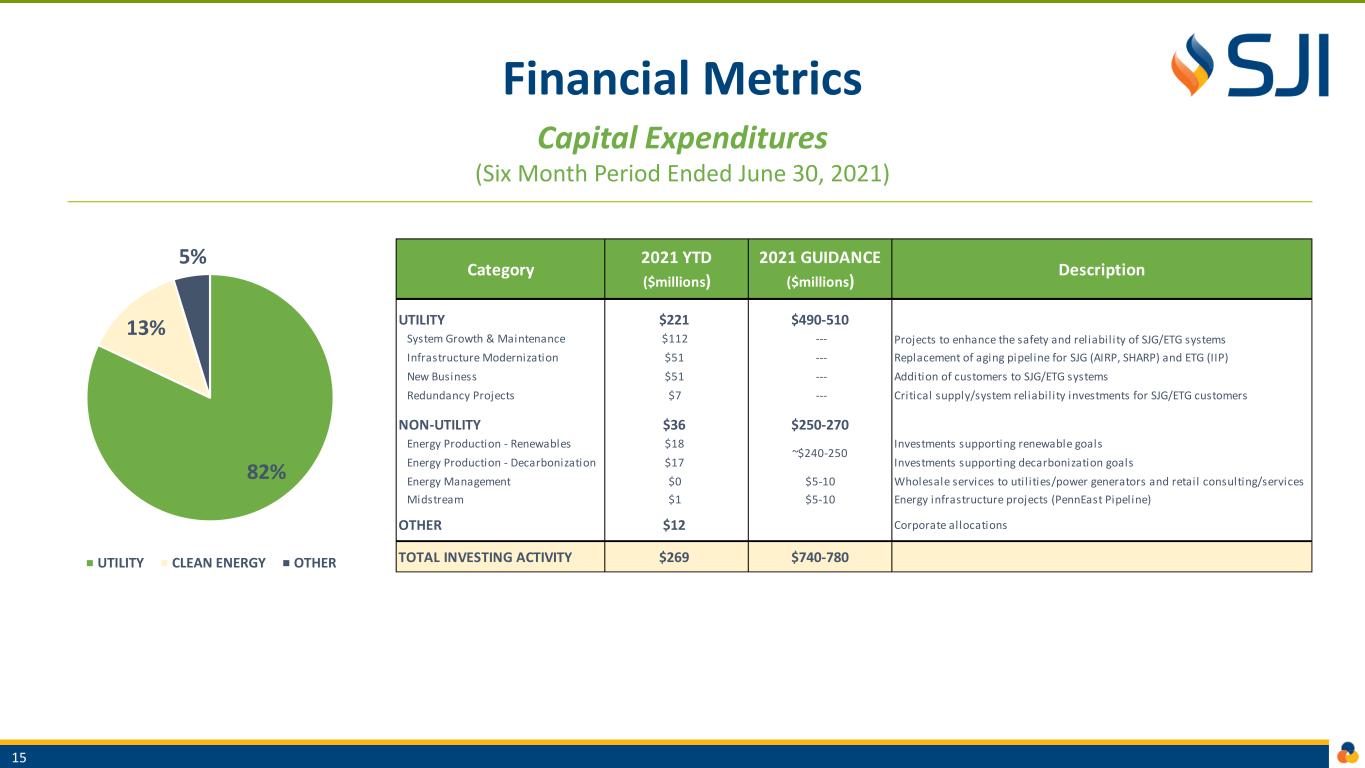
Financial Metrics Capital Expenditures (Six Month Period Ended June 30, 2021) 15 82% 13% 5% UTILITY CLEAN ENERGY OTHER UTILITY $221 $490-510 System Growth & Maintenance $112 --- Projects to enhance the safety and reliability of SJG/ETG systems Infrastructure Modernization $51 --- Replacement of aging pipeline for SJG (AIRP, SHARP) and ETG (IIP) New Business $51 --- Addition of customers to SJG/ETG systems Redundancy Projects $7 --- Critical supply/system reliability investments for SJG/ETG customers NON-UTILITY $36 $250-270 Energy Production - Renewables $18 Investments supporting renewable goals Energy Production - Decarbonization $17 Investments supporting decarbonization goals Energy Management $0 $5-10 Wholesale services to util ities/power generators and retail consulting/services Midstream $1 $5-10 Energy infrastructure projects (PennEast Pipeline) OTHER $12 Corporate allocations TOTAL INVESTING ACTIVITY $269 $740-780 Category 2021 GUIDANCE ($millions) Description 2021 YTD ($millions) ~$240-250
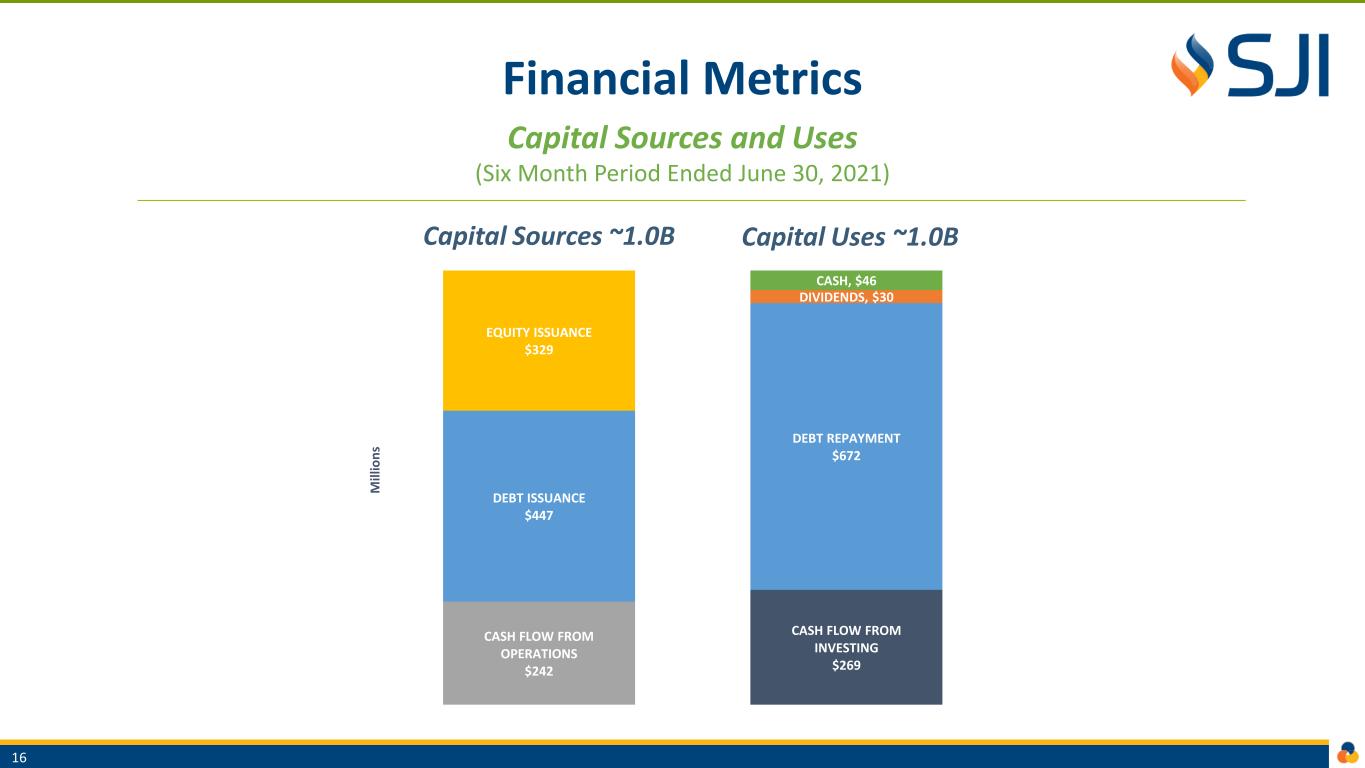
Financial Metrics Capital Sources and Uses (Six Month Period Ended June 30, 2021) Capital Sources ~1.0B Capital Uses ~1.0B 16 CASH FLOW FROM INVESTING $269 CASH FLOW FROM OPERATIONS $242 DEBT ISSUANCE $447 DEBT REPAYMENT $672 DIVIDENDS, $30 EQUITY ISSUANCE $329 CASH, $46 M ill io n s
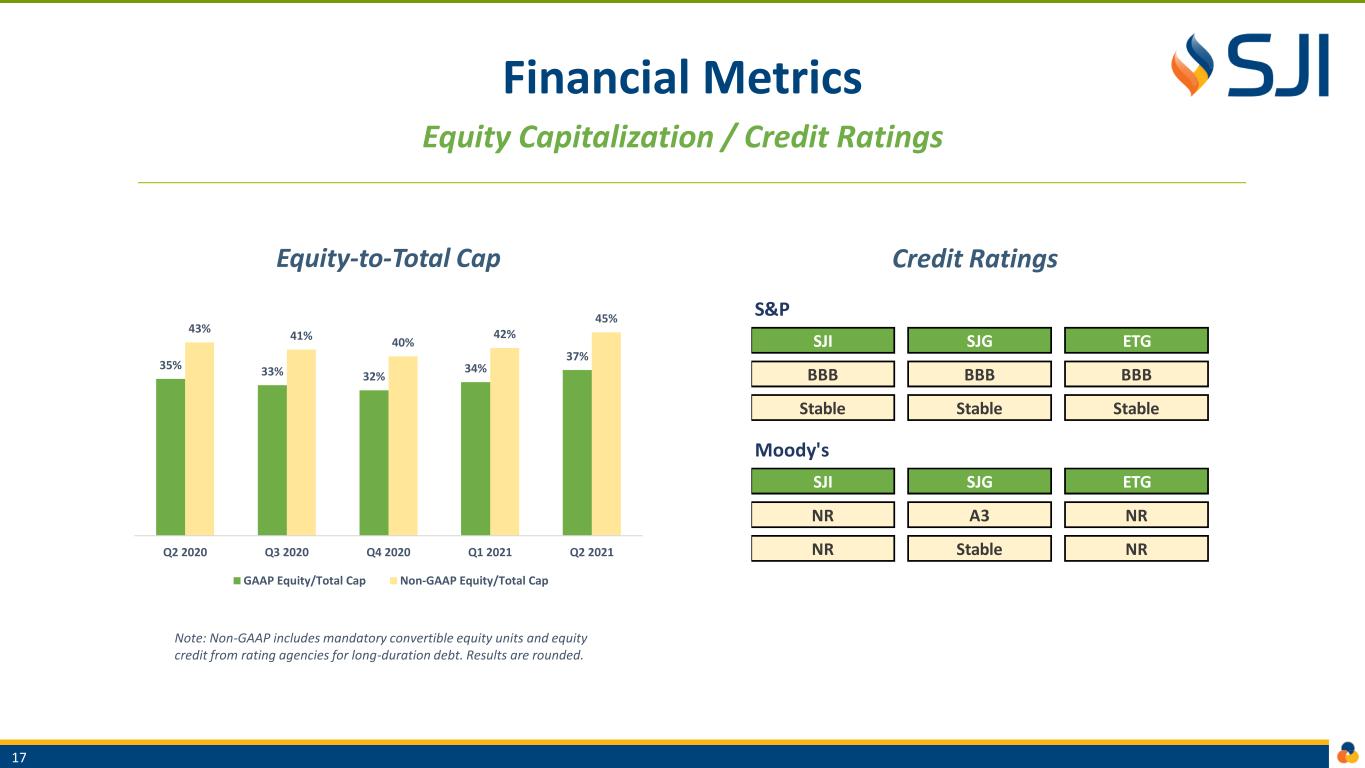
Financial Metrics Equity Capitalization / Credit Ratings Equity-to-Total Cap Credit Ratings 17 Note: Non-GAAP includes mandatory convertible equity units and equity credit from rating agencies for long-duration debt. Results are rounded. S&P SJI SJG ETG BBB BBB BBB Stable Stable Stable Moody's SJI SJG ETG NR A3 NR NR Stable NR 35% 33% 32% 34% 37% 43% 41% 40% 42% 45% Q2 2020 Q3 2020 Q4 2020 Q1 2021 Q2 2021 GAAP Equity/Total Cap Non-GAAP Equity/Total Cap
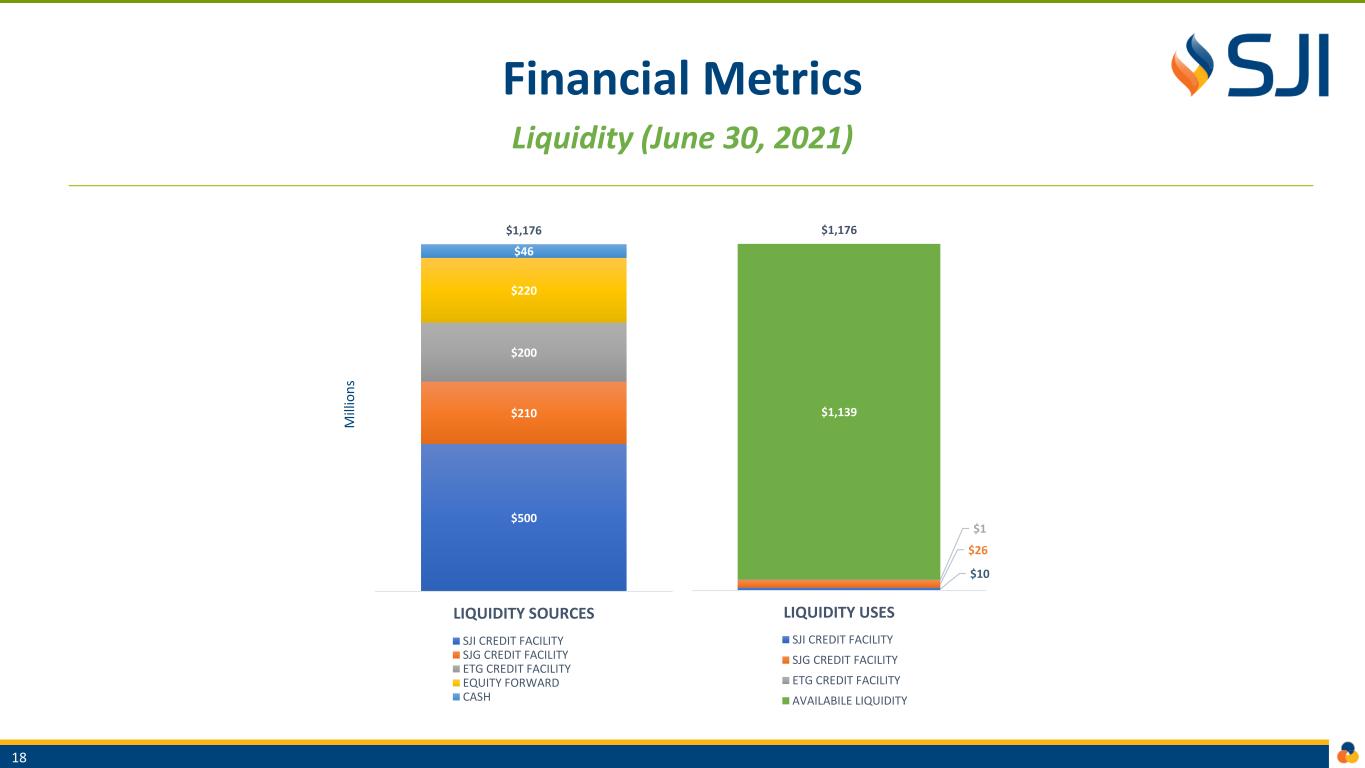
Financial Metrics Liquidity (June 30, 2021) 18 $500 $210 $200 $220 $46 $1,176 LIQUIDITY SOURCES SJI CREDIT FACILITY SJG CREDIT FACILITY ETG CREDIT FACILITY EQUITY FORWARD CASH $10 $26 $1 $1,139 $1,176 LIQUIDITY USES SJI CREDIT FACILITY SJG CREDIT FACILITY ETG CREDIT FACILITY AVAILABILE LIQUIDITY M ill io n s

Guidance and Outlook
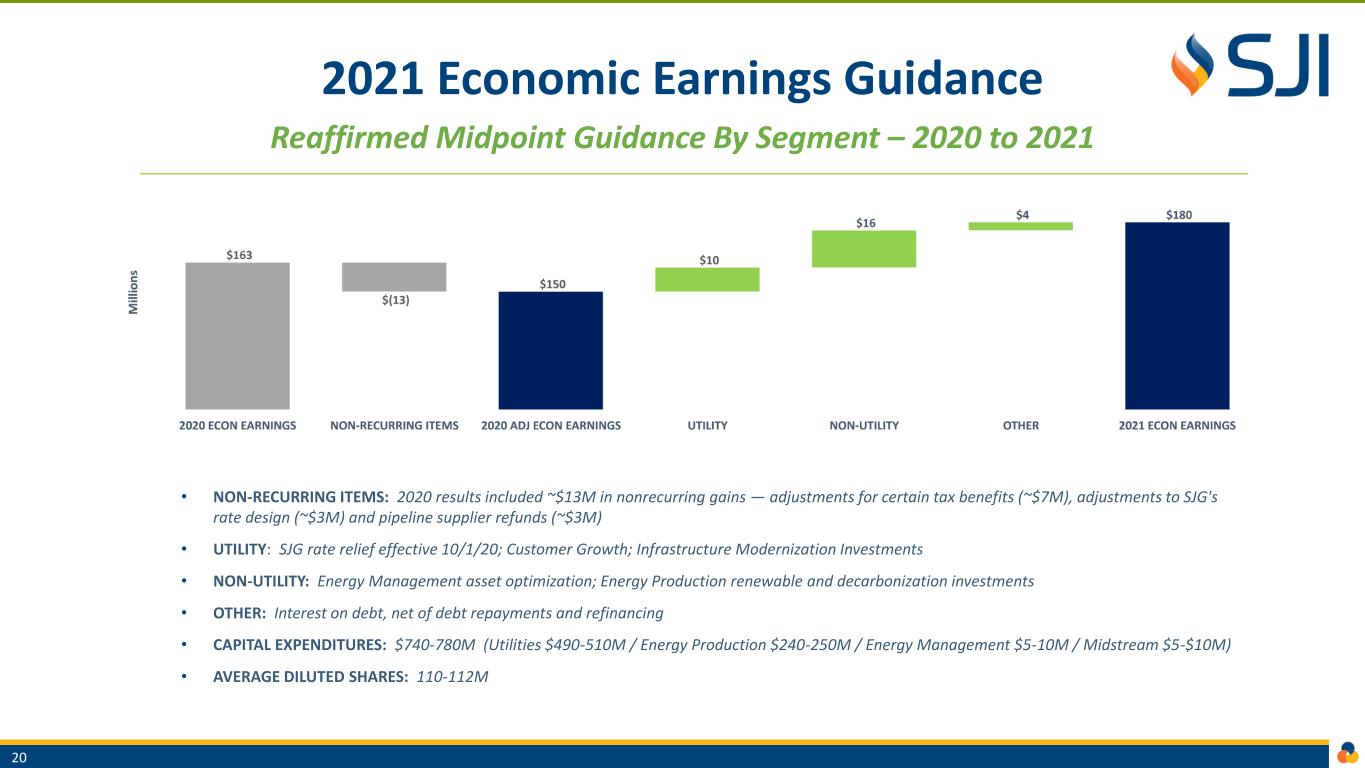
2021 Economic Earnings Guidance Reaffirmed Midpoint Guidance By Segment – 2020 to 2021 20 • NON-RECURRING ITEMS: 2020 results included ~$13M in nonrecurring gains — adjustments for certain tax benefits (~$7M), adjustments to SJG's rate design (~$3M) and pipeline supplier refunds (~$3M) • UTILITY: SJG rate relief effective 10/1/20; Customer Growth; Infrastructure Modernization Investments • NON-UTILITY: Energy Management asset optimization; Energy Production renewable and decarbonization investments • OTHER: Interest on debt, net of debt repayments and refinancing • CAPITAL EXPENDITURES: $740-780M (Utilities $490-510M / Energy Production $240-250M / Energy Management $5-10M / Midstream $5-$10M) • AVERAGE DILUTED SHARES: 110-112M
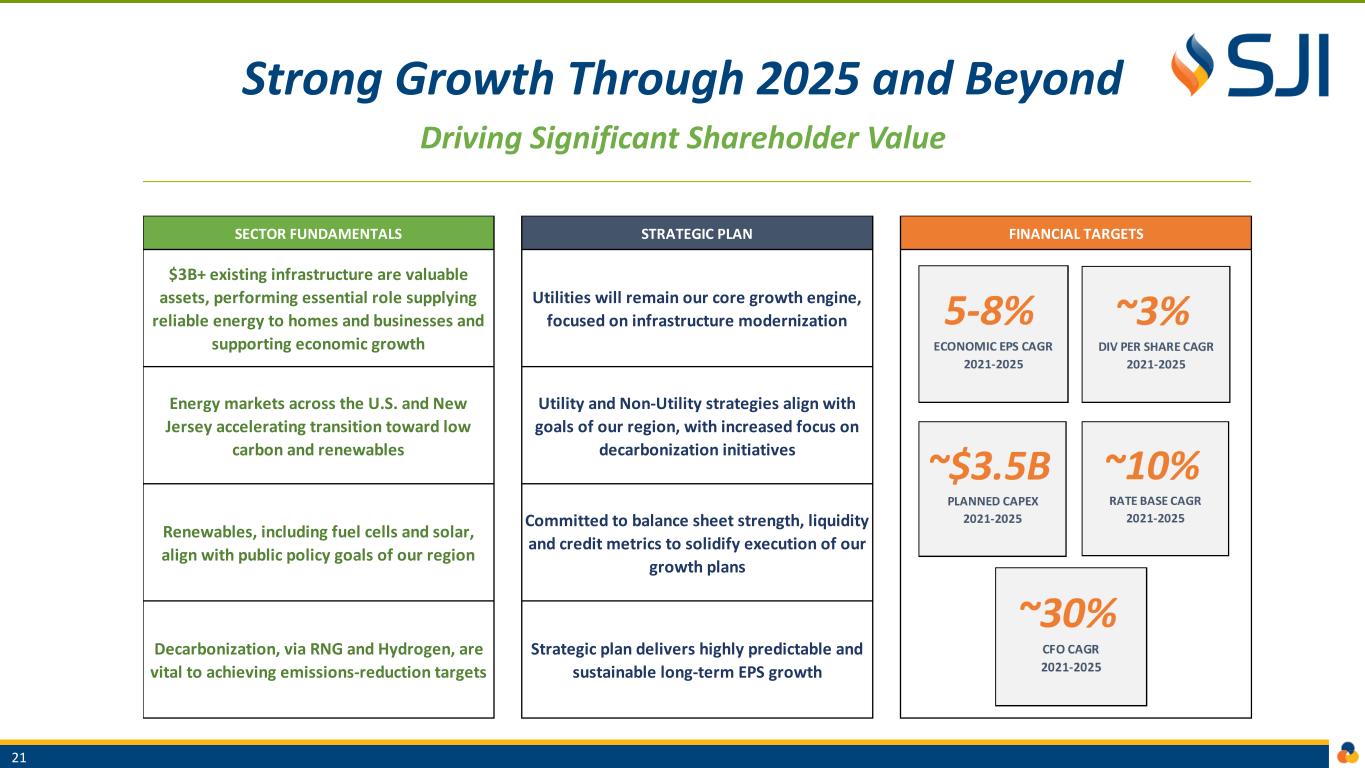
Strong Growth Through 2025 and Beyond Driving Significant Shareholder Value 21 SECTOR FUNDAMENTALS STRATEGIC PLAN FINANCIAL TARGETS $3B+ existing infrastructure are valuable assets, performing essential role supplying reliable energy to homes and businesses and supporting economic growth Utilities will remain our core growth engine, focused on infrastructure modernization Energy markets across the U.S. and New Jersey accelerating transition toward low carbon and renewables Utility and Non-Utility strategies align with goals of our region, with increased focus on decarbonization initiatives Renewables, including fuel cells and solar, align with public policy goals of our region Committed to balance sheet strength, liquidity and credit metrics to solidify execution of our growth plans Decarbonization, via RNG and Hydrogen, are vital to achieving emissions-reduction targets Strategic plan delivers highly predictable and sustainable long-term EPS growth

Appendix
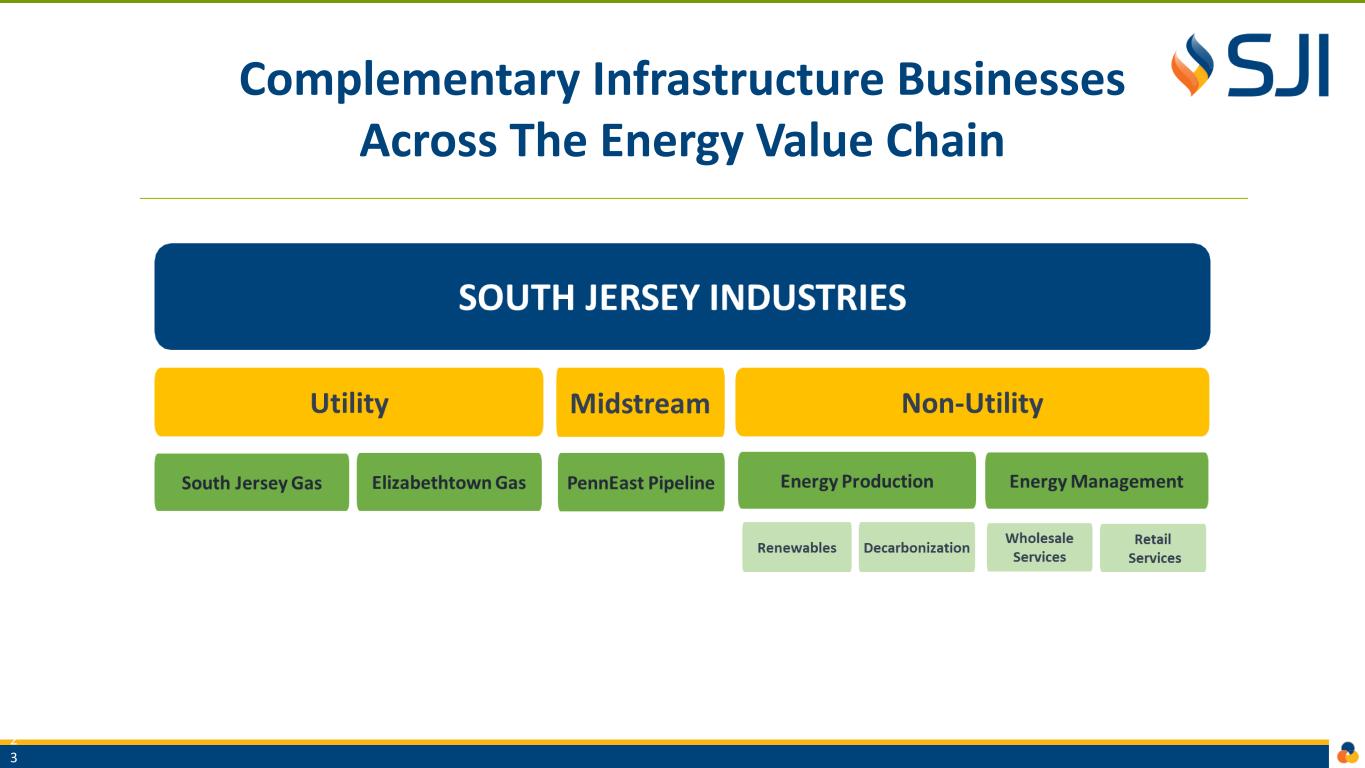
Complementary Infrastructure Businesses Across The Energy Value Chain 2 3
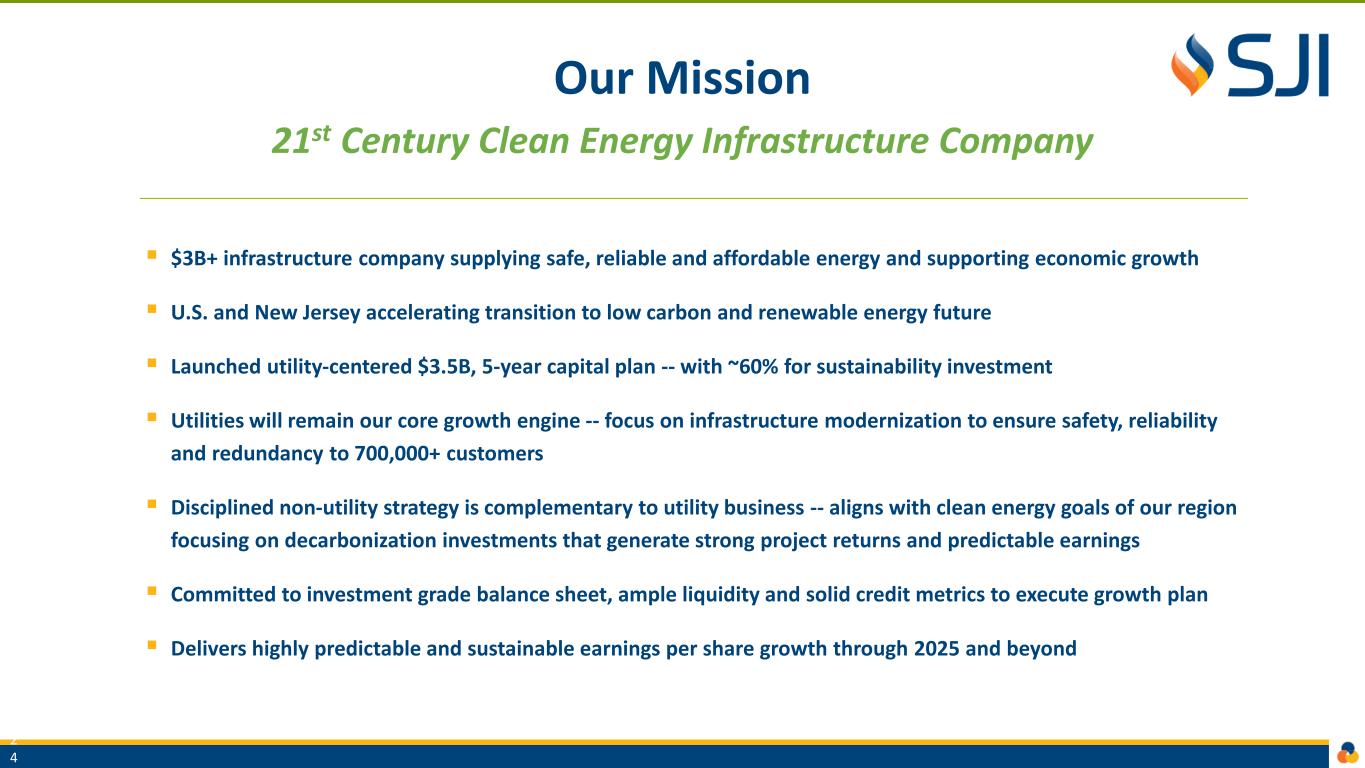
2 4 Our Mission 21st Century Clean Energy Infrastructure Company ▪ $3B+ infrastructure company supplying safe, reliable and affordable energy and supporting economic growth ▪ U.S. and New Jersey accelerating transition to low carbon and renewable energy future ▪ Launched utility-centered $3.5B, 5-year capital plan -- with ~60% for sustainability investment ▪ Utilities will remain our core growth engine -- focus on infrastructure modernization to ensure safety, reliability and redundancy to 700,000+ customers ▪ Disciplined non-utility strategy is complementary to utility business -- aligns with clean energy goals of our region focusing on decarbonization investments that generate strong project returns and predictable earnings ▪ Committed to investment grade balance sheet, ample liquidity and solid credit metrics to execute growth plan ▪ Delivers highly predictable and sustainable earnings per share growth through 2025 and beyond
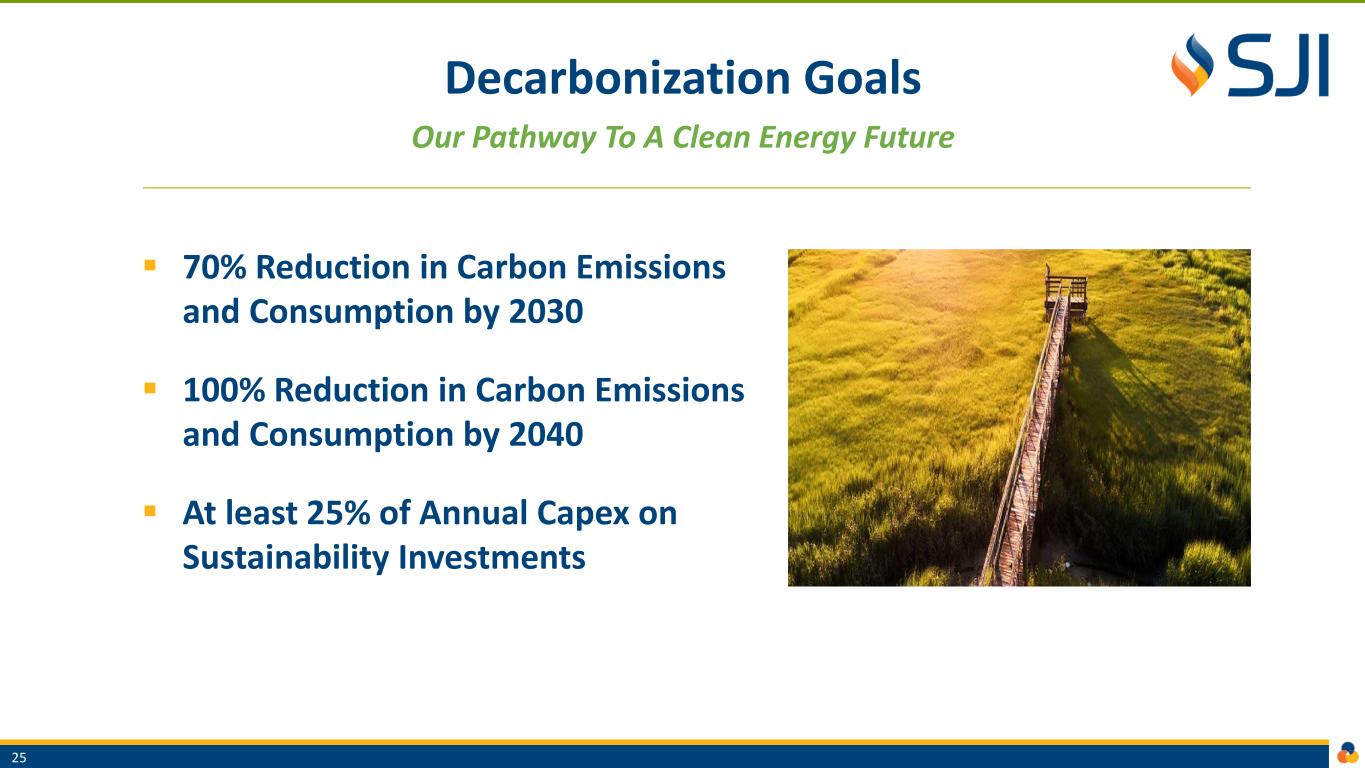
Decarbonization Goals Our Pathway To A Clean Energy Future ▪ 70% Reduction in Carbon Emissions and Consumption by 2030 ▪ 100% Reduction in Carbon Emissions and Consumption by 2040 ▪ At least 25% of Annual Capex on Sustainability Investments 25
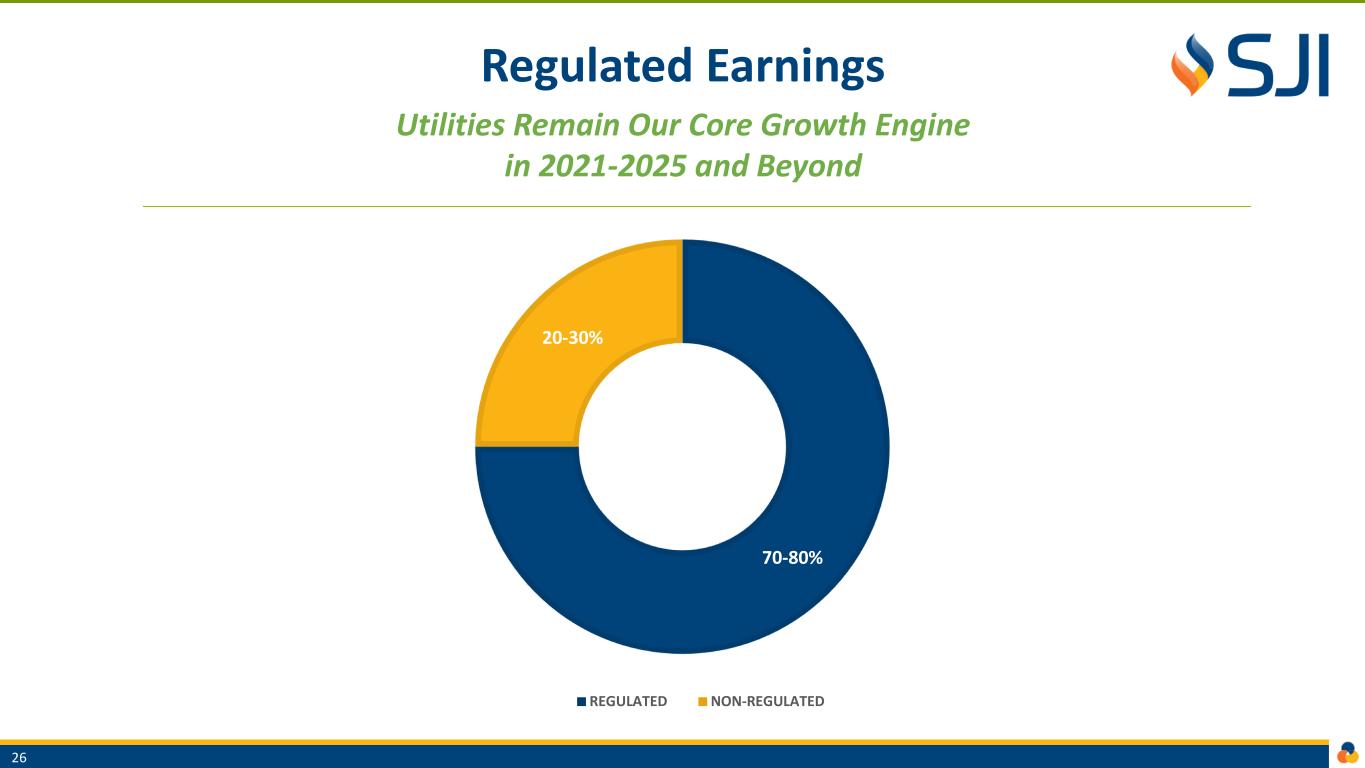
Regulated Earnings Utilities Remain Our Core Growth Engine in 2021-2025 and Beyond 26 70-80% 20-30% REGULATED NON-REGULATED
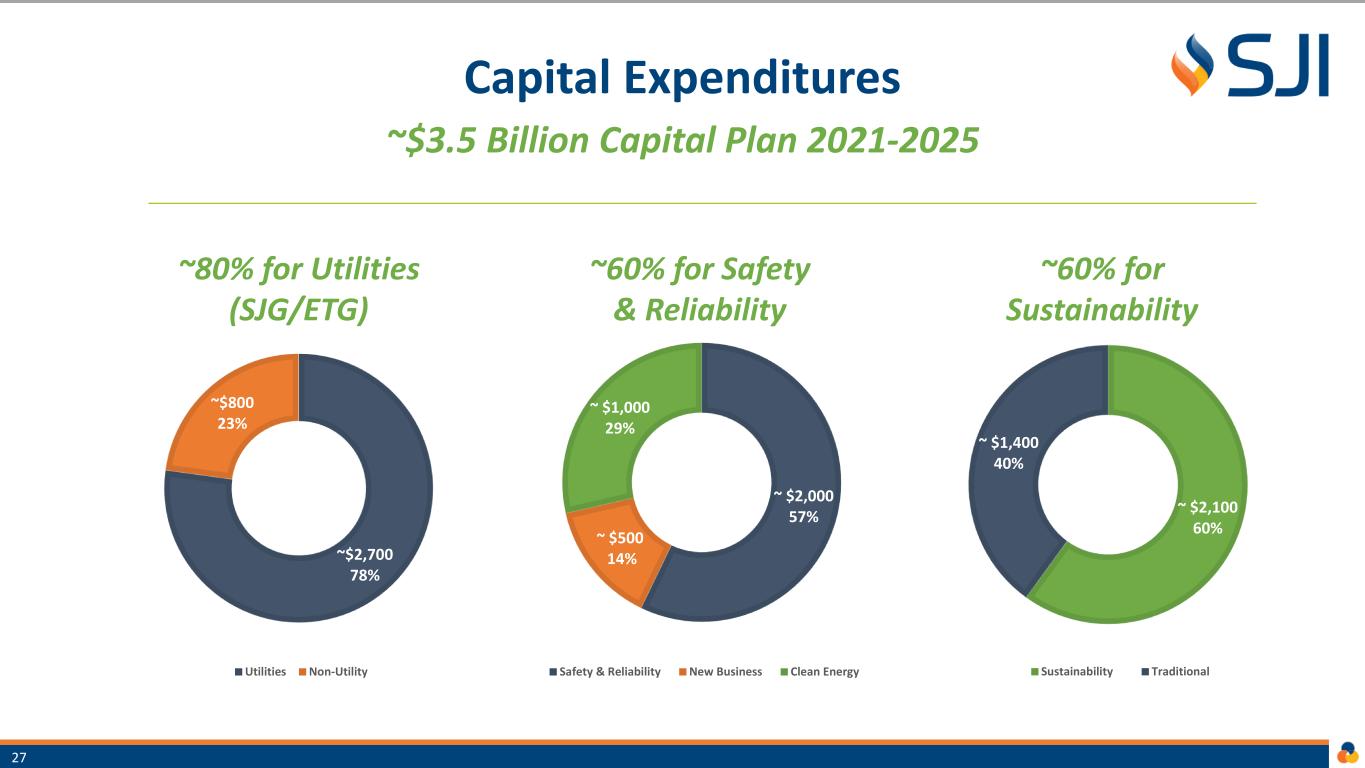
Capital Expenditures ~$3.5 Billion Capital Plan 2021-2025 ~80% for Utilities (SJG/ETG) ~60% for Safety & Reliability ~60% for Sustainability 27 ~ $2,100 60% ~ $1,400 40% Sustainability Traditional ~ $2,000 57% ~ $500 14% ~ $1,000 29% Safety & Reliability New Business Clean Energy ~$2,700 78% ~$800 23% Utilities Non-Utility
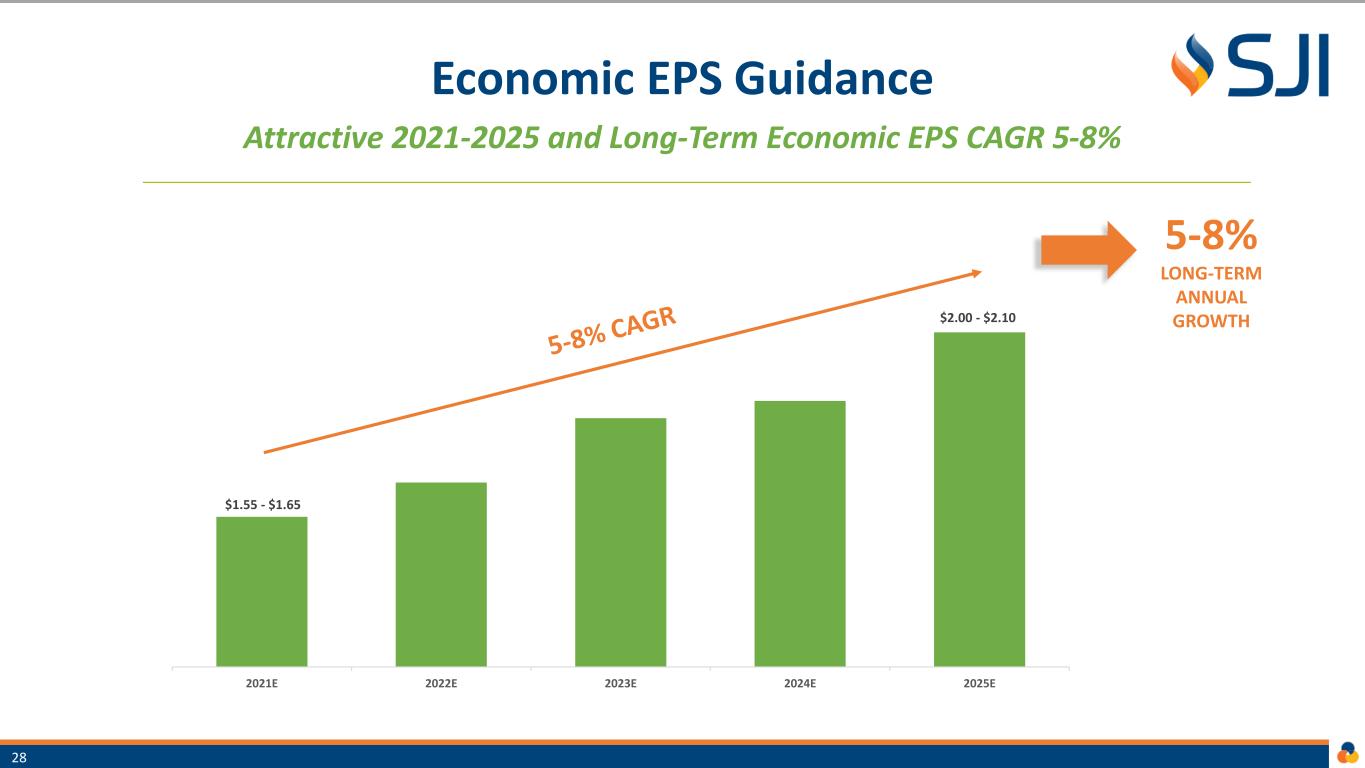
Economic EPS Guidance Attractive 2021-2025 and Long-Term Economic EPS CAGR 5-8% 5-8% LONG-TERM ANNUAL GROWTH 28 $1.55 - $1.65 $2.00 - $2.10 2021E 2022E 2023E 2024E 2025E
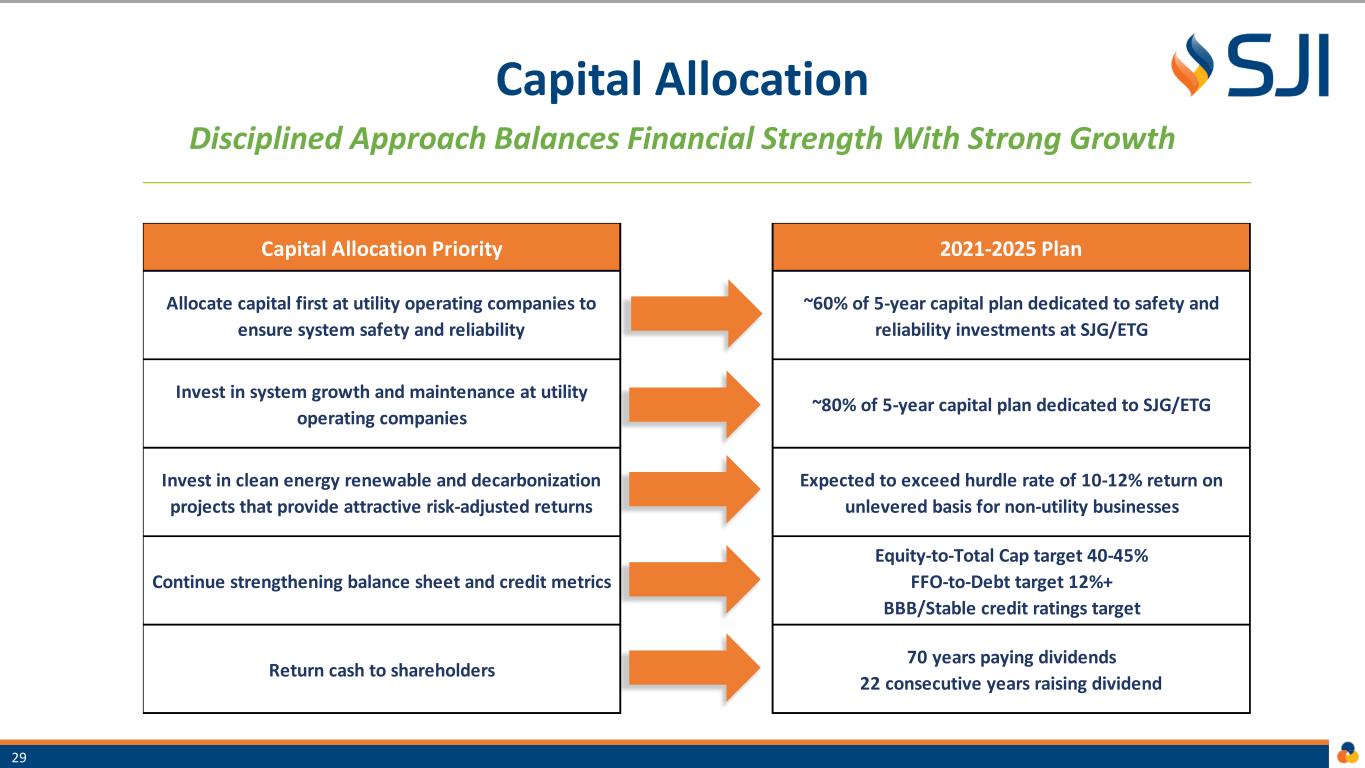
Capital Allocation Disciplined Approach Balances Financial Strength With Strong Growth 29 Capital Allocation Priority 2021-2025 Plan Allocate capital first at utility operating companies to ensure system safety and reliability ~60% of 5-year capital plan dedicated to safety and reliability investments at SJG/ETG Invest in system growth and maintenance at utility operating companies ~80% of 5-year capital plan dedicated to SJG/ETG Invest in clean energy renewable and decarbonization projects that provide attractive risk-adjusted returns Expected to exceed hurdle rate of 10-12% return on unlevered basis for non-utility businesses Continue strengthening balance sheet and credit metrics Equity-to-Total Cap target 40-45% FFO-to-Debt target 12%+ BBB/Stable credit ratings target Return cash to shareholders 70 years paying dividends 22 consecutive years raising dividend
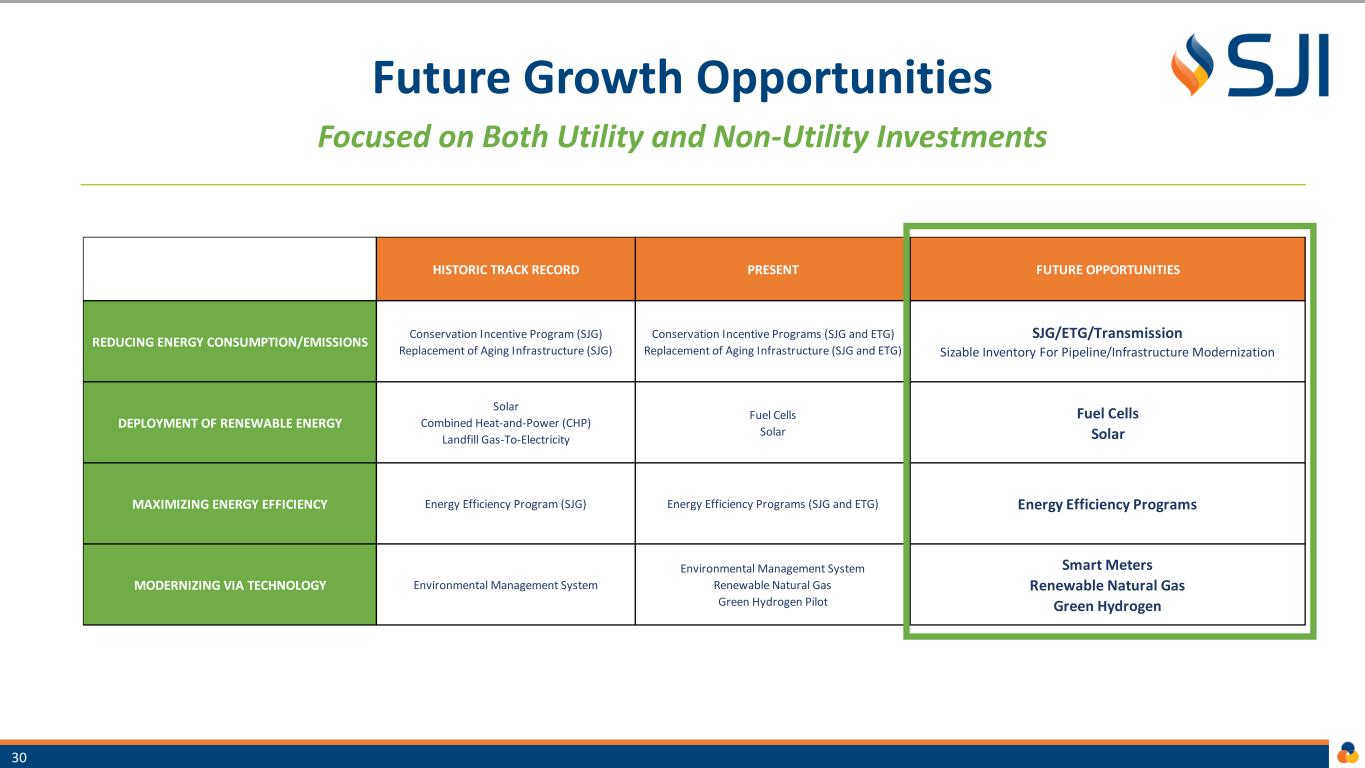
Future Growth Opportunities Focused on Both Utility and Non-Utility Investments 30 HISTORIC TRACK RECORD PRESENT FUTURE OPPORTUNITIES REDUCING ENERGY CONSUMPTION/EMISSIONS Conservation Incentive Program (SJG) Replacement of Aging Infrastructure (SJG) Conservation Incentive Programs (SJG and ETG) Replacement of Aging Infrastructure (SJG and ETG) SJG/ETG/Transmission Sizable Inventory For Pipeline/Infrastructure Modernization DEPLOYMENT OF RENEWABLE ENERGY Solar Combined Heat-and-Power (CHP) Landfill Gas-To-Electricity Fuel Cells Solar Fuel Cells Solar MAXIMIZING ENERGY EFFICIENCY Energy Efficiency Program (SJG) Energy Efficiency Programs (SJG and ETG) Energy Efficiency Programs MODERNIZING VIA TECHNOLOGY Environmental Management System Environmental Management System Renewable Natural Gas Green Hydrogen Pilot Smart Meters Renewable Natural Gas Green Hydrogen

Q&A


