UNITED STATES
SECURITIES AND EXCHANGE COMMISSION
Washington, D.C. 20549
FORM N-CSR
CERTIFIED SHAREHOLDER REPORT OF REGISTERED MANAGEMENT
INVESTMENT COMPANIES
Investment Company Act file number 811-8372
Travelers Series Fund Inc.
(Exact name of registrant as specified in charter)
| 125 Broad Street, New York, | NY 10004 | |
| (Address of principal executive offices) | (Zip code) |
Robert I. Frenkel, Esq.
Smith Barney Fund Management LLC
300 First Stamford Place
Stamford, CT 06902
(Name and address of agent for service)
Registrant’s telephone number, including area code: (800) 451-2010
Date of fiscal year end: October 31
Date of reporting period: October 31, 2004
| ITEM 1. | REPORT TO STOCKHOLDERS. |
The Annual Report to Stockholders is filed herewith.
TRAVELERS SERIES FUND INC.
SMITH BARNEY
AGGRESSIVE GROWTH PORTFOLIO
SMITH BARNEY
MID CAP CORE PORTFOLIO
ANNUAL REPORT | OCTOBER 31, 2004
NOT FDIC INSURED • NOT BANK GUARANTEED • MAY LOSE VALUE
| 1 | ||
| 4 | ||
| 7 | ||
Fund at a Glance: | ||
| 12 | ||
| 13 | ||
| 14 | ||
Fund Performance: | ||
| 16 | ||
| 18 | ||
| 20 | ||
| 29 | ||
| 30 | ||
| 31 | ||
| 33 | ||
| 35 | ||
| 42 | ||
| 43 | ||

R. JAY GERKEN, CFA
Chairman, President and Chief Executive Officer
Dear Shareholder,
Over the past 12 months, the domestic economy continued to recover from the recession of the prior three years, although a number of factors combined to slow its progress. At the start of the funds’ fiscal year in November 2003, many of the geopolitical concerns that had previously been pressuring both the economy and the stock market had begun to ease.
The initial phase of the conflict in Iraq had concluded and new federal tax legislation provided significant near-term tax cuts for consumers, businesses and investors. Key interest rates continued to hover near record lows and a wave of home mortgage refinancing freed additional cash for homeowners. Improving job growth numbers late in 2003, sustained consumer spending and positive corporate earnings news all contributed to a broad stock market rally through the end of last year. During the third calendar quarter of 2003, economic growth as measured by real gross domestic product (“GDP”)i growth reached 7.4%, a high not seen in almost two decades.
As the new year began, economic indicators grew increasingly mixed, adding to growing uncertainty for investors that helped keep the stock market trading in a limited range. GDP growth dropped to 4.2% for the fourth quarter of 2003 and has remained relatively steady. Estimated GDP growth for the third quarter of 2004 is 3.7%.ii In the spring and summer, monthly job growth figures fluctuated between net gains and losses but improved through the fall, while overall unemployment remained below the recent high of 6.3% set in June 2003.iii The U.S. Consumer Confidence Indexiv rose significantly from November of 2003 through July, but has since declined through October, reflecting consumers’ growing concern about the rate of job growth and the outlook for the economy.
Crude oil prices rose to record highs over the past year, leading to a spike in energy costs that helped curb consumer spending and acted as a brake on the domestic economy overall. After a year of four-decade-low rates, the Federal Reserve Bank (“Fed”) changed its stance from easing to tightening and raised the federal funds ratev target three times to 1.75% in September (after the close of the funds’ reporting period, on November 10, the target was raised again to 2.00%). Where the market had been concerned about the possibility of deflation at the start of the period, economic worries now center on the risks of inflation.
1 Travelers Series Fund Inc. | 2004 Annual Report
Over the past 12 months, stocks of small- and mid-capitalization companies continued to outperform large-caps in general. Value-oriented stocks handily outpaced growth-oriented stocks. International stock markets beat out the broad domestic U.S. market by a wide margin. Despite fluctuations during the year, bonds collectively generated positive total returns.
Within this environment, the funds performed as follows1:
PERFORMANCE SNAPSHOT
AS OF OCTOBER 31, 2004
| 6 Months | 12 Months | |||||
Smith Barney Aggressive Growth Portfolio | -0.49 | % | 7.09 | % | ||
Russell 3000 Growth Index | -0.57 | % | 3.54 | % | ||
Lipper Variable Multi-Cap Growth Funds Category Average | 1.9 | % | 4.78 | % | ||
Smith Barney Mid Cap Core Portfolio | 3.55 | % | 6.40 | % | ||
S&P MidCap 400 Index | 3.48 | % | 11.04 | % | ||
Lipper Variable Mid-Cap Core Funds Category Average | 4.65 | % | 11.88 | % |
The performance shown represents past performance. Past performance is no guarantee of future results and current performance may be higher or lower than the performance shown above. Principal value and investment returns will fluctuate and investors’ shares, when redeemed, may be worth more or less than their original cost.
Returns assume the reinvestment of income dividends and capital gains distributions at net asset value and the deduction of all fund expenses.
Performance figures for Smith Barney Aggressive Growth Portfolio and Smith Barney Mid Cap Core Portfolio may reflect reimbursements or fee waivers, without which the performance would have been lower.
Lipper, Inc. is a major independent mutual-fund tracking organization. Returns are based on the period ended October 31, 2004 and include the reinvestment of dividends and capital gains, if any. Returns for the multi-cap growth variable funds category average were calculated among the 104 funds for the six-month period and among the 103 funds for the 12-month period. Returns for the mid-cap core variable funds category were calculated among the 76 funds for the six-month period and among the 76 funds for the 12-month period.
| 1 | The funds are underlying investment options of various variable annuity products. A variable annuity product is a contract issued by an insurance company where the annuity premium (a set amount of dollars) is immediately turned into units of a portfolio of securities. Upon retirement, the policyholder is paid according to accumulated units whose dollar value varies according to the performance of the securities within the sub accounts. Its objective is to preserve, through investment, the purchasing value of the annuity, which otherwise is subject to erosion through inflation. The funds’ performance returns do not reflect the deduction of initial sales charges and expenses imposed in connection with investing in variable annuity contracts such as administrative fees, account charges and surrender charges, which if reflected, would reduce the performance of the funds. Past performance is no guarantee of future results. |
2 Travelers Series Fund Inc. | 2004 Annual Report
Please read on for a more detailed look at prevailing economic and market conditions during the fund’s fiscal year and to learn how those conditions have affected fund performance.
Information About Your Fund
As you may be aware several issues in the mutual fund industry have recently come under the scrutiny of federal and state regulators. The funds’ Adviser and some of its affiliates have received requests for information from various government regulators regarding market timing, late trading, fees, and other mutual fund issues in connection with various investigations. The regulators appear to be examining, among other things, the funds’ response to market timing and shareholder exchange activity, including compliance with prospectus disclosure related to these subjects. The funds have been informed that the Adviser and its affiliates are responding to those information requests, but are not in a position to predict the outcome of these requests and investigations.
In November 2003, Citigroup Asset Management (“CAM”) disclosed an investigation by the Securities and Exchange Commission (“SEC”) and the U.S. Attorney relating to CAM’s entry into the transfer agency business during 1997-1999. Citigroup has disclosed that the Staff of the SEC is considering recommending a civil injunctive action and/or an administrative proceeding against certain advisory and transfer agent entities affiliated with Citigroup, the former CEO of CAM, two former employees and a current employee of CAM, relating to the creation, operation and fees of its internal transfer agent unit that serves various CAM-managed funds. Citigroup is cooperating with the SEC and will seek to resolve this matter in discussion with the SEC Staff. Although there can be no assurance, Citigroup does not believe that this matter will have a material adverse effect on the fund.
As always, thank you for your confidence in our stewardship of your assets. We look forward to helping you continue to meet your financial goals.
Sincerely,

R. Jay Gerken, CFA
Chairman, President and Chief Executive Officer
November 17, 2004
3 Travelers Series Fund Inc. | 2004 Annual Report
Smith Barney Aggressive Growth Portfolio
Special Shareholder Notice
Effective July 1, 2004, the management fee has been revised from 0.80% of the portfolio’s average daily net assets to a fee calculated in accordance with the following breakpoint schedule:
Portfolio’s Average Daily Net Assets | Fee Rate | ||
Up to $5 billion | 0.800 | % | |
In excess of $5 billion and up to and including $7.5 billion | 0.775 | % | |
In excess of $7.5 billion and up to and including $10 billion | 0.750 | % | |
Over $10 billion | 0.700 | % | |
Market Review
At the start of the 12-month period in November of 2003, the stock market was in the middle of a strong rally that saw both stock prices and investors’ expectations rise broadly. Coming off the market bottoms set during October 2002, and again in the spring of 2003, improving economic indicators and corporate earnings news along with surprisingly strong GDP growth for the third quarter combined to produce gains in the fourth quarter of 2003 for most market sectors.
But more mixed economic data and increasing concerns about the job market dampened the rally soon after the start of the new year and the market slowed during the first quarter. Stocks were generally stuck in a limited trading range through much of the second quarter, as uncertainty over the geopolitical situation, concerns about rising interest rates and questions about the U.S. presidential race kept both businesses and many investors on the sidelines.
After supporting much of the economy through the recession and into the new year, consumers began to show signs of fatigue as the benefits of the prior year’s tax changes and the mortgage refinancing boom began to diminish. Record-high oil prices hit consumers and businesses at the gas pump, which helped drive most of the market down in the third quarter. However, after the close of the period, following the election and a break in oil prices from their recent highs, the broad market again turned upwards.
4 Travelers Series Fund Inc. | 2004 Annual Report
Performance Review
For the 12 months ended October 31, 2004, the Smith Barney Aggressive Growth Portfolio, excluding sales charges, returned 7.09%.2 The fund outperformed its unmanaged benchmark, the Russell 3000 Growth Index,vi which returned 3.54% for the same period. The fund also outperformed the Lipper multi-cap growth variable funds category average3, which was 4.78%.
Fund Overview
Both stock selection and sector allocation drove fund outperformance, led by the energy, telecommunications services and industrials sectors. Detractors from fund performance came primarily from the information technology and the consumer discretionary sectors.vii
Contributors to Performance
The top stock contributor for the period was the fund’s holding in UnitedHealth Group Inc. a leading provider of healthcare plans and services. Biogen Idec Inc., a biotechnology company focused on treatments for cancer and autoimmune and inflammatory diseases was another top contributor. Two energy sector companies — Anadarko Petroleum Corp., an oil and gas exploration, production and distribution company, and Weatherford International Ltd., a provider of equipment and services to the oil and gas production industry — enjoyed very strong returns during the period as crude oil prices reached record highs. AT&T Wireless Services Inc. in telecommunications services was another major contributor to performance, as it was acquired during the period by Cingular Wireless LLC. With the exception of AT&T Wireless, all of the contributors to performance were still held in the portfolio at the close of the period.
Detractors from Performance
Major detractors from performance during the period included biotechnology firm Chiron Corp. in healthcare, which was hurt by its highly publicized
| 2 | The fund is an underlying investment option of various variable annuity products. A variable annuity product is a contract issued by an insurance company where the annuity premium (a set amount of dollars) is immediately turned into units of a portfolio of securities. Upon retirement, the policyholder is paid according to accumulated units whose dollar value varies according to the performance of the securities within the sub accounts. Its objective is to preserve, through investment, the purchasing value of the annuity, which otherwise is subject to erosion through inflation. The fund’s performance returns do not reflect the deduction of initial sales charges and expenses imposed in connection with investing in variable annuity contracts such as administrative fees, account charges and surrender charges, which if reflected, would reduce the performance of the fund. Past performance is no guarantee of future results. |
| 3 | Lipper, Inc. is a major independent mutual-fund tracking organization. Returns are based on the 12-month period ended October 31, 2004, calculated among the 103 funds in the fund’s Lipper category, including the reinvestment of dividends and capital gains, if any. |
5 Travelers Series Fund Inc. | 2004 Annual Report
failure to deliver stocks of influenza vaccine for the U.S. Three Information Technology sector holdings — hard drive maker Maxtor Corp., SanDisk Corp., a producer of flash memory products for data storage, and semiconductor producer Micron Technology, Inc. — negatively impacted performance. Financials sector holding New York Community Bancorp Inc., which missed consensus earnings estimates and withdrew its 2005 earnings forecast late in the period, was another detractor from performance. All five detractors were still held in the portfolio at the end of October.
Portfolio Update
At the close of the period, the fund was overweight healthcare, energy, consumer discretionary and financials, underweight in information technology and industrials, and no holdings in materials. The weighted average capitalization of the portfolio was $30.4 billion, less than half of the comparable figure for benchmark index. The fund’s top ten holdings at the end of October were UnitedHealth Group, Inc., Anadarko Petroleum, Lehman Brothers Holdings Inc., Biogen Idec, Inc., Forest Laboratories Inc., Amgen Inc., Genzyme Corp., Weatherford International, Ltd., Comcast Corp. and Tyco International Ltd.viii
Thank you for your investment in the Smith Barney Aggressive Growth Portfolio. As ever, we appreciate that you have chosen us to manage your assets and we remain focused on achieving the fund’s investment goals.
Sincerely,

Richard A. Freeman
Vice President and Investment Officer
November 16, 2004
6 Travelers Series Fund Inc. | 2004 Annual Report
MANAGER OVERVIEW
Smith Barney Mid Cap Core Portfolio
Market Review
At the start of the 12-month period, we maintained a cautiously optimistic view on the market, as we did not anticipate another year of strong gains. We believe we have been in an environment of economic skepticism that has translated into slow jobs growth and limited capital spending. Interest rates have remained at decade-low levels, which resulted in consumer prices holding steady in spite of higher prices for oil and other raw materials.
After supporting much of the economy through the recession and into the current year, consumers began to show signs of fatigue as the benefits of tax changes and the mortgage-refinancing boom began to diminish. Stocks were generally stuck in a limited trading range through much of the period. Uncertainty over the geopolitical situation, concerns about rising interest rates, and questions about the U.S. presidential race along with the war in Iraq kept both businesses and many investors on the sidelines. Record-high oil prices hit consumers and businesses at the gas pump, which helped drive most of the market down in the third quarter. However, after the close of the period, following the election and a break in oil prices the broad market again turned upwards.
Performance Review
For the 12 months ended October 31, 2004, the Smith Barney Mid Cap Core Portfolio returned 6.40%.4 The fund underperformed its unmanaged benchmark, the S&P MidCap 400 Index,ix which returned 11.04% for the same period. It also underperformed the Lipper variable mid-cap core funds category average,5 which was 11.88%.
| 4 | The fund is an underlying investment option of various variable annuity products. A variable annuity product is a contract issued by an insurance company where the annuity premium (a set amount of dollars) is immediately turned into units of a portfolio of securities. Upon retirement, the policyholder is paid according to accumulated units whose dollar value varies according to the performance of the securities within the sub accounts. Its objective is to preserve, through investment, the purchasing value of the annuity, which otherwise is subject to erosion through inflation. The fund’s performance returns do not reflect the deduction of initial sales charges and expenses imposed in connection with investing in variable annuity contracts such as administrative fees, account charges and surrender charges, which if reflected, would reduce the performance of the fund. Past performance is no guarantee of future results. |
| 5 | Lipper, Inc. is a major independent mutual-fund tracking organization. Returns are based on the 12-month period ended October 31, 2004, calculated among the 76 funds in the fund’s Lipper category, including the reinvestment of dividends and capital gains, if any. |
7 Travelers Series Fund Inc. | 2004 Annual Report
Fund Overview
Our investment style has made it difficult to compete with the S&P MidCap 400 Index over the past few years. First, our market capitalization orientation has hurt us. While we are extraordinarily style pure in our market capitalization, almost 20% of the stocks in the benchmark Index have a market capitalization below $1 billion. These stocks do not meet our definition of mid-capitalization. We have also been through one of the most value-oriented markets in history, with the S&P 400 MidCap Barra Value Indexx outperforming the S&P MidCap Barra Growth Indexxi by more than 50% over the last five years. Our growth orientation has therefore impacted us negatively relative to the core benchmark. Benchmarks are one way to evaluate performance, however, we think the S&P MidCap 400 Index benchmark does not tell the complete story. The correlation between our fund and the S&P 400 MidCap Barra Growth Index over the past 5 years is almost uncanny. We track almost perfectly versus that Index over the past 5 years, and we may consider using that benchmark in the future.
Contributors to Performance
The top stock contributor for the period was the fund’s holding in Sierra Health Services Inc., a diversified healthcare services company that operates health maintenance organizations. It reported strong organic enrollment growth during the period, with solid underwriting margins and a dominant market share in Las Vegas. We believe Sierra is well positioned to deliver strong earnings in the coming year. Boyd Gaming Corp., an owner and operator of casinos in Las Vegas and other U.S. locations reported strong operating results during the period. We expect continued positive performance over the next few years from their existing casinos and from new development projects currently in progress. In the technology sector PalmOne contributed to performance, as it was able to work through its integration issues after the merger with Handspring. We locked in profits after strong performance believing that most of the good news was already priced into the stock. Logistics company and freight carrier C.H. Robinson Worldwide Inc. in the industrial sector was another major contributor. It continues to benefit from volume increases across all modes of service, tight carrier capacity and productivity, and operating efficiencies. We believe industry capacity constraints will remain and along with economic growth should help them achieve positive results for 2005.xii
Detractors from Performance
Major detractors from performance during the period included Christopher and Banks Corp., a retailer of women’s apparel in consumer discretionary. We sold our position in Christopher & Banks after it lowered earnings guidance due
8 Travelers Series Fund Inc. | 2004 Annual Report
to a sluggish retail environment, which was a result of adverse weather conditions in the company’s major markets and a poor merchandise assortment. We also believed it was faced with a tough competitive environment from Kohl’s Corporation.xii
Other stocks that underperformed during the period include drug developer NPS Pharmaceuticals Inc. in healthcare, Marvel Enterprises Inc., the toy and comic book giant in the consumer sector and Electronics for Imaging in the information technology sector. Regarding Marvel, we believe the stock is undervalued and is well poised for the future. With no debt, strong cash flow and concerns regarding 2005 movie release schedule fading, we believe the stock can trade at a multiple closer to its peers. With respect to NPS Pharmaceutical, we believe concerns regarding their PREOS drug for osteoporosis have caused a negative overreaction in the company’s stock price. We believe that the stock is undervalued based on the company’s royalty stream for its kidney-regulating drug Sensipar, along with even modest assumptions for PREOS and its remaining drug pipeline. Electronics for Imaging reported weaker-than-expected results during the period, mainly as a result of a shift of end-user demand to a lower-speed low-end copier, a segment in which they have a lower market share. There were also a number of delayed product launches from some of its original equipment manufacturer customers. We believe management has undertaken a number of initiatives in the short term that should help improve earnings until the market for premium products gets better. We also believe that it possesses a solid balance sheet and is free-cash-flow positive, perhaps enabling the company to improve returns through share buybacks and/or acquisitions.xii
Portfolio Update
At the end of October, the fund was overweight healthcare, industrials, and technology, and underweight financials, consumer discretionary, consumer staples and utilities. The weighted average capitalization of the portfolio was $4.8 billion.xii
Thank you for your investment in the Smith Barney Mid Cap Core Portfolio. As ever, we appreciate that you have chosen us to manage your assets and we remain focused on achieving the fund’s investment goals.
Sincerely,

Lawrence Weissman, CFA
Vice President and Investment Officer
November 18, 2004
Lawrence Weissman, an officer of Smith Barney Fund Management LLC, is the sole portfolio manager of the Smith Barney Mid Cap Core Portfolio and has been solely responsible for the day-to-day management of the fund since its inception in 1999.
9 Travelers Series Fund Inc. | 2004 Annual Report
The information provided is not intended to be a forecast of future events, a guarantee of future results or investment advice. Views expressed may differ from those of the firm as a whole.
RISKS:
Smith Barney Aggressive Growth Portfolio: The fund may invest a significant portion of its assets in small- and mid-cap companies which may be more volatile than an investment that focuses only on large-cap companies.
Smith Barney Mid Cap Core Portfolio: Mid-cap stocks may be more volatile than large-cap stocks. Additionally, the fund’s performance may be influenced by political, social and economic factors affecting investments in companies in foreign countries. The fund may use derivatives, such as options and futures, which can be illiquid, may disproportionately increase losses, and have a potentially large impact on fund performance.
All index performance reflects no deduction for fees, expenses or taxes. Please note that an investor cannot invest directly in an index.
| i | Gross domestic product is a market value of goods and services produced by labor and property in a given country. |
| ii | Source: Bureau of Economic Analysis, U.S. Department of Commerce, October 29, 2004. |
| iii | Source: Bureau of Labor Statistics, U.S. Department of Labor, November 5, 2004. |
| iv | Source: Consumer Confidence Index, The Conference Board, October 26, 2004. |
| v | The federal funds rate is the interest rate that banks with excess reserves at a Federal Reserve district bank charge other banks that need overnight loans. |
| vi | The Russell 3000 Growth Index measures the performance of those Russell 3000 Index companies with higher price-to-book ratios and higher forecasted growth values. |
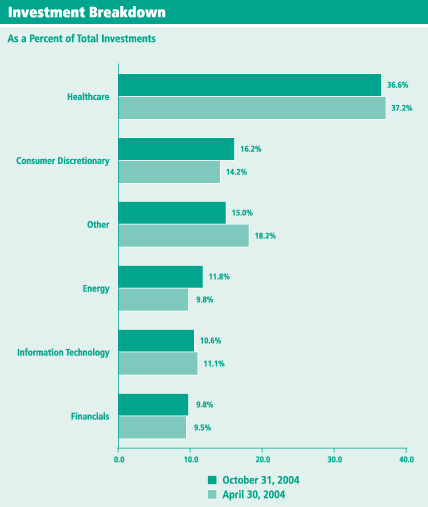
| vii | The mention of sector breakdowns is for informational purposes only and should not be construed as a recommendation to purchase or sell any securities. The information provided regarding such sectors is not a sufficient basis upon which to make an investment decision. Investors seeking financial advice regarding the appropriateness of investing in any securities or investment strategies discussed should consult their financial professional. Portfolio holdings are subject to change at any time and may not be representative of the fund’s current or future investments. The fund’s top five sector holdings as of October 31, 2004 were: Healthcare (36.7%); Consumer Discretionary (16.2%); Energy (11.8%); Information Technology (10.6%); Financials (9.9%). The fund’s portfolio composition is subject to change at any time. |
| viii | Portfolio holdings and breakdowns are as of October 31, 2004 and are subject to change and may not be representative of the fund’s current or future investments. The fund’s top ten holdings as of this date were: UnitedHealth Group Inc. (6.6%), Anadarko Petroleum Corp. (5.8%), Lehman Brothers Holdings Inc. (5.5%), Biogen Idec Inc. (4.8%), Forest Laboratories Inc. (4.7%), Amgen Inc. (4.4%), Genzyme Corp. (4.4%), Weatherford International Ltd. (4.2%), Comcast Corp., Special Class A Shares (4.1%), Tyco International Ltd. (3.4%). Please refer to pages 20 through 23 for a list and percentage breakdown of the fund’s holdings. |
| ix | The S&P MidCap 400 Index is a market-value weighted index which consists of 400 domestic stocks chosen for market size, liquidity, and industry group representation. |
| x | The S&P 400 MidCap Barra Value Index is a market-capitalization weighted index of stocks in the S&P 400 MidCap having lower price-to-book ratios relative to the S&P 400 MidCap as a whole. (A price-to-book ratio is the price of a stock compared to the difference between a company’s assets and liabilities.) |
| xi | The S&P 400 MidCap Barra Growth Index is a market-capitalization weighted index of stocks in the S&P 400 MidCap having higher price-to-book ratios relative to the S&P 400 MidCap as a whole. |
10 Travelers Series Fund Inc. | 2004 Annual Report
| xii | Portfolio holdings and breakdowns are as of October 31, 2004 and are subject to change and may not be representative of the portfolio manager’s current or future investments. The fund’s top ten holdings as of this date were: Medicis Pharmaceutical Corp., Class A Shares (2.1%), Legg Mason, Inc. (2.0%), C.H. Robinson Worldwide, Inc. (2.0%), Quest Software, Inc. (1.9%), Murphy Oil Corp. (1.8%), Boyd Gaming Corp. (1.8%), Marvel Enterprises, Inc. (1.8%), DENTSPLY International Inc. (1.7%), Ambac Financial Group, Inc. (1.7%), Varian Medical Systems, Inc. (1.6%). Please refer to pages 24 through 28 for a list and percentage breakdown of the fund’s holdings. |
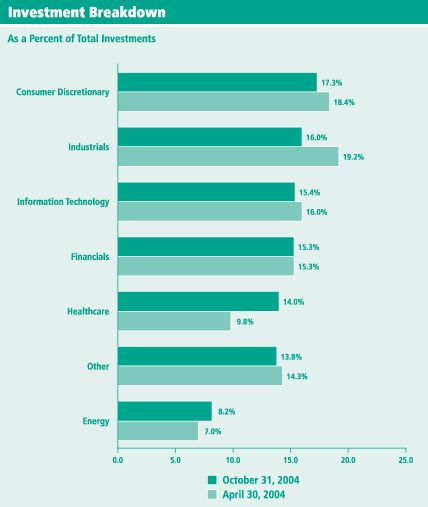
The mention of sector breakdowns is for informational purposes only and should not be construed as a recommendation to purchase or sell any securities. The information provided regarding such sectors is not a sufficient basis upon which to make an investment decision. Investors seeking financial advice regarding the appropriateness of investing in any securities or investment strategies discussed should consult their financial professional. Portfolio holdings are subject to change at any time and may not be representative of the portfolio manager’s current or future investments. The fund’s top five sector holdings as of October 31, 2004 were: Consumer Discretionary (17.2%); Industrials (15.9%); Information Technology (15.4%); Financials (15.2%); Healthcare (14.0%). The fund’s portfolio composition is subject to change at any time.
11 Travelers Series Fund Inc. | 2004 Annual Report
Smith Barney Aggressive Growth Portfolio
Fund at a Glance (unaudited)
12 Travelers Series Fund Inc. | 2004 Annual Report
Smith Barney Mid Cap Core Portfolio
Fund at a Glance (unaudited)
13 Travelers Series Fund Inc. | 2004 Annual Report
As a shareholder of the Fund, you may incur two types of costs: (1) transaction costs, including front-end and back-end sales charges (loads) on purchase payments, reinvested dividends, or other distributions; and (2) ongoing costs, including management fees; distribution and/or service (12b-1) fees; and other Fund expenses. This example is intended to help you understand your ongoing costs (in dollars) of investing in the Fund and to compare these costs with the ongoing costs of investing in other mutual funds.
This example is based on an investment of $1,000 invested on May 1, 2004 and held for the six months ended October 31, 2004.
Actual Expenses
The table below titled “Based on Actual Total Return” provides information about actual account values and actual expenses. You may use the information provided in this table, together with the amount you invested, to estimate the expenses that you paid over the period. To estimate the expenses you paid on your account, divide your ending account value by $1,000 (for example, an $8,600 ending account value divided by $1,000 = 8.6), then multiply the result by the number under the heading entitled “Expenses Paid During the Period”.
Based on Actual Total Return(1)
Actual Total Return Without Sales Charges(2) | Beginning Account Value | Ending Account Value | Annualized Expense Ratio | Expenses Paid During the Period(3) | |||||||||||
Smith Barney Aggressive Growth Portfolio | (0.49 | )% | $ | 1,000.00 | $ | 995.10 | 0.82 | % | $ | 4.11 | |||||
Smith Barney Mid Cap | 3.55 | 1,000.00 | 1,035.50 | 0.83 | 4.25 | ||||||||||
| (1) | For the six months ended October 31, 2004. |
| (2) | Assumes reinvestment of dividends and capital gains distributions, if any, at net asset value. Total return is not annualized, as it may not be representative of the total return for the year. Total returns do not reflect expenses associated with the separate account such as administrative fees, account charges and surrender charges, which, if reflected, would reduce the total returns. Performance figures may reflect fee waivers and/or expense reimbursements. Past performance is no guarantee of future results. In the absence of fee waivers and/or expense reimbursements, the total return would have been lower. |
| (3) | Expenses (net of voluntary waiver) are equal to each Fund’s respective annualized expense ratio multiplied by the average account value over the period, multiplied by the number of days in the most recent fiscal half-year, then divided by 366. |
14 Travelers Series Fund Inc. | 2004 Annual Report
Fund Expenses (unaudited) (continued)
Hypothetical Example for Comparison Purposes
The table below titled “Based on Hypothetical Total Return” provides information about hypothetical account values and hypothetical expenses based on the actual expense ratio and an assumed rate of return of 5.00% per year before expenses, which is not the Fund’s actual return. The hypothetical account values and expenses may not be used to estimate the actual ending account balance or expenses you paid for the period. You may use the information provided in this table to compare the ongoing costs of investing in the Fund and other funds. To do so, compare the 5.00% hypothetical example relating to the Fund with the 5.00% hypothetical examples that appear in the shareholder reports of the other funds.
Please note that the expenses shown in the table below are meant to highlight your ongoing costs only and do not reflect any transactional costs. Therefore, the table is useful in comparing ongoing costs only, and will not help you determine the relative total costs of owning different funds. In addition, if these transaction costs were included, your costs would have been higher.
Based on Hypothetical Total Return(1)
Hypothetical Annualized Total Return | Beginning Account Value | Ending Account Value | Annualized Expense Ratio | Expenses Paid During the Period(2) | |||||||||||
Smith Barney Aggressive | 5.00 | % | $ | 1,000.00 | $ | 1,021.01 | 0.82 | % | $ | 4.17 | |||||
Smith Barney Mid Cap | 5.00 | 1,000.00 | 1,020.96 | 0.83 | 4.22 | ||||||||||
| (1) | For the six months ended October 31, 2004. |
| (2) | Expenses (net of voluntary waiver) are equal to each Fund’s respective annualized expense ratio multiplied by the average account value over the period, multiplied by the number of days in the most recent fiscal half-year, then divided by 366. |
15 Travelers Series Fund Inc. | 2004 Annual Report
Smith Barney Aggressive Growth Portfolio
Average Annual Total Returns† (unaudited)
Twelve Months Ended 10/31/04 | 7.09 | % | |
11/1/99* through 10/31/04 | 4.14 | ||
Cumulative Total Return† (unaudited)
11/1/99* through 10/31/04 | 22.49 | % | |
| † | Assumes reinvestment of dividends and capital gains distributions, if any, at net asset value. All figures represent past performance and are not a guarantee of future results. Investment return and principal value of an investment will fluctuate so that an investor’s shares, when redeemed, may be worth more or less that their original cost. Total returns do not reflect expenses associated with the separate account such as administrative fees, account charges and surrender charges, which, if reflected, would reduce the total returns. Performance figures may reflect fee waivers and/or expense reimbursements. In the absence of fee waivers and/or expense reimbursements, the total return would have been lower. |
| * | Commencement of operations. |
16 Travelers Series Fund Inc. | 2004 Annual Report
Historical Performance (unaudited)
Value of $10,000 Invested in Shares of the
Smith Barney Aggressive Growth Portfolio vs.
Russell 3000 Growth Index†
November 1999 — October 2004
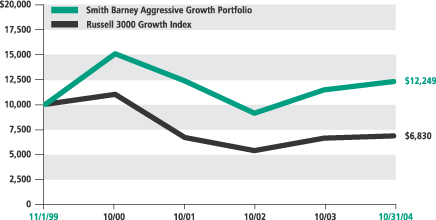
| † | Hypothetical illustration of $10,000 invested in shares of the Smith Barney Aggressive Growth Portfolio on November 1, 1999 (commencement of operations), assuming reinvestment of dividends and capital gains, if any, at net asset value through October 31, 2004. The Russell 3000 Growth Index measures the performance of those Russell 3000 Index companies with higher price-to-book ratios and higher forecasted growth values. The Index is unmanaged and is not subject to the same management and trading expenses as a mutual fund. Please note that an investor cannot invest directly in an index. |
All figures represent past performance and are not a guarantee of future results. Investment return and principal value of an investment will fluctuate so that an investor’s shares, when redeemed, may be worth more or less than their original cost. The returns shown also do not reflect the deduction of taxes that a shareholder would pay on fund distributions or the redemption of fund shares. Performance figures may reflect fee waivers and/or expense reimbursements. In the absence of fee waivers and/or expense reimbursements, the total return would have been lower.
17 Travelers Series Fund Inc. | 2004 Annual Report
Smith Barney Mid Cap Core Portfolio
Average Annual Total Returns† (unaudited)
Twelve Months Ended 10/31/04 | 6.40 | % | |
11/1/99* through 10/31/04 | 5.74 | ||
Cumulative Total Return† (unaudited)
11/1/99* through 10/31/04 | 32.16 | % | |
| † | Assumes reinvestment of dividends and capital gains distributions, if any, at net asset value. Total return is not annualized, as it may not be representative of the total return for the year. Total returns do not reflect expenses associated with the separate account such as administrative fees, account charges and surrender charges, which, if reflected, would reduce the total returns. Performance figures may reflect fee waivers and/or expense reimbursements. Past performance is no guarantee of future results. In the absence of fee waivers and/or expense reimbursements, the total return would have been lower. |
| * | Commencement of operations. |
18 Travelers Series Fund Inc. | 2004 Annual Report
Historical Performance (unaudited)
Value of $10,000 Invested in Shares of the
Smith Barney Mid Cap Core Portfolio vs.
the S&P MidCap 400 Index†
November 1999 — October 2004
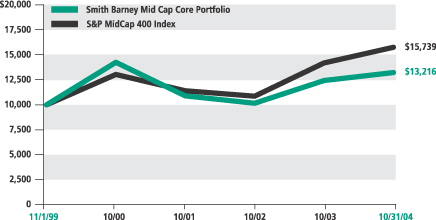
| † | Hypothetical illustration of $10,000 invested in shares of the Smith Barney Mid Cap Core Portfolio on November 1, 1999 (commencement of operations), assuming reinvestment of dividends and capital gains, if any, at net asset value through October 31, 2004. The S&P MidCap 400 Index is a widely recognized index of 400 medium-capitalization stocks. Figures for the S&P MidCap 400 Index include reinvestment of dividends. The Index is unmanaged and is not subject to the same management and trading expenses as a mutual fund. Please note that an investor cannot invest directly in an index. |
All figures represent past performance and are not a guarantee of future results. Investment return and principal value of an investment will fluctuate so that an investor’s shares, when redeemed, may be worth more or less than their original cost. The returns shown also do not reflect the deduction of taxes that a shareholder would pay on fund distributions or the redemption of fund shares. Performance figures may reflect fee waivers and/or expense reimbursements. In the absence of fee waivers and/or expense reimbursements, the total return would have been lower.
19 Travelers Series Fund Inc. | 2004 Annual Report
| Schedules of Investments | October 31, 2004 |
SMITH BARNEY AGGRESSIVE GROWTH PORTFOLIO
| SHARES | SECURITY | VALUE | |||
| COMMON STOCK — 93.9% | |||||
| CONSUMER DISCRETIONARY — 16.2% | |||||
| Media — 16.0% | |||||
| 1,243,275 | Cablevision Systems Corp., NY Group, Class A Shares† | $ | 25,586,599 | ||
| 132,842 | Comcast Corp., Class A Shares† | 3,918,839 | |||
| 1,308,160 | Comcast Corp., Special Class A Shares† | 37,988,966 | |||
| 2,215 | DreamWorks Animation SKG, Inc., Class A Shares† | 86,496 | |||
| 1,983,400 | Liberty Media Corp., Class A Shares† | 17,691,928 | |||
| 90,170 | Liberty Media International, Inc., Class A Shares† | 3,250,629 | |||
| 1,779,367 | Time Warner Inc.† | 29,608,667 | |||
| 332,699 | Viacom Inc., Class B Shares | 12,140,187 | |||
| 655,000 | The Walt Disney Co. | 16,519,100 | |||
| 34,600 | World Wrestling Entertainment, Inc. | 429,040 | |||
| 147,220,451 | |||||
| Specialty Retail — 0.2% | |||||
| 215,000 | Charming Shoppes, Inc.† | 1,640,450 | |||
| TOTAL CONSUMER DISCRETIONARY | 148,860,901 | ||||
| ENERGY — 11.8% | |||||
| Energy Equipment & Services — 6.0% | |||||
| 165,800 | Core Laboratories N.V.† | 4,111,840 | |||
| 580,650 | Grant Prideco, Inc.† | 11,938,164 | |||
| 745,450 | Weatherford International Ltd.† | 38,957,217 | |||
| 55,007,221 | |||||
| Oil & Gas — 5.8% | |||||
| 795,800 | Anadarko Petroleum Corp. | 53,676,710 | |||
| TOTAL ENERGY | 108,683,931 | ||||
| EXCHANGE TRADED — 1.7% | |||||
| 432,000 | Nasdaq-100 Index Tracking Stock | 15,923,520 | |||
| FINANCIALS — 9.8% | |||||
| Banks — 0.8% | |||||
| 33,000 | Astoria Financial Corp. | 1,289,970 | |||
| 361,566 | New York Community Bancorp, Inc. | 6,638,352 | |||
| 7,928,322 | |||||
| Diversified Financials — 9.0% | |||||
| 83,725 | CIT Group Inc. | 3,382,490 | |||
| 117,500 | Cohen & Steers, Inc. | 1,733,125 | |||
| 7,300 | Greenhill & Co., Inc. | 164,177 | |||
| 612,842 | Lehman Brothers Holdings Inc. | 50,344,970 | |||
| 500,400 | Merrill Lynch & Co., Inc. | 26,991,576 | |||
| 2,415 | National Financial Partners Corp. | 74,237 | |||
| 82,690,575 | |||||
| TOTAL FINANCIALS | 90,618,897 | ||||
See Notes to Financial Statements.
20 Travelers Series Fund Inc. | 2004 Annual Report
| Schedules of Investments (continued) | October 31, 2004 |
SMITH BARNEY AGGRESSIVE GROWTH PORTFOLIO
| SHARES | SECURITY | VALUE | |||
| HEALTHCARE — 36.7% | |||||
| Biotechnology — 21.3% | |||||
| 1,400 | Albany Molecular Research, Inc.† | $ | 12,068 | ||
| 162,500 | Alkermes, Inc.† | 2,010,125 | |||
| 720,105 | Amgen Inc.† | 40,901,964 | |||
| 763,806 | Biogen Idec Inc.† | 44,422,957 | |||
| 110,150 | CancerVax Corp.† | 941,782 | |||
| 844,850 | Chiron Corp.† | 27,390,037 | |||
| 101,900 | Genentech, Inc.† | 4,639,507 | |||
| 775,168 | Genzyme Corp.† | 40,673,065 | |||
| 476,275 | ImClone Systems Inc.† | 20,860,845 | |||
| 224,750 | Isis Pharmaceuticals, Inc.† | 1,046,211 | |||
| 766,905 | Millennium Pharmaceuticals, Inc.† | 9,954,427 | |||
| 2,300 | Nabi Biopharmaceuticals† | 31,855 | |||
| 173,000 | Nanogen, Inc.† | 688,540 | |||
| 265,400 | Vertex Pharmaceuticals Inc.† | 2,887,552 | |||
| 196,460,935 | |||||
| Healthcare Equipment & Supplies — 0.5% | |||||
| 92,100 | Biosite Inc.† | 4,495,401 | |||
| 5,400 | Cygnus, Inc.† | 551 | |||
| 4,495,952 | |||||
| Healthcare Providers & Services — 6.6% | |||||
| 836,000 | UnitedHealth Group Inc. | 60,526,400 | |||
| Pharmaceuticals — 8.3% | |||||
| 968,800 | Forest Laboratories, Inc.† | 43,208,480 | |||
| 243,448 | Johnson & Johnson | 14,212,494 | |||
| 635,666 | King Pharmaceuticals, Inc.† | 6,935,116 | |||
| 73,289 | Pfizer Inc. | 2,121,717 | |||
| 78,576 | Teva Pharmaceutical Industries Ltd., Sponsored ADR | 2,042,976 | |||
| 323,000 | Valeant Pharmaceuticals International | 7,752,000 | |||
| 76,272,783 | |||||
| TOTAL HEALTHCARE | 337,756,070 | ||||
| INDUSTRIALS — 6.9% | |||||
| Aerospace & Defense — 2.7% | |||||
| 368,800 | L-3 Communications Holdings, Inc. | 24,314,984 | |||
| Commercial Services & Supplies — 0.0% | |||||
| 2,995 | Cogent Inc.† | 57,306 | |||
| Industrial Conglomerates — 3.4% | |||||
| 1,013,412 | Tyco International Ltd. | 31,567,784 | |||
| Machinery — 0.8% | |||||
| 298,000 | Pall Corp. | 7,706,280 | |||
| TOTAL INDUSTRIALS | 63,646,354 | ||||
See Notes to Financial Statements.
21 Travelers Series Fund Inc. | 2004 Annual Report
| Schedules of Investments (continued) | October 31, 2004 |
SMITH BARNEY AGGRESSIVE GROWTH PORTFOLIO
| SHARES | SECURITY | VALUE | |||
| INFORMATION TECHNOLOGY — 10.6% | |||||
| Communications Equipment — 2.9% | |||||
| 186,100 | C-COR Inc.† | $ | 1,399,472 | ||
| 25,000 | CEVA, Inc.† | 188,500 | |||
| 133,000 | DSP Group, Inc.† | 2,637,390 | |||
| 890,500 | Motorola, Inc. | 15,370,030 | |||
| 448,325 | Nokia Oyj, Sponsored ADR | 6,913,172 | |||
| 26,508,564 | |||||
| Computers & Peripherals — 1.1% | |||||
| 876,076 | Maxtor Corp.† | 2,593,185 | |||
| 242,000 | Quantum Corp.† | 648,560 | |||
| 325,000 | SanDisk Corp.† | 6,782,750 | |||
| 10,024,495 | |||||
| Electronic Equipment & Instruments — 0.0% | |||||
| 12,400 | Excel Technology, Inc.† | 312,728 | |||
| Semiconductor Equipment & Products — 5.1% | |||||
| 125,000 | Cabot Microelectronics Corp.† | 4,503,750 | |||
| 229,000 | Cirrus Logic, Inc.† | 1,156,450 | |||
| 133,000 | Cree, Inc.† | 4,589,830 | |||
| 348,334 | Intel Corp. | 7,753,915 | |||
| 1,617,300 | Micron Technology, Inc.† | 19,698,714 | |||
| 543,000 | RF Micro Devices, Inc.† | 3,534,930 | |||
| 10,300 | Standard Microsystems Corp.† | 226,806 | |||
| 343,091 | Teradyne, Inc.† | 5,681,587 | |||
| 47,145,982 | |||||
| Software — 1.5% | |||||
| 106,000 | Advent Software, Inc.† | 2,211,160 | |||
| 115,000 | Autodesk, Inc. | 6,066,250 | |||
| 72,264 | Microsoft Corp. | 2,022,669 | |||
| 105,000 | RSA Security Inc.† | 2,148,300 | |||
| 75,000 | Verity, Inc.† | 969,000 | |||
| 13,417,379 | |||||
| TOTAL INFORMATION TECHNOLOGY | 97,409,148 | ||||
| TELECOMMUNICATION SERVICES — 0.2% | |||||
| Diversified Telecommunication Services — 0.2% | |||||
| 82,000 | AT&T Corp. | 1,403,020 | |||
| TOTAL COMMON STOCK (Cost — $893,655,662) | 864,301,841 | ||||
See Notes to Financial Statements.
22 Travelers Series Fund Inc. | 2004 Annual Report
| Schedules of Investments (continued) | October 31, 2004 |
SMITH BARNEY AGGRESSIVE GROWTH PORTFOLIO
| FACE AMOUNT | SECURITY | VALUE | ||||
| REPURCHASE AGREEMENT — 6.3% | ||||||
| $57,486,000 | Goldman, Sachs & Co. dated 10/29/04, 1.840% due 11/1/04; Proceeds at maturity — $57,494,815; (Fully collateralized by various U.S. Government Obligations and Agencies, 0.000% to 10.625% due 12/2/04 to 4/15/29; Market value — $58,635,753) | $ | 57,486,000 | |||
| TOTAL INVESTMENTS — 100.2% (Cost — $951,141,662*) | 921,787,841 | |||||
Liabilities in Excess of Other Assets — (0.2)% | (1,449,576 | ) | ||||
| TOTAL NET ASSETS — 100.0% | $ | 920,338,265 | ||||
| † | Non-income producing security. |
| * | Aggregate cost for Federal income tax purposes is $952,466,265. |
Abbreviations used in this schedule:
ADR – American Depositary Receipt
See Notes to Financial Statements.
23 Travelers Series Fund Inc. | 2004 Annual Report
| Schedules of Investments (continued) | October 31, 2004 |
SMITH BARNEY MID CAP CORE PORTFOLIO
| SHARES | SECURITY | VALUE | |||
| COMMON STOCK — 98.3% | |||||
| CONSUMER DISCRETIONARY — 17.2% | |||||
| Hotels, Restaurants & Leisure — 3.0% | |||||
| 59,350 | Boyd Gaming Corp. | $ | 1,987,632 | ||
| 20,375 | CBRL Group, Inc. | 738,798 | |||
| 21,080 | Landry’s Restaurants, Inc. | 570,846 | |||
| 1,485 | Texas Roadhouse, Inc., Class A Shares (a) | 34,185 | |||
| 3,331,461 | |||||
| Household Durables — 1.4% | |||||
| 24,850 | D.R. Horton, Inc. | 745,500 | |||
| 8,625 | The Ryland Group, Inc. | 822,739 | |||
| 1,568,239 | |||||
| Leisure Equipment & Products — 2.2% | |||||
| 127,065 | Marvel Enterprises, Inc. (a) | 1,956,801 | |||
| 29,950 | Mattel, Inc. | 524,424 | |||
| 2,481,225 | |||||
| Media — 5.4% | |||||
| 6,380 | DreamWorks Animation SKG, Inc., Class A Shares (a) | 249,139 | |||
| 31,875 | The E.W. Scripps Co., Class A Shares | 1,521,075 | |||
| 63,725 | Harte-Hanks, Inc. | 1,640,282 | |||
| 18,085 | Meredith Corp. | 886,165 | |||
| 5,100 | Pixar (a) | 410,142 | |||
| 28,050 | Sirius Satellite Radio Inc. (a) | 109,395 | |||
| 1,098 | The Washington Post Co., Class B Shares | 1,004,670 | |||
| 3,450 | XM Satellite Radio Holdings Inc., Class A Shares (a) | 111,504 | |||
| 5,932,372 | |||||
| Specialty Retail — 5.2% | |||||
| 24,405 | CDW Corp. | 1,513,842 | |||
| 5,065 | Celebrate Express, Inc. (a) | 86,054 | |||
| 50,680 | PETsMART, Inc. | 1,620,746 | |||
| 28,950 | The Sports Authority, Inc. (a) | 700,011 | |||
| 8,500 | Urban Outfitters, Inc. (a) | 348,500 | |||
| 37,450 | Williams-Sonoma, Inc. (a) | 1,429,466 | |||
| 5,698,619 | |||||
| TOTAL CONSUMER DISCRETIONARY | 19,011,916 | ||||
| CONSUMER STAPLES — 4.2% | |||||
| Food Products — 3.3% | |||||
| 34,590 | The Hain Celestial Group, Inc. (a) | 559,666 | |||
| 58,830 | Hormel Foods Corp. | 1,653,711 | |||
| 33,000 | The J. M. Smucker Co. | 1,468,500 | |||
| 3,681,877 | |||||
See Notes to Financial Statements.
24 Travelers Series Fund Inc. | 2004 Annual Report
| Schedules of Investments (continued) | October 31, 2004 |
SMITH BARNEY MID CAP CORE PORTFOLIO
| SHARES | SECURITY | VALUE | |||
| Personal Products — 0.9% | |||||
| 22,287 | Alberto-Culver Co. | $ | 999,795 | ||
| TOTAL CONSUMER STAPLES | 4,681,672 | ||||
| ENERGY — 8.2% | |||||
| Energy Equipment & Services — 4.6% | |||||
| 30,100 | GlobalSantaFe Corp. | 887,950 | |||
| 27,780 | Nabors Industries Ltd. (a) | 1,364,554 | |||
| 18,930 | Smith International, Inc. (a) | 1,099,454 | |||
| 33,275 | Weatherford International Ltd. (a) | 1,738,952 | |||
| 5,090,910 | |||||
| Oil & Gas — 3.6% | |||||
| 25,130 | Murphy Oil Corp. | 2,010,903 | |||
| 22,910 | Newfield Exploration Co. (a) | 1,333,362 | |||
| 13,000 | Nexen Inc. | 553,280 | |||
| 3,897,545 | |||||
| TOTAL ENERGY | 8,988,455 | ||||
| FINANCIALS — 15.2% | |||||
| Banks — 4.6% | |||||
| 27,825 | Banknorth Group, Inc. | 981,388 | |||
| 34,300 | Brookline Bancorp, Inc. | 531,307 | |||
| 13,615 | Comerica Inc. | 837,459 | |||
| 11,850 | Investors Financial Services Corp. | 456,106 | |||
| 25,950 | TCF Financial Corp. | 817,944 | |||
| 22,060 | Zions Bancorp. | 1,459,710 | |||
| 5,083,914 | |||||
| Diversified Financials — 4.6% | |||||
| 11,775 | The Bear Stearns Cos. Inc. | 1,115,681 | |||
| 35,287 | Legg Mason, Inc. | 2,248,135 | |||
| 37,750 | SLM Corp. | 1,708,565 | |||
| 5,072,381 | |||||
| Insurance — 6.0% | |||||
| 24,185 | Ambac Financial Group, Inc. (b) | 1,887,881 | |||
| 7,650 | Everest Re Group, Ltd. | 607,180 | |||
| 19,750 | Fidelity National Financial, Inc. | 745,365 | |||
| 17,145 | IPC Holdings, Ltd. | 693,687 | |||
| 19,060 | PartnerRe Ltd. | 1,108,339 | |||
| 44,665 | Willis Group Holdings Ltd. | 1,605,707 | |||
| 6,648,159 | |||||
| TOTAL FINANCIALS | 16,804,454 | ||||
| HEALTHCARE — 14.0% | |||||
| Biotechnology — 2.2% | |||||
| 43,005 | Gilead Sciences, Inc. (a) | 1,489,263 | |||
| 14,625 | OSI Pharmaceuticals, Inc. (a) | 950,332 | |||
| 2,439,595 | |||||
See Notes to Financial Statements.
25 Travelers Series Fund Inc. | 2004 Annual Report
| Schedules of Investments (continued) | October 31, 2004 |
SMITH BARNEY MID CAP CORE PORTFOLIO
| SHARES | SECURITY | VALUE | |||
| Healthcare Equipment & Supplies — 5.0% | |||||
| 22,625 | Cytyc Corp. (a) | $ | 590,286 | ||
| 36,640 | DENTSPLY International Inc. | 1,905,646 | |||
| 12,650 | Fisher Scientific International Inc. (a) | 725,604 | |||
| 21,150 | Kyphon Inc. (a) | 531,288 | |||
| 44,550 | Varian Medical Systems, Inc. (a) | 1,788,682 | |||
| 5,541,506 | |||||
| Healthcare Providers & Services — 3.6% | |||||
| 20,275 | Community Health Systems, Inc. (a) | 543,776 | |||
| 22,375 | Lincare Holdings Inc. (a) | 822,505 | |||
| 26,450 | Sierra Health Services, Inc. (a) | 1,262,194 | |||
| 30,900 | Universal Health Services, Inc., Class B Shares | 1,284,204 | |||
| 3,912,679 | |||||
| Pharmaceuticals — 3.2% | |||||
| 57,060 | Medicis Pharmaceutical Corp., Class A Shares | 2,320,630 | |||
| 70,845 | NPS Pharmaceuticals, Inc. (a) | 1,210,033 | |||
| 3,530,663 | |||||
| TOTAL HEALTHCARE | 15,424,443 | ||||
| INDUSTRIALS — 15.9% | |||||
| Aerospace & Defense — 2.1% | |||||
| 27,620 | Alliant Techsystems Inc. (a) | 1,587,874 | |||
| 10,925 | L-3 Communications Holdings, Inc. | 720,285 | |||
| 2,308,159 | |||||
| Building Products — 1.3% | |||||
| 38,495 | American Standard Cos. Inc. (a) | 1,407,762 | |||
| Commercial Services & Supplies — 2.7% | |||||
| 9,780 | DST Systems, Inc. (a) | 438,633 | |||
| 21,975 | Korn/Ferry International (a) | 382,365 | |||
| 21,625 | Laureate Education, Inc. (a) | 848,132 | |||
| 30,080 | Manpower Inc. | 1,361,120 | |||
| 3,030,250 | |||||
| Electrical Equipment — 0.8% | |||||
| 21,280 | Rockwell Automation, Inc. | 887,163 | |||
| Industrial Conglomerates — 1.5% | |||||
| 28,590 | Carlisle Cos. Inc. | 1,661,937 | |||
| Machinery — 3.0% | |||||
| 21,905 | Eaton Corp. | 1,400,825 | |||
| 24,730 | Navistar International Corp. (a) | 854,422 | |||
| 42,745 | Pall Corp. | 1,105,386 | |||
| 3,360,633 | |||||
See Notes to Financial Statements.
26 Travelers Series Fund Inc. | 2004 Annual Report
| Schedules of Investments (continued) | October 31, 2004 |
SMITH BARNEY MID CAP CORE PORTFOLIO
| SHARES | SECURITY | VALUE | |||
| Road & Rail — 3.3% | |||||
| 40,210 | C.H. Robinson Worldwide, Inc. | $ | 2,168,927 | ||
| 29,512 | Heartland Express, Inc. | 603,816 | |||
| 17,075 | Yellow Roadway Corp. (a) | 819,429 | |||
| 3,592,172 | |||||
| Trading Companies & Distributors — 1.2% | |||||
| 23,816 | Fastenal Co. | 1,315,358 | |||
| TOTAL INDUSTRIALS | 17,563,434 | ||||
| INFORMATION TECHNOLOGY — 15.4% | |||||
| Communications Equipment — 1.3% | |||||
| 37,800 | Avaya Inc. (a) | 544,320 | |||
| 31,725 | Juniper Networks, Inc. (a) | 844,202 | |||
| 1,388,522 | |||||
| Computers & Peripherals — 0.8% | |||||
| 50,370 | Electronics for Imaging, Inc. (a) | 908,675 | |||
| Electronic Equipment & Instruments — 2.5% | |||||
| 24,130 | Diebold, Inc. | 1,154,620 | |||
| 54,625 | Thermo Electron Corp. (a) | 1,584,125 | |||
| 2,738,745 | |||||
| Internet Software & Services — 0.1% | |||||
| 6,977 | MarketWatch, Inc. (a) | 92,480 | |||
| IT Consulting & Services — 0.7% | |||||
| 32,025 | Acxiom Corp. | 800,625 | |||
| Semiconductor Equipment & Products — 3.6% | |||||
| 51,700 | Cymer, Inc. (a) | 1,474,484 | |||
| 11,850 | Integrated Circuit Systems, Inc. (a) | 267,218 | |||
| 136,565 | Integrated Device Technology, Inc. (a) | 1,614,198 | |||
| 10,325 | Linear Technology Corp. | 391,111 | |||
| 16,200 | National Semiconductor Corp. (a) | 270,540 | |||
| 4,017,551 | |||||
| Software — 6.4% | |||||
| 9,700 | Activision, Inc. (a) | 140,456 | |||
| 43,555 | Amdocs Ltd. (a) | 1,095,408 | |||
| 41,040 | Mercury Interactive Corp. (a) | 1,782,367 | |||
| 139,775 | Quest Software, Inc. (a) | 2,050,499 | |||
| 19,600 | Synopsys, Inc. (a) | 318,304 | |||
| 76,625 | VERITAS Software Corp. (a) | 1,676,555 | |||
| 7,063,589 | |||||
| TOTAL INFORMATION TECHNOLOGY | 17,010,187 | ||||
See Notes to Financial Statements.
27 Travelers Series Fund Inc. | 2004 Annual Report
| Schedules of Investments (continued) | October 31, 2004 |
SMITH BARNEY MID CAP CORE PORTFOLIO
| SHARES | SECURITY | VALUE | |||
| MATERIALS — 5.2% | |||||
| Chemicals — 1.8% | |||||
| 27,975 | Air Products & Chemicals, Inc. | $ | 1,487,710 | ||
| 9,250 | Cytec Industries Inc. | 430,218 | |||
| 1,917,928 | |||||
| Containers & Packaging — 1.4% | |||||
| 87,810 | Smurfit-Stone Container Corp. (a) | 1,524,382 | |||
| Metals & Mining — 2.0% | |||||
| 29,820 | Compass Minerals International, Inc. | 638,745 | |||
| 36,900 | Glamis Gold Ltd. (a) | 731,727 | |||
| 14,135 | Inco Ltd. (a) | 500,379 | |||
| 17,475 | Placer Dome Inc. | 371,344 | |||
| 2,242,195 | |||||
| TOTAL MATERIALS | 5,684,505 | ||||
| UTILITIES — 3.0% | |||||
| Electric Utilities — 0.9% | |||||
| 28,935 | Wisconsin Energy Corp. | 944,439 | |||
| Gas Utilities — 1.1% | |||||
| 55,206 | Southern Union Co. (a) | 1,212,876 | |||
| Water Utilities — 1.0% | |||||
| 49,721 | Aqua America, Inc. | 1,086,901 | |||
| TOTAL UTILITIES | 3,244,216 | ||||
| TOTAL COMMON STOCK (Cost — $95,292,358) | 108,413,282 | ||||
| FACE AMOUNT | SECURITY | VALUE | |||
| REPURCHASE AGREEMENT — 1.5% | |||||
| $1,619,000 | Deutsche Bank Securities Inc. dated 10/29/04, 1.840% due 11/1/04; Proceeds at maturity — $1,619,248; (Fully collateralized by various U.S. Government Obligations and Agencies, 0.000% to 7.100% due 2/3/05 to 6/1/17; Market value — $1,651,380) (Cost — $1,619,000) | 1,619,000 | |||
| TOTAL INVESTMENTS — 99.8% (Cost — $96,911,358*) | 110,032,282 | ||||
Other Assets in Excess of Liabilities — 0.2% | 200,179 | ||||
| TOTAL NET ASSETS — 100.0% | $ | 110,232,461 | |||
| (a) | Non-income producing security. |
| (b) | This security is held at the broker as collateral for futures contracts commitments. |
| * | Aggregate cost for Federal income tax purposes is $97,154,236. |
See Notes to Financial Statements.
28 Travelers Series Fund Inc. | 2004 Annual Report
| Statements of Assets and Liabilities | October 31, 2004 |
| Smith Barney Aggressive Growth Portfolio | Smith Barney Mid Cap Core Portfolio | |||||||
| ASSETS: | ||||||||
Investments, at value (Cost — $951,141,662 and | $ | 921,787,841 | $ | 110,032,282 | ||||
Cash | 740 | 81 | ||||||
Dividends and interest receivable | 157,981 | 31,361 | ||||||
Receivable for Fund shares sold | 29,552 | 139,296 | ||||||
Receivable for securities sold | — | 1,386,029 | ||||||
Prepaid expenses | 14,147 | 2,116 | ||||||
Other receivables | 61,715 | 5,910 | ||||||
Total Assets | 922,051,976 | 111,597,075 | ||||||
| LIABILITIES: | ||||||||
Payable for Fund shares reacquired | 971,424 | 38,270 | ||||||
Management fees payable | 620,920 | 66,726 | ||||||
Payable for securities purchased | 62,020 | 1,226,039 | ||||||
Accrued expenses | 59,347 | 33,579 | ||||||
Total Liabilities | 1,713,711 | 1,364,614 | ||||||
Total Net Assets | $ | 920,338,265 | $ | 110,232,461 | ||||
| NET ASSETS: | ||||||||
Par value of capital shares ($0.00001 par value, $6,000,000,000 shares authorized) | $ | 752 | $ | 84 | ||||
Capital paid in excess of par value | 947,256,568 | 101,196,389 | ||||||
Accumulated net realized gain (loss) from investment transactions and futures contracts | 2,434,766 | (4,084,936 | ) | |||||
Net unrealized appreciation (depreciation) of investments | (29,353,821 | ) | 13,120,924 | |||||
Total Net Assets | $ | 920,338,265 | $ | 110,232,461 | ||||
Shares Outstanding | 75,176,835 | 8,391,300 | ||||||
Net Asset Value | $12.24 | $13.14 | ||||||
See Notes to Financial Statements.
29 Travelers Series Fund Inc. | 2004 Annual Report
| Statements of Operations | For the Year Ended October 31, 2004 |
| Smith Barney Aggressive Growth Portfolio | Smith Barney Mid Cap Core Portfolio | |||||||
| INVESTMENT INCOME: | ||||||||
Dividends | $ | 2,383,618 | $ | 749,064 | ||||
Interest | 722,454 | 31,735 | ||||||
Less: Foreign withholding tax | (22,780 | ) | (434) | |||||
Total Investment Income | 3,083,292 | 780,365 | ||||||
| EXPENSES: | ||||||||
Management fees (Note 2) | 6,441,853 | 758,853 | ||||||
Shareholder communications | 45,736 | 10,498 | ||||||
Custody | 39,613 | 29,281 | ||||||
Audit and legal | 31,614 | 26,300 | ||||||
Directors’ fees | 21,072 | 7,250 | ||||||
Transfer agency services (Note 2) | 4,993 | 5,004 | ||||||
Other | 9,994 | 5,635 | ||||||
Total Expenses | 6,594,875 | 842,821 | ||||||
Less: Management fee waivers (Notes 2 and 6) | (1,694 | ) | (1,694 | ) | ||||
Net Expenses | 6,593,181 | 841,127 | ||||||
Net Investment Loss | (3,509,889 | ) | (60,762 | ) | ||||
| REALIZED AND UNREALIZED GAIN ON INVESTMENTS AND FUTURES CONTRACTS (NOTES 1 AND 3): | ||||||||
Realized Gain From: | ||||||||
Investment transactions | 8,592,603 | 4,784,792 | ||||||
Futures contracts | — | 114,068 | ||||||
Net Realized Gain | 8,592,603 | 4,898,860 | ||||||
Net Increase in Unrealized Appreciation From Investments and Futures Contracts | 39,469,472 | 1,012,508 | ||||||
Net Gain on Investments and Futures Contracts | 48,062,075 | 5,911,368 | ||||||
Increase in Net Assets From Operations | $ | 44,552,186 | $ | 5,850,606 | ||||
See Notes to Financial Statements.
30 Travelers Series Fund Inc. | 2004 Annual Report
| Statements of Changes in Net Assets |
| For the Years Ended October 31, | ||||||||
| Smith Barney Aggressive Growth Portfolio | 2004 | 2003 | ||||||
| OPERATIONS: | ||||||||
Net investment loss | $ | (3,509,889 | ) | $ | (2,399,272 | ) | ||
Net realized gain (loss) | 8,592,603 | (3,239,861 | ) | |||||
Net increase in unrealized appreciation | 39,469,472 | 117,888,578 | ||||||
Increase in Net Assets From Operations | 44,552,186 | 112,249,445 | ||||||
| FUND SHARE TRANSACTIONS (NOTE 4): | ||||||||
Net proceeds from sale of shares | 270,425,936 | 113,070,096 | ||||||
Cost of shares reacquired | (18,523,736 | ) | (16,650,404 | ) | ||||
Increase in Net Assets From Fund Share Transactions | 251,902,200 | 96,419,692 | ||||||
Increase in Net Assets | 296,454,386 | 208,669,137 | ||||||
| NET ASSETS: | ||||||||
Beginning of year | 623,883,879 | 415,214,742 | ||||||
End of year | $ | 920,338,265 | $ | 623,883,879 | ||||
See Notes to Financial Statements.
31 Travelers Series Fund Inc. | 2004 Annual Report
| Statements of Changes in Net Assets (continued) |
| For the Years Ended October 31, | ||||||||
| Smith Barney Mid Cap Core Portfolio | 2004 | 2003 | ||||||
| OPERATIONS: | ||||||||
Net investment loss | $ | (60,762 | ) | $ | (17,304 | ) | ||
Net realized gain | 4,898,860 | 2,012,052 | ||||||
Net increase in unrealized appreciation | 1,012,508 | 12,637,664 | ||||||
Increase in Net Assets From Operations | 5,850,606 | 14,632,412 | ||||||
| FUND SHARE TRANSACTIONS (NOTE 4): | ||||||||
Net proceeds from sale of shares | 22,456,449 | 18,586,469 | ||||||
Cost of shares reacquired | (4,932,940 | ) | (3,004,974 | ) | ||||
Increase in Net Assets From Fund Share Transactions | 17,523,509 | 15,581,495 | ||||||
Increase in Net Assets | 23,374,115 | 30,213,907 | ||||||
| NET ASSETS: | ||||||||
Beginning of year | 86,858,346 | 56,644,439 | ||||||
End of year | $ | 110,232,461 | $ | 86,858,346 | ||||
See Notes to Financial Statements.
32 Travelers Series Fund Inc. | 2004 Annual Report
| Financial Highlights |
For a share of capital stock outstanding throughout the year ended October 31, unless otherwise noted:
| Smith Barney Aggressive Growth Portfolio | 2004 | 2003 | 2002 | 2001 | 2000(1) | |||||||||||
Net Asset Value, Beginning of Year | $11.43 | $ 9.09 | $12.32 | $15.03 | $10.00 | |||||||||||
Income (Loss) From Operations: | ||||||||||||||||
Net investment loss | (0.05 | ) | (0.04 | ) | (0.05 | ) | (0.05 | ) | (0.03 | ) | ||||||
Net realized and unrealized gain (loss) | 0.86 | 2.38 | (3.18 | ) | (2.66 | ) | 5.07 | |||||||||
Total Income (Loss) From Operations | 0.81 | 2.34 | (3.23 | ) | (2.71 | ) | 5.04 | |||||||||
Less Distributions From: | ||||||||||||||||
Capital | — | — | — | — | (0.01 | ) | ||||||||||
Total Distributions | — | — | — | — | (0.01 | ) | ||||||||||
Net Asset Value, End of Year | $12.24 | $11.43 | $ 9.09 | $12.32 | $15.03 | |||||||||||
Total Return(2) | 7.09 | % | 25.74 | % | (26.22 | )% | (18.03 | )% | 50.41 | % | ||||||
Net Assets, End of Year (000s) | $920,338 | $623,884 | $415,215 | $366,294 | $164,553 | |||||||||||
Ratios to Average Net Assets: | ||||||||||||||||
Expenses(3) | 0.82 | %(4) | 0.82 | % | 0.83 | % | 0.84 | % | 0.99 | % | ||||||
Net investment loss | (0.44 | ) | (0.49 | ) | (0.50 | ) | (0.40 | ) | (0.21 | ) | ||||||
Portfolio Turnover Rate | 4 | % | 0 | % | 9 | % | 3 | % | 0 | % | ||||||
| (1) | Per share amounts have been calculated using the monthly average shares method. |
| (2) | Performance figures may reflect fee waivers and/or expense reimbursements. Past performance is no guarantee of future results. In the absence of fee waivers and/or expense reimbursements, the total return would be lower. Total returns do not reflect expenses associated with the separate account such as administrative fees, account charges and surrender charges which, if reflected, would reduce the total returns for all periods shown. |
| (3) | As a result of a voluntary expense limitation, the expense ratio will not exceed 1.00%. |
| (4) | The manager waived a portion of its fee for the year ended October 31, 2004. The actual annualized expense ratio did not change due to these waivers. |
See Notes to Financial Statements.
33 Travelers Series Fund Inc. | 2004 Annual Report
| Financial Highlights (continued) |
For a share of capital stock outstanding throughout the year ended October 31, unless otherwise noted:
| Smith Barney Mid Cap Core Portfolio | 2004 | 2003 | 2002 | 2001 | 2000 | ||||||||||
Net Asset Value, Beginning of Year | $12.35 | $10.10 | $10.83 | $14.22 | $10.00 | ||||||||||
Income (Loss) From Operations: | |||||||||||||||
Net investment income (loss) | (0.01 | ) | (0.00 | )* | (0.02 | ) | 0.02 | 0.06 | |||||||
Net realized and unrealized gain (loss) | 0.80 | 2.25 | (0.70 | ) | (3.36 | ) | 4.17 | ||||||||
Total Income (Loss) From Operations | 0.79 | 2.25 | (0.72 | ) | (3.34 | ) | 4.23 | ||||||||
Less Distributions From: | |||||||||||||||
Net investment income | — | — | (0.01 | ) | (0.05 | ) | (0.01 | ) | |||||||
Total Distributions | — | — | (0.01 | ) | (0.05 | ) | (0.01 | ) | |||||||
Net Asset Value, End of Year | $13.14 | $12.35 | $10.10 | $10.83 | $14.22 | ||||||||||
Total Return(1) | 6.40 | % | 22.28 | % | (6.64 | )% | (23.56 | )% | 42.36 | % | |||||
Net Assets, End of Year (000s) | $110,232 | $86,858 | $56,644 | $34,376 | $17,498 | ||||||||||
Ratios to Average Net Assets: | |||||||||||||||
Expenses(2) | 0.83 | %(3) | 0.85 | % | 0.90 | % | 0.95 | %(3) | 0.95 | %(3) | |||||
Net investment income (loss) | (0.06 | ) | (0.03 | ) | (0.10 | ) | 0.25 | 0.72 | |||||||
Portfolio Turnover Rate | 92 | % | 98 | % | 79 | % | 45 | % | 61 | % | |||||
| (1) | Performance figures may reflect fee waivers and/or expense reimbursements. Past performance is no guarantee of future results. In the absence of fee waivers and/or expense reimbursements, the total return would be reduced. Total returns do not reflect expenses associated with the separate account such as administrative fees, account charges and surrender charges which, if reflected would reduce the total returns for all periods shown. |
| (2) | As a result of a voluntary expense limitation, the expense ratio will not exceed 0.95%. |
| (3) | The manager waived a portion of its fee for all years ended October 31, 2004, 2001 and 2000. If such fees were not waived, the actual expense ratios would have been 0.83%, 0.96% and 1.46%, respectively. |
| * | Amount represents less than $0.01 per share. |
See Notes to Financial Statements.
34 Travelers Series Fund Inc. | 2004 Annual Report
| 1. | Significant Accounting Policies |
The Smith Barney Aggressive Growth Portfolio (“SBAG”) and Smith Barney Mid Cap Core Portfolio (“SBMCC”) (“Fund(s)”) are separate diversified investment funds of the Travelers Series Fund Inc. (“Company”). The Company, a Maryland corporation, is registered under the Investment Company Act of 1940, as amended, as an open-end management investment company.
The following are significant accounting policies consistently followed by the Funds and are in conformity with U.S. generally accepted accounting principles (“GAAP”). The preparation of financial statements in accordance with GAAP requires management to make estimates and assumptions regarding assets, liabilities and changes in net assets resulting from operations when financial statements are prepared. Changes in the economic environment, financial markets and any other parameters used in determining these estimates could cause actual results to differ.
(a) Investment Valuation. Securities traded on national securities markets are valued at the closing price on such markets. Securities traded in the over-the-counter market and listed securities for which no sales prices were reported are valued at the mean between the bid and asked prices. Securities listed on the NASDAQ National Market System for which market quotations are available are valued at the official closing price or, if there is no official closing price on that day, at the last sale price. When market quotations or official closing prices are not readily available, or are determined not to reflect accurately fair value, such as when the value of a security has been significantly affected by events after the close of the exchange or market on which the security is principally traded (for example, a foreign exchange or market), but before the Funds calculate their net asset value, the Funds may value these investments at fair value as determined in accordance with the procedures approved by the Funds’ Board of Directors. Fair valuing of securities may be determined with the assistance of a pricing service using calculations based on indices of domestic securities and other appropriate indicators, such as prices of relevant ADRs and futures contracts. Securities maturing within 60 days are valued at amortized cost, which approximates value.
(b) Repurchase Agreements. When entering into repurchase agreements, it is the Funds’ policy that a custodian takes possession of the underlying collateral
35 Travelers Series Fund Inc. | 2004 Annual Report
Notes to Financial Statements (continued)
securities, the value of which at least equals the principal amount of the repurchase transaction, including accrued interest. To the extent that any repurchase transaction exceeds one business day, the value of the collateral is marked-to-market to ensure the adequacy of the collateral. If the seller defaults and the value of the collateral declines or if bankruptcy proceedings are commenced with respect to the seller of the security, realization of the collateral by the Funds may be delayed or limited.
(c) Investment Transactions and Investment Income. Security transactions are accounted for on trade date. Dividend income is recorded on the ex-dividend date. Foreign dividend income is recorded on the ex-dividend date or as soon as practical after the Funds determine the existence of a dividend declaration after exercising reasonable due diligence. Interest income, adjusted for amortization of premium and accretion of discount, is recorded on an accrual basis. Gains or losses on the sale of securities are calculated by using the specific identification method.
(d) Futures Contracts. SBMCC may enter into futures contracts to the extent permitted by its investment policies and objectives. Upon entering into a futures contract, the Fund is required to deposit cash or securities as initial margin. Additional securities are also segregated up to the current market value of the futures contracts. Subsequent payments, which are dependent on the daily fluctuations in the value of the underlying instrument, are made or received by the Fund each day (daily variation margin) and are recorded as unrealized gains or losses until the contracts are closed. When the contracts are closed, the Fund records a realized gain or loss equal to the difference between the proceeds from (or cost of) the closing transactions and the Fund’s basis in the contracts. The Fund enters into such contracts typically to hedge a portion of the portfolio. Risks of entering into futures contracts for hedging purposes include the possibility that a change in the value of the contract may not correlate with the changes in the value of the investments hedged. In addition, the purchase of a futures contract involves the risk that the Fund could lose more than the original margin deposit and subsequent payments required for a futures transaction.
(e) Dividends and Distributions to Shareholders. Dividends and distributions to shareholders are recorded on the ex-dividend date; the Funds
36 Travelers Series Fund Inc. | 2004 Annual Report
Notes to Financial Statements (continued)
distribute dividends and capital gains, if any, at least annually. The character of income and gains to be distributed is determined in accordance with income tax regulations which may differ from GAAP.
(f) Federal and Other Taxes. It is the Funds’ policy to comply with the federal income and excise tax requirements of the Internal Revenue Code of 1986, as amended, applicable to regulated investment companies. Accordingly, the Funds intend to distribute substantially all of their taxable income and net realized gains on investments, if any, to shareholders each year. Therefore, no federal income tax provision is required. Under the applicable foreign tax law, a withholding tax may be imposed on interest, dividends and capital gain at various rates.
(g) Reclassification. U.S. generally accepted accounting principles require that certain components of net assets be adjusted to reflect permanent differences between financial and tax reporting. Accordingly, during the current year, $3,509,889 has been reclassified between paid-in capital and accumulated net investment loss as a result of permanent differences attributable to a tax net operating loss for SBAG. Additionally, $60,762 has been reclassified between paid-in capital and accumulated net investment loss as a result of permanent differences attributable to a tax net operating loss for SBMCC. This reclassification has no effect on net assets or net asset values per share.
| 2. | Management Agreement and Transactions with Affiliated Persons |
Smith Barney Fund Management LLC (“SBFM”), an indirect wholly-owned subsidiary of Citigroup Inc. (“Citigroup”) acts as investment manager of the SBAG and SBMCC. Effective July 1, 2004, SBAG pays SBFM a management fee calculated at an annual rate of 0.800% on the first $5 billion of the Fund’s average daily net assets; 0.775% on the next $2.5 billion; 0.750% on the next $2.5 billion; 0.700% on the Fund’s average daily net assets in excess of $10 billion. SBMCC pays SBFM a management fee calculated at the annual rate of 0.75% of the average daily net assets. These fees are calculated daily and paid monthly.
For the year ended October 31, 2004, SBFM waived a portion of its management fees amounting to $1,694 and $1,694 for SBAG and SBMCC, respectively.
37 Travelers Series Fund Inc. | 2004 Annual Report
Notes to Financial Statements (continued)
Prior to July 1, 2004, SBAG paid SBFM a management fee calculated at an annual rate of 0.80% on the Fund’s average daily net assets. This fee was calculated daily and paid monthly.
Citicorp Trust Bank, fsb. (“CTB”), another subsidiary of Citigroup, acts as the Funds’ transfer agent and PFPC Inc. (“PFPC”) acts as the Funds’ sub-transfer agent. CTB receives account fees and asset-based fees that vary according to the size and type of account. PFPC is responsible for shareholder recordkeeping and financial processing for all shareholder accounts and is paid by CTB. For the year ended October 31, 2004, each Fund paid transfer agent fees of $5,000 to CTB.
For the year ended October 31, 2004, Citigroup Global Markets Inc. (“CGM”), another indirect wholly-owned subsidiary of Citigroup, received brokerage commissions totaling $26,966.
All of the officers and one Director of the Company are employees of Citigroup or its affiliates and do not receive compensation from the Funds.
| 3. | Investments |
During the year ended October 31, 2004, the aggregate cost of purchases and proceeds from sales of investments (excluding short-term investments) were as follows:
| SBAG | SBMCC | |||||
Purchases | $ | 292,413,517 | $ | 110,259,749 | ||
Sales | 33,172,300 | 90,505,525 | ||||
At October 31, 2004, the aggregate gross unrealized appreciation and depreciation of investments for Federal income tax purposes were as follows:
| SBAG | SBMCC | |||||||
Gross unrealized appreciation | $ | 121,705,653 | $ | 16,266,072 | ||||
Gross unrealized depreciation | (152,384,077 | ) | (3,388,026 | ) | ||||
Net unrealized appreciation (depreciation) | $ | (30,678,424 | ) | $ | 12,878,046 | |||
At October 31, 2004, SBMCC did not enter into any futures contracts.
| 4. | Capital Shares |
At October 31, 2004, the Company had six billion shares of capital stock authorized with a par value of $0.00001 per share. Each share of a Fund represents an equal proportionate interest in that Fund with each other share of the
38 Travelers Series Fund Inc. | 2004 Annual Report
Notes to Financial Statements (continued)
same Fund and has an equal entitlement to any dividends and distributions made by the Fund.
Transactions in shares of each Fund were as follows:
| Year Ended October 31, 2004 | Year Ended October 31, 2003 | |||||
Smith Barney Aggressive Growth Portfolio | ||||||
Shares sold | 22,127,976 | 10,654,092 | ||||
Shares reacquired | (1,514,855 | ) | (1,773,901 | ) | ||
Net Increase | 20,613,121 | 8,880,191 | ||||
Smith Barney Mid Cap Core Portfolio | ||||||
Shares sold | 1,744,843 | 1,721,743 | ||||
Shares reacquired | (384,264 | ) | (298,046 | ) | ||
Net Increase | 1,360,579 | 1,423,697 | ||||
| 5. | Income Tax Information & Distributions to Shareholders |
For the years ended October 31, 2004 and 2003, the Funds did not make any distributions.
As of October 31, 2004, the components of accumulated earnings on a tax basis were as follows:
| SBAG | SBMCC | |||||||
Undistributed long-term capital gains—net | $ | 3,759,369 | — | |||||
Capital loss carryforward | — | $ | (3,842,058 | )* | ||||
Unrealized appreciation (depreciation) | (30,678,424 | )** | 12,878,046 | ** | ||||
Total accumulated earnings (losses)—net | $ | (26,919,055 | ) | $ | 9,035,988 | |||
| * | On October 31, 2004, the SBMCC had net capital loss carryforward of approximately $3,842,058, which expires in 2010. This amount will be available to offset like amounts of any future taxable gains. |
| ** | The difference between book-basis and tax-basis unrealized appreciation is attributable primarily to the tax deferral of losses on wash sales. |
| 6. | Additional Information |
In connection with an investigation previously disclosed by Citigroup, the Staff of the Securities and Exchange Commission (“SEC”) has notified Citigroup Asset Management (“CAM”), the Citigroup business unit that includes the funds’ investment manager and other investment advisory companies; Citicorp Trust Bank (“CTB”), an affiliate of CAM; Thomas W. Jones, the former CEO
39 Travelers Series Fund Inc. | 2004 Annual Report
Notes to Financial Statements (continued)
of CAM; and three other individuals, one of whom is an employee and the other two of whom are former employees of CAM, that the SEC Staff is considering recommending a civil injunctive action and/or an administrative proceeding against each of them relating to the creation and operation of an internal transfer agent unit to serve various CAM-managed funds.
In 1999, CTB entered the transfer agent business. CTB hired an unaffiliated subcontractor to perform some of the transfer agent services. The subcontractor, in exchange, had signed a separate agreement with CAM in 1998 that guaranteed investment management revenue to CAM and investment banking revenue to a CAM affiliate. The subcontractor’s business was later taken over by PFPC Inc., and at that time the revenue guarantee was eliminated and a one-time payment was made by the subcontractor to a CAM affiliate.
CAM did not disclose the revenue guarantee when the boards of various CAM-managed funds hired CTB as transfer agent. Nor did CAM disclose to the boards of the various CAM-managed funds the one-time payment received by the CAM affiliate when it was made.
In addition, the SEC Staff has indicated that it is considering recommending action based on the adequacy of the disclosures made to the funds board that approved the transfer agency arrangement, CAM’s initiation and operation of, and compensation for, the transfer agent business and CAM’s retention of, and agreements with, the subcontractor.
Citigroup is cooperating fully in the investigation and will seek to resolve the matter in discussions with the SEC Staff. Although there can be no assurance, Citigroup does not believe that this matter will have a material adverse effect on the Funds. As previously disclosed, CAM has already agreed to pay the applicable funds, primarily through fee waivers, a total of approximately $17 million (plus interest) that is the amount of the revenue received by Citigroup relating to the revenue guarantee.
40 Travelers Series Fund Inc. | 2004 Annual Report
Notes to Financial Statements (continued)
| 7. | Legal Matters |
Beginning in June, 2004, class action lawsuits alleging violations of the federal securities laws were filed against Citigroup Global Markets Inc. (the “Distributor”) and a number of its affiliates, including Smith Barney Fund Management LLC and Salomon Brothers Asset Management Inc (the “Advisers”), substantially all of the mutual funds managed by the Advisers, including the Fund (the “Funds”), and directors or trustees of the Funds (collectively, the “Defendants”). The complaints alleged, among other things, that the Distributor created various undisclosed incentives for its brokers to sell Smith Barney and Salomon Brothers funds. In addition, according to the complaints, the Advisers caused the Funds to pay excessive brokerage commissions to the Distributor for steering clients towards proprietary funds. The complaints also alleged that the defendants breached their fiduciary duty to the Funds by improperly charging Rule 12b-1 fees and by drawing on fund assets to make undisclosed payments of soft dollars and excessive brokerage commissions. The complaints also alleged that the Funds failed to adequately disclose certain of the allegedly wrongful conduct. The complaints sought injunctive relief and compensatory and punitive damages, rescission of the Funds’ contracts with the Advisers, recovery of all fees paid to the Advisers pursuant to such contracts and an award of attorneys’ fees and litigation expenses.
On December 15, 2004, a consolidated amended complaint (the “Complaint”) was filed alleging substantially similar causes of action. While the lawsuit is in its earliest stages, to the extent that the Complaint purports to state causes of action against the Funds, Citigroup Asset Management believes the Funds have significant defenses to such allegations, which the Funds intend to vigorously assert in responding to the Complaint.
Additional lawsuits arising out of these circumstances and presenting similar allegations and requests for relief may be filed against the Defendants in the future.
As of the date of this report, Citigroup Asset Management and the Funds believe that the resolution of the pending lawsuit will not have a material effect on the financial position or results of operations of the Funds or the ability of the Advisers and their affiliates to continue to render services to the Funds under their respective contracts.
41 Travelers Series Fund Inc. | 2004 Annual Report
Report of Independent Registered Public Accounting Firm
The Shareholders and Board of Directors of Travelers Series Fund Inc.:
We have audited the accompanying statements of assets and liabilities, including the schedules of investments, of the Smith Barney Aggressive Growth and Smith Barney Mid Cap Core Portfolios (“Portfolios”) of Travelers Series Fund Inc. (“Company”) as of October 31, 2004, and the related statements of operations for the year then ended, the statements of changes in net assets for each of the years in the two-year period then ended and the financial highlights for each of the years in the five-year period then ended. These financial statements and financial highlights are the responsibility of the Company’s management. Our responsibility is to express an opinion on these financial statements and financial highlights based on our audits.
We conducted our audits in accordance with the standards of the Public Company Accounting Oversight Board (United States). Those standards require that we plan and perform the audit to obtain reasonable assurance about whether the financial statements and financial highlights are free of material misstatement. An audit includes examining, on a test basis, evidence supporting the amounts and disclosures in the financial statements. Our procedures included confirmation of securities owned as of October 31, 2004, by correspondence with the custodian and broker or by other appropriate auditing procedures where replies from brokers were not received. An audit also includes assessing the accounting principles used and significant estimates made by management, as well as evaluating the overall financial statement presentation. We believe that our audits provide a reasonable basis for our opinion.
In our opinion, the financial statements and financial highlights referred to above present fairly, in all material respects, the financial position of the Portfolios of the Company as of October 31, 2004, and the results of their operations for the year then ended, the changes in their net assets for each of the years in the two-year period then ended and the financial highlights for each of the years in the five- year period then ended, in conformity with U.S. generally accepted accounting principles.

New York, New York
December 17, 2004
42 Travelers Series Fund Inc. | 2004 Annual Report
Additional Information (unaudited)
Information about Directors and Officers
The business and affairs of the Travelers Series Fund Inc. (“Company”) are managed under the direction of the Company’s Board of Directors. Information pertaining to the Directors and Officers of the Company is set forth below.
| Name, Address, and Age | Position(s) Held with Fund | Term of Office* and Length of Time Served | Principal Occupation(s) During Past Five Years | Number of Portfolios in Fund Complex | Other Board Held by Director | |||||
| Non-Interested Directors†: | ||||||||||
Robert A. Frankel 1961 Deergrass Way Carlsbad, CA 92009 DOB: 5/20/27 | Director | Since 1999 | Managing Partner of Robert A. Frankel Managing Consultants; Former Vice President of The Readers Digest Association, Inc. | 24 | None | |||||
Michael E. Gellert 122 East 42nd Street New York, NY 10168 DOB: 6/16/31 | Director | Since 1999 | General Partner of Windcrest Partners, a venture capital firm | 17 | Director of Dalet S.A., Devon Energy Corp., High Speed Access Corp., Human, Inc., SEACOR Smit, Inc. and Six Flags, Inc. | |||||
Rainer Greeven 630 5th Avenue Suite 1960 DOB: 12/6/36 | Director | Since 1994 | Attorney, Rainer Greeven PC | 17 | Director of Continental Container Corp. | |||||
Susan M. Heilbron P.O. Box 557 Chilmark, MA 02535 DOB: 2/12/45 | Director | Since 1994 | Owner/Consultant of Lacey & Heilbron, a public relations firm | 17 | Director of National Multiple Sclerosis Society, New York City Chapter | |||||
43 Travelers Series Fund Inc. | 2004 Annual Report
Additional Information (unaudited) (continued)
| Name, Address, and Age | Position(s) Held with Fund | Term of Office* and Length of Time Served | Principal Occupation(s) During Past Five Years | Number of in Fund Complex Overseen by | Other Board Memberships Held by Director | |||||
| Interested Director: | ||||||||||
R. Jay Gerken, CFA** Citigroup Asset Management (“CAM”) 399 Park Avenue New York, NY 10022 DOB: 4/5/51 | Chairman, President and Chief Executive Officer | Since 2002 | Managing Director of Citigroup Global Markets Inc. (“CGM”) Chairman, President and Chief Executive Officer of Smith Barney Fund Management LLC (“SBFM”), Travelers Investment Adviser, Inc. (“TIA”) and Citi Fund Management Inc. (“CFM”); President and Chief Executive Officer of certain mutual funds associated with Citigroup Inc. (“Citigroup”); Formerly Portfolio Manager of Smith Barney Allocation Series Inc. (from 1996-2001) and Smith Barney Growth and Income Fund (from 1996-2000) | 221 | None | |||||
| Officers: | ||||||||||
Andrew B. Shoup CAM 125 Broad Street 10th Floor New York, NY 10004 DOB: 8/1/56 | Senior Vice President and Chief Administrative Officer | Since 2003 | Director of CAM; Senior Vice President and Chief Administrative Officer of mutual funds associated with Citigroup; Head of International Funds Administration of CAM (from 2001 to 2003); Director of Global Funds Administration of CAM (from 2000 to 2001); Head of U.S. Citibank Funds Administration of CAM (from 1998 to 2000) | N/A | N/A | |||||
James M. Giallanza CAM 125 Broad Street, 11th Floor New York, NY 10004 DOB: 3/31/66 | Chief Financial Officer and Treasurer | Since 2004 | Director of CGM; Chief Financial Officer and Treasurer of certain mutual funds associated with Citigroup; Director and Controller of the U.S. wholesale business at UBS Global Asset Management US, Inc. (from September 2001 to July 2004); Director of Global Funds Administration at CAM (from June 2000 to September 2001); Treasurer of the Lazard Funds (from June 1998 to June 2000) | N/A | N/A | |||||
44 Travelers Series Fund Inc. | 2004 Annual Report
Additional Information (unaudited) (continued)
| Name, Address, and Age | Position(s) Held with Fund | Term of Office* and Length of Time Served | Principal Occupation(s) During Past Five Years | Number of in Fund Complex Overseen by | Other Board Memberships Held by Director | |||||
Richard A. Freeman CAM 399 Park Avenue New York, NY 10022 DOB: 7/5/53 | Vice President and Investment Officer | Since 1999 | Managing Director of CGM and Investment Officer of SBFM | N/A | N/A | |||||
Lawrence B. Weissman CAM 300 First Stamford Place Stamford, CT 06902 DOB: 3/16/61 | Vice President and Investment Officer | Since 1999 | Managing Director of CGM and Investment Officer of SBFM | N/A | N/A | |||||
| Andrew Beagley CAM 399 Park Avenue, 4th Floor New York, NY 10022 DOB: 10/9/62 | Chief Anti-Money Laundering Compliance Officer
Chief Compliance Officer | Since
Since | Director of CGM (since 2000); Director of Compliance, North America, CAM (since 2000); Chief Anti-Money Laundering Compliance Officer, Chief Compliance Officer and Vice President of certain mutual funds associated with Citigroup; Director of Compliance, Europe, the Middle East and Africa, Citigroup Asset Management (from 1999 to 2000); Compliance Officer, SBFM, CFM, TIA, Salomon Brothers Asset Management Limited, Smith Barney Global Capital Management Inc., Salomon Brothers Asset Management Asia Pacific Limited (from 1997 to 1999) | N/A | N/A | |||||
45 Travelers Series Fund Inc. | 2004 Annual Report
Additional Information (unaudited) (continued)
| Name, Address, and Age | Position(s) Held with Fund | Term of Office* and Length of Time Served | Principal Occupation(s) During Past Five Years | Number of in Fund Complex Overseen by | Other Board Held by Director | |||||
Robert I. Frenkel CAM 300 First Stamford Place 4th Floor Stamford, CT 06902 DOB: 12/12/54 | Secretary and Chief Legal Officer | Since 2003 | Managing Director and General Counsel, Global Mutual Funds for CAM and its predecessor (since 1994); Secretary and Chief Legal Officer of mutual funds associated with Citigroup | N/A | N/A | |||||
| † | Abraham E. Cohen resigned as a Director of the Company, effective July 8, 2004. Mr. Cohen had served as a Director since 1996. |
| * | Each Director and officer serves until his or her successor has been duly elected and qualified. |
| ** | Mr. Gerken is an “interested person” of the Fund as defined in the Investment Company Act of 1940, as amended, because Mr. Gerken is an officer of SBFM and certain of its affiliates. |
46 Travelers Series Fund Inc. | 2004 Annual Report
TRAVELERS SERIES
FUND INC.
DIRECTORS Robert A. Frankel
OFFICERS R. Jay Gerken, CFA President and Chief
Andrew B. Shoup Senior Vice President
James M. Giallanza Chief Financial Officer and Treasurer
Richard A. Freeman Vice President and
Lawrence B. Weissman, CFA Vice President and
Andrew Beagley Chief Anti-Money Laundering Compliance Officer and Chief
Robert I. Frenkel Secretary and Chief Legal Officer | INVESTMENT MANAGER Smith Barney Fund
CUSTODIAN State Street Bank and
ANNUITY Travelers Annuity Investor Services
TRANSFER AGENT Citicorp Trust Bank, fsb.
SUB-TRANSFER AGENT PFPC Inc. |
Travelers Series Fund Inc.
Smith Barney Aggressive Growth Portfolio
Smith Barney Mid Cap Core Portfolio
The Funds are separate investment funds of the Travelers Series Fund Inc., a Maryland corporation.
The Funds file their complete schedule of portfolio holdings with Securities Exchange Commission for the first and third quarters of each fiscal year on Form N-Q. The Funds’ Forms N-Q are available on the Commission’s website at www.sec.gov. The Funds’ Forms N-Q may be reviewed and copied at the Commission’s Public Reference Room in Washington D.C., and information on the operation of the Public Reference Room may be obtained by calling 1-800-SEC-0330. To obtain information on Form N-Q from the Funds, shareholders can call 1-800-451-2010.
Information on how the funds voted proxies relating to portfolio securities during the 12 month period ended June 30, 2004 and a description of the policies and procedures that the funds use to determine how to vote proxies relating to portfolio securities is available (1) without charge, upon request, by calling 1-800-451-2010, (2) on the funds’ website at www.citigroupAM.com and (3) on the SEC’s website at www.sec.gov.
This report is submitted for the general information of the shareholders of the Travelers Series Fund Inc. — Smith Barney Aggressive Growth Portfolio and Smith Barney Mid Cap Core Portfolio.
TRAVELERS SERIES FUND INC.
125 Broad Street
10th Floor, MF-2
New York, New York 10004
IN0903 12/04 04-7562
| ITEM 2. | CODE OF ETHICS. |
The registrant has adopted a code of ethics that applies to the registrant’s principal executive officer, principal financial officer, principal accounting officer or controller.
| ITEM 3. | AUDIT COMMITTEE FINANCIAL EXPERT. |
The Board of Directors of the registrant has determined that Robert A. Frankel, the Chairman of the Board’s Audit Committee, possesses the technical attributes identified in Instruction 2(b) of Item 3 to Form N-CSR to qualify as an “audit committee financial expert,” and has designated Mr. Frankel as the Audit Committee’s financial expert. Mr. Frankel is an “independent” Director pursuant to paragraph (a)(2) of Item 3 to Form N-CSR.
| ITEM 4. | PRINCIPAL ACCOUNTANT FEES AND SERVICES. |
| (a) | Audit Fees for the Travelers Series Fund Inc. were $342,500 and $329,500 for the years ended 10/31/04 and 10/31/03. |
| (b) | Audit-Related Fees for the Travelers Series Fund Inc. were $0 and $3,500 for the years ended 10/31/04 and 10/31/03. |
| (c) | Tax Fees for Travelers Series Fund Inc. of $35,400 and $35,000 for the years ended 10/31/04 and 10/31/03. These amounts represent aggregate fees paid for tax compliance, tax advice and tax planning services, which include (the filing and amendment of federal, state and local income tax returns, timely RIC qualification review and tax distribution and analysis planning) rendered by the Accountant to Travelers Series Fund Inc. |
| (d) | All Other Fees for Travelers Series Fund Inc. of $0 and $0 for the years ended 10/31/04 and 10/31/03. |
| (e) | (1) Audit Committee’s pre–approval policies and procedures described in paragraph (c) (7) of Rule 2-01 of Regulation S-X. |
The Charter for the Audit Committee (the “Committee”) of the Board of each registered investment company (the “Fund”) advised by Smith Barney Fund Management LLC or Salomon Brothers Asset Management Inc. or one of their affiliates (each, an “Adviser”) requires that the Committee shall approve (a) all audit and permissible non-audit services to be provided to the Fund and (b) all permissible non-audit services to be provided by the Fund’s independent auditors to the Adviser and any Covered Service Providers if the engagement relates directly to the operations and financial reporting of the Fund. The Committee may implement policies and procedures by which such services are approved other than by the full Committee.
The Committee shall not approve non-audit services that the Committee believes may impair the independence of the auditors. As of the date of the approval of this Audit Committee Charter, permissible non-audit services include any professional services (including tax services), that are not prohibited services as described below, provided to the Fund by the independent auditors, other than those provided to the Fund in connection with an audit or a review of the financial statements of the Fund. Permissible non-audit services may not include: (i) bookkeeping or other services related to the accounting records or financial statements of the Fund; (ii) financial information systems design and implementation; (iii) appraisal or valuation services, fairness opinions or contribution-in-kind reports; (iv) actuarial services; (v) internal audit outsourcing services; (vi) management functions or human resources; (vii) broker or dealer, investment adviser or investment banking services; (viii) legal services and expert services unrelated to the audit; and (ix) any other service the Public Company Accounting Oversight Board determines, by regulation, is impermissible.
Pre-approval by the Committee of any permissible non-audit services is not required so long as: (i) the aggregate amount of all such permissible non-audit services provided to the Fund, the Adviser and any service providers controlling, controlled by or under common control with the Adviser that provide ongoing services to the Fund (“Covered Service Providers”) constitutes not more than 5% of the total amount of revenues paid to the independent auditors during the fiscal year in which the permissible non-audit services are provided to (a) the Fund, (b) the Adviser and (c) any entity controlling,
controlled by or under common control with the Adviser that provides ongoing services to the Fund during the fiscal year in which the services are provided that would have to be approved by the Committee; (ii) the permissible non-audit services were not recognized by the Fund at the time of the engagement to be non-audit services; and (iii) such services are promptly brought to the attention of the Committee and approved by the Committee (or its delegate(s)) prior to the completion of the audit.
(2) For the Travelers Series Fund Inc., the percentage of fees that were approved by the audit committee, with respect to: Audit-Related Fees were 100% and 100% for the years ended 10/31/04 and 10/31/03; Tax Fees were 100% and 100% for the years ended 10/31/04 and 10/31/03; and
Other Fees were 100% and 100% for the years ended 10/31/04 and 10/31/03.
| (f) | N/A |
| (g) | Non-audit fees billed by the Accountant for services rendered to Travelers Series Fund Inc. and CAM and any entity controlling, controlled by, or under common control with CAM that provides ongoing services to Travelers Series Fund Inc. were $0 and $0 for the years ended 10/31/04 and 10/31/03. |
| (h) | Yes. The Travelers Series Fund Inc.’s Audit Committee has considered whether the provision of non-audit services that were rendered to Service Affiliates which were not pre-approved (not requiring pre-approval) is compatible with maintaining the Accountant’s independence. All services provided by the Accountant to the Travelers Series Fund Inc. or to Service Affiliates which were required to be pre-approved were pre-approved as required. |
| ITEM 5. | AUDIT COMMITTEE OF LISTED REGISTRANTS. |
Not applicable.
| ITEM 6. | [RESERVED] |
| ITEM 7. | DISCLOSURE OF PROXY VOTING POLICIES AND PROCEDURES FOR CLOSED-END MANAGEMENT INVESTMENT COMPANIES. |
Not applicable.
| ITEM 8. | [RESERVED] |
| ITEM 9. | SUBMISSION OF MATTERS TO A VOTE OF SECURITY HOLDERS. |
Not applicable.
| ITEM 10. | CONTROLS AND PROCEDURES. |
| (a) | The registrant’s principal executive officer and principal financial officer have concluded that the registrant’s disclosure controls and procedures (as defined in Rule 30a- 3(c) under the Investment Company Act of 1940, as amended (the “1940 Act”)) are effective as of a date within 90 days of the filing date of this report that includes the disclosure required by this paragraph, based on their evaluation of the disclosure controls and procedures required by Rule 30a-3(b) under the 1940 Act and 15d-15(b) under the Securities Exchange Act of 1934. |
| (b) | There were no changes in the registrant’s internal control over financial reporting (as defined in Rule 30a-3(d) under the 1940 Act) that occurred during the registrant’s last fiscal half-year (the registrant’s second fiscal half-year in the case of an annual report) that have materially affected, or are likely to materially affect the registrant’s internal control over financial reporting. |
| ITEM 11. | EXHIBITS. |
| (a) | Code of Ethics attached hereto. |
Exhibit 99.CODE ETH
| (b) | Attached hereto. |
| Exhibit 99. CERT | Certifications pursuant to section 302 of the Sarbanes-Oxley Act of 2002 | |
| Exhibit 99.906CERT | Certifications pursuant to Section 906 of the Sarbanes-Oxley Act of 2002 | |
SIGNATURES
Pursuant to the requirements of the Securities Exchange Act of 1934 and the Investment Company Act of 1940, the registrant has duly caused this Report to be signed on its behalf by the undersigned, there unto duly authorized.
Travelers Series Fund Inc.
| By: | /s/ R. JAY GERKEN | |
| R. Jay Gerken | ||
| Chief Executive Officer of Travelers Series Fund Inc. | ||
Date: January 7, 2005
Pursuant to the requirements of the Securities Exchange Act of 1934 and the Investment Company Act of 1940, this report has been signed below by the following persons on behalf of the registrant and in the capacities and on the dates indicated.
| By: | /s/ R. JAY GERKEN | |
| (R. Jay Gerken) | ||
| Chief Executive Officer of Travelers Series Fund Inc. | ||
Date: January 7, 2005
| By: | /s/ JAMES M. GIALLANZA | |
| (James M. Giallanza) | ||
| Chief Financial Officer of Travelers Series Fund Inc. | ||
Date: January 7, 2005