UNITED STATES
SECURITIES AND EXCHANGE COMMISSION
Washington, D.C. 20549
FORM N-CSR
CERTIFIED SHAREHOLDER REPORT OF REGISTERED MANAGEMENT
INVESTMENT COMPANIES
Investment Company Act file number 811-8372
Travelers Series Fund Inc.
(Exact name of registrant as specified in charter)
| | |
| 125 Broad Street, New York, NY | | 10004 |
| (Address of principal executive offices) | | (Zip code) |
Robert I. Frenkel, Esq.
Smith Barney Fund Management LLC
300 First Stamford Place
Stamford, CT 06902
(Name and address of agent for service)
Registrant’s telephone number, including area code: (800) 451-2010
Date of fiscal year end: October 31
Date of reporting period: October 31, 2004
| ITEM 1. | REPORT TO STOCKHOLDERS. |
The Annual Report to Stockholders is filed herewith.
TRAVELERS SERIES FUND INC.
SMITH BARNEY LARGE CAP
VALUE PORTFOLIO
STRATEGIC EQUITY
PORTFOLIO
VAN KAMPEN
ENTERPRISE PORTFOLIO
ANNUAL REPORT | OCTOBER 31, 2004
NOT FDIC INSURED • NOT BANK GUARANTEED • MAY LOSE VALUE
WHAT’S INSIDE
LETTER FROM THE CHAIRMAN

R. JAY GERKEN, CFA
Chairman, President and Chief Executive Officer
Dear Shareholder,
Stock prices collectively advanced over the 12 months ending October 31, 2004, although performance varied sharply among sectors and investment styles. The equity market also shifted gears during the period due to investors’ reactions to mixed signals about the economy.
Last fall, stocks generally continued to rise as many geopolitical concerns began to ease, and a spate of mortgage refinancings freed up investable cash for investors. Despite positive corporate earnings results, stocks traded in a narrow range during the first quarter of this year due to concerns about anemic job growth.i During this time, the economy grew at a moderate pace,ii albeit at significantly stronger levels than during the first half of 2003.
In the spring, the economic recovery became broader-based as labor market growth improved dramatically in March and April, although signs suggested a pickup in inflation in the spring as well. As widely anticipated, the Federal Reserve Board (“Fed”)iii proceeded to push short-term interest rates higher, marking its first hike in four years. The Fed raised its target for the closely watched federal funds rateiv by 0.25% on three occasions during the reporting period, increasing it from a four-decade low of 1.00% in June to 1.75% in September, and then again to 2.00% on November 10, after the fund’s reporting period had ended. Higher interest rates can help slow a potential acceleration of economic growth and thereby help maintain a balance between that growth rate and the inflation rate that can generally accompany it.
As the period came to a close, inflation figures were benign while labor market growth, which had tapered off during the summer, exceeded consensus estimates for October. Crude oil prices, which had risen to record highs in the third quarter, when coupled with investors’ reaction to terrorism concerns, weakened investor sentiment toward the equity markets. However, reports of a pullback in oil prices and strong third-quarter corporate profits gave stock prices a boost in the final month of the period.
Over the 12 months, stocks of small- and mid-capitalization companies continued to outperform large-caps in general. Value-oriented stocks handily outpaced growth-oriented stocks. International stock markets beat out the broad domestic U.S. market by a wide margin.
1 Travelers Series Fund Inc. | 2004 Annual Report
Within this environment, the funds performed as follows1:
PERFORMANCE SNAPSHOT
AS OF OCTOBER 31, 2004
| | | | | | |
| | | 6 Months | | | 12 Months | |
| | | | | | | |
Smith Barney Large Cap Value Portfolio | | 2.70 | % | | 10.69 | % |
| | | | | | | |
S&P 500/Barra Value Index | | 6.00 | % | | 14.46 | % |
| | | | | | | |
Lipper Variable Equity Income Funds Category Average | | 4.66 | % | | 13.27 | % |
| | | | | | | |
Strategic Equity Portfolio | | 2.11 | % | | 8.44 | % |
| | | | | | | |
S&P 500 Index | | 2.96 | % | | 9.41 | % |
| | | | | | | |
Lipper Variable Multi-Cap Core Funds Category Average | | 2.91 | % | | 8.92 | % |
| | | | | | | |
Van Kampen Enterprise Portfolio | | -0.09 | % | | 0.05 | % |
| | | | | | | |
Russell 1000 Growth Index | | -0.73 | % | | 3.38 | % |
| | | | | | | |
S&P 500 Index | | 2.96 | % | | 9.41 | % |
| | | | | | | |
Lipper Variable Multi-Cap Core Funds Category Average | | 2.91 | % | | 8.92 | % |
The performance shown represents past performance. Past performance is no guarantee of future results and current performance may be higher or lower than the performance shown above. Principal value and investment returns will fluctuate and investors’ shares, when redeemed, may be worth more or less than their original cost.
Returns assume the reinvestment of income dividends and capital gains distributions at net asset value and the deduction of all fund expenses.
Performance figures for Smith Barney Large Cap Value Portfolio, Strategic Equity Portfolio and Van Kampen Enterprise Portfolio may reflect reimbursements or fee waivers, without which the performance would have been lower.
Lipper, Inc. is a major independent mutual fund tracking organization. Returns are based on the period ended October 31, 2004 and include the reinvestment of dividends and capital gains, if any. Returns for the equity income variable funds category average were calculated among the 60 funds for the six-month period and among the 60 funds for the 12-month period. Returns for the multi-cap core variable funds category were calculated among the 137 funds for the six-month period and among the 136 funds for the 12-month period.
| 1 | The funds are underlying investment options of various variable annuity products. A variable annuity product is a contract issued by an insurance company where the annuity premium (a set amount of dollars) is immediately turned into units of a portfolio of securities. Upon retirement, the policyholder is paid according to accumulated units whose dollar value varies according to the performance of the securities within the sub accounts. Its objective is to preserve, through investment, the purchasing value of the annuity, which otherwise is subject to erosion through inflation. The funds’ performance returns do not reflect the deduction of initial sales charges and expenses imposed in connection with investing in variable annuity contracts such as administrative fees, account charges and surrender charges, which if reflected, would reduce the performance of the funds. Past performance is no guarantee of future results. |
2 Travelers Series Fund Inc. | 2004 Annual Report
Please read on for a more detailed look at prevailing economic and market conditions during the fund’s fiscal year and to learn how those conditions have affected fund performance.
Information About Your Fund
As you may be aware several issues in the mutual fund industry have recently come under the scrutiny of federal and state regulators. The funds’ Adviser and some of its affiliates have received requests for information from various government regulators regarding market timing, late trading, fees, and other mutual fund issues in connection with various investigations. The regulators appear to be examining, among other things, the funds’ response to market timing and shareholder exchange activity, including compliance with prospectus disclosure related to these subjects. The funds have been informed that the Adviser and its affiliates are responding to those information requests, but are not in a position to predict the outcome of these requests and investigations.
In November 2003, Citigroup Asset Management (“CAM”) disclosed an investigation by the Securities and Exchange Commission (“SEC”) and the U.S. Attorney relating to Citigroup Asset Management’s entry into the transfer agency business during 1997-1999. Citigroup has disclosed that the Staff of the SEC is considering recommending a civil injunctive action and/or an administrative proceeding against certain advisory and transfer agent entities affiliated with Citigroup, the former CEO of CAM, two former employees and a current employee of CAM, relating to the creation, operation and fees of its internal transfer agent unit that serves various CAM-managed funds. Citigroup is cooperating with the SEC and will seek to resolve this matter in discussion with the SEC Staff. Although there can be no assurance, Citigroup does not believe that this matter will have a material adverse effect on the fund.
As always, thank you for your confidence in our stewardship of your assets. We look forward to helping you continue to meet your financial goals.
Sincerely,

R. Jay Gerken, CFA
Chairman, President and Chief Executive Officer
November 17, 2004
3 Travelers Series Fund Inc. | 2004 Annual Report
MANAGER OVERVIEW
Smith Barney Large Cap Value Portfolio
Special Shareholder Notice
Effective July 1, 2004, the management fee was reduced from 0.65% of the portfolio’s average daily net assets to a fee calculated in accordance with the following breakpoint schedule:
| | | |
Portfolio’s Average Daily Net Assets
| | Fee Rate
| |
Up to $500 million | | 0.60 | % |
| |
In excess of $500 million and up to and including $1 billion | | 0.55 | % |
| |
Over $1 billion | | 0.50 | % |
Effective August 19, 2004, Mark J. McAllister, CFA, currently a co-manager of the portfolio, and Robert Feitler are responsible for the day-to-day management of the portfolio. Mr. McAllister is an investment officer of Smith Barney Fund Management LLC (“SBFM”) and Managing Director of Salomon Brothers Asset Management Inc (“SaBAM”), an affiliate of SBFM and Citigroup Global Markets Inc. Mr. McAllister has 17 years of investment management experience. Mr. Feitler has been with SaBAM since 1995 and is a Director of SaBAM.
Effective November 1, 2004, the fund considers large capitalization companies to be companies with market capitalizations similar to companies in the Russell 1000 Index.v Securities of companies whose market capitalizations no longer meet this definition after purchase by the fund still will be considered securities of large capitalization companies for purposes of the fund’s 80% investment policy.
Performance Review
For the 12 months ended October 31, 2004, the Smith Barney Large Cap Value Portfolio, returned 10.69%.2 The fund underperformed its unmanaged benchmark, the S&P 500/Barra Value Index,vi which returned 14.46% for the
| 2 | The fund is an underlying investment option of various variable annuity products. A variable annuity product is a contract issued by an insurance company where the annuity premium (a set amount of dollars) is immediately turned into units of a portfolio of securities. Upon retirement, the policyholder is paid according to accumulated units whose dollar value varies according to the performance of the securities within the sub accounts. Its objective is to preserve, through investment, the purchasing value of the annuity, which otherwise is subject to erosion through inflation. The fund’s performance returns do not reflect the deduction of initial sales charges and expenses imposed in connection with investing in variable annuity contracts such as administrative fees, account charges and surrender charges, which if reflected, would reduce the performance of the fund. Past performance is no guarantee of future results. |
4 Travelers Series Fund Inc. | 2004 Annual Report
same period. The fund also underperformed the Lipper variable equity income funds category average3, which was 13.27%.
Market Review
The U.S. equity market, despite positive breadth, had experienced poor market volume and low volatility during the 12 months ended October 31, 2004. Less dynamic, “old economy”, industries led the market, while higher beta stocks lagged. The top-performing sector of the S&P 500 was energy, gaining 44.5% and accounting for 24% of the index’s return†. Within this energy sector, the integrated oil stocks were the main contributors to positive performance. Other leading sectors included industrials, financials and consumer discretionary. All sectors had positive returns during the period with the exception of technology, which was slightly negative.
Contributors to Fund Performance
The fund’s underperformance relative to the S&P Barra Value Index during the period was attributable to both security selection and sector allocation.vii Security selection was strongest in the telecommunications and financials sectors and weakest in the healthcare and consumer staples sectors. Top contributors during the period included AT&T Wireless, ChevronTexaco Corp., BP PLC, Total SA and Transocean Inc. We took advantage of the strength in ChevronTexaco Corp.’s share price by reducing the fund’s position. In addition, during the period, we sold all of the shares in both AT&T Wireless and Transocean Inc. that the fund owned.
Detractors from Fund Performance
Stocks that detracted from performance came from a number of different sectors and included Nortel Networks Corp., Merck & Co., Inc., Hewlett-Packard Co., The Kroger Co. and Pfizer Inc. Merck & Co., Inc. fell sharply at the end of September when the company announced that it would pull the arthritis drug Vioxx off the market due to a study that showed an increased relative risk for cardiovascular events after 18 months of use. We were disappointed with the company’s announcement and continue to watch the situation closely. We continue to hold all of these stocks.
We remain overweight in the technology, healthcare and consumer staples sectors and substantially underweight in the financials sector versus the S&P
| 3 | Lipper, Inc. is a major independent mutual-fund tracking organization. Returns are based on the 12-month period ended October 31, 2004, calculated among the 60 funds in the fund’s Lipper category, including the reinvestment of dividends and capital gains, if any. |
5 Travelers Series Fund Inc. | 2004 Annual Report
Barra Value Index. We have slightly reduced our technology weighting in the fund and increased our financials and energy weightings during the period.
Thank you for your investment in the Smith Barney Large Cap Value Portfolio. As ever, we appreciate that you have chosen us to manage your assets and we remain focused on seeking to achieve the fund’s investment goals.
Sincerely,
| | |
 | |  |
| Mark J. McAllister, CFA | | Robert Feitler |
| Vice President and Investment Officer | | Vice President and Investment Officer |
November 16, 2004
6 Travelers Series Fund Inc. | 2004 Annual Report
MANAGER OVERVIEW
Strategic Equity Portfolio
Performance Review
For the 12 months ended October 31, 2004, the Strategic Equity Portfolio returned 8.44%.4 The fund underperformed its unmanaged benchmark, the S&P 500 Index,viii which returned 9.41% for the same period. It also underperformed the Lipper variable multi-cap core funds category average,5 which was 8.92%.
Comment from Adam Hetnarski, Portfolio Manager of Strategic Equity Portfolio
Market Overview
During the fiscal year, equities produced solid returns as the economic recovery took hold. Most of the gains were realized during the first three months of the reporting period, when economic growth, low interest rates and strong corporate earnings bolstered investor confidence and fueled a broad-based rally. However, since the end of 2003, the markets have stagnated due in part to high energy prices, fears of terrorism and concerns about a slowing economy.
Contributors to Fund Performance
Against this backdrop, the portfolio underperformed its benchmark, the S&P 500 Index. A large overweight in the healthcare sector, particularly within the underperforming pharmaceuticals industry, detracted from the portfolio’s performance relative to the benchmark. The portfolio was also hurt by weak stock selection in the energy sector. Within energy, record high oil and natural gas prices created a positive environment for energy companies, particularly for large integrated oil stocks, which we generally avoided. In the consumer discretionary sector, the portfolio was overweight in the poor-performing media
| 4 | The fund is an underlying investment option of various variable annuity products. A variable annuity product is a contract issued by an insurance company where the annuity premium (a set amount of dollars) is immediately turned into units of a portfolio of securities. Upon retirement, the policyholder is paid according to accumulated units whose dollar value varies according to the performance of the securities within the sub accounts. Its objective is to preserve, through investment, the purchasing value of the annuity, which otherwise is subject to erosion through inflation. The fund’s performance returns do not reflect the deduction of initial sales charges and expenses imposed in connection with investing in variable annuity contracts such as administrative fees, account charges and surrender charges, which if reflected, would reduce the performance of the fund. Past performance is no guarantee of future results. |
| 5 | Lipper, Inc. is a major independent mutual-fund tracking organization. Returns are based on the 12-month period ended October 31, 2004, calculated among the 136 funds in the fund’s Lipper category, including the reinvestment of dividends and capital gains, if any. |
7 Travelers Series Fund Inc. | 2004 Annual Report
industry, which hurt performance. Media and entertainment stocks had a difficult time due to weak trends in advertising spending.
Contributing to performance was solid security selection and an overweight in the strong-performing industrials sector. Industrial conglomerates benefited from the recovering economy, and aerospace-&-defense companies were helped by increased defense spending. Others sources of positive performance during the fiscal year were the portfolio’s holdings in the financials, telecommunications, and consumer staples sectors.ix
Thank you for your investment in the Strategic Equity Portfolio. As ever, we appreciate that you have chosen us to manage your assets and we remain focused on seeking to achieve the fund’s investment goals.
Sincerely,
R. Jay Gerken, CFA
Chairman, President and Chief Executive Officer
October 31, 2004
8 Travelers Series Fund Inc. | 2004 Annual Report
MANAGER OVERVIEW
Van Kampen Enterprise Portfolio
Special Shareholder Notice
Effective November 15, 2004, the portfolio management team of Van Kampen Enterprise Portfolio consists of Sandip Bhagat, Feng Chang, Kevin Jung, Leah Modigliani and Hooman Yaghoobi, each of Van Kampen Asset Management. Mr. Bhagat, a portfolio manager and Managing Director of Van Kampen Asset Management, is the team leader.
Performance Review
For the 12 months ended October 31, 2004, the Van Kampen Enterprise Portfolio returned 0.05%.6 The fund underperformed both its unmanaged benchmark, the Russell 1000 Growth Index,x which returned 3.38% for the same period and its former benchmark, the S&P 500 Index,viii which returned 9.41% for the same period. It also underperformed the Lipper variable multi-cap core funds category average,7 which was 8.92%.
The portfolio’s performance was hindered by its emphasis on stocks of larger companies, which was higher than the average holding in its current benchmark. During the 12-month reporting period, larger-cap companies underperformed their small- and mid-cap counterparts in the portfolio. Based on previous market patterns, as the economic recovery matures, the portfolio’s emphasis on larger-companies’ stocks could potentially prove beneficial.
Market Review
During the first quarter of the fund’s fiscal period stocks generally continued to rise. However, performance tapered off and equities posted modest returns in early 2004 as concerns about anemic labor marketi growth overshadowed good news regarding corporate profits.
| 6 | The fund is an underlying investment option of various variable annuity products. A variable annuity product is a contract issued by an insurance company where the annuity premium (a set amount of dollars) is immediately turned into units of a portfolio of securities. Upon retirement, the policyholder is paid according to accumulated units whose dollar value varies according to the performance of the securities within the sub accounts. Its objective is to preserve, through investment, the purchasing value of the annuity, which otherwise is subject to erosion through inflation. The fund’s performance returns do not reflect the deduction of initial sales charges and expenses imposed in connection with investing in variable annuity contracts such as administrative fees, account charges and surrender charges, which if reflected, would reduce the performance of the fund. Past performance is no guarantee of future results. |
| 7 | Lipper, Inc. is a major independent mutual-fund tracking organization. Returns are based on the 12-month period ended October 31, 2004, calculated among the 136 funds in the fund’s Lipper category, including the reinvestment of dividends and capital gains, if any. |
9 Travelers Series Fund Inc. | 2004 Annual Report
Despite a significant pick-up in the growth of non-farm payroll jobs in March and April, stocks again generated only mild gains in the second quarter. This performance was due in significant part to fears that rates were poised to rise coupled with geopolitical concerns. As widely anticipated, the Fediii raised its target for the federal funds rateiv from 1.00% to 1.25% at the end of June, boosted it by 0.25% again in August and eventually to 1.75% in September. (After the fund’s reporting period ended, the Fed raised its target to 2.00% on November 10.)
In the third quarter, stocks drifted lower as the economy hit a “soft patch” and oil prices rose to record levels. Investors’ concerns about the continued turmoil in Iraq and threats of terrorism also hurt investor confidence. As the reporting period came to a close, stocks advanced amid as oil prices slipped back, and strong overall third-quarter corporate profits.
Contributors to Performance
During the fiscal year, we reduced the number of stocks held in the portfolio to better focus on the return potential of the remaining investments. The size of the companies owned increased on average, with a preference for stable companies with more predictable earnings outlooks. From an economic sector perspective, the portfolio was reshaped during the period. For example, the allocation to consumer discretionary stocks was reduced by approximately one-third. This was due to our expectation that the previous stimulus from tax cuts was waning and that consumer spending could correspondingly decline.
The portfolio’s holdings in the financial sector were trimmed as well in anticipation of a higher interest rate environment and the resulting adverse potential impact on lenders. Conversely, we put increased emphasis on stocks in the healthcare sector as companies in this sector offered attractive earnings, targeting issues that in our judgment appeared to be trading at relatively inexpensive valuations. We also increased the portfolio’s exposure to energy and telecommunications stocks.
These portfolio changes met with mixed results. For example, the added exposure to energy enhanced results. On the other hand, the portfolio’s healthcare stocks came under pressure due to the threat of regulatory or legislative actions, which might harm the business outlook for these companies. Our trimming of consumer-related companies such as retailers proved to be premature as the sector went on to produce returns above the benchmark averages.
From a stock-specific perspective, the portfolio benefited most during the period by its ownership of Carnival Corp., a leading cruise ship company. Likewise,
10 Travelers Series Fund Inc. | 2004 Annual Report
the portfolio’s performance was helped by its holding in Starwood Hotels & Resorts Worldwide, Inc. and Marriott International, Inc. Conversely, exposure to VERITAS Software Corp., Watson Pharmaceuticals Inc., ADTRAN Inc., and EMC Corp. detracted from results.xi
Thank you for your investment in the Van Kampen Enterprise Portfolio. As ever, we appreciate that you have chosen us to manage your assets and we remain focused on seeking to achieve the fund’s investment goals.
Sincerely,
| | | | |
| | |
 | |  | |  |
| Stephen Lyle Boyd | | Thomas Copper | | Mary Jayne Maly |
| Portfolio Manager | | Portfolio Manager | | Portfolio Manager |
| Van Kampen Asset Management Inc. |
November 22, 2004
The information provided is not intended to be a forecast of future events, a guarantee of future results or investment advice. Views expressed may differ from those of the firm as a whole.
RISKS:
Smith Barney Large Cap Value Portfolio: Keep in mind, common stocks are subject to market fluctuations. Foreign stocks are subject to certain risks of overseas investing, including currency fluctuations and changes in political and economic conditions, which could result in significant market fluctuations. The fund may use derivatives, such as options and futures, which can be illiquid, may disproportionately increase losses, and have a potentially large impact on fund performance.
Strategic Equity Portfolio: The fund may invest in foreign securities. Investing in foreign securities is subject to certain risks not associated with domestic investing, such as currency fluctuations, and changes in political and economic conditions. The fund may use derivatives, such as options and futures, which can be illiquid, may disproportionately increase losses, and have a potentially, large impact on fund performance.
Van Kampen Enterprise Portfolio: The fund may invest in foreign securities. Investing in foreign securities is subject to certain risks not associated with domestic investing, such as currency fluctuations, and changes in political and economic conditions. These risks are magnified in emerging or developing markets. The fund may use derivatives, such as options and futures, which can be illiquid, may disproportionately increase losses, and have a potentially large impact on fund performance. The fund may invest in small capitalization companies. Small capitalization companies may involve a higher degree of risk and volatility than investments in larger, more established companies. The fund may invest in medium capitalization companies. Medium capitalization companies may involve a higher degree of risk and volatility than investments in larger, more established companies.
All index performance reflects no deduction for fees, expenses or taxes. Please note that an investor cannot invest directly in an index.
11 Travelers Series Fund Inc. | 2004 Annual Report
| i | Source: Bureau of Economic Analysis, U.S. Department of Commerce. January 2, 2004. |
| ii | Source: Commerce Department (Bureau of Economic Analysis). Refers to quarterly growth of Gross Domestic Product (“GDP”). GDP is a market value of goods and services produced by labor and property in a given country. |
| iii | Source: U.S. Federal Reserve Board. The Fed is responsible for the formulation of a policy designed to promote economic growth, full employment, stable prices, and a sustainable pattern of international trade and payments. |
| iv | The federal funds rate is the interest rate that banks with excess reserves at a Federal Reserve district bank charge other banks that need overnight loans. |
| v | The Russell 1000 Index measures the performance of the 1000 largest companies in the Russell 3000 Index, which represents approximately 92% of the total market capitalization of the Russell 3000 Index. |
| vi | The S&P 500/Barra Value Index is a market-capitalization weighted index of stocks in the S&P 500 having lower price-to-book ratios relative to the S&P 500 as a whole. (A price-to-book ratio is the price of a stock compared to the difference between a company’s assets and liabilities.) |
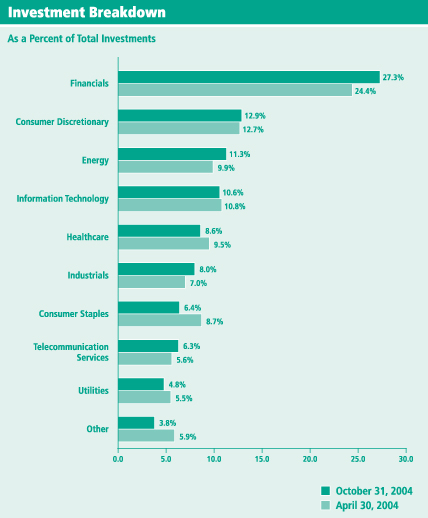
| vii | Portfolio holdings and breakdowns are as of October 31, 2004 and are subject to change and may not be representative of the fund’s current or future investments. The fund’s top ten holdings as of this date were: Bank of America Corp. (3.21%), Pfizer Inc. (2.58%), Altria Group, Inc. (2.46%), American International Group, Inc. (2.07%), Microsoft Corp. (2.00%), Royal Dutch Petroleum Co. (1.97%), Verizon Communications Inc. (1.83%), Total SA (1.80%), Merrill Lynch & Co., Inc. (1.75%), The Kroger Co. (1.74%). Please refer to pages 25 through 29 for a list and percentage breakdown of the fund’s holdings. |
| | The mention of sector breakdowns is for informational purposes only and should not be construed as a recommendation to purchase or sell any securities. The information provided regarding such sectors is not a sufficient basis upon which to make an investment decision. Investors seeking financial advice regarding the appropriateness of investing in any securities or investment strategies discussed should consult their financial professional. Portfolio holdings are subject to change at any time and may not be representative of the fund’s current or future investments. The fund’s top five sector holdings as of October 31, 2004 were: Financials (26.92%); Consumer Discretionary (12.66%); Energy (11.11%); Information Technology (10.42%); Healthcare (8.47%). The fund’s portfolio composition is subject to change at any time. |
| viii | The S&P 500 Index is a market capitalization-weighted index of 500 widely held common stocks. |
| ix | The mention of sector breakdowns is for informational purposes only and should not be construed as a recommendation to purchase or sell any securities. The information provided regarding such sectors is not a sufficient basis upon which to make an investment decision. Investors seeking financial advice regarding the appropriateness of investing in any securities or investment strategies discussed should consult their financial professional. Portfolio holdings are subject to change at any time and may not be representative of the fund’s current or future investments. The fund’s top five sector holdings as of October 31, 2004 were: Information Technology (19.06%); Healthcare (18.30%); Consumer Discretionary (13.29%); Telecommunication Services (12.56%); Financials (12.40%). The fund’s portfolio composition is subject to change at any time. |
| x | The Russell 1000 Growth Index measures the performance of those Russell 1000 companies with higher price-to-book ratios and higher forecasted growth values. Management has determined that the Russell 1000 Growth Index, which measures the performance of those Russell 1000 companies with higher price-to-book ratios and higher forecasted growth values, best represents the universe of stocks available to the fund for investment and will be utilized as the sole benchmark against which performance will be measured. Consequently, the S&P 500 Index will no longer be utilized. |
12 Travelers Series Fund Inc. | 2004 Annual Report
| xi | Portfolio holdings and breakdowns are as of October 31, 2004 and are subject to change and may not be representative of the fund’s current or future investments. The fund’s top ten holdings as of this date were: General Electric Co. (2.95%), Carnival Corp. (2.89%), Dell Inc. (2.55%), Starwood Hotels & Resorts Worldwide, Inc. (2.45%), Schering-Plough Corp. (2.32%), The Procter and Gamble Co. (2.30%), Bank of America Corp. (2.29%), International Business Machines Corp. (2.22%), Wal-Mart Stores, Inc. (2.18%), Microsoft Corp. (2.17%). Please refer to pages 36 through 39 for a list and percentage breakdown of the fund’s holdings. |
| | The mention of sector breakdowns is for informational purposes only and should not be construed as a recommendation to purchase or sell any securities. The information provided regarding such sectors is not a sufficient basis upon which to make an investment decision. Investors seeking financial advice regarding the appropriateness of investing in any securities or investment strategies discussed should consult their financial professional. Portfolio holdings are subject to change at any time and may not be representative of the fund’s current or future investments. The fund’s top five sector holdings as of October 31, 2004 were: Information Technology (23.41%); Healthcare (22.36%); Consumer Discretionary (15.14%); Industrials (10.57%); Financials (8.73%). The fund’s portfolio composition is subject to change at any time. |
13 Travelers Series Fund Inc. | 2004 Annual Report
Smith Barney Large Cap Value Portfolio
Fund at a Glance (unaudited)
14 Travelers Series Fund Inc. | 2004 Annual Report
Strategic Equity Portfolio
Fund at a Glance (unaudited)

15 Travelers Series Fund Inc. | 2004 Annual Report
Van Kampen Enterprise Portfolio
Fund at a Glance (unaudited)

16 Travelers Series Fund Inc. | 2004 Annual Report
Fund Expenses (unaudited)
As a shareholder of the Fund, you may incur two types of costs: (1) transaction costs, including front-end and back-end sales charges (loads) on purchase payments, reinvested dividends, or other distributions; and (2) ongoing costs, including management fees; distribution and/or service (12b-1) fees; and other Fund expenses. This example is intended to help you understand your ongoing costs (in dollars) of investing in the Fund and to compare these costs with the ongoing costs of investing in other mutual funds.
This example is based on an investment of $1,000 invested on May 1, 2004 and held for the six months ended October 31, 2004.
Actual Expenses
The table below titled “Based on Actual Total Return” provides information about actual account values and actual expenses. You may use the information provided in this table, together with the amount you invested, to estimate the expenses that you paid over the period. To estimate the expenses you paid on your account, divide your ending account value by $1,000 (for example, an $8,600 ending account value divided by $1,000 = 8.6), then multiply the result by the number under the heading entitled “Expenses Paid During the Period”.
Based on Actual Total Return(1)
| | | | | | | | | | | | | | | |
| | | Actual Total Return Without Sales Charges(2) | | | Beginning Account Value | | Ending Account Value | | Annualized Expense Ratio | | | Expenses Paid During the Period(3) |
Smith Barney Large Cap Value Portfolio | | 2.70 | % | | $ | 1,000.00 | | $ | 1,027.00 | | 0.65 | % | | $ | 3.31 |
|
Strategic Equity Portfolio | | 2.11 | | | | 1,000.00 | | | 1,021.10 | | 0.85 | | | | 4.32 |
|
Van Kampen Enterprise Portfolio | | (0.09 | ) | | | 1,000.00 | | | 999.10 | | 0.82 | | | | 4.12 |
|
| (1) | | For the six months ended October 31, 2004. |
| (2) | | Assumes reinvestment of dividends and capital gains distributions, if any, at net asset value. Total return is not annualized, as it may not be representative of the total return for the year. Total returns do not reflect expenses associated with the separate account such as administrative fees, account charges and surrender charges, which, if reflected, would reduce the total returns. Performance figures may reflect fee waivers and/or expense reimbursements. Past performance is no guarantee of future results. In the absence of fee waivers and/or expense reimbursements, the total return would have been lower. |
| (3) | | Expenses (net of voluntary waiver) are equal to each Funds’ respective annualized expense ratio multiplied by the average account value over the period, multiplied by the number of days in the most recent fiscal half-year, then divided by 366. |
17 Travelers Series Fund Inc. | 2004 Annual Report
Fund Expenses (unaudited) (continued)
Hypothetical Example for Comparison Purposes
The table below titled “Based on Hypothetical Total Return” provides information about hypothetical account values and hypothetical expenses based on the actual expense ratio and an assumed rate of return of 5.00% per year before expenses, which is not the Fund’s actual return. The hypothetical account values and expenses may not be used to estimate the actual ending account balance or expenses you paid for the period. You may use the information provided in this table to compare the ongoing costs of investing in the Fund and other funds. To do so, compare the 5.00% hypothetical example relating to the Fund with the 5.00% hypothetical examples that appear in the shareholder reports of the other funds.
Please note that the expenses shown in the table below are meant to highlight your ongoing costs only and do not reflect any transactional costs, such as front-end or back-end sales charges (loads). Therefore, the table is useful in comparing ongoing costs only, and will not help you determine the relative total costs of owning different funds. In addition, if these transaction costs were included, your costs would have been higher.
Based on Hypothetical Total Return(1)
| | | | | | | | | | | | | | | |
| | | Hypothetical Annualized Total Return | | | Beginning Account Value | | Ending Account Value | | Annualized Expense Ratio | | | Expenses Paid During the Period(2) |
Smith Barney Large Cap Value Portfolio | | 5.00 | % | | $ | 1,000.00 | | $ | 1,021.87 | | 0.65 | % | | $ | 3.30 |
|
Strategic Equity Portfolio | | 5.00 | | | | 1,000.00 | | | 1,020.86 | | 0.85 | | | | 4.32 |
|
Van Kampen Enterprise Portfolio | | 5.00 | | | | 1,000.00 | | | 1,021.01 | | 0.82 | | | | 4.17 |
|
| (1) | | For the six months ended October 31, 2004. |
| (2) | | Expenses (net of voluntary waiver) are equal to each Funds’ respective annualized expense ratio multiplied by the average account value over the period, multiplied by the number of days in the most recent fiscal half-year, then divided by 366. |
18 Travelers Series Fund Inc. | 2004 Annual Report
Smith Barney Large Cap Value Portfolio
Average Annual Total Returns† (unaudited)
| | | |
Twelve Months Ended 10/31/04 | | 10.69 | % |
|
|
Five Years Ended 10/31/04 | | 0.01 | |
|
|
Ten Years Ended 10/31/04 | | 8.20 | |
|
|
6/16/94* through 10/31/04 | | 8.04 | |
|
|
Cumulative Total Return† (unaudited)
| | | |
10/31/94 through 10/31/04 | | 119.97 | % |
|
|
| † | | Assumes reinvestment of dividends and capital gains distributions, if any, at net asset value. All figures represent past performance and are not a guarantee of future results. Investment return and principal value of an investment will fluctuate so that an investor’s shares, when redeemed, may be worth more or less than their original cost. Total returns do not reflect expenses associated with the separate account such as administrative fees, account charges and surrender charges, which, if reflected, would reduce the total returns. Performance figures may reflect fee waivers and/or expense reimbursements. In the absence of fee waivers and/or expense reimbursements, the total return would have been lower. |
| * | | Commencement of operations. |
19 Travelers Series Fund Inc. | 2004 Annual Report
Historical Performance (unaudited)
Value of $10,000 Invested in Shares of
the Smith Barney Large Cap Value Portfolio vs.
S&P 500/Barra Value Index†
October 1994 — October 2004
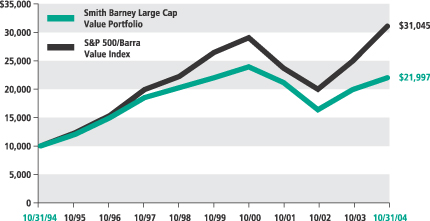
| † | Hypothetical illustration of $10,000 invested in shares of the Smith Barney Large Cap Value Portfolio on October 31, 1994, assuming reinvestment of dividends and capital gains, if any, at net asset value through October 31, 2004. The S&P 500/Barra Value Index is a market-capitalization weighted index of stocks in the S&P 500 Index having lower price-to-book ratios relative to the S&P 500 Index as a whole. (A price-to-book ratio is the price of a stock compared to the difference between a company’s assets and liabilities.) The Index is unmanaged and is not subject to the same management and trading expenses of a mutual fund. Please note that an investor cannot invest directly in an index. |
All figures represent past performance and are not a guarantee of future results. Investment return and principal value of an investment will fluctuate so that an investor’s shares, when redeemed, may be worth more or less than their original cost. The returns shown also do not reflect the deduction of taxes that a shareholder would pay on fund distributions or the redemption of fund shares. Performance figures may reflect fee waivers and/or expense reimbursements. In the absence of fee waivers and/or expense reimbursements, the total return would have been lower.
20 Travelers Series Fund Inc. | 2004 Annual Report
Strategic Equity Portfolio
Average Annual Total Returns† (unaudited)
| | | |
Twelve Months Ended 10/31/04 | | 8.44 | % |
|
|
Five Years Ended 10/31/04 | | (5.91 | ) |
|
|
Ten Years Ended 10/31/04 | | 9.10 | |
|
|
6/16/94* through 10/31/04 | | 9.42 | |
|
|
Cumulative Total Return† (unaudited)
| | | |
10/31/94 through 10/31/04 | | 138.90 | % |
|
|
| † | | Assumes reinvestment of dividends and capital gains distributions, if any, at net asset value. Total return is not annualized, as it may not be representative of the total return for the year. Total returns do not reflect expenses associated with the separate account such as administrative fees, account charges and surrender charges, which, if reflected, would reduce the total returns. Performance figures may reflect fee waivers and/or expense reimbursements. Past performance is no guarantee of future results. In the absence of fee waivers and/or expense reimbursements, the total return would have been lower. |
| * | | Commencement of operations. |
21 Travelers Series Fund Inc. | 2004 Annual Report
Historical Performance (unaudited)
Value of $10,000 Invested in Shares of the
Strategic Equity Portfolio vs.
S&P 500 Index†
October 1994 — October 2004
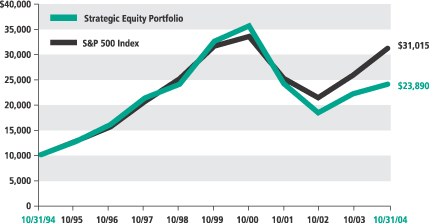
| † | Hypothetical illustration of $10,000 invested in shares of the Strategic Equity Portfolio on October 31, 1994 assuming reinvestment of dividends and capital gains, if any, at net asset value through October 31, 2004. The S&P 500 Index is an index composed of widely held common stocks listed on the New York Stock Exchange, American Stock Exchange and over-the-counter markets. Figures for the Index include reinvestment of dividends. The Index is unmanaged and is not subject to the same management and trading expenses of a mutual fund. Please note that an investor cannot invest directly in an index. |
All figures represent past performance and are not a guarantee of future results. Investment return and principal value of an investment will fluctuate so that an investor’s shares, when redeemed, may be worth more or less than their original cost. The returns shown also do not reflect the deduction of taxes that a shareholder would pay on fund distributions or the redemption of fund shares. Performance figures may reflect fee waivers and/or expense reimbursements. In the absence of fee waivers and/or expense reimbursements, the total return would have been lower.
22 Travelers Series Fund Inc. | 2004 Annual Report
Van Kampen Enterprise Portfolio
Average Annual Total Returns† (unaudited)
| | | | | |
Twelve Months Ended 10/31/04 | | 0.05 | % |
|
|
Five Years Ended 10/31/04 | | (7.66 | ) |
|
|
Ten Years Ended 10/31/04 | | 6.33 | |
|
|
6/16/94* through 10/31/04 | | 6.48 | |
|
|
Cumulative Total Return† (unaudited)
| | | | | |
10/31/94 through 10/31/04 | | 84.79 | % |
|
|
| † | | Assumes reinvestment of dividends and capital gains distributions, if any, at net asset value. Total return is not annualized, as it may not be representative of the total return for the year. Total returns do not reflect expenses associated with the separate account such as administrative fees, account charges and surrender charges, which, if reflected, would reduce the total returns. Performance figures may reflect fee waivers and/or expense reimbursements. Past performance is no guarantee of future results. In the absence of fee waivers and/or expense reimbursements, the total return would have been lower. |
| * | | Commencement of operations. |
23 Travelers Series Fund Inc. | 2004 Annual Report
Historical Performance (unaudited)
Value of $10,000 Invested in Shares of the
Van Kampen Enterprise Portfolio vs.
S&P 500 Index and Russell 1000 Growth Index†
October 1994 — October 2004
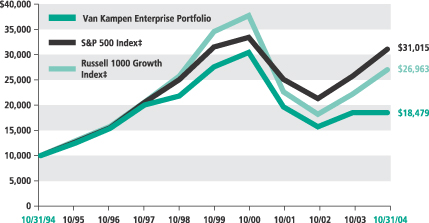
| † | | Hypothetical illustration of $10,000 invested in shares of the Van Kampen Enterprise Portfolio on October 31, assuming reinvestment of dividends and capital gains, if any, at net asset value through October 31, 2004. The S&P 500 Index is an index of widely held common stocks listed on the New York and American Stock Exchanges and the over-the-counter markets. Figures for the S&P 500 Index include reinvestment of dividends. The Russell 1000 Growth Index measures the performance of those Russell 1000 companies with higher price-to-book ratios and higher forecasted growth values. (A price-to-book ratio is the price of a stock compared to the difference between a company’s assets and liabilities.) The Indexes are unmanaged and are not subject to the same management and trading expenses of a mutual fund. Please note that an investor cannot invest directly in an index. |
All figures represent past performance and are not a guarantee of future results. Investment return and principal value of an investment will fluctuate so that an investor’s shares, when redeemed, may be worth more or less than their original cost. The returns shown also do not reflect the deduction of taxes that a shareholder would pay on fund distributions or the redemption of fund shares. Performance figures may reflect fee waivers and/or expense reimbursements. In the absence of fee waivers and/or expense reimbursements, the total return would have been lower.
| ‡ | Management has determined that the Russell 1000 Growth Index best represents the universe of stocks available to the Fund and will be utilized as the sole benchmark against which performance will be measured. Consequently, the S&P 500 Index will not appear in future reports. |
24 Travelers Series Fund Inc. | 2004 Annual Report
| | |
| Schedule of Investments | | October 31, 2004 |
SMITH BARNEY LARGE CAP VALUE PORTFOLIO
| | | | | |
| SHARES | | SECURITY | | VALUE |
| COMMON STOCK — 97.7% |
| CONSUMER DISCRETIONARY — 12.6% |
| Hotels, Restaurants & Leisure — 1.5% |
| 172,000 | | McDonald’s Corp. | | $ | 5,013,800 |
|
| Household Durables — 0.9% |
| 142,700 | | Newell Rubbermaid Inc. | | | 3,076,612 |
|
| Leisure Equipment & Products — 1.2% |
| 224,200 | | Mattel, Inc. | | | 3,925,742 |
|
| Media — 7.2% |
| | | Comcast Corp.: | | | |
| 81,300 | | Class A Shares (a) | | | 2,398,350 |
| 88,300 | | Special Class A Shares (a) | | | 2,564,232 |
| 431,800 | | Liberty Media Corp., Series A Shares (a) | | | 3,851,656 |
| 21,600 | | Liberty Media International, Inc., Series A Shares (a) | | | 778,680 |
| 157,100 | | The News Corp. Ltd., Sponsored ADR (a) | | | 4,939,224 |
| 266,100 | | Time Warner Inc. (a) | | | 4,427,904 |
| 137,700 | | Viacom Inc., Class B Shares | | | 5,024,673 |
|
| | | | | | 23,984,719 |
|
| Multi-Line Retail — 1.8% |
| 55,500 | | Target Corp. | | | 2,776,110 |
| 63,300 | | Wal-Mart Stores, Inc. | | | 3,413,136 |
|
| | | | | | 6,189,246 |
|
| | | TOTAL CONSUMER DISCRETIONARY | | | 42,190,119 |
|
| CONSUMER STAPLES — 6.3% |
| Food & Drug Retailing — 2.6% |
| 384,700 | | The Kroger Co. (a) | | | 5,812,817 |
| 152,700 | | Safeway Inc. (a) | | | 2,785,248 |
|
| | | | | | 8,598,065 |
|
| Household Products — 1.3% |
| 72,900 | | Kimberly-Clark Corp. | | | 4,349,943 |
|
| Tobacco — 2.4% |
| 168,900 | | Altria Group, Inc. | | | 8,184,894 |
|
| | | TOTAL CONSUMER STAPLES | | | 21,132,902 |
|
| ENERGY — 11.1% |
| Energy Equipment & Services — 3.4% |
| 149,700 | | ENSCO International Inc. | | | 4,573,335 |
| 86,700 | | GlobalSantaFe Corp. | | | 2,557,650 |
| 52,800 | | Nabors Industries, Ltd. (a) | | | 2,593,536 |
| 37,000 | | Noble Corp. (a) | | | 1,690,160 |
|
| | | | | | 11,414,681 |
|
See Notes to Financial Statements.
25 Travelers Series Fund Inc. | 2004 Annual Report
| | |
| Schedule of Investments (continued) | | October 31, 2004 |
SMITH BARNEY LARGE CAP VALUE PORTFOLIO
| | | | | |
| SHARES | | SECURITY | | VALUE |
| Oil & Gas — 7.7% |
| 87,600 | | BP PLC, Sponsored ADR | | $ | 5,102,700 |
| 60,300 | | ChevronTexaco Corp. | | | 3,199,518 |
| 25,300 | | EOG Resources, Inc. | | | 1,683,968 |
| 81,100 | | Marathon Oil Corp. | | | 3,090,721 |
| 120,900 | | Royal Dutch Petroleum Co., New York Shares | | | 6,557,616 |
| 57,400 | | Total SA, Sponsored ADR | | | 5,985,672 |
|
| | | | | | 25,620,195 |
|
| | | TOTAL ENERGY | | | 37,034,876 |
|
| FINANCIALS — 26.9% | | | |
| Banks — 9.2% |
| 239,000 | | Bank of America Corp. | | | 10,704,810 |
| 111,700 | | The Bank of New York Co., Inc. | | | 3,625,782 |
| 151,600 | | U.S. Bancorp | | | 4,337,276 |
| 97,200 | | Wachovia Corp. | | | 4,783,212 |
| 75,600 | | Washington Mutual, Inc. | | | 2,926,476 |
| 69,800 | | Wells Fargo & Co. | | | 4,168,456 |
|
| | | | | | 30,546,012 |
|
| Diversified Financials — 11.4% |
| 85,200 | | American Express Co. | | | 4,521,564 |
| 71,600 | | Capital One Financial Corp. | | | 5,281,216 |
| 69,500 | | Freddie Mac | | | 4,628,700 |
| 39,500 | | The Goldman Sachs Group, Inc. | | | 3,886,010 |
| 107,400 | | JPMorgan Chase & Co. | | | 4,145,640 |
| 158,700 | | MBNA Corp. | | | 4,067,481 |
| 108,200 | | Merrill Lynch & Co., Inc. | | | 5,836,308 |
| 67,300 | | Morgan Stanley | | | 3,438,357 |
| 101,200 | | Waddell & Reed Financial, Inc., Class A Shares | | | 2,126,212 |
|
| | | | | | 37,931,488 |
|
| Insurance — 4.0% |
| 113,500 | | American International Group, Inc. | | | 6,890,585 |
| 58,700 | | Loews Corp. | | | 3,516,130 |
| 86,200 | | The St. Paul Travelers Cos., Inc. | | | 2,927,352 |
|
| | | | | | 13,334,067 |
|
| Real Estate — 2.3% |
| 141,100 | | Equity Office Properties Trust | | | 3,967,732 |
| 118,300 | | Equity Residential | | | 3,945,305 |
|
| | | | | | 7,913,037 |
|
| | | TOTAL FINANCIALS | | | 89,724,604 |
|
| HEALTHCARE — 8.5% | | | |
| Healthcare Providers & Services — 0.7% |
| 64,700 | | HCA, Inc. | | | 2,376,431 |
|
See Notes to Financial Statements.
26 Travelers Series Fund Inc. | 2004 Annual Report
| | |
| Schedule of Investments (continued) | | October 31, 2004 |
SMITH BARNEY LARGE CAP VALUE PORTFOLIO
| | | | | |
| SHARES | | SECURITY | | VALUE |
| Pharmaceuticals — 7.8% |
| 79,400 | | GlaxoSmithKline PLC, ADR | | $ | 3,366,560 |
| 59,600 | | Johnson & Johnson | | | 3,479,448 |
| 48,000 | | Merck & Co., Inc. | | | 1,502,880 |
| 296,900 | | Pfizer Inc. | | | 8,595,255 |
| 195,400 | | Schering-Plough Corp. | | | 3,538,694 |
| 135,400 | | Wyeth | | | 5,368,610 |
|
| | | | | | 25,851,447 |
|
| | | TOTAL HEALTHCARE | | | 28,227,878 |
|
| INDUSTRIALS — 7.9% | | | |
| Aerospace & Defense — 4.4% |
| 98,000 | | The Boeing Co. | | | 4,890,200 |
| 92,000 | | Lockheed Martin Corp. | | | 5,068,280 |
| 26,000 | | Raytheon Co. | | | 948,480 |
| 42,100 | | United Technologies Corp. | | | 3,907,722 |
|
| | | | | | 14,814,682 |
|
| Commercial Services & Supplies — 1.9% |
| 56,900 | | Avery Dennison Corp. | | | 3,461,796 |
| 96,000 | | Waste Management, Inc. | | | 2,734,080 |
|
| | | | | | 6,195,876 |
|
| Industrial Conglomerates — 1.6% |
| 156,400 | | Honeywell International Inc. | | | 5,267,552 |
|
| | | TOTAL INDUSTRIALS | | | 26,278,110 |
|
| INFORMATION TECHNOLOGY — 10.4% | | | |
| Communications Equipment — 4.0% |
| 118,700 | | Comverse Technology, Inc. (a) | | | 2,449,968 |
| 353,600 | | Nokia Oyj, Sponsored ADR | | | 5,452,512 |
| 1,568,300 | | Nortel Networks Corp. (a) | | | 5,316,537 |
|
| | | | | | 13,219,017 |
|
| Computers & Peripherals — 3.0% |
| 173,300 | | Hewlett-Packard Co. | | | 3,233,778 |
| 39,100 | | International Business Machines Corp. | | | 3,509,225 |
| 40,900 | | Lexmark International, Inc., Class A Shares (a) | | | 3,399,199 |
|
| | | | | | 10,142,202 |
|
| Electronic Equipment & Instruments — 1.4% |
| 149,300 | | Celestica, Inc., Subordinate Voting Shares (a) | | | 2,161,864 |
| 487,100 | | Solectron Corp. (a) | | | 2,542,662 |
|
| | | | | | 4,704,526 |
|
See Notes to Financial Statements.
27 Travelers Series Fund Inc. | 2004 Annual Report
| | |
| Schedule of Investments (continued) | | October 31, 2004 |
SMITH BARNEY LARGE CAP VALUE PORTFOLIO
| | | | | |
| SHARES | | SECURITY | | VALUE |
| Software — 2.0% |
| 237,700 | | Microsoft Corp. | | $ | 6,653,223 |
|
| | | TOTAL INFORMATION TECHNOLOGY | | | 34,718,968 |
|
| MATERIALS — 2.9% | | | |
| Chemicals — 0.7% |
| 49,300 | | The Dow Chemical Co. | | | 2,215,542 |
|
| Metals & Mining — 1.0% |
| 99,400 | | Alcoa Inc. | | | 3,230,500 |
|
| Paper & Forest Products — 1.2% |
| 108,400 | | International Paper Co. | | | 4,174,484 |
|
| | | TOTAL MATERIALS | | | 9,620,526 |
|
| TELECOMMUNICATION SERVICES — 6.3% | | | |
| Diversified Telecommunication Services — 5.2% |
| 152,800 | | AT&T Corp. | | | 2,614,408 |
| 202,100 | | MCI Inc. | | | 3,486,225 |
| 199,700 | | SBC Communications Inc. | | | 5,044,422 |
| 156,100 | | Verizon Communications Inc. | | | 6,103,510 |
|
| | | | | | 17,248,565 |
|
| Wireless Telecommunication Services — 1.1% |
| 136,100 | | Nextel Communications, Inc., Class A Shares (a) | | | 3,605,289 |
|
| | | TOTAL TELECOMMUNICATION SERVICES | | | 20,853,854 |
|
| UTILITIES — 4.8% | | | |
| Electric Utilities — 2.4% |
| 53,400 | | Ameren Corp. | | | 2,563,200 |
| 53,300 | | FirstEnergy Corp. | | | 2,202,889 |
| 99,200 | | PG&E Corp. (a) | | | 3,178,368 |
|
| | | | | | 7,944,457 |
|
| Gas Utilities — 1.1% |
| 421,100 | | El Paso Corp. | | | 3,764,634 |
|
| Multi-Utilities — 1.3% |
| 196,600 | | NiSource Inc. | | | 4,217,070 |
|
| | | TOTAL UTILITIES | | | 15,926,161 |
|
| | | TOTAL COMMON STOCK
(Cost — $299,801,269) | | | 325,707,998 |
|
See Notes to Financial Statements.
28 Travelers Series Fund Inc. | 2004 Annual Report
| | |
| Schedule of Investments (continued) | | October 31, 2004 |
SMITH BARNEY LARGE CAP VALUE PORTFOLIO
| | | | | |
FACE
AMOUNT | | SECURITY | | VALUE |
| REPURCHASE AGREEMENT — 0.8% | | | |
| $2,692,000 | | UBS Securities LLC dated 10/29/04, 1.840% due 11/1/04; Proceeds at maturity — $2,692,413; (Fully collateralized by various U.S. Government obligations and agencies and International Bank Reconstruction & Development Notes & Bonds, 0.000% to 8.875% due 12/7/04 to 8/6/38; Market value — $2,745,846) (Cost — $2,692,000) | | $ | 2,692,000 |
|
| | | TOTAL INVESTMENTS — 98.5% (Cost — $302,493,269*) | | | 328,399,998 |
| | | Other Assets in Excess of Liabilities — 1.5% | | | 4,951,702 |
|
| | | TOTAL NET ASSETS — 100.0% | | $ | 333,351,700 |
|
| (a) | | Non-income producing security. |
| * | | Aggregate cost for federal income tax purposes is $304,392,953. |
Abbreviation used in this schedule:
ADR — American Depositary Receipt
See Notes to Financial Statements.
29 Travelers Series Fund Inc. | 2004 Annual Report
| | |
| Schedule of Investments (continued) | | October 31, 2004 |
STRATEGIC EQUITY PORTFOLIO
| | | | | |
| SHARES | | SECURITY | | VALUE |
| COMMON STOCK — 89.8% | | | |
| CONSUMER DISCRETIONARY — 13.3% | | | |
| Hotels, Restaurants & Leisure — 1.5% | | | |
| 47,700 | | Gaylord Entertainment Co. (a)(b) | | $ | 1,598,427 |
| 126,800 | | International Game Technology | | | 4,189,472 |
| 40,699 | | Shuffle Master, Inc. (a)(b) | | | 1,713,021 |
|
| | | | | | 7,500,920 |
|
| Internet & Catalog Retail — 0.7% |
| 100,800 | | Amazon.com, Inc. (a)(b) | | | 3,440,304 |
|
| Media — 6.7% |
| 3,100 | | DreamWorks Animation SKG, Inc., Class A Shares (a) | | | 121,055 |
| 183,700 | | Lamar Advertising Co., Class A Shares (a) | | | 7,608,854 |
| 64,600 | | Liberty Media Corp., Series A Shares (a) | | | 576,232 |
| 80,913 | | Pixar (a)(b) | �� | | 6,507,023 |
| 24,950 | | Playboy Enterprises, Inc., Class B Shares (a)(b) | | | 276,945 |
| 284,323 | | Viacom Inc., Class B Shares | | | 10,374,946 |
| 176,100 | | The Walt Disney Co. | | | 4,441,242 |
| 125,800 | | XM Satellite Radio Holdings Inc., Class A Shares (a)(b) | | | 4,065,856 |
|
| | | | | | 33,972,153 |
|
| Multi-Line Retail — 3.2% |
| 140,400 | | Nordstrom, Inc. | | | 6,062,472 |
| 188,100 | | Wal-Mart Stores, Inc. | | | 10,142,352 |
|
| | | | | | 16,204,824 |
|
| Specialty Retail — 1.2% |
| 36,442 | | Monro Muffler Brake, Inc. (a)(b) | | | 886,816 |
| 104,700 | | Staples, Inc. | | | 3,113,778 |
| 58,500 | | Urban Outfitters, Inc. (a)(b) | | | 2,398,500 |
|
| | | | | | 6,399,094 |
|
| | | TOTAL CONSUMER DISCRETIONARY | | | 67,517,295 |
|
| CONSUMER STAPLES — 7.4% |
| Beverages — 2.4% |
| 80,700 | | The Coca-Cola Co. | | | 3,281,262 |
| 180,000 | | PepsiCo, Inc. | | | 8,924,400 |
|
| | | | | | 12,205,662 |
|
| Food Products — 3.1% |
| 27,300 | | Bunge Ltd. (b) | | | 1,303,029 |
| 102,310 | | Hormel Foods Corp. | | | 2,875,934 |
| 64,120 | | The J. M. Smucker Co. (b) | | | 2,853,340 |
| 31,900 | | Kellogg Co. | | | 1,371,700 |
| 197,100 | | Kraft Foods Inc., Class A Shares | | | 6,565,401 |
| 23,800 | | Smithfield Foods, Inc. (a) | | | 576,674 |
|
| | | | | | 15,546,078 |
|
See Notes to Financial Statements.
30 Travelers Series Fund Inc. | 2004 Annual Report
| | |
| Schedule of Investments (continued) | | October 31, 2004 |
STRATEGIC EQUITY PORTFOLIO
| | | | | |
| SHARES | | SECURITY | | VALUE |
| Household Products — 0.7% |
| 68,500 | | The Procter & Gamble Co. | | $ | 3,505,830 |
|
| Tobacco — 1.2% |
| 130,600 | | Altria Group, Inc. | | | 6,328,876 |
|
| | | TOTAL CONSUMER STAPLES | | | 37,586,446 |
|
| ENERGY — 0.2% |
| Energy Equipment & Services — 0.0% |
| 4,100 | | Rowan Cos., Inc. (a) | | | 104,673 |
|
| Oil & Gas — 0.2% |
| 6,300 | | BP PLC, Sponsored ADR | | | 366,975 |
| 2,209 | | LUKOIL, Sponsored ADR | | | 275,573 |
| 4,070 | | Total SA, Sponsored ADR (b) | | | 424,420 |
|
| | | | | | 1,066,968 |
|
| | | TOTAL ENERGY | | | 1,171,641 |
|
| FINANCIALS — 12.4% |
| Banks — 0.7% |
| 57,200 | | Bank of America Corp. | | | 2,561,988 |
| 4,000 | | Boston Private Financial Holdings, Inc. (b) | | | 98,160 |
| 20,200 | | Wachovia Corp. | | | 994,042 |
|
| | | | | | 3,654,190 |
|
| Diversified Financials — 8.7% |
| 242,500 | | The Charles Schwab Corp. | | | 2,218,875 |
| 77,200 | | The Goldman Sachs Group, Inc. | | | 7,594,936 |
| 228,900 | | Janus Capital Group, Inc. | | | 3,490,725 |
| 217,900 | | Morgan Stanley | | | 11,132,511 |
| 434,650 | | SLM Corp. | | | 19,672,259 |
|
| | | | | | 44,109,306 |
|
| Insurance — 2.9% |
| 12,600 | | Ambac Financial Group Inc. | | | 983,556 |
| 183,900 | | American International Group, Inc. | | | 11,164,569 |
| 30,200 | | The Hartford Financial Services Group, Inc. | | | 1,766,096 |
| 26,040 | | Scottish Re Group Ltd. (b) | | | 585,900 |
|
| | | | | | 14,500,121 |
|
| Real Estate — 0.1% |
| 12,306 | | Redwood Trust, Inc. | | | 740,329 |
|
| | | TOTAL FINANCIALS | | | 63,003,946 |
|
| HEALTHCARE — 15.2% |
| Biotechnology — 2.0% |
| 231,103 | | Dendreon Corp. (a)(b) | | | 2,389,605 |
| 94,800 | | Genentech, Inc. (a) | | | 4,316,244 |
See Notes to Financial Statements.
31 Travelers Series Fund Inc. | 2004 Annual Report
| | |
| Schedule of Investments (continued) | | October 31, 2004 |
STRATEGIC EQUITY PORTFOLIO
| | | | | |
| SHARES | | SECURITY | | VALUE |
| Biotechnology — 2.0% (continued) |
| 158,400 | | Millennium Pharmaceuticals, Inc. (a) | | $ | 2,056,032 |
| 19,700 | | OSI Pharmaceuticals, Inc. (a) | | | 1,280,106 |
|
| | | | | | 10,041,987 |
|
| Healthcare Equipment & Supplies — 3.5% |
| 136,180 | | Biomet, Inc. | | | 6,356,882 |
| 16,500 | | Foxhollow Technologies Inc. (a) | | | 339,570 |
| 102,900 | | Guidant Corp. | | | 6,855,198 |
| 62,800 | | Medtronic, Inc. | | | 3,209,708 |
| 16,100 | | Zimmer Holdings, Inc. (a) | | | 1,249,199 |
|
| | | | | | 18,010,557 |
|
| Healthcare Providers & Services — 2.8% |
| 194,000 | | UnitedHealth Group Inc. | | | 14,045,600 |
|
| Pharmaceuticals — 6.9% |
| 67,550 | | Barr Pharmaceuticals, Inc. (a) | | | 2,543,258 |
| 60,700 | | Johnson & Johnson | | | 3,543,666 |
| 136,800 | | Merck & Co., Inc. | | | 4,283,208 |
| 129,800 | | Novartis AG, Sponsored ADR | | | 6,231,698 |
| 641,400 | | Pfizer Inc. | | | 18,568,530 |
|
| | | | | | 35,170,360 |
|
| | | TOTAL HEALTHCARE | | | 77,268,504 |
|
| INDUSTRIALS — 11.3% |
| Aerospace & Defense — 4.2% |
| 152,800 | | Lockheed Martin Corp. | | | 8,417,752 |
| 153,100 | | Northrop Grumman Corp. | | | 7,922,925 |
| 127,900 | | United Defense Industries, Inc. (a) | | | 5,133,906 |
|
| | | | | | 21,474,583 |
|
| Airlines — 2.0% |
| 172,000 | | AirTran Holdings, Inc. (a)(b) | | | 1,998,640 |
| 587,325 | | Delta Air Lines, Inc. (a)(b) | | | 3,200,921 |
| 169,200 | | Northwest Airlines Corp. (a)(b) | | | 1,497,420 |
| 230,600 | | Southwest Airlines Co. | | | 3,636,562 |
|
| | | | | | 10,333,543 |
|
| Electrical Equipment — 0.4% |
| 107,722 | | American Power Conversion Corp. (b) | | | 2,076,880 |
|
| Industrial Conglomerates — 3.7% |
| 120,700 | | General Electric Co. | | | 4,118,284 |
| 291,400 | | Honeywell International Inc. | | | 9,814,352 |
| 64,400 | | Siemens AG, Sponsored ADR (b) | | | 4,813,256 |
|
| | | | | | 18,745,892 |
|
See Notes to Financial Statements.
32 Travelers Series Fund Inc. | 2004 Annual Report
| | |
| Schedule of Investments (continued) | | October 31, 2004 |
STRATEGIC EQUITY PORTFOLIO
| | | | | |
| SHARES | | SECURITY | | VALUE |
| Machinery — 0.8% |
| 46,900 | | ITT Industries, Inc. | | $ | 3,805,466 |
|
| Road & Rail — 0.2% |
| 60,573 | | Swift Transportation Co., Inc. (a)(b) | | | 1,144,830 |
|
| | | TOTAL INDUSTRIALS | | | 57,581,194 |
|
| INFORMATION TECHNOLOGY — 17.3% |
| Communications Equipment — 5.5% |
| 395,100 | | Alcatel SA, Sponsored ADR (a)(b) | | | 5,772,411 |
| 1,653,300 | | CIENA Corp. (a) | | | 4,083,651 |
| 379,400 | | Cisco Systems, Inc. (a) | | | 7,288,274 |
| 136,600 | | Extreme Networks, Inc. (a) | | | 799,110 |
| 32,200 | | Finisar Corp. (a) | | | 47,012 |
| 117,100 | | Harmonic Inc. (a)(b) | | | 974,272 |
| 907,200 | | JDS Uniphase Corp. (a)(b) | | | 2,875,824 |
| 60,900 | | Juniper Networks, Inc. (a) | | | 1,620,549 |
| 1,117,100 | | Lucent Technologies Inc. (a)(b) | | | 3,965,705 |
| 28,200 | | Motorola, Inc. | | | 486,732 |
|
| | | | | | 27,913,540 |
|
| Computers & Peripherals — 2.0% |
| 8,504 | | Dell Inc. (a) | | | 298,150 |
| 721,700 | | EMC Corp. (a) | | | 9,288,279 |
| 81,100 | | Western Digital Corp. (a) | | | 675,563 |
|
| | | | | | 10,261,992 |
|
| Electronic Equipment & Instruments — 1.5% |
| 162,300 | | Diebold, Inc. (b) | | | 7,766,055 |
|
| Internet Software & Services — 1.2% |
| 320,190 | | DoubleClick, Inc. (a)(b) | | | 2,036,408 |
| 2,000 | | IAC/InterActiveCorp. (a) | | | 43,240 |
| 40,141 | | NetRatings, Inc. (a)(b) | | | 757,059 |
| 89,500 | | Yahoo! Inc. (a) | | | 3,239,005 |
|
| | | | | | 6,075,712 |
|
| Semiconductor Equipment & Products — 3.7% |
| 77,000 | | Credence Systems Corp. (a)(b) | | | 581,350 |
| 24,200 | | Cymer, Inc. (a)(b) | | | 690,184 |
| 19,000 | | Integrated Circuit Systems, Inc. (a) | | | 428,450 |
| 235,800 | | Integrated Device Technology, Inc. (a)(b) | | | 2,787,156 |
| 70,200 | | LTX Corp. (a)(b) | | | 456,300 |
| 99,300 | | Microchip Technology Inc. | | | 3,003,825 |
| 145,400 | | National Semiconductor Corp. | | | 2,428,180 |
| 96,800 | | PMC-Sierra, Inc. (a)(b) | | | 993,168 |
| 25,800 | | SiRF Technology Holdings, Inc. (a) | | | 305,472 |
| 282,200 | | Texas Instruments Inc. | | | 6,899,790 |
|
| | | | | | 18,573,875 |
|
See Notes to Financial Statements.
33 Travelers Series Fund Inc. | 2004 Annual Report
| | |
| Schedule of Investments (continued) | | October 31, 2004 |
STRATEGIC EQUITY PORTFOLIO
| | | | | |
| SHARES | | SECURITY | | VALUE |
| Software — 3.4% |
| 16,400 | | BEA Systems, Inc. (a)(b) | | $ | 133,168 |
| 29,200 | | Cognos, Inc. (a)(b) | | | 1,153,692 |
| 545,423 | | Microsoft Corp. | | | 15,266,390 |
| 17,800 | | NDS Group PLC, Sponsored ADR (a) | | | 465,826 |
| 900 | | Salesforce.com, Inc. (a) | | | 18,288 |
|
| | | | | | 17,037,364 |
|
| | | TOTAL INFORMATION TECHNOLOGY | | | 87,628,538 |
|
| MATERIALS — 0.1% |
| Metals & Mining — 0.1% |
| 10,200 | | Peabody Energy Corp. | | | 650,556 |
|
| TELECOMMUNICATION SERVICES — 12.6% |
| Diversified Telecommunication Services — 12.6% |
| 282,200 | | BellSouth Corp. | | | 7,526,274 |
| 959,000 | | SBC Communications Inc. | | | 24,224,340 |
| 819,700 | | Verizon Communications Inc. | | | 32,050,270 |
|
| | | TOTAL TELECOMMUNICATION SERVICES | | | 63,800,884 |
|
| | | TOTAL COMMON STOCK (Cost — $442,568,878) | | | 456,209,004 |
|
| FOREIGN STOCK – 4.7% |
| Canada — 0.3% |
| 17,400 | | Cognos, Inc. (a) | | | 689,412 |
| 39,100 | | Goldcorp Inc. | | | 540,537 |
| 33,800 | | Meridian Gold Inc. (a)(b) | | | 571,412 |
|
| | | | | | 1,801,361 |
|
| Japan — 1.3% |
| 274,000 | | Fujitsu Ltd. | | | 1,630,768 |
| 40,300 | | Tokyo Electron Ltd. | | | 2,185,672 |
| 566 | | Yahoo Japan Corp. (a)(b) | | | 2,557,197 |
|
| | | | | | 6,373,637 |
|
| Switzerland — 3.1% |
| 153,619 | | Roche Holding AG (b) | | | 15,688,749 |
|
| | | TOTAL FOREIGN STOCK (Cost — $23,852,249) | | | 23,863,747 |
|
| PREFERRED STOCK — 0.2% |
| ENERGY — 0.2% |
| Oil & Gas — 0.2% |
| 12,900 | | Chesapeake Energy Corp., 6.000% Cumulative Convertible
(Cost — $770,517) | | | 1,062,638 |
|
See Notes to Financial Statements.
34 Travelers Series Fund Inc. | 2004 Annual Report
| | |
| Schedule of Investments (continued) | | October 31, 2004 |
STRATEGIC EQUITY PORTFOLIO
| | | | | | |
FACE
AMOUNT | | SECURITY | | VALUE | |
| CONVERTIBLE BONDS — 0.4% | |
| INFORMATION TECHNOLOGY — 0.4% | |
| Communications Equipment — 0.4% | |
| $ 2,550,000 | | CIENA Corp., Notes, 3.750% due 2/1/08
(Cost — $2,322,561) | | $ | 2,129,250 | |
|
|
| REPURCHASE AGREEMENT — 5.9% | |
| 29,617,000 | | State Street Bank & Trust Co. dated 10/29/04, 1.700% due 11/1/04; Proceeds at maturity — $29,621,196; (Fully collateralized by U.S. Treasury Bonds, 6.125% due 8/15/29; Market value — $30,213,659) (Cost — $29,617,000) | | | 29,617,000 | |
|
|
| | | TOTAL INVESTMENTS — 101.0% (Cost — $499,131,205*) | | | 512,881,639 | |
| | | Liabilities in Excess of Other Assets — (1.0)% | | | (4,985,546 | ) |
|
|
| | | TOTAL NET ASSETS — 100.0% | | $ | 507,896,093 | |
|
|
| LOANED SECURITIES COLLATERAL | |
| 50,285,107 | | State Street Navigator Securities Lending Trust Prime Portfolio
(Cost — $50,285,107) | | $ | 50,285,107 | |
|
|
| (a) | | Non-income producing security. |
| (b) | | All or a portion of this security is on loan (See Notes 1 and 3). |
| * | | Aggregate cost for Federal income tax purposes is $502,853,928. |
Abbreviation used in this schedule:
ADR — American Depositary Receipt
See Notes to Financial Statements.
35 Travelers Series Fund Inc. | 2004 Annual Report
| | |
| Schedule of Investments (continued) | | October 31, 2004 |
VAN KAMPEN ENTERPRISE PORTFOLIO
| | | | | |
| SHARES | | SECURITY | | VALUE |
| COMMON STOCK — 96.7% | | | |
| CONSUMER DISCRETIONARY — 15.1% | | | |
| Hotels, Restaurants & Leisure — 8.3% | | | |
| 45,300 | | Carnival Corp. | | $ | 2,290,368 |
| 12,700 | | Harrah’s Entertainment, Inc. (a) | | | 743,204 |
| 30,200 | | Marriott International, Inc., Class A Shares | | | 1,645,598 |
| 40,700 | | Starwood Hotels & Resorts Worldwide, Inc. | | | 1,942,611 |
|
| | | | | | 6,621,781 |
|
| Media — 3.7% | | | |
| | | The News Corp. Ltd.: | | | |
| 13,800 | | Sponsored ADR (a) | | | 445,188 |
| 41,100 | | Sponsored Preferred ADR | | | 1,292,184 |
| 46,300 | | The Walt Disney Co. | | | 1,167,686 |
|
| | | | | | 2,905,058 |
|
| Multi-Line Retail — 3.1% | | | |
| 14,900 | | Target Corp. | | | 745,298 |
| 32,100 | | Wal-Mart Stores, Inc. | | | 1,730,832 |
|
| | | | | | 2,476,130 |
|
| | | TOTAL CONSUMER DISCRETIONARY | | | 12,002,969 |
|
| CONSUMER STAPLES — 7.9% | | | |
| Beverages — 1.9% | | | |
| 14,200 | | Brown-Forman Corp., Class B Shares | | | 637,580 |
| 17,600 | | PepsiCo, Inc. | | | 872,608 |
|
| | | | | | 1,510,188 |
|
| Food & Drug Retailing — 1.5% | | | |
| 27,800 | | CVS Corp. | | | 1,208,188 |
|
| Household Products — 2.8% | | | |
| 7,500 | | The Clorox Co. | | | 409,500 |
| 35,700 | | The Procter & Gamble Co. | | | 1,827,126 |
|
| | | | | | 2,236,626 |
|
| Personal Products — 1.7% | | | |
| 23,000 | | Avon Products, Inc. | | | 909,650 |
| 10,000 | | The Gillette Co. | | | 414,800 |
|
| | | | | | 1,324,450 |
|
| | | TOTAL CONSUMER STAPLES | | | 6,279,452 |
|
| ENERGY — 4.8% | | | |
| Energy Equipment & Services — 1.4% | | | |
| 25,200 | | Baker Hughes Inc. | | | 1,079,316 |
|
See Notes to Financial Statements.
36 Travelers Series Fund Inc. | 2004 Annual Report
| | |
| Schedule of Investments (continued) | | October 31, 2004 |
VAN KAMPEN ENTERPRISE PORTFOLIO
| | | | | |
| SHARES | | SECURITY | | VALUE |
| Oil & Gas — 3.4% | | | |
| 13,200 | | ConocoPhillips | | $ | 1,112,892 |
| 22,400 | | Exxon Mobil Corp. | | | 1,102,528 |
| 4,900 | | Total SA, Sponsored ADR (a) | | | 510,972 |
|
| | | | | | 2,726,392 |
|
| | | TOTAL ENERGY | | | 3,805,708 |
|
| FINANCIALS — 8.7% | | | |
| Banks — 4.1% | | | |
| 40,500 | | Bank of America Corp. | | | 1,813,995 |
| 24,000 | | Wells Fargo & Co. | | | 1,433,280 |
|
| | | | | | 3,247,275 |
|
| Diversified Financials — 4.6% | | | |
| 27,900 | | American Express Co. | | | 1,480,653 |
| 31,750 | | JPMorgan Chase & Co. | | | 1,225,550 |
| 17,900 | | Merrill Lynch & Co., Inc. | | | 965,526 |
|
| | | | | | 3,671,729 |
|
| | | TOTAL FINANCIALS | | | 6,919,004 |
|
| HEALTHCARE — 22.4% | | | |
| Biotechnology — 6.5% | | | |
| 26,300 | | Amgen Inc. (b) | | | 1,493,840 |
| 14,700 | | Biogen Idec Inc. (b) | | | 854,952 |
| 46,400 | | Celgene Corp. (b) | | | 1,374,368 |
| 41,500 | | Gilead Sciences, Inc. (b) | | | 1,437,145 |
|
| | | | | | 5,160,305 |
|
| Healthcare Equipment & Supplies — 4.0% | | | |
| 29,300 | | Medtronic, Inc. | | | 1,497,523 |
| 10,800 | | St. Jude Medical, Inc. (b) | | | 826,956 |
| 11,300 | | Zimmer Holdings, Inc. (b) | | | 876,767 |
|
| | | | | | 3,201,246 |
|
| Healthcare Providers & Services — 3.0% | | | |
| 24,200 | | Laboratory Corp. of America Holdings (b) | | | 1,108,360 |
| 17,000 | | UnitedHealth Group Inc. | | | 1,230,800 |
|
| | | | | | 2,339,160 |
|
| Pharmaceuticals — 8.9% | | | |
| 14,300 | | Allergan, Inc. | | | 1,023,308 |
| 15,600 | | Eli Lilly and Co. | | | 856,596 |
| 22,500 | | Johnson & Johnson | | | 1,313,550 |
| 25,450 | | Pfizer Inc. | | | 736,778 |
| 101,500 | | Schering-Plough Corp. | | | 1,838,165 |
See Notes to Financial Statements.
37 Travelers Series Fund Inc. | 2004 Annual Report
| | |
| Schedule of Investments (continued) | | October 31, 2004 |
VAN KAMPEN ENTERPRISE PORTFOLIO
| | | | | |
| SHARES | | SECURITY | | VALUE |
| Pharmaceuticals — 8.9% (continued) |
| 31,700 | | Wyeth | | $ | 1,256,905 |
|
| | | | | | 7,025,302 |
|
| | | TOTAL HEALTHCARE | | | 17,726,013 |
|
| INDUSTRIALS — 10.6% | | | |
| Aerospace & Defense — 2.5% | | | |
| 28,000 | | Goodrich Corp. | | | 863,240 |
| 11,700 | | United Technologies Corp. | | | 1,085,994 |
|
| | | | | | 1,949,234 |
|
| Commercial Services & Supplies — 1.4% | | | |
| 25,500 | | Automatic Data Processing, Inc. | | | 1,106,445 |
|
| Industrial Conglomerates — 5.0% | | | |
| 68,500 | | General Electric Co. | | | 2,337,220 |
| 51,900 | | Tyco International Ltd. | | | 1,616,685 |
|
| | | | | | 3,953,905 |
|
| Machinery — 1.7% | | | |
| 13,600 | | Danaher Corp. | | | 749,768 |
| 9,100 | | Ingersoll-Rand Co., Class A Shares | | | 622,804 |
|
| | | | | | 1,372,572 |
|
| | | TOTAL INDUSTRIALS | | | 8,382,156 |
|
| INFORMATION TECHNOLOGY — 23.4% | | | |
| Communications Equipment — 7.1% | | | |
| 25,900 | | ADTRAN, Inc. | | | 559,440 |
| 25,600 | | Andrew Corp. (a)(b) | | | 357,888 |
| 42,500 | | Cisco Systems, Inc. (b) | | | 816,425 |
| 69,000 | | Comverse Technology, Inc. (b) | | | 1,424,160 |
| 28,900 | | QUALCOMM Inc. | | | 1,208,309 |
| 14,300 | | Research In Motion Ltd. (b) | | | 1,261,260 |
|
| | | | | | 5,627,482 |
|
| Computers & Peripherals — 6.5% | | | |
| 57,700 | | Dell Inc. (b) | | | 2,022,962 |
| 64,100 | | EMC Corp. (b) | | | 824,967 |
| 19,600 | | International Business Machines Corp. | | | 1,759,100 |
| 6,800 | | Lexmark International, Inc., Class A Shares (b) | | | 565,148 |
|
| | | | | | 5,172,177 |
|
| Electronic Equipment & Instruments — 0.4% | | | |
| 6,400 | | Mettler-Toledo International Inc. (b) | | | 306,560 |
|
| Internet Software & Services — 1.7% | | | |
| 36,400 | | Yahoo! Inc. (b) | | | 1,317,316 |
|
See Notes to Financial Statements.
38 Travelers Series Fund Inc. | 2004 Annual Report
| | |
| Schedule of Investments (continued) | | October 31, 2004 |
VAN KAMPEN ENTERPRISE PORTFOLIO
| | | | | | |
| SHARES | | SECURITY | | VALUE | |
| Semiconductor Equipment & Products — 1.7% | | | | |
| 7,400 | | Analog Devices, Inc. | | $ | 297,924 | |
| 28,400 | | Intel Corp. | | | 632,184 | |
| 10,600 | | Linear Technology Corp. | | | 401,528 | |
|
|
| | | | | | 1,331,636 | |
|
|
| Software — 6.0% | | | | |
| 22,600 | | Adobe Systems, Inc. | | | 1,266,278 | |
| 61,400 | | Microsoft Corp. | | | 1,718,586 | |
| 33,000 | | SAP AG, Sponsored ADR | | | 1,407,450 | |
| 7,200 | | Symantec Corp. (b) | | | 409,968 | |
|
|
| | | | | | 4,802,282 | |
|
|
| | | TOTAL INFORMATION TECHNOLOGY | | | 18,557,453 | |
|
|
| TELECOMMUNICATION SERVICES — 3.8% | | | | |
| Diversified Telecommunication Services — 3.8% | | | | |
| 73,000 | | Sprint Corp. | | | 1,529,350 | |
| 36,800 | | Verizon Communications Inc. | | | 1,438,880 | |
|
|
| | | TOTAL TELECOMMUNICATION SERVICES | | | 2,968,230 | |
|
|
| | | TOTAL COMMON STOCK
(Cost — $73,137,812) | | | 76,640,985 | |
|
|
FACE
AMOUNT | | | | | |
| SHORT-TERM INVESTMENTS — 3.4% | | | | |
| $2,734,000 | | Federal Home Loan Bank, Discount Notes, due 11/1/04 (Cost — $2,734,000) | | | 2,734,000 | |
|
|
| | | TOTAL INVESTMENTS — 100.1% (Cost — $75,871,812*) | | | 79,374,985 | |
| | | Liabilities in Excess of Other Assets — (0.1)% | | | (89,259 | ) |
|
|
| | | TOTAL NET ASSETS — 100.0% | | $ | 79,285,726 | |
|
|
| LOANED SECURITIES COLLATERAL | | | | |
| 2,023,700 | | State Street Navigator Securities Lending Trust Prime Portfolio (Cost — $2,023,700) | | $ | 2,023,700 | |
|
|
| (a) | | All or a portion of this security is on loan (See Notes 1 and 3). |
| (b) | | Non-income producing security. |
| * | | Aggregate cost for Federal income tax purposes is $76,252,478. |
Abbreviation used in this schedule:
ADR — American Depositary Receipt
See Notes to Financial Statements.
39 Travelers Series Fund Inc. | 2004 Annual Report
| | |
| Statements of Assets and Liabilities | | October 31, 2004 |
| | | | | | | | | | | | |
| | | Smith Barney
Large Cap
Value
Portfolio | | | Strategic
Equity
Portfolio | | | Van Kampen
Enterprise
Portfolio | |
| ASSETS: | | | | | | | | | | | | |
Investments, at value (Cost — $302,493,269, $499,131,205 and $75,871,812, respectively) | | $ | 328,399,998 | | | $ | 512,881,639 | | | $ | 79,374,985 | |
Loaned securities collateral, at value
(Cost — $0, $50,285,107 and $2,023,700 respectively) (Notes 1 and 3) | | | — | | | | 50,285,107 | | | | 2,023,700 | |
Cash | | | 865 | | | | 1,193,897 | | | | 1,253 | |
Receivable for securities sold | | | 6,830,043 | | | | 26,664,542 | | | | — | |
Dividends and interest receivable | | | 353,485 | | | | 846,467 | | | | 59,605 | |
Receivable for open forward foreign currency contracts (Notes 1 and 3) | | | — | | | | 10,451 | | | | — | |
Receivable for Fund shares sold | | | 54,686 | | | | — | | | | — | |
Prepaid expenses | | | 9,267 | | | | 12,742 | | | | 3,919 | |
Other receivables | | | 3,802 | | | | 45,133 | | | | 4,592 | |
|
|
Total Assets | | | 335,652,146 | | | | 591,939,978 | | | | 81,468,054 | |
|
|
| LIABILITIES: | | | | | | | | | | | | |
Payable for securities purchased | | | 1,827,746 | | | | 32,862,709 | | | | — | |
Payable for Fund shares reacquired | | | 250,091 | | | | 503,199 | | | | 60,930 | |
Management fees payable | | | 167,210 | | | | 325,387 | | | | 45,296 | |
Payable for loaned securities collateral
(Notes 1 and 3) | | | — | | | | 50,285,107 | | | | 2,023,700 | |
Accrued expenses | | | 55,399 | | | | 67,483 | | | | 52,402 | |
|
|
Total Liabilities | | | 2,300,446 | | | | 84,043,885 | | | | 2,182,328 | |
|
|
Total Net Assets | | $ | 333,351,700 | | | $ | 507,896,093 | | | $ | 79,285,726 | |
|
|
| NET ASSETS: | | | | | | | | | | | | |
Par value of capital shares ($0.00001 par value, $6,000,000,000 shares authorized) | | $ | 195 | | | $ | 309 | | | $ | 72 | |
Capital paid in excess of par value | | | 347,059,746 | | | | 724,896,976 | | | | 146,229,394 | |
Undistributed net investment income | | | 4,429,540 | | | | 4,340,700 | | | | 171,496 | |
Accumulated net realized loss from investment transactions and futures contracts | | | (44,044,510 | ) | | | (235,093,805 | ) | | | (70,618,409 | ) |
Net unrealized appreciation of investments and foreign currencies | | | 25,906,729 | | | | 13,751,913 | | | | 3,503,173 | |
|
|
Total Net Assets | | $ | 333,351,700 | | | $ | 507,896,093 | | | $ | 79,285,726 | |
|
|
Shares Outstanding | | | 19,504,913 | | | | 30,895,419 | | | | 7,194,756 | |
|
|
Net Asset Value | | | $17.09 | | | | $16.44 | | | | $11.02 | |
|
|
See Notes to Financial Statements.
40 Travelers Series Fund Inc. | 2004 Annual Report
| | |
| Statements of Operations | | For the Year Ended October 31, 2004 |
| | | | | | | | | | | | |
| | | Smith Barney
Large Cap
Value
Portfolio | | | Strategic
Equity
Portfolio | | | Van Kampen
Enterprise
Portfolio | |
| INVESTMENT INCOME: | | | | | | | | | | | | |
Dividends | | $ | 7,493,204 | | | $ | 7,882,987 | | | $ | 904,178 | |
Interest (Notes 1 and 3) | | | 89,120 | | | | 764,103 | | | | 54,684 | |
Less: Foreign withholding tax | | | (95,915 | ) | | | (40,913 | ) | | | (11,622 | ) |
|
|
Total Investment Income | | | 7,486,409 | | | | 8,606,177 | | | | 947,240 | |
|
|
| EXPENSES: | | | | | | | | | | | | |
Management fees (Note 2) | | | 2,303,815 | | | | 4,309,824 | | | | 626,777 | |
Audit and legal | | | 53,756 | | | | 51,071 | | | | 41,536 | |
Custody | | | 44,921 | | | | 114,717 | | | | 22,731 | |
Shareholder communications | | | 38,207 | | | | 53,033 | | | | 11,253 | |
Directors’ fees | | | 18,757 | | | | 20,392 | | | | 9,247 | |
Transfer agency services (Note 2) | | | 7,120 | | | | 6,153 | | | | 5,115 | |
Insurance fees | | | 2,160 | | | | 2,757 | | | | 893 | |
Other | | | 4,266 | | | | 1,884 | | | | 2,800 | |
|
|
Total Expenses | | | 2,473,002 | | | | 4,559,831 | | | | 720,352 | |
Less: Management fee waiver (Notes 2 and 7) | | | (1,741 | ) | | | (1,741 | ) | | | (1,704 | ) |
Expense reimbursement (Note 4) | | | — | | | | (302,201 | ) | | | — | |
|
|
Net Expenses | | | 2,471,261 | | | | 4,255,889 | | | | 718,648 | |
|
|
Net Investment Income | | | 5,015,148 | | | | 4,350,288 | | | | 228,592 | |
|
|
REALIZED AND UNREALIZED GAIN
(LOSS) ON INVESTMENTS, FUTURES CONTRACTS AND FOREIGN
CURRENCIES (NOTES 1 AND 3): | | | | | | | | | | | | |
Realized Gain (Loss) From: | | | | | | | | | | | | |
Investment transactions | | | 22,083,608 | | | | 30,270,526 | | | | 9,114,312 | |
Futures contracts | | | — | | | | 28,081 | | | | — | |
Foreign currency transactions | | | — | | | | (10,508 | ) | | | — | |
|
|
Net Realized Gain | | | 22,083,608 | | | | 30,288,099 | | | | 9,114,312 | |
|
|
Net Change in Unrealized Appreciation From: | | | | | | | | | | | | |
Investments | | | 10,192,674 | | | | 9,521,033 | | | | (9,035,638 | ) |
Foreign currencies | | | — | | | | 2,034 | | | | — | |
|
|
Net Increase (Decrease) in Unrealized Appreciation | | | 10,192,674 | | | | 9,523,067 | | | | (9,035,638 | ) |
|
|
Net Gain on Investments, Futures
Contracts and Foreign Currencies | | | 32,276,282 | | | | 39,811,166 | | | | 78,674 | |
|
|
Increase in Net Assets From Operations | | $ | 37,291,430 | | | $ | 44,161,454 | | | $ | 307,266 | |
|
|
See Notes to Financial Statements.
41 Travelers Series Fund Inc. | 2004 Annual Report
| | |
| Statements of Changes in Net Assets | | |
| | | | | | | | |
| | | For the Years
Ended October 31, | |
| Smith Barney Large Cap Value Portfolio | | 2004 | | | 2003 | |
| OPERATIONS: | | | | | | | | |
Net investment income | | $ | 5,015,148 | | | $ | 6,407,784 | |
Net realized gain (loss) | | | 22,083,608 | | | | (24,803,070 | ) |
Net increase in unrealized appreciation | | | 10,192,674 | | | | 85,797,301 | |
|
|
Increase in Net Assets From Operations | | | 37,291,430 | | | | 67,402,015 | |
|
|
| DIVIDENDS TO SHAREHOLDERS FROM: | | | | | | | | |
Net investment income | | | (5,914,007 | ) | | | (8,408,520 | ) |
|
|
Decrease in Net Assets From
Dividends to Shareholders | | | (5,914,007 | ) | | | (8,408,520 | ) |
|
|
| FUND SHARE TRANSACTIONS (NOTE 5): | | | | | | | | |
Net proceeds from sale of shares | | | 4,321,708 | | | | 5,713,731 | |
Net asset value of shares issued for reinvestment of distributions | | | 5,914,007 | | | | 8,408,520 | |
Cost of shares reacquired | | | (74,452,875 | ) | | | (53,330,305 | ) |
|
|
Decrease in Net Assets From Fund Share Transactions | | | (64,217,160 | ) | | | (39,208,054 | ) |
|
|
Increase (Decrease) in Net Assets | | | (32,839,737 | ) | | | 19,785,441 | |
| NET ASSETS: | | | | | | | | |
Beginning of year | | | 366,191,437 | | | | 346,405,996 | |
|
|
End of year* | | $ | 333,351,700 | | | $ | 366,191,437 | |
|
|
* Includes undistributed net investment income of: | | | $4,429,540 | | | | $5,405,195 | |
|
|
See Notes to Financial Statements.
42 Travelers Series Fund Inc. | 2004 Annual Report
| | |
| Statements of Changes in Net Assets (continued) | | |
| | | | | | | | |
| | | For the Years
Ended October 31, | |
| Strategic Equity Portfolio | | 2004 | | | 2003 | |
| OPERATIONS: | | | | | | | | |
Net investment income (loss) | | $ | 4,350,288 | | | $ | (1,010,341 | ) |
Net realized gain | | | 30,288,099 | | | | 43,899,096 | |
Net increase in unrealized appreciation | | | 9,523,067 | | | | 53,566,083 | |
|
|
Increase in Net Assets From Operations | | | 44,161,454 | | | | 96,454,838 | |
|
|
| DIVIDENDS TO SHAREHOLDERS FROM: | | | | | | | | |
Net investment income | | | — | | | | (650,759 | ) |
|
|
Decrease in Net Assets From
Dividends to Shareholders | | | — | | | | (650,759 | ) |
|
|
| FUND SHARE TRANSACTIONS (NOTE 5): | | | | | | | | |
Net proceeds from sale of shares | | | 1,522,056 | | | | 6,126,116 | |
Net asset value of shares issued for reinvestment of distributions | | | — | | | | 650,759 | |
Cost of shares reacquired | | | (87,338,249 | ) | | | (68,747,111 | ) |
|
|
Decrease in Net Assets From Fund Share Transactions | | | (85,816,193 | ) | | | (61,970,236 | ) |
|
|
Increase (Decrease) in Net Assets | | | (41,654,739 | ) | | | 33,833,843 | |
| NET ASSETS: | | | | | | | | |
Beginning of year | | | 549,550,832 | | | | 515,716,989 | |
|
|
End of year* | | $ | 507,896,093 | | | $ | 549,550,832 | |
|
|
* Includes undistributed net investment income of: | | | $4,340,700 | | | | $920 | |
|
|
See Notes to Financial Statements.
43 Travelers Series Fund Inc. | 2004 Annual Report
| | |
| Statements of Changes in Net Assets (continued) | | |
| | | | | | | | |
| | | For the Years
Ended October 31, | |
| Van Kampen Enterprise Portfolio | | 2004 | | | 2003 | |
| OPERATIONS: | | | | | | | | |
Net investment income | | $ | 228,592 | | | $ | 120,944 | |
Net realized gain (loss) | | | 9,114,312 | | | | (6,797,326 | ) |
Net increase (decrease) in unrealized appreciation | | | (9,035,638 | ) | | | 21,950,369 | |
|
|
Increase in Net Assets From Operations | | | 307,266 | | | | 15,273,987 | |
|
|
| DIVIDENDS TO SHAREHOLDERS FROM: | | | | | | | | |
Net investment income | | | (134,925 | ) | | | (471,638 | ) |
|
|
Decrease in Net Assets From
Dividends to Shareholders | | | (134,925 | ) | | | (471,638 | ) |
|
|
| FUND SHARE TRANSACTIONS (NOTE 5): | | | | | | | | |
Net proceeds from sale of shares | | | 1,291,178 | | | | 966,979 | |
Net asset value of shares issued for reinvestment of distributions | | | 134,925 | | | | 471,638 | |
Cost of shares reacquired | | | (18,943,158 | ) | | | (19,790,502 | ) |
|
|
Decrease in Net Assets From Fund Share Transactions | | | (17,517,055 | ) | | | (18,351,885 | ) |
|
|
Decrease in Net Assets | | | (17,344,714 | ) | | | (3,549,536 | ) |
| NET ASSETS: | | | | | | | | |
Beginning of year | | | 96,630,440 | | | | 100,179,976 | |
|
|
End of year* | | $ | 79,285,726 | | | $ | 96,630,440 | |
|
|
* Includes undistributed net investment income of: | | | $171,496 | | | | $77,829 | |
|
|
See Notes to Financial Statements.
44 Travelers Series Fund Inc. | 2004 Annual Report
For a share of capital stock outstanding throughout each year ended October 31, unless otherwise noted:
| | | | | | | | | | | | | | | |
Smith Barney
Large Cap Value Portfolio | | 2004 | | | 2003 | | | 2002 | | | 2001 | | | 2000 | |
Net Asset Value, Beginning of Year | | $15.68 | | | $13.24 | | | $17.47 | | | $20.74 | | | $19.83 | |
|
|
Income (Loss) From Operations: | | | | | | | | | | | | | | | |
Net investment income | | 0.26 | | | 0.28 | | | 0.32 | | | 0.26 | | | 0.30 | |
Net realized and unrealized gain (loss) | | 1.41 | | | 2.49 | | | (4.24 | ) | | (2.56 | ) | | 1.34 | |
|
|
Total Income (Loss) From Operations | | 1.67 | | | 2.77 | | | (3.92 | ) | | (2.30 | ) | | 1.64 | |
|
|
Less Dividends and Distributions From: | | | | | | | | | | | | | | | |
Net investment income | | (0.26 | ) | | (0.33 | ) | | (0.31 | ) | | (0.27 | ) | | (0.26 | ) |
Net realized gains | | — | | | — | | | — | | | (0.70 | ) | | (0.47 | ) |
|
|
Total Dividends and Distributions | | (0.26 | ) | | (0.33 | ) | | (0.31 | ) | | (0.97 | ) | | (0.73 | ) |
|
|
Net Asset Value, End of Year | | $17.09 | | | $15.68 | | | $13.24 | | | $17.47 | | | $20.74 | |
|
|
Total Return(1) | | 10.69 | % | | 21.38 | % | | (22.45 | )% | | (11.58 | )% | | 8.62 | % |
|
|
Net Assets, End of Year (millions) | | $333 | | | $366 | | | $346 | | | $504 | | | $553 | |
|
|
Ratios to Average Net Assets: | | | | | | | | | | | | | | | |
Expenses | | 0.68 | %(2) | | 0.69 | % | | 0.68 | % | | 0.67 | % | | 0.66 | % |
Net investment income | | 1.38 | | | 1.85 | | | 1.59 | | | 1.42 | | | 1.45 | |
|
|
Portfolio Turnover Rate | | 37 | % | | 96 | % | | 68 | % | | 29 | % | | 23 | % |
|
|
| (1) | | Performance figures may reflect fee waivers and/or expense reimbursements. Past performance is no guarantee of future results. In the absence of fee waivers and/or expense reimbursements, the total return would be lower. Total returns do not reflect expenses associated with the separate account such as administrative fees, account charges and surrender charges which, if reflected, would reduce the total returns for all period shown. |
| (2) | | The investment manager waived a portion of its management fee for the year ended October 31, 2004. The actual expense ratio did not change due to these waivers. |
See Notes to Financial Statements.
45 Travelers Series Fund Inc. | 2004 Annual Report
| | |
| Financial Highlights (continued) | | |
For a share of capital stock outstanding throughout each year ended October 31, unless otherwise noted:
| | | | | | | | | | | | | | | |
| Strategic Equity Portfolio | | 2004 | | | 2003 | | | 2002 | | | 2001 | | | 2000 | |
Net Asset Value, Beginning of Year | | $15.16 | | | $12.59 | | | $16.67 | | | $28.63 | | | $28.35 | |
|
|
Income (Loss) From Operations: | | | | | | | | | | | | | | | |
Net investment income (loss) | | 0.14 | | | (0.03 | ) | | 0.04 | | | 0.07 | | | 0.05 | |
Net realized and unrealized gain (loss) | | 1.14 | | | 2.62 | | | (4.05 | ) | | (8.60 | ) | | 2.66 | |
|
|
Total Income (Loss) From Operations | | 1.28 | | | 2.59 | | | (4.01 | ) | | (8.53 | ) | | 2.71 | |
|
|
Less Dividends and Distributions From: | | | | | | | | | | | | | | | |
Net investment income | | — | | | (0.02 | ) | | (0.07 | ) | | (0.05 | ) | | (0.03 | ) |
Net realized gains | | — | | | — | | | — | | | (3.38 | ) | | (2.40 | ) |
|
|
Total Dividends and Distributions | | — | | | (0.02 | ) | | (0.07 | ) | | (3.43 | ) | | (2.43 | ) |
|
|
Net Asset Value, End of Year | | $16.44 | | | $15.16 | | | $12.59 | | | $16.67 | | | $28.63 | |
|
|
Total Return(1) | | 8.44 | % | | 20.57 | % | | (24.05 | )% | | (32.05 | )% | | 9.27 | % |
|
|
Net Assets, End of Year (millions) | | $508 | | | $550 | | | $516 | | | $845 | | | $1,370 | |
|
|
Ratios to Average Net Assets: | | | | | | | | | | | | | | | |
Expenses | | 0.85 | %(2) | | 0.84 | % | | 0.83 | % | | 0.82 | % | | 0.81 | % |
Net investment income (loss) | | 0.8 | 1 | | (0.20 | ) | | 0.19 | | | 0.31 | | | 0.17 | |
|
|
Portfolio Turnover Rate | | 213 | % | | 167 | % | | 100 | % | | 46 | % | | 47 | % |
|
|
| (1) | | Performance figures may reflect fee waivers and/or expense reimbursements. Past performance is no guarantee of future results. In the absence of fee waivers and/or expense reimbursements, the total return would be lower. Total returns do not reflect expenses associated with the separate account such as administrative fees, account charges and surrender charges which, if reflected, would reduce the total returns for all period shown. |
| (2) | | The investment manager waived a portion of its management fee for the year ended October 31, 2004. The actual expense ratio did not change due to these waivers. |
See Notes to Financial Statements.
46 Travelers Series Fund Inc. | 2004 Annual Report
| | |
| Financial Highlights (continued) | | |
For a share of capital stock outstanding throughout each year ended October 31, unless otherwise noted:
| | | | | | | | | | | | | | | |
| Van Kampen Enterprise Portfolio | | 2004 | | | 2003 | | | 2002 | | | 2001 | | | 2000 | |
Net Asset Value, Beginning of Year | | $11.03 | | | $ 9.40 | | | $11.81 | | | $25.60 | | | $25.52 | |
|
|
Income (Loss) From Operations: | | | | | | | | | | | | | | | |
Net investment income (loss) | | 0.03 | | | 0.01 | | | 0.05 | | | 0.03 | | | (0.06 | ) |
Net realized and unrealized gain (loss) | | (0.02 | ) | | 1.67 | | | (2.42 | ) | | (9.05 | ) | | 3.87 | |
|
|
Total Income (Loss) From Operations | | 0.01 | | | 1.68 | | | (2.37 | ) | | (9.02 | ) | | 3.81 | |
|
|
Less Dividends and Distributions From: | | | | | | | | | | | | | | | |
Net investment income | | (0.02 | ) | | (0.05 | ) | | (0.04 | ) | | (0.00 | )* | | (0.00 | )* |
Net realized gains | | — | | | — | | | — | | | (4.77 | ) | | (3.73 | ) |
|
|
Total Dividends and Distributions | | (0.02 | ) | | (0.05 | ) | | (0.04 | ) | | (4.77 | ) | | (3.73 | ) |
|
|
Net Asset Value, End of Year | | $11.02 | | | $11.03 | | | $ 9.40 | | | $11.81 | | | $25.60 | |
|
|
Total Return(1) | | 0.05 | % | | 17.93 | % | | (20.07 | )% | | (37.52 | )% | | 13.92 | % |
|
|
Net Assets, End of Year (millions) | | $79 | | | $97 | | | $100 | | | $165 | | | $331 | |
|
|
Ratios to Average Net Assets: | | | | | | | | | | | | | | | |
Expenses | | 0.80 | %(2) | | 0.80 | % | | 0.76 | % | | 0.74 | % | | 0.72 | % |
Net investment income (loss) | | 0.26 | | | 0.13 | | | 0.30 | | | 0.18 | | | (0.22 | ) |
|
|
Portfolio Turnover Rate | | 157 | % | | 123 | % | | 87 | % | | 107 | % | | 117 | % |
|
|
| (1) | | Performance figures may reflect fee waivers and/or expense reimbursements. Past performance is no guarantee of future results. In the absence of fee waivers and/or expense reimbursements, the total return would be lower. Total returns do not reflect expenses associated with the separate account such as administrative fees, account charges and surrender charges which, if reflected, would reduce the total returns for all period shown. |
| (2) | | The investment adviser waived a portion of its management fee for the year ended October 31, 2004. The actual expense ratio did not change due to these waivers. |
| * | | Amount represents less than $0.01 per share. |
See Notes to Financial Statements.
47 Travelers Series Fund Inc. | 2004 Annual Report
Notes to Financial Statements
| 1. | Significant Accounting Policies |
The Smith Barney Large Cap Value Portfolio (“SBLCV”), Strategic Equity Portfolio (“SEP”) and Van Kampen Enterprise Portfolio (“VKEP”) (“Fund(s)”) are separate diversified investment funds of the Travelers Series Fund Inc. (“Company”). The Company, a Maryland corporation, is registered under the Investment Company Act of 1940, as amended, as an open-end management investment company.
The following are significant accounting policies consistently followed by the Funds and are in conformity with U.S. generally accepted accounting principles (“GAAP”). Estimates and assumptions are required to be made regarding assets, liabilities and changes in net assets resulting from operations when financial statements are prepared. Changes in the economic environment, financial markets and any other parameters used in determining these estimates could cause actual results to differ.
(a) Investment Valuation. Securities traded on national securities markets are valued at the closing price on such markets. Securities for which no sales price was reported and U.S. government obligations and agencies are valued at the mean between bid and asked prices. Securities listed on the NASDAQ National Market System for which market quotations are available are valued at the official closing price or, if there is no official closing price on that day, at the last sale price. Fixed income obligations are valued on the basis of valuations provided by dealers in those instruments or an independent pricing service approved by the Board of Directors. When market quotations or official closing prices are not readily available, or are determined not to reflect accurately fair value, such as when the value of a security has been significantly affected by events after the close of the exchange or market on which the security is principally traded, but before the Funds calculate their net asset value, the Funds may value these investments at fair value as determined in accordance with the procedures approved by the Funds’ Board of Directors. Fair valuing of securities may be determined with the assistance of a pricing service using calculations based on indices of domestic securities and other appropriate indicators, such as prices of relevant ADRs and futures contracts. Short-term obligations with maturities of 60 days or less are valued at amortized cost, which approximates value.
(b) Repurchase Agreements. When entering into repurchase agreements, it is the Funds’ policy that a custodian takes possession of the underlying collateral securities, the value of which at least equals the principal amount of the
48 Travelers Series Fund Inc. | 2004 Annual Report
Notes to Financial Statements (continued)
repurchase transaction, including accrued interest. To the extent that any repurchase transaction exceeds one business day, the value of the collateral is marked-to-market to ensure the adequacy of the collateral. If the seller defaults and the value of the collateral declines or if bankruptcy proceedings are commenced with respect to the seller of the security, realization of the collateral by the Funds may be delayed or limited.
(c) Forward Foreign Currency Contracts. SEP may from time to time enter into foreign currency contracts. A forward foreign currency contract is an agreement between two parties to buy and sell a currency at a set price on a future date. The contract is marked-to-market daily and the change in value is recorded by the Fund as an unrealized gain or loss. When a forward foreign currency contract is extinguished, through either delivery or offset by entering into another forward foreign currency contract, the Fund records a realized gain or loss equal to the difference between the value of the contract at the time it was opened and the value of the contract at the time it was extinguished or offset. The Fund bears the market risk that arises from changes in foreign currency exchange rates and the credit risk should a counterparty fail to meet the terms of such contracts.
(d) Lending of Portfolio Securities. The Funds have an agreement with their custodians whereby the custodians may lend securities owned by the Funds to brokers, dealers and other financial organizations, and receives a lender’s fee. Fees earned by the Funds on securities lending are recorded as interest income. Loans of securities by the Funds are collateralized by cash, U.S. government securities or high quality money market instruments that are maintained at all times in an amount at least equal to the current market value of the loaned securities, plus a margin which may vary depending on the type of securities loaned. The custodian establishes and maintains the collateral in a segregated account. The Funds maintain exposure for the risk of any losses in the investment of amounts received as collateral.
(e) Investment Transactions and Investment Income. Security transactions are accounted for on trade date. Dividend income is recorded on the ex-dividend date. Foreign dividends are recorded on the ex-dividend date or as soon as practical after the Funds determine the existence of a dividend declaration after exercising reasonable due diligence. Interest income, adjusted for
49 Travelers Series Fund Inc. | 2004 Annual Report
Notes to Financial Statements (continued)
amortization of premium and accretion of discount, is recorded on an accrual basis. Gains or losses on the sale of securities are calculated by using the specific identification method.
(f) Foreign Currency Translation. The books and records of the Funds are maintained in U.S. dollars. Transactions denominated in foreign currencies are recorded at the current prevailing exchange rates. All assets and liabilities denominated in foreign currencies are translated into U.S. dollar amounts at the current exchange rates at the end of the period. Translation gains or losses resulting from changes in the exchange rates during the reporting period and realized gains and losses on the settlement of foreign currency transactions are reported in the Statement of Operations for the current period. The Funds do not isolate that portion of realized gains and losses on investments in securities, which are due to changes in the foreign exchange rates from that which is due to changes in market prices of equity securities.
(g) Dividends and Distributions to Shareholders. Dividends and distributions to shareholders are recorded on the ex-dividend date. The Funds distribute dividends and capital gains, if any, at least annually. The character of income and gains to be distributed is determined in accordance with income tax regulations, which may differ from GAAP.
(h) Federal and Other Taxes. It is the Funds policy to comply with the federal income and excise tax requirements of the Internal Revenue Code of 1986, as amended, applicable to regulated investment companies. Accordingly, the Funds intend to distribute substantially all of its taxable income and net realized gains on investments, if any, to shareholders each year. Therefore, no federal income tax provision is required. Under the applicable foreign tax law, a withholding tax may be imposed on interest, dividends and capital gains at various rates.
(i) Reclassifications. GAAP requires that certain components of net assets be adjusted to reflect permanent differences between financial and tax reporting. Accordingly, during the current year, $76,796 has been reclassified between accumulated net realized loss from investment transactions and options and accumulated net investment income due to distributions from Real Estate Investment Trusts being reclassified from income to capital gains for SBLCV. Additionally, $10,508 has been reclassified between accumulated net investment income and accumulated net realized loss from investment transactions and
50 Travelers Series Fund Inc. | 2004 Annual Report
Notes to Financial Statements (continued)
options due to foreign currency transactions treated as ordinary income for tax for SEP. VKEP had no reclassifications. These reclassifications have no effect on net assets or net asset values per share.
| 2. | Management Agreement and Transactions with Affiliated Persons |
Smith Barney Fund Management LLC (“SBFM”), an indirect wholly-owned subsidiary of Citigroup Inc. (“Citigroup”), acts as the investment manager of the SBLCV. Effective July 1, 2004, SBLCV pays SBFM a management fee calculated at an annual rate of 0.60% of the average daily net assets of SBLCV up to $500 million; 0.55% of the average daily net assets in excess of $500 million up to and including $1 billion; and 0.50% of the average daily net assets in excess of $1 billion. Travelers Investment Adviser, Inc. (“TIA”), an affiliate of SBFM, acts as the investment manager of the SEP and the VKEP. SEP and VKEP pay TIA a management fee calculated at an annual rate of 0.80% and 0.70%, respectively, of the average daily net assets of SEP and VKEP. These fees are calculated daily and paid monthly. During the year ended October 31, 2004, SBFM waived a portion of its management fee in the amount of $1,741 for SBLCV, and TIA waived a portion of its management fee in the amount of $1,741 and $1,704 for SEP and VKEP, respectively.
TIA has entered into a sub-advisory agreement with Fidelity Management & Research Co. (“FMR”). Pursuant to the sub-advisory agreement, FMR is responsible for the day-to-day portfolio operations and investment decisions and is compensated by TIA for such services at an annual rate of 0.45% of the first $250 million of SEP’s average daily net assets, 0.40% on the next $500 million of SEP’s average daily net assets, and 0.35% of SEP’s average daily net assets in excess of $750 million.
In addition, TIA has entered into a sub-advisory agreement with Van Kampen Asset Management (“VKAM”). Pursuant to the sub-advisory agreement, VKAM is responsible for the day-to-day portfolio operations and investment decisions and is compensated by TIA for such services at an annual rate of 0.325% of the average daily net assets of VKEP.
TIA has entered into a sub-administrative services agreement with SBFM. TIA pays SBFM, as sub-administrator, a fee calculated at an annual rate of 0.10% of the average daily net assets of SEP and VKEP.
51 Travelers Series Fund Inc. | 2004 Annual Report
Notes to Financial Statements (continued)
Citicorp Trust Bank, fsb. (“CTB”), another subsidiary of Citigroup, acts as the Funds’ transfer agent. PFPC Inc. (“PFPC”) acts as the Funds’ sub-transfer agent. CTB receives account fees and asset-based fees that vary according to the size and type of account. PFPC is responsible for shareholder recordkeeping and financial processing for all shareholder accounts and is paid by CTB. For the year ended October 31, 2004, each Fund paid transfer agent fees of $5,000 to CTB.
For the year ended October 31, 2004, Citigroup Global Markets Inc., another indirect wholly-owned subsidiary of Citigroup, and its affiliates received brokerage commissions of $39,749 and $30,012 from SBLCV and VKEP, respectively.
Most of the officers and one Director of the Company are employees of Citigroup or its affiliates and do not receive compensation from the Company.
During the year ended October 31, 2004, the aggregate cost of purchases and proceeds from sales of investments (excluding short-term investments) were as follows:
| | | | | | | | | |
| | | SBLCV | | SEP | | VKEP |
Purchases | | $ | 130,374,297 | | $ | 1,065,330,615 | | $ | 133,896,107 |
|
Sales | | | 196,209,177 | | | 1,111,395,090 | | | 147,990,819 |
|
At October 31, 2004, the aggregate gross unrealized appreciation and depreciation of investments for federal income tax purposes were as follows:
| | | | | | | | | | | | |
| | | SBLCV | | | SEP | | | VKEP | |
Gross unrealized appreciation | | $ | 36,744,644 | | | $ | 24,826,325 | | | $ | 5,268,750 | |
Gross unrealized depreciation | | | (12,737,599 | ) | | | (14,798,614 | ) | | | (2,146,243 | ) |
Net unrealized appreciation | | $ | 24,007,045 | | | $ | 10,027,711 | | | $ | 3,122,507 | |
|
|
At October 31, 2004, SEP had open forward foreign currency contracts as described below. The unrealized gain and loss on the contracts reflected in the accompanying financial statements were as follows:
| | | | | | | | | | |
| Foreign Currency | | Local
Currency | | Market
Value | | Settlement
Date | | Unrealized
Gain |
Contracts to Buy: | | | | | | | | | | |
Japanese Yen | | 147,932,004 | | $ | 1,395,322 | | 11/1/04 | | $ | 7,696 |
Japanese Yen | | 103,677,980 | | | 977,910 | | 11/2/04 | | | 1,979 |
Japanese Yen | | 76,612,373 | | | 723,622 | | 11/4/04 | | | 776 |
|
Net Unrealized Gain on Open Foreign Currency Contracts | | | | | | | | | $ | 10,451 |
|
52 Travelers Series Fund Inc. | 2004 Annual Report
Notes to Financial Statements (continued)
At October 31, 2004, SEP and VKEP had loaned securities having a market value of $48,263,625 and $1,973,828. SEP and VKEP received cash collateral amounting to $50,285,107 and $2,023,700 which were invested in the State Street Navigator Securities Lending Trust Prime Portfolio a Rule 2a-7 money market fund.
For the year ended October 31, 2004, income earned from securities lending by SEP and VKEP was $92,559 and $6,146, respectively.
At October 31, 2004, SBLCV did not have any securities on loan.
Many of the brokers with whom FMR places trades on behalf of certain funds provided services to these funds in addition to trade execution. These services included payments of expenses on behalf of each applicable fund. As a result of the brokerage service arrangements, for the year ended October 31, 2004, SEP has expense reductions amounting to $302,201.
At October 31, 2004, the Company had six billion shares authorized with a par value of $0.00001 per share. Each share of a Fund represents an equal proportionate interest in that Fund with each other share of the same Fund and has an equal entitlement to any dividends and distributions made by the Fund.
Transactions in shares of each Fund were as follows:
| | | | | | |
| | | Year Ended
October 31, 2004 | | | Year Ended
October 31, 2003 | |
SBLCV | | | | | | |
Shares sold | | 256,486 | | | 401,980 | |
Shares issued on reinvestment | | 357,126 | | | 639,431 | |
Shares reacquired | | (4,456,154 | ) | | (3,856,055 | ) |
|
|
Net Decrease | | (3,842,542 | ) | | (2,814,644 | ) |
|
|
SEP | | | | | | |
Shares sold | | 94,460 | | | 470,412 | |
Shares issued on reinvestment | | — | | | 53,826 | |
Shares reacquired | | (5,444,092 | ) | | (5,225,885 | ) |
|
|
Net Decrease | | (5,349,632 | ) | | (4,701,647 | ) |
|
|
VKEP | | | | | | |
Shares sold | | 114,164 | | | 93,737 | |
Shares issued on reinvestment | | 11,815 | | | 51,943 | |
Shares reacquired | | (1,692,831 | ) | | (2,038,763 | ) |
|
|
Net Decrease | | (1,566,852 | ) | | (1,893,083 | ) |
|
|
53 Travelers Series Fund Inc. | 2004 Annual Report
Notes to Financial Statements (continued)
| 6. | Income Tax Information & Distributions to Shareholders |
The tax character of distributions paid during the fiscal year ended October 31, 2004 were as follows:
| | | | | | | | | |
| | | SBLCV | | SEP | | VKEP |
Dividends paid from: | | | | | | | | | |
Ordinary Income | | $ | 5,914,007 | | $ | 0 | | $ | 134,925 |
|
The tax character of distributions paid during the fiscal year ended October 31, 2003 were as follows:
| | | | | | | | | |
| | | SBLCV | | SEP | | VKEP |
Dividends paid from: | | | | | | | | | |
Ordinary Income | | $ | 8,408,520 | | $ | 650,759 | | $ | 471,638 |
|
As of October 31, 2004, the components of accumulated earnings on a tax basis were as follows:
| | | | | | | | | | | | |
| | | SBLCV | | | SEP | | | VKEP | |
Undistributed ordinary income | | $ | 4,429,540 | | | $ | 4,351,151 | | | $ | 171,496 | |
|
|
Capital loss carryforward(1) | | $ | (42,144,826 | ) | | $ | (231,371,083 | ) | | $ | (70,237,743 | ) |
Other book/tax temporary differences(2) | | | — | | | | (10,451 | ) | | | — | |
Unrealized appreciation(3) | | | 24,007,045 | | | | 10,029,190 | | | | 3,122,507 | |
|
|
Total accumulated losses | | $ | (13,708,241 | ) | | $ | (217,001,193 | ) | | $ | (66,943,740 | ) |
|
|
| (1) | | On October 31, 2004 SBLCV had a net capital loss carryforward of $42,144,826, of which $18,994,148 expires in 2010 and $23,150,678 expires in 2011. SEP had a net capital loss carryforward of $231,371,083, all of which expires in 2010. VKEP had a net capital loss carryforward of $70,237,743, of which $27,341,054 expires in 2009, $34,687,599 expires in 2010 and $8,209,090 expires in 2011. |
| (2) | | Other book/tax temporary differences are attributable primarily to the realization for tax purposes of unrealized gains/(losses) on certain futures contracts. |
| (3) | | The difference between book-basis and tax-basis unrealized appreciation depreciation is attributable primarily to the tax deferral of losses on wash sales. |
In connection with an investigation previously disclosed by Citigroup, the Staff of the Securities and Exchange Commission (“SEC”) has notified Citigroup Asset Management (“CAM”), the Citigroup business unit that includes the funds’ investment manager and other investment advisory companies; Citicorp Trust Bank (“CTB”), an affiliate of CAM; Thomas W. Jones, the former CEO of CAM; and three other individuals, one of whom is an employee and the
54 Travelers Series Fund Inc. | 2004 Annual Report
Notes to Financial Statements (continued)
other two of whom are former employees of CAM, that the SEC Staff is considering recommending a civil injunctive action and/or an administrative proceeding against each of them relating to the creation and operation of an internal transfer agent unit to serve various CAM-managed funds.
In 1999, CTB entered the transfer agent business. CTB hired an unaffiliated subcontractor to perform some of the transfer agent services. The subcontractor, in exchange, had signed a separate agreement with CAM in 1998 that guaranteed investment management revenue to CAM and investment banking revenue to a CAM affiliate. The subcontractor’s business was later taken over by PFPC Inc., and at that time the revenue guarantee was eliminated and a one-time payment was made by the subcontractor to a CAM affiliate.
CAM did not disclose the revenue guarantee when the boards of various CAM-managed funds hired CTB as transfer agent. Nor did CAM disclose to the boards of the various CAM-managed funds the one-time payment received the CAM affiliate when it was made.
In addition, the SEC Staff has indicated that it is considering recommending action based on the adequacy of the disclosures made to the funds board that approved the transfer agency arrangement, CAM’s initiation and operation and compensation for, the transfer agent business and CAM’s retention of, and agreements with, the subcontractor.
Citigroup is cooperating fully in the investigation and will seek to resolve the matter in discussions with the SEC Staff. Although there can be no assurance, Citigroup does not believe that this matter will have a material adverse effect on the Funds. As previously disclosed, CAM has already agreed to pay the applicable funds, primarily through fee waivers, a total of approximately $17 million (plus interest) that is the amount of the revenue received by Citigroup relating to the revenue guarantee.
Beginning in June, 2004, class action lawsuits alleging violations of the federal securities laws were filed against Citigroup Global Markets Inc. (the “Distributor”) and a number of its affiliates, including Smith Barney Fund Management LLC and Salomon Brothers Asset Management Inc (the “Advisers”), substantially all of the mutual funds managed by the Advisers, including the Funds, and directors or trustees of the Funds (collectively, the
55 Travelers Series Fund Inc. | 2004 Annual Report
Notes to Financial Statements (continued)
“Defendants”). The complaints alleged, among other things, that the Distributor created various undisclosed incentives for its brokers to sell Smith Barney and Salomon Brothers funds. In addition, according to the complaints, the Advisers caused the Funds to pay excessive brokerage commissions to the Distributor for steering clients towards proprietary funds. The complaints also alleged that the defendants breached their fiduciary duty to the Funds by improperly charging Rule 12b-1 fees and by drawing on fund assets to make undisclosed payments of soft dollars and excessive brokerage commissions. The complaints also alleged that the Funds failed to adequately disclose certain of the allegedly wrongful conduct. The complaints sought injunctive relief and compensatory and punitive damages, rescission of the Funds’ contracts with the Advisers, recovery of all fees paid to the Advisers pursuant to such contracts and an award of attorneys’ fees and litigation expenses.
On December 15, 2004, a consolidated amended complaint (the “Complaint”) was filed alleging substantially similar causes of action. While the lawsuit is in its earliest stages, to the extent that the Complaint purports to state causes of action against the Funds, Citigroup Asset Management believes the Funds have significant defenses to such allegations, which the Funds intend to vigorously assert in responding to the Complaint.
Additional lawsuits arising out of these circumstances and presenting similar allegations and requests for relief may be filed against the Defendants in the future.
As of the date of this report, Citigroup Asset Management and the Funds believe that the resolution of the pending lawsuit will not have a material effect on the financial position or results of operations of the Funds or the ability of the Advisers and their affiliates to continue to render services to the Funds under their respective contracts.
56 Travelers Series Fund Inc. | 2004 Annual Report
Report of Independent Registered Public Accounting Firm
The Shareholders and Board of Directors of
Travelers Series Fund Inc.:
We have audited the accompanying statements of assets and liabilities, including the schedules of investments, of the Smith Barney Large Cap Value Portfolio, Strategic Equity Portfolio, and Van Kampen Enterprise Portfolio (“Funds”) of Travelers Series Fund Inc. (“Company”) as of October 31, 2004, and the related statements of operations for the year then ended, the statements of changes in net assets for each of the years in the two-year period then ended, and the financial highlights for each of the years in the five-year period then ended. These financial statements and financial highlights are the responsibility of the Company’s management. Our responsibility is to express an opinion on these financial statements and financial highlights based on our audits.
We conducted our audits in accordance with the standards of the Public Company Accounting Oversight Board (United States). Those standards require that we plan and perform the audit to obtain reasonable assurance about whether the financial statements and financial highlights are free of material misstatement. An audit includes examining, on a test basis, evidence supporting the amounts and disclosures in the financial statements. Our procedures included confirmation of securities owned as of October 31, 2004, by correspondence with the custodian and brokers or by other appropriate auditing procedures where replies from brokers were not received. An audit also includes assessing the accounting principles used and significant estimates made by management, as well as evaluating the overall financial statement presentation. We believe that our audits provide a reasonable basis for our opinion.
In our opinion, the financial statements and financial highlights referred to above present fairly, in all material respects, the financial position of the Funds as of October 31, 2004, and the results of their operations for the year then ended, the changes in their net assets for each of the years in the two-year period then ended, and financial highlights for each of the years in the five-year period then ended, in conformity with U.S. generally accepted accounting principles.

New York, New York
December 17, 2004
57 Travelers Series Fund Inc. | 2004 Annual Report
Additional Information (unaudited)
Information about Directors and Officers
The business and affairs of the Travelers Series Fund Inc. (“Company”) are managed under the direction of the Company’s Board of Directors. Information pertaining to the Directors and Officers of the Company is set forth below.
| | | | | | | | | | |
Name, Address,
and Age | | Position(s) Held with Fund | | Term of Office* and Length of Time Served | | Principal Occupation(s) During Past
Five Years | | Number of Portfolios in Fund Complex
Overseen by
Director | | Other Board
Membership Held by
Director |
| Non-Interested Directors:† | | | | |
| | | | | |
Robert A. Frankel 1961 Deergrass Way Carlsbad, CA 92009 DOB: 5/20/27 | | Director | | Since
1999 | | Managing Partner of Robert A. Frankel Managing Consultants; Former Vice President of The Readers Digest Association, Inc. | | 24 | | None |
| | | | | |
Michael E. Gellert 122 East 42nd Street
47th Floor New York, NY 10168 DOB: 6/16/31 | | Director | | Since
1999 | | General Partner of Windcrest Partners, a venture capital firm | | 17 | | Director of Dalet S.A., Devon Energy Corp., High Speed Access Corp., Human, Inc., SEACOR Smit, Inc. and Six Flags, Inc. |
| | | | | |
Rainer Greeven 630 5th Avenue Suite 1960
New York, NY 10111 DOB: 12/6/36 | | Director | | Since
1994 | | Attorney, Rainer Greeven PC | | 17 | | Director of Continental Container Corp. |
| | | | | |
Susan M. Heilbron P.O. Box 557 Chilmark, MA 02535 DOB: 2/12/45 | | Director | | Since
1994 | | Owner/Consultant of Lacey & Heilbron, a public relations firm | | 17 | | Director of National Multiple Sclerosis Society, New York City Chapter |
58 Travelers Series Fund Inc. | 2004 Annual Report
Additional Information (unaudited) (continued)
| | | | | | | | | | |
Name, Address,
and Age | | Position(s) Held with Fund | | Term of Office* and Length of Time Served | | Principal Occupation(s) During Past
Five Years | | Number of
Portfolios in Fund Complex Overseen by
Director | | Other Board
Memberships Held by
Director |
| Interested Director: | | | | | | | | |
R. Jay Gerken, CFA** Citigroup Asset Management (“CAM”) 399 Park Avenue New York, NY 10022 DOB: 4/5/51 | | Chairman, President and Chief Executive Officer | | Since
2002 | | Managing Director of Citigroup Global Markets Inc. (“CGM”) Chairman, President and Chief Executive Officer of Smith Barney Fund Management LLC (“SBFM”), Travelers Investment Adviser, Inc. (“TIA”) and Citi Fund Management Inc. (“CFM”); President and Chief Executive Officer of certain mutual funds associated with Citigroup Inc. (“Citigroup”); Formerly Portfolio Manager of Smith Barney Allocation Series Inc. (from 1996-2001) and Smith Barney Growth and Income Fund (from 1996-2000) | | 221 | | None |
| | | | |
| Officers: | | | | | | | | |
Andrew B. Shoup CAM 125 Broad Street 10th Floor New York, NY 10004 DOB: 8/1/56 | | Senior Vice President and Chief Administrative Officer | | Since
2003 | | Director of CAM; Senior Vice President and Chief Administrative Officer of mutual funds associated with Citigroup; Head of International Funds Administration of CAM (from 2001 to 2003); Director of Global Funds Administration of CAM (from 2000 to 2001); Head of U.S. Citibank Funds Administration of CAM (from 1998 to 2000) | | N/A | | N/A |
| | | | | |
James M. Giallanza CAM 125 Broad Street, 11th Floor New York, NY 10004 DOB: 3/31/66 | | Chief
Financial Officer and Treasurer | | Since
2004 | | Director of CGM; Chief Financial Officer and Treasurer of certain mutual funds associated with Citigroup; Director and Controller of the U.S. wholesale business at UBS Global Asset Management US, Inc. (from September 2001 to July 2004); Director of Global Funds Administration at CAM (from June 2000 to September 2001); Treasurer of the Lazard Funds (from June 1998 to June 2000) | | N/A | | N/A |
59 Travelers Series Fund Inc. | 2004 Annual Report
Additional Information (unaudited) (continued)
| | | | | | | | | | |
Name, Address,
and Age | | Position(s) Held with Fund | | Term of Office* and Length of Time Served | | Principal Occupation(s) During Past
Five Years | | Number of Portfolios in Fund Complex
Overseen by
Director | | Other Board
Memberships Held by
Director |
| Officers: | | | | | | | | |
Mark J. McAllister, CFA CAM 399 Park Avenue 4th Floor New York, NY 10022 DOB: 4/6/62 | | Vice President and Investment Officer | | Since
2004 | | Managing Director of CGM; former Executive Vice President of JLW Capital Mgt. Inc. from March 1998 to May 1999; prior to March 1998, Vice President of Cohen & Steers Capital Mgt., Inc. | | N/A | | N/A |
| | | | | |
Robert Feitler CAM 399 Park Avenue 4th Floor New York, NY 10022 DOB: 9/10/60 | | Vice President and Investment Officer | | Since
2004 | | Director of CGM | | N/A | | N/A |
| | | | | |
Andrew Beagley CAM 399 Park Avenue 4th Floor New York, NY 10022 DOB: 10/9/62 | | Chief Anti-Money Laundering Compliance Officer Chief Compliance Officer | | Since
2002 Since
2004 | | Director of CGM (since 2000); Director of Compliance, North America, CAM (since 2000); Chief Anti-Money Laundering Compliance Officer, Chief Compliance Officer and Vice President of certain mutual funds associated with Citigroup; Director of Compliance, Europe, the Middle East and Africa, Citigroup Asset Management (from 1999 to 2000); Compliance Officer, SBFM, CFM, TIA, Salomon Brothers Asset Management Limited, Smith Barney Global Capital Management Inc., Salomon Brothers Asset Management Asia Pacific Limited (from 1997 to 1999) | | N/A | | N/A |
| | | | | |
Adam Hetnarski Fidelity Management & Research Company 82 Devonshire Street Boston, MA 02109 | | Investment Officer | | Since
2003 | | Vice President and Portfolio Manager of Fidelity Management & Research Company | | N/A | | N/A |
60 Travelers Series Fund Inc. | 2004 Annual Report
Additional Information (unaudited) (continued)
| | | | | | | | | | |
Name, Address,
and Age | | Position(s) Held with Fund | | Term of Office* and Length of Time Served | | Principal Occupation(s) During Past
Five Years | | Number of Portfolios in Fund Complex
Overseen by
Director | | Other Board
Memberships Held by
Director |
| Officers (continued): | | | | | | | | |
Sandip Bhagat Van Kampen Asset Management Inc. 1 Parkview Plaza P.O. Box 5555 Oakbrook Terrace,
IL 60181 | | Investment Officer | | Since
2004 | | Managing Director and Portfolio Manager of Van Kampen Asset Management | | N/A | | N/A |
| | | | | |
Robert I. Frenkel CAM 300 First Stamford Place 4th Floor Stamford, CT 06902 DOB: 12/12/54 | | Secretary
and Chief Legal Officer | | Since
2003 | | Managing Director and General Counsel, Global Mutual Funds for CAM and its predecessor (since 1994); Secretary and Chief Legal Officer of mutual funds associated with Citigroup | | N/A | | N/A |
| † | | Abraham E. Cohen resigned as a Director of the Company, effective July 8, 2004. Mr. Cohen had served as Director since 1996. |
| * | | Each Director and officer serves until his or her successor has been duly elected and qualified. |
| ** | | Mr. Gerken is an “interested person” of the Fund as defined in the Investment Company Act of 1940, as amended, because Mr. Gerken is an officer of SBFM and certain of its affiliates. |
61 Travelers Series Fund Inc. | 2004 Annual Report
Important Tax Information (unaudited)
The following information is provided with respect to the distributions paid during the taxable year ended October 31, 2004:
| | | | |
| | | SBLCV | | VKEP |
Record Date: | | 12/29/03 | | 12/29/03 |
Payable Date: | | 12/30/03 | | 12/30/03 |
|
Dividends Qualifying for the Dividends | | | | |
Received Deductions for Corporations | | 100.00% | | 100.00% |
|
Please retain this information for your records.
62 Travelers Series Fund Inc. | 2004 Annual Report
TRAVELERS SERIES FUND INC.
| | |
DIRECTORS Robert A. Frankel Michael E. Gellert R. Jay Gerken, CFA
Chairman Rainer Greeven Susan M. Heilbron OFFICERS R. Jay Gerken, CFA Chairman, President and Chief Executive Officer Andrew B. Shoup Senior Vice President and Chief Administrative Officer James M. Giallanza Chief Financial Officer and Treasurer Mark J. McAllister, CFA Vice President and Investment Officer Robert Feitler Vice President and Investment Officer Adam Hetnarski Vice President and Portfolio Manager Sandip Bhagat Investment Officer | | OFFICERS (continued) Andrew Beagley Chief Anti-Money Laundering Compliance Officer and Chief Compliance Officer Robert I. Frenkel Secretary and Chief Legal Officer INVESTMENT MANAGERS Smith Barney Fund
Management LLC Travelers Investment Adviser, Inc. CUSTODIAN State Street Bank and
Trust Company ANNUITY ADMINISTRATION Travelers Annuity Investor Services One Cityplace Hartford, CT 06103-3415 TRANSFER AGENT Citicorp Trust Bank, fsb. 125 Broad Street, 11th Floor New York, New York 10004 SUB-TRANSFER AGENT PFPC Inc. P.O. Box 9699 Providence, Rhode Island 02940-9699 |
Travelers Series Fund Inc.
Smith Barney Large Cap Value Portfolio
Strategic Equity Portfolio
Van Kampen Enterprise Portfolio
The Funds are separate investment funds of the Travelers Series Fund Inc., a Maryland corporation.
The Funds file their complete schedule of portfolio holdings with Securities Exchange Commission for the first and third quarters of each fiscal year on Form N-Q. The Funds’ Forms N-Q are available on the Commission’s website at www.sec.gov. The Funds’ Forms N-Q may be reviewed and copied at the Commission’s Public Reference Room in Washington D.C., and information on the operation of the Public Reference Room may be obtained by calling 1-800-SEC-0330. To obtain information on Form N-Q from the Funds, shareholders can call 1-800-451-2010.
Information on how the funds voted proxies relating to portfolio securities during the 12 month period ended June 30, 2004 and a description of the policies and procedures that the funds use to determine how to vote proxies relating to portfolio securities is available (1) without charge, upon request, by calling 1-800-451-2010, (2) on the funds’ website at www.citigroupAM.com and (3) on the SEC’s website at www.sec.gov.
This report is submitted for the general information of the shareholders of Travelers Series Fund Inc. — Smith Barney Large Cap Value Portfolio, Strategic Equity Portfolio and Van Kampen Enterprise Portfolio.
TRAVELERS SERIES FUND INC.
125 Broad Street
10th Floor, MF-2
New York, New York 10004
The registrant has adopted a code of ethics that applies to the registrant’s principal executive officer, principal financial officer, principal accounting officer or controller.
| ITEM 3. | AUDIT COMMITTEE FINANCIAL EXPERT. |
The Board of Directors of the registrant has determined that Robert A. Frankel, the Chairman of the Board’s Audit Committee, possesses the technical attributes identified in Instruction 2(b) of Item 3 to Form N-CSR to qualify as an “audit committee financial expert,” and has designated Mr. Frankel as the Audit Committee’s financial expert. Mr. Frankel is an “independent” Director pursuant to paragraph (a)(2) of Item 3 to Form N-CSR.
| ITEM 4. | PRINCIPAL ACCOUNTANT FEES AND SERVICES. |
| | (a) | Audit Fees for the Travelers Series Fund Inc. were $342,500 and $329,500 for the years ended 10/31/04 and 10/31/03. |
| | (b) | Audit-Related Fees for the Travelers Series Fund Inc. were $0 and $3,500 for the years ended 10/31/04 and 10/31/03. |
| | (c) | Tax Fees for Travelers Series Fund Inc. of $35,400 and $35,000 for the years ended 10/31/04 and 10/31/03. These amounts represent aggregate fees paid for tax compliance, tax advice and tax planning services, which include (the filing and amendment of federal, state and local income tax returns, timely RIC qualification review and tax distribution and analysis planning) rendered by the Accountant to Travelers Series Fund Inc. |
| | (d) | All Other Fees for Travelers Series Fund Inc. of $0 and $0 for the years ended 10/31/04 and 10/31/03. |
| | (e) | (1) Audit Committee’s pre–approval policies and procedures described in paragraph (c) (7) of Rule 2-01 of Regulation S-X. |
The Charter for the Audit Committee (the “Committee”) of the Board of each registered investment company (the “Fund”) advised by Smith Barney Fund Management LLC or Salomon Brothers Asset Management Inc. or one of their affiliates (each, an “Adviser”) requires that the Committee shall approve (a) all audit and permissible non-audit services to be provided to the Fund and (b) all permissible non-audit services to be provided by the Fund’s independent auditors to the Adviser and any Covered Service Providers if the engagement relates directly to the operations and financial reporting of the Fund. The Committee may implement policies and procedures by which such services are approved other than by the full Committee.
The Committee shall not approve non-audit services that the Committee believes may impair the independence of the auditors. As of the date of the approval of this Audit Committee Charter, permissible non-audit services include any professional services (including tax services), that are not prohibited services as described below, provided to the Fund by the independent auditors, other than those provided to the Fund in connection with an audit or a review of the financial statements of the Fund. Permissible non-audit services may not include: (i) bookkeeping or other services related to the accounting records or financial statements of the Fund; (ii) financial information systems design and implementation; (iii) appraisal or valuation services, fairness opinions or contribution-in-kind reports; (iv) actuarial services; (v) internal audit outsourcing services; (vi) management functions or human resources; (vii) broker or dealer, investment adviser or investment banking services; (viii) legal services and expert services unrelated to the audit; and (ix) any other service the Public Company Accounting Oversight Board determines, by regulation, is impermissible.
Pre-approval by the Committee of any permissible non-audit services is not required so long as: (i) the aggregate amount of all such permissible non-audit services provided to the Fund, the Adviser and any service providers controlling, controlled by or under common control with the Adviser that provide ongoing services to the Fund (“Covered Service Providers”) constitutes not more than 5% of the total amount of revenues paid to the independent auditors during the fiscal year in which the permissible non-audit services are provided to (a) the Fund, (b) the Adviser and (c) any entity controlling,
controlled by or under common control with the Adviser that provides ongoing services to the Fund during the fiscal year in which the services are provided that would have to be approved by the Committee; (ii) the permissible non-audit services were not recognized by the Fund at the time of the engagement to be non-audit services; and (iii) such services are promptly brought to the attention of the Committee and approved by the Committee (or its delegate(s)) prior to the completion of the audit.
(2) For the Travelers Series Fund Inc., the percentage of fees that were approved by the audit committee, with respect to: Audit-Related Fees were 100% and 100% for the years ended 10/31/04 and 10/31/03; Tax Fees were 100% and 100% for the years ended 10/31/04 and 10/31/03; and
Other Fees were 100% and 100% for the years ended 10/31/04 and 10/31/03.
| | (g) | Non-audit fees billed by the Accountant for services rendered to Travelers Series Fund Inc. and CAM and any entity controlling, controlled by, or under common control with CAM that provides ongoing services to Travelers Series Fund Inc. were $0 and $0 for the years ended 10/31/04 and 10/31/03. |
| | (h) | Yes. The Travelers Series Fund Inc.’s Audit Committee has considered whether the provision of non-audit services that were rendered to Service Affiliates which were not pre-approved (not requiring pre-approval) is compatible with maintaining the Accountant’s independence. All services provided by the Accountant to the Travelers Series Fund Inc. or to Service Affiliates which were required to be pre-approved were pre-approved as required. |
| ITEM 5. | AUDIT COMMITTEE OF LISTED REGISTRANTS. |
Not applicable.
| ITEM 7. | DISCLOSURE OF PROXY VOTING POLICIES AND PROCEDURES FOR CLOSED-END MANAGEMENT INVESTMENT COMPANIES. |
Not applicable.
| ITEM 9. | SUBMISSION OF MATTERS TO A VOTE OF SECURITY HOLDERS. |
Not applicable.
| ITEM 10. | CONTROLS AND PROCEDURES. |
| | (a) | The registrant’s principal executive officer and principal financial officer have concluded that the registrant’s disclosure controls and procedures (as defined in Rule 30a- 3(c) under the Investment Company Act of 1940, as amended (the “1940 Act”)) are effective as of a date within 90 days of the filing date of this report that includes the disclosure required by this paragraph, based on their evaluation of the disclosure controls and procedures required by Rule 30a-3(b) under the 1940 Act and 15d-15(b) under the Securities Exchange Act of 1934. |
| | (b) | There were no changes in the registrant’s internal control over financial reporting (as defined in Rule 30a-3(d) under the 1940 Act) that occurred during the registrant’s last fiscal half-year (the registrant’s second fiscal half-year in the case of an annual report) that have materially affected, or are likely to materially affect the registrant’s internal control over financial reporting. |
| | (a) | Code of Ethics attached hereto. |
Exhibit 99.CODE ETH
| | |
| Exhibit 99.CERT | | Certifications pursuant to section 302 of the Sarbanes-Oxley Act of 2002 |
| |
| Exhibit 99.906CERT | | Certifications pursuant to Section 906 of the Sarbanes-Oxley Act of 2002 |
SIGNATURES
Pursuant to the requirements of the Securities Exchange Act of 1934 and the Investment Company Act of 1940, the registrant has duly caused this Report to be signed on its behalf by the undersigned, there unto duly authorized.
| | |
| Travelers Series Fund Inc. |
| |
| By: | | /s/ R. JAY GERKEN |
| | | R. Jay Gerken |
| | | Chief Executive Officer of |
| | | Travelers Series Fund Inc. |
Date: January 6, 2005
Pursuant to the requirements of the Securities Exchange Act of 1934 and the Investment Company Act of 1940, this report has been signed below by the following persons on behalf of the registrant and in the capacities and on the dates indicated.
| | |
| |
| By: | | /s/ R. JAY GERKEN |
| | | (R. Jay Gerken) |
| | | Chief Executive Officer of |
| | | Travelers Series Fund Inc. |
Date: January 6, 2005
| | |
| |
| By: | | /s/ JAMES M. GIALLANZA |
| | | (James M. Giallanza) |
| | | Chief Executive Officer of |
| | | Travelers Series Fund Inc. |
Date: January 6, 2005