UNITED STATES
SECURITIES AND EXCHANGE COMMISSION
Washington, D.C. 20549
FORM N-CSR
CERTIFIED SHAREHOLDER REPORT OF REGISTERED MANAGEMENT
INVESTMENT COMPANIES
Investment Company Act file number 811-8372
Travelers Series Fund Inc.
(Exact name of registrant as specified in charter)
| | |
| 125 Broad Street, New York, NY | | 10004 |
| (Address of principal executive offices) | | (Zip code) |
Robert I. Frenkel, Esq.
Smith Barney Fund Management LLC
300 First Stamford Place
Stamford, CT 06902
(Name and address of agent for service)
Registrant’s telephone number, including area code: (800) 451-2010
Date of fiscal year end: October 31
Date of reporting period: October 31, 2004
| ITEM 1. | REPORT TO STOCKHOLDERS. |
The Annual Report to Stockholders is filed herewith.
TRAVELERS SERIES FUND INC.
SMITH BARNEY
INTERNATIONAL ALL CAP
GROWTH PORTFOLIO
SALOMON BROTHERS
STRATEGIC TOTAL RETURN
BOND PORTFOLIO
SB ADJUSTABLE RATE
INCOME PORTFOLIO
ANNUAL REPORT | OCTOBER 31, 2004
NOT FDIC INSURED • NOT BANK GUARANTEED • MAY LOSE VALUE
WHAT’S INSIDE
LETTER FROM THE CHAIRMAN

R. JAY GERKEN, CFA
Chairman, President and Chief Executive Officer
Dear Shareholder,
Stock prices collectively advanced over the 12 months ended October 31, 2004, although performance varied sharply among sectors and investment styles. The equity market also shifted gears during the period due to investors’ reaction to mixed signals about the economy.
Last fall, stocks continued to rise as many geopolitical concerns began to ease, and a spate of mortgage refinancings freed up investable cash for investors. Despite positive corporate earnings results, stocks traded in a narrow range during the first quarter of this year due to concerns about anemic job growth. During this time, the economy grew at a moderate pace,i albeit at significantly stronger levels than during the first half of 2003.
In the spring, the economic recovery became broader based as labor market growth improved dramatically in March and April, although signs suggested a pickup in inflation in the spring as well. As widely anticipated, the Federal Reserve Board (“Fed”)ii proceeded to push short-term interest rates higher, marking its first hike in four years. The Fed raised its target for the closely watched federal funds rateiii by 0.25% on three occasions during the reporting period, increasing it from a four-decade low of 1.00% in June to 1.75% in September, and then again to 2.00% on November 10th, after the fund’s reporting period had ended. Higher rates can help slow a potential acceleration of economic growth and thereby help maintain a balance between that growth and the inflation that can generally accompany it.
As the period came to a close, inflation figures were benign while labor market growth, which had tapered off during the summer, exceeded consensus estimates for October. Crude oil prices, which had risen to record highs in the third quarter, when coupled with investors’ reaction to terrorism concerns, weakened investor sentiment toward the equity markets. However, reports of a pullback in oil prices and strong third-quarter corporate profits gave stock prices a boost in the final month of the period.
Over the past 12 months, stocks of small- and mid-capitalization companies continued to outperform large-caps in general. Value-oriented stocks handily outpaced growth-oriented stocks. International stock markets beat out the broad domestic U.S. market by a wide margin.
Following a sharp sell-off in the spring in anticipation that rates were poised to rise, bond prices rose later in the period. The bond market benefited in the third
1 Travelers Series Fund Inc. | 2004 Annual Report
quarter when investors reallocated assets from stocks into bonds. However, the fixed-income markets experienced some downward pricing pressures after the reporting period as interest rate concerns resurfaced. Over the 12 months, however, bonds finished in modestly positive territory on a total return basis.
Within this environment, the portfolios performed as follows:1
PERFORMANCE SNAPSHOT
AS OF OCTOBER 31, 2004
| | | | | | |
| | | 6 Months | | | 12 Months | |
| | | | | | | |
Smith Barney International All Cap Growth Portfolio | | 3.79 | % | | 13.90 | % |
| | | | | | | |
MSCI EAFE Growth Index | | 2.80 | % | | 14.00 | % |
| | | | | | | |
MSCI EAFE Index | | 5.74 | % | | 18.84 | % |
| | | | | | | |
Lipper Variable International Growth Funds Category Average | | 3.91 | % | | 14.40 | % |
| | | | | | | |
Salomon Brothers Strategic Total Return Bond Portfolio | | 4.69 | % | | 6.83 | % |
| | | | | | | |
J.P. Morgan Global Government Bond Index — Unhedged | | 7.29 | % | | 10.54 | % |
| | | | | | | |
Lehman Brothers Aggregate Bond Index | | 4.23 | % | | 5.53 | % |
| | | | | | | |
Lipper Variable Global Income Funds Category Average | | 6.82 | % | | 9.13 | % |
| | | | | | | |
SB Adjustable Rate Income Portfolio | | 0.50 | % | | 1.24 | % |
| | | | | | | |
Citigroup 6-Month U.S. Treasury Bill Index | | 0.65 | % | | 1.16 | % |
| | | | | | | |
Lipper Variable Short-lntermediate Investment Grade Debt Funds Category Average | | 1.41 | % | | 2.25 | % |
| | | | | | | |
30 Day SEC Yield | | 1.59 | % | | 1.59 | % |
The performance shown represents past performance. Past performance is no guarantee of future results and current performance may be higher or lower than the performance shown above. Principal value and investment returns will fluctuate and investors’ shares, when redeemed, may be worth more or less than their original cost.
Returns assume the reinvestment of income dividends and capital gains distributions at net asset value and the deduction of all fund expenses.
Performance figures for both Smith Barney International All Cap Growth Portfolio and Salomon Brothers Strategic Total Return Bond Portfolio may reflect reimbursements or fee waivers, without which the performance would have been lower. The reimbursements and/or fee waivers are voluntary and may be reduced or terminated at any time.
For SB Adjustable Rate Income Portfolio, the yields reflect fee waivers and/or expense reimbursements in effect through the period of 12 months from October 31, 2003. Without these fee waivers and reimbursements the fund’s yield would have been 1.50%.
Lipper, Inc. is a major independent mutual-fund tracking organization. Returns are based on the period ended October 31, 2004 and include the reinvestment of dividends and capital gains, if any. Returns in the variable international growth funds category were calculated among the 50 funds for the six-month period and among the 50 funds for the 12-month period. Returns in the variable global income funds category were calculated among the 31 funds for the six-month period and among the 31 funds for the 12-month period. Returns in the variable short-intermediate investment grade debt funds category were calculated among the 32 funds for the six-month period and among the 31 funds for the 12-month period.
| 1 | The fund is an underlying investment option of various variable annuity products. A variable annuity product is a contract issued by an insurance company where the annuity premiums (a set amount of dollars) is immediately turned into units of a portfolio of securities. Upon retirement, the policyholder is paid according to accumulated units whose dollar value varies according to the performance of the securities within the sub accounts. Its objective is to preserve, through investment, the purchasing value of the annuity, which otherwise is subject to erosion through inflation. The fund’s performance returns do not reflect the deduction of initial sales charges and expenses imposed in connection with investing in variable annuity contracts such as administrative fees, account charges and surrender charges, which if reflected, would reduce the performance of the fund. Past performance is no guarantee of future results. |
2 Travelers Series Fund Inc. | 2004 Annual Report
Please read on for a more detailed look at prevailing economic and market conditions during the fund’s fiscal year and to learn how those conditions have affected fund performance.
Information About Your Funds
As you may be aware, several issues in the mutual fund industry have recently come under the scrutiny of federal and state regulators. The fund’s Adviser and some of its affiliates have received requests for information from various government regulators regarding market timing, late trading, fees, and other mutual fund issues in connection with various investigations. The regulators appear to be examining, among other things, the fund’s response to market timing and shareholder exchange activity, including compliance with prospectus disclosure related to these subjects. The fund has been informed that the Adviser and its affiliates are responding to those information requests, but are not in a position to predict the outcome of these requests and investigations.
In November 2003, Citigroup Asset Management (“CAM”) disclosed an investigation by the Securities and Exchange Commission (“SEC”) and the U.S. Attorney relating to Citigroup Asset Management’s entry into the transfer agency business during 1997-1999. Citigroup has disclosed that the Staff of the SEC is considering recommending a civil injunctive action and/or an administrative proceeding against certain advisory and transfer agent entities affiliated with Citigroup, the former CEO of CAM, two former employees and a current employee of CAM, relating to the creation, operation and fees of its internal transfer agent unit that serves various CAM-managed funds. Citigroup is cooperating with the SEC and will seek to resolve this matter in discussion with the SEC Staff. Although there can be no assurance, Citigroup does not believe that this matter will have a material adverse effect on the fund.
As always, thank you for your confidence in our stewardship of your assets. We look forward to helping you continue to meet your financial goals.
Sincerely,

/s/ R. Jay Gerken
R. Jay Gerken, CFA
Chairman, President and Chief Executive Officer
December 13, 2004
3 Travelers Series Fund Inc. | 2004 Annual Report
MANAGER OVERVIEW
Smith Barney International All Cap Growth Portfolio
Special Shareholder Notice
Effective June 30, 2004, the benchmark was changed from the Morgan Stanley Capital International Europe, Australasia and the Far East Index (“MSCI EAFE” Index)iv to the Morgan Stanley Capital International Europe, Australasia and the Far East Growth Index (“MSCI EAFE Growth Index”).v
Effective July 1, 2004, the management fee payable by Smith Barney International All Cap Growth Portfolio was reduced to 0.85% of the portfolio’s average daily net assets.
Performance Review
For the 12 months ended October 31, 2004, the Smith Barney International All Cap Growth Portfolio returned 13.90%.1 In comparison, the fund’s unmanaged benchmark, the MSCI EAFE Growth Index,v returned 14.00% while the MSCI EAFE Indexiv returned 18.84% for the same period. The Lipper variable international growth funds category average2 was 14.40% for the same period.
Market Review
Equity markets rewarded many international growth investors for the twelve months ended October 31, 2004 with positive returns. The global economic recovery unfolded well as the fiscal year progressed, providing good corporate earnings gains in many sectors and markets. Improving cash flows and balance sheets were further positive influences.
Despite the somber news from the Middle East, significantly higher energy prices, terrorist activities and uncertainties heading into the U.S. elections, international growth stocks experienced strong double-digit growth over the past year.
International stocks substantially outperformed U.S. equities during the year. Those returns were augmented by the decline of the U.S. dollar versus the
| 1 | The fund is an underlying investment option of various variable annuity products. A variable annuity product is a contract issued by an insurance company where the annuity premium (a set amount of dollars) is immediately turned into units of a portfolio of securities. Upon retirement, the policyholder is paid according to accumulated units whose dollar value varies according to the performance of the securities within the sub accounts. Its objective is to preserve, through investment, the purchasing value of the annuity, which otherwise is subject to erosion through inflation. The fund’s performance returns do not reflect the deduction of initial sales charges and expenses imposed in connection with investing in variable annuity contracts such as administrative fees, account charges and surrender charges, which if reflected, would reduce the performance of the fund. Past performance is no guarantee of future results. |
| 2 | Lipper, Inc. is a major independent mutual-fund tracking organization. Returns are based on the 12-month period ended October 31, 2004, calculated among the 50 funds in the funds Lipper category, including the reinvestment of dividends and capital gains, if any. |
4 Travelers Series Fund Inc. | 2004 Annual Report
currencies underlying the benchmark index during the fiscal year. The dollar’s decline increased the return of the benchmark from 5.90% in local currencies to 14.00% as measured in U.S. dollars.
Portfolio Overview
The portfolio performed in line with the benchmark this past fiscal year. European markets were the strongest benchmark performers with an 18.00% return (in U.S. dollars) compared with 5.20% for the Pacific markets. Returns from the Pacific markets were restrained by the modest decline of the Japanese market, which slid nearly 3.00% in yen terms, and increased less than 1.00% as measured in dollars. The portfolio was modestly overweight in European markets for most of the fiscal year and was modestly underweight in Japanese equities.
Stock selection made a positive contribution during this fiscal year, offsetting the negative impact from sector selection. The top three contributors to overall portfolio return were the U.K.’s Vodafone Group PLC (+24%), the U.K.’s Capita Group PLC (+55%) and Ireland’s Grafton Group PLC (+44%). The three largest detractors to portfolio return were the U.K.’s Compass Group PLC (-27%), Japan’s Nomura Holdings, Inc. (-28%), and Japan’s NTT DoCoMo, Inc. (-18%).vi
Sector selection detracted from portfolio performance. The sector weights in the portfolio are derived from stock selection, with a risk control limit versus the benchmark weight. The portfolio had no exposure to the strong-performing utilities sector; most utilities do not meet the portfolio team’s qualitative criteria for growth companies. The overweight exposure to the information technology sector also detracted from sector attribution. Our overweight position in energy sector stocks was contributory to the portfolio’s return.vii
Portfolio Composition
Our top holdings in the portfolio reflect an eclectic mix of investment themes and portfolio emphasis. These holdings are illustrative of our growth-oriented stock selection criteria, which include what we believe are strong financial structures, large business opportunities and stable, visionary management. The portfolio ended the fiscal year with approximately 67% of its assets in European stocks, 25% in Asian stocks, and 8% in other markets and cash.
Thank you for your investment in the Smith Barney International All Cap Growth Portfolio. As ever, we appreciate that you have chosen us to manage your assets and we remain focused on seeking to achieve the fund’s investment goals.
Sincerely,

Jeffrey J. Russell, CFA
Vice President and Investment Officer
December 13, 2004
5 Travelers Series Fund Inc. | 2004 Annual Report
MANAGER OVERVIEW
Salomon Brothers Strategic Total Return Bond Portfolio
Special Shareholder Notice
Effective December 31, 2004, the Lehman Brothers Aggregate Bond Index, a broad-based bond index comprised of Government, Corporate, Mortgage, Asset-backed issues, rated investment-grade or higher, and having at least one year to maturity, will replace the J.P. Morgan Global Government Bond Index — Unhedged as the fund’s sole benchmark. The manager has determined that the Lehman Brothers Aggregate Bond Index more closely reflects the composition of the portfolio and the management style.
Performance Review
For the 12 months ended October 31, 2004, the Salomon Brothers Strategic Total Return Bond Portfolio, returned 6.83%.1 In comparison, the fund’s unmanaged benchmarks, the J.P. Morgan Global Government Bond Index — Unhedgedviii and the Lehman Brothers Aggregate Bond Index,ix returned 10.54% and 5.53%, respectively, for the same period.
Investment Grade Market Overview
U.S. government securities collectively generated positive total returns over the 12 months ended October 31, 2004, despite some market volatility as investors dissected language from the Fed for clues on its assessment of the U.S. economy and an indication when rates would begin to creep higher. The first five months were relatively stable as the economy showed signs of a turnaround, with the economic outlook for 2004 as encouraging as it has been since 1999. Nevertheless, despite the apparent strength of the economy, the Fed held fast to its 1.00% short-term lending rate, attributing the economic growth more to increases in productivity than to jobs. The Fed did, however, alter its policy
| 1 | The fund is an underlying investment option of various variable annuity products. A variable annuity product is a contract issued by an insurance company where the annuity premium (a set amount of dollars) is immediately turned into units of a portfolio of securities. Upon retirement, the policyholder is paid according to accumulated units whose dollar value varies according to the performance of the securities within the sub accounts. Its objective is to preserve, through investment, the purchasing value of the annuity, which otherwise is subject to erosion through inflation. The fund’s performance returns do not reflect the deduction of initial sales charges and expenses imposed in connection with investing in variable annuity contracts such as administrative fees, account charges and surrender charges, which if reflected, would reduce the performance of the fund. Past performance is no guarantee of future results. |
6 Travelers Series Fund Inc. | 2004 Annual Report
language after its January meeting from the open-ended “considerable period” to simply state that it wished to show “patience” in “removing” the accommodation. Following the May policy meeting, the Fed again altered its accommodation language from “patience” in “removing” the accommodation to “a pace that is likely to be measured”. We viewed this as an attempt by the Fed to signal that it was intending to raise rates incrementally and deliberately over the months to come.
Signs of inflation and strong non-farm payroll numbers began to appear in March and April of 2004. Strong job numbers combined with inflation fighting language from the Fed, led to a rise in U.S. treasury yields, with 10-year yields gaining more than 100 basis points from their early March lows. Yields on most fixed-income instruments, particularly those on shorter-maturity issues, began moving up and continued their ascent as it became more evident that the improving economy and higher inflation would compel the Fed to act in June. The Fed finally raised its federal funds rate target to 1.25% in June off the stronger employment numbers.
Against this backdrop, fixed income markets finished on a somewhat more stable note in June and July. The Fed raised its federal funds target rate by an additional 0.25% at each subsequent meeting in July, August, and September, despite significant softening of many economic indicators during the late summer months, bringing the target rate to 1.75% at the end of the reporting cycle for the portfolio. Following the end of the fund’s reporting period, at its November meeting, the Fed once again raised its target for the federal funds rate by 0.25% to 2.00%.
Over the period, U.S. treasuries, as represented by the Citigroup U.S. Treasury Bond Index,x returned 4.98%, rebounding in the third quarter after the worst quarter in more than two decades. U.S. Agencies, as represented by the Citigroup U.S. Agency Index,xi also had positive returns during the period of 4.78%. The sector saw widening in the third quarter of 2004, as the Office of Federal Housing Enterprise Oversight (OFHEO) and the SEC continued to look closely at the accounting practices of the Federal National Mortgage Association (“FNMA”). The market had been expecting no headline risk for the agencies until after the election. The mortgage-backed sector as represented by the Citigroup Mortgage Indexxii returned 5.68%. Early in the third quarter of 2004, the environment looked favorable for mortgage-backed securities with light supply, low volatility and positive technicals. As the 10-year U.S. treasury note approached 4.10% later in the quarter, convexity started to become a concern and supply from originators increased.
7 Travelers Series Fund Inc. | 2004 Annual Report
High Yield Market Overview
The high-yield bond market, as represented by the Citigroup High Yield Market Index,xiii returned 12.28% for the 12 months ended October 31, 2004. The rally that began in the second half of August 2003 continued for the remainder of the 2003 calendar year as lower U.S. treasury yields and positive mutual fund inflows propelled the high-yield market higher. Fundamentals also supported the market, with the improving economy, strong earnings and declining default rates contributing to the market’s advance. Corporate bond issuers took advantage of the low interest rates to improve their balance sheets and liquidity.
Following a strong run over 2003, high-yield bond priced began to retreat early in 2004 due to profit-taking as investors became concerned that company fundamentals did not warrant such gains and the low yields did not offer enough compensation for the risk. Additionally, the Fed’s removal of the “considerable period” language from its policy statement during this time sparked concerns that the Fed would begin raising interest rates sooner than had been expected. The high-yield market continued to decline in February, with lower-quality issues leading the way down amid large fund outflows, continued profit taking and greater focus on company fundamentals.
In March, investors sought haven in higher-rated bonds in the non-investment-grade universe as terrorism fears and weak employment numbers exerted pressure on stock markets and drove yields on U.S. treasury bonds lower. However, economic data released in April showing an improving labor market and signs of higher inflation sparked another sell-off in U.S. treasury bonds as investors shifted their expectations of Fed tightening from 2005 to the summer of 2004. Additionally, economic data in May sparked increased inflation fears, with concern over Fed tightening transitioning from timing to size and pace of the expected interest rate increases. Once again, the volatility in the U.S. treasury market spilled into the high-yield market, resulting in negative returns and large mutual fund redemptions. However, the high-yield bond market rallied for the remainder of the fiscal year due to positive mutual fund flows and a strong rally in U.S. treasuries as the economy showed signs of slowing. Additionally, default rates remained low as the improving economy and the low interest rate environment enabled companies to extend their debt maturities on new issues at favorable rates and improve their liquidity.
Based on the 7.46% yield of the Citigroup High Yield Market Indexxiii as of October 31, 2004, high-yield bonds continued to offer competitive yields relative to U.S. treasury notes.xiv However, high-yield issues are subject to additional risks, such as the increased possibility of default because of their lower credit quality, and yields and prices will fluctuate.
8 Travelers Series Fund Inc. | 2004 Annual Report
Emerging Markets Overview
Emerging markets debt performed positively through the 12 months ended October 31, 2004, returning 12.94% as represented by the J.P. Morgan Emerging Markets Bond Index Plus (“EMBI+”).xv Sovereign debt markets exhibited strong performance from the start of the fund’s fiscal year in November through March 2004 amid a relatively benign stretch in the U.S. Treasury bond markets; hedge funds joined crossover buyers in adding to their emerging markets debt allocations. However, markets were disrupted in April and May following a sharp sell-off in U.S. Treasury bonds caused by an extremely strong March U.S. jobs report. April saw the EMBI+’s largest sell-off since July of 2001, and May saw yield spreadsxvi over U.S. treasuries widening to 569 during the month, a level not seen since August of 2003. Markets rallied over the next few months — taking back all the losses of April and May — and performing strongly through the end of the period. Good country fundamentals, commodity price strength and the absence of U.S. Treasury market volatility supported emerging markets debt returns.
Through all of this, emerging markets debt fundamentals remained strong, and the markets benefited from increasing signs of a global economic turnaround. Continued strength in commodity prices, including metals, agriculture, and oil provided positive support for many emerging market countries. Oil prices, in particular, remained high favoring oil exporters, but fears remained that high-energy prices might dampen the global recovery. Revenues from oil production contributed to positive performance in Ecuador, Russia, and Venezuela. The markets also benefited from higher-than-expected global economic growth and higher-than-expected inflation.
Spreads tightened 57 basis pointsxvii during the 12-month period ended October 31, 2004, closing at 413 basis points over U.S. Treasuries. Over the same period, 12-month return volatility stood at 8.09%,xviii substantially below long-term, historical levels of approximately 16.00%.
Continued progress on political and economic reforms in many emerging countries, combined with the positive macro environment, led to a spate of upgrades or improved outlook changes during the period; Moody’s and Standard & Poor’s collectively upgraded 12 countries during the last 12 months, representing more than 56.00% of the J.P. Morgan Emerging Markets Bond Index Global, (“EMBI Global”).xix The improving credit quality in emerging markets encouraged broader investor participation and may have caused some long-term investors to change their allocation to emerging markets from tactical to strategic, providing some technical support for the market.
9 Travelers Series Fund Inc. | 2004 Annual Report
Factors Influencing Fund Performance
During the period, the fund benefited from its strategic allocations to high yield and emerging markets debt, which returned 12.28% and 12.94%, respectively, for the 12 months ended October 31, 2004, as represented by the Citigroup High Yield Market Indexxiii and the EMBI+.xv We increased our allocations to mortgage-backed securities, asset-backed securities and emerging markets debt during the 12 months and decreased our allocations to U.S. high yield and non-U.S. investment grade securities. Our decision to allocate assets out of high yield and the defensive positioning of the portfolio somewhat muted our performance during the reporting period.
We remained defensive throughout the period being shorter duration, which somewhat hampered performance as interest rates declined in the longer end of the curve. We will continue to position the portfolio defensively until we see a slowdown in the back up of rates on the short end of the curve.
Thank you for your investment in the Salomon Brothers Strategic Total Return Bond Portfolio. As ever, we appreciate that you have chosen us to manage your assets and we remain focused on achieving the fund’s investment goals.
Sincerely,
| | |

Peter J. Wilby, CFA Vice President and Investment Officer | | 
Beth A. Semmel, CFA Vice President and Investment Officer |
December 13, 2004
10 Travelers Series Fund Inc. | 2004 Annual Report
MANAGER OVERVIEW
SB Adjustable Rate Income Portfolio
Performance Review
For the 12 months ended October 31, 2004, the SB Adjustable Rate Income Portfolio returned 1.24%.1 In comparison, the portfolio’s unmanaged benchmark, the Citigroup 6-Month U.S. Treasury Bill Index,xx returned 1.16% for the same period. The Lipper variable short-intermediate investment grade debt funds category average2 was 2.25%.
Market Overview
U.S. government securities collectively generated positive total returns over the 12 months ended October 31, 2004, despite some market volatility as investors dissected language from the Fed for clues on its assessment of the U.S. economy and an indication when rates would begin to creep higher. The first five months were relatively stable as the economy showed signs of a turnaround, with the economic outlook for 2004 as encouraging as it has been since 1999. Nevertheless, despite the apparent strength of the economy, the Fed held fast to its 1.00% short-term lending rate, attributing the economic growth more to increases in productivity than to jobs. The Fed did, however, alter its policy language after its January meeting from the open-ended “considerable period” to simply state that it wished to show “patience” in “removing” the accommodation. Following the May policy meeting, the Fed again altered its accommodation language from “patience” in “removing” the accommodation to “a pace that is likely to measured”. We view this as an attempt by the Fed to signal that it intends to raise rates incrementally and deliberately over the months to come.
| 1 | The fund is an underlying investment option of various variable annuity products. A variable annuity product is a contract issued by an insurance company where the annuity premium (a set amount of dollars) is immediately turned into units of a portfolio of securities. Upon retirement, the policyholder is paid according to accumulated units whose dollar value varies according to the performance of the securities within the sub accounts. Its objective is to preserve, through investment, the purchasing value of the annuity, which otherwise is subject to erosion through inflation. The fund’s performance returns do not reflect the deduction of initial sales charges and expenses imposed in connection with investing in variable annuity contracts such as administrative fees, account charges and surrender charges, which if reflected, would reduce the performance of the fund. Past performance is no guarantee of future results. |
| 2 | Lipper, Inc. is a major independent mutual-fund tracking organization. Returns are based on the 12-month period ended October 31, 2004, calculated among the 31 funds in the fund’s Lipper category, including the reinvestment of dividends and capital gains, if any. |
11 Travelers Series Fund Inc. | 2004 Annual Report
Signs of inflation and strong non-farm payroll numbers began to appear in March and April of 2004. Strong job numbers, combined with inflation fighting language from the Fed, led to a rise in U.S. treasury yields, with 10-year yields gaining more than 100 basis points from their early March lows. Yields on most fixed-income instruments, particularly those on shorter-maturity issues, began moving up and continued their ascent as it became more evident that the improving economy and higher inflation would compel the Fed to act in June. The Fed finally raised its federal funds rate target to 1.25% in June off the stronger employment numbers.
Against this backdrop, fixed income markets finished on a somewhat more stable note in June and July. The Fed raised its federal funds target rate by an additional 0.25% at each subsequent meeting in July, August, and September, despite significant softening of many economic indicators during the late summer months, bringing the target rate to 1.75% at the end of the reporting cycle for the fund. Following the end of the fund’s reporting period, at its November meeting, the Fed once again raised its target for the federal funds rate by 0.25% to 2.00%.
Over the period, U.S. Treasuries, as represented by the Citigroup U.S. Treasury Bond Index,x returned 4.98%, rebounding in the third quarter after the worst quarter in more than two decades. U.S. Agencies, as represented by the Citigroup U.S. Agency Index,xi also had positive returns during the period of 4.78%. The sector saw widening in the third quarter of 2004, as the Office of Federal Housing Enterprise Oversight (OFHEO) and the SEC continued to look closely at the accounting practices of the Federal National Mortgage Association (“FNMA “). The market had been expecting no headline risk for the agencies until after the election. The mortgage-backed sector, as represented by the Citigroup Mortgage Index,xii returned 5.68%. Early in the third quarter of 2004, the environment looked favorable for mortgage-backed securities with light supply, low volatility and positive technicals. As the 10-year U.S. treasury note approached 4.10% later in the quarter, convexity started to become a concern and supply from originators increased.
Factors Influencing Fund Performance
Despite the volatility of the yield curve during the period, the fund outperformed its benchmark, the Citigroup 6-Month U.S. Treasury Bill Indexxx providing 8 basis points of excess returns. Our strategic allocation to mortgage-backed securities, specifically mortgage pass-throughs and, to a lesser extent collateralized mortgage obligations, and U.S. Treasury securities, benefited the fund during the period. Our substantial allocation to asset-backed securities provided diversification and attributed to NAV stability during periods of volatility within
12 Travelers Series Fund Inc. | 2004 Annual Report
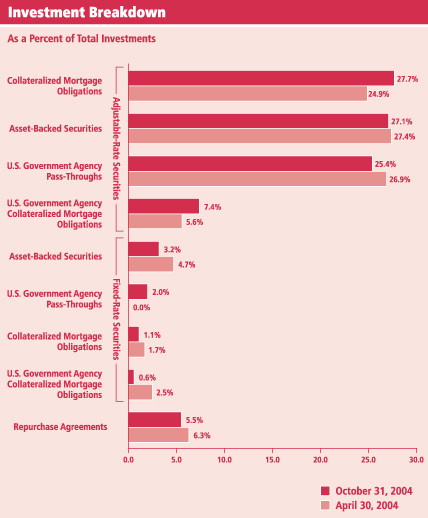
the mortgage sector. We continued to invest fund assets primarily in mortgage-backed and asset-backed securities, with strategic allocations to commercial mortgage backed securities. We increased our allocation to adjustable rate securities during the period as a defensive measure against upward pressure on the short end of the yield curve as rates continued to rise.xxi
We plan to maintain our current allocation to mortgage-backed securities and asset-backed securities in an effort to provide diversification and achieve greater total return.
Thank you for your investment in the SB Adjustable Rate Income Portfolio. As ever, we appreciate that you have chosen us to manage your assets and we remain focused on achieving the fund’s investment goals.
Sincerely,
| | |
 | |  |
| David A. Torchia | | Theresa M. Veres |
| Vice President and Investment Officer | | Vice President and Investment Officer |
December 13, 2004
The information provided is not intended to be a forecast of future events, a guarantee of future results or investment advice. Views expressed may differ from those of the firm as a whole.
RISKS:
Smith Barney International AIl Cap Growth Portfolio: Keep in mind, the fund is subject to certain risks of overseas investing, not associated with domestic investing, including currency fluctuations, change in political and economic conditions, differing securities regulations and periods of illiquidity, which could result in significant market fluctuations. These risks are magnified in emerging markets. The fund may use derivatives, such as options and futures, which can be illiquid, may disproportionately increase losses, and have a potentially large impact on fund performance.
Salomon Brothers Strategic Total Return Bond Portfolio: Investments in high-yield securities and foreign companies and governments, including emerging markets involve risks beyond those inherent solely in higher-rated and domestic investments. The risks of high-yield securities include, but are not limited to, price volatility and the possibility of default in the timely payment of interest and principal. Foreign stocks are subject to certain risks of overseas investing including currency fluctuations and changes in political and economic conditions, which could result in significant market fluctuations. The fund may use derivatives, such as options and futures, which can be illiquid, may disproportionately increase losses, and have a potentially large impact on fund performance. The fund is not diversified, which may magnify the fund’s losses from adverse events affecting a particular issuer.
SB Adjustable Rate Income Portfolio: Keep in mind, the fund is subject to fluctuations in share price as interest rates rise and fall. Adjustable rate securities are subject to additional risks such as prepayment risk. The fund may use derivatives, such as options and futures, which can be illiquid, may disproportionately increase losses, and have a potentially large impact on fund performance.
13 Travelers Series Fund Inc. | 2004 Annual Report
All index performance reflects no deduction for fees, expenses or taxes. Please note that an investor cannot invest directly in an index.
| i | Source: Commerce Department (Bureau of Economic Analysis). Refers to quarterly growth of Gross Domestic Product ("GDP"). Gross domestic product is a market value of goods and services produced by labor and property in a given country. |
| ii | Source: U.S. Federal Reserve Board. The Fed is responsible for the formulation of a policy designed to promote economic growth, full employment, stable prices, and a sustainable pattern of international trade and payments. |
| iii | The federal funds rate is the interest rate that banks with excess reserves at a Federal Reserve district bank charge other banks that need overnight loans. |
| iv | The MSCI EAFE Index is an unmanaged index of common stocks of companies located in Europe, Australasia and the Far East. |
| v | The MSCI EAFE Growth Index is an unmanaged index of growth stocks of companies located in Europe, Australasia and the Far East. |
14 Travelers Series Fund Inc. | 2004 Annual Report
| vi | Portfolio holdings and breakdowns are as of October 31, 2004 and are subject to change and may not be representative of the portfolio manager’s current or future investments. The fund’s top ten holdings as of this date were: Vodafone Group PLC (5.1%), Mettler-Toledo International, Inc. (A) (3.5%), Grafton Group PLC (3.3%), Roche Holdings AG (2.9%), Serco Group PLC (2.8%), Capita Group PLC (2.8%), CRH PLC (2.5%), Nokia Oyj (2.4%), CANON INC. (2.4%), UBS AG (2.3%). Please refer to pages 27 through 30 for a list and percentage breakdown of the fund’s holdings. |
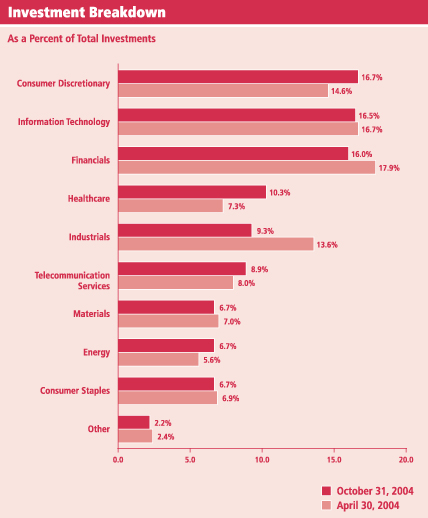
| vii | The mention of sector breakdowns is for informational purposes only and should not be construed as a recommendation to purchase or sell any securities. The information provided regarding such sectors is not a sufficient basis upon which to make an investment decision. Investors seeking financial advice regarding the appropriateness of investing in any securities or investment strategies discussed should consult their financial professional. Portfolio holdings are subject to change at any time and may not be representative of the portfolio manager’s current or future investments. The fund’s top five sector holdings as of October 31, 2004 were: Consumer Discretionary (16.4%); Information Technology (16.3%); Financials (15.7%); Healthcare (10.2%); Industrials (9.1%). The fund’s portfolio composition is subject to change at any time. |
| viii | The J.P. Morgan Global Government Bond Index — Unhedged is a daily, market capitalization-weighted, international fixed-income index consisting of 13 countries. |
| ix | The Lehman Brothers Aggregate Bond Index is a broad-based bond index comprised of Government, Corporate, Mortgage and Asset-backed issues, rated investment-grade or higher, and having at least one year to maturity. Effective December 31, 2004, The Lehman Brothers Aggregate Bond Index will replace the J.P. Morgan Global Government Bond Index — Unhedged as the fund’s sole benchmark. |
| x | The Citigroup U.S. Treasury Bond Index is a broad measure of the performance of U.S. Treasury securities. |
| xi | The Citigroup U.S. Agency Index is the U.S. Agency component of the Citigroup Broad Investment-Grade Bond Index. |
| xii | The Citigroup Mortgage Index is the mortgage component of the Citigroup Broad Investment-Grade Bond Index. It includes 30- and 15-year GNMA, Fannie Mae and Freddie Mac pass-throughs, and Fannie Mae and Freddie Mac balloon mortgages. |
| xiii | The Citigroup High Yield Market Index is a broad-based unmanaged index of high yield securities. |
| xiv | Yields are subject to change and will fluctuate. |
| xv | The J.P. Morgan Emerging Markets Bond Index Plus is a total return index that tracks the traded market for U.S. dollar-denominated Brady and other similar sovereign restructured bonds traded in the emerging markets. |
| xvi | Yield spread is the difference between yields on securities of the same quality but different maturities or the difference between yields on securities of the same maturity but different quality. |
| xvii | A basis point is one one-hundredth ( 1/100 or 0.01) of one percent. |
| xviii | Source: J.P. Morgan Chase. China. Columbia, Cote d'Ivoire, Croatia, Ecuador, Greece, Hungary, Lebanon, Malaysia, Mexico, Morocco, Nigeria, Panama, Peru, the Philippines, Poland, Russia, South Africa, South Korea. Thailand, Turkey and Venezuela. |
| xix | J.P. Morgan Emerging Markets Bond Index Global tracks total returns for U.S. dollar denominated debt instruments issued by emerging market sovereign and quasi-sovereign entities: Brady bonds, loans, Eurobonds, and local market instruments. Countries covered are Algeria, Argentina, Brazil, Bulgaria, Chile, |
| xx | The Citigroup 6-Month U.S. Treasury Bill Index performance is an average of the last 6-Month Treasury Bill issues. 6-Month U.S. Treasury Bills are guaranteed by the U.S. government and provide a fixed rate of return when held to maturity. |
| xxi | Portfolio holdings and breakdowns are as of October 31, 2004 and are subject to change and may not be representative of the portfolio manager’s current or future investments. The fund’s top ten holdings as of this date were: FNMA Six Month LIBOR, 4.810% due 10/1/34 (2.1%), MASTR Alternative Loan Trust, Series 2003-7, Class 7AI, 2.333% due 11/25/33 (1.9%), FNMA, 30 Year, 12.000% due 4/20/16 (1.6%), Credit Acceptance Auto Dealer Loan Trust, Series 2004-1, Class A, 2.530% due 8/17/09 (1.7%), Structured Asset Securities Corp., Series 2002-8A, Class 7A1, 3.319% due 5/25/32 (1.6%), FNMA Six Month Libor, 4.366% due 4/1/33 (1.6%), FNMA One Year LIBOR, 4.068% due 7/1/33 (1.6%), Renaissance Home Equity Loan Trust, Series 2003-3, Class A, 2.433% due 12/25/33 (1.5%), Fannie Mae REMIC Trust, Series 2003-W15, Class 3A, 4.027% due 12/25/42 (1.4%), Amortizing Residential Collateral Trust, Series 2002-BC10, Class A3, 2.363% due 1/25/33 (1.4%). Please refer to pages 42 through 47 for a list and percentage breakdown. |
15 Travelers Series Fund Inc. | 2004 Annual Report
International All Cap Growth Portfolio
Fund at a Glance (unaudited)
16 Travelers Series Fund Inc. | 2004 Annual Report
Salomon Brothers Strategic Total Return Bond Portfolio
Fund at a Glance (unaudited)
17 Travelers Series Fund Inc. | 2004 Annual Report
SB Adjustable Rate Income Portfolio
Fund at a Glance (unaudited)
18 Travelers Series Fund Inc. | 2004 Annual Report
Fund Expenses (unaudited)
Example
As a shareholder of the Fund, you may incur two types of costs: (1) transaction costs, including front-end and back-end sales charges (loads) on purchase payments, reinvested dividends, or other distributions; and (2) ongoing costs, including management fees; distribution and/or service (12b-1) fees; and other Fund expenses. This Example is intended to help you understand your ongoing costs (in dollars) of investing in the Fund and to compare these costs with the ongoing costs of investing in other mutual funds.
This example is based on an investment of $1,000 invested on May 1, 2004 and held for the six months ended October 31, 2004.
Actual Expenses
The table below titled “Based on Actual Total Return” provides information about actual account values and actual expenses. You may use the information provided in this table, together with the amount you invested, to estimate the expenses that you paid over the period. To estimate the expenses you paid on your account, divide your ending account value by $1,000 (for example, an $8,600 ending account value divided by $1,000 = 8.6), then multiply the result by the number under the heading entitled “Expenses Paid During the Period”.
| | | | | | | | | | | | | | | |
| Based on Actual Total Return(1) | | | |
| | | | | | | | | | | | | | | | |
| | | Actual
Total Return(2) | | | Beginning
Account
Value | | Ending
Account
Value | | Annualized
Expense
Ratio | | | Expenses
Paid During
the Period(3) |
Smith Barney International All Cap Growth Portfolio | | 3.79 | % | | $ | 1,000.00 | | $ | 1,037.90 | | 1.01 | % | | $ | 5.17 |
|
Salomon Brothers Strategic Total Return Bond Portfolio | | 4.69 | | | | 1,000.00 | | | 1,046.90 | | 1.27 | | | | 6.53 |
|
SB Adjustable Rate Income Portfolio | | 0.50 | | | | 1,000.00 | | | 1,005.00 | | 1.00 | | | | 5.04 |
|
| (1) | | For the six months ended October 31, 2004. |
| (2) | | Assumes reinvestment of all dividends and capital gain distributions, if any, at net asset value. Total return is not annualized, as it may not be representative of the total return for the year. Total returns do not reflect expenses associated with the separate account such as administrative fees, account charges and surrender charges which, if reflected, would reduce the total returns. Performance figures may reflect fee waivers and/or expense reimbursements. Past performance is no guarantee of future results. In the absence of fee waivers and/or expense reimbursements, the total return would have been lower. |
| (3) | | Expenses (net of voluntary waiver) are equal to each Fund’s respective annualized expense ratio multiplied by the average account value over the period, multiplied by the number of days in the most recent fiscal half-year, then divided by 366. |
19 Travelers Series Fund Inc. | 2004 Annual Report
Fund Expenses (unaudited) (continued)
Hypothetical Example for Comparison Purposes
The table below titled “Based on Hypothetical Total Return” provides information about hypothetical account values and hypothetical expenses based on the actual expense ratio and an assumed rate of return of 5.00% per year before expenses, which is not the Fund’s actual return. The hypothetical account values and expenses may not be used to estimate the actual ending account balance or expenses you paid for the period. You may use the information provided in this table to compare the ongoing costs of investing in the Fund and other funds. To do so, compare the 5.00% hypothetical example relating to the Fund with the 5.00% hypothetical examples that appear in the shareholder reports of the other funds.
Please note that the expenses shown in the table below are meant to highlight your ongoing costs only and do not reflect any transactional costs, such as front-end or back-end sales charges (loads). Therefore, the table is useful in comparing ongoing costs only, and will not help you determine the relative total costs of owning different funds. In addition, if these transaction costs were included, your costs would have been higher.
| | | | | | | | | | | | | | | |
| Based on Hypothetical Total Return(1) | | | |
| | | | | | | | | | | | | | | | |
| | | Hypothetical
Total Return | | | Beginning
Account
Value | | Ending
Account
Value | | Annualized
Expense
Ratios | | | Expenses
Paid During
the Period(2) |
Smith Barney International All Cap Growth Portfolio | | 5.00 | % | | $ | 1,000.00 | | $ | 1,020.06 | | 1.01 | % | | $ | 5.13 |
|
Salomon Brothers Strategic Total Return Bond Portfolio | | 5.00 | | | | 1,000.00 | | | 1,018.75 | | 1.27 | | | | 6.44 |
|
SB Adjustable Rate Income Portfolio | | 5.00 | | | | 1,000.00 | | | 1,020.11 | | 1.00 | | | | 5.08 |
|
| (1) | | For the six months ended October 31, 2004. |
| (2) | | Expenses (net of voluntary waiver) are equal each Fund’s respective annualized expense ratio multiplied by the average account value over the period, multiplied by the number of days in the most recent fiscal half-year, then divided by 366. |
20 Travelers Series Fund Inc. | 2004 Annual Report
Smith Barney International All Cap Growth Portfolio
Average Annual Total Returns† (unaudited)
| | | |
Twelve Months Ended 10/31/04 | | 13.90 | % |
|
|
Five Years Ended 10/31/04 | | (6.48 | ) |
|
|
Ten Years Ended 10/31/04 | | 1.44 | |
|
|
6/16/94* through 10/31/04 | | 1.91 | |
|
|
Cumulative Total Return† (unaudited)
| | | |
10/31/94 through 10/31/04 | | 15.33 | % |
|
|
| † | | Assumes the reinvestment of dividends and capital gains distributions, if any, at net asset value. All figures represent past performance and are not a guarantee of future results. Investment return and principal value of an investment will fluctuate so that an investor’s shares, when redeemed, may be worth more or less than their original cost. Total returns do not reflect expenses associated with the separate account such as administrative fees, account charges and surrender charges which, if reflected, would reduce the total returns. Performance figures may reflect fee waivers and/or expense reimbursements. In the absence of fee waivers and/or expense reimbursements, the total return would have been lower. |
| * | | Commencement of operations. |
21 Travelers Series Fund Inc. | 2004 Annual Report
Historical Performance (unaudited)
Value of $10,000 Invested in Shares of the
Smith Barney International All Cap Growth Portfolio vs.
MSCI EAFE Index and MSCI EAFE Growth Index†
October 1994 — October 2004

| † | Hypothetical illustration of $10,000 invested in shares of the Smith Barney International All Cap Growth Portfolio on October 31, 1994, assuming reinvestment of dividends and capital gains, if any, at net asset value through October 31, 2004. The Morgan Stanley Capital International Europe, Australasia and the Far East Growth Index (“MSCI EAFE Growth Index”) is an unmanaged index composed of growth stocks of companies located in Europe, Australasia and the Far East. The Morgan Stanley Capital International Europe, Australasia and the Far East Index (“MSCI EAFE Index”) is an unmanaged index of common stocks of companies located in Europe, Australasia and the Far East. The MSCI EAFE Index is weighted based on each company’s market capitalization. The indexes are not subject to the same management and trading expenses of a mutual fund. Please note that an investor cannot invest directly in an index. |
All figures represent past performance and are not a guarantee of future results. Investment return and principal value of an investment, which will fluctuate so that an investor’s shares, when redeemed, may be worth more or less than their original cost. The graph does not reflect expenses associated with the separate account such as administrative fees, account charges and surrender charges which, if reflected, would reduce the total returns. Performance figures may reflect fee waivers and/or expense reimbursements. In the absence of fee waivers and/or expense reimbursements, the total return would have been lower.
It is the opinion of management that the MSCI EAFE Growth Index more accurately reflects the current composition of the Fund than the MSCI EAFE Index. In future reports, the MSCI EAFE Growth Index will be used as the basis of comparison of total returns for all periods shown.
22 Travelers Series Fund Inc. | 2004 Annual Report
Salomon Brothers Strategic Total Return Bond Portfolio
Average Annual Total Returns† (unaudited)
| | | |
Twelve Months Ended 10/31/04 | | 6.83 | % |
|
|
Five Years Ended 10/31/04 | | 8.04 | |
|
|
Ten Years Ended 10/31/04 | | 7.39 | |
|
|
6/16/94* through 10/31/04 | | 7.06 | |
|
|
Cumulative Total Return† (unaudited)
| | | |
10/31/94 through 10/31/04 | | 104.03 | % |
|
|
| † | | Assumes the reinvestment of all dividends and capital gains distributions, if any, at net asset value. All figures represent past performance and are not a guarantee of future results. Investment return and principal value of an investment will fluctuate so that an investor’s shares, when redeemed, may be worth more or less than their original cost. Total returns do not reflect expenses associated with the separate account such as administrative fees, account charges and surrender charges which, if reflected, would reduce the total returns. Performance figures may reflect fee waivers and/or expense reimbursements. In the absence of fee waivers and/or expense reimbursements, the total return would have been lower. |
| * | | Commencement of operations. |
23 Travelers Series Fund Inc. | 2004 Annual Report
Historical Performance (unaudited)
Value of $10,000 Invested in Shares of the
Salomon Brothers Strategic Total Return Bond Portfolio vs.
J.P. Morgan Global Government Bond Index — Unhedged and Lehman Brothers U.S. Aggregate Bond Index†
October 1994 — October 2004
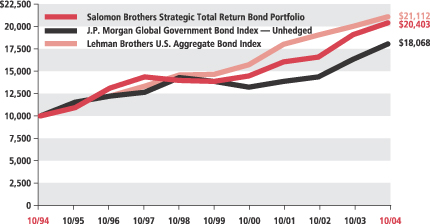
| † | Hypothetical illustration of $10,000 invested in shares of the Salomon Brothers Strategic Total Return Bond Portfolio on October 31, 1994, assuming reinvestment of dividends and capital gains, if any, at net asset value through October 31, 2004. The J.P. Morgan Global Government Bond Index — Unhedged is a daily, market capitalization weighted international fixed-income index consisting of 13 countries. The Lehman Brothers U.S. Aggregate Bond Index is a broad-based bond index comprised of Government, Corporate, Mortgage and Asset-backed issues, rated investment-grade or higher, and having at least one year to maturity. The Indexes are unmanaged and are not subject to the same management and trading expenses of a mutual fund. Please note that an investor cannot invest directly in an index. |
All figures represent past performance and are not a guarantee of future results. Investment return and principal value of an investment which will fluctuate so that an investor’s shares, when redeemed, may be worth more or less than their original cost. The graph does not reflect expenses associated with the separate account such as administrative fees, account charges and surrender charges which, if reflected, would reduce the total returns. Performance figures may reflect fee waivers and/or expense reimbursements. In the absence of fee waivers and/or expense reimbursements, the total return would have been lower.
24 Travelers Series Fund Inc. | 2004 Annual Report
SB Adjustable Rate Income Portfolio
Average Annual Total Returns† (unaudited)
| | | |
Twelve Months Ended 10/31/04 | | 1.24 | % |
|
|
9/12/03* through 10/31/04 | | 1.18 | |
|
|
Cumulative Total Return† (unaudited)
| | | |
9/12/03* through 10/31/04 | | 1.34 | % |
|
|
| † | | Assumes the reinvestment of all dividends and capital gains distributions, if any, at net asset value. All figures represent past performance and are not a guarantee of future results. Investment return and principal value of an investment will fluctuate so that an Investor’s shares, when redeemed, may be worth more or less than their original cost. Total returns do not reflect expenses associated with the separate account such as administrative fees, account charges and surrender charges which, if reflected, would reduce the total returns. Performance figures may reflect fee waivers and/or expense reimbursements. In the absence of fee waivers and/or expense reimbursements, the total return would have been lower. |
| * | | Commencement of operations. |
25 Travelers Series Fund Inc. | 2004 Annual Report
Historical Performance (unaudited)
Value of $10,000 Invested in Shares of the
SB Adjustable Rate Income Portfolio vs.
Citigroup 6 Month U.S. Treasury Bill Index†
September 2003 — October 2004
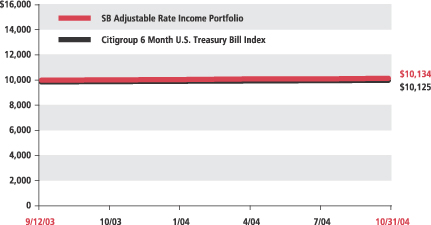
| † | Hypothetical illustration of $10,000 invested in shares of the SB Adjustable Rate Income Portfolio on September 12, 2003 (commencement of operations), assuming reinvestment of dividends and capital gains, if any, at net asset value through October 31, 2004. The Citigroup 6 Month U.S. Treasury Bill Index includes 6-Month Treasury Bills that are guaranteed by the U.S. government and provide a fixed rate of return when held to maturity. The Index is unmanaged and is not subject to the same management and trading expenses of a mutual fund. Please note that an investor cannot invest directly in an index. |
All figures represent past performance and are not a guarantee of future results. Investment return and principal value of an investment, which will fluctuate so that an investor’s shares, when redeemed, may be worth more or less than their original cost. The graph does not reflect expenses associated with the separate account such as administrative fees, account charges and surrender charges which, if reflected, would reduce the total returns. Performance figures may reflect fee waivers and/or expense reimbursements. In the absence of fee waivers and/or expense reimbursements, the total return would have been lower.
26 Travelers Series Fund Inc. | 2004 Annual Report
| | |
| Schedules of Investments | | October 31, 2004 |
SMITH BARNEY INTERNATIONAL ALL CAP GROWTH PORTFOLIO
| | | | | |
| SHARES | | SECURITY | | VALUE |
| | | | | | |
| STOCKS — 97.8% | | | |
| Australia — 2.5% | | | |
| 69,000 | | Macquarie Bank Ltd. (a) | | $ | 2,040,178 |
| 200,024 | | The News Corp. Ltd. (a) | | | 1,608,908 |
| 27,000 | | Westpac Banking Corp. | | | 380,714 |
|
| | | | | | 4,029,800 |
|
| Denmark — 1.4.% | | | |
| 44,000 | | Novo Nordisk A/S, Class B Shares | | | 2,185,206 |
|
| Finland — 2.4% | | | |
| 248,000 | | Nokia Oyj | | | 3,822,257 |
|
| France — 6.7% | | | |
| 154,000 | | Axa | | | 3,311,904 |
| 32,000 | | Essilor International SA (a) | | | 2,170,219 |
| 30,000 | | Groupe Danone (a) | | | 2,508,806 |
| 13,000 | | Total SA (a) | | | 2,701,300 |
|
| | | | | | 10,692,229 |
|
| Germany — 3.0% | | | |
| 25,300 | | BASF AG (a) | | | 1,577,144 |
| 12,500 | | SAP AG (a) | | | 2,127,800 |
| 50,000 | | Stada Arzneimittel AG (a) | | | 1,040,874 |
|
| | | | | | 4,745,818 |
|
| Hong Kong — 2.3% | | | |
| 118,000 | | Hutchinson Whampoa Ltd. | | | 909,616 |
| 826,000 | | Li & Fung Ltd. (a) | | | 1,225,708 |
| 525,000 | | Luen Thai Holdings Ltd. (b) | | | 269,802 |
| 191,000 | | Swire Pacific Ltd. | | | 1,355,785 |
|
| | | | | | 3,760,911 |
|
| Ireland — 8.4% | | | |
| 128,000 | | Bank of Ireland | | | 1,754,124 |
| 168,000 | | CRH PLC | | | 4,004,911 |
| 584,000 | | Grafton Group PLC (b) | | | 5,248,605 |
| 180,740 | | Irish Continental Group PLC | | | 2,338,634 |
|
| | | | | | 13,346,274 |
|
| Italy — 1.1% | | | |
| 150,000 | | Saipem S.p.A. | | | 1,728,628 |
|
| Japan — 17.7% | | | |
| 77,000 | | CANON INC. | | | 3,798,434 |
| 30,000 | | DaiichiKosho Co., Ltd. | | | 911,149 |
| 300 | | Dentsu Inc. | | | 803,622 |
| 179,000 | | Dowa Mining Co., Ltd. | | | 1,080,551 |
| 44,500 | | Honda Motor Co., Ltd. | | | 2,149,028 |
See Notes to Financial Statements.
27 Travelers Series Fund Inc. | 2004 Annual Report
| | |
| Schedules of Investments (continued) | | October 31, 2004 |
SMITH BARNEY INTERNATIONAL ALL CAP GROWTH PORTFOLIO
| | | | | |
| SHARES | | SECURITY | | VALUE |
| | | | | | |
| Japan — 17.7% (continued) | | | |
| 16,000 | | Hoya Corp. | | $ | 1,641,954 |
| 58,000 | | Ito-Yokado Co., Ltd. | | | 2,078,853 |
| 298 | | Mitsubishi Tokyo Financial Group, Inc. | | | 2,529,711 |
| 14,000 | | Nichii Gakkan Co. | | | 377,665 |
| 8,500 | | Nidec Corp. (a) | | | 920,392 |
| 159,000 | | Nomura Holdings, Inc. | | | 1,949,632 |
| 580 | | NTT DoCoMo, Inc. | | | 1,023,015 |
| 120 | | Rakuten, Inc. (a) | | | 899,830 |
| 12,000 | | Rohm Co., Ltd. | | | 1,231,466 |
| 26,000 | | Seven-Eleven Japan Co., Ltd. | | | 752,877 |
| 100,000 | | Sharp Corp. | | | 1,380,872 |
| 34,000 | | Shin-Etsu Chemical Co., Ltd. | | | 1,292,398 |
| 100,000 | | Terumo Corp. | | | 2,490,096 |
| 18,600 | | Tokyo Electron Ltd. | | | 1,008,772 |
|
| | | | | | 28,320,317 |
|
| Mexico — 2.0% | | | |
| 995,000 | | Wal-Mart De Mexico S.A. de C.V. | | | 3,255,439 |
|
| The Netherlands — 3.0% | | | |
| 39,351 | | ING Groep N.V. | | | 1,040,916 |
| 72,000 | | Randstad Holdings N.V. (a) | | | 2,424,057 |
| 25,000 | | Royal Dutch Petroleum Co. | | | 1,357,343 |
|
| | | | | | 4,822,316 |
|
| Norway — 0.9% | | | |
| 297,000 | | Stolt Offshore S.A. (a)(b) | | | 1,468,043 |
|
| Singapore — 2.3% | | | |
| 200,000 | | DBS Group Holdings, Ltd. | | | 1,875,282 |
| 289,000 | | Singapore Press Holdings, Ltd. | | | 816,409 |
| 104,000 | | Venture Corp., Ltd. | | | 987,648 |
|
| | | | | | 3,679,339 |
|
| Spain — 5.4% | | | |
| 136,000 | | Banco Bilbao Vizcaya Argentaria, S.A. (a) | | | 2,132,485 |
| 226,000 | | Indra Sistemas, S.A. | | | 3,347,777 |
| 190,000 | | Telefonica S.A. (b) | | | 3,134,222 |
|
| | | | | | 8,614,484 |
|
| Sweden — 2.2% | | | |
| 46,500 | | Atlas Copco AB (a) | | | 1,922,624 |
| 534,000 | | Telefonaktiebolaget LM Ericsson (b) | | | 1,549,680 |
|
| | | | | | 3,472,304 |
|
| Switzerland — 11.4% | | | |
| 115,500 | | Mettler-Toledo International Inc. (b) | | | 5,532,450 |
| 6,500 | | Nestle SA | | | 1,536,191 |
| 41,000 | | Novartis AG | | | 1,953,358 |
See Notes to Financial Statements.
28 Travelers Series Fund Inc. | 2004 Annual Report
| | |
| Schedules of Investments (continued) | | October 31, 2004 |
SMITH BARNEY INTERNATIONAL ALL CAP GROWTH PORTFOLIO
| | | | | |
| SHARES | | SECURITY | | VALUE |
| | | | | | |
| Switzerland — 11.4% (continued) | | | |
| 45,000 | | Roche Holdings AG | | $ | 4,595,745 |
| 8,800 | | Synthes, Inc. (b) | | | 936,904 |
| 50,600 | | UBS AG | | | 3,643,538 |
|
| | | | | | 18,198,186 |
|
| United Kingdom — 25.1% | | | |
| 50,000 | | BOC Group PLC | | | 804,472 |
| 330,700 | | BP PLC | | | 3,200,354 |
| 681,000 | | Capita Group PLC | | | 4,394,632 |
| 535,000 | | Compass Group PLC | | | 2,208,400 |
| 184,000 | | Diageo PLC | | | 2,459,171 |
| 87,538 | | HSBC Holdings PLC | | | 1,417,073 |
| 326,470 | | Kingfisher PLC | | | 1,810,302 |
| 880,000 | | mm02 PLC (b) | | | 1,699,206 |
| 70,000 | | Rio Tinto PLC | | | 1,828,729 |
| 57,647 | | Royal Bank of Scotland Group PLC | | | 1,697,435 |
| 1,137,000 | | Serco Group PLC | | | 4,547,349 |
| 100,000 | | Smith & Nephew PLC | | | 848,502 |
| 605,145 | | Tesco PLC | | | 3,186,271 |
| 3,196,000 | | Vodafone Group PLC | | | 8,179,416 |
| 178,000 | | WPP Group PLC | | | 1,784,644 |
|
| | | | | | 40,065,956 |
|
| | | TOTAL STOCKS
(Cost — $125,575,033) | | | 156,207,507 |
|
| | |
FACE
AMOUNT | | | | |
| REPURCHASE AGREEMENT — 0.6% | | | |
| $ 884,000 | | Goldman, Sachs & Co. dated 10/29/04, 1.840% due 11/1/04; Proceeds at maturity — $884,136; (Fully collateralized by various U.S. government agency obligations, 0.000% to 10.625% due 12/2/04 to 4/15/29; Market value — $901,680) (Cost — $884,000) | | | 884,000 |
|
| | | TOTAL INVESTMENTS — 98.4% (Cost — $126,459,033*) | | | 157,091,507 |
| | | Other Assets in Excess of Liabilities — 1.6% | | | 2,630,140 |
|
| | | TOTAL NET ASSETS — 100.0% | | $ | 159,721,647 |
|
| LOANED SECURITIES COLLATERAL | | | |
| 21,892,934 | | State Street Navigator Securities Lending Trust Prime Portfolio
(Cost — $21,892,934) | | $ | 21,892,934 |
|
| (a) | | All or a portion of this security is on loan (See Notes 1 and 3). |
| (b) | | Non-income producing security. |
| * | | Aggregate cost for federal income tax purposes is $126,490,649. |
See Notes to Financial Statements.
29 Travelers Series Fund Inc. | 2004 Annual Report
| | |
| Schedules of Investments (continued) | | October 31, 2004 |
| | | |
| Summary of Investments by Sector* | | | |
Consumer Discretionary | | 16.7 | % |
Information Technology | | 16.5 | |
Financials | | 16.0 | |
Healthcare | | 10.3 | |
Industrials | | 9.3 | |
Telecommunication Services | | 8.9 | |
Materials | | 6.7 | |
Energy | | 6.7 | |
Consumer Staples | | 6.7 | |
Other | | 2.2 | |
|
|
| | | 100.0 | % |
|
|
| * | | As a percentage of total investments. |
See Notes to Financial Statements.
30 Travelers Series Fund Inc. | 2004 Annual Report
| | |
| Schedules of Investments (continued) | | October 31, 2004 |
| | | | | | | |
| SALOMON BROTHERS STRATEGIC TOTAL RETURN BOND PORTFOLIO |
FACE
AMOUNT† | | RATING(e) | | SECURITY | | VALUE |
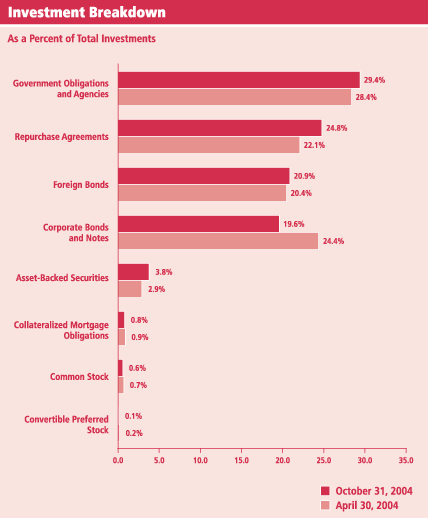
| U.S. GOVERNMENT OBLIGATIONS AND AGENCIES — 38.4% | | | |
| | | | | U.S. Treasury Notes: | | | |
| $ 450,000 | | | | 4.875% due 2/15/12 (a)(b) | | $ | 482,397 |
| 205,000 | | | | 4.000% due 2/15/14 (a) | | | 205,072 |
| 400,000 | | | | U.S. Treasury Bonds, 6.250% due 5/15/30 (a)(b) | | | 481,125 |
| | | | | Federal Home Loan Mortgage Corp.: | | | |
| 1,000,000 | | | | 5.000% due 11/1/34 (c)(d) | | | 997,188 |
| 1,250,000 | | | | 6.000% due 11/1/34 (c)(d) | | | 1,294,531 |
| | | | | Federal National Mortgage Association: | | | |
| 250,000 | | | | 5.000% due 11/1/34 (c)(d) | | | 249,140 |
| 500,000 | | | | 6.500% due 11/1/34 (c)(d) | | | 525,781 |
| 2,000,000 | | | | 7.000% due 11/1/34 (c)(d) | | | 2,123,750 |
|
| | | | | TOTAL U.S. GOVERNMENT OBLIGATIONS
AND AGENCIES (Cost — $6,225,662) | | | 6,358,984 |
|
| COLLATERALIZED MORTGAGE OBLIGATIONS — 1.1% | | | |
| 57,873 | | A+ | | Commercial Mortgage Pass-Through Certificates, Series 2003-FL9, Class E, 2.870% due 11/15/15 (f)(g) | | | 58,233 |
| 125,000 | | A2* | | Merit Securities Corp., Series 11PA, Class B2, 3.459% due 9/28/32 (f)(g) | | | 120,742 |
|
| | | | | TOTAL COLLATERALIZED MORTGAGE OBLIGATIONS (Cost — $170,339) | | | 178,975 |
|
| ASSET-BACKED SECURITIES — 4.9% | | | |
| 150,000 | | A | | Amortizing Residential Collateral Trust, Series 2002-BC6, Class M2, 3.132% due 8/25/32 (g) | | | 150,750 |
| 250,000 | | A2* | | Bayview Financial Acquisition Trust, Series 2001-CA, Class M3, 3.182% due 8/25/36 (f)(g) | | | 248,281 |
| | | | | Bear Stearns Asset Backed Securities: | | | |
| 18,509 | | BBB | | Series 2003-HE1N, Class N1, 6.500% due 8/25/05 (f) | | | 18,636 |
| 32,890 | | BBB | | Series 2004-FR1N, Class A1, 5.000% due 5/25/34 (f) | | | 32,821 |
| 33,035 | | BBB | | Series 2004-HE6, Class A1, 5.250% due 8/25/34 (f) | | | 33,000 |
| | | | | Countrywide Asset-Backed Certificates: | | | |
| 50,000 | | AA | | Series 2004-5, Class M4, 3.182% due 6/25/34 (g) | | | 50,029 |
| 33,290 | | BBB | | Series 2004-5N, Class N1, 5.500% due 10/25/35 (f) | | | 33,369 |
| 71,790 | | B | | First Consumers Master Trust, Series 2001-A, Class A, 2.180% due 9/15/08 (g) | | | 69,873 |
| 50,183 | | AAA | | Green Tree Home Equity Loan Trust, Series 1999-D, Class A5, 7.880% due 9/15/30 | | | 50,671 |
| 70,000 | | BBB | | Metris Master Trust, Series 2001-2, Class B,
2.990% due 11/20/09 (g) | | | 69,475 |
| 20,000 | | A | | Novastar Home Equity Loan Trust, Series 2003-4, Class M2, 3.557% due 2/25/34 (g) | | | 20,456 |
See Notes to Financial Statements.
31 Travelers Series Fund Inc. | 2004 Annual Report
| | |
| Schedules of Investments (continued) | | October 31, 2004 |
| | | | | | | |
| SALOMON BROTHERS STRATEGIC TOTAL RETURN BOND PORTFOLIO |
FACE
AMOUNT | | RATING(e) | | SECURITY | | VALUE |
| ASSET-BACKED SECURITIES — 4.9% (continued) | | | |
| | | | | Sail Net Interest Margin Notes: | | | |
| $ 6,184 | | BBB | | Series 2003-3, Class A, 7.750% due 4/27/33 (f) | | $ | 6,221 |
| 32,844 | | BBB+ | | Series 2004-4A, Class A, 5.000% due 4/27/34 (f) | | | 32,896 |
|
| | | | | TOTAL ASSET-BACKED SECURITIES (Cost $802,700) | | | 816,478 |
|
| CORPORATE BONDS AND NOTES — 25.6% | | | |
| Aerospace/Defense — 0.3% | | | |
| 25,000 | | B | | Alliant Techsystems Inc., Sr. Sub. Notes, 8.500% due 5/15/11 (a) | | | 27,688 |
| 25,000 | | BB- | | Sequa Corp., Sr. Notes, 9.000% due 8/1/09 | | | 28,062 |
|
| | | | | | | | 55,750 |
|
| Airlines — 0.1% | | | |
| 25,000 | | BB- | | Continental Airlines, Inc., Pass-Through Certificates, Series 98-3, Class C-2, 7.250% due 11/1/05 (a) | | | 22,142 |
|
| Automotive — 0.3% | | | |
| 25,000 | | B- | | EaglePicher Inc., Sr. Notes, 9.750% due 9/1/13 | | | 25,500 |
| 22,000 | | BB- | | TRW Automotive Inc., Sr. Notes, 9.375% due 2/15/13 | | | 25,410 |
|
| | | | | | | | 50,910 |
|
| Business Services — 0.2% | | | |
| 25,000 | | CCC | | SITEL Corp., Sr. Sub. Notes, 9.250% due 3/15/06 | | | 25,125 |
|
| Chemicals — 1.8% | | | |
| 15,000 | | Caa3* | | Applied Extrusion Technologies, Inc., Sr. Notes, Series B, 10.750% due 7/1/11 (h) | | | 9,075 |
| 25,000 | | BB+ | | FMC Corp., Sr. Debentures, 7.750% due 7/1/11 | | | 26,625 |
| 25,000 | | B | | Huntsman Advanced Materials LLC., Sr. Secured Second Lien Notes, 11.000% due 7/15/10 (a)(f) | | | 29,000 |
| 25,000 | | CCC+ | | Huntsman ICI Chemicals LLC, Sr. Sub. Notes, 10.125% due 7/1/09 | | | 26,375 |
| 25,000 | | BB- | | ISP Chemco Inc., Sr. Sub. Notes, Series B, 10.250% due 7/1/11 | | | 28,000 |
| 25,000 | | B+ | | Lyondell Chemical Co., Sr. Secured Notes, 11.125% due 7/15/12 | | | 29,594 |
| 25,000 | | BBB- | | Methanex Corp., Sr. Notes, 8.750% due 8/15/12 | | | 29,375 |
| 25,000 | | BB- | | Millenium America Inc., Sr. Notes, 9.250% due 6/15/08 (f) | | | 28,000 |
| 25,000 | | CCC | | Resolution Performance Products LLC, Sr. Sub. Notes, 13.500% due 11/15/10 | | | 24,875 |
| 25,000 | | CCC+ | | Rhodia S.A., Sr. Sub. Notes, 8.875% due 6/1/11 | | | 23,500 |
| 25,000 | | B- | | United Industries Corp., Sr. Sub. Notes, Series D, 9.875% due 4/1/09 | | | 26,375 |
| 16,000 | | BB- | | Westlake Chemical Corp., Sr. Notes, 8.750% due 7/15/11 | | | 18,120 |
|
| | | | | | | | 298,914 |
|
| Consumer Products & Services — 1.0% | | | |
| 1,000 | | CCC | | Applica Inc., Sr. Sub. Notes, 10.000% due 7/31/08 | | | 980 |
| 25,000 | | C* | | Brown Jordan International, Inc., Sr. Sub. Notes, Series B, 12.750% due 8/15/07 | | | 20,750 |
See Notes to Financial Statements.
32 Travelers Series Fund Inc. | 2004 Annual Report
| | |
| Schedules of Investments (continued) | | October 31, 2004 |
| | | | | | | |
| SALOMON BROTHERS STRATEGIC TOTAL RETURN BOND PORTFOLIO |
FACE
AMOUNT | | RATING(e) | | SECURITY | | VALUE |
| Consumer Products & Services — 1.0% (continued) | | | |
| $ 50,000 | | CCC+ | | Home Interiors & Gifts, Inc., Sr. Sub. Notes, 10.125% due 6/1/08 | | $ | 43,250 |
| 25,000 | | B- | | ICON Health & Fitness, Inc., Sr. Sub. Notes, 11.250% due 4/1/12 | | | 20,875 |
| 25,000 | | B- | | Jafra Cosmetics International, Inc./Distribuidora Comercial Jafra, S.A. de C.V., Sr. Sub. Notes, 10.750% due 5/15/11 | | | 28,625 |
| 20,000 | | CCC | | Levi Strauss & Co., Sr. Notes, 12.250% due 12/15/12 | | | 20,750 |
| 16,000 | | B | | Tempur-Pedic, Inc./Tempur Production USA, Inc., Sr. Sub. Notes, 10.250% due 8/15/10 | | | 18,600 |
|
| | | | | | | | 153,830 |
|
| Energy — 1.3% | | | |
| 50,000 | | BBB | | Devon Financing Corp., ULC., Notes, 6.875% due 9/30/11 | | | 57,332 |
| 16,000 | | B+ | | Magnum Hunter Resources, Inc., Sr. Notes, 9.600% due 3/15/12 | | | 18,360 |
| 75,000 | | BBB- | | Petróleos Mexicanos, Global Bonds, 9.500% due 9/15/27 | | | 92,625 |
| 25,000 | | B+ | | Stone Energy Corp., Sr. Sub. Notes, 8.250% due 12/15/11 | | | 27,250 |
| 25,000 | | B | | Vintage Petroleum, Inc., Sr. Sub. Notes, 7.875% due 5/15/11 | | | 27,125 |
|
| | | | | | | | 222,692 |
|
| Environmental Services — 0.3% | | | |
| 25,000 | | BB- | | Allied Waste North America, Inc., Sr. Notes, Series B, 9.250% due 9/1/12 (a) | | | 27,125 |
| 25,000 | | B- | | IMCO Recycling Inc., Sr. Secured Notes, Series B, 10.375% due 10/15/10 | | | 28,000 |
|
| | | | | | | | 55,125 |
|
| Financial Services — 4.8% | | | |
| 80,000 | | A+ | | Bank of America Corp., Sr. Notes, 4.875% due 9/15/12 | | | 82,293 |
| 25,000 | | B- | | BCP Caylux Holdings Luxembourg S.C.A., Sr. Sub. Notes, 9.625% due 6/15/14 (f) | | | 28,125 |
| 100,000 | | BBB- | | Capital One Financial Corp., Notes, 7.250% due 5/1/06 | | | 105,989 |
| 75,000 | | A | | CIT Group Inc., Sr. Notes, 7.750% due 4/2/12 | | | 89,409 |
| 100,000 | | AAA | | General Electric Capital Corp., Global Medium-Term Notes, Series A, 6.000% due 6/15/12 | | | 109,965 |
| 75,000 | | A | | Household Finance Corp., Notes, 6.375% due 11/27/12 | | | 83,862 |
| 50,000 | | AA- | | International Lease Finance Corp., Medium-Term Notes,
Series O, 4.375% due 11/1/09 | | | 50,171 |
| 70,000 | | A | | JPMorgan Chase & Co., Sub. Notes, 6.625% due 3/15/12 | | | 79,152 |
| 25,000 | | A | | Lehman Brothers Holdings Inc., Notes, 3.500% due 8/7/08 | | | 24,903 |
| 55,000 | | BBB | | MBNA Corp., Sr. Medium-Term Notes, 4.625% due 9/15/08 | | | 56,587 |
| 75,000 | | A+ | | Morgan Stanley, Notes, 6.600% due 4/1/12 | | | 84,655 |
|
| | | | | | | | 795,111 |
|
| Food & Beverage — 0.4% | | | |
| 25,000 | | B | | Del Monte Corp., Sr. Sub. Notes, Series B, 9.250% due 5/15/11 | | | 27,750 |
| 40,000 | | BBB+ | | Kraft Foods Inc., Notes, 5.625% due 11/1/11 | | | 42,681 |
|
| | | | | | | | 70,431 |
|
See Notes to Financial Statements.
33 Travelers Series Fund Inc. | 2004 Annual Report
| | |
| Schedules of Investments (continued) | | October 31, 2004 |
| | | | | | | |
| SALOMON BROTHERS STRATEGIC TOTAL RETURN BOND PORTFOLIO |
FACE
AMOUNT | | RATING(e) | | SECURITY | | VALUE |
| Healthcare — 0.4% | | | |
| $ 25,000 | | CC | | aaiPharma Inc., Sr. Sub. Notes, 12.000% due 4/1/10 (a)(g) | | $ | 19,250 |
| 25,000 | | B | | Extendicare Health Services, Inc., Sr. Notes, 9.500% due 7/1/10 | | | 28,250 |
| 25,000 | | B- | | Tenet Healthcare Corp., Sr. Notes, 9.875% due 7/1/14 (f) | | | 26,312 |
|
| | | | | | | | 73,812 |
|
| Hotel/Casino — 0.7% | | | |
| 25,000 | | B+ | | Host Marriott, L.P., Sr. Notes, 7.125% due 11/1/13 | | | 27,125 |
| 25,000 | | B | | John Q. Hammons Hotels L.P./John Q. Hammons Hotels Finance Corp. III, First Mortgage Notes, Series B,
8.875% due 5/15/12 | | | 28,875 |
| 25,000 | | BB+ | | MGM Mirage Inc., Sr. Notes, 6.750% due 9/1/12 (f) | | | 26,625 |
| 25,000 | | B+ | | Turning Stone Casino Resort Enterprise, Sr. Notes, 9.125% due 12/15/10 (f) | | | 27,250 |
|
| | | | | | | | 109,875 |
|
| Machinery — 0.5% | | | |
| 25,000 | | BB- | | Case New Holland Inc., Sr. Notes, 9.250% due 8/1/11 (f) | | | 28,625 |
| 25,000 | | B+ | | NMHG Holding Co., Sr. Notes, 10.000% due 5/15/09 | | | 27,781 |
| 25,000 | | B | | Terex Corp., Sr. Sub. Notes, Series B, 10.375% due 4/1/11 | | | 28,250 |
|
| | | | | | | | 84,656 |
|
| Manufacturing — 0.2% | | | |
| 25,000 | | B- | | Medical Device Manufacturing Inc., Sr. Sub. Notes, 10.000% due 7/15/12 (f) | | | 26,875 |
|
| Media — 2.8% | | | |
| | | | | Charter Communications Holdings, LLC/Charter Communications Holdings Capital Corp.: | | | |
| 15,000 | | CCC- | | Sr. Discount Notes, step bond to yield 18.168% due 5/15/11 | | | 9,750 |
| | | | | Sr. Notes: | | | |
| 25,000 | | CCC- | | 8.250% due 4/1/07 | | | 23,750 |
| 25,000 | | CCC- | | 10.250% due 1/15/10 | | | 20,625 |
| 10,000 | | CCC- | | 10.000% due 5/15/11 | | | 8,050 |
| 50,000 | | BBB | | Comcast Cable Communications Holdings, Notes, 8.375% due 3/15/13 (a) | | | 61,441 |
| 100,000 | | BBB | | Cox Communications, Inc., Notes, 7.750% due 11/1/10 (a) | | | 114,894 |
| 25,000 | | B+ | | CSC Holdings, Inc., Sr. Sub. Debentures, 10.500% due 5/15/16 | | | 28,688 |
| 25,000 | | BB- | | DIRECTV Holdings LLC/DIRECTV Financing Co., Inc., Sr. Notes, 8.375% due 3/15/13 | | | 28,625 |
| 25,000 | | CCC+ | | Loews Cineplex Entertainment Corp., Sr. Sub. Notes, 9.000% due 8/1/14 (f) | | | 26,312 |
| 25,000 | | B | | Mediacom LLC/Mediacom Capital Corp., Sr. Notes, 9.500% due 1/15/13 | | | 24,625 |
| 25,000 | | CCC | | Muzak LLC/Muzak Finance Corp., Sr. Notes, 10.000% due 2/15/09 | | | 22,500 |
See Notes to Financial Statements.
34 Travelers Series Fund Inc. | 2004 Annual Report
| | |
| Schedules of Investments (continued) | | October 31, 2004 |
| | | | | | | |
| SALOMON BROTHERS STRATEGIC TOTAL RETURN BOND PORTFOLIO |
FACE
AMOUNT | | RATING(e) | | SECURITY | | VALUE |
| Media — 2.8% (continued) | | | |
| $ 25,000 | | B | | Nextmedia Operating, Inc., Sr. Sub. Notes, 10.750% due 7/1/11 | | $ | 28,156 |
| 50,000 | | BBB+ | | Time Warner Inc., Debentures, 7.625% due 4/15/31 (a) | | | 59,425 |
|
| | | | | | | | 456,841 |
|
| Metals/Mining — 0.9% | | | |
| 25,000 | | B+ | | AK Steel Corp., Sr. Notes, 7.875% due 2/15/09 (a) | | | 25,500 |
| 25,000 | | B- | | Ispat Inland ULC, Sr. Secured Notes, 9.750% due 4/1/14 | | | 30,500 |
| 25,000 | | B- | | Mueller Group, Inc., Sr. Sub. Notes, 10.000% due 5/1/12 | | | 27,125 |
| 200,000 | | NR | | Republic Technologies International, LLC/RTI Capital Corp., Sr. Secured Notes, 13.750% due 7/15/09 (h)(j)‡ | | | 0 |
| 65,000 | | BBB | | WMC Finance (USA) Ltd., Notes, 5.125% due 5/15/13 | | | 65,991 |
|
| | | | | | | | 149,116 |
|
| Packaging/Containers — 0.8% | | | |
| 25,000 | | B- | | Berry Plastics Corp., Sr. Sub. Notes, 10.750% due 7/15/12 | | | 28,875 |
| 25,000 | | B | | Jefferson Smurfit Corp. (U.S.), Sr. Notes, 8.250% due 10/1/12 | | | 27,875 |
| 25,000 | | B+ | | Plastipak Holdings, Inc., Sr. Notes, 10.750% due 9/1/11 | | | 28,125 |
| 25,000 | | B- | | Pliant Corp., Sr. Secured Notes, 11.125% due 9/1/09 | | | 27,000 |
| 25,000 | | CCC | | Radnor Holdings Corp., Sr. Notes, 11.000% due 3/15/10 | | | 19,375 |
|
| | | | | | | | 131,250 |
|
| Paper/Forestry Products — 0.5% | | | |
| 25,000 | | B | | Buckeye Technologies Inc., Sr. Sub. Notes,
8.000% due 10/15/10 | | | 25,625 |
| 60,000 | | BBB- | | Domtar Inc., Notes, 5.375% due 12/1/13 | | | 59,324 |
|
| | | | | | | | 84,949 |
|
| Printing/Publishing — 0.5% | | | |
| 25,000 | | BB- | | Cenveo Corp., Sr. Notes, 9.625% due 3/15/12 | | | 27,875 |
| 23,000 | | B | | Dex Media West LLC/Dex Media West Finance Co., Sr. Sub. Notes, Series B, 9.875% due 8/15/13 | | | 27,313 |
| 25,000 | | B+ | | R.H. Donnelley Finance Corp I., Sr. Sub. Notes, 10.875% due 12/15/12 (f) | | | 30,688 |
|
| | | | | | | | 85,876 |
|
| Real Estate — 0.6% | | | |
| 65,000 | | BBB | | Boston Properties LP., Sr. Notes, 6.250% due 1/15/13 | | | 70,832 |
| 25,000 | | CCC+ | | MeriStar Hospitality Operating Partnership, L.P./MeriStar Hospitality Finance Corp. II, Sr. Notes, 10.500% due 6/15/09 | | | 27,625 |
|
| | | | | | | | 98,457 |
|
| Retail — 1.6% | | | |
| 50,000 | | CCC+ | | Eye Care Centers of America, Inc., Sr. Sub. Notes, 9.125% due 5/1/08 | | | 50,250 |
| 25,000 | | B | | Jean Coutu Group (PJC) Inc., Sr. Sub. Notes,
8.500% due 8/1/14 (f) | | | 25,625 |
See Notes to Financial Statements.
35 Travelers Series Fund Inc. | 2004 Annual Report
| | |
| Schedules of Investments (continued) | | October 31, 2004 |
| | | | | | | |
| SALOMON BROTHERS STRATEGIC TOTAL RETURN BOND PORTFOLIO |
FACE
AMOUNT | | RATING(e) | | SECURITY | | VALUE |
| Retail — 1.6% (continued) | | | |
| $ 60,000 | | BBB | | Limited Brands, Inc., Exchange Debentures, 6.950% due 3/1/33 | | $ | 65,157 |
| 25,000 | | B+ | | PETCO Animal Supplies, Inc., Sr. Sub. Notes,
10.750% due 11/1/11 | | | 29,250 |
| 75,000 | | BBB | | Safeway Inc., Debentures, 7.250% due 2/1/31 | | | 84,867 |
|
| | | | | | | | 255,149 |
|
| Technology — 0.1% | | | |
| 25,000 | | CCC+ | | Amkor Technology, Inc., Sr. Sub. Notes, 10.500% due 5/1/09 | | | 22,250 |
|
| Telecommunications — 2.6% | | | |
| 7,000 | | CCC | | Alamosa (Delaware), Inc., Sr. Notes, 11.000% due 7/31/10 (a) | | | 8,225 |
| 3,000 | | CCC | | American Tower Corp., Sr. Notes, 9.375% due 2/1/09 | | | 3,188 |
| 50,000 | | A | | AT&T Wireless Services, Inc., Sr. Notes, 8.750% due 3/1/31 (a) | | | 67,331 |
| 25,000 | | CCC | | Centennial Communications Corp./Centennial Cellular Operating Co. LLC/Centennial Puerto Rico Operations Corp., Sr. Notes, 8.125% due 2/1/14 (f) | | | 25,375 |
| 25,000 | | CCC | | Crown Castle International Corp., Sr. Notes,
10.750% due 8/1/11 | | | 27,813 |
| 15,000 | | B+ | | Insight Midwest L.P./Insight Capital, Inc., Sr. Notes, 10.500% due 11/1/10 | | | 16,687 |
| 25,000 | | BB- | | L-3 Communications Corp., Sr. Sub. Notes,
7.625% due 6/15/12 | | | 27,750 |
| 25,000 | | B | | Lucent Technologies Inc., Debentures, 6.450% due 3/15/29 | | | 21,594 |
| 25,000 | | BB | | Nextel Communications Inc., Sr. Notes, 6.875% due 10/31/13 | | | 27,250 |
| 25,000 | | B+ | | PanAmSat Corp., Sr. Notes, 9.000% due 8/15/14 (f) | | | 26,625 |
| | | | | Qwest Services Corp., Notes: | | | |
| 25,000 | | B | | 14.000% due 12/15/10 (f) | | | 29,813 |
| 25,000 | | B | | 14.500% due 12/15/14 (f) | | | 31,125 |
| 25,000 | | CCC- | | SBA Communications Corp., Sr. Notes, 10.250% due 2/1/09 | | | 26,781 |
| 25,000 | | B- | | SpectraSite, Inc., Sr. Notes, 8.250% due 5/15/10 | | | 27,187 |
| 50,000 | | BBB- | | Sprint Capital Corp., Global Notes, 6.900% due 5/1/19 | | | 56,108 |
|
| | | | | | | | 422,852 |
|
| Utilities — 2.9% | | | |
| 25,000 | | B- | | The AES Corp., Sr. Notes, 9.500% due 6/1/09 | | | 28,938 |
| 9,000 | | B+ | | Allegheny Energy Supply Co., LLC, Secured Notes, 10.250% due 11/15/07 (a)(f) | | | 10,395 |
| 25,000 | | BB- | | BRL Universal Equipment 2001 A, L.P./BRL Univeral Equipment Corp., Sr. Secured Notes, 8.875% due 2/15/08 (a) | | | 26,500 |
| | | | | Calpine Corp.: | | | |
| 25,000 | | B | | Second Priority Sr. Secured Notes, 8.500% due 7/15/10 (f) | | | 18,500 |
| 25,000 | | CCC+ | | Sr. Notes, 8.750% due 7/15/07 (a) | | | 18,000 |
| 50,000 | | BBB | | Duke Energy Corp., Sr. Notes, 4.200% due 10/1/08 | | | 50,746 |
| 25,000 | | B- | | Dynegy Holdings Inc., Second Priority Sr. Secured Notes, 9.875% due 7/15/10 (f) | | | 28,531 |
See Notes to Financial Statements.
36 Travelers Series Fund Inc. | 2004 Annual Report
| | |
| Schedules of Investments (continued) | | October 31, 2004 |
| | | | | | | |
| SALOMON BROTHERS STRATEGIC TOTAL RETURN BOND PORTFOLIO |
FACE
AMOUNT | | RATING(e) | | SECURITY | | VALUE |
| Utilities — 2.9% (continued) | | | |
| $ 15,000 | | B | | Edison Mission Energy, Sr. Notes, 9.875% due 4/15/11 | | $ | 17,812 |
| 50,000 | | CCC+ | | El Paso Corp., Global Medium-Term Notes, 7.375% due 12/15/12 | | | 50,750 |
| 75,000 | | BBB | | Entergy Gulf States Inc., First Mortgage Bonds, 6.200% due 7/1/33 | | | 75,661 |
| 25,000 | | NR | | Mirant Americas Generation, Inc., Sr. Notes, 9.125% due 5/1/31 (h) | | | 23,875 |
| 25,000 | | B+ | | NRG Energy, Inc., Second Priority Sr. Secured Notes, 8.000% due 12/15/13 (f) | | | 27,656 |
| 50,000 | | BBB- | | Pinnacle West Capital Corp., Sr. Notes, 6.400% due 4/1/06 | | | 52,187 |
| 25,000 | | B | | Reliant Energy, Inc., Sr. Secured Notes, 9.250% due 7/15/10 | | | 27,875 |
| 25,000 | | B+ | | The Williams Cos., Inc., Notes, 7.625% due 7/15/19 | | | 28,250 |
|
| | | | | | | | 485,676 |
|
| | | | | TOTAL CORPORATE BONDS AND NOTES
(Cost — $4,150,472) | | | 4,237,664 |
|
| | | |
| SHARES | | | | | | |
| COMMON STOCK (i) — 0.8% | | | |
| Media — 0.1% | | | |
| 1,997 | | | | UnitedGlobalCom, Inc. Class A Shares | | | 14,937 |
|
| Telecommunications — 0.7% | | | |
| 653 | | | | NTL Inc. | | | 43,431 |
| 1,050 | | | | SpectraSite, Inc. | | | 53,865 |
| 1,719 | | | | Telewest Global, Inc. | | | 21,144 |
|
| | | | | | | | 118,440 |
|
| | | | | TOTAL COMMON STOCK
(Cost — $103,813) | | | 133,377 |
|
| CONVERTIBLE PREFERRED STOCK — 0.1% | | | |
| Telecommunications — 0.1% | | | |
| 25 | | | | Alamosa Holdings, Inc., 7.500% Cumulative, Series B (a) (Cost — $7,125) | | | 18,881 |
|
| | | |
| WARRANTS | | | | | | |
| WARRANTS (i) — 0.0% | | | |
| Consumer Products & Services — 0.0% | | | |
| 200 | | | | Brown Jordan International, Inc., Expire 8/15/07 (f)‡ | | | 2 |
| 1,701 | | | | Pillowtex Corp., Expire 11/24/09 (j)‡ | | | 2 |
|
| | | | | | | | 4 |
|
See Notes to Financial Statements.
37 Travelers Series Fund Inc. | 2004 Annual Report
| | |
| Schedules of Investments (continued) | | October 31, 2004 |
| | | | | | | |
| SALOMON BROTHERS STRATEGIC TOTAL RETURN BOND PORTFOLIO |
| | | |
| WARRANTS | | | | SECURITY | | VALUE |
| Metals/Mining — 0.0% | | | |
| 200 | | | | Republic Technologies International LLC, Expire 7/15/09 (f)(j) | | $ | 0 |
|
| Telecommunications — 0.0% | | | |
| 15 | | | | American Tower Corp., Expire 8/1/08 (f) | | | 3,158 |
|
| | | | | TOTAL WARRANTS
(Cost — $4,367) | | | 3,162 |
|
| | | |
FACE
AMOUNT† | | RATING(e) | | | | |
| FOREIGN BONDS — 27.3% | | | |
| Argentina — 0.3% | | | |
| 100,000 | | D | | Republic of Argentina, Debt Conversion Bonds, Series L-GP, 6.000% due 3/31/23 (h) | | | 55,000 |
|
| Brazil — 5.0% | | | |
| | | | | Federal Republic of Brazil: | | | |
| 306,386 | | BB- | | Capitalization Bonds, 8.000% due 4/15/14 (a) | | | 304,567 |
| 88,235 | | BB- | | Debt Conversion Bonds, Series L,
3.125% due 4/15/12 (a)(g) | | | 81,093 |
| | | | | Global Bonds: | | | |
| 125,000 | | BB- | | 10.500% due 7/14/14 (a) | | | 140,656 |
| 15,000 | | BB- | | 10.125% due 5/15/27 (a) | | | 15,982 |
| 50,000 | | BB- | | 12.250% due 3/6/30 (a) | | | 61,863 |
| 200,000 | | BB- | | 11.000% due 8/17/40 (a) | | | 225,450 |
|
| | | | | | | | 829,611 |
|
| Bulgaria — 0.4% | | | |
| 50,000 | | BBB- | | Republic of Bulgaria, Euro-Dollar Bonds, Series REG S, 8.250% due 1/15/15 | | | 62,687 |
|
| Colombia — 0.6% | | | |
| | | | | Republic of Colombia, Global Notes: | | | |
| 25,000 | | BB | | 10.000% due 1/23/12 | | | 28,031 |
| 25,000 | | BB | | 8.125% due 5/21/24 | | | 22,875 |
| 25,000 | | BB | | 8.375% due 2/15/27 | | | 22,813 |
| 25,000 | | BB | | 10.375% due 1/28/33 | | | 27,375 |
|
| | | | | | | | 101,094 |
|
| Ecuador — 0.9% | | | |
| | | | | Republic of Ecuador, Euro-Dollar Bonds: | | | |
| 125,000 | | CCC+ | | 12.000% due 11/15/12 | | | 125,625 |
| 25,000 | | CCC+ | | Series Reg S, 8.000% due 8/15/30 | | | 21,225 |
|
| | | | | | | | 146,850 |
|
See Notes to Financial Statements.
38 Travelers Series Fund Inc. | 2004 Annual Report
| | |
| Schedules of Investments (continued) | | October 31, 2004 |
| | | | | | | | |
| SALOMON BROTHERS STRATEGIC TOTAL RETURN BOND PORTFOLIO |
FACE
AMOUNT† | | | RATING(e) | | SECURITY | | VALUE |
| France — 2.8% | | | |
| 350,000 | EUR | | AAA | | Government of France, Treasury Notes,
3.500% due 1/12/08 (a) | | $ | 455,995 |
|
| Germany — 2.9% | | | |
| 340,000 | EUR | | AAA | | Federal Republic of Germany, Bonds,
5.250% due 1/4/11 | | | 477,438 |
|
| Italy — 0.8% | | | |
| 125,000 | | | AA- | | Region of Lombardy, Global Notes, 5.804% due 10/25/32 (a) | | | 133,563 |
|
| Malaysia — 0.3% | | | |
| 50,000 | | | A- | | Federation of Malaysia, Global Bonds, 7.500% due 7/15/11 | | | 58,955 |
|
| Mexico — 2.0% | | | |
| | | | | | United Mexican States: | | | |
| 50,000 | | | BBB- | | Global Notes, 6.625% due 3/3/15 | | | 53,713 |
| | | | | | Medium-Term Notes: | | | |
| 55,000 | | | BBB- | | 8.300% due 8/15/31 | | | 63,663 |
| 75,000 | | | BBB- | | Series A, 6.375% due 1/16/13 | | | 79,913 |
| 125,000 | | | BBB- | | Series A, 5.875% due 1/15/14 | | | 128,094 |
|
| | | | | | | | | 325,383 |
|
| Morocco — 0.3% | | | |
| 57,059 | | | BB | | Kingdom of Morocco, Bonds, Series A, 2.690% due 1/5/09 (g) | | | 56,203 |
|
| The Netherlands — 2.8% | | | |
| 340,000 | EUR | | AAA | | Kingdom of the Netherlands, Bonds, 5.000% due 7/15/11 (a) | | | 471,428 |
|
| Panama — 0.2% | | | |
| | | | | | Republic of Panama, Global Bonds: | | | |
| 25,000 | | | BB | | 9.625% due 2/8/11 | | | 28,563 |
| 10,000 | | | BB | | 9.375% due 1/16/23 | | | 10,875 |
|
| | | | | | | | | 39,438 |
|
| Peru — 0.5% | | | |
| | | | | | Republic of Peru: | | | |
| 50,000 | | | BB | | Global Notes, 9.125% due 2/21/12 | | | 56,275 |
| 22,000 | | | BB | | Past-Due Interest Bonds, 5.000% due 3/7/17 (g) | | | 20,295 |
|
| | | | | | | | | 76,570 |
|
| The Philippines — 0.8% | | | |
| | | | | | Republic of the Philippines, Global Notes: | | | |
| 50,000 | | | BB | | 8.375% due 3/12/09 | | | 52,875 |
| 75,000 | | | BB | | 10.625% due 3/16/25 | | | 78,630 |
|
| | | | | | | | | 131,505 |
|
See Notes to Financial Statements.
39 Travelers Series Fund Inc. | 2004 Annual Report
| | |
| Schedules of Investments (continued) | | October 31, 2004 |
| | | | | | | |
| SALOMON BROTHERS STRATEGIC TOTAL RETURN BOND PORTFOLIO |
FACE
AMOUNT† | | RATING(e) | | SECURITY | | VALUE |
| Russia — 3.9% | | | |
| | | | | Russian Federation, Euro-Dollar Bonds: | | | |
| 50,000 | | BB+ | | 8.250% due 3/31/10 | | $ | 55,500 |
| 100,000 | | BB+ | | 11.000% due 7/24/18 (f) | | | 136,375 |
| 455,400 | | BB+ | | 5.000% due 3/31/30 | | | 456,112 |
|
| | | | | | | | 647,987 |
|
| South Africa — 0.2% | | | |
| 25,000 | | BBB | | Republic of South Africa, Global Notes, 6.500% due 6/2/14 | | | 27,250 |
|
| Supranational — 0.7% | | | |
| 100,000 | | A | | Corporación Andina de Fomento, Notes, Series B, 6.875% due 3/15/12 | | | 112,352 |
|
| Turkey — 0.8% | | | |
| | | | | Republic of Turkey, Global Notes: | | | |
| 25,000 | | BB- | | 9.000% due 6/30/11 | | | 27,906 |
| 25,000 | | BB- | | 11.500% due 1/23/12 | | | 31,438 |
| 25,000 | | BB- | | 11.000% due 1/14/13 | | | 30,937 |
| 25,000 | | BB- | | 11.875% due 1/15/30 | | | 34,406 |
|
| | | | | | | | 124,687 |
|
| Venezuela — 1.1% | | | |
| | | | | Republic of Venezuela, Global Notes: | | | |
| 75,000 | | B | | 9.250% due 9/15/27 (a) | | | 76,838 |
| 75,000 | | B | | 10.750% due 9/19/13 (a) | | | 87,037 |
| 25,000 | | B | | 8.500% due 10/8/14 (a) | | | 25,413 |
|
| | | | | | | | 189,288 |
|
| | | | | TOTAL FOREIGN BONDS
(Cost — $4,273,718) | | | 4,523,284 |
|
| | | | | SUB-TOTAL INVESTMENTS
(Cost — $15,738,196) | | | 16,270,805 |
|
| REPURCHASE AGREEMENTS — 32.4% | | | |
| 1,000,000 | | | | Bank of America dated 10/29/04, 1.830% due 11/1/04; Proceeds at maturity — $1,000,153; (Fully collateralized by various U.S. Government Agency Obligations, 0.000% to 7.625% due 11/1/04 to 1/15/30; Market value — $1,020,001) | | | 1,000,000 |
| 1,000,000 | | | | Deutsche Bank Securities dated 10/29/04, 1.840% due 11/1/04; Proceeds at maturity — $1,000,153; (Fully collateralized by various U.S. Government Agency Obligations, 0.000% to 7.100% due 2/3/05 to 6/1/17; Market value — $1,020,000) | | | 1,000,000 |
See Notes to Financial Statements.
40 Travelers Series Fund Inc. | 2004 Annual Report
| | |
| Schedules of Investments (continued) | | October 31, 2004 |
| | | | | | | | |
| SALOMON BROTHERS STRATEGIC TOTAL RETURN BOND PORTFOLIO | |
FACE
AMOUNT | | | | SECURITY | | VALUE | |
| REPURCHASE AGREEMENTS — 32.4% (continued) | | | | |
| $1,000,000 | | | | Goldman Sachs Group dated 10/29/04, 1.840% due 11/1/04; Proceeds at maturity — $1,000,153; (Fully collateralized by U.S. Treasury Inflation Indexed Notes and U.S. Treasury Notes & Bills,
0.000% to 10.625% due 12/2/04 to 4/15/29; Market value — $1,020,001) | | $ | 1,000,000 | |
| 1,000,000 | | | | Merrill Lynch, Pierce, Fenner & Smith dated 10/29/04, 1.820% due 11/1/04; Proceeds at maturity — $1,000,152; (Fully collateralized by Federal Home Loan Bank Discount Notes, 0.000% due 11/2/04 to 4/29/05; Market value — $1,020,004) | | | 1,000,000 | |
| 1,000,000 | | | | Morgan Stanley dated 10/29/04, 1.810% due 11/1/04; Proceeds at maturity — $1,000,151; (Fully collateralized by Federal Home Loan Banks, 0.000% to 8.000% due 11/2/04 to 4/26/24; Market value — $1,025,190) | | | 1,000,000 | |
| 355,000 | | | | UBS Securities LLC dated 10/29/04, 1.840% due 11/1/04; Proceeds at maturity — $355,054; (Fully collateralized by various U.S. government agency obligations, 0.000% to 8.875% due 12/7/04 to 8/6/38; Market value — $362,100) | | | 355,000 | |
|
|
| | | | | TOTAL REPURCHASE AGREEMENTS
(Cost — $5,355,000) | | | 5,355,000 | |
|
|
| | | | | TOTAL INVESTMENTS — 130.6%
(Cost — $21,093,196**) | | | 21,625,805 | |
| | | | | Liabilities in Excess of Other Assets — (30.6%) | | | (5,073,266 | ) |
|
|
| | | | | TOTAL NET ASSETS — 100% | | $ | 16,552,539 | |
|
|
| (a) | | All or a portion of this security has been segregated for open futures contracts and/or “to-be-announced” securities. |
| (b) | | All or a portion of this security is held as collateral for open futures contracts. |
| (c) | | Security is issued on a “to-be-announced” basis (See Notes 1 and 3). |
| (d) | | Security acquired under mortgage dollar roll agreement (See Notes 1 and 3). |
| (e) | | All ratings are by Standard & Poor’s Ratings Service, except for those identified by an asterisk (*), which are rated by Moody’s Investor Services. |
| (f) | | Security is exempt from registration under Rule 144A of the Securities Act of 1933. This security may be resold in transactions that are exempt from registration, normally to qualified institutional buyers. These securities have been deemed liquid pursuant to guidelines approved by the Board of Directors. |
| (g) | | Variable-rate security. |
| (h) | | Security is currently in default. |
| (i) | | Non-income producing security. |
| (j) | | Security is valued in good faith at fair value by or under the Direction of the Board of Directors. |
| † | | Face amount denominated in U.S. dollars unless noted otherwise. |
| ‡ | | Security has been deemed illiquid. |
| ** | | Aggregate cost for federal income tax purposes is $21,159,366. |
| | | | |
Seepages 48 and 49 for definitions of ratings. | | | | |
| | |
Abbreviationsused in this schedule: | | | | |
EUR— Euro | | | | |
See Notes to Financial Statements.
41 Travelers Series Fund Inc. | 2004 Annual Report
| | |
| Schedules of Investments (continued) | | October 31, 2004 |
| | | | | | | |
| SB ADJUSTABLE RATE INCOME PORTFOLIO |
FACE
AMOUNT | | RATING(a) | | SECURITY | | VALUE |
| ADJUSTABLE-RATE SECURITIES — 87.4% | | | |
| ASSET-BACKED SECURITIES — 27.1% | | | |
| $250,000 | | AAA | | Advanta Business Card Master Trust, Series 2003-B, Class A,
2.260% due 12/22/28 | | $ | 250,794 |
| 189,644 | | AAA | | Ameriquest Mortgage Securities Inc., Series 2004-R8, Class A5, 2.303% due 9/25/34 | | | 189,562 |
| 330,754 | | AAA | | Amortizing Residential Collateral Trust, Series 2002-BC10, Class A3, 2.363% due 1/25/33 | | | 331,689 |
| 123,170 | | AAA | | Asset Backed Securities Corp., Home Equity Loan Trust,
Series 2003-HE3, Class A2, 2.220% due 6/15/33 | | | 123,284 |
| | | | | Bayview Financial Acquisition Trust: | | | |
| 250,000 | | Aaa* | | Series 2002-BA, Class A2, 2.583% due 3/25/35 (b) | | | 250,166 |
| 181,350 | | AAA | | Series 2002-DA, Class A, 2.363% due 8/25/32 (b) | | | 181,779 |
| 76,783 | | AAA | | Series 2003-E, Class A, 2.459% due 10/28/34 | | | 76,867 |
| 130,000 | | AAA | | Series 2003-G, Class A1, 2.559% due 1/28/39 | | | 129,919 |
| | | | | Bear Stearns Asset Backed Securities Trust.: | | | |
| 113,257 | | AAA | | Series 2003-SD1, Class A, 2.383% due 12/25/33 | | | 113,679 |
| 136,086 | | AAA | | Series 2003-SD3, Class A, 2.413% due 10/25/33 | | | 136,537 |
| | | | | Business Loan Express: | | | |
| 143,586 | | Aaa* | | Series 2001-1A, Class A, 2.560% due 7/20/27 (b) | | | 144,046 |
| 185,980 | | AAA | | Series 2002-AA, Class A, 2.583% due 6/25/28 (b) | | | 186,693 |
| 124,634 | | AAA | | Series 2003-2A, Class A, 2.733% due 1/25/32 (b) | | | 125,524 |
| 150,000 | | AAA | | Capital One Master Trust, Series 2001-1, Class A,
2.070% due 12/15/10 | | | 150,860 |
| 104,652 | | AAA | | CDC Mortgage Capital Trust, Series 2003-HE2, Class A,
2.283% due 10/25/33 | | | 104,764 |
| 265,814 | | AAA | | Cendant Mortgage Corp., Series 2003-A, Class A3,
2.483% due 7/25/43 (b) | | | 266,769 |
| 186,242 | | AAA | | Centex Home Equity Loan Trust, Series 2003-B, Class AV,
2.213% due 6/25/33 | | | 186,522 |
| 225,000 | | AAA | | Circuit City Credit Card Master Trust, Series 2003-2, Class A,
2.300% due 4/15/11 | | | 226,113 |
| 250,000 | | AAA | | Countrywide Asset-Backed Certificates, Series 2004-6, Class 2A4, 2.383% due 11/25/34 | | | 250,145 |
| 131,141 | | AAA | | First Franklin Mortgage Loan Trust, Series 2002-FF3, Class A2, 2.393% due 8/25/32 | | | 131,604 |
| 234,047 | | AAA | | Fremont Home Loan Trust, Series 2003-A, Class 2A2,
2.288% due 8/25/33 | | | 234,354 |
| 139,444 | | AAA | | Household Home Equity Loan Trust, Series 2002-4, Class A,
2.460% due 10/20/32 | | | 139,761 |
| 85,424 | | AAA | | Household Mortgage Loan Trust, Series 2002-HC1, Class A,
2.210% due 5/20/32 | | | 85,650 |
| 83,763 | | AAA | | Long Beach Mortgage Loan Trust, Series 2003-1, Class A2,
2.333% due 3/25/33 | | | 83,911 |
See Notes to Financial Statements.
42 Travelers Series Fund Inc. | 2004 Annual Report
| | |
| Schedules of Investments (continued) | | October 31, 2004 |
| | | | | | | |
| SB ADJUSTABLE RATE INCOME PORTFOLIO |
FACE
AMOUNT | | RATING(a) | | SECURITY | | VALUE |
| ASSET-BACKED SECURITIES — 27.1% (continued) | | | |
| $250,000 | | AAA | | Morgan Stanley ABS Capital I Inc. Trust, Series 2003-HE1,
Class A4, 2.433% due 5/25/33 | | $ | 250,709 |
| 150,000 | | AA | | New Century Home Equity Loan Trust, Series 2004-2, Class M2, 2.553% due 8/25/34 | | | 150,292 |
| 128,473 | | AAA | | NovaStar Home Equity Loan, Series 2003-1, Class A2,
2.323% due 5/25/33 | | | 128,649 |
| 131,851 | | AAA | | Option One Mortgage Loan Trust, Series 2003-1, Class A2,
2.353% due 2/25/33 | | | 132,351 |
| 363,133 | | AAA | | Renaissance Home Equity Loan Trust, Series 2003-3, Class A, 2.433% due 12/25/33 | | | 363,528 |
| 81,812 | | AAA | | Saxon Asset Securities Trust, Series 2002-1, Class AV1,
2.183% due 3/25/32 | | | 81,802 |
| 271,912 | | AAA | | Securitized Asset Backed Receivables LLC Trust, Series 2004-OP1, Class A2, 2.183% due 2/25/34 | | | 272,069 |
| 114,804 | | AAA | | Soundview Home Equity Loan Trust, Series 2003-1, Class A, 2.383% due 8/25/31 | | | 114,948 |
| 140,973 | | Aaa* | | Specialty Underwriting & Residential Finance Trust,
Series 2003-BC1, Class A, 2.273% due 1/25/34 | | | 141,055 |
| | | | | Structured Asset Investment Loan Trust: | | | |
| 194,919 | | AAA | | Series 2003-BC1, Class A2, 2.273% due 1/25/33 | | | 195,327 |
| 300,000 | | AAA | | Series 2003-BC10, Class 3A5, 2.413% due 10/25/33 | | | 300,174 |
| 200,000 | | AAA | | World Financial Network Credit Card Master Note Trust,
Series 2003-A, Class A2, 2.240% due 5/15/12 | | | 201,217 |
|
| | | | | TOTAL ASSET-BACKED SECURITIES
(Cost — $6,426,118) | | | 6,433,113 |
|
| COLLATERALIZED MORTGAGE OBLIGATIONS — 27.6% | | | |
| 314,225 | | AAA | | Bank of America Mortgage Securities, Inc., Series 2003-F,
Class 1A1, 2.969% due 7/25/33 | | | 312,783 |
| 286,554 | | AAA | | Bear Stearns Asset Backed Securities Trust, Series 2003-AC5,
Class A3, 2.533% due 10/25/33 | | | 286,721 |
| | | | | CHL Mortgage Pass-Through Trust: | | | |
| 148,430 | | AAA | | Series 2001-HYB1, Class 1A1, 3.309% due 6/19/31 | | | 149,539 |
| 187,477 | | AAA | | Series 2003-HYB3, Class 7A1, 3.814% due 11/19/33 | | | 184,911 |
| | | | | Credit-Based Asset Servicing and Securitization LLC: | | | |
| 145,530 | | AAA | | Series 2002-CB2, Class A1, 2.293% due 4/25/32 | | | 145,861 |
| 58,314 | | AAA | | Series 2002-CB6, Class 2A1, 2.433% due 1/25/33 | | | 58,406 |
| 141,540 | | AAA | | GGP Mall Properties Trust, Series 2001-C1A, Class A3,
2.570% due 2/15/14 (b) | | | 142,364 |
| 238,717 | | Aa1* | | GMAC Commercial Mortgage Asset Corp., Series 2000-FLFA,
Class B, 2.510% due 9/20/10 (b) | | | 238,969 |
| 225,095 | | AA+ | | Impac CMB Trust, Series 2003-8, Class 1A2,
2.433% due 10/25/33 | | | 225,397 |
See Notes to Financial Statements.
43 Travelers Series Fund Inc. | 2004 Annual Report
| | |
| Schedules of Investments (continued) | | October 31, 2004 |
| | | | | | | |
| SB ADJUSTABLE RATE INCOME PORTFOLIO |
FACE
AMOUNT | | RATING(a) | | SECURITY | | VALUE |
| COLLATERALIZED MORTGAGE OBLIGATIONS — 27.6% (continued) | | | |
| $195,286 | | AAA | | Impac Secured Assets Corp., Series 2004-3, Class 1A4,
2.333% due 11/25/34 | | $ | 195,286 |
| 111,289 | | AAA | | Long Beach Mortgage Loan Trust, Series 2002-2, Class 2A,
2.213% due 7/25/32 | | | 111,419 |
| 458,698 | | AAA | | MASTR Alternative Loan Trust, Series 2003-7, Class 7A1,
2.333% due 11/25/33 | | | 459,489 |
| 226,684 | | AAA | | Morgan Stanley Mortgage Loan Trust, Series 2004-5AR,
Class 1A2, 2.417% due 7/25/34 | | | 226,215 |
| | | | | Residential Asset Securitization Trust: | | | |
| 202,857 | | AAA | | Series 2003-A11, Class A2, 2.383% due 11/25/33 | | | 203,044 |
| 134,997 | | AAA | | Series 2004-A2, Class 1A3, 2.333% due 5/25/34 | | | 134,895 |
| 90,656 | | AAA | | Series 2004-A4, Class A2, 2.283% due 8/25/34 | | | 90,544 |
| 169,037 | | AAA | | Residential Funding Mortgage Securities I Trust, Series 2003-S10, Class A2, 2.333% due 6/25/33 | | | 169,142 |
| | | | | Sequoia Mortgage Trust: | | | |
| 107,968 | | AAA | | Series 9, Class 2A, 3.338% due 9/20/32 | | | 110,231 |
| 249,277 | | AAA | | Series 2003-2, Class A1, 2.240% due 6/20/33 | | | 249,482 |
| | | | | Structured ARM Loan Trust: | | | |
| 142,195 | | AAA | | Series 2004-1, Class 2A, 2.243% due 2/25/34 | | | 142,234 |
| 171,142 | | AAA | | Series 2004-7, Class A1, 2.203% due 6/25/34 | | | 170,957 |
| 200,000 | | Aaa* | | Series 2004-17, Class A1, 2.734% due 11/25/34 | | | 201,500 |
| | | | | Structured Asset Mortgage Investments Inc.: | | | |
| | | | | Series 2002-AR1: | | | |
| 96,979 | | AAA | | Class 1A, 4.228% due 3/25/32 | | | 98,057 |
| 126,430 | | AAA | | Class 2A, 3.430% due 3/25/32 | | | 127,769 |
| 163,357 | | AAA | | Series 2003-AR2, Class A1, 2.260% due 12/19/33 | | | 163,173 |
| | | | | Structured Asset Securities Corp.: | | | |
| 390,777 | | AAA | | Series 2002-8A, Class 7A1, 3.319% due 5/25/32 | | | 395,054 |
| 63,927 | | AAA | | Series 2003-8, Class 2A9, 2.433% due 4/25/33 | | | 63,986 |
| 38,723 | | AAA | | Series 2003-NP3, Class A1, 2.433% due 11/25/33 (b) | | | 38,772 |
| 137,627 | | AAA | | Series 2004-NP1, Class A, 2.333% due 9/25/33 (b) | | | 137,646 |
| 247,467 | | AAA | | Thornburg Mortgage Securities Trust, Series 2004-1, Class I2A, 2.383% due 3/25/44 | | | 247,238 |
| 150,000 | | AAA | | WaMu Mortgage Pass-Through Certificates, Series 2003-AR10,
Class A3B, 3.890% due 10/25/33 | | | 150,037 |
| 244,484 | | AAA | | Washington Mutual Mortgage Securities Corp.,
Mortgage Pass-Through Certificates, Series 2002-AR1,
Class 1A1, 4.029% due 11/25/30 | | | 246,753 |
| | | | | Wells Fargo Mortgage Backed Securities Trust: | | | |
| 168,476 | | Aaa* | | Series 2003-5, Class A4, 2.333% due 5/25/33 | | | 168,680 |
| 200,000 | | AAA | | Series 2004-N, Class A2, 3.599% due 8/25/34 | | | 200,123 |
| 300,000 | | Aaa* | | Series 2004-Y, Class 1A1, 4.583% due 11/25/34 | | | 302,297 |
|
| | | | | TOTAL COLLATERALIZED MORTGAGE OBLIGATIONS
(Cost — $6,547,442) | | | 6,548,974 |
|
See Notes to Financial Statements.
44 Travelers Series Fund Inc. | 2004 Annual Report
| | |
| Schedules of Investments (continued) | | October 31, 2004 |
| | | | | | | |
| SB ADJUSTABLE RATE INCOME PORTFOLIO |
FACE
AMOUNT | | | | SECURITY | | VALUE |
| U.S. GOVERNMENT AGENCY COLLATERALIZED MORTGAGE OBLIGATIONS — 7.4% |
| $306,390 | | | | Fannie Mae Grantor Trust, Series 2004-T2, Class 2A,
4.041% due 7/25/43 | | $ | 314,066 |
| | | | | Fannie Mae REMIC Trust: | | | |
| | | | | Series 2003-117: | | | |
| 167,412 | | | | Class DF, 2.483% due 12/25/33 | | | 167,528 |
| 217,697 | | | | Class KF, 2.333% due 8/25/33 | | | 218,652 |
| 99,639 | | | | Series 2003-124, Class F, 2.233% due 1/25/34 | | | 99,832 |
| 325,275 | | | | Series 2003-W15, Class 3A, 4.027% due 12/25/42 | | | 334,760 |
| 278,153 | | | | Series 2004-31, Class FG, 2.333% due 8/25/33 | | | 279,092 |
| | | | | Fannie Mae Whole Loan: | | | |
| 148,975 | | | | Series 2003-W6, Class F, 2.283% due 9/25/42 | | | 149,378 |
| 180,897 | | | | Series 2003-W14, Class 2A, 4.014% due 1/25/43 | | | 186,104 |
|
| | | | | TOTAL U.S. GOVERNMENT AGENCY COLLATERALIZED MORTGAGE OBLIGATIONS
(Cost — $1,749,904) | | | 1,749,412 |
|
| U.S. GOVERNMENT AGENCY PASS-THROUGHS — 25.3% |
| Federal Home Loan Mortgage Corporation (FHLMC) — 3.8% | | | |
| | | | | FHLMC One Year CMT ARM: | | | |
| 244,464 | | | | 3.553% due 2/1/23 | | | 251,458 |
| 134,363 | | | | 3.688% due 8/1/30 | | | 139,312 |
| | | | | FHLMC 3/1 Hybrid ARM: | | | |
| 306,730 | | | | 3.626% due 7/1/29 | | | 315,286 |
| 211,370 | | | | 3.360% due 10/1/33 | | | 212,012 |
|
| | | | | TOTAL FEDERAL HOME LOAN MORTGAGE CORPORATION (Cost — $919,181) | | | 918,068 |
|
| Federal National Mortgage Association (FNMA) — 20.3% | | | |
| | | | | FNMA Six Month LIBOR: | | | |
| 154,510 | | | | 4.881% due 2/1/33 | | | 158,142 |
| 374,952 | | | | 4.366% due 4/1/33 | | | 381,258 |
| 169,195 | | | | 4.596% due 4/1/33 | | | 171,847 |
| 190,614 | | | | 4.552% due 5/1/33 | | | 193,703 |
| 71,445 | | | | 4.439% due 6/1/33 | | | 72,766 |
| 497,513 | | | | 4.810% due 10/1/34 | | | 508,186 |
| | | | | FNMA One Year LIBOR: | | | |
| 172,399 | | | | 4.076% due 1/1/33 | | | 174,658 |
| 283,280 | | | | 4.258% due 6/1/33 | | | 287,619 |
| 369,913 | | | | 4.068% due 7/1/33 | | | 373,325 |
| 180,456 | | | | 4.184% due 10/1/33 | | | 182,761 |
| 188,413 | | | | 3.424% due 7/1/43 | | | 189,193 |
| | | | | FNMA One Year CMT ARM: | | | |
| 233,694 | | | | 3.662% due 7/1/26 | | | 240,934 |
See Notes to Financial Statements.
45 Travelers Series Fund Inc. | 2004 Annual Report
| | |
| Schedules of Investments (continued) | | October 31, 2004 |
| | | | | | | |
| SB ADJUSTABLE RATE INCOME PORTFOLIO |
FACE
AMOUNT | | RATING(a) | | SECURITY | | VALUE |
| Federal National Mortgage Association (FNMA) — 20.3% (continued) | | | |
| $318,400 | | | | 3.448% due 5/1/28 | | $ | 327,213 |
| 262,355 | | | | 3.589% due 5/1/28 | | | 272,238 |
| 169,859 | | | | 3.701% due 5/1/28 | | | 174,828 |
| 194,526 | | | | 4.766% due 9/1/32 | | | 198,158 |
| 175,961 | | | | 4.289% due 2/1/33 | | | 178,575 |
| 195,076 | | | | 4.058% due 5/1/33 | | | 197,489 |
| 312,434 | | | | 4.221% due 7/1/33 | | | 312,164 |
| 226,908 | | | | 3.116% due 8/1/33 | | | 228,169 |
|
| | | | | TOTAL FEDERAL NATIONAL MORTGAGE ASSOCIATION (Cost — $4,828,841) | | | 4,823,226 |
|
| Government National Mortgage Association (GNMA) — 1.2% | | | |
| | | | | GNMA II One Year CMT ARM: | | | |
| 182,239 | | | | 3.375% due 5/20/32 | | | 183,438 |
| 97,831 | | | | 3.500% due 7/20/34 | | | 95,252 |
|
| | | | | TOTAL GOVERNMENT NATIONAL MORTGAGE ASSOCIATION (Cost — $277,271) | | | 278,690 |
|
| | | | | TOTAL U.S. GOVERNMENT AGENCY
PASS-THROUGHS (Cost — $6,025,293) | | | 6,019,984 |
|
| | | | | TOTAL ADJUSTABLE-RATE SECURITIES
(Cost — $20,748,757) | | | 20,751,483 |
|
| FIXED-RATE SECURITIES — 6.8% | | | |
| ASSET-BACKED SECURITIES — 3.2% | | | |
| 86,346 | | AAA | | AmeriCredit Automobile Receivables Trust, Series 2002-1,
Class A3, 4.230% due 10/6/06 | | | 86,704 |
| 400,000 | | AAA | | Credit Acceptance Auto Dealer Loan Trust, Series 2004-1,
Class A, 2.530% due 8/17/09 (b) | | | 399,113 |
| 143,684 | | AA | | MMCA Automobile Trust, Series 2001-4, Class A4,
4.920% due 8/15/07 | | | 145,143 |
| 127,143 | | AAA | | Vanderbilt Mortgage and Finance, Inc., Series 2002-C, Class A1F, 2.550% due 1/7/10 | | | 127,080 |
|
| | | | | TOTAL ASSET-BACKED SECURITIES
(Cost — $760,316) | | | 758,040 |
|
| COLLATERALIZED MORTGAGE OBLIGATIONS — 1.1% | | | |
| 250,000 | | AAA | | Merrill Lynch Mortgage Investors, Inc., Series 2003-A5, Class 2A3, 3.246% due 8/25/33 (Cost — $250,000) | | | 249,821 |
|
| U.S. GOVERNMENT AGENCY COLLATERALIZED MORTGAGE OBLIGATIONS — 0.5% |
| 131,007 | | | | Fannie Mae REMIC Trust, Series 2003-111, Class HR, 3.750% due 5/25/30 (Cost — $131,007) | | | 129,704 |
|
See Notes to Financial Statements.
46 Travelers Series Fund Inc. | 2004 Annual Report
| | |
| Schedules of Investments (continued) | | October 31, 2004 |
| | | | | | |
| SB ADJUSTABLE RATE INCOME PORTFOLIO |
FACE
AMOUNT | | SECURITY | | VALUE |
| | U.S. GOVERNMENT AGENCY PASS-THROUGHS — 2.0% |
| | | | FNMA: | | | |
| $ | 23,021 | | 15 Year, 9.500% due 12/1/06 | | $ | 23,193 |
| | 385,559 | | 30 Year, 12.000% due 4/20/16 | | | 452,897 |
|
|
| | | | TOTAL U.S. GOVERNMENT AGENCY PASS-THROUGHS
(Cost — $470,345) | | | 476,090 |
|
|
| | | | TOTAL FIXED-RATE SECURITIES
(Cost — $1,611,668) | | | 1,613,655 |
|
|
| | | | SUB-TOTAL INVESTMENTS
(Cost — $22,360,425) | | | 22,365,138 |
|
|
| | REPURCHASE AGREEMENTS — 5.5% |
| | 306,000 | | Deutsche Bank Securities Inc. dated 10/29/04, 1.840% due 11/1/04; Proceeds at maturity — $306,047; (Fully collateralized by U.S. Government Agency Obligations, 0.000% to 7.100% due 2/3/05 to 6/1/17; Market value — $312,120) | | | 306,000 |
| | 500,000 | | Merrill Lynch & Co. dated 10/29/04, 1.820% due 11/1/04; Proceeds at maturity — $500,076; (Fully collateralized by Fannie Mae and Freddie Mac Discount Notes, due 11/2/04 to 4/29/05; Market value — $510,002) | | | 500,000 |
| | 500,000 | | UBS Securities LLC dated 10/29/04, 1.840% due 11/1/04; Proceeds at maturity — $500,077; (Fully collateralized by Fannie Mae Notes, 1.750% to 7.500% due 5/23/05 to 5/21/18; Market
value — $510,001) | | | 500,000 |
|
|
| | | | TOTAL REPURCHASE AGREEMENTS
(Cost — $1,306,000) | | | 1,306,000 |
|
|
| | | | TOTAL INVESTMENTS — 99.7% (Cost — $23,666,425**) Other Assets in Excess of Liabilities — 0.3% | |
| 23,671,138
80,704 |
|
|
| | | | TOTAL NET ASSETS — 100.0% | | $ | 23,751,842 |
|
|
| (a) | | All ratings are by Standard & Poor’s Ratings Service, except those identified by an asterisk (*), which are rated by Moody’s Investor Service, Inc. |
| (b) | | Security is exempt from registration under Rule 144A of the Securities Act of 1933. This security may be resold in transactions that are exempt from registration, normally to qualified institutional buyers. These securities have been deemed liquid pursuant to guidelines approved by the Board of Directors. |
| ** | | Aggregate cost for federal income tax purposes is substantially the same. |
| | | See pages 48 and 49 for definitions of ratings. |
| | |
| Abbreviations used in this schedule: |
ARM | | — Adjustable Rate Mortgage |
CMT | | — Constant Maturity Treasury Index |
REMIC | | — Real Estate Mortgage Investment Conduit |
See Notes to Financial Statements.
47 Travelers Series Fund Inc. | 2004 Annual Report
Bond Ratings (unaudited)
The definitions of the applicable rating symbols are set forth below:
Standard & Poor’s Ratings Service (“Standard and Poor’s”) — Ratings from “AA” to “CCC” may be modified by the addition of a plus (+) or minus (–) sign to show relative standings within the major rating categories.
| | |
AAA | | — Bonds rated “AAA” have the highest rating assigned by Standard & Poor’s. Capacity to pay interest and repay principal is extremely strong. |
AA | | — Bonds rated “AA” have a very strong capacity to pay interest and repay principal and differs from the highest rated issue only in a small degree. |
A | | — Bonds rated “A” have a strong capacity to pay interest and repay principal although it is somewhat more susceptible to the adverse effects of changes in circumstances and economic conditions than bonds in higher rated categories. |
BBB | | — Bonds rated “BBB” are regarded as having an adequate capacity to pay interest and repay principal. Whereas they normally exhibit adequate protection parameters, adverse economic conditions or changing circumstances are more likely to lead to a weakened capacity to pay interest and repay principal for bonds in this category than in higher rated categories. |
| BB, B, CCC, CC and C | | — Bonds rated “BB”, “B”, “CCC”, “CC” and “C” are regarded, on balance, as predominantly speculative with respect to capacity to pay interest and repay principal in accordance with the terms of the obligation. “BB” represents the lowest degree of speculation and “C” the highest degree of speculation. While such bonds will likely have some quality and protective characteristics, these are outweighed by large uncertainties or major risk exposures to adverse conditions. |
D | | — Bonds rated “D” are in default, and payment of interest and/or repayment of principal is in arrears. |
Moody’s Investors Service (“Moody’s”) — Numerical modifiers 1, 2 and 3 may be applied to each generic rating from “Aa” to “Caa,” where 1 is the highest and 3 the lowest rating within its generic category.
| | |
Aaa | | — Bonds rated “Aaa” are judged to be of the best quality. They carry the smallest degree of investment risk and are generally referred to as “gilt edge.” Interest payments are protected by a large or by an exceptionally stable margin and principal is secure. While the various protective elements are likely to change, such changes as can be visualized are most unlikely to impair the fundamentally strong position of such issues. |
Aa | | — Bonds rated “Aa” are judged to be of high quality by all standards. Together with the “Aaa” group they comprise what are generally known as high grade bonds. They are rated lower than the best bonds because margins of protection may not be as large as in “Aaa” securities or fluctuation of protective elements may be of greater amplitude or there may be other elements present which make the long-term risks appear somewhat larger than in “Aaa” securities. |
A | | — Bonds rated “A” possess many favorable investment attributes and are to be considered as upper medium grade obligations. Factors giving security to principal and interest are considered adequate, but elements may be present that suggest a susceptibility to impairment some time in the future. |
Baa | | — Bonds rated “Baa” are considered to be medium grade obligations, i.e., they are neither highly protected nor poorly secured. Interest payment and principal security appear adequate for the present but certain protective elements may be lacking or may be characteristically unreliable over any great length of time. Such bonds lack outstanding investment characteristics and in fact have speculative characteristics as well. |
Ba | | — Bonds rated “Ba” are judged to have speculative elements; their future cannot be considered as well assured. Often the protection of interest and principal payments may be very moderate thereby not well safeguarded during both good and bad times over the future. Uncertainty of position characterizes bonds in this class. |
48 Travelers Series Fund Inc. | 2004 Annual Report
Bond Ratings (unaudited) (continued)
| | |
B | | — Bonds rated “B” generally lack characteristics of the desirable investments. Assurance of interest and principal payments or maintenance of other terms of the contract over any long period of time may be small. |
Caa and Ca | | — Bonds rated “Caa” and “Ca” are of poor standing. Such issues may be in default or present elements of danger with respect to principal or interest. |
C | | — Bonds rated “C” are the lowest rated class of bonds, and issues so rated can be regarded as having extremely poor prospects of ever attaining any real investment standing. |
| |
NR | | — Indicates that the bond is not rated by Standard & Poor’s or Moody’s. |
49 Travelers Series Fund Inc. | 2004 Annual Report
| | |
| Statements of Assets and Liabilities | | October 31, 2004 |
| | | | | | | | | | | | |
| | | Smith Barney
International
All Cap Growth
Portfolio | | | Salomon Brothers
Strategic Total
Return Bond
Portfolio | | | SB Adjustable
Rate Income
Portfolio | |
| ASSETS: | | | | | | | | | | | | |
Investments, at value
(Cost — $125,575,033, $15,738,196 and $22,360,425, respectively) | | $ | 156,207,507 | | | $ | 16,270,805 | | | $ | 22,365,138 | |
Repurchase agreements, at value (Cost — $884,000, $5,355,000 and $1,306,000, respectively) | | | 884,000 | | | | 5,355,000 | | | | 1,306,000 | |
Loaned securities collateral, at value
(Cost — $21,892,934) (Notes 1 and 3) | | | 21,892,934 | | | | — | | | | — | |
Foreign currency, at value
(Cost — $359,033 and $833, respectively) | | | 358,908 | | | | 873 | | | | — | |
Cash | | | 793 | | | | 1,577 | | | | 413 | |
Receivable for securities sold | | | 2,250,087 | | | | — | | | | — | |
Dividends and interest receivable | | | 241,393 | | | | 210,213 | | | | 45,302 | |
Receivable for open forward foreign currency contracts (Notes 1 and 3) | | | 107 | | | | 38,542 | | | | — | |
Receivable for Fund shares sold | | | 20,241 | | | | — | | | | 58,930 | |
Principal payment receivable | | | — | | | | — | | | | 26,399 | |
Prepaid expenses | | | 5,900 | | | | — | | | | 577 | |
Other receivables | | | 23,854 | | | | — | | | | — | |
|
|
Total Assets | | | 181,885,724 | | | | 21,877,010 | | | | 23,802,759 | |
|
|
| LIABILITIES: | | | | | | | | | | | | |
Payable for loaned securities collateral
(Notes 1 and 3) | | | 21,892,934 | | | | — | | | | — | |
Management fees payable | | | 112,235 | | | | 12,342 | | | | 12,136 | |
Payable for securities purchased | | | 62,017 | | | | 5,182,641 | | | | — | |
Payable for open forward foreign currency contracts (Notes 1 and 3) | | | 9,061 | | | | 78,954 | | | | — | |
Payable for Fund shares reacquired | | | 15 | | | | 3,514 | | | | — | |
Distribution plan fees payable | | | — | | | | — | | | | 640 | |
Payable to broker — variation margin | | | — | | | | 6,219 | | | | — | |
Deferred mortgage dollar roll income | | | — | | | | 4,618 | | | | — | |
Accrued expenses | | | 87,815 | | | | 36,183 | | | | 38,141 | |
|
|
Total Liabilities | | | 22,164,077 | | | | 5,324,471 | | | | 50,917 | |
|
|
Total Net Assets | | $ | 159,721,647 | | | $ | 16,552,539 | | | $ | 23,751,842 | |
|
|
| NET ASSETS: | | | | | | | | | | | | |
Par value of capital shares ($0.00001
par value, 6 billion shares authorized) | | $ | 136 | | | $ | 15 | | | $ | 24 | |
Capital paid in excess of par value | | | 194,792,147 | | | | 17,124,921 | | | | 23,584,349 | |
Undistributed net investment income | | | 1,221,698 | | | | 728,377 | | | | 204,400 | |
Accumulated net realized loss from investment transactions and futures contracts | | | (66,945,775 | ) | | | (1,781,951 | ) | | | (41,644 | ) |
Net unrealized appreciation of investments, futures contracts and foreign currencies | | | 30,653,441 | | | | 481,177 | | | | 4,713 | |
|
|
Total Net Assets | | $ | 159,721,647 | | | $ | 16,552,539 | | | $ | 23,751,842 | |
|
|
Shares Outstanding | | | 13,565,199 | | | | 1,482,707 | | | | 2,351,164 | |
|
|
Net Asset Value | | | $11.77 | | | | $11.16 | | | | $10.10 | |
|
|
See Notes to Financial Statements.
50 Travelers Series Fund Inc. | 2004 Annual Report
| | |
| Statements of Operations | | For the Year Ended October 31, 2004 |
| | | | | | | | | | | | |
| | | Smith Barney
International
All Cap Growth
Portfolio | | | Salomon Brothers
Strategic Total
Return Bond
Portfolio | | | SB Adjustable
Rate Income
Portfolio | |
| INVESTMENT INCOME: | | | | | | | | | | | | |
Dividends | | $ | 3,172,549 | | | $ | 1,293 | | | $ | — | |
Interest | | | 72,030 | | | | 1,075,793 | | | | 339,154 | |
Less: Foreign withholding tax | | | (318,417 | ) | | | — | | | | — | |
|
|
Total Investment Income | | | 2,926,162 | | | | 1,077,086 | | | | 339,154 | |
|
|
| EXPENSES: | | | | | | | | | | | | |
Management fees (Note 2) | | | 1,540,393 | | | | 151,616 | | | | 93,092 | |
Custody | | | 107,323 | | | | 37,677 | | | | 13,133 | |
Shareholder communications | | | 45,673 | | | | 12,502 | | | | 7,652 | |
Audit and legal | | | 42,926 | | | | 22,857 | | | | 38,325 | |
Directors’ fees | | | 10,051 | | | | 4,437 | | | | 5,481 | |
Transfer agency services (Note 2) | | | 5,247 | | | | 4,585 | | | | 5,001 | |
Distribution plan fees (Note 2) | | | — | | | | — | | | | 38,788 | |
Other | | | 14,960 | | | | 3,361 | | | | 1,371 | |
|
|
Total Expenses | | | 1,766,573 | | | | 237,035 | | | | 202,843 | |
Less: Management and distribution plan fee waivers (Notes 2 and 6) | | | (2,216 | ) | | | (1,741 | ) | | | (47,722 | ) |
|
|
Net Expenses | | | 1,764,357 | | | | 235,294 | | | | 155,121 | |
|
|
Net Investment Income | | | 1,161,805 | | | | 841,792 | | | | 184,033 | |
|
|
REALIZED AND UNREALIZED GAIN (LOSS) ON INVESTMENTS, FUTURES CONTRACTS AND FOREIGN CURRENCIES
(NOTES 1 AND 3): | | | | | | | | | | | | |
Realized Gain (Loss) From: | | | | | | | | | | | | |
Investment transactions | | | 7,179,391 | | | | 764,515 | | | | 6,619 | |
Futures contracts | | | — | | | | (87,551 | ) | | | — | |
Foreign currency transactions | | | 46,881 | | | | (61,049 | ) | | | — | |
|
|
Net Realized Gain | | | 7,226,272 | | | | 615,915 | | | | 6,619 | |
|
|
Net Change in Unrealized Appreciation (Depreciation) From: | | | | | | | | | | | | |
Investments and futures contracts | | | 14,902,972 | | | | (222,918 | ) | | | 3,186 | |
Foreign currencies | | | 2,891 | | | | (28,969 | ) | | | — | |
|
|
Net Increase (Decrease) in Unrealized Appreciation | | | 14,905,863 | | | | (251,887 | ) | | | 3,186 | |
|
|
Net Gain on Investments,
Futures Contracts and
Foreign Currencies | | | 22,132,135 | | | | 364,028 | | | | 9,805 | |
|
|
Increase in Net Assets From Operations | | $ | 23,293,940 | | | $ | 1,205,820 | | | $ | 193,838 | |
|
|
See Notes to Financial Statements.
51 Travelers Series Fund Inc. | 2004 Annual Report
| | |
| Statements of Changes in Net Assets | | |
| | | | | | | | |
Smith Barney International
All Cap Growth Portfolio | | For the Years Ended October 31, | |
| | 2004 | | | 2003 | |
| OPERATIONS: | | | | | | | | |
Net investment income | | $ | 1,161,805 | | | $ | 1,801,557 | |
Net realized gain (loss) | | | 7,226,272 | | | | (9,751,557 | ) |
Net increase in unrealized appreciation | | | 14,905,863 | | | | 39,171,972 | |
|
|
Increase in Net Assets From Operations | | | 23,293,940 | | | | 31,221,972 | |
|
|
| DIVIDENDS TO SHAREHOLDERS FROM: | | | | | | | | |
Net investment income | | | (1,763,610 | ) | | | (947,561 | ) |
|
|
Decrease in Net Assets From
Dividends to Shareholders | | | (1,763,610 | ) | | | (947,561 | ) |
|
|
| FUND SHARE TRANSACTIONS (NOTE 4): | | | | | | | | |
Net proceeds from sale of shares | | | 17,143,590 | | | | 247,482,410 | |
Net asset value of shares issued for reinvestment of dividends | | | 1,763,610 | | | | 947,561 | |
Cost of shares reacquired | | | (60,386,891 | ) | | | (269,100,352 | ) |
|
|
Decrease in Net Assets From Fund Share Transactions | | | (41,479,691 | ) | | | (20,670,381 | ) |
|
|
Increase (Decrease) in Net Assets | | | (19,949,361 | ) | | | 9,604,030 | |
| NET ASSETS: | | | | | | | | |
Beginning of year | | | 179,671,008 | | | | 170,066,978 | |
|
|
End of year* | | $ | 159,721,647 | | | $ | 179,671,008 | |
|
|
* Includes undistributed net investment income of: | | | $1,221,698 | | | | $1,776,622 | |
|
|
See Notes to Financial Statements.
52 Travelers Series Fund Inc. | 2004 Annual Report
| | |
| Statements of Changes in Net Assets (continued) |
| | | | | | | | |
Salomon Brothers Strategic
Total Return Bond Portfolio | | For the Years Ended October 31, | |
| | 2004 | | | 2003 | |
| OPERATIONS: | | | | | | | | |
Net investment income | | $ | 841,792 | | | $ | 1,153,098 | |
Net realized gain | | | 615,915 | | | | 783,633 | |
Net increase (decrease) in unrealized appreciation | | | (251,887 | ) | | | 1,274,190 | |
|
|
Increase in Net Assets From Operations | | | 1,205,820 | | | | 3,210,921 | |
|
|
| DIVIDENDS TO SHAREHOLDERS FROM: | | | | | | | | |
Net investment income | | | (1,228,728 | ) | | | (1,052,602 | ) |
|
|
Decrease in Net Assets From
Dividends to Shareholders | | | (1,228,728 | ) | | | (1,052,602 | ) |
|
|
| FUND SHARE TRANSACTIONS (NOTE 4): | | | | | | | | |
Net proceeds from sale of shares | | | 1,406,864 | | | | 5,123,382 | |
Net asset value of shares issued for reinvestment of dividends | | | 1,228,728 | | | | 1,052,602 | |
Cost of shares reacquired | | | (7,295,139 | ) | | | (8,248,954 | ) |
|
|
Decrease in Net Assets From Fund Share Transactions | | | (4,659,547 | ) | | | (2,072,970 | ) |
|
|
Increase (Decrease) in Net Assets | | | (4,682,455 | ) | | | 85,349 | |
| NET ASSETS: | | | | | | | | |
Beginning of year | | | 21,234,994 | | | | 21,149,645 | |
|
|
End of year* | | $ | 16,552,539 | | | $ | 21,234,994 | |
|
|
* Includes undistributed net investment income of: | | | $728,377 | | | | $1,079,213 | |
|
|
See Notes to Financial Statements.
53 Travelers Series Fund Inc. | 2004 Annual Report
| | |
| Statements of Changes in Net Assets (continued) |
| | | | | | | | |
SB Adjustable Rate Income Portfolio | | For the Years Ended October 31, | |
| | 2004 | | | 2003† | |
| OPERATIONS: | | | | | | | | |
Net investment income | | $ | 184,033 | | | $ | 12,150 | |
Net realized gain (loss) | | | 6,619 | | | | (106 | ) |
Net increase in unrealized appreciation | | | 3,186 | | | | 1,527 | |
|
|
Increase in Net Assets From Operations | | | 193,838 | | | | 13,571 | |
|
|
| DIVIDENDS TO SHAREHOLDERS FROM: | | | | | | | | |
Net investment income | | | (39,951 | ) | | | — | |
|
|
Decrease in Net Assets From
Dividends to Shareholders | | | (39,951 | ) | | | — | |
|
|
| FUND SHARE TRANSACTIONS (NOTE 4): | | | | | | | | |
Net proceeds from sale of shares | | | 26,201,711 | | | | 10,515,078 | |
Net asset value of shares issued for reinvestment of dividends | | | 39,951 | | | | — | |
Cost of shares reacquired | | | (13,165,700 | ) | | | (6,656 | ) |
|
|
Increase in Net Assets From Fund Share Transactions | | | 13,075,962 | | | | 10,508,422 | |
|
|
Increase in Net Assets | | | 13,229,849 | | | | 10,521,993 | |
| NET ASSETS: | | | | | | | | |
Beginning of year | | | 10,521,993 | | | | — | |
|
|
End of year* | | $ | 23,751,842 | | | $ | 10,521,993 | |
|
|
* Includes undistributed net investment income of: | | | $204,400 | | | | $14,955 | |
|
|
| † | | For the period September 12, 2003 (commencement of operations) to October 31, 2003. |
See Notes to Financial Statements.
54 Travelers Series Fund Inc. | 2004 Annual Report
For a share of capital stock outstanding throughout each year ended October 31:
| | | | | | | | | | | | | | | | | | | | |
Smith Barney International(1)
All Cap Growth Portfolio | | 2004 | | | 2003 | | | 2002 | | | 2001 | | | 2000 | |
Net Asset Value, Beginning of Year | | $ | 10.43 | | | $ | 8.78 | | | $ | 11.18 | | | $ | 18.52 | | | $ | 16.92 | |
|
|
Income (Loss) From Operations: | | | | | | | | | | | | | | | | | | | | |
Net investment income | | | 0.07 | | | | 0.10 | | | | 0.04 | | | | 0.05 | | | | 0.02 | |
Net realized and unrealized gain (loss) | | | 1.37 | | | | 1.60 | | | | (2.39 | ) | | | (7.39 | ) | | | 1.71 | |
|
|
Total Income (Loss) From Operations | | | 1.44 | | | | 1.70 | | | | (2.35 | ) | | | (7.34 | ) | | | 1.73 | |
|
|
Less Dividends From: | | | | | | | | | | | | | | | | | | | | |
Net investment income | | | (0.10 | ) | | | (0.05 | ) | | | (0.05 | ) | | | — | | | | (0.13 | ) |
|
|
Total Dividends | | | (0.10 | ) | | | (0.05 | ) | | | (0.05 | ) | | | — | | | | (0.13 | ) |
|
|
Net Asset Value, End of Year | | $ | 11.77 | | | $ | 10.43 | | | $ | 8.78 | | | $ | 11.18 | | | $ | 18.52 | |
|
|
Total Return(2) | | | 13.90 | % | | | 19.45 | % | | | (20.97 | )% | | | (39.63 | )% | | | 10.18 | % |
|
|
Net Assets, End of Year (millions) | | | $160 | | | | $180 | | | | $170 | | | | $244 | | | | $462 | |
Ratios to Average Net Assets: | | | | | | | | | | | | | | | | | | | | |
Expenses | | | 1.01 | %(3) | | | 0.99 | % | | | 1.00 | % | | | 1.00 | % | | | 0.98 | % |
Net investment income | | | 0.67 | | | | 1.07 | | | | 0.42 | | | | 0.31 | | | | 0.11 | |
|
|
Portfolio Turnover Rate | | | 21 | % | | | 45 | % | | | 27 | % | | | 22 | % | | | 15 | % |
|
|
| (1) | | Per share amounts have been calculated using the monthly average shares method. |
| (2) | | Performance figures may reflect fee waivers and/or expense reimbursements. Past performance is no guarantee of future results. In the absence of fee waivers and/or expense reimbursements, the total return would have been lower. Total returns do not reflect expenses associated with the separate account such as administrative fees, account charges and surrender charges which, if reflected, would reduce the total returns for all periods shown. |
| (3) | | The investment manager waived a portion of its management fee for the year ended October 31, 2004. The actual expense ratio did not change due to this waiver. |
See Notes to Financial Statements.
55 Travelers Series Fund Inc. | 2004 Annual Report
| | |
| Financial Highlights (continued) | | |
For a share of capital stock outstanding throughout each year ended October 31:
| | | | | | | | | | | | | | | |
Salomon Brothers Strategic(1)
Total Return Bond Portfolio | | 2004 | | | 2003 | | | 2002 | | | 2001 | | | 2000 | |
Net Asset Value, Beginning of Year | | $11.10 | | | $10.13 | | | $10.27 | | | $ 9.89 | | | $10.22 | |
|
|
Income (Loss) From Operations: | | | | | | | | | | | | | | | |
Net investment income | | 0.48 | | | 0.54 | | | 0.51 | (2) | | 0.58 | | | 0.81 | |
Net realized and unrealized gain (loss) | | 0.25 | | | 0.93 | | | (0.17 | )(2) | | 0.48 | | | (0.37 | ) |
|
|
Total Income From Operations | | 0.73 | | | 1.47 | | | 0.34 | | | 1.06 | | | 0.44 | |
|
|
Less Dividends From: | | | | | | | | | | | | | | | |
Net investment income | | (0.67 | ) | | (0.50 | ) | | (0.48 | ) | | (0.68 | ) | | (0.77 | ) |
|
|
Total Dividends | | (0.67 | ) | | (0.50 | ) | | (0.48 | ) | | (0.68 | ) | | (0.77 | ) |
|
|
Net Asset Value, End of Year | | $11.16 | | | $11.10 | | | $10.13 | | | $10.27 | | | $ 9.89 | |
|
|
Total Return(3) | | 6.83 | % | | 15.10 | % | | 3.36 | % | | 10.99 | % | | 4.34 | % |
|
|
Net Assets, End of Year (millions) | | $17 | | | $21 | | | $21 | | | $18 | | | $20 | |
|
|
Ratios to Average Net Assets: | | | | | | | | | | | | | | | |
Expenses | | 1.24 | %(4) | | 1.20 | % | | 1.24 | % | | 1.23 | % | | 0.98 | % |
Net investment income | | 4.47 | | | 5.06 | | | 4.95 | (2) | | 5.69 | | | 7.93 | |
|
|
Portfolio Turnover Rate | | 42 | %* | | 68 | %* | | 385 | % | | 448 | % | | 54 | % |
|
|
| (1) | | Per share amounts have been calculated using the monthly average shares method. |
| (2) | | Effective November 1, 2001, the Fund adopted a change in the accounting method that requires the Fund to amortize premiums and accrete all discounts. Without the adoption of this change, for the year ended October 31, 2002, net investment income, net realized and unrealized loss and the ratio of net investment income to average net assets would have been $0.52, $0.18 and 5.04%, respectively. Per share information, ratios and supplemental data for the periods prior to November 1, 2001 have not been restated to reflect this change in presentation. |
| (3) | | Performance figures may reflect fee waivers and/or expense reimbursements. Past performance is no guarantee of future results. In the absence of fee waivers and/or expense reimbursements, the total return would have been lower. Total returns do not reflect expenses associated with the separate account such as administrative fees, account charges and surrender charges which, if reflected, would reduce the total returns for all periods shown. |
| (4) | | The investment manager waived a portion of its management fee for the year ended October 31, 2004. If such fee were not waived, the actual expense ratio would have been 1.25% |
| * | | Excluding mortgage dollar roll transactions. If mortgage dollar roll transactions had been included, the portfolio turnover rate would have been 414% and 376% for the years ended October 31, 2004 and 2003, respectively. |
See Notes to Financial Statements.
56 Travelers Series Fund Inc. | 2004 Annual Report
| | |
| Financial Highlights (continued) | | |
For a share of capital stock outstanding throughout each year or period ended October 31:
| | | | | | |
| SB Adjustable Rate Income Portfolio | | 2004 | | | 2003(1) | |
Net Asset Value, Beginning of Period | | $10.01 | | | $10.00 | |
|
|
Income From Operations: | | | | | | |
Net investment income | | 0.09 | | | 0.01 | |
Net realized and unrealized gain | | 0.03 | | | — | |
|
|
Total Income From Operations | | 0.12 | | | 0.01 | |
|
|
Less Dividends From: | | | | | | |
Net investment income | | (0.03 | ) | | — | |
|
|
Total Dividends | | (0.03 | ) | | — | |
|
|
Net Asset Value, End of Period | | $10.10 | | | $10.01 | |
|
|
Total Return(2) | | 1.24 | % | | 0.10 | %‡ |
|
|
Net Assets, End of Period (millions) | | $24 | | | $11 | |
|
|
Ratios to Average Net Assets: | | | | | | |
Expenses(3) | | 1.00 | % | | 1.00 | %† |
Net investment income | | 1.19 | | | 0.87 | † |
Portfolio Turnover Rate | | 68 | % | | 3 | % |
|
|
| (1) | | For the period September 12, 2003 (commencement of operations) to October 31, 2003. |
| (2) | | Performance figures may reflect fee waivers and/or expense reimbursements. Past performance is no guarantee of future results. In the absence of fee waivers and/or expense reimbursements, the total return would have been lower. Total returns do not reflect expenses associated with the separate account such as administrative fees, account charges and surrender charges which, if reflected, would reduce the total returns for all periods shown. |
| (3) | | The investment manager has waived a portion of its management fee for the years ended October 31, 2004 and 2003. The investment manager also reimbursed expenses for the year ended October 31, 2003. In addition, Rule 12b-1 distribution plan fees were waived for the years ended October 31, 2004 and 2003. If such fees were not waived and expenses reimbursed, the actual expense ratios would have been 1.31% and 4.72% (annualized), respectively. |
| ‡ | | Total return is not annualized, as it may not be representative of the total return for the year. |
See Notes to Financial Statements.
57 Travelers Series Fund Inc. | 2004 Annual Report
Notes to Financial Statements
| 1. | Significant Accounting Policies |
The Smith Barney International All Cap Growth Portfolio (“SBIACG”) and the SB Adjustable Rate Income Portfolio (“SBARIP”) are separate diversified investment funds of the Travelers Series Fund Inc. (“Company”). The Salomon Brothers Strategic Total Return Bond Portfolio (“SBSTRB”) is a separate non-diversified investment fund of the Company. The Company, a Maryland corporation, is registered under the Investment Company Act of 1940, as amended, as an open-end management investment company.
The following are significant accounting policies consistently followed by the Funds and are in conformity with U.S. generally accepted accounting principles (“GAAP”). Estimates and assumptions are required to be made regarding assets, liabilities and changes in net assets resulting from operations when financial statements are prepared. Changes in the economic environment, financial markets and any other parameters used in determining these estimates could cause actual results to differ.
(a) Investment Valuation. Securities traded on national securities markets and in the over-the-counter markets are valued at the closing price on such markets or, if there were no sales during the day, at the mean between the closing bid and asked prices. Securities listed on the NASDAQ National Market System for which market quotations are available are valued at the official closing price or, if there is no official closing price on that day, at the last sale price. U.S. government agencies and obligations and other fixed income obligations are valued at the mean between the last reported bid and asked prices. When market quotations or official closing prices are not readily available, or are determined not to reflect accurately fair value, such as when the value of a security has been significantly affected by events after the close of the exchange or market on which the security is principally traded (for example, a foreign exchange or market), but before the Funds calculate their net asset value, the Funds may value these investments at fair value as determined in accordance with the procedures approved by the Funds’ Board of Directors. Fair valuing of securities may be determined with the assistance of a pricing service using calculations based on indices of domestic securities and other appropriate indicators, such as prices of relevant ADRs and futures contracts. Short-term obligations with maturities of 60 days or less are valued at amortized cost, which approximates value.
58 Travelers Series Fund Inc. | 2004 Annual Report
Notes to Financial Statements (continued)
(b) Repurchase Agreements. SBIACG, SBSTRB and SBARIP may enter into repurchase agreements. When entering into repurchase agreements, it is the Funds’ policy that a custodian takes possession of the underlying collateral securities, the value of which at least equals the principal amount of the repurchase transaction, including accrued interest. To the extent that any repurchase transaction exceeds one business day, the value of the collateral is marked-to-market to ensure the adequacy of the collateral. If the seller defaults and the value of the collateral declines or if bankruptcy proceedings are commenced with respect to the seller of the security, realization of the collateral by the Funds may be delayed or limited.
(c) Futures Contracts. SBIACG, SBSTRB and SBARIP may enter into futures contracts to the extent permitted by their respective investment policies and objectives. Upon entering into a futures contract, the Funds are required to deposit cash or securities as initial margin. Additional securities are also segregated up to the current market value of the futures contracts. Subsequent payments, which are dependent on the daily fluctuations in the value of the underlying instrument, are made or received by the Funds each day (daily variation margin) and are recorded as unrealized gains or losses until the contracts are closed. When the contracts are closed, the Funds record a realized gain or loss equal to the difference between the proceeds from (or cost of) the closing transactions and the Funds’ basis in the contracts. The Funds enter into such contracts typically to hedge a portion of the portfolio. Risks of entering into futures contracts for hedging purposes include the possibility that a change in the value of the contract may not correlate with the changes in the value of the investments hedged. In addition, the purchase of a futures contract involves the risk that the Funds could lose more than the original margin deposit and subsequent payments required for a futures transaction.
(d) Forward Foreign Currency Contracts. SBIACG and SBSTRB may enter into forward currency contracts. A forward foreign currency contract is an agreement between two parties to buy and sell a currency at a set price on a future date. The contract is marked-to-market daily and the change in value is recorded by the Funds as an unrealized gain or loss. When a forward foreign currency contract is extinguished, through either delivery or offset by entering into another forward foreign currency contract, the Fund records a realized gain or loss equal to the difference between the value of the contract at the time it
59 Travelers Series Fund Inc. | 2004 Annual Report
Notes to Financial Statements (continued)
was opened and the value of the contract at the time it was extinguished or offset. The Fund bears the market risk that arises from changes in foreign currency exchange rates and the credit risk should a counterparty fail to meet the terms of such contracts.
(e) Lending of Portfolio Securities. SBIACG, SBSTRB and SBARIP have an agreement with their custodian whereby the custodian may lend securities owned by the Funds to brokers, dealers and other financial organizations, and receive a lender’s fee. Fees earned by the Funds on securities lending are recorded as interest income. Loans of securities by the Funds are collateralized by cash, U.S. government securities or high quality money market instruments that are maintained at all times in an amount at least equal to the current market value of the loaned securities, plus a margin which may vary depending on the type of securities loaned. The custodian establishes and maintains the collateral in a segregated account. The Funds maintain exposure for the risk of any losses in the investment of amounts received as collateral. The Funds have the right under the lending agreement to recover the securities from the borrower on demand.
(f) Securities Traded on a To-Be-Announced or When Issued Basis. SBIACG, SBSTRB and SBARIP may trade securities on a when-issued basis or on a “to-be-announced” (“TBA”) basis. In a when-issued transaction, the securities are purchased or sold by the Funds with payment and delivery taking place in the future in order to secure what is considered to be an advantageous price and yield to the Funds at the time of entering into the transaction. Purchasing such securities involves the risk of loss if the value of the securities declines prior to settlement. In a TBA transaction, the Funds commit to purchasing or selling securities for which specific information is not yet known at the time of the trade, particularly the face amount and maturity date in U.S. Government Agency Mortgage Pass-Through transactions. Securities purchased on a TBA basis are not settled until they are delivered to the Funds, normally 15 to 45 days later. These transactions are subject to market fluctuations and their current value is determined in the same manner as for other securities.
(g) Mortgage Dollar Rolls. SBSTRB and SBARIP may enter into mortgage dollar roll transactions. A mortgage dollar roll transaction involves a sale by the Funds of mortgage related securities that they hold with an agreement by the Funds to repurchase similar securities at an agreed upon price and date. The securities
60 Travelers Series Fund Inc. | 2004 Annual Report
Notes to Financial Statements (continued)
purchased will bear the same interest rate as those sold, but generally will consist of pools of mortgages with different prepayment histories than those securities sold. Proceeds from the sale will be reinvested and the income from these investments, together with any additional income received on the sale, is included in investment income. Losses may arise due to changes in the value of the securities or if the counterparty does not perform under the terms of the agreement. If the counterparty files for bankruptcy or becomes insolvent, the Funds’ right to repurchase the securities may be limited.
(h) Fund Concentration. The investments by SBIACG and SBSTRB in foreign securities may involve risks not present in domestic investments. Since securities may be denominated in a foreign currency and may require settlement in foreign currencies and pay interest or dividends in foreign currencies, changes in the relationship of these foreign currencies to the U.S. dollar can significantly affect the value of the investments and earnings of SBIACG and SBSTRB. Foreign investments may also subject SBIACG and SBSTRB to foreign government exchange restrictions, expropriation, taxation or other political, social or economic developments, all of which could affect the market and/or credit risk of the investments. In addition to the risks described above, risks may arise from forward foreign currency contracts with respect to the potential inability of counterparties to meet the terms of their contracts.
(i) Credit and Market Risk. SBSTRB invests in high-yield instruments that are subject to certain credit and market risks. The yields of high-yield debt obligations reflect, among other things, perceived credit risk. The Funds’s investment in securities rated below investment-grade typically involves risks not associated with higher rated securities including, among others, greater risk of timely and ultimate payment of interest and principal, greater market price volatility and less liquid secondary market trading.
(j) Investment Transactions and Investment Income. Security transactions are accounted for on trade date. Dividend income is recorded on the ex-dividend date. Foreign dividend income is recorded on the ex-dividend date or as soon as practical after the Funds determine the existence of a dividend declaration after exercising reasonable due diligence. Interest income, adjusted for amortization of premium and accretion of discount, is recorded on an accrual basis. Gains or losses on the sale of securities are calculated by using the specific identification method.
61 Travelers Series Fund Inc. | 2004 Annual Report
Notes to Financial Statements (continued)
(k) Foreign Currency Translation. The books and records of the Funds are maintained in U.S. dollars. Transactions denominated in foreign currencies are recorded at the current prevailing exchange rates. All assets and liabilities denominated in foreign currencies are translated into U.S. dollar amounts at the current exchange rates at the end of the period. Translation gains or losses resulting from changes in the exchange rates during the reporting period and realized gains and losses on the settlement of foreign currency transactions are reported in the statement of operations for the current period. The Funds do not isolate that portion of realized gains and losses on investments in securities, which are due to changes in the foreign exchange rates from that which is due to changes in market prices of equity securities.
(l) Dividends and Distributions to Shareholders. Dividends and distributions are recorded on the ex-dividend date; the Funds distribute dividends and capital gains; if any; at least annually. The character of income and gains to be distributed is determined in accordance with income tax regulations, which may differ from GAAP.
(m) Federal and Other Taxes. It is the Funds’ policy to comply with the federal income and excise tax requirements of the Internal Revenue Code of 1986, as amended, applicable to regulated investment companies. Accordingly, the Funds intend to distribute substantially all of their taxable income and net realized gains on investments, if any, to shareholders each year. Therefore, no federal income tax provision is required. Under the applicable foreign tax law, a withholding tax may be imposed on interest, dividends and capital gains at various rates.
(n) Reclassification. GAAP requires that certain components of net assets be adjusted to reflect permanent differences between financial and tax reporting. Accordingly, during the current year, $46,881 has been reclassified between accumulated net realized loss from investment transactions and options and accumulated net investment income due to foreign currency transactions treated as ordinary income for tax for SBIACG. Additionally, $36,100 has been reclassified between accumulated net realized loss from investment transactions and net investment income due to differences between book and tax amortization of premium on fixed income securities, book foreign currency transactions treated as ordinary income for tax and income from mortgage backed securities treated as capital gains for tax purposes for SBSTRB. Finally, $45,352
62 Travelers Series Fund Inc. | 2004 Annual Report
Notes to Financial Statements (continued)
has been reclassified between accumulated net realized loss from investment transactions and net investment income due to income from mortgage backed securities treated as capital gains for tax purposes and $11, has been reclassified between paid-in capital and net investment income due to a non-deductible excise tax for SBARIP. These reclassifications have no effect on net assets or net asset values per share.
| 2. | Management Agreement and Transactions with Affiliated Persons |
Smith Barney Fund Management LLC (“SBFM”), an indirect wholly-owned subsidiary of Citigroup Inc. (“Citigroup”), acts as investment manager of SBIACG and SBARIP. Effective July 1, 2004, the management fee that SBIACG pays SBFM, which is calculated daily and payable monthly, was reduced from 0.90% of SBIACG’s average daily net assets to 0.85% of SBIACG’s average daily net assets. The terms of the amended management agreement are the same in all other material respects as the prior management agreement. SBARIP pays SBFM a management fee calculated at the annual rate of 0.60% of the average daily net assets of SBARIP. In addition, Travelers Investment Adviser, Inc. (“TIA”), an affiliate of SBFM, acts as the investment manager of SBSTRB. SBSTRB pays TIA a management fee calculated at an annual rate of 0.80% of the average daily net assets of SBSTRB. These fees are calculated daily and paid monthly. For the year ended October 31, 2004, SBFM waived a portion of its management fees amounting to $2,216, $1,741 and $24,449 for SBIACG, SBSTRB and SBARIP, respectively.
TIA has entered into a sub-advisory agreement with Salomon Brothers Asset Management Inc (“SaBAM”), another indirect wholly-owned subsidiary of Citigroup. Pursuant to the sub-advisory agreement, SaBAM is responsible for the day-to-day portfolio operations and investment decisions for SBSTRB and is compensated for such services by TIA at an annual rate of 0.375% of the average daily net assets of SBSTRB.
TIA has also entered into a sub-administrative services agreement with SBFM. TIA pays SBFM, as sub-administrator, a fee calculated at an annual rate of 0.10% of the average daily net assets of SBSTRB.
Citicorp Trust Bank, fsb. (“CTB”), another subsidiary of Citigroup, acts as the Funds’ transfer agent and PFPC Inc. (“PFPC”) acts as the Funds’ sub-transfer agent.
63 Travelers Series Fund Inc. | 2004 Annual Report
Notes to Financial Statements (continued)
CTB receives account fees and asset-based fees that vary according to the size and type of account. PFPC is responsible for shareholder recordkeeping and financial processing for all shareholder accounts and is paid by CTB. For the year ended October 31, 2004, the Funds paid transfer agent fees totaling $15,000 to CTB.
The Company, on behalf of SBARIP, has adopted a plan (“Plan”) pursuant to Rule 12b-1 under the 1940 Act for SBARIP’s Smith Barney Class shares. The Plan provides that SBARIP shall pay a fee in an amount not to exceed 0.25% of the average daily net assets of SBARIP’s Smith Barney Class shares. This fee is calculated daily and paid monthly. For the year ended October 31, 2004, Rule 12b-1 distribution plan fees of $23,273 were waived for SBARIP.
Most of the officers and one Director of the Company are employees of Citigroup or its affiliates and do not receive compensation from the Company.
During the year ended October 31, 2004, the aggregate cost of purchases and proceeds from sales of investments (excluding short-term investments and mortgage dollar rolls) were as follows:
| | | | | | | | | |
| | | SBIACG | | SBSTRB | | SBARIP |
Purchases | | $ | 36,281,875 | | $ | 7,847,676 | | $ | 22,263,707 |
|
Sales | | | 80,869,940 | | | 12,893,323 | | | 9,979,115 |
|
At October 31, 2004, the aggregate gross unrealized appreciation and depreciation of investments for Federal income tax purposes were substantially as follows:
| | | | | | | | | | | | |
| | | SBIACG | | | SBSTRB | | | SBARIP | |
Gross unrealized appreciation | | $ | 38,350,033 | | | $ | 759,125 | | | $ | 32,084 | |
Gross unrealized depreciation | | | (7,749,175 | ) | | | (292,686 | ) | | | (27,371 | ) |
|
|
Net unrealized appreciation | | $ | 30,600,858 | | | $ | 466,439 | | | $ | 4,713 | |
|
|
At October 31, 2004, SBSTRB had the following open futures contracts:
| | | | | | | | | | | | | | |
| | | Number of
Contracts | | Expiration
Date | | Basis
Value | | Market
Value | | Unrealized
Gain (Loss) | |
To Sell | | | | | | | | | | | | | | |
U.S. 5 Year Treasury Notes | | 19 | | 12/04 | | $ | 2,095,666 | | $ | 2,116,125 | | $ | (20,459 | ) |
U.S. 10 Year Treasury Notes | | 11 | | 12/04 | | | 1,245,960 | | | 1,249,188 | | | (3,228 | ) |
|
|
To Buy | | | | | | | | | | | | | | |
U.S. Treasury Bonds | | 3 | | 12/04 | | | 330,245 | | | 341,531 | | | 11,286 | |
|
|
Net Unrealized Loss on
Open Futures Contracts | | | | | | | | $ | (12,401 | ) |
|
|
At October 31, 2004, SBIACG and SBARIP did not have any open futures contracts.
64 Travelers Series Fund Inc. | 2004 Annual Report
Notes to Financial Statements (continued)
At October 31, 2004, SBIACG and SBSTRB had open forward foreign currency contracts as described below. The unrealized gain (loss) on the open contracts reflected in the accompanying financial statements are as follows:
| | | | | | | | | | | |
| Smith Barney International All Cap Growth Portfolio | | | | | |
| Foreign Currency | | Local
Currency | | Market
Value | | Settlement
Date | | Unrealized
Gain (Loss) | |
Contracts To Sell: | | | | | | | | | | | |
Pound Sterling | | 435,486 | | $ | 795,851 | | 11/1/04 | | $ | (3,092 | ) |
Hong Kong Dollar | | 1,300,000 | | | 167,127 | | 11/1/04 | | | 107 | |
Japanese Yen | | 151,743,393 | | | 1,425,302 | | 11/1/04 | | | (5,969 | ) |
|
|
Net Unrealized Loss on Open Forward
Foreign Currency Contracts | | | | $ | (8,954 | ) |
|
|
| | | | | | | | | | |
| Salomon Brothers Strategic Total Return Bond Portfolio | | | | | |
| Foreign Currency | | Local
Currency | | Market
Value | | Settlement
Date | | Unrealized
Gain (Loss) | |
To Buy: | | | | | | | | | | |
Euro | | 488,379 | | 622,537 | | 11/24/04 | | $ | 26,445 | |
Euro | | 588,058 | | 749,597 | | 11/24/04 | | | 9,597 | |
|
|
| | | | | | | | | | 36,042 | |
|
|
To Sell: | | | | | | | | | | |
Euro | | 1,600,877 | | 2,040,636 | | 11/24/04 | | | (78,954 | ) |
Euro | | 578,568 | | 737,500 | | 11/24/04 | | | 2,500 | |
|
|
| | | | | | | | | | (76,454 | ) |
|
|
Net Unrealized Loss on Open Forward
Foreign Currency Contracts | | | | $ | (40,412 | ) |
|
|
At October 31, 2004, SBARIP did not have any open forward foreign currency contracts.
At October 31, 2004, SBIACG loaned securities having a market value of $20,872,263. SBIACG received cash collateral amounting to $21,892,934 which was invested in the State Street Navigator Securities Lending Trust Prime Portfolio, a Rule 2a-7 money market fund.
Income earned by SBIACG from securities lending for the year ended October 31, 2004, was $60,590.
At October 31, 2004, SBSTRB and SBARIP did not have any securities on loan.
65 Travelers Series Fund Inc. | 2004 Annual Report
Notes to Financial Statements (continued)
During the year ended October 31, 2004, SBSTRB entered into mortgage dollar roll transactions in the aggregate amount of $5,182,641.
At October 31, 2004, the Company had six billion shares of capital stock authorized with a par value of $0.00001 per share. Each share of a Fund represents an equal proportionate interest in that Fund with each share of the same Fund and has an equal entitlement to any dividends and distributions made by the Fund.
Transactions in shares of each Fund were as follows:
| | | | | | |
| | | Year Ended
October 31, 2004 | | | Year Ended
October 31, 2003* | |
Smith Barney International All Cap Growth Portfolio | | | | |
Shares sold | | 1,538,608 | | | 28,109,301 | |
Shares issued on reinvestment | | 159,603 | | | 108,915 | |
Shares reacquired | | (5,360,813 | ) | | (30,354,096 | ) |
|
|
Net Decrease | | (3,662,602 | ) | | (2,135,880 | ) |
|
|
Salomon Brothers Strategic Total Return Bond Portfolio | | | | |
Shares sold | | 129,079 | | | 493,019 | |
Shares issued on reinvestment | | 115,157 | | | 105,155 | |
Shares reacquired | | (673,931 | ) | | (772,892 | ) |
|
|
Net Decrease | | (429,695 | ) | | (174,718 | ) |
|
|
SB Adjustable Rate Income Portfolio | | | | |
Shares sold | | 2,607,403 | | | 1,051,462 | |
Shares issued on reinvestment | | 3,999 | | | — | |
Shares reacquired | | (1,311,034 | ) | | (666 | ) |
|
|
Net Increase | | 1,300,368 | | | 1,050,796 | |
|
|
| * | | For the SB Adjustable Rate Income Portfolio, transactions are for the period September 12, 2003 (commencement of operations) to October 31, 2003. |
66 Travelers Series Fund Inc. | 2004 Annual Report
Notes to Financial Statements (continued)
| 5. | Income Tax Information and Distributions to Shareholders |
The tax character of distributions paid during the fiscal years ended October 31, 2004 were as follows:
| | | | | | | | | |
| | | Smith Barney
International
All Cap Growth
Portfolio | | Salomon Brothers
Strategic Total
Return Bond
Portfolio | | SB Adjustable
Rate Income
Portfolio |
Distributions paid from: | | | | | | | | | |
Ordinary income | | $ | 1,763,610 | | $ | 1,228,728 | | $ | 39,951 |
|
Total Distributions Paid | | $ | 1,763,610 | | $ | 1,228,728 | | $ | 39,951 |
|
The tax character of distributions paid during the fiscal year ended October 31, 2003 were as follows:
| | | | | | | | |
| | | Smith Barney
International
All Cap Growth
Portfolio | | Salomon Brothers
Strategic Total
Return Bond
Portfolio | | SB Adjustable
Rate Income
Portfolio |
Distributions paid from: | | | | | | | | |
Ordinary income | | $ | 947,561 | | $ | 1,052,602 | | — |
|
Total Distributions Paid | | $ | 947,561 | | $ | 1,052,602 | | — |
|
67 Travelers Series Fund Inc. | 2004 Annual Report
Notes to Financial Statements (continued)
As of October 31, 2004, the components of accumulated earnings on a tax basis were as follows:
| | | | | | | | | | | | |
| | | SBIACG | | | SBSTRB | | | SBARIP | |
Undistributed ordinary income | | $ | 1,212,635 | | | $ | 816,244 | | | $ | 204,400 | |
|
|
Total undistributed earnings | | | 1,212,635 | | | | 816,244 | | | | 204,400 | |
Capital loss carryforward* | | | (66,914,158 | ) | | | (1,759,311 | ) | | | (41,644 | ) |
Other book/tax temporary differences** | | | 9,063 | | | | (44,337 | ) | | | — | |
Unrealized appreciation/(depreciation)*** | | | 30,621,825 | | | | 415,007 | | | | 4,713 | |
|
|
Total accumulated earnings (losses) | | $ | (35,070,635 | ) | | $ | (572,397 | ) | | $ | 167,469 | |
|
|
| * | | On October 31, 2004, SBIACG had a net capital loss carryforward of approximately $66,914,158, of which $4,800,514 expires in 2007, $38,754,186 expires in 2009, $13,574,174 expires in 2010 and $9,785,284 expires in 2011. SBSTRB had a net capital loss carryforward of approximately $1,759,311, of which $759,256 expires in 2007, $938,295 expires in 2008, $42,124 expires in 2009 and $19,636 expires in 2010. SBARIP had a net capital loss carryforward of approximately $41,644, of which $2,911 expires in 2011 and $38,733 expires in 2012. |
| | | These amounts will be available to offset like amounts of any future taxable gains. |
| ** | | Other book/tax temporary differences for SBIACG and SBSTRB are attributable primarily to the tax deferral of losses on straddles, the book/tax differences in the accrual of income on securities in default, the realization for tax purposes of unrealized gains (losses) on certain foreign currency contracts and the realization for tax purposes of unrealized gains (losses) on certain futures contracts. |
| *** | | The differences between book-basis and tax-basis unrealized appreciation (depreciation) for SBIACG, SBSTRB and SBARIP are attributable primarily to the tax deferral of losses on wash sales and the difference between book and tax amortization methods for premiums and discounts on fixed income securities. |
In connection with an investigation previously disclosed by Citigroup, the Staff of the Securities and Exchange Commission (“SEC”) has notified Citigroup Asset Management (“CAM”), the Citigroup business unit that includes the funds’ investment manager and other investment advisory companies; Citicorp Trust Bank (“CTB”), an affiliate of CAM; Thomas W. Jones, the former CEO of CAM; and three other individuals, one of whom is an employee and the other two of whom are former employees of CAM, that the SEC Staff is considering recommending a civil injunctive action and/or an administrative proceeding against each of them relating to the creation and operation of an internal transfer agent unit to serve various CAM-managed funds.
In 1999, CTB entered the transfer agent business. CTB hired an unaffiliated subcontractor to perform some of the transfer agent services. The subcontractor, in exchange, had signed a separate agreement with CAM in 1998 that guaranteed investment management revenue to CAM and investment banking revenue
68 Travelers Series Fund Inc. | 2004 Annual Report
Notes to Financial Statements (continued)
to a CAM affiliate. The subcontractor’s business was later taken over by PFPC Inc., and at that time the revenue guarantee was eliminated and a one-time payment was made by the subcontractor to a CAM affiliate.
CAM did not disclose the revenue guarantee when the boards of various CAM-managed funds hired CTB as transfer agent. Nor did CAM disclose to the boards of the various CAM-managed funds the one-time payment received by the CAM affiliate when it was made.
In addition, the SEC Staff has indicated that it is considering recommending action based on the adequacy of the disclosures made to the fund boards that approved the transfer agency arrangement, CAM’s initiation and operation of, and compensation for, the transfer agent business and CAM’s retention of, and agreements with, the subcontractor.
Citigroup is cooperating fully in the investigation and will seek to resolve the matter in discussions with the SEC Staff. Although there can be no assurance, Citigroup does not believe that this matter will have a material adverse effect on the Funds. As previously disclosed, CAM has already agreed to pay the applicable funds, primarily through fee waivers, a total of approximately $17 million (plus interest) that is the amount of the revenue received by Citigroup relating to the revenue guarantee.
Beginning in June 2004, class action lawsuits alleging violations of the federal securities laws were filed against Citigroup Global Markets Inc. (the “Distributor”) and a number of its affiliates, including Smith Barney Fund Management LLC and Salomon Brothers Asset Management Inc (the “Advisers”), substantially all of the mutual funds managed by the Advisers, including the Fund (the “Funds”), and directors or trustees of the Funds (collectively, the “Defendants”). The complaints alleged, among other things, that the Distributor created various undisclosed incentives for its brokers to sell Smith Barney and Salomon Brothers funds. In addition, according to the complaints, the Advisers caused the Funds to pay excessive brokerage commissions to the Distributor for steering clients towards proprietary funds. The complaints also alleged that the defendants breached their fiduciary duty to the Funds by improperly charging Rule 12b-1 fees and by drawing on fund assets to make
69 Travelers Series Fund Inc. | 2004 Annual Report
Notes to Financial Statements (continued)
undisclosed payments of soft dollars and excessive brokerage commissions. The complaints also alleged that the Funds failed to adequately disclose certain of the allegedly wrongful conduct. The complaints sought injunctive relief and compensatory and punitive damages, rescission of the Funds’ contracts with the Advisers, recovery of all fees paid to the Advisers pursuant to such contracts and an award of attorneys’ fees and litigation expenses.
On December 15, 2004, a consolidated amended complaint (the “Complaint”) was filed alleging substantially similar causes of action. While the lawsuit is in its earliest stages, to the extent that the Complaint purports to state causes of action against the Funds, Citigroup Asset Management believes the Funds have significant defenses to such allegations, which the Funds intend to vigorously assert in responding to the Complaint.
Additional lawsuits arising out of these circumstances and presenting similar allegations and requests for relief may be filed against the Defendants in the future.
As of the date of this report, Citigroup Asset Management and the Funds believe that the resolution of the pending lawsuit will not have a material effect on the financial position or results of operations of the Funds or the ability of the Advisers and their affiliates to continue to render services to the Funds under their respective contracts.
70 Travelers Series Fund Inc. | 2004 Annual Report
Report of Independent Registered Public Accounting Firm
The Shareholders and Board of Directors of
Travelers Series Fund Inc.:
We have audited the accompanying statements of assets and liabilities, including the schedules of investments, of Smith Barney International All Cap Growth, Salomon Brothers Strategic Total Return Bond and SB Adjustable Rate Income Portfolios (“Funds”) of Travelers Series Fund Inc. (“Company”) as of October 31, 2004, and the related statements of operations for the year then ended, the statements of changes in net assets for each of the years in the two-year period then ended and the financial highlights for each of the years in the five-year period then ended with respect to Smith Barney International All Cap Growth and Salomon Brothers Strategic Total Return Bond Portfolios, and the statement of changes in net assets and the financial highlights for the year then ended and the period from September 12, 2003 (commencement of operations) through October 31, 2003 with respect to SB Adjustable Rate Income Portfolio. These financial statements and financial highlights are the responsibility of the Company’s management. Our responsibility is to express an opinion on these financial statements and financial highlights based on our audits.
We conducted our audits in accordance with the standards of the Public Company Accounting Oversight Board (United States). Those standards require that we plan and perform the audit to obtain reasonable assurance about whether the financial statements and financial highlights are free of material misstatement. An audit includes examining, on a test basis, evidence supporting the amounts and disclosures in the financial statements. Our procedures included confirmation of securities owned as of October 31, 2004, by correspondence with the custodian and brokers, or by other appropriate auditing procedures where replies from brokers were not received. An audit also includes assessing the accounting principles used and significant estimates made by management, as well as evaluating the overall financial statement presentation. We believe that our audits provide a reasonable basis for our opinion.
In our opinion, the financial statements and financial highlights referred to above present fairly, in all material respects, the financial position of the Funds as of October 31, 2004, and the results of their operations, the changes in their net assets and the financial highlights for the periods described above in conformity with U.S. generally accepted accounting principles.

New York, New York
December 17, 2004
71 Travelers Series Fund Inc. | 2004 Annual Report
Additional Information (unaudited)
Information about Directors and Officers
The business and affairs of the Travelers Series Fund Inc. (“Company”) are managed under the direction of the Company’s Board of Directors. Information pertaining to the Directors and Officers of the Company is set forth below.
| | | | | | | | | | |
Name, Address
and Age | | Position(s)
Held with
Fund | | Term of
Office* and
Length
of Time
Served | | Principal
Occupation(s)
During Past
Five Years | | Number of
Portfolios
in Fund
Complex
Overseen by
Director | | Other Board
Memberships Held by Director |
| Non-Interested Directors:† | | | | |
Robert A. Frankel 1961 Deergrass Way Carlsbad, CA 92009 DOB: 5/20/27 | | Director | | Since
1999 | | Managing Partner of Robert A. Frankel Managing Consultants; Former Vice President of The Readers Digest Association, Inc. | | 24 | | None |
| | | | | |
Michael E. Gellert 122 East 42nd Street 47th Floor New York, NY 10168 DOB: 6/16/31 | | Director | | Since
1999 | | General Partner of Windcrest Partners, a venture capital firm | | 17 | | Director of Dalet S.A., Devon Energy Corp., High Speed Access Corp., Human, Inc., SEACOR Smit, Inc. and Six Flags, Inc. |
| | | | | |
Rainer Greeven 630 5th Avenue Suite 1960 New York, NY 10111 DOB: 12/6/36 | | Director | | Since
1994 | | Attorney, Rainer Greeven PC | | 17 | | Director of Continental Container Corp. |
| | | | | |
Susan M. Heilbron P.O. Box 557 Chilimark, MA 02535 DOB: 2/12/45 | | Director | | Since
1994 | | Owner/Consultant of Lacey & Heilbron, a public relations firm | | 17 | | Director of National Multiple Sclerosis Society, New York City Chapter |
72 Travelers Series Fund Inc. | 2004 Annual Report
Additional Information (unaudited) (continued)
| | | | | | | | | | |
Name, Address
and Age | | Position(s)
Held with
Fund | | Term of
Office* and
Length
of Time
Served | | Principal
Occupation(s)
During Past
Five Years | | Number of
Portfolios
in Fund
Complex
Overseen by
Director | | Other Board
Memberships Held by Director |
| Interested Director: | | | | |
R. Jay Gerken, CFA** Citigroup Asset Management (“CAM”) 399 Park Avenue
4th Floor New York, NY 10022 DOB: 4/5/51 | | Chairman, President and Chief Executive Officer | | Since
2002 | | Managing Director of Citigroup Global Markets Inc. (“CGM”); Chairman, President and Chief Executive Officer of Smith Barney Fund Management LLC (“SBFM”), Travelers Investment Adviser, Inc. (“TIA”) and Citi Fund Management Inc. (“CFM”); President and Chief Executive Officer of certain mutual funds associated with Citigroup Inc. (“Citigroup”); Formerly, Portfolio Manager of Smith Barney Allocation Series Inc. (from 1996 to 2001) and Smith Barney Growth and Income Fund (from 1996 to 2000) | | 221 | | None |
| | | | | |
| Officers: | | | | | | | | | | |
Andrew B. Shoup CAM 125 Broad Street 11th Floor New York, NY 10004 DOB: 8/1/56 | | Senior Vice President and Chief Administrative Officer | | Since
2003 | | Director of CAM; Senior Vice President and Chief Administrative Officer of mutual funds associated with Citigroup; Head of International Funds Administration of CAM (from 2001 to 2003); Director of Global Funds Administration of CAM (from 2000 to 2001); Head of U.S. Citibank Funds Administration of CAM (from 1998 to 2000) | | N/A | | N/A |
73 Travelers Series Fund Inc. | 2004 Annual Report
Additional Information (unaudited) (continued)
| | | | | | | | | | |
Name, Address
and Age | | Position(s)
Held with
Fund | | Term of
Office* and
Length
of Time
Served | | Principal
Occupation(s)
During Past
Five Years | | Number of
Portfolios
in Fund
Complex
Overseen by
Director | | Other Board
Memberships Held by Director |
| Officers: | | | | | | | | | | |
James M. Giallanza CAM 125 Broad Street 11th Floor New York, NY 10004 DOB: 3/31/66 | | Chief Financial Officer and Treasurer | | Since
2004 | | Director of CGM; Chief Financial Officer and Treasurer of certain mutual funds associated with Citigroup; Director and Controller of the U.S. wholesale business at UBS Global Asset Management US, Inc. (from September 2001 to July 2004); Director of Global Funds Administration at CAM (from June 2000 to September 2001); Treasurer of the Lazard Funds (from June 1998 to June 2000) | | N/A | | N/A |
| | | | | |
Jeffrey J. Russell CAM 399 Park Avenue 4th Floor New York, NY 10022 DOB: 9/24/57 | | Vice President and Investment Officer | | Since
1994 | | Managing Director of CGM | | N/A | | N/A |
| | | | | |
Beth A. Semmel, CFA CAM 399 Park Avenue 4th Floor New York, NY 10022 DOB: 9/10/60 | | Vice President and Investment Officer | | Since
2002 | | Managing Director of CGM | | N/A | | N/A |
| | | | | |
Peter J. Wilby, CFA CAM 399 Park Avenue 4th Floor New York, NY 10022 DOB: 11/30/58 | | Vice President and Investment Officer | | Since
2000 | | Managing Director of CGM | | N/A | | N/A |
| | | | | |
David A. Torchia CAM 399 Park Avenue 4th Floor New York, NY 10022 DOB: 12/12/59 | | Vice President and Investment Officer | | Since
2003 | | Managing Director of CGM | | N/A | | N/A |
74 Travelers Series Fund Inc. | 2004 Annual Report
Additional Information (unaudited) (continued)
| | | | | | | | | | |
Name, Address
and Age | | Position(s)
Held with
Fund | | Term of
Office* and
Length
of Time
Served | | Principal
Occupation(s)
During Past
Five Years | | Number of
Portfolios
in Fund
Complex
Overseen by
Director | | Other Board
Memberships Held by Director |
| Officers: | | | | | | | | | | |
Theresa M. Veres CAM 399 Park Avenue 4th Floor New York, NY 10022 DOB: 6/1/66 | | Vice President and Investment Officer | | Since
2003 | | Director of CGM | | N/A | | N/A |
| | | | | |
Andrew Beagley CAM 399 Park Avenue,
4th Floor New York, NY 10022 DOB: 10/9/62 | | Chief Anti-Money Laundering Compliance Officer Chief Compliance Officer | | Since
2002 Since
2004 | | Director of CGM (since 2000); Director of Compliance, North America, CAM (since 2000); Chief Anti-Money Laundering Compliance Officer, Chief Compliance Officer and Vice President of certain mutual funds associated with Citigroup; Director of Compliance, Europe, the Middle East and Africa, Citigroup Asset Management (from 1999 to 2000); Compliance Officer, SBFM, CFM, TIA, Salomon Brothers Asset Management Limited, Smith Barney Global Capital Management Inc., Salomon Brothers Asset Management Asia Pacific Limited (from 1997 to 1999) | | N/A | | N/A |
| | | | | |
Robert I. Frenkel
CAM 300 First Stamford Place
4th Floor Stamford, CT 06902 DOB: 12/12/54 | | Secretary and Chief Legal Officer | | Since
2003 | | Managing Director and General Counsel of Global Mutual Funds for CAM and its predecessor (since 1994); Secretary and Chief Legal Officer of mutual funds associated with Citigroup | | N/A | | N/A |
| * | | Each Director and Officer serves until his or her successor has been duly elected and qualified. |
| ** | | Mr. Gerken is an “interested person” of the Company as defined in the Investment Company Act of 1940, as amended, because Mr. Gerken is an officer of SBFM and certain of its affiliates. |
| † | | Abraham E. Cohen resigned as a Director of the Company, effective July 8, 2004. Mr. Cohen had served as a Director since 1996. |
75 Travelers Series Fund Inc. | 2004 Annual Report
Important Tax Information (unaudited)
The following information is provided with respect to the distributions paid during the taxable year ended October 31, 2004:
| | | | | | | |
| | | Smith Barney
International
All Cap Growth
Portfolio | | | SB Adjustable
Rate Income
Portfolio | |
Record Date: | | | 12/29/2003 | | | 12/29/2003 | |
Payable Date: | | | 12/30/2003 | | | 12/30/2003 | |
|
|
Interest from Federal Obligations | | | — | | | 8.74 | % |
|
|
Foreign Source Income | | | 100.00 | %* | | — | |
|
|
Foreign Taxes Paid Per Share | | $ | 0.023500 | | | — | |
|
|
| * | | Expressed as a percentage of the cash distribution grossed-up for foreign taxes. |
The law varies in each state as to whether and what percentage of dividend income attributable to Federal obligations is exempt from state income tax. We recommend that you consult with your tax adviser to determine if any portion of the dividends you received is exempt from state income taxes.
The foreign taxes paid represent taxes incurred by the Fund on income received by the Fund from foreign sources. Foreign taxes paid may be included in taxable income with an offsetting deduction from gross income or may be taken as a credit for taxes paid to foreign governments. You should consult your tax adviser regarding the appropriate treatment of foreign taxes paid.
Please retain this information for your records.
76 Travelers Series Fund Inc. | 2004 Annual Report
TRAVELERS SERIES
FUND INC.
| | | | |
DIRECTORS Robert A. Frankel Michael E. Gellert R. Jay Gerken, CFA Chairman Rainer Greeven Susan M. Heilbron OFFICERS R. Jay Gerken, CFA President and Chief
Executive Officer Andrew B. Shoup Senior Vice President and Chief Administrative Officer James M. Giallanza Chief Financial Officer and Treasurer Jeffrey J. Russell Vice President and Investment Officer Beth A. Semmel, CFA Vice President and Investment Officer Peter J. Wilby, CFA Vice President and Investment Officer David A. Torchia Vice President and Investment Officer Theresa M. Veres Vice President and Investment Officer | | | | OFFICERS (continued) Andrew Beagley Chief Anti-Money Laundering Compliance Officer and Chief Compliance Officer Robert I. Frenkel Secretary and
Chief Legal Officer INVESTMENT MANAGERS Smith Barney Fund Management LLC Travelers Investment Adviser, Inc. CUSTODIAN State Street Bank and
Trust Company ANNUITY
ADMINISTRATION Travelers Annuity Investor Services One Cityplace Hartford, CT 06103-3415 TRANSFER AGENT Citicorp Trust Bank, fsb. 125 Broad Street, 11th Floor New York, New York 10004 SUB-TRANSFER AGENT PFPC Inc. P.O. Box 9699 Providence, Rhode Island 02940-9699 |
Travelers Series Fund Inc.
Smith Barney International All Cap Growth Portfolio
Salomon Brothers Strategic Total Return Bond Portfolio
SB Adjustable Rate Income Portfolio
The Funds are separate investment funds of the Travelers Series Fund Inc., a Maryland corporation.
The Funds file their complete schedule of portfolio holdings with the Securities and Exchange Commission for the first and third quarters of each fiscal year on Form N-Q. The Funds’ Forms N-Q are available on the Commission’s website at www.sec.gov. The Funds’ Forms N-Q may be reviewed and copied at the Commission’s Public Reference Room in Washington D.C., and information on the operation of the Public Reference Room may be obtained by calling 1-800-SEC-0330. To obtain information of Form N-Q from the Funds, shareholders can call 1-800-451-2010.
Information on how the Funds voted proxies relating to portfolio securities during the 12-month period ended June 30, 2004 and a description of the policies and procedures that the Funds use to determine hoe to vote proxies relating to portfolio securities is available (1) without charge, upon request, by calling 1-800-451-2010, (2) on the Funds’ website at www.citigroupAM.com and (3) on the SEC’s website at www.sec.gov
This report is submitted for the general information of the shareholders of Travelers Series Fund Inc. — Smith Barney International All Cap Growth, Salomon Brothers Strategic Total Return Bond and SB Adjustable Rate Income Portfolios.
TRAVELERS SERIES FUND INC.
125 Broad Street
10th Floor, MF-2
New York, New York 10004
IN0252 12/04
04-7592
The registrant has adopted a code of ethics that applies to the registrant’s principal executive officer, principal financial officer, principal accounting officer or controller.
| ITEM 3. | AUDIT COMMITTEE FINANCIAL EXPERT. |
The Board of Directors of the registrant has determined that Robert A. Frankel, the Chairman of the Board’s Audit Committee, possesses the technical attributes identified in Instruction 2(b) of Item 3 to Form N-CSR to qualify as an “audit committee financial expert,” and has designated Mr. Frankel as the Audit Committee’s financial expert. Mr. Frankel is an “independent” Director pursuant to paragraph (a)(2) of Item 3 to Form N-CSR.
| ITEM 4. | PRINCIPAL ACCOUNTANT FEES AND SERVICES |
| | (a) | Audit Fees for the Travelers Series Fund Inc. were $342,500 and $329,500 for the years ended 10/31/04 and 10/31/03. |
| | (b) | Audit-Related Fees for the Travelers Series Fund Inc. were $0 and $3,500 for the years ended 10/31/04 and 10/31/03. |
| | (c) | Tax Fees for Travelers Series Fund Inc. of $35,400 and $35,000 for the years ended 10/31/04 and 10/31/03. These amounts represent aggregate fees paid for tax compliance, tax advice and tax planning services, which include (the filing and amendment of federal, state and local income tax returns, timely RIC qualification review and tax distribution and analysis planning) rendered by the Accountant to Travelers Series Fund Inc. |
| | (d) | All Other Fees for Travelers Series Fund Inc. of $0 and $0 for the years ended 10/31/04 and 10/31/03. |
| | (e) | (1) Audit Committee’s pre–approval policies and procedures described in paragraph (c) (7) of Rule 2-01 of Regulation |
The Charter for the Audit Committee (the “Committee”) of the Board of each registered investment company (the “Fund”) advised by Smith Barney Fund Management LLC or Salomon Brothers Asset Management Inc. or one of their affiliates (each, an “Adviser”) requires that the Committee shall approve (a) all audit and permissible non-audit services to be provided to the Fund and (b) all permissible non-audit services to be provided by the Fund’s independent auditors to the Adviser and any Covered Service Providers if the engagement relates directly to the operations and financial reporting of the Fund. The Committee may implement policies and procedures by which such services are approved other than by the full Committee.
The Committee shall not approve non-audit services that the Committee believes may impair the independence of the auditors. As of the date of the approval of this Audit Committee Charter, permissible non-audit services include any professional services (including tax services), that are not prohibited services as described below, provided to the Fund by the independent auditors, other than those provided to the Fund in connection with an audit or a review of the financial statements of the Fund. Permissible non-audit services may not include: (i) bookkeeping or other services related to the accounting records or financial statements of the Fund; (ii) financial information systems design and implementation; (iii) appraisal or valuation services, fairness opinions or contribution-in-kind reports; (iv) actuarial services; (v) internal audit outsourcing services; (vi) management functions or human resources; (vii) broker or dealer, investment adviser or investment banking services; (viii) legal services and expert services unrelated to the audit; and (ix) any other service the Public Company Accounting Oversight Board determines, by regulation, is impermissible.
Pre-approval by the Committee of any permissible non-audit services is not required so long as: (i) the aggregate amount of all such permissible non-audit services provided to the Fund, the Adviser and any service providers controlling, controlled by or under common control with the Adviser that provide ongoing services to the Fund (“Covered Service Providers”) constitutes not more than 5% of the total amount of revenues paid to the independent auditors during the fiscal year in which the permissible non-audit services are provided to (a) the Fund, (b) the Adviser and (c) any entity controlling, controlled by or under common control with the Adviser that provides ongoing services to the Fund during the fiscal year in which the services are provided that would have to be approved by the Committee; (ii) the permissible non-audit services were not recognized by the Fund at the time of the engagement to be non-audit services; and (iii) such services are promptly brought to the attention of the Committee and approved by the Committee (or its delegate(s)) prior to the completion of the audit.
(2) For the Travelers Series Fund Inc., the percentage of fees that were approved by the audit committee, with respect to: Audit-Related Fees were 100% and 100% for the years ended 10/31/04 and 10/31/03; Tax Fees were 100% and 100% for the years ended 10/31/04 and 10/31/03; and
Other Fees were 100% and 100% for the years ended 10/31/04 and 10/31/03.
| | (g) | Non-audit fees billed by the Accountant for services rendered to Travelers Series Fund Inc. and CAM and any entity controlling, controlled by, or under common control with CAM that provides ongoing services to Travelers Series Fund Inc. were $0 and $0 for the years ended 10/31/04 and 10/31/03. |
| | (h) | Yes. The Travelers Series Fund Inc.’s Audit Committee has considered whether the provision of non-audit services that were rendered to Service Affiliates which were not pre-approved (not requiring pre-approval) is compatible with maintaining the Accountant’s independence. All services provided by the Accountant to the Travelers Series Fund Inc. or to Service Affiliates which were required to be pre-approved were pre-approved as required. |
| ITEM 5. | AUDIT COMMITTEE OF LISTED REGISTRANTS. |
Not applicable.
| ITEM 7. | DISCLOSURE OF PROXY VOTING POLICIES AND PROCEDURES FOR CLOSED-END MANAGEMENT INVESTMENT COMPANIES. |
Not applicable.
| ITEM 9. | SUBMISSION OF MATTERS TO A VOTE OF SECURITY HOLDERS. |
Not applicable.
| ITEM 10. | CONTROLS AND PROCEDURES. |
| | (a) | The registrant’s principal executive officer and principal financial officer have concluded that the registrant’s disclosure controls and procedures (as defined in Rule 30a- 3(c) under the Investment Company Act of 1940, as amended (the “1940 Act”)) are effective as of a date within 90 days of the filing date of this report that includes the disclosure required by this paragraph, based on their evaluation of the disclosure controls and procedures required by Rule 30a-3(b) under the 1940 Act and 15d-15(b) under the Securities Exchange Act of 1934. |
| | (b) | There were no changes in the registrant’s internal control over financial reporting (as defined in Rule 30a-3(d) under the 1940 Act) that occurred during the registrant’s last fiscal half-year (the registrant’s second fiscal half-year in the case of an annual report) that have materially affected, or are likely to materially affect the registrant’s internal control over financial reporting. |
| | (a) | Code of Ethics attached hereto. |
Exhibit 99.CODE ETH
| | |
| Exhibit 99.CERT | | Certifications pursuant to section 302 of the Sarbanes-Oxley Act of 2002 |
| |
| Exhibit 99.906CERT | | Certifications pursuant to Section 906 of the Sarbanes-Oxley Act of 2002 |
SIGNATURES
Pursuant to the requirements of the Securities Exchange Act of 1934 and the Investment Company Act of 1940, the registrant has duly caused this Report to be signed on its behalf by the undersigned, there unto duly authorized.
| | |
| Travelers Series Fund Inc. |
| |
| By: | | /s/ R. JAY GERKEN |
| | | R. Jay Gerken Chief Executive Officer of Travelers Series Fund Inc. |
| |
Date: | | January 7, 2005 |
Pursuant to the requirements of the Securities Exchange Act of 1934 and the Investment Company Act of 1940, this report has been signed below by the following persons on behalf of the registrant and in the capacities and on the dates indicated.
| | |
| |
| By: | | /s/ R. JAY GERKEN |
| | | (R. Jay Gerken) Chief Executive Officer of Travelers Series Fund Inc. |
| |
Date: | | January 7, 2005 |
| | |
| |
| By: | | /s/ JAMES M. GIALLANZA |
| | | (James M. Giallanza) Chief Financial Officer of Travelers Series Fund Inc. |
| |
Date: | | January 7, 2005 |