UNITED STATES
SECURITIES AND EXCHANGE COMMISSION
Washington, D.C. 20549
FORM N-CSR
CERTIFIED SHAREHOLDER REPORT OF REGISTERED
MANAGEMENT INVESTMENT COMPANIES
Investment Company Act file number 811-8372
Travelers Series Fund Inc.
(Exact name of registrant as specified in charter)
| | |
| 125 Broad Street, New York, NY | | 10004 |
|
| (Address of principal executive offices) | | (Zip code) |
Robert I. Frenkel, Esq.
Smith Barney Fund Management LLC
300 First Stamford Place
Stamford, CT 06902
(Name and address of agent for service)
Registrant’s telephone number, including area code: (800) 451-2010
Date of fiscal year end: October 31
Date of reporting period: April 30, 2005
| ITEM 1. | REPORT TO STOCKHOLDERS. |
| | The Semi-Annual Report to Stockholders is filed herewith. |
TRAVELERS SERIES FUND INC.
SMITH BARNEY
AGGRESSIVE GROWTH PORTFOLIO
SMITH BARNEY
MID CAP CORE PORTFOLIO
SEMI-ANNUAL REPORT | APRIL 30, 2005
NOT FDIC INSURED • NOT BANK GUARANTEED • MAY LOSE VALUE
WHAT’S INSIDE
LETTER FROM THE CHAIRMAN

R. JAY GERKEN, CFA
Chairman, President and Chief Executive Officer
Dear Shareholder,
Despite rising interest rates, climbing oil prices, geopolitical concerns and uncertainties surrounding the U.S. Presidential election, the U.S. economy continued to expand during the period. Following a robust 4.0% gain in the third quarter of 2004, gross domestic product (“GDP”)i growth was 3.8% in the fourth quarter. After the end of the Fund’s reporting period, the advance first quarter 2005 GDP figure was revised up to 3.5% from 3.1%.
Given the overall strength of the economy, the Federal Reserve Board (“Fed”)ii continued to raise interest rates over the period in an attempt to ward off inflation. Following three 25 basis pointiii rate hikes from June through September 2004, the Fed again increased its target for the federal funds rateiv in 0.25% increments four times during the reporting period. After the Fund’s reporting period had ended, at its May meeting, the Fed once again raised its fed funds target rate by 0.25% to 3.00%.
During the six months covered by this report, the U.S. stock market posted a modest gain, with the S&P 500 Indexv returning 3.28%. The reporting period began on a bright note, as the equity markets rallied sharply in November and December 2004. Investors were drawn to stocks as the uncertainty of the U.S. Presidential election ended and oil prices fell from their record highs. Thus far in 2005, the equity markets have been volatile. Equities were weak in January, rose in February and again fell in March and April. The market’s recent troubles have been attributed to mixed economic data, continued high oil prices, and rising interest rates.
Looking at the reporting period as a whole, the trend of value-oriented stocks outperforming their growth counterparts continued. In addition, mid- and large-cap stocks generally outperformed small-cap stocks during the period.
1 Travelers Series Fund Inc. | 2005 Semi-Annual Report
Within this environment, the Funds performed as follows:vi
PERFORMANCE OF THE FUNDS
AS OF APRIL 30, 2005
(unaudited)
| | | |
| | | 6 Months | |
| | | | |
Smith Barney Aggressive Growth Portfolio | | 1.19 | % |
| | | | |
Russell 3000 Growth Index | | 0.87 | % |
| | | | |
Lipper Variable Multi-Cap Growth Funds Category Average | | 1.53 | % |
| | | | |
Smith Barney Mid Cap Core Portfolio | | 1.37 | % |
| | | | |
S&P MidCap 400 Index | | 5.68 | % |
| | | | |
Lipper Variable Mid-Cap Core Funds Category Average | | 4.92 | % |
The performance shown represents past performance. Past performance is no guarantee of future results and current performance may be higher or lower than the performance shown above. Principal value and investment returns will fluctuate and investors’ shares, when redeemed, may be worth more or less than their original cost.
Fund returns assume the reinvestment of all distributions at net asset value and the deduction of all Fund expenses.
Lipper, Inc. is a major independent mutual-fund tracking organization. Returns are based on the six-month period ended April 30, 2005 and include the reinvestment of dividends and capital gains distributions, if any. Returns were calculated among the 113 funds in the variable multi-cap growth funds category. Returns were calculated among the 76 funds in the variable mid-cap core funds category.
Smith Barney Aggressive Growth Portfolio
Performance Updatevi
For the six months ended April 30, 2005, the Smith Barney Aggressive Growth Portfolio returned 1.19%. These shares outperformed the Fund’s unmanaged benchmark, the Russell 3000 Growth Index,vii which returned 0.87% for the same period. The Lipper Variable Multi-Cap Growth Funds Category Average1 was 1.53% for the same time frame.
Smith Barney Mid Cap Core Portfolio
Special Shareholder Notice
Effective May 11, 2005, a team of individuals employed by Smith Barney Fund Management LLC (the “Manager”) manages the day-to-day operations of the Fund. The members of the team are Brian M. Angerame, Derek J. Deutsch and Peter C. Stournaras.
| 1 | Lipper, Inc. is a major independent mutual-fund tracking organization. Returns are based on the 6-month period ended April 30, 2005, including the reinvestment of dividends and capital gains distributions, if any, calculated among the 113 funds in the Fund’s Lipper category, and excluding sales charges. |
2 Travelers Series Fund Inc. | 2005 Semi-Annual Report
Brian Angerame is a Director and Portfolio Manager for the manager with day-to-day responsibility for managing the Fund, including initiating buy/sell orders. He is sector manager with coverage of consumer discretionary, consumer staples, and industrials. He joined the manager in 2000. Mr. Angerame worked as a consumer analyst with Citigroup Asset Management (“CAM”) prior to assuming the role of portfolio manager. Prior to joining the manager, Mr. Angerame was a portfolio manager and analyst with Prudential Investment Management from 1997 to 2000.
Derek Deutsch is a Director and Portfolio Manager for the manager with day-to-day responsibility for managing the Fund, including initiating buy/sell orders and coordinating with research personnel. He is sector manager with coverage of healthcare and information technology. He joined CAM in 1999. Mr. Deutsch worked as a healthcare analyst with CAM prior to assuming the role of portfolio manager. Prior to joining the manager, Mr. Deutsch was a special assistant for the U.S. Department of Health and Human Services from 1994 to 1996.
Peter Stournaras is a Director and Portfolio Manager for the manager with day-to-day responsibility for managing the Fund, including initiating buy/sell orders and conducting quantitative analysis for the Fund. He joined CAM in 1998. Mr. Stournaras worked as the Head of Quantitative Equity Analysis on the Global Equities Platform of CAM prior to assuming the role of portfolio manager. Prior to joining the manager, Mr. Stournaras was a senior consultant with Deloitte and Touche LLP.
Performance Updatevi
For the six months ended April 30, 2005, the Smith Barney Mid Cap Core Portfolio returned 1.37%. The Fund underperformed the Lipper Variable Mid- Cap Core Funds Category Average2, which was 4.92% for the same period. The Fund’s unmanaged benchmark, the S&P MidCap 400 Index,viii returned 5.68% for the same time frame.
Information About Your Fund
As you may be aware, several issues in the mutual fund industry have recently come under the scrutiny of federal and state regulators. The Funds’ Adviser and some of its affiliates have received requests for information from various
| 2 | Lipper, Inc. is a major independent mutual-fund tracking organization. Returns are based on the 6-month period ended April 30, 2005, including the reinvestment of dividends and capital gains distributions, if any, calculated among the 76 funds in the Fund’s Lipper category, and excluding sales charges. |
3 Travelers Series Fund Inc. | 2005 Semi-Annual Report
government regulators regarding market timing, late trading, fees, and other mutual fund issues in connection with various investigations. The regulators appear to be examining, among other things, the Funds’ response to market timing and shareholder exchange activity, including compliance with prospectus disclosure related to these subjects. The Funds have been informed that the Adviser and its affiliates are responding to those information requests, but are not in a position to predict the outcome of these requests and investigations.
Important information concerning the Funds and their Adviser with regard to recent regulatory developments is contained in the “Additional Information” note in the Notes to the Financial Statements included in this report.
As always, thank you for your continued confidence in our stewardship of your assets. We look forward to helping you continue to meet your financial goals.
Sincerely,

R. Jay Gerken, CFA
Chairman, President and Chief Executive Officer
May 18, 2005
4 Travelers Series Fund Inc. | 2005 Semi-Annual Report
The information provided is not intended to be a forecast of future events, a guarantee of future results or investment advice. Views expressed may differ from those of the firm as a whole.
Portfolio holdings and breakdowns are as of April 30, 2005 and are subject to change. Please refer to pages 10 through 18 for a list and percentage breakdown of the Funds’ holdings.
RISKS:
Smith Barney Aggressive Growth Portfolio: The Fund may invest a significant portion of its assets in small- and mid-cap companies which may be more volatile than an investment that focuses only on large-cap companies. Please see the Fund’s prospectus for more information on these and other risks.
Smith Barney Mid Cap Core Portfolio: Mid-cap stocks may be more volatile than large-cap stocks. Additionally, the fund’s performance may be influenced by political, social and economic factors affecting investments in companies in foreign countries. The Fund may use derivatives, such as options and futures, which can be illiquid, may disproportionately increase losses, and have a potentially large impact on Fund performance. Please see the Fund’s prospectus for more information on these and other risks.
All index performance reflects no deduction for fees, expenses or taxes. Please note that an investor cannot invest directly in an index.
| i | Gross domestic product is a market value of goods and services produced by labor and property in a given country. |
| ii | The Federal Reserve Board is responsible for the formulation of a policy designed to promote economic growth, full employment, stable prices, and a sustainable pattern of international trade and payments. |
| iii | A basis point is one one-hundredth (1/100 or 0.01) of one percent. |
| iv | The federal funds rate is the interest rate that banks with excess reserves at a Federal Reserve district bank charge other banks that need overnight loans. |
| v | The S&P 500 Index is a market capitalization-weighted index of 500 widely held common stocks. |
| vi | The Funds are underlying investment options of various variable annuity and variable life insurance products. The Funds’ performance returns do not reflect the deduction of initial sales charges and expenses imposed in connection with investing in variable annuity or variable life insurance contracts, such as administrative fees, account charges, and surrender charges which, if reflected, would reduce the performance of the Funds. Past performance is no guarantee of future results. |
| vii | The Russell 3000 Growth Index measures the performance of those Russell 3000 Index companies with higher price-to-book ratios and higher forecasted growth values. |
| viii | The S&P MidCap 400 Index is a market-value weighted index which consists of 400 domestic stocks chosen for market size, liquidity, and industry group representation. |
5 Travelers Series Fund Inc. | 2005 Semi-Annual Report
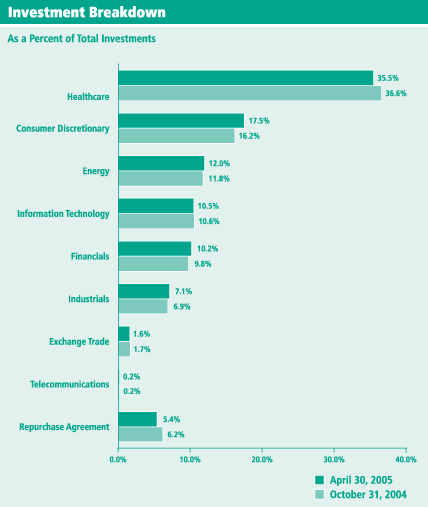
Smith Barney Aggressive Growth Portfolio
Fund at a Glance (unaudited)
6 Travelers Series Fund Inc. | 2005 Semi-Annual Report
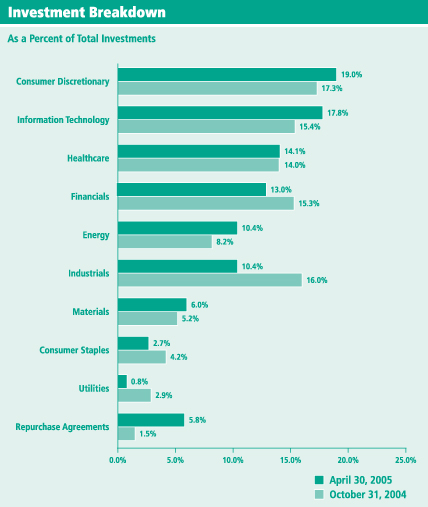
Smith Barney Mid Cap Core Portfolio
Fund at a Glance (unaudited)
7 Travelers Series Fund Inc. | 2005 Semi-Annual Report
Fund Expenses (unaudited)
As a shareholder of the Fund, you may incur two types of costs: (1) transaction costs and (2) ongoing costs, including management fees and other Fund expenses. This example is intended to help you understand your ongoing costs (in dollars) of investing in the Fund and to compare these costs with the ongoing costs of investing in other mutual funds.
This example is based on an investment of $1,000 invested on November 1, 2004 and held for the six months ended April 30, 2005.
Actual Expenses
The table below titled “Based on Actual Total Return” provides information about actual account values and actual expenses. You may use the information provided in this table, together with the amount you invested, to estimate the expenses that you paid over the period. To estimate the expenses you paid on your account, divide your ending account value by $1,000 (for example, an $8,600 ending account value divided by $1,000 = 8.6), then multiply the result by the number under the heading entitled “Expenses Paid During the Period”.
Based on Actual Total Return(1)
| | | | | | | | | | | | | | | |
| | | Actual
Total Return(2) | | | Beginning Account Value | | Ending Account Value | | Annualized Expense Ratio | | | Expenses Paid During the Period(3) |
Smith Barney Aggressive
Growth Portfolio | | 1.19 | % | | $ | 1,000.00 | | $ | 1,011.90 | | 0.82 | % | | $ | 4.09 |
|
Smith Barney Mid Cap
Core Portfolio | | 1.37 | % | | | 1,000.00 | | | 1,013.70 | | 0.83 | % | | | 4.14 |
|
| (1) | | For the six months ended April 30, 2005. |
| (2) | | Assumes reinvestment of dividends and capital gains distributions, if any, at net asset value. Total return is not annualized, as it may not be representative of the total return for the year. Total returns do not reflect expenses associated with the separate account such as administrative fees, account charges and surrender charges, which, if reflected, would reduce the total returns. Performance figures may reflect fee waivers and/or expense reimbursements. Past performance is no guarantee of future results. In the absence of fee waivers and/or expense reimbursements, the total return would have been lower. |
| (3) | | Expenses are equal to each Fund’s respective annualized expense ratio multiplied by the average account value over the period, multiplied by the number of days in the most recent fiscal half-year, then divided by 365. |
8 Travelers Series Fund Inc. | 2005 Semi-Annual Report
Fund Expenses (unaudited) (continued)
Hypothetical Example for Comparison Purposes
The table below titled “Based on Hypothetical Total Return” provides information about hypothetical account values and hypothetical expenses based on the actual expense ratio and an assumed rate of return of 5.00% per year before expenses, which is not the Fund’s actual return. The hypothetical account values and expenses may not be used to estimate the actual ending account balance or expenses you paid for the period. You may use the information provided in this table to compare the ongoing costs of investing in the Fund and other funds. To do so, compare the 5.00% hypothetical example relating to the Fund with the 5.00% hypothetical examples that appear in the shareholder reports of the other funds.
Please note that the expenses shown in the table below are meant to highlight your ongoing costs only and do not reflect any transactional costs. Therefore, the table is useful in comparing ongoing costs only, and will not help you determine the relative total costs of owning different funds. In addition, if these transaction costs were included, your costs would have been higher.
Based on Hypothetical Total Return(1)
| | | | | | | | | | | | | | | |
| | | Hypothetical Annualized Total Return | | | Beginning Account Value | | Ending Account Value | | Annualized Expense Ratio | | | Expenses Paid During the Period(2) |
Smith Barney Aggressive
Growth Portfolio | | 5.00 | % | | $ | 1,000.00 | | $ | 1,020.73 | | 0.82 | % | | $ | 4.11 |
|
Smith Barney Mid Cap
Core Portfolio | | 5.00 | | | | 1,000.00 | | | 1,020.68 | | 0.83 | | | | 4.16 |
|
| (1) | | For the six months ended April 30, 2005. |
| (2) | | Expenses are equal to each Fund’s respective annualized expense ratio multiplied by the average account value over the period, multiplied by the number of days in the most recent fiscal half-year, then divided by 365. |
9 Travelers Series Fund Inc. | 2005 Semi-Annual Report
| | |
| Schedules of Investments (unaudited) | | April 30, 2005 |
SMITH BARNEY AGGRESSIVE GROWTH PORTFOLIO
| | | | | |
| SHARES | | SECURITY | | VALUE |
| COMMON STOCK — 94.8% | | | |
| CONSUMER DISCRETIONARY — 17.6% | | | |
| Media — 17.4% | | | |
| 1,273,275 | | Cablevision Systems Corp., NY Group Class A Shares† | | $ | 33,041,486 |
| 132,842 | | Comcast Corp., Class A Shares† | | | 4,265,557 |
| 1,348,160 | | Comcast Corp., Special Class A Shares† | | | 42,777,117 |
| 2,215 | | DreamWorks Animation SKG, Inc., Class A Shares† | | | 83,062 |
| 2,013,400 | | Liberty Media Corp., Class A Shares† | | | 20,214,536 |
| 90,170 | | Liberty Media International, Inc., Class A Shares† | | | 3,739,350 |
| 1,829,367 | | Time Warner Inc.† | | | 30,751,659 |
| 332,699 | | Viacom Inc., Class B Shares | | | 11,518,039 |
| 675,000 | | The Walt Disney Co. | | | 17,820,000 |
| 34,600 | | World Wrestling Entertainment, Inc. | | | 369,874 |
|
| | | | | | 164,580,680 |
|
| Specialty Retail — 0.2% | | | |
| 215,000 | | Charming Shoppes, Inc.† | | | 1,599,600 |
|
| | | TOTAL CONSUMER DISCRETIONARY | | | 166,180,280 |
|
| ENERGY — 12.0% | | | |
| Energy Equipment & Services — 5.9% | | | |
| 165,800 | | Core Laboratories N.V.† | | | 3,912,880 |
| 580,650 | | Grant Prideco, Inc.† | | | 12,861,398 |
| 745,450 | | Weatherford International Ltd.† | | | 38,875,217 |
|
| | | | | | 55,649,495 |
|
| Oil & Gas — 6.1% | | | |
| 795,800 | | Anadarko Petroleum Corp. | | | 58,125,232 |
| 6,325 | | Bill Barret Corp.† | | | 168,498 |
|
| | | | | | 58,293,730 |
|
| | | TOTAL ENERGY | | | 113,943,225 |
|
| EXCHANGE TRADED — 1.6% | | | |
| 432,000 | | Nasdaq-100 Index Tracking Stock | | | 15,115,680 |
|
| FINANCIALS — 10.2% | | | |
| Banks — 0.8% | | | |
| 49,500 | | Astoria Financial Corp. | | | 1,312,245 |
| 361,566 | | New York Community Bancorp, Inc. | | | 6,399,718 |
|
| | | | | | 7,711,963 |
|
| Diversified Financials — 9.4% | | | |
| 83,725 | | CIT Group Inc. | | | 3,372,443 |
| 117,500 | | Cohen & Steers, Inc. | | | 1,991,625 |
| 7,300 | | Greenhill & Co., Inc. | | | 229,950 |
| 612,842 | | Lehman Brothers Holdings Inc. | | | 56,209,868 |
See Notes to Financial Statements.
10 Travelers Series Fund Inc. | 2005 Semi-Annual Report
| | |
| Schedules of Investments (unaudited) (continued) | | April 30, 2005 |
SMITH BARNEY AGGRESSIVE GROWTH PORTFOLIO
| | | | | |
| SHARES | | SECURITY | | VALUE |
| Diversified Financials — 9.4% (continued) |
| 500,400 | | Merrill Lynch & Co., Inc. | | $ | 26,986,572 |
| 2,415 | | National Financial Partners Corp. | | | 92,350 |
|
| | | | | | 88,882,808 |
|
| | | TOTAL FINANCIALS | | | 96,594,771 |
|
| HEALTHCARE — 35.6% | | | |
| Biotechnology — 19.4% | | | |
| 1,400 | | Albany Molecular Research, Inc.† | | | 13,209 |
| 162,500 | | Alkermes, Inc.† | | | 1,828,125 |
| 740,105 | | Amgen Inc.† | | | 43,081,512 |
| 783,806 | | Biogen Idec Inc.† | | | 28,405,129 |
| 110,150 | | CancerVax Corp.† | | | 301,811 |
| 844,850 | | Chiron Corp.† | | | 28,851,627 |
| 101,900 | | Genentech, Inc.† | | | 7,228,786 |
| 795,168 | | Genzyme Corp.† | | | 46,604,796 |
| 541,275 | | ImClone Systems Inc.† | | | 17,239,609 |
| 224,750 | | Isis Pharmaceuticals, Inc.† | | | 651,775 |
| 766,905 | | Millennium Pharmaceuticals, Inc.† | | | 6,718,088 |
| 2,300 | | Nabi Biopharmaceuticals† | | | 25,070 |
| 173,000 | | Nanogen, Inc.† | | | 460,180 |
| 265,400 | | Vertex Pharmaceuticals Inc.† | | | 2,531,916 |
| 29,445 | | ViaCell, Inc.† | | | 195,809 |
|
| | | | | | 184,137,442 |
|
| Healthcare Equipment & Supplies — 0.6% | | | |
| 92,100 | | Biosite Inc.† | | | 5,249,700 |
| 5,400 | | Cygnus, Inc.† | | | 729 |
|
| | | | | | 5,250,429 |
|
| Healthcare Providers & Services — 8.3% | | | |
| 836,000 | | UnitedHealth Group Inc. | | | 79,010,360 |
|
| Pharmaceuticals — 7.3% | | | |
| 998,800 | | Forest Laboratories, Inc.† | | | 35,637,184 |
| 243,448 | | Johnson & Johnson | | | 16,707,836 |
| 635,666 | | King Pharmaceuticals, Inc.† | | | 5,085,328 |
| 75,289 | | Pfizer Inc. | | | 2,045,602 |
| 78,576 | | Teva Pharmaceutical Industries Ltd., Sponsored ADR | | | 2,454,714 |
| 323,000 | | Valeant Pharmaceuticals International | | | 6,702,250 |
|
| | | | | | 68,632,914 |
|
| | | TOTAL HEALTHCARE | | | 337,031,145 |
|
| INDUSTRIALS — 7.1% | | | |
| Aerospace & Defense — 2.8% | | | |
| 378,800 | | L-3 Communications Holdings, Inc. | | | 26,883,436 |
|
See Notes to Financial Statements.
11 Travelers Series Fund Inc. | 2005 Semi-Annual Report
| | |
| Schedules of Investments (unaudited) (continued) | | April 30, 2005 |
SMITH BARNEY AGGRESSIVE GROWTH PORTFOLIO
| | | | | |
| SHARES | | SECURITY | | VALUE |
| Commercial Services & Supplies — 0.0% | | | |
| 2,995 | | Cogent Inc.† | | $ | 67,388 |
|
| Industrial Conglomerates — 3.4% | | | |
| 1,033,412 | | Tyco International Ltd. | | | 32,356,130 |
|
| Machinery — 0.9% | | | |
| 308,000 | | Pall Corp. | | | 8,263,640 |
|
| | | TOTAL INDUSTRIALS | | | 67,570,594 |
|
| INFORMATION TECHNOLOGY — 10.5% | | | |
| Communications Equipment — 2.7% | | | |
| 186,100 | | C-COR Inc.† | | | 1,230,121 |
| 25,000 | | CEVA, Inc.† | | | 166,750 |
| 133,000 | | DSP Group, Inc.† | | | 3,205,300 |
| 890,500 | | Motorola, Inc. | | | 13,660,270 |
| 448,325 | | Nokia Oyj, Sponsored ADR | | | 7,164,234 |
|
| | | | | | 25,426,675 |
|
| Computers & Peripherals — 1.3% | | | |
| 876,076 | | Maxtor Corp.† | | | 4,248,969 |
| 242,000 | | Quantum Corp.† | | | 580,800 |
| 335,000 | | SanDisk Corp.† | | | 7,939,500 |
|
| | | | | | 12,769,269 |
|
| Electronic Equipment & Instruments — 0.9% | | | |
| 280,000 | | Broadcom Corp., Class A Shares† | | | 8,374,800 |
| 12,400 | | Excel Technology, Inc.† | | | 260,276 |
|
| | | | | | 8,635,076 |
|
| Semiconductor Equipment & Products — 4.2% | | | |
| 125,000 | | Cabot Microelectronics Corp.† | | | 3,598,750 |
| 229,000 | | Cirrus Logic, Inc.† | | | 966,380 |
| 133,000 | | Cree, Inc.† | | | 3,217,270 |
| 98,324 | | Freescale Semiconductor Inc., Class B Shares† | | | 1,854,391 |
| 358,334 | | Intel Corp. | | | 8,428,016 |
| 1,617,300 | | Micron Technology, Inc.† | | | 15,703,983 |
| 543,000 | | RF Micro Devices, Inc.† | | | 2,128,560 |
| 10,300 | | Standard Microsystems Corp.† | | | 145,745 |
| 343,091 | | Teradyne, Inc.† | | | 3,780,863 |
|
| | | | | | 39,823,958 |
|
| Software — 1.4% | | | |
| 106,000 | | Advent Software, Inc.† | | | 1,891,040 |
| 230,000 | | Autodesk, Inc. | | | 7,320,900 |
| 72,264 | | Microsoft Corp. | | | 1,828,279 |
See Notes to Financial Statements.
12 Travelers Series Fund Inc. | 2005 Semi-Annual Report
| | |
| Schedules of Investments (unaudited) (continued) | | April 30, 2005 |
SMITH BARNEY AGGRESSIVE GROWTH PORTFOLIO
| | | | | | |
| SHARES | | SECURITY | | VALUE | |
| Software — 1.4% (continued) | | | | |
| 105,000 | | RSA Security Inc.† | | $ | 1,127,700 | |
| 75,000 | | Verity, Inc.† | | | 615,000 | |
|
|
| | | | | | 12,782,919 | |
|
|
| | | TOTAL INFORMATION TECHNOLOGY | | | 99,437,897 | |
|
|
| TELECOMMUNICATION SERVICES — 0.2% | | | | |
| Diversified Telecommunication Services — 0.2% | | | | |
| 82,000 | | AT&T Corp. | | | 1,568,660 | |
|
|
| | | TOTAL COMMON STOCK
(Cost — $916,117,822) | | | 897,442,252 | |
|
|
| | |
FACE
AMOUNT | | | | | |
| REPURCHASE AGREEMENT — 5.4% | | | | |
| $51,125,000 | | Interest in $398,063,000 joint tri-party repurchase agreement dated 4/29/05 with Goldman Sachs & Co., 2.940% due 5/2/05; Proceeds at maturity — $51,137,526; (Fully collateralized by various U.S. Treasury Obligations 1.250% to 12.750% due 5/31/05 to 11/15/24;
Market value — $52,147,617) (Cost — $51,125,000) | | | 51,125,000 | |
|
|
| | | TOTAL INVESTMENTS — 100.2% (Cost — $967,242,822*) | | | 948,567,252 | |
| | | Liabilities in Excess of Other Assets — (0.2)% | | | (1,439,278 | ) |
|
|
| | | TOTAL NET ASSETS — 100.0% | | $ | 947,127,974 | |
|
|
| † | | Non-income producing security. |
| * | | Aggregate cost for federal income tax purposes is substantially the same. |
|
Abbreviation used in this schedule:
|
| ADR — American Depositary Receipt |
See Notes to Financial Statements.
13 Travelers Series Fund Inc. | 2005 Semi-Annual Report
| | |
| Schedules of Investments (unaudited) (continued) | | April 30, 2005 |
SMITH BARNEY MID CAP CORE PORTFOLIO
| | | | | |
| SHARES | | SECURITY | | VALUE |
| COMMON STOCK — 94.8% | | | |
| CONSUMER DISCRETIONARY — 19.1% | | | |
| Hotels, Restaurants & Leisure — 1.9% | | | |
| 22,650 | | Aztar Corp. (a) | | $ | 618,571 |
| 37,700 | | GTECH Holdings Corp. | | | 922,519 |
| 14,865 | | IHOP Corp. | | | 607,978 |
|
| | | | | | 2,149,068 |
|
| Household Durables — 3.8% | | | |
| 35,733 | | D.R. Horton, Inc. | | | 1,089,856 |
| 52,425 | | The Ryland Group, Inc. | | | 3,218,895 |
|
| | | | | | 4,308,751 |
|
| Leisure Equipment & Products — 1.0% | | | |
| 58,995 | | Marvel Enterprises, Inc. (a) | | | 1,156,302 |
|
| Media — 6.3% | | | |
| 47,005 | | DreamWorks Animation SKG, Inc., Class A Shares (a) | | | 1,762,687 |
| 68,705 | | Harte-Hanks, Inc. | | | 1,958,092 |
| 57,700 | | Lions Gate Entertainment Corp. | | | 557,382 |
| 101,300 | | Sirius Satellite Radio Inc. (a) | | | 482,188 |
| 663 | | The Washington Post Co., Class B Shares | | | 572,998 |
| 62,425 | | XM Satellite Radio Holdings Inc., Class A Shares (a) | | | 1,731,670 |
|
| | | | | | 7,065,017 |
|
| Multi-Line Retail — 0.5% | | | |
| 27,600 | | Dollar General Corp. | | | 561,660 |
|
| Specialty Retail — 5.6% | | | |
| 47,800 | | Bed Bath & Beyond Inc. (a) | | | 1,778,638 |
| 20,380 | | CDW Corp. | | | 1,114,582 |
| 73,565 | | PETsMART, Inc. | | | 1,960,507 |
| 9,025 | | Urban Outfitters, Inc. (a) | | | 399,807 |
| 30,880 | | Williams-Sonoma, Inc. (a) | | | 1,034,171 |
|
| | | | | | 6,287,705 |
|
| | | TOTAL CONSUMER DISCRETIONARY | | | 21,528,503 |
|
| CONSUMER STAPLES — 2.7% | | | |
| Food Products — 1.8% | | | |
| 63,420 | | Hormel Foods Corp. | | | 1,974,899 |
|
| Personal Products — 0.9% | | | |
| 24,027 | | Alberto-Culver Co. | | | 1,069,201 |
|
| | | TOTAL CONSUMER STAPLES | | | 3,044,100 |
|
See Notes to Financial Statements.
14 Travelers Series Fund Inc. | 2005 Semi-Annual Report
| | |
| Schedules of Investments (unaudited) (continued) | | April 30, 2005 |
SMITH BARNEY MID CAP CORE PORTFOLIO
| | | | | |
| SHARES | | SECURITY | | VALUE |
| ENERGY — 10.5% | | | |
| Energy Equipment & Services — 5.8% | | | |
| 12,000 | | Diamond Offshore Drilling, Inc. | | $ | 529,320 |
| 48,555 | | GlobalSantaFe Corp. | | | 1,631,448 |
| 21,345 | | Nabors Industries, Ltd. (a) | | | 1,149,855 |
| 23,370 | | Smith International, Inc. | | | 1,359,667 |
| 35,275 | | Weatherford International Ltd. (a) | | | 1,839,591 |
|
| | | | | | 6,509,881 |
|
| Oil & Gas — 4.7% | | | |
| 27,095 | | Murphy Oil Corp. | | | 2,413,894 |
| 24,705 | | Newfield Exploration Co. (a) | | | 1,754,796 |
| 22,680 | | Nexen Inc. | | | 1,082,970 |
|
| | | | | | 5,251,660 |
|
| | | TOTAL ENERGY | | | 11,761,541 |
|
| FINANCIALS — 13.0% | | | |
| Banks — 4.2% | | | |
| 36,475 | | Brookline Bancorp, Inc. | | | 547,125 |
| 10,420 | | Comerica Inc. | | | 596,649 |
| 60,890 | | North Fork Bancorp., Inc. | | | 1,714,053 |
| 26,825 | | Zions Bancorp. | | | 1,878,555 |
|
| | | | | | 4,736,382 |
|
| Diversified Financials — 5.1% | | | |
| 8,685 | | The Bear Stearns Cos. Inc. | | | 822,122 |
| 35,072 | | Legg Mason, Inc. | | | 2,485,202 |
| 49,345 | | National Financial Partners Corp. | | | 1,886,953 |
| 18,000 | | Nelnet, Inc., Class A Shares (a) | | | 573,300 |
|
| | | | | | 5,767,577 |
|
| Insurance — 3.7% | | | |
| 8,520 | | Ambac Financial Group, Inc. | | | 569,562 |
| 21,300 | | Fidelity National Financial, Inc. | | | 683,943 |
| 23,590 | | PartnerRe Ltd. | | | 1,374,825 |
| 46,339 | | Willis Group Holdings Ltd. | | | 1,550,040 |
|
| | | | | | 4,178,370 |
|
| | | TOTAL FINANCIALS | | | 14,682,329 |
|
| HEALTHCARE — 14.2% | | | |
| Biotechnology — 2.3% | | | |
| 54,240 | | Gilead Sciences, Inc. (a) | | | 2,012,304 |
| 11,705 | | OSI Pharmaceuticals, Inc. (a) | | | 554,056 |
|
| | | | | | 2,566,360 |
|
See Notes to Financial Statements.
15 Travelers Series Fund Inc. | 2005 Semi-Annual Report
| | |
| Schedules of Investments (unaudited) (continued) | | April 30, 2005 |
SMITH BARNEY MID CAP CORE PORTFOLIO
| | | | | |
| SHARES | | SECURITY | | VALUE |
| Healthcare Equipment & Supplies — 5.9% | | | |
| 50,100 | | Cytyc Corp. (a) | | $ | 1,067,631 |
| 39,505 | | DENTSPLY International Inc. | | | 2,159,343 |
| 14,455 | | Fisher Scientific International Inc. (a) | | | 858,338 |
| 22,425 | | Kyphon Inc. (a) | | | 586,414 |
| 57,905 | | Varian Medical Systems, Inc. (a) | | | 1,953,715 |
|
| | | | | | 6,625,441 |
|
| Healthcare Providers & Services — 4.0% | | | |
| 19,200 | | American Healthways, Inc. (a) | | | 717,120 |
| 28,915 | | DaVita Inc. (a) | | | 1,165,275 |
| 13,745 | | PacifiCare Health Systems, Inc. (a) | | | 821,401 |
| 28,520 | | Sierra Health Services, Inc. (a) | | | 1,844,959 |
|
| | | | | | 4,548,755 |
|
| Pharmaceuticals — 2.0% | | | |
| 60,085 | | Medicis Pharmaceutical Corp., Class A Shares | | | 1,688,389 |
| 42,545 | | NPS Pharmaceuticals, Inc. (a) | | | 516,922 |
|
| | | | | | 2,205,311 |
|
| | | TOTAL HEALTHCARE | | | 15,945,867 |
|
| INDUSTRIALS — 10.5% | | | |
| Aerospace & Defense — 2.4% | | | |
| 29,785 | | Alliant Techsystems Inc. (a) | | | 2,060,526 |
| 8,300 | | L-3 Communications Holdings, Inc. | | | 589,051 |
|
| | | | | | 2,649,577 |
|
| Building Products — 1.6% | | | |
| 41,400 | | American Standard Cos. Inc. (a) | | | 1,850,994 |
|
| Commercial Services & Supplies — 2.8% | | | |
| 22,055 | | DST Systems, Inc. (a) | | | 1,001,297 |
| 37,375 | | Korn/Ferry International (a) | | | 538,200 |
| 35,415 | | Laureate Education, Inc. (a) | | | 1,573,134 |
|
| | | | | | 3,112,631 |
|
| Electrical Equipment — 0.7% | | | |
| 15,985 | | Rockwell Automation, Inc. | | | 738,987 |
|
| Road & Rail — 2.1% | | | |
| 17,555 | | C.H. Robinson Worldwide, Inc. | | | 905,838 |
| 31,287 | | Heartland Express, Inc. | | | 580,061 |
| 18,410 | | Yellow Roadway Corp. (a) | | | 902,090 |
|
| | | | | | 2,387,989 |
|
| Trading Companies & Distributors — 0.9% | | | |
| 19,196 | | Fastenal Co. | | | 1,028,138 |
|
| | | TOTAL INDUSTRIALS | | | 11,768,316 |
|
See Notes to Financial Statements.
16 Travelers Series Fund Inc. | 2005 Semi-Annual Report
| | |
| Schedules of Investments (unaudited) (continued) | | April 30, 2005 |
SMITH BARNEY MID CAP CORE PORTFOLIO
| | | | | |
| SHARES | | SECURITY | | VALUE |
| INFORMATION TECHNOLOGY — 17.9% | | | |
| Communications Equipment — 1.1% | | | |
| 15,900 | | Harris Corp. | | $ | 448,380 |
| 34,195 | | Juniper Networks, Inc. (a) | | | 772,465 |
|
| | | | | | 1,220,845 |
|
| Computers & Peripherals — 0.8% | | | |
| 40,220 | | NVIDIA Corp. (a) | | | 882,427 |
|
| Electronic Equipment & Instruments — 5.1% | | | |
| 41,695 | | Diebold, Inc. | | | 2,016,787 |
| 30,255 | | Roper Industries, Inc. | | | 2,047,356 |
| 66,785 | | Thermo Electron Corp. (a) | | | 1,668,289 |
|
| | | | | | 5,732,432 |
|
| Internet Software & Services — 0.5% | | | |
| 57,200 | | CNET Networks, Inc. | | | 567,138 |
|
| IT Consulting & Services — 1.7% | | | |
| 98,200 | | Acxiom Corp. | | | 1,865,800 |
|
| Office Electronics — 0.8% | | | |
| 19,975 | | Zebra Technologies Corp., Class A Shares (a) | | | 954,006 |
|
| Semiconductor Equipment & Products — 1.8% | | | |
| 46,390 | | Linear Technology Corp. | | | 1,657,979 |
| 17,125 | | National Semiconductor Corp. | | | 326,745 |
|
| | | | | | 1,984,724 |
|
| Software — 6.1% | | | |
| 57,166 | | Activision, Inc. (a) | | | 826,620 |
| 62,550 | | Amdocs Ltd. (a) | | | 1,670,711 |
| 66,035 | | Mercury Interactive Corp. (a) | | | 2,729,227 |
| 143,175 | | Quest Software, Inc. (a) | | | 1,698,055 |
|
| | | | | | 6,924,613 |
|
| | | TOTAL INFORMATION TECHNOLOGY | | | 20,131,985 |
|
| MATERIALS — 6.1% | | | |
| Chemicals — 3.2% | | | |
| 30,150 | | Air Products & Chemicals, Inc. | | | 1,770,710 |
| 38,800 | | Cytec Industries Inc. | | | 1,789,456 |
|
| | | | | | 3,560,166 |
|
| Metals & Mining — 2.9% | | | |
| 19,700 | | Arch Coal, Inc. | | | 873,498 |
| 32,140 | | Compass Minerals International Inc. | | | 776,181 |
| 115,990 | | Glamis Gold Ltd. (a) | | | 1,593,703 |
|
| | | | | | 3,243,382 |
|
| | | TOTAL MATERIALS | | | 6,803,548 |
|
See Notes to Financial Statements.
17 Travelers Series Fund Inc. | 2005 Semi-Annual Report
| | |
| Schedules of Investments (unaudited) (continued) | | April 30, 2005 |
SMITH BARNEY MID CAP CORE PORTFOLIO
| | | | | | |
| SHARES | | SECURITY | | VALUE | |
| UTILITIES — 0.8% | | | | |
| Water Utilities — 0.8% | | | | |
| 34,486 | | Aqua America, Inc. | | $ | 920,776 | |
|
|
| | | TOTAL COMMON STOCK
(Cost — $95,903,249) | | | 106,586,965 | |
|
|
| | |
FACE
AMOUNT | | | | | |
| REPURCHASE AGREEMENTS — 5.8% | | | | |
| $2,534,000 | | Interest in $398,063,000 joint tri-party repurchase agreement dated 4/29/05 with Goldman Sachs & Co., 2.940% due 5/2/05; Proceeds at maturity — $2,534,621 (Fully collateralized by U.S. Treasury Obligations, 1.250% to 12.750% due 5/31/05 to 11/15/24;
Market value — $2,584,686) | | | 2,534,000 | |
| 4,000,000 | | Interest in $850,128,000 joint tri-party repurchase agreement dated 4/29/05 with UBS Securities LLC, 2.950% due 5/2/05; Proceeds at maturity — $4,000,983 (Fully collateralized by various U.S. government issues, 0.000% to 8.875% due 5/26/05 to 8/6/38; Market value — $4,080,017) | | | 4,000,000 | |
|
|
| | | TOTAL REPURCHASE AGREEMENTS
(Cost — $6,534,000) | | | 6,534,000 | |
|
|
| | | TOTAL INVESTMENTS — 100.6% (Cost — $102,437,249*) | | | 113,120,965 | |
| | | Liabilities in Excess of Other Assets — (0.6)% | | | (656,636 | ) |
|
|
| | | TOTAL NET ASSETS — 100.0% | | $ | 112,464,329 | |
|
|
| (a) | | Non-income producing security. |
| * | | Aggregate cost for federal income tax purposes is substantially the same. |
See Notes to Financial Statements.
18 �� Travelers Series Fund Inc. | 2005 Semi-Annual Report
| | |
| Statements of Assets and Liabilities (unaudited) | | April 30, 2005 |
| | | | | | | | |
| | | Smith Barney Aggressive Growth
Portfolio | | | Smith Barney Mid Cap Core
Portfolio | |
| ASSETS: | | | | | | | | |
Investments, at value (Cost — $967,242,822 and $102,437,249, respectively) | | $ | 948,567,252 | | | $ | 113,120,965 | |
Cash | | | 830 | | | | 909 | |
Dividends and interest receivable | | | 415,243 | | | | 52,489 | |
Receivable for Fund shares sold | | | 6,202 | | | | 45 | |
Prepaid expenses | | | 4,367 | | | | 188 | |
|
|
Total Assets | | | 948,993,894 | | | | 113,174,596 | |
|
|
| LIABILITIES: | | | | | | | | |
Payable for Fund shares reacquired | | | 1,177,808 | | | | 57,271 | |
Management fees payable | | | 635,875 | | | | 70,924 | |
Payable for securities purchased | | | — | | | | 554,657 | |
Transfer agency services payable | | | 835 | | | | 828 | |
Directors’ fees payable | | | 430 | | | | 428 | |
Accrued expenses | | | 50,972 | | | | 26,159 | |
|
|
Total Liabilities | | | 1,865,920 | | | | 710,267 | |
|
|
Total Net Assets | | $ | 947,127,974 | | | $ | 112,464,329 | |
|
|
| NET ASSETS: | | | | | | | | |
Par value of capital shares (Note 4) | | $ | 768 | | | $ | 84 | |
Capital paid in excess of par value | | | 968,017,930 | | | | 101,874,961 | |
Accumulated net investment loss | | | (913,636 | ) | | | — | |
Undistributed net investment income | | | — | | | | 219,732 | |
Accumulated net realized loss from investment transactions
and futures contracts | | | (1,301,518 | ) | | | (314,164 | ) |
Net unrealized appreciation (depreciation) of investments | | | (18,675,570 | ) | | | 10,683,716 | |
|
|
Total Net Assets | | $ | 947,127,974 | | | $ | 112,464,329 | |
|
|
Shares Outstanding | | | 76,768,091 | | | | 8,440,578 | |
|
|
Net Asset Value | | | $12.34 | | | | $13.32 | |
|
|
See Notes to Financial Statements.
19 Travelers Series Fund Inc. | 2005 Semi-Annual Report
| | |
| Statements of Operations (unaudited) | | |
For the Six Months Ended April 30, 2005
| | | | | | | | |
| | | Smith Barney Aggressive
Growth Portfolio | | | Smith Barney Mid Cap Core
Portfolio | |
| INVESTMENT INCOME: | | | | | | | | |
Dividends | | $ | 2,435,533 | | | $ | 676,284 | |
Interest | | | 683,873 | | | | 26,067 | |
Less: Foreign withholding tax | | | (32,064 | ) | | | (441 | ) |
|
|
Total Investment Income | | | 3,087,342 | | | | 701,910 | |
|
|
| EXPENSES: | | | | | | | | |
Management fees (Note 2) | | | 3,896,949 | | | | 435,767 | |
Custody | | | 25,886 | | | | 15,158 | |
Shareholder communications | | | 24,751 | | | | 7,448 | |
Audit and legal | | | 23,800 | | | | 15,000 | |
Directors�� fees | | | 12,785 | | | | 3,038 | |
Transfer agency services (Note 2) | | | 2,506 | | | | 2,496 | |
Other | | | 14,301 | | | | 3,271 | |
|
|
Total Expenses | | | 4,000,978 | | | | 482,178 | |
|
|
Net Investment Income (Loss) | | | (913,636 | ) | | | 219,732 | |
|
|
| REALIZED AND UNREALIZED GAIN (LOSS) ON INVESTMENTS AND FUTURES CONTRACTS (NOTES 1 AND 3): | | | | | | | | |
Realized Gain (Loss) From: | | | | | | | | |
Investment transactions | | | 19,944 | | | | 3,807,795 | |
Futures contracts | | | — | | | | (37,023 | ) |
|
|
Net Realized Gain | | | 19,944 | | | | 3,770,772 | |
|
|
Net Change in Unrealized Appreciation/Depreciation of Investments | | | 10,678,251 | | | | (2,437,208 | ) |
|
|
Net Gain on Investments and Futures Contracts | | | 10,698,195 | | | | 1,333,564 | |
|
|
Increase in Net Assets From Operations | | $ | 9,784,559 | | | $ | 1,553,296 | |
|
|
See Notes to Financial Statements.
20 Travelers Series Fund Inc. | 2005 Semi-Annual Report
| | |
| Statements of Changes in Net Assets | | |
For the Six Months Ended April 30, 2005 (unaudited)
and the Year Ended October 31, 2004
| | | | | | | | |
| Smith Barney Aggressive Growth Portfolio | | 2005 | | | 2004 | |
| OPERATIONS: | | | | | | | | |
Net investment loss | | $ | (913,636 | ) | | $ | (3,509,889 | ) |
Net realized gain | | | 19,944 | | | | 8,592,603 | |
Net change in unrealized appreciation/depreciation | | | 10,678,251 | | | | 39,469,472 | |
|
|
Increase in Net Assets From Operations | | | 9,784,559 | | | | 44,552,186 | |
|
|
| DISTRIBUTIONS TO SHAREHOLDERS FROM: | | | | | | | | |
Net realized gains | | | (3,756,228 | ) | | | — | |
|
|
Decrease in Net Assets From
Distributions to Shareholders | | | (3,756,228 | ) | | | — | |
|
|
| FUND SHARE TRANSACTIONS (NOTE 4): | | | | | | | | |
Net proceeds from sale of shares | | | 41,193,817 | | | | 270,425,936 | |
Net asset value of shares issued for reinvestment of distributions | | | 3,756,228 | | | | — | |
Cost of shares reacquired | | | (24,188,667 | ) | | | (18,523,736 | ) |
|
|
Increase in Net Assets From Fund Share Transactions | | | 20,761,378 | | | | 251,902,200 | |
|
|
Increase in Net Assets | | | 26,789,709 | | | | 296,454,386 | |
| NET ASSETS: | | | | | | | | |
Beginning of period | | | 920,338,265 | | | | 623,883,879 | |
|
|
End of period* | | $ | 947,127,974 | | | $ | 920,338,265 | |
|
|
* Includes accumulated net investment loss of: | | | $(913,636) | | | | — | |
|
|
See Notes to Financial Statements.
21 Travelers Series Fund Inc. | 2005 Semi-Annual Report
| | |
| Statements of Changes in Net Assets (continued) | | |
For the Six Months Ended April 30, 2005 (unaudited)
and the Year Ended October 31, 2004
| | | | | | | | |
| Smith Barney Mid Cap Core Portfolio | | 2005 | | | 2004 | |
| OPERATIONS: | | | | | | | | |
Net investment income (loss) | | $ | 219,732 | | | $ | (60,762 | ) |
Net realized gain | | | 3,770,772 | | | | 4,898,860 | |
Net change in unrealized appreciation/depreciation | | | (2,437,208 | ) | | | 1,012,508 | |
|
|
Increase in Net Assets From Operations | | | 1,553,296 | | | | 5,850,606 | |
|
|
| FUND SHARE TRANSACTIONS (NOTE 4): | | | | | | | | |
Net proceeds from sale of shares | | | 5,286,996 | | | | 22,456,449 | |
Cost of shares reacquired | | | (4,608,424 | ) | | | (4,932,940 | ) |
|
|
Increase in Net Assets From Fund Share Transactions | | | 678,572 | | | | 17,523,509 | |
|
|
Increase in Net Assets | | | 2,231,868 | | | | 23,374,115 | |
| NET ASSETS: | | | | | | | | |
Beginning of period | | | 110,232,461 | | | | 86,858,346 | |
|
|
End of period* | | $ | 112,464,329 | | | $ | 110,232,461 | |
|
|
* Includes undistributed net investment income of: | | | $219,732 | | | | — | |
|
|
See Notes to Financial Statements.
22 Travelers Series Fund Inc. | 2005 Semi-Annual Report
For a share of capital stock outstanding throughout the year or period ended October 31, unless otherwise noted:
| | | | | | | | | | | | | | | | | | | |
Smith Barney
Aggressive Growth
Portfolio | | 2005(1) | | | 2004 | | | 2003 | | | 2002 | | | 2001 | | | 2000(2) | |
Net Asset Value, Beginning of Period | | $12.24 | | | $11.43 | | | $ 9.09 | | | | $12.32 | | | $15.03 | | | $10.00 | |
|
|
Income (Loss) From Operations: | | | | | | | | | | | | | | | | | | | |
Net investment loss | | (0.01 | ) | | (0.05 | ) | | (0.04 | ) | | | (0.05 | ) | | (0.05 | ) | | (0.03 | ) |
Net realized and unrealized gain (loss) | | 0.16 | | | 0.86 | | | 2.38 | | | | (3.18 | ) | | (2.66 | ) | | 5.07 | |
|
|
Total Income (Loss) From Operations | | 0.15 | | | 0.81 | | | 2.34 | | | | (3.23 | ) | | (2.71 | ) | | 5.04 | |
|
|
Less Distributions From: | | | | | | | | | | | | | | | | | | | |
Net realized gain | | (0.05 | ) | | — | | | — | | | | — | | | — | | | — | |
Capital | | — | | | — | | | — | | | | — | | | — | | | (0.01 | ) |
|
|
Total Distributions | | (0.05 | ) | | — | | | — | | | | — | | | — | | | (0.01 | ) |
|
|
Net Asset Value,
End of Period | | $12.34 | | | $12.24 | | | $11.43 | | | | $ 9.09 | | | $12.32 | | | $15.03 | |
|
|
Total Return(3) | | 1.19 | %‡ | | 7.09 | % | | 25.74 | % | | | (26.22 | )% | | (18.03 | )% | | 50.41 | % |
|
|
Net Assets, End of Period (000s) | | $947,128 | | | $920,338 | | | $623,884 | | | | $415,215 | | | $366,294 | | | $164,553 | |
|
|
Ratios to Average
Net Assets: | | | | | | | | | | | | | | | | | | | |
Expenses(4) | | 0.82 | %† | | 0.82 | %(5) | | 0.82 | % | | | 0.83 | % | | 0.84 | % | | 0.99 | % |
Net investment loss | | (0.19 | )† | | (0.44 | ) | | (0.49 | ) | | | (0.50 | ) | | (0.40 | ) | | (0.21 | ) |
|
|
Portfolio Turnover Rate | | 0 | %* | | 4 | % | | 0 | %* | | | 9 | % | | 3 | % | | 0 | %* |
|
|
| (1) | | For the six months ended April 30, 2005 (unaudited). |
| (2) | | Per share amounts have been calculated using the monthly average shares method. |
| (3) | | Performance figures may reflect fee waivers and/or expense reimbursements. Past performance is no guarantee of future results. In the absence of fee waivers and/or expense reimbursements, the total return would be lower. Total returns do not reflect expenses associated with the separate account such as administrative fees, account charges and surrender charges which, if reflected, would reduce the total returns for all periods shown. |
| (4) | | As a result of a voluntary expense limitation, the expense ratio will not exceed 1.00%. |
| (5) | | The manager voluntarily waived a portion of its fee for the year ended October 31, 2004. The actual annualized expense ratio did not change due to this waiver. |
| * | | Amount represents less than 1.0%. |
| ‡ | | Total return is not annualized, as it may not be representative of the total return for the year. |
See Notes to Financial Statements.
23 Travelers Series Fund Inc. | 2005 Semi-Annual Report
| | |
| Financial Highlights (continued) | | |
For a share of capital stock outstanding throughout the year or period ended October 31, unless otherwise noted:
| | | | | | | | | | | | | | | | | | |
Smith Barney
Mid Cap Core Portfolio | | 2005(1) | | | 2004 | | | 2003 | | | 2002 | | | 2001 | | | 2000 | |
Net Asset Value,
Beginning of Period | | $13.14 | | | $12.35 | | | $10.10 | | | $10.83 | | | $14.22 | | | $10.00 | |
|
|
Income (Loss) From Operations: | | | | | | | | | | | | | | | | | | |
Net investment income (loss) | | 0.03 | | | (0.01 | ) | | (0.00 | )* | | (0.02 | ) | | 0.02 | | | 0.06 | |
Net realized and
unrealized gain (loss) | | 0.15 | | | 0.80 | | | 2.25 | | | (0.70 | ) | | (3.36 | ) | | 4.17 | |
|
|
Total Income (Loss)
From Operations | | 0.18 | | | 0.79 | | | 2.25 | | | (0.72 | ) | | (3.34 | ) | | 4.23 | |
|
|
Less Distributions From: | | | | | | | | | | | | | | | | | | |
Net investment income | | — | | | — | | | — | | | (0.01 | ) | | (0.05 | ) | | (0.01 | ) |
|
|
Total Distributions | | — | | | — | | | — | | | (0.01 | ) | | (0.05 | ) | | (0.01 | ) |
|
|
Net Asset Value,
End of Period | | $13.32 | | | $13.14 | | | $12.35 | | | $10.10 | | | $10.83 | | | $14.22 | |
|
|
Total Return(2) | | 1.37 | %‡ | | 6.40 | % | | 22.28 | % | | (6.64 | )% | | (23.56 | )% | | 42.36 | % |
|
|
Net Assets, End of
Period (000s) | | $112,464 | | | $110,232 | | | $86,858 | | | $56,644 | | | $34,376 | | | $17,498 | |
|
|
Ratios to Average
Net Assets: | | | | | | | | | | | | | | | | | | |
Expenses(3) | | 0.83 | %† | | 0.83 | %(4) | | 0.85 | % | | 0.90 | % | | 0.95 | %(4) | | 0.95 | %(4) |
Net investment income (loss) | | 0.38† | | | (0.06 | ) | | (0.03 | ) | | (0.10 | ) | | 0.25 | | | 0.72 | |
|
|
Portfolio Turnover Rate | | 46 | % | | 92 | % | | 98 | % | | 79 | % | | 45 | % | | 61 | % |
|
|
| (1) | | For the six months ended April 30, 2005. |
| (2) | | Performance figures may reflect fee waivers and/or expense reimbursements. Past performance is no guarantee of future results. In the absence of fee waivers and/or expense reimbursements, the total return would be reduced. Total returns do not reflect expenses associated with the separate account such as administrative fees, account charges and surrender charges which, if reflected would reduce the total returns for all periods shown. |
| (3) | | As a result of a voluntary expense limitation, the expense ratio will not exceed 0.95%. |
| (4) | | The manager voluntarily waived a portion of its fee for the years ended October 31, 2004, 2001 and 2000. If such fees were not waived, the actual expense ratios would have been 0.83%, 0.96% and 1.46%, respectively. |
| * | | Amount represents less than $0.01 per share. |
| ‡ | | Total return is not annualized, as it may not be representative of the total return for the year. |
See Notes to Financial Statements.
24 Travelers Series Fund Inc. | 2005 Semi-Annual Report
Notes to Financial Statements (unaudited)
| 1. | Organization and Significant Accounting Policies |
The Smith Barney Aggressive Growth Portfolio (“SBAG”) and Smith Barney Mid Cap Core Portfolio (“SBMCC”) (“Fund(s)”) are separate diversified investment funds of the Travelers Series Fund Inc. (“Company”). The Company, a Maryland corporation, is registered under the Investment Company Act of 1940, as amended, as an open-end management investment company.
The following are significant accounting policies consistently followed by the Funds and are in conformity with U.S. generally accepted accounting principles (“GAAP”). Estimates and assumptions are required to be made regarding assets, liabilities and changes in net assets resulting from operations when financial statements are prepared. Changes in the economic environment, financial markets and any other parameters used in determining these estimates could cause actual results to differ.
(a) Investment Valuation. Equity securities for which market quotations are available are valued at the last sale price or official closing price on the primary market or exchange on which they trade. Debt securities are valued at the mean between the bid and asked price provided by an independent pricing service that are based on transactions in debt obligations, quotations from bond dealers, market transactions in comparable securities and various relationships between securities. When prices are not readily available, or are determined not to reflect fair value, such as when the value of a security has been significantly affected by events after the close of the exchange or market on which the security is principally traded, but before the Funds calculate their net asset values, the Funds may value these investments at fair value as determined in accordance with the procedures approved by the Funds’ Board of Directors. Short-term obligations with maturities of 60 days or less are valued at amortized cost, which approximates market value.
(b) Repurchase Agreements. When entering into repurchase agreements, it is the Funds’ policy that their custodian or a third party custodian take possession of the underlying collateral securities, the market value of which at least equals the principal amount of the repurchase transaction, including accrued interest. To the extent that any repurchase transaction exceeds one business day, the value of the collateral is marked-to-market to ensure the adequacy of the collateral. If the seller defaults, and the market value of the collateral declines or
25 Travelers Series Fund Inc. | 2005 Semi-Annual Report
Notes to Financial Statements (unaudited) (continued)
if bankruptcy proceedings are commenced with respect to the seller of the security, realization of the collateral by the Funds may be delayed or limited.
(c) Financial Futures Contracts. SBMCC may enter into financial futures contracts typically to hedge a portion of the portfolio. Upon entering into a financial futures contract, the Fund is required to deposit cash or securities as initial margin. Additional securities are also segregated up to the current market value of the financial futures contracts. Subsequent payments, known as variation margin, are made or received by the Fund each day, depending on the daily fluctuation in the value of the underlying financial instruments. The Fund recognizes an unrealized gain or loss equal to the daily variation margin. When the financial futures contracts are closed, a realized gain or loss is recognized equal to the difference between the proceeds from (or cost of) the closing transactions and the Fund’s basis in the contracts.
The risks associated with entering into financial futures contracts include the possibility that a change in the value of the contract may not correlate with the changes in the value of the underlying instruments. In addition, investing in financial futures contracts involves the risk that the Fund could lose more than the original margin deposit and subsequent payments required for a futures transaction. Risks may also arise upon entering into these contracts from the potential inability of the counterparties to meet the terms of their contracts.
(d) Security Transactions and Investment Income. Security transactions are accounted for on a trade date basis. Interest income, adjusted for amortization of premium and accretion of discount, is recorded on the accrual basis. Dividend income is recorded on the ex-dividend date. Foreign dividend income is recorded on the ex-dividend date or as soon as practical after the Funds determine the existence of a dividend declaration after exercising reasonable due diligence. The cost of investments sold is determined by use of the specific identification method.
(e) Distributions to Shareholders. Distributions from net investment income and distributions of net realized gains, if any, are declared at least annually. Distributions to shareholders of the Funds are recorded on the ex-dividend date and are determined in accordance with income tax regulations, which may differ from GAAP.
26 Travelers Series Fund Inc. | 2005 Semi-Annual Report
Notes to Financial Statements (unaudited) (continued)
(f) Federal and Other Taxes. It is the Funds’ policy to comply with the federal income and excise tax requirements of the Internal Revenue Code of 1986, as amended, applicable to regulated investment companies. Accordingly, the Funds intend to distribute substantially all of their taxable income and net realized gains on investments, if any, to shareholders each year. Therefore, no federal income tax provision is required in the Funds’ financial statements. Under the applicable foreign tax law, a withholding tax may be imposed on interest, dividends and capital gains at various rates.
(g) Reclassification. GAAP requires that certain components of net assets be adjusted to reflect permanent differences between financial and tax reporting. These reclassifications have no effect on net assets or net asset values per share.
| 2. | Management Agreement and Transactions with Affiliates |
Smith Barney Fund Management LLC (“SBFM”), an indirect wholly-owned subsidiary of Citigroup Inc. (“Citigroup”) acts as investment manager of SBAG and SBMCC. SBAG pays SBFM a management fee calculated at an annual rate of 0.800% on the first $5 billion of the Fund’s average daily net assets; 0.775% on the next $2.5 billion; 0.750% on the next $2.5 billion; and 0.700% on the Fund’s average daily net assets in excess of $10 billion. SBMCC pays SBFM a management fee calculated at the annual rate of 0.75% of the average daily net assets. These fees are calculated daily and paid monthly.
Citicorp Trust Bank, fsb. (“CTB”), another subsidiary of Citigroup, acts as the Funds’ transfer agent and PFPC Inc. (“PFPC”) acts as the Funds’ sub-transfer agent. CTB receives account fees and asset-based fees that vary according to the size and type of account. PFPC is responsible for shareholder recordkeeping and financial processing for all shareholder accounts and is paid by CTB. For the six months ended April 30, 2005, each Fund paid transfer agent fees of $2,083 to CTB.
For the six months ended April 30, 2005, Citigroup Global Markets Inc. (“CGM”), another indirect wholly-owned subsidiary of Citigroup, received brokerage commissions totaling $7,051.
All of the officers and one Director of the Company are employees of Citigroup or its affiliates and do not receive compensation from the Funds.
27 Travelers Series Fund Inc. | 2005 Semi-Annual Report
Notes to Financial Statements (unaudited) (continued)
During the six months ended April 30, 2005, the aggregate cost of purchases and proceeds from sales of investments (excluding short-term investments) were as follows:
| | | | | | |
| | | SBAG | | SBMCC |
Purchases | | $ | 22,546,455 | | $ | 51,795,248 |
|
Sales | | | 104,484 | | | 54,989,072 |
|
At April 30, 2005, the aggregate gross unrealized appreciation and depreciation of investments for federal income tax purposes were substantially as follows:
| | | | | | | | |
| | | SBAG | | | SBMCC | |
Gross unrealized appreciation | | $ | 150,353,455 | | | $ | 14,350,334 | |
Gross unrealized depreciation | | | (169,029,025 | ) | | | (3,666,618 | ) |
|
|
Net unrealized appreciation (depreciation) | | $ | (18,675,570 | ) | | $ | 10,683,716 | |
|
|
At April 30, 2005, the Company had six billion shares of capital stock authorized with a par value of $0.00001 per share. Each share of a Fund represents an equal proportionate interest in that Fund with each other share of the same Fund and has an equal entitlement to any distributions made by the Fund.
Transactions in shares of each Fund were as follows:
| | | | | | |
| | | Six Months Ended
April 30, 2005 | | | Year Ended
October 31, 2004 | |
Smith Barney Aggressive Growth Portfolio | | | | | | |
Shares sold | | 3,195,679 | | | 22,127,976 | |
Shares issued on reinvestment | | 281,999 | | | — | |
Shares reacquired | | (1,886,422 | ) | | (1,514,855 | ) |
|
|
Net Increase | | 1,591,256 | | | 20,613,121 | |
|
|
Smith Barney Mid Cap Core Portfolio | | | | | | |
Shares sold | | 380,621 | | | 1,744,843 | |
Shares reacquired | | (331,343 | ) | | (384,264 | ) |
|
|
Net Increase | | 49,278 | | | 1,360,579 | |
|
|
28 Travelers Series Fund Inc. | 2005 Semi-Annual Report
Notes to Financial Statements (unaudited) (continued)
| 5. | Capital Loss Carryforward |
On October 31, 2004, SBMCC had, for federal income tax purposes, a net capital loss carryforward of $3,842,058, which expires in 2010. This amount will be available to offset any future taxable capital gains.
On May 31, 2005, the U.S. Securities and Exchange Commission (“SEC”) issued an order in connection with the settlement of an administrative proceeding against Smith Barney Fund Management LLC (“SBFM”) and Citigroup Global Markets Inc. (“CGMI”) relating to the appointment of an affiliated transfer agent for the Smith Barney family of mutual funds (the “Funds”).
The SEC order finds that SBFM and CGMI willfully violated Section 206(1) of the Investment Advisers Act of 1940 (“Advisers Act”). Specifically, the order finds that SBFM and CGMI knowingly or recklessly failed to disclose to the boards of the Funds in 1999 when proposing a new transfer agent arrangement with an affiliated transfer agent that: First Data Investors Services Group (“First Data”), the Funds’ then-existing transfer agent, had offered to continue as transfer agent and do the same work for substantially less money than before; and that Citigroup Asset Management (“CAM”), the Citigroup business unit that includes the fund’s investment manager and other investment advisory companies, had entered into a side letter with First Data under which CAM agreed to recommend the appointment of First Data as sub-transfer agent to the affiliated transfer agent in exchange, among other things, for a guarantee by First Data of specified amounts of asset management and investment banking fees to CAM and CGMI. The order also finds that SBFM and CGMI willfully violated Section 206(2) of the Advisers Act by virtue of the omissions discussed above and other misrepresentations and omissions in the materials provided to the Funds’ boards, including the failure to make clear that the affiliated transfer agent would earn a high profit for performing limited functions while First Data continued to perform almost all of the transfer agent functions, and the suggestion that the proposed arrangement was in the Funds’ best interests and that no viable alternatives existed. SBFM and CGMI do not admit or deny any wrongdoing or liability. The settlement does not establish wrongdoing or liability for purposes of any other proceeding.
29 Travelers Series Fund Inc. | 2005 Semi-Annual Report
Notes to Financial Statements (unaudited) (continued)
The SEC censured SBFM and CGMI and ordered them to cease and desist from violations of Sections 206(1) and 206(2) of the Advisers Act. The order requires Citigroup to pay $208.1 million, including $109 million in disgorgement of profits, $19.1 million in interest, and a civil money penalty of $80 million. Approximately $24.4 million has already been paid to the Funds, primarily through fee waivers. The remaining $183.7 million, including the penalty, has been paid to the U.S. Treasury and will be distributed pursuant to a plan to be prepared by Citigroup and submitted within 90 days of the entry of the order for approval by the SEC. The order also requires that transfer agency fees received from the Funds since December 1, 2004 less certain expenses be placed in escrow and provides that a portion of such fees may be subsequently distributed in accordance with the terms of the order.
The order requires SBFM to recommend a new transfer agent contract to the Fund boards within 180 days of the entry of the order; if a Citigroup affiliate submits a proposal to serve as transfer agent or sub-transfer agent, an independent monitor must be engaged at the expense of SBFM and CGMI to oversee a competitive bidding process. Under the order, Citigroup also must comply with an amended version of a vendor policy that Citigroup instituted in August 2004. That policy, as amended, among other things, requires that when requested by a Fund board, CAM will retain at its own expense an independent consulting expert to advise and assist the board on the selection of certain service providers affiliated with Citigroup.
At this time, there is no certainty as to how the proceeds of the settlement will be distributed, to whom such distributions will be made, the methodology by which such distributions will be allocated, and when such distributions will be made. Although there can be no assurance, Citigroup does not believe that this matter will have a material adverse effect on the Funds.
Beginning in June, 2004, class action lawsuits alleging violations of the federal securities laws were filed against Citigroup Global Markets Inc. (the “Distributor”) and a number of its affiliates, including Smith Barney Fund Management LLC and Salomon Brothers Asset Management Inc (the “Advisers”), substantially all of the mutual funds managed by the Advisers, including the Funds (the “Funds”), and directors or trustees of the Funds
30 Travelers Series Fund Inc. | 2005 Semi-Annual Report
Notes to Financial Statements (unaudited) (continued)
(collectively, the “Defendants”). The complaints alleged, among other things, that the Distributor created various undisclosed incentives for its brokers to sell Smith Barney and Salomon Brothers funds. In addition, according to the complaints, the Advisers caused the Funds to pay excessive brokerage commissions to the Distributor for steering clients towards proprietary funds. The complaints also alleged that the defendants breached their fiduciary duty to the Funds by improperly charging Rule 12b-1 fees and by drawing on fund assets to make undisclosed payments of soft dollars and excessive brokerage commissions. The complaints also alleged that the Funds failed to adequately disclose certain of the allegedly wrongful conduct. The complaints sought injunctive relief and compensatory and punitive damages, rescission of the Funds’ contracts with the Advisers, recovery of all fees paid to the Advisers pursuant to such contracts and an award of attorneys’ fees and litigation expenses.
On December 15, 2004, a consolidated amended complaint (the “Complaint”) was filed alleging substantially similar causes of action. While the lawsuit is in its earliest stages, to the extent that the Complaint purports to state causes of action against the Funds, Citigroup Asset Management believes the Funds have significant defenses to such allegations, which the Funds intend to vigorously assert in responding to the Complaint.
Additional lawsuits arising out of these circumstances and presenting similar allegations and requests for relief may be filed against the Defendants in the future.
As of the date of this report, Citigroup Asset Management and the Funds believe that the resolution of the pending lawsuit will not have a material effect on the financial position or results of operations of the Funds or the ability of the Advisers and their affiliates to continue to render services to the Funds under their respective contracts.
On June 24, 2005, Citigroup announced that it has signed a definitive agreement under which Citigroup will sell substantially all of its worldwide asset management business to Legg Mason, Inc. (“Legg Mason”).
As part of this transaction, SBFM (the “Manager”), currently an indirect wholly owned subsidiary of Citigroup, would become an indirect wholly owned subsidiary of Legg Mason. The Manager is the investment adviser to the Funds.
31 Travelers Series Fund Inc. | 2005 Semi-Annual Report
Notes to Financial Statements (unaudited) (continued)
The transaction is subject to certain regulatory approvals, as well as other customary conditions to closing. Subject to such approvals and the satisfaction of the other conditions, Citigroup expects the transaction to be completed later this year.
Under the Investment Company Act of 1940, consummation of the transaction will result in the automatic termination of the investment management contract between the Funds and the Manager. Therefore, the Funds’ Board of Directors will be asked to approve a new investment management contract between the Funds and the Manager. If approved by the Board, the new investment management contract will be presented to the shareholders of the Funds for their approval.
32 Travelers Series Fund Inc. | 2005 Semi-Annual Report
TRAVELERS SERIES
FUND INC.
| | |
DIRECTORS Robert A. Frankel Michael E. Gellert R. Jay Gerken, CFA Chairman Rainer Greeven Susan M. Heilbron OFFICERS R. Jay Gerken, CFA President and Chief Executive Officer Andrew B. Shoup Senior Vice President and Chief Administrative Officer James M. Giallanza Chief Financial Officer and Treasurer Brian M. Angerame Vice President and Investment Officer Derek J. Deutsch, CFA Vice President and Investment Officer Richard A. Freeman Vice President and Investment Officer Peter C. Stournaras, CFA Vice President and Investment Officer | | OFFICERS (continued) Andrew Beagley Chief Anti-Money Laundering Compliance Officer and Chief Compliance Officer Robert I. Frenkel Secretary and Chief Legal Officer INVESTMENT MANAGER Smith Barney Fund Management LLC CUSTODIAN State Street Bank and
Trust Company ANNUITY ADMINISTRATION Travelers Annuity Investor Services One Cityplace Hartford, CT 06103-3415 TRANSFER AGENT Citicorp Trust Bank, fsb. 125 Broad Street, 11th Floor New York, New York 10004 SUB-TRANSFER AGENT PFPC Inc. P.O. Box 9699 Providence, Rhode Island 02940-9699 |
Travelers Series Fund Inc.
Smith Barney Aggressive Growth Portfolio
Smith Barney Mid Cap Core Portfolio
The Funds are separate investment funds of the Travelers Series Fund Inc., a Maryland corporation.
The Funds file their complete schedule of portfolio holdings with the Securities and Exchange Commission for the first and third quarters of each fiscal year on Form N-Q. The Funds’ Forms N-Q are available on the Commission’s website at www.sec.gov. The Funds’ Forms N-Q may be reviewed and copied at the Commission’s Public Reference Room in Washington D.C., and information on the operation of the Public Reference Room may be obtained by calling 1-800-SEC-0330. To obtain information on Form N-Q from the Funds, shareholders can call 1-800-451-2010.
Information on how the Funds voted proxies relating to portfolio securities during the 12-month period ended June 30, 2004 and a description of the policies and procedures that the Funds use to determine how to vote proxies relating to portfolio securities is available (1) without charge, upon request, by calling 1-800-451-2010, (2) on the Funds’ website at www.citigroupam.com and (3) on the SEC’s website at www.sec.gov.
This report is submitted for the general information of the shareholders of the Travelers Series Fund Inc. — Smith Barney Aggressive Growth Portfolio and Smith Barney Mid Cap Core Portfolio.
TRAVELERS SERIES FUND INC.
125 Broad Street
10th Floor, MF-2
New York, New York 10004
| ITEM 3. | AUDIT COMMITTEE FINANCIAL EXPERT. |
| ITEM 4. | PRINCIPAL ACCOUNTANT FEES AND SERVICES. |
| ITEM 5. | AUDIT COMMITTEE OF LISTED REGISTRANTS. |
| ITEM 6. | SCHEDULE OF INVESTMENTS. |
| ITEM 7. | DISCLOSURE OF PROXY VOTING POLICIES AND PROCEDURES FOR CLOSED-END MANAGEMENT INVESTMENT COMPANIES. |
| ITEM 9. | PURCHASES OF EQUITY SECURITIES BY CLOSED-END MANAGEMENT INVESTMENT COMPANY AND AFFILIATED PURCHASERS. |
| ITEM 10. | SUBMISSION OF MATTERS TO A VOTE OF SECURITY HOLDERS. |
| ITEM 11. | CONTROLS AND PROCEDURES. |
| | (a) | The registrant’s principal executive officer and principal financial officer have concluded that the registrant’s disclosure controls and procedures (as defined in Rule 30a- 3(c) under the Investment Company Act of 1940, as amended (the “1940 Act”)) are effective as of a date within 90 days of the filing date of this report that includes the disclosure required by this paragraph, based on their evaluation of the disclosure controls and procedures required by Rule 30a-3(b) under the 1940 Act and 15d-15(b) under the Securities Exchange Act of 1934. |
| | (b) | There were no changes in the registrant’s internal control over financial reporting (as defined in Rule 30a-3(d) under the 1940 Act) that occurred during the registrant’s last fiscal half-year (the registrant’s second fiscal half-year in the case of an annual report) that have materially affected, or are likely to materially affect the registrant’s internal control over financial reporting. |
| | |
| Exhibit 99.CERT | | Certifications pursuant to section 302 of the Sarbanes-Oxley Act of 2002 |
| |
| Exhibit 99.906CERT | | Certifications pursuant to Section 906 of the Sarbanes-Oxley Act of 2002 |
SIGNATURES
Pursuant to the requirements of the Securities Exchange Act of 1934 and the Investment Company Act of 1940, the registrant has duly caused this Report to be signed on its behalf by the undersigned, there unto duly authorized.
Travelers Series Fund Inc.
| | |
| By: | | /s/ R. Jay Gerken
|
| | | R. Jay Gerken |
| | | Chief Executive Officer of |
| | | Travelers Series Fund Inc. |
| |
| Date: | | July 7, 2005 |
Pursuant to the requirements of the Securities Exchange Act of 1934 and the Investment Company Act of 1940, this report has been signed below by the following persons on behalf of the registrant and in the capacities and on the dates indicated.
| | |
| By: | | /s/ R. Jay Gerken
|
| | | R. Jay Gerken |
| | | Chief Executive Officer of |
| | | Travelers Series Fund Inc. |
| |
| Date: | | July 7, 2005 |
| |
| By: | | /s/ James M. Giallanza
|
| | | James M. Giallanza |
| | | Chief Financial Officer of |
| | | Travelers Series Fund Inc. |
| |
| Date: | | July 7, 2005 |