Table of Contents
UNITED STATES
SECURITIES AND EXCHANGE COMMISSION
Washington, D.C. 20549
FORM N-CSR
CERTIFIED SHAREHOLDER REPORT OF REGISTERED
MANAGEMENT INVESTMENT COMPANIES
Investment Company Act file number 811-8372
Travelers Series Fund Inc.
(Exact name of registrant as specified in charter)
| 125 Broad Street, New York, NY | 10004 | |
| (Address of principal executive offices) | (Zip code) | |
Robert I. Frenkel, Esq.
Smith Barney Fund Management LLC
300 First Stamford Place
Stamford, CT 06902
(Name and address of agent for service)
Registrant’s telephone number, including area code: (800) 451-2010
Date of fiscal year end: October 31
Date of reporting period: April 30, 2005
Table of Contents
| ITEM 1. | REPORT TO STOCKHOLDERS. |
| The Semi-Annual Report to Stockholders is filed herewith. |
Table of Contents
TRAVELERS SERIES FUND INC.
SMITH BARNEY LARGE CAP
VALUE PORTFOLIO
STRATEGIC EQUITY
PORTFOLIO
VAN KAMPEN
ENTERPRISE PORTFOLIO
SEMI-ANNUAL REPORT | APRIL 30, 2005
NOT FDIC INSURED • NOT BANK GUARANTEED • MAY LOSE VALUE
Table of Contents
| 1 | ||
| 7 | ||
| 8 | ||
| 9 | ||
| 10 | ||
| 12 | ||
| 30 | ||
| 31 | ||
| 32 | ||
| 35 | ||
| 38 | ||
Table of Contents

R. JAY GERKEN, CFA
Chairman, President and Chief Executive Officer
Dear Shareholder,
Despite rising interest rates, climbing oil prices, geopolitical concerns and uncertainties surrounding the U.S. Presidential election, the U.S. economy continued to expand during the period. Following a robust 4.0% gain in the third quarter of 2004, gross domestic product (“GDP”)i growth was 3.8% in the fourth quarter. The advance estimate for first quarter 2005 GDP growth was 3.1%. This decline was largely attributed to high oil prices.
Given the overall strength of the economy, the Federal Reserve Board (“Fed”)ii continued to raise interest rates over the period in an attempt to ward off inflation. Following three 25 basis pointiii rate hikes from June through September 2004, the Fed again increased its target for the federal funds rateiv in 0.25% increments four times during the reporting period. Following the end of the Fund’s reporting period, at its May meeting, the Fed once again increased it’s target for the federal funds rate by 0.25% to 3.00%.
During the six months covered by this report, the U.S. stock market posted a modest gain, with the S&P 500 Indexv returning 3.28%. The reporting period began on a bright note, as the equity markets rallied sharply in November and December 2004. Investors were drawn to stocks as the uncertainty of the U.S. Presidential election ended and oil prices fell from their record highs. Thus far in 2005, the equity markets have been volatile. Equities were weak in January, rose in February and again fell in March and April. The market’s recent troubles have been attributed to mixed economic data, continued high oil prices, and rising interest rates.
Looking at the reporting period as a whole, the trend of value-oriented stocks outperforming their growth counterparts continued. In addition, mid- and large-cap stocks generally outperformed small-cap stocks during the period.
1 Travelers Series Fund Inc. | 2005 Semi-Annual Report
Table of Contents
Within this environment, the Funds performed as follows.vi
PERFORMANCE OF THE FUNDS
AS OF APRIL 30, 2005
(unaudited)
| 6 Months | ||||
Smith Barney Large Cap Value Portfolio | 2.63 | % | ||
S&P 500 Barra/Value Index | 3.51 | % | ||
Lipper Variable Large-Cap Value Funds Category Average | 4.78 | % | ||
Strategic Equity Portfolio | - | 1.90 | % | |
S&P 500 Index | 3.28 | % | ||
Lipper Variable Multi-Cap Core Funds Category Average | 3.05 | % | ||
Van Kampen Enterprise Portfolio | 3.37 | % | ||
Russell 1000 Growth Index | 1.14 | % | ||
Lipper Variable Multi-Cap Core Funds Category Average | 3.05 | % | ||
The performance shown represents past performance. Past performance is no guarantee of future results and current performance may be higher or lower than the performance shown above. Principal value and investment returns will fluctuate and investors’ shares, when redeemed, may be worth more or less than their original cost.
Fund returns assume the reinvestment of income dividends and capital gains distributions at net asset value and the deduction of all Fund expenses.
Lipper, Inc. is a major independent mutual-fund tracking organization. Returns are based on the six-month period ended April 30, 2005 and include the reinvestment of dividends and capital gains distributions, if any. Returns were calculated among the 90 funds in the variable large-cap value funds category. Returns were calculated among the 148 funds in the variable multi-cap core funds category.
Smith Barney Large Cap Value Portfolio
Performance Updatevi
For the six months ended April 30, 2005, the Smith Barney Large Cap Value Portfolio returned 2.63%. The Fund underperformed its unmanaged benchmark, the S&P 500 Barra/Value Index,vii which returned 3.51% for the same period. The Lipper Variable Large-Cap Value Funds Category Average1 was 4.78% for the same time frame.
1 Lipper, Inc. is a major independent mutual-fund tracking organization. Returns are based on the 6-month period ended April 30, 2005, including the reinvestment of dividends and capital gains distributions, if any, calculated among the 90 funds in the Fund’s Lipper category, and excluding sales charges.
2 Travelers Series Fund Inc. | 2005 Semi-Annual Report
Table of Contents
Strategic Equity Portfolio
Special Shareholder Notice
At meetings held on March 24, 2005 and April 20, 2005, the Board of Directors approved a proposal to reorganize the Strategic Equity Portfolio (the “Acquired Fund”) of Travelers Series Fund Inc. (“TSF”) into a newly organized “shell” portfolio (the “Acquiring Fund”) of Travelers Series Trust (“TST”) (the “Reorganization”).
In connection with the Reorganization, the Board of Directors approved an Agreement and Plan of Reorganization (the “Plan”) between TSF, on behalf of the Acquired Fund, and TST, on behalf of the Acquiring Fund, under which the Acquiring Fund would acquire all of the assets of the Acquired Fund and assume all of the liabilities of the Acquired Fund. The Reorganization is being proposed to the Acquired Fund’s shareholders because Travelers Investment Adviser Inc., which serves as investment adviser to the Acquired Fund and is currently an indirect wholly owned subsidiary of Citigroup Inc. (“Citigroup”), will become an indirect wholly owned subsidiary of MetLife, Inc. (“MetLife”) as part of MetLife’s acquisition of Travelers Life & Annuity, the life insurance and annuity businesses of Citigroup.
A Special Meeting of Shareholders of the Acquired Fund has been called on June 29, 2005 for the purpose of submitting the Plan and such other matters as may properly come before the meeting to the stockholders of the Acquired Fund for approval. The close of business on April 15, 2005, has been fixed as the record date for the determination of stockholders of the Acquired Fund who are entitled to notice of, and to vote at, the Special Meeting of Shareholders, including any adjournment or adjournments thereof.
Performance Updatevi
For the six months ended April 30, 2005, the Strategic Equity Portfolio returned -1.90%. The Fund underperformed the Lipper Variable Multi-Cap Core Funds Category Average,2 which was 3.05%. The Fund’s unmanaged benchmark, the S&P 500 Index,v returned 3.28% for the same period.
Van Kampen Enterprise Portfolio
Special Shareholder Notice
At meetings held on March 24, 2005 and April 20, 2005, the Board of Directors approved a proposal to reorganize the Van Kampen Enterprise Portfolio (the
2 Lipper, Inc. is a major independent mutual-fund tracking organization. Returns are based on the 6-month period ended April 30, 2005, including the reinvestment of dividends and capital gains distributions, if any, calculated among the 148 funds in the Fund’s Lipper category, and excluding sales charges.
3 Travelers Series Fund Inc. | 2005 Semi-Annual Report
Table of Contents
“Acquired Fund”) of Travelers Series Fund Inc. (“TSF”) into a newly organized “shell” portfolio (the “Acquiring Fund”) of Travelers Series Trust (“TST”) (the “Reorganization”).
In connection with the Reorganization, the Board of Directors approved an Agreement and Plan of Reorganization (the “Plan”) between TSF, on behalf of the Acquired Fund, and TST, on behalf of the Acquiring Fund, under which the Acquiring Fund would acquire all of the assets of the Acquired Fund and assume all of the liabilities of the Acquired Fund. The Reorganization is being proposed to the Acquired Fund’s shareholders because Travelers Investment Adviser Inc., which serves as investment adviser to the Acquired Fund and is currently an indirect wholly owned subsidiary of Citigroup Inc. (“Citigroup”), will become an indirect wholly owned subsidiary of MetLife, Inc. (“MetLife”) as part of MetLife’s acquisition of Travelers Life & Annuity, the life insurance and annuity businesses of Citigroup.
A Special Meeting of Shareholders of the Acquired Fund has been called on June 29, 2005 for the purpose of submitting the Plan and such other matters as may properly come before the meeting to the stockholders of the Acquired Fund for approval. The close of business on April 15, 2005, has been fixed as the record date for the determination of stockholders of the Acquired Fund who are entitled to notice of, and to vote at, the Special Meeting of Shareholders, including any adjournment or adjournments thereof.
Performance Updatevi
For the six months ended April 30, 2005, the Van Kampen Portfolio returned 3.37%. The Fund outperformed its unmanaged benchmark, the Russell 1000 Growth Index,viii which returned 1.14% for the same period. It also outperformed the Lipper Variable Multi-Cap Core Funds Category Average,3 which was 3.05%.
Information About Your Fund
As you may be aware, several issues in the mutual fund industry have recently come under the scrutiny of federal and state regulators. The Funds’ Advisers and some of their affiliates have received requests for information from various government regulators regarding market timing, late trading, fees, and other mutual fund issues in connection with various investigations. The regulators appear to be examining, among other things, the Funds’ response to market timing and shareholder exchange activity, including compliance with prospectus
| 3 | Lipper, Inc. is a major independent mutual-fund tracking organization. Returns are based on the 6-month period ended April 30, 2005, including the reinvestment of dividends and capital gains distributions, if any, calculated among the 148 funds in the Fund’s Lipper category, and excluding sales charges. |
4 Travelers Series Fund Inc. | 2005 Semi-Annual Report
Table of Contents
disclosure related to these subjects. The Funds have been informed that the Adviser and its affiliates are responding to those information requests, but are not in a position to predict the outcome of these requests and investigations.
Important information concerning the Funds and their Adviser with regard to recent regulatory developments is contained in the “Additional Information” note in the Notes to the Financial Statements included in this report.
As always, thank you for your continued confidence in our stewardship of your assets. We look forward to helping you continue to meet your financial goals.
Sincerely,

R. Jay Gerken, CFA
Chairman, President and Chief Executive Officer
May 16, 2005
5 Travelers Series Fund Inc. | 2005 Semi-Annual Report
Table of Contents
The information provided is not intended to be a forecast of future events, a guarantee of future results or investment advice. Views expressed may differ from those of the firm as a whole.
Portfolio holdings and breakdowns are as of April 30, 2005 and are subject to change. Please refer to pages 12 through 29 for a list and percentage breakdown of the Funds’ holdings.
RISKS:
Smith Barney Large Cap Value Portfolio: Keep in mind, common stocks are subject to market fluctuations. Foreign stocks are subject to certain risks of overseas investing, including currency fluctuations and changes in political and economic conditions, which could result in significant market fluctuations. The Fund may use derivatives, such as options and futures, which can be illiquid, may disproportionately increase losses, and have a potentially large impact on Fund performance. Please see the Fund’s prospectus for more information on these and other risks.
Strategic Equity Portfolio: The Fund may invest in foreign securities. Investing in foreign securities is subject to certain risks not associated with domestic investing, such as currency fluctuations, and changes in political and economic conditions. The Fund may use derivatives, such as options and futures, which can be illiquid, may disproportionately increase losses, and have a potentially, large impact on Fund performance. Please see the Fund’s prospectus for more information on these and other risks.
Van Kampen Enterprise Portfolio: The Fund may invest in foreign securities. Investing in foreign securities is subject to certain risks not associated with domestic investing, such as currency fluctuations, and changes in political and economic conditions. These risks are magnified in emerging or developing markets. The Fund may use derivatives, such as options and futures, which can be illiquid, may disproportionately increase losses, and have a potentially large impact on Fund performance. The Fund may invest in small-capitalization companies. Small-capitalization companies may involve a higher degree of risk and volatility than investments in larger, more established companies. The Fund may invest in medium-capitalization companies. Medium-capitalization companies may involve a higher degree of risk and volatility than investments in larger, more established companies. Please see the Fund’s prospectus for more information on these and other risks.
All index performance reflects no deduction for fees, expenses or taxes. Please note that an investor cannot invest directly in an index.
| i | Gross domestic product is a market value of goods and services produced by labor and property in a given country. |
| ii | The Federal Reserve Board is responsible for the formulation of a policy designed to promote economic growth, full employment, stable prices, and a sustainable pattern of international trade and payments. |
| iii | A basis point is one one-hundredth (1/100 or 0.01) of one percent. |
| iv | The federal funds rate is the interest rate that banks with excess reserves at a Federal Reserve district bank charge other banks that need overnight loans. |
| v | The S&P 500 Index is a market capitalization-weighted index of 500 widely held common stocks. |
| vi | The Funds are underlying investment options of various variable annuity and variable life insurance products. The Funds’ performance returns do not reflect the deduction of initial sales charges and expenses imposed in connection with investing in variable annuity or variable life insurance contracts, such as administrative fees, account charges, and surrender charges which, if reflected, would reduce the performance of the Funds. Past performance is no guarantee of future results. |
| vii | The S&P 500 Barra/Value Index is a market-capitalization weighted index of stocks in the S&P 500 having lower price-to-book ratios relative to the S&P 500 as a whole. (A price-to-book ratio is the price of a stock compared to the difference between a company’s assets and liabilities.) |
| viii | The Russell 1000 Growth Index measures the performance of those Russell 1000 companies with higher price-to-book ratios and higher forecasted growth values. |
6 Travelers Series Fund Inc. | 2005 Semi-Annual Report
Table of Contents
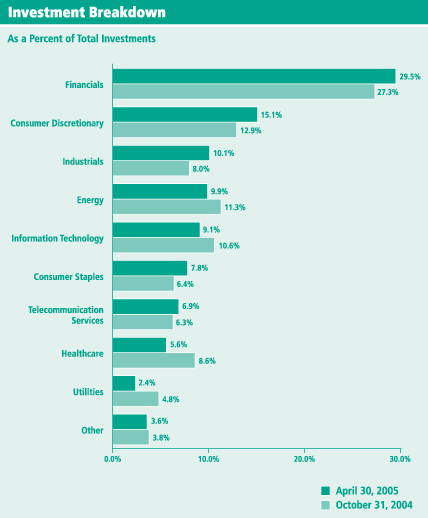
Smith Barney Large Cap Value Portfolio
Fund at a Glance (unaudited)
7 Travelers Series Fund Inc. | 2005 Semi-Annual Report
Table of Contents
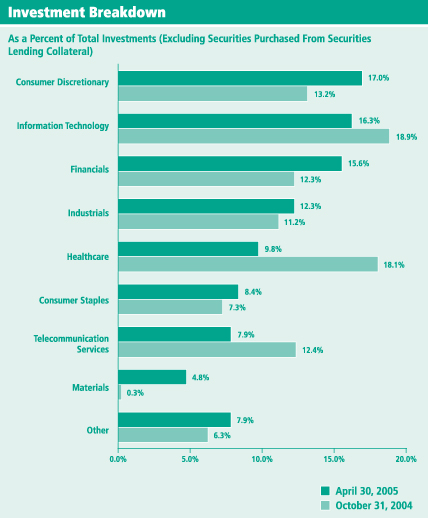
Strategic Equity Portfolio
Fund at a Glance (unaudited)
8 Travelers Series Fund Inc. | 2005 Semi-Annual Report
Table of Contents
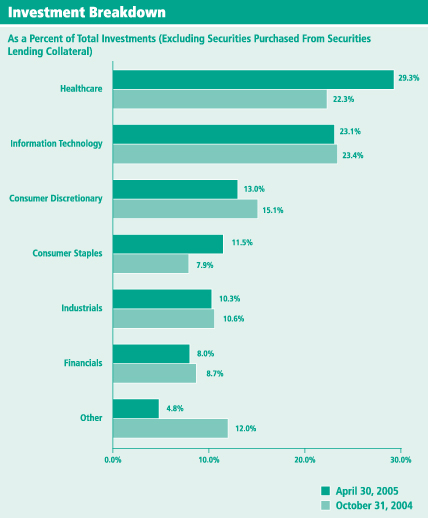
Van Kampen Enterprise Portfolio
Fund at a Glance (unaudited)
9 Travelers Series Fund Inc. | 2005 Semi-Annual Report
Table of Contents
As a shareholder of the Fund, you may incur two types of costs: (1) transaction costs and (2) ongoing costs, including management fees and other Fund expenses. This example is intended to help you understand your ongoing costs (in dollars) of investing in the Fund and to compare these costs with the ongoing costs of investing in other mutual funds.
This example is based on an investment of $1,000 invested on November 1, 2004 and held for the six months ended April 30, 2005.
Actual Expenses
The table below titled “Based on Actual Total Return” provides information about actual account values and actual expenses. You may use the information provided in this table, together with the amount you invested, to estimate the expenses that you paid over the period. To estimate the expenses you paid on your account, divide your ending account value by $1,000 (for example, an $8,600 ending account value divided by $1,000 = 8.6), then multiply the result by the number under the heading entitled “Expenses Paid During the Period”.
Based on Actual Total Return(1)
Actual Total Return(2) | Beginning Account Value | Ending Account Value | Annualized Expense Ratio | Expenses Paid During the Period(3) | |||||||||||
Smith Barney Large Cap Value Portfolio | 2.63 | % | $ | 1,000.00 | $ | 1,026.30 | 0.66 | % | $ | 3.32 | |||||
Strategic Equity Portfolio | (1.90 | ) | 1,000.00 | 981.00 | 0.84 | 4.13 | |||||||||
Van Kampen Enterprise Portfolio | 3.37 | 1,000.00 | 1,033.70 | 0.83 | 4.19 | ||||||||||
| (1) | For the six months ended April 30, 2005. |
| (2) | Assumes reinvestment of dividends and capital gains distributions, if any, at net asset value. Total return is not annualized, as it may not be representative of the total return for the year. Total returns do not reflect expenses associated with the separate account such as administrative fees, account charges and surrender charges, which, if reflected, would reduce the total returns. Performance figures may reflect fee waivers and/or expense reimbursements. Past performance is no guarantee of future results. In the absence of fee waivers and/or expense reimbursements, the total return would have been lower. |
| (3) | Expenses are equal to each Funds’ respective annualized expense ratio multiplied by the average account value over the period, multiplied by the number of days in the most recent fiscal half-year, then divided by 365. |
10 Travelers Series Fund Inc. | 2005 Semi-Annual Report
Table of Contents
Fund Expenses (unaudited) (continued)
Hypothetical Example for Comparison Purposes
The table below titled “Based on Hypothetical Total Return” provides information about hypothetical account values and hypothetical expenses based on the actual expense ratio and an assumed rate of return of 5.00% per year before expenses, which is not the Fund’s actual return. The hypothetical account values and expenses may not be used to estimate the actual ending account balance or expenses you paid for the period. You may use the information provided in this table to compare the ongoing costs of investing in the Fund and other funds. To do so, compare the 5.00% hypothetical example relating to the Fund with the 5.00% hypothetical examples that appear in the shareholder reports of the other funds.
Please note that the expenses shown in the table below are meant to highlight your ongoing costs only and do not reflect any transactional costs. Therefore, the table is useful in comparing ongoing costs only, and will not help you determine the relative total costs of owning different funds. In addition, if these transaction costs were included, your costs would have been higher.
Based on Hypothetical Total Return(1)
Hypothetical Annualized Total Return | Beginning Account Value | Ending Account Value | Annualized Expense Ratio | Expenses Paid During the Period(2) | |||||||||||
Smith Barney Large Cap Value Portfolio | 5.00 | % | $ | 1,000.00 | $ | 1,021.52 | 0.66 | % | $ | 3.31 | |||||
Strategic Equity Portfolio | 5.00 | 1,000.00 | 1,020.63 | 0.84 | 4.21 | ||||||||||
Van Kampen Enterprise Portfolio | 5.00 | 1,000.00 | 1,020.68 | 0.83 | 4.16 | ||||||||||
| (1) | For the six months ended April 30, 2005. |
| (2) | Expenses are equal to each Funds’ respective annualized expense ratio multiplied by the average account value over the period, multiplied by the number of days in the most recent fiscal half-year, then divided by 365. |
11 Travelers Series Fund Inc. | 2005 Semi-Annual Report
Table of Contents
| Schedules of Investments (unaudited) | April 30, 2005 |
SMITH BARNEY LARGE CAP VALUE PORTFOLIO
| SHARES | SECURITY | VALUE | |||
| COMMON STOCK — 97.0% | |||||
| CONSUMER DISCRETIONARY — 14.6% | |||||
Hotels, Restaurants & Leisure — 1.6% | |||||
| 176,800 | McDonald’s Corp. | $ | 5,182,008 | ||
Household Durables — 1.0% | |||||
| 146,600 | Newell Rubbermaid Inc. | 3,185,618 | |||
Leisure Equipment & Products — 0.2% | |||||
| 27,900 | Mattel, Inc. | 503,595 | |||
Media — 8.6% | |||||
| 174,500 | Comcast Corp., Class A Shares (a) | 5,603,195 | |||
| 443,900 | Liberty Media Corp., Class A Shares (a) | 4,456,756 | |||
| 22,300 | Liberty Media International, Inc., Class A Shares (a) | 924,781 | |||
| 399,600 | News Corp., Class B Shares | 6,361,632 | |||
| 273,700 | Time Warner Inc. (a) | 4,600,897 | |||
| 141,600 | Viacom Inc., Class B Shares | 4,902,192 | |||
| 26,849,453 | |||||
Multi-Line Retail — 3.2% | |||||
| 90,100 | J.C. Penney Co., Inc. | 4,271,641 | |||
| 57,100 | Target Corp. | 2,650,011 | |||
| 65,100 | Wal-Mart Stores, Inc. | 3,068,814 | |||
| 9,990,466 | |||||
| TOTAL CONSUMER DISCRETIONARY | 45,711,140 | ||||
| CONSUMER STAPLES — 7.9% | |||||
Food & Drug Retailing — 2.0% | |||||
| 386,800 | The Kroger Co. (a) | 6,099,836 | |||
Food Products—1.1% | |||||
| 156,000 | Sara Lee Corp. | 3,336,840 | |||
Household Products — 1.2% | |||||
| 62,200 | Kimberly-Clark Corp. | 3,884,390 | |||
Tobacco — 3.6% | |||||
| 173,700 | Altria Group, Inc. | 11,288,763 | |||
| TOTAL CONSUMER STAPLES | 24,609,829 | ||||
| ENERGY — 9.9% | |||||
Energy Equipment & Services — 3.9% | |||||
| 153,900 | ENSCO International Inc. | 5,017,140 | |||
| 89,100 | GlobalSantaFe Corp. | 2,993,760 | |||
| 44,100 | Nabors Industries, Ltd. (a) | 2,375,667 | |||
| 38,000 | Noble Corp. | 1,934,200 | |||
| 12,320,767 | |||||
See Notes to Financial Statements.
12 Travelers Series Fund Inc. | 2005 Semi-Annual Report
Table of Contents
| Schedules of Investments (unaudited) (continued) | April 30, 2005 |
SMITH BARNEY LARGE CAP VALUE PORTFOLIO
| SHARES | SECURITY | VALUE | |||
Oil & Gas — 6.0% | |||||
| 53,500 | BP PLC, Sponsored ADR | $ | 3,258,150 | ||
| 26,200 | EOG Resources, Inc. | 1,245,810 | |||
| 94,700 | Marathon Oil Corp. | 4,410,179 | |||
| 55,600 | Royal Dutch Petroleum Co., New York Shares | 3,238,700 | |||
| 58,600 | Total SA, Sponsored ADR | 6,499,326 | |||
| 18,652,165 | |||||
| TOTAL ENERGY | 30,972,932 | ||||
| FINANCIALS — 29.5% | |||||
Banks — 10.7% | |||||
| 245,600 | Bank of America Corp. | 11,061,824 | |||
| 76,800 | The Bank of New York Co., Inc. | 2,145,792 | |||
| 58,100 | Comerica Inc. | 3,326,806 | |||
| 156,000 | U.S. Bancorp | 4,352,400 | |||
| 99,900 | Wachovia Corp. | 5,112,882 | |||
| 77,700 | Washington Mutual, Inc. | 3,210,564 | |||
| 71,700 | Wells Fargo & Co. | 4,297,698 | |||
| 33,507,966 | |||||
Diversified Financials — 10.7% | |||||
| 87,500 | American Express Co. | 4,611,250 | |||
| 87,000 | Capital One Financial Corp. | 6,167,430 | |||
| 78,500 | Freddie Mac | 4,829,320 | |||
| 40,800 | The Goldman Sachs Group, Inc. | 4,357,032 | |||
| 110,500 | JPMorgan Chase & Co. | 3,921,645 | |||
| 75,800 | MBNA Corp. | 1,497,050 | |||
| 111,300 | Merrill Lynch & Co., Inc. | 6,002,409 | |||
| 42,400 | Morgan Stanley | 2,231,088 | |||
| 33,617,224 | |||||
Insurance — 5.3% | |||||
| 116,700 | American International Group, Inc. | 5,934,195 | |||
| 41,700 | The Chubb Corp. | 3,410,226 | |||
| 60,400 | Loews Corp. | 4,281,152 | |||
| 82,900 | The St. Paul Travelers Cos., Inc. | 2,967,820 | |||
| 16,593,393 | |||||
Real Estate — 2.8% | |||||
| 145,100 | Equity Office Properties Trust | 4,566,297 | |||
| 121,700 | Equity Residential | 4,180,395 | |||
| 8,746,692 | |||||
| TOTAL FINANCIALS | 92,465,275 | ||||
See Notes to Financial Statements.
13 Travelers Series Fund Inc. | 2005 Semi-Annual Report
Table of Contents
| Schedules of Investments (unaudited) (continued) | April 30, 2005 |
SMITH BARNEY LARGE CAP VALUE PORTFOLIO
| SHARES | SECURITY | VALUE | |||
| HEALTHCARE — 5.6% | |||||
Healthcare Providers & Services — 0.4% | |||||
| 15,600 | Aetna Inc. | $ | 1,144,572 | ||
Pharmaceuticals — 5.2% | |||||
| 61,400 | Johnson & Johnson | 4,213,882 | |||
| 67,700 | Novartis AG, ADR | 3,299,021 | |||
| 148,600 | Pfizer Inc. | 4,037,462 | |||
| 110,900 | Sanofi-Aventis, ADR | 4,920,633 | |||
| 16,470,998 | |||||
| TOTAL HEALTHCARE | 17,615,570 | ||||
| INDUSTRIALS — 10.1% | |||||
Aerospace & Defense — 6.3% | |||||
| 100,600 | The Boeing Co. | 5,987,712 | |||
| 94,700 | Lockheed Martin Corp. | 5,771,965 | |||
| 91,500 | Raytheon Co. | 3,441,315 | |||
| 43,200 | United Technologies Corp. | 4,394,304 | |||
| 19,595,296 | |||||
Commercial Services & Supplies — 2.0% | |||||
| 65,600 | Avery Dennison Corp. | 3,434,160 | |||
| 98,800 | Waste Management, Inc. | 2,814,812 | |||
| 6,248,972 | |||||
Industrial Conglomerates — 1.8% | |||||
| 160,700 | Honeywell International Inc. | 5,746,632 | |||
| TOTAL INDUSTRIALS | 31,590,900 | ||||
| INFORMATION TECHNOLOGY — 9.1% | |||||
Communications Equipment — 4.0% | |||||
| 122,100 | Comverse Technology, Inc. (a) | 2,782,659 | |||
| 363,600 | Nokia Oyj, Sponsored ADR | 5,810,328 | |||
| 1,612,600 | Nortel Networks Corp. (a) | 4,015,374 | |||
| 12,608,361 | |||||
Computers & Peripherals — 2.6% | |||||
| 72,400 | Hewlett-Packard Co. | 1,482,028 | |||
| 40,400 | International Business Machines Corp. | 3,085,752 | |||
| 52,500 | Lexmark International, Inc., Class A Shares (a) | 3,646,125 | |||
| 8,213,905 | |||||
Electronic Equipment & Instruments — 0.5% | |||||
| 500,800 | Solectron Corp. (a) | 1,652,640 | |||
See Notes to Financial Statements.
14 Travelers Series Fund Inc. | 2005 Semi-Annual Report
Table of Contents
| Schedules of Investments (unaudited) (continued) | April 30, 2005 |
SMITH BARNEY LARGE CAP VALUE PORTFOLIO
| SHARES | SECURITY | VALUE | |||
Software — 2.0% | |||||
| 244,400 | Microsoft Corp. | $ | 6,183,320 | ||
| TOTAL INFORMATION TECHNOLOGY | 28,658,226 | ||||
MATERIALS — 1.0% | |||||
| Chemicals — 0.9% | |||||
| 51,600 | Air Products & Chemicals, Inc. | 3,030,468 | |||
Paper & Forest Products — 0.1% | |||||
| 7,200 | International Paper Co. | 246,888 | |||
| TOTAL MATERIALS | 3,277,356 | ||||
| TELECOMMUNICATION SERVICES — 6.9% | |||||
Diversified Telecommunication Services — 4.9% | |||||
| 72,000 | ALLTEL Corp. | 4,101,120 | |||
| 82,600 | AT&T Corp. | 1,580,138 | |||
| 205,300 | SBC Communications Inc. | 4,886,140 | |||
| 70,400 | Sprint Corp. | 1,567,104 | |||
| 87,100 | Verizon Communications Inc. | 3,118,180 | |||
| 15,252,682 | |||||
Wireless Telecommunication Services — 2.0% | |||||
| 223,600 | Nextel Communications, Inc., Class A Shares (a) | 6,258,564 | |||
| TOTAL TELECOMMUNICATION SERVICES | 21,511,246 | ||||
| UTILITIES — 2.4% | |||||
Gas Utilities — 1.3% | |||||
| 406,700 | El Paso Corp. | 4,062,933 | |||
Multi-Utilities — 1.1% | |||||
| 84,400 | Sempra Energy | 3,408,072 | |||
| TOTAL UTILITIES | 7,471,005 | ||||
| TOTAL COMMON STOCK (Cost — $277,155,977) | 303,883,479 | ||||
| FOREIGN STOCK — 0.5% | |||||
France — 0.5% | |||||
| 115,800 | SES Global, FDR (b) (Cost — $1,570,129) | 1,591,414 | |||
See Notes to Financial Statements.
15 Travelers Series Fund Inc. | 2005 Semi-Annual Report
Table of Contents
| Schedules of Investments (unaudited) (continued) | April 30, 2005 |
SMITH BARNEY LARGE CAP VALUE PORTFOLIO
| FACE AMOUNT | SECURITY | VALUE | |||
| SHORT-TERM INVESTMENT — 2.5% | |||||
| REPURCHASE AGREEMENT — 2.5% | |||||
| $7,893,000 | Interest in $850,128,000 joint tri-party repurchase agreement dated 4/29/05 with UBS Securities LLC, 2.950% due 5/2/05; Proceeds at maturity — $7,894,940; (Fully collateralized by various U.S. Government Obligations and Agencies and International Bank Reconstruction & Development Notes & Bonds, 0.000% to 8.875% due 5/26/05 to 8/6/38; Market value — $8,050,894) (Cost — $7,893,000) | $ | 7,893,000 | ||
| TOTAL INVESTMENTS — 100.0% (Cost — $286,619,106*) | 313,367,893 | ||||
| Other Assets in Excess of Liabilities — 0.0% | 17,871 | ||||
| TOTAL NET ASSETS — 100.0% | $ | 313,385,764 | |||
| (a) | Non-income producing security. |
| (b) | Security is fair valued at April 30, 2005 in accordance with the policies adopted by the Board of Directors (See Note 1). |
| * | Aggregate cost for federal income tax purposes is substantially the same. |
Abbreviations used in this schedule: | ||||
| ADR | — | American Depositary Receipt | ||
| FDR | — | Foreign Depositary Receipt | ||
See Notes to Financial Statements.
16 Travelers Series Fund Inc. | 2005 Semi-Annual Report
Table of Contents
| Schedules of Investments (unaudited) (continued) | April 30, 2005 |
STRATEGIC EQUITY PORTFOLIO
| SHARES | SECURITY | VALUE | |||
| COMMON STOCK — 87.1% | |||||
| CONSUMER DISCRETIONARY — 16.0% | |||||
Auto Components — 0.2% | |||||
| 21,365 | Gentex Corp. | $ | 693,508 | ||
Automobiles — 0.1% | |||||
| 20,100 | Monaco Coach Corp. | 285,018 | |||
Hotels, Restaurants & Leisure — 2.2% | |||||
| 11,900 | Gaylord Entertainment Co. (a)(b) | 476,000 | |||
| 26,700 | GTECH Holdings Corp. | 653,349 | |||
| 239,700 | International Game Technology | 6,445,533 | |||
| 25,700 | Scientific Games Corp., Class A Shares (a) | 551,779 | |||
| 3,900 | Shuffle Master, Inc. (a) | 98,241 | |||
| 8,600 | Vail Resorts, Inc. (a) | 222,482 | |||
| 71,400 | WMS Industries Inc. (a)(b) | 1,813,560 | |||
| 10,260,944 | |||||
Household Durables — 0.0% | |||||
| 19,800 | National R.V. Holdings, Inc. (a) | 189,288 | |||
Internet & Catalog Retail — 0.5% | |||||
| 58,200 | Amazon.com, Inc. (a) | 1,883,352 | |||
| 7,800 | eBay Inc. (a) | 247,494 | |||
| 2,130,846 | |||||
Leisure Equipment & Products — 0.9% | |||||
| 52,600 | Brunswick Corp. | 2,209,200 | |||
| 112,700 | Hasbro, Inc. | 2,132,284 | |||
| 4,341,484 | |||||
Media — 7.0% | |||||
| 250,100 | Clear Channel Communications, Inc. | 7,988,194 | |||
| 217,079 | Cumulus Media Inc., Class A Shares (a)(b) | 2,817,685 | |||
| 68,900 | EchoStar Communications Corp., Class A Shares | 1,994,655 | |||
| 65,750 | Entercom Communications Corp. (a) | 2,119,122 | |||
| 2,000 | Getty Images, Inc. (a)(b) | 143,100 | |||
| 224,452 | Lamar Advertising Co., Class A Shares (a) | 8,390,016 | |||
| 50,603 | Macrovision Corp. (a)(b) | 1,034,831 | |||
| 426 | Pixar (a) | 19,485 | |||
| 24,950 | Playboy Enterprises, Inc., Class B Shares (a)(b) | 301,396 | |||
| 75,276 | Univision Communications Inc., Class A Shares (a) | 1,979,006 | |||
| 180,300 | XM Satellite Radio Holdings Inc., Class A Shares (a)(b) | 5,001,522 | |||
| 31,789,012 | |||||
Multi-Line Retail — 1.0% | |||||
| 95,800 | Wal-Mart Stores, Inc. | 4,516,012 | |||
See Notes to Financial Statements.
17 Travelers Series Fund Inc. | 2005 Semi-Annual Report
Table of Contents
| Schedules of Investments (unaudited) (continued) | April 30, 2005 |
STRATEGIC EQUITY PORTFOLIO
| SHARES | SECURITY | VALUE | |||
Specialty Retail — 3.5% | |||||
| 34,900 | Borders Group, Inc. | $ | 844,231 | ||
| 61,100 | Electronics Boutique Holdings Corp. (a) | 3,405,103 | |||
| 141,400 | GameStop Corp., Class A Shares (a)(b) | 3,479,854 | |||
| 64,556 | Monro Muffler Brake, Inc. (a) | 1,652,634 | |||
| 331,000 | Staples, Inc. | 6,312,170 | |||
| 8,800 | Urban Outfitters, Inc. (a) | 389,840 | |||
| 16,083,832 | |||||
Textiles & Apparel — 0.6% | |||||
| 40,000 | Ashworth, Inc. (a)(b) | 439,600 | |||
| 29,200 | NIKE, Inc., Class B Shares | 2,242,852 | |||
| 2,682,452 | |||||
| TOTAL CONSUMER DISCRETIONARY | 72,972,396 | ||||
| CONSUMER STAPLES — 7.6% | |||||
Beverages — 1.1% | |||||
| 112,400 | The Coca-Cola Co. | 4,882,656 | |||
Food Products — 1.3% | |||||
| 48,800 | Archer-Daniels-Midland Co. | 877,912 | |||
| 41,900 | Bunge Ltd. | 2,379,920 | |||
| 15,400 | Corn Products International, Inc. | 339,108 | |||
| 65,110 | Hormel Foods Corp. | 2,027,525 | |||
| 12,800 | Ralcorp Holdings, Inc. | 507,136 | |||
| 6,131,601 | |||||
Household Products — 1.9% | |||||
| 160,700 | The Procter & Gamble Co. | 8,701,905 | |||
Personal Products — 0.3% | |||||
| 24,300 | The Gillette Co. | 1,254,852 | |||
Tobacco — 3.0% | |||||
| 193,800 | Altria Group, Inc. | 12,595,062 | |||
| 38,700 | Loews Corp — Carolina Group | 1,219,050 | |||
| 13,814,112 | |||||
| TOTAL CONSUMER STAPLES | 34,785,126 | ||||
| ENERGY — 0.0% | |||||
Oil & Gas — 0.0% | |||||
| 100 | Quicksilver Resources Inc. (a)(b) | 5,133 | |||
| FINANCIALS — 16.0% | |||||
Banks — 1.1% | |||||
| 19,400 | Bank of America Corp. | 873,776 | |||
| 2,300 | Boston Private Financial Holdings, Inc. (b) | 51,382 | |||
| 45,000 | Unibanco-Uniao de Bancos Brasileiros S.A., GDR (b) | 1,493,550 | |||
See Notes to Financial Statements.
18 Travelers Series Fund Inc. | 2005 Semi-Annual Report
Table of Contents
| Schedules of Investments (unaudited) (continued) | April 30, 2005 |
STRATEGIC EQUITY PORTFOLIO
| SHARES | SECURITY | VALUE | |||
Banks — 1.1% (continued) | |||||
| 50,600 | Wachovia Corp. | $ | 2,589,708 | ||
| 5,008,416 | |||||
Diversified Financials — 4.1% | |||||
| 282,050 | SLM Corp. | 13,436,862 | |||
| 90,891 | T. Rowe Price Group Inc. | 5,014,456 | |||
| 18,451,318 | |||||
Insurance — 10.8% | |||||
| 151,900 | ACE Ltd. | 6,525,624 | |||
| 217,100 | AFLAC, Inc. | 8,825,115 | |||
| 119,600 | Ambac Financial Group Inc. | 7,995,260 | |||
| 478,450 | American International Group, Inc. | 24,329,182 | |||
| 18,900 | Endurance Speciality Holdings Ltd. | 684,180 | |||
| 26,040 | Scottish Re Group Ltd. (b) | 611,419 | |||
| 10,350 | W.R. Berkley Corp. | 336,375 | |||
| 49,307,155 | |||||
| TOTAL FINANCIALS | 72,766,889 | ||||
| HEALTHCARE — 6.7% | |||||
Biotechnology — 1.3% | |||||
| 66,100 | Gilead Sciences, Inc. (a) | 2,452,310 | |||
| 72,500 | MedImmune, Inc. (a) | 1,839,325 | |||
| 7,600 | Millennium Pharmaceuticals, Inc. (a) | 66,576 | |||
| 13,600 | Onyx Pharmaceuticals, Inc. (a) | 420,104 | |||
| 21,600 | OSI Pharmaceuticals, Inc. (a) | 1,022,436 | |||
| 5,800,751 | |||||
Healthcare Equipment & Supplies — 1.4% | |||||
| 61,800 | BioLase Technology, Inc. (b) | 406,644 | |||
| 82,900 | Guidant Corp. | 6,141,232 | |||
| 6,547,876 | |||||
Healthcare Providers & Services — 0.6% | |||||
| 30,100 | UnitedHealth Group Inc. | 2,844,751 | |||
Pharmaceuticals — 3.4% | |||||
| 41,400 | Johnson & Johnson | 2,841,282 | |||
| 14,700 | Merck & Co., Inc. | 498,330 | |||
| 118,200 | Novartis AG, ADR | 5,759,886 | |||
| 228,700 | Pfizer Inc. | 6,213,779 | |||
| 15,313,277 | |||||
| TOTAL HEALTHCARE | 30,506,655 | ||||
See Notes to Financial Statements.
19 Travelers Series Fund Inc. | 2005 Semi-Annual Report
Table of Contents
| Schedules of Investments (unaudited) (continued) | April 30, 2005 |
STRATEGIC EQUITY PORTFOLIO
| SHARES | SECURITY | VALUE | |||
| INDUSTRIALS — 12.6% | |||||
Aerospace & Defense — 2.5% | |||||
| 117,600 | The Boeing Co. | $ | 6,999,552 | ||
| 76,400 | Northrop Grumman Corp. | 4,189,776 | |||
| 11,189,328 | |||||
Airlines — 2.6% | |||||
| 387,100 | AirTran Holdings, Inc. (a)(b) | 3,212,930 | |||
| 843,530 | Delta Air Lines, Inc. (a)(b) | 2,775,214 | |||
| 646,753 | Northwest Airlines Corp. (a)(b) | 3,350,181 | |||
| 159,700 | Southwest Airlines Co. | 2,376,336 | |||
| 11,714,661 | |||||
Electrical Equipment — 0.2% | |||||
| 17,837 | American Power Conversion Corp. (b) | 432,726 | |||
| 24,500 | Energy Conversion Devices, Inc. (a)(b) | 552,230 | |||
| 984,956 | |||||
Industrial Conglomerates — 6.3% | |||||
| 453,100 | General Electric Co. | 16,402,220 | |||
| 286,400 | Honeywell International Inc. | 10,241,664 | |||
| 69,700 | Tyco International Ltd. | 2,182,307 | |||
| 28,826,191 | |||||
Machinery — 0.6% | |||||
| 46,400 | Deere & Co. | 2,901,856 | |||
Marine — 0.3% | |||||
| 38,087 | Alexander & Baldwin, Inc. (b) | 1,551,284 | |||
Road & Rail — 0.1% | |||||
| 20,900 | Laidlaw International Inc. (a) | 467,951 | |||
| TOTAL INDUSTRIALS | 57,636,227 | ||||
| INFORMATION TECHNOLOGY — 15.9% | |||||
Communications Equipment — 4.9% | |||||
| 3,443,600 | CIENA Corp. (a)(b) | 7,920,280 | |||
| 54,300 | Cisco Systems, Inc. (a) | 938,304 | |||
| 717,600 | Corning Inc. (a) | 9,867,000 | |||
| 1,599,703 | Finisar Corp. (a)(b) | 2,015,626 | |||
| 911,300 | JDS Uniphase Corp. (a)(b) | 1,348,724 | |||
| 12,100 | Juniper Networks, Inc. (a)(b) | 273,339 | |||
| 56,802 | NMS Communications Corp. (a) | 180,630 | |||
| 22,543,903 | |||||
Computers & Peripherals — 0.8% | |||||
| 100 | Applied Films Corp. (a) | 2,391 | |||
| 57,595 | Dell Inc. (a) | 2,006,034 | |||
See Notes to Financial Statements.
20 Travelers Series Fund Inc. | 2005 Semi-Annual Report
Table of Contents
| Schedules of Investments (unaudited) (continued) | April 30, 2005 |
STRATEGIC EQUITY PORTFOLIO
| SHARES | SECURITY | VALUE | |||
Computers & Peripherals — 0.8% (continued) | |||||
| 3,900 | International Business Machines Corp. | $ | 297,882 | ||
| 21,400 | NVIDIA Corp. (a) | 469,516 | |||
| 72,300 | Western Digital Corp. (a) | 917,487 | |||
| 3,693,310 | |||||
Electronic Equipment & Instruments — 0.5% | |||||
| 5,186 | Diebold, Inc. (b) | 250,847 | |||
| 147,900 | Symbol Technologies, Inc. | 1,977,423 | |||
| 2,228,270 | |||||
Internet Software & Services — 0.0% | |||||
| 9,700 | Akamai Technologies, Inc. (a) | 114,557 | |||
| 600 | Yahoo! Inc. (a) | 20,706 | |||
| 135,263 | |||||
IT Consulting & Services — 0.2% | |||||
| 19,400 | Anteon International Corp. (a) | 810,920 | |||
Semiconductor Equipment & Products — 2.0% | |||||
| 38,800 | Analog Devices, Inc. | 1,323,468 | |||
| 11,700 | Applied Materials, Inc. | 173,979 | |||
| 10,100 | ASML Holding N.V., New York Registered Shares (a) | 146,349 | |||
| 8,853 | Cymer, Inc. (a)(b) | 219,466 | |||
| 900 | Integrated Circuit Systems, Inc. (a) | 16,443 | |||
| 600 | Integrated Device Technology, Inc. (a) | 6,420 | |||
| 7,800 | Intel Corp. | 183,456 | |||
| 100 | KLA-Tencor Corp. | 3,902 | |||
| 210,203 | LTX Corp. (a)(b) | 807,180 | |||
| 263,400 | PMC-Sierra, Inc. (a) | 2,123,004 | |||
| 196,000 | Teradyne, Inc. (a) | 2,159,920 | |||
| 3,900 | Texas Instruments Inc. | 97,344 | |||
| 310,300 | United Microelectronics Corp., ADR (a)(b) | 1,008,475 | |||
| 32,400 | Volterra Semiconductor Corp. (a) | 345,708 | |||
| 11,600 | Xilinx, Inc. | 312,504 | |||
| 8,927,618 | |||||
Software — 7.5% | |||||
| 85,300 | Activision, Inc. (a) | 1,233,438 | |||
| 391,900 | BEA Systems, Inc. (a) | 2,704,110 | |||
| 6,012 | Computer Associates International, Inc. | 161,723 | |||
| 1,200 | Electronic Arts Inc. (a) | 64,068 | |||
| 1,144,123 | Microsoft Corp. | 28,946,312 | |||
| 18,500 | NDS Group PLC, Sponsored ADR (a)(b) | 578,495 | |||
| 97,400 | TIBCO Software Inc. (a) | 695,436 | |||
| 34,383,582 | |||||
| TOTAL INFORMATION TECHNOLOGY | 72,722,866 | ||||
See Notes to Financial Statements.
21 Travelers Series Fund Inc. | 2005 Semi-Annual Report
Table of Contents
| Schedules of Investments (unaudited) (continued) | April 30, 2005 |
STRATEGIC EQUITY PORTFOLIO
| SHARES | SECURITY | VALUE | |||
| MATERIALS — 4.2% | |||||
Chemicals — 1.5% | |||||
| 115,100 | Monsanto Co. | $ | 6,747,162 | ||
Metals & Mining — 2.7% | |||||
| 66,600 | Apex Silver Mines Ltd. (a)(b) | 873,792 | |||
| 163,100 | Glamis Gold Ltd. (a)(b) | 2,240,994 | |||
| 139,700 | Meridian Gold Inc. (a)(b) | 2,129,028 | |||
| 186,160 | Newmont Mining Corp. | 7,068,495 | |||
| 12,312,309 | |||||
| TOTAL MATERIALS | 19,059,471 | ||||
| TELECOMMUNICATION SERVICES — 8.1% | |||||
Diversified Telecommunication Services — 8.1% | |||||
| 175,600 | BellSouth Corp. | 4,651,644 | |||
| 736,200 | SBC Communications Inc. | 17,521,560 | |||
| 414,400 | Verizon Communications Inc. | 14,835,520 | |||
| TOTAL COMMUNICATION SERVICES | 37,008,724 | ||||
| TOTAL COMMON STOCK (Cost — $415,282,741) | 397,463,487 | ||||
| FOREIGN STOCK — 6.9% | |||||
Canada (c) — 1.0% | |||||
| 185,900 | Glamis Gold Ltd. (a) | 2,612,081 | |||
| 34,900 | Goldcorp Inc. | 452,893 | |||
| 197,400 | High River Gold Mines Ltd. (a) | 218,312 | |||
| 176,100 | IAMGOLD Corp. | 1,076,062 | |||
| 4,359,348 | |||||
France (c) — 2.2% | |||||
| 89,389 | Compagnie Generale des Etablissements Michelin, Class B Shares (b) | 5,435,277 | |||
| 48,600 | Groupe Danone (b) | 4,572,263 | |||
| 23,300 | Silicon-On-Insulator Technologies (SOITEC) (a) | 249,439 | |||
| 10,256,979 | |||||
Japan (c) — 0.2% | |||||
| 78,000 | Fujitsu Ltd. | 431,438 | |||
| 7,800 | Tokyo Electron Ltd. | 403,944 | |||
| 835,382 | |||||
Switzerland (c) — 3.3% | |||||
| 124,106 | Roche Holding AG (b) | 15,080,527 | |||
See Notes to Financial Statements.
22 Travelers Series Fund Inc. | 2005 Semi-Annual Report
Table of Contents
| Schedules of Investments (unaudited) (continued) | April 30, 2005 |
STRATEGIC EQUITY PORTFOLIO
| SHARES | SECURITY | VALUE | ||||
United Kingdom (c) — 0.2% |
| |||||
| 38,800 | Reuters Group PLC | $ | 286,452 | |||
| 77,700 | Sportingbet PLC (a) | 424,327 | ||||
| 710,779 | ||||||
| TOTAL FOREIGN STOCK (Cost — $31,431,909) | 31,243,015 | |||||
| FACE AMOUNT | ||||||
| CONVERTIBLE BONDS — 0.5% | ||||||
| INFORMATION TECHNOLOGY — 0.5% | ||||||
Communications Equipment — 0.5% |
| |||||
| $ 2,550,000 | CIENA Corp., Notes, 3.750% due 2/1/08 (Cost — $2,354,137) | 2,145,187 | ||||
| SHORT-TERM INVESTMENTS — 19.0% | ||||||
| REPURCHASE AGREEMENT — 7.9% | ||||||
| 35,920,000 | State Street Bank & Trust Co. dated 4/29/05, 2.600% due 5/2/05; Proceeds at maturity — $35,927,783; (Fully collateralized by U.S. Treasury Bond, 7.250% due 5/15/16; Market value — $36,644,637) (Cost — $35,920,000) | 35,920,000 | ||||
| SHARES | ||||||
| SECURITIES PURCHASED FROM SECURITIES LENDING COLLATERAL — 11.1% | ||||||
| 50,819,030 | State Street Navigator Securities Lending Trust Prime Portfolio (Cost — $50,819,030) | 50,819,030 | ||||
| TOTAL SHORT-TERM INVESTMENTS (Cost — $86,739,030) | 86,739,030 | |||||
| TOTAL INVESTMENTS — 113.5% (Cost — $535,807,817*) | 517,590,719 | |||||
Liabilities in Excess of Other Assets — (13.5)% | (61,450,090 | ) | ||||
| TOTAL NET ASSETS — 100.0% | $ | 456,140,629 | ||||
| (a) | Non-income producing security. |
| (b) | All or a portion of this security is on loan (See Notes 1 and 3). |
| (c) | Securities are fair valued at April 30, 2005 in accordance with policies adopted by the Board of Directors (See Note 1). |
| * | Aggregate cost for federal income tax purposes is substantially the same. |
Abbreviations used in this schedule: | ||||
| ADR | — | American Depositary Receipt | ||
| GDR | — | Global Depositary Receipt | ||
| PLC | — | Public Limited Company (British) | ||
See Notes to Financial Statements.
23 Travelers Series Fund Inc. | 2005 Semi-Annual Report
Table of Contents
| Schedules of Investments (unaudited) (continued) | April 30, 2005 |
VAN KAMPEN ENTERPRISE PORTFOLIO
| SHARES | SECURITY | VALUE | |||
| COMMON STOCK — 99.6% | |||||
| CONSUMER DISCRETIONARY — 13.0% | |||||
Hotels, Restaurants & Leisure — 3.3% | |||||
| 13,599 | Carnival Corp. | $ | 664,719 | ||
| 6,000 | Harrah’s Entertainment, Inc. (a) | 393,720 | |||
| 11,100 | Marriott International, Inc., Class A Shares | 696,525 | |||
| 12,205 | Starwood Hotels & Resorts Worldwide, Inc. | 663,220 | |||
| 2,418,184 | |||||
Household Durables — 1.3% | |||||
| 3,800 | The Black & Decker Corp. | 317,794 | |||
| 21,938 | D.R. Horton, Inc. | 669,109 | |||
| 986,903 | |||||
Leisure Equipment & Products — 0.4% | |||||
| 6,500 | Brunswick Corp. | 273,000 | |||
Media — 1.0% | |||||
| 34,500 | News Corp., Class A Shares | 527,160 | |||
| 7,800 | The Walt Disney Co. | 205,920 | |||
| 733,080 | |||||
Multi-Line Retail — 3.6% | |||||
| 4,800 | Nordstrom, Inc. | 243,984 | |||
| 20,400 | Target Corp. | 946,764 | |||
| 31,100 | Wal-Mart Stores, Inc. | 1,466,054 | |||
| 2,656,802 | |||||
Specialty Retail — 2.6% | |||||
| 7,100 | Abercrombie & Fitch Co., Class A Shares | 383,045 | |||
| 11,000 | American Eagle Outfitters, Inc. | 288,420 | |||
| 9,400 | Chico’s FAS, Inc. (b) | 240,922 | |||
| 13,868 | The Home Depot, Inc. | 490,511 | |||
| 9,800 | Pacific Sunwear of California, Inc. (b) | 221,578 | |||
| 5,700 | Urban Outfitters, Inc. (b) | 252,510 | |||
| 1,876,986 | |||||
Textiles & Apparel — 0.8% | |||||
| 12,200 | Coach, Inc. (b) | 326,960 | |||
| 5,741 | Reebok International Ltd. | 233,142 | |||
| 560,102 | |||||
| TOTAL CONSUMER DISCRETIONARY | 9,505,057 | ||||
| CONSUMER STAPLES — 11.5% | |||||
Beverages — 2.7% | |||||
| 13,700 | Brown-Forman Corp., Class B Shares | 760,350 | |||
| 8,800 | The Pepsi Bottling Group, Inc. | 252,296 | |||
See Notes to Financial Statements.
24 Travelers Series Fund Inc. | 2005 Semi-Annual Report
Table of Contents
| Schedules of Investments (unaudited) (continued) | April 30, 2005 |
VAN KAMPEN ENTERPRISE PORTFOLIO
| SHARES | SECURITY | VALUE | |||
Beverages — 2.7% (continued) | |||||
| 17,100 | PepsiCo, Inc. | $ | 951,444 | ||
| 1,964,090 | |||||
Food & Drug Retailing — 1.9% | |||||
| 26,900 | CVS Corp. | 1,387,502 | |||
Food Products — 1.8% | |||||
| 10,161 | The Hershey Company | 649,288 | |||
| 8,200 | McCormick & Co., Non-Voting Shares | 283,638 | |||
| 5,614 | Wm. Wrigley Jr. Co. | 388,096 | |||
| 1,321,022 | |||||
Household Products — 3.2% | |||||
| 7,300 | The Clorox Co. | 462,090 | |||
| 34,500 | The Procter & Gamble Co. | 1,868,175 | |||
| 2,330,265 | |||||
Personal Products — 1.9% | |||||
| 8,048 | Alberto-Culver Co. | 358,136 | |||
| 13,108 | Avon Products, Inc. | 525,369 | |||
| 9,700 | The Gillette Co. | 500,908 | |||
| 1,384,413 | |||||
| TOTAL CONSUMER STAPLES | 8,387,292 | ||||
| ENERGY — 1.4% | |||||
Energy Equipment & Services — 0.5% | |||||
| 8,300 | Baker Hughes Inc. | 366,196 | |||
Oil & Gas — 0.9% | |||||
| 2,200 | ConocoPhillips | 230,670 | |||
| 3,859 | Exxon Mobil Corp. | 220,079 | |||
| 1,800 | Total SA, Sponsored ADR (a) | 199,638 | |||
| 650,387 | |||||
| TOTAL ENERGY | 1,016,583 | ||||
| FINANCIALS — 8.0% | |||||
Banks — 2.8% | |||||
| 31,825 | Bank of America Corp. | 1,433,398 | |||
| 10,000 | Wells Fargo & Co. | 599,400 | |||
| 2,032,798 | |||||
Diversified Financials — 4.3% | |||||
| 21,487 | American Express Co. | 1,132,365 | |||
| 7,100 | Capital One Financial Corp. | 503,319 | |||
| 15,250 | JPMorgan Chase & Co. | 541,222 | |||
| 17,300 | Merrill Lynch & Co., Inc. | 932,989 | |||
| 3,109,895 | |||||
See Notes to Financial Statements.
25 Travelers Series Fund Inc. | 2005 Semi-Annual Report
Table of Contents
| Schedules of Investments (unaudited) (continued) | April 30, 2005 |
VAN KAMPEN ENTERPRISE PORTFOLIO
| SHARES | SECURITY | VALUE | |||
Insurance — 0.9% | |||||
| 7,449 | American International Group, Inc. | $ | 378,782 | ||
| 6,700 | Unitrin, Inc. | 304,850 | |||
| 683,632 | |||||
| TOTAL FINANCIALS | 5,826,325 | ||||
| HEALTHCARE — 29.5% | |||||
Biotechnology — 5.5% | |||||
| 25,500 | Amgen Inc. (b) | 1,484,355 | |||
| 11,323 | Biogen Idec Inc. (b) | 410,345 | |||
| 24,500 | Celgene Corp. (a)(b) | 928,795 | |||
| 6,300 | Cephalon, Inc. (a)(b) | 276,570 | |||
| 23,640 | Gilead Sciences, Inc. (b) | 877,044 | |||
| 3,977,109 | |||||
Healthcare Equipment & Supplies — 1.8% | |||||
| 580 | Lumenis Ltd. (a)(b) | 995 | |||
| 7,200 | Medtronic, Inc. | 379,440 | |||
| 10,800 | St. Jude Medical, Inc. (b) | 421,524 | |||
| 5,800 | Zimmer Holdings, Inc. (b) | 472,236 | |||
| 1,274,195 | |||||
Healthcare Providers & Services — 9.8% | |||||
| 11,854 | Aetna Inc. | 869,728 | |||
| 16,400 | Caremark Rx, Inc. (b) | 656,820 | |||
| 11,925 | Coventry Health Care, Inc. (b) | 816,028 | |||
| 6,791 | DaVita, Inc. (b) | 273,677 | |||
| 14,400 | Laboratory Corp. of America Holdings (b) | 712,800 | |||
| 7,947 | Lincare Holdings Inc. (b) | 339,178 | |||
| 9,200 | Manor Care, Inc. | 306,820 | |||
| 10,400 | PacifiCare Health Systems, Inc. (b) | 621,504 | |||
| 3,400 | Quest Diagnostics Inc. | 359,720 | |||
| 16,500 | UnitedHealth Group Inc. | 1,559,415 | |||
| 4,887 | WellPoint Inc. (b) | 624,314 | |||
| 7,140,004 | |||||
Pharmaceuticals — 12.4% | |||||
| 5,100 | Abbott Laboratories | 250,716 | |||
| 7,800 | Allergan, Inc. | 549,042 | |||
| 8,700 | Barr Pharmaceuticals Inc. (b) | 451,182 | |||
| 8,700 | Forest Laboratories, Inc. (b) | 310,416 | |||
| 43,399 | Johnson & Johnson | 2,978,473 | |||
| 8,300 | Medco Health Solutions, Inc. (b) | 423,051 | |||
| 57,833 | Pfizer Inc. | 1,571,323 | |||
See Notes to Financial Statements.
26 Travelers Series Fund Inc. | 2005 Semi-Annual Report
Table of Contents
| Schedules of Investments (unaudited) (continued) | April 30, 2005 |
VAN KAMPEN ENTERPRISE PORTFOLIO
| SHARES | SECURITY | VALUE | |||
Pharmaceuticals — 12.4% (continued) | |||||
| 75,909 | Schering-Plough Corp. | $ | 1,584,221 | ||
| 20,900 | Wyeth | 939,246 | |||
| 9,057,670 | |||||
| TOTAL HEALTHCARE | 21,448,978 | ||||
| INDUSTRIALS — 10.4% | |||||
Aerospace & Defense — 1.8% | |||||
| 5,748 | Precision Castparts Corp. | 423,398 | |||
| 8,800 | United Technologies Corp. | 895,136 | |||
| 1,318,534 | |||||
Air Freight & Couriers — 0.5% | |||||
| 4,100 | FedEx Corp. | 348,295 | |||
Commercial Services & Supplies — 2.7% | |||||
| 24,700 | Automatic Data Processing, Inc. | 1,072,968 | |||
| 8,100 | The Brink’s Co. | 261,306 | |||
| 10,798 | Career Education Corp. (b) | 339,489 | |||
| 7,400 | First Data Corp. | 281,422 | |||
| 1,955,185 | |||||
Electrical Equipment — 1.2% | |||||
| 12,100 | AMETEK, Inc. | 458,227 | |||
| 8,600 | Rockwell Automation, Inc. | 397,578 | |||
| 855,805 | |||||
Industrial Conglomerates — 2.4% | |||||
| 13,000 | General Electric Co. | 470,600 | |||
| 41,600 | Tyco International Ltd. | 1,302,496 | |||
| 1,773,096 | |||||
Machinery — 1.8% | |||||
| 13,100 | Danaher Corp. | 663,253 | |||
| 5,398 | Deere & Co. | 337,591 | |||
| 4,000 | Ingersoll-Rand Co., Class A Shares | 307,480 | |||
| 1,308,324 | |||||
| TOTAL INDUSTRIALS | 7,559,239 | ||||
| INFORMATION TECHNOLOGY — 23.2% | |||||
Communications Equipment — 5.7% | |||||
| 25,100 | ADTRAN, Inc. (a) | 520,323 | |||
| 24,800 | Andrew Corp. (b) | 304,296 | |||
| 61,600 | Cisco Systems, Inc. (b) | 1,064,448 | |||
| 13,412 | Comverse Technology, Inc. (b) | 305,659 | |||
| 33,000 | Corning Inc. (b) | 453,750 | |||
| 15,864 | Juniper Networks, Inc. (b) | 358,368 | |||
See Notes to Financial Statements.
27 Travelers Series Fund Inc. | 2005 Semi-Annual Report
Table of Contents
| Schedules of Investments (unaudited) (continued) | April 30, 2005 |
VAN KAMPEN ENTERPRISE PORTFOLIO
| SHARES | SECURITY | VALUE | |||
Communications Equipment — 5.7% (continued) | |||||
| 23,100 | Motorola, Inc. | $ | 354,354 | ||
| 17,200 | QUALCOMM Inc. | 600,108 | |||
| 2,622 | Research In Motion Ltd. (b) | 168,883 | |||
| 4,130,189 | |||||
Computers & Peripherals — 6.0% | |||||
| 61,357 | Dell Inc. (b) | 2,137,064 | |||
| 62,000 | EMC Corp. (b) | 813,440 | |||
| 18,200 | International Business Machines Corp. | 1,390,116 | |||
| 890 | Lexmark International, Inc., Class A Shares (b) | 61,810 | |||
| 4,402,430 | |||||
Electronic Equipment & Instruments — 0.4% | |||||
| 6,200 | Mettler-Toledo International Inc. (b) | 284,270 | |||
Internet Software & Services — 1.7% | |||||
| 35,200 | Yahoo! Inc. (b) | 1,214,752 | |||
IT Consulting & Services — 0.8% | |||||
| 5,300 | Affiliated Computer Services, Inc., Class A Shares (b) | 252,651 | |||
| 7,600 | Cognizant Technology Solutions Corp., Class A Shares (b) | 319,276 | |||
| 571,927 | |||||
Semiconductor Equipment & Products — 3.3% | |||||
| 7,200 | Analog Devices, Inc. | 245,592 | |||
| 37,131 | Applied Materials, Inc. | 552,138 | |||
| 54,200 | Intel Corp. | 1,274,784 | |||
| 10,300 | Linear Technology Corp. | 368,122 | |||
| 2,440,636 | |||||
Software — 5.3% | |||||
| 15,200 | Adobe Systems, Inc. | 903,944 | |||
| 534 | Computer Associates International, Inc. | 14,365 | |||
| 69,600 | Microsoft Corp. | 1,760,880 | |||
| 22,425 | SAP AG, Sponsored ADR (a) | 884,218 | |||
| 13,900 | Symantec Corp. (b) | 261,042 | |||
| 3,824,449 | |||||
| TOTAL INFORMATION TECHNOLOGY | 16,868,653 | ||||
| TELECOMMUNICATION SERVICES — 2.6% | |||||
Diversified Telecommunication Services — 2.6% | |||||
| 55,156 | Sprint Corp. | 1,227,772 | |||
| 18,341 | Verizon Communications Inc. | 656,608 | |||
| TOTAL TELECOMMUNICATION SERVICES | 1,884,380 | ||||
| TOTAL COMMON STOCK (Cost — $69,994,866) | 72,496,507 | ||||
See Notes to Financial Statements.
28 Travelers Series Fund Inc. | 2005 Semi-Annual Report
Table of Contents
| Schedules of Investments (unaudited) (continued) | April 30, 2005 |
VAN KAMPEN ENTERPRISE PORTFOLIO
| WARRANTS | SECURITY | VALUE | ||||
| WARRANTS — 0.0% | ||||||
| 1,831 | Lucent Technologies Inc. (b) (Cost — $0) | $ | 879 | |||
| FACE AMOUNT | ||||||
| SHORT-TERM INVESTMENTS — 4.7% | ||||||
| DISCOUNT NOTES — 0.8% | ||||||
| $ 586,000 | Federal National Mortgage Association, Discount Notes, | 585,953 | ||||
| SHARES | ||||||
| SECURITIES PURCHASED FROM SECURITIES LENDING COLLATERAL — 3.9% | ||||||
| 2,878,257 | State Street Navigator Securities Lending Trust Prime Portfolio (Cost — $2,878,257) | 2,878,257 | ||||
| TOTAL SHORT-TERM INVESTMENTS (Cost — $3,464,210) | 3,464,210 | |||||
| TOTAL INVESTMENTS — 104.3% (Cost — $73,459,076*) | 75,961,596 | |||||
Liabilities in Excess of Other Assets — (4.3)% | (3,159,811 | ) | ||||
| TOTAL NET ASSETS — 100.0% | $ | 72,801,785 | ||||
| (a) | All or a portion of this security is on loan (See Notes 1 and 3). |
| (b) | Non-income producing security. |
| * | Aggregate cost for federal income tax purposes is substantially the same. |
Abbreviation used in this schedule: | ||||
| ADR | — | American Depositary Receipt | ||
See Notes to Financial Statements.
29 Travelers Series Fund Inc. | 2005 Semi-Annual Report
Table of Contents
| Statements of Assets and Liabilities (unaudited) | April 30, 2005 |
| Smith Barney Large Cap Value Portfolio | Strategic Equity Portfolio | Van Kampen Enterprise Portfolio | ||||||||||
| ASSETS: | ||||||||||||
Investments, at value | $ | 313,367,893 | $ | 517,590,719 | $ | 75,961,596 | ||||||
Cash | 28 | 148 | 1,030 | |||||||||
Receivable for securities sold | 1,030,230 | 3,689,242 | — | |||||||||
Dividends and interest receivable | 306,531 | 671,748 | 40,260 | |||||||||
Receivable for open foreign currency contracts (Notes 1 and 3) | — | 861 | — | |||||||||
Prepaid expenses | 4,021 | 5,463 | 1,620 | |||||||||
Other receivables | — | 108,845 | — | |||||||||
Total Assets | 314,708,703 | 522,067,026 | 76,004,506 | |||||||||
| LIABILITIES: | ||||||||||||
Payable for securities purchased | 954,974 | 13,620,645 | — | |||||||||
Management fees payable | 158,390 | 288,665 | 42,706 | |||||||||
Payable for Fund shares reacquired | 152,785 | 1,142,388 | 244,446 | |||||||||
Transfer agency services payable | 834 | 834 | 834 | |||||||||
Payable for open foreign currency contracts (Notes 1 and 3) | 328 | — | — | |||||||||
Directors’ fees | 279 | 368 | 593 | |||||||||
Payable for loaned securities collateral | — | 50,819,030 | 2,878,257 | |||||||||
Accrued expenses | 55,349 | 54,467 | 35,885 | |||||||||
Total Liabilities | 1,322,939 | 65,926,397 | 3,202,721 | |||||||||
Total Net Assets | $ | 313,385,764 | $ | 456,140,629 | $ | 72,801,785 | ||||||
| NET ASSETS: | ||||||||||||
Par value of capital shares (Note 5) | $ | 182 | $ | 287 | $ | 64 | ||||||
Capital paid in excess of par value | 324,029,875 | 687,895,917 | 137,335,166 | |||||||||
Undistributed net investment income | 1,311,156 | 1,475,944 | 9,313 | |||||||||
Accumulated net realized loss from investment transactions and foreign currencies | (38,704,018 | ) | (215,017,328 | ) | (67,045,278 | ) | ||||||
Net unrealized appreciation (depreciation) of investments and foreign currencies | 26,748,569 | (18,214,191 | ) | 2,502,520 | ||||||||
Total Net Assets | $ | 313,385,764 | $ | 456,140,629 | $ | 72,801,785 | ||||||
Shares Outstanding | 18,202,891 | 28,666,392 | 6,423,274 | |||||||||
Net Asset Value | $17.22 | $15.91 | $11.33 | |||||||||
See Notes to Financial Statements.
30 Travelers Series Fund Inc. | 2005 Semi-Annual Report
Table of Contents
| Statements of Operations (unaudited) |
For the Six Months Ended April 30, 2005
| Smith Barney Large Cap Value Portfolio | Strategic Equity Portfolio | Van Kampen Enterprise Portfolio | ||||||||||
| INVESTMENT INCOME: | ||||||||||||
Dividends | $ | 4,305,473 | $ | 5,823,752 | $ | 580,428 | ||||||
Interest | 138,138 | 477,003 | 20,072 | |||||||||
Securities lending | — | 164,428 | 826 | |||||||||
Less: Foreign withholding tax | (59,663 | ) | (35,928 | ) | — | |||||||
Total Investment Income | 4,383,948 | 6,429,255 | 601,326 | |||||||||
| EXPENSES: | ||||||||||||
Management fees (Note 2) | 1,005,526 | 1,986,581 | 272,937 | |||||||||
Shareholder communications | 38,757 | 6,464 | 15,264 | |||||||||
Audit and legal | 24,357 | 19,949 | 17,448 | |||||||||
Custody | 20,203 | 61,955 | 12,230 | |||||||||
Directors’ fees | 5,145 | 6,793 | 606 | |||||||||
Transfer agency services (Note 2) | 2,504 | 2,502 | 2,502 | |||||||||
Other | 5,834 | 8,600 | 1,980 | |||||||||
Total Expenses | 1,102,326 | 2,092,844 | 322,967 | |||||||||
Net Investment Income | 3,281,622 | 4,336,411 | 278,359 | |||||||||
| REALIZED AND UNREALIZED GAIN (LOSS) ON INVESTMENTS AND FOREIGN CURRENCIES (NOTES 1 AND 3): | ||||||||||||
Realized Gain (Loss) From: | ||||||||||||
Investment transactions | 5,340,331 | 20,120,153 | 3,573,131 | |||||||||
Foreign currencies | 161 | (43,676 | ) | — | ||||||||
Net Realized Gain | 5,340,492 | 20,076,477 | 3,573,131 | |||||||||
Net Change in Unrealized Appreciation/ Depreciation From: | ||||||||||||
Investments | 842,058 | (31,967,532 | ) | (1,000,653 | ) | |||||||
Foreign currencies | (218 | ) | 1,428 | — | ||||||||
Net Change in Unrealized Appreciation/Depreciation | 841,840 | (31,966,104 | ) | (1,000,653 | ) | |||||||
Net Gain (Loss) on Investments and Foreign Currencies | 6,182,332 | (11,889,627 | ) | 2,572,478 | ||||||||
Increase (Decrease) in Net Assets | $ | 9,463,954 | $ | (7,553,216 | ) | $ | 2,850,837 | |||||
See Notes to Financial Statements.
31 Travelers Series Fund Inc. | 2005 Semi-Annual Report
Table of Contents
| Statements of Changes in Net Assets | ||
For the Six Months Ended April 30, 2005 (unaudited)
and the Year Ended October 31, 2004
| Smith Barney Large Cap Value Portfolio | 2005 | 2004 | ||||||
| OPERATIONS: | ||||||||
Net investment income | $ | 3,281,622 | $ | 5,015,148 | ||||
Net realized gain | 5,340,492 | 22,083,608 | ||||||
Net change in unrealized appreciation/depreciation | 841,840 | 10,192,674 | ||||||
Increase in Net Assets From Operations | 9,463,954 | 37,291,430 | ||||||
| DISTRIBUTIONS TO SHAREHOLDERS FROM (NOTE 1): | ||||||||
Net investment income | (6,400,006 | ) | (5,914,007 | ) | ||||
Decrease in Net Assets From Distributions to Shareholders | (6,400,006 | ) | (5,914,007 | ) | ||||
| FUND SHARE TRANSACTIONS (NOTE 5): | ||||||||
Net proceeds from sale of shares | 1,276,403 | 4,321,708 | ||||||
Net asset value of shares issued for reinvestment of distributions | 6,400,006 | 5,914,007 | ||||||
Cost of shares reacquired | (30,706,293 | ) | (74,452,875 | ) | ||||
Decrease in Net Assets From Fund Share Transactions | (23,029,884 | ) | (64,217,160 | ) | ||||
Decrease in Net Assets | (19,965,936 | ) | (32,839,737 | ) | ||||
| NET ASSETS: | ||||||||
Beginning of period | 333,351,700 | 366,191,437 | ||||||
End of period* | $ | 313,385,764 | $ | 333,351,700 | ||||
* Includes undistributed net investment income of: | $1,311,156 | $4,429,540 | ||||||
See Notes to Financial Statements.
32 Travelers Series Fund Inc. | 2005 Semi-Annual Report
Table of Contents
| Statements of Changes in Net Assets (continued) | ||
For the Six Months Ended April 30, 2005 (unaudited)
and the Year Ended October 31, 2004
| Strategic Equity Portfolio | 2005 | 2004 | ||||||
| OPERATIONS: | ||||||||
Net investment income | $ | 4,336,411 | $ | 4,350,288 | ||||
Net realized gain | 20,076,477 | 30,288,099 | ||||||
Net change in unrealized appreciation/depreciation | (31,966,104 | ) | 9,523,067 | |||||
Increase (Decrease) in Net Assets From Operations | (7,553,216 | ) | 44,161,454 | |||||
| DISTRIBUTIONS TO SHAREHOLDERS FROM (NOTE 1): | ||||||||
Net investment income | (7,201,167 | ) | — | |||||
Decrease in Net Assets From Distributions to Shareholders | (7,201,167 | ) | — | |||||
| FUND SHARE TRANSACTIONS (NOTE 5): | ||||||||
Net proceeds from sale of shares | 373,137 | 1,522,056 | ||||||
Net asset value of shares issued for reinvestment of distributions | 7,201,167 | — | ||||||
Cost of shares reacquired | (44,575,385 | ) | (87,338,249 | ) | ||||
Decrease in Net Assets From Fund Share Transactions | (37,001,081 | ) | (85,816,193 | ) | ||||
Decrease in Net Assets | (51,755,464 | ) | (41,654,739 | ) | ||||
| NET ASSETS: | ||||||||
Beginning of period | 507,896,093 | 549,550,832 | ||||||
End of period* | $ | 456,140,629 | $ | 507,896,093 | ||||
* Includes undistributed net investment income of: | $1,475,944 | $4,340,700 | ||||||
See Notes to Financial Statements.
33 Travelers Series Fund Inc. | 2005 Semi-Annual Report
Table of Contents
| Statements of Changes in Net Assets (continued) | ||
For the Six Months Ended April 30, 2005 (unaudited)
and the Year Ended October 31, 2004
| Van Kampen Enterprise Portfolio | 2005 | 2004 | ||||||
| OPERATIONS: | ||||||||
Net investment income | $ | 278,359 | $ | 228,592 | ||||
Net realized gain | 3,573,131 | 9,114,312 | ||||||
Net change in unrealized appreciation/depreciation | (1,000,653 | ) | (9,035,638 | ) | ||||
Increase in Net Assets From Operations | 2,850,837 | 307,266 | ||||||
| DISTRIBUTIONS TO SHAREHOLDERS FROM (NOTE 1): | ||||||||
Net investment income | (440,542 | ) | (134,925 | ) | ||||
Decrease in Net Assets From Distributions to Shareholders | (440,542 | ) | (134,925 | ) | ||||
| FUND SHARE TRANSACTIONS (NOTE 5): | ||||||||
Net proceeds from sale of shares | 308,905 | 1,291,178 | ||||||
Net asset value of shares issued for reinvestment of distributions | 440,542 | 134,925 | ||||||
Cost of shares reacquired | (9,643,683 | ) | (18,943,158 | ) | ||||
Decrease in Net Assets From Fund Share Transactions | (8,894,236 | ) | (17,517,055 | ) | ||||
Decrease in Net Assets | (6,483,941 | ) | (17,344,714 | ) | ||||
| NET ASSETS: | ||||||||
Beginning of period | 79,285,726 | 96,630,440 | ||||||
End of period* | $ | 72,801,785 | $ | 79,285,726 | ||||
* Includes undistributed net investment income of: | $9,313 | $171,496 | ||||||
See Notes to Financial Statements.
34 Travelers Series Fund Inc. | 2005 Semi-Annual Report
Table of Contents
| Financial Highlights |
For a share of capital stock outstanding throughout each year or period ended October 31, unless otherwise noted:
| Smith Barney Large Cap Value Portfolio | 2005(1) | 2004 | 2003 | 2002 | 2001 | 2000 | ||||||||||||
Net Asset Value, Beginning of Period | $17.09 | $15.68 | $13.24 | $17.47 | $20.74 | $19.83 | ||||||||||||
Income (Loss) From Operations: | ||||||||||||||||||
Net investment income | 0.18 | 0.26 | 0.28 | 0.32 | 0.26 | 0.30 | ||||||||||||
Net realized and unrealized gain (loss) | 0.29 | 1.41 | 2.49 | (4.24 | ) | (2.56 | ) | 1.34 | ||||||||||
Total Income (Loss) From Operations | 0.47 | 1.67 | 2.77 | (3.92 | ) | (2.30 | ) | 1.64 | ||||||||||
Less Distributions From: | ||||||||||||||||||
Net investment income | (0.34 | ) | (0.26 | ) | (0.33 | ) | (0.31 | ) | (0.27 | ) | (0.26 | ) | ||||||
Net realized gains | — | — | — | — | (0.70 | ) | (0.47 | ) | ||||||||||
Total Distributions | (0.34 | ) | (0.26 | ) | (0.33 | ) | (0.31 | ) | (0.97 | ) | (0.73 | ) | ||||||
Net Asset Value, End of Period | $17.22 | $17.09 | $15.68 | $13.24 | $17.47 | $20.74 | ||||||||||||
Total Return(2) | 2.63 | %‡ | 10.69 | % | 21.38 | % | (22.45 | )% | (11.58 | )% | 8.62 | % | ||||||
Net Assets, End of Period (millions) | $313 | $333 | $366 | $346 | $504 | $553 | ||||||||||||
Ratios to Average Net Assets: | ||||||||||||||||||
Expenses(3) | 0.66 | %† | 0.68 | %(4) | 0.69 | % | 0.68 | % | 0.67 | % | 0.66 | % | ||||||
Net investment income | 1.96 | † | 1.38 | 1.85 | 1.59 | 1.42 | 1.45 | |||||||||||
Portfolio Turnover Rate | 23 | % | 37 | % | 96 | % | 68 | % | 29 | % | 23 | % | ||||||
| (1) | For the six months ended April 30, 2005 (unaudited). |
| (2) | Performance figures may reflect fee waivers and/or expense reimbursements. Past performance is no guarantee of future results. In the absence of fee waivers and/or expense reimbursements, the total return would be lower. Total returns do not reflect expenses associated with the separate account such as administrative fees, account charges and surrender charges which, if reflected, would reduce the total returns for all periods shown. |
| (3) | As a result of a voluntary expense limitation, the expense ratio will not exceed 1.25%. |
| (4) | The investment manager voluntarily waived a portion of its management fee for the year ended October 31, 2004. The actual expense ratio did not change due to this waiver. |
| ‡ | Total return is not annualized, as it may not be representative of the total return for the year. |
| † | Annualized. |
See Notes to Financial Statements.
35 Travelers Series Fund Inc. | 2005 Semi-Annual Report
Table of Contents
| Financial Highlights (continued) |
For a share of capital stock outstanding throughout each year or period ended October 31, unless otherwise noted:
| Strategic Equity Portfolio | 2005(1) | 2004 | 2003 | 2002 | 2001 | 2000 | ||||||||||||
Net Asset Value, Beginning of Period | $16.44 | $15.16 | $12.59 | $16.67 | $28.63 | $28.35 | ||||||||||||
Income (Loss) From Operations: | ||||||||||||||||||
Net investment income (loss) | 0.15 | 0.14 | (0.03 | ) | 0.04 | 0.07 | 0.05 | |||||||||||
Net realized and unrealized gain (loss) | (0.44 | ) | 1.14 | 2.62 | (4.05 | ) | (8.60 | ) | 2.66 | |||||||||
Total Income (Loss) From Operations | (0.29 | ) | 1.28 | 2.59 | (4.01 | ) | (8.53 | ) | 2.71 | |||||||||
Less Distributions From: | ||||||||||||||||||
Net investment income | (0.24 | ) | — | (0.02 | ) | (0.07 | ) | (0.05 | ) | (0.03 | ) | |||||||
Net realized gains | — | — | — | — | (3.38 | ) | (2.40 | ) | ||||||||||
Total Distributions | (0.24 | ) | — | (0.02 | ) | (0.07 | ) | (3.43 | ) | (2.43 | ) | |||||||
Net Asset Value, End of Period | $15.91 | $16.44 | $15.16 | $12.59 | $16.67 | $28.63 | ||||||||||||
Total Return(2) | (1.90 | )%‡ | 8.44 | % | 20.57 | % | (24.05 | )% | (32.05 | )% | 9.27 | % | ||||||
Net Assets, End of Period (millions) | $456 | $508 | $550 | $516 | $845 | $1,370 | ||||||||||||
Ratios to Average Net Assets: | ||||||||||||||||||
Expenses(3) | 0.84 | %† | 0.85 | %(4) | 0.84 | % | 0.83 | % | 0.82 | % | 0.81 | % | ||||||
Net investment income (loss) | 1.75 | † | 0.81 | (0.20 | ) | 0.19 | 0.31 | 0.17 | ||||||||||
Portfolio Turnover Rate | 130 | % | 213 | % | 167 | % | 100 | % | 46 | % | 47 | % | ||||||
| (1) | For the six months ended April 30, 2005 (unaudited). |
| (2) | Performance figures may reflect fee waivers and/or expense reimbursements. Past performance is no guarantee of future results. In the absence of fee waivers and/or expense reimbursements, the total return would be lower. Total returns do not reflect expenses associated with the separate account such as administrative fees, account charges and surrender charges which, if reflected, would reduce the total returns for all periods shown. |
| (3) | As a result of a voluntary expense limitation, the expense ratio will not exceed 1.25%. |
| (4) | The investment manager voluntarily waived a portion of its management fee for the year ended October 31, 2004. The actual expense ratio did not change due to this waiver. |
| ‡ | Total return is not annualized, as it may not be representative of the total return for the year. |
| † | Annualized. |
See Notes to Financial Statements.
36 Travelers Series Fund Inc. | 2005 Semi-Annual Report
Table of Contents
| Financial Highlights (continued) |
For a share of capital stock outstanding throughout each year or period ended October 31, unless otherwise noted:
| Van Kampen Enterprise Portfolio | 2005(1) | 2004 | 2003 | 2002 | 2001 | 2000 | ||||||||||||
Net Asset Value, Beginning of Period | $11.02 | $11.03 | $ 9.40 | $11.81 | $25.60 | $25.52 | ||||||||||||
Income (Loss) From Operations: | ||||||||||||||||||
Net investment income (loss) | 0.04 | 0.03 | 0.01 | 0.05 | 0.03 | (0.06 | ) | |||||||||||
Net realized and unrealized gain (loss) | 0.33 | (0.02 | ) | 1.67 | (2.42 | ) | (9.05 | ) | 3.87 | |||||||||
Total Income (Loss) From Operations | 0.37 | 0.01 | 1.68 | (2.37 | ) | (9.02 | ) | 3.81 | ||||||||||
Less Distributions From: | ||||||||||||||||||
Net investment income | (0.06 | ) | (0.02 | ) | (0.05 | ) | (0.04 | ) | (0.00 | )* | (0.00 | )* | ||||||
Net realized gains | — | — | — | — | (4.77 | ) | (3.73 | ) | ||||||||||
Total Distributions | (0.06 | ) | (0.02 | ) | (0.05 | ) | (0.04 | ) | (4.77 | ) | (3.73 | ) | ||||||
Net Asset Value, End of Period | $11.33 | $11.02 | $11.03 | $ 9.40 | $11.81 | $25.60 | ||||||||||||
Total Return(2) | 3.37 | %‡ | 0.05 | % | 17.93 | % | (20.07 | )% | (37.52 | )% | 13.92 | % | ||||||
Net Assets, End of Period (millions) | $73 | $79 | $97 | $100 | $165 | $331 | ||||||||||||
Ratios to Average Net Assets: | ||||||||||||||||||
Expenses(3) | 0.83 | %† | 0.80 | %(4) | 0.80 | % | 0.76 | % | 0.74 | % | 0.72 | % | ||||||
Net investment income (loss) | 0.71 | † | 0.26 | 0.13 | 0.30 | 0.18 | (0.22 | ) | ||||||||||
Portfolio Turnover Rate | 31 | % | 157 | % | 123 | % | 87 | % | 107 | % | 117 | % | ||||||
| (1) | For the six months ended April 30, 2005 (unaudited). |
| (2) | Performance figures may reflect fee waivers and/or expense reimbursements. Past performance is no guarantee of future results. In the absence of fee waivers and/or expense reimbursements, the total return would be lower. Total returns do not reflect expenses associated with the separate account such as administrative fees, account charges and surrender charges which, if reflected, would reduce the total returns for all periods shown. |
| (3) | As a result of a voluntary expense limitation, the expense ratio will not exceed 1.25%. |
| (4) | The investment adviser voluntarily waived a portion of its management fee for the year ended October 31, 2004. The actual expense ratio did not change due to this waiver. |
| * | Amount represents less than $0.01 per share. |
| ‡ | Total return is not annualized, as it may not be representative of the total return for the year. |
| † | Annualized. |
See Notes to Financial Statements.
37 Travelers Series Fund Inc. | 2005 Semi-Annual Report
Table of Contents
Notes to Financial Statements (unaudited)
| 1. | Significant Accounting Policies |
The Smith Barney Large Cap Value Portfolio (“SBLCV”), Strategic Equity Portfolio (“SEP”) and Van Kampen Enterprise Portfolio (“VKEP”) (“Fund(s)”) are separate diversified investment funds of the Travelers Series Fund Inc. (“Company”). The Company, a Maryland corporation, is registered under the Investment Company Act of 1940 (the “1940 Act”), as amended, as an open-end management investment company.
The following are significant accounting policies consistently followed by the Funds and are in conformity with U.S. generally accepted accounting principles (“GAAP”). Estimates and assumptions are required to be made regarding assets, liabilities and changes in net assets resulting from operations when financial statements are prepared. Changes in the economic environment, financial markets and any other parameters used in determining these estimates could cause actual results to differ.
(a) Investment Valuation. Equity securities for which market quotations are available are valued at the last sale price or official closing price on the primary market or exchange on which they trade. Debt securities are valued at the mean between the bid and asked price provided by an independent pricing service that are based on transactions in debt obligations, quotations from bond dealers, market transactions in comparable securities and various relationships between securities. When prices are not readily available, or are determined not to reflect fair value, such as when the value of a security has been significantly affected by events after the close of the exchange or market on which the security is principally traded, but before the Funds calculate their net asset value, the Funds may value these investments at fair value as determined in accordance with the procedures approved by the Funds’ Board of Directors. Short-term obligations with maturities of 60 days or less are valued at amortized cost, which approximates market value.
(b) Repurchase Agreements. When entering into repurchase agreements, it is the Funds’ policy that their custodian or a third party custodian take possession of the underlying collateral securities, the market value of which at least equals the principal amount of the repurchase transaction, including accrued interest. To the extent that any repurchase transaction exceeds one business day, the value of the collateral is marked-to-market to ensure the adequacy of the
38 Travelers Series Fund Inc. | 2005 Semi-Annual Report
Table of Contents
Notes to Financial Statements (unaudited) (continued)
collateral. If the seller defaults, and the market value of the collateral declines or if bankruptcy proceedings are commenced with respect to the seller of the security, realization of the collateral by the Funds may be delayed or limited.
(c) Forward Foreign Currency Contracts. The Funds may enter into forward foreign currency contracts to hedge against foreign currency exchange rate risk on its non-U.S. dollar denominated securities or to facilitate settlement of foreign currency denominated portfolio transactions. A forward foreign currency contract is an agreement between two parties to buy and sell a currency at a set price on a future date. The contract is marked-to-market daily and the change in value is recorded by the Funds as an unrealized gain or loss. When a forward foreign currency contract is extinguished, through either delivery or offset by entering into another forward foreign currency contract, the Funds record a realized gain or loss equal to the difference between the value of the contract at the time it was opened and the value of the contract at the time it was extinguished.
Forward foreign currency contracts involve elements of market risk in excess of the amounts reflected in the Statements of Assets and Liabilities. The Funds bear the risk of an unfavorable change in the foreign exchange rate underlying the forward foreign currency contract. Risks may also arise upon entering into these contracts from the potential inability of the counterparties to meet the terms of their contracts.
(d) Lending of Portfolio Securities. The Funds have an agreement with their custodian whereby the custodian may lend securities owned by the Funds to brokers, dealers and other financial organizations. In exchange for lending securities under the terms of the agreement with their custodian, the Funds receive a lender’s fee. Fees earned by the Funds on securities lending are recorded as securities lending income. Loans of securities by the Funds are collateralized by cash, U.S. government securities or high quality money market instruments that are maintained at all times in an amount at least equal to the current market value of the loaned securities, plus a margin which varies depending on the type of securities loaned. The custodian establishes and maintains the collateral in a segregated account. The Fund has the right under the lending agreement to recover the securities from the borrower on demand.
The Funds maintain the risk of any loss on the securities on loan as well as the potential loss on investments purchased with cash collateral received from securities lending.
39 Travelers Series Fund Inc. | 2005 Semi-Annual Report
Table of Contents
Notes to Financial Statements (unaudited) (continued)
(e) Foreign Currency Translation. Investment securities and other assets and liabilities denominated in foreign currencies are translated into U.S. dollar amounts based upon prevailing exchange rates on the date of valuation. Purchases and sales of investment securities and income and expense items denominated in foreign currencies are translated into U.S. dollar amounts based upon prevailing exchange rates on the respective dates of such transactions.
The Funds do not isolate that portion of the results of operations resulting from changes in foreign exchange rates on investments from the fluctuations arising from changes in market prices of securities held. Such fluctuations are included with the net realized and unrealized gain or loss on investments.
Net realized foreign exchange gains or losses arise from sales of foreign currencies, including gains and losses on forward foreign currency contracts, currency gains or losses realized between the trade and settlement dates on securities transactions and the difference between the amounts of dividends, interest and foreign withholding taxes recorded on the Funds’ books and the U.S. dollar equivalent of the amounts actually received or paid. Net unrealized foreign exchange gains and losses arise from changes in the fair values of assets and liabilities, other than investments in securities, at the date of valuation, resulting from changes in exchange rates.
Foreign security and currency transactions may involve certain considerations and risks not typically associated with those of U.S. dollar denominated transactions as a result of, among other factors, the possibility of lower levels of governmental supervision and regulation of foreign securities markets and the possibility of political or economic instability.
(f) Security Transactions and Investment Income. Security transactions are accounted for on a trade date basis. Interest income, adjusted for amortization of premium and accretion of discount, is recorded on the accrual basis. Dividend income is recorded on the ex-dividend date. Foreign dividend income is recorded on the ex-dividend date or as soon as practical after the Funds determine the existence of a dividend declaration after exercising reasonable due diligence. The cost of investments sold is determined by use of the specific identification method.
40 Travelers Series Fund Inc. | 2005 Semi-Annual Report
Table of Contents
Notes to Financial Statements (unaudited) (continued)
(g) Distributions to Shareholders. Distributions from net investment income and distributions of net realized gains, if any, are declared at least annually. Distributions to shareholders of the Funds are recorded on the ex-dividend date and are determined in accordance with income tax regulations, which may differ from GAAP.
(h) Federal and Other Taxes. It is the Funds’ policy to comply with the federal income and excise tax requirements of the Internal Revenue Code of 1986, as amended, applicable to regulated investment companies. Accordingly, the Funds intend to distribute substantially all of its taxable income and net realized gains on investments, if any, to shareholders each year. Therefore, no federal income tax provision is required in the Funds’ financial statements. Under the applicable foreign tax laws, a withholding tax may be imposed on interest, dividends and capital gains at various rates.
(i) Reclassifications. GAAP requires that certain components of net assets be adjusted to reflect permanent differences between financial and tax reporting. These reclassifications have no effect on net assets or net asset values per share.
| 2. | Management Agreement and Transactions with Affiliates |
Smith Barney Fund Management LLC (“SBFM”), an indirect wholly-owned subsidiary of Citigroup Inc. (“Citigroup”), acts as the investment manager of SBLCV. SBLCV pays SBFM a management fee calculated at an annual rate of 0.60% of SBLCV’s average daily net assets up to $500 million; 0.55% of the average daily net assets in excess of $500 million up to and including $1 billion; and 0.50% of the average daily net assets in excess of $1 billion.
Travelers Investment Adviser, Inc. (“TIA”), an affiliate of SBFM, acts as the investment manager of SEP and VKEP. SEP and VKEP pay TIA a management fee calculated at an annual rate of 0.80% and 0.70%, respectively, of the average daily net assets of SEP and VKEP. These fees are calculated daily and paid monthly.
For the six months ended April 30, 2005, the Funds each had a voluntary expense limitation in place of 1.25%. These expense limitations can be terminated at any time by TIA.
41 Travelers Series Fund Inc. | 2005 Semi-Annual Report
Table of Contents
Notes to Financial Statements (unaudited) (continued)
TIA has entered into a sub-advisory agreement with Fidelity Management & Research Co. (“FMR”). Pursuant to the sub-advisory agreement, FMR is responsible for the day-to-day portfolio operations and investment decisions and is compensated by TIA for such services at an annual rate of 0.45% of the first $250 million of SEP’s average daily net assets, 0.40% on the next $500 million of SEP’s average daily net assets, and 0.35% of SEP’s average daily net assets in excess of $750 million.
In addition, TIA has entered into a sub-advisory agreement with Van Kampen Asset Management (“VKAM”). Pursuant to the sub-advisory agreement, VKAM is responsible for the day-to-day portfolio operations and investment decisions and is compensated by TIA for such services at an annual rate of 0.325% of the average daily net assets of VKEP.
TIA has entered into a sub-administrative services agreement with SBFM. TIA pays SBFM, as sub-administrator, a fee calculated at an annual rate of 0.10% of the average daily net assets of SEP and VKEP.
Citicorp Trust Bank, fsb. (“CTB”), another subsidiary of Citigroup, acts as the Funds’ transfer agent. PFPC Inc. (“PFPC”) acts as the Funds’ sub-transfer agent. CTB receives account fees and asset-based fees that vary according to the size and type of account. PFPC is responsible for shareholder recordkeeping and financial processing for all shareholder accounts and is paid by CTB. For the six months ended April 30, 2005, each Fund paid transfer agent fees of $2,083 to CTB.
For the six months ended April 30, 2005, Citigroup Global Markets Inc., another indirect wholly-owned subsidiary of Citigroup, and its affiliates received brokerage commissions of $8,599 and $108 from SBLCV and SEP, respectively.
Most of the officers and one Director of the Company are employees of Citigroup or its affiliates and do not receive compensation from the Company.
| 3. | Investments |
During the six months ended April 30, 2005, the aggregate cost of purchases and proceeds from sales of investments (excluding short-term investments) were as follows:
| SBLCV | SEP | VKEP | |||||||
Purchases | $ | 74,560,274 | $ | 609,490,082 | $ | 23,416,586 | |||
Sales | 100,859,273 | �� | 649,454,301 | 30,095,856 | |||||
42 Travelers Series Fund Inc. | 2005 Semi-Annual Report
Table of Contents
Notes to Financial Statements (unaudited) (continued)
At April 30, 2005, the aggregate gross unrealized appreciation and depreciation of investments for federal income tax purposes were substantially as follows:
| SBLCV | SEP | VKEP | ||||||||||
Gross unrealized appreciation | $ | 38,898,725 | $ | 11,351,230 | $ | 5,931,038 | ||||||
Gross unrealized depreciation | (12,149,938 | ) | (29,568,328 | ) | (3,428,518 | ) | ||||||
Net unrealized appreciation (depreciation) | $ | 26,748,787 | $ | (18,217,098 | ) | $ | 2,502,520 | |||||
At April 30, 2005, SBLCV and SEP had open foreign currency contracts as described below. The unrealized gain (loss) on the contracts reflected in the accompanying financial statements were as follows:
| SBLCV | Local Currency | Market Value | Settlement Date | Unrealized Loss | |||||
Contracts to Buy: | |||||||||
Euro Dollar | 84,637 | $109,338 | 5/2/05 | $(309 | ) | ||||
Euro Dollar | 103,147 | 133,251 | 5/3/05 | (19 | ) | ||||
Net Unrealized Loss on Open Foreign Currency Contracts | $(328 | ) | |||||||
| SEP | Local Currency | Market Value | Settlement Date | Unrealized Gain | |||||
Contracts to Buy: | |||||||||
Canadian Dollar | 384,999 | $306,320 | 5/3/05 | $494 | |||||
Canadian Dollar | 316,109 | 251,509 | 5/4/05 | 264 | |||||
British Pound | 8,180 | 15,640 | 5/4/05 | 42 | |||||
British Pound | 21,689 | 41,471 | 5/5/05 | 61 | |||||
Net Unrealized Gain on Open Foreign Currency Contracts | $861 | ||||||||
VKEP did not have any open foreign currency contracts at April 30, 2005.
At April 30, 2005, SEP and VKEP had loaned securities having a market value of $49,216,689 and $2,820,250. SEP and VKEP received cash collateral amounting to $50,819,030 and $2,878,257 which were invested in the State Street Navigator Securities Lending Trust Prime Portfolio, a Rule 2a-7 money market fund, registered under the 1940 Act.
At April 30, 2005, SBLCV did not have any securities on loan.
| 4. | Commission Recapture Program |
In addition to trade execution, many of the brokers with whom FMR places trades pay for certain expenses of SEP or provide other services. During the six months ended April 30, 2004, SEP received cash rebates from these brokers in
43 Travelers Series Fund Inc. | 2005 Semi-Annual Report
Table of Contents
Notes to Financial Statements (unaudited) (continued)
lieu of additional services or expense reductions. The amounts of these rebates, included in realized gains in the statement of operations, is noted below.
| Brokerage Service Arrangements | |||
Strategic Equity Portfolio | $ | 437,179 | |
Certain amounts on the prior year statement of changes in net assets with respect to this arrangement have been reclassified to conform with the current year presentation.
| 5. | Capital Shares |
At April 30, 2005, the Company had six billion shares authorized with a par value of $0.00001 per share. Each share of a Fund represents an equal proportionate interest in that Fund with each other share of the same Fund and has an equal entitlement to any dividends and distributions made by the Fund.
Transactions in shares of each Fund were as follows:
| Six Months Ended April 30, 2005 | Year Ended October 31, 2004 | |||||
SBLCV | ||||||
Shares sold | 71,009 | 256,486 | ||||
Shares issued on reinvestment | 354,178 | 357,126 | ||||
Shares reacquired | (1,727,209 | ) | (4,456,154 | ) | ||
Net Decrease | (1,302,022 | ) | (3,842,542 | ) | ||
SEP | ||||||
Shares sold | 22,370 | 94,460 | ||||
Shares issued on reinvestment | 410,323 | — | ||||
Shares reacquired | (2,661,720 | ) | (5,444,092 | ) | ||
Net Decrease | (2,229,027 | ) | (5,349,632 | ) | ||
VKEP | ||||||
Shares sold | 26,602 | 114,164 | ||||
Shares issued on reinvestment | 37,177 | 11,815 | ||||
Shares reacquired | (835,261 | ) | (1,692,831 | ) | ||
Net Decrease | (771,482 | ) | (1,566,852 | ) | ||
44 Travelers Series Fund Inc. | 2005 Semi-Annual Report
Table of Contents
Notes to Financial Statements (unaudited) (continued)
| 6. | Capital Loss Carryforward |
On October 31, 2004 SBLCV had a net capital loss carryforward of $42,144,826, of which $18,994,148 expires in 2010 and $23,150,678 expires in 2011. SEP had a net capital loss carryforward of $231,371,083, all of which expires in 2010. VKEP had a net capital loss carryforward of $70,237,743, of which $27,341,054 expires in 2009, $34,687,599 expires in 2010 and $8,209,090 expires in 2011.
| 7. | Additional Information |
On May 31, 2005, the U.S. Securities and Exchange Commission (“SEC”) issued an order in connection with the settlement of an administrative proceeding against Smith Barney Fund Management LLC (“SBFM”) and Citigroup Global Markets Inc. (“CGMI”) relating to the appointment of an affiliated transfer agent for the Smith Barney family of mutual funds (the “Funds”).
The SEC order finds that SBFM and CGMI willfully violated Section 206(1) of the Investment Advisers Act of 1940 (“Advisers Act”). Specifically, the order finds that SBFM and CGMI knowingly or recklessly failed to disclose to the boards of the Funds in 1999 when proposing a new transfer agent arrangement with an affiliated transfer agent that: First Data Investors Services Group (“First Data”), the Funds’ then-existing transfer agent, had offered to continue as transfer agent and do the same work for substantially less money than before; and that Citigroup Asset Management (“CAM”), the Citigroup business unit that includes the fund’s investment manager and other investment advisory companies, had entered into a side letter with First Data under which CAM agreed to recommend the appointment of First Data as sub-transfer agent to the affiliated transfer agent in exchange, among other things, for a guarantee by First Data of specified amounts of asset management and investment banking fees to CAM and CGMI. The order also finds that SBFM and CGMI willfully violated Section 206(2) of the Advisers Act by virtue of the omissions discussed above and other misrepresentations and omissions in the materials provided to the Funds’ boards, including the failure to make clear that the affiliated transfer agent would earn a high profit for performing limited functions while First Data continued to perform almost all of the transfer agent functions, and the suggestion that the proposed arrangement was in the Funds’ best interests and that no viable alternatives existed. SBFM and CGMI do not admit or deny any wrongdoing or
45 Travelers Series Fund Inc. | 2005 Semi-Annual Report
Table of Contents
Notes to Financial Statements (unaudited) (continued)
liability. The settlement does not establish wrongdoing or liability for purposes of any other proceeding.
The SEC censured SBFM and CGMI and ordered them to cease and desist from violations of Sections 206(1) and 206(2) of the Advisers Act. The order requires Citigroup to pay $208.1 million, including $109 million in disgorgement of profits, $19.1 million in interest, and a civil money penalty of $80 million. Approximately $24.4 million has already been paid to the Funds, primarily through fee waivers. The remaining $183.7 million, including the penalty, has been paid to the U.S. Treasury and will be distributed pursuant to a plan to be prepared by Citigroup and submitted within 90 days of the entry of the order for approval by the SEC. The order also requires that transfer agency fees received from the Funds since December 1, 2004 less certain expenses be placed in escrow and provides that a portion of such fees may be subsequently distributed in accordance with the terms of the order.
The order requires SBFM to recommend a new transfer agent contract to the Fund boards within 180 days of the entry of the order; if a Citigroup affiliate submits a proposal to serve as transfer agent or sub-transfer agent, an independent monitor must be engaged at the expense of SBFM and CGMI to oversee a competitive bidding process. Under the order, Citigroup also must comply with an amended version of a vendor policy that Citigroup instituted in August 2004. That policy, as amended, among other things, requires that when requested by a Fund board, CAM will retain at its own expense an independent consulting expert to advise and assist the board on the selection of certain service providers affiliated with Citigroup.
At this time, there is no certainty as to how the proceeds of the settlement will be distributed, to whom such distributions will be made, the methodology by which such distributions will be allocated, and when such distributions will be made. Although there can be no assurance, Citigroup does not believe that this matter will have a material adverse effect on the Funds.
| 8. | Legal Matters |
Beginning in June 2004, class action lawsuits alleging violations of the federal securities laws were filed against Citigroup Global Markets Inc. (the “Distributor”) and a number of its affiliates, including Smith Barney Fund Management LLC and Salomon Brothers Asset Management Inc (the
46 Travelers Series Fund Inc. | 2005 Semi-Annual Report
Table of Contents
Notes to Financial Statements (unaudited) (continued)
“Advisers”), substantially all of the mutual funds managed by the Advisers, including the Fund (the “Funds”), and directors or trustees of the Funds (collectively, the “Defendants”). The complaints alleged, among other things, that the Distributor created various undisclosed incentives for its brokers to sell Smith Barney and Salomon Brothers funds. In addition, according to the complaints, the Advisers caused the Funds to pay excessive brokerage commissions to the Distributor for steering clients towards proprietary funds. The complaints also alleged that the defendants breached their fiduciary duty to the Funds by improperly charging Rule 12b-1 fees and by drawing on fund assets to make undisclosed payments of soft dollars and excessive brokerage commissions. The complaints also alleged that the Funds failed to adequately disclose certain of the allegedly wrongful conduct. The complaints sought injunctive relief and compensatory and punitive damages, rescission of the Funds’ contracts with the Advisers, recovery of all fees paid to the Advisers pursuant to such contracts and an award of attorneys’ fees and litigation expenses.
On December 15, 2004, a consolidated amended complaint (the “Complaint”) was filed alleging substantially similar causes of action. While the lawsuit is in its earliest stages, to the extent that the Complaint purports to state causes of action against the Funds, Citigroup Asset Management believes the Funds have significant defenses to such allegations, which the Funds intend to vigorously assert in responding to the Complaint.
Additional lawsuits arising out of these circumstances and presenting similar allegations and requests for relief may be filed against the Defendants in the future.
As of the date of this report, Citigroup Asset Management and the Funds believe that the resolution of the pending lawsuit will not have a material effect on the financial position or results of operations of the Funds or the ability of the Advisers and their affiliates to continue to render services to the Funds under their respective contracts.
47 Travelers Series Fund Inc. | 2005 Semi-Annual Report
Table of Contents
Notes to Financial Statements (unaudited) (continued)
| 9. | Subsequent Event |
On January 31, 2005, Citigroup announced that it had reached an agreement with MetLife, Inc. (“MetLife”) to sell Citigroup’s life insurance and annuity businesses (“Travelers Life & Annuity”) to MetLife. As part of this transaction, TIA, currently an indirect wholly owned subsidiary of Citigroup, would become an indirect wholly owned subsidiary of MetLife. TIA is the investment adviser to the Van Kampen Enterprise Portfolio and Strategic Equity Portfolio.
The transaction is subject to certain regulatory approvals, as well as other customary conditions to closing. The transaction is scheduled to close on June 30, 2005.
In connection with this transaction, at meetings held on March 24, 2005 and April 20, 2005, the Board of Directors approved a proposal to reorganize the Van Kampen Enterprise Portfolio and the Strategic Equity Portfolio (the “Acquired Funds”) of Travelers Series Fund Inc., into newly organized “shell” portfolios (the “Acquiring Funds”) of The Travelers Series Trust. In connection with the reorganization, the Acquiring Funds would acquire all of the assets and assume the liabilities of the Acquired Funds.
The proposed reorganization is subject to the fulfillment of certain conditions, including approval by the Acquired Funds shareholders. Proxy materials describing the proposed reorganization were mailed on or about June 9, 2005, to the Acquired Funds shareholders of record on April 15, 2005, in anticipation of a meeting of shareholders scheduled to be held on June 29, 2005. If approved by the Acquired Funds shareholders, the reorganization will occur as soon as possible after the shareholder meeting.
On June 24, 2005, Citigroup announced that it has signed a definitive agreement under which Citigroup will sell substantially all of its worldwide asset management business to Legg Mason, Inc. (“Legg Mason”).
As part of this transaction, SBFM (the “Manager”), currently an indirect wholly owned subsidiary of Citigroup, would become an indirect wholly owned subsidiary of Legg Mason. The Manager is the investment adviser to SBLCV.
The transaction is subject to certain regulatory approvals, as well as other customary conditions to closing. Subject to such approvals and the satisfaction of the other conditions, Citigroup expects the transaction to be completed later this year.
48 Travelers Series Fund Inc. | 2005 Semi-Annual Report
Table of Contents
Notes to Financial Statements (unaudited) (continued)
Under the Investment Company Act of 1940, consummation of the transaction will result in the automatic termination of the investment management contract between SBLCV and the Manager. Therefore, the SBLCV’s Board of Directors will be asked to approve a new investment management contract between SBLCV and the Manager. If approved by the Board, the new investment management contract will be presented to the shareholders of SBLCV for their approval.
49 Travelers Series Fund Inc. | 2005 Semi-Annual Report
Table of Contents
TRAVELERS SERIES FUND INC.
DIRECTORS Robert A. Frankel Michael E. Gellert R. Jay Gerken, CFA Rainer Greeven Susan M. Heilbron
OFFICERS R. Jay Gerken, CFA Chairman, President and Chief Executive Officer
Andrew B. Shoup Senior Vice President and Chief Administrative Officer
James M. Giallanza Chief Financial Officer
Mark J. McAllister, CFA Vice President and Investment Officer
Robert Feitler Vice President and Investment Officer
Adam Hetnarski Investment Officer
Sandip Bhagat Investment Officer | OFFICERS (continued) Andrew Beagley Chief Anti-Money Laundering Compliance Officer and Chief Compliance Officer
Robert I. Frenkel Secretary and Chief Legal Officer
INVESTMENT MANAGERS Smith Barney Fund Travelers Investment Adviser, Inc.
CUSTODIAN State Street Bank and
ANNUITY ADMINISTRATION Travelers Annuity Investor Services One Cityplace Hartford, CT 06103-3415
TRANSFER AGENT Citicorp Trust Bank, fsb. 125 Broad Street, 11th Floor New York, New York 10004
SUB-TRANSFER AGENT PFPC Inc. P.O. Box 9699 Providence, Rhode Island 02940-9699 |
Table of Contents
Travelers Series Fund Inc.
Smith Barney Large Cap Value Portfolio
Strategic Equity Portfolio
Van Kampen Enterprise Portfolio
The Funds are separate investment funds of the Travelers Series Fund Inc., a Maryland corporation.
The Funds file their complete schedule of portfolio holdings with Securities Exchange Commission for the first and third quarters of each fiscal year on Form N-Q. The Funds’ Forms N-Q are available on the Commission’s website at www.sec.gov. The Funds’ Forms N-Q may be reviewed and copied at the Commission’s Public Reference Room in Washington D.C., and information on the operation of the Public Reference Room may be obtained by calling 1-800-SEC-0330. To obtain information on Form N-Q from the Funds, shareholders can call 1-800-451-2010.
Information on how the Funds voted proxies relating to portfolio securities during the 12-month period ended June 30, 2004 and a description of the policies and procedures that the Funds use to determine how to vote proxies relating to portfolio securities is available (1) without charge, upon request, by calling 1-800-451-2010, (2) on the Funds’ website at www.citigroupam.com and (3) on the SEC’s website at www.sec.gov.
This report is submitted for the general information of the shareholders of Travelers Series Fund Inc. — Smith Barney Large Cap Value Portfolio, Strategic Equity Portfolio and Van Kampen Enterprise Portfolio.
TRAVELERS SERIES FUND INC.
125 Broad Street
10th Floor, MF-2
New York, New York 10004
IN0801 06/05 | 05-8633 |
Table of Contents
| ITEM 2. | CODE OF ETHICS. |
| Not Applicable. |
| ITEM 3. | AUDIT COMMITTEE FINANCIAL EXPERT. |
| Not Applicable. |
| ITEM 4. | PRINCIPAL ACCOUNTANT FEES AND SERVICES. |
| Not Applicable. |
| ITEM 5. | AUDIT COMMITTEE OF LISTED REGISTRANTS. |
| Not applicable. |
| ITEM 6. | SCHEDULE OF INVESTMENTS. |
| Not applicable. |
| ITEM 7. | DISCLOSURE OF PROXY VOTING POLICIES AND PROCEDURES FOR CLOSED-END MANAGEMENT INVESTMENT COMPANIES. |
| Not applicable. |
| ITEM 8. | [RESERVED] |
| ITEM 9. | PURCHASES OF EQUITY SECURITIES BY CLOSED-END MANAGEMENT INVESTMENT COMPANY AND AFFILIATED PURCHASERS. |
| Not applicable. |
| ITEM 10. | SUBMISSION OF MATTERS TO A VOTE OF SECURITY HOLDERS. |
| Not applicable. |
| ITEM 11. | CONTROLS AND PROCEDURES. |
| (a) | The registrant’s principal executive officer and principal financial officer have concluded that the registrant’s disclosure controls and procedures (as defined in Rule 30a- 3(c) under the Investment Company Act of 1940, as amended (the “1940 Act”)) are effective as of a date within 90 days of the filing date of this report that includes the disclosure required by this paragraph, based on their evaluation of the disclosure controls and procedures required by Rule 30a-3(b) under the 1940 Act and 15d-15(b) under the Securities Exchange Act of 1934. | |
| (b) | There were no changes in the registrant’s internal control over financial reporting (as defined in Rule 30a-3(d) under the 1940 Act) that occurred during the registrant’s last fiscal half-year (the registrant’s second fiscal half-year in the case of an annual report) that have materially affected, or are likely to materially affect the registrant’s internal control over financial reporting. | |
| ITEM 12. | EXHIBITS. |
| (a) | Code of Ethics attached hereto. |
Table of Contents
| Exhibit 99.CODE ETH | ||
| (b) | Attached hereto. | |
| Exhibit 99.CERT | Certifications pursuant to section 302 of the Sarbanes-Oxley Act of 2002 | |
| Exhibit 99.906CERT | Certifications pursuant to Section 906 of the Sarbanes-Oxley Act of 2002 | |
Table of Contents
SIGNATURES
Pursuant to the requirements of the Securities Exchange Act of 1934 and the Investment Company Act of 1940, the registrant has duly caused this Report to be signed on its behalf by the undersigned, there unto duly authorized.
Travelers Series Fund Inc.
| By: | /s/ R. Jay Gerken | |
| R. Jay Gerken | ||
| Chief Executive Officer of | ||
| Travelers Series Fund Inc. | ||
| Date: July 7, 2005 | ||
Pursuant to the requirements of the Securities Exchange Act of 1934 and the Investment Company Act of 1940, this report has been signed below by the following persons on behalf of the registrant and in the capacities and on the dates indicated.
| By: | /s/ R. Jay Gerken | |
| (R. Jay Gerken) | ||
| Chief Executive Officer of | ||
| Travelers Series Fund Inc. | ||
| Date: July 7, 2005 | ||
| By: | /s/ James M. Giallanza | |
| (James M. Giallanza) | ||
| Chief Financial Officer of | ||
| Travelers Series Fund Inc. | ||
| Date: July 7, 2005 | ||