UNITED STATES
SECURITIES AND EXCHANGE COMMISSION
Washington, D.C. 20549
FORM N-CSR
CERTIFIED SHAREHOLDER REPORT OF REGISTERED
MANAGEMENT INVESTMENT COMPANIES
Investment Company Act file number 811-8372
Travelers Series Fund Inc.
(Exact name of registrant as specified in charter)
| | |
| 125 Broad Street, New York, NY | | 10004 |
|
| (Address of principal executive offices) | | (Zip code) |
Robert I. Frenkel, Esq.
Smith Barney Fund Management LLC
300 First Stamford Place
Stamford, CT 06902
(Name and address of agent for service)
Registrant’s telephone number, including area code: (800) 451-2010
Date of fiscal year end: October 31
Date of reporting period: April 30, 2005
| | |
| ITEM 1. | | REPORT TO STOCKHOLDERS. |
|
The Semi-Annual Report to Stockholders is filed herewith. |
[INSERT SHAREHOLDER REPORT]
TRAVELERS SERIES FUND INC.
SMITH BARNEY
INTERNATIONAL ALL CAP
GROWTH PORTFOLIO
SALOMON BROTHERS
STRATEGIC TOTAL RETURN
BOND PORTFOLIO
SB ADJUSTABLE RATE
INCOME PORTFOLIO
SEMI-ANNUAL REPORT | APRIL 30, 2005
NOT FDIC INSURED • NOT BANK GUARANTEED • MAY LOSE VALUE
WHAT’S INSIDE
LETTER FROM THE CHAIRMAN

R. JAY GERKEN, CFA
Chairman, President and Chief Executive Officer
Dear Shareholder,
Despite generally lackluster economic news, the international equity markets generated solid results for the six-month reporting period covered by this report. A recent International Monetary Fund’s World Economic Outlook projected a modest 1.6% growth rate for the Eurozone in 2005, and Japanese growth is expected to be 0.8% in 2005, compared to 2.6% in 2004.i Yet, international equities, as measured by the MSCI EAFE Index,ii returned 8.71% over the reporting period. In contrast to the MSCI EAFE Index, U.S. stocks, as measured by the S&P 500 Index,iii rose only 3.28% over the same period.
The reporting period began on a bright note, as the international equity markets rallied sharply in November and December 2004. Investors were drawn to stocks as oil prices retreated from their record highs and the uncertainty of the U.S. Presidential election ended. Thus far in 2005, however, the equity markets have been volatile. International equities were weak in January but then rallied strongly in February. However, they again fell in March and April. The market’s recent gyrations have been attributed to mixed economic data and continued high oil prices.
Given the overall strength of the economy, the Federal Reserve Board (“Fed”)iv continued to raise interest rates over the period in an attempt to ward off inflation. Following three rate hikes from June through September 2004, the Fed again increased its target for the federal funds ratev in 0.25% increments four times during the reporting period. After the Fund’s reporting period had ended, at its May meeting, the Fed once again raised its fed funds target rate by 0.25% to 3.00%.
During the first half of the reporting period, the U.S. fixed income market confounded many investors as short-term interest rates rose in concert with the Fed rate tightening, while longer-term rates, surprisingly, remained fairly steady. However, this began to change in late February 2005, as strong economic data and inflationary concerns caused longer-term rates to rise as well. This continued through March, before longer-term rates again declined on the back of mixed economic data. Looking at the six-month period as a whole, the overall U.S. bond market, as measured by the Lehman Brothers Aggregate Bond Index,vi
1 Travelers Series Fund Inc. | 2005 Semi-Annual Report
returned 0.98%. Elsewhere, the global bond market, as measured by the JPMorgan Global Government Bond Index—Unhedgedvii returned 4.20% over the same period.
Within this environment, the Funds performed as follows:viii
PERFORMANCE OF THE FUNDS
AS OF APRIL 30, 2005
(unaudited)
| | | |
| | | 6 Months | |
| | | | |
Smith Barney International All Cap Growth Portfolio | | 8.07 | % |
| | | | |
MSCI EAFE Growth Index | | 8.30 | % |
| | | | |
MSCI EAFE Index | | 8.71 | % |
| | | | |
Lipper Variable International Growth Funds Category Average | | 7.28 | % |
| | | | |
Salomon Brothers Strategic Total Return Bond Portfolio | | 1.81 | % |
| | | | |
Lehman Brothers Aggregate Bond Index | | 0.98 | % |
| | | | |
JPMorgan Global Government Bond Index—Unhedged | | 4.20 | % |
| | | | |
Lipper Variable Global Income Funds Category Average | | 3.40 | % |
| | | | |
SB Adjustable Rate Income Portfolio | | 0.77 | % |
| | | | |
Citigroup 6-Month U.S. Treasury Bill Index | | 1.10 | % |
| | | | |
Lipper Variable Short-Intermediate Investment Grade Debt Funds Category Average | | 0.37 | % |
The performance shown represents past performance. Past performance is no guarantee of future results and current performance may be higher or lower than the performance shown above. Principal value and investment returns will fluctuate and investors’ shares, when redeemed, may be worth more or less than their original cost.
The 30-Day SEC Yield for SB Adjustable Rate Income Portfolio was 2.43%. Management has contractually agreed to waive fees and/or reimburse expenses through a period of 16 months from October 31, 2004. Absent these reimbursements or fee waivers, the 30-day SEC yield would have been 2.28%.
Fund returns assume the reinvestment of income dividends and capital gains distributions at net asset value and the deduction of all fund expenses.
Lipper, Inc. is a major independent mutual-fund tracking organization. Returns are based on the six-month period ended April 30, 2005 and include the reinvestment of dividends and capital gains distributions, if any. Returns were calculated among the 53 funds in the variable international growth funds category. Returns were calculated among the 31 funds in the variable global income funds category. Returns were calculated among the 32 funds in the variable short-intermediate investment grade debt funds category.
2 Travelers Series Fund Inc. | 2005 Semi-Annual Report
Smith Barney International All Cap Growth Portfolio
Performance Updateviii
For the six months ended April 30, 2005, the Smith Barney International All Cap Growth Portfolio returned 8.07%. The Fund’s unmanaged benchmark, the MSCI EAFE Growth Index,ix returned 8.30% while the Fund’s previous benchmark, the MSCI EAFE Index,ii returned 8.71% for the same period. The Lipper Variable International Growth Funds Category Average1 was 7.28%.
Salomon Brothers Strategic Total Return Bond Portfolio
Special Shareholder Notice
At meetings held on March 24, 2005 and April 20, 2005, the Board of Directors approved a proposal to reorganize the Salomon Brothers Strategic Total Return Bond Portfolio (the “Acquired Fund”) of Travelers Series Fund Inc. (“TSF”) into a newly organized “shell” portfolio (the “Acquiring Fund”) of Travelers Series Trust (“TST”) (the “Reorganization”).
In connection with the Reorganization, the Board of Directors approved an Agreement and Plan of Reorganization (the “Plan”) between TSF, on behalf of the Acquired Fund, and TST, on behalf of the Acquiring Fund, under which the Acquiring Fund would acquire all of the assets of the Acquired Fund and assume all of the liabilities of the Acquired Fund. The Reorganization is being proposed to the Acquired Fund’s shareholders because Travelers Investment Adviser Inc., which serves as investment adviser to the Acquired Fund and is currently an indirect wholly owned subsidiary of Citigroup Inc. (“Citigroup”), will become an indirect wholly owned subsidiary of MetLife, Inc. (“MetLife”) as part of MetLife’s acquisition of Travelers Life & Annuity, the life insurance and annuity businesses of Citigroup.
A Special Meeting of Shareholders of the Acquired Fund has been called on June 29, 2005 for the purpose of submitting the Plan and such other matters as may properly come before the meeting to the stockholders of the Acquired Fund for approval. The close of business on April 15, 2005 has been fixed as the record date for the determination of stockholders of the Acquired Fund, who are entitled to notice of, and to vote at, the Special Meeting of Shareholders, including any adjournment or adjournments thereof.
Effective April 1, 2005, Roger Lavan and David Scott replaced Beth A. Semmel as co-managers of the Fund. Both are Managing Directors of the manager and portfolio managers of other funds advised by the manager.
| 1 | Lipper, Inc. is a major independent mutual-fund tracking organization. Returns are based on the 6-month period ended April 30, 2005, including the reinvestment of dividends and capital gains distributions, if any, calculated among the 53 funds in the Fund’s Lipper category, and excluding sales charges. |
3 Travelers Series Fund Inc. | 2005 Semi-Annual Report
Performance Updateviii
For the six months ended April 30, 2005, the Salomon Brothers Strategic Total Return Bond Portfolio returned 1.81%. The Fund’s unmanaged benchmark, the Lehman Brothers Aggregate Bond Index,vi returned 0.98% while the Fund’s previous benchmark, the JPMorgan Global Government Bond Index—Unhedged,vii returned 4.20% for the same period. The Lipper Variable Global Income Funds Category Average2 was 3.40%.
SB Adjustable Rate Income Portfolio
Performance Updateviii
For the six months ended April 30, 2005, SB Adjustable Rate Income Portfolio returned 0.77%. The Fund’s unmanaged benchmark, the Citigroup 6-Month U.S. Treasury Bill Index,x returned 1.10% for the same period. The Lipper Variable Short-Intermediate Investment Grade Debt Funds Category Average3 was 0.37%.
Information About Your Funds
As you may be aware, several issues in the mutual fund industry have recently come under the scrutiny of federal and state regulators. The Funds’ Adviser and some of its affiliates have received requests for information from various government regulators regarding market timing, late trading, fees, and other mutual fund issues in connection with various investigations. The regulators appear to be examining, among other things, the Funds’ response to market timing and shareholder exchange activity, including compliance with prospectus disclosure related to these subjects. The Funds have been informed that the Adviser and its affiliates are responding to those information requests, but are not in a position to predict the outcome of these requests and investigations.
Important information concerning the Funds and their Adviser with regard to recent regulatory developments is contained in the “Additional Information” note in the Notes to the Financial Statements included in this report.
| 2 | Lipper, Inc. is a major independent mutual-fund tracking organization. Returns are based on the 6-month period ended April 30, 2005, including the reinvestment of dividends and capital gains distributions, if any, calculated among the 31 funds in the Fund’s Lipper category, and excluding sales charges. |
| 3 | Lipper, Inc. is a major independent mutual-fund tracking organization. Returns are based on the 6-month period ended April 30, 2005, including the reinvestment of dividends and capital gains distributions, if any, calculated among the 32 funds in the Fund’s Lipper category, and excluding sales charges. |
4 Travelers Series Fund Inc. | 2005 Semi-Annual Report
As always, thank you for your continued confidence in our stewardship of your assets. We look forward to helping you continue to meet your financial goals.
Sincerely,

/s/ R. Jay Gerken
R. Jay Gerken, CFA
Chairman, President and Chief Executive Officer
May 17, 2005
The information provided is not intended to be a forecast of future events, a guarantee of future results or investment advice. Views expressed may differ from those of the firm as a whole.
Portfolio holdings and breakdowns are as of April 30, 2005 and are subject to change. Please refer to pages 12 through 33 for a list and percentage breakdown of the Funds’ holdings.
All index performance reflects no deduction for fees, expenses or taxes. Please note that an investor can not invest directly in an index.
5 Travelers Series Fund Inc. | 2005 Semi-Annual Report
RISKS:
Smith Barney International All Cap Growth Portfolio: Keep in mind, the Fund is subject to certain risks of overseas investing, not associated with domestic investing, including currency fluctuations, change in political and economic conditions, differing securities regulations and periods of illiquidity, which could result in significant market fluctuations. These risks are magnified in emerging markets. The Fund may use derivatives, such as options and futures, which can be illiquid, may disproportionately increase losses, and have a potentially large impact on Fund performance. Please see the Fund’s prospectus for more information on these and other risks.
Salomon Brothers Strategic Total Return Bond Portfolio: Investments in high-yield securities and foreign companies and governments, including emerging markets involve risks beyond those inherent solely in higher-rated and domestic investments. The risks of high-yield securities include, but are not limited to, price volatility and the possibility of default in the timely payment of interest and principal. Foreign stocks are subject to certain risks of overseas investing including currency fluctuations and changes in political and economic conditions, which could result in significant market fluctuations. The Fund may use derivatives, such as options and futures, which can be illiquid, may disproportionately increase losses, and have a potentially large impact on fund performance. The Fund is not diversified, which may magnify the Fund’s losses from adverse events affecting a particular issuer. Please see the Fund’s prospectus for more information on these and other risks.
SB Adjustable Rate Income Portfolio: Keep in mind, the Fund is subject to fluctuations in share price as interest rates rise and fall. Adjustable rate securities are subject to additional risks such as prepayment risk. The Fund may use derivatives, such as options and futures, which can be illiquid, may disproportionately increase losses, and have a potentially large impact on Fund performance. Please see the Fund’s prospectus for more information on these and other risks.
All index performance reflects no deduction for fees, expenses or taxes. Please note that an investor cannot invest directly in an index.
| i | Source: International Monetary Fund, World Economic Outlook, April 2005. |
| ii | The MSCI EAFE Index is an unmanaged index of common stocks of companies located in Europe, Australasia and the Far East. |
| iii | The S&P 500 Index is a market capitalization-weighted index of 500 widely held common stocks. |
| iv | The Federal Reserve Board is responsible for the formulation of a policy designed to promote economic growth, full employment, stable prices, and a sustainable pattern of international trade and payments. |
| v | The federal funds rate is the interest rate that banks with excess reserves at a Federal Reserve district bank charge other banks that need overnight loans. |
| vi | The Lehman Brothers Aggregate Bond Index is a broad-based bond index comprised of Government, Corporate, Mortgage and Asset-backed issues, rated investment grade or higher, and having at least one year to maturity. |
| vii | The JPMorgan Global Government Bond Index—Unhedged is a daily, market capitalization-weighted, international fixed-income index consisting of 13 countries. |
| viii | The Funds are underlying investment options of various variable annuity and variable life insurance products. A variable annuity product is a contract issued by an insurance company where the annuity premium (a set amount of dollars) is immediately turned into units of a portfolio of securities. The Funds’ performance returns do not reflect the deduction of initial sales charges and expenses imposed in connection with investing in variable annuity and variable life insurance contracts, such as administrative fees, account charges, and surrender charges which, if reflected, would reduce the performance of the Funds. Past performance is no guarantee of future results. |
| ix | The MSCI EAFE Growth Index is an unmanaged index of growth stocks of companies located in Europe, Australasia and the Far East. |
| x | The Citigroup 6-Month U.S. Treasury Bill Index performance is an average of the last 6-Month Treasury Bill issues. 6-Month U.S. Treasury Bills are guaranteed by the U.S. government and provide a fixed rate of return when held to maturity. |
6 Travelers Series Fund Inc. | 2005 Semi-Annual Report
Smith Barney International All Cap Growth Portfolio
Fund at a Glance (unaudited)
7 Travelers Series Fund Inc. | 2005 Semi-Annual Report
Salomon Brothers Strategic Total Return Bond Portfolio
Fund at a Glance (unaudited)
8 Travelers Series Fund Inc. | 2005 Semi-Annual Report
SB Adjustable Rate Income Portfolio
Fund at a Glance (unaudited)
9 Travelers Series Fund Inc. | 2005 Semi-Annual Report
Fund Expenses (unaudited)
Example
As a shareholder of the Fund, you may incur two types of costs: (1) transaction costs and (2) ongoing costs, including management fees and other Fund expenses. This example is intended to help you understand your ongoing costs (in dollars) of investing in the Fund and to compare these costs with the ongoing costs of investing in other mutual funds.
This example is based on an investment of $1,000 invested on November 1, 2004 and held for the six months ended April 30, 2005.
Actual Expenses
The table below titled “Based on Actual Total Return” provides information about actual account values and actual expenses. You may use the information provided in this table, together with the amount you invested, to estimate the expenses that you paid over the period. To estimate the expenses you paid on your account, divide your ending account value by $1,000 (for example, an $8,600 ending account value divided by $1,000 = 8.6), then multiply the result by the number under the heading entitled “Expenses Paid During the Period”.
| | | | | | | | | | | | | | | |
| Based on Actual Total Return(1) | | | |
| | | | | | | | | | | | | | | | |
| | | Actual Total
Return(2) | | | Beginning
Account
Value | | Ending
Account
Value | | Annualized
Expense
Ratio | | | Expenses
Paid During
the Period(3) |
Smith Barney International All Cap Growth Portfolio | | 8.07 | % | | $ | 1,000.00 | | $ | 1,080.70 | | 0.98 | % | | $ | 5.06 |
|
Salomon Brothers Strategic Total Return Bond Portfolio | | 1.81 | | | | 1,000.00 | | | 1,018.10 | | 1.34 | | | | 6.71 |
|
SB Adjustable Rate Income Portfolio | | 0.77 | | | | 1,000.00 | | | 1,007.70 | | 1.00 | | | | 4.98 |
|
| (1) | | For the six months ended April 30, 2005. |
| (2) | | Assumes reinvestment of all dividends and capital gain distributions, if any, at net asset value. Total return is not annualized, as it may not be representative of the total return for the year. Total returns do not reflect expenses associated with the separate account such as administrative fees, account charges and surrender charges which, if reflected, would reduce the total returns. Performance figures may reflect voluntary fee waivers and/or expense reimbursements. Past performance is no guarantee of future results. In the absence of voluntary fee waivers and/or expense reimbursements, the total return would have been lower. |
| (3) | | Expenses (net of contractual or voluntary fee waiver) are equal to each Fund’s respective annualized expense ratio multiplied by the average account value over the period, multiplied by the number of days in the most recent fiscal half-year, then divided by 365. |
10 Travelers Series Fund Inc. | 2005 Semi-Annual Report
Fund Expenses (unaudited) (continued)
Hypothetical Example for Comparison Purposes
The table below titled “Based on Hypothetical Total Return” provides information about hypothetical account values and hypothetical expenses based on the actual expense ratio and an assumed rate of return of 5.00% per year before expenses, which is not the Fund’s actual return. The hypothetical account values and expenses may not be used to estimate the actual ending account balance or expenses you paid for the period. You may use the information provided in this table to compare the ongoing costs of investing in the Fund and other funds. To do so, compare the 5.00% hypothetical example relating to the Fund with the 5.00% hypothetical examples that appear in the shareholder reports of the other funds.
Please note that the expenses shown in the table below are meant to highlight your ongoing costs only and do not reflect any transactional costs. Therefore, the table is useful in comparing ongoing costs only, and will not help you determine the relative total costs of owning different funds. In addition, if these transaction costs were included, your costs would have been higher.
| | | | | | | | | | | | | | | |
| Based on Hypothetical Total Return(1) | | | |
| | | | | | | | | | | | | | | | |
| | | Hypothetical
Annualized
Total Return | | | Beginning
Account
Value | | Ending
Account
Value | | Annualized
Expense
Ratios | | | Expenses
Paid During
the Period(2) |
Smith Barney International All Cap Growth Portfolio | | 5.00 | % | | $ | 1,000.00 | | $ | 1,019.93 | | 0.98 | % | | $ | 4.91 |
|
Salomon Brothers Strategic Total Return Bond Portfolio | | 5.00 | | | | 1,000.00 | | | 1,018.15 | | 1.34 | | | | 6.71 |
|
SB Adjustable Rate Income Portfolio | | 5.00 | | | | 1,000.00 | | | 1,019.84 | | 1.00 | | | | 5.01 |
|
| (1) | | For the six months ended April 30, 2005. |
| (2) | | Expenses (net of contractual or voluntary fee waiver) are equal each Fund’s respective annualized expense ratio multiplied by the average account value over the period, multiplied by the number of days in the most recent fiscal half-year, then divided by 365. |
11 Travelers Series Fund Inc. | 2005 Semi-Annual Report
| | |
| Schedules of Investments (unaudited) | | April 30, 2005 |
SMITH BARNEY INTERNATIONAL ALL CAP GROWTH PORTFOLIO
| | | | | |
| SHARES | | SECURITY | | VALUE |
| | | | | | |
| COMMON STOCK — 97.8% | | | |
Australia (a) — 1.6% | | | |
| 62,000 | | Macquarie Bank Ltd. | | $ | 2,236,443 |
| 27,000 | | Westpac Banking Corp. | | | 412,535 |
|
| | | | | | 2,648,978 |
|
Denmark (a) — 1.1% | | | |
| 35,000 | | Novo Nordisk A/S, Class B Shares | | | 1,771,935 |
|
Finland (a) — 2.2% | | | |
| 220,000 | | Nokia Oyj (b) | | | 3,529,409 |
|
France (a) — 6.0% | | | |
| 70,000 | | Axa (b) | | | 1,732,345 |
| 32,000 | | Essilor International SA (b) | | | 2,294,393 |
| 30,000 | | Groupe Danone (b) | | | 2,822,384 |
| 13,000 | | Total SA (b) | | | 2,896,187 |
|
| | | | | | 9,745,309 |
|
Germany (a) — 3.5% | | | |
| 25,300 | | BASF AG (b) | | | 1,644,002 |
| 12,500 | | SAP AG (b) | | | 1,973,756 |
| 65,400 | | Stada Arzneimittel AG (b) | | | 2,064,243 |
|
| | | | | | 5,682,001 |
|
Greece (a) — 0.9% | | | |
| 25,000 | | EFG Eurobank Ergasias (c) | | | 756,483 |
| 45,000 | | Piraeus Bank S.A. | | | 761,912 |
|
| | | | | | 1,518,395 |
|
Hong Kong (a) — 2.8% | | | |
| 118,000 | | Hutchinson Whampoa Ltd. (b) | | | 1,058,374 |
| 826,000 | | Li & Fung Ltd. | | | 1,586,863 |
| 745,000 | | Luen Thai Holdings Ltd. (c) | | | 280,919 |
| 191,000 | | Swire Pacific Ltd. | | | 1,605,062 |
|
| | | | | | 4,531,218 |
|
Ireland (a) — 9.1% | | | |
| 103,000 | | Bank of Ireland | | | 1,565,715 |
| 168,000 | | CRH PLC | | | 4,184,392 |
| 584,000 | | Grafton Group PLC | | | 6,660,194 |
| 180,740 | | Irish Continental Group PLC | | | 2,237,879 |
|
| | | | | | 14,648,180 |
|
Italy (a) — 0.9% | | | |
| 112,000 | | Saipem S.p.A. (b) | | | 1,405,346 |
|
See Notes to Financial Statements.
12 Travelers Series Fund Inc. | 2005 Semi-Annual Report
| | |
| Schedules of Investments (unaudited) (continued) | | April 30, 2005 |
SMITH BARNEY INTERNATIONAL ALL CAP GROWTH PORTFOLIO
| | | | | |
| SHARES | | SECURITY | | VALUE |
| | | | | | |
Japan (a) — 17.9% | | | |
| 65,000 | | CANON INC. | | $ | 3,396,785 |
| 30,000 | | DaiichiKosho Co., Ltd. | | | 777,529 |
| 300 | | Dentsu Inc. | | | 768,807 |
| 179,000 | | Dowa Mining Co., Ltd. | | | 1,180,971 |
| 44,500 | | Honda Motor Co., Ltd. | | | 2,148,504 |
| 16,000 | | Hoya Corp. (b) | | | 1,677,204 |
| 30,000 | | Ito-Yokado Co., Ltd. | | | 1,032,284 |
| 298 | | Mitsubishi Tokyo Financial Group, Inc. (b) | | | 2,593,989 |
| 27,000 | | Nichii Gakkan Co. | | | 776,960 |
| 8,500 | | Nidec Corp. (b) | | | 999,949 |
| 159,000 | | Nomura Holdings, Inc. | | | 2,026,359 |
| 350 | | NTT Data Corp. | | | 1,081,609 |
| 580 | | NTT DoCoMo, Inc. | | | 898,728 |
| 6,500 | | Orix Corp. | | | 888,130 |
| 1,080 | | Rakuten, Inc. (b) | | | 908,132 |
| 12,000 | | Rohm Co., Ltd. | | | 1,135,009 |
| 26,000 | | Seven-Eleven Japan Co., Ltd. | | | 733,917 |
| 100,000 | | Sharp Corp. | | | 1,568,010 |
| 55,000 | | Shin-Etsu Chemical Co., Ltd. | | | 2,039,166 |
| 75,000 | | Terumo Corp. | | | 2,237,970 |
|
| | | | | | 28,870,012 |
|
Mexico (a) — 1.8% | | | |
| 773,100 | | Wal-Mart De Mexico S.A. de C.V. | | | 2,859,019 |
|
The Netherlands (a) — 3.2% | | | |
| 39,351 | | ING Groep N.V. (b) | | | 1,083,137 |
| 65,088 | | Randstad Holdings N.V. | | | 2,660,992 |
| 25,000 | | Royal Dutch Petroleum Co. | | | 1,463,743 |
|
| | | | | | 5,207,872 |
|
Norway (a) — 0.7% | | | |
| 157,000 | | Stolt Offshore S.A. (b)(c) | | | 1,154,108 |
|
Singapore (a) — 1.4% | | | |
| 172,000 | | DBS Group Holdings, Ltd. | | | 1,507,532 |
| 289,000 | | Singapore Press Holdings, Ltd. | | | 771,683 |
|
| | | | | | 2,279,215 |
|
Spain (a) — 5.2% | | | |
| 111,000 | | Banco Bilbao Vizcaya Argentaria, S.A. | | | 1,726,134 |
| 200,000 | | Indra Sistemas, S.A. (b) | | | 3,474,582 |
| 190,000 | | Telefonica S.A. | | | 3,243,474 |
|
| | | | | | 8,444,190 |
|
Sweden (a) — 2.0% | | | |
| 37,000 | | Atlas Copco AB (b) | | | 1,688,386 |
| 534,000 | | Telefonaktiebolaget LM Ericsson (b)(c) | | | 1,589,532 |
|
| | | | | | 3,277,918 |
|
See Notes to Financial Statements.
13 Travelers Series Fund Inc. | 2005 Semi-Annual Report
| | |
| Schedules of Investments (unaudited) (continued) | | April 30, 2005 |
SMITH BARNEY INTERNATIONAL ALL CAP GROWTH PORTFOLIO
| | | | | | |
| SHARES | | SECURITY | | VALUE | |
| | | | | | | |
Switzerland (a) — 11.8% | | | | |
| 115,000 | | Mettler-Toledo International Inc. (c) | | $ | 5,272,750 | |
| 6,500 | | Nestle SA (b) | | | 1,714,437 | |
| 41,000 | | Novartis AG (b) | | | 2,004,000 | |
| 45,000 | | Roche Holding AG | | | 5,468,098 | |
| 8,800 | | Synthes, Inc. (c) | | | 1,002,339 | |
| 45,000 | | UBS AG (b) | | | 3,623,909 | |
|
|
| | | | | | 19,085,533 | |
|
|
United Kingdom (a) — 24.7% | | | | |
| 50,000 | | BOC Group PLC | | | 928,890 | |
| 330,700 | | BP PLC | | | 3,377,141 | |
| 620,000 | | Capita Group PLC | | | 4,471,988 | |
| 154,000 | | Diageo PLC | | | 2,285,675 | |
| 88,872 | | HSBC Holdings PLC (b) | | | 1,445,436 | |
| 880,000 | | mm02 PLC (c) | | | 1,981,954 | |
| 70,000 | | Rio Tinto PLC | | | 2,116,452 | |
| 57,647 | | Royal Bank of Scotland Group PLC | | | 1,743,702 | |
| 1,047,000 | | Serco Group PLC | | | 4,792,717 | |
| 150,000 | | Smith & Nephew PLC | | | 1,548,163 | |
| 565,145 | | Tesco PLC | | | 3,343,752 | |
| 350,000 | | Tomkins PLC | | | 1,649,910 | |
| 3,196,000 | | Vodafone Group PLC | | | 8,363,300 | |
| 162,000 | | WPP Group PLC | | | 1,767,550 | |
|
|
| | | | | | 39,816,630 | |
|
|
United States — 1.0% | | | | |
| 100,012 | | News Corp., Class B Shares | | | 1,592,191 | |
|
|
| | | TOTAL COMMON STOCK
(Cost — $117,446,732) | | | 158,067,459 | |
|
|
FACE AMOUNT | | | | | |
| SHORT-TERM INVESTMENTS — 14.2% | | | | |
| REPURCHASE AGREEMENT — 2.0% | | | | |
| $ 3,202,000 | | Interest in $398,063,000 joint tri-party repurchase agreement dated 4/29/05 with Goldman Sachs, 2.940% due 5/2/05; Proceeds at maturity — $3,202,784; (Fully collateralized by various Government Agency Obligations, 1.250% to 12.750% due 5/31/05 to 11/15/24; Market value — $3,266,047) (Cost — $3,202,000) | | | 3,202,000 | |
|
|
| SECURITIES PURCHASED FROM SECURITIES LENDING COLLATERAL — 12.2% | |
| 19,628,867 | | State Street Navigator Securities Lending Trust Prime Portfolio
(Cost — $19,628,867) | | | 19,628,867 | |
|
|
| | | TOTAL SHORT-TERM INVESTMENTS (Cost — $22,830,867) | | | 22,830,867 | |
|
|
| | | TOTAL INVESTMENTS — 112.0% (Cost — $140,277,599*) | | | 180,898,326 | |
| | | Liabilities in Excess of Other Assets — (12.0)% | | | (19,354,785 | ) |
|
|
| | | TOTAL NET ASSETS — 100.0% | | $ | 161,543,541 | |
|
|
| (a) | | Securities are fair valued at April 30, 2005 in accordance with the policies adopted by the Board of Directors (See Note 1). |
| (b) | | All or a portion of this security is on loan (See Notes 1 and 3). |
| (c) | | Non-income producing security. |
| * | | Aggregate cost for federal income tax purposes is substantially the same. |
See Notes to Financial Statements.
14 Travelers Series Fund Inc. | 2005 Semi-Annual Report
| | |
| Schedules of Investments (unaudited) (continued) | | April 30, 2005 |
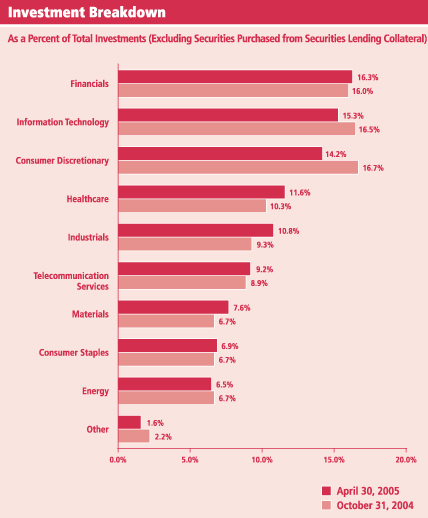
| | | |
| Summary of Investments by Sector† | | | |
Financials | | 16.3 | % |
Information Technology | | 15.3 | |
Consumer Discretionary | | 14.2 | |
Healthcare | | 11.6 | |
Industrials | | 10.8 | |
Telecommunication Services | | 9.2 | |
Materials | | 7.6 | |
Consumer Staples | | 6.9 | |
Energy | | 6.5 | |
Other | | 1.6 | |
|
|
| | | 100.0 | % |
|
|
| † | | As a percentage of total investments excluding securities purchased from securities lending collateral. Please note that Fund holdings are subject to change. |
See Notes to Financial Statements.
15 Travelers Series Fund Inc. | 2005 Semi-Annual Report
| | |
| Schedules of Investments (unaudited) (continued) | | April 30, 2005 |
SALOMON BROTHERS STRATEGIC TOTAL RETURN BOND PORTFOLIO
| | | | | | | |
FACE
AMOUNT† | | | | SECURITY | | VALUE |
| U.S. GOVERNMENT OBLIGATIONS AND AGENCIES — 44.2% | | | |
| | | | | U.S. Treasury Notes: | | | |
| 450,000 | | | | 4.875% due 2/15/12 (a) | | $ | 472,905 |
| 205,000 | | | | 4.000% due 2/15/14 (b) | | | 202,670 |
| 400,000 | | | | U.S. Treasury Bonds, 6.250% due 5/15/30 (a) | | | 498,141 |
| | | | | Federal Home Loan Mortgage Corp.: | | | |
| 1,000,000 | | | | 5.000% due 5/1/35 (c)(d) | | | 990,312 |
| 1,250,000 | | | | 6.000% due 5/1/35 (c)(d) | | | 1,283,203 |
| | | | | Federal National Mortgage Association: | | | |
| 500,000 | | | | 4.000% due 5/1/20 (c)(d) | | | 484,844 |
| 250,000 | | | | 5.000% due 5/1/35 (c)(d) | | | 247,578 |
| 2,410,000 | | | | 6.500% due 5/1/35 (c)(d) | | | 2,506,400 |
|
| | | | | TOTAL U.S. GOVERNMENT OBLIGATIONS AND AGENCIES (Cost — $6,630,308) | | | 6,686,053 |
|
| | | |
| | | RATING(e) | | | | |
| COLLATERALIZED MORTGAGE OBLIGATIONS — 1.1% | | | |
| 43,834 | | A+ | | Commercial Mortgage Pass-Through Certificates, Series 2003-FL9, Class E, 3.954% due 11/15/15 (b)(f)(g) | | | 44,097 |
| 125,000 | | A2* | | Merit Securities Corp., Series 11PA, Class B2, 4.560% due 9/28/32 (b)(f)(g) | | | 123,783 |
|
| | | | | TOTAL COLLATERALIZED MORTGAGE OBLIGATIONS (Cost — $156,497) | | | 167,880 |
|
| ASSET-BACKED SECURITIES — 4.4% | | | |
| 150,000 | | A+ | | Amortizing Residential Collateral Trust, Series 2002-BC6, Class M2, 4.220% due 8/25/32 (b)(g) | | | 151,456 |
| 250,000 | | NR | | Bayview Financial Acquisition Trust, Series 2001-CA, Class M3, 4.270% due 8/25/36 (b)(f)(g) | | | 249,531 |
| | | | | Bear Stearns Asset Backed Securities: | | | |
| 9,297 | | BBB | | Series 2003-HE1N, Class N1, 6.500% due 8/25/05 (f) | | | 9,310 |
| 19,138 | | BBB | | Series 2004-FR1N, Class A1, 5.000% due 5/25/34 (f) | | | 19,038 |
| 19,713 | | BBB | | Series 2004-HE6, Class A1, 5.250% due 8/25/34 (f) | | | 19,641 |
| | | | | Countrywide Asset-Backed Certificates: | | | |
| 50,000 | | AA | | Series 2004-5, Class M4, 4.270% due 6/25/34 (b)(g) | | | 50,871 |
| 20,414 | | BBB | | Series 2004-5N, Class N1, 5.500% due 10/25/35 (f) | | | 20,367 |
| 41,551 | | B | | First Consumers Master Trust, Series 2001-A, Class A, 3.264% due 9/15/08 (b)(g) | | | 41,315 |
| 70,000 | | BBB | | Metris Master Trust, Series 2001-2, Class B, 4.070% due 11/20/09 (b)(g) | | | 70,232 |
| 20,000 | | A | | Novastar Home Equity Loan Trust, Series 2003-4, Class M2, 4.645% due 2/25/34 (g) | | | 20,614 |
See Notes to Financial Statements.
16 Travelers Series Fund Inc. | 2005 Semi-Annual Report
| | |
| Schedules of Investments (unaudited) (continued) | | April 30, 2005 |
SALOMON BROTHERS STRATEGIC TOTAL RETURN BOND PORTFOLIO
| | | | | | | |
FACE
AMOUNT† | | RATING(e) | | SECURITY | | VALUE |
| ASSET-BACKED SECURITIES — 4.4% (continued) | | | |
| | | | | Sail Net Interest Margin Notes: | | | |
| 1,363 | | BBB | | Series 2003-3, Class A, 7.750% due 4/27/33 (f) | | $ | 1,366 |
| 17,698 | | BBB+ | | Series 2004-4A, Class A, 5.000% due 4/27/34 (f) | | | 17,728 |
|
| | | | | TOTAL ASSET-BACKED SECURITIES
(Cost — $852,566) | | | 671,469 |
|
| CORPORATE BONDS AND NOTES — 25.0% | | | |
Aerospace/Defense — 0.4% | | | |
| 25,000 | | B | | Alliant Techsystems Inc., Sr. Sub. Notes, 8.500% due 5/15/11 (b) | | | 26,688 |
| 25,000 | | BB- | | Sequa Corp., Sr. Notes, 9.000% due 8/1/09 (b) | | | 26,500 |
|
| | | | | | | | 53,188 |
|
Airlines — 0.2% | | | |
| 25,000 | | B+ | | Continental Airlines, Inc., Pass-Through Certificates, Series 98-3, Class C-2, 7.250% due 11/1/05 | | | 23,810 |
|
Automotive — 0.5% | | | |
| 50,000 | | BBB | | DaimerChrysler NA Holding Corp., Notes, 4.050% due 6/4/08 | | | 48,199 |
| 22,000 | | BB- | | TRW Automotive Inc., Sr. Notes, 9.375% due 2/15/13 | | | 22,880 |
|
| | | | | | | | 71,079 |
|
Business Services — 0.2% | | | |
| 22,000 | | Caa2* | | SITEL Corp., Sr. Sub. Notes, 9.250% due 3/15/06 | | | 22,110 |
|
Chemicals — 1.7% | | | |
| 2,727 | | NR | | Applied Extrusion Technologies, Inc., Sr. Notes, 12.000% due 3/15/12 (f) | | | 2,718 |
| 25,000 | | BB+ | | FMC Corp., Sr. Debentures, 7.750% due 7/1/11 (b) | | | 26,750 |
| 25,000 | | BB- | | Huntsman Advanced Materials LLC, Sr. Secured Second Lien Notes, 11.000% due 7/15/10 (b)(f) | | | 28,625 |
| 14,000 | | B | | Huntsman ICI Chemicals LLC, Sr. Sub. Notes, 10.125% due 7/1/09 | | | 14,595 |
| 25,000 | | BB- | | ISP Chemco Inc., Sr. Sub. Notes, Series B, 10.250% due 7/1/11 (b) | | | 27,187 |
| 25,000 | | BB- | | Lyondell Chemical Co., Sr. Secured Notes, 11.125% due 7/15/12 (b) | | | 28,688 |
| 25,000 | | BBB- | | Methanex Corp., Sr. Notes, 8.750% due 8/15/12 (b) | | | 29,125 |
| 25,000 | | BB- | | Millennium America Inc., Sr. Notes, 9.250% due 6/15/08 (b) | | | 26,750 |
| 25,000 | | CCC | | Resolution Performance Products LLC, Sr. Sub. Notes, 13.500% due 11/15/10 (b) | | | 27,188 |
| 25,000 | | CCC+ | | Rhodia S.A., Sr. Sub. Notes, 8.875% due 6/1/11 | | | 23,500 |
| 16,000 | | BB- | | Westlake Chemical Corp., Sr. Notes, 8.750% due 7/15/11 | | | 17,480 |
|
| | | | | | | | 252,606 |
|
See Notes to Financial Statements.
17 Travelers Series Fund Inc. | 2005 Semi-Annual Report
| | |
| Schedules of Investments (unaudited) (continued) | | April 30, 2005 |
SALOMON BROTHERS STRATEGIC TOTAL RETURN BOND PORTFOLIO
| | | | | | | |
FACE
AMOUNT† | | RATING(e) | | SECURITY | | VALUE |
Consumer Products & Services — 0.6% | | | |
| 1,000 | | CCC | | Applica Inc., Sr. Sub. Notes, 10.000% due 7/31/08 | | $ | 905 |
| 25,000 | | CCC+ | | Home Interiors & Gifts, Inc., Sr. Sub. Notes, 10.125% due 6/1/08 | | | 21,250 |
| 25,000 | | CCC- | | ICON Health & Fitness, Inc., Sr. Sub. Notes, 11.250% due 4/1/12 | | | 17,875 |
| 16,000 | | B- | | Jafra Cosmetics International, Inc./Distribuidora Comercial Jafra, S.A. de C.V., Sr. Sub. Notes, 10.750% due 5/15/11 | | | 18,080 |
| 20,000 | | B- | | Levi Strauss & Co., Sr. Notes, 12.250% due 12/15/12 | | | 21,300 |
| 16,000 | | B | | Tempur-Pedic, Inc./Tempur Production USA, Inc., Sr. Sub. Notes, 10.250% due 8/15/10 | | | 17,920 |
|
| | | | | | | | 97,330 |
|
Energy — 0.8% | | | |
| 50,000 | | BBB | | Devon Financing Corp., ULC, Notes, 6.875% due 9/30/11 (b) | | | 55,601 |
| 16,000 | | B+ | | Magnum Hunter Resources, Inc., Sr. Notes, 9.600% due 3/15/12 | | | 17,840 |
| 25,000 | | B+ | | Stone Energy Corp., Sr. Sub. Notes, 8.250% due 12/15/11 (b) | | | 25,750 |
| 25,000 | | B | | Vintage Petroleum, Inc., Sr. Sub. Notes, 7.875% due 5/15/11 (b) | | | 26,125 |
|
| | | | | | | | 125,316 |
|
Environmental Services — 0.3% | | | |
| 17,000 | | BB- | | Allied Waste North America, Inc., Sr. Notes, Series B, 9.250% due 9/1/12 | | | 18,020 |
| 25,000 | | B- | | IMCO Recycling Inc., Sr. Secured Notes, Series B, 10.375% due 10/15/10 (b) | | | 27,312 |
|
| | | | | | | | 45,332 |
|
Financial Services — 5.7% | | | |
| 85,000 | | A+ | | Bank of America Corp., Sub. Notes, 7.400% due 1/15/11 (b) | | | 96,811 |
| 16,000 | | B- | | BCP Caylux Holdings Luxembourg S.C.A., Sr. Sub. Notes, 9.625% due 6/15/14 (b) | | | 17,720 |
| 50,000 | | BBB | | Capital One Bank, Notes, 4.875% due 5/15/08 (b) | | | 50,451 |
| 75,000 | | A | | CIT Group Inc., Sr. Notes, 7.750% due 4/2/12 (b) | | | 87,575 |
| 75,000 | | A | | Countrywide Financial Corp., Medium-Term Notes, Series L, 4.000% due 3/22/11 (b) | | | 71,917 |
| 50,000 | | A- | | Encana Holdings Financial Corp., Notes, 5.800% due 5/1/14 (b) | | | 52,950 |
| 75,000 | | A | | HSBC Finance Corp., Notes, 5.250% due 4/15/15 (a) | | | 76,089 |
| 50,000 | | AA- | | International Lease Finance Corp., Medium-Term Notes, Series O, 4.375% due 11/1/09 (b) | | | 49,640 |
| 50,000 | | BBB- | | iStar Financial Inc., Sr. Notes, 5.150% due 3/1/12 (b) | | | 48,950 |
| 70,000 | | A | | JPMorgan Chase & Co., Sub. Notes, 6.625% due 3/15/12 (b) | | | 77,401 |
| 25,000 | | A | | Lehman Brothers Holdings Inc., Notes, 3.500% due 8/7/08 (b) | | | 24,527 |
| 55,000 | | BBB | | MBNA Corp., Sr. Medium-Term Notes, 4.625% due 9/15/08 (b) | | | 54,958 |
| 75,000 | | A+ | | Morgan Stanley, Notes, 6.600% due 4/1/12 (b) | | | 82,247 |
| 50,000 | | A- | | Standard Chartered Bank, Sub. Notes, 8.000% due 5/30/31 (b)(f) | | | 66,390 |
|
| | | | | | | | 857,626 |
|
Food & Beverage — 0.3% | | | |
| 40,000 | | BBB+ | | Kraft Foods Inc., Notes, 5.625% due 11/1/11 (b) | | | 42,014 |
|
See Notes to Financial Statements.
18 Travelers Series Fund Inc. | 2005 Semi-Annual Report
| | |
| Schedules of Investments (unaudited) (continued) | | April 30, 2005 |
SALOMON BROTHERS STRATEGIC TOTAL RETURN BOND PORTFOLIO
| | | | | | | |
FACE
AMOUNT† | | RATING(e) | | SECURITY | | VALUE |
Healthcare — 0.8% | | | |
| 25,000 | | D | | aaiPharma Inc., Sr. Sub. Notes, 11.500% due 4/1/10 (g)(h) | | $ | 9,125 |
| 25,000 | | B | | Extendicare Health Services, Inc., Sr. Notes, 9.500% due 7/1/10 (b) | | | 27,281 |
| 25,000 | | B | | Tenet Healthcare Corp., Sr. Notes, 9.875% due 7/1/14 (b) | | | 25,813 |
| 10,000 | | CCC+ | | Vanguard Health Holding Co. I, LLC, Sr. Discount Notes, zero coupon until 10/1/07, 11.250% thereafter, due 10/1/15 | | | 6,850 |
| 50,000 | | A | | Wyeth, Notes, 5.500% due 3/15/13 (b)(g) | | | 51,864 |
|
| | | | | | | | 120,933 |
|
Hotel/Casino — 0.7% | | | |
| 25,000 | | B+ | | Host Marriott, L.P., Sr. Notes, 7.125% due 11/1/13 (b) | | | 25,437 |
| 25,000 | | B | | John Q. Hammons Hotels L.P./John Q. Hammons Hotels Finance Corp. III, First Mortgage Notes, Series B, 8.875% due 5/15/12 (b) | | | 26,750 |
| 25,000 | | BB | | MGM Mirage Inc., Sr. Notes, 6.750% due 9/1/12 (b) | | | 25,125 |
| 25,000 | | B+ | | Turning Stone Casino Resort Enterprise, Sr. Notes, 9.125% due 12/15/10 (b)(f) | | | 25,750 |
|
| | | | | | | | 103,062 |
|
Machinery — 0.5% | | | |
| 25,000 | | BB- | | Case New Holland Inc., Sr. Notes, 9.250% due 8/1/11 (b)(f) | | | 25,625 |
| 25,000 | | B+ | | NMHG Holding Co., Sr. Notes, 10.000% due 5/15/09 (b) | | | 27,062 |
| 25,000 | | B | | Terex Corp., Sr. Sub. Notes, Series B, 10.375% due 4/1/11 (b) | | | 27,250 |
|
| | | | | | | | 79,937 |
|
Manufacturing — 0.2% | | | |
| 25,000 | | B- | | Medical Device Manufacturing Inc., Sr. Sub. Notes, 10.000% due 7/15/12 (b) | | | 26,875 |
|
Media — 2.1% | | | |
| | | | | Charter Communications Holdings, LLC/Charter Communications Holdings Capital Corp., Sr. Notes: | | | |
| 50,000 | | CCC- | | 10.250% due 1/15/10 (b) | | | 37,000 |
| 10,000 | | CCC- | | 10.000% due 5/15/11 | | | 7,050 |
| 50,000 | | BBB | | Comcast Cable Communications Holdings, Notes, 8.375% due 3/15/13 (b) | | | 60,791 |
| 25,000 | | B+ | | CSC Holdings, Inc., Sr. Sub. Debentures, 10.500% due 5/15/16 (b) | | | 27,437 |
| 25,000 | | BB- | | DIRECTV Holdings LLC/DIRECTV Financing Co., Inc., Sr. Notes, 8.375% due 3/15/13 (b) | | | 27,187 |
| 25,000 | | CCC+ | | Loews Cineplex Entertainment Corp., Sr. Sub. Notes, 9.000% due 8/1/14 (b)(f) | | | 24,125 |
| 25,000 | | B | | Mediacom LLC/Mediacom Capital Corp., Sr. Notes, 9.500% due 1/15/13 (b) | | | 24,062 |
| 25,000 | | CCC- | | Muzak LLC/Muzak Finance Corp., Sr. Notes, 10.000% due 2/15/09 (b) | | | 21,125 |
See Notes to Financial Statements.
19 Travelers Series Fund Inc. | 2005 Semi-Annual Report
| | |
| Schedules of Investments (unaudited) (continued) | | April 30, 2005 |
SALOMON BROTHERS STRATEGIC TOTAL RETURN BOND PORTFOLIO
| | | | | | | |
FACE
AMOUNT† | | RATING(e) | | SECURITY | | VALUE |
Media — 2.1% (continued) | | | |
| 25,000 | | B- | | Nextmedia Operating, Inc., Sr. Sub. Notes, 10.750% due 7/1/11 (b) | | $ | 27,031 |
| 50,000 | | BBB+ | | Time Warner Inc., Debentures, 7.625% due 4/15/31 (b) | | | 61,121 |
|
| | | | | | | | 316,929 |
|
Metals/Mining — 0.3% | | | |
| 25,000 | | B+ | | AK Steel Corp., Sr. Notes, 7.875% due 2/15/09 | | | 23,063 |
| 25,000 | | B- | | Mueller Group, Inc., Sr. Sub. Notes, 10.000% due 5/1/12 (b) | | | 27,000 |
| 200,000 | | NR | | Republic Technologies International, LLC/RTI Capital Corp., Sr. Secured Notes, 13.750% due 7/15/09 (h)(j)# | | | 0 |
|
| | | | | | | | 50,063 |
|
Packaging/Containers — 0.8% | | | |
| 25,000 | | B- | | Berry Plastics Corp., Sr. Sub. Notes, 10.750% due 7/15/12 (b) | | | 27,750 |
| 25,000 | | B | | Jefferson Smurfit Corp. (U.S.), Sr. Notes, 8.250% due 10/1/12 (b) | | | 24,625 |
| 25,000 | | B+ | | Plastipak Holdings, Inc., Sr. Notes, 10.750% due 9/1/11 (b) | | | 27,375 |
| 25,000 | | CCC+ | | Pliant Corp., Sr. Secured Notes, 11.125% due 9/1/09 (b) | | | 22,875 |
| 25,000 | | CCC- | | Radnor Holdings Corp., Sr. Notes, 11.000% due 3/15/10 (b) | | | 16,750 |
|
| | | | | | | | 119,375 |
|
Paper/Forestry Products — 0.5% | | | |
| 25,000 | | B | | Buckeye Technologies Inc., Sr. Sub. Notes, 8.000% due 10/15/10 (b) | | | 24,625 |
| 60,000 | | BBB- | | Domtar Inc., Notes, 5.375% due 12/1/13 (b) | | | 54,772 |
|
| | | | | | | | 79,397 |
|
Printing/Publishing — 0.5% | | | |
| 25,000 | | B+ | | Cenveo Corp., Sr. Notes, 9.625% due 3/15/12 (b) | | | 26,750 |
| 23,000 | | B | | Dex Media West LLC/Dex Media West Finance Co., Sr. Sub. Notes, Series B, 9.875% due 8/15/13 (b) | | | 25,645 |
| 25,000 | | B+ | | R.H. Donnelley Finance Corp I, Sr. Sub. Notes, 10.875% due 12/15/12 (b)(f) | | | 28,687 |
|
| | | | | | | | 81,082 |
|
Real Estate — 0.6% | | | |
| 65,000 | | BBB | | Boston Properties L.P., Sr. Notes, 6.250% due 1/15/13 (b) | | | 69,945 |
| 25,000 | | CCC+ | | MeriStar Hospitality Operating Partnership, L.P./MeriStar Hospitality Finance Corp. II, Sr. Notes, 10.500% due 6/15/09 (b) | | | 26,375 |
|
| | | | | | | | 96,320 |
|
Retail — 1.3% | | | |
| 25,000 | | B | | Jean Coutu Group (PJC) Inc., Sr. Sub. Notes,
8.500% due 8/1/14 (b) | | | 23,688 |
| 60,000 | | BBB | | Limited Brands, Inc., Exchange Debentures, 6.950% due 3/1/33 (b) | | | 61,912 |
| 25,000 | | B+ | | PETCO Animal Supplies, Inc., Sr. Sub. Notes, 10.750% due 11/1/11 (b) | | | 27,875 |
| 75,000 | | BBB | | Safeway Inc., Debentures, 7.250% due 2/1/31 (b) | | | 83,033 |
|
| | | | | | | | 196,508 |
|
See Notes to Financial Statements.
20 Travelers Series Fund Inc. | 2005 Semi-Annual Report
| | |
| Schedules of Investments (unaudited) (continued) | | April 30, 2005 |
SALOMON BROTHERS STRATEGIC TOTAL RETURN BOND PORTFOLIO
| | | | | | | |
FACE
AMOUNT† | | RATING(e) | | SECURITY | | VALUE |
Technology — 0.1% | | | |
| 25,000 | | CCC+ | | Amkor Technology, Inc., Sr. Sub. Notes, 10.500% due 5/1/09 (b) | | $ | 20,000 |
|
Telecommunications — 3.0% | | | |
| 7,000 | | CCC+ | | Alamosa (Delaware), Inc., Sr. Notes, 11.000% due 7/31/10 | | | 7,849 |
| 1,000 | | CCC | | American Tower Corp., Sr. Notes, 9.375% due 2/1/09 | | | 1,051 |
| 50,000 | | A | | AT&T Wireless Services, Inc., Sr. Notes, 8.750% due 3/1/31 (b) | | | 68,396 |
| 25,000 | | CCC | | Centennial Communications Corp./Centennial Cellular Operating Co. LLC/Centennial Puerto Rico Operations Corp., Sr. Notes, 8.125% due 2/1/14 (b) | | | 25,062 |
| 25,000 | | CCC+ | | Crown Castle International Corp., Sr. Notes, 10.750% due 8/1/11 (b) | | | 26,875 |
| 15,000 | | B+ | | Insight Midwest L.P./Insight Capital, Inc., Sr. Notes, 10.500% due 11/1/10 (b) | | | 16,050 |
| 10,000 | | B | | INTELSAT/Zeus Special, Sr. Discount Notes, zero coupon until 2/1/10, 9.250% thereafter, due 2/1/15 (f) | | | 6,100 |
| 25,000 | | BB+ | | L-3 Communications Corp., Sr. Sub. Notes, 7.625% due 6/15/12 (b) | | | 26,562 |
| 25,000 | | B | | Lucent Technologies Inc., Debentures, 6.450% due 3/15/29 | | | 21,219 |
| 25,000 | | BB | | Nextel Communications Inc., Sr. Notes, 6.875% due 10/31/13 (b) | | | 26,375 |
| 16,000 | | B+ | | PanAmSat Corp., Sr. Notes, 9.000% due 8/15/14 (b) | | | 16,720 |
| | | | | Qwest Services Corp., Notes: | | | |
| 25,000 | | B | | 14.000% due 12/15/10 (b)(f) | | | 28,250 |
| 25,000 | | B | | 14.500% due 12/15/14 (b)(f) | | | 29,125 |
| 25,000 | | B- | | SpectraSite, Inc., Sr. Notes, 8.250% due 5/15/10 (b) | | | 26,187 |
| 50,000 | | BBB- | | Sprint Capital Corp., Global Notes, 8.375% due 3/15/12 (b) | | | 59,289 |
| 70,000 | | A+ | | Verizon Florida Inc., Sr. Debentures, Series F, 6.125% due 1/15/13 (b) | | | 73,976 |
|
| | | | | | | | 459,086 |
|
Utilities — 2.9% | | | |
| 25,000 | | B- | | The AES Corp., Sr. Notes, 9.500% due 6/1/09 (a) | | | 27,250 |
| 9,000 | | BB- | | Allegheny Energy Supply Co., LLC, Secured Notes, 10.250% due 11/15/07 (f) | | | 9,945 |
| 50,000 | | BBB | | Appalachian Power Co., Bonds, Series H, 5.950% due 5/15/33 (b) | | | 52,285 |
| | | | | Calpine Corp.: | | | |
| 25,000 | | B | | Second Priority Sr. Secured Notes, 8.500% due 7/15/10 (b)(f) | | | 17,500 |
| 25,000 | | CCC+ | | Sr. Notes, 8.750% due 7/15/07 (b) | | | 14,125 |
| 50,000 | | BBB | | Duke Energy Corp., Sr. Notes, 4.200% due 10/1/08 (b) | | | 49,787 |
| 25,000 | | B- | | Dynegy Holdings Inc., Second Priority Sr. Secured Notes, 9.875% due 7/15/10 (b)(f) | | | 25,375 |
| 15,000 | | B+ | | Edison Mission Energy, Sr. Notes, 9.875% due 4/15/11 (b) | | | 17,025 |
| 50,000 | | CCC+ | | El Paso Corp., Global Medium-Term Notes, 7.375% due 12/15/12 (b) | | | 47,500 |
See Notes to Financial Statements.
21 Travelers Series Fund Inc. | 2005 Semi-Annual Report
| | |
| Schedules of Investments (unaudited) (continued) | | April 30, 2005 |
SALOMON BROTHERS STRATEGIC TOTAL RETURN BOND PORTFOLIO
| | | | | | | |
FACE
AMOUNT† | | RATING(e) | | SECURITY | | VALUE |
Utilities — 2.9% (continued) | | | |
| 75,000 | | BBB+ | | Entergy Gulf States Inc., First Mortgage Bonds, 6.200% due 7/1/33 (b) | | $ | 76,720 |
| 25,000 | | NR | | Mirant Americas Generation, Inc., Sr. Notes, 9.125% due 5/1/31 (b)(h) | | | 26,500 |
| 20,000 | | B | | NRG Energy, Inc., Second Priority Sr. Secured Notes, 8.000% due 12/15/13 (b)(f) | | | 20,300 |
| 25,000 | | B+ | | Reliant Energy, Inc., Sr. Secured Notes, 9.250% due 7/15/10 (b) | | | 25,687 |
| 25,000 | | B+ | | The Williams Cos., Inc., Notes, 7.625% due 7/15/19 (b) | | | 26,938 |
|
| | | | | | | | 436,937 |
|
| | | | | TOTAL CORPORATE BONDS AND NOTES
(Cost — $3,857,710) | | | 3,776,915 |
|
| | | |
| SHARES | | | | | | |
| COMMON STOCK (i) — 1.0% | | | |
Chemicals — 0.0% | | | |
| 259 | | | | Applied Extrusion Technologies, Inc., Class B Shares (j) | | | 6,030 |
|
Media — 0.1% | | | |
| 1,997 | | | | UnitedGlobalCom, Inc., Class A Shares (b) | | | 17,873 |
|
Telecommunications — 0.9% | | | |
| 653 | | | | NTL Inc. (b) | | | 41,779 |
| 1,050 | | | | SpectraSite, Inc. (b) | | | 58,937 |
| 1,719 | | | | Telewest Global, Inc. (b) | | | 31,870 |
|
| | | | | | | | 132,586 |
|
| | | | | TOTAL COMMON STOCK (Cost — $114,036) | | | 156,489 |
|
| CONVERTIBLE PREFERRED STOCK — 0.2% | | | |
Telecommunications — 0.2% | | | |
| 25 | | | | Alamosa Holdings, Inc., 7.500% Cumulative, Series B (b) (Cost —$7,125) | | | 24,372 |
|
| | | |
| WARRANTS | | | | | | |
| WARRANTS (i) — 0.0% | | | |
Consumer Products & Services — 0.0% | | | |
| 200 | | | | Brown Jordan International, Inc., Expire 8/15/07 (f)# | | | 2 |
| 1,701 | | | | Pillowtex Corp., Expire 11/24/09 (j)# | | | 2 |
|
| | | | | | | | 4 |
|
Telecommunications — 0.0% | | | |
| 15 | | | | American Tower Corp., Expire 8/1/08 (f) | | | 3,653 |
|
| | | | | TOTAL WARRANTS (Cost — $4,367) | | | 3,657 |
|
See Notes to Financial Statements.
22 Travelers Series Fund Inc. | 2005 Semi-Annual Report
| | |
| Schedules of Investments (unaudited) (continued) | | April 30, 2005 |
SALOMON BROTHERS STRATEGIC TOTAL RETURN BOND PORTFOLIO
| | | | | | | | |
FACE
AMOUNT† | | | RATING(e) | | SECURITY | | VALUE |
| FOREIGN BONDS — 21.7% | | | |
| Argentina — 0.4% | | | |
| 100,000 | | | D | | Republic of Argentina, Debt Conversion Bonds, Series L-GP, 6.000% due 3/31/23 (b)(g) | | $ | 58,220 |
|
| Brazil — 2.8% | | | |
| | | | | | Federal Republic of Brazil: | | | |
| 131,937 | | | BB- | | Capitalization Bonds, 8.000% due 4/15/14 (b) | | | 131,607 |
| 123,529 | | | BB- | | Debt Conversion Bonds, Series L, 4.313% due 4/15/12 (b)(g) | | | 115,770 |
| | | | | | Global Bonds: | | | |
| 25,000 | | | BB- | | 10.500% due 7/14/14 (b) | | | 28,219 |
| 25,000 | | | BB- | | 10.125% due 5/15/27 (b) | | | 27,044 |
| 75,000 | | | BB- | | 12.250% due 3/6/30 (b) | | | 92,887 |
| 25,000 | | | BB- | | 11.000% due 8/17/40 (b) | | | 28,325 |
|
| | | | | | | | | 423,852 |
|
| Bulgaria — 0.2% | | | |
| 25,000 | | | BBB- | | Republic of Bulgaria, Euro-Dollar Bonds, Series REG S, 8.250% due 1/15/15 (b) | | | 31,094 |
|
| Colombia — 0.5% | | | |
| | | | | | Republic of Colombia, Global Notes: | | | |
| 25,000 | | | BB | | 10.000% due 1/23/12 (b) | | | 27,425 |
| 25,000 | | | BB | | 8.125% due 5/21/24 (b) | | | 23,000 |
| 25,000 | | | BB | | 10.375% due 1/28/33 (b) | | | 27,062 |
|
| | | | | | | | | 77,487 |
|
| France — 2.0% | | | |
| 230,000 | EUR | | AAA | | Government of France, Treasury Notes, 3.000% due 1/12/10 (b) | | | 300,025 |
|
| Germany — 3.3% | | | |
| 340,000 | EUR | | AAA | | Federal Republic of Germany, Bonds, 5.250% due 1/4/11 (b) | | | 492,974 |
|
| Italy — 0.7% | | | |
| 100,000 | | | AA- | | Region of Lombardy, Global Notes, 5.804% due 10/25/32 (b) | | | 110,279 |
|
| Mexico — 2.3% | | | | | |
| | | | | | United Mexican States: | | | |
| 150,000 | | | BBB | | Global Notes, 6.625% due 3/3/15 (b) | | | 159,075 |
| | | | | | Medium-Term Notes, Series A: | | | |
| 25,000 | | | BBB | | 6.375% due 1/16/13 (b) | | | 26,125 |
| 125,000 | | | BBB | | 5.875% due 1/15/14 (b) | | | 126,344 |
| 25,000 | | | BBB | | 8.000% due 9/24/22 (b) | | | 29,100 |
|
| | | | | | | | | 340,644 |
|
| The Netherlands — 3.2% | | | |
| 340,000 | EUR | | AAA | | Kingdom of the Netherlands, Bonds, 5.000% due 7/15/11 (b) | | | 488,023 |
|
See Notes to Financial Statements.
23 Travelers Series Fund Inc. | 2005 Semi-Annual Report
| | |
| Schedules of Investments (unaudited) (continued) | | April 30, 2005 |
SALOMON BROTHERS STRATEGIC TOTAL RETURN BOND PORTFOLIO
| | | | | | | |
FACE
AMOUNT† | | RATING(e) | | SECURITY | | VALUE |
Panama — 0.3% | | | |
| | | | | Republic of Panama, Global Bonds: | | | |
| 25,000 | | BB | | 9.625% due 2/8/11 (b) | | $ | 29,500 |
| 10,000 | | BB | | 9.375% due 1/16/23 | | | 11,788 |
|
| | | | | | | | 41,288 |
|
Peru — 0.7% | | | |
| | | | | Republic of Peru: | | | |
| 50,000 | | BB | | Global Notes, 9.125% due 2/21/12 (b) | | | 57,500 |
| 21,250 | | BB- | | Past-Due Interest Bonds, 5.000% due 3/7/17 (g) | | | 20,294 |
| 24,750 | | BB- | | Restructured Debt, 5.000% due 3/7/17 (g) | | | 23,203 |
|
| | | | | | | | 100,997 |
|
The Philippines — 0.5% | | | |
| | | | | Republic of the Philippines: | | | |
| 25,000 | | BB- | | Global Bonds, 9.875% due 1/15/19 (b) | | | 26,266 |
| 50,000 | | BB- | | Global Notes, 8.375% due 3/12/09 (b) | | | 52,685 |
|
| | | | | | | | 78,951 |
|
Russia — 2.8% | | | |
| | | | | Russian Federation, Euro-Dollar Bonds: | | | |
| 50,000 | | BBB- | | 8.250% due 3/31/10 (b) | | | 54,875 |
| 100,000 | | BBB- | | 11.000% due 7/24/18 (b) | | | 143,500 |
| 205,400 | | BBB- | | 5.000% due 3/31/30 (b) | | | 218,751 |
|
| | | | | | | | 417,126 |
|
South Africa — 0.2% | | | |
| 25,000 | | BBB | | Republic of South Africa, Global Notes, 6.500% due 6/2/14 (b) | | | 27,125 |
|
Supranational — 0.7% | | | |
| 100,000 | | A | | Corporación Andinade Fomento, Notes, Series B, 6.875% due 3/15/12 (b) | | | 111,245 |
|
Turkey — 0.5% | | | | | |
| 75,000 | | BB- | | Republic of Turkey, Global Notes, 9.000% due 6/30/11 (b) | | | 81,750 |
|
Venezuela — 0.6% | | | |
| | | | | Republic of Venezuela, Global Notes: | | | |
| 25,000 | | B | | 8.500% due 10/8/14 (b) | | | 24,713 |
| 75,000 | | B | | 9.250% due 9/15/27 (b) | | | 73,988 |
|
| | | | | | | | 98,701 |
|
| | | | | TOTAL FOREIGN BONDS (Cost — $2,907,645) | | | 3,279,781 |
|
| | | | | SUB-TOTAL INVESTMENTS (Cost — $14,530,254) | | | 14,766,616 |
|
See Notes to Financial Statements.
24 Travelers Series Fund Inc. | 2005 Semi-Annual Report
| | |
| Schedules of Investments (unaudited) (continued) | | April 30, 2005 |
SALOMON BROTHERS STRATEGIC TOTAL RETURN BOND PORTFOLIO
| | | | | | | | |
FACE
AMOUNT† | | | | SECURITY | | VALUE | |
REPURCHASE AGREEMENTS (a) — 38.0% | | | | |
| 752,000 | | Interest in $1,326,764,000 joint tri-party repurchase agreement dated 4/29/05 with Bank of America, 2.960% due 5/2/05; Proceeds at maturity — $752,185; (Fully collateralized by various U.S. government agency obligations, 0.000% to 3.350% due 7/27/05 to 11/9/07; Market value — $767,040) | | $ | 752,000 | |
| 1,000,000 | | Interest in $629,394,000 joint tri-party repurchase agreement dated 4/29/05 with Deutsche Bank Securities, 2.960% due 5/2/05; Proceeds at maturity — $1,000,247; (Fully collateralized by various U.S. government agency obligations and U.S. Treasury Bills, 0.000% to 9.500% due 9/15/05 to 4/1/35; Market value — $1,020,795) | | | 1,000,000 | |
| 1,000,000 | | Interest in $398,063,000 joint tri-party repurchase agreement dated 4/29/05 with Goldman Sachs Group, 2.940% due 5/2/05; Proceeds at maturity — $1,000,245; (Fully collateralized by U.S. Treasury Obligations, 1.250% to 12.750% due 2/15/06 to 11/15/24; Market value — $1,020,002) | | | 1,000,000 | |
| 1,000,000 | | Interest in $59,758,000 joint tri-party repurchase agreement dated 4/29/05 with Merrill Lynch, 2.920% due 5/2/05; Proceeds at maturity — $1,000,243; (Fully collateralized by U.S. Treasury Notes, 3.125% due 1/31/07; Market value — $1,020,025) | | | 1,000,000 | |
| 1,000,000 | | Interest in $485,347,000 joint tri-party repurchase agreement dated 4/29/05 with Morgan Stanley, 2.950% due 5/2/05; Proceeds at maturity — $1,000,246; (Fully collateralized by various government agency obligations, 0.000% to 6.000% due 3/3/08 to 3/3/25; Market value — $1,027,423) | | | 1,000,000 | |
| 1,000,000 | | Interest in $850,128,000 joint tri-party repurchase agreement dated 4/29/05 with UBS Securities LLC, 2.950% due 5/2/05; Proceeds at maturity — $1,000,246; (Fully collateralized by various U.S. government agency obligations, 0.000% to 8.875% due 5/26/05 to 8/6/38; Market value — $1,020,004) | | | 1,000,000 | |
|
|
| | | TOTAL REPURCHASE AGREEMENTS
(Cost — $5,752,000) | | | 5,752,000 | |
|
|
| | | TOTAL INVESTMENTS — 135.6%
(Cost — $20,282,254**) | | | 20,518,616 | |
| | | Liabilities in Excess of Other Assets — (35.6)% | | | (5,394,325 | ) |
|
|
| | | TOTAL NET ASSETS — 100.0% | | $ | 15,124,291 | |
|
|
| (a) | | All or a portion of this security is held as collateral for open futures contracts. |
| (b) | | All or a portion of this security has been segregated for open futures contracts and/or “to-be-announced” securities. |
| (c) | | Security is issued on a “to-be-announced” basis. |
| (d) | | Security acquired under mortgage dollar roll agreement. |
| (e) | | All ratings are by Standard & Poor’s Ratings Services, except for those identified by an asterisk (*), which are rated by Moody’s Investors Service. |
See Notes to Financial Statements.
25 Travelers Series Fund Inc. | 2005 Semi-Annual Report
| | |
| Schedules of Investments (unaudited) (continued) | | April 30, 2005 |
| (f) | | Security is exempt from registration under Rule 144A of the Securities Act of 1933. This security may be resold in transactions that are exempt from registration, normally to qualified institutional buyers. These securities have been deemed liquid pursuant to guidelines approved by the Board of Directors. |
| (g) | | Variable-rate security. Rate shown is rate in effect on April 30, 2005. |
| (h) | | Security is currently in default. |
| (i) | | Non-income producing security. |
| (j) | | Security is valued in good faith at fair value by or under the direction of the Board of Directors. |
| † | | Face amount denominated in U.S. dollars unless noted otherwise. |
| ** | | Aggregate cost for federal income tax purposes is substantially the same. |
| # | | This security has been deemed illiquid. |
| | | | |
Abbreviations used in this schedule:
|
| | | | |
| EUR | | — | | Euro |
| SEK | | — | | Swedish Krona |
See Notes to Financial Statements.
26 Travelers Series Fund Inc. | 2005 Semi-Annual Report
| | |
| Schedules of Investments (unaudited) (continued) | | April 30, 2005 |
SB ADJUSTABLE RATE INCOME PORTFOLIO
| | | | | | | |
FACE
AMOUNT | | RATING(a) | | SECURITY | | VALUE |
| ADJUSTABLE-RATE SECURITIES — 90.7% | | | |
| ASSET-BACKED SECURITIES — 21.8% | | | |
| $ 250,000 | | AAA | | Advanta Business Card Master Trust, Series 2003-B, Class A, 3.340% due 12/22/08 | | $ | 250,547 |
| 208,837 | | AAA | | Ameriquest Mortgage Securities Inc., Series 2004-R8, Class A5, 3.390% due 9/25/34 | | | 209,517 |
| 54,857 | | AAA | | Amortizing Residential Collateral Trust, Series 2002-BC10, Class A3, 3.450% due 1/25/33 | | | 54,926 |
| 253,893 | | AAA | | Argent Securities Inc., Series 2004-W10, Class A2, 3.410% due 10/25/34 | | | 254,590 |
| | | | | Asset Backed Securities Corp., Home Equity Loan Trust: | | | |
| 283,845 | | AAA | | Series 2001-HE3, Class A1, 3.224% due 11/15/31 | | | 284,141 |
| 69,441 | | AAA | | Series 2003-HE3, Class A2, 3.304% due 6/15/33 | | | 69,501 |
| | | | | Bayview Financial Acquisition Trust: | | | |
| 150,000 | | AAA | | Series 2001-CA, Class A1, 3.390% due 8/25/36 (b) | | | 150,118 |
| 159,164 | | AAA | | Series 2002-DA, Class A, 3.450% due 8/25/32 (b) | | | 159,470 |
| 60,671 | | AAA | | Series 2003-E, Class A, 3.560% due 10/28/34 | | | 60,895 |
| 130,000 | | AAA | | Series 2003-G, Class A1, 3.660% due 1/28/39 | | | 130,284 |
| 214,589 | | AAA | | Bear Stearns Asset Backed Securities I Trust, Series 2004-B01, Class 2A2, 3.420% due 9/25/34 | | | 214,994 |
| | | | | Bear Stearns Asset Backed Securities Trust: | | | |
| 139,031 | | AAA | | Series 2003-1, Class A1, 3.520% due 11/25/42 | | | 139,706 |
| 91,233 | | AAA | | Series 2003-SD1, Class A, 3.470% due 12/25/33 | | | 91,560 |
| 109,751 | | AAA | | Series 2003-SD3, Class A, 3.500% due 12/25/42 | | | 110,003 |
| | | | | Business Loan Express: | | | |
| 131,654 | | Aaa* | | Series 2001-1A, Class A, 3.640% due 7/20/27 (b) | | | 132,587 |
| 163,771 | | AAA | | Series 2002-AA, Class A, 3.670% due 6/25/28 (b) | | | 165,036 |
| 118,142 | | AAA | | Series 2003-2A, Class A, 3.820% due 1/25/32 (b) | | | 119,523 |
| 217,811 | | AAA | | Series 2003-AA, Class A, 3.904% due 5/15/29 (b) | | | 221,650 |
| 375,000 | | AAA | | Capital One Master Trust, Series 2001-1, Class A, 3.154% due 12/15/10 | | | 376,966 |
| 247,113 | | AAA | | CDC Mortgage Capital Trust, Series 2002-HE1, Class A, 3.330% due 1/25/33 | | | 247,751 |
| 210,371 | | AAA | | Cendant Mortgage Corp., Series 2003-A, Class A3, 3.570% due 7/25/43 (b) | | | 211,287 |
| 225,000 | | AAA | | Circuit City Credit Card Master Trust, Series 2003-2, Class A, 3.384% due 4/15/11 | | | 225,761 |
| 250,000 | | AAA | | Countrywide Asset-Backed Certificates, Series 2004-6, Class 2A4, 3.470% due 11/25/34 | | | 251,374 |
| 248,000 | | AA+ | | CS First Boston Mortgage Securities Corp., Series 2001-HE16, Class M1, 3.670% due 11/25/31 | | | 249,289 |
| 180,108 | | AAA | | First Franklin Mortgage Loan Trust, Series 2002-FF3, Class A2, 3.480% due 8/25/32 | | | 180,475 |
| 156,871 | | AAA | | Fremont Home Loan Trust, Series 2003-A, Class 2A2, 3.375% due 8/25/33 | | | 157,305 |
See Notes to Financial Statements.
27 Travelers Series Fund Inc. | 2005 Semi-Annual Report
| | |
| Schedules of Investments (unaudited) (continued) | | April 30, 2005 |
SB ADJUSTABLE RATE INCOME PORTFOLIO
| | | | | | | |
FACE
AMOUNT | | RATING(a) | | SECURITY | | VALUE |
| ASSET-BACKED SECURITIES — 21.8% (continued) | | | |
| $ 250,000 | | AAA | | GMAC Mortgage Corporation Loan Trust, Series 2004-HE2, Class A2, 2.880% due 10/25/33 | | $ | 246,847 |
| 100,189 | | AAA | | Household Home Equity Loan Trust, Series 2002-4, Class A, 3.540% due 10/20/32 | | | 100,413 |
| 344,713 | | AAA | | Morgan Stanley ABS Capital I Inc. Trust, Series 2003-HE1, Class A4, 3.520% due 5/25/33 | | | 345,965 |
| 450,000 | | AA | | New Century Home Equity Loan Trust, Series 2004-2, Class M2, 3.640% due 8/25/34 (c) | | | 452,685 |
| 64,315 | | AAA | | Option One Mortgage Loan Trust, Series 2003-1, Class A2, 3.440% due 2/25/33 | | | 64,552 |
| 278,162 | | AAA | | Renaissance Home Equity Loan Trust, Series 2003-3, Class A, 3.520% due 12/25/33 | | | 279,658 |
| 31,288 | | AAA | | Saxon Asset Securities Trust, Series 2002-1, Class AV1, 3.270% due 3/25/32 | | | 31,357 |
| 173,321 | | AAA | | Securitized Asset Backed Receivables LLC Trust, Series 2004-OP1, Class A2, 3.270% due 2/25/34 | | | 173,422 |
| 87,995 | | AAA | | Soundview Home Equity Loan Trust, Series 2003-1, Class A, 3.470% due 8/25/31 | | | 88,270 |
| 58,932 | | Aaa* | | Specialty Underwriting & Residential Finance Trust, Series 2003-BC1, Class A, 3.360% due 1/25/34 | | | 59,016 |
| | | | | Structured Asset Investment Loan Trust: | | | |
| 120,112 | | AAA | | Series 2003-BC1, Class A2, 3.360% due 1/25/33 | | | 120,435 |
| 450,000 | | AAA | | Series 2003-BC10, Class 3A5, 3.500% due 10/25/33 (c) | | | 451,197 |
| 200,000 | | AAA | | World Financial Network Credit Card Master Note Trust, Series 2003-A, Class A2, 3.324% due 5/15/12 | | | 201,183 |
|
| | | | | TOTAL ASSET-BACKED SECURITIES (Cost — $7,321,281) | | | 7,334,256 |
|
| COLLATERALIZED MORTGAGE OBLIGATIONS — 29.1% | | | |
| 270,182 | | AAA | | Banc of America Mortgage Securities, Inc., Series 2003-F, Class 1A1, 2.969% due 7/25/33 | | | 267,633 |
| 349,347 | | AAA | | Bear Stearns ARM, Series 2004-12, Class 1A1, 4.267% due 2/25/35 | | | 349,019 |
| 231,769 | | AAA | | Bear Stearns Asset Backed Securities Trust, Series 2003-AC5, Class A3, 3.620% due 10/25/33 | | | 231,903 |
| | | | | CHL Mortgage Pass-Through Trust: | | | |
| 311,809 | | AAA | | Series 2001-HYB1, Class 1A1, 4.093% due 6/19/31 | | | 314,566 |
| 147,699 | | AAA | | Series 2002-26, Class A4, 3.520% due 12/25/17 | | | 148,133 |
| 160,012 | | AAA | | Series 2003-HYB3, Class 7A1, 3.810% due 11/19/33 | | | 156,561 |
| 21,619 | | AAA | | Credit-Based Asset Servicing and Securitization LLC, Series 2002-CB6, Class 2A1, 3.520% due 1/25/33 | | | 21,641 |
| 465,723 | | AAA | | Deutsche Mortgage Securities, Inc. Mortgage Loan Trust, Series 2004-4, Class 7AR2, 3.470% due 6/25/34 (c) | | | 467,108 |
| 115,306 | | AAA | | GGP Mall Properties Trust, Series 2001-C1A, Class A3, 3.654% due 2/15/14 (b) | | | 115,831 |
| 451,648 | | AAA | | GMAC Commercial Mortgage Asset Corp., Series 2003-SNFA, Class A, 3.770% due 1/17/18 (b)(c) | | | 452,677 |
See Notes to Financial Statements.
28 Travelers Series Fund Inc. | 2005 Semi-Annual Report
| | |
| Schedules of Investments (unaudited) (continued) | | April 30, 2005 |
SB ADJUSTABLE RATE INCOME PORTFOLIO
| | | | | | | |
FACE
AMOUNT | | RATING(a) | | SECURITY | | VALUE |
| COLLATERALIZED MORTGAGE OBLIGATIONS — 29.1% (continued) | | | |
| $ 359,506 | | AA+ | | Impac CMB Trust, Series 2003-8, Class 1A2, 3.520% due 10/25/33 | | $ | 360,048 |
| 167,791 | | AAA | | Impac Secured Assets Corp., Series 2004-3, Class 1A4, 3.420% due 11/25/34 | | | 168,831 |
| 6,349 | | AAA | | Long Beach Mortgage Loan Trust, Series 2002-2, Class 2A, 3.300% due 7/25/32 | | | 6,354 |
| 415,161 | | AAA | | MASTR Alternative Loan Trust, Series 2003-7, Class 7A1, 3.420% due 11/25/33 (c) | | | 415,484 |
| 291,899 | | AAA | | Merrill Lynch Mortgage Investors Trust, Series 2005-A2, Class A4, 4.507% due 2/25/35 | | | 291,671 |
| 190,256 | | AAA | | Morgan Stanley Mortgage Loan Trust, Series 2004-5AR, Class 1A2, 3.136% due 7/25/34 | | | 189,661 |
| | | | | Residential Asset Securitization Trust: | | | |
| 175,891 | | AAA | | Series 2003-A11, Class A2, 3.470% due 11/25/33 | | | 175,889 |
| 388,640 | | AAA | | Series 2004-A2, Class 1A3, 3.420% due 5/25/34 | | | 389,742 |
| 77,139 | | AAA | | Series 2004-A4, Class A2, 3.370% due 8/25/34 | | | 77,133 |
| 141,148 | | AAA | | Residential Funding Mortgage Securities I Trust, Series 2003-S10, Class A2, 3.420% due 6/25/33 | | | 141,220 |
| | | | | Sequoia Mortgage Trust: | | | |
| 83,545 | | AAA | | Series 9, Class 2A, 4.230% due 9/20/32 | | | 85,556 |
| 220,980 | | AAA | | Series 2003-2, Class A1, 3.320% due 6/20/33 | | | 221,159 |
| | | | | Structured ARM Loan Trust: | | | |
| 296,525 | | AAA | | Series 2004-1, Class 1A, 4.832% due 2/25/34 | | | 302,613 |
| 94,534 | | AAA | | Series 2004-1, Class 2A, 3.330% due 2/25/34 | | | 94,622 |
| 130,627 | | AAA | | Series 2004-7, Class A1, 3.290% due 6/25/34 | | | 130,691 |
| 166,565 | | Aaa* | | Series 2004-17, Class A1, 3.601% due 11/25/34 | | | 166,760 |
| 150,000 | | AAA | | Series 2005-3XS, Class A2, 3.270% due 1/25/35 | | | 150,205 |
| | | | | Structured Asset Mortgage Investments Inc.: | | | |
| 74,956 | | AAA | | Series 2002-AR1, Class 1A, 4.599% due 3/25/32 | | | 75,391 |
| 106,118 | | AAA | | Series 2002-AR1, Class 2A, 4.042% due 3/25/32 | | | 107,114 |
| 424,246 | | AAA | | Series 2003-AR2, Class A1, 3.350% due 12/19/33 (c) | | | 426,100 |
| | | | | Structured Asset Securities Corp.: | | | |
| 129,457 | | AA‡ | | Series 1998-3, Class M1, 4.020% due 3/25/28 | | | 129,612 |
| 145,056 | | AA | | Series 1998-8, Class M1, 3.960% due 8/25/28 | | | 145,224 |
| 286,777 | | AAA | | Series 2002-8A, Class 7A1, 4.241% due 5/25/32 | | | 290,329 |
| 131,372 | | AAA | | Series 2002-16A, Class 1A1, 4.762% due 8/25/32 | | | 133,671 |
| 113,472 | | AAA | | Series 2002-18A, Class 4A, 4.820% due 9/25/32 | | | 117,135 |
| 51,333 | | AAA | | Series 2003-8, Class 2A9, 3.520% due 4/25/33 | | | 51,353 |
| 18,949 | | AAA | | Series 2003-NP3, Class A1, 3.520% due 11/25/33 (b) | | | 18,972 |
| 306,988 | | AAA | | Series 2004-NP1, Class A, 3.420% due 9/25/33 (b) | | | 307,370 |
| | | | | Thornburg Mortgage Securities Trust: | | | |
| 310,369 | | AAA | | Series 2004-1, Class I2A, 3.470% due 3/25/44 | | | 311,306 |
| 240,830 | | AAA | | Series 2004-3, Class A, 3.390% due 9/25/34 | | | 241,600 |
| | | | | Washington Mutual Mortgage Pass-Through Certificates: | | | |
| 210,632 | | AAA | | Series 2002-AR1, Class 1A1, 4.626% due 11/25/30 | | | 210,841 |
| 127,779 | | AAA | | Series 2003-AR10, Class A3B, 3.890% due 10/25/33 | | | 127,548 |
See Notes to Financial Statements.
29 Travelers Series Fund Inc. | 2005 Semi-Annual Report
| | |
| Schedules of Investments (unaudited) (continued) | | April 30, 2005 |
SB ADJUSTABLE RATE INCOME PORTFOLIO
| | | | | | | |
FACE
AMOUNT | | RATING(a) | | SECURITY | | VALUE |
| COLLATERALIZED MORTGAGE OBLIGATIONS — 29.1% (continued) | | | |
| $ 279,085 | | AAA | | Series 2003-S6, Class 2A8, 3.420% due 7/25/18 | | $ | 279,398 |
| 168,006 | | AAA | | Series 2004-AR2, Class A, 3.571% due 4/25/44 | | | 169,838 |
| | | | | Wells Fargo Mortgage Backed Securities Trust: | | | |
| 143,120 | | Aaa* | | Series 2003-5, Class A4, 3.420% due 5/25/33 | | | 143,282 |
| 200,000 | | AAA | | Series 2004-N, Class A2, 3.599% due 8/25/34 | | | 199,465 |
| 168,144 | | AAA | | Series 2004-S, Class A2, 3.541% due 9/25/34 | | | 167,873 |
| 277,394 | | AAA | | Series 2004-Y, Class 1A1, 4.578% due 11/25/34 | | | 275,932 |
|
| | | | | TOTAL COLLATERALIZED MORTGAGE OBLIGATIONS
(Cost — $9,831,417) | | | 9,822,065 |
|
| U.S. GOVERNMENT AGENCY COLLATERALIZED MORTGAGE OBLIGATIONS — 9.4% |
| | | | | Fannie Mae Grantor Trust: | | | |
| 461,554 | | | | Series 2001-T1, Class A2, 4.562% due 10/25/40 (c) | | | 472,256 |
| 273,769 | | | | Series 2002-T18, Class A5, 4.422% due 5/25/42 | | | 280,475 |
| 211,398 | | | | Series 2002-T19, Class A4, 4.409% due 3/25/42 | | | 216,016 |
| 271,881 | | | | Series 2004-T2, Class 2A, 4.297% due 7/25/43 | | | 277,299 |
| | | | | Fannie Mae REMIC Trust: | | | |
| 316,237 | | | | Series 1997-20, Class F, 2.629% due 3/25/27 | | | 314,083 |
| | | | | Series 2003-117: | | | |
| 137,116 | | | | Class DF, 3.570% due 12/25/33 | | | 137,173 |
| 381,121 | | | | Class KF, 3.420% due 8/25/33 | | | 382,662 |
| 77,545 | | | | Series 2003-124, Class F, 3.320% due 1/25/34 | | | 77,789 |
| 437,538 | | | | Series 2004-31, Class FG, 3.420% due 8/25/33 (c) | | | 439,044 |
| | | | | Fannie Mae Whole Loan: | | | |
| 122,383 | | | | Series 2003-W6, Class F, 3.370% due 9/25/42 | | | 123,041 |
| 156,191 | | | | Series 2003-W14, Class 2A, 4.309% due 1/25/43 | | | 159,965 |
| 268,258 | | | | Series 2003-W15, Class 3A, 4.306% due 12/25/42 | | | 274,186 |
|
| | | | | TOTAL U.S. GOVERNMENT AGENCY COLLATERALIZED MORTGAGE OBLIGATIONS (Cost — $3,155,001) | | | 3,153,989 |
|
| U.S. GOVERNMENT AGENCY PASS-THROUGHS — 30.4% | | | |
Federal Home Loan Mortgage Corporation (FHLMC) — 4.7% | | | |
| | | | | FHLMC One Year CMT ARM: | | | |
| 227,931 | | | | 4.061% due 2/1/23 | | | 233,684 |
| 185,656 | | | | 4.056% due 4/1/26 | | | 190,821 |
| 120,172 | | | | 4.162% due 8/1/30 | | | 123,898 |
| | | | | FHLMC 3/1 Hybrid ARM: | | | |
| 263,055 | | | | 4.205% due 7/1/29 | | | 270,206 |
| 172,806 | | | | 3.377% due 10/1/33 | | | 174,039 |
| 591,668 | | | | FHLMC 5/1 Hybrid ARM, 4.075% due 5/1/33 (c) | | | 591,043 |
|
| | | | | | | | 1,583,691 |
|
Federal National Mortgage Association (FNMA) — 22.2% | | | |
| | | | | FNMA Six Month LIBOR: | | | |
| 119,214 | | | | 4.886% due 2/1/33 | | | 121,057 |
| 298,257 | | | | 4.303% due 4/1/33 | | | 300,189 |
See Notes to Financial Statements.
30 Travelers Series Fund Inc. | 2005 Semi-Annual Report
| | |
| Schedules of Investments (unaudited) (continued) | | April 30, 2005 |
SB ADJUSTABLE RATE INCOME PORTFOLIO
| | | | | | | |
FACE
AMOUNT | | RATING(a) | | SECURITY | | VALUE |
Federal National Mortgage Association (FNMA) — 22.2% (continued) | | | |
| $ 136,772 | | | | 4.617% due 4/1/33 | | $ | 138,301 |
| 334,027 | | | | 4.917% due 4/1/33 | | | 341,646 |
| 151,955 | | | | 4.562% due 5/1/33 | | | 153,694 |
| 55,994 | | | | 4.440% due 6/1/33 | | | 56,496 |
| 423,566 | | | | 4.002% due 8/1/34 | | | 420,382 |
| 292,024 | | | | 4.513% due 10/1/34 | | | 292,427 |
| 446,370 | | | | 4.780% due 10/1/34 | | | 451,886 |
| | | | | FNMA One Year LIBOR: | | | |
| 128,338 | | | | 4.068% due 1/1/33 | | | 129,090 |
| 220,851 | | | | 4.220% due 6/1/33 | | | 221,315 |
| 313,946 | | | | 4.060% due 7/1/33 | | | 313,608 |
| 161,557 | | | | 4.159% due 10/1/33 | | | 161,801 |
| 500,000 | | | | 4.316% due 3/1/35 | | | 498,437 |
| 187,297 | | | | 3.424% due 7/1/43 | | | 188,522 |
| | | | | FNMA One Year CMT ARM: | | | |
| 521,200 | | | | 3.752% due 8/1/15 | | | 519,918 |
| 353,626 | | | | 4.035% due 4/1/20 | | | 353,524 |
| 362,696 | | | | 4.205% due 11/1/25 | | | 369,330 |
| 470,874 | | | | 4.367% due 1/1/26 | | | 483,022 |
| 201,102 | | | | 4.240% due 7/1/26 | | | 204,845 |
| 292,281 | | | | 4.059% due 5/1/28 | | | 295,886 |
| 240,839 | | | | 4.404% due 5/1/28 | | | 246,594 |
| 158,101 | | | | 4.475% due 5/1/28 | | | 162,869 |
| 160,847 | | | | 4.741% due 9/1/32 | | | 163,325 |
| 149,069 | | | | 3.844% due 1/1/33 | | | 151,540 |
| 145,598 | | | | 4.287% due 2/1/33 | | | 146,917 |
| 144,713 | | | | 4.066% due 5/1/33 | | | 144,039 |
| 296,991 | | | | 4.204% due 7/1/33 | | | 295,454 |
| 167,355 | | | | 3.140% due 8/1/33 | | | 166,251 |
|
| | | | | | | | 7,492,365 |
|
Government National Mortgage Association (GNMA) — 3.5% |
| | | | | GNMA II One Year CMT ARM: | | | |
| 150,144 | | | | 3.375% due 5/20/26 | | | 152,028 |
| 146,899 | | | | 3.375% due 5/20/32 | | | 148,836 |
| 88,860 | | | | 3.500% due 7/20/34 | | | 86,836 |
| 490,527 | | | | 4.000% due 1/20/35 | | | 495,510 |
| 297,244 | | | | 4.000% due 2/20/35 | | | 293,094 |
|
| | | | | | | | 1,176,304 |
|
| | | | | TOTAL U.S. GOVERNMENT AGENCY
PASS-THROUGHS (Cost — $10,311,808) | | | 10,252,360 |
|
| | | | | TOTAL ADJUSTABLE-RATE SECURITIES (Cost — $30,619,507) | | | 30,562,670 |
|
See Notes to Financial Statements.
31 Travelers Series Fund Inc. | 2005 Semi-Annual Report
| | |
| Schedules of Investments (unaudited) (continued) | | April 30, 2005 |
SB ADJUSTABLE RATE INCOME PORTFOLIO
| | | | | | | |
FACE
AMOUNT | | RATING(a) | | SECURITY | | VALUE |
| FIXED-RATE SECURITIES — 5.7% | | | |
| ASSET-BACKED SECURITIES — 1.1% | | | |
| $ 288,765 | | AAA | | Credit Acceptance Auto Dealer Loan Trust, Series 2004-1, Class A, 2.530% due 8/17/09 (b) | | $ | 288,448 |
| 80,869 | | AA | | MMCA Automobile Trust, Series 2001-4, Class A4, 4.920% due 8/15/07 | | | 81,184 |
|
| | | | | TOTAL ASSET-BACKED SECURITIES (Cost — $370,467) | | | 369,632 |
|
| COLLATERALIZED MORTGAGE OBLIGATIONS — 1.2% | | | |
| 300,000 | | AAA | | ABN AMRO Mortgage Corp., Series 2003-5, Class A11, 4.750% due 4/25/33 | | | 297,307 |
| 126,050 | | AAA | | Merrill Lynch Mortgage Investors, Inc., | | | |
| | | | | Series 2003-A5, Class 2A3, 3.246% due 8/25/33 | | | 125,647 |
|
| | | | | TOTAL COLLATERALIZED MORTGAGE OBLIGATIONS (Cost — $426,744) | | | 422,954 |
|
| U.S. GOVERNMENT AGENCY COLLATERALIZED MORTGAGE OBLIGATIONS — 2.2% |
| 105,785 | | | | Fannie Mae REMIC Trust, Series 2003-111, Class HR, 3.750% due 5/25/30 | | | 103,705 |
| | | | | Freddie Mac: | | | |
| 250,000 | | | | Series 2852, Class TE, 5.000% due 1/15/13 | | | 253,580 |
| 375,000 | | | | Series 2866, Class WA, 5.000% due 8/15/16 | | | 380,964 |
|
| | | | | TOTAL U.S. GOVERNMENT AGENCY COLLATERALIZED MORTGAGE OBLIGATIONS (Cost — $746,831) | | | 738,249 |
|
| U.S. GOVERNMENT AGENCY PASS-THROUGHS — 1.2% | | | |
| | | | | FNMA: | | | |
| 3,868 | | | | 15 Year, 9.500% due 12/1/06 | | | 3,870 |
| 341,449 | | | | 30 Year, 12.000% due 4/20/16 | | | 404,264 |
|
| | | | | TOTAL U.S. GOVERNMENT AGENCY PASS-THROUGHS (Cost — $397,770) | | | 408,134 |
|
| | | | | TOTAL FIXED-RATE SECURITIES (Cost — $1,941,812) | | | 1,938,969 |
|
| | | | | SUB-TOTAL INVESTMENTS (Cost — $32,561,319) | | $ | 32,501,639 |
|
See Notes to Financial Statements.
32 Travelers Series Fund Inc. | 2005 Semi-Annual Report
| | |
| Schedules of Investments (unaudited) (continued) | | April 30, 2005 |
SB ADJUSTABLE RATE INCOME PORTFOLIO
| | | | | | | | |
FACE
AMOUNT | | RATING(a) | | SECURITY | | VALUE | |
| REPURCHASE AGREEMENT — 3.6% | | | | |
| $1,202,000 | | | | Interest in $1,326,764,000 joint tri-party repurchase agreement dated 4/29/05 with Bank of America Corp., 2.960% due 5/2/05; Proceeds at maturity — $1,202,296; (Fully collateralized by various U.S. government agency obligations, 0.000% to 3.350% due 7/27/05 to 11/9/07; Market value — $1,226,040) (Cost — $1,202,000) | | $ | 1,202,000 | |
|
|
| | | | | TOTAL INVESTMENTS — 100.0% (Cost —$33,763,319**) | | | 33,703,639 | |
| | | | | Liabilities in Excess of Other Assets — 0.0% | | | (15,169 | ) |
|
|
| | | | | TOTAL NET ASSETS — 100.0% | | $ | 33,688,470 | |
|
|
| (a) | | All ratings are by Standard & Poor’s Rating Service, except those identified by an asterisk (*) which are rated by Moody’s Investor Service, Inc. and by a double dagger (‡) which are rated by the Fitch Ratings. |
| (b) | | Security is exempt from registration under Rule 144A of the Securities Act of 1933. This security may be resold in transactions that are exempt from registration, normally to qualified institutional buyers. This security has been deemed liquid pursuant to guidelines approved by the Board of Directors. |
| (c) | | All or a portion of this security is segregated for open futures contracts commitments. |
| ** | | Aggregate cost for federal income tax purposes is substantially the same. |
| | | | |
Abbreviations used in this schedule:
|
| | | | |
| ARM | | — | | Adjustable Rate Mortgage |
| CMT | | — | | Constant Maturity Treasury Index |
| LIBOR | | — | | London Interbank Offered Rate |
| REMIC | | — | | Real Estate Mortgage Investment Conduit |
| | | | | |
| See pages 34 and 35 for definitions of ratings. |
See Notes to Financial Statements.
33 Travelers Series Fund Inc. | 2005 Semi-Annual Report
Bond Ratings (unaudited)
The definitions of the applicable rating symbols are set forth below:
Standard & Poor’s Ratings Service (“Standard and Poor’s”) — Ratings from “AA” to “CCC” may be modified by the addition of a plus (+) or minus (–) sign to show relative standings within the major rating categories.
| | |
AAA | | — Bonds rated “AAA” have the highest rating assigned by Standard & Poor’s. Capacity to pay interest and repay principal is extremely strong. |
AA | | — Bonds rated “AA” have a very strong capacity to pay interest and repay principal and differs from the highest rated issue only in a small degree. |
A | | — Bonds rated “A” have a strong capacity to pay interest and repay principal although it is somewhat more susceptible to the adverse effects of changes in circumstances and economic conditions than bonds in higher rated categories. |
BBB | | — Bonds rated “BBB” are regarded as having an adequate capacity to pay interest and repay principal. Whereas they normally exhibit adequate protection parameters, adverse economic conditions or changing circumstances are more likely to lead to a weakened capacity to pay interest and repay principal for bonds in this category than in higher rated categories. |
| BB, B, CCC, CC and C | | — Bonds rated “BB”, “B”, “CCC”, “CC” and “C” are regarded, on balance, as predominantly speculative with respect to capacity to pay interest and repay principal in accordance with the terms of the obligation. “BB” represents the lowest degree of speculation and “C” the highest degree of speculation. While such bonds will likely have some quality and protective characteristics, these are outweighed by large uncertainties or major risk exposures to adverse conditions. |
D | | — Bonds rated “D” are in default, and payment of interest and/or repayment of principal is in arrears. |
Moody’s Investors Service (“Moody’s”) — Numerical modifiers 1, 2 and 3 may be applied to each generic rating from “Aa” to “Caa,” where 1 is the highest and 3 the lowest rating within its generic category.
| | |
Aaa | | — Bonds rated “Aaa” are judged to be of the best quality. They carry the smallest degree of investment risk and are generally referred to as “gilt edge.” Interest payments are protected by a large or by an exceptionally stable margin and principal is secure. While the various protective elements are likely to change, such changes as can be visualized are most unlikely to impair the fundamentally strong position of such issues. |
Aa | | — Bonds rated “Aa” are judged to be of high quality by all standards. Together with the “Aaa” group they comprise what are generally known as high grade bonds. They are rated lower than the best bonds because margins of protection may not be as large as in “Aaa” securities or fluctuation of protective elements may be of greater amplitude or there may be other elements present which make the long-term risks appear somewhat larger than in “Aaa” securities. |
A | | — Bonds rated “A” possess many favorable investment attributes and are to be considered as upper medium grade obligations. Factors giving security to principal and interest are considered adequate, but elements may be present that suggest a susceptibility to impairment some time in the future. |
Baa | | — Bonds rated “Baa” are considered to be medium grade obligations, i.e., they are neither highly protected nor poorly secured. Interest payment and principal security appear adequate for the present but certain protective elements may be lacking or may be characteristically unreliable over any great length of time. Such bonds lack outstanding investment characteristics and in fact have speculative characteristics as well. |
Ba | | — Bonds rated “Ba” are judged to have speculative elements; their future cannot be considered as well assured. Often the protection of interest and principal payments may be very moderate thereby not well safeguarded during both good and bad times over the future. Uncertainty of position characterizes bonds in this class. |
34 Travelers Series Fund Inc. | 2005 Semi-Annual Report
Bond Ratings (unaudited) (continued)
| | |
B | | — Bonds rated “B” generally lack characteristics of the desirable investments. Assurance of interest and principal payments or maintenance of other terms of the contract over any long period of time may be small. |
Caa and Ca | | — Bonds rated “Caa” and “Ca” are of poor standing. Such issues may be in default or present elements of danger with respect to principal or interest. |
C | | — Bonds rated “C” are the lowest rated class of bonds, and issues so rated can be regarded as having extremely poor prospects of ever attaining any real investment standing. |
Fitch Ratings (“Fitch’’) — Ratings from “AAA” to “CCC” may be modified by the additional of a plus (+) or a minus (-) sign to show relative standings with the major ratings categories.
| | |
AA | | — Bonds rated “AA” are considered to be investment-grade and of very high credit quality. The obligator’s ability to pay interest and/or dividends and repay principal is very strong. |
A | | — Bonds rated “A” are considered to have a low expectation of credit risk. The capacity for timely payment of financial commitments is considered to be strong, but may be more vulnerable to changes in economic conditions and circumstances than bonds with higher ratings. |
BBB | | — Bonds rated “BBB” currently have a low expectation of credit risk. The capacity for timely payment of financial commitments is considered to be adequate. Adverse changes in economic conditions and circumstances, however, are more likely to impair this capacity. This is the lowest investment grade category assigned by Fitch. |
BB | | — Bonds rated “BB” indicate that there is a possibility of credit risk developing, particularly as the result of adverse economic change over time; however, business of financial alternatives may be available to allow financial commitments to be met. |
B | | — Bonds rated “B” indicate that significant credit risk is present, but a limited margin of safety remains. Financial Commitments are currently being met; however, capacity for continued payment is contingent upon a sustained, favorable business and economic environment. |
CCC, CC and C | | — Bonds rated “CCC”, “CC” and “C” carry the real possibility of defaulting. The capacity to meet financial commitments depends solely on a sustained, favorable business and economic environment. Default of some kind on bonds rated “CC” appears probable, a “C” rating indicates imminent default. |
NR | | — Indicates that the bond is not rated by Standard & Poor’s, Moody’s or Fitch. |
35 Travelers Series Fund Inc. | 2005 Semi-Annual Report
| | |
| Statements of Assets and Liabilities (unaudited) | | April 30, 2005 |
| | | | | | | | | | | | |
| | | Smith Barney
International
All Cap Growth
Portfolio | | | Salomon Brothers
Strategic Total
Return Bond
Portfolio | | | SB Adjustable
Rate Income
Portfolio | |
| ASSETS: | | | | | | | | | | | | |
Investments, at value (Cost —$117,446,732, $14,530,254 and $32,561,319, respectively) | | $ | 158,067,459 | | | $ | 14,766,616 | | | $ | 32,501,639 | |
Short-term investments, at value
(Cost — $22,830,867, $5,752,000 and $1,202,000, respectively) | | | 22,830,867 | | | | 5,752,000 | | | | 1,202,000 | |
Foreign currency, at value
(Cost — $81,742) | | | 81,394 | | | | — | | | | — | |
Cash | | | 869 | | | | 457 | | | | 8,497 | |
Dividends and interest receivable | | | 752,583 | | | | 160,134 | | | | 78,678 | |
Receivable for securities sold | | | 741,713 | | | | 262,247 | | | | — | |
Receivable for open forward foreign currency contracts (Notes 1 and 3) | | | 1,314 | | | | 48,075 | | | | — | |
Receivable for Fund shares sold | | | — | | | | — | | | | 71,805 | |
Principal payments receivable | | | — | | | | — | | | | 35,283 | |
Receivable from broker — variation margin on open futures contracts | | | — | | | | 5,062 | | | | 4,500 | |
Prepaid expenses | | | 2,766 | | | | — | | | | — | |
|
|
Total Assets | | | 182,478,965 | | | | 20,994,591 | | | | 33,902,402 | |
|
|
| LIABILITIES: | | | | | | | | | | | | |
Payable for loaned securities collateral (Notes 1 and 3) | | | 19,628,867 | | | | — | | | | — | |
Payable for securities purchased | | | 1,027,652 | | | | 5,750,524 | | | | 167,751 | |
Management fees payable | | | 114,910 | | | | 12,803 | | | | 14,955 | |
Payable for Fund shares reacquired | | | 111,787 | | | | 27,736 | | | | — | |
Payable for open forward foreign currency contracts (Notes 1 and 3) | | | 2,089 | | | | 50,142 | | | | — | |
Transfer agency services payable | | | 834 | | | | 833 | | | | 828 | |
Directors’ fees payable | | | 84 | | | | 416 | | | | 567 | |
Distribution plan fees payable | | | — | | | | — | | | | 827 | |
Deferred mortgage dollar roll income | | | — | | | | 4,254 | | | | — | |
Accrued expenses | | | 49,201 | | | | 23,592 | | | | 29,004 | |
|
|
Total Liabilities | | | 20,935,424 | | | | 5,870,300 | | | | 213,932 | |
|
|
Total Net Assets | | $ | 161,543,541 | | | $ | 15,124,291 | | | $ | 33,688,470 | |
|
|
| NET ASSETS: | | | | | | | | | | | | |
Par value of capital shares (Note 4) | | $ | 128 | | | $ | 14 | | | $ | 33 | |
Capital paid in excess of par value | | | 185,232,551 | | | | 16,351,649 | | | | 33,589,119 | |
Undistributed net investment income | | | 806,660 | | | | 105,231 | | | | 219,568 | |
Accumulated net realized loss from investment transactions, futures contracts and foreign currencies | | | (65,128,825 | ) | | | (1,556,198 | ) | | | (40,536 | ) |
Net unrealized appreciation (depreciation) of investments, futures contracts and foreign currencies | | | 40,633,027 | | | | 223,595 | | | | (79,714 | ) |
|
|
Total Net Assets | | $ | 161,543,541 | | | $ | 15,124,291 | | | $ | 33,688,470 | |
|
|
Shares Outstanding | | | 12,815,530 | | | | 1,413,942 | | | | 3,344,854 | |
|
|
Net Asset Value | | | $12.61 | | | | $10.70 | | | | $10.07 | |
|
|
See Notes to Financial Statements.
36 Travelers Series Fund Inc. | 2005 Semi-Annual Report
| | |
| Statements of Operations (unaudited) | | |
For the Six Months Ended April 30, 2005
| | | | | | | | | | | | |
| | | Smith Barney
International
All Cap Growth
Portfolio | | | Salomon Brothers
Strategic Total
Return Bond
Portfolio | | | SB Adjustable
Rate Income
Portfolio | |
| INVESTMENT INCOME: | | | | | | | | | | | | |
Dividends | | $ | 2,059,414 | | | $ | 234 | | | $ | — | |
Securities lending income | | | 38,280 | | | | — | | | | — | |
Interest | | | 13,468 | | | | 419,955 | | | | 461,244 | |
Less: Foreign withholding tax | | | (209,549 | ) | | | — | | | | — | |
|
|
Total Investment Income | | | 1,901,613 | | | | 420,189 | | | | 461,244 | |
|
|
| EXPENSES: | | | | | | | | | | | | |
Management fees (Note 2) | | | 710,442 | | | | 62,952 | | | | 87,535 | |
Custody | | | 48,031 | | | | 18,087 | | | | 12,198 | |
Shareholder communications | | | 22,652 | | | | 3,773 | | | | 8,715 | |
Audit and legal | | | 19,064 | | | | 14,580 | | | | 18,044 | |
Directors’ fees | | | 3,602 | | | | 2,150 | | | | 2,304 | |
Transfer agency services (Note 2) | | | 2,454 | | | | 2,469 | | | | 2,496 | |
Distribution plan fees (Note 2) | | | — | | | | — | | | | 36,473 | |
Other | | | 9,580 | | | | 1,308 | | | | 1,381 | |
|
|
Total Expenses | | | 815,825 | | | | 105,319 | | | | 169,146 | |
Less: Fees waivers (Note 2) | | | — | | | | — | | | | (23,255 | ) |
|
|
Net Expenses | | | 815,825 | | | | 105,319 | | | | 145,891 | |
|
|
Net Investment Income | | | 1,085,788 | | | | 314,870 | | | | 315,353 | |
|
|
REALIZED AND UNREALIZED GAIN (LOSS) ON INVESTMENTS, FUTURES CONTRACTS AND FOREIGN CURRENCIES
(NOTES 1 AND 3): | | | | | | | | | | | | |
Realized Gain From: | | | | | | | | | | | | |
Investment transactions | | | 1,814,094 | | | | 177,935 | | | | 1,108 | |
Futures contracts | | | — | | | | 36,707 | | | | — | |
Foreign currency transactions | | | 2,856 | | | | 11,111 | | | | — | |
|
|
Net Realized Gain | | | 1,816,950 | | | | 225,753 | | | | 1,108 | |
|
|
Net Change in Unrealized Appreciation/Depreciation From: | | | | | | | | | | | | |
Investments and futures contracts | | | 9,979,809 | | | | (294,668 | ) | | | (84,427 | ) |
Foreign currencies | | | (223 | ) | | | 37,086 | | | | — | |
|
|
Net Change in Unrealized Appreciation/Depreciation | | | 9,979,586 | | | | (257,582 | ) | | | (84,427 | ) |
|
|
Net Gain (Loss) on Investments, Futures Contracts and Foreign Currencies | | | 11,796,536 | | | | (31,829 | ) | | | (83,319 | ) |
|
|
Increase in Net Assets From Operations | | $ | 12,882,324 | | | $ | 283,041 | | | $ | 232,034 | |
|
|
See Notes to Financial Statements.
37 Travelers Series Fund Inc. | 2005 Semi-Annual Report
| | |
| Statements of Changes in Net Assets | | |
For the Six Months Ended April 30, 2005 (unaudited) and the Year Ended October 31, 2004
| | | | | | | | |
Smith Barney International
All Cap Growth Portfolio | | 2005 | | | 2004 | |
| OPERATIONS: | | | | | | | | |
Net investment income | | $ | 1,085,788 | | | $ | 1,161,805 | |
Net realized gain | | | 1,816,950 | | | | 7,226,272 | |
Net change in unrealized appreciation/depreciation | | | 9,979,586 | | | | 14,905,863 | |
|
|
Increase in Net Assets From Operations | | | 12,882,324 | | | | 23,293,940 | |
|
|
| DISTRIBUTIONS TO SHAREHOLDERS FROM: | | | | | | | | |
Net investment income | | | (1,500,826 | ) | | | (1,763,610 | ) |
|
|
Decrease in Net Assets From
Distributions to Shareholders | | | (1,500,826 | ) | | | (1,763,610 | ) |
|
|
| FUND SHARE TRANSACTIONS (NOTE 4): | | | | | | | | |
Net proceeds from sale of shares | | | 3,957,425 | | | | 17,143,590 | |
Net asset value of shares issued for reinvestment of distributions | | | 1,500,826 | | | | 1,763,610 | |
Cost of shares reacquired | | | (15,017,855 | ) | | | (60,386,891 | ) |
|
|
Decrease in Net Assets From Fund Share Transactions | | | (9,559,604 | ) | | | (41,479,691 | ) |
|
|
Increase (Decrease) in Net Assets | | | 1,821,894 | | | | (19,949,361 | ) |
| NET ASSETS: | | | | | | | | |
Beginning of period | | | 159,721,647 | | | | 179,671,008 | |
|
|
End of period* | | $ | 161,543,541 | | | $ | 159,721,647 | |
|
|
* Includes undistributed net investment income of: | | | $806,660 | | | | $1,221,698 | |
|
|
See Notes to Financial Statements.
38 Travelers Series Fund Inc. | 2005 Semi-Annual Report
| | |
| Statements of Changes in Net Assets (continued) | | |
For the Six Months Ended April 30, 2005 (unaudited) and the Year Ended October 31, 2004
| | | | | | | | |
Salomon Brothers Strategic
Total Return Bond Portfolio | | 2005 | | | 2004 | |
| OPERATIONS: | | | | | | | | |
Net investment income | | $ | 314,870 | | | $ | 841,792 | |
Net realized gain | | | 225,753 | | | | 615,915 | |
Net change in unrealized appreciation/depreciation | | | (257,582 | ) | | | (251,887 | ) |
|
|
Increase in Net Assets From Operations | | | 283,041 | | | | 1,205,820 | |
|
|
| DISTRIBUTIONS TO SHAREHOLDERS FROM: | | | | | | | | |
Net investment income | | | (938,016 | ) | | | (1,228,728 | ) |
|
|
Decrease in Net Assets From
Distributions to Shareholders | | | (938,016 | ) | | | (1,228,728 | ) |
|
|
| FUND SHARE TRANSACTIONS (NOTE 4): | | | | | | | | |
Net proceeds from sale of shares | | | 453,325 | | | | 1,406,864 | |
Net asset value of shares issued for reinvestment of distributions | | | 938,016 | | | | 1,228,728 | |
Cost of shares reacquired | | | (2,164,614 | ) | | | (7,295,139 | ) |
|
|
Decrease in Net Assets From Fund Share Transactions | | | (773,273 | ) | | | (4,659,547 | ) |
|
|
Decrease in Net Assets | | | (1,428,248 | ) | | | (4,682,455 | ) |
| NET ASSETS: | | | | | | | | |
Beginning of period | | | 16,552,539 | | | | 21,234,994 | |
|
|
End of period* | | $ | 15,124,291 | | | $ | 16,552,539 | |
|
|
* Includes undistributed net investment income of: | | | $105,231 | | | | $728,377 | |
|
|
See Notes to Financial Statements.
39 Travelers Series Fund Inc. | 2005 Semi-Annual Report
| | |
| Statements of Changes in Net Assets (continued) | | |
For the Six Months Ended April 30, 2005 (unaudited) and the Year Ended October 31, 2004
| | | | | | | | |
| SB Adjustable Rate Income Portfolio | | 2005 | | | 2004 | |
| OPERATIONS: | | | | | | | | |
Net investment income | | $ | 315,353 | | | $ | 184,033 | |
Net realized gain | | | 1,108 | | | | 6,619 | |
Net change in unrealized appreciation/depreciation | | | (84,427 | ) | | | 3,186 | |
|
|
Increase in Net Assets From Operations | | | 232,034 | | | | 193,838 | |
|
|
| DISTRIBUTIONS TO SHAREHOLDERS FROM: | | | | | | | | |
Net investment income | | | (300,185 | ) | | | (39,951 | ) |
|
|
Decrease in Net Assets From
Distributions to Shareholders | | | (300,185 | ) | | | (39,951 | ) |
|
|
| FUND SHARE TRANSACTIONS (NOTE 4): | | | | | | | | |
Net proceeds from sale of shares | | | 14,532,694 | | | | 26,201,711 | |
Net asset value of shares issued for reinvestment of distributions | | | 300,185 | | | | 39,951 | |
Cost of shares reacquired | | | (4,828,100 | ) | | | (13,165,700 | ) |
|
|
Increase in Net Assets From Fund Share Transactions | | | 10,004,779 | | | | 13,075,962 | |
|
|
Increase in Net Assets | | | 9,936,628 | | | | 13,229,849 | |
| NET ASSETS: | | | | | | | | |
Beginning of period | | | 23,751,842 | | | | 10,521,993 | |
|
|
End of period* | | $ | 33,688,470 | | | $ | 23,751,842 | |
|
|
* Includes undistributed net investment income of: | | | $219,568 | | | | $204,400 | |
|
|
See Notes to Financial Statements.
40 Travelers Series Fund Inc. | 2005 Semi-Annual Report
For a share of capital stock outstanding throughout each year or period ended October 31, unless otherwise noted:
| | | | | | | | | | | | | | | | | | |
Smith Barney International
All Cap Growth Portfolio(1) | | 2005(2) | | | 2004 | | | 2003 | | | 2002 | | | 2001 | | | 2000 | |
Net Asset Value, Beginning of Period | | $11.77 | | | $10.43 | | | $8.78 | | | $11.18 | | | $18.52 | | | $16.92 | |
|
|
Income (Loss) From Operations: | | | | | | | | | | | | | | | | | | |
Net investment income | | 0.08 | | | 0.07 | | | 0.10 | | | 0.04 | | | 0.05 | | | 0.02 | |
Net realized and unrealized gain (loss) | | 0.87 | | | 1.37 | | | 1.60 | | | (2.39 | ) | | (7.39 | ) | | 1.71 | |
|
|
Total Income (Loss) From Operations | | 0.95 | | | 1.44 | | | 1.70 | | | (2.35 | ) | | (7.34 | ) | | 1.73 | |
|
|
Less Distributions From: | | | | | | | | | | | | | | | | | | |
Net investment income | | (0.11 | ) | | (0.10 | ) | | (0.05 | ) | | (0.05 | ) | | — | | | (0.13 | ) |
|
|
Total Distributions | | (0.11 | ) | | (0.10 | ) | | (0.05 | ) | | (0.05 | ) | | — | | | (0.13 | ) |
|
|
Net Asset Value, End of Period | | $12.61 | | | $11.77 | | | $10.43 | | | $8.78 | | | $11.18 | | | $18.52 | |
|
|
Total Return(3) | | 8.07 | %‡ | | 13.90 | % | | 19.45 | % | | (20.97 | )% | | (39.63 | )% | | 10.18 | % |
|
|
Net Assets, End of Period (millions) | | $162 | | | $160 | | | $180 | | | $170 | | | $244 | | | $462 | |
Ratios to Average Net Assets: | | | | | | | | | | | | | | | | | | |
Expenses(4) | | 0.98 | %† | | 1.01 | %(5) | | 0.99 | % | | 1.00 | % | | 1.00 | % | | 0.98 | % |
Net investment income | | 1.30 | † | | 0.67 | | | 1.07 | | | 0.42 | | | 0.31 | | | 0.11 | |
|
|
Portfolio Turnover Rate | | 6 | % | | 21 | % | | 45 | % | | 27 | % | | 22 | % | | 15 | % |
|
|
| (1) | | Per share amounts have been calculated using the monthly average shares method. |
| (2) | | For the six months ended April 30, 2005 (unaudited). |
| (3) | | Performance figures may reflect voluntary fee waivers and/or expense reimbursements. Past performance is no guarantee of future results. In the absence of voluntary fee waivers and/or expense reimbursements, the total return would have been lower. Total returns do not reflect expenses associated with the separate account such as administrative fees, account charges and surrender charges which, if reflected, would reduce the total returns for all periods shown. |
| (4) | | As a result of a voluntary expense limitation, the expense ratio will not exceed 1.50%. |
| (5) | | The investment manager voluntarily waived a portion of its management fee for the year ended October 31, 2004. The actual expense ratio did not change due to this voluntary waiver. |
| ‡ | | Total return is not annualized, as it may not be representative of the total return for the year. |
See Notes to Financial Statements.
41 Travelers Series Fund Inc. | 2005 Semi-Annual Report
| | |
| Financial Highlights (continued) | | |
For a share of capital stock outstanding throughout each year or period ended October 31, unless otherwise noted:
| | | | | | | | | | | | | | | | | | |
Salomon Brothers Strategic
Total Return Bond Portfolio | | 2005(1) | | | 2004(2) | | | 2003(2) | | | 2002(2) | | | 2001(2) | | | 2000(2) | |
Net Asset Value, Beginning of Period | | $11.16 | | | $11.10 | | | $10.13 | | | $10.27 | | | $9.89 | | | $10.22 | |
|
|
Income (Loss) From Operations: | | | | | | | | | | | | | | | | | | |
Net investment income | | 0.22 | | | 0.48 | | | 0.54 | | | 0.51 | (3) | | 0.58 | | | 0.81 | |
Net realized and unrealized gain (loss) | | (0.02 | ) | | 0.25 | | | 0.93 | | | (0.17 | )(3) | | 0.48 | | | (0.37 | ) |
|
|
Total Income From Operations | | 0.20 | | | 0.73 | | | 1.47 | | | 0.34 | | | 1.06 | | | 0.44 | |
|
|
Less Distributions From: | | | | | | | | | | | | | | | | | | |
Net investment income | | (0.66 | ) | | (0.67 | ) | | (0.50 | ) | | (0.48 | ) | | (0.68 | ) | | (0.77 | ) |
|
|
Total Distributions | | (0.66 | ) | | (0.67 | ) | | (0.50 | ) | | (0.48 | ) | | (0.68 | ) | | (0.77 | ) |
|
|
Net Asset Value, End of Period | | $10.70 | | | $11.16 | | | $11.10 | | | $10.13 | | | $10.27 | | | $9.89 | |
|
|
Total Return(4) | | 1.81 | %‡ | | 6.83 | % | | 15.10 | % | | 3.36 | % | | 10.99 | % | | 4.34 | % |
|
|
Net Assets, End of Period (millions) | | $15 | | | $17 | | | $21 | | | $21 | | | $18 | | | $20 | |
|
|
Ratios to Average Net Assets: | | | | | | | | | | | | | | | | | | |
Expenses(5) | | 1.34 | %† | | 1.24 | %(6) | | 1.20 | % | | 1.24 | % | | 1.23 | % | | 0.98 | % |
Net investment income | | 4.00 | † | | 4.47 | | | 5.06 | | | 4.95 | (3) | | 5.69 | | | 7.93 | |
|
|
Portfolio Turnover Rate | | 37 | %* | | 42 | %* | | 68 | %* | | 385 | % | | 448 | % | | 54 | % |
|
|
| (1) | | For the six months ended April 30, 2005 (unaudited). |
| (2) | | Per share amounts have been calculated using the monthly average shares method. |
| (3) | | Effective November 1, 2001, the Fund adopted a change in the accounting method that requires the Fund to amortize premiums and accrete all discounts. Without the adoption of this change, for the year ended October 31, 2002, net investment income, net realized and unrealized loss and the ratio of net investment income to average net assets would have been $0.52, $0.18 and 5.04%, respectively. Per share information, ratios and supplemental data for the periods prior to November 1, 2001 have not been restated to reflect this change in presentation. |
| (4) | | Performance figures may reflect voluntary fee waivers and/or expense reimbursements. Past performance is no guarantee of future results. In the absence of voluntary fee waivers and/or expense reimbursements, the total return would have been lower. Total returns do not reflect expenses associated with the separate account such as administrative fees, account charges and surrender charges which, if reflected, would reduce the total returns for all periods shown. |
| (5) | | As a result of a voluntary expense limitation, the expense ratio will not exceed 1.50%. |
| (6) | | The investment manager voluntarily waived a portion of its management fee for the year ended October 31, 2004. If such fee were not voluntarily waived, the actual expense ratio would have been 1.25% |
| ‡ | | Total return is not annualized, as it may not be representative of the total return for the year. |
| * | | Excluding mortgage dollar roll transactions. If mortgage dollar roll transactions had been included, the portfolio turnover rate would have been 228% for the six months ended April 30, 2005 and 414% and 376% for the years ended October 31, 2004 and 2003, respectively. |
See Notes to Financial Statements.
42 Travelers Series Fund Inc. | 2005 Semi-Annual Report
| | |
| Financial Highlights (continued) | | |
For a share of capital stock outstanding throughout each year or period ended October 31, unless otherwise noted:
| | | | | | | | | |
| SB Adjustable Rate Income Portfolio | | 2005(1) | | | 2004 | | | 2003(2) | |
Net Asset Value, Beginning of Period | | $10.10 | | | $10.01 | | | $10.00 | |
|
|
Income From Operations: | | | | | | | | | |
Net investment income | | 0.09 | | | 0.09 | | | 0.01 | |
Net realized and unrealized gain (loss) | | (0.01 | ) | | 0.03 | | | 0.00 | * |
|
|
Total Income From Operations | | 0.08 | | | 0.12 | | | 0.01 | |
|
|
Less Distributions From: | | | | | | | | | |
Net investment income | | (0.11 | ) | | (0.03 | ) | | — | |
|
|
Total Distributions | | (0.11 | ) | | (0.03 | ) | | — | |
|
|
Net Asset Value, End of Period | | $10.07 | | | $10.10 | | | $10.01 | |
|
|
Total Return(3) | | 0.77 | %‡ | | 1.24 | % | | 0.10 | %‡ |
|
|
Net Assets, End of Period (millions) | | $34 | | | $24 | | | $11 | |
|
|
Ratios to Average Net Assets: | | | | | | | | | |
Expenses(4) | | 1.00 | %† | | 1.00 | % | | 1.00 | %† |
Net investment income | | 2.16 | † | | 1.19 | | | 0.87 | † |
Portfolio Turnover Rate | | 28 | % | | 68 | % | | 3 | % |
|
|
| (1) | | For the six months ended April 30, 2005 (unaudited). |
| (2) | | For the period September 12, 2003 (commencement of operations) to October 31, 2003. |
| (3) | | Performance figures may reflect voluntary fee waivers and/or expense reimbursements. Past performance is no guarantee of future results. In the absence of voluntary fee waivers and/or expense reimbursements, the total return would have been lower. Total returns do not reflect expenses associated with the separate account such as administrative fees, account charges and surrender charges which, if reflected, would reduce the total returns for all periods shown. |
| (4) | | Citigroup Global Markets Inc. (“the Distributor”) has voluntarily waived 0.15% of 12b-1 distribution plan fees for the six months ended April 30, 2005, the year ended October 31, 2004 and the period ended October 31, 2003. This waiver is voluntary and may be discontinued at any time by the Distributor. In addition, Smith Barney Fund Management LLC (“the Manager”) has contractually agreed to an expense limitation of 1.00%. If such fees were not waived and certain expenses not reimbursed, the annualized expense ratios would have been 1.16%, 1.31% and 4.72% for the six months ended April 30, 2005, year ended October 31, 2004 and the period ended October 31, 2003, respectively. |
| * | | Amount represents less than $0.01 per share. |
| ‡ | | Total return is not annualized, as it may not be representative of the total return for the year. |
See Notes to Financial Statements.
43 Travelers Series Fund Inc. | 2005 Semi-Annual Report
Notes to Financial Statements (unaudited)
| 1. | Organization and Significant Accounting Policies |
The Smith Barney International All Cap Growth Portfolio (“SBIACG”) and the SB Adjustable Rate Income Portfolio (“SBARIP”) are separate diversified investment funds of the Travelers Series Fund Inc. (“Company”). The Salomon Brothers Strategic Total Return Bond Portfolio (“SBSTRB”) is a separate non-diversified investment fund of the Company. The Company, a Maryland corporation, is registered under the Investment Company Act of 1940 (the “1940 Act”), as amended, as an open-end management investment company.
The following are significant accounting policies consistently followed by the Funds and are in conformity with U.S. generally accepted accounting principles (“GAAP”). Estimates and assumptions are required to be made regarding assets, liabilities and changes in net assets resulting from operations when financial statements are prepared. Changes in the economic environment, financial markets and any other parameters used in determining these estimates could cause actual results to differ.
(a) Investment Valuation. Debt securities are valued at the mean between the bid and asked price provided by an independent pricing service that are based on transactions in debt obligations, quotations from bond dealers, market transactions in comparable securities and various relationship between securities. Equity securities for which market quotations are available are valued at the last sale price or official closing price on the primary market or exchange on which they trade. When prices are not readily available, or are determined not to reflect fair value, such as when the value of a security has been significantly affected by events after the close of the exchange or market on which the security is principally traded, but before the Funds calculate their net asset value, the Funds may value these investments at fair value as determined in accordance with the procedures approved by the Fund’s Board of Directors. Short-term obligations with maturities of 60 days or less are valued at amortized cost, which approximates market value.
(b) Repurchase Agreements. When entering into repurchase agreements, it is the Funds’ policy that their custodian or a third party custodian take possession of the underlying collateral securities, the market value of which at least equals the principal amount of the repurchase transaction, including accrued interest. To the extent that any repurchase transaction exceeds one business day, the value of the collateral is marked-to-market to ensure the adequacy of the
44 Travelers Series Fund Inc. | 2005 Semi-Annual Report
Notes to Financial Statements (unaudited) (continued)
collateral. If the seller defaults, and the market value of the collateral declines or if bankruptcy proceedings are commenced with respect to the seller of the security, realization of the collateral by the Funds may be delayed or limited.
(c) Financial Futures Contracts. The Funds may enter into financial futures contracts typically to hedge a portion of their portfolio. Upon entering into a financial futures contract, the Funds are required to deposit cash or securities as initial margin. Additional securities are also segregated up to the current market value of the financial futures contracts. Subsequent payments, known as variation margin, are made or received by the Funds each day, depending on the daily fluctuation in the value of the underlying financial instruments. The Funds recognize an unrealized gain or loss equal to the daily variation margin. When the financial futures contracts are closed, a realized gain or loss is recognized equal to the difference between the proceeds from (or cost of) the closing transactions and the Funds’ basis in the contracts.
The risks associated with entering into financial futures contracts include the possibility that a change in the value of the contract may not correlate with the changes in the value of the underlying instruments. In addition, investing in financial futures contracts involves the risk that the Funds could lose more than the original margin deposit and subsequent payments required for a futures transaction. Risks may also arise upon entering into these contracts from the potential inability of the counterparties to meet the terms of their contracts.
(d) Forward Foreign Currency Contracts. SBIACG and SBSTRB may enter into forward foreign currency contracts to hedge against foreign currency exchange rate risk on its non-US dollar denominated securities or to facilitate settlement of foreign currency denominated portfolio transactions. A forward foreign currency contract is an agreement between two parties to buy and sell a currency at a set price on a future date. The contract is marked-to-market daily and the change in value is recorded by the Funds as an unrealized gain or loss. When a forward foreign currency contract is extinguished, through either delivery or offset by entering into another forward foreign currency contract, the Funds record a realized gain or loss equal to the difference between the value of the contract at the time it was opened and the value of the contract at the time it was extinguished.
45 Travelers Series Fund Inc. | 2005 Semi-Annual Report
Notes to Financial Statements (unaudited) (continued)
Forward foreign currency contracts involve elements of market risk in excess of the amounts reflected in the Statements of Assets and Liabilities. The Funds bear the risk of an unfavorable change in the foreign exchange rate underlying the forward foreign currency contract. Risks may also arise upon entering into these contracts from the potential inability of the counterparties to meet the terms of their contracts.
(e) Lending of Portfolio Securities. The Funds have an agreement with their custodian whereby the custodian may lend securities owned by the Funds to brokers, dealers and other financial organizations. In exchange for lending securities under the terms of the agreement with its custodian, the Funds receive a lender’s fee. Fees earned by the Funds on securities lending are recorded as securities lending income. Loans of securities by the Funds are collateralized by cash, U.S. government securities or high quality money market instruments that are maintained at all times in an amount at least equal to the current market value of the loaned securities, plus a margin which varies depending on the type of securities loaned. The custodian establishes and maintains the collateral in a segregated account. The Funds have the right under the lending agreement to recover the securities from the borrower on demand.
Funds maintain the risk of any loss on the securities on loan as well as the potential loss on investments purchased with cash collateral received from securities lending.
(f) Securities Traded on a To-Be-Announced Basis. The Funds may trade securities on a to-be-announced (“TBA”) basis. In a TBA transaction, the Funds commit to purchasing or selling securities, which have not yet been issued by the issuer and for which specific information is not known, such as the face amount and maturity date and the underlying pool of investments in U.S. government agency mortgage pass-through transactions. Securities purchased on a TBA basis are not settled until they are delivered to the Funds, normally 15 to 45 days later. Beginning on the date the Funds enter into a TBA transaction, cash, U.S. government securities or other liquid high-grade debt obligations are segregated in an amount equal in value to the purchase price of the TBA security. These transactions are subject to market fluctuations and their current value is determined in the same manner as for other securities.
(g) Mortgage Dollar Rolls. SBSTRB and SBARIP may enter into dollar rolls in which the Funds sell mortgage-backed securities for delivery in the current
46 Travelers Series Fund Inc. | 2005 Semi-Annual Report
Notes to Financial Statements (unaudited) (continued)
month and simultaneously contract to repurchase substantially similar (same type, coupon and maturity) securities to settle on a specified future date. During the roll period, the Funds forgo principal and interest paid on the securities. The Funds are compensated by a fee paid by the counterparty, often in the form of a drop in the repurchase price of the securities. Dollar rolls are accounted for as financing arrangements; the fee is accrued into interest income ratably over the term of the dollar roll and any gain or loss on the roll is deferred and realized upon disposition of the rolled security.
The risk of entering into a mortgage dollar roll is that the market value of the securities the Funds are obligated to repurchase under the agreement may decline below the repurchase price. In the event the buyer of securities under a mortgage dollar roll files for bankruptcy or becomes insolvent, the Funds’ use of proceeds of the dollar roll may be restricted pending a determination by the other party, or its trustee or receiver, whether to enforce the Funds’ obligation to repurchase the securities.
(h) Fund Concentration. The investments by SBIACG and SBSTRB in foreign securities may involve risks not present in domestic investments. Since securities may be denominated in a foreign currency and may require settlement in foreign currencies and pay interest or dividends in foreign currencies, changes in the relationship of these foreign currencies to the U.S. dollar can significantly affect the value of the investments and earnings of SBIACG and SBSTRB. Foreign investments may also subject SBIACG and SBSTRB to foreign government exchange restrictions, expropriation, taxation or other political, social or economic developments, all of which could affect the market and/or credit risk of the investments. In addition to the risks described above, risks may arise from forward foreign currency contracts with respect to the potential inability of counterparties to meet the terms of their contracts.
(i) Credit and Market Risk. SBSTRB invests in high yield instruments that are subject to certain credit and market risks. The yields of high yield debt obligations reflect, among other things, perceived credit risk. The Fund’s investment in securities rated below investment grade typically involve risks not associated with higher rated securities including, among others, greater risk related to timely and ultimate payment of interest and principal, greater market price volatility and less liquid secondary market trading.
47 Travelers Series Fund Inc. | 2005 Semi-Annual Report
Notes to Financial Statements (unaudited) (continued)
(j) Security Transactions and Investment Income. Security transactions are accounted for on trade date. Dividend income is recorded on the ex-dividend date. Foreign dividend income is recorded on the ex-dividend date or as soon as practical after the Funds determine the existence of a dividend declaration after exercising reasonable due diligence. Interest income, adjusted for amortization of premium and accretion of discount, is recorded on an accrual basis. Gains or losses on the sale of securities are calculated by using the specific identification method.
(k) Foreign Currency Translation. Investment securities and other assets and liabilities denominated in foreign currencies are translated into U.S. dollar amounts based upon prevailing exchange rates on the date of valuation. Purchases and sales of investment securities and income and expense items denominated in foreign currencies are translated into U.S. dollar amounts based upon prevailing exchange rates on the respective dates of such transactions.
The Funds do not isolate that portion of the results of operations resulting from changes in foreign exchange rates on investments from the fluctuations arising from changes in market prices of securities held. Such fluctuations are included with the net realized and unrealized gain or loss on investments.
Net realized foreign exchange gains or losses arise from sales of foreign currencies, including gains and losses on forward foreign currency contracts, currency gains or losses realized between the trade and settlement dates on securities transactions and the difference between the amounts of dividends, interest and foreign withholding taxes recorded on the Funds’ books and the U.S. dollar equivalent of the amounts actually received or paid. Net unrealized foreign exchange gains and losses arise from changes in the fair values of assets and liabilities, other than investments in securities, at the date of valuation, resulting from changes in exchange rates.
Foreign security and currency transactions may involve certain considerations and risks not typically associated with those of U.S. dollar denominated transactions as a result of, among other factors, the possibility of lower levels of governmental supervision and regulation of foreign securities markets and the possibility of political or economic instability.
(l) Distributions to Shareholders. Distributions from net investment income and distributions of net realized gains, if any, are declared at least annually. Distributions
48 Travelers Series Fund Inc. | 2005 Semi-Annual Report
Notes to Financial Statements (unaudited) (continued)
to shareholders of the Funds are recorded on the ex-dividend date and are determined in accordance with income tax regulations, which may differ from GAAP.
(m) Federal and Other Taxes. It is the Funds’ policy to comply with the federal income and excise tax requirements of the Internal Revenue Code of 1986, as amended, applicable to regulated investment companies. Accordingly, the Funds intend to distribute substantially all of its taxable income and net realized gains on investments, if any, to shareholders each year. Therefore, no federal income tax provision is required in the Funds’ financial statements. Under the applicable foreign tax laws, a withholding tax may be imposed on interest, dividends and capital gains at various rates.
(n) Reclassification. GAAP requires that certain components of net assets be adjusted to reflect permanent differences between financial and tax reporting. These reclassifications have no effect on net assets or net asset values per share.
| 2. | Management Agreement and Transactions with Affiliates |
Smith Barney Fund Management LLC (“SBFM”), an indirect wholly-owned subsidiary of Citigroup Inc. (“Citigroup”), acts as investment manager of SBIACG and SBARIP. SBIACG pays SBFM a management fee, which is calculated daily and payable monthly, at the rate of 0.85% of SBIACG’s average daily net assets. SBARIP pays SBFM a management fee calculated at the annual rate of 0.60% of the average daily net assets of SBARIP. In addition, Travelers Investment Adviser, Inc. (“TIA”), an affiliate of SBFM, acts as the investment manager of SBSTRB. SBSTRB pays TIA a management fee calculated at an annual rate of 0.80% of the average daily net assets of SBSTRB. These fees are calculated daily and paid monthly. SBIACG and SBSTRB both have a voluntary expense limitation in place of 1.50%. In addition, SBARIP has a contractual expense limitation in place of 1.00% for a period of sixteen months from October 31, 2004. For the six months ended April 30, 2005, SBFM waived a portion of its management fees amounting to $1,371 for SBARIP.
TIA has entered into a sub-advisory agreement with Salomon Brothers Asset Management Inc (“SaBAM”), another indirect wholly-owned subsidiary of Citigroup. Pursuant to the sub-advisory agreement, SaBAM is responsible for the day-to-day portfolio operations and investment decisions for SBSTRB and is compensated for such services by TIA at an annual rate of 0.375% of the average daily net assets of SBSTRB.
49 Travelers Series Fund Inc. | 2005 Semi-Annual Report
Notes to Financial Statements (unaudited) (continued)
TIA has also entered into a sub-administrative services agreement with SBFM. TIA pays SBFM, as sub-administrator, a fee calculated at an annual rate of 0.10% of the average daily net assets of SBSTRB.
Citicorp Trust Bank, fsb. (“CTB”), another subsidiary of Citigroup, acts as the Funds’ transfer agent and PFPC Inc. (“PFPC”) acts as the Funds’ sub-transfer agent. CTB receives account fees and asset-based fees that vary according to the size and type of account. PFPC is responsible for shareholder recordkeeping and financial processing for all shareholder accounts and is paid by CTB. For the six months ended April 30, 2005, each Fund paid transfer agent fees of $2,083 to CTB.
The Company, on behalf of SBARIP, has adopted a plan (“Plan”) pursuant to Rule 12b-1 under the 1940 Act for SBARIP’s Smith Barney Class shares. Citigroup Global Markets Inc. acts as the distributor for SBARIP. The Plan provides that SBARIP shall pay a fee in an amount not to exceed 0.25% of the average daily net assets of SBARIP’s Smith Barney Class shares. This fee is calculated daily and paid monthly. The Company has agreed to voluntarily waive 0.15% of the Rule 12b-1 distribution plan fees for SBARIP. For the six months ended April 30, 2005, Rule 12b-1 distribution plan fees of $21,884 were waived for SBARIP.
Most of the officers and one Director of the Company are employees of Citigroup or its affiliates and do not receive compensation from the Company.
During the six months ended April 30, 2005, the aggregate cost of purchases and proceeds from sales of investments (excluding short-term investments and mortgage dollar rolls) were as follows:
| | | | | | | | | |
| | | SBIACG | | SBSTRB | | SBARIP |
Purchases | | $ | 9,565,930 | | $ | 5,646,947 | | $ | 17,902,461 |
|
Sales | | | 19,508,325 | | | 6,981,344 | | | 7,655,813 |
|
At April 30, 2005, the aggregate gross unrealized appreciation and depreciation of investments for federal income tax purposes were substantially as follows:
| | | | | | | | | | | | |
| | | SBIACG | | | SBSTRB | | | SBARIP | |
Gross unrealized appreciation | | $ | 44,776,294 | | | $ | 582,222 | | | $ | 47,119 | |
Gross unrealized depreciation | | | (4,155,567 | ) | | | (345,860 | ) | | | (106,799 | ) |
|
|
Net unrealized appreciation (depreciation) | | $ | 40,620,727 | | | $ | 236,362 | | | $ | (59,680 | ) |
|
|
50 Travelers Series Fund Inc. | 2005 Semi-Annual Report
Notes to Financial Statements (unaudited) (continued)
At April 30, 2005, SBSTRB and SBARIP had the following open futures contracts:
| | | | | | | | | | | | | | |
| Salomon Brothers Strategic Total Return Bond Portfolio: | |
| | | Number of
Contracts | | Expiration
Date | | Basis
Value | | Market
Value | | Unrealized
Gain (Loss) | |
To Sell: | | | | | | | | | | | | | | |
U.S. 2 Year Treasury Notes | | 1 | | 6/05 | | $ | 207,340 | | $ | 207,703 | | $ | (363 | ) |
U.S. 5 Year Treasury Notes | | 11 | | 6/05 | | | 1,180,991 | | | 1,192,984 | | | (11,993 | ) |
U.S. 10 Year Treasury Notes | | 12 | | 6/05 | | | 1,320,970 | | | 1,337,063 | | | (16,093 | ) |
|
|
| | | | | | | | | | | | | | (28,449 | ) |
|
|
To Buy: | | | | | | | | | | | | | | |
U.S. Treasury Bonds | | 5 | | 6/05 | | | 556,552 | | | 574,219 | | | 17,667 | |
|
|
Net Unrealized Loss on Open Futures Contracts | | | | | | | | | | | | $ | (10,782 | ) |
|
|
| | | | | | | | | | | | | | |
| SB Adjustable Rate Income Portfolio: | |
| | | Number of
Contracts | | Expiration
Date | | Basis
Value | | Market
Value | | Unrealized
Loss | |
To Sell: | | | | | | | | | | | | | | |
U.S. Treasury 2 Year 6% Notes | | 18 | | 6/05 | | $ | 3,718,622 | | $ | 3,738,656 | | $ | (20,034 | ) |
|
|
At April 30, 2005, SBARIP had deposited $8,100 with the broker dealer as initial margin collateral.
At April 30, 2005, SBIACG did not have any open futures contracts.
At April 30, 2005, SBIACG and SBSTRB had open forward foreign currency contracts as described below. The unrealized gain (loss) on the open contracts reflected in the accompanying financial statements are as follows:
| | | | | | | | | | |
| Smith Barney International All Cap Growth Portfolio: | | | |
| Foreign Currency | | Local
Currency | | Market
Value | | Settlement
Date | | Unrealized
Gain (Loss) | |
To Buy: | | | | | | | | | | |
Pound Sterling | | 270,883 | | 517,942 | | 5/5/05 | | $ | 1,314 | |
|
|
To Sell: | | | | | | | | | | |
Danish Krone | | 2,645,199 | | 458,985 | | 5/4/05 | | | (2,089 | ) |
|
|
Net Unrealized Loss on Open Forward
Foreign Currency Contracts | | | | $ | (775 | ) |
|
|
51 Travelers Series Fund Inc. | 2005 Semi-Annual Report
Notes to Financial Statements (unaudited) (continued)
| | | | | | | | | | |
| Salomon Brothers Strategic Total Return Bond Portfolio: | |
| Foreign Currency | | Local
Currency | | Market
Value | | Settlement Date | | Unrealized Gain (Loss) | |
To Buy: | | | | | | | | | | |
Euro | | 500,000 | | 646,367 | | 5/24/05 | | $ | (15,563 | ) |
Euro | | 19,000 | | 24,562 | | 5/24/05 | | | (600 | ) |
Euro | | 597,144 | | 771,948 | | 5/24/05 | | | (28,052 | ) |
Euro | | 88,394 | | 114,270 | | 5/24/05 | | | (2,454 | ) |
Euro | | 384,237 | | 496,716 | | 5/24/05 | | | (3,284 | ) |
|
|
| | | | | | | | | | (49,953 | ) |
|
|
To Sell: | | | | | | | | | | |
Euro | | 1,078,541 | | 1,394,267 | | 5/24/05 | | | 30,794 | |
Euro | | 1,069,609 | | 1,382,719 | | 5/24/05 | | | 17,281 | |
Euro | | 21,817 | | 28,204 | | 5/24/05 | | | (189 | ) |
|
|
| | | | | | | | | | 47,886 | |
|
|
Net Unrealized Loss on Open Forward
Foreign Currency Contracts | | | | $ | (2,067 | ) |
|
|
At April 30, 2005, SBSTRB had outstanding mortgage dollar rolls with a total cost of $5,481,173. At April 30, 2005, SBARIP did not have any outstanding mortgage dollar rolls.
At April 30, 2005, SBIACG loaned securities having a market value of $18,641,084. SBIACG received cash collateral amounting to $19,628,867 which was invested in the State Street Navigator Securities Lending Trust Prime Portfolio, a Rule 2a-7 money market fund, registered under the 1940 Act.
At April 30, 2005, SBSTRB and SBARIP did not have any securities on loan.
At April 30, 2005, the Company had six billion shares of capital stock authorized with a par value of $0.00001 per share. Each share of a Fund represents an equal proportionate interest in that Fund with each share of the same Fund and has an equal entitlement to any dividends and distributions made by the Fund.
52 Travelers Series Fund Inc. | 2005 Semi-Annual Report
Notes to Financial Statements (unaudited) (continued)
Transactions in shares of each Fund were as follows:
| | | | | | |
| | | Six Months Ended
April 30, 2005 | | | Year Ended
October 31, 2004 | |
Smith Barney International All Cap Growth Portfolio | | | | |
Shares sold | | 309,401 | | | 1,538,608 | |
Shares issued on reinvestment | | 115,894 | | | 159,603 | |
Shares reacquired | | (1,174,964 | ) | | (5,360,813 | ) |
|
|
Net Decrease | | (749,669 | ) | | (3,662,602 | ) |
|
|
Salomon Brothers Strategic Total Return Bond Portfolio | | | | |
Shares sold | | 41,842 | | | 129,079 | |
Shares issued on reinvestment | | 87,912 | | | 115,157 | |
Shares reacquired | | (198,519 | ) | | (673,931 | ) |
|
|
Net Decrease | | (68,765 | ) | | (429,695 | ) |
|
|
SB Adjustable Rate Income Portfolio | | | | |
Shares sold | | 1,443,446 | | | 2,607,403 | |
Shares issued on reinvestment | | 29,988 | | | 3,999 | |
Shares reacquired | | (479,744 | ) | | (1,311,034 | ) |
|
|
Net Increase | | 993,690 | | | 1,300,368 | |
|
|
| 5. | Capital Loss Carryforward |
On October 31, 2004, SBIACG had, for federal income tax purposes, a net capital loss carryforward of approximately $66,914,158, of which $4,800,514 expires in 2007, $38,754,186 expires in 2009, $13,574,174 expires in 2010 and $9,785,284 expires in 2011. SBSTRB had a net capital loss carryforward of approximately $1,759,311, of which $759,256 expires in 2007, $938,295 expires in 2008, $42,124 expires in 2009 and $19,636 expires in 2010. SBARIP had a net capital loss carryforward of approximately $41,644, of which $2,911 expires in 2011 and $38,733 expires in 2012. These amounts will be available to offset any future taxable capital gains.
On May 31, 2005, the U.S. Securities and Exchange Commission (“SEC”) issued an order in connection with the settlement of an administrative proceeding against Smith Barney Fund Management LLC (“SBFM”) and Citigroup Global Markets Inc. (“CGMI”) relating to the appointment of an affiliated transfer agent for the Smith Barney family of mutual funds (the “Funds”).
The SEC order finds that SBFM and CGMI willfully violated Section 206(1) of the Investment Advisers Act of 1940 (“Advisers Act”). Specifically, the order finds
53 Travelers Series Fund Inc. | 2005 Semi-Annual Report
Notes to Financial Statements (unaudited) (continued)
that SBFM and CGMI knowingly or recklessly failed to disclose to the boards of the Funds in 1999 when proposing a new transfer agent arrangement with an affiliated transfer agent that: First Data Investors Services Group (“First Data”), the Funds’ then-existing transfer agent, had offered to continue as transfer agent and do the same work for substantially less money than before; and that Citigroup Asset Management (“CAM”), the Citigroup business unit that includes the fund’s investment manager and other investment advisory companies, had entered into a side letter with First Data under which CAM agreed to recommend the appointment of First Data as sub-transfer agent to the affiliated transfer agent in exchange, among other things, for a guarantee by First Data of specified amounts of asset management and investment banking fees to CAM and CGMI. The order also finds that SBFM and CGMI willfully violated Section 206(2) of the Advisers Act by virtue of the omissions discussed above and other misrepresentations and omissions in the materials provided to the Funds’ boards, including the failure to make clear that the affiliated transfer agent would earn a high profit for performing limited functions while First Data continued to perform almost all of the transfer agent functions, and the suggestion that the proposed arrangement was in the Funds’ best interests and that no viable alternatives existed. SBFM and CGMI do not admit or deny any wrongdoing or liability. The settlement does not establish wrongdoing or liability for purposes of any other proceeding.
The SEC censured SBFM and CGMI and ordered them to cease and desist from violations of Sections 206(1) and 206(2) of the Advisers Act. The order requires Citigroup to pay $208.1 million, including $109 million in disgorgement of profits, $19.1 million in interest, and a civil money penalty of $80 million. Approximately $24.4 million has already been paid to the Funds, primarily through fee waivers. The remaining $183.7 million, including the penalty, has been paid to the U.S. Treasury and will be distributed pursuant to a plan to be prepared by Citigroup and submitted within 90 days of the entry of the order for approval by the SEC. The order also requires that transfer agency fees received from the Funds since December 1, 2004 less certain expenses be placed in escrow and provides that a portion of such fees may be subsequently distributed in accordance with the terms of the order.
The order requires SBFM to recommend a new transfer agent contract to the Fund boards within 180 days of the entry of the order; if a Citigroup affiliate submits a proposal to serve as transfer agent or sub-transfer agent, an
54 Travelers Series Fund Inc. | 2005 Semi-Annual Report
Notes to Financial Statements (unaudited) (continued)
independent monitor must be engaged at the expense of SBFM and CGMI to oversee a competitive bidding process. Under the order, Citigroup also must comply with an amended version of a vendor policy that Citigroup instituted in August 2004. That policy, as amended, among other things, requires that when requested by a Fund board, CAM will retain at its own expense an independent consulting expert to advise and assist the board on the selection of certain service providers affiliated with Citigroup.
At this time, there is no certainty as to how the proceeds of the settlement will be distributed, to whom such distributions will be made, the methodology by which such distributions will be allocated, and when such distributions will be made. Although there can be no assurance, Citigroup does not believe that this matter will have a material adverse effect on the Funds.
Beginning in June 2004, class action lawsuits alleging violations of the federal securities laws were filed against Citigroup Global Markets Inc. (the “Distributor”) and a number of its affiliates, including Smith Barney Fund Management LLC and Salomon Brothers Asset Management Inc (the “Advisers”), substantially all of the mutual funds managed by the Advisers, including the Fund (the “Funds”), and directors or trustees of the Funds (collectively, the “Defendants”). The complaints alleged, among other things, that the Distributor created various undisclosed incentives for its brokers to sell Smith Barney and Salomon Brothers funds. In addition, according to the complaints, the Advisers caused the Funds to pay excessive brokerage commissions to the Distributor for steering clients towards proprietary funds. The complaints also alleged that the defendants breached their fiduciary duty to the Funds by improperly charging Rule 12b-1 fees and by drawing on fund assets to make undisclosed payments of soft dollars and excessive brokerage commissions. The complaints also alleged that the Funds failed to adequately disclose certain of the allegedly wrongful conduct. The complaints sought injunctive relief and compensatory and punitive damages, rescission of the Funds’ contracts with the Advisers, recovery of all fees paid to the Advisers pursuant to such contracts and an award of attorneys’ fees and litigation expenses.
On December 15, 2004, a consolidated amended complaint (the “Complaint”) was filed alleging substantially similar causes of action. While the lawsuit is in its
55 Travelers Series Fund Inc. | 2005 Semi-Annual Report
Notes to Financial Statements (unaudited) (continued)
earliest stages, to the extent that the Complaint purports to state causes of action against the Funds, Citigroup Asset Management believes the Funds have significant defenses to such allegations, which the Funds intend to vigorously assert in responding to the Complaint.
Additional lawsuits arising out of these circumstances and presenting similar allegations and requests for relief may be filed against the Defendants in the future.
As of the date of this report, Citigroup Asset Management and the Funds believe that the resolution of the pending lawsuit will not have a material effect on the financial position or results of operations of the Funds or the ability of the Advisers and their affiliates to continue to render services to the Funds under their respective contracts.
On January 31, 2005, Citigroup announced that it had reached an agreement with MetLife, Inc. (“MetLife”) to sell Citigroup’s life insurance and annuity businesses (“Travelers Life & Annuity”) to MetLife. As part of this transaction, TIA, currently an indirect wholly owned subsidiary of Citigroup, would become an indirect wholly owned subsidiary of MetLife. TIA is the investment adviser to the Salomon Brothers Strategic Total Return Bond Portfolio.
The transaction is subject to certain regulatory approvals, as well as other customary conditions to closing. The transaction is scheduled to close on June 30, 2005.
In connection with this transaction, at meetings held on March 24, 2005 and April 20, 2005, the Board of Directors approved a proposal to reorganize the Salomon Brothers Strategic Total Return Bond Portfolio (the “Acquired Fund”) of Travelers Series Fund Inc., into a newly organized “shell” portfolio (the “Acquiring Fund”) of The Travelers Series Trust. In connection with the reorganization, the Acquiring Fund would acquire all of the assets and assume the liabilities of the Acquired Fund.
The proposed reorganization is subject to the fulfillment of certain conditions, including approval by the Acquired Fund shareholders. Proxy materials describing the proposed reorganization were mailed on or about June 9, 2005, to the Acquired Fund shareholders of record on April 15, 2005, in anticipation of a meeting of shareholders scheduled to be held on June 29, 2005. If approved by the Acquired Fund shareholders, the reorganization will occur as soon as possible after the shareholder meeting.
56 Travelers Series Fund Inc. | 2005 Semi-Annual Report
Notes to Financial Statements (unaudited) (continued)
On June 24, 2005, Citigroup announced that it has signed a definitive agreement under which Citigroup will sell substantially all of its worldwide asset management business to Legg Mason, Inc. (“Legg Mason”).
As part of this transaction, SBFM (the “Manager”), currently an indirect wholly owned subsidiary of Citigroup, would become an indirect wholly owned subsidiary of Legg Mason. The Manager is the investment manager to SBIACG and SBARIP.
The transaction is subject to certain regulatory approvals, as well as other customary conditions to closing. Subject to such approvals and the satisfaction of the other conditions, Citigroup expects the transaction to be completed later this year.
Under the Investment Company Act of 1940, consummation of the transaction will result in the automatic termination of the investment management contract between SBIACG, SBARIP and the Manager. Therefore, the Board of Directors for SBIACG and SBARIP will be asked to approve a new investment management contract between SBIACG, SBARIP and the Manager. If approved by the Board, the new investment management contract will be presented to the shareholders of SBIACG and SBARIP for their approval.
57 Travelers Series Fund Inc. | 2005 Semi-Annual Report
TRAVELERS SERIES
FUND INC.
| | | | |
DIRECTORS Robert A. Frankel Michael E. Gellert R. Jay Gerken, CFA Chairman Rainer Greeven Susan M. Heilbron OFFICERS R. Jay Gerken, CFA President and Chief
Executive Officer Andrew B. Shoup Senior Vice President and Chief Administrative Officer James M. Giallanza Chief Financial Officer and Treasurer Jeffrey J. Russell Vice President and Investment Officer Roger M. Lavan Vice President and Investment Officer David Scott Vice President and Investment Officer Peter J. Wilby, CFA Vice President and Investment Officer David A. Torchia Vice President and Investment Officer | | | | OFFICERS (continued) Theresa M. Veres Vice President and Investment Officer Andrew Beagley Chief Anti-Money Laundering Compliance Officer and Chief Compliance Officer Robert I. Frenkel Secretary and
Chief Legal Officer INVESTMENT MANAGERS Smith Barney Fund Management LLC Travelers Investment Adviser, Inc. DISTRIBUTOR Citigroup Global Markets Inc. CUSTODIAN State Street Bank and
Trust Company ANNUITY
ADMINISTRATION Travelers Annuity Investor Services One Cityplace Hartford, CT 06103-3415 TRANSFER AGENT Citicorp Trust Bank, fsb. 125 Broad Street, 11th Floor New York, New York 10004 SUB-TRANSFER AGENT PFPC Inc. P.O. Box 9699 Providence, Rhode Island 02940-9699 |
Travelers Series Fund Inc.
Smith Barney International All Cap Growth Portfolio
Salomon Brothers Strategic Total Return Bond Portfolio
SB Adjustable Rate Income Portfolio
The Funds are separate investment funds of the Travelers Series Fund Inc., a Maryland corporation.
The Funds file their complete schedule of portfolio holdings with the Securities and Exchange Commission for the first and third quarters of each fiscal year on Form N-Q. The Funds’ Forms N-Q are available on the Commission’s website at www.sec.gov. The Funds’ Forms N-Q may be reviewed and copied at the Commission’s Public Reference Room in Washington D.C., and information on the operation of the Public Reference Room may be obtained by calling 1-800-SEC-0330. To obtain information of Form N-Q from the Funds, shareholders can call 1-800-451-2010.
Information on how the Funds voted proxies relating to portfolio securities during the 12-month period ended June 30, 2004 and a description of the policies and procedures that the Funds use to determine how to vote proxies relating to portfolio securities is available (1) without charge, upon request, by calling 1-800-451-2010, (2) on the Funds’ website at www.citigroupam.com and (3) on the SEC’s website at www.sec.gov
This report is submitted for the general information of the shareholders of Travelers Series Fund Inc. — Smith Barney International All Cap Growth, Salomon Brothers Strategic Total Return Bond and SB Adjustable Rate Income Portfolios.
TRAVELERS SERIES FUND INC.
125 Broad Street
10th Floor, MF-2
New York, New York 10004
IN0802 6/05
05-8632
| | | | |
| ITEM 2. | | CODE OF ETHICS. |
| |
| | | Not Applicable. |
| |
| ITEM 3. | | AUDIT COMMITTEE FINANCIAL EXPERT. |
| |
| | | Not Applicable. |
| |
| ITEM 4. | | PRINCIPAL ACCOUNTANT FEES AND SERVICES. |
| |
| | | Not applicable. |
| |
| ITEM 5. | | AUDIT COMMITTEE OF LISTED REGISTRANTS. |
| |
| | | Not applicable. |
| |
| ITEM 6. | | SCHEDULE OF INVESTMENTS |
| |
| | | Not applicable. |
| |
| ITEM 7. | | DISCLOSURE OF PROXY VOTING POLICIES AND PROCEDURES FOR CLOSED-END MANAGEMENT INVESTMENT COMPANIES. |
| |
| | | Not applicable. |
| |
| ITEM 8. | | [RESERVED] |
| |
| ITEM 9. | | PURCHASES OF EQUITY SECURITIES BY CLOSED-END MANAGEMENT INVESTMENT COMPANY AND AFFILIATED PURCHASERS. |
| |
| | | Not applicable. |
| |
| ITEM 10. | | SUBMISSION OF MATTERS TO A VOTE OF SECURITY HOLDERS. |
| |
| | | Not applicable. |
| |
| ITEM 11. | | CONTROLS AND PROCEDURES. |
| | |
| | | (a) | | The registrant’s principal executive officer and principal financial officer have concluded that the registrant’s disclosure controls and procedures (as defined in Rule 30a- 3(c) under the Investment Company Act of 1940, as amended (the “1940 Act”)) are effective as of a date within 90 days of the filing date of this report that includes the disclosure required by this paragraph, based on their evaluation of the disclosure controls and procedures required by Rule 30a-3(b) under the 1940 Act and 15d-15(b) under the Securities Exchange Act of 1934. |
| | |
| | | (b) | | There were no changes in the registrant’s internal control over financial reporting (as defined in Rule 30a-3(d) under the 1940 Act) that occurred during the registrant’s last fiscal half-year (the registrant’s second fiscal half-year in the case of an annual report) that have materially affected, or are likely to materially affect the registrant’s internal control over financial reporting. |
| | | | |
ITEM 12. | | EXHIBITS. | | |
| |
| | | (a) Not applicable. |
| |
| | | (b) Attached hereto. |
| | |
| | | Exhibit 99.CERT | | Certifications pursuant to section 302 of the Sarbanes-Oxley Act of 2002 |
| | |
| | | Exhibit 99.906CERT | | Certifications pursuant to Section 906 of the Sarbanes-Oxley Act of 2002 |
SIGNATURES
Pursuant to the requirements of the Securities Exchange Act of 1934 and the Investment Company Act of 1940, the registrant has duly caused this Report to be signed on its behalf by the undersigned, there unto duly authorized.
| | |
| Travelers Series Fund Inc. |
| |
| By: | | /s/ R. Jay Gerken
|
| | | R. Jay Gerken |
| | | Chief Executive Officer of |
| | | Travelers Series Fund Inc. |
Date: July 7, 2005
Pursuant to the requirements of the Securities Exchange Act of 1934 and the Investment Company Act of 1940, this report has been signed below by the following persons on behalf of the registrant and in the capacities and on the dates indicated.
| | |
| By: | | /s/ R. Jay Gerken
|
| | | R. Jay Gerken |
| | | Chief Executive Officer of |
| | | Travelers Series Fund Inc. |
|
| Date: July 7, 2005 |
| |
| By: | | /s/ James M. Giallanza
|
| | | James M. Giallanza |
| | | Chief Financial Officer of |
| | | Travelers Series Fund Inc. |
Date: July 7, 2005