UNITED STATES
SECURITIES AND EXCHANGE COMMISSION
Washington, D.C. 20549
FORM N-CSR
CERTIFIED SHAREHOLDER REPORT OF REGISTERED
MANAGEMENT INVESTMENT COMPANIES
Investment Company Act file number 811-8372
Travelers Series Fund Inc.
(Exact name of registrant as specified in charter)
| | |
| 125 Broad Street, New York, NY | | 10004 |
|
| (Address of principal executive offices) | | (Zip code) |
Robert I. Frenkel, Esq.
Smith Barney Fund Management LLC
300 First Stamford Place
Stamford, CT 06902
(Name and address of agent for service)
Registrant’s telephone number, including area code: (800) 451-2010
Date of fiscal year end: October 31
Date of reporting period: April 30, 2005
| | |
| ITEM 1. | | REPORT TO STOCKHOLDERS. |
| |
| | | The Semi-Annual Report to Stockholders is filed herewith. |
TRAVELERS SERIES FUND INC.
AIM CAPITAL
APPRECIATION PORTFOLIO
SMITH BARNEY LARGE
CAPITALIZATION GROWTH
PORTFOLIO
SEMI-ANNUAL REPORT | APRIL 30, 2005
NOT FDIC INSURED • NOT BANK GUARANTEED • MAY LOSE VALUE
WHAT’S INSIDE
LETTER FROM THE CHAIRMAN

R. JAY GERKEN, CFA
Chairman, President and Chief Executive Officer
Dear Shareholder,
Despite rising interest rates, climbing oil prices, geopolitical concerns and uncertainties surrounding the U.S. Presidential election, the U.S. economy continued to expand during the period. Following a robust 4.0% gain in the third quarter of 2004, gross domestic product (“GDP”)i growth was 3.8% in the fourth quarter. After the end of the Funds’ reporting period, the advance first quarter 2005 GDP figure was revised up to 3.5% from 3.1%.
Given the overall strength of the economy, the Federal Reserve Board (“Fed”)ii continued to raise interest rates over the period in an attempt to ward off inflation. Following three 25 basis pointiii rate hikes from June through September 2004, the Fed again increased its target for the federal funds rateiv in 0.25% increments four times during the reporting period. Following the end of the Fund’s reporting period, at its May meeting, the Fed once again increased it’s target for the federal funds rate by 0.25% to 3.00%.
During the six months covered by this report, the U.S. stock market posted a modest gain, with the S&P 500 Indexv returning 3.28%. The reporting period began on a bright note, as the equity markets rallied sharply in November and December 2004. Investors were drawn to stocks as the uncertainty of the U.S. Presidential election ended and oil prices fell from their record highs. Thus far in 2005, the equity markets have been volatile. Equities were weak in January, rose in February and again fell in March and April. The market’s recent troubles have been attributed to mixed economic data, continued high oil prices, and rising interest rates.
Looking at the reporting period as a whole, the trend of value-oriented stocks outperforming their growth counterparts continued. In addition, mid- and large-cap stocks generally outperformed small-cap stocks during the period.
1 Travelers Series Fund Inc. | 2005 Semi-Annual Report
Within this environment, the funds performed as follows:vi
PERFORMANCE OF THE FUNDS
AS OF APRIL 30, 2005
(unaudited)
| | | |
| | | 6 Months | |
AIM Capital Appreciation Portfolio | | -0.07 | % |
| | | | |
S&P 500 Index | | 3.28 | % |
| | | | |
Lipper Variable Multi-Cap Growth Funds Category Average | | 1.53 | % |
| | | | |
Smith Barney Large Capitalization Growth Portfolio | | 0.74 | % |
| | | | |
Russell 1000 Growth Index | | 1.14 | % |
| | | | |
Lipper Variable Large-Cap Growth Funds Category Average | | 1.21 | % |
The performance shown represents past performance. Past performance is no guarantee of future results and current performance may be higher or lower than the performance shown above. Principal value and investment returns will fluctuate and investors’ shares, when redeemed, may be worth more or less than their original cost.
Fund returns assume the reinvestment of income dividends and capital gains distributions at net asset value and the deduction of all fund expenses.
Lipper, Inc. is a major independent mutual-fund tracking organization. Returns are based on the six-month period ended April 30, 2005 and include the reinvestment of dividends and capital gains distributions, if any. Returns were calculated among the 113 funds in the variable multi-cap growth funds category. Returns were calculated among the 170 funds in the variable large-cap growth funds category.
AIM CAPITAL APPRECIATION PORTFOLIOvi
Special Shareholder Notice
At meetings held on March 24, 2005 and April 20, 2005, the Board of Directors approved a proposal to reorganize the AIM Capital Appreciation Portfolio (the “Acquired Fund”) of Travelers Series Fund Inc. (“TSF”) into a newly organized “shell” portfolio (the “Acquiring Fund”) of Travelers Series Trust (“TST”) (“the Reorganization”).
In connection with the Reorganization, the Board of Directors approved an Agreement and Plan of Reorganization (the “Plan”) between TSF, on behalf of the Acquired Fund, and TST, on behalf of the Acquiring Fund, under which the Acquiring Fund would acquire all of the assets of the Acquired Fund and assume all of the liabilities of the Acquired Fund. The Reorganization is being proposed to the Acquired Fund’s shareholders because Travelers Investment Adviser Inc., which serves as investment adviser to the Acquired Fund and is currently an indirect wholly owned subsidiary of Citigroup Inc. (“Citigroup”), will become an indirect wholly owned subsidiary of MetLife, Inc. (“MetLife”) as
2 Travelers Series Fund Inc. | 2005 Semi-Annual Report
part of MetLife’s acquisition of Travelers Life & Annuity, the life insurance and annuity businesses of Citigroup.
A Special Meeting of Shareholders of the Acquired Fund has been called on June 29, 2005, for the purpose of submitting the Plan and such other matters as may properly come before the meeting to the stockholders of the Acquired Fund for approval. The close of business on April 15, 2005 has been fixed as the record date for the determination of stockholders of the Acquired Fund, who are entitled to notice of, and to vote at, the Special Meeting of Shareholders, including any adjournment or adjournments thereof.
For the six months ended April 30, 2005, the AIM Capital Appreciation Portfolio returned –0.07%. These shares underperformed the Lipper Variable Multi-Cap Growth Funds Category Average,1 which was 1.53%. The Fund’s unmanaged benchmark, the S&P 500 Index, returned 3.28% for the same period.
SMITH BARNEY LARGE CAPITALIZATION GROWTH PORTFOLIOvi
For the six months ended April 30, 2005, the Smith Barney Large Capitalization Growth Portfolio returned 0.74%. These shares underperformed the Fund’s unmanaged benchmark, the Russell 1000 Growth Index,vii which returned 1.14%. The Fund’s Lipper Variable Large-Cap Growth Funds Category Average2 was 1.21% for the same period.
Information About Your Funds
As you may be aware, several issues in the mutual fund industry have recently come under the scrutiny of federal and state regulators. The Funds’ Adviser and some of its affiliates have received requests for information from various government regulators regarding market timing, late trading, fees, and other mutual fund issues in connection with various investigations. The regulators appear to be examining, among other things, the Funds’ response to market timing and shareholder exchange activity, including compliance with prospectus disclosure related to these subjects. The Funds have been informed that the Adviser and its affiliates are responding to those information requests, but are not in a position to predict the outcome of these requests and investigations.
| 1 | Lipper, Inc. is a major independent mutual-fund tracking organization. Returns are based on the six-month period ended April 30, 2005, including the reinvestment of dividends and capital gains distributions, if any, calculated among the 113 funds in the Fund’s Lipper category, and excluding sales charges. |
| 2 | Lipper, Inc. is a major independent mutual-fund tracking organization. Returns are based on the six-month period ended April 30, 2005, including the reinvestment of dividends and capital gains distributions, if any, calculated among the 170 funds in the Fund’s Lipper category, and excluding sales charges. |
3 Travelers Series Fund Inc. | 2005 Semi-Annual Report
Important information concerning the Funds and its Adviser with regard to recent regulatory developments is contained in the “Additional Information” note in the Notes to the Financial Statements included in this report.
As always, thank you for your continued confidence in our stewardship of your assets. We look forward to helping you continue to meet your financial goals.
Sincerely,

R. Jay Gerken, CFA
Chairman, President and Chief Executive Officer
May 18, 2005
4 Travelers Series Fund Inc. | 2005 Semi-Annual Report
The information provided is not intended to be a forecast of future events, a guarantee of future results or investment advice. Views expressed may differ from those of the firm as a whole.
RISKS:
AIM Capital Appreciation Portfolio: The Fund may invest in foreign securities. Investing in foreign securities is subject to certain risks not associated with domestic investing, such as currency fluctuations, and changes in political and economic conditions. The Fund may use derivatives, such as options and futures, which can be illiquid, may disproportionately increase losses, and have a potentially large impact on fund performance. The Fund may invest in small capitalization companies. Small capitalization companies may involve a higher degree of risk and volatility than investments in larger, more established companies. The Fund may invest in medium-capitalization companies. These investments may involve a higher degree of risk and volatility than investments in larger, more established companies. Please see the Fund’s prospectus for more information on these and other risks.
Smith Barney Large Capitalization Growth Portfolio: Keep in mind, common stocks are subject to market fluctuations. Please see the Fund’s prospectus for more information on these and other risks.
All index performance reflects no deduction for fees, expenses or taxes. Please note that an investor cannot invest directly in an index.
| i | Gross domestic product is a market value of goods and services produced by labor and property in a given country. |
| ii | The Federal Reserve Board is responsible for the formulation of a policy designed to promote economic growth, full employment, stable prices, and a sustainable pattern of international trade and payments. |
| iii | A basis point is one one-hundredth (1/100 or 0.01) of one percent. |
| iv | The federal funds rate is the interest rate that banks with excess reserves at a Federal Reserve district bank charge other banks that need overnight loans. |
| v | The S&P 500 Index is a market capitalization-weighted index of 500 widely held common stocks. |
| vi | The Funds are underlying investment options of various variable annuity and variable life insurance products. The Funds’ performance returns do not reflect the deduction of initial sales charges and expenses imposed in connection with investing in variable annuity contracts or variable life insurance, such as administrative fees, account charges, and surrender charges which, if reflected, would reduce the performance of each fund. Past performance is no guarantee of future results. |
| vii | The Russell 1000 Growth Index measures the performance of those Russell 1000 companies with higher price-to-book ratios and higher forecasted growth values. |
5 Travelers Series Fund Inc. | 2005 Semi-Annual Report
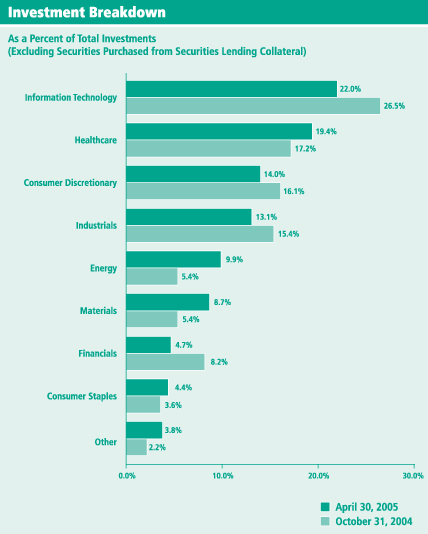
AIM Capital Appreciation Portfolio
Fund at a Glance (unaudited)
6 Travelers Series Fund Inc. | 2005 Semi-Annual Report
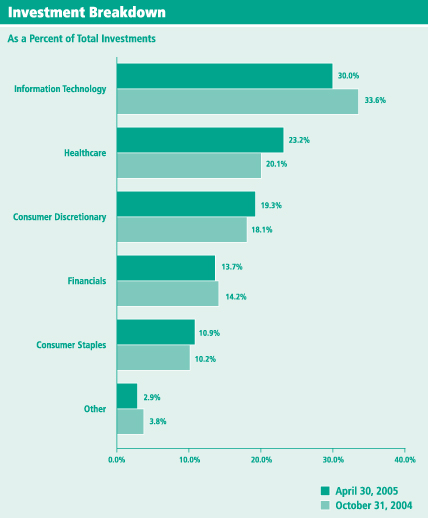
Smith Barney Large Capitalization Growth Portfolio Fund at a Glance (unaudited)
7 Travelers Series Fund Inc. | 2005 Semi-Annual Report
Fund Expenses (unaudited)
Example
As a shareholder of the Fund, you may incur two types of costs: (1) transaction costs and (2) ongoing costs, including management fees and other Fund expenses. This example is intended to help you understand your ongoing costs (in dollars) of investing in the Fund and to compare these costs with the ongoing costs of investing in other mutual funds.
This example is based on an investment of $1,000 invested on November 1, 2004 and held for the six months ended April 30, 2005.
Actual Expenses
The table below titled “Based on Actual Total Return” provides information about actual account values and actual expenses. You may use the information provided in this table, together with the amount you invested, to estimate the expenses that you paid over the period. To estimate the expenses you paid on your account, divide your ending account value by $1,000 (for example, an $8,600 ending account value divided by $1,000 = 8.6), then multiply the result by the number under the heading entitled “Expenses Paid During the Period”.
| | | | | | | | | | |
| Based on Actual Total Return(1) | | | | | | | | |
| | | | | | | | | | | | | | | |
| | | Actual Total
Return(2) | | | Beginning
Account
Value | | Ending
Account
Value | | Annualized
Expense
Ratio | | | Expenses
Paid During
the Period(3) |
AIM Capital Appreciation Portfolio | | (0.07 | )% | | $ | 1,000.00 | | $ | 999.30 | | 0.85 | % | | $ | 4.21 |
|
Smith Barney Large Capitalization Growth Portfolio | | 0.74 | | | | 1,000.00 | | | 1,007.40 | | 0.78 | | | | 3.88 |
|
| (1) | | For the six months ended April 30, 2005. |
| (2) | | Assumes reinvestment of dividends and capital gains distributions, if any, at net asset value. Total return is not annualized, as it may not be representative of the total return for the year. Total returns do not reflect expenses associated with the separate account such as administrative fees, account charges and surrender charges, which, if reflected, would reduce the total returns. Performance figures may reflect voluntary fee waivers and/or expense reimbursements. Past performance is no guarantee of future results. In the absence of voluntary fee waivers and/or expense reimbursements, the total return would have been lower. |
| (3) | | Expenses are equal to each Funds’ respective annualized expense ratio multiplied by the average account value over the period, multiplied by the number of days in the most recent fiscal half-year, then divided by 365. |
8 Travelers Series Fund Inc. | 2005 Semi-Annual Report
Fund Expenses (unaudited) (continued)
Hypothetical Example for Comparison Purposes
The table below titled “Based on Hypothetical Total Return” provides information about hypothetical account values and hypothetical expenses based on the actual expense ratio and an assumed rate of return of 5.00% per year before expenses, which is not the Fund’s actual return. The hypothetical account values and expenses may not be used to estimate the actual ending account balance or expenses you paid for the period. You may use the information provided in this table to compare the ongoing costs of investing in the Fund and other funds. To do so, compare the 5.00% hypothetical example relating to the Fund with the 5.00% hypothetical examples that appear in the shareholder reports of the other funds.
Please note that the expenses shown in the table below are meant to highlight your ongoing costs only and do not reflect any transactional costs. Therefore, the table is useful in comparing ongoing costs only, and will not help you determine the relative total costs of owning different funds. In addition, if these transaction costs were included, your costs would have been higher.
| | | | | | | | | | |
| Based on Hypothetical Total Return(1) | | | | | | | | |
| | | | | | | | | | | | | | | |
| | | Hypothetical
Annualized
Total Return | | | Beginning
Account
Value | | Ending
Account
Value | | Annualized
Expense
Ratio | | | Expenses
Paid During
the Period(2) |
AIM Capital Appreciation Portfolio | | 5.00 | % | | $ | 1,000.00 | | $ | 1,020.58 | | 0.85 | % | | $ | 4.26 |
|
Smith Barney Large Capitalization Growth Portfolio | | 5.00 | | | | 1,000.00 | | | 1,020.93 | | 0.78 | | | | 3.91 |
|
| (1) | | For the six months ended April 30, 2005. |
| (2) | | Expenses are equal to each Funds’ respective annualized expense ratio multiplied by the average account value over the period, multiplied by the number of days in the most recent fiscal half-year, then divided by 365. |
9 Travelers Series Fund Inc. | 2005 Semi-Annual Report
| | |
| Schedules of Investments (unaudited) | | April 30, 2005 |
| | | | | |
AIM CAPITAL APPRECIATION PORTFOLIO |
| SHARES | | SECURITY | | VALUE |
| COMMON STOCK — 97.8% | | | |
| CONSUMER DISCRETIONARY — 14.1% | | | |
Hotels, Restaurants & Leisure — 3.0% | | | |
| 23,000 | | Brinker International, Inc. (a) | | $ | 777,400 |
| 37,300 | | Carnival Corp. | | | 1,823,224 |
| 5,000 | | Las Vegas Sands Corp. (a)(b) | | | 187,250 |
| 41,400 | | McDonald’s Corp. | | | 1,213,434 |
| 29,000 | | Starbucks Corp. (a) | | | 1,436,080 |
| 31,100 | | Starwood Hotels & Resorts Worldwide, Inc. | | | 1,689,974 |
|
| | | | | | 7,127,362 |
|
Household Durables — 1.2% | | | |
| 16,600 | | Garmin Ltd. (b) | | | 655,700 |
| 28,700 | | Harman International Industries, Inc. | | | 2,255,246 |
|
| | | | | | 2,910,946 |
|
Media — 2.7% | | | |
| 12,500 | | Dolby Laboratories Inc., Class A Shares (a) | | | 255,625 |
| 7,800 | | DreamWorks Animation SKG, Inc., Class A Shares (a) | | | 292,500 |
| 46,300 | | Lamar Advertising Co., Class A Shares (a) | | | 1,730,694 |
| 62,150 | | Univision Communications Inc., Class A Shares (a) | | | 1,633,923 |
| 34,711 | | Viacom Inc., Class B Shares | | | 1,201,695 |
| 41,400 | | XM Satellite Radio Holdings Inc., Class A Shares (a)(b) | | | 1,148,436 |
|
| | | | | | 6,262,873 |
|
Multiline Retail — 1.3% | | | |
| 20,700 | | Kohl’s Corp. (a) | | | 985,320 |
| 6,552 | | Sears Holdings Corp. (a)(b) | | | 886,092 |
| 25,400 | | Wal-Mart Stores, Inc. | | | 1,197,356 |
|
| | | | | | 3,068,768 |
|
Specialty Retail — 4.3% | | | |
| 20,700 | | Abercrombie & Fitch Co., Class A Shares | | | 1,116,765 |
| 49,700 | | Bed Bath & Beyond Inc. (a) | | | 1,849,337 |
| 24,900 | | Best Buy Co., Inc. (b) | | | 1,253,466 |
| 33,100 | | CDW Corp. | | | 1,810,239 |
| 48,200 | | Office Depot, Inc. (a) | | | 943,756 |
| 29,400 | | Ross Stores, Inc. | | | 785,568 |
| 120,000 | | Staples, Inc. | | | 2,288,400 |
|
| | | | | | 10,047,531 |
|
Textiles & Apparel — 1.6% | | | |
| 82,900 | | Coach, Inc. (a) | | | 2,221,720 |
| 20,700 | | NIKE, Inc., Class B Shares | | | 1,589,967 |
|
| | | | | | 3,811,687 |
|
| | | TOTAL CONSUMER DISCRETIONARY | | | 33,229,167 |
|
See Notes to Financial Statements.
10 Travelers Series Fund Inc. | 2005 Semi-Annual Report
| | |
| Schedules of Investments (unaudited) (continued) | | April 30, 2005 |
| | | | | |
AIM CAPITAL APPRECIATION PORTFOLIO |
| SHARES | | SECURITY | | VALUE |
| CONSUMER STAPLES — 4.5% | | | |
Beverages — 0.6% | | | |
| 24,900 | | PepsiCo, Inc. | | $ | 1,385,436 |
|
Food & Drug Retailing — 1.5% | | | |
| 22,800 | | Sysco Corp. | | | 788,880 |
| 41,400 | | Walgreen Co. | | | 1,782,684 |
| 8,900 | | Whole Foods Market, Inc. | | | 887,508 |
|
| | | | | | 3,459,072 |
|
Food Products — 0.9% | | | |
| 20,700 | | Hershey Foods Corp. | | | 1,322,730 |
| 18,600 | | Kellogg Co. | | | 836,070 |
|
| | | | | | 2,158,800 |
|
Household Products — 0.6% | | | |
| 24,900 | | The Procter & Gamble Co. | | | 1,348,335 |
|
Personal Products — 0.9% | | | |
| 43,200 | | The Gillette Co. | | | 2,230,848 |
|
| | | TOTAL CONSUMER STAPLES | | | 10,582,491 |
|
| ENERGY — 10.0% | | | |
Energy Equipment & Services — 2.9% | | | |
| 34,800 | | Baker Hughes Inc. | | | 1,535,376 |
| 44,000 | | ENSCO International Inc. | | | 1,434,400 |
| 35,200 | | GlobalSantaFe Corp. | | | 1,182,720 |
| 53,900 | | Patterson-UTI Energy, Inc. | | | 1,291,983 |
| 25,900 | | Weatherford International Ltd. (a)(b) | | | 1,350,685 |
|
| | | | | | 6,795,164 |
|
Oil & Gas — 7.1% | | | |
| 16,600 | | Apache Corp. | | | 934,414 |
| 23,400 | | Burlington Resources, Inc. | | | 1,137,474 |
| 20,200 | | ChevronTexaco Corp.* | | | 1,050,400 |
| 20,700 | | ConocoPhillips | | | 2,170,395 |
| 46,800 | | Devon Energy Corp. | | | 2,113,956 |
| 62,100 | | Exxon Mobil Corp. | | | 3,541,563 |
| 12,400 | | Newfield Exploration Co. (a) | | | 880,772 |
| 17,200 | | Occidental Petroleum Corp. | | | 1,186,800 |
| 35,200 | | Valero Energy Corp. | | | 2,412,256 |
| 44,233 | | XTO Energy, Inc. | | | 1,334,510 |
|
| | | | | | 16,762,540 |
|
| | | TOTAL ENERGY | | | 23,557,704 |
|
See Notes to Financial Statements.
11 Travelers Series Fund Inc. | 2005 Semi-Annual Report
| | |
| Schedules of Investments (unaudited) (continued) | | April 30, 2005 |
AIM CAPITAL APPRECIATION PORTFOLIO
| | | | | |
| SHARES | | SECURITY | | VALUE |
| FINANCIALS — 4.8% | | | |
Banks — 1.5% | | | |
| 61,700 | | Bank of America Corp. | | $ | 2,778,968 |
| 15,700 | | Investors Financial Services Corp. (b) | | | 658,615 |
|
| | | | | | 3,437,583 |
|
Diversified Financials — 2.8% | | | |
| 31,400 | | American Express Co. | | | 1,654,780 |
| 1,700 | | The Chicago Mercantile Exchange | | | 332,384 |
| 12,400 | | Franklin Resources, Inc. | | | 851,632 |
| 10,400 | | The Goldman Sachs Group, Inc. | | | 1,110,616 |
| 11,100 | | Merrill Lynch & Co., Inc. | | | 598,623 |
| 41,400 | | SLM Corp. | | | 1,972,296 |
|
| | | | | | 6,520,331 |
|
Insurance — 0.5% |
| 30,100 | | AFLAC, Inc. | | | 1,223,565 |
|
| | | TOTAL FINANCIALS | | | 11,181,479 |
|
| HEALTHCARE — 19.5% |
Biotechnology — 2.1% |
| 30,900 | | Amgen Inc. (a) | | | 1,798,689 |
| 63,300 | | Gilead Sciences, Inc. (a) | | | 2,348,430 |
| 47,300 | | Protein Design Labs, Inc. (a)(b) | | | 845,724 |
|
| | | | | | 4,992,843 |
|
Healthcare Equipment & Supplies — 8.0% |
| 28,100 | | Alcon, Inc. | | | 2,725,700 |
| 42,800 | | Becton Dickinson & Co. | | | 2,504,656 |
| 93,300 | | Biomet, Inc. | | | 3,609,777 |
| 21,600 | | C.R. Bard, Inc. | | | 1,537,272 |
| 27,600 | | Fisher Scientific International Inc. (a) | | | 1,638,888 |
| 33,800 | | Medtronic, Inc. | | | 1,781,260 |
| 52,000 | | St. Jude Medical, Inc. (a) | | | 2,029,560 |
| 43,100 | | Varian Medical Systems, Inc. (a) | | | 1,454,194 |
| 19,700 | | Zimmer Holdings, Inc. (a) | | | 1,603,974 |
|
| | | | | | 18,885,281 |
|
Healthcare Providers & Services — 5.3% |
| 34,300 | | Aetna, Inc. | | | 2,516,591 |
| 100,623 | | Caremark Rx, Inc. (a) | | | 4,029,951 |
| 20,700 | | HCA Inc. | | | 1,155,888 |
| 41,400 | | Health Management Associates, Inc., Class A Shares | | | 1,023,822 |
| 19,900 | | PacifiCare Health Systems, Inc. (a)(b) | | | 1,189,224 |
| 19,200 | | UnitedHealth Group Inc. | | | 1,814,592 |
| 5,200 | | WellPoint Inc. (a) | | | 664,300 |
|
| | | | | | 12,394,368 |
|
See Notes to Financial Statements.
12 Travelers Series Fund Inc. | 2005 Semi-Annual Report
| | |
| Schedules of Investments (unaudited) (continued) | | April 30, 2005 |
AIM CAPITAL APPRECIATION PORTFOLIO
| | | | | |
| SHARES | | SECURITY | | VALUE |
Pharmaceuticals — 4.1% |
| 70,300 | | Johnson & Johnson | | $ | 4,824,689 |
| 54,800 | | Medicis Pharmaceutical Corp., Class A Shares (b) | | | 1,539,880 |
| 53,600 | | Pfizer Inc. | | | 1,456,312 |
| 58,400 | | Teva Pharmaceutical Industries Ltd., Sponsored ADR (b) | | | 1,824,416 |
|
| | | | | | 9,645,297 |
|
| | | TOTAL HEALTHCARE | | | 45,917,789 |
|
| INDUSTRIALS — 13.2% |
Air Freight & Couriers — 0.7% |
| 20,700 | | FedEx Corp. | | | 1,758,465 |
|
Commercial Services & Supplies — 3.4% |
| 41,400 | | Automatic Data Processing Inc. | | | 1,798,416 |
| 62,100 | | Fiserv, Inc. (a)(b) | | | 2,626,830 |
| 41,400 | | Iron Mountain Inc. (a)(b) | | | 1,229,580 |
| 93,200 | | Robert Half International Inc. | | | 2,313,224 |
|
| | | | | | 7,968,050 |
|
Electrical Equipment — 1.1% | | | |
| 21,100 | | Emerson Electric Co. | | | 1,322,337 |
| 29,100 | | Rockwell Automation, Inc. | | | 1,345,293 |
|
| | | | | | 2,667,630 |
|
Industrial Conglomerates — 2.4% | | | |
| 62,100 | | General Electric Co. | | | 2,248,020 |
| 51,800 | | Honeywell International Inc. | | | 1,852,368 |
| 51,800 | | Tyco International Ltd. | | | 1,621,858 |
|
| | | | | | 5,722,246 |
|
Machinery — 5.6% | | | |
| 24,900 | | Caterpillar Inc. | | | 2,192,445 |
| 41,400 | | Danaher Corp. | | | 2,096,082 |
| 20,700 | | Deere & Co. | | | 1,294,578 |
| 20,700 | | Eaton Corp. | | | 1,214,055 |
| 15,100 | | Illinois Tool Works, Inc. | | | 1,265,682 |
| 45,600 | | Ingersoll-Rand Co. Ltd., Class A Shares | | | 3,505,272 |
| 24,900 | | Parker-Hannifin Corp. | | | 1,492,506 |
|
| | | | | | 13,060,620 |
|
| | | TOTAL INDUSTRIALS | | | 31,177,011 |
|
| INFORMATION TECHNOLOGY — 22.1% | | | |
Communications Equipment — 2.5% | | | |
| 165,700 | | Cisco Systems, Inc. (a) | | | 2,863,296 |
| 42,000 | | Comverse Technology, Inc. (a) | | | 957,180 |
| 44,100 | | Juniper Networks, Inc. (a) | | | 996,219 |
See Notes to Financial Statements.
13 Travelers Series Fund Inc. | 2005 Semi-Annual Report
| | |
| Schedules of Investments (unaudited) (continued) | | April 30, 2005 |
AIM CAPITAL APPRECIATION PORTFOLIO
| | | | | |
| SHARES | | SECURITY | | VALUE |
Communications Equipment — 2.5% (continued) | | | |
| 34,200 | | QUALCOMM, Inc. | | $ | 1,193,238 |
|
| | | | | | 6,009,933 |
|
Computers & Peripherals — 4.3% | | | |
| 87,000 | | Apple Computer, Inc. (a) | | | 3,137,220 |
| 155,400 | | Dell Inc. (a) | | | 5,412,582 |
| 123,900 | | EMC Corp. (a) | | | 1,625,568 |
|
| | | | | | 10,175,370 |
|
Internet Software & Services — 3.8% | | | |
| 10,400 | | Google Inc., Class A Shares (a) | | | 2,288,000 |
| 41,400 | | McAfee Inc. (a) | | | 865,674 |
| 41,400 | | VeriSign, Inc. (a) | | | 1,095,444 |
| 134,600 | | Yahoo! Inc. (a) | | | 4,645,046 |
|
| | | | | | 8,894,164 |
|
IT Consulting & Services — 0.3% | | | |
| 20,700 | | NAVTEQ Corp. (a) | | | 753,894 |
|
Semiconductor Equipment & Products — 5.2% | | | |
| 72,500 | | Analog Devices, Inc. (b) | | | 2,472,975 |
| 65,600 | | Applied Materials, Inc. | | | 975,472 |
| 20,700 | | KLA-Tencor Corp. | | | 807,714 |
| 60,100 | | Linear Technology Corp. | | | 2,147,974 |
| 31,100 | | Marvell Technology Group Ltd. (a) | | | 1,041,228 |
| 33,400 | | Maxim Integrated Products, Inc. | | | 1,249,160 |
| 124,243 | | Microchip Technology Inc. | | | 3,538,441 |
|
| | | | | | 12,232,964 |
|
Software — 6.0% | | | |
| 19,700 | | Adobe Systems, Inc. | | | 1,171,559 |
| 33,100 | | Amdocs Ltd. (a) | | | 884,101 |
| 49,700 | | Autodesk, Inc. | | | 1,581,951 |
| 20,700 | | Cognos, Inc. (a)(b) | | | 783,288 |
| 22,800 | | Electronic Arts Inc. (a) | | | 1,217,292 |
| 24,900 | | Mercury Interactive Corp. (a) | | | 1,029,117 |
| 207,100 | | Microsoft Corp. | | | 5,239,630 |
| 183,900 | | Oracle Corp. (a) | | | 2,125,884 |
|
| | | | | | 14,032,822 |
|
| | | TOTAL INFORMATION TECHNOLOGY | | | 52,099,147 |
|
| MATERIALS — 8.8% | | | |
Chemicals — 5.5% | | | |
| 24,900 | | Air Products & Chemicals, Inc. | | | 1,462,377 |
| 26,900 | | The Dow Chemical Co. | | | 1,235,517 |
| 41,400 | | E.I. du Pont de Nemours & Co. | | | 1,950,354 |
See Notes to Financial Statements.
14 Travelers Series Fund Inc. | 2005 Semi-Annual Report
| | |
| Schedules of Investments (unaudited) (continued) | | April 30, 2005 |
AIM CAPITAL APPRECIATION PORTFOLIO
| | | | | |
| SHARES | | SECURITY | | VALUE |
Chemicals — 5.5% (continued) | | | |
| 24,900 | | Eastman Chemical Co. | | $ | 1,344,600 |
| 33,100 | | Ecolab Inc. | | | 1,082,701 |
| 29,000 | | Monsanto Co. | | | 1,699,980 |
| 34,900 | | Praxair, Inc. | | | 1,634,367 |
| 41,400 | | Rohm and Haas Co. | | | 1,807,524 |
| 42,300 | | UAP Holding Corp. (b) | | | 608,697 |
|
| | | | | | 12,826,117 |
|
Metals & Mining — 3.3% | | | |
| 50,100 | | Alcoa Inc. | | | 1,453,902 |
| 22,900 | | Newmont Mining Corp. | | | 869,513 |
| 24,900 | | Nucor Corp. | | | 1,272,390 |
| 16,200 | | Peabody Energy Corp. | | | 709,074 |
| 16,600 | | Phelps Dodge Corp. | | | 1,425,110 |
| 43,900 | | Placer Dome Inc. (b) | | | 586,504 |
| 33,000 | | United States Steel Corp. | | | 1,411,080 |
|
| | | | | | 7,727,573 |
|
| | | TOTAL MATERIALS | | | 20,553,690 |
|
| TELECOMMUNICATION SERVICES — 0.8% | | | |
Wireless Telecommunication Services — 0.8% |
| 40,900 | | Nextel Communications, Inc., Class A Shares (a) | | | 1,144,791 |
| 52,500 | | Syniverse Holdings Inc. (a)(b) | | | 635,250 |
|
| | | TOTAL TELECOMMUNICATION SERVICES | | | 1,780,041 |
|
| | | TOTAL COMMON STOCK
(Cost — $215,115,955) | | | 230,078,519 |
|
| | | | |
| | |
| CONTRACTS | | | | |
| PURCHASED OPTIONS — 0.0% | | |
Internet Software & Services — 0.0% | | |
| 10,300 | | Google, Inc. | | 1,545 |
| 66,700 | | Yahoo!, Inc. | | 6,670 |
|
| | | TOTAL PURCHASED OPTIONS (Cost — $120,778) | | 8,215 |
|
| | | TOTAL INVESTMENTS BEFORE SHORT-TERM
INVESTMENTS (Cost — $215,236,733) | | 230,086,734 |
|
See Notes to Financial Statements.
15 Travelers Series Fund Inc. | 2005 Semi-Annual Report
| | |
| Schedules of Investments (unaudited) (continued) | | April 30, 2005 |
AIM CAPITAL APPRECIATION PORTFOLIO
| | | | | | |
FACE
AMOUNT | | SECURITY | | VALUE | |
| SHORT-TERM INVESTMENTS — 8.1% | | | | |
| REPURCHASE AGREEMENT — 3.0% | | | | |
| $ 7,054,000 | | State Street Bank & Trust Co. dated 4/29/05, 2.600% due 5/2/05; Proceeds at maturity — $7,055,528; (Fully collateralized by U.S. Treasury Note, 6.250% due 8/15/23; Market value — $7,200,276) (Cost — $7,054,000) | | $ | 7,054,000 | |
|
|
| | |
| SHARES | | | | | |
| SECURITIES PURCHASED FROM SECURITIES LENDING COLLATERAL — 5.1% | |
| 12,091,157 | | State Street Navigator Securities Lending Trust Prime Portfolio | | | | |
| | | (Cost — $12,091,157) | | | 12,091,157 | |
|
|
| | | TOTAL SHORT-TERM INVESTMENTS
(Cost — $19,145,157) | | | 19,145,157 | |
|
|
| | | TOTAL INVESTMENTS — 105.9% (Cost — $234,381,890**) | | | 249,231,891 | |
| | | Liabilities in Excess of Other Assets — (5.9)% | | | (13,938,256 | ) |
|
|
| | | TOTAL NET ASSETS — 100.0% | | $ | 235,293,635 | |
|
|
| (a) | | Non-income producing security. |
| (b) | | All or a portion of this security is on loan (See Notes 1 and 3). |
| * | | Subsequent to the reporting period, the company changed its name to Chevron Corp. |
| ** | | Aggregate cost for federal income tax purposes is substantially the same. |
| | |
Abbreviation used in this schedule: |
ADR — American Depositary Receipt |
See Notes to Financial Statements.
16 Travelers Series Fund Inc. | 2005 Semi-Annual Report
| | |
| Schedules of Investments (unaudited) (continued) | | April 30, 2005 |
SMITH BARNEY LARGE CAPITALIZATION GROWTH PORTFOLIO
| | | | | |
| SHARES | | SECURITY | | VALUE |
| COMMON STOCK — 100.4% | | | |
| CONSUMER DISCRETIONARY — 19.4% | | | |
Internet & Catalog Retail — 7.4% | | | |
| 592,800 | | Amazon.com, Inc. (a) | | $ | 19,183,008 |
| 259,500 | | eBay Inc. (a) | | | 8,233,935 |
|
| | | | | | 27,416,943 |
|
Media — 6.8% | | | |
| 889,320 | | Time Warner Inc. (a) | | | 14,949,469 |
| 388,915 | | The Walt Disney Co. | | | 10,267,356 |
|
| | | | | | 25,216,825 |
|
Specialty Retail — 5.2% | | | |
| 145,300 | | Bed Bath & Beyond Inc. (a) | | | 5,406,613 |
| 385,450 | | The Home Depot, Inc. | | | 13,633,367 |
|
| | | | | | 19,039,980 |
|
| | | TOTAL CONSUMER DISCRETIONARY | | | 71,673,748 |
|
| CONSUMER STAPLES — 10.9% | | | |
Beverages — 3.5% | | | |
| 296,290 | | The Coca-Cola Co. | | | 12,870,838 |
|
Food Products — 2.8% | | | |
| 148,140 | | Wm. Wrigley Jr. Co. | | | 10,240,918 |
|
Personal Products — 4.6% | | | |
| 333,295 | | The Gillette Co. | | | 17,211,354 |
|
| | | TOTAL CONSUMER STAPLES | | | 40,323,110 |
|
| FINANCIALS — 13.8% | | | |
Diversified Financials — 7.2% | | | |
| 259,530 | | Merrill Lynch & Co., Inc. | | | 13,996,453 |
| 237,170 | | Morgan Stanley | | | 12,479,885 |
|
| | | | | | 26,476,338 |
|
Insurance — 6.6% | | | |
| 176,456 | | American International Group, Inc. | | | 8,972,788 |
| 182 | | Berkshire Hathaway Inc., Class A Shares (a) | | | 15,351,700 |
|
| | | | | | 24,324,488 |
|
| | | TOTAL FINANCIALS | | | 50,800,826 |
|
| HEALTHCARE — 23.3% | | | |
Biotechnology — 12.9% | | | |
| 296,180 | | Amgen Inc. (a) | | | 17,240,638 |
| 259,350 | | Biogen Idec Inc. (a) | | | 9,398,844 |
| 296,300 | | Genentech, Inc. (a) | | | 21,019,522 |
|
| | | | | | 47,659,004 |
|
See Notes to Financial Statements.
17 Travelers Series Fund Inc. | 2005 Semi-Annual Report
| | |
| Schedules of Investments (unaudited) (continued) | | April 30, 2005 |
SMITH BARNEY LARGE CAPITALIZATION GROWTH PORTFOLIO
| | | | | | |
| SHARES | | SECURITY | | VALUE | |
Pharmaceuticals — 10.4% | | | | |
| 222,250 | | Eli Lilly & Co. | | $ | 12,994,957 | |
| 163,070 | | Johnson & Johnson | | | 11,191,494 | |
| 518,770 | | Pfizer Inc. | | | 14,094,981 | |
|
|
| | | | | | 38,281,432 | |
|
|
| | | TOTAL HEALTHCARE | | | 85,940,436 | |
|
|
| INDUSTRIALS — 2.9% | | | | |
Industrial Conglomerates — 2.9% | | | | |
| 296,120 | | General Electric Co. | | | 10,719,544 | |
|
|
| INFORMATION TECHNOLOGY — 30.1% | | | | |
Communications Equipment — 8.0% | | | | |
| 518,508 | | Cisco Systems, Inc. (a) | | | 8,959,818 | |
| 400,900 | | Juniper Networks, Inc. (a) | | | 9,056,331 | |
| 741,680 | | Motorola, Inc. | | | 11,377,371 | |
|
|
| | | | | | 29,393,520 | |
|
|
Computers & Peripherals — 3.4% | | | | |
| 359,100 | | Dell Inc. (a) | | | 12,507,453 | |
|
|
Internet Software & Services — 3.9% | | | | |
| 259,500 | | Akamai Technologies, Inc. (a) | | | 3,064,695 | |
| 518,700 | | IAC/InterActiveCorp. (a) | | | 11,276,538 | |
|
|
| | | | | | 14,341,233 | |
|
|
Semiconductor Equipment & Products — 9.5% | | | | |
| 518,600 | | Intel Corp. | | | 12,197,472 | |
| 592,660 | | Texas Instruments Inc. | | | 14,792,794 | |
| 302,980 | | Xilinx, Inc. | | | 8,162,281 | |
|
|
| | | | | | 35,152,547 | |
|
|
Software — 5.3% | | | | |
| 73,500 | | Electronic Arts Inc. (a) | | | 3,924,165 | |
| 459,500 | | Microsoft Corp. | | | 11,625,350 | |
| 375,000 | | Red Hat, Inc. (a) | | | 4,031,250 | |
|
|
| | | | | | 19,580,765 | |
|
|
| | | TOTAL INFORMATION TECHNOLOGY | | | 110,975,518 | |
|
|
| | | TOTAL INVESTMENTS — 100.4% (Cost — $322,472,289*) | | | 370,433,182 | |
| | | Liabilities in Excess of Other Assets — (0.4)% | | | (1,634,578 | ) |
|
|
| | | TOTAL NET ASSETS — 100.0% | | $ | 368,798,604 | |
|
|
| (a) | | Non-income producing security. |
| * | | Aggregate cost for federal income tax purposes is substantially the same. |
See Notes to Financial Statements.
18 Travelers Series Fund Inc. | 2005 Semi-Annual Report
| | |
| Statements of Assets and Liabilities (unaudited) | | April 30, 2005 |
| | | | | | | | |
| | | AIM Capital
Appreciation
Portfolio | | | Smith Barney
Large Capitalization
Growth Portfolio | |
| ASSETS: | | | | | | | | |
Investments, at value (Cost — $234,381,890 and $322,472,289, respectively) | | $ | 249,231,891 | | | $ | 370,433,182 | |
Cash | | | 925 | | | | — | |
Receivable for securities sold | | | 4,099,921 | | | | 7,347,904 | |
Dividends and interest receivable | | | 83,385 | | | | 114,970 | |
Receivable for Fund shares sold | | | — | | | | 15,572 | |
Prepaid expenses | | | 3,134 | | | | 3,245 | |
|
|
Total Assets | | | 253,419,256 | | | | 377,914,873 | |
|
|
| LIABILITIES: | | | | | | | | |
Payable for loaned securities collateral (Note 3) | | | 12,091,157 | | | | — | |
Payable for securities purchased | | | 4,880,905 | | | | 7,097,259 | |
Payable for Fund shares reacquired | | | 960,822 | | | | 819,689 | |
Management fees payable | | | 159,642 | | | | 229,997 | |
Transfer agency services payable | | | 834 | | | | 833 | |
Directors’ fees payable | | | 338 | | | | 267 | |
Due to custodian | | | — | | | | 933,205 | |
Accrued expenses | | | 31,923 | | | | 35,019 | |
|
|
Total Liabilities | | | 18,125,621 | | | | 9,116,269 | |
|
|
Total Net Assets | | $ | 235,293,635 | | | $ | 368,798,604 | |
|
|
| NET ASSETS: | | | | | | | | |
Par value of capital shares (Note 4) | | $ | 236 | | | $ | 279 | |
Capital paid in excess of par value | | | 278,248,335 | | | | 400,430,658 | |
Undistributed net investment income | | | 362,714 | | | | 115,429 | |
Accumulated net realized loss from investment transactions and foreign currencies | | | (58,167,651 | ) | | | (79,708,655 | ) |
Net unrealized appreciation of investments and options | | | 14,850,001 | | | | 47,960,893 | |
|
|
Total Net Assets | | $ | 235,293,635 | | | $ | 368,798,604 | |
|
|
Shares Outstanding | | | 23,619,371 | | | | 27,942,410 | |
|
|
Net Asset Value | | | $9.96 | | | | $13.20 | |
|
|
See Notes to Financial Statements.
19 Travelers Series Fund Inc. | 2005 Semi-Annual Report
| | |
| Statements of Operations (unaudited) | | |
For the Six Months Ended April 30, 2005
| | | | | | | | |
| | | AIM Capital
Appreciation
Portfolio | | | Smith Barney
Large Capitalization
Growth Portfolio | |
| INVESTMENT INCOME: | | | | | | | | |
Dividends | | $ | 1,628,891 | | | $ | 3,137,702 | |
Interest | | | 74,537 | | | | 11,705 | |
Securities lending income | | | 9,247 | | | | — | |
Less: Foreign withholding tax | | | (2,504 | ) | | | — | |
|
|
Total Investment Income | | | 1,710,171 | | | | 3,149,407 | |
|
|
| EXPENSES: | | | | | | | | |
Management fees (Note 2) | | | 962,717 | | | | 1,473,633 | |
Custody | | | 22,269 | | | | 17,176 | |
Audit and legal | | | 20,860 | | | | 14,676 | |
Shareholder communications | | | 8,235 | | | | 15,544 | |
Directors’ fees | | | 4,016 | | | | 5,181 | |
Transfer agency services (Note 2) | | | 2,456 | | | | 2,299 | |
Other | | | 4,122 | | | | 4,500 | |
|
|
Total Expenses | | | 1,024,675 | | | | 1,533,009 | |
|
|
Net Investment Income | | | 685,496 | | | | 1,616,398 | |
|
|
REALIZED AND UNREALIZED GAIN (LOSS) ON | | | | | | | | |
INVESTMENTS, OPTIONS AND FOREIGN | | | | | | | | |
CURRENCIES (NOTES 1 AND 3): | | | | | | | | |
Realized Gain (Loss) From: | | | | | | | | |
Investment transactions | | | 8,345,165 | | | | (7,903,850 | ) |
Foreign currency transactions | | | 14,400 | | | | — | |
|
|
Net Realized Gain (Loss) | | | 8,359,565 | | | | (7,903,850 | ) |
|
|
Net Change in Unrealized Appreciation/Depreciation of Investments and Options | | | (9,665,601 | ) | | | 10,217,572 | |
|
|
Net Gain (Loss) on Investments, Options and Foreign Currencies | | | (1,306,036 | ) | | | 2,313,722 | |
|
|
Increase (Decrease) in Net Assets From Operations | | $ | (620,540 | ) | | $ | 3,930,120 | |
|
|
See Notes to Financial Statements.
20 Travelers Series Fund Inc. | 2005 Semi-Annual Report
| | |
| Statements of Changes in Net Assets | | |
For the Six Months Ended April 30, 2005 (unaudited) and the Year Ended October 31, 2004
| | | | | | | | |
| AIM Capital Appreciation Portfolio | | 2005 | | | 2004 | |
| OPERATIONS: | | | | | | | | |
Net investment income (loss) | | $ | 685,496 | | | $ | (382,450 | ) |
Net realized gain | | | 8,359,565 | | | | 11,819,139 | |
Net change in unrealized appreciation/depreciation | | | (9,665,601 | ) | | | (3,853,039 | ) |
|
|
Increase (Decrease) in Net Assets From Operations | | | (620,540 | ) | | | 7,583,650 | |
|
|
| DISTRIBUTIONS TO SHAREHOLDERS FROM: | | | | | | | | |
Net investment income | | | (322,782 | ) | | | — | |
|
|
Decrease in Net Assets From
Distributions to Shareholders | | | (322,782 | ) | | | — | |
|
|
| FUND SHARE TRANSACTIONS (NOTE 4): | | | | | | | | |
Net proceeds from sale of shares | | | 31,938,298 | | | | 81,806,468 | |
Net asset value of shares issued for reinvestment of distributions | | | 322,782 | | | | — | |
Cost of shares reacquired | | | (29,646,664 | ) | | | (34,221,120 | ) |
|
|
Increase in Net Assets From Fund Share Transactions | | | 2,614,416 | | | | 47,585,348 | |
|
|
Increase in Net Assets | | | 1,671,094 | | | | 55,168,998 | |
| NET ASSETS: | | | | | | | | |
Beginning of period | | | 233,622,541 | | | | 178,453,543 | |
|
|
End of period* | | $ | 235,293,635 | | | $ | 233,622,541 | |
|
|
* Includes undistributed net investment income of: | | | $362,714 | | | | — | |
|
|
See Notes to Financial Statements.
21 Travelers Series Fund Inc. | 2005 Semi-Annual Report
| | |
| Statements of Changes in Net Assets (continued) | | |
For the Six Months Ended April 30, 2005 (unaudited) and the Year Ended October 31, 2004
| | | | | | | | |
| Smith Barney Large Capitalization Growth Portfolio | | 2005 | | | 2004 | |
| OPERATIONS: | | | | | | | | |
Net investment income (loss) | | $ | 1,616,398 | | | $ | (95,094 | ) |
Net realized loss | | | (7,903,850 | ) | | | (6,346,198 | ) |
Net change in unrealized appreciation/depreciation | | | 10,217,572 | | | | (14,076,919 | ) |
|
|
Increase (Decrease) in Net Assets From Operations | | | 3,930,120 | | | | (20,518,211 | ) |
|
|
| DISTRIBUTIONS TO SHAREHOLDERS FROM: | | | | | | | | |
Net investment income | | | (1,500,969 | ) | | | (23,939 | ) |
Return of capital | | | — | | | | (46,869 | ) |
|
|
Decrease in Net Assets From
Distributions to Shareholders | | | (1,500,969 | ) | | | (70,808 | ) |
|
|
| FUND SHARE TRANSACTIONS (NOTE 4): | | | | | | | | |
Net proceeds from sale of shares | | | 7,412,099 | | | | 83,145,183 | |
Net asset value of shares issued for reinvestment of distributions | | | 1,500,969 | | | | 70,808 | |
Cost of shares reacquired | | | (32,214,263 | ) | | | (26,791,922 | ) |
|
|
Increase (Decrease) in Net Assets From
Fund Share Transactions | | | (23,301,195 | ) | | | 56,424,069 | |
|
|
Increase (Decrease) in Net Assets | | | (20,872,044 | ) | | | 35,835,050 | |
| NET ASSETS: | | | | | | | | |
Beginning of period | | | 389,670,648 | | | | 353,835,598 | |
|
|
End of period* | | $ | 368,798,604 | | | $ | 389,670,648 | |
|
|
* Includes undistributed net investment income of: | | | $115,429 | | | | — | |
|
|
See Notes to Financial Statements.
22 Travelers Series Fund Inc. | 2005 Semi-Annual Report
For a share of capital stock outstanding throughout each year or period ended October 31, unless otherwise noted:
| | | | | | | | | | | | | | | | | | |
AIM Capital Appreciation
Portfolio | | 2005(1) | | | 2004 | | | 2003 | | | 2002 | | | 2001 | | | 2000 | |
Net Asset Value, Beginning
of Period | | $9.98 | | | $9.63 | | | $8.04 | | | $9.11 | | | $21.73 | | | $16.30 | |
|
|
| Income (Loss) From Operations: | | | | | | | | | | | | | | | | | | |
Net investment income (loss) | | 0.03 | | | (0.02 | ) | | (0.02 | ) | | (0.03 | ) | | (0.02 | ) | | (0.07 | ) |
Net realized and unrealized gain (loss) | | (0.04 | ) | | 0.37 | | | 1.61 | | | (1.04 | ) | | (8.72 | ) | | 6.03 | |
|
|
Total Income (Loss) From Operations | | (0.01 | ) | | 0.35 | | | 1.59 | | | (1.07 | ) | | (8.74 | ) | | 5.96 | |
|
|
Less Distributions From: | | | | | | | | | | | | | | | | | | |
Net investment income | | (0.01 | ) | | — | | | — | | | — | | | — | | | — | |
Net realized gains | | — | | | — | | | — | | | — | | | (3.88 | ) | | (0.53 | ) |
|
|
Total Distributions | | (0.01 | ) | | — | | | — | | | — | | | (3.88 | ) | | (0.53 | ) |
|
|
Net Asset Value, End
of Period | | $9.96 | | | $9.98 | | | $9.63 | | | $8.04 | | | $9.11 | | | $21.73 | |
|
|
Total Return(2) | | (0.07 | )%‡ | | 3.63 | % | | 19.78 | % | | (11.75 | )% | | (43.36 | )% | | 36.53 | % |
|
|
Net Assets, End of Period (millions) | | $235 | | | $234 | | | $178 | | | $172 | | | $224 | | | $435 | |
|
|
Ratios to Average
Net Assets: | | | | | | | | | | | | | | | | | | |
Expenses(3) | | 0.85 | %† | | 0.85 | %(4) | | 0.85 | % | | 0.85 | % | | 0.83 | % | | 0.83 | % |
Net investment income (loss) | | 0.57 | † | | (0.18 | ) | | (0.25 | ) | | (0.28 | ) | | (0.20 | ) | | (0.35 | ) |
|
|
Portfolio Turnover Rate | | 43 | % | | 71 | % | | 49 | % | | 65 | % | | 77 | % | | 91 | % |
|
|
| (1) | | For the six months ended April 30, 2005 (unaudited). |
| (2) | | Total returns do not reflect expenses associated with the separate account such as administrative fees, account charges and surrender charges which, if reflected, would reduce the total returns for all periods shown. Performance figures may reflect voluntary fee waivers and/or expense reimbursements. Past performance is no guarantee of future results. In the absence of voluntary fee waivers and/or expense reimbursements, the total return would have been lower. |
| (3) | | As a result of voluntary expense limitation, the expense ratio will not exceed 1.25%. |
| (4) | | The investment manager voluntarily waived a portion of its fees for the year ended October 31, 2004. The actual expense ratios did not change due to these waivers. |
| ‡ | | Total return is not annualized, as it may not be representative of the total return for the year. |
See Notes to Financial Statements.
23 Travelers Series Fund Inc. | 2005 Semi-Annual Report
| | |
| Financial Highlights (continued) | | |
For a share of capital stock outstanding throughout each year or period ended October 31, unless otherwise noted:
| | | | | | | | | | | | | | | | | | |
Smith Barney Large
Capitalization Growth
Portfolio | | 2005(1) | | | 2004 | | | 2003 | | | 2002 | | | 2001 | | | 2000 | |
Net Asset Value, Beginning of Period | | $13.15 | | | $13.76 | | | $ 9.91 | | | $11.86 | | | $16.04 | | | $14.53 | |
|
|
| Income (Loss) From Operations: | | | | | | | | | | | | | | | | | | |
Net investment income (loss) | | 0.06 | | | (0.00 | )* | | 0.01 | | | 0.02 | | | 0.02 | | | 0.01 | |
Net realized and unrealized gain (loss) | | 0.04 | | | (0.61 | ) | | 3.86 | | | (1.95 | ) | | (4.20 | ) | | 1.55 | |
|
|
Total Income (Loss) From Operations | | 0.10 | | | (0.61 | ) | | 3.87 | | | (1.93 | ) | | (4.18 | ) | | 1.56 | |
|
|
Less Distributions From: | | | | | | | | | | | | | | | | | | |
Net investment income | | (0.05 | ) | | (0.00 | )* | | (0.02 | ) | | (0.02 | ) | | — | | | (0.01 | ) |
Net realized gains | | — | | | — | | | — | | | — | | | — | | | (0.02 | ) |
Return of capital | | — | | | (0.00 | )* | | — | | | — | | | — | | | (0.02 | ) |
|
|
Total Distributions | | (0.05 | ) | | (0.00 | )* | | (0.02 | ) | | (0.02 | ) | | — | | | (0.05 | ) |
|
|
Net Asset Value, End
of Period | | $13.20 | | | $13.15 | | | $13.76 | | | $ 9.91 | | | $11.86 | | | $16.04 | |
|
|
Total Return(2) | | 0.74 | %‡ | | (4.42 | )% | | 39.16 | % | | (16.29 | )% | | (26.06 | )% | | 10.77 | % |
|
|
Net Assets, End of Period (millions) | | $369 | | | $390 | | | $354 | | | $225 | | | $280 | | | $324 | |
|
|
Ratios to Average
Net Assets: | | | | | | | | | | | | | | | | | | |
Expenses | | 0.78 | %† | | 0.78 | %(3) | | 0.79 | % | | 0.80 | % | | 0.78 | % | | 0.77 | % |
Net investment income (loss) | | 0.82 | † | | (0.02 | ) | | 0.06 | | | 0.13 | | | 0.14 | | | 0.06 | |
|
|
Portfolio Turnover Rate | | 13 | % | | 7 | % | | 16 | % | | 19 | % | | 10 | % | | 7 | % |
|
|
| (1) | | For the six months ended April 30, 2005 (unaudited). |
| (2) | | Total returns do not reflect expenses associated with the separate account such as administrative fees, account charges and surrender charges which, if reflected, would reduce the total returns for all periods shown. Performance figures may reflect voluntary fee waivers and/or expense reimbursements. Past performance is no guarantee of future results. In the absence of voluntary fee waivers and/or expense reimbursements, the total return would have been lower. |
| (3) | | The investment manager voluntarily waived a portion of its fees for the year ended October 31, 2004. The actual expense ratios did not change due to these waivers. |
| * | | Amount represents less than $0.01 per share. |
| ‡ | | Total return is not annualized, as it may not be representative of the total return for the year. |
See Notes to Financial Statements.
24 Travelers Series Fund Inc. | 2005 Semi-Annual Report
Notes to Financial Statements (unaudited)
| 1. | Organization and Significant Accounting Policies |
The AIM Capital Appreciation Portfolio (“AIMCAP”) and Smith Barney Large Capitalization Growth Portfolio (“SBLCG”) (“Funds”) are separate diversified investment funds of the Travelers Series Fund Inc. (“Company”). The Company, a Maryland corporation, is registered under the Investment Company Act of 1940 (the “1940 Act”), as amended, as an open-end management investment company.
The following are significant accounting policies consistently followed by the Funds and are in conformity with U.S. generally accepted accounting principles (“GAAP”). Estimates and assumptions are required to be made regarding assets, liabilities and changes in net assets resulting from operations when financial statements are prepared. Changes in the economic environment, financial markets and any other parameters used in determining these estimates could cause actual results to differ.
(a) Investment Valuation. Equity securities for which market quotations are available are valued at the last sale price or official closing price on the primary market or exchange on which they trade. Debt securities are valued at the mean between the bid and asked price provided by an independent pricing service that are based on transactions in debt obligations, quotations from bond dealers, market transactions in comparable securities and various relationships between securities. When prices are not readily available, or are determined not to reflect fair value, such as when the value of a security has been significantly affected by events after the close of the exchange or market on which the security is principally traded, but before the Funds calculate their net asset value, the Funds may value these investments at fair value as determined in accordance with the procedures approved by the Funds’ Board of Directors. Short-term obligations with maturities of 60 days or less are valued at amortized cost, which approximates market value.
(b) Repurchase Agreements. When entering into repurchase agreements, it is the Funds’ policy that their custodian or a third party custodian takes possession of the underlying collateral securities, the market value of which at least equals the principal amount of the repurchase transaction, including accrued interest. To the extent that any repurchase transaction exceeds one business day, the value of the collateral is marked-to-market to ensure the adequacy of the
25 Travelers Series Fund Inc. | 2005 Semi-Annual Report
Notes to Financial Statements (unaudited) (continued)
collateral. If the seller defaults, and the market value of the collateral declines or if bankruptcy proceedings are commenced with respect to the seller of the security, realization of the collateral by the Funds may be delayed or limited.
(c) Forward Foreign Currency Contracts. AIMCAP may enter into forward foreign currency contracts to hedge against foreign currency exchange rate risk on its non-US dollar denominated securities or to facilitate settlement of foreign currency denominated portfolio transactions. A forward foreign currency contract is an agreement between two parties to buy and sell a currency at a set price on a future date. The contract is marked-to-market daily and the change in value is recorded by the Fund as an unrealized gain or loss. When a forward foreign currency contract is extinguished, through either delivery or offset by entering into another forward foreign currency contract, the Fund records a realized gain or loss equal to the difference between the value of the contract at the time it was opened and the value of the contract at the time it was extinguished.
Forward foreign currency contracts involve elements of market risk in excess of the amounts reflected in the Statements of Assets and Liabilities. The Fund bears the risk of an unfavorable change in the foreign exchange rate underlying the forward foreign currency contract. Risks may also arise upon entering into these contracts from the potential inability of the counterparties to meet the terms of their contracts.
(d) Lending of Portfolio Securities. The Funds have an agreement with their custodian whereby the custodian may lend securities owned by the Funds to brokers, dealers and other financial organizations. In exchange for lending securities under the terms of the agreement with their custodian, the Funds receive a lender’s fee. Fees earned by the Funds on securities lending are recorded as securities lending income. Loans of securities by the Funds are collateralized by cash, U.S. government securities or high quality money market instruments that are maintained at all times in an amount at least equal to the current market value of the loaned securities, plus a margin which varies depending on the type of securities loaned. The custodian establishes and maintains the collateral in a segregated account. The Funds have the right under the lending agreement to recover the securities from the borrower on demand.
26 Travelers Series Fund Inc. | 2005 Semi-Annual Report
Notes to Financial Statements (unaudited) (continued)
Funds maintain the risk of any loss on the securities on loan as well as the potential loss on investments purchased with cash collateral received from securities lending.
(e) Security Transactions and Investment Income. Security transactions are accounted for on a trade date basis. Interest income, adjusted for amortization of premium and accretion of discount, is recorded on the accrual basis. Dividend income is recorded on the ex-dividend date. Foreign dividend income is recorded on the ex-dividend date or as soon as practical after the Funds determine the existence of a dividend declaration after exercising reasonable due diligence. The cost of investments sold is determined by use of the specific identification method.
(f) Foreign Currency Translation. Investment securities and other assets and liabilities denominated in foreign currencies are translated into U.S. dollar amounts based upon prevailing exchange rates on the date of valuation. Purchases and sales of investment securities and income and expense items denominated in foreign currencies are translated into U.S. dollar amounts based upon prevailing exchange rates on the respective dates of such transactions.
The Funds do not isolate that portion of the results of operations resulting from changes in foreign exchange rates on investments from the fluctuations arising from changes in market prices of securities held. Such fluctuations are included with the net realized and unrealized gain or loss on investments.
Net realized foreign exchange gains or losses arise from sales of foreign currencies, including gains and losses on forward foreign currency contracts, currency gains or losses realized between the trade and settlement dates on securities transactions and the difference between the amounts of dividends, interest and foreign withholding taxes recorded on the Funds’ books and the U.S. dollar equivalent of the amounts actually received or paid. Net unrealized foreign exchange gains and losses arise from changes in the fair values of assets and liabilities, other than investments in securities, at the date of valuation, resulting from changes in exchange rates.
Foreign security and currency transactions may involve certain considerations and risks not typically associated with those of U.S. dollar denominated transactions as a result of, among other factors, the possibility of lower levels of
27 Travelers Series Fund Inc. | 2005 Semi-Annual Report
Notes to Financial Statements (unaudited) (continued)
governmental supervision and regulation of foreign securities markets and the possibility of political or economic instability.
(g) Distributions to Shareholders. Distributions from net investment income and distributions of net realized gains, if any, are declared at least annually. Distributions to shareholders of the Funds are recorded on the ex-dividend date and are determined in accordance with income tax regulations, which may differ from GAAP
(h) Federal and Other Taxes. It is the Funds’ policy to comply with the federal income and excise tax requirements of the Internal Revenue Code of 1986, as amended, applicable to regulated investment companies. Accordingly, the Funds intend to distribute substantially all of their taxable income and net realized gains on investments, if any, to shareholders each year. Therefore, no federal income tax provision is required in the Funds’ financial statements. Under the applicable foreign tax laws, a withholding tax may be imposed on interest, dividends and capital gains at various rates.
(i) Reclassification. GAAP requires that certain components of net assets be adjusted to reflect permanent differences between financial and tax reporting. These reclassifications have no effect on net assets or net asset values per share.
| 2. | Management Agreement and Transactions with Affiliates |
Smith Barney Fund Management LLC (“SBFM”), an indirect wholly-owned subsidiary of Citigroup Inc. (“Citigroup”), acts as investment manager of SBLCG. SBLCG pays SBFM a management fee, which is calculated daily and payable monthly, based on the Fund’s average daily net assets is calculated in accordance with the following breakpoint schedule:
| | | |
| Portfolio’s Average Daily Net Assets | | Fee Rate | |
Up to $5 billion | | 0.750 | % |
In excess of $5 billion and up to and including $7.5 billion | | 0.725 | % |
In excess of $7.5 billion and up to and including $10 billion | | 0.700 | % |
Over $10 billion | | 0.650 | % |
|
|
Travelers Investment Adviser, Inc. (“TIA”), an affiliate of SBFM, acts as the investment manager of AIMCAP. AIMCAP pays TIA a management fee
28 Travelers Series Fund Inc. | 2005 Semi-Annual Report
Notes to Financial Statements (unaudited) (continued)
calculated at an annual rate of 0.80% on the average daily net assets of AIMCAP. This fee is calculated daily and paid monthly. During the six months ended April 30, 2005, AIMCAP had a voluntary expense limitation in place of 1.25%. This limitation can be terminated at any time by TIA.
TIA has also entered into a sub-advisory agreement with AIM Capital Management, Inc. (“AIM”). Pursuant to the sub-advisory agreement, AIM is responsible for the day-to-day portfolio operations and investment decisions and is compensated by TIA for such services at the annual rate of 0.375% of AIMCAP’s average daily net assets.
TIA has also entered into a Sub-Administrative Services Agreement with SBFM. TIA pays SBFM, as sub-administrator, a fee calculated at an annual rate of 0.10% of the average daily net assets of AIMCAP.
Citicorp Trust Bank, fsb. (“CTB”), another subsidiary of Citigroup, acts as the Funds’ transfer agent. PFPC Inc. (“PFPC”) acts as the Funds’ sub-transfer agent. CTB receives account fees and asset-based fees that vary according to the size and type of account. PFPC is responsible for shareholder recordkeeping and financial processing for all shareholder accounts and is paid by CTB. For the six months ended April 30, 2005, each Fund paid transfer agent fees of $2,083 to CTB.
During the six months ended April 30, 2005, Citigroup Global Markets Inc., another indirect wholly-owned subsidiary of Citigroup, received brokerage commissions in the amounts of $408 for AIMCAP. During the six months ended April 30, 2005, SBLCG did not receive any brokerage commissions.
Most of the officers and one Director of the Company are employees of Citigroup or its affiliates and do not receive compensation from the Company.
During the six months ended April 30, 2005, the aggregate cost of purchases and proceeds from sales of investments (excluding short-term investments) were as follows:
| | | | | | |
| | | AIMCAP | | SBLCG |
Purchases | | $ | 102,033,742 | | $ | 49,263,279 |
|
Sales | | | 101,164,608 | | | 67,848,098 |
|
29 Travelers Series Fund Inc. | 2005 Semi-Annual Report
Notes to Financial Statements (unaudited) (continued)
At April 30, 2005, the aggregate gross unrealized appreciation and depreciation of investments for federal income tax purposes were substantially as follows:
| | | | | | | | |
| | | AIMCAP | | | SBLCG | |
Gross unrealized appreciation | | $ | 23,430,564 | | | $ | 64,037,578 | |
Gross unrealized depreciation | | | (8,580,563 | ) | | | (16,076,685 | ) |
|
|
Net unrealized appreciation | | $ | 14,850,001 | | | $ | 47,960,893 | |
|
|
At April 30, 2005, AIMCAP loaned securities having a market value of $11,943,914 and received cash collateral amounting to $12,091,157 which was invested in the State Street Navigator Securities Lending Trust Prime Portfolio, a Rule 2a-7 money market fund, registered under the 1940 Act.
At April 30, 2005, SBLCG did not have any securities on loan.
At April 30, 2005, the Company had six billion shares of capital stock authorized with a par value of $0.00001 per share. Each share of a Fund represents an equal proportionate interest in that Fund with each other share of the same Fund and has an equal entitlement to any dividends and distributions made by the Fund.
Transactions in shares of each Fund were as follows:
| | | | | | |
| | | Six Months Ended
April 30, 2005 | | | Year Ended
October 31, 2004 | |
AIM Capital Appreciation Portfolio | | | | | | |
Shares sold | | 3,016,310 | | | 8,342,805 | |
Shares issued on reinvestment | | 30,138 | | | — | |
Shares reacquired | | (2,847,763 | ) | | (3,444,970 | ) |
|
|
Net Increase | | 198,685 | | | 4,897,835 | |
|
|
Smith Barney Large Capitalization Growth Portfolio | | | | |
Shares sold | | 545,113 | | | 5,848,481 | |
Shares issued on reinvestment | | 104,162 | | | 4,938 | |
Shares reacquired | | (2,349,735 | ) | | (1,924,673 | ) |
|
|
Net Increase (Decrease) | | (1,700,460 | ) | | 3,928,746 | |
|
|
| 5. | Capital Loss Carryforward |
On October 31, 2004, AIM Capital Appreciation Portfolio had a net capital loss carryforward of approximately $64,786,202, of which $27,595,246 expires in 2009, $25,303,918 expires in 2010 and $11,887,038 expires in 2011. Smith Barney Large Capitalization Growth Portfolio had a net capital loss carryforward
30 Travelers Series Fund Inc. | 2005 Semi-Annual Report
Notes to Financial Statements (unaudited) (continued)
of approximately $51,991,108, of which $2,019,427 expires in 2008, $5,453,825 expires in 2009, $30,603,559 expires in 2010, $8,588,495 expires in 2011 and $5,325,802 expires in 2012. This amount will be available to offset like amounts of any future taxable gains.
On May 31, 2005, the U.S. Securities and Exchange Commission (“SEC”) issued an order in connection with the settlement of an administrative proceeding against Smith Barney Fund Management LLC (“SBFM”) and Citigroup Global Markets Inc. (“CGMI”) relating to the appointment of an affiliated transfer agent for the Smith Barney family of mutual funds (the “Funds”).
The SEC order finds that SBFM and CGMI willfully violated Section 206(1) of the Investment Advisers Act of 1940 (“Advisers Act”). Specifically, the order finds that SBFM and CGMI knowingly or recklessly failed to disclose to the boards of the Funds in 1999 when proposing a new transfer agent arrangement with an affiliated transfer agent that: First Data Investors Services Group (“First Data”), the Funds’ then-existing transfer agent, had offered to continue as transfer agent and do the same work for substantially less money than before; and that Citigroup Asset Management (“CAM”), the Citigroup business unit that includes the fund’s investment manager and other investment advisory companies, had entered into a side letter with First Data under which CAM agreed to recommend the appointment of First Data as sub-transfer agent to the affiliated transfer agent in exchange, among other things, for a guarantee by First Data of specified amounts of asset management and investment banking fees to CAM and CGMI. The order also finds that SBFM and CGMI willfully violated Section 206(2) of the Advisers Act by virtue of the omissions discussed above and other misrepresentations and omissions in the materials provided to the Funds’ boards, including the failure to make clear that the affiliated transfer agent would earn a high profit for performing limited functions while First Data continued to perform almost all of the transfer agent functions, and the suggestion that the proposed arrangement was in the Funds’ best interests and that no viable alternatives existed. SBFM and CGMI do not admit or deny any wrongdoing or liability. The settlement does not establish wrongdoing or liability for purposes of any other proceeding.
31 Travelers Series Fund Inc. | 2005 Semi-Annual Report
Notes to Financial Statements (unaudited) (continued)
The SEC censured SBFM and CGMI and ordered them to cease and desist from violations of Sections 206(1) and 206(2) of the Advisers Act. The order requires Citigroup to pay $208.1 million, including $109 million in disgorgement of profits, $19.1 million in interest, and a civil money penalty of $80 million. Approximately $24.4 million has already been paid to the Funds, primarily through fee waivers. The remaining $183.7 million, including the penalty, has been paid to the U.S. Treasury and will be distributed pursuant to a plan to be prepared by Citigroup and submitted within 90 days of the entry of the order for approval by the SEC. The order also requires that transfer agency fees received from the Funds since December 1, 2004 less certain expenses be placed in escrow and provides that a portion of such fees may be subsequently distributed in accordance with the terms of the order.
The order requires SBFM to recommend a new transfer agent contract to the Fund boards within 180 days of the entry of the order; if a Citigroup affiliate submits a proposal to serve as transfer agent or sub-transfer agent, an independent monitor must be engaged at the expense of SBFM and CGMI to oversee a competitive bidding process. Under the order, Citigroup also must comply with an amended version of a vendor policy that Citigroup instituted in August 2004. That policy, as amended, among other things, requires that when requested by a Fund board, CAM will retain at its own expense an independent consulting expert to advise and assist the board on the selection of certain service providers affiliated with Citigroup.
At this time, there is no certainty as to how the proceeds of the settlement will be distributed, to whom such distributions will be made, the methodology by which such distributions will be allocated, and when such distributions will be made. Although there can be no assurance, Citigroup does not believe that this matter will have a material adverse effect on the Funds.
Beginning in June 2004, class action lawsuits alleging violations of the federal securities laws were filed against Citigroup Global Markets Inc. (the “Distributor”) and a number of its affiliates, including Smith Barney Fund Management LLC and Salomon Brothers Asset Management Inc (the “Advisers”), substantially all of the mutual funds managed by the Advisers, including the Funds (the “Funds”), and directors or trustees of the Funds
32 Travelers Series Fund Inc. | 2005 Semi-Annual Report
Notes to Financial Statements (unaudited) (continued)
(collectively, the “Defendants”). The complaints alleged, among other things, that the Distributor created various undisclosed incentives for its brokers to sell Smith Barney and Salomon Brothers funds. In addition, according to the complaints, the Advisers caused the Funds to pay excessive brokerage commissions to the Distributor for steering clients towards proprietary funds. The complaints also alleged that the defendants breached their fiduciary duty to the Funds by improperly charging Rule 12b-1 fees and by drawing on fund assets to make undisclosed payments of soft dollars and excessive brokerage commissions. The complaints also alleged that the Funds failed to adequately disclose certain of the allegedly wrongful conduct. The complaints sought injunctive relief and compensatory and punitive damages, rescission of the Funds’ contracts with the Advisers, recovery of all fees paid to the Advisers pursuant to such contracts and an award of attorneys’ fees and litigation expenses.
On December 15, 2004, a consolidated amended complaint (the “Complaint”) was filed alleging substantially similar causes of action. While the lawsuit is in its earliest stages, to the extent that the Complaint purports to state causes of action against the Funds, Citigroup Asset Management believes the Funds have significant defenses to such allegations, which the Funds intend to vigorously assert in responding to the Complaint.
Additional lawsuits arising out of these circumstances and presenting similar allegations and requests for relief may be filed against the Defendants in the future.
As of the date of this report, Citigroup Asset Management and the Funds believe that the resolution of the pending lawsuit will not have a material effect on the financial position or results of operations of the Funds or the ability of the Advisers and their affiliates to continue to render services to the Funds under their respective contracts.
On January 31, 2005, Citigroup announced that it had reached an agreement with MetLife, Inc. (“MetLife”) to sell Citigroup’s life insurance and annuity businesses (“Travelers Life & Annuity”) to MetLife. As part of this transaction, TIA, currently an indirect wholly owned subsidiary of Citigroup, would become an indirect wholly owned subsidiary of MetLife. TIA is the investment adviser to the AIM Capital Appreciation Portfolio.
33 Travelers Series Fund Inc. | 2005 Semi-Annual Report
Notes to Financial Statements (unaudited) (continued)
The transaction is subject to certain regulatory approvals, as well as other customary conditions to closing. The transaction is scheduled to close on June 30, 2005.
In connection with this transaction, at meetings held on March 24, 2005 and April 20, 2005, the Board of Directors approved a proposal to reorganize the AIM Capital Appreciation Portfolio (the “Acquired Fund”) of Travelers Series Fund Inc., into a newly organized “shell” portfolio (the “ Acquiring Fund”) of The Travelers Series Trust. In connection with the reorganization, the Acquiring Fund would acquire all of the assets and assume the liabilities of the Acquired Fund.
The proposed reorganization is subject to the fulfillment of certain conditions, including approval by the Acquired Fund shareholders. Proxy materials describing the proposed reorganization were mailed on or about June 9, 2005, to the Acquired Fund shareholders of record on April 15, 2005, in anticipation of a meeting of shareholders scheduled to be held on June 29, 2005. If approved by the Acquired Fund shareholders, the reorganization will occur as soon as possible after the shareholder meeting.
On June 24, 2005, Citigroup announced that it has signed a definitive agreement under which Citigroup will sell substantially all of its worldwide asset management business to Legg Mason, Inc. (“Legg Mason”).
As part of this transaction, SBFM (the “Manager”), currently an indirect wholly owned subsidiary of Citigroup, would become an indirect wholly owned subsidiary of Legg Mason. The Manager is the investment manager to SBLCG.
The transaction is subject to certain regulatory approvals, as well as other customary conditions to closing. Subject to such approvals and the satisfaction of the other conditions, Citigroup expects the transaction to be completed later this year.
Under the Investment Company Act of 1940, consummation of the transaction will result in the automatic termination of the investment management contract between SBLCG and the Manager. Therefore, SBLCG’s Board of Directors will be asked to approve a new investment management contract between SBLCG and the Manager. If approved by the Board, the new investment management contract will be presented to the shareholders of SBLCG for their approval.
34 Travelers Series Fund Inc. | 2005 Semi-Annual Report
TRAVELERS SERIES
FUND INC.
| | |
DIRECTORS Robert A. Frankel Michael E. Gellert R. Jay Gerken, CFA Chairman Rainer Greeven Susan M. Heilbron OFFICERS R. Jay Gerken, CFA President and Chief Executive Officer Andrew B. Shoup Senior Vice President and Chief
Administrative Officer James M. Giallanza Chief Financial Officer and Treasurer Alan J. Blake Vice President and Investment Officer Andrew Beagley Chief Anti-Money Laundering Compliance Officer and Chief Compliance Officer Robert I. Frenkel Secretary and Chief Legal Officer | | INVESTMENT MANAGERS Smith Barney Fund
Management LLC Travelers Investment Adviser, Inc. CUSTODIAN State Street Bank and
Trust Company ANNUITY ADMINISTRATION Travelers Annuity Investor Services One Cityplace Hartford, CT 06103-3415 TRANSFER AGENT Citicorp Trust Bank, fsb. 125 Broad Street, 11th Floor New York, New York 10004 SUB-TRANSFER AGENT PFPC Inc. P.O. Box 9699 Providence, Rhode Island 02940-9699 |
Travelers Series Fund Inc.
AIM Capital Appreciation Portfolio
Smith Barney Large Capitalization Growth
Portfolio
The Funds are separate investment funds of the Travelers Series Fund Inc., a Maryland corporation.
The Funds file their complete schedule of portfolio holdings with the Securities and Exchange Commission for the first and third quarters of each fiscal year on Form N-Q. The Funds’ Forms N-Q are available on the Commission’s website at www.sec.gov. The Funds’ Forms N-Q may be reviewed and copied at the Commission’s Public Reference Room in Washington D.C., and information on the operation of the Public Reference Room may be obtained by calling 1-800-SEC-0330. To obtain information on Form N-Q from the Funds, shareholders can call 1-800-451-2010.
Information on how the Funds voted proxies relating to portfolio securities during the 12-month period ended June 30, 2004 and a description of the policies and procedures that the Funds use to determine how to vote proxies relating to portfolio securities is available (1) without charge, upon request, by calling 1-800-451-2010, (2) on the Funds’ website at www.citigroupam.com and (3) on the SEC’s website at www.sec.gov.
This report is submitted for the general information of the shareholders of the Travelers Series Fund Inc. — AIM Capital Appreciation Portfolio and Smith Barney Large Capitalization Growth Portfolio.
TRAVELERS SERIES FUND INC.
125 Broad Street
10th Floor, MF-2
New York, New York 10004
| | | | |
| .ITEM 2. | | CODE OF ETHICS. |
| |
| | | Not Applicable. |
| |
| ITEM 3. | | AUDIT COMMITTEE FINANCIAL EXPERT. |
| |
| | | Not Applicable. |
| |
| ITEM 4. | | PRINCIPAL ACCOUNTANT FEES AND SERVICES. |
| |
| | | Not applicable. |
| |
| ITEM 5. | | AUDIT COMMITTEE OF LISTED REGISTRANTS. |
| |
| | | Not applicable. |
| |
| ITEM 6. | | SCHEDULES OF INVESTMENTS. |
| |
| | | Not applicable. |
| |
| ITEM 7. | | DISCLOSURE OF PROXY VOTING POLICIES AND PROCEDURES FOR CLOSED-END MANAGEMENT INVESTMENT COMPANIES. |
| |
| | | Not applicable. |
| |
| ITEM 8. | | [RESERVED] |
| |
ITEM 9. | | PURCHASES OF EQUITY SECURITIES BY CLOSED-END MANAGEMENT INVESTMENT COMPANY AND AFFILIATED PURCHASERS. |
| |
| | | Not applicable. |
| |
| ITEM 10. | | SUBMISSION OF MATTERS TO A VOTE OF SECURITY HOLDERS. |
| |
| | | Not applicable. |
| |
| ITEM 11. | | CONTROLS AND PROCEDURES. |
| | |
| | | (a) | | The registrant’s principal executive officer and principal financial officer have concluded that the registrant’s disclosure controls and procedures (as defined in Rule 30a-3(c) under the Investment Company Act of 1940, as amended (the “1940 Act”)) are effective as of a date within 90 days of the filing date of this report that includes the disclosure required by this paragraph, based on their evaluation of the disclosure controls and procedures required by Rule 30a-3(b) under the 1940 Act and 15d-15(b) under the Securities Exchange Act of 1934. |
| | |
| | | (b) | | There were no changes in the registrant’s internal control over financial reporting (as defined in Rule 30a-3(d) under the 1940 Act) that occurred during the registrant’s last fiscal half-year (the registrant’s second fiscal half-year in the case of an annual report) that have materially affected, or are likely to materially affect the registrant’s internal control over financial reporting. |
| | | | |
| ITEM 12. | | EXHIBITS. |
| |
| | | (a) Not applicable. |
| |
| | | (b) Attached hereto. |
| | |
| | | Exhibit 99.CERT | | Certifications pursuant to section 302 of the Sarbanes-Oxley Act of 2002 |
| | |
| | | Exhibit 99.906CERT | | Certifications pursuant to Section 906 of the Sarbanes-Oxley Act of 2002 |
SIGNATURES
Pursuant to the requirements of the Securities Exchange Act of 1934 and the Investment Company Act of 1940, the registrant has duly caused this Report to be signed on its behalf by the undersigned, there unto duly authorized.
Travelers Series Fund Inc.
| | |
| By: | | /s/ R. Jay Gerken
|
| | | R. Jay Gerken |
| | | Chief Executive Officer of |
| | | Travelers Series Fund Inc. |
Date: July 8, 2005
Pursuant to the requirements of the Securities Exchange Act of 1934 and the Investment Company Act of 1940, this report has been signed below by the following persons on behalf of the registrant and in the capacities and on the dates indicated.
| | |
| By: | | /s/ R. Jay Gerken
|
| | | R. Jay Gerken |
| | | Chief Executive Officer of |
| | | Travelers Series Fund Inc. |
|
| Date: July 8, 2005 |
| |
| By: | | /s/ James M. Giallanza
|
| | | James M. Giallanza |
| | | Chief Financial Officer of |
| | | Travelers Series Fund Inc. |
Date: July 8, 2005