SEMI-ANNUAL
REPORT
APRIL 30, 2006

Legg Mason Partners Variable Portfolios III, Inc.
Legg Mason Partners Variable Large Cap Value Portfolio
Legg Mason Partners Variable Large Cap Growth Portfolio
Legg Mason Partners Variable Mid Cap Core Portfolio
Legg Mason Partners Variable Aggressive Growth Portfolio
Legg Mason Partners Variable International All Cap Growth Portfolio
INVESTMENT PRODUCTS: NOT FDIC INSURED Ÿ NO BANK GUARANTEE Ÿ MAY LOSE VALUE
Legg Mason Partners Variable Portfolios III, Inc.
Semi-Annual Report • April 30, 2006
What’s
Inside
“Smith Barney”, “Salomon Brothers” and “Citi” are service marks of Citigroup, licensed for use by Legg Mason as the names of funds and investment managers. Legg Mason and its affiliates, as well as the Funds’ investment manager, are not affiliated with Citigroup.
Letter from the Chairman

R. JAY GERKEN, CFA
Chairman, President and Chief Executive Officer
Dear Shareholder,
The U.S. economy was mixed during the six-month reporting period. After a 4.1% advance in the third quarter of 2005, fourth quarter gross domestic product (“GDP”)i growth slipped to 1.7%. This marked the first quarter in which GDP growth did not surpass 3.0% since the first three months of 2003. However, as expected, the economy rebounded sharply in the first quarter of 2006, with GDP rising an estimated 5.3%. The economic turnaround was prompted by both strong consumer and business spending. In addition, the U.S. Labor Department reported that unemployment hit a five-year low in March.
Overseas, economic growth has been improving in many areas. After a lengthy period of weakness and deflation, Japan’s economy has gained momentum due, in part, to strong exports and improving consumer spending. Growth in the Eurozone has also been strengthening on the back of improved domestic spending in countries such as Germany. In addition, interest rates have remained low in the region.
For the six-month period ended April 30, 2006, the U.S. stock market generated strong results, with the S&P 500 Indexii returning 9.63%. While high oil and commodity prices, steadily rising interest rates, and geopolitical issues triggered periods of market volatility, investors generally remained focused on the strong corporate profit environment.
Investment returns were even stronger in the international equity markets. While these markets experienced many of the same issues as the U.S., they rallied on expectations for improving economic growth and solid corporate profits. During the six-month period ended April 30, 2006, the MSCI EAFE Indexiii rose 22.89%. This was surpassed by the emerging equity markets, as the MSCI Emerging Markets Indexiv surged 37.60% over the same period.
Legg Mason Partners Variable Portfolios III, Inc. I
Within this environment, the funds performed as follows:
| | |
| Performance Snapshot as of April 30, 2006 (unaudited) |
| |
| | | 6 months |
| | | |
Variable Large Cap Value Portfolio1 | | 11.37% |
|
S&P 500/Citigroup Value Index | | 13.20% |
|
Lipper Variable Large-Cap Value Funds Category Average | | 10.79% |
|
Variable Large Cap Growth Portfolio1 | | 2.27% |
|
Russell 1000 Growth Index | | 7.06% |
|
Lipper Variable Large-Cap Growth Funds Category Average | | 7.63% |
|
Variable Mid Cap Core Portfolio1 | | 14.63% |
|
S&P MidCap 400 Index | | 15.26% |
|
Lipper Variable Mid-Cap Core Funds Category Average | | 14.35% |
|
Variable Aggressive Growth Portfolio1 | | 10.73% |
|
Russell 3000 Growth Index | | 8.19% |
|
Lipper Variable Multi-Cap Growth Funds Category Average | | 11.97% |
|
Variable International All Cap Growth Portfolio1 | | 23.07% |
|
MSCI EAFE Growth Index | | 22.26% |
|
Lipper Variable International Growth Funds Category Average | | 24.80% |
|
| The performance shown represents past performance. Past performance is no guarantee of future results and current performance may be higher or lower than the performance shown above. Principal value and investment returns will fluctuate and investors’ shares, when redeemed, may be worth more or less than their original cost. |
| Performance figures reflect fee waivers and/or expense reimbursements, without which the performance would have been lower. |
| Fund returns assume the reinvestment of all distributions, including returns of capital, if any, at net asset value and the deduction of all fund expenses. |
| Lipper, Inc. is a major independent mutual-fund tracking organization. Returns are based on the six-month period ended April 30, 2006 and include the reinvestment of distributions, including returns of capital, if any. Returns were calculated among the 97 funds in the variable large-cap value funds category. Returns were calculated among the 195 funds in the variable large-cap growth funds category. Returns were calculated among the 83 funds in the variable mid-cap core funds category. Returns were calculated among the 124 funds in the variable multi-cap growth funds category. Returns were calculated among the 57 funds in the variable international growth funds category. |
| 1 | | The fund is an underlying investment option of various variable annuity and variable life insurance products. The fund’s performance returns do not reflect the deduction of initial sales charges and expenses imposed in connection with investing in variable annuity or variable life insurance contracts, such as administrative fees, account charges, and surrender charges, which, if reflected, would reduce the performance of the fund. Past performance is no guarantee of future results. |
II Legg Mason Partners Variable Portfolios III, Inc.
Legg Mason Partners Variable Large Cap Value Portfolio2
For the six months ended April 30, 2006, the Legg Mason Partners Variable Large Cap Value Portfolio returned 11.37%. The fund outperformed the Lipper Variable Large-Cap Value Funds Category Average,3 which increased 10.79%. The fund’s unmanaged benchmark, the S&P 500/Citigroup Value Index,v returned 13.20% for the same period.
Legg Mason Partners Variable Large Cap Growth Portfolio2
For the six months ended April 30, 2006, the Legg Mason Partners Variable Large Cap Growth Portfolio returned 2.27%. The fund underperformed the Lipper Variable Large-Cap Growth Funds Category Average,4 which increased 7.63%. The fund’s unmanaged benchmark, the Russell 1000 Growth Index,vi returned 7.06% for the same period.
Legg Mason Partners Variable Mid Cap Core Portfolio2
For the six months ended April 30, 2006, the Legg Mason Partners Variable Mid Cap Core Portfolio returned 14.63%. The fund outperformed the Lipper Variable Mid-Cap Core Funds Category Average,5 which increased 14.35%. The fund’s unmanaged benchmark, the S&P 500 MidCap 400 Index,vii returned 15.26% for the same period.
Legg Mason Partners Variable Aggressive Growth Portfolio2
For the six months ended April 30, 2006, the Legg Mason Partners Variable Aggressive Growth Portfolio returned
| 2 | | The fund is an underlying investment option of various variable annuity and variable life insurance products. The fund’s performance returns do not reflect the deduction of initial sales charges and expenses imposed in connection with investing in variable annuity or variable life insurance contracts, such as administrative fees, account charges, and surrender charges, which, if reflected, would reduce the performance of the fund. Past performance is no guarantee of future results. |
| 3 | | Lipper, Inc. is a major independent mutual-fund tracking organization. Returns are based on the six-month period ended April 30, 2006, including the reinvestment of distributions, including returns of capital, if any, calculated among the 97 funds in the fund’s Lipper category. |
| 4 | | Lipper, Inc. is a major independent mutual-fund tracking organization. Returns are based on the six-month period ended April 30, 2006, including the reinvestment of distributions, including returns of capital, if any, calculated among the 195 funds in the fund’s Lipper category. |
| 5 | | Lipper, Inc. is a major independent mutual-fund tracking organization. Returns are based on the six-month period ended April 30, 2006, including the reinvestment of distributions, including returns of capital, if any, calculated among the 83 funds in the fund’s Lipper category. |
Legg Mason Partners Variable Portfolios III, Inc. III
10.73%. The fund outperformed its unmanaged benchmark, the Russell 3000 Growth Index,viii which returned 8.19% for the same period. The Lipper Variable Multi-Cap Growth Funds Category Average6 increased 11.97% over the same time frame.
Legg Mason Partners Variable International All Cap Growth Portfolio7
For the six months ended April 30, 2006, the Legg Mason Partners Variable International All Cap Growth Portfolio, returned 23.07%. These shares outperformed the fund’s unmanaged benchmark, the MSCI EAFE Growth Indexix, which returned 22.26% for the same period. The Lipper Variable International Growth Funds Category Average8 increased 24.80% over the same time frame.
Special Shareholder Notices
On December 1, 2005, Citigroup Inc. (“Citigroup”) completed the sale of substantially all of its asset management business to Legg Mason, Inc. (“Legg Mason”). As a result, the funds’ investment adviser (the “Manager”), previously an indirect wholly-owned subsidiary of Citigroup, has become a wholly-owned subsidiary of Legg Mason. Completion of the sale caused the funds’ then existing investment management contract to terminate. The funds’ shareholders previously approved a new investment management contract between the funds and the Manager, which became effective on December 1, 2005.
Prior to May 1, 2006, the funds were knows as Travelers Series Fund Inc. Smith Barney Large Cap Value Portfolio, Smith Barney Large Capitalization Growth Portfolio, Smith Barney Mid Cap Core Portfolio, Smith Barney Aggressive Growth Portfolio and Smith Barney International All Cap Growth Portfolio. The funds’ investment strategy and objective have not changed.
| 6 | | Lipper, Inc. is a major independent mutual-fund tracking organization. Returns are based on the six-month period ended April 30, 2006, including the reinvestment of distributions, including returns of capital, if any, calculated among the 124 funds in the fund’s Lipper category. |
| 7 | | The fund is an underlying investment option of various variable annuity and variable life insurance products. The fund’s performance returns do not reflect the deduction of initial sales charges and expenses imposed in connection with investing in variable annuity or variable life insurance contracts, such as administrative fees, account charges, and surrender charges, which, if reflected, would reduce the performance of the fund. Past performance is no guarantee of future results. |
| 8 | | Lipper, Inc. is a major independent mutual-fund tracking organization. Returns are based on the six-month period ended April 30, 2006, including the reinvestment of distributions, including returns of capital, if any, calculated among the 57 funds in the fund’s Lipper category. |
IV Legg Mason Partners Variable Portfolios III, Inc.
Information About Your Funds
As you may be aware, several issues in the mutual fund industry have come under the scrutiny of federal and state regulators. The funds’ Manager and some of its affiliates have received requests for information from various government regulators regarding market timing, late trading, fees, and other mutual fund issues in connection with various investigations. The regulators appear to be examining, among other things, the funds’ response to market timing and shareholder exchange activity, including compliance with prospectus disclosure related to these subjects. The funds have been informed that the Manager and its affiliates are responding to those information requests, but are not in a position to predict the outcome of these requests and investigations.
Important information concerning the funds and their Manager with regard to recent regulatory developments is contained in the Notes to Financial Statements included in this report.
As always, thank you for your continued confidence in our stewardship of your assets. We look forward to helping you continue to meet your financial goals.
Sincerely,

R. Jay Gerken, CFA
Chairman, President and Chief Executive Officer
May 25, 2006
Legg Mason Partners Variable Portfolios III, Inc. V
The information provided is not intended to be a forecast of future events, a guarantee of future results or investment advice. Views expressed may differ from those of the firm as a whole.
Legg Mason Partners Variable Large Cap Value Portfolio
RISKS: Keep in mind, common stocks are subject to market fluctuations. Foreign stocks are subject to certain risks of overseas investing, including currency fluctuations and changes in political and economic conditions, which could result in significant market fluctuations. The fund may use derivatives, such as options and futures, which can be illiquid, may disproportionately increase losses, and have a potentially large impact on fund performance. Please see the fund’s prospectus for more information on these and other risks.
Legg Mason Partners Variable Large Cap Growth Portfolio
RISKS: Keep in mind, common stocks are subject to market fluctuations. Please see the fund’s prospectus for more information on these and other risks.
Legg Mason Partners Variable Mid Cap Core Portfolio
RISKS: Mid-cap stocks may be more volatile than large-cap stocks. Additionally, the fund’s performance may be influenced by political, social and economic factors affecting investments in companies in foreign countries. The fund may use derivatives, such as options and futures, which can be illiquid, may disproportionately increase losses, and have a potentially large impact on fund performance. Please see the fund’s prospectus for more information on these and other risks.
Legg Mason Partners Variable Aggressive Growth Portfolio
RISKS: The fund may invest a significant portion of its assets in small- and mid-cap companies which may be more volatile than an investment that focuses only on large-cap companies. Please see the fund’s prospectus for more information on these and other risks.
Legg Mason Partners Variable International All Cap Growth Portfolio
RISKS: Keep in mind, the fund is subject to certain risks of overseas investing, not associated with domestic investing, including currency fluctuations, change in political and economic conditions, differing securities regulations and periods of illiquidity, which could result in significant market fluctuations. These risks are magnified in emerging markets. The fund may use derivatives, such as options and futures, which can be illiquid, may disproportionately increase losses, and have a potentially large impact on fund performance. Please see the fund’s prospectus for more information on these and other risks.
All index performance reflects no deduction for fees, expenses or taxes. Please note that an investor cannot invest directly in an index.
| i | | Gross domestic product is a market value of goods and services produced by labor and property in a given country. |
| ii | | The S&P 500 Index is an unmanaged index of 500 stocks that is generally representative of the performance of larger companies in the U.S. |
| iii | | The MSCI EAFE Index is an unmanaged index of common stocks of companies located in Europe, Australasia and the Far East. |
| iv | | The MSCI Emerging Markets Index consists of emerging market companies with an average size of $800 million. The index measures the performance of emerging markets in South America, South Africa, Asia and Eastern Europe. |
| v | | The S&P 500/Citigroup Value Index is an index of stocks representing approximately half of the market capitalization of the stocks in the S&P 500 Index that, on a growth-value spectrum, have been identified as falling either wholly or partially within the value half of the spectrum based on a number of factors. Until December 16, 2005, when Standard & Poor’s changed both the name of the index and its calculation methodology, the index was called the S&P 500/BARRA Value Index. |
| vi | | The Russell 1000 Growth Index measures the performance of those Russell 1000 companies with higher price-to-book ratios and higher forecasted growth values. |
| vii | | The S&P MidCap 400 Index is a market-value weighted index which consists of 400 domestic stocks chosen for market size, liquidity, and industry group representation. |
| viii | | The Russell 3000 Growth Index measures the performance of those Russell 3000 Index companies with higher price-to-book ratios and higher forecasted growth values. |
| ix | | The MSCI EAFE Growth Index is an unmanaged index of growth stocks of companies located in Europe, Australasia and the Far East. |
VI Legg Mason Partners Variable Portfolios III, Inc.
Fund at a Glance (unaudited)
Legg Mason Partners Variable Large Cap Value Portfolio
Legg Mason Partners Variable Portfolios III, Inc. 2006 Semi-Annual Report 1
Fund at a Glance (unaudited)
Legg Mason Partners Variable Large Cap Growth Portfolio
2 Legg Mason Partners Variable Portfolios III, Inc. 2006 Semi-Annual Report
Fund at a Glance (unaudited)
Legg Mason Partners Variable Mid Cap Core Portfolio
Legg Mason Partners Variable Portfolios III, Inc. 2006 Semi-Annual Report 3
Fund at a Glance (unaudited)
Legg Mason Partners Variable Aggressive Growth Portfolio

4 Legg Mason Partners Variable Portfolios III, Inc. 2006 Semi-Annual Report
Fund at a Glance (unaudited)
Legg Mason Partners Variable International All Cap Growth Portfolio
Legg Mason Partners Variable Portfolios III, Inc. 2006 Semi-Annual Report 5
Fund Expenses (unaudited)
As a shareholder of the Funds, you may incur two types of costs: (1) transaction costs and (2) ongoing costs, including management fees and other Fund expenses. This example is intended to help you understand your ongoing costs (in dollars) of investing in the Fund and to compare these costs with the ongoing costs of investing in other mutual funds.
This example is based on an investment of $1,000 invested on November 1, 2005 and held for the six months ended April 30, 2006.
Actual Expenses
The table below titled “Based on Actual Total Return” provides information about actual account values and actual expenses. You may use the information provided in this table, together with the amount you invested, to estimate the expenses that you paid over the period. To estimate the expenses you paid on your account, divide your ending account value by $1,000 (for example, an $8,600 ending account value divided by $1,000 = 8.6), then multiply the result by the number under the heading entitled “Expenses Paid During the Period”.
| | | | | | | | | | | | | | | |
| Based on Actual Total Return(1) | | | | | | | | | | | | | |
| | | | | |
| | | Actual Total
Return(2) | | | Beginning
Account
Value | | Ending
Account
Value | | Annualized
Expense
Ratio | | | Expenses
Paid During
the Period(3) |
Legg Mason Partners Variable Large Cap Value Portfolio | | 11.37 | % | | $ | 1,000.00 | | $ | 1,113.70 | | 0.63 | % | | $ | 3.30 |
|
Legg Mason Partners Variable Large Cap Growth Portfolio | | 2.27 | | | | 1,000.00 | | | 1,022.70 | | 0.78 | | | | 3.91 |
|
Legg Mason Partners Variable Mid Cap Core Portfolio | | 14.63 | | | | 1,000.00 | | | 1,146.30 | | 0.81 | | | | 4.31 |
|
Legg Mason Partners Variable Aggressive Growth Portfolio | | 10.73 | | | | 1,000.00 | | | 1,107.30 | | 0.76 | | | | 3.97 |
|
Legg Mason Partners Variable International All Cap Growth Portfolio | | 23.07 | | | | 1,000.00 | | | 1,230.70 | | 0.96 | | | | 5.31 |
|
| (1) | | For the six months ended April 30, 2006. |
| (2) | | Assumes reinvestment of all distributions, including returns of capital, if any, at net asset value. Total return is not annualized, as it may not be representative of the total return for the year. Total returns do not reflect expenses associated with the separate account such as administrative fees, account charges and surrender charges which, if reflected, would reduce the total returns. Performance figures may reflect voluntary fee waivers and/or expense reimbursements. Past performance is no guarantee of future results. In the absence of voluntary fee waivers and/or expense reimbursements, the total return would have been lower. |
| (3) | | Expenses (net of voluntary fee waivers and/or expense reimbursements) are equal to each Fund’s respective annualized expense ratio multiplied by the average account value over the period, multiplied by the number of days in the most recent fiscal half-year, then divided by 365. |
6 Legg Mason Partners Variable Portfolios III, Inc. 2006 Semi-Annual Report
Fund Expenses (unaudited) (continued)
Hypothetical Example for Comparison Purposes
The table below titled “Based on Hypothetical Total Return” provides information about hypothetical account values and hypothetical expenses based on the actual expense ratio and an assumed rate of return of 5.00% per year before expenses, which is not the Fund’s actual return. The hypothetical account values and expenses may not be used to estimate the actual ending account balance or expenses you paid for the period. You may use the information provided in this table to compare the ongoing costs of investing in the Fund and other funds. To do so, compare the 5.00% hypothetical example relating to the Fund with the 5.00% hypothetical examples that appear in the shareholder reports of the other funds.
Please note that the expenses shown in the table below are meant to highlight your ongoing costs only and do not reflect any transactional costs. Therefore, the table is useful in comparing ongoing costs only, and will not help you determine the relative total costs of owning different funds. In addition, if these transaction costs were included, your costs would have been higher.
| | | | | | | | | | | | | | | |
| Based on Hypothetical Total Return(1) |
| | | | | |
| | | Hypothetical
Annualized
Total Return | | | Beginning
Account
Value | | Ending
Account
Value | | Annualized
Expense
Ratio | | | Expenses
Paid During
the Period(2) |
Legg Mason Partners Variable Large Cap Value Portfolio | | 5.00 | % | | $ | 1,000.00 | | $ | 1,021.67 | | 0.63 | % | | $ | 3.16 |
|
Legg Mason Partners Variable Large Cap Growth Portfolio | | 5.00 | | | | 1,000.00 | | | 1,020.93 | | 0.78 | | | | 3.91 |
|
Legg Mason Partners Variable Mid Cap Core Portfolio | | 5.00 | | | | 1,000.00 | | | 1,020.78 | | 0.81 | | | | 4.06 |
|
Legg Mason Partners Variable Aggressive Growth Portfolio | | 5.00 | | | | 1,000.00 | | | 1,021.03 | | 0.76 | | | | 3.81 |
|
Legg Mason Partners Variable International All Cap Growth Portfolio | | 5.00 | | | | 1,000.00 | | | 1,020.03 | | 0.96 | | | | 4.81 |
|
| (1) | | For the six months ended April 30, 2006. |
| (2) | | Expenses (net of voluntary fee waivers and/or expense reimbursements) are equal to each Fund’s respective annualized expense ratio, multiplied by the average account value over the period, multiplied by the number of days in the most recent fiscal half-year, then divided by 365. |
Legg Mason Partners Variable Portfolios III, Inc. 2006 Semi-Annual Report 7
Schedules of Investments (April 30, 2006) (unaudited)
LEGG MASON PARTNERS VARIABLE LARGE CAP VALUE PORTFOLIO
| | | | | |
| | |
| Shares | | Security | | Value |
| COMMON STOCKS — 96.4% | | | |
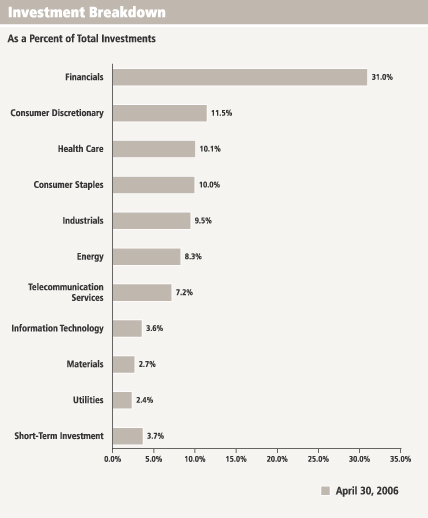
| CONSUMER DISCRETIONARY — 11.5% | | | |
| Hotels, Restaurants & Leisure — 1.8% | | | |
| 158,500 | | McDonald’s Corp. | | $ | 5,479,345 |
|
| Household Durables — 1.2% | | | |
| 132,800 | | Newell Rubbermaid Inc. | | | 3,641,376 |
|
| Media — 7.6% | | | |
| 102,400 | | EchoStar Communications Corp., Class A Shares* | | | 3,164,160 |
| 3,607 | | Interpublic Group of Cos. Inc.* | | | 34,555 |
| 43,100 | | Liberty Global Inc., Series A Shares* | | | 892,601 |
| 22,300 | | Liberty Global Inc., Series C Shares* | | | 445,331 |
| 402,100 | | Liberty Media Corp., Class A Shares* | | | 3,357,535 |
| 458,100 | | News Corp., Class B Shares | | | 8,351,163 |
| 111,500 | | SES Global SA, FDR | | | 1,828,370 |
| 288,600 | | Time Warner Inc. | | | 5,021,640 |
|
| | | Total Media | | | 23,095,355 |
|
| Multiline Retail — 0.9% | | | |
| 51,700 | | Target Corp. | | | 2,745,270 |
|
| | | TOTAL CONSUMER DISCRETIONARY | | | 34,961,346 |
|
| CONSUMER STAPLES — 10.0% | | | |
| Food & Staples Retailing — 4.3% | | | |
| 401,900 | | Kroger Co.* | | | 8,142,494 |
| 113,700 | | Wal-Mart Stores Inc. | | | 5,119,911 |
|
| | | Total Food & Staples Retailing | | | 13,262,405 |
|
| Food Products — 1.0% | | | |
| 163,000 | | Sara Lee Corp. | | | 2,912,810 |
|
| Household Products — 1.5% | | | |
| 80,500 | | Kimberly-Clark Corp. | | | 4,711,665 |
|
| Tobacco — 3.2% | | | |
| 132,500 | | Altria Group Inc. | | | 9,693,700 |
|
| | | TOTAL CONSUMER STAPLES | | | 30,580,580 |
|
| ENERGY — 8.3% | | | |
| Energy Equipment & Services — 2.5% | | | |
| 82,300 | | GlobalSantaFe Corp. | | | 5,037,583 |
| 32,600 | | Halliburton Co. | | | 2,547,690 |
|
| | | Total Energy Equipment & Services | | | 7,585,273 |
|
| Oil, Gas & Consumable Fuels — 5.8% | | | |
| 36,700 | | Marathon Oil Corp. | | | 2,912,512 |
| 50,200 | | Royal Dutch Shell PLC, ADR, Class A Shares | | | 3,420,126 |
| 46,300 | | Suncor Energy Inc. | | | 3,969,762 |
| 53,100 | | Total SA, Sponsored ADR | | | 7,328,862 |
|
| | | Total Oil, Gas & Consumable Fuels | | | 17,631,262 |
|
| | | TOTAL ENERGY | | | 25,216,535 |
See Notes to Financial Statements.
8 Legg Mason Partners Variable Portfolios III, Inc. 2006 Semi-Annual Report
Schedules of Investments (April 30, 2006) (unaudited) (continued)
| | | | | |
| | |
| Shares | | Security | | Value |
| FINANCIALS — 31.0% | | | |
| Capital Markets — 5.2% | | | |
| 85,600 | | Bank of New York Co. Inc. | | $ | 3,008,840 |
| 31,100 | | Goldman Sachs Group Inc. | | | 4,985,019 |
| 105,300 | | Merrill Lynch & Co. Inc. | | | 8,030,178 |
|
| | | Total Capital Markets | | | 16,024,037 |
|
| Commercial Banks — 7.1% | | | |
| 181,600 | | Bank of America Corp. | | | 9,065,472 |
| 90,400 | | Wachovia Corp. | | | 5,410,440 |
| 102,900 | | Wells Fargo & Co. | | | 7,068,201 |
|
| | | Total Commercial Banks | | | 21,544,113 |
|
| Consumer Finance — 4.4% | | | |
| 114,900 | | American Express Co. | | | 6,182,769 |
| 82,800 | | Capital One Financial Corp. | | | 7,173,792 |
|
| | | Total Consumer Finance | | | 13,356,561 |
|
| Diversified Financial Services — 2.3% | | | |
| 154,500 | | JPMorgan Chase & Co. | | | 7,011,210 |
|
| Insurance — 8.8% | | | |
| 77,400 | | AFLAC Inc. | | | 3,679,596 |
| 105,700 | | American International Group Inc. | | | 6,896,925 |
| 94,600 | | Chubb Corp. | | | 4,875,684 |
| 54,800 | | Loews Corp. | | | 5,817,020 |
| 52,300 | | Marsh & McLennan Cos. Inc. | | | 1,604,041 |
| 92,800 | | St. Paul Travelers Cos. Inc. | | | 4,085,984 |
|
| | | Total Insurance | | | 26,959,250 |
|
| Thrifts & Mortgage Finance — 3.2% | | | |
| 70,900 | | Freddie Mac | | | 4,329,154 |
| 75,140 | | Golden West Financial Corp. | | | 5,400,312 |
|
| | | Total Thrifts & Mortgage Finance | | | 9,729,466 |
|
| | | TOTAL FINANCIALS | | | 94,624,637 |
|
| HEALTH CARE — 10.1% | | | |
| Health Care Providers & Services — 3.1% | | | |
| 95,100 | | UnitedHealth Group Inc. | | | 4,730,274 |
| 68,900 | | WellPoint Inc.* | | | 4,891,900 |
|
| | | Total Health Care Providers & Services | | | 9,622,174 |
|
| Pharmaceuticals — 7.0% | | | |
| 91,500 | | Abbott Laboratories | | | 3,910,710 |
| 55,700 | | Johnson & Johnson | | | 3,264,577 |
| 83,000 | | Novartis AG, Sponsored ADR | | | 4,773,330 |
| 184,200 | | Pfizer Inc. | | | 4,665,786 |
| 100,300 | | Sanofi-Aventis, ADR | | | 4,718,112 |
|
| | | Total Pharmaceuticals | | | 21,332,515 |
|
| | | TOTAL HEALTH CARE | | | 30,954,689 |
See Notes to Financial Statements.
Legg Mason Partners Variable Portfolios III, Inc. 2006 Semi-Annual Report 9
Schedules of Investments (April 30, 2006) (unaudited) (continued)
| | | | | |
| | |
| Shares | | Security | | Value |
| INDUSTRIALS — 9.6% | | | |
| Aerospace & Defense — 4.6% | | | |
| 71,900 | | Boeing Co. | | $ | 6,000,055 |
| 68,200 | | Raytheon Co. | | | 3,019,214 |
| 77,900 | | United Technologies Corp. | | | 4,892,899 |
|
| | | Total Aerospace & Defense | | | 13,912,168 |
|
| Building Products — 1.1% | | | |
| 102,400 | | Masco Corp. | | | 3,266,560 |
|
| Commercial Services & Supplies — 1.2% | | | |
| 59,400 | | Avery Dennison Corp. | | | 3,712,500 |
|
| Industrial Conglomerates — 1.7% | | | |
| 57,600 | | Textron Inc. | | | 5,181,120 |
|
| Machinery — 1.0% | | | |
| 38,100 | | Parker Hannifin Corp. | | | 3,088,005 |
|
| | | TOTAL INDUSTRIALS | | | 29,160,353 |
|
| INFORMATION TECHNOLOGY — 3.6% | | | |
| Communications Equipment — 1.7% | | | |
| 225,400 | | Nokia Oyj, Sponsored ADR | | | 5,107,564 |
|
| Computers & Peripherals — 1.0% | | | |
| 36,500 | | International Business Machines Corp. | | | 3,005,410 |
|
| Software — 0.9% | | | |
| 115,100 | | Microsoft Corp. | | | 2,779,665 |
|
| | | TOTAL INFORMATION TECHNOLOGY | | | 10,892,639 |
|
| MATERIALS — 2.7% | | | |
| Chemicals — 2.7% | | | |
| 46,600 | | Air Products & Chemicals Inc. | | | 3,193,032 |
| 113,700 | | E.I. du Pont de Nemours & Co. | | | 5,014,170 |
|
| | | TOTAL MATERIALS | | | 8,207,202 |
|
| TELECOMMUNICATION SERVICES — 7.2% | | | |
| Diversified Telecommunication Services — 2.1% | | | |
| 244,037 | | AT&T Inc. | | | 6,396,210 |
|
| Wireless Telecommunication Services — 5.1% | | | |
| 92,200 | | ALLTEL Corp. | | | 5,934,914 |
| 387,002 | | Sprint Nextel Corp. | | | 9,597,649 |
|
| | | Total Wireless Telecommunication Services | | | 15,532,563 |
|
| | | TOTAL TELECOMMUNICATION SERVICES | | | 21,928,773 |
|
| UTILITIES — 2.4% | | | |
| Multi-Utilities — 2.4% | | | |
| 157,300 | | Sempra Energy | | | 7,238,946 |
|
| | | TOTAL INVESTMENTS BEFORE SHORT-TERM INVESTMENT
(Cost — $235,068,659) | | | 293,765,700 |
See Notes to Financial Statements.
10 Legg Mason Partners Variable Portfolios III, Inc. 2006 Semi-Annual Report
Schedules of Investments (April 30, 2006) (unaudited) (continued)
| | | | | | | |
| | |
Face Amount | | Security | | Value | |
| | SHORT-TERM INVESTMENT — 3.7% | | | | |
| | Repurchase Agreement — 3.7% | | | | |
| $ | 11,259,000 | | Interest in $513,793,000 joint tri-party repurchase agreement dated 4/28/06 with Merrill Lynch, Pierce, Fenner & Smith, Inc., 4.790% due 5/1/06; Proceeds at maturity — $11,263,494; (Fully collateralized by U.S. Treasury obligations, 0.000% to 2.375% due 4/30/06 to 4/15/11; Market value — $11,484,251) (Cost — $11,259,000) | | $ | 11,259,000 | |
|
|
|
| | | | TOTAL INVESTMENTS — 100.1% (Cost — $246,327,659#) | | | 305,024,700 | |
| | | | Liabilities in Excess of Other Assets — (0.1)% | | | (260,076 | ) |
|
|
|
| | | | TOTAL NET ASSETS — 100.0% | | $ | 304,764,624 | |
|
|
|
| * | | Non-income producing security. |
| # | | Aggregate cost for federal income tax purposes is substantially the same. |
| | |
Abbreviations used in this schedule:
|
| ADR | | — American Depositary Receipt |
| FDR | | — Foreign Depositary Receipt |
See Notes to Financial Statements.
Legg Mason Partners Variable Portfolios III, Inc. 2006 Semi-Annual Report 11
Schedules of Investments (April 30, 2006) (unaudited) (continued)
LEGG MASON PARTNERS VARIABLE LARGE CAP GROWTH PORTFOLIO
| | | | | |
| | |
| Shares | | Security | | Value |
| COMMON STOCKS — 100.1% | | | |
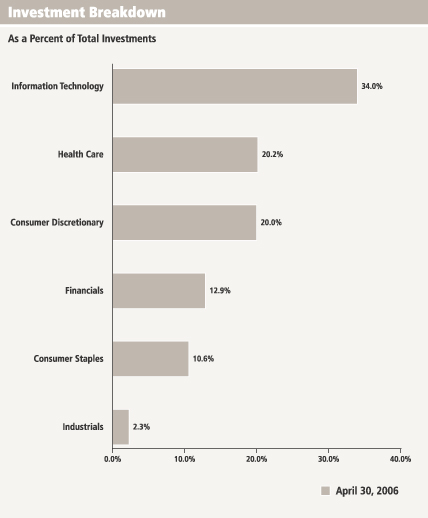
| CONSUMER DISCRETIONARY — 20.0% | | | |
| Internet & Catalog Retail — 10.1% | | | |
| 474,000 | | Amazon.com Inc.* | | $ | 16,689,540 |
| 296,100 | | eBay Inc.* | | | 10,188,801 |
| 295,000 | | IAC/InterActiveCorp.* | | | 8,516,650 |
|
| | | Total Internet & Catalog Retail | | | 35,394,991 |
|
| Media — 5.2% | | | |
| 589,320 | | Time Warner Inc. | | | 10,254,168 |
| 291,915 | | Walt Disney Co. | | | 8,161,943 |
|
| | | Total Media | | | 18,416,111 |
|
| Specialty Retail — 4.7% | | | |
| 134,600 | | Bed Bath & Beyond Inc.* | | | 5,161,910 |
| 288,450 | | Home Depot Inc. | | | 11,517,809 |
|
| | | Total Specialty Retail | | | 16,679,719 |
|
| | | TOTAL CONSUMER DISCRETIONARY | | | 70,490,821 |
|
| CONSUMER STAPLES — 10.6% | | | |
| Beverages — 4.6% | | | |
| 194,490 | | Coca-Cola Co. | | | 8,160,800 |
| 135,700 | | PepsiCo Inc. | | | 7,903,168 |
|
| | | Total Beverages | | | 16,063,968 |
|
| Food Products — 2.4% | | | |
| 144,540 | | Wm. Wrigley Jr. Co. | | | 6,803,498 |
| 36,335 | | Wm. Wrigley Jr. Co., Class B | | | 1,711,378 |
|
| | | Total Food Products | | | 8,514,876 |
|
| Household Products — 3.6% | | | |
| 218,355 | | Procter & Gamble Co. | | | 12,710,445 |
|
| | | TOTAL CONSUMER STAPLES | | | 37,289,289 |
|
| FINANCIALS — 12.9% | | | |
| Capital Markets — 7.2% | | | |
| 194,430 | | Merrill Lynch & Co. Inc. | | | 14,827,232 |
| 164,970 | | Morgan Stanley | | | 10,607,571 |
|
| | | Total Capital Markets | | | 25,434,803 |
|
| Insurance — 5.7% | | | |
| 141,556 | | American International Group Inc. | | | 9,236,529 |
| 119 | | Berkshire Hathaway Inc., Class A Shares* | | | 10,591,000 |
|
| | | Total Insurance | | | 19,827,529 |
|
| | | TOTAL FINANCIALS | | | 45,262,332 |
See Notes to Financial Statements.
12 Legg Mason Partners Variable Portfolios III, Inc. 2006 Semi-Annual Report
Schedules of Investments (April 30, 2006) (unaudited) (continued)
| | | | | | |
| Shares | | Security | | Value | |
| HEALTH CARE — 20.2% | | | | |
| Biotechnology — 13.4% | | | | |
| 260,580 | | Amgen Inc.* | | $ | 17,641,266 | |
| 237,150 | | Biogen Idec Inc.* | | | 10,636,178 | |
| 236,800 | | Genentech Inc.* | | | 18,875,328 | |
|
|
| | | Total Biotechnology | | | 47,152,772 | |
|
|
| Pharmaceuticals — 6.8% | | | | |
| 94,050 | | Eli Lilly & Co. | | | 4,977,126 | |
| 131,870 | | Johnson & Johnson | | | 7,728,901 | |
| 444,470 | | Pfizer Inc. | | | 11,258,425 | |
|
|
| | | Total Pharmaceuticals | | | 23,964,452 | |
|
|
| | | TOTAL HEALTH CARE | | | 71,117,224 | |
|
|
| INDUSTRIALS — 2.3% | | | | |
| Industrial Conglomerates — 2.3% | | | | |
| 235,220 | | General Electric Co. | | | 8,136,260 | |
|
|
| INFORMATION TECHNOLOGY — 34.1% | | | | |
| Communications Equipment — 11.3% | | | | |
| 412,908 | | Cisco Systems Inc.* | | | 8,650,422 | |
| 423,100 | | Juniper Networks Inc.* | | | 7,818,888 | |
| 592,680 | | Motorola Inc. | | | 12,653,718 | |
| 207,400 | | QUALCOMM Inc. | | | 10,647,916 | |
|
|
| | | Total Communications Equipment | | | 39,770,944 | |
|
|
| Computers & Peripherals — 2.3% | | | | |
| 131,900 | | Dell Inc.* | | | 3,455,780 | |
| 346,900 | | EMC Corp.* | | | 4,686,619 | |
|
|
| | | Total Computers & Peripherals | | | 8,142,399 | |
|
|
| Internet Software & Services — 5.6% | | | | |
| 259,700 | | Akamai Technologies Inc.* | | | 8,749,293 | |
| 336,300 | | Yahoo! Inc.* | | | 11,023,914 | |
|
|
| | | Total Internet Software & Services | | | 19,773,207 | |
|
|
| Semiconductors & Semiconductor Equipment — 7.0% | | | | |
| 406,400 | | Intel Corp. | | | 8,119,872 | |
| 474,080 | | Texas Instruments Inc. | | | 16,455,317 | |
|
|
| | | Total Semiconductors & Semiconductor Equipment | | | 24,575,189 | |
|
|
| Software — 7.9% | | | | |
| 205,200 | | Electronic Arts Inc.* | | | 11,655,360 | |
| 299,600 | | Microsoft Corp. | | | 7,235,340 | |
| 294,600 | | Red Hat Inc.* | | | 8,658,294 | |
|
|
| | | Total Software | | | 27,548,994 | |
|
|
| | | TOTAL INFORMATION TECHNOLOGY | | | 119,810,733 | |
|
|
| | | TOTAL INVESTMENTS — 100.1% (Cost — $263,372,939#) | | | 352,106,659 | |
| | | Liabilities in Excess of Other Assets — (0.1)% | | | (369,965 | ) |
|
|
| | | TOTAL NET ASSETS — 100.0% | | $ | 351,736,694 | |
|
|
| * | | Non-income producing security. |
| # | | Aggregate cost for federal income tax purposes is substantially the same. |
See Notes to Financial Statements.
Legg Mason Partners Variable Portfolios III, Inc. 2006 Semi-Annual Report 13
Schedules of Investments (April 30, 2006) (unaudited) (continued)
LEGG MASON PARTNERS VARIABLE MID CAP CORE PORTFOLIO
| | | | | |
| | |
| Shares | | Security | | Value |
| COMMON STOCKS — 96.7% | | | |
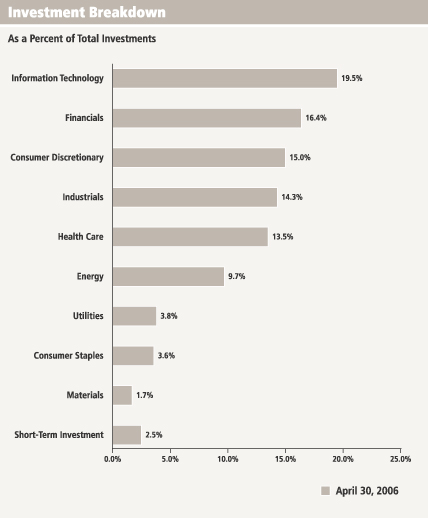
| CONSUMER DISCRETIONARY — 14.9% | | | |
| Diversified Consumer Services — 2.1% | | | |
| 227,300 | | ServiceMaster Co. | | $ | 2,736,692 |
|
| Hotels, Restaurants & Leisure — 2.9% | | | |
| 59,400 | | CBRL Group Inc. | | | 2,418,174 |
| 39,600 | | GTECH Holdings Corp. | | | 1,352,736 |
|
| | | Total Hotels, Restaurants & Leisure | | | 3,770,910 |
|
| Household Durables — 3.9% | | | |
| 24,570 | | Black & Decker Corp. | | | 2,299,998 |
| 26,390 | | Mohawk Industries Inc.* | | | 2,113,839 |
| 20,000 | | Toll Brothers Inc.* | | | 643,000 |
|
| | | Total Household Durables | | | 5,056,837 |
|
| Multiline Retail — 2.0% | | | |
| 146,400 | | Dollar General Corp. | | | 2,556,144 |
|
| Specialty Retail — 4.0% | | | |
| 63,050 | | Bed Bath & Beyond Inc.* | | | 2,417,967 |
| 56,200 | | Sherwin-Williams Co. | | | 2,862,828 |
|
| | | Total Specialty Retail | | | 5,280,795 |
|
| | | TOTAL CONSUMER DISCRETIONARY | | | 19,401,378 |
|
| CONSUMER STAPLES — 3.5% | | | |
| Beverages — 1.8% | | | |
| 31,500 | | Molson Coors Brewing Co., Class B Shares | | | 2,326,590 |
|
| Food Products — 1.7% | | | |
| 67,570 | | Hormel Foods Corp. | | | 2,267,649 |
|
| | | TOTAL CONSUMER STAPLES | | | 4,594,239 |
|
| ENERGY — 9.7% | | | |
| Energy Equipment & Services — 5.0% | | | |
| 36,690 | | Nabors Industries Ltd.* | | | 1,369,638 |
| 40,640 | | Smith International Inc. | | | 1,716,227 |
| 63,650 | | Weatherford International Ltd.* | | | 3,368,994 |
|
| | | Total Energy Equipment & Services | | | 6,454,859 |
|
| Oil, Gas & Consumable Fuels — 4.7% | | | |
| 28,990 | | Murphy Oil Corp. | | | 1,454,718 |
| 39,210 | | Newfield Exploration Co.* | | | 1,748,766 |
| 26,460 | | Nexen Inc. | | | 1,547,910 |
| 31,500 | | Pioneer Natural Resources Co. | | | 1,348,830 |
|
| | | Total Oil, Gas & Consumable Fuels | | | 6,100,224 |
|
| | | TOTAL ENERGY | | | 12,555,083 |
See Notes to Financial Statements.
14 Legg Mason Partners Variable Portfolios III, Inc. 2006 Semi-Annual Report
Schedules of Investments (April 30, 2006) (unaudited) (continued)
| | | | | |
| | |
| Shares | | Security | | Value |
| FINANCIALS — 16.2% | | | |
| Capital Markets — 1.0% | | | |
| 8,985 | | Bear Stearns Cos. Inc. | | $ | 1,280,452 |
|
| Commercial Banks — 1.7% | | | |
| 42,700 | | Associated Banc-Corp. | | | 1,444,114 |
| 12,620 | | Comerica Inc. | | | 717,700 |
|
| | | Total Commercial Banks | | | 2,161,814 |
|
| Consumer Finance — 0.6% | | | |
| 19,300 | | Nelnet Inc., Class A Shares* | | | 750,770 |
|
| Insurance — 5.7% | | | |
| 8,820 | | Ambac Financial Group Inc. | | | 726,415 |
| 16,500 | | Fidelity National Financial Inc. | | | 692,670 |
| 34,590 | | National Financial Partners Corp. | | | 1,798,680 |
| 99,250 | | Old Republic International Corp. | | | 2,208,312 |
| 32,790 | | PartnerRe Ltd. | | | 2,051,015 |
|
| | | Total Insurance | | | 7,477,092 |
|
| Real Estate Investment Trusts (REITs) — 1.2% | | | |
| 138,005 | | Spirit Finance Corp. | | | 1,600,858 |
|
| Thrifts & Mortgage Finance — 6.0% | | | |
| 145,885 | | Hudson City Bancorp Inc. | | | 1,956,318 |
| 19,100 | | MGIC Investment Corp. | | | 1,350,370 |
| 142,700 | | New York Community Bancorp Inc. | | | 2,455,867 |
| 44,900 | | PMI Group Inc. | | | 2,072,135 |
|
| | | Total Thrifts & Mortgage Finance | | | 7,834,690 |
|
| | | TOTAL FINANCIALS | | | 21,105,676 |
|
| HEALTH CARE — 13.4% | | | |
| Biotechnology — 2.2% | | | |
| 77,900 | | ImClone Systems Inc.* | | | 2,812,190 |
|
| Health Care Equipment & Supplies — 4.2% | | | |
| 53,850 | | Cytyc Corp.* | | | 1,392,023 |
| 31,855 | | Fisher Scientific International Inc.* | | | 2,247,370 |
| 47,335 | | Thermo Electron Corp.* | | | 1,824,291 |
|
| | | Total Health Care Equipment & Supplies | | | 5,463,684 |
|
| Health Care Providers & Services — 5.6% | | | |
| 39,250 | | Coventry Health Care Inc.* | | | 1,949,548 |
| 49,030 | | Manor Care Inc. | | | 2,149,965 |
| 18,600 | | Omnicare Inc. | | | 1,054,806 |
| 43,200 | | Pediatrix Medical Group Inc.* | | | 2,186,784 |
|
| | | Total Health Care Providers & Services | | | 7,341,103 |
|
| Pharmaceuticals — 1.4% | | | |
| 93,800 | | MGI Pharma Inc.* | | | 1,752,184 |
|
| | | TOTAL HEALTH CARE | | | 17,369,161 |
See Notes to Financial Statements.
Legg Mason Partners Variable Portfolios III, Inc. 2006 Semi-Annual Report 15
Schedules of Investments (April 30, 2006) (unaudited) (continued)
| | | | | |
| | |
| Shares | | Security | | Value |
| INDUSTRIALS — 14.2% | | | |
| Aerospace & Defense — 4.3% | | | |
| 24,085 | | Alliant Techsystems Inc.* | | $ | 1,926,559 |
| 29,000 | | Armor Holdings Inc.* | | | 1,771,030 |
| 23,300 | | L-3 Communications Holdings Inc. | | | 1,903,610 |
|
| | | Total Aerospace & Defense | | | 5,601,199 |
|
| Air Freight & Logistics — 0.8% | | | |
| 22,210 | | C.H. Robinson Worldwide Inc. | | | 985,013 |
|
| Commercial Services & Supplies — 2.4% | | | |
| 68,240 | | R.R. Donnelley & Sons Co. | | | 2,299,006 |
| 19,610 | | YRC Worldwide Inc.* | | | 823,620 |
|
| | | Total Commercial Services & Supplies | | | 3,122,626 |
|
| Electrical Equipment — 2.1% | | | |
| 7,985 | | Rockwell Automation Inc. | | | 578,593 |
| 44,250 | | Roper Industries Inc. | | | 2,100,105 |
|
| | | Total Electrical Equipment | | | 2,678,698 |
|
| Machinery — 4.0% | | | |
| 115,800 | | AGCO Corp.* | | | 2,740,986 |
| 33,100 | | Eaton Corp. | | | 2,537,115 |
|
| | | Total Machinery | | | 5,278,101 |
|
| Road & Rail — 0.6% | | | |
| 33,887 | | Heartland Express Inc. | | | 823,793 |
|
| | | TOTAL INDUSTRIALS | | | 18,489,430 |
|
| INFORMATION TECHNOLOGY — 19.3% | | | |
| Communications Equipment — 0.6% | | | |
| 17,200 | | Harris Corp. | | | 801,004 |
|
| Computers & Peripherals — 4.2% | | | |
| 48,700 | | Avid Technology Inc.* | | | 1,877,385 |
| 48,900 | | Intergraph Corp.* | | | 2,152,578 |
| 66,500 | | Western Digital Corp.* | | | 1,399,160 |
|
| | | Total Computers & Peripherals | | | 5,429,123 |
|
| Electronic Equipment & Instruments — 4.9% | | | |
| 84,300 | | Benchmark Electronics Inc.* | | | 2,301,390 |
| 21,730 | | CDW Corp. | | | 1,293,370 |
| 97,300 | | Ingram Micro Inc., Class A Shares* | | | 1,789,347 |
| 28,800 | | Tech Data Corp.* | | | 1,057,536 |
|
| | | Total Electronic Equipment & Instruments | | | 6,441,643 |
|
| Internet Software & Services — 2.7% | | | |
| 23,570 | | j2 Global Communications Inc.* | | | 1,157,051 |
| 64,900 | | WebEx Communications Inc.* | | | 2,294,215 |
|
| | | Total Internet Software & Services | | | 3,451,266 |
|
See Notes to Financial Statements.
16 Legg Mason Partners Variable Portfolios III, Inc. 2006 Semi-Annual Report
Schedules of Investments (April 30, 2006) (unaudited) (continued)
| | | | | | | |
| | |
| Shares | | Security | | Value | |
| | IT Services — 2.6% | | | | |
| | 38,950 | | Acxiom Corp. | | $ | 1,009,584 | |
| | 104,600 | | Sabre Holdings Corp., Class A Shares | | | 2,415,214 | |
|
|
|
| | | | Total IT Services | | | 3,424,798 | |
|
|
|
| | Semiconductors & Semiconductor Equipment — 4.0% | | | | |
| | 55,500 | | Lam Research Corp.* | | | 2,712,840 | |
| | 66,400 | | Microchip Technology Inc. | | | 2,474,064 | |
|
|
|
| | | | Total Semiconductors & Semiconductor Equipment | | | 5,186,904 | |
|
|
|
| | Software — 0.3% | | | | |
| | 16,520 | | Internet Security Systems Inc.* | | | 370,709 | |
|
|
|
| | | | TOTAL INFORMATION TECHNOLOGY | | | 25,105,447 | |
|
|
|
| | MATERIALS — 1.7% | | | | |
| | Chemicals — 1.2% | | | | |
| | 22,550 | | Air Products & Chemicals Inc. | | | 1,545,126 | |
|
|
|
| | Metals & Mining — 0.5% | | | | |
| | 26,800 | | Compass Minerals International Inc. | | | 705,644 | |
|
|
|
| | | | TOTAL MATERIALS | | | 2,250,770 | |
|
|
|
| | UTILITIES — 3.8% | | | | |
| | Electric Utilities — 2.3% | | | | |
| | 67,200 | | Pepco Holdings Inc. | | | 1,550,976 | |
| | 27,700 | | WPS Resources Corp. | | | 1,384,723 | |
|
|
|
| | | | Total Electric Utilities | | | 2,935,699 | |
|
|
|
| | Multi-Utilities — 1.1% | | | | |
| | 36,700 | | SCANA Corp. | | | 1,436,438 | |
|
|
|
| | Water Utilities — 0.4% | | | | |
| | 21,981 | | Aqua America Inc. | | | 525,346 | |
|
|
|
| | | | TOTAL UTILITIES | | | 4,897,483 | |
|
|
|
| | | | TOTAL INVESTMENTS BEFORE SHORT-TERM INVESTMENT
(Cost — $105,701,576) | | | 125,768,667 | |
|
|
|
| | |
Face
Amount | | | | | |
| | SHORT-TERM INVESTMENT — 2.5% | | | | |
| | Repurchase Agreement — 2.5% | | | | |
| $ | 3,296,000 | | Interest in $604,665,000 joint tri-party repurchase agreement dated 4/28/06 with Deutsche Bank Securities Inc., 4.790% due 5/1/06; Proceeds at maturity — $3,297,316; (Fully collateralized by various U.S. government agency obligations, 0.000% to 22.306% due 2/15/17 to 4/15/36; Market value — $3,361,920) (Cost — $3,296,000) | | | 3,296,000 | |
|
|
|
| | | | TOTAL INVESTMENTS — 99.2% (Cost — $108,997,576#) | | | 129,064,667 | |
| | | | Other Assets in Excess of Liabilities — 0.8% | | | 1,045,077 | |
|
|
|
| | | | TOTAL NET ASSETS — 100.0% | | $ | 130,109,744 | |
|
|
|
| * | | Non-income producing security. |
| # | | Aggregate cost for federal income tax purposes is substantially the same. |
See Notes to Financial Statements.
Legg Mason Partners Variable Portfolios III, Inc. 2006 Semi-Annual Report 17
Schedules of Investments (April 30, 2006) (unaudited) (continued)
LEGG MASON PARTNERS VARIABLE AGGRESSIVE GROWTH PORTFOLIO
| | | | | |
| | |
| Shares | | Security | | Value |
| COMMON STOCKS — 95.0% |
| CONSUMER DISCRETIONARY — 13.4% |
| Media — 13.2% |
| 1,273,275 | | Cablevision Systems Corp., New York Group, Class A Shares* | | $ | 25,809,284 |
| 166,349 | | CBS Corp., Class B Shares | | | 4,236,909 |
| 132,842 | | Comcast Corp., Class A Shares* | | | 4,111,460 |
| 1,348,160 | | Comcast Corp., Special Class A Shares* | | | 41,563,773 |
| 201,340 | | Discovery Holding Co., Class A Shares* | | | 2,999,966 |
| 90,170 | | Liberty Global Inc., Series A Shares* | | | 1,867,421 |
| 90,170 | | Liberty Global Inc., Series C Shares* | | | 1,800,695 |
| 2,013,400 | | Liberty Media Corp., Class A Shares* | | | 16,811,890 |
| 1,829,367 | | Time Warner Inc. | | | 31,830,986 |
| 166,349 | | Viacom Inc., Class B Shares* | | | 6,625,680 |
| 675,000 | | Walt Disney Co. | | | 18,873,000 |
| 34,600 | | World Wrestling Entertainment Inc. | | | 599,964 |
|
| | | Total Media | | | 157,131,028 |
|
| Specialty Retail — 0.2% | | | |
| 215,000 | | Charming Shoppes Inc.* | | | 2,956,250 |
|
| | | TOTAL CONSUMER DISCRETIONARY | | | 160,087,278 |
|
| ENERGY — 17.0% | | | |
| Energy Equipment & Services — 10.0% | | | |
| 165,800 | | Core Laboratories NV* | | | 10,155,250 |
| 580,650 | | Grant Prideco Inc.* | | | 29,729,280 |
| 1,490,900 | | Weatherford International Ltd.* | | | 78,913,337 |
|
| | | Total Energy Equipment & Services | | | 118,797,867 |
|
| Oil, Gas & Consumable Fuels — 7.0% | | | |
| 795,800 | | Anadarko Petroleum Corp. | | | 83,415,756 |
| 6,325 | | Bill Barrett Corp.* | | | 190,003 |
|
| | | Total Oil, Gas & Consumable Fuels | | | 83,605,759 |
|
| | | TOTAL ENERGY | | | 202,403,626 |
|
| EXCHANGE TRADED FUND — 1.9% | | | |
| 532,000 | | Nasdaq-100 Index Tracking Stock | | | 22,258,880 |
|
| FINANCIALS — 12.4% | | | |
| Capital Markets — 11.3% | | | |
| 154,400 | | Cohen & Steers Inc. | | | 3,957,272 |
| 612,842 | | Lehman Brothers Holdings Inc. | | | 92,631,068 |
| 500,400 | | Merrill Lynch & Co. Inc. | | | 38,160,504 |
|
| | | Total Capital Markets | | | 134,748,844 |
|
| Diversified Financial Services — 0.4% | | | |
| 83,725 | | CIT Group Inc. | | | 4,521,987 |
|
| Insurance — 0.0% | | | |
| 2,415 | | National Financial Partners Corp. | | | 125,580 |
|
See Notes to Financial Statements.
18 Legg Mason Partners Variable Portfolios III, Inc. 2006 Semi-Annual Report
Schedules of Investments (April 30, 2006) (unaudited) (continued)
| | | | | |
| | |
| Shares | | Security | | Value |
| Thrifts & Mortgage Finance — 0.7% | | | |
| 49,500 | | Astoria Financial Corp. | | $ | 1,550,340 |
| 361,566 | | New York Community Bancorp Inc. | | | 6,222,551 |
|
| | | Total Thrifts & Mortgage Finance | | | 7,772,891 |
|
| | | TOTAL FINANCIALS | | | 147,169,302 |
|
| HEALTH CARE — 29.4% | | | |
| Biotechnology — 15.5% | | | |
| 162,500 | | Alkermes Inc.* | | | 3,488,875 |
| 740,105 | | Amgen Inc.* | | | 50,105,108 |
| 783,806 | | Biogen Idec Inc.* | | | 35,153,699 |
| 110,150 | | CancerVax Corp.* | | | 283,086 |
| 101,900 | | Genentech Inc.* | | | 8,122,449 |
| 795,168 | | Genzyme Corp.* | | | 48,632,475 |
| 541,275 | | ImClone Systems Inc.* | | | 19,540,028 |
| 224,750 | | Isis Pharmaceuticals Inc.* | | | 1,928,355 |
| 766,905 | | Millennium Pharmaceuticals Inc.* | | | 6,963,497 |
| 173,000 | | Nanogen Inc.* | | | 444,610 |
| 265,400 | | Vertex Pharmaceuticals Inc.* | | | 9,652,598 |
| 29,445 | | ViaCell Inc.* | | | 170,487 |
|
| | | Total Biotechnology | | | 184,485,267 |
|
| Health Care Equipment & Supplies — 0.5% | | | |
| 92,100 | | Biosite Inc.* | | | 5,194,440 |
|
| Health Care Providers & Services — 7.0% | | | |
| 1,672,000 | | UnitedHealth Group Inc. | | | 83,165,280 |
|
| Pharmaceuticals — 6.4% | | | |
| 998,800 | | Forest Laboratories Inc.* | | | 40,331,544 |
| 243,448 | | Johnson & Johnson | | | 14,268,487 |
| 635,666 | | King Pharmaceuticals Inc.* | | | 11,054,232 |
| 75,289 | | Pfizer Inc. | | | 1,907,070 |
| 78,576 | | Teva Pharmaceutical Industries Ltd., Sponsored ADR | | | 3,182,328 |
| 323,000 | | Valeant Pharmaceuticals International | | | 5,781,700 |
|
| | | Total Pharmaceuticals | | | 76,525,361 |
|
| | | TOTAL HEALTH CARE | | | 349,370,348 |
|
| INDUSTRIALS — 6.9% | | | |
| Aerospace & Defense — 2.6% | | | |
| 378,800 | | L-3 Communications Holdings Inc. | | | 30,947,960 |
|
| Industrial Conglomerates — 3.5% | | | |
| 1,583,412 | | Tyco International Ltd. | | | 41,722,906 |
|
| Machinery — 0.8% | | | |
| 308,000 | | Pall Corp. | | | 9,295,440 |
|
| | | TOTAL INDUSTRIALS | | | 81,966,306 |
|
| INFORMATION TECHNOLOGY — 13.9% | | | |
| Communications Equipment — 2.6% | | | |
| 186,100 | | C-COR Inc.* | | | 1,522,298 |
See Notes to Financial Statements.
Legg Mason Partners Variable Portfolios III, Inc. 2006 Semi-Annual Report 19
Schedules of Investments (April 30, 2006) (unaudited) (continued)
| | | | | |
| | |
| Shares | | Security | | Value |
| Communications Equipment — 2.6% (continued) | | | |
| 890,500 | | Motorola Inc. | | $ | 19,012,175 |
| 448,325 | | Nokia Oyj, Sponsored ADR | | | 10,159,044 |
|
| | | Total Communications Equipment | | | 30,693,517 |
|
| Computers & Peripherals — 2.8% | | | |
| 876,076 | | Maxtor Corp.* | | | 8,480,416 |
| 242,000 | | Quantum Corp.* | | | 827,640 |
| 385,000 | | SanDisk Corp.* | | | 24,574,550 |
|
| | | Total Computers & Peripherals | | | 33,882,606 |
|
| Electronic Equipment & Instruments — 0.0% | | | |
| 12,400 | | Excel Technology Inc.* | | | 366,668 |
|
| Semiconductors & Semiconductor Equipment — 7.0% | | | |
| 495,000 | | Broadcom Corp., Class A Shares* | | | 20,349,450 |
| 125,000 | | Cabot Microelectronics Corp.* | | | 4,088,750 |
| 229,000 | | Cirrus Logic Inc.* | | | 2,164,050 |
| 133,000 | | Cree Inc.* | | | 3,966,060 |
| 133,000 | | DSP Group Inc.* | | | 3,596,320 |
| 98,324 | | Freescale Semiconductor Inc., Class B Shares* | | | 3,113,921 |
| 358,334 | | Intel Corp. | | | 7,159,514 |
| 1,617,300 | | Micron Technology Inc.* | | | 27,445,581 |
| 543,000 | | RF Micro Devices Inc.* | | | 5,049,900 |
| 10,300 | | Standard Microsystems Corp.* | | | 239,990 |
| 343,091 | | Teradyne Inc.* | | | 5,784,514 |
|
| | | Total Semiconductors & Semiconductor Equipment | | | 82,958,050 |
|
| Software — 1.5% |
| 106,000 | | Advent Software Inc.* | | | 3,731,200 |
| 230,000 | | Autodesk Inc.* | | | 9,669,200 |
| 72,264 | | Microsoft Corp. | | | 1,745,176 |
| 105,000 | | RSA Security Inc.* | | | 2,198,700 |
|
| | | Total Software | | | 17,344,276 |
|
| | | TOTAL INFORMATION TECHNOLOGY | | | 165,245,117 |
|
| TELECOMMUNICATION SERVICES — 0.1% | | | |
| Diversified Telecommunication Services — 0.1% | | | |
| 63,912 | | AT&T Inc. | | | 1,675,134 |
|
| | | TOTAL INVESTMENTS BEFORE SHORT-TERM INVESTMENT
(Cost — $885,461,449) | | | 1,130,175,991 |
|
See Notes to Financial Statements.
20 Legg Mason Partners Variable Portfolios III, Inc. 2006 Semi-Annual Report
Schedules of Investments (April 30, 2006) (unaudited) (continued)
| | | | | | | |
| | |
Face
Amount | | Security | | Value | |
| | SHORT-TERM INVESTMENT — 5.1% | | | | |
| | Repurchase Agreement — 5.1% | | | | |
| $ | 60,571,000 | | Interest in $513,793,000 joint tri-party repurchase agreement dated 4/28/06 with Merrill Lynch, Pierce, Fenner & Smith Inc., 4.790% due 5/1/06; Proceeds at maturity — $60,595,178; (Fully collateralized by U.S. Treasury obligations, 0.000% to 2.375% due 4/30/06 to 4/15/11; Market value — $61,782,800) (Cost — $60,571,000) | | $ | 60,571,000 | |
|
|
|
| | | | TOTAL INVESTMENTS — 100.1% (Cost — $946,032,449#) | | | 1,190,746,991 | |
| | | | Liabilities in Excess of Other Assets — (0.1)% | | | (843,093 | ) |
|
|
|
| | | | TOTAL NET ASSETS — 100.0% | | $ | 1,189,903,898 | |
|
|
|
| * | | Non-income producing security. |
| # | | Aggregate cost for federal income tax purposes is substantially the same. |
| | |
Abbreviation used in this schedule:
|
| ADR | | — American Depositary Receipt |
See Notes to Financial Statements.
Legg Mason Partners Variable Portfolios III, Inc. 2006 Semi-Annual Report 21
Schedules of Investments (April 30, 2006) (unaudited) (continued)
LEGG MASON PARTNERS VARIABLE INTERNATIONAL ALL CAP GROWTH PORTFOLIO
| | | | | |
| | |
| Shares | | Security | | Value |
| COMMON STOCKS — 99.4% |
| Australia — 2.7% |
| 146,000 | | Babcock & Brown Ltd. | | $ | 2,028,296 |
| 53,000 | | Macquarie Bank Ltd. | | | 2,872,775 |
|
| | | Total Australia | | | 4,901,071 |
|
| Denmark — 1.3% | | | |
| 35,930 | | Novo Nordisk A/S, Class B Shares | | | 2,334,696 |
|
| Finland — 2.8% | | | |
| 225,000 | | Nokia Oyj | | | 5,126,721 |
|
| France — 7.3% | | | |
| 225,000 | | Altran Technologies SA* | | | 3,263,492 |
| 32,625 | | Essilor International SA | | | 3,274,143 |
| 25,000 | | Groupe Danone | | | 3,121,161 |
| 13,000 | | Total SA | | | 3,597,194 |
| 800 | | Total SA, Sponsored ADR | | | 110,416 |
|
| | | Total France | | | 13,366,406 |
|
| Germany — 5.9% | | | |
| 25,300 | | BASF AG | | | 2,170,471 |
| 450 | | BASF AG, Sponsored ADR | | | 38,502 |
| 50,000 | | IKB Deutsche Industriebank AG | | | 2,075,304 |
| 12,500 | | SAP AG | | | 2,732,989 |
| 1,300 | | SAP AG, Sponsored ADR | | | 71,019 |
| 76,400 | | Stada Arzneimittel AG | | | 3,700,540 |
|
| | | Total Germany | | | 10,788,825 |
|
| Greece — 1.3% | | | |
| 25,000 | | EFG Eurobank Ergasias | | | 996,626 |
| 45,000 | | Piraeus Bank SA | | | 1,419,008 |
|
| | | Total Greece | | | 2,415,634 |
|
| Hong Kong — 0.6% | | | |
| 120,000 | | Hutchison Whampoa Ltd. | | | 1,180,939 |
|
| Ireland — 8.1% | | | |
| 106,900 | | Bank of Ireland | | | 2,005,287 |
| 77,512 | | CRH PLC | | | 2,852,249 |
| 584,000 | | Grafton Group PLC* | | | 8,101,968 |
| 118,740 | | Irish Continental Group PLC | | | 1,723,752 |
| 35,391 | | United Drug PLC | | | 167,088 |
|
| | | Total Ireland | | | 14,850,344 |
|
| Italy — 1.6% | | | |
| 114,000 | | Saipem SpA | | | 2,852,256 |
|
| Japan — 26.4% | | | |
| 51,000 | | Aisin Seiki Co., Ltd. | | | 1,918,523 |
| 43,000 | | Canon Inc. | | | 3,291,848 |
See Notes to Financial Statements.
22 Legg Mason Partners Variable Portfolios III, Inc. 2006 Semi-Annual Report
Schedules of Investments (April 30, 2006) (unaudited) (continued)
| | | | | |
| | |
| Shares | | Security | | Value |
| Japan — 26.4% (continued) | | | |
| 48,000 | | Daikin Industries Ltd. | | $ | 1,674,885 |
| 150,000 | | Dowa Mining Co., Ltd. | | | 1,713,909 |
| 43,000 | | Fanuc Limited | | | 4,070,402 |
| 44,500 | | Honda Motor Co., Ltd. | | | 3,164,184 |
| 2,000 | | Honda Motor Co., Ltd., Sponsored ADR | | | 70,860 |
| 65,200 | | Hoya Corp. | | | 2,641,811 |
| 380 | | Mitsubishi UFJ Financial Group Inc. | | | 5,978,466 |
| 17,400 | | Nidec Corp. | | | 1,342,755 |
| 460 | | NTT Data Corp. | | | 2,130,696 |
| 15,800 | | Orix Corp. | | | 4,749,374 |
| 2,380 | | Rakuten Inc. | | | 1,924,500 |
| 37,200 | | Seven & I Holdings Co., Ltd. | | | 1,441,898 |
| 184,000 | | Sharp Corp. | | | 3,232,837 |
| 62,400 | | Shin-Etsu Chemical Co., Ltd. | | | 3,608,807 |
| 79,000 | | Terumo Corp. | | | 2,832,960 |
| 63,000 | | Trend Micro Inc. | | | 2,441,925 |
|
| | | Total Japan | | | 48,230,640 |
|
| Mexico — 2.2% | | | |
| 1,400,200 | | Wal-Mart de Mexico SA de CV | | | 3,983,365 |
|
| Netherlands — 1.9% | | | |
| 39,351 | | ING Groep NV, CVA | | | 1,602,508 |
| 51,950 | | Royal Dutch Shell PLC, Class A Shares | | | 1,782,440 |
|
| | | Total Netherlands | | | 3,384,948 |
|
| Norway — 1.4% | | | |
| 159,900 | | Acergy SA* | | | 2,606,346 |
|
| Singapore — 0.7% | | | |
| 106,000 | | DBS Group Holdings Ltd. | | | 1,193,422 |
|
| Spain — 2.3% | | | |
| 205,000 | | Indra Sistemas SA | | | 4,223,320 |
|
| Sweden — 2.8% | | | |
| 90,000 | | Assa Abloy AB | | | 1,742,314 |
| 111,000 | | Atlas Copco AB, Class A Shares | | | 3,279,830 |
|
| | | Total Sweden | | | 5,022,144 |
|
| Switzerland — 12.0% | | | |
| 96,000 | | Mettler-Toledo International Inc.* | | | 6,220,800 |
| 6,740 | | Nestle SA | | | 2,053,902 |
| 41,000 | | Novartis AG | | | 2,350,171 |
| 42,000 | | Roche Holding AG | | | 6,452,689 |
| 40,000 | | UBS AG | | | 4,737,160 |
|
| | | Total Switzerland | | | 21,814,722 |
|
| United Kingdom — 17.1% | | | |
| 52,000 | | BOC Group PLC | | | 1,475,989 |
| 337,300 | | BP PLC | | | 4,157,157 |
| 514,800 | | Capita Group PLC | | | 4,368,212 |
See Notes to Financial Statements.
Legg Mason Partners Variable Portfolios III, Inc. 2006 Semi-Annual Report 23
Schedules of Investments (April 30, 2006) (unaudited) (continued)
| | | | | | | |
| | |
| Shares | | Security | | Value | |
| | United Kingdom — 17.1% (continued) | | | | |
| | 65,000 | | Rio Tinto PLC | | $ | 3,571,552 | |
| | 1,069,000 | | Serco Group PLC | | | 6,543,789 | |
| | 151,700 | | Smith & Nephew PLC | | | 1,253,358 | |
| | 576,352 | | Tesco PLC | | | 3,354,834 | |
| | 357,000 | | Tomkins PLC | | | 2,203,230 | |
| | 1,854,000 | | Vodafone Group PLC | | | 4,374,131 | |
|
|
|
| | | | Total United Kingdom | | | 31,302,252 | |
|
|
|
| | United States — 1.0% | | | | |
| | 101,814 | | News Corp., Class B Shares | | | 1,856,069 | |
|
|
|
| | | | TOTAL COMMON STOCKS
(Cost — $103,835,579) | | | 181,434,120 | |
|
|
|
| | |
| Right | | | | | |
| | RIGHT — 0.0% | |
| | Hong Kong — 0.0% | |
| | 6 | | Hutchison Whampoa (a)*
(Cost — $0) | | | 0 | |
|
|
|
| | | | TOTAL INVESTMENTS BEFORE SHORT-TERM INVESTMENT
(Cost — $103,835,579) | | | 181,434,120 | |
|
|
|
| | |
Face
Amount | | | | | |
| | SHORT-TERM INVESTMENT — 0.3% | | | | |
| | Repurchase Agreement — 0.3% | | | | |
| $ | 474,000 | | Interest in $513,793,000 joint tri-party repurchase agreement dated 4/28/06 with Merrill Lynch, Pierce, Fenner & Smith, Inc., 4.790% due 5/1/06; Proceeds at maturity — $474,189; (Fully collateralized by U.S. Treasury obligations, 0.000% to 2.375% due 4/30/06 to 4/15/11; Market value — $483,483) (Cost — $474,000) | | | 474,000 | |
|
|
|
| | | | TOTAL INVESTMENTS — 99.7% (Cost — $104,309,579#) | | | 181,908,120 | |
| | | | Other Assets in Excess of Liabilities — 0.3% | | | 638,637 | |
|
|
|
| | | | TOTAL NET ASSETS — 100.0% | | $ | 182,546,757 | |
|
|
|
| * | | Non-income producing security. |
| (a) | | Security is valued in good faith at fair value by or under the direction of the Board of Directors (See Note 1). |
| # | | Aggregate cost for federal income tax purposes is substantially the same. |
| | |
Abbreviations used in this schedule:
|
| ADR | | — American Depositary Receipt |
| CVA | | — Certificaaten van aandelen (Share Certificates) |
See Notes to Financial Statements.
24 Legg Mason Partners Variable Portfolios III, Inc. 2006 Semi-Annual Report
Schedules of Investments (April 30, 2006) (unaudited) (continued)
| | | |
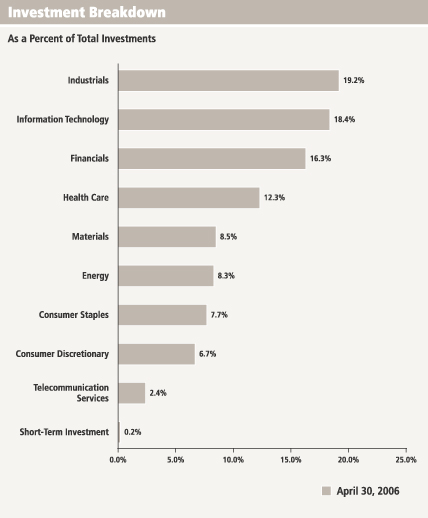
| Summary of Investments by Sector* | |
Industrials | | 19.2 | % |
Information Technology | | 18.4 | |
Financials | | 16.3 | |
Health Care | | 12.3 | |
Materials | | 8.5 | |
Energy | | 8.3 | |
Consumer Staples | | 7.7 | |
Consumer Discretionary | | 6.7 | |
Telecommunication Services | | 2.4 | |
Short-Term Investment | | 0.2 | |
|
|
| | | 100.0 | % |
|
|
| * | | As a percentage of total investments. |
See Notes to Financial Statements.
Legg Mason Partners Variable Portfolios III, Inc. 2006 Semi-Annual Report 25
Statement of Assets and Liabilities (April 30, 2006) (unaudited)
| | | | | | | | |
| | |
| | | Legg Mason Partners
Variable
Large Cap
Value Portfolio | | | Legg Mason Partners
Variable
Large Cap
Growth
Portfolio | |
| ASSETS: | | | | | | | | |
Investments, at cost | | $ | 246,327,659 | | | $ | 263,372,939 | |
Foreign currency, at cost | | | 45,760 | | | | — | |
|
|
Investments, at value | | | 305,024,700 | | | | 352,106,659 | |
Foreign currency, at value | | | 47,718 | | | | — | |
Cash | | | 152 | | | | 210,067 | |
Receivable for securities sold | | | — | | | | — | |
Dividends and interest receivable | | | 279,853 | | | | 128,793 | |
Receivable for Fund shares sold | | | 10 | | | | 53,833 | |
Prepaid expenses | | | 2,318 | | | | — | |
|
|
Total Assets | | | 305,354,751 | | | | 352,499,352 | |
|
|
| LIABILITIES: | | | | | | | | |
Payable for Fund shares repurchased | | | 395,144 | | | | 503,001 | |
Investment management fee payable | | | 149,502 | | | | 221,499 | |
Payable for securities purchased | | | — | | | | — | |
Accrued expenses | | | 45,481 | | | | 38,158 | |
|
|
Total Liabilities | | | 590,127 | | | | 762,658 | |
|
|
Total Net Assets | | $ | 304,764,624 | | | $ | 351,736,694 | |
|
|
| NET ASSETS: | | | | | | | | |
Par value (Note 4) | | $ | 150 | | | $ | 237 | |
Paid-in capital in excess of par value | | | 264,406,584 | | | | 338,237,908 | |
Undistributed (Overdistributed) net investment income | | | 470,068 | | | | (60,761 | ) |
Accumulated net investment loss | | | — | | | | — | |
Accumulated net realized gain (loss) on investments and foreign currency transactions | | | (18,811,293 | ) | | | (75,174,410 | ) |
Net unrealized appreciation on investments and foreign currencies | | | 58,699,115 | | | | 88,733,720 | |
|
|
Total Net Assets | | $ | 304,764,624 | | | $ | 351,736,694 | |
|
|
Shares Outstanding | | | 15,028,092 | | | | 23,736,041 | |
|
|
Net Asset Value | | | $20.28 | | | | $14.82 | |
|
|
See Notes to Financial Statements.
26 Legg Mason Partners Variable Portfolios III, Inc. 2006 Semi-Annual Report
Statement of Assets and Liabilities (April 30, 2006) (unaudited) (continued)
| | | | | | | | | |
| | |
Legg Mason Partners
Variable
Mid Cap Core Portfolio | | Legg Mason Partners
Variable
Aggressive Growth Portfolio | | | Legg Mason Partners
Variable
International
All Cap Growth
Portfolio | |
| | | | | | | | | | |
| $ | 108,997,576 | | $ | 946,032,449 | | | $ | 104,309,579 | |
| | — | | | — | | | | 518,314 | |
|
|
|
| | 129,064,667 | | | 1,190,746,991 | | | | 181,908,120 | |
| | — | | | — | | | | 524,319 | |
| | 13 | | | 397 | | | | 651 | |
| | 3,220,914 | | | — | | | | — | |
| | 47,390 | | | 238,025 | | | | 585,518 | |
| | — | | | 303,971 | | | | 12 | |
| | — | | | 895 | | | | 6,780 | |
|
|
|
| | 132,332,984 | | | 1,191,290,279 | | | | 183,025,400 | |
|
|
|
| | | | | | | | | | |
| | 101,979 | | | 619,299 | | | | 284,758 | |
| | 79,660 | | | 725,065 | | | | 124,555 | |
| | 2,025,154 | | | — | | | | — | |
| | 16,447 | | | 42,017 | | | | 69,330 | |
|
|
|
| | 2,223,240 | | | 1,386,381 | | | | 478,643 | |
|
|
|
| $ | 130,109,744 | | $ | 1,189,903,898 | | | $ | 182,546,757 | |
|
|
|
| | | | | | | | | | |
| $ | 83 | | $ | 754 | | | $ | 111 | |
| | 99,965,343 | | | 945,859,486 | | | | 160,061,815 | |
| | 130,030 | | | — | | | | (213,121 | ) |
| | — | | | (1,242,437 | ) | | | — | |
| | 9,947,197 | | | 571,553 | | | | (54,931,218 | ) |
| | 20,067,091 | | | 244,714,542 | | | | 77,629,170 | |
|
|
|
| $ | 130,109,744 | | $ | 1,189,903,898 | | | $ | 182,546,757 | |
|
|
|
| | 8,341,565 | | | 75,377,718 | | | | 11,080,993 | |
|
|
|
| | $15.60 | | | $15.79 | | | | $16.47 | |
|
|
|
See Notes to Financial Statements.
Legg Mason Partners Variable Portfolios III, Inc. 2006 Semi-Annual Report 27
Statements of Operations (For the six months ended April 30, 2006) (unaudited)
| | | | | | | | |
| | |
| | | Legg Mason Partners
Variable
Large Cap Value
Portfolio | | |
Legg Mason Partners
Variable
Large Cap Growth
Portfolio | |
| INVESTMENT INCOME: | | | | | | | | |
Dividends | | $ | 2,958,155 | | | $ | 1,706,186 | |
Interest | | | 235,547 | | | | 13,064 | |
Income from securities lending | | | — | | | | — | |
Less: Foreign taxes withheld | | | (57,533 | ) | | | — | |
|
|
Total Investment Income | | | 3,136,169 | | | | 1,719,250 | |
|
|
| EXPENSES: | | | | | | | | |
Investment management fee (Note 2) | | | 910,278 | | | | 1,400,774 | |
Audit and tax | | | 14,609 | | | | 13,007 | |
Directors’ fees | | | 13,100 | | | | 12,518 | |
Legal fees | | | 11,238 | | | | 10,363 | |
Shareholder reports | | | 9,567 | | | | 17,339 | |
Insurance | | | 3,755 | | | | 6,755 | |
Custody fees | | | 3,127 | | | | 11,212 | |
Transfer agent fees (Note 2) | | | 864 | | | | 1,276 | |
Miscellaneous expenses | | | 580 | | | | 632 | |
|
|
Total Expenses | | | 967,118 | | | | 1,473,876 | |
Less: Fee waivers and/or expense reimbursements (Notes 2 and 7) | | | (8,241 | ) | | | (9,948 | ) |
|
|
Net Expenses | | | 958,877 | | | | 1,463,928 | |
|
|
Net Investment Income (Loss) | | | 2,177,292 | | | | 255,322 | |
|
|
| REALIZED AND UNREALIZED GAIN (LOSS) ON INVESTMENTS AND FOREIGN CURRENCY TRANSACTIONS (NOTES 1 AND 3): | | | | | | | | |
Net Realized Gain (Loss) From: | | | | | | | | |
Investment transactions | | | 12,675,702 | | | | 6,250,761 | |
Foreign currency transactions | | | (130 | ) | | | — | |
|
|
Net Realized Gain | | | 12,675,572 | | | | 6,250,761 | |
|
|
Change in Net Unrealized Appreciation/Depreciation From: | | | | | | | | |
Investments | | | 18,077,770 | | | | 2,795,418 | |
Foreign currencies | | | 2,214 | | | | — | |
|
|
Change in Net Unrealized Appreciation/Depreciation | | | 18,079,984 | | | | 2,795,418 | |
|
|
Net Gain on Investments and Foreign Currency Transactions | | | 30,755,556 | | | | 9,046,179 | |
|
|
Increase in Net Assets From Operations | | $ | 32,932,848 | | | $ | 9,301,501 | |
|
|
See Notes to Financial Statements.
28 Legg Mason Partners Variable Portfolios III, Inc. 2006 Semi-Annual Report
Statements of Operations (For the six months ended April 30, 2006) (unaudited) (continued)
| | | | | | | | |
| | |
Legg Mason Partners
Variable
Mid Cap Core Portfolio | | Legg Mason Partners
Variable
Aggressive Growth Portfolio | | | Legg Mason Partners
Variable
International All Cap Growth Portfolio | |
| | | | | | | | | |
$ 814,670 | | $ | 2,739,233 | | | $ | 1,601,756 | |
53,988 | | | 405,163 | | | | 40,525 | |
— | | | — | | | | 4,545 | |
(413) | | | (33,799 | ) | | | (119,238 | ) |
|
|
868,245 | | | 3,110,597 | | | | 1,527,588 | |
|
|
| | | | | | | | | |
472,567 | | | 4,272,145 | | | | 717,790 | |
9,551 | | | 14,111 | | | | 13,883 | |
6,800 | | | 27,523 | | | | 9,000 | |
12,852 | | | 8,602 | | | | 14,490 | |
6,459 | | | 28,462 | | | | 23,646 | |
644 | | | 10,789 | | | | 1,979 | |
1,075 | | | 14,318 | | | | 26,192 | |
1,249 | | | 1,404 | | | | 885 | |
868 | | | 2,148 | | | | 6,565 | |
|
|
512,065 | | | 4,379,502 | | | | 814,430 | |
(4,296) | | | (26,468 | ) | | | (5,221 | ) |
|
|
507,769 | | | 4,353,034 | | | | 809,209 | |
|
|
360,476 | | | (1,242,437 | ) | | | 718,379 | |
|
|
| | | | | | | | | |
| | | | | | | | | |
| | | | | | | | | |
| | | | | | | | | |
10,105,318 | | | 1,896,164 | | | | 6,479,252 | |
(28) | | | — | | | | 2,478 | |
|
|
10,105,290 | | | 1,896,164 | | | | 6,481,730 | |
|
|
| | | | | | | | | |
6,752,184 | | | 114,785,196 | | | | 28,270,038 | |
— | | | — | | | | 27,959 | |
|
|
6,752,184 | | | 114,785,196 | | | | 28,297,997 | |
|
|
16,857,474 | | | 116,681,360 | | | | 34,779,727 | |
|
|
$17,217,950 | | $ | 115,438,923 | | | $ | 35,498,106 | |
|
|
See Notes to Financial Statements.
Legg Mason Partners Variable Portfolios III, Inc. 2006 Semi-Annual Report 29
Statements of Changes in Net Assets
| | | | | | | | |
For the six months ended April 30, 2006 (unaudited)
and the year ended October 31, 2005 | | | | | | | | |
| | |
| Legg Mason Partners Variable Large Cap Value Portfolio | | 2006 | | | 2005 | |
| OPERATIONS: | | | | | | | | |
Net investment income | | $ | 2,177,292 | | | $ | 5,151,001 | |
Net realized gain | | | 12,675,572 | | | | 12,469,887 | |
Change in net unrealized appreciation/depreciation | | | 18,079,984 | | | | 14,712,402 | |
|
|
Increase in Net Assets From Operations | | | 32,932,848 | | | | 32,333,290 | |
|
|
| DISTRIBUTIONS TO SHAREHOLDERS FROM (NOTE 1): | | | | | | | | |
Net investment income | | | (4,800,001 | ) | | | (6,400,006 | ) |
|
|
Decrease in Net Assets From Distributions to Shareholders | | | (4,800,001 | ) | | | (6,400,006 | ) |
|
|
| FUND SHARE TRANSACTIONS (NOTE 4): | | | | | | | | |
Net proceeds from sale of shares | | | 510,623 | | | | 3,130,472 | |
Reinvestment of distributions | | | 4,800,001 | | | | 6,400,006 | |
Cost of shares repurchased | | | (31,646,089 | ) | | | (65,848,220 | ) |
|
|
Decrease in Net Assets From Fund Share Transactions | | | (26,335,465 | ) | | | (56,317,742 | ) |
|
|
Increase (Decrease) in Net Assets | | | 1,797,382 | | | | (30,384,458 | ) |
| NET ASSETS: | | | | | | | | |
Beginning of period | | | 302,967,242 | | | | 333,351,700 | |
|
|
End of period* | | $ | 304,764,624 | | | $ | 302,967,242 | |
|
|
* Includes undistributed net investment income of: | | | $470,068 | | | | $3,092,777 | |
|
|
See Notes to Financial Statements.
30 Legg Mason Partners Variable Portfolios III, Inc. 2006 Semi-Annual Report
Statements of Changes in Net Assets (continued)
| | | | | | | | |
For the six months ended April 30, 2006 (unaudited)
and the year ended October 31, 2005 | | | | | | | | |
| | |
| Legg Mason Partners Variable Large Cap Growth Portfolio | | 2006 | | | 2005 | |
| OPERATIONS: | | | | | | | | |
Net investment income | | $ | 255,322 | | | $ | 1,684,888 | |
Net realized gain (loss) | | | 6,250,761 | | | | (9,620,366 | ) |
Change in net unrealized appreciation/depreciation | | | 2,795,418 | | | | 48,194,981 | |
|
|
Increase in Net Assets From Operations | | | 9,301,501 | | | | 40,259,503 | |
|
|
| DISTRIBUTIONS TO SHAREHOLDERS FROM (NOTE 1): | | | | | | | | |
Net investment income | | | (500,002 | ) | | | (1,500,969 | ) |
|
|
Decrease in Net Assets From Distributions to Shareholders | | | (500,002 | ) | | | (1,500,969 | ) |
|
|
| FUND SHARE TRANSACTIONS (NOTE 4): | | | | | | | | |
Net proceeds from sale of shares | | | 5,209,785 | | | | 11,593,119 | |
Reinvestment of distributions | | | 500,002 | | | | 1,500,969 | |
Cost of shares repurchased | | | (40,695,730 | ) | | | (63,602,132 | ) |
|
|
Decrease in Net Assets From Fund Share Transactions | | | (34,985,943 | ) | | | (50,508,044 | ) |
|
|
Decrease in Net Assets | | | (26,184,444 | ) | | | (11,749,510 | ) |
| NET ASSETS: | | | | | | | | |
Beginning of period | | | 377,921,138 | | | | 389,670,648 | |
|
|
End of period* | | $ | 351,736,694 | | | $ | 377,921,138 | |
|
|
| | | | | |
* Includes undistributed (overdistributed) net investment income of: | | $ | (60,761) | | $183,919 |
|
See Notes to Financial Statements.
Legg Mason Partners Variable Portfolios III, Inc. 2006 Semi-Annual Report 31
Statements of Changes in Net Assets (continued)
| | | | | | | | |
For the six months ended April 30, 2006 (unaudited)
and the year ended October 31, 2005 | | | | | | | | |
| | |
| Legg Mason Partners Variable Mid Cap Core Portfolio | | 2006 | | | 2005 | |
| OPERATIONS: | | | | | | | | |
Net investment income | | $ | 360,476 | | | $ | 519,554 | |
Net realized gain | | | 10,105,290 | | | | 12,955,266 | |
Change in net unrealized appreciation/depreciation | | | 6,752,184 | | | | 193,983 | |
|
|
Increase in Net Assets From Operations | | | 17,217,950 | | | | 13,668,803 | |
|
|
| DISTRIBUTIONS TO SHAREHOLDERS FROM (NOTE 1): | | | | | | | | |
Net investment income | | | (750,004 | ) | | | — | |
Net realized gains | | | (9,028,419 | ) | | | — | |
|
|
Decrease in Net Assets From Distributions to Shareholders | | | (9,778,423 | ) | | | — | |
|
|
| FUND SHARE TRANSACTIONS (NOTE 4): | | | | | | | | |
Net proceeds from sale of shares | | | 1,033,203 | | | | 8,699,598 | |
Reinvestment of distributions | | | 9,778,423 | | | | — | |
Cost of shares repurchased | | | (8,788,201 | ) | | | (11,954,070 | ) |
|
|
Increase (Decrease) in Net Assets From Fund Share Transactions | | | 2,023,425 | | | | (3,254,472 | ) |
|
|
Increase in Net Assets | | | 9,462,952 | | | | 10,414,331 | |
| NET ASSETS: | | | | | | | | |
Beginning of period | | | 120,646,792 | | | | 110,232,461 | |
|
|
End of period* | | $ | 130,109,744 | | | $ | 120,646,792 | |
|
|
* Includes undistributed net investment income of: | | | $130,030 | | | | $519,558 | |
|
|
See Notes to Financial Statements.
32 Legg Mason Partners Variable Portfolios III, Inc. 2006 Semi-Annual Report
Statements of Changes in Net Assets (continued)
| | | | | | | | |
For the six months ended April 30, 2006 (unaudited)
and the year ended October 31, 2005 | | | | | | | | |
| | |
| Legg Mason Partners Variable Aggressive Growth Portfolio | | 2006 | | | 2005 | |
| OPERATIONS: | | | | | | | | |
Net investment loss | | $ | (1,242,437 | ) | | $ | (2,707,794 | ) |
Net realized gain | | | 1,896,164 | | | | 211,120 | |
Change in net unrealized appreciation/depreciation | | | 114,785,196 | | | | 159,283,167 | |
|
|
Increase in Net Assets From Operations | | | 115,438,923 | | | | 156,786,493 | |
|
|
| DISTRIBUTIONS TO SHAREHOLDERS FROM (NOTE 1): | | | | | | | | |
Net realized gains | | | (32,468 | ) | | | (3,756,228 | ) |
|
|
Decrease in Net Assets From Distributions to Shareholders | | | (32,468 | ) | | | (3,756,228 | ) |
|
|
| FUND SHARE TRANSACTIONS (NOTE 4): | | | | | | | | |
Net proceeds from sale of shares | | | 36,049,635 | | | | 63,139,525 | |
Reinvestment of distributions | | | 32,468 | | | | 3,756,228 | |
Cost of shares repurchased | | | (40,583,746 | ) | | | (61,265,197 | ) |
|
|
Increase (Decrease) in Net Assets From Fund Share Transactions | | | (4,501,643 | ) | | | 5,630,556 | |
|
|
Increase in Net Assets | | | 110,904,812 | | | | 158,660,821 | |
| NET ASSETS: | | | | | | | | |
Beginning of period | | | 1,078,999,086 | | | | 920,338,265 | |
|
|
End of period* | | $ | 1,189,903,898 | | | $ | 1,078,999,086 | |
|
|
| | | | | |
* Includes accumulated net investment loss of: | | $ | (1,242,437) | | — |
|
See Notes to Financial Statements.
Legg Mason Partners Variable Portfolios III, Inc. 2006 Semi-Annual Report 33
Statements of Changes in Net Assets (continued)
| | | | | | | | |
For the six months ended April 30, 2006 (unaudited)
and the year ended October 31, 2005 | | | | | | | | |
| | |
Legg Mason Partners Variable International All Cap
Growth Portfolio | | 2006 | | | 2005 | |
| OPERATIONS: | | | | | | | | |
Net investment income | | $ | 718,379 | | | $ | 1,625,823 | |
Net realized gain | | | 6,481,730 | | | | 5,456,478 | |
Change in net unrealized appreciation/depreciation | | | 28,297,997 | | | | 17,715,799 | |
|
|
Increase in Net Assets From Operations | | | 35,498,106 | | | | 24,798,100 | |
|
|
| DISTRIBUTIONS TO SHAREHOLDERS FROM (NOTE 1): | | | | | | | | |
Net investment income | | | (2,200,003 | ) | | | (1,500,826 | ) |
|
|
Decrease in Net Assets From Distributions to Shareholders | | | (2,200,003 | ) | | | (1,500,826 | ) |
|
|
| FUND SHARE TRANSACTIONS (NOTE 4): | | | | | | | | |
Net proceeds from sale of shares | | | 923,656 | | | | 5,415,806 | |
Reinvestment of distributions | | | 2,200,003 | | | | 1,500,826 | |
Cost of shares repurchased | | | (14,251,947 | ) | | | (32,422,744 | ) |
Net assets of shares issued in connection with merger (Note 5) | | | — | | | | 2,864,133 | |
|
|
Decrease in Net Assets From Fund Share Transactions | | | (11,128,288 | ) | | | (22,641,979 | ) |
|
|
Increase in Net Assets | | | 22,169,815 | | | | 655,295 | |
| NET ASSETS: | | | | | | | | |
Beginning of period | | | 160,376,942 | | | | 159,721,647 | |
|
|
End of period* | | $ | 182,546,757 | | | $ | 160,376,942 | |
|
|
| | | | | |
* Includes undistributed (overdistributed) net investment income of: | | $ | (213,121) | | $1,268,503 |
|
See Notes to Financial Statements.
34 Legg Mason Partners Variable Portfolios III, Inc. 2006 Semi-Annual Report
Financial Highlights
For a share of capital stock outstanding throughout each year ended October 31, unless otherwise noted:
| | | | | | | | | | | | | | | | | | | | | | | | |
| | | | | | |
Legg Mason Partners Variable
Large Cap Value Portfolio | | 2006(1) | | | 2005 | | | 2004 | | | 2003 | | | 2002 | | | 2001 | |
Net Asset Value, Beginning of Period | | $ | 18.50 | | | $ | 17.09 | | | $ | 15.68 | | | $ | 13.24 | | | $ | 17.47 | | | $ | 20.74 | |
|
|
Income (Loss) From Operations: | | | | | | | | | | | | | | | | | | | | | | | | |
Net investment income | | | 0.15 | | | | 0.30 | | | | 0.26 | | | | 0.28 | | | | 0.32 | | | | 0.26 | |
Net realized and unrealized gain (loss) | | | 1.93 | | | | 1.45 | | | | 1.41 | | | | 2.49 | | | | (4.24 | ) | | | (2.56 | ) |
|
|
Total Income (Loss) From Operations | | | 2.08 | | | | 1.75 | | | | 1.67 | | | | 2.77 | | | | (3.92 | ) | | | (2.30 | ) |
|
|
Less Distributions From: | | | | | | | | | | | | | | | | | | | | | | | | |
Net investment income | | | (0.30 | ) | | | (0.34 | ) | | | (0.26 | ) | | | (0.33 | ) | | | (0.31 | ) | | | (0.27 | ) |
Net realized gains | | | — | | | | — | | | | — | | | | — | | | | — | | | | (0.70 | ) |
|
|
Total Distributions | | | (0.30 | ) | | | (0.34 | ) | | | (0.26 | ) | | | (0.33 | ) | | | (0.31 | ) | | | (0.97 | ) |
|
|
Net Asset Value, End of Period | | $ | 20.28 | | | $ | 18.50 | | | $ | 17.09 | | | $ | 15.68 | | | $ | 13.24 | | | $ | 17.47 | |
|
|
Total Return(2) | | | 11.37 | % | | | 10.26 | % | | | 10.69 | % | | | 21.38 | % | | | (22.45 | )% | | | (11.58 | )% |
|
|
Net Assets, End of Period (millions) | | | $305 | | | | $303 | | | | $333 | | | | $366 | | | | $346 | | | | $504 | |
|
|
Ratios to Average Net Assets: | | | | | | | | | | | | | | | | | | | | | | | | |
Gross expenses | | | 0.64 | %(3) | | | 0.65 | % | | | 0.68 | % | | | 0.69 | % | | | 0.68 | % | | | 0.67 | % |
Net expenses(4) | | | 0.63 | (3)(5) | | | 0.65 | | | | 0.68 | (5) | | | 0.69 | | | | 0.68 | | | | 0.67 | |
Net investment income | | | 1.44 | (3) | | | 1.62 | | | | 1.38 | | | | 1.85 | | | | 1.59 | | | | 1.42 | |
|
|
Portfolio Turnover Rate | | | 15 | % | | | 44 | % | | | 37 | % | | | 96 | % | | | 68 | % | | | 29 | % |
|
|
| (1) | | For the six months ended April 30, 2006 (unaudited). |
| (2) | | Performance figures may reflect voluntary fee waivers and/or expense reimbursements. Past performance is no guarantee of future results. In the absence of voluntary fee waivers and/or expense reimbursements, the total return would be lower. Total returns do not reflect expenses associated with the separate accounts such as administrative fees, account charges and surrender charges which, if reflected, would reduce the total return for all periods shown. Total returns for periods of less than one year are not annualized. |
| (4) | | As a result of a voluntary expense limitation, the ratio of expenses to average net assets will not exceed 1.25%. |
| (5) | | The investment manager voluntarily waived a portion of its fees and/or reimbursed expenses. |
See Notes to Financial Statements.
Legg Mason Partners Variable Portfolios III, Inc. 2006 Semi-Annual Report 35
Financial Highlights (continued)
For a share of capital stock outstanding throughout each year ended October 31, unless otherwise noted:
| | | | | | | | | | | | | | | | | | | | | | | | |
| | | | | | |
Legg Mason Partners Variable
Large Cap Growth Portfolio | | 2006(1) | | | 2005 | | | 2004 | | | 2003 | | | 2002 | | | 2001 | |
Net Asset Value, Beginning of Period | | $ | 14.51 | | | $ | 13.15 | | | $ | 13.76 | | | $ | 9.91 | | | $ | 11.86 | | | $ | 16.04 | |
|
|
Income (Loss) From Operations: | | | | | | | | | | | | | | | | | | | | | | | | |
Net investment income (loss) | | | 0.01 | | | | 0.06 | | | | (0.00 | )(2) | | | 0.01 | | | | 0.02 | | | | 0.02 | |
Net realized and unrealized gain (loss) | | | 0.32 | | | | 1.35 | | | | (0.61 | ) | | | 3.86 | | | | (1.95 | ) | | | (4.20 | ) |
|
|
Total Income (Loss) From Operations | | | 0.33 | | | | 1.41 | | | | (0.61 | ) | | | 3.87 | | | | (1.93 | ) | | | (4.18 | ) |
|
|
Less Distributions From: | | | | | | | | | | | | | | | | | | | | | | | | |
Net investment income | | | (0.02 | ) | | | (0.05 | ) | | | (0.00 | )(2) | | | (0.02 | ) | | | (0.02 | ) | | | — | |
Return of capital | | | — | | | | — | | | | (0.00 | )(2) | | | — | | | | — | | | | — | |
|
|
Total Distributions | | | (0.02 | ) | | | (0.05 | ) | | | (0.00 | )(2) | | | (0.02 | ) | | | (0.02 | ) | | | — | |
|
|
Net Asset Value, End of Period | | $ | 14.82 | | | $ | 14.51 | | | $ | 13.15 | | | $ | 13.76 | | | $ | 9.91 | | | $ | 11.86 | |
|
|
Total Return(3) | | | 2.27 | % | | | 10.74 | % | | | (4.42 | )% | | | 39.16 | % | | | (16.29 | )% | | | (26.06 | )% |
|
|
Net Assets, End of Period (millions) | | | $352 | | | | $378 | | | | $390 | | | | $354 | | | | $225 | | | | $280 | |
|
|
Ratios to Average Net Assets: | | | | | | | | | | | | | | | | | | | | | | | | |
Gross expenses | | | 0.79 | %(4) | | | 0.79 | % | | | 0.78 | % | | | 0.79 | % | | | 0.80 | % | | | 0.78 | % |
Net expenses | | | 0.78 | (4)(5) | | | 0.79 | | | | 0.78 | (5) | | | 0.79 | | | | 0.80 | | | | 0.78 | |
Net investment income (loss) | | | 0.14 | (4) | | | 0.43 | | | | (0.02 | ) | | | 0.06 | | | | 0.13 | | | | 0.14 | |
|
|
Portfolio Turnover Rate | | | 8 | % | | | 20 | % | | | 7 | % | | | 16 | % | | | 19 | % | | | 10 | % |
|
|
| (1) | | For the six months ended April 30, 2006 (unaudited). |
| (2) | | Amount represents less than $0.01 per share. |
| (3) | | Performance figures may reflect voluntary fee waivers and/or expense reimbursements. Past performance is no guarantee of future results. In the absence of voluntary fee waivers and/or expense reimbursements, the total return would be lower. Total returns do not reflect expenses associated with the separate accounts such as administrative fees, account charges and surrender charges which, if reflected, would reduce the total return for all periods shown. Total returns for periods of less than one year are not annualized. |
| (5) | | The investment manager voluntarily waived a portion of its fees and/or reimbursed expenses. |
See Notes to Financial Statements.
36 Legg Mason Partners Variable Portfolios III, Inc. 2006 Semi-Annual Report
Financial Highlights (continued)
For a share of capital stock outstanding throughout each year ended October 31, unless otherwise noted:
| | | | | | | | | | | | | | | | | | | | | | | | |
| | | | | | |
Legg Mason Partners Variable
Mid Cap Core Portfolio | | 2006(1) | | | 2005 | | | 2004 | | | 2003 | | | 2002 | | | 2001 | |
Net Asset Value, Beginning of Period | | $ | 14.76 | | | $ | 13.14 | | | $ | 12.35 | | | $ | 10.10 | | | $ | 10.83 | | | $ | 14.22 | |
|
|
Income (Loss) From Operations: | | | | | | | | | | | | | | | | | | | | | | | | |
Net investment income (loss) | | | 0.05 | | | | 0.06 | | | | (0.01 | ) | | | (0.00 | )(2) | | | (0.02 | ) | | | 0.02 | |
Net realized and unrealized gain (loss) | | | 2.00 | | | | 1.56 | | | | 0.80 | | | | 2.25 | | | | (0.70 | ) | | | (3.36 | ) |
|
|
Total Income (Loss) From Operations | | | 2.05 | | | | 1.62 | | | | 0.79 | | | | 2.25 | | | | (0.72 | ) | | | (3.34 | ) |
|
|
Less Distributions From: | | | | | | | | | | | | | | | | | | | | | | | | |
Net investment income | | | (0.09 | ) | | | — | | | | — | | | | — | | | | (0.01 | ) | | | (0.05 | ) |
Net realized gains | | | (1.12 | ) | | | — | | | | — | | | | — | | | | — | | | | — | |
|
|
Total Distributions | | | (1.21 | ) | | | — | | | | — | | | | — | | | | (0.01 | ) | | | (0.05 | ) |
|
|
Net Asset Value, End of Period | | $ | 15.60 | | | $ | 14.76 | | | $ | 13.14 | | | $ | 12.35 | | | $ | 10.10 | | | $ | 10.83 | |
|
|
Total Return(3) | | | 14.63 | % | | | 12.33 | % | | | 6.40 | % | | | 22.28 | % | | | (6.64 | )% | | | (23.56 | )% |
|
|
Net Assets, End of Period (millions) | | | $130 | | | | $121 | | | | $110 | | | | $87 | | | | $57 | | | | $34 | |
|
|
Ratios to Average Net Assets: | | | | | | | | | | | | | | | | | | | | | | | | |
Gross expenses | | | 0.81 | %(4) | | | 0.82 | % | | | 0.83 | % | | | 0.85 | % | | | 0.90 | % | | | 0.96 | % |
Net expenses(5) | | | 0.81 | (4)(6) | | | 0.82 | | | | 0.83 | (6) | | | 0.85 | | | | 0.90 | | | | 0.95 | (6) |
Net investment income (loss) | | | 0.57 | (4) | | | 0.44 | | | | (0.06 | ) | | | (0.03 | ) | | | (0.10 | ) | | | 0.25 | |
|
|
Portfolio Turnover Rate | | | 38 | % | | | 107 | % | | | 92 | % | | | 98 | % | | | 79 | % | | | 45 | % |
|
|
| (1) | | For the six months ended April 30, 2006 (unaudited). |
| (2) | | Amount represents less than $0.01 per share. |
| (3) | | Performance figures may reflect voluntary fee waivers and/or expense reimbursements. Past performance is no guarantee of future results. In the absence of voluntary fee waivers and/or expense reimbursements, the total return would be lower. Total returns do not reflect expenses associated with the separate accounts such as administrative fees, account charges and surrender charges which, if reflected, would reduce the total return for all periods shown. Total returns for periods of less than one year are not annualized. |
| (5) | | As a result of a voluntary expense limitation, the ratio of expenses to average net assets of the fund will not exceed 0.95%. |
| (6) | | The investment manager voluntarily waived a portion of its fees and/or reimbursed expenses. |
See Notes to Financial Statements.
Legg Mason Partners Variable Portfolios III, Inc. 2006 Semi-Annual Report 37
Financial Highlights (continued)
For a share of capital stock outstanding throughout each year ended October 31, unless otherwise noted:
| | | | | | | | | | | | | | | | | | | | | | | | |
| | | | | | |
Legg Mason Partners Variable
Aggressive Growth Portfolio | | 2006(1) | | | 2005(2) | | | 2004 | | | 2003 | | | 2002 | | | 2001 | |
Net Asset Value, Beginning of Period | | $ | 14.26 | | | $ | 12.24 | | | $ | 11.43 | | | $ | 9.09 | | | $ | 12.32 | | | $ | 15.03 | |
|
|
Income (Loss) From Operations: | | | | | | | | | | | | | | | | | | | | | | | | |
Net investment loss | | | (0.02 | ) | | | (0.04 | ) | | | (0.05 | ) | | | (0.04 | ) | | | (0.05 | ) | | | (0.05 | ) |
Net realized and unrealized gain (loss) | | | 1.55 | | | | 2.11 | | | | 0.86 | | | | 2.38 | | | | (3.18 | ) | | | (2.66 | ) |
|
|
Total Income (Loss) From Operations | | | 1.53 | | | | 2.07 | | | | 0.81 | | | | 2.34 | | | | (3.23 | ) | | | (2.71 | ) |
|
|
Less Distributions From: | | | | | | | | | | | | | | | | | | | | | | | | |
Net realized gains | | | (0.00 | )(3) | | | (0.05 | ) | | | — | | | | — | | | | — | | | | — | |
|
|
Total Distributions | | | (0.00 | )(3) | | | (0.05 | ) | | | — | | | | — | | | | — | | | | — | |
|
|
Net Asset Value, End of Period | | $ | 15.79 | | | $ | 14.26 | | | $ | 12.24 | | | $ | 11.43 | | | $ | 9.09 | | | $ | 12.32 | |
|
|
Total Return(4) | | | 10.73 | % | | | 16.94 | % | | | 7.09 | % | | | 25.74 | % | | | (26.22 | )% | | | (18.03 | )% |
|
|
Net Assets, End of Period (millions) | | | $1,190 | | | | $1,079 | | | | $920 | | | | $624 | | | | $415 | | | | $366 | |
|
|
Ratios to Average Net Assets: | | | | | | | | | | | | | | | | | | | | | | | | |
Gross expenses | | | 0.77 | %(5) | | | 0.82 | % | | | 0.82 | % | | | 0.82 | % | | | 0.83 | % | | | 0.84 | % |
Net expenses(6) | | | 0.76 | (5)(7) | | | 0.82 | | | | 0.82 | (7) | | | 0.82 | | | | 0.83 | | | | 0.84 | |
Net investment loss | | | (0.22 | )(5) | | | (0.27 | ) | | | (0.44 | ) | | | (0.49 | ) | | | (0.50 | ) | | | (0.40 | ) |
|
|
Portfolio Turnover Rate | | | 0 | % | | | 0 | % | | | 4 | % | | | 0 | % | | | 9 | % | | | 3 | % |
|
|
| (1) | | For the six months ended April 30, 2006 (unaudited). |
| (2) | | Per share amounts have been calculated using the average shares method. |
| (3) | | Amount represents less than $0.01 per share. |
| (4) | | Performance figures may reflect voluntary fee waivers and/or expense reimbursements. Past performance is no guarantee of future results. In the absence of voluntary fee waivers and/or expense reimbursements, the total return would be lower. Total returns do not reflect expenses associated with the separate accounts such as administrative fees, account charges and surrender charges which, if reflected, would reduce the total return for all periods shown. Total returns for periods of less than one year are not annualized. |
| (6) | | As a result of a voluntary expense limitation, the ratio of expenses to average net assets will not exceed 1.00%. |
| (7) | | The investment manager voluntarily waived a portion of its fees and/or reimbursed expenses. |
See Notes to Financial Statements.
38 Legg Mason Partners Variable Portfolios III, Inc. 2006 Semi-Annual Report
Financial Highlights (continued)
For a share of capital stock outstanding throughout each year ended October 31, unless otherwise noted:
| | | | | | | | | | | | | | | | | | | | | | | | |
| | | | | | |
Legg Mason Partners Variable
International All Cap
Growth Portfolio | | 2006(1) | | | 2005 | | | 2004(2) | | | 2003(2) | | | 2002(2) | | | 2001(2) | |
Net Asset Value, Beginning of Period | | $ | 13.56 | | | $ | 11.77 | | | $ | 10.43 | | | $ | 8.78 | | | $ | 11.18 | | | $ | 18.52 | |
|
|
Income (Loss) From Operations: | | | | | | | | | | | | | | | | | | | | | | | | |
Net investment income | | | 0.06 | | | | 0.13 | | | | 0.07 | | | | 0.10 | | | | 0.04 | | | | 0.05 | |
Net realized and unrealized gain (loss) | | | 3.04 | | | | 1.77 | | | | 1.37 | | | | 1.60 | | | | (2.39 | ) | | | (7.39 | ) |
|
|
Total Income (Loss) From Operations | | | 3.10 | | | | 1.90 | | | | 1.44 | | | | 1.70 | | | | (2.35 | ) | | | (7.34 | ) |
|
|
Less Distributions From: | | | | | | | | | | | | | | | | | | | | | | | | |
Net investment income | | | (0.19 | ) | | | (0.11 | ) | | | (0.10 | ) | | | (0.05 | ) | | | (0.05 | ) | | | — | |
|
|
Total Distributions | | | (0.19 | ) | | | (0.11 | ) | | | (0.10 | ) | | | (0.05 | ) | | | (0.05 | ) | | | — | |
|
|
Net Asset Value, End of Period | | $ | 16.47 | | | $ | 13.56 | | | $ | 11.77 | | | $ | 10.43 | | | $ | 8.78 | | | $ | 11.18 | |
|
|
Total Return(3) | | | 23.07 | % | | | 16.21 | % | | | 13.90 | % | | | 19.45 | % | | | (20.97 | )% | | | (39.63 | )% |
|
|
Net Assets, End of Period (millions) | | | $183 | | | | $160 | | | | $160 | | | | $180 | | | | $170 | | | | $244 | |
|
|
Ratios to Average Net Assets: | | | | | | | | | | | | | | | | | | | | | | | | |
Gross expenses | | | 0.96 | %(4) | | | 1.00 | % | | | 1.01 | % | | | 0.99 | % | | | 1.00 | % | | | 1.00 | % |
Net expenses(5) | | | 0.96 | (4)(6) | | | 1.00 | | | | 1.01 | (6) | | | 0.99 | | | | 1.00 | | | | 1.00 | |
Net investment income | | | 0.85 | (4) | | | 0.98 | | | | 0.67 | | | | 1.07 | | | | 0.42 | | | | 0.31 | |
|
|
Portfolio Turnover Rate | | | 6 | % | | | 16 | % | | | 21 | % | | | 45 | % | | | 27 | % | | | 22 | % |
|
|
| (1) | | For the six months ended April 30, 2006 (unaudited). |
| (2) | | Per share amounts have been calculated using the average shares method. |
| (3) | | Performance figures may reflect voluntary fee waivers and/or expense reimbursements. Past performance is no guarantee of future results. In the absence of voluntary fee waivers and/or expense reimbursements, the total return would be lower. Total returns do not reflect expenses associated with the separate accounts such as administrative fees, account charges and surrender charges which, if reflected, would reduce the total return for all periods shown. Total returns for periods of less than one year are not annualized. |
| (5) | | As a result of a voluntary expense limitation, the ratio of expenses to average net assets will not exceed 1.50%. |
| (6) | | The investment manager voluntarily waived a portion of its fees and/or reimbursed expenses. |
See Notes to Financial Statements.
Legg Mason Partners Variable Portfolios III, Inc. 2006 Semi-Annual Report 39
Notes to Financial Statements (unaudited)
| 1. | Organization and Significant Accounting Policies |
Legg Mason Partners Variable Large Cap Value Portfolio, Legg Mason Partners Variable Large Cap Growth Portfolio, Legg Mason Partners Variable Mid Cap Core Portfolio, Legg Mason Partners Variable Aggressive Growth Portfolio and Legg Mason Partners Variable International All Cap Growth Portfolio (formerly known as Smith Barney Large Cap Value Portfolio, Smith Barney Large Capitalization Growth Portfolio, Smith Barney Mid Cap Core Portfolio, Smith Barney Aggressive Growth Portfolio and Smith Barney International All Cap Growth Portfolio), respectively (the “Funds”) are separate diversified investment funds of Legg Mason Partners Variable Portfolios III, Inc. (formerly known as Travelers Series Fund Inc.) (the “Company”). The Company, a Maryland corporation, is registered under the Investment Company Act of 1940, as amended (the “1940 Act”), as an open-end management investment company. Shares of the Funds may only be purchased or redeemed through variable annuity contracts and variable life insurance policies offered by the separate accounts of participating life insurance companies or through eligible pension or other qualified plans.
The following are significant accounting policies consistently followed by the Funds and are in conformity with U.S. generally accepted accounting principles (“GAAP”). Estimates and assumptions are required to be made regarding assets, liabilities and changes in net assets resulting from operations when financial statements are prepared. Changes in the economic environment, financial markets and any other parameters used in determining these estimates could cause actual results to differ.
(a) Investment Valuation. Equity securities for which market quotations are available are valued at the last sale price or official closing price on the primary market or exchange on which they trade. Debt securities are valued at the mean between the bid and asked prices provided by an independent pricing service that are based on transactions in debt obligations, quotations from bond dealers, market transactions in comparable securities and various relationships between securities. When prices are not readily available, or are determined not to reflect fair value, such as when the value of a security has been significantly affected by events after the close of the exchange or market on which the security is principally traded, but before the Funds calculate their net asset value, the Funds may value these investments at fair value as determined in accordance with the procedures approved by the Funds’ Board of Directors. Fair valuing of securities may be determined with the assistance of a pricing service using calculations based on indices of domestic securities and other appropriate indicators, such as prices of relevant ADRs and futures contracts. Short-term obligations maturing within 60 days are valued at amortized cost, which approximates market value.
(b) Repurchase Agreements. When entering into repurchase agreements, it is the Funds’ policy that their custodian or a third party custodian take possession of the underlying collateral securities, the market value of which at least equals the principal amount of the repurchase transaction, including accrued interest. To the extent that any repurchase transaction exceeds one business day, the value of the collateral is marked-to-market to ensure the adequacy of the collateral. If the seller defaults and the market value of the collateral declines or if bankruptcy proceedings are commenced with respect to the seller of the security, realization of the collateral by the Funds may be delayed or limited.
40 Legg Mason Partners Variable Portfolios III, Inc. 2006 Semi-Annual Report
Notes to Financial Statements (unaudited) (continued)
(c) Lending of Portfolio Securities. The Funds have an agreement with their custodian whereby the custodian may lend securities owned by the Funds to brokers, dealers and other financial organizations. In exchange for lending securities under the terms of the agreement with their custodian, the Funds receive a lender’s fee. Fees earned by the Funds on securities lending are recorded as securities lending income. Loans of securities by the Funds are collateralized by cash, U.S. government securities or high quality money market instruments that are maintained at all times in an amount at least equal to the current market value of the loaned securities, plus a margin which varies depending on the type of securities loaned. The custodian establishes and maintains the collateral in a segregated account. The Funds have the right under the lending agreement to recover the securities from the borrower on demand.
The Funds maintain the risk of any loss on the securities on loan as well as the potential loss on investments purchased with cash collateral received from securities lending.
(d) Foreign Risk. The Funds’ investments in foreign securities may involve risks not present in domestic investments. Since securities may be denominated in foreign currencies and may require settlement in foreign currencies and pay interest or dividends in foreign currencies, changes in the relationship of these foreign currencies to the U.S. dollar can significantly affect the value of the investments and earnings of the Funds. Foreign investments may also subject the Funds to foreign government exchange restrictions, expropriation, taxation or other political, social or economic developments, all of which affect the market and/or credit risk of the investments.
(e) Foreign Currency Translation. Investment securities and other assets and liabilities denominated in foreign currencies are translated into U.S. dollar amounts based upon prevailing exchange rates on the date of valuation. Purchases and sales of investment securities and income and expense items denominated in foreign currencies are translated into U.S. dollar amounts based upon prevailing exchange rates on the respective dates of such transactions.
The Funds do not isolate that portion of the results of operations resulting from changes in foreign exchange rates on investments from the fluctuations arising from changes in market prices of securities held. Such fluctuations are included with the net realized and unrealized gain or loss on investments.
Net realized foreign exchange gains or losses arise from sales of foreign currencies, including gains and losses on forward foreign currency contracts, currency gains or losses realized between the trade and settlement dates on securities transactions and the difference between the amounts of dividends, interest and foreign withholding taxes recorded on the Funds’ books and the U.S. dollar equivalent of the amounts actually received or paid. Net unrealized foreign exchange gains and losses arise from changes in the fair values of assets and liabilities, other than investments in securities, at the date of valuation, resulting from changes in exchange rates.
Foreign security and currency transactions may involve certain considerations and risks not typically associated with those of U.S. dollar denominated transactions as a result of, among other factors, the possibility of lower levels of governmental supervision and regulation of foreign securities markets and the possibility of political or economic instability.
Legg Mason Partners Variable Portfolios III, Inc. 2006 Semi-Annual Report 41
Notes to Financial Statements (unaudited) (continued)
(f) Security Transactions and Investment Income. Security transactions are accounted for on a trade date basis. Interest income, adjusted for amortization of premium and accretion of discount, is recorded on the accrual basis. Dividend income is recorded on the ex-dividend date. Foreign dividend income is recorded on the ex-dividend date or as soon as practical after the Funds determine the existence of a dividend declaration after exercising reasonable due diligence. The cost of investments sold is determined by use of the specific identification method. To the extent any issuer defaults on an expected interest payment, the Funds’ policy is to generally halt any additional interest income accruals and consider the realizability of interest accrued up to the date of default.
(g) Distributions to Shareholders. Distributions from net investment income and distributions of net realized gains, if any, are declared at least annually. Distributions to shareholders of the Funds are recorded on the ex-dividend date and are determined in accordance with income tax regulations, which may differ from GAAP.
(h) Federal and Other Taxes. It is the Funds’ policy to comply with the federal income and excise tax requirements of the Internal Revenue Code of 1986, as amended, applicable to regulated investment companies. Accordingly, the Funds intend to distribute substantially all of its income and net realized gains on investments, if any, to shareholders each year. Therefore, no federal income tax provision is required in the Funds’ financial statements. Under the applicable foreign tax laws, a withholding tax may be imposed on interest, dividends and capital gains at various rates.
(i) Reclassification. GAAP requires that certain components of net assets be adjusted to reflect permanent differences between financial and tax reporting. These reclassifications have no effect on net assets or net asset values per share.
| 2. | Investment Management Agreement and Other Transactions with Affiliates |
On December 1, 2005, Citigroup Inc. (“Citigroup”) completed the sale of substantially all of its asset management business, Citigroup Asset Management (“CAM”), to Legg Mason, Inc. (“Legg Mason”). As a result, the Funds’ investment manager, Smith Barney Fund Management LLC (“SBFM” or the “Manager”), previously an indirect wholly-owned subsidiary of Citigroup, has become a wholly-owned subsidiary of Legg Mason. Completion of the sale caused the Funds’ existing investment management contracts to terminate. The Funds’ shareholders approved a new investment management contract between the Funds and the Manager, which became effective on December 1, 2005.
Legg Mason, whose principal executive offices are in Baltimore, Maryland, is a financial services holding company.
42 Legg Mason Partners Variable Portfolios III, Inc. 2006 Semi-Annual Report
Notes to Financial Statements (unaudited) (continued)
Effective November 1, 2005 and under the new Investment Management agreements effective December 1, 2005, Legg Mason Partners Variable Mid Cap Core Portfolio pays the Manager a management fee calculated daily and payable monthly at an annual rate of 0.75% of the Fund’s average daily net assets. Legg Mason Partners Variable Large Cap Value Portfolio, Legg Mason Partners Variable Large Cap Growth Portfolio, Legg Mason Partners Variable Aggressive Growth Portfolio and Legg Mason Partners Variable International All Cap Growth Portfolio pay the Manager an investment management fee, which is calculated in accordance with the following breakpoint schedule:
| | | |
| |
| Average Daily Net Assets | | Annual Rate | |
|
|
Legg Mason Partners Variable Large Cap Value Portfolio | | | |
|
|
First $500 million | | 0.600 | % |
Next $500 million | | 0.550 | |
Over $1 billion | | 0.500 | |
|
|
Legg Mason Partners Variable Large Cap Growth Portfolio | | | |
|
|
First $1 billion | | 0.750 | % |
Next $1 billion | | 0.725 | |
Next $3 billion | | 0.700 | |
Next $5 billion | | 0.675 | |
Over $10 billion | | 0.650 | |
|
|
Legg Mason Partners Variable Aggressive Growth Portfolio | | | |
|
|
First $1 billion | | 0.750 | % |
Next $1 billion | | 0.725 | |
Next $3 billion | | 0.700 | |
Next $5 billion | | 0.675 | |
Over $10 billion | | 0.650 | |
|
|
Legg Mason Partners Variable International All Cap Growth Portfolio | | | |
|
|
First $1 billion | | 0.850 | % |
Next $1 billion | | 0.825 | |
Next $3 billion | | 0.800 | |
Next $5 billion | | 0.775 | |
Over $10 billion | | 0.750 | |
|
|
During the six months ended April 30, 2006, Legg Mason Partners Variable Large Cap Value Portfolio, Legg Mason Partners Variable Mid Cap Core Portfolio, Legg Mason Partners Variable Aggressive Growth Portfolio and Legg Mason Partners Variable International All Cap Growth Portfolio, had voluntary expense limitations in place of 1.25%, 0.95%, 1.00% and 1.50%, respectively. These expense limitations are voluntary and may be terminated at any time.
During the six months ended April 30, 2006, the Manager waived and/or reimbursed expenses amounting to $8,241 for Legg Mason Partners Variable Large Cap Value Portfolio; $9,948 for Legg Mason Partners Variable Large Cap Growth Portfolio; $4,296 for Legg Mason Partners Variable Mid Cap Core Portfolio; $26,468 for Legg Mason Partners Variable Aggressive Growth Portfolio and $5,221 for Legg Mason Partners Variable International All Cap Growth Portfolio, respectively.
Legg Mason Partners Variable Portfolios III, Inc. 2006 Semi-Annual Report 43
Notes to Financial Statements (unaudited) (continued)
The Funds’ Board has approved PFPC Inc. (“PFPC”) to serve as transfer agent for the Funds, effective January 1, 2006. The principal business office of PFPC is located at 4400 Computer Drive, Westborough, MA 01581. Prior to January 1, 2006, Citicorp Trust Bank, fsb. (“CTB”), a subsidiary of Citigroup, acted as the Funds’ transfer agent. Also, prior to January 1, 2006, PFPC acted as the Funds’ sub-transfer agent. CTB received account fees and asset-based fees that varied according to the size and type of account. PFPC was responsible for shareholder recordkeeping and financial processing for all shareholder accounts and was paid by CTB. For the period ended April 30, 2006, the Funds paid transfer agent fees of $10,480 to CTB.
The totals for each Fund were as follows:
| | | |
| |
| | | Transfer Agent Fees |
Legg Mason Partners Variable Large Cap Value Portfolio | | $ | 2,097 |
Legg Mason Partners Variable Large Cap Growth Portfolio | | | 2,093 |
Legg Mason Partners Variable Mid Cap Core Portfolio | | | 2,092 |
Legg Mason Partners Variable Aggressive Growth Portfolio | | | 2,093 |
Legg Mason Partners Variable International All Cap Growth Portfolio | | | 2,105 |
|
The Funds’ Board has appointed the Funds’ current distributor, Citigroup Global Markets Inc. (“CGM”), and Legg Mason Investor Services, LLC (“LMIS”), a wholly-owned broker-dealer subsidiary of Legg Mason, as co-distributors of the Funds. CGM and other broker-dealers, financial intermediaries and financial institutions (each called a “Service Agent”) that currently offer Fund shares will continue to make the Funds’ shares available to their clients. Additional Service Agents may offer Fund shares in the future.
For the six months ended April 30, 2006, CGM, its affiliates and LMIS did not receive any brokerage commissions from the Funds.
Certain officers and one Director of the Company are employees of Legg Mason or its affiliates and do not receive compensation from the Company.
During the six months ended April 30, 2006, the aggregate cost of purchases and proceeds from sales of investments (excluding short-term investments) were as follows:
| | | | | | |
| | |
| | | Purchases | | Sales |
Legg Mason Partners Variable Large Cap Value Portfolio | | $ | 45,259,085 | | $ | 74,510,653 |
Legg Mason Partners Variable Large Cap Growth Portfolio | | | 29,908,301 | | | 65,423,206 |
Legg Mason Partners Variable Mid Cap Core Portfolio | | | 46,689,287 | | | 53,610,630 |
Legg Mason Partners Variable Aggressive Growth Portfolio | | | 16,349,882 | | | 116,708 |
Legg Mason Partners Variable International All Cap Growth Portfolio | | | 9,320,713 | | | 20,328,430 |
|
44 Legg Mason Partners Variable Portfolios III, Inc. 2006 Semi-Annual Report
Notes to Financial Statements (unaudited) (continued)
At April 30, 2006, the aggregate gross unrealized appreciation and depreciation of investments for federal income tax purposes were substantially as follows:
| | | | | | | | | | |
| | | |
| | | Gross unrealized
appreciation | | Gross unrealized
depreciation | | | Net unrealized
appreciation |
Legg Mason Partners Variable Large Cap Value Portfolio | | $ | 61,311,778 | | $ | (2,614,737 | ) | | $ | 58,697,041 |
Legg Mason Partners Variable Large Cap Growth Portfolio | | | 94,818,940 | | | (6,085,220 | ) | | | 88,733,720 |
Legg Mason Partners Variable Mid Cap Core Portfolio | | | 22,223,030 | | | (2,155,939 | ) | | | 20,067,091 |
Legg Mason Partners Variable Aggressive Growth Portfolio | | | 357,048,453 | | | (112,333,911 | ) | | | 244,714,542 |
Legg Mason Partners Variable International All Cap Growth Portfolio | | | 78,500,127 | | | (901,586 | ) | | | 77,598,541 |
|
At April 30, 2006, Legg Mason Partners Variable Large Cap Value Portfolio, Legg Mason Partners Variable Large Cap Growth Portfolio, Legg Mason Partners Variable Mid Cap Core Portfolio, Legg Mason Partners Variable Aggressive Growth Portfolio and Legg Mason Partners Variable International All Cap Growth Portfolio did not have any securities on loan.
At April 30, 2006, the Company had six billion shares of capital stock authorized with a par value of $0.00001 per share. Each share of a Fund represents an equal proportionate interest in that Fund with each other share of the same Fund and has an equal entitlement to any dividends and distributions made by the Fund.
Transactions in shares of each Fund were as follows:
| | | | | | |
| | | Six Months Ended
April 30, 2006 | | | Year Ended
October 31, 2005 | |
Legg Mason Partners Variable Large Cap Value Portfolio | | | | | | |
|
|
Shares sold | | 25,965 | | | 174,564 | |
Shares issued on reinvestment | | 252,366 | | | 354,179 | |
Shares repurchased | | (1,628,759 | ) | | (3,655,136 | ) |
|
|
Net Decrease | | (1,350,428 | ) | | (3,126,393 | ) |
|
|
Legg Mason Partners Variable Large Cap Growth Portfolio | | | | | | |
|
|
Shares sold | | 345,654 | | | 837,308 | |
Shares issued on reinvestment | | 32,723 | | | 104,161 | |
Shares repurchased | | (2,694,805 | ) | | (4,531,870 | ) |
|
|
Net Decrease | | (2,316,428 | ) | | (3,590,401 | ) |
|
|
Legg Mason Partners Variable Portfolios III, Inc. 2006 Semi-Annual Report 45
Notes to Financial Statements (unaudited) (continued)
| | | | | | |
| | | Six Months Ended
April 30, 2006 | | | Year Ended
October 31, 2005 | |
Legg Mason Partners Variable Mid Cap Core Portfolio | | | | | | |
|
|
Shares sold | | 67,766 | | | 618,090 | |
Shares issued on reinvestment | | 681,898 | | | — | |
Shares repurchased | | (580,538 | ) | | (836,951 | ) |
|
|
Net Increase (Decrease) | | 169,126 | | | (218,861 | ) |
|
|
Legg Mason Partners Variable Aggressive Growth Portfolio | | | | | | |
|
|
Shares sold | | 2,351,882 | | | 4,820,016 | |
Shares issued on reinvestment | | 2,165 | | | 281,999 | |
Shares repurchased | | (2,647,626 | ) | | (4,607,553 | ) |
|
|
Net Increase (Decrease) | | (293,579 | ) | | 494,462 | |
|
|
Legg Mason Partners Variable International All Cap Growth Portfolio | | | | |
|
|
Shares sold | | 60,905 | | | 423,243 | |
Shares issued on reinvestment | | 153,310 | | | 115,894 | |
Shares repurchased | | (958,853 | ) | | (2,502,814 | ) |
Shares issued in connection with merger | | — | | | 224,109 | |
|
|
Net Decrease | | (744,638 | ) | | (1,739,568 | ) |
|
|
On July 8, 2005, Legg Mason Partners Variable International All Cap Growth Portfolio acquired the assets and certain liabilities of the GSS Salomon Brothers Variable International Equity Fund pursuant to a plan of reorganization approved by GSS Salomon Brothers Variable International Equity Fund shareholders on July 1, 2005. Total shares issued by Legg Mason Partners Variable International All Cap Growth Portfolio, the total net assets of the GSS Salomon Brothers Variable International Equity Fund and total net assets of Legg Mason Partners Variable International All Cap Growth Portfolio on the date of the transfer were as follows:
| | | | | | | | |
| | | |
| Acquired Fund | | Shares Issued by
Legg Mason
Partners Variable
International All Cap
Growth Portfolio | | Total Net Assets of the GSS
Salomon Brothers Variable
International Equity Fund | | Total Net Assets of,
Legg Mason
Partners Variable
International All Cap
Growth Portfolio |
GSS Salomon Brothers Variable International Equity Fund | | 224,109 | | $ | 2,864,133 | | $ | 158,199,570 |
|
The total assets of the GSS Salomon Brothers Variable International Equity Fund before acquisition included unrealized depreciation of $961,933 and accumulated net realized gains of $494. Total net assets of Legg Mason Partners Variable International All Cap Growth Portfolio immediately after the transfer were $161,063,703. The transaction was structured to qualify as a tax-free reorganization under the Internal Revenue Code of 1986, as amended.
46 Legg Mason Partners Variable Portfolios III, Inc. 2006 Semi-Annual Report
Notes to Financial Statements (unaudited) (continued)
| 6. | Capital Loss Carryforward |
On October 31, 2005, the Legg Mason Partners Variable Large Cap Value Portfolio Fund had a net capital loss carryforward of $29,341,801 of which $6,191,123 expires in 2010, $23,150,678 expires in 2011. The Legg Mason Partners Variable Large Cap Growth Portfolio Fund had a net capital loss carryforward of $64,924,813 of which $2,019,427 expires in 2008, $5,453,825 expires in 2009, $30,603,559 expires in 2010, $8,588,495 expires in 2011, $5,325,802 expires in 2012 and $12,933,705 expires in 2013. The Legg Mason Partners Variable International All Cap Growth Portfolio Fund had a net capital loss carryforward of $61,381,331 of which $38,021,872 expires in 2009, $13,574,174 expires in 2010 and $9,785,285 expires in 2011. These amounts will be available to offset any future taxable capital gain.
On May 31, 2005, the U.S. Securities and Exchange Commission (“SEC”) issued an order in connection with the settlement of an administrative proceeding against SBFM and CGM relating to the appointment of an affiliated transfer agent for the Smith Barney family of mutual funds (the “Funds”).
The SEC order finds that SBFM and CGM willfully violated Section 206(1) of the Investment Advisers Act of 1940 (“Advisers Act”). Specifically, the order finds that SBFM and CGM knowingly or recklessly failed to disclose to the boards of the Funds in 1999 when proposing a new transfer agent arrangement with an affiliated transfer agent that: First Data Investors Services Group (“First Data”), the Funds’ then-existing transfer agent, had offered to continue as transfer agent and do the same work for substantially less money than before; and that Citigroup Asset Management (“CAM”), the Citigroup business unit that, at the time, included the fund’s investment manager and other investment advisory companies, had entered into a side letter with First Data under which CAM agreed to recommend the appointment of First Data as sub-transfer agent to the affiliated transfer agent in exchange for, among other things, a guarantee by First Data of specified amounts of asset management and investment banking fees to CAM and CGM. The order also finds that SBFM and CGM willfully violated Section 206(2) of the Advisers Act by virtue of the omissions discussed above and other misrepresentations and omissions in the materials provided to the Funds’ boards, including the failure to make clear that the affiliated transfer agent would earn a high profit for performing limited functions while First Data continued to perform almost all of the transfer agent functions, and the suggestion that the proposed arrangement was in the Funds’ best interests and that no viable alternatives existed. SBFM and CGM do not admit or deny any wrongdoing or liability. The settlement does not establish wrongdoing or liability for purposes of any other proceeding.
The SEC censured SBFM and CGM and ordered them to cease and desist from violations of Sections 206(1) and 206(2) of the Advisers Act. The order requires Citigroup to pay $208.1 million, including $109 million in disgorgement of profits, $19.1 million in interest, and a civil money penalty of $80 million. Approximately $24.4 million has already been paid to the Funds, primarily through fee waivers. The remaining $183.7 million, including the penalty, has been paid to the U.S. Treasury and will be distributed pursuant to a plan submitted for the approval of the SEC. At this time, there is no
Legg Mason Partners Variable Portfolios III, Inc. 2006 Semi-Annual Report 47
Notes to Financial Statements (unaudited) (continued)
certainty as to how the above-described proceeds of the settlement will be distributed, to whom such distributions will be made, the methodology by which such distributions will be allocated, and when such distributions will be made.
The order also required that transfer agency fees received from the Funds since December 1, 2004 less certain expenses be placed in escrow and provided that a portion of such fees might be subsequently distributed in accordance with the terms of the order. On April 3, 2006, an aggregate amount of approximately $9 million was distributed to the affected Funds.
The order required SBFM to recommend a new transfer agent contract to the Fund boards within 180 days of the entry of the order; if a Citigroup affiliate submitted a proposal to serve as transfer agent or sub-transfer agent, SBFM and CGM would have been required, at their expense, to engage an independent monitor to oversee a competitive bidding process. On November 21, 2005, and within the specified timeframe, the Fund’s Board selected a new transfer agent for the Fund. No Citigroup affiliate submitted a proposal to serve as transfer agent. Under the order, SBFM also must comply with an amended version of a vendor policy that Citigroup instituted in August 2004.
Although there can be no assurance, SBFM does not believe that this matter will have a material adverse effect on the Funds.
On December 1, 2005, Citigroup completed the sale of substantially all of its global asset management business, including SBFM, to Legg Mason.
Beginning in August 2005, five class action lawsuits alleging violations of federal securities laws and state law were filed against CGM and SBFM (collectively, the “Defendants”) based on the May 31, 2005 settlement order issued against the Defendants by the SEC described in Note 7. The complaints seek injunctive relief and compensatory and punitive damages, removal of SBFM as the investment manager for the Smith Barney family of funds, rescission of the Funds’ management and other contracts with SBFM, recovery of all fees paid to SBFM pursuant to such contracts, and an award of attorneys’ fees and litigation expenses.
On October 5, 2005, a motion to consolidate the five actions and any subsequently filed, related action was filed. That motion contemplates that a consolidated amended complaint alleging substantially similar causes of action will be filed in the future.
As of the date of this report, the Fund’s investment manager believes that resolution of the pending lawsuit will not have a material effect on the financial position or results of operations of the Fund or the ability of the Fund’s investment manager and its affiliates to continue to render services to the Funds under their respective contracts.
* * *
Beginning in June 2004, class action lawsuits alleging violations of the federal securities laws were filed against CGM and a number of its affiliates, including SBFM and Salomon Brothers Asset Management Inc. (“SBAM”) (collectively, the “Advisers”), substantially all of the mutual funds managed by the Advisers, including the Fund (the “Funds”), and directors or trustees of the Funds (collectively, the “Defendants”). The complaints alleged,
48 Legg Mason Partners Variable Portfolios III, Inc. 2006 Semi-Annual Report
Notes to Financial Statements (unaudited) (continued)
among other things, that CGM created various undisclosed incentives for its brokers to sell Smith Barney and Salomon Brothers funds. In addition, according to the complaints, the Advisers caused the Funds to pay excessive brokerage commissions to CGM for steering clients towards proprietary funds. The complaints also alleged that the Defendants breached their fiduciary duty to the Funds by improperly charging Rule l2b-1 fees and by drawing on fund assets to make undisclosed payments of soft dollars and excessive brokerage commissions. The complaints also alleged that the Funds failed to adequately disclose certain aspects of the allegedly wrongful conduct. The complaints sought injunctive relief and compensatory and punitive damages, rescission of the Funds’ contracts with the Advisers, recovery of all fees paid to the Advisers pursuant to such contracts and an award of attorneys’ fees and litigation expenses.
On December 15, 2004, a consolidated amended complaint (the “Complaint”) was filed alleging substantially similar causes of action. While the lawsuit is in its earliest stages, to the extent that the Complaint purports to state causes of action against the Funds, the Fund’s investment manager believes the Funds have significant defenses to such allegations, which the Funds intend to vigorously assert in responding to the Complaint.
Additional lawsuits arising out of theses circumstances and presenting similar allegations and requests for relief may be filed against the Defendants in the future.
As of the date of this report, the Fund’s investment manager and the Funds believe that the resolution of the pending lawsuit will not have a material effect on the financial position or results of operations of the Funds or the ability of the Advisers and their affiliates to continue to render services to the Funds under their respective contracts.
The Defendants have moved to dismiss the Complaint. Those motions are pending before the court.
On September 16, 2005, the staff of the Securities and Exchange Commission (the “Commission”) informed SBFM and SBAM that the staff is considering recommending that the Commission institute administrative proceedings against SBFM and SBAM for alleged violations of Section 19(a) and 34(b) of the Investment Company Act (and related Rule 19a-1). The notification is a result of an industry wide inspection by the SEC and is based upon alleged deficiencies in disclosures regarding dividends and distributions paid to shareholders of certain funds. Section 19(a) and related Rule 19a-1 of the Investment Company Act generally require funds that are making dividend and distribution payments to provide shareholders with a written statement disclosing the source of the dividends and distributions, and, in particular, the portion of the payments made from each of net investment income, undistributed net profits and/or paid-in capital. In connection with the contemplated proceedings, the staff may seek a cease and desist order and/or monetary damages from SBFM or SBAM.
Although there can be no assurance, SBFM believes that this matter is not likely to have a material adverse effect on the Funds or SBFM’s ability to perform investment management services relating to the Funds.
Legg Mason Partners Variable Portfolios III, Inc. 2006 Semi-Annual Report 49
Additional Shareholder Information (unaudited)
Results of a Special Meeting of Shareholders
On November 15, 2005, a Special Meeting of Shareholders was held for the following purposes: 1) to approve a new management agreement and 2) to elect Directors of the Company to oversee the Funds. The following tables provide the number of votes cast for, against or withheld, as well as the number of abstentions and broker non-votes as to each matter voted on at the Special Meeting of Shareholders.
1. Approval of New Management Agreement
| | | | | | | | |
| Fund Name | | Votes For | | Votes Against | | Abstentions | | Broker Non-Votes |
Legg Mason Partners Variable Large Cap Value Portfolio | | 13,670,372.185 | | 258,701.103 | | 606,723.162 | | 0.000 |
Legg Mason Partners Variable Large Cap Growth Portfolio | | 25,401,706.570 | | 340,106.990 | | 904,455.030 | | 0.000 |
Legg Mason Partners Variable Mid Cap Core Portfolio | | 7,850,506.152 | | 141,232.635 | | 303,474.232 | | 0.000 |
Legg Mason Partners Variable Aggressive Growth Portfolio | | 72,040,450.790 | | 1,572,564.120 | | 2,469,981.890 | | 0.000 |
Legg Mason Partners Variable International All Cap Growth Portfolio | | 10,445,981.758 | | 247,818.709 | | 347,653.702 | | 0.000 |
|
2. Election of Directors1
| | | | | | | | |
| Nominees | | Votes For | | Authority
Withheld | | Abstentions | | Broker Non-Votes |
Robert A. Frankel | | 644,358,719.408 | | 16,164,564.582 | | 0.000 | | 0.000 |
Michael E. Gellert | | 644,364,511.260 | | 16,158,772.730 | | 0.000 | | 0.000 |
Rainer Greeven | | 644,620,846.258 | | 15,902,437.742 | | 0.000 | | 0.000 |
Susan M. Heilborn | | 644,899,625.635 | | 15,623,658.365 | | 0.000 | | 0.000 |
R. Jay Gerken | | 644,284,458.802 | | 16,238,825.188 | | 0.000 | | 0.000 |
|
| 1 | | Directors are elected by the shareholders of all of the series of the Company of which the Funds are a series. |
50 Legg Mason Partners Variable Portfolios III, Inc. 2006 Semi-Annual Report
Legg Mason Partners Variable Portfolios III, Inc.
| | |
DIRECTORS Robert A. Frankel Michael E. Gellert R. Jay Gerken, CFA Chairman Rainer Greeven Susan M. Heilbron OFFICERS R. Jay Gerken, CFA President and Chief Executive Officer Andrew B. Shoup Senior Vice President and Chief Administrative Officer James M. Giallanza Chief Financial Officer and Treasurer Brian Angerame Vice President and Investment Officer Derek Deutsch Vice President and Investment Officer Peter Stournaras Vice President and Investment Officer Alan J. Blake Vice President and Investment Officer Robert Feitler Vice President and Investment Officer Richard A. Freeman Vice President and Investment Officer Mark J. McAllister, CFA Vice President and Investment Officer | | OFFICERS (continued) Jeffrey J. Russell Vice President and Investment Officer Ted P. Becker Chief Compliance Officer John Chiota Chief Anti-Money Laundering Compliance Officer Robert I. Frenkel Secretary and Chief Legal Officer INVESTMENT MANAGER Smith Barney Fund
Management LLC DISTRIBUTORS Citigroup Global Markets Inc. Legg Mason Investor Services, LLC CUSTODIAN State Street Bank and Trust
Company ANNUITY ADMINISTRATION Travelers Annuity Investor Services One Cityplace Hartford, CT 06103-3415 TRANSFER AGENT PFPC Inc. 4400 Computer Drive Westborough, Massachusetts 01581 INDEPENDENT REGISTERED PUBLIC ACCOUNTING FIRM KPMG LLP 345 Park Avenue New York, New York 10154 |
This report is submitted for the general information of the shareholders of the Legg Mason Partners Variable Portfolios III, Inc. — Legg Mason Partners Variable Large Cap Value Portfolio, Legg Mason Partners Variable Large Cap Growth Portfolio, Legg Mason Partners Variable Mid Cap Core Portfolio, Legg Mason Partners Variable Aggressive Growth Portfolio and Legg Mason Partners Variable International All Cap Growth Portfolio.
This report must be preceded or accompanied by a free prospectus. Investors should consider the Funds’ investment objectives, risks, charges and expenses before investing. The prospectus contains this and other important information about the Funds. Please read the prospectus carefully before investing.
www.leggmason.com/InvestorServices
©2006 Legg Mason Investor Services, LLC Member NASD, SIPC
Legg Mason Partners Variable Portfolios III, Inc.
Legg Mason Partners Variable Large Cap Value Portfolio
Legg Mason Partners Variable Large Cap Growth Portfolio
Legg Mason Partners Variable Mid Cap Core Portfolio
Legg Mason Partners Variable Aggressive Growth Portfolio
Legg Mason Partners Variable International All Cap Growth Portfolio
The Funds are separate investment funds of the Legg Mason Partners Variable Portfolios III, Inc., a Maryland corporation.
LEGG MASON PARTNERS VARIABLE PORTFOLIOS III, INC.
Legg Mason Partners Funds
125 Broad Street
10th Floor, MF-2
New York, New York 10004
The Funds file their complete schedule of portfolio holdings with the Securities and Exchange Commission for the first and third quarters of each fiscal year on Form N-Q. The Funds’ Forms N-Q are available on the Commission’s website at www.sec.gov. The Funds’ Forms N-Q may be reviewed and copied at the Commission’s Public Reference Room in Washington D.C., and information on the operation of the Public Reference Room may be obtained by calling 1-800-SEC-0330. To obtain information on Form N-Q from the Funds, shareholders can call 1-800-451-2010.
Information an how the Funds voted proxies relating to portfolio securities during the prior 12 month period ended June 30th of each year and a description of the policies and procedures that the Funds use to determine how to vote proxies related to portfolio transactions is available (1) without charge, upon request, by calling 1-800-451-2010, (2) on each Fund’s website at www.leggmason.com/InvestorServices and (3) on the SEC’s website at www.sec.gov. Proxy voting reports for the period ending June 30, 2005 will be continue to be listed under the Funds’ former Travelers Series Fund Inc. name.