UNITED STATES
SECURITIES AND EXCHANGE COMMISSION
Washington, D.C. 20549
FORM N-CSR
CERTIFIED SHAREHOLDER REPORT OF REGISTERED
MANAGEMENT INVESTMENT COMPANIES
Investment Company Act file number 811-8372
| | |
Legg Mason Partners Variable Portfolios III, Inc. |
| (Exact name of registrant as specified in charter) |
| |
125 Broad Street, New York, | | NY 10004 |
| (Address of principal executive offices) | | (Zip code) |
|
Robert I. Frenkel, Esq. Legg Mason & Co., LLC 300 First Stamford Place, 4th Fl. Stamford, CT 06902 |
| (Name and address of agent for service) |
Registrant’s telephone number, including area code: (800) 451-2010
| | |
| Date of fiscal year end: | | October 31 |
| |
| Date of reporting period: | | October 31, 2006 |
| ITEM 1. | REPORT TO STOCKHOLDERS. |
The Annual Report to Stockholders is filed herewith.
ANNUAL REPORT
OCTOBER 31, 2006

Legg Mason Partners Variable Portfolios III, Inc.
Legg Mason Partners Variable Large Cap Value Portfolio
Legg Mason Partners Variable Large Cap Growth Portfolio
Legg Mason Partners Variable Mid Cap Core Portfolio
Legg Mason Partners Variable Aggressive Growth Portfolio
Legg Mason Partners Variable International All Cap Growth Portfolio
INVESTMENT PRODUCTS: NOT FDIC INSURED Ÿ NO BANK GUARANTEE Ÿ MAY LOSE VALUE
Legg Mason Partners
Variable Portfolios III, Inc.
Annual Report • October 31, 2006
What’s Inside
Letter from the Chairman

R. JAY GERKEN, CFA
Chairman, President and Chief Executive Officer
Dear Shareholder,
While the U.S. economy continued to expand, it weakened considerably as the reporting period progressed. After expanding 4.1% in the third quarter of 2005, gross domestic product (“GDP”)i increase a modest 1.7% during the last three months of the year. The economy then rebounded sharply in the first quarter of 2006. Over this period, GDP rose 5.6%, its highest reading since the third quarter of 2003. The economy then took a step backwards in the second quarter 2006, as GDP growth was 2.6% according to the U.S. Commerce Department. The preliminary estimate for third quarter GDP growth was 2.2%.
After increasing the federal funds rateii to 5.25% in June — its 17th consecutive rate hike — the Federal Reserve Board (“Fed”)iii paused from raising rates at its next four meetings. In its statement accompanying the December meeting, the Fed stated, “Economic growth has slowed over the course of the year, partly reflecting a substantial cooling of the housing market. Although recent indicators have been mixed, the economy seems likely to expand at a moderate pace on balance over coming quarters.” The Fed’s next meeting is at the end of January, and we believe any further rate movements will likely be data dependent.
For the 12-month period ended October 31, 2006, the U.S. stock market generated solid results, with the S&P 500 Indexiv returning 16.33%. For much of the period, stock prices moved in fits and starts due to continued interest rate hikes, high oil prices and inflationary pressures. However, toward the end of the period, several of these overhangs were removed, as the Fed paused from tightening rates, and after peaking at $78 a barrel in mid-July, subsequently oil prices fell 15% in the latter part of the third quarter.v
International equities also generated positive results during the reporting period and significantly outperformed their
Legg Mason Partners Variable Portfolios III, Inc. I
U.S. counterparts. During the 12 months ended October 31, 2006, the MSCI EAFE Indexvi returned 27.52%. As was the case in the U.S., international equities experienced periods of volatility, but rallied toward the end of period. One notable exception was Japan, as its equity market lagged the MSCI EAFE Index during the reporting period. Mixed economic data and concerns over the likelihood of higher interest rates dragged its market down.
II Legg Mason Partners Variable Portfolios III, Inc.
Within this environment, the Portfolios performed as follows:
| | | | |
| Performance Snapshot as of October 31, 2006 (unaudited) |
| | |
| | | 6 Months | | 12 Months |
| | | | |
Variable Large Cap Value Portfolio1 | | 6.26% | | 18.34% |
| |
S&P 500/Citigroup Value Index | | 6.48% | | 20.54% |
| |
Lipper Variable Large-Cap Value Funds Category Average | | 7.19% | | 18.74% |
| |
Variable Large Cap Growth Portfolio1 | | 3.85% | | 6.20% |
| |
Russell 1000 Growth Index | | 3.53% | | 10.84% |
| |
Lipper Variable Large-Cap Growth Funds Category Average | | 0.78% | | 8.41% |
| |
Variable Mid Cap Core Portfolio1 | | 0.51% | | 15.22% |
| |
S&P 400 Midcap Index | | -1.59% | | 13.43% |
| |
Lipper Variable Mid-Cap Core Funds Category Average | | 0.50% | | 14.80% |
| |
Variable Aggressive Growth Portfolio1 | | 1.65% | | 12.56% |
| |
Russell 3000 Growth Index | | 2.95% | | 11.39% |
| |
Lipper Variable Multi-Cap Growth Funds Category Average | | -0.69% | | 10.51% |
| |
Variable International All Cap Growth Portfolio1 | | 1.94% | | 25.46% |
| |
MSCI EAFE Growth Index | | 1.45% | | 24.04% |
| |
Lipper Variable International Growth Funds Category Average | | 0.99% | | 26.27% |
| |
| The performance shown represents past performance. Past performance is no guarantee of future results and current performance may be higher or lower than the performance shown above. Principal value and investment returns will fluctuate and investors’ shares, when redeemed, may be worth more or less than their original cost. |
| Performance figures reflect reimbursements and/or fee waivers, without which the performance would have been lower. |
| Portfolio returns assume the reinvestment of all distributions, including returns of capital, if any, at net asset value and the deduction of all Portfolio expenses. |
| Lipper, Inc. is a major independent mutual-fund tracking organization. Returns are based on the period ended October 31, 2006 and include the reinvestment of distributions, including returns of capital, if any. Returns were calculated among the 98 Funds for the six-month period and among the 97 Funds for the 12-month period in the Lipper variable large-cap value funds category. Returns were calculated among the 197 Funds for the six-month period and among the 195 Funds for the 12-month period in the Lipper Variable Large Cap Growth Funds category. Returns were calculated among the 89 Funds for the six-month period and among the 85 Funds for the 12-month period in the Lipper Variable Mid-Cap Core Funds category. Returns were calculated among the 166 Portfolios for the six-month period and among the 157 Funds for the 12-month period in the Lipper Variable Multi-Cap Growth Funds category. Returns were calculated among the 65 Funds for the six-month period and among the 62 Funds for the 12-month period in the Lipper Variable International Growth Funds category. |
| 1 | | The Portfolio is an underlying investment option of various variable annuity and variable life insurance products. The Portfolio’s performance returns do not reflect the deduction of initial sales charges and expenses imposed in connection with investing in variable annuity or variable life insurance contracts, such as administrative fees, account charges, and surrender charges, which, if reflected, would reduce the performance of the Portfolio. Past performance is no guarantee of future results. |
Legg Mason Partners Variable Portfolios III, Inc. III
Please read on for a more detailed look at prevailing economic and market conditions during the Portfolios’ fiscal year and to learn how those conditions have affected each Portfolio’s performance.
Special Shareholder Notices
As part of the continuing effort to integrate investment products managed by the advisers acquired with Citigroup Inc.’s asset management business, Legg Mason, Inc. (“Legg Mason”) recommended various Portfolio actions in order to streamline product offerings, eliminate redundancies and improve efficiencies within the organization. At Board meetings held during June and July 2006, the Portfolios’ Board reviewed and approved these recommendations, and provided authorization to move ahead with proxy solicitations for those matters needing shareholder approval.
Effective August 1, 2006, Legg Mason Partners Portfolio Advisor, LLC (“LMPFA”) became each Portfolio’s investment manager and ClearBridge Advisors, LLC (“ClearBridge”), formerly CAM North America, LLC, became each Portfolio’s subadviser. The portfolio managers who are responsible for the day-to-day management of each Portfolio remain the same immediately prior to and immediately after the date of these changes. LMPFA and ClearBridge are wholly-owned subsidiaries of Legg Mason.
Legg Mason Partners Variable Large Cap Value Portfolio
Shareholder approval of a reorganization pursuant to which the Portfolio’s assets will be acquired, and its liabilities assumed by the Legg Mason Partners Variable Investors Portfolio (the “Acquiring Portfolio”), in exchange for shares of the Acquiring Portfolio has been obtained. It is expected that the Portfolio will be liquidated, and shares of the Acquiring Portfolio distributed to Portfolio shareholders on or about May 1, 2007.
The Portfolio was formerly known as Smith Barney Large Cap Value Portfolio.
IV Legg Mason Partners Variable Portfolios III Inc.
Legg Mason Partners Variable Large Cap Growth Portfolio
The Portfolio was formerly known as Smith Barney Large Capitalization Growth Portfolio.
Legg Mason Partners Variable Mid Cap Core Portfolio
Effective December 1, 2006, the Portfolio will be permitted to engage in short-selling. Short-selling is a technique that may be considered speculative and involves additional risks. For more information regarding these and other risks, please see the Portfolio’s current prospectus.
The Portfolio was formerly known as Smith Barney Mid Cap Core Portfolio.
Legg Mason Partners Variable Aggressive Growth Portfolio
The Portfolio was formerly known as Smith Barney Aggressive Growth Portfolio.
Legg Mason Partners Variable International All Cap Growth Portfolio
In addition to the investment manager and subadviser changes discussed above, the Portfolio’s Board approved Brandywine Global Asset Management, LLC (“Brandywine) as a new subadviser for the Portfolio. Brandywine is an affiliate of Legg Mason. Shareholder approval of the new subadvisory agreement with Brandywine has also been obtained. Brandywine is expected to replace ClearBridge as the Portfolio’s subadviser on or about May 1, 2007.
The Portfolio’s Board also approved an investment strategy change for the Portfolio. The change will occur in conjunction with the change of the subadviser. Shareholders should consult the Portfolio’s current prospectus for more information.
The Portfolio was formerly known as Smith Barney International All Cap Growth Portfolio.
Legg Mason Partners Variable Portfolios III, Inc. V
Information About Your Portfolios
As you may be aware, several issues in the mutual fund industry have come under the scrutiny of federal and state regulators. Affiliates of the Portfolios’ manager have, in recent years, received requests for information from various government regulators regarding market timing, late trading, fees, and other mutual fund issues in connection with various investigations. The regulators appear to be examining, among other things, the Portfolios’ responses to market timing and shareholder exchange activity, including compliance with prospectus disclosure related to these subjects. The Portfolios are not in a position to predict the outcome of these requests and investigations.
Important information with regard to recent regulatory developments that may affect the Portfolios are contained in the Notes to Financial Statements included in this report.
As always, thank you for your confidence in our stewardship of your assets. We look forward to helping you meet your financial goals.
Sincerely,

R. Jay Gerken, CFA
Chairman, President and Chief Executive Officer
December 13, 2006
All index performance reflects no deduction for fees, expenses or taxes. Please note that an investor cannot invest directly in an index.
| i | | Gross domestic product is a market value of goods and services produced by labor and property in a given country. |
| ii | | The federal funds rate is the interest rate that banks with excess reserves at a Federal Reserve district bank charge other banks that need overnight loans. |
| iii | | The Federal Reserve Board is responsible for the formulation of a policy designed to promote economic growth, full employment, stable prices, and a sustainable pattern of international trade and payments. |
| iv | | The S&P 500 Index is an unmanaged index of 500 stocks that is generally representative of the performance of larger companies in the U.S. |
| v | | Source: The Wall Street Journal, 9/29/06 |
| vi | | The MSCI EAFE Index is an unmanaged index of common stocks of companies located in Europe, Australasia and the Far East. |
VI Legg Mason Partners Variable Portfolios III, Inc.
Portfolio Overview
Legg Mason Partners Variable Large Cap Value Portfolio
Q. What were the overall market conditions during the Portfolio’s reporting period?
A. Interest rates, inflation and oil prices continued to be a key focus of most investors. The markets experienced increased volatility, much of which was triggered by investor confusion over the future of Federal Reserve (“Fed”)i policy. Over the period, equity market returns essentially formed a barbell pattern with strong first and fourth quarters and weaker second and third quarters. The economy seemed to show signs of slowing in late 2005 but then appeared to reaccelerate in early 2006. The Fed continued its tightening campaign and raised the federal funds rateii to 5.25% at its June meeting.
Then, the Fed finally decided to pause in its two year tightening campaign. After 17 consecutive rate increases, the Fed held the target rate steady at the August, September and October meetings. The Federal Open Market Committee’s October statement cited “economic growth has slowed over the course of the year, partly reflecting a cooling of the housing market. Going forward, the economy seems likely to expand at a moderate pace.” This created a more bullish sentiment for equities.
Crude oil prices fluctuated widely from as high as $77.03 a barrel (7/14/06) to $58.73 a barrel (10/31/06) by the end of the period.iii The sharp decline was due to diminishing concerns about Middle East supply; fairly robust inventory levels in the U.S. and some of the other major industrialized nations; and the expected moderation in demand growth from slowing worldwide economies. The decline in energy prices has translated into lower gasoline prices, which has also helped boost consumer confidence.
All sectors of the S&P 500 Indexiv posted positive returns during the period. Leading sectors included telecommunication services (32.59%), materials (24.72%) and energy (19.35%). Lagging sectors included information technology (9.99%), health care (11.37%) and consumer staples (13.47%).
Performance Update
For the 12 months ended October 31, 2006, the Legg Mason Partners Variable Large Cap Value Portfolio,1 returned 18.34%. These shares underperformed the Lipper Variable Large-Cap Value Funds Category Average,2 which increased 18.74%. The Portfolio’s unmanaged benchmark, the S&P 500/Citigroup Value Indexv, returned 20.54% for the same period.
Q. What were the most significant factors affecting Portfolio performance?
A. The Portfolio underperformed the S&P 500/Citigroup Value Index during the period. Favorable sector allocation was not enough to offset adverse security selection. An underweight position in technology and a market weight position in energy contributed
| 1 | | The Portfolio is an underlying investment option of various variable annuity and variable life insurance products. The Portfolio’s performance returns do not reflect the deduction of initial sales charges and expenses imposed in connection with investing in variable annuity or variable life insurance contracts, such as administrative fees, account charges, and surrender charges which, if reflected, would reduce the performance of the Portfolio. Past performance is no guarantee of future results. |
| 2 | | Lipper, Inc. is a major independent mutual-fund tracking organization. Returns are based on the 12-month period ended October 31, 2006, including the reinvestment of all distributions, including returns of capital, if any, calculated among the 97 Funds in the Portfolio’s Lipper category. |
Legg Mason Partners Variable Portfolios III, Inc. 2006 Annual Report 1
positively to performance. However, these benefits were partly offset by an underweight in the materials sector and an overweight in the consumer staples sector, which held back performance. Security selection was strongest in energy and industrials and weakest in health care and telecommunication services.
What were the leading contributors to performance?
A. Top contributors during the period included AT&T, News Corp., Merrill Lynch, Marathon Oil and Bank of America.
What were the leading detractors from performance?
A. Stocks that detracted from performance came from a number of different sectors and included Sprint Nextel, UnitedHealth Group, Comcast, Nortel Networks and Masco. In August, shares of Sprint Nextel fell sharply due to disappointing second quarter results and lowered guidance. The company underestimated the impact of operational issues facing the combined entity after the merger. Nevertheless, we continue to hold this position in the Portfolio since we believe the investment thesis is not impaired and the specific steps taken by management should position the company for improved performance going forward. We sold our position in both Comcast and Nortel Networks during the period.
Q. Were there any significant changes to the Portfolio during the reporting period?
A. During the period, we reduced our energy and technology exposures in the Portfolio and increased our industrials and consumer discretionary weightings. We are currently overweight in the consumer discretionary, health care and consumer staples sectors and underweight in the industrials, technology and utilities sectors versus the S&P 500/ Citigroup Value Index.
Thank you for your investment in the Legg Mason Partners Variable Large Cap Value Portfolio. As ever, we appreciate that you have chosen us to manage your assets and we remain focused on seeking to achieve the Portfolio’s investment goals.
Sincerely,

Mark J. McAllister, CFA
Portfolio Manager
Clearbridge Advisors, LLC
November 29, 2006
2 Legg Mason Partners Variable Portfolios III, Inc. 2006 Annual Report
The information provided is not intended to be a forecast of future events, a guarantee of future results or investment advice. Views expressed may differ from those of the firm as a whole.
Portfolio holdings and breakdowns are as of October 31, 2006 and are subject to change and may not be representative of the portfolio manager’s current or future investments. The Portfolio’s top ten holdings (as a percentage of net assets) as of this date were: Altria Group Inc. (3.4%), Merrill Lynch & Co. Inc. (3.1%), AT&T Inc (2.8%), News Corp. (2.8%), Total SA (2.7%), Capital One Financial Corp. (2.7%), Sempra Energy (2.5%), JPMorgan Chase & Co. (2.5%), Sprint Nextel Corp. (2.5%) and American Express Co. (2.3%). Please refer to pages 33 through 36 for a list and percentage breakdown of the Portfolio’s holdings.
The mention of sector breakdowns is for informational purposes only and should not be construed as a recommendation to purchase or sell any securities. The information provided regarding such sectors is not a sufficient basis upon which to make an investment decision. Investors seeking financial advice regarding the appropriateness of investing in any securities or investment strategies discussed should consult their financial professional. Portfolio holdings are subject to change at any time and may not be representative of the portfolio manager’s current or future investments. The Portfolio’s top five sector holdings (as a percentage of net assets) as of October 31, 2006 were: Financials (31.1%), Consumer Discretionary (14.6%), Industrials (9.5%), Health Care (8.9%) and Consumer Staples (8.9%). The Portfolio’s composition is subject to change at any time.
RISKS: Keep in mind, common stocks are subject to market fluctuations. Foreign stocks are subject to certain risks of overseas investing, including currency fluctuations and changes in political and economic conditions, which could result in significant market fluctuations. The Portfolio may use derivatives, such as options and futures, which can be illiquid, may disproportionately increase losses, and have a potentially large impact on Portfolio performance. Please see the Portfolio’s prospectus for more information on these and other risks.
All index performance reflects no deduction for fees, expenses or taxes. Please note that an investor cannot invest directly in an index.
| i | | The Federal Reserve Board is responsible for the formulation of a policy designed to promote economic growth, full employment, stable prices, and a sustainable pattern of international trade and payments. |
| ii | | The federal funds rate is the interest rate that banks with excess reserves at a Federal Reserve district bank charge other banks that need overnight loans. |
| iii | | Source: Bloomberg 10/31/06. |
| iv | | The S&P 500 Index is an unmanaged index of 500 stocks that is generally representative of the performance of larger companies in the U.S. |
| v | | The S&P 500/Citigroup Value Index is an index of stocks representing approximately half of the market capitalization of the stocks in the S&P 500 Index that, on a growth-value spectrum, have been identified as falling either wholly or partially within the value half of the spectrum based on a number of factors. Until December 16, 2005, when Standard & Poor’s changed both the name of the index and its calculation methodology, the index was called the S&P 500/BARRA Value Index. |
Legg Mason Partners Variable Portfolios III, Inc. 2006 Annual Report 3
Portfolio Overview
Legg Mason Partners Variable Large Cap Growth Portfolio
Q. What were the overall market conditions during the Portfolio’s reporting period?
A. At the start of the fiscal year in the Fall of 2005, the broad stock market experienced a sharp sell-off early as investors were hit with the uncertainty surrounding Hurricanes Katrina and Rita and the pending challenges of rebuilding the region. Showing considerable resilience, a year-end rally led by strong earnings and weaker oil prices began in late October. Through the first quarter of 2006, the prevailing theme was one of continued investor agnosticism towards the equity markets. Negative headlines certainly played a part, as the broad media continued to emphasize the plethora of downbeat themes from 2005: low Presidential approval ratings, lack of measurable success in Iraq, steady interest rate increases, continued upward pressure on energy prices, an inverted yield curvei, and record budget and trade deficits.
The broad market indexes experienced sharp corrections in May and June of this year, led by pullbacks in international markets and commodities, and investor sentiment remained low. While not impervious to this pullback, the large cap growth space performed better than many other sectors of the market. We believe the market correction shook up some investors, moving them to reassess their risk profiles and seek safety in some of the higher quality, best-capitalized domestic stocks in the marketplace.
This belief was reinforced as the economy slowed due to higher borrowing costs (witness housing and retail sales) and input costs (energy and raw materials) and companies with strong fundamentals and rock-solid financials began to gain favor in this difficult market environment. Many of the forces that negatively impacted the portfolio in the first half of the year reversed themselves in the Fall of 2006.
Performance Update
For the 12 months ended October 31, 2006, the Legg Mason Partners Variable Large Cap Growth Portfolio1, returned 6.20%. These shares underperformed the Lipper Variable Large-Cap Growth Portfolios Category Average,2 which increased 8.41%. The Portfolio’s unmanaged benchmark, the Russell 1000 Growth Indexii, returned 10.84% for the same period.
Q. What were the most significant factors affecting Portfolio performance?
A. For the 12-month period, the Portfolio had positive absolute returns in all sectors in which it was invested, with the strongest returns seen in the financials sector. Relative to the benchmark, the Russell 1000 Growth Index, stock selection accounted for the majority of the difference between the Portfolio’s return and the benchmark return for the same
| 1 | | The Portfolio is an underlying investment option of various variable annuity and variable life insurance products. The Portfolio’s performance returns do not reflect the deduction of initial sales charges and expenses imposed in connection with investing in variable annuity or variable life insurance contracts, such as administrative fees, account charges, and surrender charges, which, if reflected, would reduce the performance of the Portfolio. Past performance is no guarantee of future results. |
| 2 | | Lipper, Inc. is a major independent mutual-fund tracking organization. Returns are based on the 12-month period ended October 31, 2006, including the reinvestment of all distributions, including returns of capital, if any, calculated among the 195 Funds in the Portfolio’s Lipper category. |
4 Legg Mason Partners Variable Portfolios III, Inc. 2006 Annual Report
period. In general, large cap growth stocks appeared to be out of favor with the broad stock market for much of the period, but began to show improving valuations as a group towards the end of the fiscal year.
What were the leading contributors to performance?
A. Leading contributors to relative performance included stock selection in the financials sector as well as an overweight to financials and an underweight to the energy sector (the Portfolio held no energy stocks for the period). In terms of individual stocks, significant contributors to relative performance for the period include positions in Akamai Technologies Inc. and Cisco Systems Inc. in information technology (IT), Merrill Lynch & Co. Inc. and Morgan Stanley in financials, and Pfizer Inc. in health care.
What were the leading detractors from performance?
A. Significant detractors from relative performance for the period included stock selection in the IT sector, as well as stock selection in the consumer discretionary, health care, industrials and the consumer staples sectors. An overweight to IT and underweights to the industrials, telecommunications services and utilities sectors also negatively impacted relative performance. For the period, leading stock detractors from relative Portfolio performance included positions in Yahoo! Inc., Juniper Networks Inc., Red Hat Inc., eBay Inc., and QUALCOMM Inc., all in the IT sector.
Q. Were there any significant changes to the Portfolio during the reporting period?
A. As usual, the Portfolio’s sector allocation was the result of its bottom-up stock selection decisions rather than a top-down allocation strategy. Sector allocation changed little during the period, with most changes the result of individual stock transactions and changes in market valuation. During the fiscal period, the Portfolio closed its positions in EMC Corp. in IT, Bed Bath & Beyond Inc. in consumer discretionary, Eli Lilly & Co. in health care, Expedia Inc. in consumer discretionary, General Electric Co. in industrials, and Xilinx Inc. and Dell Inc. in IT. During the period, the Portfolio established new positions in Electronic Arts Inc. in IT, and Medtronic Inc. in health care, and added to existing positions in eBay Inc. and Cisco Systems Inc. in IT, Coca-Cola Co. in consumer staples and Amazon.com Inc. in consumer discretionary.
Legg Mason Partners Variable Portfolios III, Inc. 2006 Annual Report 5
Thank you for your investment in the Legg Mason Partners Variable Large Cap Growth Portfolio. As ever, we appreciate that you have chosen us to manage your assets and we remain focused on seeking to achieve the Portfolio’s investment goals.
Sincerely,

Alan Blake
Portfolio Manager
Clearbridge Advisors, LLC
November 29, 2006
The information provided is not intended to be a forecast of future events, a guarantee of future results or investment advice. Views expressed may differ from those of the firm as a whole.
Portfolio holdings and breakdowns are as of October 31, 2006 and are subject to change and may not be representative of the portfolio manager’s current or future investments. The Portfolio’s top ten holdings (as a percentage of net assets) as of this date were: Amgen Inc. (5.9%), Genentech Inc. (5.8%), Amazon.Com Inc. (5.6%), Merrill Lynch & Co. Inc. (4.5%), Motorola Inc. (4.0%), Procter & Gamble Co. (4.0%), Berkshire Hathaway Inc. (3.7%), Texas Instruments Inc. (3.7%), Akamai Technologies Inc. (3.5%) and Biogen Idec inc. (3.3%). Please refer to pages 37 through 38 for a list and percentage breakdown of the Portfolio’s holdings.
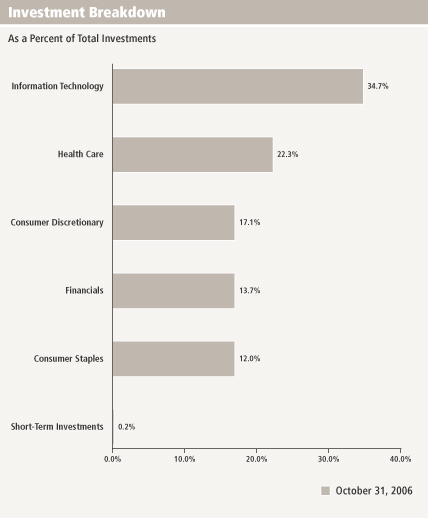
The mention of sector breakdowns is for informational purposes only and should not be construed as a recommendation to purchase or sell any securities. The information provided regarding such sectors is not a sufficient basis upon which to make an investment decision. Investors seeking financial advice regarding the appropriateness of investing in any securities or investment strategies discussed should consult their financial professional. Portfolio holdings are subject to change at any time and may not be representative of the portfolio manager’s current or future investments. The Portfolio’s top five sector holdings (as a percentage of net assets) as of October 31, 2006 were: Information Technology (34.8%), Health Care (22.4%), Consumer Discretionary (17.2%), Financials (13.7%) and Consumer Staples (12.0%). The Portfolio’s composition is subject to change at any time.
RISKS: Keep in mind, common stocks are subject to market fluctuations. Please see the Portfolio’s prospectus for more information on these and other risks.
All index performance reflects no deduction for fees, expenses or taxes. Please note that an investor cannot invest directly in an index.
| i | | The yield curve is the graphical depiction of the relationship between the yield on bonds of the same credit quality but different maturities. |
| ii | | The Russell 1000 Growth Index measures the performance of those Russell 1000 companies with higher price-to-book ratios and higher forecasted growth values. Please note an investor cannot invest directly in an index. |
6 Legg Mason Partners Variable Portfolios III, Inc. 2006 Annual Report
Portfolio Overview
Legg Mason Partners Variable Mid Cap Core Portfolio
Q. What were the overall market conditions during the Portfolio’s reporting period?
A. The ongoing economic expansion and solid corporate profits helped the U.S. equity market to generate solid results during the 12-month period that ended October 31, 2006. Over that time, the S&P 400 MidCap Indexi returned 13.43%. Despite the strong overall return, the ascent wasn’t steady and included a fairly sharp correction during the Spring and a recovery in the Fall as the market struggled with interest rate expectations and volatile energy prices. A downturn in housing after an unprecedented expansion also contributed to uncertainty in the marketplace and pressured certain sectors as a result.
Oil prices, after peaking at $78 a barrel in mid-July, then declined nearly 15%, leading to decreased costs for both energy using corporate producers and consumers.ii
After increasing the federal funds rateiii to 5.25% in June — its 17th consecutive rate hike — the Federal Reserve Board (“Fed”)iv paused from raising rates at its August, September and October meetings, signaling the end of the two-year tightening cycle. In addition to the fundamental factors impacting the market, equities also benefited from strong M&A and leveraged buyout activity, and record high share buybacks.
During this period, every sector in the S&P 400 MidCap Index generated positive results, with the telecommunication services (+28.0%), information technology (IT) (+20.2%) and utilities (+19.01%) sectors generating the best absolute results. The weakest performing sectors over the same period were health care (+4.4%), consumer discretionary (+6.2%) and energy (+6.3%) stocks. Within the mid-cap universe, value stocks outperformed their growth counterparts, as the S&P 400 MidCap/Citigroup Valuev and S&P 400 MidCap/Citigroup Growthvi Indices returned 16.21% and 10.35%, respectively.
Performance Update
For the 12 months ended October 31, 2006, the Legg Mason Partners Variable Mid Cap Core Portfolio1, returned 15.22%. These shares overperformed the Portfolio’s unmanaged benchmark, the S&P 400 MidCap Index, which returned 13.43% for the same period. They also outperformed the Portfolio’s Lipper Variable Mid-Cap Core Funds Category Average2, which increased 14.80%.
Q. What were the most significant factors affecting Portfolio performance?
What were the leading contributors to performance?
A. During the period, our overall stock selection was a significant contributor to results. In particular, stock selection in the industrials, IT and consumer discretionary sectors
| 1 | | The Portfolio is an underlying investment option of various variable annuity and variable life insurance products. The Portfolio’s performance returns do not reflect the deduction of initial sales charges and expenses imposed in connection with investing in variable annuity or variable life insurance contracts, such as administrative fees, account charges, and surrender charges, which, if reflected, would reduce the performance of the Portfolio. Past performance is no guarantee of future results. |
| 2 | | Lipper, Inc. is a major independent mutual-fund tracking organization. Returns are based on the 12-month period ended October 31, 2006, including the reinvestment of all distributions, including returns of capital, if any, calculated among the 85 Funds in the Portfolio’s Lipper category. |
Legg Mason Partners Variable Portfolios III, Inc. 2006 Annual Report 7
enhanced results. In terms of sector positioning, the Portfolio’s exposure to IT, consumer discretionary and energy were positive contributors to relative performance. On an individual stock basis, the largest absolute contributors to performance were AGCO Corp., Sherwin-Williams Co., Fisher Scientific International, Inc., Lam Research Corp., and Weatherford International Ltd.
What were the leading detractors from performance?
A. During the period, our overall sector positioning detracted from relative results. In particular, the Portfolio’s exposures to utilities, health care and industrials detracted the most from relative performance. In terms of stock selection, holdings in the financial and utilities sectors hurt results the most. On an individual stock basis, the largest detractors from absolute performance were Dollar General Corp., Pioneer Natural Resources Co., Nelnet, Inc., National Financial Partners Corp. and Coventry Health Care, Inc.
Q. Were there any significant changes to the Portfolio during the reporting period?
A. There were no significant changes made to the Portfolio during the period.
Thank you for your investment in the Legg Mason Partners Variable Mid Cap Core Portfolio. As ever, we appreciate that you have chosen us to manage your assets and we remain focused on seeking to achieve the Portfolio’s investment goals.
Sincerely,
| | |
| |
 | |  |
| Brian M. Angerame | | Derek J. Deutsch, CFA |
| Co-Portfolio Manager | | Co-Portfolio Manager |
| ClearBridge Advisors, LLC | | ClearBridge Advisors, LLC |
November 29, 2006
8 Legg Mason Partners Variable Portfolios III, Inc. 2006 Annual Report
The information provided is not intended to be a forecast of future events, a guarantee of future results or investment advice. Views expressed may differ from those of the firm as a whole.
Portfolio holdings and breakdowns are as of October 31, 2006 and are subject to change and may not be representative of the portfolio manager’s current or future investments. The Portfolio’s top ten holdings (as a percentage of net assets) as of this date were: Bed Bath & Beyond Inc. (2.4%), Intergraph Corp. (2.4%), Service Master Company (2.4%), Fisher Scientific International Inc. (2.3%), AGCO Corp. (2.3%), Eaton Corp. (2.2%), CBRL Group Inc. (2.2%), R.R. Donnelley & Sons Co. (2.1%), Armor Holdings Inc. (2.1%), and Sherwin-Williams Co. (2.1%). Please refer to pages 39 through 42 for a list and percentage breakdown of the Portfolio’s holdings.
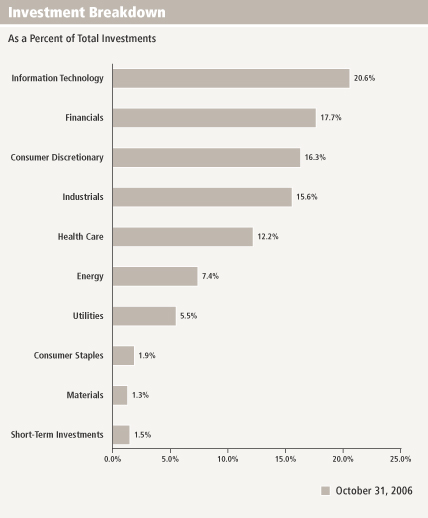
The mention of sector breakdowns is for informational purposes only and should not be construed as a recommendation to purchase or sell any securities. The information provided regarding such sectors is not a sufficient basis upon which to make an investment decision. Investors seeking financial advice regarding the appropriateness of investing in any securities or investment strategies discussed should consult their financial professional. Portfolio holdings are subject to change at any time and may not be representative of the portfolio manager’s current or future investments. The Portfolio’s top five sector holdings (as a percentage of net assets) as of October 31, 2006 were: Information Technology (20.7%), Financials (17.7%), Consumer Discretionary (16.3%), Industrials (15.7%) and Health Care (12.3%). The Portfolio’s composition is subject to change at any time.
RISKS: Mid-cap stocks may be more volatile than large-cap stocks. Additionally, the Portfolio’s performance may be influenced by political, social and economic factors affecting investments in companies in foreign countries. The Portfolio may use derivatives, such as options and futures, which can be illiquid, may disproportionately increase losses, and have a potentially large impact on Portfolio performance. Please see the Portfolio’s prospectus for more information on these and other risks.
All index performance reflects no deduction for fees, expenses or taxes. Please note that an investor cannot invest directly in an index.
| i | | The S&P 400 MidCap Index is a market-value weighted index which consists of 400 domestic stocks chosen for market size, liquidity, and industry group representation. An investor cannot invest directly in an index. |
| ii | | Source: The Wall Street Journal, 10/03/06 |
| iii | | The federal funds rate is the interest rate that banks with excess reserves at a Federal Reserve district bank charge other banks that need overnight loans. |
| iv | | The Federal Reserve Board is responsible for the formulation of a policy designed to promote economic growth, full employment, stable prices, and a sustainable pattern of international trade and payments. |
| v | | The S&P MidCap 400/Citigroup Value Index is designed to provide a comprehensive measure of mid-cap U.S. equity “value” performance. It is an unmanaged float adjusted market capitalization weighted index comprised of stocks representing approximately half the market capitalization of the S&P MidCap 400 Index that have been identified as being on the value end of the growth-value spectrum. An investor cannot directly invest in an index. |
| vi | | The S&P MidCap 400/Citigroup Growth Index is designed to provide a comprehensive measure of mid-cap U.S. equity “growth” performance. It is an unmanaged float adjusted market capitalization weighted index comprised of stocks representing approximately half the market capitalization of the S&P MidCap 400 Index that have been identified as being on the growth end of the growth-value spectrum. An investor cannot directly invest in an index. |
Legg Mason Partners Variable Portfolios III, Inc. 2006 Annual Report 9
Portfolio Overview
Legg Mason Partners Variable Aggressive Growth Portfolio
Q. What were the overall market conditions during the Portfolio’s reporting period?
A. The U.S. economy performed relatively well given the significant hurdles encountered during the reporting period, as many corporate balance sheets and profits appeared to maintain their strength. Consumer spending, however, showed signs of weakening through much of the period, with households burdened by both a rising interest rate environment and high energy prices, while the housing market began to cool in many areas. The Federal Reserve Board (“Fed”)i continued to raise interest rates during most of the reporting period, but appeared to have ended its current rate-hike cycle by August 2006. The broad stock market experienced significant periods of market volatility during the twelve-month period, but in general, achieved moderate-to-strong gains for the reporting period.
Performance Update
For the 12 months ended October 31, 2006, the Legg Mason Partners Variable Aggressive Growth Portfolio1 returned 12.56%. These shares overperformed the Portfolio’s unmanaged benchmark, the Russell 3000 Growth Indexii, which returned 11.39% for the same period. These shares also outperformed the Portfolio’s Lipper Variable Multi-Cap Growth Portfolios Category Average2, which increased 10.51%.
Q. What were the most significant factors affecting Portfolio performance?
A. The Portfolio’s stock selection accounted for the Portfolio’s outperformance in comparison to the benchmark index, while sector allocation negatively affected relative performance. In particular, stock selection in the consumer discretionary, financials and energy sectors made significant contributions to relative performance, while stock selection in health care, industrials and information technology (IT) negatively affected relative performance. To a lesser extent, underweights to consumer staples and IT and an overweight to consumer discretionary also contributed to relative performance, while overweights to health care and energy and underweights to industrials, materials and utilities negatively affected relative performance.
What were the leading contributors to performance?
A. Top contributors to Portfolio performance for the period included holdings in Lehman Brothers Holdings Inc. in financials, Comcast Corp. and Cablevision Systems Corp. in consumer discretionary, Weatherford International Ltd. in energy and Forest Laboratories Inc. in health care.
| 1 | | The Portfolio is an underlying investment option of various variable annuity life insurance products. The Portfolio’s performance returns do not reflect the deduction of initial sales charges and expenses imposed in connection with investing in variable annuity or variable life insurance contracts, such as administrative fees, account charges, and surrender charges, which, if reflected, would reduce the performance of the Portfolio. Past performance is no guarantee of future results. |
| 2 | | Lipper, Inc. is a major independent mutual-fund tracking organization. Returns are based on the 12-month period ended October 31, 2006, including the reinvestment of all distributions, including returns of capital, if any, calculated among the 157 funds in the Portfolio’s Lipper category. |
10 Legg Mason Partners Variable Portfolios III, Inc. 2006 Annual Report
What were the leading detractors from performance?
A. Top detractors from performance during the period included positions in UnitedHealth Group Inc., ImClone Systems Inc., and Genzyme Corp., all in health care, as well as SanDisk Corp. and Autodesk Inc. in IT.
Q. Were there any significant changes to the Portfolio during the reporting period?
A. During the period, the Portfolio significantly increased its positions in both the biotechnology industry within the health care sector, specifically in existing positions in Biogen Idec Inc., Genzyme Corp. and Amgen Inc., and in the cable and broadcasting segments of the consumer discretionary sector including Portfolio holdings in both Time Warner Inc. and Cablevision Systems Corp. Three of the Portfolio’s holdings were acquired by other companies during the period resulting in full sales of the positions, including Chiron in health care and Maxtor Corp. and RSA Security Inc., both in IT.
Thank you for your investment in the Legg Mason Partners Variable Aggressive Growth Portfolio. As ever, we appreciate that you have chosen us to manage your assets and we remain focused on seeking to achieve the Portfolio’s investment goals.
Sincerely,

Richard Freeman
Portfolio Manager
Clearbridge Advisors, LLC
November 29, 2006
Legg Mason Partners Variable Portfolios III, Inc. 2006 Annual Report 11
The information provided is not intended to be a forecast of future events, a guarantee of future results or investment advice. Views expressed may differ from those of the firm as a whole.
Portfolio holdings and breakdowns are as of October 31, 2006 and are subject to change and may not be representative of the portfolio manager’s current or future investments. The Portfolio’s top ten holdings (as a percentage of net assets) as of this date were: Lehman Brothers Holdings Inc. (8.0%), UnitedHealth Group Inc. (6.8%), Anadarko Petroleum Corp. (6.2%), Weatherford International Ltd. (5.1%), Amgen Inc. (4.9%), Genzyme Corp. (4.7%), Comcast Corp., Special Class A Shares (4.6%), Forest Laboratories Inc. (4.3%), Tyco International Ltd. (4.2%) and Biogen Idec Inc. (3.7%). Please refer to pages 43 through 46 for a list and percentage breakdown of the Portfolio’s holdings.
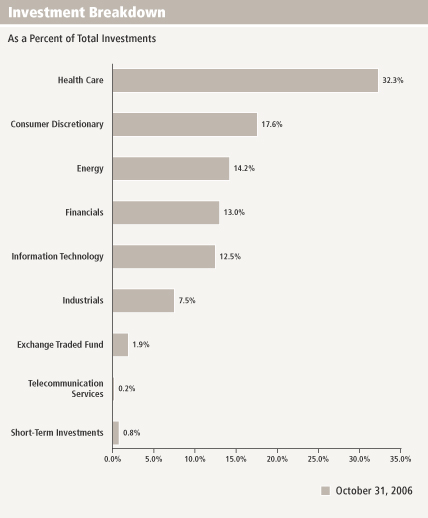
The mention of sector breakdowns is for informational purposes only and should not be construed as a recommendation to purchase or sell any securities. The information provided regarding such sectors is not a sufficient basis upon which to make an investment decision. Investors seeking financial advice regarding the appropriateness of investing in any securities or investment strategies discussed should consult their financial professional. Portfolio holdings are subject to change at any time and may not be representative of the portfolio manager’s current or future investments. The Portfolio’s top five sector holdings (as a percentage of net assets) as of October 31, 2006 were: Health Care (32.3%), Consumer Discretionary (17.6%), Energy (14.2%), Financials (13.1%) and Information Technology (12.5%). The Portfolio’s composition is subject to change at any time.
RISKS: The Portfolio may invest a significant portion of its assets in small- and mid-cap companies which may be more volatile than an investment that focuses only on large-cap companies. Please see the Portfolio’s prospectus for more information on these and other risks.
All index performance reflects no deduction for fees, expenses or taxes. Please note that an investor cannot invest directly in an index.
| i | | The Federal Reserve Board is responsible for the formulation of a policy designed to promote economic growth, full employment, stable prices, and a sustainable pattern of international trade and payments. |
| ii | | The Russell 3000 Growth Index measures the performance of those Russell 3000 Index companies with higher price-to-book ratios and higher forecasted growth values. |
12 Legg Mason Partners Variable Portfolios III, Inc. 2006 Annual Report
Portfolio Overview
Legg Mason Partners Variable International All Cap Growth Portfolio
Q. What were the overall market conditions during the Portfolio’s reporting period?
A. Equity markets rewarded investors for the twelve months ended October 2006 with strongly positive returns. The global economic recovery provided good corporate earnings gains in many sectors and markets as the fiscal year progressed. Improving cash flows and balance sheets were further positive influences. Merger and acquisition activity occurred at record levels of transactions. International stocks substantially outperformed U.S. equities during the fiscal year. Those returns were augmented by the decline of the U.S. dollar versus the currencies underlying the Portfolio’s benchmark index, the MSCI EAFE Growth Indexi, during the fiscal year, which contributed over five percentage points to benchmark returns during the reporting period.
Performance Update
For the 12 months ended October 31, 2006, the Legg Mason Partners Variable International All Cap Growth Portfolio1, returned 25.46%. These shares outperformed the Portfolio’s unmanaged benchmark, the MSCI EAFE Growth Index, which returned 24.04% for the same period. They underperformed the Portfolio’s Lipper Variable International Growth Funds Category Average2, which increased 26.27%.
Q. What were the most significant factors affecting Portfolio performance?
What were the leading contributors to performance?
A. The Portfolio outperformed the MSCI EAFE Growth Index this past fiscal year. European markets were the strongest benchmark performers with a 26.70% return (in dollars) compared with 18.51% for the Pacific markets. Returns from the Pacific markets were restrained by the relatively modest advance of the Japanese market, up 14.78%. The Portfolio was modestly overweight the European markets for most of the fiscal year and was underweight Japanese equities.
The top five contributors to overall portfolio return were Ireland’s Grafton Group (+1.90%), the U.K.’s Serco Group (+1.69%), the U.K.’s Capita Group (+1.27%), Mettler Toledo (+1.16%) and Japan’s Orix Group (+1.12%).
What were the leading detractors from performance?
A. The sector weights in the Portfolio are derived from stock selection. The Portfolio had no exposure to the strong-performing utility sector; most utilities do not meet the
| 1 | | The Portfolio is an underlying investment option of various variable annuity and variable life insurance products. The Portfolio’s performance returns do not reflect the deduction of initial sales charges and expenses imposed in connection with investing in variable annuity or variable life insurance contracts, such as administrative fees, account charges, and surrender charges, which, if reflected, would reduce the performance of the Portfolio. Past performance is no guarantee of future results. |
| 2 | | Lipper, Inc. is a major independent mutual-fund tracking organization. Returns are based on the 12-month period ended October 31, 2006, including the reinvestment of all distributions, including returns of capital, if any, calculated among the 62 funds in the Portfolio’s Lipper category. |
Legg Mason Partners Variable Portfolios III, Inc. 2006 Annual Report 13
portfolio team’s criteria for growth companies. The overweight exposure to information technology detracted from portfolio return as the sector lagged the benchmark. Our stock selection was beneficial in the consumer staples sector and industrials where the overweight position was also contributory to the portfolio’s return.
The top five detractors to overall portfolio return were Japan’s Rakuten Inc. (-0.54%), France’s Altran Technologies S.A. (-0.44%), Switzerland’s UBS Ag (-0.32%), the U.K.’s Vodafone Group PLC (-0.26%) and Japan’s Aisin Seiki Co. Ltd. (-0.23%).
Q. Were there any significant changes to the Portfolio during the reporting period?
A. The Portfolio ended the fiscal year with allocations of 68% Europe, 28% Asia, and 4% in other markets and cash. Our top holdings in the Portfolio reflect an eclectic mix of investment themes and portfolio emphasis. These holdings are illustrative of our growth-oriented stock selection criteria, which include strong financial structures, large business opportunities and stable, visionary management.
Thank you for your investment in the Legg Mason Partners Variable International All Cap Growth Portfolio. As ever, we appreciate that you have chosen us to manage your assets and we remain focused on seeking to achieve the Portfolio’s investment goals.
Sincerely,

Jeffrey Russell
Portfolio Manager
Clearbridge Advisors, LLC
November 29, 2006
14 Legg Mason Partners Variable Portfolios III, Inc. 2006 Annual Report
The information provided is not intended to be a forecast of future events, a guarantee of future results or investment advice. Views expressed may differ from those of the firm as a whole.
Portfolio holdings and breakdowns are as of October 31, 2006 and are subject to change and may not be representative of the portfolio manager’s current or future investments. The Portfolio’s top ten holdings (as a percentage of net assets) as of this date were: Grafton Group PLC (4.5%), Roche Holding AG (4.0%), Mettler-Toledo International Inc. (3.9%), Serco Group PLC (3.9%), Capita Group PLC (3.1%), UBS AG (2.8%), Indra Sistemas SA (2.7%), ORIX Corp. (2.6%), Vodafone Group PLC (2.5%) and Shin-Etsu Chemical Co., Ltd. (2.4%). Please refer to pages 47 through 49 for a list and percentage breakdown of the Portfolio’s holdings.
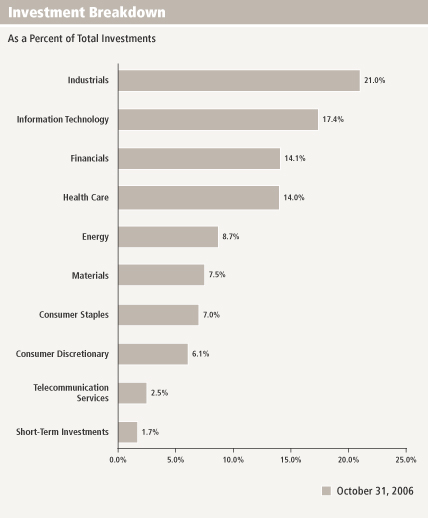
The mention of sector breakdowns is for informational purposes only and should not be construed as a recommendation to purchase or sell any securities. The information provided regarding such sectors is not a sufficient basis upon which to make an investment decision. Investors seeking financial advice regarding the appropriateness of investing in any securities or investment strategies discussed should consult their financial professional. Portfolio holdings are subject to change at any time and may not be representative of the portfolio manager’s current or future investments. The Portfolio’s top five sector holdings (as a percentage of net assets) as of October 31, 2006 were: Industrials (20.8%), Information Technology (17.3%), Financials (14.0%), Health Care (13.8%) and Energy (8.6%). The Portfolio’s composition is subject to change at any time.
RISKS: Keep in mind, the Portfolio is subject to certain risks of overseas investing, not associated with domestic investing, including currency fluctuations, change in political and economic conditions, differing securities regulations and periods of illiquidity, which could result in significant market fluctuations. These risks are magnified in emerging markets. The Portfolio may use derivatives, such as options and futures, which can be illiquid, may disproportionately increase losses, and have a potentially large impact on Portfolio performance. Please see the Portfolio’s prospectus for more information on these and other risks.
All index performance reflects no deduction for fees, expenses or taxes. Please note that an investor cannot invest directly in an index.
| i | | The MSCI EAFE Growth Index is an unmanaged index of growth stocks of companies located in Europe, Australasia and the Far East. |
Legg Mason Partners Variable Portfolios III, Inc. 2006 Annual Report 15
Fund at a Glance (unaudited)
Legg Mason Partners Variable Large Cap Value Portfolio

16 Legg Mason Partners Variable Portfolios III, Inc. 2006 Annual Report
Fund at a Glance (unaudited)
Legg Mason Partners Variable Large Cap Growth Portfolio
Legg Mason Partners Variable Portfolios III, Inc. 2006 Annual Report 17
Fund at a Glance (unaudited)
Legg Mason Partners Variable Mid Cap Core Portfolio
18 Legg Mason Partners Variable Portfolios III, Inc. 2006 Annual Report
Fund at a Glance (unaudited)
Legg Mason Partners Variable Aggressive Growth Portfolio
Legg Mason Partners Variable Portfolios III, Inc. 2006 Annual Report 19
Fund at a Glance (unaudited)
Legg Mason Partners Variable International All Cap Growth Portfolio
20 Legg Mason Partners Variable Portfolios III, Inc. 2006 Annual Report
Fund Expenses (unaudited)
As a shareholder of the Funds, you may incur two types of costs: (1) transaction costs and (2) ongoing costs, including management fees and other Fund expenses. This example is intended to help you understand your ongoing costs (in dollars) of investing in the Fund and to compare these costs with the ongoing costs of investing in other mutual funds.
This example is based on an investment of $1,000 invested on May 1, 2006 and held for the six months ended October 31, 2006.
Actual Expenses
The table below titled “Based on Actual Total Return” provides information about actual account values and actual expenses. You may use the information provided in this table, together with the amount you invested, to estimate the expenses that you paid over the period. To estimate the expenses you paid on your account, divide your ending account value by $1,000 (for example, an $8,600 ending account value divided by $1,000 = 8.6), then multiply the result by the number under the heading entitled “Expenses Paid During the Period”.
| | | | | | | | | | | | | | | |
| Based on Actual Total Return(1) | | | | | | | | | | | | | |
| | | | | |
| | | Actual Total
Return(2) | | | Beginning
Account
Value | | Ending
Account
Value | | Annualized
Expense
Ratio | | | Expenses
Paid During
the Period(3) |
Legg Mason Partners Variable Large Cap Value Portfolio | | 6.26 | % | | $ | 1,000.00 | | $ | 1,062.60 | | 0.68 | % | | $ | 3.54 |
| |
Legg Mason Partners Variable Large Cap Growth Portfolio | | 3.85 | | | | 1,000.00 | | | 1,038.50 | | 0.83 | | | | 4.26 |
| |
Legg Mason Partners Variable Mid Cap Core Portfolio | | 0.51 | | | | 1,000.00 | | | 1,005.10 | | 0.87 | | | | 4.40 |
| |
Legg Mason Partners Variable Aggressive Growth Portfolio | | 1.65 | | | | 1,000.00 | | | 1,016.50 | | 0.80 | | | | 4.07 |
| |
Legg Mason Partners Variable International All Cap Growth Portfolio | | 1.94 | | | | 1,000.00 | | | 1,019.40 | | 0.95 | | | | 4.84 |
| |
| (1) | | For the six months ended October 31, 2006. |
| (2) | | Assumes reinvestment of all distributions, including returns of capital, if any, at net asset value. Total return is not annualized, as it may not be representative of the total return for the year. Total returns do not reflect expenses associated with the separate account such as administrative fees, account charges and surrender charges which, if reflected, would reduce the total returns. Performance figures may reflect fee waivers and/or expense reimbursements. Past performance is no guarantee of future results. In the absence of fee waivers and/or expense reimbursements, the total return would have been lower. |
| (3) | | Expenses (net of fee waivers and/or expense reimbursements) are equal to each Fund’s respective annualized expense ratio multiplied by the average account value over the period, multiplied by the number of days in the most recent fiscal half-year, then divided by 365. |
Legg Mason Partners Variable Portfolios III, Inc. 2006 Annual Report 21
Fund Expenses (unaudited) (continued)
Hypothetical Example for Comparison Purposes
The table below titled “Based on Hypothetical Total Return” provides information about hypothetical account values and hypothetical expenses based on the actual expense ratio and an assumed rate of return of 5.00% per year before expenses, which is not the Fund’s actual return. The hypothetical account values and expenses may not be used to estimate the actual ending account balance or expenses you paid for the period. You may use the information provided in this table to compare the ongoing costs of investing in the Fund and other funds. To do so, compare the 5.00% hypothetical example relating to the Fund with the 5.00% hypothetical examples that appear in the shareholder reports of the other funds.
Please note that the expenses shown in the table below are meant to highlight your ongoing costs only and do not reflect any transactional costs. Therefore, the table is useful in comparing ongoing costs only, and will not help you determine the relative total costs of owning different funds. In addition, if these transaction costs were included, your costs would have been higher.
| | | | | | | | | | | | | | | |
| Based on Hypothetical Total Return(1) |
| | | | | |
| | | Hypothetical
Annualized
Total Return | | | Beginning
Account
Value | | Ending
Account
Value | | Annualized
Expense
Ratio | | | Expenses
Paid During
the Period(2) |
Legg Mason Partners Variable Large Cap Value Portfolio | | 5.00 | % | | $ | 1,000.00 | | $ | 1,021.78 | | 0.68 | % | | $ | 3.47 |
| |
Legg Mason Partners Variable Large Cap Growth Portfolio | | 5.00 | | | | 1,000.00 | | | 1,021.02 | | 0.83 | | | | 4.23 |
| |
Legg Mason Partners Variable Mid Cap Core Portfolio | | 5.00 | | | | 1,000.00 | | | 1,020.82 | | 0.87 | | | | 4.43 |
| |
Legg Mason Partners Variable Aggressive Growth Portfolio | | 5.00 | | | | 1,000.00 | | | 1,021.17 | | 0.80 | | | | 4.08 |
| |
Legg Mason Partners Variable International All Cap Growth Portfolio | | 5.00 | | | | 1,000.00 | | | 1,020.42 | | 0.95 | | | | 4.84 |
| |
| (1) | | For the six months ended October 31, 2006. |
| (2) | | Expenses (net of fee waivers and/or expense reimbursements) are equal to each Fund’s respective annualized expense ratio, multiplied by the average account value over the period, multiplied by the number of days in the most recent fiscal half-year, then divided by 365. |
22 Legg Mason Partners Variable Portfolios III, Inc. 2006 Annual Report
Fund Performance
Legg Mason Partners Variable Large Cap Value Portfolio
| | | |
| Average Annual Total Returns† (unaudited) | | | |
Twelve Months Ended 10/31/06 | | 18.34 | % |
| | |
Five Years Ended 10/31/06 | | 6.34 | |
| | |
Ten Years Ended 10/31/06 | | 6.72 | |
| | |
Inception* through 10/31/06 | | 9.02 | |
| | |
| | | |
| Cumulative Total Return† (unaudited) | | | |
10/31/96 through 10/31/06 | | 91.72 | % |
| | |
| † | | Assumes reinvestment of all distributions, including returns of capital, if any, at net asset value. All figures represent past performance and are not a guarantee of future results. Investment return and principal value of an investment will fluctuate so that an investor’s shares, when redeemed, may be worth more or less than their original cost. The returns shown do not reflect expenses associated with the separate account such as administrative fees, account charges and surrender charges, which, if reflected, would reduce the total returns. Performance figures may reflect fee waivers and/or expense reimbursements. In the absence of fee waivers and/or expense reimbursements, the total return would have been lower. |
| * | | Inception date is June 16, 1994. |
Legg Mason Partners Variable Portfolios III, Inc. 2006 Annual Report 23
Fund Performance (continued)
Legg Mason Partners Variable Large Cap Growth Portfolio
| | | |
| Average Annual Total Returns† (unaudited) | | | |
Twelve Months Ended 10/31/06 | | 6.20 | % |
| | |
Five Years Ended 10/31/06 | | 5.54 | |
| | |
Inception* through 10/31/06 | | 5.37 | |
| | |
| | | |
| Cumulative Total Return† (unaudited) | | | |
Inception* through 10/31/06 | | 55.96 | % |
| | |
| † | | Assumes reinvestment of all distributions, including returns of capital, if any, at net asset value. All figures represent past performance and are not a guarantee of future results. Investment return and principal value of an investment will fluctuate so that an investor’s shares, when redeemed, may be worth more or less than their original cost. The returns shown do not reflect expenses associated with the separate account such as administrative fees, account charges and surrender charges, which, if reflected, would reduce the total returns. Performance figures may reflect fee waivers and/or expense reimbursements. In the absence of fee waivers and/or expense reimbursements, the total return would have been lower. |
| * | | Inception date is May 1, 1998. |
24 Legg Mason Partners Variable Portfolios III, Inc. 2006 Annual Report
Fund Performance (continued)
Legg Mason Partners Variable Mid Cap Core Portfolio
| | | |
| Average Annual Total Returns† (unaudited) | | | |
Twelve Months Ended 10/31/06 | | 15.22 | % |
| | |
Five Years Ended 10/31/06 | | 9.47 | |
| | |
Inception* through 10/31/06 | | 7.97 | |
| | |
| | | |
| Cumulative Total Return† (unaudited) | | | |
Inception* through 10/31/06 | | 71.05 | % |
| | |
| † | | Assumes reinvestment of all distributions, including returns of capital, if any, at net asset value. All figures represent past performance and are not a guarantee of future results. Investment return and principal value of an investment will fluctuate so that an investor’s shares, when redeemed, may be worth more or less than their original cost. The returns shown do not reflect expenses associated with the separate account such as administrative fees, account charges and surrender charges, which, if reflected, would reduce the total returns. Performance figures may reflect fee waivers and/or expense reimbursements. In the absence of fee waivers and/or expense reimbursements, the total return would have been lower. |
| * | | Inception date is November 1, 1999. |
Legg Mason Partners Variable Portfolios III, Inc. 2006 Annual Report 25
Fund Performance (continued)
Legg Mason Partners Variable Aggressive Growth Portfolio
| | | |
| Average Annual Total Returns† (unaudited) | | | |
Twelve Months Ended 10/31/06 | | 12.56 | % |
| | |
Five Years Ended 10/31/06 | | 5.51 | |
| | |
Inception* through 10/31/06 | | 7.06 | |
| | |
| | | |
| Cumulative Total Return† (unaudited) | | | |
Inception* through 10/31/06 | | 61.22 | % |
| | |
| † | | Assumes reinvestment of all distributions, including returns of capital, if any, at net asset value. All figures represent past performance and are not a guarantee of future results. Investment return and principal value of an investment will fluctuate so that an investor’s shares, when redeemed, may be worth more or less than their original cost. The returns shown do not reflect expenses associated with the separate account such as administrative fees, account charges and surrender charges, which, if reflected, would reduce the total returns. Performance figures may reflect fee waivers and/or expense reimbursements. In the absence of fee waivers and/or expense reimbursements, the total return would have been lower. |
| * | | Inception date is November 1, 1999. |
26 Legg Mason Partners Variable Portfolios III, Inc. 2006 Annual Report
Fund Performance (continued)
Legg Mason Partners Variable International All Cap Growth Portfolio
| | | |
| Average Annual Total Returns† (unaudited) | | | |
Twelve Months Ended 10/31/06 | | 25.46 | % |
| | |
Five Years Ended 10/31/06 | | 9.41 | |
| | |
Ten Years Ended 10/31/06 | | 3.82 | |
| | |
Inception* through 10/31/06 | | 4.74 | |
| | |
| | | |
| Cumulative Total Return† (unaudited) | | | |
10/31/96 through 10/31/06 | | 45.48 | % |
| | |
| † | | Assumes reinvestment of all distributions, including returns of capital, if any, at net asset value. All figures represent past performance and are not a guarantee of future results. Investment return and principal value of an investment will fluctuate so that an investor’s shares, when redeemed, may be worth more or less than their original cost. The returns shown do not reflect expenses associated with the separate account such as administrative fees, account charges and surrender charges which, if reflected, would reduce the total returns. Performance figures may reflect fee waivers and/or expense reimbursements. In the absence of fee waivers and/or expense reimbursements, the total return would have been lower. |
| * | | Inception date is June 16, 1994. |
Legg Mason Partners Variable Portfolios III, Inc. 2006 Annual Report 27
Historical Performance (unaudited)
Value of $10,000 Invested in Shares of the Legg Mason Partners Variable Large Cap Value Portfolio vs. S&P 500/Citigroup Value Index† (October 1996 — October 2006)
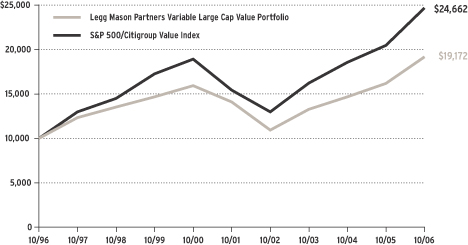
| † | | Hypothetical illustration of $10,000 invested in shares of the Legg Mason Partners Variable Large Cap Value Portfolio on October 31, 1996, assuming reinvestment of all distributions, including returns of capital, if any, at net asset value through October 31, 2006. The S&P 500/Citigroup Value Index is a market-capitalization weighted index of stocks in the S&P 500 Index having lower price-to-book ratios relative to the S&P 500 Index as a whole. (A price-to-book ratio is the price of a stock compared to the difference between a company’s assets and liabilities.) The Index is unmanaged and is not subject to the same management and trading expenses of a mutual fund. Please note that an investor cannot invest directly in an index. |
All figures represent past performance and are not a guarantee of future results. Investment return and principal value of an investment will fluctuate so that an investor’s shares, when redeemed, may be worth more or less than their original cost. The returns shown do not reflect expenses associated with the separate account such as administrative fees, account charges and surrender charges, which if reflected would reduce the total returns.
28 Legg Mason Partners Variable Portfolios III, Inc. 2006 Annual Report
Historical Performance (unaudited) (continued)
Value of $10,000 Invested in Shares of the Legg Mason Partners Variable Large Cap Growth Portfolio vs. Russell 1000 Growth Index† (May 1998 — October 2006)
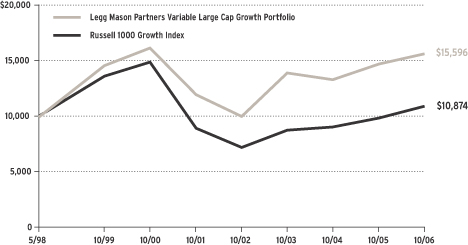
| † | | Hypothetical illustration of $10,000 invested in shares of the Legg Mason Partners Variable Large Cap Growth Portfolio on May 1, 1998 (commencement of operations), assuming reinvestment of all distributions, including returns of capital, if any, at net asset value through October 31, 2006. The Russell 1000 Growth Index is considered indicative of the growth-oriented domestic stock market in general and is comprised of stocks in the Russell 1000 Index that have higher price-to-book ratios and higher forecasted growth values as a whole. (A price-to-book ratio is the price of a stock compared to the difference between a company’s assets and liabilities.) Figures for the Index include reinvestment of dividends. The Index is unmanaged and is not subject to the same management and trading expenses of a mutual fund. Please note that an investor cannot invest directly in an index. |
All figures represent past performance and are not a guarantee of future results. Investment return and principal value of an investment will fluctuate so that an investor’s shares, when redeemed, may be worth more or less than their original cost. The returns shown do not reflect expenses associated with the separate account such as administrative fees, account charges and surrender charges, which if reflected, would reduce the total returns.
Legg Mason Partners Variable Portfolios III, Inc. 2006 Annual Report 29
Historical Performance (unaudited) (continued)
Value of $10,000 Invested in Shares of the Legg Mason Partners Variable Mid Cap Core Portfolio vs. the S&P MidCap 400 Index† (November 1999 — October 2006)
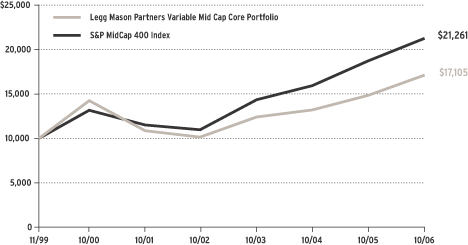
| † | | Hypothetical illustration of $10,000 invested in shares of the Legg Mason Partners Variable Mid Cap Core Portfolio on November 1, 1999 (commencement of operations), assuming reinvestment of all distributions, including returns of capital, if any, at net asset value through October 31, 2006. The S&P MidCap 400 Index is a widely recognized index of 400 medium-capitalization stocks. Figures for the S&P MidCap 400 Index include reinvestment of dividends. The Index is unmanaged and is not subject to the same management and trading expenses as a mutual fund. Please note that an investor cannot invest directly in an index. |
All figures represent past performance and are not a guarantee of future results. Investment return and principal value of an investment will fluctuate so that an investor’s shares, when redeemed, may be worth more or less than their original cost. The returns shown do not reflect expenses associated with the separate account such as administrative fees, account charges and surrender charges, which if reflected, would reduce the total returns.
30 Legg Mason Partners Variable Portfolios III, Inc. 2006 Annual Report
Historical Performance (unaudited) (continued)
Value of $10,000 Invested in Shares of the Legg Mason Partners Variable Aggressive Growth Portfolio vs. Russell 3000 Growth Index† (November 1999 — October 2006)
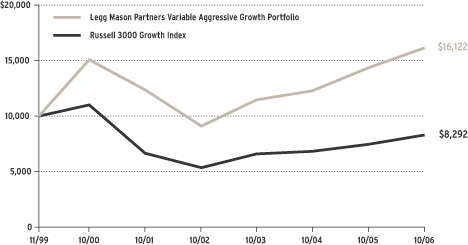
| † | | Hypothetical illustration of $10,000 invested in shares of the Legg Mason Partners Variable Aggressive Growth Portfolio on November 1, 1999 (commencement of operations), assuming reinvestment of all distributions, including returns of capital, if any, at net asset value through October 31, 2006. The Russell 3000 Growth Index measures the performance of those Russell 3000 Index companies with higher price-to-book ratios and higher forecasted growth values as a whole. (A price-to-book ratio is the price of a stock compared to the difference between a company’s assets and liabilities.) The Index is unmanaged and is not subject to the same management and trading expenses as a mutual fund. Please note that an investor cannot invest directly in an index. |
All figures represent past performance and are not a guarantee of future results. Investment return and principal value of an investment will fluctuate so that an investor’s shares, when redeemed, may be worth more or less than their original cost. The returns shown do not reflect expenses associated with the separate account such as administrative fees, account charges and surrender charges, which if reflected, would reduce the total returns.
Legg Mason Partners Variable Portfolios III, Inc. 2006 Annual Report 31
Historical Performance (unaudited) (continued)
Value of $10,000 Invested in Shares of the Legg Mason Partners Variable International All Cap Growth Portfolio vs. MSCI EAFE Growth Index† (October 1996 — October 2006)
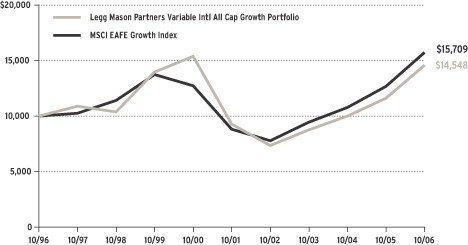
| † | | Hypothetical illustration of $10,000 invested in shares of the Legg Mason Partners Variable International All Cap Growth Portfolio on October 31, 1996, assuming reinvestment of all distributions, including returns of capital, if any, at net asset value through October 31, 2006. The Morgan Stanley Capital International Europe, Australasia and the Far East Growth Index (“MSCI EAFE Growth Index”) is an unmanaged index composed of growth stocks of companies located in Europe, Australasia and the Far East. The Index is unmanaged and is not subject to the same management and trading expenses of a mutual fund. Please note that an investor cannot invest directly in an index. |
All figures represent past performance and are not a guarantee of future results. Investment return and principal value of an investment will fluctuate so that an investor’s shares, when redeemed, may be worth more or less than their original cost. The returns shown do not reflect expenses associated with the separate account such as administrative fees, account charges and surrender charges which, if reflected, would reduce the total returns.
32 Legg Mason Partners Variable Portfolios III, Inc. 2006 Annual Report
Schedules of Investments (October 31, 2006)
LEGG MASON PARTNERS VARIABLE LARGE CAP VALUE PORTFOLIO
| | | | | |
| | |
| Shares | | Security | | Value |
| | | | | |
| COMMON STOCKS — 97.4% | | | |
| CONSUMER DISCRETIONARY — 14.6% | | | |
| Hotels, Restaurants & Leisure — 2.3% | | | |
| 156,900 | | McDonald’s Corp. | | $ | 6,577,248 |
| |
| Household Durables — 1.3% | | | |
| 131,500 | | Newell Rubbermaid Inc. | | | 3,784,570 |
| |
| Media — 7.9% | | | |
| 101,400 | | EchoStar Communications Corp., Class A Shares* | | | 3,601,728 |
| 20,105 | | Liberty Media Holding Corp., Capital Group, Series A Shares* | | | 1,790,551 |
| 100,525 | | Liberty Media Holding Corp., Interactive Group, Series A Shares* | | | 2,218,587 |
| 370,000 | | News Corp., Class B Shares | | | 8,043,800 |
| 111,500 | | SES Global SA, FDR | | | 1,710,317 |
| 285,700 | | Time Warner Inc. | | | 5,716,857 |
| |
| | Total Media | | | 23,081,840 |
| |
| Multiline Retail — 1.2% | | | |
| 58,400 | | Target Corp. | | | 3,456,112 |
| |
| Specialty Retail — 1.9% | | | |
| 149,200 | | Home Depot Inc. | | | 5,569,636 |
| |
| | TOTAL CONSUMER DISCRETIONARY | | | 42,469,406 |
| |
| |
| CONSUMER STAPLES — 8.9% | | | |
| Food & Staples Retailing — 3.7% | | | |
| 196,800 | | Kroger Co. | | | 4,426,032 |
| 127,200 | | Wal-Mart Stores Inc. | | | 6,268,416 |
| |
| | Total Food & Staples Retailing | | | 10,694,448 |
| |
| Household Products — 1.8% | | | |
| 79,700 | | Kimberly-Clark Corp. | | | 5,301,644 |
| |
| Tobacco — 3.4% | | | |
| 122,300 | | Altria Group Inc. | | | 9,946,659 |
| |
| | TOTAL CONSUMER STAPLES | | | 25,942,751 |
| |
| ENERGY — 7.0% | | | |
| Energy Equipment & Services — 1.9% | | | |
| 81,500 | | GlobalSantaFe Corp. | | | 4,229,850 |
| 36,600 | | Halliburton Co. | | | 1,184,010 |
| |
| | Total Energy Equipment & Services | | | 5,413,860 |
| |
| Oil, Gas & Consumable Fuels — 5.1% | | | |
| 49,700 | | Royal Dutch Shell PLC, ADR, Class A Shares | | | 3,460,114 |
| 45,800 | | Suncor Energy Inc. | | | 3,510,570 |
| 115,200 | | Total SA, ADR | | | 7,849,728 |
| |
| | Total Oil, Gas & Consumable Fuels | | | 14,820,412 |
| |
| | TOTAL ENERGY | | | 20,234,272 |
| |
See Notes to Financial Statements.
Legg Mason Partners Variable Portfolios III, Inc. 2006 Annual Report 33
Schedules of Investments (October 31, 2006) (continued)
| | | | | |
| | |
| Shares | | Security | | Value |
| | | | | |
| FINANCIALS — 31.1% | | | |
| Capital Markets — 5.7% | | | |
| 84,700 | | Bank of New York Co. Inc. | | $ | 2,911,139 |
| 23,800 | | Goldman Sachs Group Inc. | | | 4,517,002 |
| 104,200 | | Merrill Lynch & Co. Inc. | | | 9,109,164 |
| |
| | Total Capital Markets | | | 16,537,305 |
| |
| Commercial Banks — 3.9% | | | |
| 102,335 | | Wachovia Corp. | | | 5,679,593 |
| 157,800 | | Wells Fargo & Co. | | | 5,726,562 |
| |
| | Total Commercial Banks | | | 11,406,155 |
| |
| Consumer Finance — 4.9% | | | |
| 114,500 | | American Express Co. | | | 6,619,245 |
| 98,200 | | Capital One Financial Corp. | | | 7,790,206 |
| |
| | Total Consumer Finance | | | 14,409,451 |
| |
| Diversified Financial Services — 4.7% | | | |
| 119,100 | | Bank of America Corp. | | | 6,415,917 |
| 152,900 | | JPMorgan Chase & Co. | | | 7,253,576 |
| |
| | Total Diversified Financial Services | | | 13,669,493 |
| |
| Insurance — 10.2% | | | |
| 76,600 | | AFLAC Inc. | | | 3,440,872 |
| 83,500 | | American International Group Inc. | | | 5,608,695 |
| 93,600 | | Chubb Corp. | | | 4,974,840 |
| 162,700 | | Loews Corp. | | | 6,332,284 |
| 154,700 | | Marsh & McLennan Cos. Inc. | | | 4,554,368 |
| 95,900 | | St. Paul Travelers Cos. Inc. | | | 4,903,367 |
| |
| | Total Insurance | | | 29,814,426 |
| |
| Thrifts & Mortgage Finance — 1.7% | | | |
| 70,200 | | Freddie Mac | | | 4,843,098 |
| |
| | TOTAL FINANCIALS | | | 90,679,928 |
| |
| |
| HEALTH CARE — 8.9% | | | |
| Health Care Providers & Services — 3.4% | | | |
| 100,400 | | UnitedHealth Group Inc. | | | 4,897,512 |
| 68,200 | | WellPoint Inc.* | | | 5,205,024 |
| |
| | Total Health Care Providers & Services | | | 10,102,536 |
| |
| Pharmaceuticals — 5.5% | | | |
| 90,600 | | Abbott Laboratories | | | 4,304,406 |
| 46,500 | | Johnson & Johnson | | | 3,134,100 |
| 82,200 | | Novartis AG, ADR | | | 4,992,006 |
| 82,200 | | Sanofi-Aventis, ADR | | | 3,509,118 |
| |
| | Total Pharmaceuticals | | | 15,939,630 |
| |
| | TOTAL HEALTH CARE | | | 26,042,166 |
| |
See Notes to Financial Statements.
34 Legg Mason Partners Variable Portfolios III, Inc. 2006 Annual Report
Schedules of Investments (October 31, 2006) (continued)
| | | | | |
| | |
| Shares | | Security | | Value |
| | | | | |
| INDUSTRIALS — 9.5% | | | |
| Aerospace & Defense — 4.3% | | | |
| 53,400 | | Boeing Co. | | $ | 4,264,524 |
| 67,500 | | Raytheon Co. | | | 3,371,625 |
| 77,100 | | United Technologies Corp. | | | 5,067,012 |
| |
| | Total Aerospace & Defense | | | 12,703,161 |
| |
| Building Products — 1.0% | | | |
| 101,400 | | Masco Corp. | | | 2,803,710 |
| |
| Commercial Services & Supplies — 1.3% | | | |
| 58,800 | | Avery Dennison Corp. | | | 3,712,632 |
| |
| Industrial Conglomerates — 1.8% | | | |
| 57,000 | | Textron Inc. | | | 5,183,010 |
| |
| Machinery — 1.1% | | | |
| 37,700 | | Parker Hannifin Corp. | | | 3,152,851 |
| |
| | TOTAL INDUSTRIALS | | | 27,555,364 |
| |
| |
| INFORMATION TECHNOLOGY — 3.8% | | | |
| Communications Equipment — 1.5% | | | |
| 223,100 | | Nokia Oyj, ADR | | | 4,435,228 |
| |
| Computers & Peripherals — 1.2% | | | |
| 36,100 | | International Business Machines Corp. | | | 3,333,113 |
| |
| Software — 1.1% | | | |
| 113,900 | | Microsoft Corp. | | | 3,270,069 |
| |
| | TOTAL INFORMATION TECHNOLOGY | | | 11,038,410 |
| |
| MATERIALS — 2.9% | | | |
| Chemicals — 2.9% | | | |
| 46,100 | | Air Products & Chemicals Inc. | | | 3,211,787 |
| 112,500 | | E.I. du Pont de Nemours & Co. | | | 5,152,500 |
| |
| | TOTAL MATERIALS | | | 8,364,287 |
| |
| TELECOMMUNICATION SERVICES — 8.2% | | | |
| Diversified Telecommunication Services — 4.1% | | | |
| 241,537 | | AT&T Inc. | | | 8,272,642 |
| 73,450 | | Embarq Corp. | | | 3,551,308 |
| |
| | Total Diversified Telecommunication Services | | | 11,823,950 |
| |
| Wireless Telecommunication Services — 4.1% | | | |
| 91,300 | | ALLTEL Corp. | | | 4,867,203 |
| 385,802 | | Sprint Nextel Corp. | | | 7,210,639 |
| |
| | Total Wireless Telecommunication Services | | | 12,077,842 |
| |
| | TOTAL TELECOMMUNICATION SERVICES | | | 23,901,792 |
| |
See Notes to Financial Statements.
Legg Mason Partners Variable Portfolios III, Inc. 2006 Annual Report 35
Schedules of Investments (October 31, 2006) (continued)
| | | | | | |
| | |
| Shares | | Security | | Value |
| | UTILITIES — 2.5% | | | |
| | Multi-Utilities — 2.5% | | | |
| | 136,900 | | Sempra Energy | | $ | 7,261,176 |
| | |
| | | TOTAL INVESTMENTS BEFORE SHORT-TERM INVESTMENT (Cost — $216,899,975) | | | 283,489,552 |
| | |
| | |
Face
Amount | | | | |
| | SHORT-TERM INVESTMENT — 2.3% | | | |
| | Repurchase Agreement — 2.3% | | | |
| $ | 6,847,000 | | Interest in $443,169,000 joint tri-party repurchase agreement dated 10/31/06 with Greenwich Capital Markets Inc., 5.280% due 11/1/06; Proceeds at maturity — $6,848,004; (Fully collateralized by various U.S. government agency obligations, 3.314% to 6.554% due 11/1/28 to 11/1/36; Market value — $6,983,988)
(Cost — $6,847,000) | | | 6,847,000 |
| | |
| | | TOTAL INVESTMENTS — 99.7% (Cost — $223,746,975#) | | | 290,336,552 |
| | | Other Assets in Excess of Liabilities — 0.3% | | | 857,663 |
| | |
| | | TOTAL NET ASSETS — 100.0% | | $ | 291,194,215 |
| | |
| * | | Non-income producing security. |
| # | | Aggregate cost for federal income tax purposes is $225,405,180. |
| | |
Abbreviations used in this schedule: |
| ADR | | — American Depositary Receipt |
| FDR | | — Foreign Depositary Receipt |
See Notes to Financial Statements.
36 Legg Mason Partners Variable Portfolios III, Inc. 2006 Annual Report
Schedules of Investments (October 31, 2006) (continued)
LEGG MASON PARTNERS VARIABLE LARGE CAP GROWTH PORTFOLIO
| | | | | |
| | |
| Shares | | Security | | Value |
| | | | | |
| COMMON STOCKS — 100.1% | | | |
| CONSUMER DISCRETIONARY — 17.2% | | | |
| Internet & Catalog Retail — 8.3% | | | |
| 488,400 | | Amazon.com Inc.* | | $ | 18,603,156 |
| 290,100 | | IAC/InterActiveCorp* | | | 8,987,298 |
| |
| | Total Internet & Catalog Retail | | | 27,590,454 |
| |
| Media — 5.9% | | | |
| 525,120 | | Time Warner Inc. | | | 10,507,651 |
| 287,015 | | Walt Disney Co. | | | 9,029,492 |
| |
| | Total Media | | | 19,537,143 |
| |
| Specialty Retail — 3.0% | | | |
| 263,850 | | Home Depot Inc. | | | 9,849,521 |
| |
| | TOTAL CONSUMER DISCRETIONARY | | | 56,977,118 |
| |
| CONSUMER STAPLES — 12.0% | | | |
| Beverages — 5.2% | | | |
| 191,290 | | Coca-Cola Co. | | | 8,937,069 |
| 133,400 | | PepsiCo Inc. | | | 8,462,896 |
| |
| | Total Beverages | | | 17,399,965 |
| |
| Food Products — 2.8% | | | |
| 178,675 | | Wm. Wrigley Jr. Co. | | | 9,282,166 |
| |
| Household Products — 4.0% | | | |
| 208,255 | | Procter & Gamble Co. | | | 13,201,285 |
| |
| | TOTAL CONSUMER STAPLES | | | 39,883,416 |
| |
| FINANCIALS — 13.7% | | | |
| Capital Markets — 7.3% | | | |
| 172,330 | | Merrill Lynch & Co. Inc. | | | 15,065,089 |
| 120,670 | | Morgan Stanley | | | 9,222,808 |
| |
| | Total Capital Markets | | | 24,287,897 |
| |
| Insurance — 6.4% | | | |
| 134,956 | | American International Group Inc. | | | 9,064,994 |
| 115 | | Berkshire Hathaway Inc., Class A Shares* | | | 12,129,625 |
| |
| | Total Insurance | | | 21,194,619 |
| |
| | TOTAL FINANCIALS | | | 45,482,516 |
| |
| HEALTH CARE — 22.4% | | | |
| Biotechnology — 15.0% | | | |
| 257,980 | | Amgen Inc.* | | | 19,583,262 |
| 229,350 | | Biogen Idec Inc.* | | | 10,917,060 |
| 229,300 | | Genentech Inc.* | | | 19,100,690 |
| |
| | Total Biotechnology | | | 49,601,012 |
| |
See Notes to Financial Statements.
Legg Mason Partners Variable Portfolios III, Inc. 2006 Annual Report 37
Schedules of Investments (October 31, 2006) (continued)
| | | | | | | |
| | |
| Shares | | Security | | Value | |
| | | | | | |
| | Health Care Equipment & Supplies — 2.1% | | | | |
| | 143,650 | | Medtronic Inc. | | $ | 6,992,882 | |
| | | |
| | Pharmaceuticals — 5.3% | | | | |
| | 126,170 | | Johnson & Johnson | | | 8,503,858 | |
| | 344,770 | | Pfizer Inc. | | | 9,188,120 | |
| | | |
| | | Total Pharmaceuticals | | | 17,691,978 | |
| | | |
| | | TOTAL HEALTH CARE | | | 74,285,872 | |
| | | |
| | INFORMATION TECHNOLOGY — 34.8% | | | | |
| | Communications Equipment — 11.0% | | | | |
| | 398,508 | | Cisco Systems Inc.* | | | 9,615,998 | |
| | 351,900 | | Juniper Networks Inc.* | | | 6,059,718 | |
| | 573,380 | | Motorola Inc. | | | 13,222,143 | |
| | 208,900 | | QUALCOMM Inc. | | | 7,601,871 | |
| | | |
| | | Total Communications Equipment | | | 36,499,730 | |
| | | |
| | Internet Software & Services — 9.3% | | | | |
| | 246,500 | | Akamai Technologies Inc.* | | | 11,550,990 | |
| | 321,800 | | eBay Inc.* | | | 10,339,434 | |
| | 344,700 | | Yahoo! Inc.* | | | 9,079,398 | |
| | | |
| | | Total Internet Software & Services | | | 30,969,822 | |
| | | |
| | Semiconductors & Semiconductor Equipment — 6.6% | | | | |
| | 455,200 | | Intel Corp. | | | 9,713,968 | |
| | 401,480 | | Texas Instruments Inc. | | | 12,116,666 | |
| | | |
| | | Total Semiconductors & Semiconductor Equipment | | | 21,830,634 | |
| | | |
| | Software — 7.9% | | | | |
| | 201,800 | | Electronic Arts Inc.* | | | 10,673,202 | |
| | 349,000 | | Microsoft Corp. | | | 10,019,790 | |
| | 327,200 | | Red Hat Inc.* | | | 5,359,536 | |
| | | |
| | | Total Software | | | 26,052,528 | |
| | | |
| | | TOTAL INFORMATION TECHNOLOGY | | | 115,352,714 | |
| | | |
| | | TOTAL INVESTMENTS BEFORE SHORT-TERM INVESTMENT
(Cost — $232,499,234) | | | 331,981,636 | |
| | | |
| | |
Face
Amount | | | | | |
| | SHORT-TERM INVESTMENT — 0.2% | | | | |
| | Repurchase Agreement — 0.2% | | | | |
| $ | 762,000 | | Interest in $382,313,000 joint tri-party repurchase agreement dated 10/31/06 with Banc of America Securities LLC, 5.290% due 11/1/06; Proceeds at maturity — $762,112; (Fully collateralized by various U.S. government agency obligations, 0.000% to 5.375% due 7/23/07 to 5/15/19; Market value — $777,246)
(Cost — $762,000) | | | 762,000 | |
| | | |
| | | TOTAL INVESTMENTS — 100.3% (Cost — $233,261,234#) | | | 332,743,636 | |
| | | Liabilities in Excess of Other Assets — (0.3)% | | | (887,606 | ) |
| | | |
| | | TOTAL NET ASSETS — 100.0% | | $ | 331,856,030 | |
| | | |
| * | | Non-income producing security. |
| # | | Aggregate cost for federal income tax purposes is $247,609,462. |
See Notes to Financial Statements.
38 Legg Mason Partners Variable Portfolios III, Inc. 2006 Annual Report
Schedules of Investments (October 31, 2006) (continued)
LEGG MASON PARTNERS VARIABLE MID CAP CORE PORTFOLIO
| | | | | |
| | |
| Shares | | Security | | Value |
| | | | | |
| COMMON STOCKS — 98.8% | | | |
| CONSUMER DISCRETIONARY — 16.3% | | | |
| Auto Components — 1.0% | | | |
| 20,400 | | BorgWarner Inc. | | $ | 1,173,000 |
| |
| Diversified Consumer Services — 2.3% | | | |
| 248,400 | | ServiceMaster Co. | | | 2,814,372 |
| |
| Hotels, Restaurants & Leisure — 2.2% | | | |
| 59,400 | | CBRL Group Inc. | | | 2,608,254 |
| |
| Household Durables — 5.2% | | | |
| 24,570 | | Black & Decker Corp. | | | 2,060,932 |
| 26,390 | | Mohawk Industries Inc.* | | | 1,918,553 |
| 77,900 | | Toll Brothers Inc.* | | | 2,252,089 |
| |
| | Total Household Durables | | | 6,231,574 |
| |
| Media — 1.1% | | | |
| 49,000 | | Warner Music Group Corp. | | | 1,270,570 |
| |
| Specialty Retail — 4.5% | | | |
| 72,150 | | Bed Bath & Beyond Inc.* | | | 2,906,923 |
| 42,700 | | Sherwin-Williams Co. | | | 2,529,121 |
| |
| | Total Specialty Retail | | | 5,436,044 |
| |
| | TOTAL CONSUMER DISCRETIONARY | | | 19,533,814 |
| |
| CONSUMER STAPLES — 1.9% | | | |
| Beverages — 1.9% | | | |
| 31,500 | | Molson Coors Brewing Co., Class B Shares | | | 2,242,170 |
| |
| ENERGY — 7.4% | | | |
| Energy Equipment & Services — 4.0% | | | |
| 36,690 | | Nabors Industries Ltd.* | | | 1,132,987 |
| 40,640 | | Smith International Inc. | | | 1,604,467 |
| 49,650 | | Weatherford International Ltd.* | | | 2,039,622 |
| |
| | Total Energy Equipment & Services | | | 4,777,076 |
| |
| Oil, Gas & Consumable Fuels — 3.4% | | | |
| 28,990 | | Murphy Oil Corp. | | | 1,367,169 |
| 39,210 | | Newfield Exploration Co.* | | | 1,599,376 |
| 22,160 | | Nexen Inc. | | | 1,181,571 |
| |
| | Total Oil, Gas & Consumable Fuels | | | 4,148,116 |
| |
| | TOTAL ENERGY | | | 8,925,192 |
| |
| FINANCIALS — 17.7% | | | |
| Capital Markets — 1.7% | | | |
| 13,385 | | Bear Stearns Cos. Inc. | | | 2,025,820 |
| |
| Commercial Banks — 1.0% | | | |
| 21,220 | | Comerica Inc. | | | 1,234,792 |
| |
See Notes to Financial Statements.
Legg Mason Partners Variable Portfolios III, Inc. 2006 Annual Report 39
Schedules of Investments (October 31, 2006) (continued)
| | | | | |
| | |
| Shares | | Security | | Value |
| | | | | |
| Consumer Finance — 1.0% | | | |
| 40,350 | | Nelnet Inc., Class A Shares* | | $ | 1,187,904 |
| |
| Insurance — 6.6% | | | |
| 8,820 | | Ambac Financial Group Inc. | | | 736,382 |
| 41,500 | | Cincinnati Financial Corp. | | | 1,894,475 |
| 16,500 | | Fidelity National Financial Inc. | | | 367,950 |
| 17,287 | | Fidelity National Title Group Inc., Class A | | | 380,487 |
| 99,250 | | Old Republic International Corp. | | | 2,236,102 |
| 32,790 | | PartnerRe Ltd. | | | 2,292,677 |
| |
| | Total Insurance | | | 7,908,073 |
| |
| Real Estate Investment Trusts (REITs) — 1.6% | | | |
| 161,005 | | Spirit Finance Corp. | | | 1,917,569 |
| |
| Thrifts & Mortgage Finance — 5.8% | | | |
| 181,585 | | Hudson City Bancorp Inc. | | | 2,493,162 |
| 22,800 | | MGIC Investment Corp. | | | 1,339,728 |
| 72,800 | | New York Community Bancorp Inc. | | | 1,190,280 |
| 44,900 | | PMI Group Inc. | | | 1,914,985 |
| |
| | Total Thrifts & Mortgage Finance | | | 6,938,155 |
| |
| | TOTAL FINANCIALS | | | 21,212,313 |
| |
| HEALTH CARE — 12.3% | | | |
| Biotechnology — 3.9% | | | |
| 47,000 | | ImClone Systems Inc.* | | | 1,470,630 |
| 76,800 | | MedImmune Inc.* | | | 2,460,672 |
| 17,700 | | Vertex Pharmaceuticals Inc.* | | | 718,620 |
| |
| | Total Biotechnology | | | 4,649,922 |
| |
| Health Care Equipment & Supplies — 3.6% | | | |
| 99,700 | | Boston Scientific Corp.* | | | 1,586,227 |
| 31,855 | | Fisher Scientific International Inc.* | | | 2,727,425 |
| |
| | Total Health Care Equipment & Supplies | | | 4,313,652 |
| |
| Health Care Providers & Services — 3.9% | | | |
| 24,350 | | Coventry Health Care Inc.* | | | 1,143,233 |
| 26,200 | | Health Net Inc.* | | | 1,087,562 |
| 53,600 | | Pediatrix Medical Group Inc.* | | | 2,408,248 |
| |
| | Total Health Care Providers & Services | | | 4,639,043 |
| |
| Pharmaceuticals — 0.9% | | | |
| 58,500 | | MGI Pharma Inc.* | | | 1,113,255 |
| |
| | TOTAL HEALTH CARE | | | 14,715,872 |
| |
| INDUSTRIALS — 15.7% | | | |
| Aerospace & Defense — 4.2% | | | |
| 49,200 | | Armor Holdings Inc.* | | | 2,531,832 |
| 31,200 | | L-3 Communications Holdings Inc. | | | 2,512,224 |
| |
| | Total Aerospace & Defense | | | 5,044,056 |
| |
See Notes to Financial Statements.
40 Legg Mason Partners Variable Portfolios III, Inc. 2006 Annual Report
Schedules of Investments (October 31, 2006) (continued)
| | | | | |
| | |
| Shares | | Security | | Value |
| | | | | |
| Commercial Services & Supplies — 2.2% | | | |
| 75,440 | | R.R. Donnelley & Sons Co. | | $ | 2,554,398 |
| |
| Electrical Equipment — 1.4% | | | |
| 34,950 | | Roper Industries Inc. | | | 1,672,358 |
| |
| Machinery — 7.9% | | | |
| 101,200 | | AGCO Corp.* | | | 2,707,100 |
| 36,600 | | Eaton Corp. | | | 2,650,938 |
| 62,900 | | JLG Industries Inc. | | | 1,739,185 |
| 28,700 | | Parker Hannifin Corp. | | | 2,400,181 |
| |
| | Total Machinery | | | 9,497,404 |
| |
| | TOTAL INDUSTRIALS | | | 18,768,216 |
| |
| INFORMATION TECHNOLOGY — 20.7% | | | |
| Computers & Peripherals — 8.1% | | | |
| 65,000 | | Intergraph Corp.* | | | 2,839,850 |
| 34,700 | | Lexmark International Inc., Class A Shares* | | | 2,206,573 |
| 141,700 | | Palm Inc.* | | | 2,175,095 |
| 138,200 | | Western Digital Corp.* | | | 2,526,296 |
| |
| | Total Computers & Peripherals | | | 9,747,814 |
| |
| Electronic Equipment & Instruments — 2.3% | | | |
| 62,300 | | Benchmark Electronics Inc.* | | | 1,654,065 |
| 16,730 | | CDW Corp. | | | 1,098,659 |
| |
| | Total Electronic Equipment & Instruments | | | 2,752,724 |
| |
| Internet Software & Services — 1.5% | | | |
| 67,200 | | j2 Global Communications Inc.* | | | 1,843,968 |
| |
| IT Services — 1.8% | | | |
| 82,700 | | Sabre Holdings Corp., Class A Shares | | | 2,102,234 |
| |
| Semiconductors & Semiconductor Equipment — 5.1% | | | |
| 66,700 | | Agere Systems Inc.* | | | 1,132,566 |
| 64,000 | | Freescale Semiconductor Inc., Class B Shares* | | | 2,517,120 |
| 48,700 | | Lam Research Corp.* | | | 2,408,215 |
| |
| | Total Semiconductors & Semiconductor Equipment | | | 6,057,901 |
| |
| Software — 1.9% | | | |
| 108,200 | | Check Point Software Technologies Ltd.* | | | 2,241,904 |
| |
| | TOTAL INFORMATION TECHNOLOGY | | | 24,746,545 |
| |
| MATERIALS — 1.3% | | | |
| Metals & Mining — 1.3% | | | |
| 26,800 | | Compass Minerals International Inc. | | | 829,460 |
| 21,500 | | Reliance Steel & Aluminum Co. | | | 738,525 |
| |
| | TOTAL MATERIALS | | | 1,567,985 |
| |
| UTILITIES — 5.5% | | | |
| Electric Utilities — 2.6% | | | |
| 67,200 | | Pepco Holdings Inc. | | | 1,708,224 |
| 27,700 | | WPS Resources Corp. | | | 1,473,917 |
| |
| | Total Electric Utilities | | | 3,182,141 |
| |
See Notes to Financial Statements.
Legg Mason Partners Variable Portfolios III, Inc. 2006 Annual Report 41
Schedules of Investments (October 31, 2006) (continued)
| | | | | | | |
| | |
| Shares | | Security | | Value | |
| | | | | | |
| | Multi-Utilities — 2.9% | | | | |
| | 36,700 | | SCANA Corp. | | $ | 1,466,532 | |
| | 37,700 | | Sempra Energy | | | 1,999,608 | |
| | | |
| | | Total Multi-Utilities | | | 3,466,140 | |
| | | |
| | | TOTAL UTILITIES | | | 6,648,281 | |
| | | |
| | | TOTAL INVESTMENTS BEFORE SHORT-TERM INVESTMENT
(Cost — $103,265,773) | | | 118,360,388 | |
| | | |
| | |
Face
Amount | | | | | |
| | SHORT-TERM INVESTMENT — 1.5% | | | | |
| | Repurchase Agreement — 1.5% | | | | |
| $ | 1,799,000 | | Interest in $382,313,000 joint tri-party repurchase agreement dated 10/31/06 with Banc of America Securities LLC, 5.290% due 11/1/06; Proceeds at maturity — $1,799,264; (Fully collateralized by various U.S. government agency obligations, 0.000% to 5.375% due 7/23/07 to 5/15/19; Market value — $1,834,993)
(Cost — $1,799,000) | | | 1,799,000 | |
| | | |
| | | TOTAL INVESTMENTS — 100.3% (Cost — $105,064,773#) | | | 120,159,388 | |
| | | Liabilities in Excess of Other Assets — (0.3)% | | | (386,559 | ) |
| | | |
| | | TOTAL NET ASSETS — 100.0% | | $ | 119,772,829 | |
| | | |
| | | |
| * | | Non-income producing security. |
| # | | Aggregate cost for federal income tax purposes is $105,073,933. |
See Notes to Financial Statements.
42 Legg Mason Partners Variable Portfolios III, Inc. 2006 Annual Report
Schedules of Investments (October 31, 2006) (continued)
LEGG MASON PARTNERS VARIABLE AGGRESSIVE GROWTH PORTFOLIO
| | | | | |
| | |
| Shares | | Security | | Value |
| | | | | |
| COMMON STOCKS — 99.4% | | | |
| CONSUMER DISCRETIONARY — 17.6% | | | |
| Media — 17.3% | | | |
| 1,273,275 | | Cablevision Systems Corp., New York Group, Class A Shares | | $ | 35,384,312 |
| 166,349 | | CBS Corp., Class B Shares | | | 4,814,140 |
| 132,842 | | Comcast Corp., Class A Shares* | | | 5,402,684 |
| 1,348,160 | | Comcast Corp., Special Class A Shares* | | | 54,573,517 |
| 201,340 | | Discovery Holding Co., Class A Shares* | | | 2,987,886 |
| 81,888 | | Liberty Global Inc., Series A Shares* | | | 2,148,741 |
| 83,046 | | Liberty Global Inc., Series C Shares* | | | 2,111,860 |
| 100,670 | | Liberty Media Holding Corp., Capital Group, Series A Shares* | | | 8,965,670 |
| 503,350 | | Liberty Media Holding Corp., Interactive Group, Series A Shares* | | | 11,108,934 |
| 2,484,705 | | Sirius Satellite Radio Inc.* | | | 9,516,420 |
| 2,029,367 | | Time Warner Inc. | | | 40,607,634 |
| 166,349 | | Viacom Inc., Class B Shares* | | | 6,474,303 |
| 675,000 | | Walt Disney Co. | | | 21,235,500 |
| 34,600 | | World Wrestling Entertainment Inc. | | | 576,782 |
| |
| | Total Media | | | 205,908,383 |
| |
| Specialty Retail — 0.3% | | | |
| 215,000 | | Charming Shoppes Inc.* | | | 3,182,000 |
| 12,600 | | J. Crew Group Inc.* | | | 388,584 |
| |
| | Total Specialty Retail | | | 3,570,584 |
| |
| | TOTAL CONSUMER DISCRETIONARY | | | 209,478,967 |
| |
| ENERGY — 14.2% | | | |
| Energy Equipment & Services — 8.0% | | | |
| 165,800 | | Core Laboratories NV* | | | 12,085,162 |
| 580,650 | | Grant Prideco Inc.* | | | 21,931,151 |
| 1,490,900 | | Weatherford International Ltd.* | | | 61,246,172 |
| |
| | Total Energy Equipment & Services | | | 95,262,485 |
| |
| Oil, Gas & Consumable Fuels — 6.2% | | | |
| 1,591,600 | | Anadarko Petroleum Corp. | | | 73,882,072 |
| 6,325 | | Bill Barrett Corp.* | | | 180,452 |
| |
| | Total Oil, Gas & Consumable Fuels | | | 74,062,524 |
| |
| | TOTAL ENERGY | | | 169,325,009 |
| |
| EXCHANGE TRADED FUND — 1.9% | | | |
| 532,000 | | Nasdaq-100 Index Tracking Stock | | | 22,652,560 |
| |
| FINANCIALS — 13.1% | | | |
| Capital Markets — 12.1% | | | |
| 154,400 | | Cohen & Steers Inc. | | | 5,385,472 |
| 1,225,684 | | Lehman Brothers Holdings Inc. | | | 95,407,243 |
| 500,400 | | Merrill Lynch & Co. Inc. | | | 43,744,968 |
| |
| | Total Capital Markets | | | 144,537,683 |
| |
See Notes to Financial Statements.
Legg Mason Partners Variable Portfolios III, Inc. 2006 Annual Report 43
Schedules of Investments (October 31, 2006) (continued)
| | | | | |
| | |
| Shares | | Security | | Value |
| | | | | |
| Diversified Financial Services — 0.4% | | | |
| 83,725 | | CIT Group Inc. | | $ | 4,357,886 |
| |
| Insurance — 0.0% | | | |
| 2,415 | | National Financial Partners Corp. | | | 95,151 |
| |
| Thrifts & Mortgage Finance — 0.6% | | | |
| 49,500 | | Astoria Financial Corp. | | | 1,435,995 |
| 361,566 | | New York Community Bancorp Inc. | | | 5,911,604 |
| |
| | Total Thrifts & Mortgage Finance | | | 7,347,599 |
| |
| | TOTAL FINANCIALS | | | 156,338,319 |
| |
| HEALTH CARE — 32.3% | | | |
| Biotechnology — 17.5% | | | |
| 162,500 | | Alkermes Inc.* | | | 2,730,000 |
| 770,105 | | Amgen Inc.* | | | 58,458,670 |
| 933,806 | | Biogen Idec Inc.* | | | 44,449,166 |
| 101,900 | | Genentech Inc.* | | | 8,488,270 |
| 825,168 | | Genzyme Corp.* | | | 55,707,092 |
| 541,275 | | ImClone Systems Inc.* | | | 16,936,495 |
| 224,750 | | Isis Pharmaceuticals Inc.* | | | 1,928,355 |
| 36,716 | | Micromet Inc.* | | | 93,259 |
| 766,905 | | Millennium Pharmaceuticals Inc.* | | | 8,972,788 |
| 173,000 | | Nanogen Inc.* | | | 356,380 |
| 265,400 | | Vertex Pharmaceuticals Inc.* | | | 10,775,240 |
| 29,445 | | ViaCell Inc.* | | | 141,336 |
| |
| | Total Biotechnology | | | 209,037,051 |
| |
| Health Care Equipment & Supplies — 0.4% | | | |
| 92,100 | | Biosite Inc.* | | | 4,230,153 |
| |
| Health Care Providers & Services — 6.8% | | | |
| 1,672,000 | | UnitedHealth Group Inc. | | | 81,560,160 |
| |
| Pharmaceuticals — 7.6% | | | |
| 96,900 | | BioMimetic Therapeutics Inc.* | | | 1,292,646 |
| 1,048,800 | | Forest Laboratories Inc.* | | | 51,328,272 |
| 243,448 | | Johnson & Johnson | | | 16,408,395 |
| 635,666 | | King Pharmaceuticals Inc.* | | | 10,634,692 |
| 75,289 | | Pfizer Inc. | | | 2,006,452 |
| 78,576 | | Teva Pharmaceutical Industries Ltd., ADR | | | 2,590,651 |
| 323,000 | | Valeant Pharmaceuticals International | | | 6,033,640 |
| |
| | Total Pharmaceuticals | | | 90,294,748 |
| |
| | TOTAL HEALTH CARE | | | 385,122,112 |
| |
| INDUSTRIALS — 7.6% | | | |
| Aerospace & Defense — 2.6% | | | |
| 378,800 | | L-3 Communications Holdings Inc. | | | 30,500,976 |
| |
See Notes to Financial Statements.
44 Legg Mason Partners Variable Portfolios III, Inc. 2006 Annual Report
Schedules of Investments (October 31, 2006) (continued)
| | | | | |
| | |
| Shares | | Security | | Value |
| | | | | |
| Industrial Conglomerates — 4.2% | | | |
| 1,683,412 | | Tyco International Ltd. | | $ | 49,542,815 |
| |
| Machinery — 0.8% | | | |
| 308,000 | | Pall Corp. | | | 9,825,200 |
| |
| | TOTAL INDUSTRIALS | | | 89,868,991 |
| |
| INFORMATION TECHNOLOGY — 12.5% | | | |
| Communications Equipment — 2.7% | | | |
| 186,100 | | C-COR Inc.* | | | 1,859,139 |
| 890,500 | | Motorola Inc. | | | 20,534,930 |
| 448,325 | | Nokia Oyj, ADR | | | 8,912,701 |
| |
| | Total Communications Equipment | | | 31,306,770 |
| |
| Computers & Peripherals — 2.6% | | | |
| 242,000 | | Quantum Corp.* | | | 527,560 |
| 485,000 | | SanDisk Corp.* | | | 23,328,500 |
| 324,148 | | Seagate Technology | | | 7,319,262 |
| |
| | Total Computers & Peripherals | | | 31,175,322 |
| |
| Electronic Equipment & Instruments — 0.0% | | | |
| 12,400 | | Excel Technology Inc.* | | | 314,464 |
| |
| Semiconductors & Semiconductor Equipment — 6.0% | | | |
| 545,000 | | Broadcom Corp., Class A Shares* | | | 16,497,150 |
| 125,000 | | Cabot Microelectronics Corp.* | | | 3,568,750 |
| 229,000 | | Cirrus Logic Inc.* | | | 1,616,740 |
| 133,000 | | Cree Inc.* | | | 2,924,670 |
| 133,000 | | DSP Group Inc.* | | | 2,888,760 |
| 98,324 | | Freescale Semiconductor Inc., Class B Shares* | | | 3,867,083 |
| 358,334 | | Intel Corp. | | | 7,646,847 |
| 1,617,300 | | Micron Technology Inc.* | | | 23,369,985 |
| 543,000 | | RF Micro Devices Inc.* | | | 3,963,900 |
| 10,300 | | Standard Microsystems Corp.* | | | 317,549 |
| 343,091 | | Teradyne Inc.* | | | 4,810,136 |
| |
| | Total Semiconductors & Semiconductor Equipment | | | 71,471,570 |
| |
| Software — 1.2% | | | |
| 106,000 | | Advent Software Inc.* | | | 3,924,120 |
| 230,000 | | Autodesk Inc.* | | | 8,452,500 |
| 72,264 | | Microsoft Corp. | | | 2,074,699 |
| |
| | Total Software | | | 14,451,319 |
| |
| | TOTAL INFORMATION TECHNOLOGY | | | 148,719,445 |
| |
| TELECOMMUNICATION SERVICES — 0.2% | | | |
| Diversified Telecommunication Services — 0.2% | | | |
| 63,912 | | AT&T Inc. | | | 2,188,986 |
| |
| | TOTAL INVESTMENTS BEFORE SHORT-TERM INVESTMENT (Cost — $918,372,440) | | | 1,183,694,389 |
| |
| |
See Notes to Financial Statements.
Legg Mason Partners Variable Portfolios III, Inc. 2006 Annual Report 45
Schedules of Investments (October 31, 2006) (continued)
| | | | | | | |
| | |
Face Amount | | Security | | Value | |
| | SHORT-TERM INVESTMENT — 0.8% | | | | |
| | Repurchase Agreement — 0.8% | | | | |
| $ | 10,121,000 | | Interest in $382,313,000 joint tri-party repurchase agreement dated 10/31/06 with Banc of America Securities LLC, 5.290% due 11/1/06; Proceeds at maturity — $10,122,487; (Fully collateralized by various U.S. government agency obligations, 0.000% to 5.375% due 7/23/07 to 5/15/19; Market value — $10,323,496)
(Cost — $10,121,000) | | $ | 10,121,000 | |
| | | |
| | | TOTAL INVESTMENTS — 100.2% (Cost — $928,493,440) | | | 1,193,815,389 | |
| | | Liabilities in Excess of Other Assets — (0.2)% | | | (2,530,932 | ) |
| | | |
| | | TOTAL NET ASSETS — 100.0% | | $ | 1,191,284,457 | |
| | | |
| * | | Non-income producing security. |
| # | | Aggregate cost for federal income tax purposes is $929,818,043. |
| | |
Abbreviation used in this schedule: |
| | ADR — American Depositary Receipt |
See Notes to Financial Statements.
46 Legg Mason Partners Variable Portfolios III, Inc. 2006 Annual Report
Schedules of Investments (October 31, 2006) (continued)
LEGG MASON PARTNERS VARIABLE INTERNATIONAL ALL CAP GROWTH PORTFOLIO
| | | | | |
| | |
| Shares | | Security | | Value |
| | | | | |
| COMMON STOCKS — 97.5% | | | |
| Australia — 1.8% | | | |
| 53,000 | | Macquarie Bank Ltd. | | $ | 3,059,179 |
| |
| Denmark — 1.6% | | | |
| 35,930 | | Novo Nordisk A/S, Class B Shares | | | 2,715,113 |
| |
| Finland — 2.4% | | | |
| 200,000 | | Nokia Oyj | | | 3,972,091 |
| |
| France — 6.3% | | | |
| 40 | | Arkema, ADR* | | | 1,945 |
| 32,625 | | Essilor International SA | | | 3,425,162 |
| 25,000 | | Groupe Danone | | | 3,665,563 |
| 52,000 | | Total SA | | | 3,523,282 |
| 1,600 | | Total SA, ADR | | | 109,024 |
| |
| | Total France | | | 10,724,976 |
| |
| Germany — 4.7% | | | |
| 25,300 | | BASF AG | | | 2,231,546 |
| 450 | | BASF AG, ADR | | | 39,591 |
| 12,500 | | SAP AG | | | 2,488,623 |
| 1,300 | | SAP AG, ADR | | | 64,532 |
| 67,700 | | Stada Arzneimittel AG | | | 3,192,340 |
| |
| | Total Germany | | | 8,016,632 |
| |
| Greece — 1.5% | | | |
| 30,000 | | EFG Eurobank Ergasias | | | 998,515 |
| 56,250 | | Piraeus Bank SA | | | 1,604,961 |
| |
| | Total Greece | | | 2,603,476 |
| |
| Hong Kong — 0.6% | | | |
| 120,000 | | Hutchison Whampoa Ltd. | | | 1,065,244 |
| |
| Ireland — 8.7% | | | |
| 106,900 | | Bank of Ireland | | | 2,155,850 |
| 77,512 | | CRH PLC | | | 2,741,263 |
| 525,000 | | Grafton Group PLC* | | | 7,711,092 |
| 118,740 | | Irish Continental Group PLC | | | 1,933,597 |
| 35,391 | | United Drug PLC | | | 166,341 |
| |
| | Total Ireland | | | 14,708,143 |
| |
| Italy — 1.6% | | | |
| 114,000 | | Saipem SpA | | | 2,690,702 |
| |
| Japan — 23.6% | | | |
| 51,000 | | Aisin Seiki Co., Ltd. | | | 1,571,649 |
| 64,500 | | Canon Inc. | | | 3,461,864 |
| 48,000 | | Daikin Industries Ltd. | | | 1,355,932 |
| 43,000 | | Fanuc Ltd. | | | 3,736,090 |
| 89,000 | | Honda Motor Co., Ltd. | | | 3,154,083 |
See Notes to Financial Statements.
Legg Mason Partners Variable Portfolios III, Inc. 2006 Annual Report 47
Schedules of Investments (October 31, 2006) (continued)
| | | | | |
| | |
| Shares | | Security | | Value |
| | | | | |
| Japan — 23.6% (continued) |
| 2,000 | | Honda Motor Co., Ltd., ADR | | $ | 70,660 |
| 65,200 | | Hoya Corp. | | | 2,522,719 |
| 280 | | Mitsubishi UFJ Financial Group Inc. | | | 3,523,369 |
| 17,400 | | Nidec Corp. | | | 1,333,076 |
| 460 | | NTT Data Corp. | | | 2,295,669 |
| 15,800 | | ORIX Corp. | | | 4,456,514 |
| 184,000 | | Sharp Corp. | | | 3,284,027 |
| 62,400 | | Shin-Etsu Chemical Co., Ltd. | | | 4,096,970 |
| 79,000 | | Terumo Corp. | | | 3,198,682 |
| 63,000 | | Trend Micro Inc. | | | 2,022,342 |
| |
| | Total Japan | | | 40,083,646 |
| |
| Mexico — 2.2% | | | |
| 1,080,200 | | Wal-Mart de Mexico SA de CV | | | 3,751,809 |
| |
| Netherlands — 1.0% | | | |
| 39,351 | | ING Groep NV, CVA | | | 1,744,493 |
| |
| Norway — 1.7% | | | |
| 159,900 | | Acergy SA* | | | 2,893,592 |
| |
| Singapore — 0.8% | | | |
| 106,000 | | DBS Group Holdings Ltd. | | | 1,388,423 |
| |
| Spain — 2.7% | | | |
| 205,000 | | Indra Sistemas SA | | | 4,555,771 |
| |
| Sweden — 2.6% | | | |
| 90,000 | | Assa Abloy AB | | | 1,733,287 |
| 91,400 | | Atlas Copco AB, Class A Shares | | | 2,672,033 |
| |
| | Total Sweden | | | 4,405,320 |
| |
| Switzerland — 13.6% | | | |
| 96,000 | | Mettler-Toledo International Inc.* | | | 6,590,400 |
| 6,740 | | Nestle SA | | | 2,305,340 |
| 41,000 | | Novartis AG | | | 2,491,248 |
| 38,900 | | Roche Holding AG | | | 6,815,444 |
| 80,000 | | UBS AG | | | 4,783,711 |
| |
| | Total Switzerland | | | 22,986,143 |
| |
| United Kingdom — 18.8% | | | |
| 125,000 | | BG Group PLC | | | 1,659,071 |
| 337,300 | | BP PLC | | | 3,752,691 |
| 514,800 | | Capita Group PLC | | | 5,295,235 |
| 430,000 | | Cobham PLC | | | 1,577,585 |
| 65,000 | | Rio Tinto PLC | | | 3,587,316 |
| 969,000 | | Serco Group PLC | | | 6,564,627 |
| 151,700 | | Smith & Nephew PLC | | | 1,482,947 |
| 285,352 | | Tesco PLC | | | 2,142,810 |
| 357,000 | | Tomkins PLC | | | 1,655,512 |
| 1,622,250 | | Vodafone Group PLC | | | 4,179,357 |
| |
| | Total United Kingdom | | | 31,897,151 |
| |
See Notes to Financial Statements.
48 Legg Mason Partners Variable Portfolios III, Inc. 2006 Annual Report
Schedules of Investments (October 31, 2006) (continued)
| | | | | | | |
| | |
| Shares | | Security | | Value | |
| | | | | | |
| | United States — 1.3% | | | | |
| | 101,814 | | News Corp., Class B Shares | | $ | 2,213,436 | |
| | | |
| | | TOTAL INVESTMENTS BEFORE SHORT-TERM INVESTMENTS
(Cost — $90,854,941) | | | 165,475,340 | |
| | | |
| | |
Face
Amount | | | | | |
| | SHORT-TERM INVESTMENTS — 1.7% | | | | |
| | Repurchase Agreements — 1.7% | | | | |
| $ | 1,438,000 | | Interest in $382,313,000 joint tri-party repurchase agreement dated 10/31/06 with Banc of America Securities LLC, 5.290% due 11/1/06; Proceeds at maturity — $1,438,211; (Fully collateralized by various U.S. government agency obligations, 0.000% to 5.375% due 7/23/07 to 5/15/19; Market value — $1,466,771) | | | 1,438,000 | |
| | 1,438,000 | | Interest in $443,169,000 joint tri-party repurchase agreement dated 10/31/06 with Greenwich Capital Markets Inc., 5.280% due 11/1/06; Proceeds at maturity — 1,438,211; (Fully collateralized by various U.S. government agency obligations, 3.314% to 6.554% due 11/1/28 to 11/1/36; Market value — $1,466,770) | | | 1,438,000 | |
| | | |
| | | TOTAL SHORT-TERM INVESTMENTS (Cost — $2,876,000) | | | 2,876,000 | |
| | | |
| | | TOTAL INVESTMENTS — 99.2% (Cost — $93,730,941#) | | | 168,351,340 | |
| | | Other Assets in Excess of Liabilities — 0.8% | | | 1,413,081 | |
| | | |
| | | TOTAL NET ASSETS — 100.0% | | $ | 169,764,421 | |
| | | |
| * | | Non-income producing security. |
| # | | Aggregate cost for federal income tax purposes is $95,802,424. |
| | |
Abbreviations used in this schedule: |
| ADR | | — American Depositary Receipt |
| CVA | | — Certificaaten van aandelen (Share Certificates) |
Summary of Investments by Sector**
| | | |
Industrials | | 21.0 | % |
Information Technology | | 17.4 | |
Financials | | 14.1 | |
Health Care | | 14.0 | |
Energy | | 8.7 | |
Materials | | 7.5 | |
Consumer Staples | | 7.0 | |
Consumer Discretionary | | 6.1 | |
Telecommunication Services | | 2.5 | |
Short-Term Investments | | 1.7 | |
| | |
| | 100.0 | % |
| | |
| ** | | As a percentage of total investments. Please note that Fund holdings are as of October 31, 2006 and are subject to change. |
See Notes to Financial Statements.
Legg Mason Partners Variable Portfolios III, Inc. 2006 Annual Report 49
Statements of Assets and Liabilities (October 31, 2006)
| | | | | | | | |
| | |
| | |
Legg Mason Partners
Variable
Large Cap Value
Portfolio | | | Legg Mason Partners
Variable
Large Cap Growth
Portfolio | |
| ASSETS: | | | | | | | | |
Investments, at cost | | $ | 223,746,975 | | | $ | 233,261,234 | |
Foreign currency, at cost | | | — | | | | — | |
| | |
Investments, at value | | | 290,336,552 | | | | 332,743,636 | |
Foreign currency, at value | | | — | | | | — | |
Cash | | | 553 | | | | 55 | |
Receivable for securities sold | | | 993,948 | | | | — | |
Dividends and interest receivable | | | 235,421 | | | | 126,471 | |
Receivable for Fund shares sold | | | 1,839 | | | | 8,627 | |
Prepaid expenses | | | 5,677 | | | | 4,063 | |
| | |
Total Assets | | | 291,573,990 | | | | 332,882,852 | |
| | |
| LIABILITIES: | | | | | | | | |
Payable for Fund shares repurchased | | | 159,977 | | | | 743,988 | |
Investment management fee payable | | | 147,805 | | | | 211,793 | |
Directors’ fees payable | | | 2,351 | | | | 738 | |
Payable for securities purchased | | | — | | | | — | |
Accrued expenses | | | 69,642 | | | | 70,303 | |
| | |
Total Liabilities | | | 379,775 | | | | 1,026,822 | |
| | |
Total Net Assets | | $ | 291,194,215 | | | $ | 331,856,030 | |
| | |
| NET ASSETS: | | | | | | | | |
Par value (Note 4) | | $ | 135 | | | $ | 216 | |
Paid-in capital in excess of par value | | | 233,735,293 | | | | 306,983,600 | |
Accumulated net investment loss | | | — | | | | — | |
Undistributed net investment income | | | 2,464,675 | | | | 179,284 | |
Accumulated net realized gain (loss) on investments and foreign currency transactions | | | (11,595,615 | ) | | | (74,789,472 | ) |
Net unrealized appreciation on investments and foreign currencies | | | 66,589,727 | | | | 99,482,402 | |
| | |
Total Net Assets | | $ | 291,194,215 | | | $ | 331,856,030 | |
| | |
Shares Outstanding | | | 13,511,541 | | | | 21,567,281 | |
| | |
Net Asset Value | | | $21.55 | | | | $15.39 | |
| | |
See Notes to Financial Statements.
50 Legg Mason Partners Variable Portfolios III, Inc. 2006 Annual Report
Statements of Assets and Liabilities (October 31, 2006) (continued)
| | | | | | | | | |
| | |
Legg Mason Partners
Variable
Mid Cap Core
Portfolio | | Legg Mason Partners Variable
Aggressive Growth
Portfolio | | | Legg Mason Partners
Variable
International
All Cap Growth Portfolio | |
| | | | | | | | | |
| $ | 105,064,773 | | $ | 928,493,440 | | | $ | 93,730,941 | |
| | — | | | — | | | | 1,532,564 | |
| | | |
| | 120,159,388 | | | 1,193,815,389 | | | | 168,351,340 | |
| | — | | | — | | | | 1,557,116 | |
| | 846 | | | 17 | | | | 719 | |
| | — | | | — | | | | — | |
| | 22,595 | | | 191,079 | | | | 314,680 | |
| | — | | | 249,032 | | | | — | |
| | 1,334 | | | 16,505 | | | | 2,437 | |
| | | |
| | | | | | | | | |
| | 120,184,163 | | | 1,194,272,022 | | | | 170,226,292 | |
| | | |
| | | | | | | | | |
| | 42,356 | | | 2,139,759 | | | | 281,114 | |
| | 76,417 | | | 749,441 | | | | 121,263 | |
| | 574 | | | 71,250 | | | | 10,759 | |
| | 253,371 | | | — | | | | — | |
| | 38,616 | | | 27,115 | | | | 48,735 | |
| | | |
| | 411,334 | | | 2,987,565 | | | | 461,871 | |
| | | |
| $ | 119,772,829 | | $ | 1,191,284,457 | | | $ | 169,764,421 | |
| | | |
| | | | | | | | | |
| $ | 76 | | $ | 742 | | | $ | 101 | |
| | 89,437,648 | | | 926,090,021 | | | | 144,697,049 | |
| | — | | | (71,131 | ) | | | — | |
| | 410,633 | | | — | | | | 848,326 | |
|
14,829,857 | | | (57,124 | ) | | | (50,441,084 | ) |
|
15,094,615 | | | 265,321,949 | | | | 74,660,029 | |
| | | |
| $ | 119,772,829 | | $ | 1,191,284,457 | | | $ | 169,764,421 | |
| | | |
| | 7,639,898 | | | 74,234,411 | | | | 10,108,492 | |
| | | |
| | $15.68 | | | $16.05 | | | | $16.79 | |
| | | |
See Notes to Financial Statements.
Legg Mason Partners Variable Portfolios III, Inc. 2006 Annual Report 51
Statements of Operations (For the year ended October 31, 2006)
| | | | | | | | |
| | |
| | |
Legg Mason Partners
Variable
Large Cap Value
Portfolio | | | Legg Mason Partners
Variable Large Cap Growth
Portfolio | |
| INVESTMENT INCOME: | | | | | | | | |
Dividends | | $ | 5,681,437 | | | $ | 3,251,879 | |
Interest | | | 494,662 | | | | 41,943 | |
Income from securities lending | | | — | | | | — | |
Less: Foreign taxes withheld | | | (95,149 | ) | | | — | |
| | |
Total Investment Income | | | 6,080,950 | | | | 3,293,822 | |
| | |
| EXPENSES: | | | | | | | | |
Investment management fee (Note 2) | | | 1,783,292 | | | | 2,637,603 | |
Merger and proxy fees | | | 40,095 | | | | 39,734 | |
Audit and tax | | | 30,945 | | | | 29,992 | |
Directors’ fees | | | 27,361 | | | | 31,558 | |
Legal fees | | | 19,925 | | | | 24,401 | |
Directors’ retirement expense | | | 18,118 | | | | 19,839 | |
Shareholder reports | | | 22,423 | | | | 30,358 | |
Insurance | | | 7,473 | | | | 8,591 | |
Custody fees | | | 5,655 | | | | 20,184 | |
Transfer agent fees (Note 2) | | | 1,022 | | | | 1,280 | |
Miscellaneous expenses | | | 3,122 | | | | 4,613 | |
| | |
Total Expenses | | | 1,959,431 | | | | 2,848,153 | |
Less: Fee waivers and/or expense reimbursements
(Notes 2 and 7) | | | (8,257 | ) | | | (9,964 | ) |
| | |
Net Expenses | | | 1,951,174 | | | | 2,838,189 | |
| | |
Net Investment Income (Loss) | | | 4,129,776 | | | | 455,633 | |
| | |
| REALIZED AND UNREALIZED GAIN (LOSS) ON INVESTMENTS AND FOREIGN CURRENCY TRANSACTIONS (NOTES 1 AND 3): | | | | | | | | |
Net Realized Gain (Loss) From: | | | | | | | | |
Investment transactions | | | 19,902,990 | | | | 6,635,699 | |
Foreign currency transactions | | | 2,028 | | | | — | |
| | |
Net Realized Gain | | | 19,905,018 | | | | 6,635,699 | |
| | |
Change in Net Unrealized Appreciation/Depreciation From: | | | | | | | | |
Investments | | | 25,957,184 | | | | 13,544,100 | |
Foreign currencies | | | 290 | | | | — | |
| | |
Change in Net Unrealized Appreciation/Depreciation | | | 25,957,474 | | | | 13,544,100 | |
| | |
Net Gain on Investments and Foreign Currency Transactions | | | 45,862,492 | | | | 20,179,799 | |
| | |
Increase in Net Assets From Operations | | | $49,992,268 | | | | $20,635,432 | |
| | |
See Notes to Financial Statements.
52 Legg Mason Partners Variable Portfolios III, Inc. 2006 Annual Report
Statements of Operations (For the year ended October 31, 2006) (continued)
| | | | | | | | |
| | |
Legg Mason Partners
Variable
Mid Cap Core
Portfolio | | Legg Mason Partners
Variable
Aggressive Growth
Portfolio | | | Legg Mason Partners
Variable
International
All Cap Growth
Portfolio | |
| | | | | | | | |
$ 1,538,655 | | $ | 5,185,355 | | | $ | 3,511,186 | |
123,959 | | | 1,302,813 | | | | 49,354 | |
— | | | — | | | | 4,545 | |
(710) | | | (34,353 | ) | | | (211,827 | ) |
| | |
1,661,904 | | | 6,453,815 | | | | 3,353,258 | |
| | |
| | | | | | | | |
925,677 | | | 8,579,697 | | | | 1,435,331 | |
10,652 | | | 89,418 | | | | 23,938 | |
24,667 | | | 31,392 | | | | 30,039 | |
18,877 | | | 81,880 | | | | 19,795 | |
25,654 | | | 22,482 | | | | 24,721 | |
7,306 | | | 71,131 | | | | 10,534 | |
13,199 | | | 61,905 | | | | 2,264 | |
1,653 | | | 22,866 | | | | 4,594 | |
2,615 | | | 19,859 | | | | 50,339 | |
903 | | | 1,498 | | | | 1,096 | |
4,559 | | | 4,480 | | | | 16,222 | |
| | |
1,035,762 | | | 8,986,608 | | | | 1,618,873 | |
(4,313) | | | (26,484 | ) | | | (5,237 | ) |
| | |
1,031,449 | | | 8,960,124 | | | | 1,613,636 | |
| | |
630,455 | | | (2,506,309 | ) | | | 1,739,622 | |
| | |
| | | | | | | | |
| | | | | | | | |
14,987,950 | | | 1,510,801 | | | | 10,971,864 | |
(28) | | | — | | | | 16,266 | |
| | |
14,987,922 | | | 1,510,801 | | | | 10,988,130 | |
| | |
| | | | | | | | |
1,779,708 | | | 135,392,603 | | | | 25,291,896 | |
— | | | — | | | | 36,960 | |
| | |
1,779,708 | | | 135,392,603 | | | | 25,328,856 | |
| | |
16,767,630 | | | 136,903,404 | | | | 36,316,986 | |
| | |
$17,398,085 | | $ | 134,397,095 | | | $ | 38,056,608 | |
| | |
See Notes to Financial Statements.
Legg Mason Partners Variable Portfolios III, Inc. 2006 Annual Report 53
Statements of Changes in Net Assets (For the years ended October 31,)
| | | | | | | | |
| | |
| Legg Mason Partners Variable Large Cap Value Portfolio | | 2006 | | | 2005 | |
| OPERATIONS: | | | | | | | | |
Net investment income | | $ | 4,129,776 | | | $ | 5,151,001 | |
Net realized gain | | | 19,905,018 | | | | 12,469,887 | |
Change in net unrealized appreciation/depreciation | | | 25,957,474 | | | | 14,712,402 | |
| | |
Increase in Net Assets From Operations | | | 49,992,268 | | | | 32,333,290 | |
| | |
| DISTRIBUTIONS TO SHAREHOLDERS FROM (NOTE 1): | | | | | | | | |
Net investment income | | | (4,800,001 | ) | | | (6,400,006 | ) |
| | |
Decrease in Net Assets From Distributions to Shareholders | | | (4,800,001 | ) | | | (6,400,006 | ) |
| | |
| FUND SHARE TRANSACTIONS (NOTE 4): | | | | | | | | |
Net proceeds from sale of shares | | | 2,464,772 | | | | 3,130,472 | |
Reinvestment of distributions | | | 4,800,001 | | | | 6,400,006 | |
Cost of shares repurchased | | | (64,230,067 | ) | | | (65,848,220 | ) |
| | |
Decrease in Net Assets From Fund Share Transactions | | | (56,965,294 | ) | | | (56,317,742 | ) |
| | |
Decrease in Net Assets | | | (11,773,027 | ) | | | (30,384,458 | ) |
| NET ASSETS: | | | | | | | | |
Beginning of year | | | 302,967,242 | | | | 333,351,700 | |
| | |
End of year* | | $ | 291,194,215 | | | $ | 302,967,242 | |
| | |
* Includes undistributed net investment income of: | | | $2,464,675 | | | | $3,092,777 | |
| | |
See Notes to Financial Statements.
54 Legg Mason Partners Variable Portfolios III, Inc. 2006 Annual Report
Statements of Changes in Net Assets (For the years ended October 31,) (continued)
| | | | | | | | |
| | |
| Legg Mason Partners Variable Large Cap Growth Portfolio | | 2006 | | | 2005 | |
| OPERATIONS: | | | | | | | | |
Net investment income | | $ | 455,633 | | | $ | 1,684,888 | |
Net realized gain (loss) | | | 6,635,699 | | | | (9,620,366 | ) |
Change in net unrealized appreciation/depreciation | | | 13,544,100 | | | | 48,194,981 | |
| | |
Increase in Net Assets From Operations | | | 20,635,432 | | | | 40,259,503 | |
| | |
| DISTRIBUTIONS TO SHAREHOLDERS FROM (NOTE 1): | | | | | | | | |
Net investment income | | | (500,002 | ) | | | (1,500,969 | ) |
| | |
Decrease in Net Assets From Distributions to Shareholders | | | (500,002 | ) | | | (1,500,969 | ) |
| | |
| FUND SHARE TRANSACTIONS (NOTE 4): | | | | | | | | |
Net proceeds from sale of shares | | | 10,086,678 | | | | 11,593,119 | |
Reinvestment of distributions | | | 500,002 | | | | 1,500,969 | |
Cost of shares repurchased | | | (76,787,218 | ) | | | (63,602,132 | ) |
| | |
Decrease in Net Assets From Fund Share Transactions | | | (66,200,538 | ) | | | (50,508,044 | ) |
| | |
Decrease in Net Assets | | | (46,065,108 | ) | | | (11,749,510 | ) |
| NET ASSETS: | | | | | | | | |
Beginning of year | | | 377,921,138 | | | | 389,670,648 | |
| | |
End of year* | | $ | 331,856,030 | | | $ | 377,921,138 | |
| | |
* Includes undistributed net investment income of: | | | $179,284 | | | | $183,919 | |
| | |
See Notes to Financial Statements.
Legg Mason Partners Variable Portfolios III, Inc. 2006 Annual Report 55
Statements of Changes in Net Assets (For the years ended October 31,) (continued)
| | | | | | | | |
| | |
| Legg Mason Partners Variable Mid Cap Core Portfolio | | 2006 | | | 2005 | |
| OPERATIONS: | | | | | | | | |
Net investment income | | $ | 630,455 | | | $ | 519,554 | |
Net realized gain | | | 14,987,922 | | | | 12,955,266 | |
Change in net unrealized appreciation/depreciation | | | 1,779,708 | | | | 193,983 | |
| | |
Increase in Net Assets From Operations | | | 17,398,085 | | | | 13,668,803 | |
| | |
| DISTRIBUTIONS TO SHAREHOLDERS FROM (NOTE 1): | | | | | | | | |
Net investment income | | | (750,004 | ) | | | — | |
Net realized gains | | | (9,028,419 | ) | | | — | |
| | |
Decrease in Net Assets From Distributions to Shareholders | | | (9,778,423 | ) | | | — | |
| | |
| FUND SHARE TRANSACTIONS (NOTE 4): | | | | | | | | |
Net proceeds from sale of shares | | | 1,416,477 | | | | 8,699,598 | |
Reinvestment of distributions | | | 9,778,423 | | | | — | |
Cost of shares repurchased | | | (19,688,525 | ) | | | (11,954,070 | ) |
| | |
Decrease in Net Assets From Fund Share Transactions | | | (8,493,625 | ) | | | (3,254,472 | ) |
| | |
Increase (Decrease) in Net Assets | | | (873,963 | ) | | | 10,414,331 | |
| NET ASSETS: | | | | | | | | |
Beginning of year | | | 120,646,792 | | | | 110,232,461 | |
| | |
End of year* | | $ | 119,772,829 | | | $ | 120,646,792 | |
| | |
* Includes undistributed net investment income of: | | | $410,633 | | | | $519,558 | |
| | |
See Notes to Financial Statements.
56 Legg Mason Partners Variable Portfolios III, Inc. 2006 Annual Report
Statements of Changes in Net Assets (For the years ended October 31,) (continued)
| | | | | | | | |
| | |
| Legg Mason Partners Variable Aggressive Growth Portfolio | | 2006 | | | 2005 | |
| OPERATIONS: | | | | | | | | |
Net investment loss | | $ | (2,506,309 | ) | | $ | (2,707,794 | ) |
Net realized gain | | | 1,510,801 | | | | 211,120 | |
Change in net unrealized appreciation/depreciation | | | 135,392,603 | | | | 159,283,167 | |
| | |
Increase in Net Assets From Operations | | | 134,397,095 | | | | 156,786,493 | |
| | |
| DISTRIBUTIONS TO SHAREHOLDERS FROM (NOTE 1): | | | | | | | | |
Net realized gains | | | (32,468 | ) | | | (3,756,228 | ) |
| | |
Decrease in Net Assets From Distributions to Shareholders | | | (32,468 | ) | | | (3,756,228 | ) |
| | |
| FUND SHARE TRANSACTIONS (NOTE 4): | | | | | | | | |
Net proceeds from sale of shares | | | 92,743,038 | | | | 63,139,525 | |
Reinvestment of distributions | | | 32,468 | | | | 3,756,228 | |
Cost of shares repurchased | | | (114,854,762 | ) | | | (61,265,197 | ) |
| | |
Increase (Decrease) in Net Assets From Fund Share Transactions | | | (22,079,256 | ) | | | 5,630,556 | |
| | |
Increase in Net Assets | | | 112,285,371 | | | | 158,660,821 | |
| NET ASSETS: | | | | | | | | |
Beginning of year | | | 1,078,999,086 | | | | 920,338,265 | |
| | |
End of year* | | $ | 1,191,284,457 | | | $ | 1,078,999,086 | |
| | |
* Includes accumulated net investment loss of: | | | $(71,131) | | | | — | |
| | |
See Notes to Financial Statements.
Legg Mason Partners Variable Portfolios III, Inc. 2006 Annual Report 57
Statements of Changes in Net Assets (For the years ended October 31,) (continued)
| | | | | | | | |
| | |
Legg Mason Partners Variable
International All Cap Growth Portfolio | | 2006 | | | 2005 | |
| OPERATIONS: | | | | | | | | |
Net investment income | | $ | 1,739,622 | | | $ | 1,625,823 | |
Net realized gain | | | 10,988,130 | | | | 5,456,478 | |
Change in net unrealized appreciation/depreciation | | | 25,328,856 | | | | 17,715,799 | |
| | |
Increase in Net Assets From Operations | | | 38,056,608 | | | | 24,798,100 | |
| | |
| DISTRIBUTIONS TO SHAREHOLDERS FROM (NOTE 1): | | | | | | | | |
Net investment income | | | (2,200,003 | ) | | | (1,500,826 | ) |
| | |
Decrease in Net Assets From Distributions to Shareholders | | | (2,200,003 | ) | | | (1,500,826 | ) |
| | |
| FUND SHARE TRANSACTIONS (NOTE 4): | | | | | | | | |
Net proceeds from sale of shares | | | 1,917,185 | | | | 5,415,806 | |
Reinvestment of distributions | | | 2,200,003 | | | | 1,500,826 | |
Cost of shares repurchased | | | (30,586,314 | ) | | | (32,422,744 | ) |
Net assets of shares issued in connection with merger (Note 5) | | | — | | | | 2,864,133 | |
| | |
Decrease in Net Assets From Fund Share Transactions | | | (26,469,126 | ) | | | (22,641,979 | ) |
| | |
Increase in Net Assets | | | 9,387,479 | | | | 655,295 | |
| NET ASSETS: | | | | | | | | |
Beginning of year | | | 160,376,942 | | | | 159,721,647 | |
| | |
End of year* | | $ | 169,764,421 | | | $ | 160,376,942 | |
| | |
* Includes undistributed net investment income of: | | | $848,326 | | | | $1,268,503 | |
| | |
See Notes to Financial Statements.
58 Legg Mason Partners Variable Portfolios III, Inc. 2006 Annual Report
Financial Highlights
For a share of capital stock outstanding throughout each year ended October 31:
| | | | | | | | | | | | | | | | | | | | |
| | | | | |
Legg Mason Partners Variable
Large Cap Value Portfolio | | 2006 | | | 2005 | | | 2004 | | | 2003 | | | 2002 | |
Net Asset Value, Beginning of Year | | $ | 18.50 | | | $ | 17.09 | | | $ | 15.68 | | | $ | 13.24 | | | $ | 17.47 | |
| | |
Income (Loss) From Operations: | | | | | | | | | | | | | | | | | | | | |
Net investment income | | | 0.30 | | | | 0.30 | | | | 0.26 | | | | 0.28 | | | | 0.32 | |
Net realized and unrealized gain (loss) | | | 3.05 | | | | 1.45 | | | | 1.41 | | | | 2.49 | | | | (4.24 | ) |
| | |
Total Income (Loss) From Operations | | | 3.35 | | | | 1.75 | | | | 1.67 | | | | 2.77 | | | | (3.92 | ) |
| | |
Less Distributions From: | | | | | | | | | | | | | | | | | | | | |
Net investment income | | | (0.30 | ) | | | (0.34 | ) | | | (0.26 | ) | | | (0.33 | ) | | | (0.31 | ) |
| | |
Total Distributions | | | (0.30 | ) | | | (0.34 | ) | | | (0.26 | ) | | | (0.33 | ) | | | (0.31 | ) |
| | |
Net Asset Value, End of Year | | $ | 21.55 | | | $ | 18.50 | | | $ | 17.09 | | | $ | 15.68 | | | $ | 13.24 | |
| | |
Total Return(1) | | | 18.34 | % | | | 10.26 | % | | | 10.69 | % | | | 21.38 | % | | | (22.45 | )% |
| | |
Net Assets, End of Year (millions) | | | $291 | | | | $303 | | | | $333 | | | | $366 | | | | $346 | |
| | |
Ratios to Average Net Assets: | | | | | | | | | | | | | | | | | | | | |
Gross expenses | | | 0.66 | % | | | 0.65 | % | | | 0.68 | % | | | 0.69 | % | | | 0.68 | % |
Net expenses(2) | | | 0.66 | (3) | | | 0.65 | | | | 0.68 | (3) | | | 0.69 | | | | 0.68 | |
Net investment income | | | 1.39 | | | | 1.62 | | | | 1.38 | | | | 1.85 | | | | 1.59 | |
| | |
Portfolio Turnover Rate | | | 23 | % | | | 44 | % | | | 37 | % | | | 96 | % | | | 68 | % |
| | |
| (1) | | Performance figures may reflect voluntary fee waivers and/or expense reimbursements. Past performance is no guarantee of future results. In the absence of voluntary fee waivers and/or expense reimbursements, the total return would be lower. Total returns do not reflect expenses associated with the separate accounts such as administrative fees, account charges and surrender charges which, if reflected, would reduce the total return for all periods shown. |
| (2) | | As a result of a voluntary expense limitation, the ratio of expense to average net assets, other than interest, brokerage, taxes and extraordinary expenses, will not exceed 1.25%. |
| (3) | | Reflects fee waivers and/or expense reimbursements. |
See Notes to Financial Statements.
Legg Mason Partners Variable Portfolios III, Inc. 2006 Annual Report 59
Financial Highlights (continued)
For a share of capital stock outstanding throughout each year ended October 31:
| | | | | | | | | | | | | | | | | | | | |
| | | | | |
Legg Mason Partners Variable
Large Cap Growth Portfolio | | 2006 | | | 2005 | | | 2004 | | | 2003 | | | 2002 | |
Net Asset Value, Beginning of Year | | $ | 14.51 | | | $ | 13.15 | | | $ | 13.76 | | | $ | 9.91 | | | $ | 11.86 | |
| | |
Income (Loss) From Operations: | | | | | | | | | | | | | | | | | | | | |
Net investment income (loss) | | | 0.02 | | | | 0.06 | | | | (0.00 | )(1) | | | 0.01 | | | | 0.02 | |
Net realized and unrealized gain (loss) | | | 0.88 | | | | 1.35 | | | | (0.61 | ) | | | 3.86 | | | | (1.95 | ) |
| | |
Total Income (Loss) From Operations | | | 0.90 | | | | 1.41 | | | | (0.61 | ) | | | 3.87 | | | | (1.93 | ) |
| | |
Less Distributions From: | | | | | | | | | | | | | | | | | | | | |
Net investment income | | | (0.02 | ) | | | (0.05 | ) | | | (0.00 | )(1) | | | (0.02 | ) | | | (0.02 | ) |
Return of capital | | | — | | | | — | | | | (0.00 | )(1) | | | — | | | | — | |
| | |
Total Distributions | | | (0.02 | ) | | | (0.05 | ) | | | (0.00 | )(1) | | | (0.02 | ) | | | (0.02 | ) |
| | |
Net Asset Value, End of Year | | $ | 15.39 | | | $ | 14.51 | | | $ | 13.15 | | | $ | 13.76 | | | $ | 9.91 | |
| | |
Total Return(2) | | | 6.20 | % | | | 10.74 | % | | | (4.42 | )% | | | 39.16 | % | | | (16.29 | )% |
| | |
Net Assets, End of Year (millions) | | | $332 | | | | $378 | | | | $390 | | | | $354 | | | | $225 | |
| | |
Ratios to Average Net Assets: | | | | | | | | | | | | | | | | | | | | |
Gross expenses | | | 0.81 | % | | | 0.79 | % | | | 0.78 | % | | | 0.79 | % | | | 0.80 | % |
Net expenses | | | 0.81 | (3) | | | 0.79 | | | | 0.78 | (3) | | | 0.79 | | | | 0.80 | |
Net investment income | | | 0.13 | | | | 0.43 | | | | (0.02 | ) | | | 0.06 | | | | 0.13 | |
| | |
Portfolio Turnover Rate | | | 12 | % | | | 20 | % | | | 7 | % | | | 16 | % | | | 19 | % |
| | |
| (1) | | Amount represents less than $0.01 per share. |
| (2) | | Performance figures may reflect fee waivers and/or expense reimbursements. Past performance is no guarantee of future results. In the absence of fee waivers and/or expense reimbursements, the total return would be lower. Total returns do not reflect expenses associated with the separate accounts such as administrative fees, account charges and surrender charges which, if reflected, would reduce the total return for all periods shown. |
| (3) | | Reflects fee waivers and/or expense reimbursements. |
See Notes to Financial Statements.
60 Legg Mason Partners Variable Portfolios III, Inc. 2006 Annual Report
Financial Highlights (continued)
For a share of capital stock outstanding throughout each year ended October 31:
| | | | | | | | | | | | | | | |
| | | | | |
Legg Mason Partners Variable
Mid Cap Core Portfolio | | 2006 | | | 2005 | | | 2004 | | | 2003 | | | 2002 | |
Net Asset Value, Beginning of Year | | $14.76 | | | $13.14 | | | $12.35 | | | $10.10 | | | $10.83 | |
| | |
Income (Loss) From Operations: | | | | | | | | | | | | | | | |
Net investment income (loss) | | 0.08 | | | 0.06 | | | (0.01 | ) | | (0.00 | )(1) | | (0.02 | ) |
Net realized and unrealized gain (loss) | | 2.05 | | | 1.56 | | | 0.80 | | | 2.25 | | | (0.70 | ) |
| | |
Total Income (Loss) From Operations | | 2.13 | | | 1.62 | | | 0.79 | | | 2.25 | | | (0.72 | ) |
| | |
Less Distributions From: | | | | | | | | | | | | | | | |
Net investment income | | (0.09 | ) | | — | | | — | | | — | | | (0.01 | ) |
Net realized gains | | (1.12 | ) | | — | | | — | | | — | | | — | |
| | |
Total Distributions | | (1.21 | ) | | — | | | — | | | — | | | (0.01 | ) |
| | |
Net Asset Value, End of Year | | $15.68 | | | $14.76 | | | $13.14 | | | $12.35 | | | $10.10 | |
| | |
Total Return(2) | | 15.22 | % | | 12.33 | % | | 6.40 | % | | 22.28 | % | | (6.64 | )% |
| | |
Net Assets, End of Year (millions) | | $120 | | | $121 | | | $110 | | | $87 | | | $57 | |
| | |
Ratios to Average Net Assets: | | | | | | | | | | | | | | | |
Gross expenses | | 0.84 | % | | 0.82 | % | | 0.83 | % | | 0.85 | % | | 0.90 | % |
Net expenses(3) | | 0.84 | (4) | | 0.82 | | | 0.83 | (4) | | 0.85 | | | 0.90 | |
Net investment income | | 0.54 | | | 0.44 | | | (0.06 | ) | | (0.03 | ) | | (0.10 | ) |
| | |
Portfolio Turnover Rate | | 71 | % | | 107 | % | | 92 | % | | 98 | % | | 79 | % |
| | |
| (1) | | Amount represents less than $0.01 per share. |
| (2) | | Performance figures may reflect fee waivers and/or expense reimbursements. Past performance is no guarantee of future results. In the absence of fee waivers and/or expense reimbursements, the total return would be lower. Total returns do not reflect expenses associated with the separate accounts such as administrative fees, account charges and surrender charges which, if reflected, would reduce the total return for all periods shown. |
| (3) | | As a result of a voluntary expense limitation, the ratio of expenses to average net assets, other than interest, brokerage, taxes and extraordinary expenses, will not exceed 0.95%. |
| (4) | | Reflects fee waivers and/or expense reimbursements. |
See Notes to Financial Statements.
Legg Mason Partners Variable Portfolios III, Inc. 2006 Annual Report 61
Financial Highlights (continued)
For a share of capital stock outstanding throughout each year ended October 31:
| | | | | | | | | | | | | | | | | | | | |
| | | | | |
Legg Mason Partners Variable
Aggressive Growth Portfolio | | 2006(1) | | | 2005(1) | | | 2004 | | | 2003 | | | 2002 | |
Net Asset Value, Beginning of Year | | $ | 14.26 | | | $ | 12.24 | | | $ | 11.43 | | | $ | 9.09 | | | $ | 12.32 | |
| | |
Income (Loss) From Operations: | | | | | | | | | | | | | | | | | | | | |
Net investment loss | | | (0.03 | ) | | | (0.04 | ) | | | (0.05 | ) | | | (0.04 | ) | | | (0.05 | ) |
Net realized and unrealized gain (loss) | | | 1.82 | | | | 2.11 | | | | 0.86 | | | | 2.38 | | | | (3.18 | ) |
| | |
Total Income (Loss) From Operations | | | 1.79 | | | | 2.07 | | | | 0.81 | | | | 2.34 | | | | (3.23 | ) |
| | |
Less Distributions From: | | | | | | | | | | | | | | | | | | | | |
Net realized gains | | | (0.00 | )(2) | | | (0.05 | ) | | | — | | | | — | | | | — | |
| | |
Total Distributions | | | (0.00 | )(2) | | | (0.05 | ) | | | — | | | | — | | | | — | |
| | |
Net Asset Value, End of Year | | $ | 16.05 | | | $ | 14.26 | | | $ | 12.24 | | | $ | 11.43 | | | $ | 9.09 | |
| | |
Total Return(3) | | | 12.56 | % | | | 16.94 | % | | | 7.09 | % | | | 25.74 | % | | | (26.22 | )% |
| | |
Net Assets, End of Year (millions) | | | $1,191 | | | | $1,079 | | | | $920 | | | | $624 | | | | $415 | |
| | |
Ratios to Average Net Assets: | | | | | | | | | | | | | | | | | | | | |
Gross expenses | | | 0.78 | % | | | 0.82 | % | | | 0.82 | % | | | 0.82 | % | | | 0.83 | % |
Net expenses(4) | | | 0.78 | (5) | | | 0.82 | | | | 0.82 | (5) | | | 0.82 | | | | 0.83 | |
Net investment loss | | | (0.22 | ) | | | (0.27 | ) | | | (0.44 | ) | | | (0.49 | ) | | | (0.50 | ) |
| | |
Portfolio Turnover Rate | | | 4 | % | | | 0 | % | | | 4 | % | | | 0 | % | | | 9 | % |
| | |
| (1) | | Per share amounts have been calculated using the average shares method. |
| (2) | | Amount represents less than $0.01 per share. |
| (3) | | Performance figures may reflect waivers and/or expense reimbursements. Past performance is no guarantee of future results. In the absence of waivers and/or expense reimbursements, the total return would be lower. Total returns do not reflect expenses associated with the separate accounts such as administrative fees, account charges and surrender charges which, if reflected, would reduce the total return for all periods shown. |
| (4) | | As a result of a voluntary expense limitation, the ratio of expenses to average net assets, other than interest, brokerage, taxes and extraordinary expenses, will not exceed 1.00%. |
| (5) | | Reflects fee waivers and/or expense reimbursements. |
See Notes to Financial Statements.
62 Legg Mason Partners Variable Portfolios III, Inc. 2006 Annual Report
Financial Highlights (continued)
For a share of capital stock outstanding throughout each year ended October 31:
| | | | | | | | | | | | | | | | | | | | |
| | | | | |
Legg Mason Partners Variable
International All Cap Growth Portfolio | | 2006 | | | 2005 | | | 2004(1) | | | 2003(1) | | | 2002(1) | |
Net Asset Value, Beginning of Year | | $ | 13.56 | | | $ | 11.77 | | | $ | 10.43 | | | $ | 8.78 | | | $ | 11.18 | |
| | |
Income (Loss) From Operations: | | | | | | | | | | | | | | | | | | | | |
Net investment income | | | 0.17 | | | | 0.13 | | | | 0.07 | | | | 0.10 | | | | 0.04 | |
Net realized and unrealized gain (loss) | | | 3.25 | | | | 1.77 | | | | 1.37 | | | | 1.60 | | | | (2.39 | ) |
| | |
Total Income (Loss) From Operations | | | 3.42 | | | | 1.90 | | | | 1.44 | | | | 1.70 | | | | (2.35 | ) |
| | |
Less Distributions From: | | | | | | | | | | | | | | | | | | | | |
Net investment income | | | (0.19 | ) | | | (0.11 | ) | | | (0.10 | ) | | | (0.05 | ) | | | (0.05 | ) |
| | |
Total Distributions | | | (0.19 | ) | | | (0.11 | ) | | | (0.10 | ) | | | (0.05 | ) | | | (0.05 | ) |
| | |
Net Asset Value, End of Year | | $ | 16.79 | | | $ | 13.56 | | | $ | 11.77 | | | $ | 10.43 | | | $ | 8.78 | |
| | |
Total Return(2) | | | 25.46 | % | | | 16.21 | % | | | 13.90 | % | | | 19.45 | % | | | (20.97 | )% |
| | |
Net Assets, End of Year (millions) | | | $170 | | | | $160 | | | | $160 | | | | $180 | | | | $170 | |
| | |
Ratios to Average Net Assets: | | | | | | | | | | | | | | | | | | | | |
Gross expenses | | | 0.96 | % | | | 1.00 | % | | | 1.01 | % | | | 0.99 | % | | | 1.00 | % |
Net expenses(3) | | | 0.96 | (4) | | | 1.00 | | | | 1.01 | (4) | | | 0.99 | | | | 1.00 | |
Net investment income | | | 1.03 | | | | 0.98 | | | | 0.67 | | | | 1.07 | | | | 0.42 | |
| | |
Portfolio Turnover Rate | | | 8 | % | | | 16 | % | | | 21 | % | | | 45 | % | | | 27 | % |
| | |
| (1) | | Per share amounts have been calculated using the average shares method. |
| (2) | | Performance figures may reflect fee waivers and/or expense reimbursements. Past performance is no guarantee of future results. In the absence of fee waivers and/or expense reimbursements, the total return would be lower. Total returns do not reflect expenses associated with the separate accounts such as administrative fees, account charges and surrender charges which, if reflected, would reduce the total return for all periods shown. |
| (3) | | As a result of a voluntary expense limitation, the ratio of expenses to average net assets, other than interest, brokerage, taxes and extraordinary expenses, will not exceed 1.50%. |
| (4) | | Reflects fee waivers and/or expense reimbursements. |
See Notes to Financial Statements.
Legg Mason Partners Variable Portfolios III, Inc. 2006 Annual Report 63
Notes to Financial Statements
| 1. | Organization and Significant Accounting Policies |
Legg Mason Partners Variable Large Cap Value Portfolio, Legg Mason Partners Variable Large Cap Growth Portfolio, Legg Mason Partners Variable Mid Cap Core Portfolio, Legg Mason Partners Variable Aggressive Growth Portfolio and Legg Mason Partners Variable International All Cap Growth Portfolio (formerly known as Smith Barney Large Cap Value Portfolio, Smith Barney Large Capitalization Growth Portfolio, Smith Barney Mid Cap Core Portfolio, Smith Barney Aggressive Growth Portfolio and Smith Barney International All Cap Growth Portfolio, respectively) (the “Funds”) are separate diversified investment funds of Legg Mason Partners Variable Portfolios III, Inc. (formerly known as Travelers Series Fund Inc.) (the “Company”). The Company, a Maryland corporation, is registered under the Investment Company Act of 1940, as amended (the “1940 Act”), as an open-end management investment company. Shares of the Funds may only be purchased or redeemed through variable annuity contracts and variable life insurance policies offered by the separate accounts of participating life insurance companies or through eligible pension or other qualified plans.
The following are significant accounting policies consistently followed by the Funds and are in conformity with U.S. generally accepted accounting principles (“GAAP”). Estimates and assumptions are required to be made regarding assets, liabilities and changes in net assets resulting from operations when financial statements are prepared. Changes in the economic environment, financial markets and any other parameters used in determining these estimates could cause actual results to differ.
(a) Investment Valuation. Equity securities for which market quotations are available are valued at the last sale price or official closing price on the primary market or exchange on which they trade. Debt securities are valued at the mean between the bid and asked prices provided by an independent pricing service that are based on transactions in debt obligations, quotations from bond dealers, market transactions in comparable securities and various other relationships between securities. When prices are not readily available, or are determined not to reflect fair value, such as when the value of a security has been significantly affected by events after the close of the exchange or market on which the security is principally traded, but before the Funds calculate their net asset value, the Funds may value these investments at fair value as determined in accordance with the procedures approved by the Funds’ Board of Directors. Fair valuing of securities may be determined with the assistance of a pricing service using calculations based on indices of domestic securities and other appropriate indicators, such as prices of relevant ADRs and futures contracts. Short-term obligations maturing within 60 days are valued at amortized cost, which approximates market value.
(b) Repurchase Agreements. When entering into repurchase agreements, it is the Funds’ policy that their custodian or a third party custodian take possession of the underlying collateral securities, the market value of which at least equals the principal amount of the repurchase transaction, including accrued interest. To the extent that any repurchase transaction exceeds one business day, the value of the collateral is marked-to-market to ensure the adequacy of the collateral. If the seller defaults and the market value of the collateral declines or if bankruptcy proceedings are commenced with respect to the seller of the security, realization of the collateral by the Funds may be delayed or limited.
64 Legg Mason Partners Variable Portfolios III, Inc. 2006 Annual Report
Notes to Financial Statements (continued)
(c) Lending of Portfolio Securities. The Funds have an agreement with their custodian whereby the custodian may lend securities owned by the Funds to brokers, dealers and other financial organizations. In exchange for lending securities under the terms of the agreement with their custodian, the Funds receive a lender’s fee. Fees earned by the Funds on securities lending are recorded as securities lending income. Loans of securities by the Funds are collateralized by cash, U.S. government securities or high quality money market instruments that are maintained at all times in an amount at least equal to the current market value of the loaned securities, plus a margin which varies depending on the type of securities loaned. The custodian establishes and maintains the collateral in a segregated account. The Funds have the right under the lending agreement to recover the securities from the borrower on demand.
The Funds maintain the risk of any loss on the securities on loan as well as the potential loss on investments purchased with cash collateral received from securities lending.
(d) Foreign Risk. Certain Funds’ investments in foreign securities may involve risks not present in domestic investments. Since securities may be denominated in foreign currencies and may require settlement in foreign currencies and pay interest or dividends in foreign currencies, changes in the relationship of these foreign currencies to the U.S. dollar can significantly affect the value of the investments and earnings of the Funds. Foreign investments may also subject the Funds to foreign government exchange restrictions, expropriation, taxation or other political, social or economic developments, all of which affect the market and/or credit risk of the investments.
(e) Foreign Currency Translation. Investment securities and other assets and liabilities denominated in foreign currencies are translated into U.S. dollar amounts based upon prevailing exchange rates on the date of valuation. Purchases and sales of investment securities and income and expense items denominated in foreign currencies are translated into U.S. dollar amounts based upon prevailing exchange rates on the respective dates of such transactions.
The Funds do not isolate that portion of the results of operations resulting from changes in foreign exchange rates on investments from the fluctuations arising from changes in market prices of securities held. Such fluctuations are included with the net realized and unrealized gain or loss on investments.
Net realized foreign exchange gains or losses arise from sales of foreign currencies, including gains and losses on forward foreign currency contracts, currency gains or losses realized between the trade and settlement dates on securities transactions and the difference between the amounts of dividends, interest and foreign withholding taxes recorded on the Funds’ books and the U.S. dollar equivalent of the amounts actually received or paid. Net unrealized foreign exchange gains and losses arise from changes in the fair values of assets and liabilities, other than investments in securities, at the date of valuation, resulting from changes in exchange rates.
Foreign security and currency transactions may involve certain considerations and risks not typically associated with those of U.S. dollar denominated transactions as a result of, among other factors, the possibility of lower levels of governmental supervision and regulation of foreign securities markets and the possibility of political or economic instability.
Legg Mason Partners Variable Portfolios III, Inc. 2006 Annual Report 65
Notes to Financial Statements (continued)
(f) Security Transactions and Investment Income. Security transactions are accounted for on a trade date basis. Interest income, adjusted for amortization of premium and accretion of discount, is recorded on the accrual basis. Dividend income is recorded on the ex-dividend date. Foreign dividend income is recorded on the ex-dividend date or as soon as practical after the Funds determine the existence of a dividend declaration after exercising reasonable due diligence. The cost of investments sold is determined by use of the specific identification method. To the extent any issuer defaults on an expected interest payment, the Funds’ policy is to generally halt any additional interest income accruals and consider the realizability of interest accrued up to the date of default.
(g) Distributions to Shareholders. Distributions from net investment income and distributions of net realized gains, if any, are declared at least annually. Distributions to shareholders of the Funds are recorded on the ex-dividend date and are determined in accordance with income tax regulations, which may differ from GAAP.
(h) Federal and Other Taxes. It is the Funds’ policy to comply with the federal income and excise tax requirements of the Internal Revenue Code of 1986, as amended, applicable to regulated investment companies. Accordingly, the Funds intend to distribute substantially all of its income and net realized gains on investments, if any, to shareholders each year. Therefore, no federal income tax provision is required in the Funds’ financial statements. Under the applicable foreign tax laws, a withholding tax may be imposed on interest, dividends and capital gains at various rates.
(i) Reclassification. GAAP requires that certain components of net assets be adjusted to reflect permanent differences between financial and tax reporting. These reclassifications have no effect on net assets or net asset values per share. Additionally, during the current year, the following reclassifications have been made:
| | | | | | | | | | | | | | | |
| | | | |
| Fund | | | | | Accumulated Net
Investment Loss/
Undistributed Net
Investment Income | | | Accumulated Net
Realized Gains/
(Losses) | | | Paid-in Capital | |
Legg Mason Partners Variable Large Cap Value Portfolio | | (a | ) | | $ | 40,095 | | | $ | 1,382 | | | $ | (41,477 | ) |
| | (b | ) | | | 2,028 | | | | (2,028 | ) | | | — | |
| | |
Legg Mason Partners Variable Large Cap Growth Portfolio | | (a | ) | | | 39,734 | | | | — | | | | (39,734 | ) |
| | |
Legg Mason Partners Variable Mid Cap Core Portfolio | | (a | ) | | | 10,652 | | | | — | | | | (10,652 | ) |
| | (b | ) | | | (28 | ) | | | 28 | | | | — | |
| | |
Legg Mason Partners Variable Aggressive Growth Portfolio | | (c | ) | | | 2,191,864 | | | | — | | | | (2,191,864 | ) |
| | (d | ) | | | 243,314 | | | | (243,314 | ) | | | — | |
| | |
Legg Mason Partners Variable International All Cap Growth Portfolio | | (a | ) | | | 23,938 | | | | — | | | | (23,938 | ) |
| | (b | ) | | | 16,266 | | | | (16,266 | ) | | | — | |
| | |
| (a) | Reclassifications are primarily due to a book/tax differences in the treatment of various items. |
| (b) | Reclassifications are primarily due to foreign currency transactions treated as ordinary income for tax purposes. |
| (c) | Reclassifications are primarily due to a tax net operating loss and book/tax differences in the treatment of various items. |
| (d) | Reclassifications are primarily due to a tax net operating loss offsetting current year short-term capital gains for tax purposes. |
66 Legg Mason Partners Variable Portfolios III, Inc. 2006 Annual Report
Notes to Financial Statements (continued)
Additionally for Legg Mason Partners Variable Large Cap Value Portfolio, during the current period, Accumulated Realized Gain and Cost of Investments each have been reduced by $13,122 as a result of return of capital distributions paid by REITs. These adjustments have no effect on net assets or asset values per share.
| 2. | Investment Management Agreement and Other Transactions with Affiliates |
On December 1, 2005, Citigroup Inc. (“Citigroup”) completed the sale of substantially all of its asset management business to Legg Mason, Inc. (“Legg Mason”). As a result, the Funds’ then investment manager, Smith Barney Fund Management LLC (“SBFM”), previously an indirect wholly-owned subsidiary of Citigroup, became a wholly-owned subsidiary of Legg Mason. Completion of the sale caused the Funds’ then existing investment management contracts to terminate. The Funds’ shareholders approved a new investment management contract between the Funds and the manager, which became effective on December 1, 2005.
Effective November 1, 2005 and continuing under a new investment management agreement, effective December 1, 2005, Legg Mason Partners Variable Mid Cap Core Portfolio paid the manager an investment management fee calculated daily and paid monthly at an annual rate of 0.75% of the Fund’s average daily net assets. Legg Mason Partners Variable Large Cap Value Portfolio, Legg Mason Partners Variable Large Cap Growth Portfolio, Legg Mason Partners Variable Aggressive Growth Portfolio and Legg Mason Partners Variable International All Cap Growth Portfolio paid the manager an investment management fee, which is calculated daily and paid monthly in accordance with the following breakpoint schedule:
| | | |
| |
| Average Daily Net Assets | | Annual Rate | |
Legg Mason Partners Variable Large Cap Value Portfolio | | | |
| | |
First $500 million | | 0.600 | % |
Next $500 Million | | 0.550 | |
Over $1 billion | | 0.500 | |
| | |
Legg Mason Partners Variable Large Cap Growth Portfolio | | | |
| | |
First $1 billion | | 0.750 | % |
Next $1 billion | | 0.725 | |
Next $3 billion | | 0.700 | |
Next $5 billion | | 0.675 | |
Over $10 billion | | 0.650 | |
| | |
Legg Mason Partners Variable Aggressive Growth Portfolio | | | |
| | |
First $1 billion | | 0.750 | % |
Next $1 billion | | 0.725 | |
Next $3 billion | | 0.700 | |
Next $5 billion | | 0.675 | |
Over $10 billion | | 0.650 | |
| | |
Legg Mason Partners Variable International All Cap Growth Portfolio | | | |
| | |
First $1 billion | | 0.850 | % |
Next $1 billion | | 0.825 | |
Next $3 billion | | 0.800 | |
Next $5 billion | | 0.775 | |
Over $10 billion | | 0.750 | |
| | |
Legg Mason Partners Variable Portfolios III, Inc. 2006 Annual Report 67
Notes to Financial Statements (continued)
Effective August 1, 2006, Legg Mason Partners Fund Advisor, LLC (“LMPFA”) became each Fund’s investment manager and ClearBridge Advisors, LLC (“ClearBridge”), formerly known as CAM North America, LLC, became each Fund’s subadviser. The Portfolio managers who are responsible for the day-to-day management of each Fund remain the same immediately prior to and immediately after the date of these changes. LMPFA and ClearBridge are wholly-owned subsidiaries of Legg Mason.
LMPFA provides administrative and certain oversight services to each Fund. LMPFA has delegated to the subadviser the day-to-day portfolio management of each Fund. The Funds’ investment management fee remain unchanged. For its services, LMPFA pays ClearBridge 70% of the net management fee that it receives from each Fund.
During the year ended October 31, 2006, Legg Mason Partners Variable Large Cap Value Portfolio, Legg Mason Partners Variable Mid Cap Core Portfolio, Legg Mason Partners Variable Aggressive Growth Portfolio and Legg Mason Partners Variable International All Cap Growth Portfolio, had voluntary expense limitations in place of 1.25%, 0.95%, 1.00% and 1.50%, respectively.
During the year ended October 31, 2006, SBFM waived a portion of its investment management fee in the amount of $6,724, $8,416, $2,764, $24,936 and $3,705 for Legg Mason Partners Variable Large Cap Value Portfolio, Legg Mason Partners Variable Large Cap Growth Portfolio, Legg Mason Partners Variable Mid Cap Core Portfolio, for Legg Mason Partners Variable Aggressive Growth Portfolio and Legg Mason Partners Variable International All Cap Growth Portfolio, respectively.
In addition, during the year ended October 31, 2006, Legg Mason Partners Variable Large Cap Value Portfolio, Legg Mason Partners Variable Large Cap Growth Portfolio, Legg Mason Partners Variable Mid Cap Core Portfolio, Legg Mason Partners Variable Aggressive Growth Portfolio and Legg Mason Partners Variable International All Cap Growth Portfolio were reimbursed for expenses amounting to $1,533, $1,548, $1,549, $1,548, $1,532, respectively.
The Funds’ Board approved PFPC Inc. (“PFPC”) to serve as transfer agent for the Funds, effective January 1, 2006. The principal business office of PFPC is located at 4400 Computer Drive, Westborough, MA 01581. Prior to January 1, 2006, Citicorp Trust Bank, fsb. (“CTB”), a subsidiary of Citigroup, acted as the Funds’ transfer agent. Also, prior to January 1, 2006, PFPC acted as the Funds’ sub-transfer agent. CTB received account fees and asset-based fees that varied according to the size and type of account. PFPC was responsible for shareholder recordkeeping and financial processing for all shareholder accounts and was paid by CTB. For the period ended October 31, 2006, the Funds paid transfer agent fees of $10,480 to CTB.
The totals for each Fund were as follows:
| | | |
| |
| | | Transfer Agent Fees |
Legg Mason Partners Variable Large Cap Value Portfolio | | $ | 2,097 |
Legg Mason Partners Variable Large Cap Growth Portfolio | | | 2,093 |
Legg Mason Partners Variable Mid Cap Core Portfolio | | | 2,092 |
Legg Mason Partners Variable Aggressive Growth Portfolio | | | 2,093 |
Legg Mason Partners Variable International All Cap Growth Portfolio | | | 2,105 |
| |
68 Legg Mason Partners Variable Portfolios III, Inc. 2006 Annual Report
Notes to Financial Statements (continued)
The Funds’ Board has appointed the Funds’ current distributor, Citigroup Global Markets Inc. (“CGM”), a subsidiary of Citigroup, and Legg Mason Investor Services, LLC (“LMIS”), a wholly-owned broker-dealer subsidiary of Legg Mason, as co-distributors of the Funds. CGM and other broker-dealers, financial intermediaries and financial institutions (each called a “Service Agent”) that currently offer Fund shares will continue to make the Funds’ shares available to their clients. Additional Service Agents may offer Fund shares in the future.
For the year ended October 31, 2006, CGM, its affiliates and LMIS did not receive any brokerage commissions from the Funds.
Certain officers and one Director of the Company are employees of Legg Mason or its affiliates and do not receive compensation from the Company.
During the year ended October 31, 2006, the aggregate cost of purchases and proceeds from sales of investments (excluding short-term investments) were as follows:
| | | | | | |
| | |
| | | Purchases | | Sales |
Legg Mason Partners Variable Large Cap Value Portfolio | | $ | 65,853,754 | | $ | 120,685,570 |
Legg Mason Partners Variable Large Cap Growth Portfolio | | | 43,622,611 | | | 110,396,159 |
Legg Mason Partners Variable Mid Cap Core Portfolio | | | 85,819,619 | | | 100,004,747 |
Legg Mason Partners Variable Aggressive Growth Portfolio | | | 54,741,375 | | | 46,777,142 |
Legg Mason Partners Variable International All Cap Growth Portfolio | | | 12,840,162 | | | 41,319,479 |
| |
At October 31, 2006, the aggregate gross unrealized appreciation and depreciation of investments for federal income tax purposes were as follows:
| | | | | | | | | | |
| | | |
| | | Gross unrealized
appreciation | | Gross unrealized
depreciation | | | Net unrealized
appreciation |
Legg Mason Partners Variable Large Cap Value Portfolio | | $ | 67,602,765 | | $ | (2,671,393 | ) | | $ | 64,931,372 |
Legg Mason Partners Variable Large Cap Growth Portfolio | | | 91,667,222 | | | (6,533,048 | ) | | | 85,134,174 |
Legg Mason Partners Variable Barney Mid Cap Core Portfolio | | | 17,208,053 | | | (2,122,598 | ) | | | 15,085,455 |
Legg Mason Partners Variable Aggressive Growth Portfolio | | | 370,856,757 | | | (106,859,411 | ) | | | 263,997,346 |
Legg Mason Partners Variable International All Cap Growth Portfolio | | | 73,889,517 | | | (1,340,601 | ) | | | 72,548,916 |
| |
Legg Mason Partners Variable Portfolios III, Inc. 2006 Annual Report 69
Notes to Financial Statements (continued)
At October 31, 2006, the Company had six billion shares of capital stock authorized with a par value of $0.00001 per share. Each share of a Fund represents an equal proportionate interest in that Fund with each other share of the same Fund and has an equal entitlement to any dividends and distributions made by the Fund.
Transactions in shares of each Fund were as follows:
| | | | | | |
| | | Year Ended
October 31, 2006 | | | Year Ended
October 31, 2005 | |
Legg Mason Partners Variable Large Cap Value Portfolio | | | | | | |
| | |
Shares sold | | 122,225 | | | 174,564 | |
Shares issued on reinvestment | | 252,366 | | | 354,179 | |
Shares repurchased | | (3,241,570 | ) | | (3,655,136 | ) |
| | |
Net Decrease | | (2,866,979 | ) | | (3,126,393 | ) |
| | |
Legg Mason Partners Variable Large Cap Growth Portfolio | | | | | | |
| | |
Shares sold | | 684,765 | | | 837,308 | |
Shares issued on reinvestment | | 32,723 | | | 104,161 | |
Shares repurchased | | (5,202,676 | ) | | (4,531,870 | ) |
| | |
Net Decrease | | (4,485,188 | ) | | (3,590,401 | ) |
| | |
Legg Mason Partners Variable Mid Cap Core Portfolio | | | | | | |
| | |
Shares sold | | 93,328 | | | 618,090 | |
Shares issued on reinvestment | | 681,898 | | | — | |
Shares repurchased | | (1,307,767 | ) | | (836,951 | ) |
| | |
Net Decrease | | (532,541 | ) | | (218,861 | ) |
| | |
Legg Mason Partners Variable Aggressive Growth Portfolio | | | | | | |
| | |
Shares sold | | 6,095,206 | | | 4,820,016 | |
Shares issued on reinvestment | | 2,165 | | | 281,999 | |
Shares repurchased | | (7,534,257 | ) | | (4,607,553 | ) |
| | |
Net Increase (Decrease) | | (1,436,886 | ) | | 494,462 | |
| | |
Legg Mason Partners Variable International All Cap Growth Portfolio | | | | |
| | |
Shares sold | | 123,392 | | | 423,243 | |
Shares issued on reinvestment | | 153,310 | | | 115,894 | |
Shares repurchased | | (1,993,841 | ) | | (2,502,814 | ) |
Shares issued in connection with merger | | — | | | 224,109 | |
| | |
Net Decrease | | (1,717,139 | ) | | (1,739,568 | ) |
| | |
On July 8, 2005, Legg Mason Partners Variable International All Cap Growth Portfolio acquired the assets and certain liabilities of the GSS Salomon Brothers Variable International Equity Fund pursuant to a plan of reorganization approved by GSS Salomon Brothers Variable International Equity Fund shareholders on July 1, 2005. Total shares issued by Legg Mason Partners Variable International All Cap Growth Portfolio, the total net assets of the GSS Salomon Brothers Variable International Equity Fund and total net
70 Legg Mason Partners Variable Portfolios III, Inc. 2006 Annual Report
Notes to Financial Statements (continued)
assets of Legg Mason Variable International All Cap Growth Portfolio on the date of the transfer were as follows:
| | | | | | | | |
| | | |
| Acquired Fund | | Shares Issued by
Legg Mason
Partners Variable
International All Cap
Growth Portfolio | | Total Net Assets of the GSS
Salomon Brothers Variable
International Equity Fund | | Total Net Assets of,
Legg Mason
Partners Variable
International All Cap
Growth Portfolio |
GSS Salomon Brothers Variable International Equity Fund | | 224,109 | | $ | 2,864,133 | | $ | 158,199,570 |
| |
The total net assets of the GSS Salomon Brothers Variable International Equity Fund before acquisition included unrealized depreciation of $961,933 and accumulated net realized gain of $494. Total net assets of Legg Mason Partners Variable International All Cap Growth Portfolio immediately after the transfer were $161,063,703. The transaction was structured to qualify as a tax-free reorganization under the Internal Revenue Code of 1986, as amended.
| 6. | Income Tax Information and Distributions to Shareholders |
The tax character of distributions paid during the fiscal year ended October 31, 2006 were as follows:
| | | | | | | | | |
| | | |
| | | Legg Mason
Partners Variable
Large Cap Value
Portfolio | | Legg Mason
Partners Variable
Large Cap Growth
Portfolio | | Legg Mason
Partners Variable
Mid Cap Core
Portfolio |
Distributions paid from: | | | | | | | | | |
Ordinary Income | | $ | 4,800,001 | | $ | 500,002 | | $ | 750,004 |
Net Long-term Capital Gains | | | — | | | — | | | 9,028,419 |
| |
Total Distributions Paid | | $ | 4,800,001 | | $ | 500,002 | | $ | 9,778,423 |
| |
| | | |
| | | Legg Mason
Partners Variable
Aggressive Growth
Portfolio | | Legg Mason
Partners Variable
International All
Cap Growth
Portfolio | | |
Distributions paid from: | | | | | | | | | |
Ordinary Income | | | — | | $ | 2,200,003 | | | |
Net Long-term Capital Gains | | $ | 32,468 | | | — | | | |
| |
Total Distributions Paid | | $ | 32,468 | | $ | 2,200,003 | | | |
| |
Legg Mason Partners Variable Portfolios III, Inc. 2006 Annual Report 71
Notes to Financial Statements (continued)
The tax character of distributions paid during the fiscal year ended October 31, 2005 were as follows:
| | | | | | |
| | |
| | | Legg Mason
Partners Variable
Large Cap Value
Portfolio | | Legg Mason
Partners Variable
Large Cap Growth
Portfolio |
Distributions paid from: | | | | | | |
Ordinary Income | | $ | 6,400,006 | | $ | 1,500,969 |
| |
Total Distributions Paid | | $ | 6,400,006 | | $ | 1,500,969 |
| |
| | |
| | | Legg Mason
Partners Variable
Aggressive Growth
Portfolio | | Legg Mason
Partners Variable
International All
Cap Growth
Portfolio |
Distributions paid from: | | | | | | |
Ordinary Income | | $ | — | | $ | 1,500,826 |
Net Long-term Capital Gains | | | 3,756,228 | | | — |
| |
Total Distributions Paid | | $ | 3,756,228 | | $ | 1,500,826 |
| |
Additionally, Legg Mason Partners Variable Mid Cap Core Portfolio did not pay any distributions during the fiscal year ended October 31, 2005.
As of October 31, 2006, the components of accumulated earnings on a tax basis were as follows:
| | | | | | | | | | | | |
| | | |
| | | Legg Mason
Partners Variable
Large Cap Value
Portfolio | | | Legg Mason
Partners Variable
Large Cap Growth
Portfolio | | | Legg Mason
Partners Variable
Mid Cap Core
Portfolio | |
Undistributed ordinary income — net | | $ | 2,482,793 | | | $ | 199,123 | | | $ | 5,536,972 | |
Undistributed long-term capital gains — net | | | 5,149,182 | | | | — | | | | 9,719,984 | |
| | |
Total undistributed earnings | | | 7,631,975 | | | | 199,123 | | | | 15,256,956 | |
| | |
Capital loss carryforward* | | $ | (15,086,592 | ) | | $ | (60,441,244 | ) | | | — | |
Other book/tax temporary differences | | | (18,118 | )(a) | | | (19,839 | )(a) | | $ | (7,306 | )(a) |
Unrealized appreciation/(depreciation) | | | 64,931,522 | (b) | | | 85,134,174 | (b) | | | 15,085,455 | (b) |
| | |
Total accumulated earnings/(losses) — net | | $ | 57,458,787 | | | $ | 24,872,214 | | | $ | 30,355,105 | |
| | |
72 Legg Mason Partners Variable Portfolios III, Inc. 2006 Annual Report
Notes to Financial Statements (continued)
| | | | | | | | |
| | |
| | | Legg Mason
Partners Variable
Aggressive
Growth Portfolio | | | Legg Mason
Partners Variable
International All
Cap Growth
Portfolio | |
Undistributed ordinary income — net | | | — | | | $ | 2,923,606 | |
Undistributed long-term capital gains — net | | $ | 1,267,479 | | | | 3,577,243 | |
| | |
Total undistributed earnings | | | 1,267,479 | | | | 6,500,849 | |
Capital loss carryforward* | | | — | | | | (54,009,980 | ) |
Other book/tax temporary differences | | | (71,131 | )(a) | | | (12,144 | )(a) |
Unrealized appreciation/(depreciation) | | | 263,997,346 | (b) | | | 72,588,546 | (c) |
| | |
Total accumulated earnings/(losses) — net | | $ | 265,193,694 | | | $ | 25,067,271 | |
| | |
| * | | During the taxable year ended October 31, 2006, Legg Mason Partners Variable Large Cap Value Portfolio utilized $14,198,592, Legg Mason Partners Variable Large Cap Growth Portfolio utilized $4,483,569, and Legg Mason Partners Variable International All Cap Growth Portfolio utilized $7,371,351, of their respective capital loss carryovers available from prior years. As of October 31, 2006, the Funds had the following net capital loss carryforwards remaining: |
| | | | | | | | | | | | |
Year of Expiration | | Legg Mason
Partners Variable
Large Cap Value
Portfolio | | | Legg Mason
Partners Variable
Large Cap Growth
Portfolio | | | Legg Mason
Partners Variable
International All
Cap Growth
Portfolio | |
10/31/2009 | | $ | — | | | $ | (2,989,683 | ) | | $ | (30,650,521 | ) |
10/31/2010 | | | — | | | | (30,603,559 | ) | | | (13,574,174 | ) |
10/31/2011 | | | (15,086,592 | ) | | | (8,588,495 | ) | | | (9,785,285 | ) |
10/31/2012 | | | — | | | | (5,325,802 | ) | | | | |
10/31/2013 | | | | | | | (12,933,705 | ) | | | | |
| | | | | | | | | | | | |
Total | | $ | (15,086,592 | ) | | $ | (60,441,244 | ) | | $ | (54,009,980 | ) |
| | | | | | | | | | | | |
These amounts will be available to offset any future taxable capital gains, subject to an annual limitation resulting from an ownership change the Funds experienced in the prior year. The Funds are subject to the following annual limitation:
| | | |
Fund | | Annual Limitation |
Legg Mason Partners Variable Large Cap Value Portfolio | | $ | 13,861,111 |
Legg Mason Partners Variable Large Cap Growth Portfolio | | | 16,427,952 |
Legg Mason Partners Variable International All Cap Growth Portfolio | | | 6,907,953 |
| | | |
Due to the proposed reorganization of Legg Mason Partners Variable Large Cap Value Portfolio described in Note 10, the expiration dates of these loss carryforwards will move up by one year. Additionally, as a result of the reorganization, the loss carryforwards will be subject to various tax limitations, which may result in future taxable capital gain distributions to shareholders due to the fact that some portion of the Fund’s loss carryforwards may be unable to be utilized.
| (a) | | Other book/tax temporary differences are attributable primarily to the differences in the book/tax treatment of various items. |
| (b) | | The difference between book-basis and tax-basis unrealized appreciation/(depreciation) is attributable primarily to the tax deferral of losses on wash sales. |
| (c) | | The difference between book-basis and tax-basis unrealized appreciation/(depreciation) is attributable primarily to the tax deferral of losses on wash sales and the realization for tax purposes of unrealized gains on investments in passive foreign investment companies. |
On May 31, 2005, the U.S. Securities and Exchange Commission (“SEC”) issued an order in connection with the settlement of an administrative proceeding against SBFM and CGM relating to the appointment of an affiliated transfer agent for the Smith Barney family of mutual funds (the “Funds”).
The SEC order finds that SBFM and CGM willfully violated Section 206(1) of the Investment Advisers Act of 1940 (“Advisers Act”). Specifically, the order finds that SBFM and CGM knowingly or recklessly failed to disclose to the boards of the Funds in 1999 when proposing a new transfer agent arrangement with an affiliated transfer agent that:
Legg Mason Partners Variable Portfolios III, Inc. 2006 Annual Report 73
Notes to Financial Statements (continued)
First Data Investors Services Group (“First Data”), the Funds’ then-existing transfer agent, had offered to continue as transfer agent and do the same work for substantially less money than before; and that Citigroup Asset Management (“CAM”), the Citigroup business unit that, at the time, included the Funds’ investment manager and other investment advisory companies, had entered into a side letter with First Data under which CAM agreed to recommend the appointment of First Data as sub-transfer agent to the affiliated transfer agent in exchange for, among other things, a guarantee by First Data of specified amounts of asset management and investment banking fees to CAM and CGM. The order also finds that SBFM and CGM willfully violated Section 206(2) of the Advisers Act by virtue of the omissions discussed above and other misrepresentations and omissions in the materials provided to the Funds’ boards, including the failure to make clear that the affiliated transfer agent would earn a high profit for performing limited functions while First Data continued to perform almost all of the transfer agent functions, and the suggestion that the proposed arrangement was in the Funds’ best interests and that no viable alternatives existed. SBFM and CGM do not admit or deny any wrongdoing or liability. The settlement does not establish wrongdoing or liability for purposes of any other proceeding.
The SEC censured SBFM and CGM and ordered them to cease and desist from violations of Sections 206(1) and 206(2) of the Advisers Act. The order requires Citigroup to pay $208.1 million, including $109 million in disgorgement of profits, $19.1 million in interest, and a civil money penalty of $80 million. Approximately $24.4 million has already been paid to the Funds, primarily through fee waivers. The remaining $183.7 million, including the penalty, has been paid to the U.S. Treasury and will be distributed pursuant to a plan submitted for the approval of the SEC. At this time, there is no certainty as to how the above-described proceeds of the settlement will be distributed, to whom such distributions will be made, the methodology by which such distributions will be allocated, and when such distributions will be made. The order also required that transfer agency fees received from the Funds since December 1, 2004, less certain expenses be placed in escrow and provided that a portion of such fees might be subsequently distributed in accordance with the terms of the order. On April 3, 2006, an aggregate amount of approximately $9 million was distributed to the affected Funds.
The order required SBFM to recommend a new transfer agent contract to the Fund boards within 180 days of the entry of the order; if a Citigroup affiliate submitted a proposal to serve as transfer agent or sub-transfer agent, SBFM and CGM would have been required, at their expense, to engage an independent monitor to oversee a competitive bidding process. On November 21, 2005, and within the specified timeframe, the Funds’ Board selected a new transfer agent for the Funds. No Citigroup affiliate submitted a proposal to serve as transfer agent. Under the order, SBFM also must comply with an amended version of a vendor policy that Citigroup instituted in August 2004.
Although there can be no assurance, the Funds’ manager does not believe that this matter will have a material adverse effect on the Funds.
On December 1, 2005, Citigroup completed the sale of substantially all of its global asset management business, including SBFM, to Legg Mason.
74 Legg Mason Partners Variable Portfolios III, Inc. 2006 Annual Report
Notes to Financial Statements (continued)
Beginning in August 2005, five class action lawsuits alleging violations of federal securities laws and state law were filed against CGM and SBFM (collectively, the “Defendants”) based on the May 31, 2005 settlement order issued against the Defendants by the SEC as described in Note 7. The complaints seek injunctive relief and compensatory and punitive
damages, removal of SBFM as the investment manager for the Smith Barney family of funds, rescission of the Funds’ management and other contracts with SBFM, recovery of all fees paid to SBFM pursuant to such contracts, and an award of attorneys’ fees and litigation expenses.
On October 5, 2005, a motion to consolidate the five actions and any subsequently filed, related action was filed. That motion contemplates that a consolidated amended complaint alleging substantially similar causes of action will be filed in the future.
As of the date of this report, the Funds’ manager believes that resolution of the pending lawsuit will not have a material effect on the financial position or results of operations of the Funds or the ability of the Funds’ manager and its affiliates to continue to render services to the Funds under their respective contracts.
* * *
Beginning in June 2004, class action lawsuits alleging violations of the federal securities laws were filed against CGM and a number of its then affiliates, SBFM and Salomon Brothers Asset Management Inc (“SBAM”), which were then investment adviser or manager to certain of the Funds (the “Managers”), substantially all of the mutual funds then managed by the Managers (the “Defendant Funds”), and Board Members of the Defendant Funds (collectively, the “Defendants”). The complaints alleged, among other things, that CGM created various undisclosed incentives for its brokers to sell Smith Barney and Salomon Brothers funds. In addition, according to the complaints, the Managers caused the Defendant Funds to pay excessive brokerage commissions to CGM for steering clients towards proprietary funds. The complaints also alleged that the defendants breached their fiduciary duty to the Defendant Funds by improperly charging Rule 12b-1 fees and by drawing on fund assets to make undisclosed payments of soft dollars and excessive brokerage commissions. The complaints also alleged that the Defendant Funds failed to adequately disclose certain of the allegedly wrongful conduct. The complaints sought injunctive relief and compensatory and punitive damages, rescission of the Defendant Funds’ contracts with the Managers, recovery of all fees paid to the Managers pursuant to such contracts and an award of attorneys’ fees and litigation expenses.
On December 15, 2004, a consolidated amended complaint (the “Complaint”) was filed alleging substantially similar causes of action. On May 27, 2005, all of the Defendants filed motions to dismiss the Complaint. On July 26, 2006, the court issued a decision and order (1) finding that plaintiffs lacked standing to sue on behalf of the shareholders of the Defendant Funds in which none of the plaintiffs had invested (including the Funds) and dismissing those Defendant Funds from the case (although stating that they could be brought back into the case if standing as to them could be established), and (2) other than
Legg Mason Partners Variable Portfolios III, Inc. 2006 Annual Report 75
Notes to Financial Statements (continued)
one stayed claim, dismissing all of the causes of action against the remaining Defendants, with prejudice, except for the cause of action under Section 36(b) of the 1940 Act, which the court granted plaintiffs leave to replead as a derivative claim.
On October 16, 2006, plaintiffs filed their Second Consolidated Amended Complaint (“Second Amended Complaint”) which alleges derivative claims on behalf of nine funds identified in the Second Amended Complaint, under Section 36(b) of the 1940 Act, against Citigroup Asset Management, Salomon Brothers Asset Management Inc, SBFM and CGM as investment advisers to the identified funds, as well as CGM as a distributor for the identified funds (collectively, the “Second Amended Complaint Defendants”). The Funds were not identified in the Second Amended Complaint. The Second Amended Complaint alleges no claims against any of the Funds or any of their Board Members. Under Section 36(b), the Second Amended Complaint alleges similar facts and seeks similar relief against the Second Amended Complaint Defendants as the Complaint.
Additional lawsuits arising out of these circumstances and presenting similar allegations and requests for relief may be filed in the future.
On September 16, 2005, the staff of the Securities and Exchange Commission (the “Commission”) informed SBFM and SBAM that the staff is considering recommending that the Commission institute administrative proceedings against SBFM and SBAM and for alleged violations of Section 19(a) and 34(b) of the Investment Company Act (and related Rule 19a-1). The notification is a result of an industry wide inspection by the SEC and is based upon alleged deficiencies in disclosures regarding dividends and distributions paid to shareholders of certain funds. Section 19(a) and related Rule 19a-1 of the Investment Company Act generally require funds that are making dividend and distribution payments to provide shareholders with a written statement disclosing the source of the dividends and distributions, and, in particular, the portion of the payments made from each of net investment income, undistributed net profits and/or paid-in capital. In connection with the contemplated proceedings, the staff may seek a cease and desist order and/or monetary damages from SBFM or SBAM.
Although there can be no assurance, the Funds’ manager believe that this matter is not likely to have a material adverse effect on the Funds.
| 10. | Additional Shareholder Information |
The Funds’ Board approved a number of other initiatives designed to streamline and restructure the fund complex, and authorized seeking shareholder approval for those initiatives where shareholder approval is required. As a result, Fund shareholders have been asked to elect a new Board, approve matters that will result in the Funds being grouped for organizational and governance purposes with other funds in the fund complex, and domicile the Funds as a Maryland business trust, with all funds operating under uniform charter documents. Fund shareholders have also been asked to approve investment matters, including standardized fundamental investment policies.
76 Legg Mason Partners Variable Portfolios III, Inc. 2006 Annual Report
Notes to Financial Statements (continued)
Shareholder approval was obtained on December 11, 2006. These matters generally are expected to be implemented on or about May 1, 2007.
The Board also approved Brandywine Global Asset Management, LLC (“Brandywine) as a new subadviser for the Legg Mason Partners Variable International All Cap Growth Portfolio. Brandywine is an affiliate of Legg Mason. Shareholder approval of the new subadvisory agreement with Brandywine has also been obtained. Brandywine is expected to replace ClearBridge as the subadviser to Legg Mason Partners Variable International All Cap Growth Portfolio on or about May 1, 2007.
Shareholder approval of a reorganization pursuant to which the Legg Mason Variable Large Cap Value Portfolio’s (the “Acquired Fund”) assets would be acquired, and its liabilities assumed by the Legg Mason Partners Variable Investors Value Portfolio (the “Acquiring Fund”), in exchange for shares of the Acquiring Fund. The Fund would then be liquidated and shares of the Acquiring Fund distributed to the Acquired Fund shareholders on or about May 1, 2007.
Effective December 1, 2006, the Legg Mason Partners Variable Mid Cap Core Portfolio will be permitted to engage in short-selling. Short-selling is a technique that may be considered speculative and involves additional risks. For more information regarding these and other risks, please see the Fund’s current prospectus.
| 12. | Recent Accounting Pronouncements |
During June 2006, the Financial Accounting Standards Board (“FASB”) issued FASB Interpretation 48 (“FIN 48” or the “Interpretation”), Accounting for Uncertainty in Income Taxes — an interpretation of FASB statement 109. FIN 48 supplements FASB Statement 109, Accounting for Income Taxes, by defining the confidence level that a tax position must meet in order to be recognized in the financial statements. FIN 48 prescribes a comprehensive model for how a fund should recognize, measure, present, and disclose in its financial statements uncertain tax positions that the fund has taken or expects to take on a tax return. FIN 48 requires that the tax effects of a position be recognized only if it is “more likely than not” to be sustained based solely on its technical merits. Management must be able to conclude that the tax law, regulations, case law, and other objective information regarding the technical merits sufficiently support the position’s sustainability with a likelihood of more than 50 percent. FIN 48 is effective for fiscal periods beginning after December 15, 2006, which for the Funds will be November 1, 2007. At adoption, the financial statements must be adjusted to reflect only those tax positions that are more likely than not to be sustained as of the adoption date. Management of the Funds has determined that FIN 48 will not have a material impact on the Funds’ financial statements.
Should shareholders approve the reorganization proposal for Legg Mason Partners Variable Large Cap Value Portfolio, these new standards will not be applicable.
* * *
Legg Mason Partners Variable Portfolios III, Inc. 2006 Annual Report 77
Notes to Financial Statements (continued)
On September 20, 2006, the FASB released Statement of Financial Accounting Standards No. 157 “Fair Value Measurements” (“FAS 157”). FAS 157 establishes an authoritative definition of fair value, sets out a framework for measuring fair value, and requires additional disclosures about fair value measurements. The application of FAS 157 is required for fiscal years, beginning after November 15, 2007 and interim periods within those fiscal years. At this time, management is evaluating the implications of FAS 157 and its impact on the financial statements has not yet been determined.
These new standards will not be applicable to the Legg Mason Partners Variable Large Cap Value Portfolio as a result of shareholder approval of the reorganization proposal.
78 Legg Mason Partners Variable Portfolios III, Inc. 2006 Annual Report
Report of Independent Registered Public Accounting Firm
The Board of Directors and Shareholders
Legg Mason Partners Variable Portfolios III, Inc.:
We have audited the accompanying statements of assets and liabilities, including the schedules of investments, of Legg Mason Partners Variable Large Cap Value Portfolio (formerly Smith Barney Large Cap Value Portfolio), Legg Mason Partners Variable Large Cap Growth Portfolio (formerly Smith Barney Large Capitalization Growth Portfolio), Legg Mason Partners Variable Mid Cap Core Portfolio (formerly Smith Barney Mid Cap Core Portfolio), Legg Mason Partners Variable Aggressive Growth Portfolio (formerly Smith Barney Aggressive Growth Portfolio) and Legg Mason Partners Variable International All Cap Growth Portfolio (formerly Smith Barney International All Cap Growth Portfolio), each a series of Legg Mason Partners Variable Portfolios III, Inc. (formerly Travelers Series Fund Inc.), as of October 31, 2006, and the related statements of operations for the year then ended, the statements of changes in net assets for each of the years in the two-year period then ended, and the financial highlights for each of the years in the five-year period then ended. These financial statements and financial highlights are the responsibility of the Funds’ management. Our responsibility is to express an opinion on these financial statements and financial highlights based on our audits.
We conducted our audits in accordance with the standards of the Public Company Accounting Oversight Board (United States). Those standards require that we plan and perform the audit to obtain reasonable assurance about whether the financial statements and financial highlights are free of material misstatement. An audit includes examining, on a test basis, evidence supporting the amounts and disclosures in the financial statements. Our procedures included confirmation of securities owned as of October 31, 2006, by correspondence with the custodian and brokers or by other appropriate auditing procedures. An audit also includes assessing the accounting principles used and significant estimates made by management, as well as evaluating the overall financial statement presentation. We believe that our audits provide a reasonable basis for our opinion.
In our opinion, the financial statements and financial highlights referred to above present fairly, in all material respects, the financial position of Legg Mason Partners Variable Large Cap Value Portfolio, Legg Mason Partners Variable Large Cap Growth Portfolio, Legg Mason Partners Variable Mid Cap Core Portfolio, Legg Mason Partners Variable Aggressive Growth Portfolio and Legg Mason Partners Variable International All Cap Growth Portfolio, as of October 31, 2006, and the results of their operations for the year then ended, the changes in their net assets for each of the years in the two-year period then ended, and the financial highlights for each of the years in the five-year period then ended, in conformity with U.S. generally accepted accounting principles.

New York, New York
December 27, 2006
Legg Mason Partners Variable Portfolios III, Inc. 2006 Annual Report 79
Board Approval of Management and Subadvisory Agreements (unaudited)
At a meeting held in person on June 23, 2006, each Fund’s Board, including a majority of the Board Members who are not “interested persons” of the Funds or Legg Mason Partners Fund Advisor, LLC (the “Manager”) or any proposed sub-investment adviser as defined in the Investment Company Act of 1940, as amended (the “1940 Act”) (the “Independent Board Members”), approved a new management agreement (the “New Management Agreement”) between each Fund and the Manager. Each Fund’s Board, including a majority of the Independent Board Members, also approved a new subadvisory agreement between the Manager and ClearBridge Advisors, LLC, formerly CAM North America, LLC (the “Subadviser”) (each a “New Subadvisory Agreement”). The New Management Agreement and the New Subadvisory Agreement replaced each Fund’s prior management agreement with Smith Barney Fund Management, LLC and were entered into in connection with an internal reorganization of Legg Mason, the parent company of the Manager, the prior manager and the proposed Subadviser. The Board of Legg Mason Partners Variable International All Cap Growth Portfolio (“International All Cap Growth Portfolio”), including a majority of the Independent Board Members, also approved a new subadvisory agreement between the Manager and Brandywine Global Investment Management, LLC (“Brandywine”), subject to shareholder approval (also a “New Subadvisory Agreement”). The New Subadvisory Agreement with Brandywine was approved by the Board, subject to shareholder approval, with the intent that following such shareholder approval, Brandywine would replace ClearBridge as International All Cap Growth Portfolio’s sub-investment adviser. In approving the New Management Agreement and New Subadvisory Agreement for each Fund, the Board, including the Independent Board Members, considered the factors discussed below, among other things.
The Board noted that the Manager will provide administrative and certain oversight services to each Fund, and that the Manager will delegate to the applicable Subadviser the day-to-day portfolio management of each Fund. The Board Members reviewed the qualifications, backgrounds and responsibilities of the senior personnel that will provide oversight and general management services and the portfolio management team that would be primarily responsible for the day-to-day management of each Fund. The Board Members noted that the portfolio management team was expected to be the same as then managing each Fund. The Board Members further noted that Brandywine has not previously provided services to the International All Cap Growth Portfolio but has investment expertise and strong track records managing products having an investment style similar to that of International All Cap Growth Portfolio.
The Board Members received and considered information regarding the nature, extent and quality of services expected to be provided to each Fund by the Manager under the New Management Agreement and by the Subadviser under the New Subadvisory Agreement. The Board Members’ evaluation of the services expected to be provided by the Manager and ClearBridge took into account the Board Members’ knowledge and familiarity gained as Fund Board Members, including as to the scope and quality of Legg Mason’s investment management and other capabilities and the quality of its administrative and other services. The Board Members considered information presented by representatives of
80 Legg Mason Partners Variable Portfolios III, Inc.
Board Approval of Management and Subadvisory Agreements (unaudited) (continued)
Brandywine about Brandywine’s investment advisory capabilities. The Board Members considered, among other things, information and assurances provided by Legg Mason as to the operations, facilities and organization of the Manager and the Subadviser and the qualifications, backgrounds and responsibilities of their senior personnel. The Board Members further considered the financial resources available to the Manager, the Subadviser and Legg Mason. The Board Members concluded that, overall, the nature, extent and quality of services expected to be provided under the New Management Agreement and the New Subadvisory Agreement for each Fund were acceptable.
The Board Members also received and considered performance information for each Fund as well as comparative information with respect to a peer group of funds (the “Performance Universe”) selected by Lipper, Inc. (“Lipper”), an independent provider of investment company data. The Board Members were provided with a description of the methodology Lipper used to determine the similarity of each Fund to the funds included in
the Performance Universe. The Board Members noted that they had received and discussed with management, at periodic intervals, information comparing each Fund’s performance against, among other things, its benchmark. Based on the Board Members’ review, which included careful consideration of the factors noted above, the Board Members concluded that the performance of each Fund, under the circumstances, supported approval of the New Management Agreement and New Subadvisory Agreement for each Fund.
The Board Members reviewed and considered the management fee that would be payable by the Fund to the Manager in light of the nature, extent and quality of the management services expected to be provided by the Manager, including the fee waiver and/or expense reimbursement arrangements currently in place. Additionally, the Board Members received and considered information comparing each Fund’s management fee and overall expenses with those of comparable funds in both the relevant expense group and a broader group of funds, each selected and provided by Lipper. The Board Members also reviewed and considered the subadvisory fee that would be payable by the Manager to the Subadviser in light of the nature, extent and quality of the investment advisory services expected to be provided by the Subadviser. The Board Members noted that the Manager, and not the Fund, will pay the subadvisory fee to the Subadviser. The Board Members determined that each Fund’s management fee and each Fund’s subadvisory fee were reasonable in light of the nature, extent and quality of the services expected to be provided to each Fund under the New Management Agreement and the New Subadvisory Agreement with ClearBridge. With respect to the International All Cap Growth Portfolio, the Board Members further considered information provided by Brandywine about the performance of funds advised by Brandywine with a similar investment style as to the International All Cap Growth Portfolio.
The Board Members received and considered a pro-forma profitability analysis of Legg Mason and its affiliates in providing services to each Fund, including information with respect to the allocation methodologies used in preparing the profitability data. The Board Members recognized that Legg Mason may realize economies of scale based on its internal reorganization and synergies of operations. The Board Members noted that it was not
Legg Mason Partners Variable Portfolios III, Inc. 81
Board Approval of Management and Subadvisory Agreements (unaudited) (continued)
possible to predict with a high degree of confidence how Legg Mason’s and its affiliates’ profitability would be affected by its internal reorganization and by other factors including potential economies of scale, but that based on their review of the pro forma profitability analysis, their most recent prior review of the profitability of the predecessor manager and its affiliates from their relationship with each Fund and other factors considered, they determined that the management fee was reasonable. The Board Members noted that they expect to receive profitability information on an annual basis.
In their deliberations, the Board Members also considered, and placed significant importance on, information that had been received and conclusions that had been reached by the Board in connection with the Board’s most recent approval of the Fund’s prior management agreement with predecessors of the Manager and ClearBridge, in addition to information provided in connection with the Board’s evaluation of the terms and conditions of the New Management Agreement and the New Subadvisory Agreement.
The Board Members considered Legg Mason’s advice and the advice of Legg Mason’s counsel that the New Management Agreement and the New Subadvisory Agreement with ClearBridge were being entered into in connection with an internal reorganization within Legg Mason, that did not involve an actual change of control or management. The Board Members further noted that the terms and conditions of the New Management Agreement are substantially identical to those of each Fund’s previous management agreement except for the identity of the Manager, and that the initial term of the New Management Agreement (after which it will continue in effect only if such continuance is specifically approved at least annually by the Board, including a majority of the Independent Board Members) was the same as that under the prior management agreement. The Board Members noted that the New Subadvisory Agreement with Brandywine for the International All Cap Growth Portfolio required shareholder approval. Following shareholder approval it is expected that the term of the New Subadvisory Agreement with Brandywine for the International All Cap Growth Portfolio would commence on or about May 1, 2007.
In light of all of the foregoing, the Board, including the Independent Board Members, approved the New Management Agreement and the New Subadvisory Agreement with ClearBridge. The Board, including a majority of the Independent Board Members, also approved the New Subadvisory Agreement with Brandywine, subject to shareholder approval. No single factor reviewed by the Board Members was identified as the principal factor in determining whether to approve the New Management Agreement and each New Subadvisory Agreement. The Independent Board Members were advised by separate independent legal counsel throughout the process. The Independent Board Members also discussed the proposed approval of the New Management Agreement and each New Subadvisory Agreement in private sessions with their independent legal counsel at which no representatives of the Manager or either Subadviser were present.
82 Legg Mason Partners Variable Portfolios III, Inc.
Additional Information (unaudited)
Information about Directors and Officers
The business and affairs of Legg Mason Partners Variable Portfolios III, Inc. (formerly known as Travelers Series Fund Inc.) (the “Company”) are managed under the direction of the Company’s Board of Directors. Information pertaining to the Directors and Officers of the Company is set forth below. The Statement of Additional Information includes additional information about each Fund’s Directors and is available, without charge, by calling Legg Mason Partners Shareholder Services 1-800-451-2010.
| | | | | | | | | | |
| | | | | |
| Name, Address, and Birth Year | | Position(s) Held with Fund | | Term of Office* and Length of Time Served | | Principal Occupation(s) During Past
Five Years | | Number of Portfolios in Fund Complex
Overseen by
Director | | Other Board
Memberships Held by
Director |
| Non-Interested Directors: | | | | |
Robert A. Frankel 1961 Deergrass Way Carlsbad, CA 92009 Birth Year: 1927 | | Director | | Since
1999 | | Managing Partner of Robert A. Frankel Managing Consultants; Former Vice President of The Readers Digest Association, Inc. | | 18 | | None |
| | | | | |
Michael E. Gellert 122 East 42nd Street
47th Floor New York, NY 10168 Birth Year: 1931 | | Director | | Since
1999 | | General Partner of Windcrest Partners, a venture capital firm | | 11 | | Director of Dalet S.A., (media management operations), SEACOR Holdings, Inc. (offshore marine services provider) and Six Flags, Inc. |
| | | | | |
Rainer Greeven 630 5th Avenue Suite 1960
New York, NY 10111 Birth Year: 1936 | | Director | | Since
1994 | | Attorney, Rainer Greeven PC (since 1998); President and Director,
175 E. 62nd St. Corp. (real estate) (since 2002) | | 11 | | None |
| | | | | |
Susan M. Heilbron P.O. Box 557 Chilmark, MA 02535 Birth Year: 1945 | | Director | | Since
1994 | | Independent consultant (since 2001); formerly, owner of Lacey & Heilbron (communications consulting)
(1993 to 2001) | | 11 | | None |
Legg Mason Partners Variable Portfolios III, Inc. 83
Additional Information (unaudited) (continued)
| | | | | | | | | | |
| | | | | |
| Name, Address, and Birth Year | | Position(s) Held with Fund | | Term of Office* and Length of Time Served | | Principal Occupation(s) During Past
Five Years | | Number of
Portfolios in Fund Complex Overseen by
Director | | Other Board Memberships Held by
Director |
| Interested Director: | | | | | | | | |
R. Jay Gerken, CFA** Legg Mason & Co., LLC (“Legg Mason”) 399 Park Avenue, 4th Floor New York, NY 10022 Birth Year: 1951 | | Chairman, President and Chief Executive Officer | | Since
2002 | | Managing Director of Legg Mason; President and Chief Executive Officer of Legg Mason Partners Fund Advisors LLC (“LMPFA”) (Since 2006); President and Chief Executive Officer of Smith Barney Fund Management LLC (“SBFM”) and Citi Fund Management Inc. (“CFM”); President and Chief Executive Officer of certain mutual funds associated with Legg Mason; Formerly, Chairman of SBFM and CFM (from 2002 to 2006); Formerly, Chairman, President and Chief Executive Officer of Travelers Investment Advisers, Inc. (from 2002 to 2005) | | 162 | | Trustee, Consulting Group Capital Markets Funds |
84 Legg Mason Partners Variable Portfolios III, Inc.
Additional Information (unaudited) (continued)
| | | | | | | | | | |
| | | | | |
| Name, Address, and Birth Year | | Position(s) Held with Fund | | Term of Office* and Length of Time Served | | Principal Occupation(s) During Past
Five Years | | Number of
Portfolios in Fund Complex Overseen by
Director | | Other Board Memberships Held by
Director |
| Officers: | | | | | | | | |
Frances M. Guggino Legg Mason 125 Broad Street 10th Floor New York, NY 10004 Birth Year: 1957 | | Chief Financial Officer and Treasurer | | Since
2006 | | Director of Legg Mason; Chief Financial Officer and Treasurer of certain mutual funds associated with Legg Mason | | N/A | | N/A |
| | | | | |
Ted P. Becker Legg Mason 399 Park Avenue 4th Floor New York, NY 10022 Birth Year: 1951 | | Chief Compliance Officer | | Since
2006 | | Director of Global Compliance at Legg Mason (since 2006) Chief Compliance Officer of LMPFA (since 2006); Managing Director of Compliance at Legg Mason (2005 Present); Chief Compliance Officer with certain mutual funds associated with Legg Mason (since 2006); Managing Director of Compliance at Legg Mason or its predecessor (2002-2005); Prior to 2002, Managing Director – Internal Audit & Risk Review at Citigroup, Inc. | | N/A | | N/A |
| | | | | |
Alan J. Blake ClearBridge Advisors, LLC (“ClearBridge Advisors”) 399 Park Avenue
4th Floor New York, NY 10022 Birth Year: 1949 | | Vice President and Investment Officer | | Since
1998 | | Managing Director of Legg Mason and Investment Officer of certain mutual funds associated with Legg Mason | | N/A | | N/A |
| | | | | |
Richard A. Freeman ClearBridge Advisors 399 Park Avenue New York, NY 10022 Birth Year: 1953 | | Vice President and Investment Officer | | Since
1999 | | Managing Director of Legg Mason and Investment Officer of certain mutual funds associated with Legg Mason | | N/A | | N/A |
Legg Mason Partners Variable Portfolios III, Inc. 85
Additional Information (unaudited) (continued)
| | | | | | | | | | |
| | | | | |
| Name, Address, and Birth Year | | Position(s) Held with Fund | | Term of Office* and Length of Time Served | | Principal Occupation(s) During Past
Five Years | | Number of
Portfolios in Fund Complex Overseen by
Director | | Other Board Memberships Held by
Director |
Robert Feitler ClearBridge Advisors 399 Park Avenue
4th Floor New York, NY 10022 Birth Year: 1960 | | Vice President and Investment Officer | | Since
2004 | | Director of Legg Mason and Investment Officer of certain mutual funds associated with Legg Mason | | N/A | | N/A |
| | | | | |
Mark J. McAllister, CFA ClearBridge Advisors 399 Park Avenue 4th Floor New York, NY 10022 Birth Year: 1962 | | Vice President and Investment Officer | | Since
2004 | | Managing Director of Legg Mason and Investment Officer of certain mutual funds associated with Legg Mason | | N/A | | N/A |
| | | | | |
Jeffrey J. Russell ClearBridge Advisors 399 Park Avenue 4th Floor New York, NY 10022 Birth Year: 1957 | | Vice President and Investment Officer | | Since
1994 | | Managing Director of Legg Mason and Investment Officer of certain mutual funds associated with Legg Mason | | N/A | | N/A |
| | | | | |
Brian Angerame
ClearBridge Advisors 399 Park Avenue
New York, NY 10022
Birth Year: 1972 | | Vice President and Investment Officer | | Since
2005 | | Director of Legg Mason; Formerly Portfolio manager of Prudential Investment Management (from 1997 to 2000) | | N/A | | N/A |
| | | | | |
Derek Deutsch, CFA
ClearBridge Advisors 399 Park Avenue
New York, NY 10022
Birth Year: 1969 | | Vice President and Investment Officer | | Since
2005 | | Director of Legg Mason and Investment Officer of certain mutual funds associated with Legg Mason | | N/A | | N/A |
| | | | | |
John Chiota Legg Mason 300 First Stamford Place 4th Floor Stamford, CT 06902 Birth Year: 1968 | | Chief Anti-Money Laundering Compliance Officer | | Since
2006 | | Vice President of Legg Mason or its predecessor (since 2004); Chief Anti-Money Laundering Compliance Officer with certain mutual funds associated with Legg Mason (since 2006); Prior to August 2004, Chief AML Compliance Officer with TD Waterhouse | | N/A | | N/A |
86 Legg Mason Partners Variable Portfolios III, Inc.
Additional Information (unaudited) (continued)
| | | | | | | | | | |
| | | | | |
| Name, Address, and Birth Year | | Position(s) Held with Fund | | Term of Office* and Length of Time Served | | Principal Occupation(s) During Past
Five Years | | Number of
Portfolios in Fund Complex Overseen by
Director | | Other Board Memberships Held by
Director |
Robert I. Frenkel Legg Mason 300 First Stamford Place 4th Floor Stamford, CT 06902 Birth Year: 1954 | | Secretary and Chief Legal Officer | | Since 2003 | | Managing Director and General Counsel of Global Mutual Funds for Legg Mason and its predecessors (since 1994); Secretary and Chief Legal Officer of mutual funds associated with Legg Mason (since 2003); formerly, Secretary of CFM (from 2001 to 2004) | | N/A | | N/A |
| * | | Each Director and officer serves until his or her successor has been duly elected and qualified. |
| ** | | Mr. Gerken is an “interested person” of the Funds as defined in the Investment Company Act of 1940, as amended, because Mr. Gerken is an officer of LMPFA and certain of its affiliates. |
Legg Mason Partners Variable Portfolios III, Inc. 87
Additional Shareholder Information (unaudited)
Results of Special Meetings of Shareholders
On October 19, 2006, a Special Meeting of Shareholders was held to approve an Agreement and Plan of Reorganization, providing for (i) the acquisition of all of the assets and the assumption of all of the liabilities of the Legg Mason Partners Variable Large Cap Value Portfolio, a series of Legg Mason Partners Variable Portfolios III, Inc. (the “Acquired Fund”), in exchange for shares of the corresponding Legg Mason Partners Variable Investors Value Portfolio, a series of Legg Mason Partners Variable Portfolios I, Inc. (the “Acquiring Fund”) to be distributed to the shareholders of the Acquired Fund and (ii) the subsequent termination of the Acquired Fund. The following table provides the number of votes cast for, against or withheld, as well as the number of abstentions and broker non-votes for the matter voted on at the Special Meeting of Shareholders.
Agreement and Plan of Reorganization
| | | | | | | | |
| Fund | | Votes For | | Votes Against | | Abstentions | | Broker
Non-Votes |
Legg Mason Partners Variable Large Cap Value Portfolio | | 12,244,908.128 | | 448,397.770 | | 1,303,765.051 | | 0.000 |
| |
On December 11, 2006, a Special Meeting of Shareholders was held to vote on various proposals recently approved by the Funds’ Board Members. The following tables provide the number of votes cast for, against or withheld, as well as the number of abstentions and broker non-votes as to the following proposals: (1) Elect Board Members, (2) Revise Fundamental Investment Policies, and (3) Approve New Sub-Advisory Agreement.
Proposal 1: Elect Board Members.†
| | | | | | | | |
| Item Voted On | | Votes For | | Votes Against | | Abstentions | | Broker
Non-Votes |
Nominees: | | | | | | | | |
Paul R Ades | | 627,038,784.337 | | 28,077,775.512 | | 0.000 | | 0.000 |
Andrew L. Breech | | 627,196,957.837 | | 27,919,602.012 | | 0.000 | | 0.000 |
Dwight B. Crane | | 626,833,724.086 | | 28,282,835.763 | | 0.000 | | 0.000 |
Robert M. Frayn, Jr. | | 626,781,438.698 | | 28,335,121.151 | | 0.000 | | 0.000 |
Frank G. Hubbard | | 626,978,109.222 | | 28,138,450.627 | | 0.000 | | 0.000 |
Howard J. Johnson | | 626,924,564.456 | | 28,191,995.393 | | 0.000 | | 0.000 |
David E. Maryatt | | 626,906,972.055 | | 28,209,587.794 | | 0.000 | | 0.000 |
Jerome H. Miller | | 627,150,693.392 | | 27,965,866.457 | | 0.000 | | 0.000 |
Ken Miller | | 627,176,821.935 | | 27,939,737.914 | | 0.000 | | 0.000 |
John J. Murphy | | 626,472,532.788 | | 28,644,027.061 | | 0.000 | | 0.000 |
Thomas F. Schlafly | | 627,140,091.304 | | 27,976,468.545 | | 0.000 | | 0.000 |
Jerry A. Viscione | | 626,511,106.887 | | 28,605,452.962 | | 0.000 | | 0.000 |
R. Jay Gerken, CFA | | 626,765,585.797 | | 28,350,974.052 | | 0.000 | | 0.000 |
| |
| † | | Board Members are elected by the shareholders of all of the series of the Company of which the Fund is a series. |
88 Legg Mason Partners Variable Portfolios III, Inc.
Additional Shareholder Information (unaudited) (continued)
Proposal 2: Revise Fundamental Investment Policies.
| | | | | | | | |
| Items Voted On | | Votes For | | Votes Against | | Abstentions | | Broker
Non-Votes |
Legg Mason Variable Large Cap Value Portfolio | | | | |
Borrowing Money | | 12,987,435.793 | | 313,032.538 | | 451,639.667 | | 0.000 |
Underwriting | | 13,000,656.775 | | 300,332.195 | | 451,119.028 | | 0.000 |
Lending | | 12,942,094.920 | | 302,676.657 | | 507,336.421 | | 0.000 |
Issuing Senior Securities | | 12,940,674.270 | | 278,518.921 | | 532,914.807 | | 0.000 |
Real Estate | | 12,916,480.266 | | 313,531.822 | | 522,095.910 | | 0.000 |
Commodities | | 12,982,122.851 | | 316,881.952 | | 453,103.195 | | 0.000 |
Concentration | | 12,987,320.210 | | 258,593.599 | | 506,194.189 | | 0.000 |
Diversification | | 12,932,039.391 | | 303,305.888 | | 516,762.719 | | 0.000 |
Non-Fundamental | | 12,863,332.427 | | 380,512.770 | | 508,262.801 | | 0.000 |
| |
| | | | | | | | |
| Items Voted On | | Votes For | | Votes Against | | Abstentions | | Broker
Non-Votes |
Legg Mason Variable Large Cap Growth Portfolio | | |
Borrowing Money | | 21,040,942.081 | | 410,176.643 | | 558,088.215 | | 0.000 |
Underwriting | | 21,135,850.087 | | 327,212.398 | | 546,144.454 | | 0.000 |
Lending | | 21,123,397.421 | | 349,407.122 | | 536,402.396 | | 0.000 |
Issuing Senior Securities | | 21,110,274.391 | | 362,878.859 | | 536,053.689 | | 0.000 |
Real Estate | | 21,117,104.712 | | 326,120.930 | | 565,981.297 | | 0.000 |
Commodities | | 20,928,684.622 | | 454,653.216 | | 625,869.101 | | 0.000 |
Concentration | | 21,071,820.261 | | 370,657.880 | | 566,728.798 | | 0.000 |
Diversification | | 20,995,539.906 | | 410,098.816 | | 603,568.217 | | 0.000 |
Non-Fundamental | | 20,941,592.732 | | 509,559.282 | | 558,054.925 | | 0.000 |
| |
| | | | | | | | |
| Items Voted On | | Votes For | | Votes Against | | Abstentions | | Broker
Non-Votes |
Legg Mason Variable Mid Cap Core Portfolio | | | | |
Borrowing Money | | 7,434,577.319 | | 141,070.893 | | 167,738.038 | | 0.000 |
Underwriting | | 7,448,911.872 | | 117,125.768 | | 177,348.610 | | 0.000 |
Lending | | 7,447,944.493 | | 134,289.673 | | 161,152.084 | | 0.000 |
Issuing Senior Securities | | 7,478,716.917 | | 113,199.376 | | 151,469.957 | | 0.000 |
Real Estate | | 7,445,182.615 | | 131,330.525 | | 166,873.110 | | 0.000 |
Commodities | | 7,459,185.458 | | 132,113.385 | | 152,087.407 | | 0.000 |
Concentration | | 7,430,944.581 | | 132,801.635 | | 179,640.034 | | 0.000 |
Diversification | | 7,456,724.253 | | 119,556.159 | | 167,105.838 | | 0.000 |
Non-Fundamental | | 7,396,080.656 | | 182,402.179 | | 164,903.415 | | 0.000 |
| |
Legg Mason Partners Variable Portfolios III, Inc. 89
Additional Shareholder Information (unaudited) (continued)
| | | | | | | | |
| Items Voted On | | Votes For | | Votes Against | | Abstentions | | Broker
Non-Votes |
Legg Mason Variable Aggressive Growth Portfolio | | | | |
Borrowing Money | | 71,260,181.400 | | 1,953,177.357 | | 1,525,434.703 | | 0.000 |
Underwriting | | 71,466,586.119 | | 1,681,256.469 | | 1,590,950.872 | | 0.000 |
Lending | | 71,449,270.656 | | 1,809,383.436 | | 1,480,139.368 | | 0.000 |
Issuing Senior Securities | | 71,657,494.682 | | 1,567,708.649 | | 1,513,590.129 | | 0.000 |
Real Estate | | 71,694,934.556 | | 1,478,536.964 | | 1,565,321.940 | | 0.000 |
Commodities | | 71,550,555.670 | | 1,565,938.760 | | 1,622,299.030 | | 0.000 |
Concentration | | 71,452,027.950 | | 1,630,496.603 | | 1,656,268.907 | | 0.000 |
Diversification | | 71,348,810.842 | | 1,711,998.719 | | 1,677,983.899 | | 0.000 |
Non-Fundamental | | 71,003,874.880 | | 2,052,744.392 | | 1,682,174.188 | | 0.000 |
| |
| | | | | | | | |
| Items Voted On | | Votes For | | Votes Against | | Abstentions | | Broker
Non-Votes |
Legg Mason Variable International All Cap Growth Portfolio | | |
Borrowing Money | | 9,591,601.238 | | 322,452.090 | | 311,876.433 | | 0.000 |
Underwriting | | 9,557,762.883 | | 340,784.035 | | 327,382.843 | | 0.000 |
Lending | | 9,356,699.175 | | 390,938.151 | | 298,292.435 | | 0.000 |
Issuing Senior Securities | | 9,567,112.419 | | 339,554.655 | | 319,262.687 | | 0.000 |
Real Estate | | 9,615,707.081 | | 296,459.676 | | 313,764.004 | | 0.000 |
Commodities | | 9,541,879.211 | | 387,569.246 | | 296,481.304 | | 0.000 |
Concentration | | 9,553,401.161 | | 333,143.004 | | 339,385.596 | | 0.000 |
Diversification | | 9,539,844.678 | | 382,970.273 | | 303,114.810 | | 0.000 |
Non-Fundamental | | 9,499,090.124 | | 393,823.060 | | 333,016.577 | | 0.000 |
| |
Proposal 3: Approve a New Sub-Advisory Agreement
| | | | | | | | |
| Fund | | Votes For | | Votes Against | | Abstentions | | Broker
Non-Votes |
Legg Mason Variable International All Cap Growth Portfolio | | 9,583,617.726 | | 325,760.948 | | 316,551.087 | | 0.000 |
| |
90 Legg Mason Partners Variable Portfolios III, Inc.
Important Tax Information (unaudited)
The following information is provided with respect to the distributions paid during the taxable year ended October 31, 2006:
| | | | | | | | | | | | |
| | | |
| | | Legg Mason
Partners Variable
Large Cap Value
Portfolio | | | Legg Mason
Partners Variable
Large Cap Growth
Portfolio | | | Legg Mason
Partners Variable
Mid Cap Core
Portfolio | |
Record Date: | | | 12/27/2005 | | | | 12/27/2005 | | | | 12/27/2005 | |
Payable Date | | | 12/28/2005 | | | | 12/28/2005 | | | | 12/28/2005 | |
| | |
Ordinary Income: | | | | | | | | | | | | |
Dividends Qualifying for the Dividends Received Deduction for Corporations | | | 100.00 | % | | | 100.00 | % | | | 100.00 | % |
| | |
Long-Term Capital Gain Dividends | | $ | — | | | $ | — | | | $ | 1.119951 | |
| | |
| | | |
| | | Legg Mason
Partners Variable
Aggressive Growth
Portfolio | | | Legg Mason
Partners Variable
International All
Cap Growth
Portfolio | | | | |
Record Date: | | | 12/27/2005 | | | | 12/27/2005 | | | | | |
Payable Date | | | 12/28/2005 | | | | 12/28/2005 | | | | | |
| | |
Foreign Source Income | | | — | | | | 73.47 | %* | | | | |
| | |
Foreign Taxes Paid Per Share | | $ | — | | | $ | 0.008424 | | | | | |
| | |
Long-Term Capital Gain Dividend | | $ | 0.000429 | | | $ | — | | | | | |
| | |
| * | | Expressed as a percentage of the cash distribution grossed-up for foreign taxes. |
The foreign taxes paid represent taxes incurred by the Fund on income received by the Fund from foreign sources. Foreign taxes paid may be included in taxable income with an offsetting deduction from gross income or may be taken as a credit for taxes paid to foreign governments. You should consult your tax adviser regarding the appropriate treatment of foreign taxes paid.
Please retain this information for your records.
Legg Mason Partners Variable Portfolios III, Inc. 91
Legg Mason Partners Variable Portfolios III, Inc.
| | |
DIRECTORS Robert A. Frankel Michael E. Gellert R. Jay Gerken, CFA Chairman Rainer Greeven Susan M. Heilbron | | INVESTMENT MANAGER Legg Mason Partners Fund Advisor, LLC SUBADVISER ClearBridge Advisors, LLC DISTRIBUTORS Citigroup Global Markets Inc. Legg Mason Investor Services, LLC CUSTODIAN State Street Bank and Trust
Company ANNUITY ADMINISTRATION Travelers Annuity Investor Services One Cityplace Hartford, CT 06103-3415 TRANSFER AGENT PFPC Inc. 4400 Computer Drive Westborough, Massachusetts 01581 INDEPENDENT REGISTERED PUBLIC ACCOUNTING FIRM KPMG LLP 345 Park Avenue New York, New York 10154 |
This report is submitted for the general information of the shareholders of the Legg Mason Partners Variable Portfolios III, Inc. — Legg Mason Partners Variable Large Cap Value Portfolio, Legg Mason Partners Variable Large Cap Growth Portfolio, Legg Mason Partners Variable Mid Cap Core Portfolio, Legg Mason Partners Variable Aggressive Growth Portfolio and Legg Mason Partners Variable International All Cap Growth Portfolio.
This report must be preceded or accompanied by a free prospectus. Investors should consider the Funds’ investment objectives, risks, charges and expenses before investing. The prospectus contains this and other important information about the Funds. Please read the prospectus carefully before investing.
www.leggmason.com/InvestorServices
©2006 Legg Mason Investor Services, LLC Member NASD, SIPC
Legg Mason Partners Variable Portfolios III, Inc.
Legg Mason Partners Variable Large Cap Value Portfolio
Legg Mason Partners Variable Large Cap Growth Portfolio
Legg Mason Partners Variable Mid Cap Core Portfolio
Legg Mason Partners Variable Aggressive Growth Portfolio
Legg Mason Partners Variable International All Cap Growth Portfolio
The Funds are separate investment funds of the Legg Mason Partners Variable Portfolios III, Inc., a Maryland corporation.
LEGG MASON PARTNERS VARIABLE PORTFOLIOS III, INC.
Legg Mason Partners Funds
125 Broad Street
10th Floor, MF-2
New York, New York 10004
The Funds file their complete schedule of portfolio holdings with the Securities and Exchange Commission for the first and third quarters of each fiscal year on Form N-Q. The Funds’ Forms N-Q are available on the Commission’s website at www.sec.gov. The Funds’ Forms N-Q may be reviewed and copied at the Commission’s Public Reference Room in Washington D.C., and information on the operation of the Public Reference Room may be obtained by calling 1-800-SEC-0330. To obtain information on Form N-Q from the Funds, shareholders can call Legg Mason Partners Shareholder Services at 1-800-451-2010.
Information an how the Funds voted proxies relating to portfolio securities during the prior 12 month period ended June 30th of each year and a description of the policies and procedures that the Funds use to determine how to vote proxies related to portfolio transactions is available (1) without charge, upon request, by calling 1-800-451-2010, (2) on each Fund’s website at www.leggmason.com/InvestorServices and (3) on the SEC’s website at www.sec.gov.
The registrant has adopted a code of ethics that applies to the registrant’s principal executive officer, principal financial officer, principal accounting officer or controller.
| ITEM 3. | AUDIT COMMITTEE FINANCIAL EXPERT. |
The Board of Directors of the registrant has determined that Robert A. Frankel, the Chairman of the Board’s Audit Committee, possesses the technical attributes identified in Instruction 2(b) of Item 3 to Form N-CSR to qualify as an “audit committee financial expert,” and has designated Mr. Frankel as the Audit Committee’s financial expert. Mr. Frankel is an “independent” Director pursuant to paragraph (a)(2) of Item 3 to Form N-CSR.
| ITEM 4. | PRINCIPAL ACCOUNTANT FEES AND SERVICES. |
a) Audit Fees. The aggregate fees billed in the last two fiscal years ending October 31, 2005 and October 31, 2006 (the “Reporting Periods”) for professional services rendered by the Registrant’s principal accountant (the “Auditor”) for the audit of the Registrant’s annual financial statements, or services that are normally provided by the Auditor in connection with the statutory and regulatory filings or engagements for the Reporting Periods, were $177,500 in 2005 and $207,000 in 2006.
b) Audit-Related Fees. There were no fees billed in the Reporting Periods for assurance and related services by the Auditor that are reasonably related to the performance of the audit of the Registrant’s financial statements and are not reported under paragraph (a) of this Item 4.
In addition, there were no Audit-Related Fees billed in the Reporting Period for assurance and related services by the Auditor to the Registrant’s investment adviser (not including any sub-adviser whose role is primarily portfolio management and is subcontracted with or overseen by another investment adviser), and any entity controlling, controlled by or under common control with the investment adviser that provides ongoing services to the Legg Mason Partners Variable Portfolio III (“service affiliates”), that were reasonably related to the performance of the annual audit of the service affiliates. Accordingly, there were no such fees that required pre-approval by the Audit Committee for the Reporting Periods (prior to May 6, 2003 services provided by the Auditor were not required to be pre-approved).
(c) Tax Fees. The aggregate fees billed in the Reporting Periods for professional services rendered by the Auditor for tax compliance, tax advice and tax planning (“Tax Services”) were $37,500 in 2005 and $4,400 in 2006. These services consisted of (i) review or preparation of U.S. federal, state, local and excise tax returns; (ii) U.S. federal, state and local tax planning, advice and assistance regarding statutory, regulatory or administrative developments, and (iii) tax advice regarding tax qualification matters and/or treatment of various financial instruments held or proposed to be acquired or held.
There were no fees billed for tax services by the Auditors to service affiliates during the Reporting Periods that required pre-approval by the Audit Committee.
d) All Other Fees. There were no other fees billed in the Reporting Periods for products and services provided by the Auditor, other than the services reported in paragraphs (a) through (c) of this Item for the Legg Mason Partners Variable Portfolio III
All Other Fees. There were no other non-audit services rendered by the Auditor to Smith Barney Fund Management LLC (“SBFM”), and any entity controlling, controlled by or under common control with SBFM that provided ongoing services to Legg Mason Partners Variable Portfolio III requiring pre-approval by the Audit Committee in the Reporting Period.
(e) Audit Committee’s pre–approval policies and procedures described in paragraph (c) (7) of Rule 2-01 of Regulation S-X.
(1) The Charter for the Audit Committee (the “Committee”) of the Board of each registered investment company (the “Fund”) advised by Smith Barney Fund Management LLC or Salomon Brothers Asset Management Inc. or one of their affiliates (each, an “Adviser”) requires that the Committee shall approve (a) all audit and permissible non-audit services to be provided to the Fund and (b) all permissible non-audit services to be provided by the Fund’s independent auditors to the Adviser and any Covered Service Providers if the engagement relates directly to the operations and financial reporting of the Fund. The Committee may implement policies and procedures by which such services are approved other than by the full Committee.
The Committee shall not approve non-audit services that the Committee believes may impair the independence of the auditors. As of the date of the approval of this Audit Committee Charter, permissible non-audit services include any professional services (including tax services), that are not prohibited services as described below, provided to the Fund by the independent auditors, other than those provided to the Fund in connection with an audit or a review of the financial statements of the Fund. Permissible non-audit services may not include: (i) bookkeeping or other services related to the accounting records or financial statements of the Fund; (ii) financial information systems design and implementation; (iii) appraisal or valuation services, fairness opinions or contribution-in-kind reports; (iv) actuarial services; (v) internal audit outsourcing services; (vi) management functions or human resources; (vii) broker or dealer, investment adviser or investment banking services; (viii) legal services and expert services unrelated to the audit; and (ix) any other service the Public Company Accounting Oversight Board determines, by regulation, is impermissible.
Pre-approval by the Committee of any permissible non-audit services is not required so long as: (i) the aggregate amount of all such permissible non-audit services provided to the Fund, the Adviser and any service providers controlling, controlled by or under common control with the Adviser that provide ongoing services to the Fund (“Covered Service Providers”) constitutes not more than 5% of the total amount of revenues paid to the independent auditors during the fiscal year in which the permissible non-audit services are provided to (a) the Fund, (b) the Adviser and (c) any entity controlling, controlled by or under common control with the Adviser that provides ongoing services to the Fund during the fiscal year in which the services are provided that would have to be approved by the Committee; (ii) the permissible non-audit services were not recognized by the Fund at the time of the engagement to be non-audit services; and (iii) such services are promptly brought to the attention of the Committee and approved by the Committee (or its delegate(s)) prior to the completion of the audit.
(2) For the Legg Mason Partners Variable Portfolio III, the percentage of fees that were approved by the audit committee, with respect to: Audit-Related Fees were 100% and 0% for 2005 and 2006; Tax Fees were 100% and 0% for 2005 and 2006; and Other Fees were 100% and 0% for 2005 and 2006.
(f) N/A
(g) Non-audit fees billed by the Auditor for services rendered to Legg Mason Partners Variable Portfolio III and CAM and any entity controlling, controlled by, or under common control with CAM that provides ongoing services to Legg Mason Partners Variable Portfolio III during the reporting period were $0 in 2006 for fees related to the transfer agent matter as fully described in the notes the financial statements titled “additional information” and $75,000 for 2005.
(h) Yes. Legg Mason Partners Variable Portfolio III’s Audit Committee has considered whether the provision of non-audit services that were rendered to Service Affiliates which were not pre-approved (not requiring pre-approval) is compatible with maintaining the Accountant’s independence. All services provided by the Auditor to the Legg Mason Partners Variable Portfolio III or to Service Affiliates, which were required to be pre-approved, were pre-approved as required.
| ITEM 5. | AUDIT COMMITTEE OF LISTED REGISTRANTS. |
Not applicable.
| ITEM 6. | SCHEDULE OF INVESTMENTS. |
Included herein under Item 1.
| ITEM 7. | DISCLOSURE OF PROXY VOTING POLICIES AND PROCEDURES FOR CLOSED-END MANAGEMENT INVESTMENT COMPANIES. |
Not applicable.
| ITEM 8. | PORTFOLIO MANAGERS OF CLOSED-END MANAGEMENT INVESTMENT COMPANIES. |
Not applicable.
| ITEM 9. | PURCHASES OF EQUITY SECURITIES BY CLOSED-END MANAGEMENT INVESTMENT COMPANY AND AFFILIATED PURCHASERS. |
Not applicable.
| ITEM 10. | SUBMISSION OF MATTERS TO A VOTE OF SECURITY HOLDERS. |
Not applicable.
| ITEM 11. | CONTROLS AND PROCEDURES. |
| | (a) | The registrant’s principal executive officer and principal financial officer have concluded that the registrant’s disclosure controls and procedures (as defined in Rule 30a- 3(c) under the Investment Company Act of 1940, as amended (the “1940 Act”)) are effective as of a date within 90 days of the filing date of this report that includes the disclosure required by this paragraph, based on their evaluation of the disclosure controls and procedures required by Rule 30a-3(b) under the 1940 Act and 15d-15(b) under the Securities Exchange Act of 1934. |
| | (b) | There were no changes in the registrant’s internal control over financial reporting (as defined in Rule 30a-3(d) under the 1940 Act) that occurred during the registrant’s last fiscal half-year (the registrant’s second fiscal half-year in the case of an annual report) that have materially affected, or are likely to materially affect the registrant’s internal control over financial reporting. |
| | |
| (a)(1) | | Code of Ethics attached hereto. |
| |
| | Exhibit 99.CODE ETH |
| |
| (a)(2) | | Certifications pursuant to section 302 of the Sarbanes-Oxley Act of 2002 attached hereto. |
| |
| | Exhibit 99.CERT |
| |
| (b) | | Certifications pursuant to Section 906 of the Sarbanes-Oxley Act of 2002 attached hereto. |
| |
| | Exhibit 99.906CERT |
SIGNATURES
Pursuant to the requirements of the Securities Exchange Act of 1934 and the Investment Company Act of 1940, the registrant has duly caused this Report to be signed on its behalf by the undersigned, there unto duly authorized.
| | |
| Legg Mason Partners Variable Portfolios III, Inc. |
| |
| By: | | /s/ R. Jay Gerken |
| | R. Jay Gerken |
| | Chief Executive Officer of |
| | Legg Mason Partners Variable Portfolios III, Inc. |
| |
| Date: | | January 8, 2007 |
Pursuant to the requirements of the Securities Exchange Act of 1934 and the Investment Company Act of 1940, this report has been signed below by the following persons on behalf of the registrant and in the capacities and on the dates indicated.
| | |
| By: | | /s/ R. Jay Gerken |
| | R. Jay Gerken |
| | Chief Executive Officer of |
| | Legg Mason Partners Variable Portfolios III, Inc. |
| |
| Date: | | January 8, 2007 |
| |
| By: | | /s/ Frances M. Guggino |
| | Frances M. Guggino |
| | Chief Financial Officer of |
| | Legg Mason Partners Variable Portfolios III, Inc. |
| |
| Date: | | January 8, 2007 |