UNITED STATES
SECURITIES AND EXCHANGE COMMISSION
Washington, D.C. 20549
FORM N-CSR
CERTIFIED SHAREHOLDER REPORT OF REGISTERED
MANAGEMENT INVESTMENT COMPANIES
Investment Company Act file number 811-8372
Legg Mason Partners Variable Portfolios III, Inc.
(Exact name of registrant as specified in charter)
| | |
| 125 Broad Street, New York, NY | | 10004 |
| |
| (Address of principal executive offices) | | (Zip code) |
Robert I. Frenkel, Esq.
Legg Mason & Co., LLC
300 First Stamford Place, 4th Fl.
Stamford, CT 06902
(Name and address of agent for service)
Registrant’s telephone number, including area code: (800) 451-2010
Date of fiscal year end: October 31
Date of reporting period: October 31, 2006
| ITEM 1. | REPORT TO STOCKHOLDERS. |
The Annual Report to Stockholders is filed herewith.
ANNUAL REPORT
OCTOBER 31, 2006

Legg Mason Partners
Variable Adjustable Rate
Income Portfolio
Legg Mason Partners Variable
High Income Portfolio
INVESTMENT PRODUCTS: NOT FDIC INSURED Ÿ NO BANK GUARANTEE Ÿ MAY LOSE VALUE
Legg Mason Partners Variable Adjustable Rate Income Portfolio
Legg Mason Partners Variable High Income Portfolio
Annual Report • October 31, 2006
What’s
Inside

R. JAY GERKEN, CFA
Chairman, President and Chief Executive Officer
Letter from the Chairman
Dear Shareholder,
While the U.S. economy continued to expand, it weakened considerably as the reporting period progressed. After expanding 4.1% in the third quarter of 2005, gross domestic product (“GDP”)i increased a modest 1.7% during the last three months of the year. The economy then rebounded sharply in the first quarter of 2006. Over this period, GDP rose 5.6%, its highest reading since the third quarter of 2003. The economy then took a step backwards in the second quarter of 2006, as GDP growth was 2.6%, according to the U.S. Commerce Department. The preliminary estimate for third quarter GDP growth was 2.2%.
After increasing the federal funds rateii to 5.25% in June-its 17th consecutive rate hike-the Federal Reserve Board (“Fed”)iii paused from raising rates at its next four meetings. In its statement accompanying the December meeting, the Fed stated, “Economic growth has slowed over the course of the year, partly reflecting a substantial cooling of the housing market. Although recent indicators have been mixed, the economy seems likely to expand at a moderate pace on balance over coming quarters.” The Fed’s next meeting is at the end of January, and we believe any further rate movements will likely be data dependent.
Both short- and long-term yields rose over the reporting period. However, after peaking in late June—with two-year and 10-year Treasuries hitting 5.29% and 5.25%, respectively—rates fell sharply as the Fed paused from its tightening cycle. In addition, inflationary pressures eased as oil prices, which rose to a record $78 a barrel in mid-July, fell 15% in the latter part of the third quarter.iv Overall, during the 12 months ended October 31, 2006, two-year Treasury yields increased from 4.40% to 4.71%. Over the same period, 10-year Treasury yields moved from 4.57% to 4.61%. Looking at the 12-month period as a whole, the overall bond market, as measured by the Lehman Brothers U.S. Aggregate Indexv, returned 5.19%.
Legg Mason Partners Variable Portfolios III, Inc. I
Strong corporate profits and low default rates helped high yield bonds generate positive returns during the reporting period. While there were several high profile company specific issues, mostly in the automobile industry, they were not enough to drag down the overall high yield market. During the 12-month period ended October 31, 2006, the Citigroup High Yield Market Indexvi returned 9.95%.
Despite periods of weakness, emerging markets debt generated strong results over the 12-month period, as the JPMorgan Emerging Markets Bond Index Globalvii returned 11.45%. An expanding global economy, solid domestic spending and a pause in U.S. interest rate hikes supported many emerging market countries.
Within this environment, the Portfolios performed as follows:
| | | | |
| Performance Snapshot as of October 31, 2006 (unaudited) |
| | |
| | | 6 months | | 12 months |
Variable Adjustable Rate Income Portfolio1 | | 2.29% | | 4.09% |
| |
Citigroup 6-Month U.S. Treasury Bill Index | | 2.47% | | 4.56% |
| |
Lipper Variable Short-Intermediate Investment Grade
Debt Funds Category Average | | 2.78% | | 4.32% |
| |
Variable High Income Portfolio1 | | 3.79% | | 9.37% |
| |
Citigroup High Yield Market Index | | 5.16% | | 9.95% |
| |
Lipper Variable High Current Yield Funds Category Average | | 3.97% | | 9.18% |
| |
| The performance shown represents past performance. Past performance is no guarantee of future results and current performance may be higher or lower than the performance shown above. Principal value and investment returns will fluctuate and investors’ shares, when redeemed, may be worth more or less than their original cost. |
| Performance figures reflect reimbursements and/or fee waivers, without which the performance would have been lower. |
| Portfolio returns assume the reinvestment of all distributions including returns of capital, if any, at net asset value and the deduction of all Portfolio expenses. |
| Lipper, Inc. is a major independent mutual-fund tracking organization. Returns are based on the period ended October 31, 2006 and include the reinvestment of distributions, if any, calculated among the 39 funds for the six-month period and among the 37 funds for the 12-month period in the Lipper Variable Short-Intermediate Investment Grade Debt Funds category. Returns were calculated among the 108 funds for the six-month period and among the 104 funds for the 12-month period in the Lipper Variable High Current Yield Funds category. |
| 1 | | The Portfolio is an underlying investment option of various variable annuity and variable life insurance products. The Portfolio’s performance returns do not reflect the deduction of initial sales charges and expenses imposed in connection with investing in variable annuity or variable life insurance contracts, such as administrative fees, account charges, and surrender charges, which, if reflected, would reduce the performance of the Portfolio. Past performance is no guarantee of future results. |
II Legg Mason Partners Variable Portfolios III, Inc.
Please read on for a more detailed look at prevailing economic and market conditions during the Portfolios’ fiscal year and to learn how those conditions have affected each Portfolio’s performance.
Special Shareholder Notices
As part of the continuing effort to integrate investment products managed by the advisers acquired with Citigroup Inc.’s asset management business, Legg Mason, Inc. (“Legg Mason”) recommended various Portfolio actions in order to streamline product offerings, eliminate redundancies and improve efficiencies within the organization. At Board meetings held during June and July 2006, the Portfolios’ Board reviewed and approved these recommendations, and provided authorization to move ahead with proxy solicitations for those matters needing shareholder approval.
Effective August 1, 2006, Legg Mason Partners Fund Advisor, LLC (“LMPFA”) became each Portfolio’s investment manager and Western Asset Management Company (“Western Asset”) became each Portfolio’s subadviser. The portfolio managers who are responsible for the day-to-day management of the Portfolios remain the same immediately prior to and immediately after the date of these changes. LMPFA and Western Asset are wholly-owned subsidiaries of Legg Mason.
Legg Mason Partners Variable Adjustable Rate Portfolio
The Portfolio’s Board approved a number of changes in the way the Portfolio will be managed, effective December 1, 2006. The Portfolio will continue to invest, under normal circumstances, at least 80% of the value of its net assets in adjustable rate securities and up to 20% of its net assets in fixed income securities. However, under the revised investment strategy, the Portfolio will be permitted to invest up to 20% of its net assets, including any borrowings in investments that are rated below investment grade or, if unrated, deemed to be of comparable credit quality by the Portfolio’s subadviser. In addition, the Portfolio may invest in bank loan instruments, including those rated below investment
Legg Mason Partners Variable Portfolios III, Inc. III
grade. The Portfolio’s investment objective remains unchanged. Because of the Portfolio’s revised investment strategy, the Portfolio will be subject to additional risks. Please see the current prospectus for more information on these and other risks.
The Portfolio was formerly known as Travelers Series Fund Inc.—SB Adjustable Rate Income Portfolio.
Legg Mason Partners Variable High Income Portfolio
The Portfolio was previously known as Travelers Series Fund Inc.—Smith Barney High Income Portfolio.
Information About Your Portfolios
As you may be aware, several issues in the mutual fund industry have come under the scrutiny of federal and state regulators. Affiliates of the Portfolios’ manager have, in recent years, received requests for information from various government regulators regarding market timing, late trading, fees, and other mutual fund issues in connection with various investigations. The regulators appear to be examining, among other things, the Portfolios’ response to market timing and shareholder exchange activity, including compliance with prospectus disclosure related to these subjects. The Portfolios are not in a position to predict the outcome of these requests and investigations.
Important information with regard to recent regulatory developments that may affect the Portfolios is contained in the Notes to Financial Statements included in this report.
As always, thank you for your confidence in our stewardship of your assets. We look forward to helping you meet your financial goals.
Sincerely,

R. Jay Gerken, CFA
Chairman, President and Chief Executive Officer
December 13, 2006
IV Legg Mason Partners Variable Portfolios III, Inc.
All index performance reflects no deduction for fees, expenses or taxes. Please note that an investor cannot invest directly in an index.
| i | | Gross domestic product is a market value of goods and services produced by labor and property in a given country. |
| ii | | The federal funds rate is the interest rate that banks with excess reserves at a Federal Reserve district bank charge other banks that need overnight loans. |
| iii | | The Federal Reserve Board is responsible for the formulation of a policy designed to promote economic growth, full employment, stable prices, and a sustainable pattern of international trade and payments. |
| iv | | Source: The Wall Street Journal, 9/29/06. |
| v | | The Lehman Brothers U.S. Aggregate Index is a broad-based bond index comprised of government, corporate, mortgage and asset-backed issues, rated investment grade or higher, and having at least one year to maturity. |
| vi | | The Citigroup High Yield Market Index is a broad-based unmanaged index of high yield securities. |
| vii | | The JPMorgan Emerging Markets Bond Index Global tracks total returns for U.S. dollar denominated debt instruments issued by emerging market sovereign and quasi-sovereign entities: Brady bonds, loans, Eurobonds, and local market instruments. Countries covered are Algeria, Argentina, Brazil, Bulgaria, Chile, China, Colombia, Cote d’Ivoire, Croatia, Ecuador, Greece, Hungary, Lebanon, Malaysia, Mexico, Morocco, Nigeria, Panama, Peru, the Philippines, Poland, Russia, South Africa, South Korea, Thailand, Turkey and Venezuela. |
Legg Mason Partners Variable Portfolios III, Inc V
Portfolio Overview
Legg Mason Partners Variable Adjustable Rate Income Portfolio
Q. What were the overall market conditions during the Portfolio’s reporting period?
A. The bond market faced a number of challenges over the period, including six additional short-term interest rate hikes by the Federal Reserve Board (“Fed”)i, inflationary pressures and a continued economic expansion. However, as the period progressed, oil prices fell sharply, a cooling housing market triggered slower economic growth and the Fed paused from raising rates during its meetings in August, September and October 2006. This led to a strong rally in the bond market, with both short- and long-term yields falling sharply. At the end of October, the yield curveii was inverted, as two-year Treasury yields were higher than their 10-year counterparts. Historically, this has often been a precursor of slower economic growth.
Performance Update1
For the 12 months ended October 31, 2006, the Legg Mason Partners Variable Adjustable Rate Income Portfolio returned 4.09%. In comparison, the Portfolio’s unmanaged benchmark, the Citigroup 6-Month U.S. Treasury Bill Indexiii, returned 4.56%, and its Lipper Variable Short-Intermediate Investment Grade Debt Funds Category Average,2 increased 4.32% over the same period.
Q. What were the most significant factors affecting Portfolio performance?
What were the leading contributors to performance?
A. In the first four months of the reporting period, the Portfolio’s adjustable-rate mortgage (“ARMs”) securities enhanced performance, benefiting from the corresponding rate reset that occurred in the wake of the Fed’s “measured” rate short-term hikes. The Portfolio’s ARMs also benefited from improved technical support on diminished supply, with issuance increasingly shifting from hybrid ARMs to fixed rate mortgages as rates rose.
As the reporting period progressed, the Portfolio’s large allocation to mortgage-backed securities enhanced results as spreads contracted slightly and volatility remained low. Within the mortgage-backed sector, the Portfolio’s heavier allocation to FNMA (“Fannie Mae”) bonds versus GNMA (“Ginnie Mae”) bonds enhanced results. The Portfolio’s asset-backed securities also contributed to the performance. Finally, the Portfolio’s duration was slighter longer than its benchmark in the final few months of the reporting period. This positioning was beneficial to performance when interest rates started their decent that began in July (interest rates and bond prices move in the opposite direction).
| 1 | | The Portfolio is an underlying investment option of various variable annuity and variable life insurance products. The Portfolio’s performance returns do not reflect the deduction of initial sales charges and expenses imposed in connection with investing in variable annuity or variable life insurance contracts, such as administrative fees, account charges, and surrender charges, which, if reflected, would reduce the performance of the Portfolio. Past performance is no guarantee of future results. |
| 2 | | Lipper, Inc. is a major independent mutual-fund tracking organization. Returns are based on the 12-month period ended October 31, 2006, including the reinvestment of all distributions, including returns of capital, if any, calculated among the 37 funds in the Portfolio’s Lipper category. |
Legg Mason Partners Variable Portfolios III, Inc. 2006 Annual Report 1
What were the leading detractors from performance?
A. In last two months of 2005 and the first two months of 2006, we overweighted floating-rate securities in an effort to provide stability to the Portfolio’s net asset value. However, this reduced the Portfolio’s overall yield sooner than would otherwise have occurred had we not invested in floating rate securities. In addition, the presence of mortgages in the portfolio detracted from performance versus its 100% U.S. Treasury benchmark.
The Portfolio added a moderate exposure to U.S. Treasury Inflation-Protected Securities (“TIPS”)iv in October, which significantly detracted from results as these securities were adversely affected by diminishing inflation concerns, triggered by a correction in energy prices and a weakening housing market. As mentioned, we moved the Portfolio’s duration to slightly longer than that of the benchmark later in the period. While this was a positive for performance when interest rates fell, it was a negative during periods when economic data was stronger than expected and interest rates rose.
Q. Were there any significant changes to the Portfolio during the reporting period?
A. There were no significant changes to the Portfolio during the reporting period.
Thank you for your investment in the Legg Mason Partners Variable Adjustable Rate Income Portfolio. As ever, we appreciate that you have chosen us to manage your assets and we remain focused on seeking to achieve the Portfolio’s investment goals.
Sincerely,
Western Asset Management Company
November 20, 2006
The information provided is not intended to be a forecast of future events, a guarantee of future results or investment advice. Views expressed may differ from those of the firm as a whole.
RISKS: Keep in mind, the Portfolio is subject to fluctuations in share price as interest rates rise and fall. As interest rates rise, bond prices fall, reducing the value of the Portfolio’s share price. Adjustable rate securities are subject to additional risks such as prepayment risk. The Portfolio may use derivatives, such as options and futures, which can be illiquid, may disproportionately increase losses, and have a potentially large impact on performance. Please see the Portfolio’s prospectus for more information on these and other risks.
All index performance reflects no deduction for fees, expenses or taxes. Please note that an investor cannot invest directly in an index.
| i | | The Federal Reserve Board is responsible for the formulation of a policy designed to promote economic growth, full employment, stable prices, and a sustainable pattern of international trade and payments. |
| ii | | The yield curve is the graphical depiction of the relationship between the yield on bonds of the same credit quality but different maturities. |
| iii | | The Citigroup 6-Month U.S. Treasury Bill Index performance is an average of the last 6-Month Treasury Bill issues. 6-Month U.S. Treasury Bills are guaranteed by the U.S. government and provide a fixed rate of return when held to maturity. |
| iv | | U.S. Treasury Inflation Protected Securities (“TIPS”) are bonds sold at auction and available in 10- or 30-year maturities. TIPS receive a fixed, stated rate of return. But they also increase their principal by the changes in the CPI-U (the non-seasonally adjusted U.S. city average all items consumer price index for all urban consumers, published by the Bureau of Labor Statistics). Investors should note that TIPS, like most fixed income instruments with long maturities, are subject to price risk. |
2 Legg Mason Partners Variable Portfolios III, Inc. 2006 Annual Report
Fund at a Glance (unaudited)
Legg Mason Partners Variable Adjustable Rate Income Portfolio
Legg Mason Partners Variable Portfolios III, Inc. 2006 Annual Report 3
Fund Performance
Legg Mason Partners Variable Adjustable Rate Income Portfolio
| | | |
| Average Annual Total Returns(1) (unaudited) | |
Twelve Months Ended 10/31/06 | | 4.09 | % |
| | |
9/12/03* through 10/31/06 | | 2.32 | |
| | |
| | | |
| Cumulative Total Return(1) (unaudited) | |
9/12/03* through 10/31/06 | | 7.46 | % |
| | |
| (1) | | Assumes reinvestment of all distributions, including returns of capital, if any, at net asset value. All figures represent past performance and are not a guarantee of future results. Investment return and principal value of an investment will fluctuate so that an Investor’s shares, when redeemed, may be worth more or less than their original cost. Total returns do not reflect expenses associated with the separate account such as administrative fees, account charges and surrender charges which, if reflected, would reduce the total returns. Performance figures may reflect fee waivers and/or expense reimbursements. In the absence of fee waivers and/or expense reimbursements, the total return would have been lower. |
| * | | Commencement of operations. |
4 Legg Mason Partners Variable Portfolios III, Inc. 2006 Annual Report
Historical Performance (unaudited)
Value of $10,000 Invested in Shares of the Legg Mason Partners Variable Adjustable Rate Income Portfolio vs. Citigroup 6-Month U.S. Treasury Bill Index† (September 2003 — October 2006)
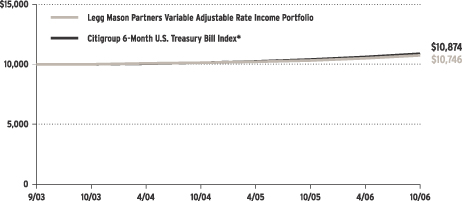
| † | | Hypothetical illustration of $10,000 invested in shares of the Legg Mason Partners Variable Adjustable Rate Income Portfolio on September 12, 2003 (commencement of operations), assuming reinvestment of all distributions, including returns of capital, if any, at net asset value through October 31, 2006. The Citigroup 6-month U.S. Treasury Bill Index includes 6-month Treasury Bills that are guaranteed by the U.S. government and provide a fixed rate of return when held to maturity. The Index is unmanaged and is not subject to the same management and trading expenses of a mutual fund. Please note that an investor cannot invest directly in an index. |
All figures represent past performance and are not a guarantee of future results. Investment return and principal value of an investment, which will fluctuate so that an investor’s shares, when redeemed, may be worth more or less than their original cost. The graph does not reflect expenses associated with the separate account such as administrative fees, account charges and surrender charges which, if reflected, would reduce the total returns. Performance figures may reflect fee waivers and/or expense reimbursements. In the absence of fee waivers and/or expense reimbursements, the total return would have been lower.
| * | | Benchmark return beginning 09/30/2003. |
Legg Mason Partners Variable Portfolios III, Inc. 2006 Annual Report 5
Portfolio Overview
Legg Mason Partners Variable High Income Portfolio
Q. What were the overall market conditions during the Portfolio’s reporting period?
A. During the reporting period, the bond market faced a number of challenges, including six additional short-term interest rate hikes by the Federal Reserve Board (“Fed”)i, inflationary pressures and a continued economic expansion. However, as the period progressed, oil prices fell sharply, a cooling housing market triggered slower economic growth and the Fed paused from raising rates during their meetings in August, September and October 2006. Collectively, this led to a sharp rally in the overall bond market and the Lehman Brothers U.S. Aggregate Indexii generated a positive 5.19% return during the 12 month period ended October 31, 2006.
Riskier asset classes, such as high yield bonds, experienced periods of volatility during the reporting period. This was often triggered by uncertainty regarding Fed policy and periodic investor flights to quality. However, for the 12-month period as a whole, the Citigroup High Yield Market Indexiii returned a strong 9.95%. High yield bonds performed well on the back of solid corporate profits, low default rates and solid demand.
Performance Update
For the 12 months ended October 31, 2006, the Legg Mason Partners Variable High Income Portfolio,1 excluding sales charges, returned 9.37%. In comparison, the Portfolio’s unmanaged benchmark, the Citigroup High Yield Market Index, returned 9.95%, and its Lipper Variable High Current Yield Funds Category Average,2 increased 9.18% over the same period.
Q. What were the most significant factors affecting Portfolio performance?
What were the leading contributors to performance?
A. During the three months of the reporting period, issue selection in the utilities, automotive and paper & forest products sectors boosted returns. The Portfolio’s overweight to the airlines sector and underweight to utilities also supported returns. As the reporting period progressed, overweights to media-cable and consumer cyclical, as well as underweights to the basic industry and consumer non-cyclical sectors contributed to performance. In addition, increasing the Portfolio’s exposure to CCC-rated issues enhanced results.
| 1 | | The Portfolio is an underlying investment option of various variable annuity and variable life insurance products. The Portfolio’s performance returns do not reflect the deduction of initial sales charges and expenses imposed in connection with investing in variable annuity or variable life insurance contracts, such as administrative fees, account charges, and surrender charges, which, if reflected, would reduce the performance of the Portfolio. Past performance is no guarantee of future results. |
| 2 | | Lipper, Inc. is a major independent mutual-fund tracking organization. Returns are based on the 12-month period ended October 31, 2006, including the reinvestment of all distributions, including returns of capital, if any, calculated among the 104 funds in the Portfolio’s Lipper category. |
6 Legg Mason Partners Variable Portfolios III, Inc. 2006 Annual Report
What were the leading detractors from performance?
A. Over the first three months of the reporting period, a higher than average level of cash—due to a series of calls and tenders—detracted from overall performance. In addition, security selection in the telecommunications sector was a drag on performance. As the Fund’s fiscal year progressed, an overweight in energy and BB-rated securities hurt the Portfolio’s performance. In addition, the Portfolio’s exposure to emerging markets debt detracted from results.
Q. Were there any significant changes to the Portfolio during the reporting period?
A. There were no significant changes to the Portfolio during the reporting period.
Thank you for your investment in the Legg Mason Partners Variable High Income Portfolio. As ever, we appreciate that you have chosen us to manage your assets and we remain focused on seeking to achieve the Portfolio’s investment goals.
Sincerely,
Western Asset Management Company
November 20, 2006
The information provided is not intended to be a forecast of future events, a guarantee of future results or investment advice. Views expressed may differ from those of the firm as a whole.
RISKS: Keep in mind, high-yield bonds are rated below investment grade and carry more risk than higher rated securities. Also, the Portfolio is subject to fluctuations in share price as interest rates rise and fall and is subject to certain risks of overseas investing, including currency fluctuations, differing securities regulations and periods of illiquidity, which could result in significant market fluctuations. These risks are magnified in emerging markets. As interest rates rise, bond prices fall, reducing the value of the Portfolio’s share price. The Portfolio may use derivatives, such as options and futures, which can be illiquid, may disproportionately increase losses, and have a potentially large impact on fund performance. Please see the Portfolio’s prospectus for more information on these and other risks.
All index performance reflects no deduction for fees, expenses or taxes. Please note that an investor cannot invest directly in an index.
| i | | The Federal Reserve Board is responsible for the formulation of a policy designed to promote economic growth, full employment, stable prices, and a sustainable pattern of international trade and payments. |
| ii | | The Lehman Brothers U.S. Aggregate Index is a broad-based bond index comprised of government, corporate, mortgage and asset-backed issues, rated investment grade or higher, and having at least one year to maturity. |
| iii | | The Citigroup High Yield Market Index is a broad-based unmanaged index of high yield securities. |
Legg Mason Partners Variable Portfolios III, Inc. 2006 Annual Report 7
Fund at a Glance (unaudited)
Legg Mason Partners Variable High Income Portfolio
8 Legg Mason Partners Variable Portfolios III, Inc. 2006 Annual Report
Fund Performance
Legg Mason Partners Variable High Income Portfolio
| | | | | |
| Average Annual Total Returns(1) (unaudited) | |
Twelve Months Ended 10/31/06 | | 9.37 | % |
| | |
Five Years Ended 10/31/06 | | 9.10 | |
| | |
Ten Years Ended 10/31/06 | | 4.94 | |
| | |
6/16/94* through 10/31/06 | | 6.15 | |
| | |
| | | | | |
| Cumulative Total Return(1) (unaudited) | |
10/31/96 through 10/31/06 | | 62.02 | % |
| | |
| (1) | | Assumes the reinvestment of all distributions, including returns of capital, if any, at net asset value. All figures represent past performance and are not a guarantee of future results. Investment return and principal value of an investment will fluctuate so that an investor’s shares, when redeemed, may be worth more or less than their original cost. Total returns do not reflect expenses associated with the separate account such as administrative fees, account charges and surrender charges, which, if reflected, would reduce the total returns. Performance figures may reflect fee waivers and/or expense reimbursements. In the absence of fee waivers and/or expense reimbursements, the total return would have been lower. |
| * | | Commencement of operations. |
Legg Mason Partners Variable Portfolios III, Inc. 2006 Annual Report 9
Historical Performance (unaudited)
Value of $10,000 Invested in Shares of the Legg Mason Partners Variable High Income Portfolio vs. Citigroup High Yield Market Index (October 1996 — October 2006)
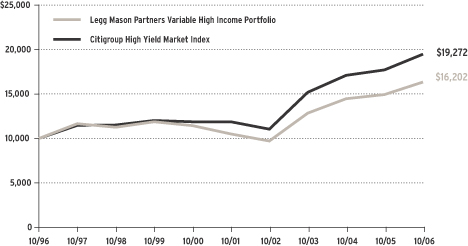
| † | | Hypothetical illustration of $10,000 invested in shares of the Legg Mason Partners Variable High Income Portfolio on October 31, 1996, assuming reinvestment of all distributions, including returns of capital, if any, at net asset value through October 31, 2006. The Citigroup High Yield Market Index is a broad-based unmanaged index of high yield securities. The Index is unmanaged and is not subject to the same management and trading expenses as a mutual fund. Please note that an investor cannot invest directly in an index. |
All figures represent past performance and are not a guarantee of future results. Investment return and principal value of an investment will fluctuate so that an investor’s shares, when redeemed, may be worth more or less than their original cost. Total returns do not reflect expenses associated with the separate account such as administrative fees, account charges and surrender charges, which, if reflected, would reduce the total returns. Performance figures may reflect fee waivers and/or expense reimbursements. In the absence of fee waivers and/or expense reimbursements, the total return would have been lower.
10 Legg Mason Partners Variable Portfolios III, Inc. 2006 Annual Report
Fund Expenses (unaudited)
Example
As a shareholder of the Fund, you may incur two types of costs: (1) transaction costs and (2) ongoing costs, including management fees; distribution and/or service (12b-1) fees; and other Fund expenses. This example is intended to help you understand your ongoing costs (in dollars) of investing in the Fund and to compare these costs with the ongoing costs of investing in other mutual funds.
This example is based on an investment of $1,000 invested on May 1, 2006 and held for the six months ended October 31, 2006.
Actual Expenses
The table below titled “Based on Actual Total Return” provides information about actual account values and actual expenses. You may use the information provided in this table, together with the amount you invested, to estimate the expenses that you paid over the period. To estimate the expenses you paid on your account, divide your ending account value by $1,000 (for example, an $8,600 ending account value divided by $1,000 = 8.6), then multiply the result by the number under the heading entitled “Expenses Paid During the Period”.
| | | | | | | | | | | | | | | |
| Based on Actual Total Return(1) | | | | | | | | | | | | | |
| | | | | |
| | | Actual Total
Return(2) | | | Beginning
Account
Value | | Ending
Account
Value | | Annualized
Expense
Ratio | | | Expenses Paid During the Period(3) |
Legg Mason Partners Variable Adjustable Rate Income Portfolio | | 2.29 | % | | $ | 1,000.00 | | $ | 1,022.90 | | 0.90 | % | | $ | 4.59 |
| |
Legg Mason Partners Variable High Income Portfolio | | 3.79 | | | | 1,000.00 | | | 1,037.90 | | 0.70 | | | | 3.60 |
| |
| (1) | | For the six months ended October 31, 2006. |
| (2) | | Assumes reinvestment of all distributions, including returns of capital, if any, at net asset value. Total return is not annualized, as it may not be representative of the total return for the year. Total returns do not reflect expenses associated with the separate account such as administrative fees, account charges and surrender charges which, if reflected, would reduce the total returns. Performance figures may reflect fee waivers and/or expense reimbursements. Past performance is no guarantee of future results. In the absence of fee waivers and/or expense reimbursements, the total return would have been lower. |
| (3) | | Expenses (net of fee waivers and/or expense reimbursements) are equal to each Fund’s respective annualized expense ratio multiplied by the average account value over the period, multiplied by the number of days in the most recent fiscal half-year, then divided by 365. |
Legg Mason Partners Variable Portfolios III, Inc. 2006 Annual Report 11
Fund Expenses (unaudited) (continued)
Hypothetical Example for Comparison Purposes
The table below titled “Based on Hypothetical Total Return” provides information about hypothetical account values and hypothetical expenses based on the actual expense ratio and an assumed rate of return of 5.00% per year before expenses, which is not the Fund’s actual return. The hypothetical account values and expenses may not be used to estimate the actual ending account balance or expenses you paid for the period. You may use the information provided in this table to compare the ongoing costs of investing in the Fund and other funds. To do so, compare the 5.00% hypothetical example relating to the Fund with the 5.00% hypothetical examples that appear in the shareholder reports of the other funds.
Please note that the expenses shown in the table below are meant to highlight your ongoing costs only and do not reflect any transactional costs. Therefore, the table is useful in comparing ongoing costs only, and will not help you determine the relative total costs of owning different funds. In addition, if these transaction costs were included, your costs would have been higher.
| | | | | | | | | | | | | | | |
| Based on Hypothetical Total Return(1) | | | | | | | | | |
| | | | | |
| | | Hypothetical
Annualized
Total Return | | | Beginning
Account
Value | | Ending
Account
Value | | Annualized
Expense
Ratio | | | Expenses Paid During the Period(2) |
Legg Mason Partners Variable Adjustable Rate Income Portfolio | | 5.00 | % | | $ | 1,000.00 | | $ | 1,020.67 | | 0.90 | % | | $ | 4.58 |
| |
Legg Mason Partners Variable High Income Portfolio | | 5.00 | | | | 1,000.00 | | | 1,021.68 | | 0.70 | | | | 3.57 |
| |
| (1) | | For the six months ended October 31, 2006. |
| (2) | | Expenses (net of fee waivers and/or expense reimbursements) are equal each Fund’s respective annualized expense ratio multiplied by the average account value over the period, multiplied by the number of days in the most recent fiscal half-year, then divided by 365. |
12 Legg Mason Partners Variable Portfolios III, Inc. 2006 Annual Report
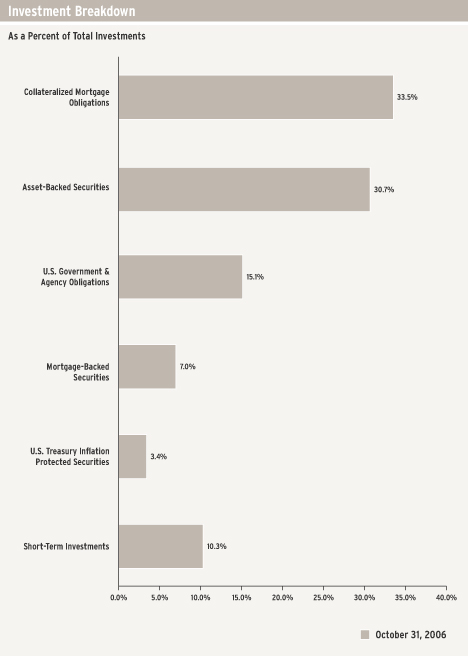
Schedules of Investments (October 31, 2006)
LEGG MASON PARTNERS VARIABLE ADJUSTABLE RATE INCOME PORTFOLIO
| | | | | | | | |
| | | |
Face Amount | | Rating‡ | | Security | | Value |
| | | | | | | | |
| | COLLATERALIZED MORTGAGE OBLIGATIONS — 35.2% | | | |
| $ | 279,029 | | AAA | | ABN Amro Mortgage Corp., Series 2003-5, Class A11, PAC,
4.750% due 4/25/33 (a) | | $ | 273,395 |
| | | | | Banc of America Mortgage Securities Inc.: | | | |
| | 78,180 | | AAA | | Series 2003-F, Class 1A1, 6.059% due 7/25/33 (b) | | | 78,545 |
| | 75,398 | | AAA | | Series 2004-A, Class 1A1, 3.440% due 2/25/34 (b) | | | 76,132 |
| | 500,000 | | AAA | | Series 2004-E, Class 2A3, 4.113% due 6/25/34 (a)(b) | | | 493,596 |
| | 137,952 | | Aaa(c) | | Series 2005-A, Class 2A1, 4.460% due 2/25/35 (b) | | | 134,979 |
| | 72,493 | | AAA | | Bear Stearns Alternate-A Trust, Series 2004-11, Class 1A2,
5.740% due 11/25/34 (b) | | | 72,683 |
| | | | | Bear Stearns ARM Trust: | | | |
| | 193,065 | | AAA | | Series 2004-12, Class 1A1, 4.178% due 2/25/35 (b) | | | 190,350 |
| | 162,680 | | AAA | | Series 2005-6, Class 1A1, 5.095% due 8/25/35 (b) | | | 163,007 |
| | 273,282 | | AAA | | Bear Stearns Asset-Backed Securities Inc., Series 2003-AC5, Class A3,
5.920% due 10/25/33 (a)(b) | | | 273,408 |
| | | | | Countrywide Alternative Loan Trust: | | | |
| | 333,131 | | AAA | | Series 2005-24, Class 4A1, 5.550% due 7/20/35 (a)(b) | | | 334,140 |
| | 404,653 | | AAA | | Series 2005-72, Class A1, 5.590% due 1/25/36 (a)(b) | | | 405,206 |
| | 394,538 | | AAA | | Series 2006-OA07, Class 3A1, 5.530% due 6/25/46 (a)(b) | | | 394,754 |
| | 387,043 | | AAA | | Series 2006-OA11, Class A4, 5.510% due 7/25/36 (a)(b) | | | 386,718 |
| | | | | Countrywide Home Loan Mortgage Pass-Through Trust: | | | |
| | 96,443 | | AAA | | Series 2001-HYB1, Class 1A1, 6.273% due 6/19/31 (b) | | | 96,531 |
| | 107,333 | | AAA | | Series 2002-26, Class A4, 5.820% due 12/25/17 (b) | | | 107,657 |
| | 353,700 | | AAA | | Deutsche Mortgage Securities Inc., Series 2004-4, Class 7AR2,
5.840% due 6/25/34 (a)(b) | | | 354,328 |
| | | | | Federal Home Loan Mortgage Corp. (FHLMC): | | | |
| | 102,216 | | AAA | | Series 2852, Class TE, PAC, 5.000% due 1/15/13 | | | 101,985 |
| | 192,496 | | AAA | | Series 2866, Class WA, PAC, 5.000% due 8/15/16 | | | 191,871 |
| | | | | Federal National Mortgage Association (FNMA): | | | |
| | | | | Grantor Trust: | | | |
| | 307,554 | | AAA | | Series 2001-T1, Class A2, 5.384% due 10/25/25 (a)(b) | | | 310,236 |
| | 131,691 | | AAA | | Series 2002-T19, Class A4, 5.521% due 3/25/42 (b) | | | 134,388 |
| | | | | REMIC Trust: | | | |
| | 200,556 | | AAA | | Series 1997-20, Class F, 5.107% due 3/25/27 (b) | | | 202,085 |
| | 247,718 | | AAA | | Series 2003-117, Class KF, PAC, 5.720% due 8/25/33 (b) | | | 248,326 |
| | 42,380 | | AAA | | Series 2003-124, Class F, 5.620% due 1/25/34 (b) | | | 42,382 |
| | 135,409 | | AAA | | Series 2005-86, Class FC, 5.620% due 10/25/35 (b) | | | 134,379 |
| | | | | Whole Loan: | | | |
| | 75,823 | | AAA | | Series 2003-W06, Class F, 5.670% due 9/25/42 (b) | | | 76,240 |
| | 89,835 | | AAA | | Series 2003-W14, Class 2A, 5.481% due 1/25/43 (b) | | | 91,990 |
| | 290,000 | | AAA | | First Horizon Alternative Mortgage Securities, Series 2005-AA12,
Class 1A1, 6.000% due 2/25/36 (a)(b) | | | 293,255 |
| | | | | IMPAC CMB Trust: | | | |
| | 65,475 | | AA+ | | Series 2003-8, Class 1A2, 6.320% due 10/25/33 (b) | | | 65,548 |
| | 391,747 | | AAA | | Series 2005-7, Class A1, 5.580% due 11/25/35 (a)(b) | | | 392,484 |
See Notes to Financial Statements.
Legg Mason Partners Variable Portfolios III, Inc. 2006 Annual Report 13
Schedules of Investments (October 31, 2006) (continued)
| | | | | | | | |
| | | |
Face Amount | | Rating‡ | | Security | | Value |
| | | | | | | | |
| | COLLATERALIZED MORTGAGE OBLIGATIONS — 35.2% (continued) | | | |
| $ | 258,273 | | AAA | | IMPAC Secured Assets Corp., Series 2004-3, Class 1A4,
5.720% due 11/25/34 (a)(b) | | $ | 259,107 |
| | 361,588 | | AAA | | Indymac Index Mortgage Loan Trust, Series 2005-AR21, Class 4A1,
5.408% due 10/25/35 (a)(b) | | | 359,396 |
| | 146,255 | | AAA | | Lehman Structured Securities Corp., Series 2005-1, Class A1,
5.660% due 9/26/45 (b)(d) | | | 146,667 |
| | 292,722 | | AAA | | MASTR Alternative Loans Trust, Series 2003-7, Class 7A1, PAC,
5.720% due 11/25/33 (a)(b) | | | 294,932 |
| | 249,645 | | AAA | | MASTR ARM Trust, Series 2003-6, Class 5A1,
4.695% due 12/25/33 (b) | | | 249,528 |
| | 217,240 | | AAA | | Merrill Lynch Mortgage Investors Inc., Series 2005-A2,
Class A4, 4.489% due 2/25/35 (b) | | | 213,209 |
| | | | | Residential Asset Securitization Trust: | | | |
| | 94,901 | | AAA | | Series 2003-A11, Class A2, PAC, 5.770% due 11/25/33 (b) | | | 95,238 |
| | 286,241 | | AAA | | Series 2004-A02, Class 1A3, PAC, 5.720% due 5/25/34 (a)(b) | | | 287,301 |
| | 270,175 | | AAA | | Series 2004-A4, Class A2, PAC, 5.670% due 8/25/34 (a)(b) | | | 270,332 |
| | 96,522 | | AAA | | Residential Funding Mortgage Securities I Trust, Series 2003-S10,
Class A2, 5.720% due 6/25/33 (b) | | | 96,701 |
| | | | | Sequoia Mortgage Trust: | | | |
| | 20,114 | | AAA | | Series 09, Class 2A, 7.017% due 9/20/32 (b) | | | 20,159 |
| | 298,490 | | AAA | | Series 2003-2, Class A1, 5.650% due 6/20/33 (a)(b) | | | 298,793 |
| | | | | Structured ARM Loan Trust: | | | |
| | 33,345 | | AAA | | Series 2004-01, Class 2A, 5.630% due 2/25/34 (b) | | | 33,390 |
| | 33,473 | | AAA | | Series 2004-07, Class A1, 5.590% due 6/25/34 (b) | | | 33,491 |
| | 42,522 | | Aaa(c) | | Series 2004-17, Class A1, 6.035% due 11/25/34 (b) | | | 42,384 |
| | 87,803 | | AAA | | Series 2005-03XS, Class A2, 5.570% due 1/25/35 (b) | | | 87,899 |
| | 286,802 | | AAA | | Series 2005-17, Class 4A2, 5.150% due 8/25/35 (a)(b) | | | 284,199 |
| | 255,845 | | AAA | | Series 2005-18, Class 9A1, 5.250% due 9/25/35 (b) | | | 253,483 |
| | | | | Structured Asset Mortgage Investments Inc.: | | | |
| | | | | Series 2002-AR1: | | | |
| | 36,511 | | AAA | | Class 1A, 7.050% due 3/25/32 (b) | | | 36,590 |
| | 57,423 | | AAA | | Class 2A, 6.416% due 3/25/32 (b) | | | 57,571 |
| | 133,335 | | AAA | | Series 2003-AR2, Class A1, 5.690% due 12/19/33 (b) | | | 133,247 |
| | 107,980 | | AAA | | Series 2005-AR3, Class 2A1, 6.820% due 8/25/35 (b) | | | 110,383 |
| | | | | Series 2005-AR7: | | | |
| | 252,006 | | AAA | | Class 1A1, 6.887% due 12/27/35 (b) | | | 256,157 |
| | 252,006 | | AAA | | Class 1A2, 5.700% due 12/27/35 (b) | | | 252,547 |
| | 489,658 | | AAA | | Series 2006-AR6, Class 1A3, 5.514% due 7/25/35 (a)(b) | | | 490,979 |
| | | | | Structured Asset Securities Corp.: | | | |
| | 73,955 | | AA(e) | | Series 1998-3, Class M1, 6.320% due 3/25/28 (b) | | | 74,045 |
| | 92,581 | | AA | | Series 1998-8, Class M1, 6.260% due 8/25/28 (b) | | | 92,690 |
| | 110,947 | | AAA | | Series 2002-08A, Class 7A1, 6.926% due 5/25/32 (b) | | | 111,429 |
| | 143,301 | | AAA | | Series 2002-16A, Class 1A1, 7.576% due 8/25/32 (b) | | | 143,558 |
| | 20,189 | | AAA | | Series 2002-18A, Class 4A, 6.999% due 9/25/32 (b) | | | 20,310 |
| | 31,910 | | AAA | | Series 2003-8, Class 2A9, 5.820% due 4/25/33 (b) | | | 32,045 |
| | 119,038 | | AAA | | Series 2004-NP1, Class A, 5.720% due 9/25/33 (b)(d) | | | 119,202 |
| | 169,521 | | AAA | | Series 2005-5N, Class 3A3A, 5.510% due 11/25/35 (b) | | | 169,731 |
| | 175,664 | | AAA | | Series 2005-RF3, Class 2A, 5.641% due 6/25/35 (b)(d) | | | 178,299 |
See Notes to Financial Statements.
14 Legg Mason Partners Variable Portfolios III, Inc. 2006 Annual Report
Schedules of Investments (October 31, 2006) (continued)
| | | | | | | | | |
| | | |
Face Amount | | Rating‡ | | Security | | Value | |
| | | | | | | | | |
| | COLLATERALIZED MORTGAGE OBLIGATIONS — 35.2% (continued) | | | | |
| | | | | Thornburg Mortgage Securities Trust: | | | | |
| $ | 54,822 | | AAA | | Series 2004-1, Class 12A, 5.770% due 3/25/44 (b) | | $ | 54,863 | |
| | 145,085 | | AAA | | Series 2004-3, Class A, 5.690% due 9/25/34 (b) | | | 145,888 | |
| | 439,057 | | AAA | | Series 2005-3, Class A4, 5.600% due 8/25/35 (a)(b) | | | 438,584 | |
| | 347,395 | | AAA | | Wachovia Mortgage Loan Trust LLC, Series 2005-A, Class 1A1,
4.778% due 8/20/35 (a)(b) | | | 343,151 | |
| | | | | Washington Mutual Inc.: | | | | |
| | 218,127 | | AAA | | Series 2003-S6, Class 2A8, 5.720% due 7/25/18 (b) | | | 218,914 | |
| | 73,149 | | AAA | | Series 2004-AR2, Class A, 6.064% due 4/25/44 (b) | | | 73,961 | |
| | 363,520 | | AAA | | Series 2005-AR19, Class A1A1, 5.590% due 12/25/45 (a)(b) | | | 364,693 | |
| | 193,149 | | AAA | | Series 2006-AR10, Class 1A1, 5.977% due 9/25/36 (b) | | | 195,210 | |
| | 155,881 | | AAA | | Washington Mutual Mortgage Pass-Through Certificates,
Series 2002-AR1, Class 1A1, 7.022% due 11/25/30 (b) | | | 155,268 | |
| | | | | Wells Fargo Mortgage Backed Securities Trust: | | | | |
| | 100,033 | | Aaa(c) | | Series 2003-5, Class A4, PAC, 5.720% due 5/25/33 (b) | | | 100,587 | |
| | 200,038 | | AAA | | Series 2004-Y, Class 1A1, 4.595% due 11/25/34 (b) | | | 197,565 | |
| | | |
| | | | | TOTAL COLLATERALIZED MORTGAGE OBLIGATIONS
(Cost — $14,047,016) | | | 14,014,274 | |
| | | |
| | ASSET-BACKED SECURITIES — 32.3% | | | | |
| | Automobiles — 2.2% | | | | |
| | 450,000 | | AAA | | AmeriCredit Automobile Receivables Trust, Series 2005-BM,
Class A4, 5.400% due 5/6/12 (a)(b) | | | 450,427 | |
| | 250,000 | | AAA | | Capital One Auto Finance Trust, Series 2004-B, Class A4,
5.430% due 8/15/11 (b) | | | 250,205 | |
| | 171,034 | | AAA | | Franklin Auto Trust, Series 2004-1, Class A2, 3.570% due 3/16/09 | | | 170,453 | |
| | | |
| | | | | Total Automobiles | | | 871,085 | |
| | | |
| | Credit Card — 0.9% | | | | |
| | 375,000 | | | | Capital One Master Trust, Series 2001-1, Class A,
5.520% due 12/15/10 (a)(b) | | | 376,465 | |
| | | |
| | Diversified Financial Services — 1.4% | | | | |
| | | | | Business Loan Express: | | | | |
| | 83,039 | | Aaa(c) | | Series 2001-1A, Class A, 5.970% due 7/20/27 (b)(d) | | | 83,719 | |
| | 281,859 | | AAA | | Series 2002-AA, Class A, 5.970% due 6/25/28 (a)(b)(d) | | | 284,443 | |
| | 67,358 | | AAA | | Series 2003-2A, Class A, 6.120% due 1/25/32 (b)(d) | | | 68,505 | |
| | 111,715 | | AAA | | Series 2003-AA, Class A, 6.270% due 5/15/29 (b)(d) | | | 114,242 | |
| | | |
| | | | | Total Diversified Financial Services | | | 550,909 | |
| | | |
| | Home Equity — 26.2% | | | | |
| | 139,309 | | AAA | | Aegis Asset-Backed Securities Trust, Series 2004-5, Class 1A2,
5.660% due 3/25/31 (b) | | | 139,462 | |
| | 81,016 | | AAA | | Ameriquest Mortgage Securities Inc., Series 2004-R8, Class A5,
5.690% due 9/25/34 (b) | | | 81,186 | |
| | 66,428 | | AAA | | Argent Securities Inc., Series 2004-W10, Class A2,
5.710% due 10/25/34 (b) | | | 66,554 | |
| | 126,316 | | AAA | | Asset-Backed Securities Corp., Home Equity Loan Trust, Series 2001-HE3, Class A1, 5.860% due 11/15/31 (b) | | | 126,413 | |
See Notes to Financial Statements.
Legg Mason Partners Variable Portfolios III, Inc. 2006 Annual Report 15
Schedules of Investments (October 31, 2006) (continued)
| | | | | | | | |
| | | |
Face Amount | | Rating‡ | | Security | | Value |
| | | | | | | | |
| | Home Equity — 26.2% (continued) | | | |
| $ | 430,000 | | AAA | | Bayview Financial Acquisition Trust, Series 2003-G, Class A1,
5.920% due 1/28/39 (a)(b) | | $ | 430,806 |
| | 138,167 | | AAA | | Bear Stearns Asset-Backed Securities I Trust, Series 2004-B01,
Class 2A2, 5.720% due 9/25/34 (b) | | | 138,590 |
| | | | | Bear Stearns Asset-Backed Securities Inc.: | | | |
| | 209,368 | | AAA | | Series 2003-1, Class A1, 5.820% due 11/25/42 (b) | | | 210,043 |
| | 255,360 | | AAA | | Series 2003-SD1, Class A, 5.770% due 12/25/33 (b) | | | 256,778 |
| | 60,589 | | AAA | | Series 2003-SD3, Class A, 5.800% due 12/25/42 (b) | | | 60,791 |
| | 349,539 | | AAA | | Carrington Mortgage Loan Trust, Series 2005-NC2, Class A2,
4.431% due 5/25/35 (a)(b) | | | 349,875 |
| | 136,326 | | AAA | | CDC Mortgage Capital Trust, Series 2002-HE1, Class A,
5.630% due 1/25/33 (b) | | | 136,530 |
| | 87,727 | | AAA(e) | | Cendant Mortgage Corp., Series 2003-A, Class A3,
5.870% due 7/25/43 (b)(d) | | | 88,058 |
| | 600,000 | | AAA | | Centex Home Equity, Series 2005-D, Class AV2,
5.590% due 10/25/35 (a)(b) | | | 600,630 |
| | | | | Countrywide Asset-Backed Certificates: | | | |
| | 177,281 | | AAA | | Series 2004-6, Class 2A4, 5.770% due 11/25/34 (b) | | | 177,924 |
| | 342,876 | | AAA | | Series 2006-SD2, Class IA1, 5.670% due 11/25/36 (a)(b)(d) | | | 342,940 |
| | 379,997 | | AAA | | Series 2006-SD3, Class A1, 5.660% due 10/25/36 (a)(b)(d) | | | 381,826 |
| | 185,427 | | AAA | | Countrywide Home Equity Loan Trust, Series 2004-J, Class 2A,
5.610% due 12/15/33 (b) | | | 185,856 |
| | 475,617 | | AAA | | Fieldstone Mortgage Investment Corp., Series 2005-1, Class 2A2,
5.540% due 3/25/35 (a)(b) | | | 476,195 |
| | 266,315 | | AAA | | First Franklin Mortgage Loan Asset-Backed Certificates,
Series 2004-FFH4, Class 1A1, 5.620% due 1/25/35 (a)(b) | | | 267,188 |
| | 32,908 | | AAA | | First Franklin Mortgage Loan Trust, Series 2002-FF3, Class A2,
5.780% due 8/25/32 (b) | | | 32,946 |
| | 400,000 | | AAA | | GMAC Mortgage Corp. Loan Trust, Series 2006-HE1, Class A,
5.530% due 11/25/36 (a)(b) | | | 400,431 |
| | 335,705 | | AAA | | GSAMP Trust, Series 2006-SEA1, Class A,
5.620% due 5/25/36 (a)(b)(d) | | | 335,705 |
| | 369,476 | | AAA | | Merrill Lynch Mortgage Investors Trust, Series 2006-SD1, Class A, 5.610% due 1/25/47 (a)(b) | | | 369,705 |
| | 128,726 | | AAA | | Morgan Stanley ABS Capital I, Series 2005-HE1, Class A3B, 5.540% due 12/25/34 (b) | | | 128,884 |
| | 390,000 | | AA | | New Century Home Equity Loan Trust, Series 2004-2, Class M2, 5.940% due 8/25/34 (a)(b) | | | 393,010 |
| | 418,322 | | AAA | | Option One Mortgage Loan Trust, Series 2003-1, Class A2, 5.740% due 2/25/33 (a)(b) | | | 419,085 |
| | | | | RAAC Series: | | | |
| | 337,943 | | AAA | | 2006-RP2, Class A, 5.570% due 2/25/37 (a)(b)(d) | | | 337,942 |
| | 355,061 | | AAA | | 2006-RP3, Class A, 5.590% due 5/25/36 (a)(b)(d) | | | 355,061 |
| | 491,144 | | AAA | | 2006-RP4, Class A, 5.610% due 1/25/46 (a)(b)(d) | | | 491,448 |
| | | | | Renaissance Home Equity Loan Trust: | | | |
| | 214,674 | | AAA | | Series 2003-2, Class A, 5.760% due 8/25/33 (b) | | | 215,370 |
| | 249,120 | | AAA | | Series 2003-3, Class A, 5.820% due 12/25/33 (b) | | | 251,292 |
| | 169,920 | | AAA | | Residential Asset Securities Corp., Series 2002-KS4, Class AIIB, 5.570% due 7/25/32 (b) | | | 170,075 |
See Notes to Financial Statements.
16 Legg Mason Partners Variable Portfolios III, Inc. 2006 Annual Report
Schedules of Investments (October 31, 2006) (continued)
| | | | | | | | | |
| | | |
Face Amount | | Rating‡ | | Security | | Value | |
| | Home Equity — 26.2% (continued) | | | | |
| | | | | | | | | |
| | | | | SACO I Trust: | | | | |
| $ | 137,305 | | Aaa(c) | | Series 2005-02, Class A, 5.520% due 4/25/35 (b)(d) | | $ | 137,374 | |
| | 236,185 | | AAA | | Series 2005-08, Class A1, 5.600% due 9/25/33 (b) | | | 236,400 | |
| | 284,717 | | AAA | | Series 2005-10, Class 1A, 5.580% due 11/25/33 (a)(b) | | | 285,199 | |
| | 110,662 | | AAA | | Series 2005-WM3, Class A1, 5.580% due 9/25/33 (b) | | | 110,760 | |
| | 315,172 | | AAA | | Series 2006-5, Class 1A, 5.470% due 4/25/36 (a)(b) | | | 315,398 | |
| | 31,288 | | AAA | | Saxon Asset Securities Trust, Series 2002-1, Class AV1, 5.570% due 3/25/32 (b) | | | 31,322 | |
| | 35,979 | | AAA | | Soundview Home Equity Loan Trust, Series 2003-I, Class A, 5.770% due 8/25/31 (b) | | | 36,083 | |
| | 4,046 | | Aaa(c) | | Specialty Underwriting & Residential Finance Trust, Series 2003-BC1, Class A, 5.660% due 1/25/34 (b) | | | 4,052 | |
| | | | | Structured Asset Investment Loan Trust: | | | | |
| | 55,481 | | AAA | | Series 2003-BC1, Class A2, 5.660% due 1/25/33 (b) | | | 55,557 | |
| | 337,988 | | AAA | | Series 2005-2, Class A3, 5.570% due 3/25/35 (a)(b) | | | 338,379 | |
| | 370,056 | | AAA | | Truman Capital Mortgage Loan Trust, Series 2005-1, Class A, 5.750% due 3/25/35 (a)(b)(d) | | | 370,056 | |
| | 99,853 | | AAA | | Wachovia Asset Securitization Inc., Series 2003-HE1, Class A1, 5.610% due 3/25/33 (b) | | | 100,033 | |
| | | |
| | | | | Total Home Equity | | | 10,439,212 | |
| | | |
| | Other — 0.4% | | | | |
| | 164,556 | | AAA | | Lehman XS Trust, Series 2005-2, Class 2A1A, 5.470% due 7/25/35 (b) | | | 164,759 | |
| | | |
| | Student Loan — 1.2% | | | | |
| | 400,000 | | AAA | | Carrington Mortgage Loan Trust, Series 2005-NC5, Class A2, 5.640% due 4/25/12 (a)(b) | | | 401,157 | |
| | 60,541 | | AAA | | Morgan Stanley ABS Capital I, Series 2004-NC5, Class A2, 5.620% due 5/25/34 (b) | | | 60,611 | |
| | | |
| | | | | Total Student Loan | | | 461,768 | |
| | | |
| | | | | TOTAL ASSET-BACKED SECURITIES
(Cost — $12,851,484) | | | 12,864,198 | |
| | | |
| | MORTGAGE-BACKED SECURITIES — 7.3% | | | | |
| | FHLMC — 0.5% | | | | |
| | 203,996 | | | | Federal Home Loan Mortgage Corp. (FHLMC), 6.411% due 1/1/27 (b) | | | 205,467 | |
| | | |
| | FNMA — 6.8% | | | | |
| | | | | Federal National Mortgage Association (FNMA): | | | | |
| | 493,537 | | | | 5.228% due 9/1/35 (a)(b) | | | 492,169 | |
| | 2,000,000 | | | | 5.000% due 12/1/36 (f)(g) | | | 1,930,937 | |
| | 293,731 | | | | 5.427% due 5/1/42 (a)(b) | | | 296,023 | |
| | | |
| | | | | Total FNMA | | | 2,719,129 | |
| | | |
| | | | | TOTAL MORTGAGE-BACKED SECURITIES
(Cost — $2,902,863) | | | 2,924,596 | |
| | | |
See Notes to Financial Statements.
Legg Mason Partners Variable Portfolios III, Inc. 2006 Annual Report 17
Schedules of Investments (October 31, 2006) (continued)
| | | | | | | | | |
| | | |
Face Amount | | | | Security | | Value | |
| | | | | | | | | |
| | U.S. GOVERNMENT & AGENCY OBLIGATIONS — 15.8% | | | | |
| | U.S. Government Agencies — 15.8% | | | | |
| | | | | Federal Home Loan Mortgage Corp. (FHLMC): | | | | |
| | | | | One Year CMT ARM: | | | | |
| $ | 149,706 | | | | 5.560% due 2/1/23 (b) | | $ | 150,891 | |
| | 340,866 | | | | 6.421% due 4/1/26 (a)(b) | | | 343,081 | |
| | 113,015 | | | | 6.913% due 7/1/29 (b) | | | 114,767 | |
| | 85,808 | | | | 6.783% due 8/1/30 (b) | | | 87,265 | |
| | 96,113 | | | | 3.859% due 10/1/33 (b) | | | 96,587 | |
| | 391,253 | | | | One Year LIBOR, 4.070% due 5/1/33 (a)(b) | | | 385,631 | |
| | | | | Federal National Mortgage Association (FNMA): | | | | |
| | 224,460 | | | | 12.000% due 4/1/16 (a) | | | 259,072 | |
| | | | | One Year CMT ARM: | | | | |
| | 211,565 | | | | 6.035% due 8/1/15 (b) | | | 211,763 | |
| | 199,071 | | | | 5.777% due 4/1/20 (b) | | | 198,722 | |
| | 241,870 | | | | 6.817% due 11/1/25 (b) | | | 243,214 | |
| | 337,315 | | | | 6.762% due 1/1/26 (a)(b) | | | 344,628 | |
| | 377,008 | | | | 6.625% due 7/1/26 (a)(b) | | | 383,491 | |
| | 201,263 | | | | 6.406% due 5/1/28 (b) | | | 202,404 | |
| | 98,122 | | | | 6.710% due 5/1/28 (b) | | | 100,344 | |
| | 200,894 | | | | 6.671% due 9/1/30 (b) | | | 204,275 | |
| | 89,150 | | | | 4.698% due 9/1/32 (b) | | | 89,774 | |
| | 55,691 | | | | 5.823% due 1/1/33 (b) | | | 57,043 | |
| | 94,511 | | | | 4.281% due 2/1/33 (b) | | | 94,651 | |
| | 89,265 | | | | 4.053% due 5/1/33 (b) | | | 88,063 | |
| | 236,035 | | | | 4.196% due 7/1/33 (b) | | | 228,397 | |
| | 240,437 | | | | 3.606% due 9/1/33 (b) | | | 233,575 | |
| | | | | One Year LIBOR: | | | | |
| | 33,254 | | | | 5.904% due 1/1/33 (b) | | | 33,503 | |
| | 198,708 | | | | 4.066% due 7/1/33 (b) | | | 196,396 | |
| | 105,431 | | | | 4.089% due 10/1/33 (b) | | | 103,553 | |
| | 250,126 | | | | 4.465% due 2/1/34 (b) | | | 244,571 | |
| | 269,069 | | | | 4.725% due 10/1/34 (a)(b) | | | 265,936 | |
| | | | | Six Month LIBOR: | | | | |
| | 134,205 | | | | 4.351% due 4/1/33 (b) | | | 132,225 | |
| | 98,204 | | | | 7.223% due 4/1/33 (b) | | | 99,527 | |
| | 80,229 | | | | 4.549% due 5/1/33 (b) | | | 79,567 | |
| | 32,807 | | | | 4.429% due 6/1/33 (b) | | | 32,365 | |
| | 305,489 | | | | 4.500% due 10/1/34 (a)(b) | | | 296,379 | |
| | | | | Government National Mortgage Association (GNMA) II, One Year CMT ARM: | | | | |
| | 104,472 | | | | 5.375% due 5/20/26 (b) | | | 105,105 | |
| | 66,508 | | | | 5.375% due 5/20/32 (b) | | | 66,880 | |
| | 308,061 | | | | 5.000% due 1/20/35 (a)(b) | | | 308,988 | |
| | 228,434 | | | | 4.000% due 2/20/35 (b) | | | 222,387 | |
| | | |
| | | | | TOTAL U.S. GOVERNMENT & AGENCY OBLIGATIONS
(Cost — $6,397,263) | | | 6,305,020 | |
| | | |
See Notes to Financial Statements.
18 Legg Mason Partners Variable Portfolios III, Inc. 2006 Annual Report
Schedules of Investments (October 31, 2006) (continued)
| | | | | | | | | |
| | | |
Face Amount | | | | Security | | Value | |
| | | | | | | | | |
| | U.S. TREASURY INFLATION PROTECTED SECURITIES — 3.6% | | | | |
| | | | | U.S. Treasury Notes, Inflation Indexed: | | | | |
| $ | 1,026,391 | | | | 2.375% due 4/15/11 (a) | | $ | 1,021,219 | |
| | 104,702 | | | | 1.875% due 7/15/15 | | | 100,845 | |
| | 302,589 | | | | 2.500% due 7/15/16 (a) | | | 307,034 | |
| | | |
| | | | | TOTAL U.S. TREASURY INFLATION PROTECTED SECURITIES (Cost — $1,421,797) | | | 1,429,098 | |
| | | |
| | | | | TOTAL INVESTMENTS BEFORE SHORT-TERM INVESTMENTS (Cost — $37,620,423) | | | 37,537,186 | |
| | | |
| | SHORT-TERM INVESTMENTS — 10.8% | | | | |
| | U.S. Government Agency — 0.4% | | | | |
| | 180,000 | | | | Federal National Mortgage Association (FNMA), Discount Notes,
5.197% due 6/25/07 (Cost — $174,100) (h) | | | 174,087 | |
| | | |
| | Repurchase Agreement — 10.4% | | | | |
| | 4,122,000 | | | | Nomura Securities International Inc. repurchase agreement dated 10/31/06; 5.280% due 11/1/06; Proceeds at maturity — $4,122,605;
(Fully collateralized by U.S. Treasury Note, 4.625% due 01/15/08;
Market value — $4,204,754)
(Cost — $4,122,000) (a) | | | 4,122,000 | |
| | | |
| | | | | TOTAL SHORT-TERM INVESTMENTS (Cost — $4,296,100) | | | 4,296,087 | |
| | | |
| | | | | TOTAL INVESTMENTS — 105.0% (Cost — $41,916,523#) | | | 41,833,273 | |
| | | | | Liabilities in Excess of Other Assets — (5.0)% | | | (2,007,403 | ) |
| | | |
| | | | | TOTAL NET ASSETS — 100.0% | | $ | 39,825,870 | |
| | | |
| ‡ | | All ratings are by Standard & Poor’s Ratings Service, unless otherwise noted. All ratings are unaudited. |
| (a) | | All or a portion of this security is segregated for open futures contracts, TBA’s and/or mortgage dollar rolls. |
| (b) | | Variable rate security. Interest rate disclosed is that which is in effect at October 31, 2006. |
| (c) | | Rating by Moody’s Investors Service. All ratings are unaudited. |
| (d) | | Security is exempt from registration under Rule 144A of the Securities Act of 1933. This security may be resold in transactions that are exempt from registration, normally to qualified institutional buyers. This security has been deemed liquid pursuant to guidelines approved by the Board of Directors, unless otherwise noted. |
| (e) | | Rating by Fitch Ratings Service. All ratings are unaudited. |
| (f) | | This security is traded on a to-be-announced (“TBA”) basis (See Note 1). |
| (g) | | All or a portion of this security was acquired under a mortgage dollar roll agreement (See Notes 1 and 2). |
| (h) | | Rate shown represents yield-to-maturity. |
| # | | Aggregate cost for federal income tax purposes is substantially the same. |
See pages 36 and 37 for definitions of ratings.
| | |
| Abbreviations used in this schedule: |
| ARM | | — Adjustable Rate Mortgage |
| CDC | | — CDC Capital Mortgage |
| CMB | | — Cash Management Bill |
| CMT | | — Constant Maturity Treasury |
| GMAC | | — General Motors Acceptance Corp. |
| GSAMP | | — Goldman Sachs Mortgage Corp. |
| LIBOR | | — London Interbank Offered Rate |
| MASTR | | — Mortgage Asset Securitization Transactions Inc. |
| PAC | | — Planned Amortization Class |
| REMIC | | — Real Estate Mortgage Investment Conduit |
See Notes to Financial Statements.
Legg Mason Partners Variable Portfolios III, Inc. 2006 Annual Report 19
Schedules of Investments (October 31, 2006) (continued)
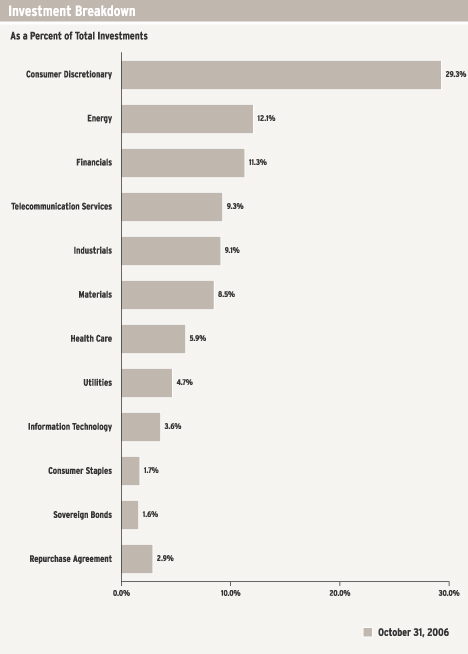
LEGG MASON PARTNERS VARIABLE HIGH INCOME PORTFOLIO
| | | | | | | | | |
| | | |
Face
Amount | | Rating‡ | | Security | | Value | |
| | | | | | | | | |
| | CORPORATE BONDS & NOTES — 90.7% | | | | |
| | Aerospace & Defense — 1.7% | | | | |
| $ | 810,000 | | B+ | | Alliant Techsystems Inc., Senior Subordinated Notes, 6.750% due 4/1/16 | | $ | 805,950 | |
| | 1,225,000 | | B | | Argo-Tech Corp., Senior Notes, 9.250% due 6/1/11 | | | 1,277,062 | |
| | | | | DRS Technologies Inc., Senior Subordinated Notes: | | | | |
| | 395,000 | | B+ | | 6.625% due 2/1/16 | | | 393,025 | |
| | 970,000 | | B | | 7.625% due 2/1/18 | | | 996,675 | |
| | | | | L-3 Communications Corp., Senior Subordinated Notes: | | | | |
| | 1,015,000 | | BB+ | | 7.625% due 6/15/12 | | | 1,059,406 | |
| | 45,000 | | BB+ | | 5.875% due 1/15/15 | | | 43,763 | |
| | | |
| | | | | Total Aerospace & Defense | | | 4,575,881 | |
| | | |
| | Airlines — 0.8% | | | | |
| | 113,218 | | B+ | | Continental Airlines Inc., Pass-Through Certificates, Series 2000-2, Class C, 8.312% due 4/2/11 | | | 114,703 | |
| | | | | United Airlines Inc., Pass-Through Certificates: | | | | |
| | 437,290 | | B | | Series 2000-1, Class B, 8.030% due 7/1/11 (a) | | | 448,496 | |
| | 888,598 | | B | | Series 2000-2, Class B, 7.811% due 10/1/09 (a) | | | 955,798 | |
| | | | | Series 2001-1: | | | | |
| | 160,000 | | B+ | | Class B, 6.932% due 9/1/11 (a) | | | 175,300 | |
| | 365,000 | | CCC- | | Class C, 6.831% due 9/1/08 (a) | | | 387,128 | |
| | | |
| | | | | Total Airlines | | | 2,081,425 | |
| | | |
| | Auto Components — 1.3% | | | | |
| | 260,000 | | B | | Arvin Capital I, Capital Securities, 9.500% due 2/1/27 | | | 265,525 | |
| | 815,000 | | B- | | Keystone Automotive Operations Inc., Senior Subordinated Notes, 9.750% due 11/1/13 | | | 790,550 | |
| | | | | TRW Automotive Inc.: | | | | |
| | 340,000 | | BB- | | Senior Notes, 9.375% due 2/15/13 | | | 365,925 | |
| | 97,000 | | BB- | | Senior Subordinated Notes, 11.000% due 2/15/13 | | | 106,942 | |
| | | | | Visteon Corp., Senior Notes: | | | | |
| | 1,245,000 | | CCC+ | | 8.250% due 8/1/10 | | | 1,195,200 | |
| | 880,000 | | CCC+ | | 7.000% due 3/10/14 | | | 767,800 | |
| | | |
| | | | | Total Auto Components | | | 3,491,942 | |
| | | |
| | Automobiles — 2.8% | | | | |
| | | | | Ford Motor Co.: | | | | |
| | 405,000 | | B | | Debentures, 8.875% due 1/15/22 | | | 353,362 | |
| | 5,425,000 | | B | | Notes, 7.450% due 7/16/31 | | | 4,278,969 | |
| | | | | General Motors Corp.: | | | | |
| | 680,000 | | B- | | Notes, 7.200% due 1/15/11 | | | 637,500 | |
| | | | | Senior Debentures: | | | | |
| | 750,000 | | B- | | 8.250% due 7/15/23 | | | 669,375 | |
| | 1,970,000 | | B- | | 8.375% due 7/15/33 | | | 1,763,150 | |
| | | |
| | | | | Total Automobiles | | | 7,702,356 | |
| | | |
See Notes to Financial Statements.
20 Legg Mason Partners Variable Portfolios III, Inc. 2006 Annual Report
Schedules of Investments (October 31, 2006) (continued)
| | | | | | | | | |
| | | |
Face
Amount | | Rating‡ | | Security | | Value | |
| | | | | | | | | |
| | Biotechnology — 0.0% | | | | |
| $ | 125,000 | | B | | Angiotech Pharmaceuticals Inc., Senior Subordinated Notes, 7.750% due 4/1/14 (b) | | $ | 119,375 | |
| | | |
| | Building Products — 1.7% | | | | |
| | | | | Associated Materials Inc.: | | | | |
| | 2,320,000 | | CCC | | Senior Discount Notes, step bond to yield 11.920% due 3/1/14 | | | 1,374,600 | |
| | 220,000 | | CCC | | Senior Subordinated Notes, 9.750% due 4/15/12 | | | 226,050 | |
| | 645,000 | | B | | Jacuzzi Brands Inc., Senior Secured Notes, 9.625% due 7/1/10 | | | 694,181 | |
| | 765,000 | | CCC+ | | Nortek Inc., Senior Subordinated Notes, 8.500% due 9/1/14 | | | 734,400 | |
| | 2,450,000 | | CCC+ | | NTK Holdings Inc., Senior Discount Notes, step bond to yield 8.324% due 3/1/14 | | | 1,690,500 | |
| | | |
| | | | | Total Building Products | | | 4,719,731 | |
| | | |
| | Capital Markets — 0.8% | | | | |
| | 1,235,000 | | B | | BCP Crystal U.S. Holdings Corp., Senior Subordinated Notes, 9.625% due 6/15/14 | | | 1,361,587 | |
| | | | | E*TRADE Financial Corp., Senior Notes: | | | | |
| | 315,000 | | BB- | | 7.375% due 9/15/13 | | | 325,238 | |
| | 585,000 | | BB- | | 7.875% due 12/1/15 | | | 621,563 | |
| | | |
| | | | | Total Capital Markets | | | 2,308,388 | |
| | | |
| | Chemicals — 2.7% | | | | |
| | 1,150,000 | | BB- | | Equistar Chemicals LP, Senior Notes, 10.625% due 5/1/11 | | | 1,236,250 | |
| | 1,370,000 | | B+ | | Georgia Gulf Corp., Senior Notes, 9.500% due 10/15/14 (b) | | | 1,356,300 | |
| | 405,000 | | B | | Huntsman International LLC, Senior Subordinated Notes, 7.875% due 11/13/14 (b) | | | 405,000 | |
| | | | | Lyondell Chemical Co.: | | | | |
| | | | | Senior Notes: | | | | |
| | 365,000 | | B+ | | 8.000% due 9/15/14 | | | 375,038 | |
| | 305,000 | | B+ | | 8.250% due 9/15/16 | | | 315,675 | |
| | | | | Senior Secured Notes: | | | | |
| | 605,000 | | BB | | 11.125% due 7/15/12 | | | 657,937 | |
| | 50,000 | | BB | | 10.500% due 6/1/13 | | | 55,250 | |
| | 760,000 | | BBB- | | Methanex Corp., Senior Notes, 8.750% due 8/15/12 | | | 822,700 | |
| | 1,420,000 | | B- | | Montell Finance Co. BV, Debentures, 8.100% due 3/15/27 (b) | | | 1,341,900 | |
| | 725,000 | | BB+ | | Westlake Chemical Corp., Senior Notes, 6.625% due 1/15/16 | | | 697,812 | |
| | | |
| | | | | Total Chemicals | | | 7,263,862 | |
| | | |
| | Commercial Services & Supplies — 1.7% | | | | |
| | 850,000 | | CCC+ | | Allied Security Escrow Corp., Senior Subordinated Notes, 11.375% due 7/15/11 | | | 858,500 | |
| | 575,000 | | CCC+ | | Brand Services Inc., Senior Notes, 12.000% due 10/15/12 | | | 643,298 | |
| | 995,000 | | B | | DynCorp International LLC/DIV Capital Corporation, Senior Subordinated Notes, Series B, 9.500% due 2/15/13 | | | 1,039,775 | |
| | 560,000 | | B+ | | Quebecor World Capital Corp., Senior Notes, 8.750% due 3/15/16 (b) | | | 539,000 | |
| | 1,560,000 | | BB- | | Windstream Corp., Senior Notes, 8.625% due 8/1/16 (b) | | | 1,690,650 | |
| | | |
| | | | | Total Commercial Services & Supplies | | | 4,771,223 | |
| | | |
See Notes to Financial Statements.
Legg Mason Partners Variable Portfolios III, Inc. 2006 Annual Report 21
Schedules of Investments (October 31, 2006) (continued)
| | | | | | | | | |
| | | |
Face
Amount | | Rating‡ | | Security | | Value | |
| | | | | | | | | |
| | Communications Equipment — 0.4% | | | | |
| $ | 1,105,000 | | B | | Lucent Technologies Inc., Debentures, 6.450% due 3/15/29 | | $ | 994,500 | |
| | | |
| | Consumer Finance — 4.6% | | | | |
| | | | | Ford Motor Credit Co.: | | | | |
| | | | | Notes: | | | | |
| | 775,000 | | B | | 7.875% due 6/15/10 | | | 756,839 | |
| | 350,000 | | B | | 9.824% due 4/15/12 (c) | | | 365,505 | |
| | 610,000 | | B | | 7.000% due 10/1/13 | | | 567,825 | |
| | | | | Senior Notes: | | | | |
| | 542,000 | | B | | 10.640% due 6/15/11 (b)(c) | | | 571,051 | |
| | 1,120,000 | | B | | 9.875% due 8/10/11 | | | 1,158,406 | |
| | | | | General Motors Acceptance Corp., Notes: | | | | |
| | 2,480,000 | | BB | | 6.875% due 8/28/12 | | | 2,489,602 | |
| | 6,240,000 | | BB | | 8.000% due 11/1/31 | | | 6,704,699 | |
| | | |
| | | | | Total Consumer Finance | | | 12,613,927 | |
| | | |
| | Containers & Packaging — 2.9% | | | | |
| | 595,000 | | CCC+ | | Berry Plastics Holding Corp., Senior Secured Notes,
8.875% due 9/15/14 (b) | | | 603,925 | |
| | 1,305,000 | | CCC+ | | Graham Packaging Co. Inc., Senior Subordinated Notes,
9.875% due 10/15/14 | | | 1,314,787 | |
| | | | | Graphic Packaging International Corp.: | | | | |
| | 1,020,000 | | B- | | Senior Notes, 8.500% due 8/15/11 | | | 1,053,150 | |
| | 380,000 | | B- | �� | Senior Subordinated Notes, 9.500% due 8/15/13 | | | 392,350 | |
| | 1,000,000 | | B- | | JSG Funding PLC, Senior Notes, 9.625% due 10/1/12 | | | 1,063,750 | |
| | 1,072,000 | | BB- | | Owens-Brockway Glass Container Inc., Senior Secured Notes,
8.875% due 2/15/09 | | | 1,104,160 | |
| | 725,000 | | B | | Plastipak Holdings Inc., Senior Notes, 8.500% due 12/15/15 (b) | | | 754,000 | |
| | 600,000 | | NR | | Radnor Holdings Corp., Senior Notes, 11.000% due 3/15/10 (a) | | | 70,500 | |
| | 345,000 | | BBB | | Sealed Air Corp., Notes, 6.950% due 5/15/09 (b) | | | 356,914 | |
| | | | | Smurfit-Stone Container Enterprises Inc., Senior Notes: | | | | |
| | 516,000 | | CCC+ | | 9.750% due 2/1/11 | | | 534,705 | |
| | 675,000 | | CCC+ | | 8.375% due 7/1/12 | | | 661,500 | |
| | | |
| | | | | Total Containers & Packaging | | | 7,909,741 | |
| | | |
| | Diversified Consumer Services — 1.6% | | | | |
| | 660,000 | | CCC+ | | Education Management LLC/Education Management Corp.,
Senior Notes, 8.750% due 6/1/14 (b) | | | 679,800 | |
| | | | | Hertz Corp.: | | | | |
| | 400,000 | | B | | Senior Notes, 8.875% due 1/1/14 (b) | | | 420,000 | |
| | 2,485,000 | | B | | Senior Subordinated Notes, 10.500% due 1/1/16 (b) | | | 2,739,712 | |
| | | | | Service Corp. International: | | | | |
| | 500,000 | | BB- | | Debentures, 7.875% due 2/1/13 | | | 517,500 | |
| | 25,000 | | BB- | | Senior Notes, 7.375% due 10/1/14 (b) | | | 25,813 | |
| | | |
| | | | | Total Diversified Consumer Services | | | 4,382,825 | |
| | | |
See Notes to Financial Statements.
22 Legg Mason Partners Variable Portfolios III, Inc. 2006 Annual Report
Schedules of Investments (October 31, 2006) (continued)
| | | | | | | | | |
| | | |
Face
Amount | | Rating‡ | | Security | | Value | |
| | | | | | | | | |
| | Diversified Financial Services — 2.6% | | | | |
| $ | 910,000 | | B- | | Basell AF SCA, Senior Secured Subordinated Second Priority Notes,
8.375% due 8/15/15 (b) | | $ | 928,200 | |
| | 160,000 | | BB | | Case Credit Corp., Notes, 6.750% due 10/21/07 | | | 161,600 | |
| | 650,000 | | CCC+ | | CCM Merger Inc., Notes, 8.000% due 8/1/13 (b) | | | 629,687 | |
| | | | | CitiSteel USA Inc., Senior Secured Notes: | | | | |
| | 345,000 | | CCC+ | | 12.949% due 9/1/10 (c) | | | 357,938 | |
| | 265,000 | | NR | | 15.000% due 10/1/10 (b)(d) | | | 287,525 | |
| | 812,000 | | B- | | Global Cash Access LLC/Global Cash Finance Corp., Senior Subordinated Notes, 8.750% due 3/15/12 | | | 861,735 | |
| | | | | Hexion U.S. Finance Corp./Hexion Nova Scotia Finance ULC: | | | | |
| | 167,000 | | B- | | Second Priority, Senior Secured Notes, 9.000% due 7/15/14 | | | 188,710 | |
| | 1,155,000 | | B- | | Senior Secured Notes, 9.750% due 11/15/14 (b) | | | 1,157,887 | |
| | 375,000 | | B- | | Hughes Network Systems LLC/HNS Finance Corp., Senior Notes,
9.500% due 4/15/14 (b) | | | 390,000 | |
| | 270,000 | | CCC | | Milacron Escrow Corp., Senior Secured Notes, 11.500% due 5/15/11 | | | 261,563 | |
| | 430,000 | | B- | | UCAR Finance Inc., Senior Notes, 10.250% due 2/15/12 | | | 454,187 | |
| | 550,000 | | B- | | UGS Corp., Senior Subordinated Notes, 10.000% due 6/1/12 | | | 596,750 | |
| | 850,000 | | CCC+ | | Vanguard Health Holdings Co. II LLC, Senior Subordinated Notes,
9.000% due 10/1/14 | | | 826,625 | |
| | | |
| | | | | Total Diversified Financial Services | | | 7,102,407 | |
| | | |
| | Diversified Telecommunication Services — 6.0% | | | | |
| | | | | Cincinnati Bell Inc.: | | | | |
| | 1,025,000 | | B- | | Senior Notes, 7.000% due 2/15/15 | | | 1,012,187 | |
| | 230,000 | | B- | | Senior Subordinated Notes, 8.375% due 1/15/14 | | | 235,750 | |
| | 130,000 | | BB- | | Cincinnati Bell Telephone Co., Senior Debentures, 6.300% due 12/1/28 | | | 115,700 | |
| | 850,000 | | BB+ | | Citizens Communications Co., Senior Notes, 9.000% due 8/15/31 | | | 927,563 | |
| | 695,000 | | NR | | GT Group Telecom Inc., Senior Discount Notes, 13.250% due 2/1/10 (a)(e)(f) | | | 0 | |
| | 895,000 | | CCC+ | | Hawaiian Telcom Communications Inc., Senior Subordinated Notes, Series B, 12.500% due 5/1/15 | | | 959,887 | |
| | 475,000 | | B+ | | Inmarsat Finance PLC, Senior Notes, 7.625% due 6/30/12 | | | 492,219 | |
| | 375,000 | | B | | Insight Midwest LP/Insight Capital Inc., Senior Notes, 10.500% due 11/1/10 | | | 389,063 | |
| | | | | Intelsat Bermuda Ltd., Senior Notes: | | | | |
| | 950,000 | | B+ | | 9.250% due 6/15/16 (b) | | | 1,018,875 | |
| | 1,920,000 | | B | | 11.250% due 6/15/16 (b) | | | 2,100,000 | |
| | 380,000 | | B | | Intelsat Ltd., Notes, 7.625% due 4/15/12 | | | 344,850 | |
| | | | | Level 3 Financing Inc., Senior Notes: | | | | |
| | 240,000 | | CCC- | | 11.800% due 3/15/11 (c) | | | 253,800 | |
| | 160,000 | | CCC- | | 10.750% due 10/15/11 | | | 170,800 | |
| | 550,000 | | CCC- | | 9.250% due 11/1/14 (b) | | | 556,188 | |
| | 630,000 | | B | | Nordic Telephone Co. Holdings, Senior Notes, 8.875% due 5/1/16 (b) | | | 663,075 | |
| | | | | NTL Cable PLC, Senior Notes: | | | | |
| | 200,000 | | B- | | 8.750% due 4/15/14 | | | 211,250 | |
| | 495,000 | | B- | | 9.125% due 8/15/16 | | | 522,844 | |
See Notes to Financial Statements.
Legg Mason Partners Variable Portfolios III, Inc. 2006 Annual Report 23
Schedules of Investments (October 31, 2006) (continued)
| | | | | | | | | |
| | | |
Face
Amount | | Rating‡ | | Security | | Value | |
| | | | | | | | | |
| | Diversified Telecommunication Services — 6.0% (continued) | | | | |
| $ | 361,000 | | B | | PanAmSat Corp., Senior Notes, 9.000% due 8/15/14 | | $ | 379,050 | |
| | | | | Qwest Communications International Inc., Senior Notes: | | | | |
| | 180,000 | | B | | 7.500% due 2/15/14 | | | 184,500 | |
| | 935,000 | | B | | Series B, 7.500% due 2/15/14 | | | 958,375 | |
| | | | | Qwest Corp.: | | | | |
| | 1,890,000 | | BB | | Notes, 8.875% due 3/15/12 | | | 2,088,450 | |
| | 1,385,000 | | BB | | Senior Notes, 7.500% due 10/1/14 (b) | | | 1,457,712 | |
| | 1,310,000 | | B- | | Wind Acquisition Finance SA, Senior Bond, 10.750% due 12/1/15 (b) | | | 1,462,287 | |
| | | |
| | | | | Total Diversified Telecommunication Services | | | 16,504,425 | |
| | | |
| | Electric Utilities — 0.6% | | | | |
| | 375,660 | | BB- | | Midwest Generation LLC, Pass-Through Certificates, Series B, 8.560% due 1/2/16 | | | 405,948 | |
| | 1,165,000 | | B- | | Orion Power Holdings Inc., Senior Notes, 12.000% due 5/1/10 | | | 1,328,100 | |
| | | |
| | | | | Total Electric Utilities | | | 1,734,048 | |
| | | |
| | Electronic Equipment & Instruments — 0.3% | | | | |
| | | | | NXP BV/NXP Funding LLC: | | | | |
| | 200,000 | | B+ | | Senior Notes, 9.500% due 10/15/15 (b) | | | 202,750 | |
| | 630,000 | | BB+ | | Senior Secured Bonds, 7.875% due 10/15/14 (b) | | | 642,600 | |
| | | |
| | | | | Total Electronic Equipment & Instruments | | | 845,350 | |
| | | |
| | Energy Equipment & Services — 1.9% | | | | |
| | 995,000 | | B+ | | ANR Pipeline Co., Debentures, 9.625% due 11/1/21 | | | 1,243,305 | |
| | 286,000 | | B | | Dresser-Rand Group Inc., Senior Subordinated Notes, 7.375% due 11/1/14 | | | 284,213 | |
| | 140,000 | | B | | GulfMark Offshore Inc., Senior Subordinated Notes, 7.750% due 7/15/14 | | | 141,400 | |
| | 1,000,000 | | B | | Hanover Compressor Co., Senior Subordinated Notes, 8.625% due 12/15/10 | | | 1,045,000 | |
| | 320,000 | | BB- | | Pride International Inc., Senior Notes, 7.375% due 7/15/14 | | | 332,000 | |
| | 1,780,000 | | B+ | | Tennessee Gas Pipeline Co., Bonds, 8.375% due 6/15/32 | | | 2,078,308 | |
| | | |
| | | | | Total Energy Equipment & Services | | | 5,124,226 | |
| | | |
| | Food & Staples Retailing — 0.5% | | | | |
| | 1,125,000 | | BB+ | | Delhaize America Inc., Debentures, 9.000% due 4/15/31 | | | 1,325,462 | |
| | | |
| | Food Products — 0.4% | | | | |
| | | | | Dole Food Co. Inc., Senior Notes: | | | | |
| | 1,200,000 | | B | | 7.250% due 6/15/10 | | | 1,125,000 | |
| | 44,000 | | B | | 8.875% due 3/15/11 | | | 42,185 | |
| | | |
| | | | | Total Food Products | | | 1,167,185 | |
| | | |
| | Health Care Providers & Services — 5.2% | | | | |
| | 1,150,000 | | B- | | AmeriPath Inc., Senior Subordinated Notes, 10.500% due 4/1/13 | | | 1,242,000 | |
| | 725,000 | | B | | Community Health Systems Inc., Senior Subordinated Notes,
6.500% due 12/15/12 | | | 696,906 | |
See Notes to Financial Statements.
24 Legg Mason Partners Variable Portfolios III, Inc. 2006 Annual Report
Schedules of Investments (October 31, 2006) (continued)
| | | | | | | | | |
| | | |
Face
Amount | | Rating‡ | | Security | | Value | |
| | | | | | | | | |
| | Health Care Providers & Services — 5.2% (continued) | | | | |
| | | | | DaVita Inc.: | | | | |
| $ | 650,000 | | B | | Senior Notes, 6.625% due 3/15/13 | | $ | 643,500 | |
| | 1,005,000 | | B | | Senior Subordinated Notes, 7.250% due 3/15/15 | | | 1,005,000 | |
| | | | | HCA Inc.: | | | | |
| | 435,000 | | B- | | Debentures, 7.500% due 11/15/95 | | | 324,389 | |
| | 2,925,000 | | B- | | Notes, 6.375% due 1/15/15 | | | 2,347,312 | |
| | 1,875,000 | | B- | | IASIS Healthcare LLC/IASIS Capital Corp., Senior Subordinated Notes, 8.750% due 6/15/14 | | | 1,821,094 | |
| | 700,000 | | BB+ | | Omnicare Inc., Senior Subordinated Notes, 6.875% due 12/15/15 | | | 689,500 | |
| | 583,000 | | B- | | Psychiatric Solutions Inc., Senior Subordinated Notes,
10.625% due 6/15/13 | | | 638,385 | |
| | | | | Tenet Healthcare Corp., Senior Notes: | | | | |
| | 650,000 | | CCC+ | | 7.375% due 2/1/13 | | | 579,313 | |
| | 2,970,000 | | CCC+ | | 9.875% due 7/1/14 | | | 2,921,737 | |
| | 1,425,000 | | B+ | | Triad Hospitals Inc., Senior Subordinated Notes,
7.000% due 11/15/13 | | | 1,392,938 | |
| | | |
| | | | | Total Health Care Providers & Services | | | 14,302,074 | |
| | | |
| | Hotels, Restaurants & Leisure — 5.4% | | | | |
| | 1,300,000 | | B+ | | Boyd Gaming Corp., Senior Subordinated Notes, 6.750% due 4/15/14 | | | 1,278,875 | |
| | 160,000 | | CCC | | Buffets Inc., Senior Notes, 12.500% due 11/1/14 (b) | | | 161,600 | |
| | 1,400,000 | | BB- | | Caesars Entertainment Inc., Senior Subordinated Notes,
8.125% due 5/15/11 | | | 1,436,750 | |
| | 725,000 | | B- | | Carrols Corp., Senior Subordinated Notes, 9.000% due 1/15/13 | | | 737,687 | |
| | 585,000 | | CCC+ | | Denny’s Holdings Inc., Senior Notes, 10.000% due 10/1/12 | | | 611,325 | |
| | 520,000 | | B- | | Gaylord Entertainment Co., Senior Notes, 6.750% due 11/15/14 | | | 500,500 | |
| | 1,300,000 | | B- | | Herbst Gaming Inc., Senior Subordinated Notes, 8.125% due 6/1/12 | | | 1,339,000 | |
| | | | | Hilton Hotels Corp.: | | | | |
| | 250,000 | | BB | | Notes, 7.625% due 12/1/12 | | | 265,973 | |
| | 510,000 | | BB | | Senior Notes, 7.950% due 4/15/07 | | | 515,738 | |
| | 1,345,000 | | B- | | Inn of the Mountain Gods Resort & Casino, Senior Notes,
12.000% due 11/15/10 | | | 1,445,875 | |
| | 1,375,000 | | B | | Isle of Capri Casinos Inc., Senior Subordinated Notes,
7.000% due 3/1/14 | | | 1,326,875 | |
| | 1,150,000 | | B | | Las Vegas Sands Corp., Senior Notes, 6.375% due 2/15/15 | | | 1,086,750 | |
| | 260,000 | | B+ | | Mandalay Resort Group, Senior Subordinated Debentures,
7.625% due 7/15/13 | | | 255,125 | |
| | 1,275,000 | | BB | | MGM MIRAGE Inc., Senior Notes, 6.750% due 9/1/12 | | | 1,243,125 | |
| | 750,000 | | B+ | | Mohegan Tribal Gaming Authority, Senior Subordinated Notes,
6.875% due 2/15/15 | | | 748,125 | |
| | 115,000 | | B+ | | River Rock Entertainment Authority, Senior Notes,
9.750% due 11/1/11 | | | 123,625 | |
| | 100,000 | | BB | | Seneca Gaming Corp., Senior Notes, 7.250% due 5/1/12 | | | 101,125 | |
| | | | | Station Casinos Inc.: | | | | |
| | 260,000 | | BB- | | Senior Notes, 7.750% due 8/15/16 | | | 268,450 | |
| | 1,225,000 | | B+ | | Senior Subordinated Notes, 6.875% due 3/1/16 | | | 1,130,062 | |
See Notes to Financial Statements.
Legg Mason Partners Variable Portfolios III, Inc. 2006 Annual Report 25
Schedules of Investments (October 31, 2006) (continued)
| | | | | | | | | |
| | | |
Face
Amount | | Rating‡ | | Security | | Value | |
| | | | | | | | | |
| | Hotels, Restaurants & Leisure — 5.4% (continued) | | | | |
| $ | 275,000 | | B+ | | Turning Stone Casino Resort Enterprise, Senior Notes,
9.125% due 12/15/10 (b) | | $ | 281,875 | |
| | | |
| | | | | Total Hotels, Restaurants & Leisure | | | 14,858,460 | |
| | | |
| | Household Durables — 2.6% | | | | |
| | 105,000 | | BB+ | | American Greetings Corp., Senior Notes, 7.375% due 6/1/16 | | | 107,363 | |
| | | | | Beazer Homes USA Inc., Senior Notes: | | | | |
| | 100,000 | | BB | | 6.875% due 7/15/15 | | | 94,500 | |
| | 580,000 | | BB | | 8.125% due 6/15/16 | | | 593,050 | |
| | 320,000 | | BBB- | | D.R. Horton Inc., Senior Notes, 8.000% due 2/1/09 | | | 336,501 | |
| | 900,000 | | B | | Interface Inc., Senior Notes, 10.375% due 2/1/10 | | | 990,000 | |
| | | | | K Hovnanian Enterprises Inc., Senior Notes: | | | | |
| | 1,300,000 | | BB | | 7.500% due 5/15/16 | | | 1,267,500 | |
| | 775,000 | | BB | | 8.625% due 1/15/17 | | | 803,094 | |
| | 785,000 | | B- | | Norcraft Cos. LP/Norcraft Finance Corp., Senior Subordinated Notes, 9.000% due 11/1/11 | | | 808,550 | |
| | 910,000 | | B- | | Norcraft Holdings LP/Norcraft Capital Corp., Senior Discount Notes, step bond to yield 10.368% due 9/1/12 | | | 757,575 | |
| | 1,200,000 | | B | | Sealy Mattress Co., Senior Subordinated Notes, 8.250% due 6/15/14 | | | 1,251,000 | |
| | | |
| | | | | Total Household Durables | | | 7,009,133 | |
| | | |
| | Household Products — 0.6% | | | | |
| | | | | Nutro Products Inc.: | | | | |
| | 150,000 | | CCC | | Senior Notes, 9.400% due 10/15/13 (b)(c) | | | 154,875 | |
| | 400,000 | | CCC | | Senior Subordinated Notes, 10.750% due 4/15/14 (b) | | | 432,000 | |
| | | | | Spectrum Brands Inc., Senior Subordinated Notes: | | | | |
| | 460,000 | | CCC | | 8.500% due 10/1/13 | | | 402,500 | |
| | 270,000 | | CCC | | 7.375% due 2/1/15 | | | 220,050 | |
| | 555,000 | | B- | | Visant Holding Corp., Senior Notes, 8.750% due 12/1/13 | | | 571,650 | |
| | | |
| | | | | Total Household Products | | | 1,781,075 | |
| | | |
| | Independent Power Producers & Energy Traders — 3.8% | | | | |
| | 305,000 | | B+ | | AES China Generating Co., Ltd., Class A, 8.250% due 6/26/10 | | | 302,350 | |
| | | | | AES Corp.: | | | | |
| | | | | Senior Notes: | | | | |
| | 1,470,000 | | B | | 9.500% due 6/1/09 | | | 1,582,087 | |
| | 1,095,000 | | B | | 7.750% due 3/1/14 | | | 1,152,487 | |
| | 240,000 | | BB- | | Senior Secured Notes, 9.000% due 5/15/15 (b) | | | 259,500 | |
| | | | | Dynegy Holdings Inc.: | | | | |
| | 1,250,000 | | B- | | Senior Debentures, 7.625% due 10/15/26 | | | 1,168,750 | |
| | 195,000 | | B- | | Senior Notes, 8.375% due 5/1/16 | | | 201,338 | |
| | | | | Edison Mission Energy, Senior Notes: | | | | |
| | 325,000 | | BB- | | 7.730% due 6/15/09 | | | 339,625 | |
| | 160,000 | | BB- | | 7.500% due 6/15/13 (b) | | | 165,200 | |
| | 880,000 | | BB- | | 7.750% due 6/15/16 (b) | | | 913,000 | |
| | 1,065,000 | | B- | | Mirant North America LLC, Senior Notes, 7.375% due 12/31/13 | | | 1,082,306 | |
See Notes to Financial Statements.
26 Legg Mason Partners Variable Portfolios III, Inc. 2006 Annual Report
Schedules of Investments (October 31, 2006) (continued)
| | | | | | | | | |
| | | |
Face
Amount | | Rating‡ | | Security | | Value | |
| | | | | | | | | |
| | Independent Power Producers & Energy Traders — 3.8% (continued) | | | | |
| | | | | NRG Energy Inc., Senior Notes: | | | | |
| $ | 525,000 | | B- | | 7.250% due 2/1/14 | | $ | 532,219 | |
| | 2,665,000 | | B- | | 7.375% due 2/1/16 | | | 2,701,644 | |
| | | |
| | | | | Total Independent Power Producers & Energy Traders | | | 10,400,506 | |
| | | |
| | Industrial Conglomerates — 0.1% | | | | |
| | 245,000 | | BB- | | Sequa Corp., Senior Notes, 9.000% due 8/1/09 | | | 259,700 | |
| | | |
| | Insurance — 0.6% | | | | |
| | 1,570,000 | | BB | | Crum & Forster Holdings Corp., Senior Notes, 10.375% due 6/15/13 | | | 1,636,725 | |
| | | |
| | Internet & Catalog Retail — 0.6% | | | | |
| | 445,000 | | B | | Brookstone Co. Inc., Senior Secured Notes, 12.000% due 10/15/12 | | | 431,650 | |
| | 1,264,000 | | B- | | FTD Inc., Senior Subordinated Notes, 7.750% due 2/15/14 | | | 1,264,000 | |
| | | |
| | | | | Total Internet & Catalog Retail | | | 1,695,650 | |
| | | |
| | IT Services — 0.7% | | | | |
| | | | | Sungard Data Systems Inc.: | | | | |
| | 750,000 | | B- | | Senior Notes, 9.125% due 8/15/13 | | | 781,875 | |
| | 1,120,000 | | B- | | Senior Subordinated Notes, 10.250% due 8/15/15 | | | 1,178,800 | |
| | | |
| | | | | Total IT Services | | | 1,960,675 | |
| | | |
| | Leisure Equipment & Products — 0.3% | | | | |
| | 735,000 | | B | | WMG Acquisition Corp., Senior Subordinated Notes, 7.375% due 4/15/14 | | | 722,138 | |
| | | |
| | Machinery — 0.5% | | | | |
| | 245,000 | | B+ | | Commercial Vehicle Group Inc., Senior Notes,
8.000% due 7/1/13 | | | 238,875 | |
| | 845,000 | | B | | Mueller Group Inc., Senior Subordinated Notes,
10.725% due 5/1/12 | | | 925,275 | |
| | 205,000 | | B | | Mueller Holdings Inc., Senior Discount Notes, step bond to yield
10.725% due 4/15/14 | | | 181,425 | |
| | | |
| | | | | Total Machinery | | | 1,345,575 | |
| | | |
| | Media — 10.9% | | | | | | |
| | | | | Affinion Group Inc.: | | | | |
| | 1,070,000 | | B- | | Senior Notes, 10.125% due 10/15/13 | | | 1,139,550 | |
| | 135,000 | | B- | | Senior Subordinated Notes, 11.500% due 10/15/15 | | | 141,413 | |
| | | | | AMC Entertainment Inc.: | | | | |
| | 155,000 | | B- | | Senior Notes, Series B, 8.625% due 8/15/12 | | | 160,619 | |
| | 1,660,000 | | CCC+ | | Senior Subordinated Notes, 11.000% due 2/1/16 | | | 1,844,675 | |
| | 891,000 | | CCC- | | CCH I Holdings LLC, Senior Notes, 13.500% due 1/15/14 | | | 833,085 | |
| | | | | CCH I Holdings LLC/CCH I Holdings Capital Corp.: | | | | |
| | 25,000 | | CCC- | | Senior Notes, 11.750% due 5/15/14 | | | 21,438 | |
| | 48,000 | | CCC(g) | | Senior Secured Notes, 11.000% due 10/1/15 (b) | | | 46,320 | |
| | 1,540,000 | | CCC- | | CCH I LLC/CCH Capital Corp., Senior Secured Notes, 11.000% due 10/1/15 | | | 1,491,875 | |
See Notes to Financial Statements.
Legg Mason Partners Variable Portfolios III, Inc. 2006 Annual Report 27
Schedules of Investments (October 31, 2006) (continued)
| | | | | | | | | |
| | | |
Face
Amount | | Rating‡ | | Security | | Value | |
| | | | | | | | | |
| | Media — 10.9% (continued) | | | | |
| | | | | CCH II LLC/CCH II Capital Corp., Senior Notes: | | | | |
| $ | 1,340,000 | | CCC- | | 10.250% due 9/15/10 | | $ | 1,390,250 | |
| | 981,000 | | CCC(g) | | 10.250% due 10/1/13 (b) | | | 1,015,335 | |
| | 225,000 | | CCC- | | Charter Communications Holdings LLC, Senior Discount Notes, step bond to yield 15.518% due 1/15/12 | | | 196,875 | |
| | 400,000 | | BB- | | Chukchansi Economic Development Authority, Senior Notes,
8.000% due 11/15/13 (b) | | | 418,000 | |
| | 830,000 | | CCC | | CMP Susquehanna Corp., Senior Subordinated Notes,
9.875% due 5/15/14 (b) | | | 806,137 | |
| | | | | CSC Holdings Inc.: | | | | |
| | 770,000 | | B+ | | Senior Debentures, 7.625% due 7/15/18 | | | 762,300 | |
| | 40,000 | | B+ | | Senior Debentures, Series B, 8.125% due 8/15/09 | | | 41,450 | |
| | | | | Senior Notes: | | | | |
| | 740,000 | | B+ | | 6.750% due 4/15/12 (b) | | | 733,525 | |
| | | | | Series B: | | | | |
| | 360,000 | | B+ | | 8.125% due 7/15/09 | | | 373,050 | |
| | 260,000 | | B+ | | 7.625% due 4/1/11 | | | 263,575 | |
| | 504,000 | | B | | Dex Media East LLC/Dex Media East Finance Co., Senior Notes, Series B, 12.125% due 11/15/12 | | | 563,220 | |
| | 1,001,000 | | B | | Dex Media West LLC/Dex Media Finance Co., Senior Subordinated Notes, Series B, 9.875% due 8/15/13 | | | 1,092,341 | |
| | | | | DIRECTV Holdings LLC/DIRECTV Financing Co. Inc., Senior Notes: | | | | |
| | 527,000 | | BB- | | 8.375% due 3/15/13 | | | 549,398 | |
| | 335,000 | | BB- | | 6.375% due 6/15/15 | | | 322,438 | |
| | | | | EchoStar DBS Corp., Senior Notes: | | | | |
| | 910,000 | | BB- | | 7.000% due 10/1/13 (b) | | | 906,587 | |
| | 2,050,000 | | BB- | | 6.625% due 10/1/14 | | | 1,983,375 | |
| | 615,000 | | BB- | | 7.125% due 2/1/16 (b) | | | 604,237 | |
| | | | | Houghton Mifflin Co.: | | | | |
| | 1,100,000 | | CCC+ | | Senior Discount Notes, step bond to yield 10.515% due 10/15/13 | | | 998,250 | |
| | 95,000 | | CCC+ | | Senior Subordinated Notes, 9.875% due 2/1/13 | | | 102,244 | |
| | 1,065,000 | | CCC+ | | Insight Communications Co. Inc., Senior Discount Notes,
12.250% due 2/15/11 | | | 1,126,237 | |
| | 235,000 | | CCC- | | ION Media Networks Inc., Secured Notes,
11.624% due 1/15/13 (b)(c) | | | 236,469 | |
| | 1,530,000 | | B- | | Kabel Deutschland GMBH, Senior Notes, 10.625% due 7/1/14 (b) | | | 1,661,962 | |
| | 580,000 | | B | | Lamar Media Corp., Senior Subordinated Notes, 6.625% due 8/15/15 | | | 561,150 | |
| | 1,125,000 | | B- | | LodgeNet Entertainment Corp., Senior Subordinated Notes, 9.500% due 6/15/13 | | | 1,209,375 | |
| | 870,000 | | B | | Primedia Inc., Senior Notes, 8.875% due 5/15/11 | | | 867,825 | |
| | 590,000 | | B | | Quebecor Media Inc., Senior Notes, 7.750% due 3/15/16 | | | 598,850 | |
| | | | | R.H. Donnelley Corp., Senior Discount Notes: | | | | |
| | 300,000 | | B | | Series A-1, 6.875% due 1/15/13 | | | 283,875 | |
| | 550,000 | | B | | Series A-2, 6.875% due 1/15/13 | | | 520,438 | |
| | 175,000 | | B | | R.H. Donnelley Finance Corp. I, Senior Subordinated Notes, 10.875% due 12/15/12 (b) | | | 192,281 | |
See Notes to Financial Statements.
28 Legg Mason Partners Variable Portfolios III, Inc. 2006 Annual Report
Schedules of Investments (October 31, 2006) (continued)
| | | | | | | | | |
| | | |
Face
Amount | | Rating‡ | | Security | | Value | |
| | | | | | | | | |
| | Media — 10.9% (continued) | | | | |
| $ | 400,000 | | B | | R.H. Donnelley Inc., Senior Subordinated Notes, 10.875% due 12/15/12 | | $ | 439,500 | |
| | | | | Rainbow National Services LLC: | | | | |
| | 530,000 | | B+ | | Senior Notes, 8.750% due 9/1/12 (b) | | | 559,812 | |
| | 620,000 | | B+ | | Senior Subordinated Debentures, 10.375% due 9/1/14 (b) | | | 692,850 | |
| | | | | Rogers Cable Inc.: | | | | |
| | 130,000 | | BB+ | | Secured Notes, 5.500% due 3/15/14 | | | 122,850 | |
| | | | | Senior Secured Second Priority Notes: | | | | |
| | 90,000 | | BB+ | | 6.250% due 6/15/13 | | | 89,325 | |
| | 1,040,000 | | BB+ | | 6.750% due 3/15/15 | | | 1,053,000 | |
| | | | | XM Satellite Radio Inc., Senior Notes: | | | | |
| | 290,000 | | CCC | | 9.989% due 5/1/13 (c) | | | 274,050 | |
| | 605,000 | | CCC | | 9.750% due 5/1/14 | | | 577,775 | |
| | | |
| | | | | Total Media | | | 29,869,186 | |
| | | |
| | Metals & Mining — 0.9% | | | | |
| | 1,465,000 | | B- | | Metals USA Inc., Senior Secured Notes, 11.125% due 12/1/15 | | | 1,611,500 | |
| | 735,000 | | B- | | RathGibson Inc., Senior Notes, 11.250% due 2/15/14 (b) | | | 768,075 | |
| | | |
| | | | | Total Metals & Mining | | | 2,379,575 | |
| | | |
| | Multi-Utilities — 0.1% | | | | |
| | 180,000 | | BB+ | | Avista Corp., Senior Notes, 9.750% due 6/1/08 | | | 190,927 | |
| | | |
| | Multiline Retail — 0.9% | | | | |
| | | | | Neiman Marcus Group Inc.: | | | | |
| | 1,510,000 | | B- | | Senior Notes, 9.000% due 10/15/15 | | | 1,627,025 | |
| | 210,000 | | B- | | Senior Subordinated Notes, 10.375% due 10/15/15 | | | 230,738 | |
| | 667,000 | | B+ | | Saks Inc., Notes, 9.875% due 10/1/11 | | | 727,030 | |
| | | |
| | | | | Total Multiline Retail | | | 2,584,793 | |
| | | |
| | Office Electronics — 0.9% | | | | |
| | 1,375,000 | | B+ | | Xerox Capital Trust I Exchange Capital Securities, 8.000% due 2/1/27 | | | 1,411,094 | |
| | 1,030,000 | | BB+ | | Xerox Corp., Senior Notes, 6.400% due 3/15/16 | | | 1,037,725 | |
| | | |
| | | | | Total Office Electronics | | | 2,448,819 | |
| | | |
| | Oil, Gas & Consumable Fuels — 9.7% | | | | |
| | 700,000 | | B- | | Alpha Natural Resources LLC/Alpha Natural Resources Capital Corp., Senior Notes, 10.000% due 6/1/12 | | | 756,000 | |
| | 1,360,000 | | CCC+ | | Belden & Blake Corp., Secured Notes, 8.750% due 7/15/12 | | | 1,394,000 | |
| | | | | Chesapeake Energy Corp., Senior Notes: | | | | |
| | 2,325,000 | | BB | | 6.375% due 6/15/15 | | | 2,255,250 | |
| | 235,000 | | BB | | 6.500% due 8/15/17 | | | 222,663 | |
| | 550,000 | | BB | | 6.250% due 1/15/18 | | | 523,875 | |
| | 842,000 | | BB- | | Cimarex Energy Co., Senior Notes, 9.600% due 3/15/12 | | | 890,415 | |
| | 295,000 | | BB- | | Compagnie Generale de Geophysique SA, Senior Notes, 7.500% due 5/15/15 | | | 292,788 | |
| | | | | El Paso Corp., Medium-Term Notes: | | | | |
| | 1,735,000 | | B | | 7.800% due 8/1/31 | | | 1,817,412 | |
| | 1,305,000 | | B | | 7.750% due 1/15/32 | | | 1,366,987 | |
See Notes to Financial Statements.
Legg Mason Partners Variable Portfolios III, Inc. 2006 Annual Report 29
Schedules of Investments (October 31, 2006) (continued)
| | | | | | | | | |
| | | |
Face
Amount | | Rating‡ | | Security | | Value | |
| | | | | | | | | |
| | Oil, Gas & Consumable Fuels — 9.7% (continued) | | | | |
| $ | 620,000 | | B+ | | Enterprise Products Operating LP, Junior Subordinated Notes, 8.375% due 8/1/66 (c) | | $ | 667,444 | |
| | 1,300,000 | | B- | | EXCO Resources Inc., Senior Notes, 7.250% due 1/15/11 | | | 1,257,750 | |
| | 675,000 | | B | | Inergy LP/Inergy Finance Corp., Senior Notes, 6.875% due 12/15/14 | | | 656,438 | |
| | 795,000 | | CCC+ | | International Coal Group Inc., Senior Notes, 10.250% due 7/15/14 (b) | | | 777,112 | |
| | 495,000 | | B- | | Mariner Energy Inc., Senior Notes, 7.500% due 4/15/13 (b) | | | 477,675 | |
| | 400,000 | | B+ | | OMI Corp., Senior Notes, 7.625% due 12/1/13 | | | 410,000 | |
| | 660,000 | | B- | | Petrohawk Energy Corp., Senior Notes, 9.125% due 7/15/13 (b) | | | 676,500 | |
| | 955,000 | | B+ | | Plains Exploration & Production Co., Senior Subordinated Notes, Series B, 8.750% due 7/1/12 | | | 1,019,462 | |
| | | | | Pogo Producing Co., Senior Subordinated Notes: | | | | |
| | 10,000 | | B+ | | 7.875% due 5/1/13 (b) | | | 10,225 | |
| | 1,220,000 | | B+ | | 6.875% due 10/1/17 | | | 1,168,150 | |
| | 195,000 | | B+ | | Series B, 8.250% due 4/15/11 | | | 201,338 | |
| | 1,485,000 | | B1(h) | | SemGroup LP, Senior Notes, 8.750% due 11/15/15 (b) | | | 1,503,562 | |
| | 55,000 | | BB- | | SESI LLC, Senior Notes, 6.875% due 6/1/14 (b) | | | 54,863 | |
| | 1,450,000 | | B- | | Stone Energy Corp., Senior Subordinated Notes, 6.750% due 12/15/14 | | | 1,392,000 | |
| | 1,185,000 | | B | | Swift Energy Co., Senior Subordinated Notes, 9.375% due 5/1/12 | | | 1,253,137 | |
| | 455,000 | | A- | | Vintage Petroleum Inc., Senior Notes, 8.250% due 5/1/12 | | | 479,483 | |
| | 460,000 | | B | | Whiting Petroleum Corp., Senior Subordinated Notes,
7.000% due 2/1/14 | | | 455,400 | |
| | | | | Williams Cos. Inc.: | | | | |
| | | | | Notes: | | | | |
| | 865,000 | | BB- | | 7.875% due 9/1/21 | | | 919,062 | |
| | 2,650,000 | | BB- | | 8.750% due 3/15/32 | | | 2,954,750 | |
| | 600,000 | | BB- | | Senior Notes, 7.625% due 7/15/19 | | | 634,500 | |
| | | |
| | | | | Total Oil, Gas & Consumable Fuels | | | 26,488,241 | |
| �� | | |
| | Paper & Forest Products — 1.7% | | | | |
| | 1,400,000 | | B | | Appleton Papers Inc., Senior Subordinated Notes, Series B, 9.750% due 6/15/14 | | | 1,393,000 | |
| | 535,000 | | B+ | | Domtar Inc., Notes, 5.375% due 12/1/13 | | | 472,806 | |
| | 1,455,000 | | CCC+ | | NewPage Corp., Senior Subordinated Notes, 12.000% due 5/1/13 | | | 1,527,750 | |
| | 270,000 | | BB+ | | P.H. Glatfelter, Senior Notes, 7.125% due 5/1/16 (b) | | | 270,559 | |
| | | | | Verso Paper Holdings LLC: | | | | |
| | 305,000 | | B+ | | Senior Secured Notes, 9.125% due 8/1/14 (b) | | | 311,100 | |
| | 625,000 | | B- | | Senior Subordinated Notes, 11.375% due 8/1/16 (b) | | | 637,500 | |
| | | |
| | | | | Total Paper & Forest Products | | | 4,612,715 | |
| | | |
| | Personal Products — 0.2% | | | | |
| | 540,000 | | B+ | | Playtex Products Inc., Senior Secured Notes, 8.000% due 3/1/11 | | | 565,650 | |
| | | |
| | Pharmaceuticals — 0.4% | | | | |
| | 1,185,000 | | CCC | | Leiner Health Products Inc., Senior Subordinated Notes, 11.000% due 6/1/12 | | | 1,176,113 | |
| | | |
| | Real Estate Investment Trusts (REITs) — 1.9% | | | | |
| | 40,000 | | BB- | | Forest City Enterprises Inc., Senior Notes, 7.625% due 6/1/15 | | | 40,800 | |
See Notes to Financial Statements.
30 Legg Mason Partners Variable Portfolios III, Inc. 2006 Annual Report
Schedules of Investments (October 31, 2006) (continued)
| | | | | | | | | |
| | | |
Face
Amount | | Rating‡ | | Security | | Value | |
| | | | | | | | | |
| | Real Estate Investment Trusts (REITs) — 1.9% (continued) | | | | |
| | | | | Host Marriott LP: | | | | |
| | | | | Senior Notes: | | | | |
| $ | 625,000 | | BB | | 7.125% due 11/1/13 | | $ | 635,156 | |
| | 1,020,000 | | BB | | Series I, 9.500% due 1/15/07 | | | 1,031,475 | |
| | 1,125,000 | | BB | | Series O, 6.375% due 3/15/15 | | | 1,101,094 | |
| | 700,000 | | BB | | Series Q, 6.750% due 6/1/16 | | | 685,125 | |
| | 770,000 | | B | | Kimball Hill Inc., Senior Subordinated Notes, 10.500% due 12/15/12 | | | 696,850 | |
| | | | | Ventas Realty LP/Ventas Capital Corp., Senior Notes: | | | | |
| | 230,000 | | BB+ | | 7.125% due 6/1/15 | | | 237,762 | |
| | 225,000 | | BB+ | | 6.500% due 6/1/16 | | | 225,563 | |
| | 575,000 | | BB+ | | 6.750% due 4/1/17 | | | 582,187 | |
| | | |
| | | | | Total Real Estate Investment Trusts (REITs) | | | 5,236,012 | |
| | | |
| | Real Estate Management & Development — 0.0% | |
| | 125,000 | | B- | | Ashton Woods USA LLC/Ashton Woods Finance Co., Senior Subordinated Notes, 9.500% due 10/1/15 | | | 107,813 | |
| | | |
| | Road & Rail — 0.8% | |
| | | | | Grupo Transportacion Ferroviaria Mexicana SA de CV, Senior Notes: | | | | |
| | 170,000 | | B- | | 10.250% due 6/15/07 | | | 174,463 | |
| | 1,230,000 | | B- | | 9.375% due 5/1/12 | | | 1,319,175 | |
| | 50,000 | | B- | | 12.500% due 6/15/12 | | | 55,000 | |
| | 433,000 | | CCC+ | | Horizon Lines LLC/Horizon Lines Holding Co., Senior Notes,
9.000% due 11/1/12 | | | 454,650 | |
| | 240,000 | | B- | | Kansas City Southern Railway, Senior Notes, 7.500% due 6/15/09 | | | 243,900 | |
| | | |
| | | | | Total Road & Rail | | | 2,247,188 | |
| | | |
| | Software — 0.6% | |
| | 640,000 | | CCC+ | | Activant Solutions Inc., Senior Subordinated Notes,
9.500% due 5/1/16 (b) | | | 598,400 | |
| | 945,000 | | B- | | UGS Capital Corp. II, Senior Subordinated Notes,
10.380% due 6/1/11 (b)(c)(d) | | | 980,438 | |
| | | |
| | | | | Total Software | | | 1,578,838 | |
| | | |
| | Specialty Retail — 1.4% | |
| | 540,000 | | B | | Asbury Automotive Group Inc., Senior Subordinated Notes,
9.000% due 6/15/12 | | | 561,600 | |
| | | | | AutoNation Inc. Senior Notes: | | | | |
| | 240,000 | | BB+ | | 7.374% due 4/15/13 (c) | | | 243,000 | |
| | 300,000 | | BB+ | | 7.000% due 4/15/14 | | | 300,000 | |
| | 635,000 | | CCC | | Blockbuster Inc., Senior Subordinated Notes, 9.000% due 9/1/12 | | | 574,675 | |
| | 205,000 | | CCC+ | | EPL Finance Corp., Senior Notes, 11.750% due 11/15/13 (b) | | | 219,350 | |
| | 185,000 | | CCC+ | | Eye Care Centers of America, Senior Subordinated Notes,
10.750% due 2/15/15 | | | 203,038 | |
| | 125,000 | | B | | Linens ‘n Things Inc., Senior Secured Notes, 10.999% due 1/15/14 (c) | | | 123,125 | |
| | 240,000 | | CCC | | Michaels Stores Inc., Senior Subordinated Notes,
11.375% due 11/1/16 (b) | | | 241,500 | |
See Notes to Financial Statements.
Legg Mason Partners Variable Portfolios III, Inc. 2006 Annual Report 31
Schedules of Investments (October 31, 2006) (continued)
| | | | | | | | | |
| | | |
Face
Amount | | Rating‡ | | Security | | Value | |
| | | | | | | | | |
| | Specialty Retail — 1.4% (continued) | |
| $ | 1,435,000 | | B- | | Suburban Propane Partners LP/Suburban Energy Finance Corp., Senior Notes, 6.875% due 12/15/13 | | $ | 1,388,362 | |
| | | |
| | | | | Total Specialty Retail | | | 3,854,650 | |
| | | |
| | Textiles, Apparel & Luxury Goods — 0.8% | |
| | 1,430,000 | | B- | | Levi Strauss & Co., Senior Notes, 9.750% due 1/15/15 | | | 1,522,950 | |
| | 600,000 | | B | | Oxford Industries Inc., Senior Notes, 8.875% due 6/1/11 | | | 618,750 | |
| | | |
| | | | | Total Textiles, Apparel & Luxury Goods | | | 2,141,700 | |
| | | |
| | Thrifts & Mortgage Finance — 0.4% | |
| | 1,075,000 | | CCC- | | Ocwen Capital Trust I, Capital Securities, 10.875% due 8/1/27 | | | 1,139,500 | |
| | | |
| | Tobacco — 0.1% | |
| | 220,000 | | B- | | Alliance One International Inc., Senior Notes, 11.000% due 5/15/12 | | | 229,900 | |
| | | |
| | Trading Companies & Distributors — 1.1% | |
| | 565,000 | | B | | Ashtead Capital Inc., Notes, 9.000% due 8/15/16 (b) | | | 597,487 | |
| | 415,000 | | B+ | | H&E Equipment Services Inc., Senior Notes, 8.375% due 7/15/16 (b) | | | 430,563 | |
| | 1,145,000 | | CCC+ | | Penhall International Corp., Senior Secured Notes, 12.000% due 8/1/14 (b) | | | 1,225,150 | |
| | 645,000 | | B- | | Transdigm Inc., Senior Subordinated Notes, 7.750% due 7/15/14 (b) | | | 665,962 | |
| | | |
| | | | | Total Trading Companies & Distributors | | | 2,919,162 | |
| | | |
| | Wireless Telecommunication Services — 2.2% | |
| | 240,000 | | CCC | | Metropcs Wireless Inc., Senior Notes, 9.250% due 11/1/14 (b) | | | 243,300 | |
| | 1,775,000 | | BBB+ | | Nextel Communications Inc., Senior Notes, Series E,
6.875% due 10/31/13 | | | 1,815,612 | |
| | 130,000 | | BB+ | | Rogers Wireless Communications Inc., Senior Secured Notes,
7.250% due 12/15/12 | | | 137,150 | |
| | 320,000 | | BB- | | Rogers Wireless Inc., Senior Subordinated Notes, 8.000% due 12/15/12 | | | 340,000 | |
| | 990,000 | | CCC | | Rural Cellular Corp., Senior Notes, 9.875% due 2/1/10 | | | 1,044,450 | |
| | | | | Sprint Capital Corp.: | | | | |
| | 1,350,000 | | BBB+ | | Notes, 8.750% due 3/15/32 | | | 1,672,666 | |
| | 775,000 | | BBB+ | | Senior Notes, 6.875% due 11/15/28 | | | 796,352 | |
| | | |
| | | | | Total Wireless Telecommunication Services | | | 6,049,530 | |
| | | |
| | | | | TOTAL CORPORATE BONDS & NOTES
(Cost — $242,925,432) | | | 248,530,302 | |
| | | |
| | ASSET-BACKED SECURITY — 0.0% | | | | |
| | Diversified Financial Services — 0.0% | | | | |
| | 1,402,534 | | D | | Airplanes Pass-Through Trust, Subordinated Notes, Series D, 10.875% due 3/15/19 (a)(e)(f) (Cost — $1,559,727) | | | 0 | |
| | | |
| | CONVERTIBLE BOND & NOTE — 0.1% | | | | |
| | Semiconductors & Semiconductor Equipment — 0.1% | | | | |
| | 335,000 | | CCC | | Amkor Technologies Inc., Senior Subordinated Bond, 2.500% due 5/15/11 (Cost — $293,710) | | | 284,331 | |
| | | |
See Notes to Financial Statements.
32 Legg Mason Partners Variable Portfolios III, Inc. 2006 Annual Report
Schedules of Investments (October 31, 2006) (continued)
| | | | | | | | | |
| | | |
Face
Amount | | Rating‡ | | Security | | Value | |
| | | | | | | | | |
| | LOAN PARTICIPATION — 1.1% | | | | |
| | United States — 1.1% | | | | |
| $ | 3,000,000 | | | | UPC Broadband Holding B.V. Term Loan, 7.640% due 3/15/13 (Toronto Dominion)
(Cost — $3,000,000) | | $ | 3,003,081 | |
| | | |
| | SOVEREIGN BONDS — 1.6% | | | | |
| | Brazil — 0.5% | | | | |
| | | | | Federative Republic of Brazil: | | | | |
| | 760,000 | | BB | | 11.000% due 8/17/40 | | | 1,000,730 | |
| | 340,000 | | BB | | Collective Action Securities, Notes, 8.000% due 1/15/18 | | | 376,295 | |
| | | |
| | | | | Total Brazil | | | 1,377,025 | |
| | | |
| | Panama — 0.1% | | | | |
| | 186,000 | | BB | | Republic of Panama, 9.375% due 4/1/29 | | | 242,498 | |
| | | |
| | Russia — 1.0% | | | | |
| | 2,430,000 | | BBB+ | | Russian Federation, 5.000% due 3/31/30 (b) | | | 2,725,397 | |
| | | |
| | | | | TOTAL SOVEREIGN BONDS
(Cost — $4,241,264) | | | 4,344,920 | |
| | | |
| | | |
| Shares | | | | | | | |
| | COMMON STOCKS — 0.1% | | | | |
| | CONSUMER DISCRETIONARY — 0.0% | | | | |
| | Household Durables — 0.0% | | | | |
| | 2,453,154 | | | | Home Interiors of Gifts Inc. (e)(f)* | | | 24,531 | |
| | | |
| | CONSUMER STAPLES — 0.0% | | | | |
| | Food Products — 0.0% | | | | |
| | 23,465 | | | | Aurora Foods Inc. (e)(f)* | | | 0 | |
| | | |
| | FINANCIALS — 0.0% | | | | |
| | Diversified Financial Services — 0.0% | | | | |
| | 1,776 | | | | Outsourcing Solutions Inc. (e)(f)* | | | 7,547 | |
| | | |
| | INFORMATION TECHNOLOGY — 0.1% | | | | |
| | Communications Equipment — 0.1% | | | | |
| | 4,335 | | | | Motorola Inc. | | | 99,965 | |
| | | |
| | Semiconductors & Semiconductor Equipment — 0.0% | | | | |
| | 478 | | | | Freescale Semiconductor Inc., Class B Shares* | | | 18,800 | |
| | | |
| | | | | TOTAL INFORMATION TECHNOLOGY | | | 118,765 | |
| | | |
| | MATERIALS — 0.0% | | | | |
| | Chemicals — 0.0% | | | | |
| | 17,316 | | | | Applied Extrusion Technologies Inc., Class A Shares* | | | 103,896 | |
| | | |
See Notes to Financial Statements.
Legg Mason Partners Variable Portfolios III, Inc. 2006 Annual Report 33
Schedules of Investments (October 31, 2006) (continued)
| | | | | | | | | |
| | | |
Shares | | | | Security | | Value | |
| | | | | | | | | |
| | TELECOMMUNICATION SERVICES — 0.0% | | | | |
| | Diversified Telecommunication Services — 0.0% | | | | |
| | 870 | | | | McLeodUSA Inc., Class A Shares (e)(f)* | | $ | 0 | |
| | | |
| | Wireless Telecommunication Services — 0.0% | | | | |
| | 1 | | | | Crown Castle International Corp.* | | | 34 | |
| | | |
| | | | | TOTAL TELECOMMUNICATION SERVICES | | | 34 | |
| | | |
| | | | | TOTAL COMMON STOCKS
(Cost — $2,524,502) | | | 254,773 | |
| | | |
| | CONVERTIBLE PREFERRED STOCKS — 0.3% | | | | |
| | ENERGY — 0.2% | |
| | Oil, Gas & Consumable Fuels — 0.2% | | | | |
| | 1,616 | | | | Chesapeake Energy Corp., Convertible, 6.250% | | | 442,178 | |
| | | |
| | TELECOMMUNICATION SERVICES — 0.1% | | | | |
| | Wireless Telecommunication Services — 0.1% | | | | |
| | 7,000 | | | | Crown Castle International Corp., 6.250% | | | 387,625 | |
| | | |
| | | | | TOTAL CONVERTIBLE PREFERRED STOCKS
(Cost — $612,254) | | | 829,803 | |
| | | |
| | |
| Warrants | | | | | |
| | WARRANTS (e)(f) — 0.0% | | | | |
| | 430 | | | | Cybernet Internet Services International Inc., Expires 7/1/09 (b)* | | | 0 | |
| | 695 | | | | GT Group Telecom Inc., Class B Shares, Expires 2/1/10 (b)* | | | 0 | |
| | 375 | | | | IWO Holdings Inc., Expires 1/15/11 (b)* | | | 0 | |
| | 165 | | | | Jazztel PLC, Expires 5/1/09 (b)* | | | 0 | |
| | 435 | | | | Merrill Corp., Class B Shares, Expires 5/1/09 (b)* | | | 0 | |
| | 700 | | | | RSL Communications Ltd., Class A Shares, Expires 11/15/06* | | | 0 | |
| | | |
| | | | | TOTAL WARRANTS
(Cost — $184,325) | | | 0 | |
| | | |
| | | | | TOTAL INVESTMENTS BEFORE SHORT-TERM INVESTMENTS
(Cost — $255,341,214) | | | 257,247,210 | |
| | | |
| | |
Face
Amount | | | | | |
| | SHORT-TERM INVESTMENT — 2.9% | | | | |
| | Repurchase Agreement — 2.9% | | | | |
| $ | 7,778,000 | | | | Nomura Securities International Inc. repurchase agreement dated
10/31/06, 5.280% due 11/1/06; Proceeds at maturity — $7,779,141;
(Fully collateralized by U.S government agency obligation
5.000% due 1/15/07; Market value — $7,933,860)
(Cost — $7,778,000) (i) | | | 7,778,000 | |
| | | |
| | | | | TOTAL INVESTMENTS — 96.8% (Cost — $263,119,214) | | | 265,025,210 | |
| | | | | Other Assets in Excess of Liabilities — 3.2% | | | 8,875,004 | |
| | | |
| | | | | TOTAL NET ASSETS — 100.0% | | $ | 273,900,214 | |
| | | |
See Notes to Financial Statements.
34 Legg Mason Partners Variable Portfolios III, Inc. 2006 Annual Report
Schedules of Investments (October 31, 2006) (continued)
| * | | Non-income producing security. |
| ‡ | | All ratings are by Standard & Poor’s Ratings Service, unless otherwise noted. All ratings are unaudited. |
| (a) | | Security is currently in default. |
| (b) | | Security is exempt from registration under Rule 144A of the Securities Act of 1933. This security may be resold in transactions that are exempt from registration, normally to qualified institutional buyers. This security has been deemed liquid pursuant to guidelines approved by the Board of Directors, unless otherwise noted. |
| (c) | | Variable rate security. Interest rate disclosed is that which is in effect at October 31, 2006. |
| (d) | | Payment-in-kind security for which part of the income earned may be paid as additional principal. |
| (f) | | Security is valued in good faith at fair value by or under the direction of the Board of Directors (See Note 1). |
| (g) | | Rating by Fitch Ratings Service. All ratings are unaudited. |
| (h) | | Rating by Moody’s Investors Service. All ratings are unaudited. |
| (i) | | All or a portion of this security is segregated for extended settlements. |
| # | | Aggregate cost for federal income tax purposes is $263,718,134. |
See pages 36 and 37 for definitions of ratings.
See Notes to Financial Statements.
Legg Mason Partners Variable Portfolios III, Inc. 2006 Annual Report 35
Bond Ratings (unaudited)
The definitions of the applicable rating symbols are set forth below:
Standard & Poor’s Ratings Service (“Standard and Poor’s”) — Ratings from “AA” to “CCC” may be modified by the addition of a plus (+) or minus (–) sign to show relative standings within the major rating categories.
AAA | — Bonds rated “AAA” have the highest rating assigned by Standard & Poor’s. Capacity to pay interest and repay principal is extremely strong. |
AA | — Bonds rated “AA” have a very strong capacity to pay interest and repay principal and differs from the highest rated issue only in a small degree. |
A | — Bonds rated “A” have a strong capacity to pay interest and repay principal although it is somewhat more susceptible to the adverse effects of changes in circumstances and economic conditions than bonds in higher rated categories. |
BBB | — Bonds rated “BBB” are regarded as having an adequate capacity to pay interest and repay principal. Whereas they normally exhibit adequate protection parameters, adverse economic conditions or changing circumstances are more likely to lead to a weakened capacity to pay interest and repay principal for bonds in this category than in higher rated categories. |
BB, B, CCC, CC and C | — Bonds rated “BB”, “B”, “CCC”, “CC” and “C” are regarded, on balance, as predominantly speculative with respect to capacity to pay interest and repay principal in accordance with the terms of the obligation. “BB” represents the lowest degree of speculation and “C” the highest degree of speculation. While such bonds will likely have some quality and protective characteristics, these are outweighed by large uncertainties or major risk exposures to adverse conditions. |
D | — Bonds rated “D” are in default, and payment of interest and/or repayment of principal is in arrears. |
Moody’s Investors Service (“Moody’s”) — Numerical modifiers 1, 2 and 3 may be applied to each generic rating from “Aa” to “Caa,” where 1 is the highest and 3 the lowest rating within its generic category.
Aaa | — Bonds rated “Aaa” are judged to be of the best quality. They carry the smallest degree of investment risk and are generally referred to as “gilt edge.” Interest payments are protected by a large or by an exceptionally stable margin and principal is secure. While the various protective elements are likely to change, such changes as can be visualized are most unlikely to impair the fundamentally strong position of such issues. |
Aa | — Bonds rated “Aa” are judged to be of high quality by all standards. Together with the “Aaa” group they comprise what are generally known as high grade bonds. They are rated lower than the best bonds because margins of protection may not be as large as in “Aaa” securities or fluctuation of protective elements may be of greater amplitude or there may be other elements present which make the long-term risks appear somewhat larger than in “Aaa” securities. |
A | — Bonds rated “A” possess many favorable investment attributes and are to be considered as upper medium grade obligations. Factors giving security to principal and interest are considered adequate, but elements may be present that suggest a susceptibility to impairment some time in the future. |
Baa | — Bonds rated “Baa” are considered to be medium grade obligations, i.e., they are neither highly protected nor poorly secured. Interest payment and principal security appear adequate for the present but certain protective elements may be lacking or may be characteristically unreliable over any great length of time. Such bonds lack outstanding investment characteristics and in fact have speculative characteristics as well. |
Ba | — Bonds rated “Ba” are judged to have speculative elements; their future cannot be considered as well assured. Often the protection of interest and principal payments may be very moderate thereby not well safeguarded during both good and bad times over the future. Uncertainty of position characterizes bonds in this class. |
B | — Bonds rated “B” generally lack characteristics of the desirable investments. Assurance of interest and principal payments or maintenance of other terms of the contract over any long period of time may be small. |
Caa and Ca | — Bonds rated “Caa” and “Ca” are of poor standing. Such issues may be in default or present elements of danger with respect to principal or interest. |
C | — Bonds rated “C” are the lowest rated class of bonds, and issues so rated can be regarded as having extremely poor prospects of ever attaining any real investment standing. |
36 Legg Mason Partners Variable Portfolios III, Inc. 2006 Annual Report
Bond Ratings (unaudited) (continued)
Fitch Ratings Service (“Fitch’’) — Ratings from “AA” to “CCC” may be modified by the additional of a plus (+) or a minus (-) sign to show relative standings with the major ratings categories.
AA | — Bonds rated “AA” are considered to be investment-grade and of very high credit quality. The obligator’s ability to pay interest and/or dividends and repay principal is very strong. |
A | — Bonds rated “A” are considered to have a low expectation of credit risk. The capacity for timely payment of financial commitments is considered to be strong, but may be more vulnerable to changes in economic conditions and circumstances than bonds with higher ratings. |
BBB | — Bonds rated “BBB” currently have a low expectation of credit risk. The capacity for timely payment of financial commitments is considered to be adequate. Adverse changes in economic conditions and circumstances, however, are more likely to impair this capacity. This is the lowest investment grade category assigned by Fitch. |
BB | — Bonds rated “BB” indicate that there is a possibility of credit risk developing, particularly as the result of adverse economic change over time; however, business of financial alternatives may be available to allow financial commitments to be met. |
B | — Bonds rated “B” indicate that significant credit risk is present, but a limited margin of safety remains. Financial Commitments are currently being met; however, capacity for continued payment is contingent upon a sustained, favorable business and economic environment. |
CCC, CC and C | — Bonds rated “CCC”, “CC” and “C” carry the real possibility of defaulting. The capacity to meet financial commitments depends solely on a sustained, favorable business and economic environment. Default of some kind on bonds rated “CC” appears probable, a “C” rating indicates imminent default. |
NR | — Indicates that the bond is not rated by Standard & Poor’s, Moody’s or Fitch. |
Legg Mason Partners Variable Portfolios III, Inc. 2006 Annual Report 37
Statements of Assets and Liabilities (October 31, 2006)
| | | | | | | | |
| | |
| | | Legg Mason Partners
Variable Adjustable
Rate Income
Portfolio | | | Legg Mason Partners
Variable High Income
Portfolio | |
| ASSETS: | | | | | | | | |
Investments, at cost | | $ | 37,794,523 | | | $ | 255,341,214 | |
Repurchase agreements, at cost | | | 4,122,000 | | | | 7,778,000 | |
| | |
Investments, at value | | $ | 37,711,273 | | | $ | 257,247,210 | |
Repurchase agreements, at value | | | 4,122,000 | | | | 7,778,000 | |
Cash | | | 932 | | | | 659 | |
Receivable for securities sold | | | 955,859 | | | | 816,783 | |
Dividend and Interest receivable | | | 97,348 | | | | 5,898,716 | |
Receivable for Fund shares sold | | | 12,216 | | | | 5,295,134 | |
Prepaid expenses | | | 645 | | | | 66,620 | |
| | |
Total Assets | | | 42,900,273 | | | | 277,103,122 | |
| | |
| LIABILITIES: | | | | | | | | |
Payable for securities purchased | | | 2,876,875 | | | | 2,964,518 | |
Payable for Fund shares repurchased | | | 126,789 | | | | 512 | |
Investment management fee payable | | | 18,571 | | | | 136,696 | |
Payable to broker — variation margin on open futures contracts | | | 8,625 | | | | — | |
Directors’ fees payable | | | 3,595 | | | | 192 | |
Distribution fees payable | | | 1,310 | | | | — | |
Deferred dollar roll income | | | 264 | | | | — | |
Accrued expenses | | | 38,374 | | | | 100,990 | |
| | |
Total Liabilities | | | 3,074,403 | | | | 3,202,908 | |
| | |
Total Net Assets | | $ | 39,825,870 | | | $ | 273,900,214 | |
| | |
| NET ASSETS: | | | | | | | | |
Par value (Note 4) | | $ | 39 | | | $ | 357 | |
Paid-in capital in excess of par value | | | 38,957,769 | | | | 349,889,476 | |
Undistributed net investment income | | | 1,291,435 | | | | 16,732,361 | |
Accumulated net realized loss on investments, futures contracts and options written | | | (295,834 | ) | | | (94,627,976 | ) |
Net unrealized appreciation (depreciation) on investments and futures contracts | | | (127,539 | ) | | | 1,905,996 | |
| | |
Total Net Assets | | $ | 39,825,870 | | | $ | 273,900,214 | |
| | |
Shares Outstanding | | | 3,875,518 | | | | 35,753,498 | |
| | |
Net Asset Value | | | $10.28 | | | | $7.66 | |
| | |
See Notes to Financial Statements.
38 Legg Mason Partners Variable Portfolios III, Inc. 2006 Annual Report
Statements of Operations (For the year ended October 31, 2006)
| | | | | | | | |
| | |
| | | Legg Mason Partners
Variable Adjustable
Rate Income
Portfolio | | | Legg Mason Partners
Variable
High Income
Portfolio | |
| INVESTMENT INCOME: | | | | | | | | |
Interest | | $ | 1,932,003 | | | $ | 23,043,615 | |
Dividends | | | — | | | | 35,337 | |
| | |
Total Investment Income | | | 1,932,003 | | | | 23,078,952 | |
| | |
| EXPENSES: | | | | | | | | |
Investment management fee (Note 2) | | | 218,696 | | | | 1,670,014 | |
Distribution fees (Note 2) | | | 99,407 | | | | — | |
Audit and tax | | | 28,590 | | | | 30,246 | |
Legal fees | | | 21,813 | | | | 30,780 | |
Directors’ fees | | | 13,697 | | | | 27,276 | |
Shareholder reports | | | 12,141 | | | | 57,367 | |
Custody fees | | | 5,277 | | | | 9,428 | |
Directors’ retirement expense | | | 2,547 | | | | 16,946 | |
Proxy Fee | | | 2,503 | | | | 21,960 | |
Transfer agent fees (Note 2) | | | 911 | | | | 1,024 | |
Insurance | | | 327 | | | | 6,486 | |
Miscellaneous expenses | | | 4,008 | | | | 3,805 | |
| | |
Total Expenses | | | 409,917 | | | | 1,875,332 | |
Less: Fee waivers and/or expense reimbursements (Notes 2 and 6) | | | (62,094 | ) | | | (7,937 | ) |
| | |
Net Expenses | | | 347,823 | | | | 1,867,395 | |
| | |
Net Investment Income | | | 1,584,180 | | | | 21,211,557 | |
| | |
REALIZED AND UNREALIZED GAIN (LOSS) ON INVESTMENTS, FUTURES
CONTRACTS AND OPTIONS WRITTEN (NOTES 1 AND 3): | |
Net Realized Gain (Loss) From: | | | | | | | | |
Investment transactions | | | (96,325 | ) | | | 4,068,704 | |
Futures contracts | | | 20,679 | | | | — | |
Options written | | | 21,764 | | | | — | |
| | |
Net Realized Gain (Loss) | | | (53,882 | ) | | | 4,068,704 | |
| | |
Change in Net Unrealized Appreciation/Depreciation From: | | | | | | | | |
Investments | | | 122,224 | | | | (484,547 | ) |
Futures contracts | | | (78,536 | ) | | | — | |
| | |
Change in Net Unrealized Appreciation/Depreciation | | | 43,688 | | | | (484,547 | ) |
| | |
Net Gain (Loss) on Investments, Futures Contracts and Options Written | | | (10,194 | ) | | | 3,584,157 | |
| | |
Increase in Net Assets From Operations | | $ | 1,573,986 | | | $ | 24,795,714 | |
| | |
See Notes to Financial Statements.
Legg Mason Partners Variable Portfolios III, Inc. 2006 Annual Report 39
Statements of Changes in Net Assets (For the years ended October 31,)
| | | | | | | | |
| | |
| Legg Mason Partners Variable Adjustable Rate Income Portfolio | | 2006 | | | 2005 | |
| OPERATIONS: | | | | | | | | |
Net investment income | | $ | 1,584,180 | | | $ | 816,945 | |
Net realized loss | | | (53,882 | ) | | | (16,712 | ) |
Change in net unrealized appreciation/depreciation | | | 43,688 | | | | (175,940 | ) |
| | |
Increase in Net Assets From Operations | | | 1,573,986 | | | | 624,293 | |
| | |
| DISTRIBUTIONS TO SHAREHOLDERS FROM (NOTE 1): | | | | | | | | |
Net investment income | | | (1,200,004 | ) | | | (300,185 | ) |
| | |
Decrease in Net Assets From Distributions to Shareholders | | | (1,200,004 | ) | | | (300,185 | ) |
| | |
| FUND SHARE TRANSACTIONS (NOTE 4): | | | | | | | | |
Net proceeds from sale of shares | | | 10,095,957 | | | | 21,156,364 | |
Reinvestment of distributions | | | 1,200,004 | | | | 300,185 | |
Cost of shares repurchased | | | (10,159,197 | ) | | | (7,217,375 | ) |
| | |
Increase in Net Assets From Fund Share Transactions | | | 1,136,764 | | | | 14,239,174 | |
| | |
Increase in Net Assets | | | 1,510,746 | | | | 14,563,282 | |
| NET ASSETS: | | | | | | | | |
Beginning of year | | | 38,315,124 | | | | 23,751,842 | |
| | |
End of year* | | $ | 39,825,870 | | | $ | 38,315,124 | |
| | |
* Includes undistributed net investment income of: | | | $1,291,435 | | | | $816,291 | |
| | |
See Notes to Financial Statements.
40 Legg Mason Partners Variable Portfolios III, Inc. 2006 Annual Report
Statements of Changes in Net Assets (For the years ended October 31,) (continued)
| | | | | | | | |
| | |
| Legg Mason Partners Variable High Income Portfolio | | 2006 | | | 2005 | |
| OPERATIONS: | | | | | | | | |
Net investment income | | $ | 21,211,557 | | | $ | 21,065,496 | |
Net realized gain | | | 4,068,704 | | | | 2,557,666 | |
Change in net unrealized appreciation/depreciation | | | (484,547 | ) | | | (14,885,829 | ) |
Increase from payment by affiliate | | | — | | | | 92,400 | |
| | |
Increase in Net Assets From Operations | | | 24,795,714 | | | | 8,829,733 | |
| | |
| DISTRIBUTIONS TO SHAREHOLDERS FROM (NOTE 1): | | | | | | | | |
Net investment income | | | (23,000,001 | ) | | | (23,581,997 | ) |
| | |
Decrease in Net Assets From Distributions to Shareholders | | | (23,000,001 | ) | | | (23,581,997 | ) |
| | |
| FUND SHARE TRANSACTIONS (NOTE 4): | | | | | | | | |
Net proceeds from sale of shares | | | 9,874,142 | | | | 37,541,706 | |
Reinvestment of distributions | | | 23,000,001 | | | | 23,581,997 | |
Cost of shares repurchased | | | (48,240,106 | ) | | | (38,385,269 | ) |
| | |
Increase (Decrease) in Net Assets From Fund Share Transactions | | | (15,365,963 | ) | | | 22,738,434 | |
| | |
Increase (Decrease) in Net Assets | | | (13,570,250 | ) | | | 7,986,170 | |
| NET ASSETS: | | | | | | | | |
Beginning of year | | | 287,470,464 | | | | 279,484,294 | |
| | |
End of year* | | $ | 273,900,214 | | | $ | 287,470,464 | |
| | |
* Includes undistributed net investment income of: | | | $16,732,361 | | | | $17,947,071 | |
| | |
See Notes to Financial Statements.
Legg Mason Partners Variable Portfolios III, Inc. 2006 Annual Report 41
Financial Highlights
For a share of capital stock outstanding throughout each year ended October 31:
| | | | | | | | | | | | | | | | |
| | | | |
Legg Mason Partners Variable Adjustable Rate Income Portfolio | | 2006 | | | 2005 | | | 2004 | | | 2003(1) | |
Net Asset Value, Beginning of Period | | $ | 10.18 | | | $ | 10.10 | | | $ | 10.01 | | | $ | 10.00 | |
| | |
Income (Loss) From Operations: | | | | | | | | | | | | | | | | |
Net investment income | | | 0.42 | | | | 0.24 | | | | 0.09 | | | | 0.01 | |
Net realized and unrealized gain (loss) | | | (0.01 | ) | | | (0.05 | ) | | | 0.03 | | | | — | |
| | |
Total Income From Operations | | | 0.41 | | | | 0.19 | | | | 0.12 | | | | 0.01 | |
| | |
Less Distributions From: | | | | | | | | | | | | | | | | |
Net investment income | | | (0.31 | ) | | | (0.11 | ) | | | (0.03 | ) | | | — | |
| | |
Total Distributions | | | (0.31 | ) | | | (0.11 | ) | | | (0.03 | ) | | | — | |
| | |
Net Asset Value, End of Period | | $ | 10.28 | | | $ | 10.18 | | | $ | 10.10 | | | $ | 10.01 | |
| | |
Total Return(2) | | | 4.09 | % | | | 1.87 | % | | | 1.24 | % | | | 0.10 | % |
| | |
Net Assets, End of Period (millions) | | | $40 | | | | $38 | | | | $24 | | | | $11 | |
| | |
Ratios to Average Net Assets: | | | | | | | | | | | | | | | | |
Gross expenses | | | 1.03 | % | | | 1.13 | % | | | 1.31 | % | | | 4.72 | %(3) |
Net expenses(4) | | | 0.87 | (5) | | | 0.98 | | | | 1.00 | (5) | | | 1.00 | (3)(5) |
Net investment income | | | 3.98 | | | | 2.49 | | | | 1.19 | | | | 0.87 | (3) |
| | |
Portfolio Turnover Rate | | | 45 | %(6) | | | 12 | % | | | 68 | % | | | 3 | % |
| | |
| (1) | | For the period September 12, 2003 (commencement of operations) to October 31, 2003. |
| (2) | | Performance figures may reflect fee waivers and/or expense reimbursements. Past performance is no guarantee of future results. In the absence of fee waivers and/or expense reimbursements, the total return would be lower. Total returns do not reflect expenses associated with the separate accounts such as administrative fees, account charges and surrender charges which, if reflected, would reduce the total return for all periods shown. Total returns for periods of less than one year are not annualized. |
| (4) | | As a result of a contractual expense limitation, effective October 31, 2005 through February 28, 2007, the ratio of expenses to average net assets, other than interest, brokerage, taxes and extraordinary expenses, of the Fund will not exceed 1.00%. |
| (5) | | Reflects fee waivers and/or expense reimbursements. |
| (6) | | Excluding mortgage dollar roll transactions. If mortgage dollar roll transactions had been included, the portfolio turnover rate would have been 77% for the year ended October 31, 2006. |
See Notes to Financial Statements.
42 Legg Mason Partners Variable Portfolios III, Inc. 2006 Annual Report
Financial Highlights (continued)
For a share of capital stock outstanding throughout each year ended October 31:
| | | | | | | | | | | | | | | | | | | | |
| | | | | |
Legg Mason Partners Variable
High Income Portfolio | | 2006 | | | 2005 | | | 2004 | | | 2003 | | | 2002 | |
Net Asset Value, Beginning of Year | | $ | 7.61 | | | $ | 8.02 | | | $ | 7.67 | | | $ | 6.65 | | | $ | 8.32 | |
| | |
Income (Loss) From Operations: | | | | | | | | | | | | | | | | | | | | |
Net investment income | | | 0.61 | | | | 0.58 | | | | 0.58 | | | | 0.63 | | | | 0.82 | |
Net realized and unrealized gain (loss) | | | 0.06 | | | | (0.33 | ) | | | 0.32 | | | | 1.28 | | | | (1.44 | ) |
| | |
Total Income (Loss) From Operations | | | 0.67 | | | | 0.25 | | | | 0.90 | | | | 1.91 | | | | (0.62 | ) |
| | |
Less Distributions From: | | | | | | | | | | | | | | | | | | | | |
Net investment income | | | (0.62 | ) | | | (0.66 | ) | | | (0.55 | ) | | | (0.89 | ) | | | (1.05 | ) |
| | |
Total Distributions | | | (0.62 | ) | | | (0.66 | ) | | | (0.55 | ) | | | (0.89 | ) | | | (1.05 | ) |
| | |
Net Asset Value, End of Year | | $ | 7.66 | | | $ | 7.61 | | | $ | 8.02 | | | $ | 7.67 | | | $ | 6.65 | |
| | |
Total Return(1) | | | 9.37 | % | | | 3.14 | %(2) | | | 12.33 | % | | | 31.70 | % | | | (7.39 | )% |
| | |
Net Assets, End of Year (millions) | | | $274 | | | | $287 | | | | $279 | | | | $237 | | | | $155 | |
| | |
Ratios to Average Net Assets: | | | | | | | | | | | | | | | | | | | | |
Gross expenses | | | 0.67 | % | | | 0.66 | % | | | 0.66 | % | | | 0.69 | % | | | 0.69 | % |
Net expenses | | | 0.67 | (3) | | | 0.66 | | | | 0.66 | (3) | | | 0.69 | | | | 0.69 | |
Net investment income | | | 7.62 | | | | 7.31 | | | | 7.93 | | | | 9.53 | | | | 10.39 | |
| | |
Portfolio Turnover Rate | | | 73 | % | | | 20 | % | | | 33 | % | | | 36 | % | | | 78 | % |
| | |
| (1) | | Performance figures may reflect fee waivers and/or expense reimbursements. Past performance is no guarantee of future results. In the absence of fee waivers and/or expense reimbursements, the total return would be lower. Total returns do not reflect expenses associated with the separate accounts such as administrative fees, account charges and surrender charges which, if reflected, would reduce the total return for all periods shown. |
| (2) | | The investment manager fully reimbursed the Fund for losses incurred resulting from an investment transaction error. Without this reimbursement, total return would not have changed. |
| (3) | | Reflects fee waivers and/or expense reimbursements. |
See Notes to Financial Statements.
Legg Mason Partners Variable Portfolios III, Inc. 2006 Annual Report 43
Notes to Financial Statements
| 1. | Organization and Significant Accounting Policies |
Legg Mason Partners Variable Adjustable Rate Income Portfolio and Legg Mason Partners Variable High Income Portfolio (formerly known as SB Adjustable Rate Income Portfolio and Smith Barney High Income Portfolio, respectively) (the “Funds”) are separate diversified investment funds of Legg Mason Partners Variable Portfolios III, Inc. (formerly known as Travelers Series Fund Inc.) (the “Company”). The Company, a Maryland corporation, is registered under the Investment Company Act of 1940, as amended (“1940 Act”), as an open-end management investment company.
Shares of the Fund may only be purchased or redeemed through variable annuity contracts and variable life insurance policies offered by the separate accounts of participating insurance companies.
The following are significant accounting policies consistently followed by the Funds and are in conformity with U.S. generally accepted accounting principles (“GAAP”). Estimates and assumptions are required to be made regarding assets, liabilities and changes in net assets resulting from operations when financial statements are prepared. Changes in the economic environment, financial markets and any other parameters used in determining these estimates could cause actual results to differ.
(a) Investment Valuation. Debt securities are valued at the mean between the bid and asked prices provided by an independent pricing service that are based on transactions in debt obligations, quotations from bond dealers, market transactions in comparable securities and various other relationships between securities. Equity securities for which market quotations are available are valued at the last sale price or official closing price on the primary market or exchange on which they trade. Publicly traded foreign government debt securities are typically traded internationally in the over-the-counter market, and are valued at the mean between the bid and asked prices as of the close of business of that market. When prices are not readily available, or are determined not to reflect fair value, such as when the value of a security has been significantly affected by events after the close of the exchange or market on which the security is principally traded, but before the Funds calculate their net asset value, the Funds may value these investments at fair value as determined in accordance with the procedures approved by the Funds’ Board of Directors. Short-term obligations with maturities of 60 days or less are valued at amortized cost, which approximates market value.
(b) Repurchase Agreements. When entering into repurchase agreements, it is the Funds’ policy that their custodian or a third party custodian take possession of the underlying collateral securities, the market value of which at least equals the principal amount of the repurchase transaction, including accrued interest. To the extent that any repurchase transaction exceeds one business day, the value of the collateral is marked-to-market to ensure the adequacy of the collateral. If the seller defaults and the market value of the collateral declines or if bankruptcy proceedings are commenced with respect to the seller of the security, realization of the collateral by the Funds may be delayed or limited.
(c) Financial Futures Contracts. The Funds may enter into financial futures contracts typically to hedge a portion of the portfolios. Upon entering into a financial futures contract, the Funds are required to deposit cash or securities as initial margin. Additional
44 Legg Mason Partners Variable Portfolios III, Inc. 2006 Annual Report
Notes to Financial Statements (continued)
securities are also segregated up to the current market value of the financial futures contracts. Subsequent payments, known as variation margin, are made or received by the Funds each day, depending on the daily fluctuation in the value of the underlying financial instruments. The Funds recognize an unrealized gain or loss equal to the daily variation margin. When the financial futures contracts are closed, a realized gain or loss is recognized equal to the difference between the proceeds from (or cost of) the closing transactions and the Funds’ basis in the contracts.
The risks associated with entering into financial futures contracts include the possibility that a change in the value of the contract may not correlate with the changes in the value of the underlying instruments. In addition, investing in financial futures contracts involves the risk that the Funds could lose more than the original margin deposit and subsequent payments required for a futures transaction. Risks may also arise upon entering into these contracts from the potential inability of the counterparties to meet the terms of their contracts.
(d) Written Options. When a Fund writes an option, an amount equal to the premium received by the Funds are recorded as a liability, the value of which is marked-to-market daily to reflect the current market value of the option written. If the option expires, the Funds realize a gain from investments equal to the amount of the premium received. When a written call option is exercised, the difference between the premium and the amount for effecting a closing purchase transaction, including brokerage commission, is also treated as a realized gain or loss. When a written put option is exercised, the amount of the premium received reduces the cost of the security purchased by the Funds.
A risk in writing a covered call option is that the Funds may forego the opportunity of profit if the market price of the underlying security increases and the option is exercised. The risk in writing a put option is that the Funds may incur a loss if the market price of the underlying security decreases and the option is exercised. The risk in writing a call option is that the Funds are exposed to the risk of loss if the market price of the underlying security increases. In addition, there is the risk that the Funds may not be able to enter into a closing transaction because of an illiquid secondary market.
(e) Loan Participations. The Legg Mason Partners Variable High Income Portfolio may invest in loans arranged through private negotiation between one or more financial institutions. The Fund’s investment in any such loan may be in the form of a participation in or an assignment of the loan. In connection with purchasing participations, the Fund generally will have no right to enforce compliance by the borrower with the terms of the loan agreement relating to the loan, nor any rights of set-off against the borrower and the Fund may not benefit directly from any collateral supporting the loan in which it has purchased the participation.
The Fund assumes the credit risk of the borrower, the lender that is selling the participation and any other persons interpositioned between the Fund and the borrower. In the event of the insolvency of the lender selling the participation, the Fund may be treated as a general creditor of the lender and may not benefit from any set-off between the lender and the borrower.
(f) Mortgage Dollar Rolls. The Funds enter into dollar rolls in which the Funds sell mortgage-backed securities for delivery in the current month and simultaneously contracts
Legg Mason Partners Variable Portfolios III, Inc. 2006 Annual Report 45
Notes to Financial Statements (continued)
to repurchase substantially similar (same type, coupon and maturity) securities to settle on a specified future date. During the roll period, the Funds forego principal and interest paid on the securities. The Funds are compensated by a fee paid by the counterparty, often in the form of a drop in the repurchase price of the securities. Dollar rolls are accounted for as financing arrangements; the fee is accrued into interest income ratably over the term of the dollar roll and any gain or loss on the roll is deferred and realized upon disposition of the rolled security.
The risk of entering into a mortgage dollar roll is that the market value of the securities the Funds are obligated to repurchase under the agreement may decline below the repurchase price. In the event the buyer of securities under a mortgage dollar roll files for bankruptcy or becomes insolvent, the Funds’ use of proceeds of the dollar roll may be restricted pending a determination by the other party, or its trustee or receiver, whether to enforce the Funds’ obligation to repurchase the securities.
(g) Securities Traded on a To-Be-Announced Basis. The Funds may trade securities on a to-be-announced (“TBA”) basis. In a TBA transaction, the Funds commit to purchasing or selling securities, which have not yet been issued by the issuer and for which specific information is not known, such as the face amount and maturity date and the underlying pool of investments in U.S. government agency mortgage pass-through transactions. Securities purchased on a TBA basis are not settled until they are delivered to the Funds, normally 15 to 45 days later. Beginning on the date the Funds enter into a TBA transaction, cash, U.S. government securities or other liquid high-grade debt obligations are segregated in an amount equal in value to the purchase price of the TBA security. These transactions are subject to market fluctuations and their current value is determined in the same manner as for other securities.
(h) Credit and Market Risk. The Legg Mason Partners Variable High Income Portfolio invests in high yield instruments that are subject to certain credit and market risks. The yields of high yield obligations reflect, among other things, perceived credit and market risks. The Fund’s investment in securities rated below investment grade typically involves risks not associated with higher rated securities including, among others, greater risk related to timely and ultimate payment of interest and principal, greater market price volatility and less liquid secondary market trading.
(i) Security Transactions and Investment Income. Security transactions are accounted for on a trade date basis. Interest income, adjusted for amortization of premium and accretion of discount, is recorded on the accrual basis. Dividend income is recorded on the ex-dividend date. The cost of investments sold is determined by use of the specific identification method. To the extent any issuer defaults on an expected interest payment, the Funds’ policy is to generally halt any additional interest income accruals and consider the realizability of interest accrued up to the date of default.
(j) Distributions to Shareholders. Distributions from net investment income and distributions of net realized gains, if any, are declared at least annually. Distributions to shareholders of the Funds are recorded on the ex-dividend date and are determined in accordance with income tax regulations, which may differ from GAAP.
46 Legg Mason Partners Variable Portfolios III, Inc. 2006 Annual Report
Notes to Financial Statements (continued)
(k) Federal and Other Taxes. It is the Funds’ policy to comply with the federal income and excise tax requirements of the Internal Revenue Code of 1986, as amended, applicable to regulated investment companies. Accordingly, the Funds intend to distribute substantially all of its income and net realized gains on investments, if any, to shareholders each year. Therefore, no federal income tax provision is required in the Funds’ financial statements.
(l) Reclassification. GAAP requires that certain components of net assets be adjusted to reflect permanent differences between financial and tax reporting. These reclassifications have no effect on net assets or net asset values per share. During the current year, the following reclassifications have been made:
| | | | | | | | | | |
| | | | |
| Fund | | | | Undistributed Net
Investment Income | | Accumulated Net
Realized Loss | | | Paid-in Capital | |
Legg Mason Partners Variable Adjustable Rate Income Portfolio | | (a) | | $ 2,503 | | — | | | $ (2,503 | ) |
| | (b) | | 88,465 | | $ (88,465 | ) | | — | |
| | |
| Legg Mason Partners Variable High Income Portfolio | | (a) | | $ 21,960 | | — | | | $(21,960 | ) |
| | (c) | | 551,774 | | $(551,774 | ) | | — | |
| | |
| (a) | Reclassifications are primarily due to book/tax differences in the treatment of various items. |
| (b) | Reclassifications are primarily due to income from mortgage backed securities treated as capital gains for tax purposes. |
| (c) | Reclassifications are primarily due to differences between book and tax amortization of premium on fixed income securities, book/tax differences in the treatment of consent fees and book/tax differences in the treatment of various items. |
| 2. | Investment Management Agreement and Other Transactions with Affiliates |
On December 1, 2005, Citigroup Inc. (“Citigroup”) completed the sale of substantially all of its asset management business, to Legg Mason, Inc. (“Legg Mason”). As a result, the Funds’ then investment manager, Smith Barney Fund Management LLC (“SBFM”), previously an indirect wholly-owned subsidiary of Citigroup, became a wholly-owned subsidiary of Legg Mason. Completion of the sale caused the Funds’ then existing investment management contracts to terminate. The Funds’ shareholders approved a new investment management contract between the Funds and SBFM, which became effective on December 1, 2005.
Prior to the Legg Mason transaction and continuing under a new investment management agreement, effective December 1, 2005, Legg Mason Partners Variable Adjustable Rate Income Portfolio paid SBFM an investment management fee calculated daily and paid monthly in accordance with the following breakpoint schedule:
| | | |
| |
| Average Daily Net Assets | | Annual Rate | |
First $1 billion | | 0.550 | % |
Next $1 billion | | 0.525 | |
Next $3 billion | | 0.500 | |
Next $5 billion | | 0.475 | |
Over $10 billion | | 0.450 | |
| | |
Legg Mason Partners Variable Portfolios III, Inc. 2006 Annual Report 47
Notes to Financial Statements (continued)
Prior to the Legg Mason transaction and continuing under a new investment management agreement, effective December 1, 2005, Legg Mason Partners Variable High Income Portfolio paid SBFM a fee calculated daily and paid monthly at an annual rate of 0.60% of the Fund’s average daily net assets.
Legg Mason Partners Variable Adjustable Rate Income Portfolio has a contractual expense limitation in place of 1.00%.
Effective August 1, 2006, Legg Mason Partners Fund Advisor, LLC (“LMPFA”) became the Funds’ investment manager and Western Asset Management Company (“Western Asset”) became the Funds’ subadviser. The portfolio managers who are responsible for the day-to-day management of the Funds remain the same immediately prior to and immediately after the date of these changes. LMPFA and Western Asset are wholly-owned subsidiaries of Legg Mason.
LMPFA provides administrative and certain oversight services to the Funds. LMPFA has delegated to the subadviser the day-to-day portfolio management of the Funds. The Funds’ investment management fee remains unchanged. For its services, LMPFA pays Western Asset 70% of the net management fee that it receives from the Funds.
During the year ended October 31, 2006, SBFM and LMPFA waived a portion of their investment management fee in the amount of $894 and $6,392 for the Legg Mason Partners Variable Adjustable Rate Income Portfolio and Legg Mason Partners Variable High Income Portfolio, respectively. In addition, during the year ended October 31, 2006, Legg Mason Partners Variable Adjustable Rate Income Portfolio and Legg Mason Partners Variable High Income Portfolio were reimbursed for expenses in the amount of $1,556 and $1,545, respectively.
The Funds’ Board has approved PFPC Inc. (“PFPC”) to serve as transfer agent for the Funds, effective January 1, 2006. The principal business office of PFPC is located at 4400 Computer Drive, Westborough, MA 01581. Prior to January 1, 2006, Citicorp Trust Bank, fsb. (“CTB”), a subsidiary of Citigroup, acted as the Funds’ transfer agent. Also, prior to January 1, 2006, PFPC acted as the Funds’ sub-transfer agent. CTB received account fees and asset-based fees that varied according to the size and type of account. PFPC was responsible for shareholder recordkeeping and financial processing for all shareholder accounts and was paid by CTB. For the period ended October 31, 2006, transfer agent fees totals for each Fund were as follows:
| | | |
| |
| | | Transfer Agent Fees |
Legg Mason Partners Variable Adjustable Rate Income Portfolio | | $ | 2,083 |
| |
Legg Mason Partners Variable High Income Portfolio | | $ | 2,083 |
| |
The Funds’ Board has appointed the Funds’ current distributor, Citigroup Global Markets Inc. (“CGM”), a subsidiary of Citigroup, and Legg Mason Investor Services, LLC (“LMIS”), a wholly-owned broker-dealer subsidiary of Legg Mason, as co-distributors of the Funds. The Funds’ Board has also approved an amended and restated Rule 12b-1 Plan. CGM and other broker-dealers, financial intermediaries and financial institutions (each called a “Service Agent”)
48 Legg Mason Partners Variable Portfolios III, Inc. 2006 Annual Report
Notes to Financial Statements (continued)
that currently offer Fund shares will continue to make the Funds’ shares available to their clients. Additional Service Agents may offer Fund shares in the future.
The Company, on behalf of Legg Mason Partners Adjustable Rate Income Portfolio, has adopted a plan (“Plan”) pursuant to Rule 12b-1 under the 1940 Act. The plan provides that Legg Mason Partners Adjustable Rate Income Portfolio shall pay a fee in an amount not to exceed 0.25% of the average daily net assets of Legg Mason Partners Adjustable Rate Income Portfolio. This fee is calculated daily and paid monthly. The Company has agreed to waive 0.15% of the Rule 12b-1 distribution plan fees for Legg Mason Partners Adjustable Rate Income Portfolio. For the year ended October 31, 2006, Rule 12b-1 distribution plan fees of $59,644 were waived for Legg Mason Partners Adjustable Rate Income Portfolio.
For the period ended October 31, 2006, LMIS, CGM and its affiliates did not receive any brokerage commission from the Funds.
Certain officers and one Director of the Company are employees of Legg Mason or its affiliates and do not receive compensation from the Company.
During the year ended October 31, 2006, the aggregate cost of purchases and proceeds from sales of investments (excluding short-term investments and mortgage dollar rolls) and U.S Government & Agency Obligations were as follows:
| | | | | | | | | | | | |
| | |
| | | Investments | | U.S. Government &
Agency Obligations |
| | | Purchases | | Sales | | Purchases | | Sales |
Legg Mason Partners Variable
Adjustable Rate Income Portfolio | | $ | 18,567,056 | | $ | 6,446,256 | | $ | 11,774,363 | | $ | 10,628,255 |
| |
Legg Mason Partners Variable
High Income Portfolio | | | 195,592,766 | | | 206,315,384 | | | — | | | — |
| |
At October 31, 2006, the aggregate gross unrealized appreciation and depreciation of investments for federal income tax purposes were as follows:
| | | | | | | | | | | |
| | | |
| | | Gross
Unrealized
Appreciation | | Gross
Unrealized
Depreciation | | | Net Unrealized
Appreciation/
Depreciation | |
Legg Mason Partners Variable
Adjustable Rate Income Portfolio | | $ | 72,065 | | $ | (155,315 | ) | | $ | (83,250 | ) |
| | |
Legg Mason Partners Variable
High Income Portfolio | | | 9,492,010 | | | (8,184,934 | ) | | | 1,307,076 | |
| | |
Legg Mason Partners Variable Portfolios III, Inc. 2006 Annual Report 49
Notes to Financial Statements (continued)
At October 31, 2006, Legg Mason Partners Variable Adjustable Rate Income Portfolio had the following open futures contracts:
| | | | | | | | | | | | | | |
| | | | | |
| | | Number of
Contracts | | Expiration
Date | | Basis
Value | | Market
Value | | Unrealized
Gain (Loss) | |
Contracts to Buy: | | | | | | | | | | | | | | |
U.S. Treasury Notes 2 Year Futures | | 76 | | 12/06 | | $ | 15,509,865 | | $ | 15,534,875 | | $ | 25,010 | |
| | |
Contracts to Sell: | | | | | | | | | | | | | | |
U.S. Treasury Notes 5 Year Futures | | 18 | | 12/06 | | $ | 1,885,582 | | $ | 1,900,125 | | $ | (14,543 | ) |
U.S. Treasury Notes 10 Year Futures | | 45 | | 12/06 | | | 4,815,088 | | | 4,869,844 | | | (54,756 | ) |
| | |
| | | | | | | | | | | | | (69,299 | ) |
| | |
Net Unrealized Loss on Open Futures Contracts | | | | | | | | $ | (44,289 | ) |
| | |
At October 31, 2006, Legg Mason Partners Variable High Income Portfolio did not have any open futures contracts.
At October 31, 2006, written option transactions for Legg Mason Partners Variable Adjustable Rate Income Rate Portfolio were as follows:
| | | | | | | |
| | |
| | | Number of
Contracts | | | Premiums
Received | |
Options written, outstanding at October 31, 2005 | | — | | | | — | |
Options written | | 44 | | | $ | 21,764 | |
Options closed | | (44 | ) | | | (21,764 | ) |
Options expired | | — | | | | — | |
| | |
Options written, outstanding at October 31, 2006 | | — | | | | — | |
| | |
At October 31, 2006, Legg Mason Partners Variable High Income Portfolio held loan participations with a total cost of $3,000,000 and a total market value of $3,003,081.
At October 31, 2006, Legg Mason Partners Variable Adjustable Rate Income Portfolio had outstanding mortgage dollar rolls with a total cost of $2,859,639. During the year ended October 31, 2006, the Fund entered into mortgage dollar roll transactions in the aggregate amount of $2,876,875. For the year ended October 31, 2006, Legg Mason Partners Variable Adjustable Rate Income Portfolio recorded interest income of $3,497 related to such mortgage rolls.
At October 31, 2006, the Company had six billion shares of capital stock authorized with a par value of $0.00001 per share. Each share of a Fund represents an equal proportionate interest in that Fund with each other share of the same Fund and has an equal entitlement to any dividends and distributions made by the Fund.
50 Legg Mason Partners Variable Portfolios III, Inc. 2006 Annual Report
Notes to Financial Statements (continued)
Transactions in shares of each Fund were as follows:
| | | | | | |
| | |
| | | Year Ended
October 31, 2006 | | | Year Ended
October 31, 2005 | |
Legg Mason Partners Variable Adjustable Rate Income Portfolio | | | | |
Shares sold | | 998,394 | | | 2,096,973 | |
Shares issued on reinvestment | | 120,846 | | | 29,989 | |
Shares repurchased | | (1,006,561 | ) | | (715,287 | ) |
| | |
Net Increase | | 112,679 | | | 1,411,675 | |
| | |
Legg Mason Partners Variable High Income Portfolio | | | | | | |
Shares sold | | 1,305,905 | | | 4,829,415 | |
Shares issued on reinvestment | | 3,225,807 | | | 3,127,586 | |
Shares repurchased | | (6,540,379 | ) | | (5,025,782 | ) |
| | |
Net Increase (Decrease) | | (2,008,667 | ) | | 2,931,219 | |
| | |
| 5. | Income Tax Information and Distributions to Shareholders |
The tax character of distributions paid during the fiscal year ended October 31, 2006 were as follows:
| | | | | | |
| | |
| | | Legg Mason
Partners Variable
Adjustable Rate Income Portfolio | | Legg Mason
Partners Variable
High Income Portfolio |
Distributions paid from: | | | | | | |
Ordinary income | | $ | 1,200,004 | | $ | 23,000,001 |
| |
The tax character of distributions paid during the fiscal year ended October 31, 2005 were as follows:
| | | | | | |
| | |
| | | Legg Mason
Partners Variable
Adjustable Rate Income Portfolio | | Legg Mason
Partners Variable
High Income Portfolio |
Distributions paid from: | | | | | | |
Ordinary income | | $ | 300,185 | | $ | 23,581,997 |
| |
Legg Mason Partners Variable Portfolios III, Inc. 2006 Annual Report 51
Notes to Financial Statements (continued)
As of October 31, 2006, the components of accumulated earnings on a tax basis were as follows:
| | | | | | | | |
| | |
| | | Legg Mason
Partners Variable
Adjustable Rate Income Portfolio | | | Legg Mason
Partners Variable
High Income Portfolio | |
Undistributed ordinary income — net | | $ | 1,293,984 | | | $ | 16,749,307 | |
Capital loss carryforward * | | | (340,123 | ) | | | (94,029,056 | ) |
Other book/tax temporary differences | | | 41,740 | (a) | | | (16,946 | )(b) |
Unrealized appreciation/(depreciation) | | | (127,539 | ) | | | 1,307,076 | (c) |
| | |
Total Accumulated Earnings/(losses) — net | | $ | 868,062 | | | $ | (75,989,619 | ) |
| | |
| * | | During the taxable year ended October 31, 2006, Legg Mason Partners Variable High Income Portfolio utilized $3,255,958 of its capital loss carryovers available from prior years. As of October 31, 2006, the Funds had the following net capital loss carryforwards remaining: |
| | | | | | | | |
Year of Expiration | | Legg Mason
Partners Variable
Adjustable Rate Income Portfolio | | | Legg Mason
Partners Variable
High Income Portfolio | |
10/31/2007 | | | — | | | $ | (6,374,557 | ) |
10/31/2008 | | | — | | | | (18,327,807 | ) |
10/31/2009 | | | — | | | | (42,940,350 | ) |
10/31/2010 | | | — | | | | (21,882,303 | ) |
10/31/2011 | | $ | (2,911 | ) | | | (4,504,039 | ) |
10/31/2012 | | | (38,733 | ) | | | — | |
10/31/2013 | | | (77,596 | ) | | | — | |
10/31/2014 | | | (220,883 | ) | | | — | |
| | | | | | | | |
| | $ | (340,123 | ) | | $ | (94,029,056 | ) |
| | | | | | | | |
These amounts will be available to offset any future taxable capital gains. Additionally, Legg Mason Partners Variable High Income Portfolio’s capital loss carryover is subject to an annual limitation of $12,467,410 as a result of an ownership change the Fund experienced in the prior year.
| (a) | | Other book/tax temporary differences are attributable primarily to the realization for tax purposes of unrealized losses on certain futures contracts and differences in the book/tax treatment of various items. |
| (b) | | Other book/tax temporary differences are attributable primarily to differences in the book/tax treatment of various items. |
| (c) | | The difference between book-basis and tax-basis unrealized appreciation/(depreciation) is attributable primarily to the tax deferral of losses on wash sales, the difference between book & tax amortization methods for premiums on fixed income securities, and book/tax differences in the treatment of consent fees. |
6. Regulatory Matters
On May 31, 2005, the U.S. Securities and Exchange Commission (“SEC”) issued an order in connection with the settlement of an administrative proceeding against SBFM the Fund’s prior investment manager and CGM relating to the appointment of an affiliated transfer agent for the Smith Barney family of mutual funds (the “Funds”).
The SEC order finds that SBFM and CGM willfully violated Section 206(1) of the Investment Advisers Act of 1940 (“Advisers Act”). Specifically, the order finds that SBFM and CGM knowingly or recklessly failed to disclose to the boards of the Funds in 1999 when proposing a new transfer agent arrangement with an affiliated transfer agent that: First Data Investors Services Group (“First Data”), the Funds’ then-existing transfer agent, had offered to continue as transfer agent and do the same work for substantially less money than before; and that Citigroup Asset Management (“CAM”), the Citigroup business unit that, at the time, included the Funds’ investment manager and other investment advisory
52 Legg Mason Partners Variable Portfolios III, Inc. 2006 Annual Report
Notes to Financial Statements (continued)
companies, had entered into a side letter with First Data under which CAM agreed to recommend the appointment of First Data as sub-transfer agent to the affiliated transfer agent in exchange for, among other things, a guarantee by First Data of specified amounts of asset management and investment banking fees to CAM and CGM. The order also finds that SBFM and CGM willfully violated Section 206(2) of the Advisers Act by virtue of the omissions discussed above and other misrepresentations and omissions in the materials provided to the Funds’ boards, including the failure to make clear that the affiliated transfer agent would earn a high profit for performing limited functions while First Data continued to perform almost all of the transfer agent functions, and the suggestion that the proposed arrangement was in the Funds’ best interests and that no viable alternatives existed. SBFM
and CGM do not admit or deny any wrongdoing or liability. The settlement does not establish wrongdoing or liability for purposes of any other proceeding.
The SEC censured SBFM and CGM and ordered them to cease and desist from violations of Sections 206(1) and 206(2) of the Advisers Act. The order requires Citigroup to pay $208.1 million, including $109 million in disgorgement of profits, $19.1 million in interest, and a civil money penalty of $80 million. Approximately $24.4 million has already been paid to the Funds, primarily through fee waivers. The remaining $183.7 million, including the penalty, has been paid to the U.S. Treasury and will be distributed pursuant to a plan submitted for the approval of the SEC. At this time, there is no certainty as to how the above-described proceeds of the settlement will be distributed, to whom such distributions will be made, the methodology by which such distributions will be allocated, and when such distributions will be made. The order also required that transfer agency fees received from the Funds since December 1, 2004, less certain expenses, be placed in escrow and provided that a portion of such fees might be subsequently distributed in accordance with the terms of the order. On April 3, 2006, an aggregate amount of approximately $9 million was distributed to the affected Funds.
The order required SBFM to recommend a new transfer agent contract to the Funds’ boards within 180 days of the entry of the order; if a Citigroup affiliate submitted a proposal to serve as transfer agent or sub-transfer agent, SBFM and CGM would have been required, at their expense, to engage an independent monitor to oversee a competitive bidding process. On November 21, 2005, and within the specified timeframe, the Fund’s Board selected a new transfer agent for the Funds. No Citigroup affiliate submitted a proposal to serve as transfer agent. Under the order, SBFM also must comply with an amended version of a vendor policy that Citigroup instituted in August 2004.
Although there can be no assurance, the Funds’ manager does not believe that this matter will have a material adverse effect on the Funds.
On December 1, 2005, Citigroup completed the sale of substantially all of its global asset management business, including SBFM, to Legg Mason.
Beginning in August 2005, five class action lawsuits alleging violations of federal securities laws and state law were filed against CGM and SBFM, (collectively, the “Defendants”) based on the May 31, 2005 settlement order issued against the Defendants by the SEC as
Legg Mason Partners Variable Portfolios III, Inc. 2006 Annual Report 53
Notes to Financial Statements (continued)
described in Note 6. The complaints seek injunctive relief and compensatory and punitive damages, removal of SBFM as the investment manager for the Smith Barney family of funds, rescission of the Funds’ management and other contracts with SBFM, recovery of all fees paid to SBFM pursuant to such contracts, and an award of attorneys’ fees and litigation expenses.
On October 5, 2005, a motion to consolidate the five actions and any subsequently-filed, related action was filed. That motion contemplates that a consolidated amended complaint alleging substantially similar causes of action will be filed in the future.
As of the date of this report, the Funds’ manager believes that resolution of the pending lawsuit will not have a material effect on the financial position or results of operations of the Funds or the ability of the Funds’ manager and its affiliates to continue to render services to the Funds under their respective contracts.
* * *
Beginning in June 2004, class action lawsuits alleging violations of the federal securities laws were filed against CGM and a number of its then affiliates, including SBFM and Salomon Brothers Asset Management Inc. (“SBAM”), which were then investment adviser or manager to certain of the Funds (the “Managers”), substantially all of the mutual funds then managed by the Managers (the “Defendant Funds”), and Board Members of the Defendant Funds (collectively, the “Defendants”). The complaints alleged, among other things, that CGM created various undisclosed incentives for its brokers to sell Smith Barney and Salomon Brothers funds. In addition, according to the complaints, the Managers caused the Defendant Funds to pay excessive brokerage commissions to CGM for steering clients towards proprietary funds. The complaints also alleged that the defendants breached their fiduciary duty to the Defendant Funds by improperly charging Rule 12b-1 fees and by drawing on fund assets to make undisclosed payments of soft dollars and excessive brokerage commissions. The complaints also alleged that the Defendant Funds failed to adequately disclose certain of the allegedly wrongful conduct. The complaints sought injunctive relief and compensatory and punitive damages, rescission of the Defendant Funds’ contracts with the Managers, recovery of all fees paid to the Managers pursuant to such contracts and an award of attorneys’ fees and litigation expenses.
On December 15, 2004, a consolidated amended complaint (the “Complaint”) was filed alleging substantially similar causes of action. On May 27, 2005, all of the Defendants filed motions to dismiss the Complaint. On July 26, 2006, the court issued a decision and order (1) finding that plaintiffs lacked standing to sue on behalf of the shareholders of the Defendant Funds in which none of the plaintiffs had invested (including the Funds) and dismissing those Defendant Funds from the case (although stating that they could be brought back into the case if standing as to them could be established), and (2) other than one stayed claim, dismissing all of the causes of action against the remaining Defendants, with prejudice, except for the cause of action under Section 36(b) of the 1940 Act, which the court granted plaintiffs leave to replead as a derivative claim.
54 Legg Mason Partners Variable Portfolios III, Inc. 2006 Annual Report
Notes to Financial Statements (continued)
On October 16, 2006, plaintiffs filed their Second Consolidated Amended Complaint (“Second Amended Complaint”) which alleges derivative claims on behalf of nine funds identified in the Second Amended Complaint, Section 36(b) of the 1940 Act, against CAM, SBAM, SBFM and CGM as investment advisers to the identified funds, as well as CGM as a distributor for the identified funds (collectively, the “Second Amended Complaint Defendants”). The Funds were not identified in the Second Amended Complaint. The Second Amended Complaint alleges no claims against any of the Funds or any of their Board Members. Under Section 36(b), the Second Amended Complaint alleges similar facts and seeks similar relief against the Second Amended Complaint Defendants as the Complaint.
Additional lawsuits arising out of these circumstances and presenting similar allegations and requests for relief may be filed in the future.
On September 16, 2005, the staff of the SEC informed SBFM and SBAM that the staff is considering recommending that the SEC institute administrative proceedings against SBFM and SBAM for alleged violations of Section 19(a) and 34(b) of the 1940 Act (and related Rule 19a-1). The notification is a result of an industry wide inspection by the SEC and is based upon alleged deficiencies in disclosures regarding dividends and distributions paid to shareholders of certain funds. Section 19(a) and related Rule 19a-1 of the 1940 Act generally require funds that are making dividend and distribution payments to provide shareholders with a written statement disclosing the source of the dividends and distributions, and, in particular, the portion of the payments made from each of net investment income, undistributed net profits and/or paid-in capital. In connection with the contemplated proceedings, the staff may seek a cease and desist order and/or monetary damages from SBFM or SBAM.
Although there can be no assurance, the Funds’ manager believes that this matter is not likely to have a material adverse effect on the Funds.
| 9. | Additional Shareholder Information |
The Funds’ Board approved a number of initiatives designed to streamline and restructure the fund complex, and authorized seeking shareholder approval for those initiatives where shareholder approval is required. As a result, shareholders of each Fund have been asked to elect a new Board, approve matters that will result in the Fund being grouped for organizational and governance purposes with other funds in the fund complex, and domicile the Funds as a Maryland business trust, with all funds operating under uniform charter documents. Shareholders of each Fund also have been asked to approve investment matters, including standardized fundamental investment policies. Shareholder approval was obtained on December 11, 2006. These matters generally are expected to be implemented during the first half of 2007.
| 10. | Recent Accounting Pronouncements |
During June 2006, the Financial Accounting Standards Board (“FASB”) issued FASB Interpretation 48 (“FIN 48” or the “Interpretation”), Accounting for Uncertainty in
Legg Mason Partners Variable Portfolios III, Inc. 2006 Annual Report 55
Notes to Financial Statements (continued)
Income Taxes—an interpretation of FASB Statement 109. FIN 48 supplements FASB Statement 109, Accounting for Income Taxes, by defining the confidence level that a tax position must meet in order to be recognized in the financial statements. FIN 48 prescribes a comprehensive model for how a fund should recognize, measure, present, and disclose in its financial statements uncertain tax positions that the fund has taken or expects to take on a tax return. FIN 48 requires that the tax effects of a position be recognized only if it is “more likely than not” to be sustained based solely on its technical merits. Management must be able to conclude that the tax law, regulations, case law, and other objective information regarding the technical merits sufficiently support the position’s sustainability with a likelihood of more than 50 percent. FIN 48 is effective for fiscal periods beginning after December 15, 2006, which for these Funds will be November 1, 2007. At adoption, the financial statements must be adjusted to reflect only those tax positions that are more likely than not to be sustained as of the adoption date. Management of the Funds has determined that adopting FIN 48 will not have a material impact on the Funds’ financial statements.
* * *
On September 20, 2006, FASB released Statement of Financial Accounting Standards No. 157 “Fair Value Measurements” (“FAS 157”). FAS 157 establishes an authoritative definition of fair value, sets out a framework for measuring fair value, and requires additional disclosures about fair value measurements. The application of FAS 157 is required for fiscal years beginning after November 15, 2007 and interim periods within those fiscal years. At this time, management is evaluating the implications of FAS 157 and its impact on the financial statements has not yet been determined.
56 Legg Mason Partners Variable Portfolios III, Inc. 2006 Annual Report
Report of Independent Registered Public Accounting Firm
The Board of Directors and Shareholders
Legg Mason Partners Variable Portfolios III, Inc.:
We have audited the accompanying statements of assets and liabilities, including the schedules of investments, of Legg Mason Partners Variable High Income Portfolio (formerly Smith Barney High Income Portfolio) and Legg Mason Partners Variable Adjustable Rate Income Portfolio (formerly SB Adjustable Rate Income Portfolio), each a series of Legg Mason Partners Variable Portfolios III, Inc. (formerly Travelers Series Fund Inc.), as of October 31, 2006, and the related statements of operations for the year then ended, the statements of changes in net assets for each of the years in the two-year period then ended, and the financial highlights for each of the years or periods in the five-year period then ended. These financial statements and financial highlights are the responsibility of the Funds’s management. Our responsibility is to express an opinion on these financial statements and financial highlights based on our audits.
We conducted our audits in accordance with the standards of the Public Company Accounting Oversight Board (United States). Those standards require that we plan and perform the audit to obtain reasonable assurance about whether the financial statements and financial highlights are free of material misstatement. An audit includes examining, on a test basis, evidence supporting the amounts and disclosures in the financial statements. Our procedures included confirmation of securities owned as of October 31, 2006, by correspondence with the custodian and brokers or by other appropriate auditing procedures. An audit also includes assessing the accounting principles used and significant estimates made by management, as well as evaluating the overall financial statement presentation. We believe that our audits provide a reasonable basis for our opinion.
In our opinion, the financial statements and financial highlights referred to above present fairly, in all material respects, the financial position of Legg Mason Partners Variable High Income Portfolio and Legg Mason Partners Variable Adjustable Rate Income Portfolio as of October 31, 2006, and the results of their operations for the year then ended, the changes in their net assets for each of the two-year period then ended and the financial highlights for each of the years or periods in the five- year period then ended in conformity with U.S. generally accepted accounting principles.

New York, New York
December 27, 2006
Legg Mason Partners Variable Portfolios III, Inc. 2006 Annual Report 57
Board Approval of Management and Subadvisory Agreements (unaudited)
At a meeting held in person on June 23, 2006, the Funds’ Board, including a majority of the Board Members who are not “interested persons” of each Fund or Legg Mason Partners Fund Advisor, LLC (the “Manager”) or any proposed sub-investment adviser as defined in the Investment Company Act of 1940, as amended (the “1940 Act”) (the “Independent Board Members”), approved a new management agreement (the “New Management Agreement”) between each Fund and the Manager. The Funds’ Board, including a majority of the Independent Board Members, also approved a new subadvisory agreement between the Manager and Western Asset Management Company (the “Subadviser”) (the “New Subadvisory Agreement”) for each Fund. The New Management Agreement and the New Subadvisory Agreement replaced each Fund’s prior management agreement with Smith Barney Fund Management, LLC and were entered into in connection with an internal reorganization of Legg Mason, the parent company of the Manager and the prior manager. In approving the New Management Agreement and New Subadvisory Agreement, the Board, including the Independent Board Members, considered the factors discussed below, among other things.
The Board noted that the Manager will provide administrative and certain oversight services to the Funds, and that the Manager will delegate to the Subadviser the day-to-day portfolio management of each of the Funds. The Board Members reviewed the qualifications, backgrounds and responsibilities of the senior personnel that will provide oversight and general management services and the portfolio management team that would be primarily responsible for the day-to-day management of each of the Funds. The Board Members noted that the portfolio management team was expected to be the same as then managing each of the Funds.
The Board Members received and considered information regarding the nature, extent and quality of services expected to be provided to each of the Funds by the Manager under the New Management Agreement and by the Subadviser under the New Subadvisory Agreement. The Board Members’ evaluation of the services expected to be provided by the Manager and the Subadviser took into account the Board Members’ knowledge and familiarity gained as Board Members of each Fund, including as to the scope and quality of Legg Mason’s investment management and other capabilities and the quality of its administrative and other services. The Board Members considered, among other things, information and assurances provided by Legg Mason as to the operations, facilities and organization of the Manager and the Subadviser and the qualifications, backgrounds and responsibilities of their senior personnel. The Board Members further considered the financial resources available to the Manager, the Subadviser and Legg Mason. The Board Members concluded that, overall, the nature, extent and quality of services expected to be provided under the New Management Agreement and the New Subadvisory Agreement for each Fund were acceptable.
The Board Members also received and considered performance information for each of the Funds as well as comparative information with respect to a peer group of funds (the “Performance Universe”) selected by Lipper, Inc. (“Lipper”), an independent provider of investment company data. The Board Members were provided with a description of the
58 Legg Mason Partners Variable Portfolios III, Inc.
Board Approval of Management and Subadvisory Agreements (unaudited) (continued)
methodology Lipper used to determine the similarity of each Fund to the funds included in the Performance Universe. The Board Members noted that they had received and discussed with management, at periodic intervals, information comparing each Fund’s performance against, among other things, its benchmark. Based on the Board Members’ review, which included careful consideration of the factors noted above, the Board Members concluded that the performance of each Fund, under the circumstances, supported approval of the New Management Agreement and New Subadvisory Agreement.
The Board Members reviewed and considered the management fee that would be payable by each Fund to the Manager in light of the nature, extent and quality of the management services expected to be provided by the Manager, including the fee waiver and/or expense reimbursement arrangements currently in place. Additionally, the Board Members received and considered information comparing each Fund’s management fee and overall expenses with those of comparable funds in both the relevant expense group and a broader group of funds, each selected and provided by Lipper. The Board Members also reviewed and considered the subadvisory fee that would be payable by the Manager to the Subadviser in light of the nature, extent and quality of the management services expected to be provided by the Subadviser. The Board Members noted that the Manager, and not the Funds, will pay the subadvisory fee to the Subadviser. The Board Members determined that each Fund’s management fee and subadvisory fee were reasonable in light of the nature, extent and quality of the services expected to be provided to each Fund under the New Management Agreement and the New Subadvisory Agreement.
The Board Members received and considered a pro-forma profitability analysis of Legg Mason and its affiliates in providing services to each Fund, including information with respect to the allocation methodologies used in preparing the profitability data. The Board Members recognized that Legg Mason may realize economies of scale based on its internal reorganization and synergies of operations. The Board Members noted that it was not possible to predict with a high degree of confidence how Legg Mason’s and its affiliates’ profitability would be affected by its internal reorganization and by other factors including potential economies of scale, but that based on their review of the pro forma profitability analysis, their most recent prior review of the profitability of the predecessor manager and its affiliates from their relationship with the Funds and other factors considered, they determined that the management fee was reasonable. The Board Members noted that they expect to receive profitability information on an annual basis.
In their deliberations, the Board Members also considered, and placed significant importance on, information that had been received and conclusions that had been reached by the Board in connection with the Board’s most recent approval of each Fund’s prior management agreement, in addition to information provided in connection with the Board’s evaluation of the terms and conditions of the New Management Agreement and the New Subadvisory Agreement.
The Board Members considered Legg Mason’s advice and the advice of its counsel that the New Management Agreement and the New Subadvisory Agreement were being entered into in connection with an internal reorganization within Legg Mason, that did
Legg Mason Partners Variable Portfolios III, Inc. 59
Board Approval of Management and Subadvisory Agreements (unaudited) (continued)
not involve an actual change of control or management. The Board Members further noted that the terms and conditions of the New Management Agreement are substantially identical to those of each Fund’s previous management agreement except for the identity of the Manager, and that the initial term of the New Management Agreement (after which it will continue in effect only if such continuance is specifically approved at least annually by the Board, including a majority of the Independent Board Members) was the same as that under the prior management agreement.
In light of all of the foregoing, the Board, including the Independent Board Members, approved the New Management Agreement and the New Subadvisory Agreement. No single factor reviewed by the Board Members was identified as the principal factor in determining whether to approve the New Management Agreement and the New Subadvisory Agreement. The Independent Board Members were advised by separate independent legal counsel throughout the process. The Independent Board Members also discussed the proposed approval of the New Management Agreement and the New Subadvisory Agreement in private sessions with their independent legal counsel at which no representatives of the Manager or Subadviser were present.
Subsequently, at a meeting held in person on September 19, 2006, the Board of Legg Mason Partners Variable High Income Portfolio (“High Income Portfolio”), including a majority of the Independent Board Members, approved a new subadvisory agreement between Western Asset Management Company (“Western Asset”) and Western Asset Management Company Limited (the “Sub-subadvisory Agreement”). Western Asset Management Company Limited (“Western Asset Limited”) provides investment advisory services with respect to the High Income Portfolio’s non-U.S. dollar-denominated securities and related foreign currencies and futures. It is expected that the term of the new Sub-subadvisory Agreement, and the advisory services provided thereunder by Western Asset Limited, will commence on or about May 1, 2007.
In approving the Sub-subadvisory Agreement, the Board Members considered that the appointment of Western Asset Limited would not result in any material change in the nature or the level of investment advisory services provided to the High Income Portfolio. The Board Members considered that Western Asset Limited personnel are highly integrated into the Western Asset structure and that Western Asset has supervisory oversight responsibility over all of Western Asset Limited’s business, including investment decisions and execution of transactions. The Board Members further considered that Western Asset’s oversight includes the active participation by its senior investment management and market sector teams in the investment process relating to the development and implementation of investment strategy. The Board Members further considered that the Sub-subadvisory Agreement would not result in any increase in the management fees payable by the High Income Portfolio for investment management services. In particular, the Board Members considered that Western Asset compensates Western Asset Limited for its services based on the percentage of average daily net assets of the High Income Portfolio that is allocated by Western Asset to Western Asset Limited.
60 Legg Mason Partners Variable Portfolios III, Inc.
Board Approval of Management and Subadvisory Agreements (unaudited) (continued)
In their deliberations, the Board Members also considered, and placed significant importance on, information that had been received and conclusions that had been recently reached by the Board Members in connection with the Board’s evaluation of the terms and conditions of the New Management Agreement and the New Subadvisory Agreement. No single factor reviewed by the Board Members was identified as the principal factor in determining whether to approve the Sub-subadvisory Agreement. The Independent Board Members were advised by separate independent legal counsel in connection with the approval of the Sub-subadvisory Agreement and discussed the proposed approval of the Sub-subadvisory Agreement in private sessions with their independent legal counsel at which no representatives of the Manager, Western Asset or Western Asset Limited were present.
Legg Mason Partners Variable Portfolios III, Inc. 61
Additional Information (unaudited)
Information about Directors and Officers
The business and affairs of the Legg Mason Partners Variable Portfolios III, Inc. (formerly known as Travelers Series Fund Inc.) (the “Company”) are managed under the direction of the Board of Directors. Information pertaining to the Directors and Officers of the Company is set forth below. The Statement of Additional Information includes additional information about the Company’s Directors and is available, without charge, by calling Legg Mason Partners Shareholder Services at 1-800-451-2010.
| | | | | | | | | | |
| | | | | |
Name, Address
and Birth Year | | Position(s)
Held with
Fund | | Term of
Office* and
Length
of Time
Served | | Principal
Occupation(s)
During Past
Five Years | | Number of
Portfolios
in Fund
Complex
Overseen by
Director | | Other Board
Memberships Held by Director |
| Non-Interested Directors: | | | | |
Robert A. Frankel 1961 Deergrass Way Carlsbad, CA 92009 Birth Year: 1927 | | Director | | Since
1999 | | Managing Partner of Robert A. Frankel Managing Consultants; Formerly, Vice President of The Readers Digest Association, Inc. | | 18 | | None |
| | | | | |
Michael E. Gellert 122 East 42nd Street 47th Floor New York, NY 10168 Birth Year: 1931 | | Director | | Since
1999 | | General Partner of Windcrest Partners, a venture capital firm | | 11 | | Director of Dalet S.A. (media management operations); SEACOR Holdings, Inc. (offshore marine services provider) and Six Flags, Inc. |
| | | | | |
Rainer Greeven 630 5th Avenue Suite 1960 New York, NY 10111 Birth Year: 1936 | | Director | | Since
1994 | | Attorney, Rainer Greeven PC (since 1998); President and Director, 175 E. 62nd St. Corp. (real estate) (since 2002) | | 11 | | None |
| | | | | |
Susan M. Heilbron P.O. Box 557 Chilimark, MA 02535 Birth Year: 1945 | | Director | | Since
1994 | | Independent consultant (since 2001); Formerly, owner of Lacey & Heilbron (communications consulting) (from 1993 to 2001) | | 11 | | None |
62 Legg Mason Partners Variable Portfolios III, Inc.
Additional Information (unaudited) (continued)
| | | | | | | | | | |
| | | | | |
Name, Address
and Birth Year | | Position(s)
Held with
Fund | | Term of
Office* and
Length
of Time
Served | | Principal
Occupation(s)
During Past
Five Years | | Number of
Portfolios
in Fund
Complex
Overseen by
Director | | Other Board
Memberships Held by Director |
| Interested Director: | | | | |
R. Jay Gerken, CFA** Legg Mason & Co., LLC (“Legg Mason”) 399 Park Avenue
4th Floor New York, NY 10022 Birth Year: 1951 | | Chairman, President and Chief Executive Officer | | Since
2002 | | Managing Director of Legg Mason; President and Chief Executive Officer of Legg Mason Partners Fund Advisors, LLC (“LMPFA”) (Since 2006); President and Chief Executive Officer of Smith Barney Fund Management LLC (“SBFM”) and Citi Fund Management Inc, (“CFM”); President and Chief Executive Officer of certain mutual funds associated with Legg Mason; Formerly, Chairman of SBFM and CFM (from 2002 to 2006); Formerly, Chairman, President and Chief Executive Officer of Travelers Investment Advisers, Inc. (from 2002 to 2005) | | 162 | | Trustee, Consulting Group Capital Markets Fund |
| Officers: | | | | | | | | | | |
Frances M. Guggino Legg Mason 125 Broad Street, 10th Floor New York, NY 10004 Birth Year: 1957 | | Chief Financial Officer and Treasurer | | Since
2006 | | Director of Legg Mason; Chief Financial Officer and Treasurer of certain mutual funds associated with Legg Mason; Formerly, Controller of certain mutual funds associated with Legg Mason (from 1999 to 2004) | | N/A | | N/A |
Legg Mason Partners Variable Portfolios III, Inc. 63
Additional Information (unaudited) (continued)
| | | | | | | | | | |
| | | | | |
Name, Address
and Birth Year | | Position(s)
Held with
Fund | | Term of
Office* and
Length
of Time
Served | | Principal
Occupation(s)
During Past
Five Years | | Number of
Portfolios
in Fund
Complex
Overseen by
Director | | Other Board
Memberships Held by Director |
Ted P. Becker Legg Mason 399 Park Avenue, 4th Floor New York, NY 10022 Birth Year: 1951 | | Chief Compliance Officer | | Since
2006 | | Director of Global Compliance at Legg Mason (since 2006); Chief Compliance Officer of LMPFA (since 2006); Managing Director of Compliance at Legg Mason (since 2005); Chief Compliance Officer with certain mutual funds associated with Legg Mason (since 2006); Managing Director of Compliance at Legg Mason or its predecessor (2002- 2005); Prior to 2002, Managing Director— Internal Audit & Risk Review at Citigroup, Inc. | | N/A | | N/A |
| | | | | |
John Chiota Legg Mason 100 First Stamford Place, 5th Floor Stamford, CT 06902 Birth Year: 1968 | | Chief Anti-Money Laundering Compliance Officer | | Since
2006 | | Vice President of Legg Mason or its predecessor (since 2004); Chief Anti- Money Laundering Compliance Officer with certain mutual funds associated with Legg Mason (since 2006); Prior to August 2004, Chief AML Compliance Officer with TD Waterhouse | | N/A | | N/A |
64 Legg Mason Partners Variable Portfolios III, Inc.
Additional Information (unaudited) (continued)
| | | | | | | | | | |
| | | | | |
Name, Address
and Birth Year | | Position(s)
Held with
Fund | | Term of
Office* and
Length
of Time
Served | | Principal
Occupation(s)
During Past
Five Years | | Number of
Portfolios
in Fund
Complex
Overseen by
Director | | Other Board
Memberships Held by Director |
Robert I. Frenkel
Legg Mason 300 First Stamford Place
4th Floor Stamford, CT 06902 Birth Year: 1954 | | Secretary and Chief Legal Officer | | Since
2003 | | Managing Director and General Counsel of Global Mutual Funds for Legg Mason and its predecessors (since 1994); Secretary and Chief Legal Officer of mutual funds associated with Legg Mason (since 2003); Formerly, Secretary of CFM (from 2001 to 2004) | | N/A | | N/A |
| * | | Each Director and Officer serves until his or her successor has been duly elected and qualified. |
| ** | | Mr. Gerken is an “interested person” of the Company as defined in the Investment Company Act of 1940, as amended, because Mr. Gerken is an officer of LMPFA and certain of its affiliates. |
Legg Mason Partners Variable Portfolios III, Inc. 65
Additional Shareholder Information (unaudited)
Results of a Special Meeting of Shareholders
On December 11, 2006, a Special Meeting of Shareholders was held to vote on various proposals recently approved by the Fund's Board Members. The following tables provide the number of votes cast for, against or withheld, as well as the number of abstentions and broker non-votes as to the following proposals: (1) Elect Board Members, (2) Regroup and Reorganize Funds, and (3) Revise Fundamental Investment Policies.
Proposal 1: Elect Board Members†.
| | | | | | | | |
| Item Voted On | | Votes For | | Votes Against | | Abstentions | | Broker
Non-Votes |
Nominees: | | | | | | | | |
Paul R. Ades | | 627,038,784.337 | | 28,077,775.512 | | 0.000 | | 0.000 |
Andrew L. Breech | | 627,196,957.837 | | 27,919,602.012 | | 0.000 | | 0.000 |
Dwight B. Crane | | 626,833,724.086 | | 28,282,835.763 | | 0.000 | | 0.000 |
Robert M. Frayn, Jr. | | 626,781,438.698 | | 28,335,121.151 | | 0.000 | | 0.000 |
Frank G. Hubbard | | 626,978,109.222 | | 28,138,450.627 | | 0.000 | | 0.000 |
Howard J. Johnson | | 626,924,564.456 | | 28,191,995.393 | | 0.000 | | 0.000 |
David E. Maryatt | | 626,906,972.055 | | 28,209,587.794 | | 0.000 | | 0.000 |
Jerome H. Miller | | 627,150,693.392 | | 27,965,866.457 | | 0.000 | | 0.000 |
Ken Miller | | 627,176,821.935 | | 27,939,737.914 | | 0.000 | | 0.000 |
John J. Murphy | | 626,472,532.788 | | 28,644,027.061 | | 0.000 | | 0.000 |
Thomas F. Schlafly | | 627,140,091.304 | | 27,976,468.545 | | 0.000 | | 0.000 |
Jerry A. Viscione | | 626,511,106.887 | | 28,605,452.962 | | 0.000 | | 0.000 |
R. Jay Gerken, CFA | | 626,765,585.797 | | 28,350,974.052 | | 0.000 | | 0.000 |
| |
| † | | Board Members are elected by the shareholders of all of the series of the Company of which the Fund is a series. |
Proposal 2: Regroup and Reorganize Funds.
| | | | | | | | |
Fund | | Votes For | | Votes Against | | Abstentions | | Broker
Non-Votes |
Legg Mason Variable Adjustable Rate Income Portfolio | | 3,734,150.000 | | 22,514.497 | | 93,501.880 | | 0.000 |
Legg Mason Variable High Income Portfolio | | 33,924,834.512 | | 432,037.429 | | 1,108,062.789 | | 0.000 |
| |
66 Legg Mason Partners Variable Portfolios III, Inc.
Additional Shareholder Information (unaudited) (continued)
Proposal 3: Revise Fundamental Investment Policies.
| | | | | | | | |
| Items Voted On | | Votes For | | Votes Against | | Abstentions | | Broker
Non-Votes |
Legg Mason Variable Adjustable Rate Income Portfolio | | | | |
Borrowing Money | | 3,661,044.388 | | 63,358.145 | | 125,763.844 | | 0.000 |
Underwriting | | 3,673,143.889 | | 47,456.636 | | 129,566.852 | | 0.000 |
Lending | | 3,660,383.443 | | 63,327.933 | | 126,455.001 | | 0.000 |
Issuing Senior Securities | | 3,669,230.402 | | 47,426.573 | | 133,509.402 | | 0.000 |
Real Estate | | 3,680,964.992 | | 41,717.545 | | 127,483.840 | | 0.000 |
Commodities | | 3,683,532.132 | | 37,067.393 | | 129,566.852 | | 0.000 |
Concentration | | 3,701,227.090 | | 18,343.595 | | 130,595.692 | | 0.000 |
Diversification | | 3,698,579.983 | | 22,562.456 | | 129,023.938 | | 0.000 |
Non-Fundamental | | 3,693,949.550 | | 29,761.826 | | 126,455.001 | | 0.000 |
Purchasing Securities on Margin | | 3,669,005.466 | | 52,136.973 | | 129,023.938 | | 0.000 |
Short Sales | | 3,665,317.933 | | 55,824.506 | | 129,023.938 | | 0.000 |
| |
| |
Legg Mason Variable High Income Portfolio | | | | | | |
Borrowing Money | | 33,548,913.569 | | 559,259.673 | | 1,356,761.488 | | 0.000 |
Underwriting | | 33,604,427.684 | | 546,280.619 | | 1,314,226.427 | | 0.000 |
Lending | | 33,640,827.305 | | 569,790.359 | | 1,254,317.066 | | 0.000 |
Issuing Senior Securities | | 33,658,980.933 | | 500,601.298 | | 1,305,352.499 | | 0.000 |
Real Estate | | 33,667,380.873 | | 512,017.141 | | 1,285,536.716 | | 0.000 |
Commodities | | 33,659,082.738 | | 476,751.139 | | 1,329,100.853 | | 0.000 |
Concentration | | 33,689,453.527 | | 471,082.041 | | 1,304,399.162 | | 0.000 |
Diversification | | 33,679,051.757 | | 461,058.847 | | 1,324,824.126 | | 0.000 |
Non-Fundamental | | 33,561,304.610 | | 638,936.229 | | 1,264,693.891 | | 0.000 |
| |
Legg Mason Partners Variable Portfolios III, Inc. 67
Important Tax Information (unaudited)
The following information is provided with respect to the distributions paid during the taxable year ended October 31, 2006:
| | | |
| |
| | | Legg Mason Partners Variable High Income Portfolio | |
Record Date: | | 12/27/2005 | |
Payable Date: | | 12/28/2005 | |
| | |
Dividends Qualifying for the Dividends Received Deduction for Corporations | | 0.21 | % |
| | |
Please retain this information for your records.
68 Legg Mason Partners Variable Portfolios III, Inc.
Legg Mason Partners Variable Adjustable Rate Income Portfolio
Legg Mason Partners Variable High Income Portfolio
| | |
DIRECTORS Robert A. Frankel Michael E. Gellert R. Jay Gerken, CFA
Chairman Rainer Greeven Susan M. Heilbron | | INVESTMENT MANAGER Legg Mason Partners Fund Advisor, LLC SUBADVISER Western Asset Management Company DISTRIBUTORS Citigroup Global Markets Inc. Legg Mason Investor Services, LLC CUSTODIAN State Street Bank and Trust Company ANNUITY
ADMINISTRATION Travelers Annuity Investor Services One Cityplace Hartford, Connecticut 06103-3415 TRANSFER AGENT PFPC Inc. 4400 Computer Drive Westborough, Massachusetts 01581 INDEPENDENT
REGISTERED PUBLIC ACCOUNTING FIRM KPMG LLP 345 Park Avenue New York, New York 10154 |
This report is submitted for the general information of the shareholders of Legg Mason Partners Variable Adjustable Rate Income and Legg Mason Partners Variable High Income Portfolios.
This report must be preceded or accompanied by a free prospectus. Investors should consider the Funds’ investment objectives, risks, charges and expenses carefully before investing. The prospectus contains this and other information about the Funds. Please read the prospectus carefully before investing.
www.leggmason.com/InvestorServices
©2006 Legg Mason Investor Services, LLC
Member NASD, SIPC
Legg Mason Partners Variable Adjustable Rate Income Portfolio
Legg Mason Partners Variable High Income Portfolio
The Funds are separate investment funds of the Legg Mason Partners Variable Portfolios III, Inc., a Maryland corporation.
LEGG MASON PARTNERS VARIABLE PORTFOLIOS III, INC.
Legg Mason Partners Funds
125 Broad Street
10th Floor, MF-2
New York, New York 10004
The Funds file their complete schedule of portfolio holdings with the Securities and Exchange Commission for the first and third quarters of each fiscal year on Form N-Q. The Funds’ Forms N-Q are available on the Commission’s website at www.sec.gov. The Funds’ Forms N-Q may be reviewed and copied at the Commission’s Public Reference Room in Washington D.C., and information on the operation of the Public Reference Room may be obtained by calling 1-800-SEC-0330. To obtain information of Form N-Q from the Funds, shareholders can call Legg Mason Partners Shareholder Services at 1-800-451-2010.
Information on how the Funds voted proxies relating to portfolio securities during the prior 12-month period ended June 30th of each year and a description of the policies and procedures that the Funds use to determine how to vote proxies related to portfolio transactions are available (1) without charge, upon request, by calling 1-800-451-2010, (2) on the Funds’ website at www.leggmason.com/InvestorServices and (3) on the SEC’s website at www.sec.gov.
The registrant has adopted a code of ethics that applies to the registrant’s principal executive officer, principal financial officer, principal accounting officer or controller.
| ITEM 3. | AUDIT COMMITTEE FINANCIAL EXPERT. |
The Board of Directors of the registrant has determined that Robert A. Frankel, the Chairman of the Board’s Audit Committee, possesses the technical attributes identified in Instruction 2(b) of Item 3 to Form N-CSR to qualify as an “audit committee financial expert,” and has designated Mr. Frankel as the Audit Committee’s financial expert. Mr. Frankel is an “independent” Director pursuant to paragraph (a)(2) of Item 3 to Form N-CSR.
| ITEM 4. | PRINCIPAL ACCOUNTANT FEES AND SERVICES. |
a) Audit Fees. The aggregate fees billed in the last two fiscal years ending October 31, 2005 and October 31, 2006 (the “Reporting Periods”) for professional services rendered by the Registrant’s principal accountant (the “Auditor”) for the audit of the Registrant’s annual financial statements, or services that are normally provided by the Auditor in connection with the statutory and regulatory filings or engagements for the Reporting Periods, were $177,500 in 2005 and $207,000 in 2006.
b) Audit-Related Fees. There were no fees billed in the Reporting Periods for assurance and related services by the Auditor that are reasonably related to the performance of the audit of the Registrant’s financial statements and are not reported under paragraph (a) of this Item 4.
In addition, there were no Audit-Related Fees billed in the Reporting Period for assurance and related services by the Auditor to the Registrant’s investment adviser (not including any sub-adviser whose role is primarily portfolio management and is subcontracted with or overseen by another investment adviser), and any entity controlling, controlled by or under common control with the investment adviser that provides ongoing services to the Legg Mason Partners Variable Portfolio III (“service affiliates”), that were reasonably related to the performance of the annual audit of the service affiliates. Accordingly, there were no such fees that required pre-approval by the Audit Committee for the Reporting Periods (prior to May 6, 2003 services provided by the Auditor were not required to be pre-approved).
(c) Tax Fees. The aggregate fees billed in the Reporting Periods for professional services rendered by the Auditor for tax compliance, tax advice and tax planning (“Tax Services”) were $37,500 in 2005 and $4,400 in 2006. These services consisted of (i) review or preparation of U.S. federal, state, local and excise tax returns; (ii) U.S. federal, state and local tax planning, advice and assistance regarding statutory, regulatory or administrative developments, and (iii) tax advice regarding tax qualification matters and/or treatment of various financial instruments held or proposed to be acquired or held.
There were no fees billed for tax services by the Auditors to service affiliates during the Reporting Periods that required pre-approval by the Audit Committee.
d) All Other Fees. There were no other fees billed in the Reporting Periods for products and services provided by the Auditor, other than the services reported in paragraphs (a) through (c) of this Item for the Legg Mason Partners Variable Portfolio III
All Other Fees. There were no other non-audit services rendered by the Auditor to Smith Barney Fund Management LLC (“SBFM”), and any entity controlling, controlled by or under common control with SBFM that provided ongoing services to Legg Mason Partners Variable Portfolio III requiring pre-approval by the Audit Committee in the Reporting Period.
(e) Audit Committee’s pre–approval policies and procedures described in paragraph (c) (7) of Rule 2-01 of Regulation S-X.
(1) The Charter for the Audit Committee (the “Committee”) of the Board of each registered investment company (the “Fund”) advised by Smith Barney Fund Management LLC or Salomon Brothers Asset Management Inc. or one of their affiliates (each, an “Adviser”) requires that the Committee shall approve (a) all audit and permissible non-audit services to be provided to the Fund and (b) all permissible non-audit services to be provided by the Fund’s independent auditors to the Adviser and any Covered Service Providers if the engagement relates directly to the operations and financial reporting of the Fund. The Committee may implement policies and procedures by which such services are approved other than by the full Committee.
The Committee shall not approve non-audit services that the Committee believes may impair the independence of the auditors. As of the date of the approval of this Audit Committee Charter, permissible non-audit services include any professional services (including tax services), that are not prohibited services as described below, provided to the Fund by the independent auditors, other than those provided to the Fund in connection with an audit or a review of the financial statements of the Fund. Permissible non-audit services may not include: (i) bookkeeping or other services related to the accounting records or financial statements of the Fund; (ii) financial information systems design and implementation; (iii) appraisal or valuation services, fairness opinions or contribution-in-kind reports; (iv) actuarial services; (v) internal audit outsourcing services; (vi) management functions or human resources; (vii) broker or dealer, investment adviser or investment banking services; (viii) legal services and expert services unrelated to the audit; and (ix) any other service the Public Company Accounting Oversight Board determines, by regulation, is impermissible.
Pre-approval by the Committee of any permissible non-audit services is not required so long as: (i) the aggregate amount of all such permissible non-audit services provided to the Fund, the Adviser and any service providers controlling, controlled by or under common control with the Adviser that provide ongoing services to the Fund (“Covered Service Providers”) constitutes not more than 5% of the total amount of revenues paid to the independent auditors during the fiscal year in which the permissible non-audit services are provided to (a) the Fund, (b) the Adviser and (c) any entity controlling, controlled by or under common control with the Adviser that provides ongoing services to the Fund during the fiscal year in which the services are provided that would have to be approved by the Committee; (ii) the permissible non-audit services were not recognized by the Fund at the time of the engagement to be non-audit services; and (iii) such services are promptly brought to the attention of the Committee and approved by the Committee (or its delegate(s)) prior to the completion of the audit.
(2) For the Legg Mason Partners Variable Portfolio III, the percentage of fees that were approved by the audit committee, with respect to: Audit-Related Fees were 100% and 0% for 2005 and 2006; Tax Fees were 100% and 0% for 2005 and 2006; and Other Fees were 100% and 0% for 2005 and 2006.
(f) N/A
(g) Non-audit fees billed by the Auditor for services rendered to Legg Mason Partners Variable Portfolio III and CAM and any entity controlling, controlled by, or under common control with CAM that provides ongoing services to Legg Mason Partners Variable Portfolio III during the reporting period were $0 in 2006 for fees related to the transfer agent matter as fully described in the notes the financial statements titled “additional information” and $75,000 for 2005.
(h) Yes. Legg Mason Partners Variable Portfolio III’s Audit Committee has considered whether the provision of non-audit services that were rendered to Service Affiliates which were not pre-approved (not requiring pre-approval) is compatible with maintaining the Accountant’s independence. All services provided by the Auditor to the Legg Mason Partners Variable Portfolio III or to Service Affiliates, which were required to be pre-approved, were pre-approved as required.
| ITEM 5. | AUDIT COMMITTEE OF LISTED REGISTRANTS. |
Not applicable.
| ITEM 6. | SCHEDULE OF INVESTMENTS. |
Included herein under Item 1.
| ITEM 7. | DISCLOSURE OF PROXY VOTING POLICIES AND PROCEDURES FOR CLOSED-END MANAGEMENT INVESTMENT COMPANIES. |
Not applicable.
| ITEM 8. | PORTFOLIO MANAGERS OF CLOSED-END MANAGEMENT INVESTMENT COMPANIES. |
Not applicable.
| ITEM 9. | PURCHASES OF EQUITY SECURITIES BY CLOSED-END MANAGEMENT INVESTMENT COMPANY AND AFFILIATED PURCHASERS. |
Not applicable.
| ITEM 10. | SUBMISSION OF MATTERS TO A VOTE OF SECURITY HOLDERS. |
Not applicable.
| ITEM 11. | CONTROLS AND PROCEDURES. |
| | (a) | The registrant’s principal executive officer and principal financial officer have concluded that the registrant’s disclosure controls and procedures (as defined in Rule 30a- 3(c) under the Investment Company Act of 1940, as amended (the “1940 Act”)) are effective as of a date within 90 days of the filing date of this report that includes the disclosure required by this paragraph, based on their evaluation of the disclosure controls and procedures required by Rule 30a-3(b) under the 1940 Act and 15d-15(b) under the Securities Exchange Act of 1934. |
| | (b) | There were no changes in the registrant’s internal control over financial reporting (as defined in Rule 30a-3(d) under the 1940 Act) that occurred during the registrant’s last fiscal half-year (the registrant’s second fiscal half-year in the case of an annual report) that have materially affected, or are likely to materially affect the registrant’s internal control over financial reporting. |
| | (a)(1) | Code of Ethics attached hereto. |
Exhibit 99.CODE ETH
| | (a)(2) | Certifications pursuant to section 302 of the Sarbanes-Oxley Act of 2002 attached hereto. |
Exhibit 99.CERT
| | (b) | Certifications pursuant to Section 906 of the Sarbanes-Oxley Act of 2002 attached hereto. |
Exhibit 99.906CERT
SIGNATURES
Pursuant to the requirements of the Securities Exchange Act of 1934 and the Investment Company Act of 1940, the registrant has duly caused this Report to be signed on its behalf by the undersigned, there unto duly authorized.
Legg Mason Partners Variable Portfolios III, Inc.
| | |
| By: | | /s/ R. Jay Gerken |
| | R. Jay Gerken |
| | Chief Executive Officer of Legg Mason Partners Variable Portfolios III, Inc. |
|
| Date: January 8, 2007 |
Pursuant to the requirements of the Securities Exchange Act of 1934 and the Investment Company Act of 1940, this report has been signed below by the following persons on behalf of the registrant and in the capacities and on the dates indicated.
| | |
| By: | | /s/ R. Jay Gerken |
| | R. Jay Gerken |
| | Chief Executive Officer of Legg Mason Partners Variable Portfolios III, Inc. |
|
| Date: January 8, 2007 |
| |
| By: | | /s/ Frances M. Guggino |
| | Frances M. Guggino |
| | Chief Financial Officer of Legg Mason Partners Variable Portfolios III, Inc. |
|
| Date: January 8, 2007 |