UNITED STATES SECURITIES AND EXCHANGE COMMISSION
Washington, D.C. 20549
Form 10-K
| | | |
| (Mark One) | | |
þ | | ANNUAL REPORT PURSUANT TO SECTION 13 OR 15(d)
OF THE SECURITIES EXCHANGE ACT OF 1934 |
| | | For the fiscal year ended January 29, 2007 |
or |
o | | TRANSITION REPORT PURSUANT TO SECTION 13 OR 15(d) OF THE SECURITIES EXCHANGE ACT OF 1934 |
Commission File Number 1-11313
CKE Restaurants, Inc.
(Exact name of registrant as specified in its charter)
| | | |
| Delaware | | 33-0602639 |
(State or other jurisdiction of
incorporation or organization) | | (I.R.S. Employer
Identification No.) |
6307 Carpinteria Ave., Ste. A
Carpinteria, California 93013
(Address of principal executive offices)
Registrant’s telephone number, including area code
(805) 745-7500
Securities Registered Pursuant to Section 12(b) of the Act:
| | | |
Title of Each Class | | Name of Each Exchange on Which Registered |
| |
| Common Stock, $.01 par value | | New York Stock Exchange |
| 4% Convertible Subordinated Notes due 2023 | | New York Stock Exchange |
Securities Registered Pursuant to Section 12(g) of the Act:
None
Indicate by check mark whether the registrant is well-known seasoned issuer, as defined in Rule 405 of the Securities Act. Yes þ No o
Indicate by check mark if the registrant is not required to file reports pursuant to Section 13 or Section 15(d) of the Act. Yes o No þ
Indicate by check mark whether the registrant (1) has filed all reports required to be filed by Section 13 or 15(d) of the Securities Exchange Act of 1934 during the preceding 12 months (or for such shorter period that the registrant was required to file such reports), and (2) has been subject to such filing requirements for the past 90 days. Yes þ Noo
Indicate by check mark if disclosure of delinquent filers pursuant to Item 405 ofRegulation S-K (§229.405 of this chapter) is not contained herein, and will not be contained, to the best of registrant’s knowledge, in definitive proxy or information statements incorporated by reference in Part III of thisForm 10-K or any amendment to thisForm 10-K. o
Indicate by check mark whether the registrant is a large accelerated filer, an accelerated filer, or a non-accelerated filer. See definition of “accelerated filer and large accelerated filer” inRule 12b-2 of the Exchange Act.
(Check one): Large accelerated filer þ Accelerated filero Non-accelerated filer o
Indicate by check mark if the registrant is a shell company (as defined inRule 12b-2 of the Act). Yes o No þ
The aggregate market value of the voting stock held by non-affiliates of the registrant as of August 14, 2006 was $885,818,062.
The number of outstanding shares of the registrant’s common stock was 67,198,004 as of March 22, 2007.
DOCUMENTS INCORPORATED BY REFERENCE:
Portions of the registrant’s Proxy Statement for the 2007 Annual Meeting of Stockholders, which will be filed with the Securities and Exchange Commission within 120 days of January 29, 2007, are incorporated by reference into Part III of this Report.
CKE RESTAURANTS, INC. AND SUBSIDIARIES
INDEX TO ANNUAL REPORT ONFORM 10-K
For the Fiscal Year Ended January 29, 2007
TABLE OF CONTENTS
i
PART I
Our fiscal year ends on the last Monday in January each year. In this Annual Report onForm 10-K, we refer to the fiscal years by reference to the calendar year in which they end (e.g., the fiscal year ended January 29, 2007, is referred to as “fiscal 2007,” and the fiscal year ended January 30, 2006, is referred to as “fiscal 2006”). Fiscal 2007 and fiscal 2006 each include 52 weeks, and fiscal 2005 includes 53 weeks. For clarity of presentation, we generally label all fiscal years presented as if the fiscal year ended January 31. All dollar amounts, except per share amounts, presented in this Annual Report onForm 10-K are in thousands, unless otherwise noted.
Company Overview
We own, operate, franchise or license 3,105 quick-service and fast-casual restaurants, which are referred to in our industry as QSRs, primarily under the brand names Carl’s Jr.®, Hardee’s® and La Salsa Fresh Mexican Grill® (“La Salsa”). According to the June 26, 2006 issue of Nation’s Restaurant News, our Hardee’s and Carl’s Jr. chains are the tenth and twelfth largest sandwich restaurant chains in the U.S., respectively, based on U.S. system-wide foodservice sales. Our system-wide restaurant portfolio at January 31, 2007, consisted of:
| | | | | | | | | | | | | | | | | | | | | |
| | | Carl’s Jr. | | | Hardee’s | | | La Salsa | | | Other | | | Total | |
| |
| Company-operated | | | 393 | | | | 696 | | | | 55 | | | | 1 | | | | 1,145 | |
| Franchised and licensed | | | 694 | | | | 1,210 | | | | 41 | | | | 15 | | | | 1,960 | |
| | | | | | | | | | | | | | | | | | | | | |
| Total | | | 1,087 | | | | 1,906 | | | | 96 | | | | 16 | | | | 3,105 | |
| | | | | | | | | | | | | | | | | | | | | |
Carl’s Jr. The first Carl’s Jr. restaurant was opened in 1956. Our Carl’s Jr. restaurants are located predominantly in the Western United States. Carl’s Jr. restaurants offer superior quality food, a largely burger-based menu with other premium quality dining selections at reasonable prices and attentive customer service to create a quality dining experience for our customers. As of January 31, 2007, 171 of our 393 company-operated Carl’s Jr. restaurants are dual-branded with Green Burrito®. These dual-branded Carl’s Jr. restaurants typically have both higher sales and profits. Carl’s Jr. is predominantly a lunch and dinner concept, with approximately 85% of Carl’s Jr. company-operated restaurant revenue coming from the lunch and dinner portion of its business in fiscal 2007.
Hardee’s. The first Hardee’s restaurant was opened in 1960. Our Hardee’s restaurants are located predominantly in the Southeastern and Midwestern United States. Hardee’s lunch and dinner menu is anchored by its super-premium quality line of1/3-,1/2- and2/3-lb. Angus beef Thickburgerstm, which are complemented withbest-in-class charbroiled and crispy chicken sandwiches. Historically, Hardee’s has been known as the best choice for breakfast in the QSR industry, with approximately 44% of company-operated revenue derived from that portion of its business in fiscal 2007. Hardee’s breakfast menu can attribute much of its success to the industry-first Made From Scratch® biscuits and biscuit breakfast sandwiches. The brand’s emphasis on superior customer service coupled with its more balanced current menu now gives Hardee’s an ideal opportunity to build sales in all meal occasions.
La Salsa. We acquired La Salsa on March 1, 2002, when we acquired Santa Barbara Restaurant Group, Inc. (“SBRG”). Our La Salsa restaurants are located predominantly in California, and are quality, fast-casual restaurants featuring traditional Mexican food items including tacos, burritos, enchiladas and salads.
Recent Developments
Restatement of Prior Period Financial Results. As reported in our Current Report onForm 8-K filed on February 28, 2007, the Audit Committee of our Board of Directors, after discussion with management and KPMG LLP, our independent registered public accounting firm, concluded on February 27, 2007, that our previously issued fiscal 2006 consolidated financial statements needed to be restated. As a result of the restatement, the consolidated financial statements included in our Annual Report onForm 10-K for the fiscal year ended January 31, 2006, should no longer be relied upon, and the consolidated financial statements for fiscal 2006 contained in this Annual Report
1
should be relied upon in their place. Please see “Management’s Discussion and Analysis of Financial Condition and Results of Operations — Restatement of Previously Issued Financial Statements and Notes to Consolidated Financial Statements — Note 1 — Significant Accounting Policies — Restatement of Previously Issued Financial Statements” for additional information.
Amendment to Sixth Amended and Restated Credit Facility (“Facility”). On January 22, 2007, we entered into an amendment of our existing senior credit facility, increasing the aggregate amount that we are permitted to expend for stock repurchases and dividend payments by $130,000, and increasing the total amount available to us for revolving loans under the Facility by $100,000 to $250,000. As a result of the increased capacity for stock repurchases under the Facility, our Board of Directors authorized a further expansion of our stock repurchase program, as discussed below.
Seventh Amended and Restated Credit Facility (“Amended Facility”).On March 27, 2007, we amended and restated the Facility by entering into the Amended Facility, which provides for a $320,000 senior secured credit facility consisting of a $200,000 revolving credit facility and a $120,000 term loan. The revolving credit facility matures on March 27, 2012. The principal amount of the term loan is scheduled to be repaid in quarterly installments, with the remaining principal balance scheduled to mature on March 27, 2013.
Repurchase of Common Stock. Pursuant to a program (“Stock Repurchase Plan”) authorized by our Board of Directors, as modified during fiscal 2007, we are allowed to repurchase up to an aggregate of $200,000 of our common stock in the open market. As part of our Stock Repurchase Plan, we have implemented a stock repurchase plan pursuant toRule 10b5-1 of the Securities Exchange Act of 1934, as amended (“Exchange Act”), under which we are allowed to repurchase $5,000 of our common stock in the open market each fiscal quarter through the quarter ending January 28, 2008.Rule 10b5-1 allows us to repurchase our common stock when we might otherwise be prevented from doing so under insider trading laws or because of self-imposed trading blackout periods. As of January 31, 2007, we have repurchased common stock totaling $90,613, with $81,057 of these repurchases occurring during fiscal 2007. Based on the Board of Directors’ authorization and the amount of cumulative repurchase of our common stock that we have already made thereunder, we are permitted to make additional repurchases of our common stock up to $109,387 under the Stock Repurchase Plan as of January 31, 2007.
Expiration of Stockholder Rights Plan. During fiscal 2006, our Board of Directors approved the adoption of a Stockholder Rights Plan (“Rights Plan”) pursuant to a Rights Agreement between us and Mellon Investor Services, LLC, dated October 10, 2005 (“Rights Agreement”). On December 31, 2006, the Rights expired pursuant to the terms of the Rights Plan. The Rights expired because our Board of Directors determined not to solicit the requisite stockholder approval of the Rights Agreement by December 31, 2006. As a result, the Rights have no further force or effect and the Rights Plan has effectively terminated.
Purchase of Restaurant Assets. During March 2006, we purchased, for aggregate consideration of $15,762, a total of 36 restaurant locations that we had previously leased from a commercial lessor.
Termination of Franchise Agreement. During February 2006, we terminated our franchise agreement with a Hardee’s franchisee that operated 90 franchised restaurants as a result of its inability to remedy, on a timely basis, certain defaults under the terms of the agreement. At that time, ten of the affected restaurants were located on property that we owned and leased to the franchisee, and 51 of the affected restaurants were located on leased premises that we sublet to the franchisee. During March 2006, we purchased five additional parcels that we had previously leased from a commercial lessor and sublet to the franchisee. The franchisee continued to operate the affected restaurants pursuant to a temporary license agreement until May 18, 2006, when we terminated the license agreement, leases and subleases and assumed full operational control of the aforementioned 61 restaurants. Since the termination of the license agreement, we have purchased $2,400 of existing equipment, closed 19 of the 61 restaurants and recorded facility action charges of $1,959 related to closing these restaurants. We currently operate the remaining 42 restaurants as company-operated restaurants. The former franchisee’s lenders (through a receiver) kept the remaining 29 restaurant locations, of which they subsequently closed 15. During October 2006, we purchased 11 of these restaurants for $6,538 and an existing franchisee, under a franchise agreement, purchased the remaining three restaurants. The total purchase price included land, buildings and existing equipment.
Adoption of New Accounting Pronouncements. See Note 3 of Notes to Consolidated Financial Statements.
2
Use of Non-GAAP Financial Measurements
In various places throughout this Annual Report onForm 10-K, we use certain non-GAAP financial measures, which we believe provide valuable information to our stockholders. An example of such a non-GAAP financial measure would be Adjusted EBITDA, which is a measure used by our senior lenders under the Facility to evaluate our ability to service debt. Additional information regarding the non-GAAP financial measures used in this Annual Report can be found under the headings “Presentation of Non-GAAP Measurements” and “Liquidity and Capital Resources” in Item 7 of this Annual Report onForm 10-K.
Contact Information; Obtaining Copies of this Annual Report
We are incorporated in the State of Delaware. Our principal offices are located at 6307 Carpinteria Avenue, Suite A, Carpinteria, California, 93013. Our general website address iswww.ckr.com.
Electronic copies of our Annual Report onForm 10-K, Quarterly Reports onForm 10-Q and Current Reports onForm 8-K, and any amendments to those reports filed or furnished pursuant to Section 13(a) or 15(d) of the Exchange Act, are available free of charge by visiting the “Investors” section ofwww.ckr.com. These reports are posted as soon as reasonably practicable after they are electronically filed with the Securities and Exchange Commission. You may read and copy any materials we file with the SEC at the SEC’s Public Reference Room at 100 F Street, N.E., Washington, D.C. 20549. You may obtain information on the operation of the Public Reference Room by calling the SEC at1-800-SEC-0330. The SEC maintains an Internet site (www.sec.gov) that contains our reports.
In addition, print copies of any of the foregoing documents may be obtained free of charge by visiting the “Contact” section ofwww.ckr.com, or by contacting Investor Relations at(805) 745-7500.
Information contained in our website is not deemed to be a part of this Annual Report.
Competitive Strengths
The QSR industry is highly competitive. In order to maintain or increase their sales, a number of our major competitors have from time to time discounted certain menu items and promoted these discounted “value items.” By contrast, we have developed and implemented a strategy to differentiate our Carl’s Jr. and Hardee’s brands from our competitors that includes the following elements:
| | |
| | • | promotion of distinctive, premium, great tasting products such as the Carl’s Jr. line of Six Dollar Burgerstm, Hand-Scooped Ice Cream Shakes and Maltstm and Breakfast Burgerstm and burritos; as well as Hardee’s line of1/3-,1/2- and2/3-lb. Angus Beef Thickburgers, Hand-Scooped Ice Cream Shakes and Maltstm, and Made From Scratchtm breakfast biscuits; |
| |
| | • | utilization of gas-fired charbroilers in all of our Carl’s Jr. and Hardee’s restaurants to improve taste, operations and food safety; |
| |
| | • | implementation of a program to focus on the essentials of restaurant operations — quality, service and cleanliness; and |
| |
| | • | initiation of a program to elevate customer service at Carl’s Jr. and Hardee’s to an industry-leading level. |
Carl’s Jr. and Hardee’s further differentiate themselves from their competitors by preparing their products according to exacting standards so that customers receive hot and fresh food, and by offering their customers the convenience of table service once the order is placed.
Carl’s Jr. Carl’s Jr. is a well-recognized brand that has operated profitably in each of the past ten fiscal years. The brand focuses on selling its signature products, such as the Carl’s Famous Star® hamburger, The Six Dollar Burger® and the Green Burrito Taco Saladtm, and on developing innovative new premium products, such as the Pastrami Burgertm, Hand-Scooped Ice Cream Shakes and Malts and the Smoked Sausage Breakfast Sandwichtm, to attract what we characterize as the “young, hungry guy.” Carl’s Jr. focus on this customer type is enhanced through edgy, breakthrough advertising and high visibility sports sponsorships with professional sports teams in its major markets, including the National Basketball Association’s Los Angeles Lakers, Los Angeles Clippers and Sacramento Kings and Major League Baseball’s (“MLB”) Los Angeles Dodgers and Los Angeles Angels of
3
Anaheim. While we continue to build new Carl’s Jr. restaurants, most of the brand’s growth in recent years has come from its strong franchise community and its dual-branding opportunities with our Green Burrito brand.
Hardee’s. Hardee’s is a well-recognized brand that has completed its turnaround phase and is now focused on long-term growth initiatives. The brand focuses on selling its signature products, such as the Thickburger® and Made From Scratch breakfast biscuits, and on developing innovative new premium products, such as the Philly Cheesesteak Thickburgertm, Jalapeño Thickburgertm, Smoked Sausage Biscuittm, Hand-Scooped Ice Cream Shakes and Malts and the Monster Biscuittm, to attract what we characterize as the “young, hungry guy.” Hardee’s focus on this customer type is enhanced through edgy, breakthrough advertising and high visibility sports sponsorships with professional sports teams in its major markets, including the MLB’s St. Louis Cardinals. While we believe the greatest opportunity for the brand is within building the lunch and dayparts at our existing restaurants, we will gradually increase the number of new restaurants built and will continue to rollout the test of our Red Burrito dual-branded concept.
La Salsa. Our La Salsa restaurants, modeled after the “taquerias” of Mexico, primarily cater to the lunch and dinner segment, and feature freshly prepared items such as tacos, burritos, enchiladas, salads and guacamole. La Salsa restaurants emphasize generous portions and quality ingredients including Grade “A” skinless chicken, USDA lean steak, fish, shrimp, real cheddar and Monterey Jack cheeses, long-grain rice, both black and pinto beans and avocado.
All ingredients are fresh, and there are no can openers or microwave ovens in the restaurants. Food is prepared to order, so that each item served will be fresh and hot. The restaurants offer a self-service salsa bar featuring a variety of condiments and freshly made salsas.
Business Strategy
We remain focused on vigorously pursuing a comprehensive business strategy. The main components of our strategy are as follows:
| | |
| | • | increase revenues, average unit volumes and operating income at our major brands; |
| |
| | • | remain focused on restaurant fundamentals — quality, service and cleanliness; |
| |
| | • | capitalize on our unique brand positioning and cutting-edge advertising; |
| |
| | • | offer premium products that compete on quality, innovation and taste; |
| |
| | • | continue to capitalize on dual-branding opportunities available with Green Burrito and Red Burritotm; |
| |
| | • | control costs and improve capital structure while increasing shareholder distributions; |
| |
| | • | leverage our infrastructure and marketing presence to build out existing core markets; |
| |
| | • | remodel our existing store base to remain competitive; and |
| |
| | • | strengthen our franchise system and pursue further franchising opportunities, including new franchisees. |
Increasing average unit volume at Hardee’s remains a primary focus of our management team. The key driver in improving Hardee’s profitability is increasing sales. For the fiscal year ended January 31, 2007, the average unit volume (“AUV”) at our company-operated Hardee’s restaurants was approximately $916, up from $874 in fiscal 2006 and $862 in fiscal 2005. Franchise-operated AUV was approximately $949 at the end of fiscal 2007, up from $897 in fiscal 2006 and $891 in fiscal 2005. We can provide no assurance that we will be successful in improving company-operated Hardee’s restaurant AUVs, or maintaining franchise-operated Hardee’s restaurant AUVs.
Franchise Strategy
Our franchise and licensing strategy depends upon on our franchisees’ active involvement in and management of restaurant operations. Candidates are reviewed for appropriate operational experience and financial stability, including specific net worth and liquidity requirements. Generally, area development agreements require franchisees to open a specified number of restaurants in a designated geographic area within a specified period of time. Our franchise strategy is designed to further the development of our restaurant chains and reduce the total capital we need to develop our brands.
4
Carl’s Jr. Franchise agreements with Carl’s Jr. franchisees, which operate in Alaska, Arizona, California, Colorado, Hawaii, Idaho, Nevada, New Mexico, Oklahoma, Oregon, Texas, Utah and Washington, generally provide for initial fees and continuing royalty payments and advertising fees to us based upon a percentage of gross sales (generally 4.0% for royalties and 5.0% to 6.0% for advertising). As of January 31, 2007, our Carl’s Jr. franchisees and licensees operated 694 Carl’s Jr. restaurants, or approximately 64% of the Carl’s Jr. system. The majority of our Carl’s Jr. franchisees own more than one restaurant, with 17 franchisees owning ten or more restaurants.
Hardee’s. Franchise agreements with Hardee’s franchisees, who operate restaurants predominantly in the Southeastern and Midwestern United States, generally provide for initial fees and continuing royalty payments to us, and advertising fees to a national fundand/or a regional cooperative fund, based upon a percentage of gross sales (generally 4.0% for royalties and 4.0% to 5.0% for advertising). As of January 31, 2007, our Hardee’s franchisees and licensees operated 1,210 Hardee’s restaurants, or approximately 63% of the Hardee’s system. The majority of our Hardee’s franchisees own more than one restaurant, with 24 franchisees owning ten or more restaurants. Since our acquisition of Hardee’s in 1997, we have worked diligently to develop and enhance productive relationships with our Hardee’s franchisees. We have been supportive of the Hardee’s franchise association, and we believe that we have strong communications with the franchisees.
La Salsa. Franchise agreements with La Salsa franchisees, which operate restaurants predominantly in California, generally provide for initial fees and continuing royalty payments and advertising fees to us based upon a percentage of gross sales (generally 5.0% for royalties and 1.0% to 2.0% for advertising). As of January 31, 2007, our La Salsa franchisees and licensees operated 41 La Salsa restaurants, or approximately 43% of the La Salsa system.
The results of executing our business strategy have been:
| | |
| | • | We evolved the system-wide mix of restaurants to one that is primarily franchise-operated. At the end of fiscal 2007, approximately 64% of Carl’s Jr. and Hardee’s restaurants combined were franchised. |
| |
| | • | We closed many unprofitable Hardee’s restaurants and increased our AUV for the brand. |
| |
| | • | We believe we have improved the food quality, service and cleanliness at our Hardee’s restaurants. |
| |
| | • | Our same-store sales trends for company-operated restaurants, for each brand by quarter are: |
| | | | | | | | | | | | | |
| | | Carl’s Jr. | | Hardee’s | | La Salsa |
| |
Fiscal 2007 | | | | | | | | | | | | |
| First Quarter | | | 5.6 | % | | | 5.6 | % | | | 1.0 | % |
| Second Quarter | | | 4.8 | % | | | 3.0 | % | | | 2.1 | % |
| Third Quarter | | | 6.2 | % | | | 5.6 | % | | | 2.0 | % |
| Fourth Quarter | | | 2.8 | % | | | 4.8 | % | | | (0.2 | )% |
Fiscal 2006 | | | | | | | | | | | | |
| First Quarter | | | 2.4 | % | | | (0.1 | )% | | | 2.0 | % |
| Second Quarter | | | 1.0 | % | | | 0.0 | % | | | 2.6 | % |
| Third Quarter | | | (0.1 | )% | | | (3.5 | )% | | | 2.6 | % |
| Fourth Quarter | | | 5.3 | % | | | 2.9 | % | | | 3.7 | % |
5
| | |
| | • | Quarterly operating income (loss) by segment has been: |
| | | | | | | | | | | | | | | | | | | | | |
| | | | | | | | | | | | | | | Consolidated
| |
| | | | | | | | | | | | | | | Operating
| |
| | | Carl’s Jr. | | | Hardee’s | | | La Salsa | | | Other | | | Income | |
| |
Fiscal 2007 | | | | | | | | | | | | | | | | | | | | |
| First Quarter | | $ | 27,669 | | | $ | 7,796 | | | $ | (1,701 | ) | | $ | (130 | ) | | $ | 33,634 | |
| Second Quarter | | | 21,571 | | | | 13,303 | | | | (1,609 | ) | | | 43 | | | | 33,308 | |
| Third Quarter | | | 17,157 | | | | 10,764 | | | | (3,669 | ) | | | 3 | | | | 24,255 | |
| Fourth Quarter | | | 17,128 | | | | 684 | | | | (4,402 | ) | | | (115 | ) | | | 13,295 | |
Fiscal 2006 | | | | | | | | | | | | | | | | | | | | |
| First Quarter | | $ | 21,265 | | | $ | 4,168 | | | $ | (2,233 | ) | | $ | (52 | ) | | $ | 23,148 | |
| Second Quarter | | | 18,635 | | | | 6,903 | | | | (1,242 | ) | | | (11,087 | ) | | | 13,209 | |
| Third Quarter | | | 17,754 | | | | 4,275 | | | | (904 | ) | | | (141 | ) | | | 20,984 | |
| Fourth Quarter | | | 25,119 | | | | (1,953 | ) | | | (2,628 | ) | | | 1 | | | | 20,539 | |
The operating loss for Other, Including Discontinued Operations, for the second quarter of fiscal 2006 includes a charge of $11,000 to purchase and cancel all the outstanding options of Mr. William P. Foley, who resigned from the Board of Directors on July 19, 2005. This charge was recorded as a component of general and administrative expense.
Financial Information about Operating Segments
We are engaged in the development, operation and franchising of quick-service and fast-casual restaurants, primarily under the brand names Carl’s Jr., Hardee’s, and La Salsa, principally in the United States of America. Information about our revenues, operating results and assets is contained in Part II, Items 6 and 7 of this Annual Report onForm 10-K and in Note 22 of Notes to Consolidated Financial Statements. As shown in the table of quarterly operating income (loss) above, Carl’s Jr. and Hardee’s typically generate operating income, while La Salsa generates a loss from operations. In evaluating the profitability of our segments, we allocate much of our general and administrative expenses between these segments.
Investments in Other Restaurant Concepts
We selectively evaluate opportunities to acquire additional interests in other restaurant concepts, and we may make such investmentsand/or acquisitions in the future depending on the business prospects of the restaurant concept, the availability of financing at attractive terms, alternative business opportunities available to us, the consent of our senior lenders, if required, and general economic conditions.
Restaurant Development
We perform extensive due diligence on prospective restaurant sites before we commit to opening, or permitting a franchisee to open, a restaurant at a location. We intend to continue to open new company-operated restaurants, primarily in established markets. In fiscal 2007, we opened 13 new company-operated restaurants, and our franchisees and licensees opened 62 new restaurants. The average development cost for company-operated restaurants opened in fiscal 2007 is summarized in the following table.
6
| | | | | | | | | | | | | |
| | | Average per restaurant(1) | |
| | | Carl’s Jr. | | | Hardee’s | | | La Salsa | |
| |
| Land(2) | | $ | — | | | $ | 456 | | | $ | — | |
| Building and leasehold improvements | | | 1,173 | | | | 884 | | | | 577 | |
| Equipment | | | 327 | | | | 319 | | | | 265 | |
| | | | | | | | | | | | | |
| Total | | $ | 1,500 | | | $ | 1,659 | | | $ | 842 | |
| | | | | | | | | | | | | |
| | |
| (1) | | The averages above are contingent upon a number of factors including, but not limited to, restaurant prototype, geographical area and local zoning requirements. |
| |
| (2) | | The majority of Carl’s Jr. and La Salsa restaurants are constructed on leased land. |
Restaurant Operations and Support
We strive to maintain high standards in all products and equipment used by our restaurants, as well as our operations related to food preparation, service and cleanliness. We generally prepare our hamburgers and chicken sandwiches after the customer has placed an order, with the goal of serving them promptly. In addition, we charbroil hamburger patties and chicken breasts in a gas-fired double broiler that sears the meat on both sides in a uniform heating and cooking time. At our La Salsa restaurants, we prepare our fresh-Mexican menu items after the customer has placed an order with the goal of serving them promptly.
Our commitment to quality in both our products and our operations is supported by our training program. Each company-operated Carl’s Jr. and Hardee’s restaurant is operated by a general manager who has received a minimum of nine to twelve weeks of management training. Each company-operated La Salsa restaurant is operated by a general manager who has received a minimum of seven weeks of management training. These training programs involve a combination of classroom instruction andon-the-job training in specially designated training restaurants. The general manager trains other employees in accordance with our guidelines. District managers, who are typically responsible for seven to nine restaurants, also supervise general managers. Approximately 158 Carl’s Jr. and Hardee’s district managers are under the supervision of regional vice presidents or regional directors, who regularly inspect the operations in their respective districts and regions.
Marketing and Advertising
Our marketing and advertising initiatives focus on building brand awareness through the balanced use of television, radio and print advertising. These activities have been supported by contributions of 5.6% of sales from Carl’s Jr. company-operated and approximately 5.3% of sales from franchised restaurants during fiscal 2007.
Hardee’s company-operated restaurants contributed 4.6% of their sales for television, radio and print advertising during fiscal 2007. They also spent an additional 1.3% of sales on local advertising, billboards and point of purchase materials. Hardee’s franchised restaurants contributed 4.2% to 5.6% of their sales for advertising during fiscal 2007.
La Salsa company-operated restaurants have contributed 3.0% of their sales for the production of print and broadcast advertising and marketing material during fiscal 2007, and La Salsa franchised restaurants contributed approximately 1.0% of their sales during fiscal 2007.
Additional discussion of advertising can be found under the heading “Consolidated Expenses” in Item 7 of this Annual Report onForm 10-K.
Purchasing
We purchase most of the food products and packaging supplies used in our Carl’s Jr. restaurant system and warehouse and distribute such items to both company-operated and franchised Carl’s Jr. restaurants. Although not required to do so, our Carl’s Jr. franchisees in California and some adjacent states purchase most of their food, packaging and supplies from us. We have elected not to outsource our Carl’s Jr. distribution activities because we believe our mature procurement process allows us to effectively manage our food costs, provide adequate quantities
7
of food and supplies at competitive prices, generate revenue from Carl’s Jr. franchisees by adding a nominalmark-up to cover direct costs and provide better overall service to our restaurants in California and some adjacent states. We seek competitive bids from suppliers on many of our products, approve suppliers of those products and require them to adhere to our established product specifications.
We currently purchase substantially all of the food, packaging and supplies sold or used in our Hardee’s restaurants from Meadowbrook Meat Company, Inc., dba MBM, Inc. (“MBM”). See“Risk Factors — We depend on our suppliers to deliver quality products to us timely” on page 12. MBM currently distributes products to company-operated restaurants and to many of the franchised Hardee’s restaurants. Pursuant to the terms of our distribution agreements, we are obligated to purchase substantially all of our specified product requirements from MBM through July 14, 2010. The prices and delivery fees we pay for MBM products are subject to adjustment in certain circumstances, which may include increases or decreases resulting from changes in MBM’s cost structure.
We purchase most of the food, packaging and supplies used in our La Salsa restaurants from McLane Foodservice (“McLane”). We have distribution agreements with both McLane, which services restaurants in California, Nevada and Arizona, and Sysco Corporation (“Sysco”), which distributes to a small number of our outer market franchise restaurants. The agreements with McLane and Sysco expire on September 30, 2007 and August 31, 2008, respectively.
Information about our unconditional purchase obligations can be found under the heading “Long-Term Obligations” in Item 7 of this Annual Report onForm 10-K.
Competition and Markets
The restaurant business is intensely competitive and affected by changes in a geographic area, changes in the public’s eating habits and preferences, local and national economic conditions affecting consumer spending habits, population trends and local traffic patterns. Key elements of competition in the industry are the price, quality and value of food products offered, quality and speed of service, advertising effectiveness, brand name identification, restaurant locations and attractiveness of facilities.
We primarily compete with major restaurant chains, some of which dominate the QSR industry, and also compete with a variety of other take-out foodservice companies and fast-food restaurants. Our competitors also include a variety of mid-price, full-service casual-dining restaurants, health and nutrition-oriented restaurants, delicatessens and prepared food restaurants, as well as supermarkets and convenience stores. In selling franchises, we compete with many other restaurant franchisors, some of which have substantially greater financial resources and higher franchise AUVs.
Trademarks and Service Marks
We own numerous trademarks and service marks, and have registered many of those marks with the United States Patent and Trademark Office, including Carl’s Jr., the Happy Star logo, Hardee’s, La Salsa Fresh Mexican Grill and proprietary names for a number of the Carl’s Jr. and Hardee’s menu items. We believe our trademarks and service marks have value and play an important role in our marketing efforts.
Government Regulation
Each company-operated and franchised restaurant must comply with regulations adopted by federal agencies and with licensing and other regulations enforced by state and local health, sanitation, safety, fire and other departments. In addition, these restaurants must comply with federal and state environmental regulations, but those regulations have not had a material effect on the restaurants’ operations. Stringent and varied requirements of local governmental bodies with respect to zoning, land use and environmental factors can delay and sometimes prevent development of new restaurants and remodeling of existing restaurants in particular locations.
We are also subject to federal laws and a substantial number of state laws regulating the offer and sale of franchises. Such laws impose registration and disclosure requirements on franchisors in the offer and sale of franchises and may include substantive standards regarding the relationship between franchisor and franchisee, including limitations on the ability of franchisors to terminate franchise agreements or otherwise alter franchise
8
arrangements. We believe we are operating in substantial compliance with applicable laws and regulations governing our franchise operations.
We, and our franchisees, must comply with the Fair Labor Standards Act and various federal and state laws governing employment matters, such as minimum wages, overtime pay practices, child labor laws, citizenship requirements and other working conditions. Many of our employees are paid hourly rates related to the federal and state minimum wage laws and, accordingly, increases in the minimum wage increase our labor costs. Federal and state laws may also require us to provide new or increased levels of employee benefits to our employees, many of whom are not currently eligible for such benefits.
We monitor our facilities for compliance with the Americans with Disabilities Act (“ADA”) in order to conform to its requirements. Under the ADA, we could be required to expend funds to modify our restaurants to better provide service to, or make reasonable accommodation for the employment of, disabled persons. We believe that such expenditures, if required, would not have a material adverse effect on our consolidated financial position or results of operations.
Environmental Matters
We are subject to various federal, state and local environmental laws. These laws govern discharges to air and water from our restaurants, as well as handling and disposal practices for solid and hazardous wastes. These laws may impose liability for damages from and the costs of cleaning up sites of spills, disposals or other releases of hazardous materials. We may be responsible for environmental conditions relating to our restaurants and the land on which our restaurants are located, regardless of whether we lease or own the restaurants or land in question and regardless of whether such environmental conditions were created by us or by a prior owner or tenant.
We cannot provide assurance that all such environmental conditions have been identified by us. These conditions include the presence of asbestos-containing materials, leaking underground storage tanks andon-site spills. Further, certain properties formerly had landfills, historic industrial use, gasoline stationsand/or dry cleaning businesses located on or near the premises. Corrective action, as required by the regulatory agencies, has been undertaken at some of the sites, although the majority of these sites are being remediated by former landowners or tenants. The enforcement of our rights against third parties for environmental conditions, such as off-site sources of contamination, may result in additional costs for us.
Seasonality
We operate on a retail accounting calendar. Our fiscal year is comprised of 13 four-week accounting periods and ends on the last Monday in January. The first quarter of our fiscal year has four periods, or 16 weeks. All other quarters have three periods, or 12 weeks. Fiscal 2007 and fiscal 2006 each include 52 weeks, and fiscal 2005 includes 53 weeks (including one five-week accounting period in our fiscal fourth quarter). For clarity of presentation, we generally label all fiscal years presented as if the fiscal year ended January 31.
Our restaurant sales and, therefore, our profitability are subject to seasonal fluctuations and are traditionally higher during the spring and summer months because of factors such as increased travel upon school vacations and improved weather conditions, which affect the public’s dining habits.
Government Contracts
No material portion of our business is subject to renegotiation of profits or termination of contracts or subcontracts at the election of the U.S. government.
Research and Development
We operate research and development facilities in California and Missouri. While research and development activities are important to our business, these expenditures are not material.
9
Employees
We employ approximately 30,000 persons, primarily in company-operated restaurants and in our corporate offices and distribution facilities. Only those hourly employees working at the La Salsa restaurant located in the Luxor Hotel in Las Vegas, Nevada are covered by a collective bargaining agreement. We have never experienced a work stoppage attributable to a labor dispute. Past attempts to unionize our distribution center employees have been rejected by employee votes. We believe our employee relations are good.
Working Capital Practices
Information about our liquidity is contained under the caption “Liquidity and Capital Resources” in Item 7 of this Annual Report onForm 10-K and the accompanying Consolidated Statements of Cash Flows for the fiscal years ended January 31, 2007, 2006 and 2005.
Disclosure Regarding Forward-Looking Statements
Matters discussed in this Annual Report onForm 10-K contain forward-looking statements relating to future plans and developments, financial goals and operating performance that are based on our current beliefs and assumptions. Such statements are subject to risks and uncertainties that are often difficult to predict, are beyond our control and which may cause results to differ materially from expectations. Factors that could cause our results to differ materially from those described include, but are not limited to, whether or not restaurants will be closed and the number of restaurant closures, consumers’ concerns or adverse publicity regarding our products, the effectiveness of operating initiatives and advertising and promotional efforts (particularly at the Hardee’s brand), changes in economic conditions or prevailing interest rates, changes in the price or availability of commodities, availability and cost of energy, workers’ compensation and general liability premiums and claims experience, changes in our suppliers’ ability to provide quality and timely products, delays in opening new restaurants or completing remodels, severe weather conditions, the operational and financial success of our franchisees, franchisees’ willingness to participate in our strategies, the availability of financing for us and our franchisees, unfavorable outcomes in litigation, changes in accounting policies and practices, effectiveness of internal controls over financial reporting, new legislation or government regulation (including environmental laws), the availability of suitable locations and terms for the sites designated for development, and other factors as discussed in our filings with the Securities and Exchange Commission.
Forward-looking statements speak only as of the date they are made. We undertake no obligation to publicly update or revise any forward-looking statement, whether as a result of new information, future events or otherwise, except as required by law or the rules of the New York Stock Exchange.
Executive Officers of the Registrant
The names and ages, as of March 30, 2007, of our executive officers are as follows:
| | | | | | | |
Name | | Age | | Position |
| |
| Andrew F. Puzder | | | 56 | | | Chief Executive Officer and President |
| E. Michael Murphy | | | 55 | | | Executive Vice President, Chief Administrative Officer, General Counsel and Secretary |
| Theodore Abajian | | | 43 | | | Executive Vice President, Chief Financial Officer |
| John J. Dunion | | | 49 | | | Executive Vice President, Supply Chain Management |
| Brad Haley | | | 49 | | | Executive Vice President, Marketing — Carl’s Jr. and Hardee’s |
Andrew F. Puzderwas appointed to the Board of Directors in May 2001. Mr. Puzder became Chief Executive Officer and President of CKE in September 2000. From February 1997 to September 2000, he served as Executive Vice President, General Counsel and Secretary of CKE. Mr. Puzder was also Executive Vice President of Fidelity National Financial, Inc. (“FNF”) from January 1995 to June 2000. Mr. Puzder was a partner in the Costa Mesa, California law firm of Lewis, D’Amato, Brisbois & Bisgaard from September 1991 to March 1994, and a
10
shareholder in the Newport Beach, California law firm of Stradling Yocca Carlson & Rauth from March 1994 until joining FNF in 1995.
E. Michael Murphybecame Executive Vice President, General Counsel and Secretary of CKE in January 2001, after serving as Senior Vice President of the Company and Senior Vice President, General Counsel of Hardee’s Food Systems, Inc. from July 1998. He was also named Chief Administrative Officer of the Company in August 2006. For the prior 10 years, Mr. Murphy was a partner of The Stolar Partnership law firm in St. Louis, Missouri.
Theodore Abajianwas appointed Executive Vice President and Chief Financial Officer of the Company in May 2003. From March 2002 to May 2003, he served as Executive Vice President, Chief Administrative Officer. From November 2000 to March 2002, Mr. Abajian served as President and Chief Executive Officer of SBRG, and as its Executive Vice President and Chief Financial Officer from May 1998. In addition, from January 2000 to October 2000, Mr. Abajian held the position of Senior Vice President and Chief Financial Officer for Checkers Drive-In Restaurants, Inc., and served as the Chief Financial Officer of Star Buffet, Inc. from July 1997 to May 1998. Mr. Abajian also served as a director of Staceys Buffet, Inc. from October 1997 to February 1998, and was Vice President and Controller with Summit Family Restaurants, Inc. from 1994 to 1998.
John J. Dunionwas appointed Executive Vice President, Supply Chain Management in July 2001. Prior to that, he served the Company as Executive Vice President, Chief Administrative Officer from February 1999, Senior Vice President, Purchasing from April 1998 and Vice President, Purchasing from September 1996. Mr. Dunion was Vice President, Purchasing at Unigate Restaurants, Inc. from 1993 to September 1996. Prior to 1990, Mr. Dunion held management positions with Jack in the Box Inc. and Taco Bell Corp.
Brad R. Haleywas appointed Executive Vice President, Marketing for Hardee’s in September 2000. He also assumed responsibility for Carl’s Jr. marketing in January 2004. Prior to joining Hardee’s, Mr. Haley worked as Chief Marketing Officer for Church’s Chicken. From 1992 to 1999, Mr. Haley served as Corporate Vice President of Marketing Communications for Jack in the Box Inc.
We are engaged in a business strategy that includes the long-term growth of our Hardee’s operations. The success of a business strategy, by its very nature, involves a significant number of risks, many of which are discussed below:
Our success depends on our ability to judge the impact of competitive products and pricing.
Successful operation of our restaurants requires the ability to identify the effects of product and pricing trends. If we are unable to evaluate the impact of product or pricing trends effectively, we may fail to implement strategies allowing us to capitalize on those trends, which may result in decreased sales or increased costs.
Our success depends on our ability to compete with our competitors.
The foodservice industry is intensely competitive with respect to the quality and value of food products offered, concept service, price, dining experience and location. We compete with major restaurant chains, some of which dominate the QSR segment. Our competitors also include a variety of mid-price, full-service casual-dining restaurants, health and nutrition-oriented restaurants, delicatessens and prepared food restaurants, as well as supermarkets and convenience stores. Many of our competitors have substantially greater brand recognition, as well as greater financial, marketing, operating and other resources than we have, which may give them competitive advantages. Our competitors could also make changes to pricing or other marketing strategies which may impact us detrimentally. As our competitors expand operations, we expect competition to intensify. Such increased competition could have a material adverse effect on our consolidated financial position and results of operations.
11
Restrictive covenants in our credit facility and outstanding senior indebtedness could adversely affect our business.
The Facility, the Amended Facility and our other outstanding senior indebtedness contain restrictive covenants and, in the case of the Amended Facility, requirements that we comply with certain financial ratios. Certain of these covenants limit our ability to take various actions, including the incurrence of additional debt, the guaranteeing of indebtedness and engaging in various types of transactions, including mergers and sales of assets, and making specified distributions or other restricted payments, including investments. These covenants could have an adverse effect on our business by limiting our ability to take advantage of business opportunities. Failure to maintain financial ratios required by the Amended Facility or to comply with the covenants in the Amended Facility or our other indebtedness could also result in acceleration of our indebtedness, which would impair our liquidity and limit our ability to operate.
Failure to continue our revitalization of Hardee’s would have a significant negative effect on our success.
We have been challenged in our efforts to reestablish the connection between Hardee’s and consumers. Our efforts have included developing new marketing strategies, remodeling restaurants, refranchising restaurants, enhancing menu variety and focusing on the fundamentals of quality, service and cleanliness. Hardee’s performance has improved significantly; however, we believe Hardee’s remains an under-performing brand.
Our success depends on our ability to attract and retain key personnel.
We believe that our success will depend, in part, on the continuing services of our key management personnel. The loss of the services of key personnel could have a material impact on our financial results. Additionally, our success may depend on our ability to attract and retain additional skilled management personnel.
Our success depends on our franchisees’ participation in our strategy.
Our franchisees are an integral part of our business. We may be unable to successfully implement our brand strategies if our franchisees do not actively participate in that implementation. The failure of our franchisees to focus on the fundamentals of restaurant operations, such as quality, service and cleanliness, would have a negative impact on our success.
Our financial results are affected by the financial results of our franchisees.
We receive royalties from our franchisees. Our financial results are somewhat contingent upon the operational and financial success of our franchisees, including implementation of our strategic plans, as well as their ability to secure adequate financing. If sales trends or economic conditions worsen for our franchisees, their financial health may worsen, our collection rates may decline and we may be required to assume the responsibility for additional lease payments on franchised restaurants. Additionally, refusal on the part of franchisees to renew their franchise agreements may result in decreased royalties. Entering into restructured franchise agreements may result in reduced franchise royalty rates in the future.
We may be unable to recover increased operating costs through price increases.
The QSR segment historically has attracted consumers that are either lower incomeand/or pressed for time. An economic downturn that decreases our customers’ disposable incomes would have a negative impact on our sales and profitability. In addition, unfavorable macroeconomic trends or developments concerning factors such as increased food, labor and employee benefit costs and availability of experienced employees may also adversely affect our financial condition and results of operations. We may be unable to increase prices to match increased costs without further harming our sales. If we are unable to raise prices in order to recover increased costs for food, fuel, utilities, wages, clothing and equipment, our profitability will be negatively affected.
12
We face commodity price and availability risks.
We purchase energy and agricultural products that are subject to price volatility caused by weather, market conditions and other factors that are not predictable or within our control. Increases in commodity prices could result in higher restaurant operating costs for our restaurant concepts. Occasionally, the availability of commodities can be limited due to circumstances beyond our control. If we are unable to obtain such commodities, we may be unable to offer related products, which would have a negative impact on our profitability.
We depend on our suppliers to deliver quality products to us timely.
Our profitability is dependent on, among other things, our continuing ability to offer fresh, high-quality food at moderate prices. While we continue to operate our own distribution business for most of our Carl’s Jr. system, we rely upon independent distributors for our Hardee’s and La Salsa restaurants. Our Hardee’s restaurants depend on the distribution services of MBM, an independent supplier and distributor of food and other products. MBM is responsible for delivering food, paper and other products from our vendors to our Hardee’s restaurants on a regular basis. MBM also provides distribution services to a large number of our Hardee’s franchisees. Pursuant to the terms of our distribution agreements, we are obligated to purchase substantially all of our specified product requirements from MBM through July 14, 2010. We purchase most of the food, packaging and supplies used in our La Salsa restaurants from McLane. We have distribution agreements with both McLane, which services restaurants in California, Nevada and Arizona, and Sysco, which distributes to a small number of our franchise restaurants outside these states. The agreements with McLane and Sysco expire on September 30, 2007 and August 31, 2008, respectively. In addition, our dependence on frequent deliveries of food and paper products subjects our restaurants to the risk that shortages or interruptions in supply, caused by adverse weather or other conditions, could adversely affect the availability, quality and cost of ingredients. Any disruption in these distribution services could have a material adverse effect on our consolidated financial position and results of operations.
Adverse publicity regarding poultry or beef could negatively impact our business.
Given the events regarding afflictions affecting livestock in various parts of the world, such as “avian flu” and “mad cow” disease, it is possible that the respective production and supply of U.S. poultry or beef could be negatively impacted. A reduction in the supply of poultry or beef could have a material effect on the price at which we could obtain it. In addition, concerns regarding hormones, steroids and antibiotics may cause consumers to reduce or avoid consumption of poultry or beef. Failure to procure poultry or beef at reasonable terms and prices, or any reduction in consumption of poultry or beef by consumers, could have a material adverse effect on our consolidated financial condition and results of operations.
Consumer preferences and perceptions may have significant effects on our business.
Foodservice businesses are often affected by changes in consumer tastes and perceptions. Traffic patterns, demographics and the type, number and locations of competing restaurants may adversely affect the performance of individual restaurants.Multi-unit foodservice businesses such as ours can also be materially and adversely affected by publicity resulting from poor food quality, illness, injury or other health concerns or operating issues stemming from one or a limited number of restaurants. We can be similarly affected by consumer concerns with respect to the nutritional value of quick-service food.
Our operations are seasonal and heavily influenced by weather conditions.
Weather, which is unpredictable, can adversely impact our sales. Harsh weather conditions that discourage customers from dining out result in lost opportunities for our restaurants. A heavy snowstorm can leave an entire metropolitan area snowbound, resulting in a reduction in sales. Our first and fourth quarters, most notably the fourth quarter, include winter months when there is historically a lower level of sales. Because a significant portion of our restaurant operating costs is fixed or semi-fixed in nature, the loss of sales during these periods adversely impacts our profitability. These adverse, weather-driven events principally arise at our Hardee’s restaurants. For these reasons, a sequentialquarter-to-quarter comparison may not be a good indication of our performance or how we may perform in the future.
13
Our business may suffer due to our inability to hire and retain qualified personnel and due to higher labor costs.
Given that our restaurant-level workforce requires large numbers of both entry-level and skilled employees, low levels of unemployment could compromise our ability to provide quality service in our restaurants. From time to time, we have had difficulty hiring and maintaining qualified restaurant management personnel. Increases in the minimum wage have impacted our labor costs. Due to the labor-intensive nature of our business, a continuing shortage of labor or increases in minimum wage levels could have a negative effect on our consolidated results of operations.
Our sales and profits may be materially and adversely affected by our inability to integrate acquisitions successfully.
Our future consolidated results of operations and cash flow may depend in part upon our ability to integrate any future acquisitions and mergers. If we are unable to achieve the strategic operating objectives we anticipate from any such acquisitions we may experience increased costs or decreased sales which would have a negative impact on our consolidated results from operations. Strategic operating initiatives that we may be unable to achieve include economies of scale in operations, cost reductions, sales increases and marketing initiatives.
Our business may be impacted by increased insuranceand/or self-insurance costs.
In the past, we have been negatively affected by increases in both workers’ compensation and general liability insurance and claims expense due to our claims experience and rising healthcare costs. Although we seek to manage our claims to prevent increases, such increases can occur unexpectedly and without regard to our efforts to limit them. If such increases occur, we may be unable to pass them along to the consumer through product price increases, resulting in decreased operating results.
Our financial results may be impacted by our ability to select appropriate restaurant locations, construct new restaurants or complete remodels.
In recent years, we have not opened a significant number of new restaurants, as available cash was used to repay indebtedness, repurchase common stock and pay dividends. Our strategic plan, and a component of our business strategy, includes the construction of new restaurants and the remodeling of existing restaurants. We and our franchisees face competition from other restaurant operators, retail chains, companies and developers for desirable site locations, which may adversely affect the cost, implementation and timing of our expansion plans. If we experience delays in the construction process we may be unable to complete such construction activities at the planned cost, which would adversely affect our future results from operations. Additionally, we cannot assure you that such remodels and conversions will increase the revenues generated by these restaurants or be sustainable. Likewise, we cannot be sure that the sites we select for new restaurants will result in restaurants whose sales results meet our expectations.
The nature of our business exposes us to potential litigation.
We have thousands of interactions or transactions each day with vendors, franchisees, customers, employees and others. In the ordinary course of business, disputes may arise for a number of reasons. We cannot be certain that we will prevail in every legal action brought against us.
Governmental regulations may change and require us to incur substantial expenditures to comply.
We are subject to governmental regulation at the federal, state and local level in many areas of our business, such as food safety and sanitation, the sale of alcoholic beverages, environmental issues and minimum wage. Governmental entities may change regulations that may require us to incur substantial cost increases in order to comply with such laws and regulations. While we endeavor to comply with all applicable laws and regulations, we cannot assure you that we are in full compliance with all laws and regulations at all times or that we will be able to comply with any future laws or regulations. If we fail to comply with applicable laws and regulations, we may be
14
subject to sanctions or civil remedies, including fines and injunctions. The cost of compliance or the consequences of non-compliance could have a material adverse effect on our business and consolidated results of operations.
Compliance with environmental laws may affect our financial condition.
We are subject to various federal, state and local environmental laws. These laws govern discharges to air and water, as well as handling and disposal practices for solid and hazardous wastes. These laws may also impose liability for damages from and the costs of cleaning up sites of spills, disposals or other releases of hazardous materials. We may be responsible for environmental conditions or contamination relating to our restaurants and the land on which our restaurants are located, regardless of whether we lease or own the restaurant or land in question and regardless of whether such environmental conditions were created by us or by a prior owner or tenant. The costs of any cleanup could be significant and have a material adverse effect on our consolidated financial position and results of operations.
Provisions of our Certificate of Incorporation and Bylaws could limit the ability of our stockholders to effect a change in control.
Our certificate of incorporation and bylaws include several provisions and features intended to render more difficult certain unsolicited or hostile attempts to acquire our business. In addition, our Board of Directors has the authority, without further action by our stockholders, to issue up to 5,000,000 shares of preferred stock in one or more series, and to fix the rights, preferences and restrictions of such preferred stock.
These provisions may discourage a third party from attempting to acquire control of us and could limit the price that investors might be willing to pay in the future for shares of our common stock.
We face risks related to interest rates.
Our principal exposure to financial market risks is the impact that interest rate changes could have on our Facility, the magnitude of which depends on the amount of borrowings we have outstanding. As of January 31, 2007, under the revolving portion of the Facility, we had $43,500 in borrowings that we locked in at a rate of 7.625%, and $2,000 in borrowings that bore interest at Prime plus an applicable margin, or 9.25%. As of January 31, 2007, we also had $69,821 outstanding under the term loan portion of the Facility, which bore interest at LIBOR plus an applicable margin, or 7.375%, and $57,263 in outstanding letters of credit, which bore fees at 2.25%.
Our financial results may be impacted by changes in accounting policies and practices.
In the first quarter of fiscal 2005, we began to include in our Consolidated Financial Statements the operations of one of our Hardee’s franchisees, the Hardee’s National Advertising Fund and approximately 82 Hardee’s local advertising cooperative funds as a result of the adoption of Financial Accounting Standards Board (“FASB”) Interpretation 46R,Consolidation of Variable Interest Entities — an Interpretation of ARB No. 51(“FIN 46R”).
As of the beginning of fiscal 2007, we adopted the provisions of Statement of Financial Accounting Standards (“SFAS”) 123 (revised 2004),Share-Based Payment(“SFAS 123R”), which required us to measure and record compensation cost for all share-based payments, including employee stock options, at fair value.
Future changes to U.S. generally accepted accounting principles may materially adversely affect our consolidated financial position and results of operations if we are required to change our methods of accounting for transactions. See Note 2 of Notes to Consolidated Financial Statements for a discussion of accounting pronouncements not yet adopted.
| |
| Item 1B. | Unresolved Staff Comments |
None.
15
The following table sets forth information regarding our restaurant properties at January 31, 2007:
| | | | | | | | | | | | | | | | | |
| | | Land and
| | | Land Leased
| | | Land and
| | | | |
| | | Building
| | | and Building
| | | Building
| | | | |
| | | Owned | | | Owned | | | Leased | | | Total | |
| |
Carl’s Jr.: | | | | | | | | | | | | | | | | |
| Company-operated | | | 16 | | | | 111 | | | | 266 | | | | 393 | |
| Franchise-operated(1) | | | 10 | | | | 47 | | | | 171 | | | | 228 | |
| Third party-operated/vacant(2) | | | 4 | | | | 3 | | | | 17 | | | | 24 | |
| | | | | | | | | | | | | | | | | |
| Subtotal | | | 30 | | | | 161 | | | | 454 | | | | 645 | |
| | | | | | | | | | | | | | | | | |
Hardee’s: | | | | | | | | | | | | | | | | |
| Company-operated | | | 357 | | | | 150 | | | | 189 | | | | 696 | |
| Franchise-operated(1) | | | 27 | | | | 39 | | | | 73 | | | | 139 | |
| Third party-operated/vacant(2) | | | 24 | | | | 15 | | | | 54 | | | | 93 | |
| | | | | | | | | | | | | | | | | |
| Subtotal | | | 408 | | | | 204 | | | | 316 | | | | 928 | |
| | | | | | | | | | | | | | | | | |
La Salsa: | | | | | | | | | | | | | | | | |
| Company-operated | | | — | | | | 4 | | | | 51 | | | | 55 | |
| Third party-operated/vacant(2) | | | 1 | | | | — | | | | 6 | | | | 7 | |
| | | | | | | | | | | | | | | | | |
| Subtotal | | | 1 | | | | 4 | | | | 57 | | | | 62 | |
| | | | | | | | | | | | | | | | | |
Other: | | | | | | | | | | | | | | | | |
| Company-operated | | | — | | | | — | | | | 1 | | | | 1 | |
| Third party-operated/vacant(2) | | | — | | | | 2 | | | | 1 | | | | 3 | |
| | | | | | | | | | | | | | | | | |
| Subtotal | | | — | | | | 2 | | | | 2 | | | | 4 | |
| | | | | | | | | | | | | | | | | |
Total: | | | | | | | | | | | | | | | | |
| Company-operated | | | 373 | | | | 265 | | | | 507 | | | | 1,145 | |
| Franchise-operated(1) | | | 37 | | | | 86 | | | | 244 | | | | 367 | |
| Third party-operated/vacant(2) | | | 29 | | | | 20 | | | | 78 | | | | 127 | |
| | | | | | | | | | | | | | | | | |
| Total | | | 439 | | | | 371 | | | | 829 | | | | 1,639 | |
| | | | | | | | | | | | | | | | | |
| | |
| (1) | | “Franchise-operated” properties are those which we own and lease to franchisees, or lease and sublease to franchisees. |
| |
| (2) | | “Third party-operated/vacant” properties are those we own or lease that are either leased or subleased by unaffiliated entities or are currently vacant. |
The terms of our leases and subleases vary in length, with primary terms (i.e., before consideration of option periods) expiring on various dates through 2044. We do not expect the expiration of these leases to have a material impact on our operations in any particular year, as the expiration dates are staggered over a number of years and many of the leases contain renewal options.
Our corporate headquarters and Carl’s Jr. brand headquarters are both located in Carpinteria, California and contain approximately 65,000 square feet of space. Our primary administrative service center is located in Anaheim, California and contains approximately 78,000 square feet of space. Our primary distribution center is located in Ontario, California and contains approximately 201,000 square feet of space. A secondary distribution center for the Carl’s Jr. brand is located in Manteca, California, and contains approximately 52,000 square feet of space. Our Hardee’s corporate facility is located in St. Louis, Missouri, and contains approximately 33,000 square
16
feet of space. Our Hardee’s equipment distribution center is located in Rocky Mount, North Carolina, in a facility that contains approximately 81,000 square feet of space.
| |
| Item 3. | Legal Proceedings |
There are currently a number of claims and lawsuits pending against us. These claims and lawsuits cover a variety of allegations spanning our entire business. The following is a brief description of the more significant of these categories of claims and lawsuits. In addition, we are subject to various federal, state and local regulations that affect our business. We do not believe that any such claims, lawsuits or regulations will have a material adverse effect on our consolidated financial position or results of operations.
Employees
We employ many thousands of persons, both by us and in restaurants owned and operated by subsidiaries of ours. In addition, thousands of persons from time to time seek employment in such restaurants. In the ordinary course of business, disputes arise regarding hiring, firing and promotion practices.
Customers
Our restaurants serve a large cross-section of the public and, in the course of serving that many people, disputes arise as to products, services, accidents and other matters typical of an extensive restaurant business such as ours.
Suppliers
We rely on large numbers of suppliers, who are required to meet and maintain our high standards. On occasion, disputes may arise with our suppliers on a number of issues including, but not limited to, compliance with product specifications and certain business concerns. Additionally, disputes may arise on a number of issues between us and individuals or entities who claim they should have been granted the approval or opportunity to supply products or services to our restaurants.
Franchising
A substantial number of our restaurants are franchised to independent entrepreneurs operating under contractual arrangements with us. In the course of the franchise relationship, disputes occasionally arise between us and our franchisees relating to a broad range of subjects including, without limitation, quality, service and cleanliness issues, contentions regarding grants or terminations of franchises, and delinquent payments. Additionally, occasional disputes arise between us and individuals who claim they should have been granted a franchise.
Intellectual Property
We have registered trademarks and service marks, patents and copyrights, some of which are of material importance to our business. From time to time, we may become involved in litigation to defend and protect our use of our intellectual property.
Summary of Significant Litigation
We are, from time to time, the subject of complaints or litigation from customers alleging illness, injury or other food quality, health or operational concerns. Adverse publicity resulting from such allegations may materially adversely affect us and our restaurants, regardless of whether such allegations are valid or whether we are liable. We are also, at times, the subject of complaints or allegations from current or former employees, franchisees, vendors, landlords and others.
| |
| Item 4. | Submission of Matters to a Vote of Security Holders |
None.
17
PART II
| |
| Item 5. | Market For Registrant’s Common Equity, Related Stockholder Matters and Issuer Purchases of Equity Securities |
Our common stock is listed on the New York Stock Exchange under the symbol “CKR”. As of March 22, 2007, there were approximately 1,753 record holders of our common stock. The following table sets forth, for the periods indicated, the high and low sales prices of our common stock, as reported on the New York Stock Exchange Composite Tape:
| | | | | | | | | |
| | | High | | | Low | |
| |
Fiscal 2007 | | | | | | | | |
| First Quarter | | $ | 18.50 | | | $ | 15.17 | |
| Second Quarter | | | 17.37 | | | | 14.00 | |
| Third Quarter | | | 20.00 | | | | 14.55 | |
| Fourth Quarter | | | 20.04 | | | | 17.57 | |
Fiscal 2006 | | | | | | | | |
| First Quarter | | $ | 17.15 | | | $ | 14.53 | |
| Second Quarter | | | 16.77 | | | | 12.11 | |
| Third Quarter | | | 13.87 | | | | 11.51 | |
| Fourth Quarter | | | 15.69 | | | | 12.45 | |
On January 22, 2007, we amended the Facility to increase the aggregate amount that we are permitted to expend for common stock repurchases and dividend payments by $130,000. During fiscal 2007, we declared aggregate cash dividends of $0.16 per share of common stock, for a total of $10,397.
Pursuant to the Stock Repurchase Plan authorized by our Board of Directors, as modified during fiscal 2007, we are allowed to repurchase up to an aggregate of $200,000 of our common stock. During the fiscal quarter and fiscal year ended January 31, 2007, we repurchased 2,541,992 and 4,607,437 shares of our common stock at an average price of $18.51 and $17.59 per share, for a total cost, including trading commissions, of $47,059 and $81,057, of which we retired 2,523,692 and 4,589,137 shares, respectively. As of January 31, 2007, we had 18,300 shares of common stock that had been repurchased but not yet retired and are shown as common stock held in treasury on the accompanying Consolidated Balance Sheet. These shares were retired subsequent to January 31, 2007. There was no common stock held in treasury at January 31, 2006.
Based on the Board of Directors’ authorization and the amount of cumulative repurchase of our common stock that we have already made thereunder, we are permitted to make additional repurchases of our common stock up to $109,387 under the Stock Repurchase Plan as of January 31, 2007. As part of our Stock Repurchase Plan, we have implemented a share repurchase plan pursuant toRule 10b5-1 of the Exchange Act, under which we are allowed to repurchase $5,000 of our common stock in the open market each fiscal quarter through the quarter ending January 28, 2008.Rule 10b5-1 allows us to repurchase our common stock when we might otherwise be prevented from doing so under insider trading laws or because of self-imposed trading blackout periods.
18
The following table provides information as of January 29, 2007, with respect to shares of common stock repurchased by us during the fiscal quarter then ended (in thousands, except share and per share amounts):
| | | | | | | | | | | | | | | | | |
| | | (a) | | | (b) | | | (c) | | | (d) | |
| | | | | | | | | Total Number of
| | | Maximum Dollar
| |
| | | | | | | | | Shares Purchased
| | | Value of Shares
| |
| | | Total
| | | Average
| | | as Part of
| | | that May Yet Be
| |
| | | Number of
| | | Price
| | | Publicly
| | | Purchased Under
| |
| | | Shares
| | | Paid per
| | | Announced Plans
| | | the Plans or
| |
Period | | Purchased | | | Share | | | or Programs | | | Programs | |
| |
| November 7, 2006 — December 4, 2006 | | | 89,400 | | | $ | 18.92 | | | | 89,400 | | | $ | 54,752 | |
| December 5, 2006 — December 29, 2006 | | | 2,364,192 | | | | 18.47 | | | | 2,364,192 | | | | 11,085 | |
| December 30, 2006 — January 29, 2007 | | | 88,400 | | | | 19.18 | | | | 88,400 | | | | 109,387 | |
| | | | | | | | | | | | | | | | | |
| Total | | | 2,541,992 | | | $ | 18.51 | | | | 2,541,992 | | | $ | 109,387 | |
| | | | | | | | | | | | | | | | | |
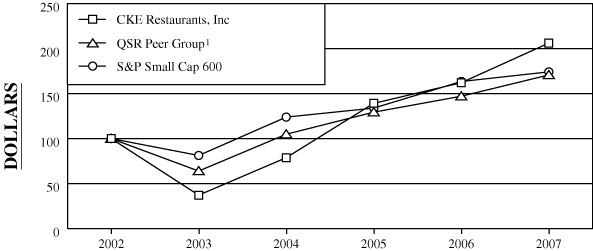
The graph below shows the cumulative total stockholder return of an investment of $100 (and the reinvestment of any dividends thereafter) on January 31, 2002 in (i) our common stock, (ii) the QSR Peer Group and (iii) the Standard and Poor (S&P) Small Cap 600 Index. Our stock price performance shown in the graph below is not indicative of future stock price performance.
COMPARISON OF 5 YEAR CUMULATIVE TOTAL RETURN*
Among CKE Restaurants, Inc. — CKR, QSR Peer Group
And The S&P Small Cap 600 Index
| | | | | | | | | | | | | | | | | | | | | | | | | | | | | | | |
| | | | 2002 | | | 2003 | | | 2004 | | | 2005 | | | 2006 | | | 2007 |
| CKE Restaurants, Inc | | | $ | 100.00 | | | | $ | 37.13 | | | | $ | 78.77 | | | | $ | 139.18 | | | | $ | 162.15 | | | | $ | 206.15 | |
| QSR Peer Group(1) | | | $ | 100.00 | | | | $ | 63.93 | | | | $ | 104.84 | | | | $ | 129.38 | | | | $ | 147.09 | | | | $ | 170.75 | |
| S&P Small Cap 600 | | | $ | 100.00 | | | | $ | 81.22 | | | | $ | 123.90 | | | | $ | 133.88 | | | | $ | 163.47 | | | | $ | 174.17 | |
| | | | | | | | | | | | | | | | | | | | | | | | | | | | | | | |
| | |
| * | | $100 invested on January 31, 2002 in stock or index-including reinvestment of dividends. |
| | |
| (1) | | The QSR Peer Group is comprised of the following companies: Jack in the Box Inc., McDonalds Corp., Wendy’s International, Inc. and Yum! Brands, Inc. |
19
| |
| Item 6. | Selected Financial Data |
The information set forth below should be read in conjunction with the Consolidated Financial Statements and related notes and Management’s Discussion and Analysis of Financial Condition and Results of Operations included elsewhere in this Annual Report onForm 10-K. All amounts, except per share amounts, presented in Item 6 are in thousands.
Selected Financial and Operating Data
| | | | | | | | | | | | | | | | | | | | | |
| | | Fiscal Year Ended January 31,(1)(2) | |
| | | 2007 | | | 2006(7) | | | 2005 | | | 2004(6) | | | 2003(4)(5) | |
| | | | | | (as restated) | | | | | | | | | | |
| |
Consolidated Statements of Operations Data: | | | | | | | | | | | | | | | | | | | | |
| Revenue: | | | | | | | | | | | | | | | | | | | | |
| Company-operated restaurants | | $ | 1,269,687 | | | $ | 1,209,456 | | | $ | 1,217,273 | | | $ | 1,142,929 | | | $ | 1,109,646 | |
| Franchised and licensed restaurants and other | | | 318,723 | | | | 308,891 | | | | 302,608 | | | | 270,491 | | | | 253,715 | |
| | | | | | | | | | | | | | | | | | | | | |
| Total revenue | | $ | 1,588,410 | | | $ | 1,518,347 | | | $ | 1,519,881 | | | $ | 1,413,420 | | | $ | 1,363,361 | |
| | | | | | | | | | | | | | | | | | | | | |
| Operating income (loss) | | $ | 104,492 | | | $ | 77,880 | | | $ | 56,780 | | | $ | (8,268 | ) | | $ | 35,617 | |
| Interest expense | | | 19,751 | | | | 23,016 | | | | 36,748 | | | | 39,962 | | | | 39,924 | |
| Income tax expense (benefit) | | | 31,899 | | | | (123,888 | ) | | | (1,592 | ) | | | 2,417 | | | | (7,093 | ) |
| Income (loss) from continuing operations | | | 50,172 | | | | 181,139 | | | | 18,662 | | | | (50,430 | ) | | | 19,214 | |
| Loss from discontinued operations | | | — | | | | — | | | | (646 | ) | | | (2,790 | ) | | | (53 | ) |
| Income (loss) before cumulative effect of accounting change | | | 50,172 | | | | 181,139 | | | | 18,016 | | | | (53,220 | ) | | | 19,161 | |
| Cumulative effect of accounting change(5) | | | — | | | | — | | | | — | | | | — | | | | (175,780 | ) |
| Net income (loss) | | | 50,172 | | | | 181,139 | | | | 18,016 | | | | (53,220 | ) | | | (156,619 | ) |
| Net income (loss) per share — basic | | | 0.79 | | | | 3.06 | | | | 0.31 | | | | (0.92 | ) | | | (2.76 | ) |
| Income (loss) from continuing operations per share — diluted | | | 0.72 | | | | 2.51 | | | | 0.31 | | | | (0.88 | ) | | | 0.33 | |
| Loss from discontinued operations per share — diluted | | | — | | | | — | | | | (0.01 | ) | | | (0.04 | ) | | | — | |
| Income (loss) before cumulative effect of accounting change per share — diluted | | | 0.72 | | | | 2.51 | | | | 0.30 | | | | (0.92 | ) | | | 0.33 | |
| Cumulative effect of accounting change per share — diluted(5) | | | — | | | | — | | | | — | | | | — | | | | (3.02 | ) |
| Net income (loss) per share — diluted | | $ | 0.72 | | | $ | 2.51 | | | $ | 0.30 | | | $ | (0.92 | ) | | $ | (2.69 | ) |
| Weighted-average shares outstanding — diluted | | | 72,377 | | | | 73,250 | | | | 59,583 | | | | 57,536 | | | | 58,124 | |
| Cash dividends declared per common share | | $ | 0.16 | | | $ | 0.16 | | | $ | — | | | $ | — | | | $ | — | |
| Ratio of earnings to fixed charges(3) | | | 2.6 | x | | | 2.0 | x | | | 1.2 | x | | | — | | | | 1.2x | |
20
| | | | | | | | | | | | | | | | | | | | | |
| | | Fiscal Year Ended January 31,(1)(2) | |
| | | 2007 | | | 2006(7) | | | 2005 | | | 2004(6) | | | 2003(4)(5) | |
| | | | | | (as restated) | | | | | | | | | | |
| |
Segment Operating Data: | | | | | | | | | | | | | | | | | | | | |
| Carl’s Jr.: | | | | | | | | | | | | | | | | | | | | |
| Total revenue | | $ | 830,961 | | | $ | 802,761 | | | $ | 792,829 | | | $ | 725,055 | | | $ | 693,692 | |
| Operating income | | | 83,525 | | | | 82,773 | | | | 61,656 | | | | 55,109 | | | | 52,577 | |
| Hardee’s: | | | | | | | | | | | | | | | | | | | | |
| Total revenue | | | 706,884 | | | | 661,509 | | | | 673,172 | | | | 642,694 | | | | 627,785 | |
| Operating income (loss) | | | 32,547 | | | | 13,393 | | | | 5,293 | | | | (26,336 | ) | | | (16,361 | ) |
| La Salsa: | | | | | | | | | | | | | | | | | | | | |
| Total revenue | | | 46,339 | | | | 49,156 | | | | 48,794 | | | | 43,933 | | | | 39,959 | |
| Operating loss(6) | | | (11,381 | ) | | | (7,007 | ) | | | (10,270 | ) | | | (37,304 | ) | | | (397 | ) |
Consolidated Balance Sheet Data: | | | | | | | | | | | | | | | | | | | | |
| Cash and cash equivalents | | $ | 18,680 | | | $ | 21,343 | | | $ | 18,432 | | | $ | 54,355 | | | $ | 18,440 | |
| Working capital deficit | | | (32,861 | ) | | | (27,038 | ) | | | (74,907 | ) | | | (43,820 | ) | | | (69,586 | ) |
| Total assets | | | 794,422 | | | | 791,337 | | | | 668,883 | | | | 730,404 | | | | 804,937 | |
| Total long-term debt and capital lease obligations, including current portion | | | 178,055 | | | | 264,662 | | | | 317,048 | | | | 418,176 | | | | 423,275 | |
| Stockholders’ equity | | | 378,846 | | | | 308,938 | | | | 119,668 | | | | 100,658 | | | | 152,660 | |
| | |
| (1) | | Our fiscal year is 52 or 53 weeks, ending the last Monday in January. For clarity of presentation, we generally label all fiscal years presented as if the fiscal year ended January 31. Fiscal 2007 and 2006 include 52 weeks. Fiscal 2005 includes 53 weeks. Fiscal 2004 and 2003 include 52 weeks. |
| |
| (2) | | Fiscal 2007, 2006, 2005, 2004 and 2003, include $8,546, $8,025, $14,320, $17,776 and $5,194, respectively, of facility action charges, net, which are included in operating income (loss). |
| |
| (3) | | For purposes of calculating the ratio of earnings to fixed charges (a) earnings represent income (loss) before income taxes, discontinued operations and cumulative effect of accounting change and fixed charges, and (b) fixed charges consist of interest on all indebtedness, interest related to capital lease obligations, amortization of debt issuance costs and a portion of rental expense that is representative of the interest factor (deemed by us to be one-third). Earnings were sufficient to cover fixed charges for fiscal 2007, 2006, 2005 and 2003, and insufficient to cover fixed charges for fiscal 2004 by $48,013. |
| |
| (4) | | Fiscal 2003 includes operating results of SBRG from the date of acquisition, March 1, 2002. |
| |
| (5) | | During fiscal 2003, we adopted SFAS 142,Goodwill and Other Intangible Assets,resulting in a transitional impairment charge of $175,780 (or $3.02 per diluted common share). |
| |
| (6) | | Fiscal 2004 includes a $34,059 impairment charge to reduce the carrying value of La Salsa goodwill to $0. |
| |
| (7) | | Fiscal 2006 has been restated to correct a $13,443 overstatement of our income tax benefit and deferred income tax assets. Fiscal 2006 (as restated) includes an income tax benefit of $123,888 attributable primarily to the reversal of a previously recorded valuation allowance against deferred tax assets. |
21
Selected Financial and Operating Data by Segment
| | | | | | | | | | | | | | | | | | | | | |
| | | Fiscal Year Ended January 31,(1) | |
| | | 2007 | | | 2006 | | | 2005 | | | 2004 | | | 2003(3) | |
| |
Carl’s Jr. Restaurants | | | | | | | | | | | | | | | | | | | | |
| Restaurants open (at end of fiscal year): | | | | | | | | | | | | | | | | | | | | |
| Company-operated | | | 393 | | | | 428 | | | | 428 | | | | 426 | | | | 440 | |
| Franchised and licensed | | | 694 | | | | 621 | | | | 586 | | | | 580 | | | | 547 | |
| | | | | | | | | | | | | | | | | | | | | |
| Total | | | 1,087 | | | | 1,049 | | | | 1,014 | | | | 1,006 | | | | 987 | |
| | | | | | | | | | | | | | | | | | | | | |
| Restaurant sales: | | | | | | | | | | | | | | | | | | | | |
| Company-operated restaurants | | $ | 590,613 | | | $ | 574,663 | | | $ | 567,960 | | | $ | 523,945 | | | $ | 507,526 | |
| Franchised and licensed restaurants(2) | | | 795,520 | | | | 700,590 | | | | 679,734 | | | | 596,318 | | | | 567,048 | |
| Average unit volume per company-operated restaurant | | | 1,440 | | | | 1,341 | | | | 1,301 | | | | 1,187 | | | | 1,152 | |
| Percentage increase in comparable company-operated restaurant sales | | | 4.9 | % | | | 2.2 | % | | | 7.7 | % | | | 2.9 | % | | | 0.7 | % |
| Restaurant operating costs as a percentage of company-operated revenue | | | 76.3 | % | | | 76.6 | % | | | 78.9 | % | | | 79.8 | % | | | 79.2 | % |
Hardee’s Restaurants | | | | | | | | | | | | | | | | | | | | |
| Restaurants open (at end of fiscal year): | | | | | | | | | | | | | | | | | | | | |
| Company-operated | | | 696 | | | | 663 | | | | 677 | | | | 721 | | | | 730 | |
| Franchised and licensed | | | 1,210 | | | | 1,330 | | | | 1,357 | | | | 1,400 | | | | 1,499 | |
| | | | | | | | | | | | | | | | | | | | | |
| Total | | | 1,906 | | | | 1,993 | | | | 2,034 | | | | 2,121 | | | | 2,229 | |
| | | | | | | | | | | | | | | | | | | | | |
| Restaurant sales: | | | | | | | | | | | | | | | | | | | | |
| Company-operated restaurants | | $ | 634,264 | | | $ | 587,082 | | | $ | 601,068 | | | $ | 575,238 | | | $ | 562,010 | |
| Franchised and licensed restaurants(2) | | | 1,156,201 | | | | 1,173,442 | | | | 1,203,750 | | | | 1,186,490 | | | | 1,251,526 | |
| Average unit volume per company-operated restaurant | | | 916 | | | | 874 | | | | 862 | | | | 792 | | | | 763 | |
| Percentage increase (decrease) in comparable company-operated restaurant sales | | | 4.8 | % | | | (0.2 | )% | | | 7.0 | % | | | 2.5 | % | | | (2.2 | )% |
| Restaurant operating costs as a percentage of company-operated revenue | | | 81.9 | % | | | 84.5 | % | | | 85.7 | % | | | 90.7 | % | | | 89.5 | % |
22
| | | | | | | | | | | | | | | | | | | | | |
| | | Fiscal Year Ended January 31,(1) | |
| | | 2007 | | | 2006 | | | 2005 | | | 2004 | | | 2003(3) | |
| |
La Salsa Restaurants | | | | | | | | | | | | | | | | | | | | |
| Restaurants open (at end of fiscal year): | | | | | | | | | | | | | | | | | | | | |
| Company-operated | | | 55 | | | | 59 | | | | 62 | | | | 61 | | | | 57 | |
| Franchised and licensed | | | 41 | | | | 43 | | | | 39 | | | | 41 | | | | 42 | |
| | | | | | | | | | | | | | | | | | | | | |
| Total | | | 96 | | | | 102 | | | | 101 | | | | 102 | | | | 99 | |
| | | | | | | | | | | | | | | | | | | | | |
| Restaurant sales: | | | | | | | | | | | | | | | | | | | | |
| Company-operated restaurants | | $ | 44,460 | | | $ | 47,277 | | | $ | 46,950 | | | $ | 42,310 | | | $ | 38,550 | |
| Franchised and licensed restaurants(2) | | | 36,630 | | | | 34,457 | | | | 34,170 | | | | 28,176 | | | | 23,802 | |
| Average unit volume per company-operated restaurant | | | 797 | | | | 772 | | | | 748 | | | | 723 | | | | 751 | |
| Percentage increase (decrease) in comparable company-operated restaurant sales | | | 1.2 | % | | | 2.6 | % | | | 5.2 | % | | | (1.3 | )% | | | 0.8 | % |
| Restaurant operating costs as a percentage of company-operated revenue | | | 93.5 | % | | | 95.0 | % | | | 97.6 | % | | | 94.7 | % | | | 87.9 | % |
| | |
| (1) | | Our fiscal year is 52 or 53 weeks, ending on the last Monday in January. For clarity of presentation, we generally label all fiscal years presented as if the fiscal year ended January 31. Fiscal 2007 and 2006 include 52 weeks. Fiscal 2005 includes 53 weeks. Fiscal 2004 and 2003 include 52 weeks. |
| |
| (2) | | Franchisee restaurant operations are not included in our Consolidated Financial Statements; however, franchisee sales result in royalties and rental income, which are included in franchised and licensed revenues. |
| |
| (3) | | Fiscal 2003 includes operating results of La Salsa from the date of the SBRG acquisition, March 1, 2002. |
23
| |
| Item 7. | Management’s Discussion and Analysis of Financial Condition and Results of Operations |
The following discussion should be read in conjunction with the Consolidated Financial Statements and related notes and Selected Financial and Operating Data included elsewhere in this Annual Report onForm 10-K.
Overview
Highlights from fiscal 2007 include:
| | |
| �� | • | Consolidated revenue increased 4.6%, to $1,588,410 in fiscal 2007 from $1,518,347 in fiscal 2006. |
| |
| | • | Carl’s Jr. same-store sales increased for the seventh consecutive year in fiscal 2007, growing 4.9% at company-operated restaurants, following a 2.2% increase in fiscal 2006. |
| |
| | • | Hardee’s same-store sales increased 4.8% at company-operated restaurants in fiscal 2007, following a 0.2% decrease in fiscal 2006. |
| |
| | • | Annual average unit volume increased 7.4%, to $1,440, for Carl’s Jr. company-operated restaurants and increased 4.8%, to $916, for Hardee’s company-operated restaurants. |
| |
| | • | Carl’s Jr. total restaurant operating costs as a percent of company-operated revenue decreased 30 basis points to 76.3% in fiscal 2007, as compared to 76.6% in fiscal 2006. |
| |
| | • | Hardee’s total restaurant operating costs as a percent of company-operated revenue decreased 260 basis points to 81.9% in fiscal 2007, as compared to 84.5% in fiscal 2006. |
| |
| | • | Income before income taxes and discontinued operations increased $24,820, or 43.4%, reaching $82,071 in fiscal 2007, as compared to $57,251 in fiscal 2006. |
| |
| | • | Net income decreased to $50,172, or $0.72 per diluted share. This represents a decrease of $130,967 from the prior year net income. Net income in fiscal 2006 (as restated) includes an income tax benefit of $123,888 attributable primarily to the reversal of a previously recorded valuation allowance against deferred tax assets, while net income in fiscal 2007 includes income tax expense of $31,899. |
| |
| | • | During fiscal 2007, we repaid a total of $28,928 of the term loan portion of the Facility. |
| |
| | • | During fiscal 2007, we repurchased 4,607,437 shares of our common stock for $81,057 under our Stock Repurchase Plan. |
| |
| | • | On January 22, 2007, we amended the Facility to increase the aggregate amount that we are permitted to expend for stock repurchases and dividend payments by $130,000, and increase the total amount available to us for revolving loans under the Facility by $100,000 to $250,000. As of January 31, 2007, we are permitted to make additional repurchases of our common stock up to $109,387 under the Stock Repurchase Plan. |
| |
| | • | During fiscal 2007, we declared cash dividends of $0.04 per share of our common stock each quarter for a total of $0.16 per share. |
We are a nationwide owner, operator and franchisor of QSRs, operating principally under the Carl’s Jr. and Hardee’s brand names. Based on United States system-wide sales, our Hardee’s and Carl’s Jr. chains are the tenth and twelfth largest quick-service hamburger restaurant chains in the United States of America, respectively, according to the June 26, 2006 issue of Nation’s Restaurant News. As of January 31, 2007, the Carl’s Jr. system included 1,087 restaurants, of which we operated 393 restaurants and our franchisees and licensees operated 694 restaurants. Carl’s Jr. restaurants are located in the Western United States, predominantly in California. As of January 31, 2007, the Hardee’s system consisted of 1,906 restaurants, of which we operated 696 restaurants and our franchisees and licensees operated 1,210 restaurants. Hardee’s restaurants are located primarily throughout the Southeastern and Midwestern United States.
We derive our revenue primarily from sales at company-operated restaurants and revenue from franchisees, including franchise and royalty fees, sales to Carl’s Jr. franchisees and licensees of food and packaging products, rentals under real property leases and revenue from the sale of equipment to our franchisees. Restaurant operating expenses consist primarily of food and packaging costs, payroll and other employee benefits and occupancy and
24
CKE RESTAURANTS, INC. AND SUBSIDIARIES
Management’s Discussion and Analysis — (Continued)
(Dollars in thousands)
other operating expenses of company-operated restaurants. Franchise operating costs include the cost of food and packaging products sold to Carl’s Jr. franchisees and licensees, lease payments or depreciation expense on properties leased or subleased to our franchisees, the cost of equipment sold to franchisees, and franchise administrative support. Our revenue and expenses are directly affected by the number and sales volume of company-operated restaurants and, to a lesser extent, franchised and licensed restaurants.
From time to time, we experience increases in our general operating costs. In the past, we have been successful at passing on such increases through price increases, but it has likely had an impact on transaction counts. If we were unable to pass along such price increases, and at the same time could not increase our transaction counts, the recoverability of the carrying value of our restaurants could be impacted.
Restatement of Previously Issued Financial Statements
In connection with the preparation and review of our income tax provision for fiscal 2007, we identified errors in our income tax provision for fiscal 2006, which resulted primarily from mistakes made in summarizing various computations utilized to determine the cumulative difference between our book and tax bases in our fixed assets.
These errors resulted in an overstatement of our income tax benefit for the fiscal year ended January 31, 2006, by $13,443. For the Consolidated Financial Statements presented herein, we have restated our current and non-current deferred income tax assets; income tax benefit; net income; earnings per share and accumulated deficit as of and for the fiscal year ended January 31, 2006, to reflect the correction of the $13,443 overstatement of income tax benefit noted above. (See Note 20 of Notes to Consolidated Financial Statements for additional information.)
We did not amend our previously filed Annual Report onForm 10-K for the fiscal year ended January 31, 2006. Accordingly, readers of the financial statements should rely upon the restated information in this Annual Report onForm 10-K as opposed to the previously filed information.
See Note 1 of Notes to Consolidated Financial Statements for additional information.
Critical Accounting Policies
Our reported results are impacted by the application of certain accounting policies that require us to make subjective or complex judgments. These judgments involve making estimates about the effect of matters that are inherently uncertain and may significantly impact our consolidated financial position and results of operations. Specific risks associated with these critical accounting policies are described in the following paragraphs.
For all of these policies, we caution that future events rarely develop exactly as expected, and the best estimates routinely require adjustment. Our most significant accounting policies require:
| | |
| | • | estimation of future cash flows used to assess the recoverability of long-lived assets and to establish the estimated liability for closing restaurants and subsidizing lease payments of franchisees; |
| |
| | • | estimation, using actuarially determined methods, of our self-insured claim losses under our workers’ compensation, general and auto liability insurance programs; |
| |
| | • | determination of appropriate estimated liabilities for loss contingencies; |
| |
| | • | determination of appropriate assumptions to use in evaluating leases for capital versus operating lease treatment, establishing depreciable lives for leasehold improvements and establishing straight-line rent expense periods; |
| |
| | • | estimation of the appropriate allowances associated with franchise and license receivables and liabilities for franchise subleases; |
25
CKE RESTAURANTS, INC. AND SUBSIDIARIES
Management’s Discussion and Analysis — (Continued)
(Dollars in thousands)
| | |
| | • | determination of the appropriate assumptions to use to estimate the fair value of stock-based compensation; and |
| |
| | • | estimation of our net deferred income tax asset valuation allowance and effective tax rate. |
Descriptions of these critical accounting policies follow.
Impairment of Property and Equipment and Other Amortizable Long-Lived Assets Held and Used, Held for Sale or To Be Disposed of Other Than By Sale
We evaluate the carrying value of individual restaurants when the results of operations have reasonably progressed to a point to adequately evaluate the probability of continuing operating losses or upon expectation that a restaurant will be sold or otherwise disposed of before the end of its previously estimated useful life. We generally estimate the useful life of restaurants on owned property to be 20 to 35 years and estimate the remaining useful life of restaurants subject to leases to range from the end of the lease term then in effect to the end of such lease term including all option periods. We then estimate the future cash flows from operating the restaurant over its estimated useful life. In making these judgments, we consider the period of time since the restaurant was opened or remodeled, and the trend of operations and expectations for future sales growth. We also make assumptions about future same-store sales and operating expenses. Our approach incorporates a probability-weighted approach wherein we estimate the effectiveness of future sales and marketing efforts on same-store sales. If an estimate of the fair value of our assets becomes necessary, we typically base such estimate on forecasted cash flows discounted at an estimated weighted-average cost of capital.
During the second and fourth quarter of each fiscal year, and whenever eventsand/or circumstances indicate that the carrying value of assets may be impaired, we perform an asset recoverability analysis through which we estimate future cash flows for each of our restaurants based upon experience gained, current intentions about refranchising restaurants and closures, expected sales trends, internal plans and other relevant information. As the operations of restaurants opened or remodeled in recent years progress to the point that their profitability and future prospects can adequately be evaluated, additional restaurants will become subject to review and to the possibility that impairments exist.
Same-store sales and the rates at which restaurant operating costs will increase in the future are key assumptions used to estimate future cash flow for evaluating recoverability. If our same-store sales do not perform at or above our forecasted level, or if restaurant operating cost increases exceed our forecast and we are unable to recover such costs through price increases, the carrying value of certain of our restaurants may prove to be unrecoverable and we may incur additional impairment charges in the future.
Typically, restaurants are operated for three years before we test them for impairment. Also, restaurants typically are not tested for two years following a remodel. We believe this provides the restaurant sufficient time to establish its presence in the market and build a customer base. If we were to test all restaurants for impairment without regard to the amount of time the restaurants were operating, the total asset impairment could increase substantially. In addition, if recently opened or remodeled restaurants do not eventually establish stronger market presence and build a customer base, the carrying value of certain of these restaurants may prove to be unrecoverable and we may incur additional impairment charges in the future.
As of January 31, 2007, we had a total of 91 restaurants among our three major restaurant concepts that generated negative cash flows on a trailing-13 period basis. These restaurants had combined net book values of $23,202. Included within these totals are 37 restaurants with combined net book values of $15,397 that have not been tested for impairment because they had not yet been operated for a sufficient period of time as of our most recent comprehensive semi-annual asset recoverability analysis in the fourth quarter of fiscal 2007. If these negative cash flow restaurants were not to begin generating positive cash flows within a reasonable period of time, the
26
CKE RESTAURANTS, INC. AND SUBSIDIARIES
Management’s Discussion and Analysis — (Continued)
(Dollars in thousands)
carrying value of these restaurants may prove to be unrecoverable and we may recognize additional impairment charges in the future.
Impairment of Goodwill
In accordance with SFAS 142, goodwill is tested annually for impairment, or more frequently if events or circumstances indicate that the asset might be impaired. We perform our annual impairment test during the first quarter of our fiscal year. An impairment loss is recognized to the extent that the carrying amount exceeds the asset’s fair value. The impairment test is performed at the reporting unit level. We consider the reporting unit level to be the brand level as the components (e.g., restaurants) within each brand have similar economic characteristics, including products and services, production processes, types or classes of customers and distribution methods. The impairment test consists of two steps. First, we determine the fair value of a reporting unit and compare it to its carrying amount. Second, if the carrying amount of a reporting unit exceeds its fair value, an impairment loss is recognized for any excess of the carrying amount of the reporting unit’s goodwill over the implied fair value of that goodwill. The implied fair value of goodwill is determined by allocating the fair value of the reporting unit in a manner similar to a purchase price allocation, in accordance with SFAS 141,Business Combinations. The residual fair value after this allocation is the implied fair value of the reporting unit’s goodwill.
During the first quarter of fiscal year 2007, we evaluated the Carl’s Jr. brand, the only one of our brands for which goodwill is recorded. As a result of our evaluation, we concluded that the fair value of the net assets of Carl’s Jr. exceeded the carrying value, and thus no impairment charge was required. As of January 31, 2007, we had $22,649 in goodwill recorded in our accompanying Consolidated Balance Sheet, all of which relates to Carl’s Jr.
Estimated Liability for Closing Restaurants
We typically make decisions to close restaurants based on prospects for estimated future profitability. However, sometimes we are forced to close restaurants due to circumstances beyond our control (e.g., a landlord’s refusal to negotiate a new lease). Our restaurant operators evaluate each restaurant’s performance no less frequently than the second and fourth quarter of each fiscal year. When restaurants continue to perform poorly, we consider a number of factors, including the demographics of the location and the likelihood of being able to improve an unprofitable restaurant. Based on the operators’ judgment and a financial review, we estimate the future cash flows. If we determine that the restaurant will not, within a reasonable period of time, operate at break-even cash flow or be profitable, and we are not contractually obligated to continue operating the restaurant, we may decide to close the restaurant.
The estimated liability for closing restaurants on properties vacated is based on the terms of the lease and the lease termination fee, if any, that we expect to pay, as well as estimated maintenance costs until the lease has been abated. The amount of the estimated liability established is the present value of these estimated future payments, net of the present value of expected lease or sublease income, which approximates the fair value of such obligations. The interest rate used to calculate the present value of these liabilities is based on an estimated credit-adjusted risk-free rate at the time the liability is established. The related discount is amortized and shown in facility action charges, net in our accompanying Consolidated Statements of Income.
A significant assumption used in determining the amount of the estimated liability for closing restaurants is the amount of the estimated liability for future lease payments on vacant restaurants. We estimate the cost to maintain leased and owned vacant properties until the lease can be abated or the owned property can be sold. If the costs to maintain properties increase, or it takes longer than anticipated to sell properties or sublease or terminate leases, we may need to record additional estimated liabilities. If the leases on the vacant restaurants are not terminated or subleased on the terms that we used to estimate the liabilities, we may be required to record losses in future periods. Conversely, if the leases on the vacant restaurants are terminated or subleased on more favorable terms than we used to estimate the liabilities, we reverse previously established estimated liabilities, resulting in an increase in
27
CKE RESTAURANTS, INC. AND SUBSIDIARIES
Management’s Discussion and Analysis — (Continued)
(Dollars in thousands)
operating income. As of January 31, 2007, the present value of our operating lease payment obligations on all closed restaurants was approximately $8,470, which represents the discounted amount we would be required to pay if we are unable to enter into sublease agreements or terminate the leases prior to the terms required in the lease agreements. However, it is our experience that we can often terminate those leases for less than that amount, or sublease the property and accordingly, we have recorded an estimated liability for operating lease obligations of $4,492 as of January 31, 2007.
Estimated Liability for Self-Insurance
We are self-insured for a portion of our current and prior years’ losses related to workers’ compensation, general and auto liability insurance programs. We have obtained stop loss insurance for individual workers’ compensation, general and auto liability claims over $500. Accrued liabilities for self-insurance are recorded based on the present value of actuarial estimates of the amounts of incurred and unpaid losses, based on an estimated risk-free interest rate of 4.5% as of January 31, 2007. In determining our estimated liability, management, with the assistance of our actuary, develops assumptions based on the average historical losses on claims we have incurred and on actuarial observations of historical claim loss development. Our actual future loss development may be better or worse than the development we estimated in conjunction with the actuary, in which case our reserves would require adjustment. As such, if we experience a higher than expected number of claims or the costs of claims rise more than expected, then we would be required to adjust the expected losses upward and increase our future self-insurance expense.
Our actuary provides us with estimated unpaid losses for each loss category, upon which our analysis is based. As of January 31, 2007, our estimated liability for self-insured workers’ compensation, general and auto liability losses was $37,833.
Loss Contingencies
We maintain accrued liabilities for contingencies related to litigation. We account for contingent obligations in accordance with SFAS 5,Accounting for Contingencies,which requires that we assess each loss contingency to determine estimates of the degree of probability and range of possible settlement. Those contingencies that are deemed to be probable and where the amount of such settlement is reasonably estimable are accrued in our Consolidated Financial Statements. If only a range of loss can be determined, with no amount in the range representing a better estimate than any other amount within the range, we accrue to the low end of the range. In accordance with SFAS 5, as of January 31, 2007, we have recorded an accrued liability for contingencies related to litigation in the amount of $630 (see Notes 10 and 27 of Notes to Consolidated Financial Statements for further information). The assessment of contingencies is highly subjective and requires judgments about future events. Contingencies are reviewed at least quarterly to determine the adequacy of the recorded liabilities and related Consolidated Financial Statement disclosure. The ultimate resolution of such loss contingencies may differ materially from amounts we have accrued in our Consolidated Financial Statements.
Accounting for Lease Obligations
We lease a substantial portion of our restaurant properties. At the inception of the lease, each property is evaluated to determine whether the lease is an operating or capital lease. The lease accounting evaluation may require significant exercise of judgment in estimating the fair value and useful life of the leased property and to establish the appropriate lease term. The lease term used for this evaluation includes renewal option periods only in instances in which the exercise of the renewal option can be reasonably assured because failure to exercise such option would result in an economic penalty. Such economic penalty would typically result from our having to abandon buildings and other non-detachable improvements upon vacating the property. The lease term used for this
28
CKE RESTAURANTS, INC. AND SUBSIDIARIES
Management’s Discussion and Analysis — (Continued)
(Dollars in thousands)
evaluation also provides the basis for establishing depreciable lives for buildings subject to lease and leasehold improvements, as well as the period over which we recognize straight-line rent expense.
In addition, the lease term is calculated from the date we are given control of the leased premises through the end of the lease term. There is potential for variability in the “rent holiday” period, which begins on the date we are given control of the leased premises and typically ends upon restaurant opening. Factors that may affect the length of the rent holiday period include construction-related delays. Extension of the rent holiday period due to such delays would result in greater rent expense recognized during the rent holiday period.
Franchised and Licensed Operations
We monitor the financial condition of certain franchisees and record provisions for estimated losses on receivables when we believe that our franchisees are unable to make their required payments to us. Each quarter, we perform an analysis to estimate bad debts for each franchisee. We then compare the aggregate result of that analysis to the amount recorded in our Consolidated Financial Statements as the allowance for doubtful accounts and adjust the allowance as appropriate. Additionally, we cease accruing royalties and rental income from franchisees that are materially delinquent in paying or in default for other reasons and reverse any royalties and rent income accrued during the fiscal quarter in which such delinquency or default occurs. Over time, our assessment of individual franchisees may change. For instance, we have had some franchisees, who in the past we had determined required an estimated loss equal to the total amount of the receivable, who have paid us in full or established a consistent record of payments (generally six months) such that we determined an allowance was no longer required.
Depending on the facts and circumstances, there are a number of different actions weand/or our franchisees may take to resolve franchise collections issues. These actions may include the purchase of franchise restaurants by us or by other franchisees, a modification to the franchise agreement (which may include a provision to defer certain royalty payments or reduce royalty rates in the future), a restructuring of the franchisee’s businessand/or finances (including the restructuring of leases for which we are the primary obligee — see further discussion below) or, if necessary, the termination of the franchise agreement. The allowance established is based on our assessment of the most likely course of action that will occur.
Many of the restaurants that we sold to Hardee’s and Carl’s Jr. franchisees as part of our refranchising program were on leased sites. Generally, we remain principally liable for the lease and have entered into a sublease with the franchisee on the same terms as the primary lease. In such cases, we account for the sublease payments received as franchising rental income and the lease payments we make as rental expense in franchised and licensed restaurants and other expense in our Consolidated Statements of Income. As of January 31, 2007, the present value of our total obligation on lease arrangements with Hardee’s and Carl’s Jr. franchisees (including subsidized leases — see further discussion below) was $21,900 and $85,093, respectively. We do not expect Carl’s Jr. franchisees to experience the same level of financial difficulties as Hardee’s franchisees have encountered in the past, however, we can provide no assurance that this will not occur.
In addition to the sublease arrangements with franchisees described above, we also lease land and buildings to franchisees. As of January 31, 2007, the net book value of property under lease to Hardee’s and Carl’s Jr. franchisees was $15,132 and $5,015, respectively. Financially troubled franchisees include those with whom we have entered into workout agreements and who may have liquidity problems in the future. In the event that a financially troubled franchisee closes a restaurant for which we own the property, our options are to operate the restaurant as a company-operated restaurant, transfer the restaurant to another franchisee, lease the property to another tenant or sell the property. These circumstances would cause us to consider whether the carrying value of the land and building was impaired. If we determined the property’s carrying value was impaired, we would record a charge to operations for the amount the carrying value of the property exceeds its fair value. As of January 31, 2007, the net book value of property under lease to Hardee’s franchisees that are considered to be financially troubled franchisees was approximately $332 and is included in the amount above.
29
CKE RESTAURANTS, INC. AND SUBSIDIARIES
Management’s Discussion and Analysis — (Continued)
(Dollars in thousands)
In accordance with SFAS��146,Accounting for Costs Associated with Exit or Disposal Activities, an estimated liability for future lease obligations on restaurants operated by franchisees for which we are the primary obligee is established on the date the franchisee closes the restaurant. Also, we record an estimated liability for subsidized lease payments when we sign a sublease agreement committing us to the subsidy. The liability includes an estimation related to the risk that certain lease payments from the franchisee may ultimately be uncollectible.
The amount of the estimated liability is established using the methodology described in “Estimated Liability for Closing Restaurants” above. Because losses are typically not probableand/or able to be reasonably estimated, we have not established an additional estimated liability for potential losses not yet incurred under a significant portion of our franchise sublease arrangements. The present value of future sublease obligations from financially troubled franchisees is approximately $1,078 (three financially troubled franchisees represent approximately 95.7% of this amount). If sales trends or economic conditions worsen for our franchisees, their financial health may worsen, our collection rates may decline and we may be required to assume the responsibility for additional lease payments on franchised restaurants. The likelihood of needing to increase the estimated liability for future lease obligations is primarily related to the success of our Hardee’s concept.
During February 2006, we terminated our franchise agreement with a Hardee’s franchisee that operated 90 franchised restaurants as a result of its inability to remedy, on a timely basis, certain defaults under the terms of the agreement. At that time, ten of the affected restaurants were located on property that we owned and leased to the franchisee, and 51 of the affected restaurants were located on leased premises that we sublet to the franchisee. During March 2006, we purchased five additional parcels that we had previously leased from a commercial lessor and sublet to the franchisee. The franchisee continued to operate the affected restaurants pursuant to a temporary license agreement until May 18, 2006, when we terminated the license agreement, leases and subleases and assumed full operational control of the aforementioned 61 restaurants. Since the termination of the license agreement, we have purchased $2,400 of existing equipment, closed 19 of the 61 restaurants and recorded facility action charges of $1,959 related to closing these restaurants. We currently operate the remaining 42 restaurants as company-operated restaurants. The former franchisee’s lenders (through a receiver) kept the remaining 29 restaurant locations, of which they subsequently closed 15. During October 2006, we purchased 11 of these restaurants for $6,538 and an existing franchisee, under a franchise agreement, purchased the remaining three restaurants. The total purchase price included land, buildings and existing equipment.
Share-Based Compensation
As discussed in Notes 1 and 23 of Notes to Consolidated Financial Statements, we have various share-based compensation plans that provide stock options and restricted awards for certain employees and non-employee directors to acquire shares of our common stock. Prior to our adoption of SFAS 123R at the beginning of fiscal 2007, we accounted for share-based compensation in accordance with APB 25, which utilizes the intrinsic value method of accounting, as opposed to using the fair-value method prescribed in SFAS 123R. During fiscal years ended January 31, 2007 and 2006, we recorded share-based compensation expense of $8,368 and $188, respectively. (See Note 23 for analysis of the effect of certain changes in assumptions used to determine the fair value of share-based compensation.)
Valuation Allowance for Net Deferred Tax Assets
Deferred income taxes are provided for the estimated income tax effect of temporary differences between the financial and tax bases of assets and liabilities using the liability method. Deferred tax assets are also provided for net operating loss and income tax credit carryforwards. A valuation allowance to reduce the carrying amount of deferred tax assets is established when it is more likely than not that we will not realize some portion or all of the tax benefit of our deferred tax assets. We evaluate, on a quarterly basis, whether it is more likely than not that our deferred income tax assets are realizable. In performing this analysis, we consider all available evidence, both
30
CKE RESTAURANTS, INC. AND SUBSIDIARIES
Management’s Discussion and Analysis — (Continued)
(Dollars in thousands)
positive and negative, including historical operating results, the estimated timing of future reversals of existing taxable temporary differences, estimated future taxable income exclusive of reversing temporary differences and carryforwards, and potential tax planning strategies that may be employed to prevent operating loss or tax credit carryforwards from expiring unused.
As of January 31, 2005, we maintained a valuation allowance of $190,179 against our net deferred tax assets, since we had determined, based primarily on a history of cumulative losses in recent years and uncertainty regarding the timing and amounts of future taxable income, that realization of our deferred tax assets was not more likely than not. During the fourth quarter of fiscal 2006, after considering a number of factors, including a three-year history of cumulative earnings, utilization of net operating loss carryforwards in fiscal 2006, and estimated taxable income in future years, we determined we would more likely than not realize substantial future tax benefits from our deferred tax assets. As a result of this analysis, we reduced our valuation allowance by $159,959 at January 31, 2006, resulting in a net deferred tax asset of $135,740, as restated. Of the total tax benefit from the reversal of the valuation allowance, $11,971 was recorded to additional paid-in capital for the tax benefit from the exercise of stock options during both the current and prior years.
During the fourth quarter of fiscal 2007, we determined that we would more likely than not realize additional future tax benefits from our deferred tax assets. This determination was based on a number of factors, including our ability, for the first time in several years, to utilize more foreign tax credits than we generated in fiscal 2007 and our projected future foreign source income. As a result of our analysis, we reduced our valuation allowance by $4,884 at January 31, 2007. As of January 31, 2007, our remaining valuation allowance of $27,257 relates to federal and state capital loss carryforwards and certain state net operating loss and income tax credit carryforwards. Realization of the tax benefit of such deferred tax assets may remain uncertain for the foreseeable future, even though we expect to generate taxable income, since they are subject to various limitations and may only be used to offset income of certain entities or of a certain character.
Business Strategy
We remain focused on vigorously pursuing a comprehensive business strategy. The main components of our strategy are as follows:
| | |
| | • | increase revenues, average unit volumes and operating income at our major brands; |
| |
| | • | remain focused on restaurant fundamentals — quality, service and cleanliness; |
| |
| | • | capitalize on our unique brand positioning and cutting-edge advertising; |
| |
| | • | offer premium products that compete on quality, innovation and taste; |
| |
| | • | continue to capitalize on dual-branding opportunities available with Green Burrito and Red Burritotm; |
| |
| | • | control costs and improve capital structure while increasing shareholder distributions; |
| |
| | • | leverage our infrastructure and marketing presence to build out existing core markets; |
| |
| | • | remodel our existing store base to remain competitive; and |
| |
| | • | strengthen our franchise system and pursue further franchising opportunities, including new franchisees. |
Franchise Operations
Like others in the quick-service restaurant industry, some of our franchisees experience financial difficulties from time to time with respect to their operations. Our approach to dealing with financial and operational issues that arise from these situations is described under Critical Accounting Policies above, under the heading “Franchised
31
CKE RESTAURANTS, INC. AND SUBSIDIARIES
Management’s Discussion and Analysis — (Continued)
(Dollars in thousands)
and Licensed Operations.” Some franchisees in the Hardee’s system have experienced significant financial problems and, as discussed above, there are a number of potential resolutions of these financial issues.
We continue to work with franchisees in an attempt to maximize our future franchising income. Our franchising income is dependent on both the number of restaurants operated by franchisees and their operational and financial success, such that they can make their royalty and lease payments to us. Although we review the allowance for doubtful accounts and the estimated liability for closed franchise restaurants, there can be no assurance that the number of franchisees or franchised restaurants experiencing financial difficulties will not increase from our current assessments, nor can there be any assurance that we will be successful in resolving financial issues relating to any specific franchisee. As of January 31, 2007, our consolidated allowance for doubtful accounts on notes receivable was 77.9% of the gross balance of notes receivable and our consolidated allowance for doubtful accounts on accounts receivable was 0.9% of the gross balance of accounts receivable. When appropriate, we establish notes receivable pursuant to completing workout agreements with financially troubled franchisees. As of January 31, 2007, we have not recognized, on a cumulative basis, $151 in accounts receivable and $5,955 in notes receivable, nor the royalty and rent revenue associated with these accounts and notes receivable, due from franchisees that are in default under the terms of their franchise agreements. We still experience specific problems with troubled franchisees (see Critical Accounting Policies — Franchise and Licensed Operations) and may be required to increase the amount of our allowances for doubtful accountsand/or increase the amount of our estimated liability for future lease obligations.
32
CKE RESTAURANTS, INC. AND SUBSIDIARIES
Management’s Discussion and Analysis — (Continued)
(Dollars in thousands)
Operating Review
The following table sets forth the percentage relationship to total revenue, unless otherwise indicated, of certain items included in our accompanying Consolidated Statements of Income for the years indicated:
| | | | | | | | | | | | | |
| | | Fiscal Year Ended January 31, | |
| | | 2007 | | | 2006 | | | 2005 | |
| | | (as restated) | |
| |
| Revenue: | | | | | | | | | | | | |
| Company-operated restaurants | | | 79.9 | % | | | 79.7 | % | | | 80.1 | % |
| Franchised and licensed restaurants and other | | | 20.1 | | | | 20.3 | | | | 19.9 | |
| | | | | | | | | | | | | |
| Total revenue | | | 100.0 | | | | 100.0 | | | | 100.0 | |
| | | | | | | | | | | | | |
| Operating costs and expenses: | | | | | | | | | | | | |
| Restaurant operating costs(1): | | | | | | | | | | | | |
| Food and packaging | | | 28.7 | | | | 29.3 | | | | 29.6 | |
| Payroll and other employee benefits | | | 29.2 | | | | 29.5 | | | | 31.0 | |
| Occupancy and other | | | 21.8 | | | | 22.4 | | | | 22.5 | |
| | | | | | | | | | | | | |
| Total restaurant operating costs | | | 79.7 | | | | 81.2 | | | | 83.0 | |
| | | | | | | | | | | | | |
| Franchised and licensed restaurants and other(2) | | | 75.6 | | | | 77.2 | | | | 75.2 | |
| Advertising(1) | | | 5.7 | | | | 5.9 | | | | 5.9 | |
| General and administrative | | | 9.5 | | | | 9.3 | | | | 9.1 | |
| Facility action charges, net | | | 0.5 | | | | 0.5 | | | | 0.9 | |
| | | | | | | | | | | | | |
| Operating income | | | 6.6 | | | | 5.1 | | | | 3.7 | |
| Interest expense | | | (1.2 | ) | | | (1.5 | ) | | | (2.4 | ) |
| Conversion inducement expense | | | (0.4 | ) | | | — | | | | — | |
| Other income (expense), net | | | 0.2 | | | | 0.2 | | | | (0.2 | ) |
| | | | | | | | | | | | | |
| Income before income taxes and discontinued operations | | | 5.2 | | | | 3.8 | | | | 1.1 | |
| Income tax expense (benefit) | | | 2.0 | | | | (8.2 | ) | | | (0.1 | ) |
| | | | | | | | | | | | | |
| Income from continuing operations | | | 3.2 | % | | | 12.0 | % | | | 1.2 | % |
| | | | | | | | | | | | | |
| | |
| (1) | | As a percent of revenue from company-operated restaurants. |
| |
| (2) | | As a percent of revenue from franchised and licensed restaurants and other. |
33
CKE RESTAURANTS, INC. AND SUBSIDIARIES
Management’s Discussion and Analysis — (Continued)
(Dollars in thousands)
The following tables are presented to facilitate Management’s Discussion and Analysis of Financial Condition and Results of Operations and are classified in the same way as we present segment information (see Note 22 of Notes to Consolidated Financial Statements).
| | | | | | | | | | | | | | | | | | | | | | | | | |
| | | Fiscal 2007 | |
| | | Carl’s Jr. | | | Hardee’s | | | La Salsa | | | Other(A) | | | Eliminations(B) | | | Total | |
| |
| Company-operated revenue | | $ | 590,613 | | | $ | 634,264 | | | $ | 44,460 | | | $ | 350 | | | $ | — | | | $ | 1,269,687 | |
| | | | | | | | | | | | | | | | | | | | | | | | | |
| Restaurant operating costs: | | | | | | | | | | | | | | | | | | | | | | | | |
| Food and packaging | | | 170,142 | | | | 182,695 | | | | 11,423 | | | | 115 | | | | — | | | | 364,375 | |
| Payroll and employee benefits | | | 154,791 | | | | 201,008 | | | | 14,791 | | | | 134 | | | | — | | | | 370,724 | |
| Occupancy and other operating costs | | | 125,574 | | | | 135,716 | | | | 15,353 | | | | 110 | | | | — | | | | 276,753 | |
| | | | | | | | | | | | | | | | | | | | | | | | | |
| Total restaurant operating costs | | | 450,507 | | | | 519,419 | | | | 41,567 | | | | 359 | | | | — | | | | 1,011,852 | |
| | | | | | | | | | | | | | | | | | | | | | | | | |
| Franchised and licensed restaurants and other revenue: | | | | | | | | | | | | | | | | | | | | | | | | |
| Royalties | | | 29,692 | | | | 47,546 | | | | 1,844 | | | | 487 | | | | (70 | ) | | | 79,499 | |
| Distribution centers | | | 187,533 | | | | 16,995 | | | | — | | | | — | | | | (8 | ) | | | 204,520 | |
| Rent | | | 21,371 | | | | 7,426 | | | | — | | | | — | | | | — | | | | 28,797 | |
| Retail sales of variable interest entity | | | — | | | | — | | | | — | | | | 3,467 | | | | — | | | | 3,467 | |
| Other | | | 1,752 | | | | 653 | | | | 35 | | | | — | | | | — | | | | 2,440 | |
| | | | | | | | | | | | | | | | | | | | | | | | | |
| Total franchised and licensed restaurants and other revenue | | | 240,348 | | | | 72,620 | | | | 1,879 | | | | 3,954 | | | | (78 | ) | | | 318,723 | |
| | | | | | | | | | | | | | | | | | | | | | | | | |
| Franchised and licensed restaurants and other expenses: | | | | | | | | | | | | | | | | | | | | | | | | |
| Administrative expense (including provision for bad debts) | | | 5,281 | | | | 4,336 | | | | 1,437 | | | | — | | | | — | | | | 11,054 | |
| Distribution centers | | | 185,271 | | | | 17,840 | | | | — | | | | — | | | | — | | | | 203,111 | |
| Rent and other occupancy | | | 18,280 | | | | 5,117 | | | | — | | | | — | | | | — | | | | 23,397 | |
| Operating costs of variable interest entity | | | — | | | | — | | | | — | | | | 3,437 | | | | (47 | ) | | | 3,390 | |
| | | | | | | | | | | | | | | | | | | | | | | | | |
| Total franchised and licensed restaurants and other expenses | | | 208,832 | | | | 27,293 | | | | 1,437 | | | | 3,437 | | | | (47 | ) | | | 240,952 | |
| | | | | | | | | | | | | | | | | | | | | | | | | |
| Advertising | | | 33,318 | | | | 37,589 | | | | 1,339 | | | | 7 | | | | — | | | | 72,253 | |
| | | | | | | | | | | | | | | | | | | | | | | | | |
| General and administrative | | | 54,115 | | | | 87,542 | | | | 8,374 | | | | 284 | | | | — | | | | 150,315 | |
| | | | | | | | | | | | | | | | | | | | | | | | | |
| Facility action charges, net | | | 664 | | | | 2,494 | | | | 5,003 | | | | 385 | | | | — | | | | 8,546 | |
| | | | | | | | | | | | | | | | | | | | | | | | | |
| Operating income (loss) | | $ | 83,525 | | | $ | 32,547 | | | $ | (11,381 | ) | | $ | (168 | ) | | $ | (31 | ) | | $ | 104,492 | |
| | | | | | | | | | | | | | | | | | | | | | | | | |
| Company-operated average unit volume (trailing-13 periods) | | $ | 1,440 | | | $ | 916 | | | $ | 797 | | | | | | | | | | | | | |
| Franchise-operated average unit volume (trailing-13 periods) | | $ | 1,205 | | | $ | 949 | | | $ | 869 | | | | | | | | | | | | | |
| Company-operated same-store sales increase | | | 4.9 | % | | | 4.8 | % | | | 1.2 | % | | | | | | | | | | | | |
| Franchise-operated same-store sales increase | | | 5.4 | % | | | 4.3 | % | | | 2.2 | % | | | | | | | | | | | | |
| Company-operated same-store transaction increase (decrease) | | | 0.7 | % | | | 1.4 | % | | | (4.5 | )% | | | | | | | | | | | | |
| Average check (actual $) | | $ | 6.49 | | | $ | 4.89 | | | $ | 10.84 | | | | | | | | | | | | | |
| Restaurant operating costs as a % of company-operated revenue: | | | | | | | | | | | | | | | | | | | | | | | | |
| Food and packaging | | | 28.8 | % | | | 28.8 | % | | | 25.7 | % | | | | | | | | | | | | |
| Payroll and employee benefits | | | 26.2 | % | | | 31.7 | % | | | 33.3 | % | | | | | | | | | | | | |
| Occupancy and other operating costs | | | 21.3 | % | | | 21.4 | % | | | 34.5 | % | | | | | | | | | | | | |
| Total restaurant operating costs | | | 76.3 | % | | | 81.9 | % | | | 93.5 | % | | | | | | | | | | | | |
| Advertising as a % of company-operated revenue | | | 5.6 | % | | | 5.9 | % | | | 3.0 | % | | | | | | | | | | | | |
34
CKE RESTAURANTS, INC. AND SUBSIDIARIES
Management’s Discussion and Analysis — (Continued)
(Dollars in thousands)
| | | | | | | | | | | | | | | | | | | | | | | | | |
| | | Fiscal 2006 | |
| | | Carl’s Jr. | | | Hardee’s | | | La Salsa | | | Other(A) | | | Eliminations(B) | | | Total | |
| |
| Company-operated revenue | | $ | 574,663 | | | $ | 587,082 | | | $ | 47,277 | | | $ | 434 | | | $ | — | | | $ | 1,209,456 | |
| | | | | | | | | | | | | | | | | | | | | | | | | |
| Restaurant operating costs: | | | | | | | | | | | | | | | | | | | | | | | | |
| Food and packaging | | | 166,863 | | | | 174,611 | | | | 12,617 | | | | 148 | | | | — | | | | 354,239 | |
| Payroll and employee benefits | | | 150,559 | | | | 190,486 | | | | 15,722 | | | | 193 | | | | — | | | | 356,960 | |
| Occupancy and other operating costs | | | 122,859 | | | | 131,149 | | | | 16,559 | | | | 149 | | | | — | | | | 270,716 | |
| | | | | | | | | | | | | | | | | | | | | | | | | |
| Total restaurant operating costs | | | 440,281 | | | | 496,246 | | | | 44,898 | | | | 490 | | | | — | | | | 981,915 | |
| | | | | | | | | | | | | | | | | | | | | | | | | |
| Franchised and licensed restaurants and other revenue: | | | | | | | | | | | | | | | | | | | | | | | | |
| Royalties | | | 26,224 | | | | 42,050 | | | | 1,754 | | | | 433 | | | | (86 | ) | | | 70,375 | |
| Distribution centers | | | 179,222 | | | | 24,458 | | | | — | | | | — | | | | (139 | ) | | | 203,541 | |
| Rent | | | 20,968 | | | | 7,121 | | | | — | | | | — | | | | — | | | | 28,089 | |
| Retail sales of variable interest entity | | | — | | | | — | | | | — | | | | 4,279 | | | | — | | | | 4,279 | |
| Other | | | 1,684 | | | | 798 | | | | 125 | | | | — | | | | — | | | | 2,607 | |
| | | | | | | | | | | | | | | | | | | | | | | | | |
| Total franchised and licensed restaurants and other revenue | | | 228,098 | | | | 74,427 | | | | 1,879 | | | | 4,712 | | | | (225 | ) | | | 308,891 | |
| | | | | | | | | | | | | | | | | | | | | | | | | |
| Franchised and licensed restaurants and other expenses: | | | | | | | | | | | | | | | | | | | | | | | | |
| Administrative expense (including provision for bad debts) | | | 4,609 | | | | 5,169 | | | | 1,389 | | | | — | | | | — | | | | 11,167 | |
| Distribution centers | | | 174,149 | | | | 24,930 | | | | — | | | | — | | | | — | | | | 199,079 | |
| Rent and other occupancy | | | 18,213 | | | | 5,959 | | | | — | | | | — | | | | — | | | | 24,172 | |
| Operating costs of variable interest entity | | | — | | | | — | | | | — | | | | 4,299 | | | | (256 | ) | | | 4,043 | |
| | | | | | | | | | | | | | | | | | | | | | | | | |
| Total franchised and licensed restaurants and other expenses | | | 196,971 | | | | 36,058 | | | | 1,389 | | | | 4,299 | | | | (256 | ) | | | 238,461 | |
| | | | | | | | | | | | | | | | | | | | | | | | | |
| Advertising | | | 34,660 | | | | 35,282 | | | | 1,014 | | | | 8 | | | | — | | | | 70,964 | |
| | | | | | | | | | | | | | | | | | | | | | | | | |
| General and administrative | | | 46,284 | | | | 75,877 | | | | 7,318 | | | | 11,623 | | | | — | | | | 141,102 | |
| | | | | | | | | | | | | | | | | | | | | | | | | |
| Facility action charges, net | | | 1,792 | | | | 4,653 | | | | 1,544 | | | | 36 | | | | — | | | | 8,025 | |
| | | | | | | | | | | | | | | | | | | | | | | | | |
| Operating income (loss) | | $ | 82,773 | | | $ | 13,393 | | | $ | (7,007 | ) | | $ | (11,310 | ) | | $ | 31 | | | $ | 77,880 | |
| | | | | | | | | | | | | | | | | | | | | | | | | |
| Company-operated average unit volume (trailing-13 periods) | | $ | 1,341 | | | $ | 874 | | | $ | 772 | | | | | | | | | | | | | |
| Franchise-operated average unit volume (trailing-13 periods) | | $ | 1,160 | | | $ | 897 | | | $ | 897 | | | | | | | | | | | | | |
| Company-operated same-store sales increase (decrease) | | | 2.2 | % | | | (0.2 | )% | | | 2.6 | % | | | | | | | | | | | | |
| Franchise-operated same-store sales increase (decrease) | | | 0.7 | % | | | (2.2 | )% | | | 3.9 | % | | | | | | | | | | | | |
| Company-operated same-store transaction decrease | | | (3.0 | )% | | | (2.7 | )% | | | (1.7 | )% | | | | | | | | | | | | |
| Average check (actual $) | | $ | 6.22 | | | $ | 4.76 | | | $ | 10.15 | | | | | | | | | | | | | |
| Restaurant operating costs as a % of company-operated revenue: | | | | | | | | | | | | | | | | | | | | | | | | |
| Food and packaging | | | 29.0 | % | | | 29.7 | % | | | 26.7 | % | | | | | | | | | | | | |
| Payroll and employee benefits | | | 26.2 | % | | | 32.4 | % | | | 33.3 | % | | | | | | | | | | | | |
| Occupancy and other operating costs | | | 21.4 | % | | | 22.4 | % | | | 35.0 | % | | | | | | | | | | | | |
| Total restaurant operating costs | | | 76.6 | % | | | 84.5 | % | | | 95.0 | % | | | | | | | | | | | | |
| Advertising as a % of company-operated revenue | | | 6.0 | % | | | 6.0 | % | | | 2.1 | % | | | | | | | | | | | | |
35
CKE RESTAURANTS, INC. AND SUBSIDIARIES
Management’s Discussion and Analysis — (Continued)
(Dollars in thousands)
| | | | | | | | | | | | | | | | | | | | | | | | | |
| | | Fiscal 2005 | |
| | | Carl’s Jr. | | | Hardee’s | | | La Salsa | | | Other(A) | | | Eliminations(B) | | | Total | |
| |
| Company-operated revenue | | $ | 567,960 | | | $ | 601,068 | | | $ | 46,950 | | | $ | 1,295 | | | $ | — | | | $ | 1,217,273 | |
| | | | | | | | | | | | | | | | | | | | | | | | | |
| Restaurant operating costs: | | | | | | | | | | | | | | | | | | | | | | | | |
| Food and packaging | | | 166,120 | | | | 180,515 | | | | 12,848 | | | | 456 | | | | — | | | | 359,939 | |
| Payroll and employee benefits | | | 160,240 | | | | 200,349 | | | | 16,285 | | | | 531 | | | | — | | | | 377,405 | |
| Occupancy and other operating costs | | | 121,779 | | | | 134,387 | | | | 16,711 | | | | 417 | | | | — | | | | 273,294 | |
| | | | | | | | | | | | | | | | | | | | | | | | | |
| Total restaurant operating costs | | | 448,139 | | | | 515,251 | | | | 45,844 | | | | 1,404 | | | | — | | | | 1,010,638 | |
| | | | | | | | | | | | | | | | | | | | | | | | | |
| Franchised and licensed restaurants and other revenue: | | | | | | | | | | | | | | | | | | | | | | | | |
| Royalties | | | 25,426 | | | | 43,414 | | | | 1,732 | | | | 351 | | | | (66 | ) | | | 70,857 | |
| Distribution centers | | | 176,304 | | | | 18,181 | | | | — | | | | — | | | | — | | | | 194,485 | |
| Rent | | | 22,172 | | | | 9,985 | | | | — | | | | — | | | | — | | | | 32,157 | |
| Retail sales of variable interest entity | | | — | | | | — | | | | — | | | | 3,506 | | | | — | | | | 3,506 | |
| Other | | | 967 | | | | 524 | | | | 112 | | | | — | | | | — | | | | 1,603 | |
| | | | | | | | | | | | | | | | | | | | | | | | | |
| Total franchised and licensed restaurants and other revenue | | | 224,869 | | | | 72,104 | | | | 1,844 | | | | 3,857 | | | | (66 | ) | | | 302,608 | |
| | | | | | | | | | | | | | | | | | | | | | | | | |
| Franchised and licensed restaurants and other expenses: | | | | | | | | | | | | | | | | | | | | | | | | |
| Administrative expense (including provision for bad debts) | | | 4,006 | | | | 4,758 | | | | 1,111 | | | | — | | | | — | | | | 9,875 | |
| Distribution centers | | | 171,363 | | | | 18,379 | | | | — | | | | — | | | | — | | | | 189,742 | |
| Rent and other occupancy | | | 18,040 | | | | 6,540 | | | | — | | | | — | | | | — | | | | 24,580 | |
| Operating costs of variable interest entity | | | — | | | | — | | | | — | | | | 3,457 | | | | (66 | ) | | | 3,391 | |
| | | | | | | | | | | | | | | | | | | | | | | | | |
| Total franchised and licensed restaurants and other expenses | | | 193,409 | | | | 29,677 | | | | 1,111 | | | | 3,457 | | | | (66 | ) | | | 227,588 | |
| | | | | | | | | | | | | | | | | | | | | | | | | |
| Advertising | | | 34,413 | | | | 36,023 | | | | 1,377 | | | | 26 | | | | — | | | | 71,839 | |
| | | | | | | | | | | | | | | | | | | | | | | | | |
| General and administrative | | | 52,418 | | | | 79,840 | | | | 6,388 | | | | 70 | | | | — | | | | 138,716 | |
| | | | | | | | | | | | | | | | | | | | | | | | | |
| Facility action charges, net | | | 2,794 | | | | 7,088 | | | | 4,344 | | | | 94 | | | | — | | | | 14,320 | |
| | | | | | | | | | | | | | | | | | | | | | | | | |
| Operating income (loss) | | $ | 61,656 | | | $ | 5,293 | | | $ | (10,270 | ) | | $ | 101 | | | $ | — | | | $ | 56,780 | |
| | | | | | | | | | | | | | | | | | | | | | | | | |
| Company-operated average unit volume (trailing-13 periods) | | $ | 1,301 | | | $ | 862 | | | $ | 748 | | | | | | | | | | | | | |
| Franchise-operated average unit volume (trailing-13 periods) | | $ | 1,146 | | | $ | 891 | | | $ | 823 | | | | | | | | | | | | | |
| Company-operated same-store sales increase | | | 7.7 | % | | | 7.0 | % | | | 5.2 | % | | | | | | | | | | | | |
| Franchise-operated same-store sales increase | | | 6.6 | % | | | 3.6 | % | | | 3.7 | % | | | | | | | | | | | | |
| Company-operated same-store transaction increase | | | 1.3 | % | | | 0.2 | % | | | 1.0 | % | | | | | | | | | | | | |
| Average check (actual $) | | $ | 5.89 | | | $ | 4.63 | | | $ | 9.65 | | | | | | | | | | | | | |
| Restaurant operating costs as a % of company-operated revenue: | | | | | | | | | | | | | | | | | | | | | | | | |
| Food and packaging | | | 29.3 | % | | | 30.0 | % | | | 27.4 | % | | | | | | | | | | | | |
| Payroll and employee benefits | | | 28.2 | % | | | 33.3 | % | | | 34.6 | % | | | | | | | | | | | | |
| Occupancy and other operating costs | | | 21.4 | % | | | 22.4 | % | | | 35.6 | % | | | | | | | | | | | | |
| Total restaurant operating costs | | | 78.9 | % | | | 85.7 | % | | | 97.6 | % | | | | | | | | | | | | |
| Advertising as a % of company-operated revenue | | | 6.1 | % | | | 6.0 | % | | | 2.9 | % | | | | | | | | | | | | |
36
CKE RESTAURANTS, INC. AND SUBSIDIARIES
Management’s Discussion and Analysis — (Continued)
(Dollars in thousands)
| | | | | | | | | | | | | | | | | | | | | | | | | |
| | | Fourth Quarter Fiscal 2007 | |
| | | Carl’s Jr. | | | Hardee’s | | | La Salsa | | | Other(A) | | | Eliminations(B) | | | Total | |
| |
| Company-operated revenue | | $ | 133,041 | | | $ | 145,030 | | | $ | 9,349 | | | $ | 77 | | | $ | — | | | $ | 287,497 | |
| | | | | | | | | | | | | | | | | | | | | | | | | |
| Restaurant operating costs: | | | | | | | | | | | | | | | | | | | | | | | | |
| Food and packaging | | | 38,805 | | | | 41,508 | | | | 2,442 | | | | 25 | | | | — | | | | 82,780 | |
| Payroll and employee benefits | | | 34,800 | | | | 46,747 | | | | 3,315 | | | | 31 | | | | — | | | | 84,893 | |
| Occupancy and other operating costs | | | 29,253 | | | | 32,009 | | | | 3,478 | | | | 24 | | | | — | | | | 64,764 | |
| | | | | | | | | | | | | | | | | | | | | | | | | |
| Total restaurant operating costs | | | 102,858 | | | | 120,264 | | | | 9,235 | | | | 80 | | | | — | | | | 232,437 | |
| | | | | | | | | | | | | | | | | | | | | | | | | |
| Franchised and licensed restaurants and other revenue: | | | | | | | | | | | | | | | | | | | | | | | | |
| Royalties | | | 7,214 | | | | 9,476 | | | | 386 | | | | 105 | | | | (37 | ) | | | 17,144 | |
| Distribution centers | | | 43,332 | | | | 3,464 | | | | — | | | | — | | | | (2 | ) | | | 46,794 | |
| Rent | | | 5,175 | | | | 1,326 | | | | — | | | | — | | | | — | | | | 6,501 | |
| Retail sales of variable interest entity | | | — | | | | — | | | | — | | | | 724 | | | | — | | | | 724 | |
| Other | | | 210 | | | | 98 | | | | 2 | | | | — | | | | — | | | | 310 | |
| | | | | | | | | | | | | | | | | | | | | | | | | |
| Total franchised and licensed restaurants and other revenue | | | 55,931 | | | | 14,364 | | | | 388 | | | | 829 | | | | (39 | ) | | | 71,473 | |
| | | | | | | | | | | | | | | | | | | | | | | | | |
| Franchised and licensed restaurants and other expenses: | | | | | | | | | | | | | | | | | | | | | | | | |
| Administrative expense (including provision for bad debts) | | | 1,281 | | | | 1,236 | | | | 350 | | | | — | | | | — | | | | 2,867 | |
| Distribution centers | | | 43,245 | | | | 3,618 | | | | — | | | | — | | | | — | | | | 46,863 | |
| Rent and other occupancy | | | 4,332 | | | | 944 | | | | — | | | | — | | | | — | | | | 5,276 | |
| Operating costs of variable interest entity | | | — | | | | — | | | | — | | | | 742 | | | | (16 | ) | | | 726 | |
| | | | | | | | | | | | | | | | | | | | | | | | | |
| Total franchised and licensed restaurants and other expenses | | | 48,858 | | | | 5,798 | | | | 350 | | | | 742 | | | | (16 | ) | | | 55,732 | |
| | | | | | | | | | | | | | | | | | | | | | | | | |
| Advertising | | | 7,065 | | | | 8,817 | | | | 286 | | | | 2 | | | | — | | | | 16,170 | |
| | | | | | | | | | | | | | | | | | | | | | | | | |
| General and administrative | | | 12,921 | | | | 21,450 | | | | 1,882 | | | | 63 | | | | — | | | | 36,316 | |
| | | | | | | | | | | | | | | | | | | | | | | | | |
| Facility action charges, net | | | 142 | | | | 2,381 | | | | 2,386 | | | | 111 | | | | — | | | | 5,020 | |
| | | | | | | | | | | | | | | | | | | | | | | | | |
| Operating income (loss) | | $ | 17,128 | | | $ | 684 | | | $ | (4,402 | ) | | $ | (92 | ) | | $ | (23 | ) | | $ | 13,295 | |
| | | | | | | | | | | | | | | | | | | | | | | | | |
| Company-operated same-store sales increase (decrease) | | | 2.8 | % | | | 4.8 | % | | | (0.2 | )% | | | | | | | | | | | | |
| Franchise-operated same-store sales increase | | | 2.6 | % | | | 4.1 | % | | | 1.1 | % | | | | | | | | | | | | |
| Company-operated same-store transaction (decrease) increase | | | (2.1 | )% | | | 1.9 | % | | | (4.5 | )% | | | | | | | | | | | | |
| Average check (actual $) | | $ | 6.77 | | | $ | 4.94 | | | $ | 10.72 | | | | | | | | | | | | | |
| Restaurant operating costs as a % of company-operated revenue: | | | | | | | | | | | | | | | | | | | | | | | | |
| Food and packaging | | | 29.2 | % | | | 28.6 | % | | | 26.1 | % | | | | | | | | | | | | |
| Payroll and employee benefits | | | 26.1 | % | | | 32.2 | % | | | 35.5 | % | | | | | | | | | | | | |
| Occupancy and other operating costs | | | 22.0 | % | | | 22.1 | % | | | 37.2 | % | | | | | | | | | | | | |
| Total restaurant operating costs | | | 77.3 | % | | | 82.9 | % | | | 98.8 | % | | | | | | | | | | | | |
| Advertising as a % of company-operated revenue | | | 5.3 | % | | | 6.1 | % | | | 3.1 | % | | | | | | | | | | | | |
37
CKE RESTAURANTS, INC. AND SUBSIDIARIES
Management’s Discussion and Analysis — (Continued)
(Dollars in thousands)
| | | | | | | | | | | | | | | | | | | | | | | | | |
| | | Fourth Quarter Fiscal 2006 | |
| | | Carl’s Jr. | | | Hardee’s | | | La Salsa | | | Other(A) | | | Eliminations(B) | | | Total | |
| |
| Company-operated revenue | | $ | 135,133 | | | $ | 131,025 | | | $ | 10,265 | | | $ | 80 | | | $ | — | | | $ | 276,503 | |
| | | | | | | | | | | | | | | | | | | | | | | | | |
| Restaurant operating costs: | | | | | | | | | | | | | | | | | | | | | | | | |
| Food and packaging | | | 39,403 | | | | 38,899 | | | | 2,795 | | | | 26 | | | | — | | | | 81,123 | |
| Payroll and employee benefits | | | 32,334 | | | | 43,391 | | | | 3,501 | | | | 34 | | | | — | | | | 79,260 | |
| Occupancy and other operating costs | | | 27,895 | | | | 28,333 | | | | 3,772 | | | | 24 | | | | — | | | | 60,024 | |
| | | | | | | | | | | | | | | | | | | | | | | | | |
| Total restaurant operating costs | | | 99,632 | | | | 110,623 | | | | 10,068 | | | | 84 | | | | — | | | | 220,407 | |
| | | | | | | | | | | | | | | | | | | | | | | | | |
| Franchised and licensed restaurants and other revenue: | | | | | | | | | | | | | | | | | | | | | | | | |
| Royalties | | | 6,464 | | | | 9,101 | | | | 405 | | | | 95 | | | | (18 | ) | | | 16,047 | |
| Distribution centers | | | 43,021 | | | | 4,845 | | | | — | | | | — | | | | (6 | ) | | | 47,860 | |
| Rent | | | 5,094 | | | | 1,301 | | | | — | | | | — | | | | — | | | | 6,395 | |
| Retail sales of variable interest entity | | | — | | | | — | | | | — | | | | 883 | | | | — | | | | 883 | |
| Other | | | 606 | | | | 154 | | | | 94 | | | | — | | | | — | | | | 854 | |
| | | | | | | | | | | | | | | | | | | | | | | | | |
| Total franchised and licensed restaurants and other revenue | | | 55,185 | | | | 15,401 | | | | 499 | | | | 978 | | | | (24 | ) | | | 72,039 | |
| | | | | | | | | | | | | | | | | | | | | | | | | |
| Franchised and licensed restaurants and other expenses: | | | | | | | | | | | | | | | | | | | | | | | | |
| Administrative expense (including provision for bad debts) | | | 998 | | | | 1,407 | | | | 381 | | | | — | | | | — | | | | 2,786 | |
| Distribution centers | | | 41,546 | | | | 4,883 | | | | — | | | | — | | | | — | | | | 46,429 | |
| Rent and other occupancy | | | 4,418 | | | | 1,308 | �� | | | — | | | | — | | | | — | | | | 5,726 | |
| Operating costs of variable interest entity | | | — | | | | — | | | | — | | | | 878 | | | | (6 | ) | | | 872 | |
| | | | | | | | | | | | | | | | | | | | | | | | | |
| Total franchised and licensed restaurants and other expenses | | | 46,962 | | | | 7,598 | | | | 381 | | | | 878 | | | | (6 | ) | | | 55,813 | |
| | | | | | | | | | | | | | | | | | | | | | | | | |
| Advertising | | | 6,433 | | | | 8,141 | | | | (30 | ) | | | 4 | | | | — | | | | 14,548 | |
| | | | | | | | | | | | | | | | | | | | | | | | | |
| General and administrative | | | 11,625 | | | | 19,465 | | | | 1,840 | | | | 67 | | | | — | | | | 32,997 | |
| | | | | | | | | | | | | | | | | | | | | | | | | |
| Facility action charges, net | | | 547 | | | | 2,552 | | | | 1,133 | | | | 6 | | | | — | | | | 4,238 | |
| | | | | | | | | | | | | | | | | | | | | | | | | |
| Operating income (loss) | | $ | 25,119 | | | $ | (1,953 | ) | | $ | (2,628 | ) | | $ | 19 | | | $ | (18 | ) | | $ | 20,539 | |
| | | | | | | | | | | | | | | | | | | | | | | | | |
| Company-operated same-store sales increase | | | 5.3 | % | | | 2.9 | % | | | 3.7 | % | | | | | | | | | | | | |
| Franchise-operated same-store sales increase | | | 4.3 | % | | | 2.9 | % | | | 5.1 | % | | | | | | | | | | | | |
| Company-operated same-store transaction (decrease) increase | | | (0.4 | )% | | | 0.4 | % | | | (0.5 | )% | | | | | | | | | | | | |
| Average check (actual $) | | $ | 6.41 | | | $ | 4.83 | | | $ | 10.16 | | | | | | | | | | | | | |
| Restaurant operating costs as a % of company-operated revenue: | | | | | | | | | | | | | | | | | | | | | | | | |
| Food and packaging | | | 29.2 | % | | | 29.7 | % | | | 27.2 | % | | | | | | | | | | | | |
| Payroll and employee benefits | | | 23.9 | % | | | 33.1 | % | | | 34.1 | % | | | | | | | | | | | | |
| Occupancy and other operating costs | | | 20.6 | % | | | 21.6 | % | | | 36.8 | % | | | | | | | | | | | | |
| Total restaurant operating costs | | | 73.7 | % | | | 84.4 | % | | | 98.1 | % | | | | | | | | | | | | |
| Advertising as a % of company-operated revenue | | | 4.8 | % | | | 6.2 | % | | | (0.3 | )% | | | | | | | | | | | | |
| | |
| (A) | | “Other” consists of Green Burrito and amounts that we do not believe would be proper to allocate to the operating segments. |
| |
| (B) | | “Eliminations” consists of the elimination of royalty revenues and expenses generated between Hardee’s and a variable interest entity franchisee included in our Consolidated Financial Statements. |
38
CKE RESTAURANTS, INC. AND SUBSIDIARIES
Management’s Discussion and Analysis — (Continued)
(Dollars in thousands)
Presentation of Non-GAAP Measurements
Adjusted EBITDA
Adjusted EBITDA is a non-GAAP measure used by our senior lenders under our Facility to evaluate our ability to service debt and fund capital expenditures. Adjusted EBITDA is not a recognized term under GAAP and does not purport to be an alternative to income from operations, an indicator of cash flow from operations or a measure of liquidity. As shown in the table below and defined in the Facility, Adjusted EBITDA is calculated as earnings before cumulative effect of accounting changes, discontinued operations, interest expense, income taxes, depreciation and amortization, facility action charges, impairment of goodwill and impairment of assets held for sale. Because not all companies calculate Adjusted EBITDA identically, this presentation of Adjusted EBITDA may not be comparable to similarly titled measures of other companies. Adjusted EBITDA is not intended to be a measure of free cash flow for management’s discretionary use, as it does not consider certain cash requirements such as interest expense, income taxes, debt service payments and cash costs arising from facility actions.
The Facility includes a number of financial covenants, including a current requirement that we generate a minimum Adjusted EBITDA of $125,000 on a trailing-13 period basis. In addition, our maximum annual capital expenditures are limited by the Facility, based on a sliding scale driven by our Adjusted EBITDA.
The Adjusted EBITDA amounts presented in the tables below are calculated using the definition in our Facility as of January 31, 2007. On March 27, 2007, we amended and restated our Facility. The Amended Facility modifies the definition of Adjusted EBITDA to include an adjustment for share-based compensation expense. Total share-based compensation expense was $8,368, $188 and $0 for fiscal 2007, 2006 and 2005, respectively.
| | | | | | | | | | | | | | | | | | | | | |
| | | 2007 | |
| | | Carl’s Jr. | | | Hardee’s | | | La Salsa | | | Other | | | Total | |
| |
| Net income (loss) | | $ | 52,146 | | | $ | 5,956 | | | $ | (7,255 | ) | | $ | (675 | ) | | $ | 50,172 | |
| Interest expense (income) | | | 3,991 | | | | 15,491 | | | | (17 | ) | | | 286 | | | | 19,751 | |
| Income tax expense (benefit) | | | 29,388 | | | | 6,966 | | | | (4,089 | ) | | | (366 | ) | | | 31,899 | |
| Depreciation and amortization | | | 26,328 | | | | 32,821 | | | | 3,050 | | | | 219 | | | | 62,418 | |
| Facility action charges, net | | | 664 | | | | 2,494 | | | | 5,003 | | | | 385 | | | | 8,546 | |
| | | | | | | | | | | | | | | | | | | | | |
| Adjusted EBITDA | | $ | 112,517 | | | $ | 63,728 | | | $ | (3,308 | ) | | $ | (151 | ) | | $ | 172,786 | |
| | | | | | | | | | | | | | | | | | | | | |
| | | | | | | | | | | | | | | | | | | | | |
| | | 2006 (as restated) | |
| | | Carl’s Jr. | | | Hardee’s | | | La Salsa | | | Other | | | Total | |
| |
| Net income (loss) | | $ | 77,065 | | | $ | (3,782 | ) | | $ | (6,855 | ) | | $ | 114,711 | | | $ | 181,139 | |
| Interest expense | | | 4,255 | | | | 18,641 | | | | 28 | | | | 92 | | | | 23,016 | |
| Income tax expense (benefit) | | | 1,955 | | | | — | | | | (138 | ) | | | (125,705 | ) | | | (123,888 | ) |
| Depreciation and amortization | | | 24,958 | | | | 35,473 | | | | 3,558 | | | | 166 | | | | 64,155 | |
| Facility action charges, net | | | 1,792 | | | | 4,653 | | | | 1,544 | | | | 36 | | | | 8,025 | |
| | | | | | | | | | | | | | | | | | | | | |
| Adjusted EBITDA | | $ | 110,025 | | | $ | 54,985 | | | $ | (1,863 | ) | | $ | (10,700 | ) | | $ | 152,447 | |
| | | | | | | | | | | | | | | | | | | | | |
39
CKE RESTAURANTS, INC. AND SUBSIDIARIES
Management’s Discussion and Analysis — (Continued)
(Dollars in thousands)
| | | | | | | | | | | | | | | | | | | | | |
| | | 2005 | |
| | | Carl’s Jr. | | | Hardee’s | | | La Salsa | | | Other | | | Total | |
| |
| Net income (loss) | | $ | 58,490 | | | $ | (32,750 | ) | | $ | (10,314 | ) | | $ | 2,590 | | | $ | 18,016 | |
| Discontinued operations, excluding impairment | | | — | | | | — | | | | — | | | | (252 | ) | | | (252 | ) |
| Interest expense (income) | | | 5,071 | | | | 31,510 | | | | (27 | ) | | | 194 | | | | 36,748 | |
| Income tax expense (benefit) | | | 498 | | | | 73 | | | | 2 | | | | (2,165 | ) | | | (1,592 | ) |
| Depreciation and amortization | | | 23,875 | | | | 38,782 | | | | 3,965 | | | | 171 | | | | 66,793 | |
| Facility action charges, net | | | 2,794 | | | | 7,088 | | | | 4,344 | | | | 94 | | | | 14,320 | |
| Premium on early redemption of Senior Notes | | | — | | | | 9,126 | | | | — | | | | — | | | | 9,126 | |
| Impairment of Timber Lodge | | | — | | | | — | | | | — | | | | 898 | | | | 898 | |
| | | | | | | | | | | | | | | | | | | | | |
| Adjusted EBITDA | | $ | 90,728 | | | $ | 53,829 | | | $ | (2,030 | ) | | $ | 1,530 | | | $ | 144,057 | |
| | | | | | | | | | | | | | | | | | | | | |
The following table reconciles Adjusted EBITDA (a non-GAAP measurement) to cash flows provided by operating activities (a GAAP measurement) for the fiscal years ended January 31, 2007, 2006 and 2005:
| | | | | | | | | | | | | |
| | | 2007 | | | 2006 | | | 2005 | |
| | | (as restated) | |
| |
| Cash flows provided by operating activities | | $ | 164,145 | | | $ | 116,173 | | | $ | 112,222 | |
| Interest expense | | | 19,751 | | | | 23,016 | | | | 36,748 | |
| Income tax expense (benefit) | | | 31,899 | | | | (123,888 | ) | | | (1,592 | ) |
| Premium on early redemption of Senior Notes | | | — | | | | — | | | | 9,126 | |
| Amortization of loan fees | | | (3,097 | ) | | | (3,312 | ) | | | (3,637 | ) |
| Share-based compensation expense | | | (8,308 | ) | | | (188 | ) | | | — | |
| Recovery of (provision for) losses on accounts and notes receivable | | | 192 | | | | (176 | ) | | | 1,940 | |
| Loss on sale of property and equipment, capital leases and extinguishment of debt | | | (3,449 | ) | | | (3,180 | ) | | | (9,676 | ) |
| Deferred income taxes | | | (25,961 | ) | | | 125,478 | | | | (295 | ) |
| Other non-cash charges | | | (77 | ) | | | (88 | ) | | | (79 | ) |
| Change in estimated liability for closing restaurants and estimated liability for self-insurance | | | 5,204 | | | | 13,701 | | | | 5,905 | |
| Net change in refundable income taxes | | | 4,356 | | | | (612 | ) | | | 3,366 | |
| Net change in receivables, inventories, prepaid expenses and other current assets | | | 3,739 | | | | 5,002 | | | | (1,766 | ) |
| Net change in accounts payable and other current liabilities | | | (15,608 | ) | | | 521 | | | | (8,086 | ) |
| Adjusted EBITDA from discontinued operations | | | — | | | | — | | | | 262 | |
| Net cash flows from discontinued operations | | | — | | | | — | | | | (119 | ) |
| | | | | | | | | | | | | |
| Adjusted EBITDA, including discontinued operations | | | 172,786 | | | | 152,447 | | | | 144,319 | |
| Less: Adjusted EBITDA from discontinued operations | | | — | | | | — | | | | (262 | ) |
| | | | | | | | | | | | | |
| Adjusted EBITDA | | $ | 172,786 | | | $ | 152,447 | | | $ | 144,057 | |
| | | | | | | | | | | | | |
40
CKE RESTAURANTS, INC. AND SUBSIDIARIES
Management’s Discussion and Analysis — (Continued)
(Dollars in thousands)
Fiscal 2007 Compared with Fiscal 2006 and Fiscal 2006 Compared with Fiscal 2005
Carl’s Jr.
During fiscal 2007, we opened seven and closed two company-operated restaurants, and divested 40 company-operated restaurants to franchisees; Carl’s Jr. franchisees and licensees opened 38 and closed five restaurants, and acquired 40 former company-operated restaurants. As of January 31, 2007, 2006 and 2005, the Carl’s Jr. system consisted of the following:
| | | | | | | | | | | | | | | | | | | | | | | | | | | | | | | | | | | | | | | | | |
| | | Restaurant Portfolio | | | Fiscal Year Revenue | |
| | | | | | | | | | | | 2007-2006
| | | 2006-2005
| | | | | | | | | | | | 2007-2006
| | | 2006-2005
| |
| | | 2007 | | | 2006 | | | 2005 | | | Change | | | Change | | | 2007 | | | 2006 | | | 2005 | | | Change | | | Change | |
| |
| Company | | | 393 | | | | 428 | | | | 428 | | | | (35 | ) | | | — | | | $ | 590,613 | | | $ | 574,663 | | | $ | 567,960 | | | $ | 15,950 | | | $ | 6,703 | |
| Franchised and licensed(a) | | | 694 | | | | 621 | | | | 586 | | | | 73 | | | | 35 | | | | 240,348 | | | | 228,098 | | | | 224,869 | | | | 12,250 | | | | 3,229 | |
| | | | | | | | | | | | | | | | | | | | | | | | | | | | | | | | | | | | | | | | | |
| Total | | | 1,087 | | | | 1,049 | | | | 1,014 | | | | 38 | | | | 35 | | | $ | 830,961 | | | $ | 802,761 | | | $ | 792,829 | | | $ | 28,200 | | | $ | 9,932 | |
| | | | | | | | | | | | | | | | | | | | | | | | | | | | | | | | | | | | | | | | | |
| | |
| (a) | | Includes $187,533, $179,222 and $176,304 of revenues from distribution of food, packaging and supplies to franchised and licensed restaurants in fiscal 2007, 2006 and 2005, respectively. |
Company-Operated Restaurants
Revenue from company-operated restaurants increased $15,950, or 2.8%, to $590,613 during fiscal 2007 as compared to the prior year, mainly due to increases in same-store sales of 4.9%, partially offset by the net impact of the opening of seven new company-operated restaurants, the closing of two restaurants and the divestiture of 40 restaurants to franchisees. Same-store sales were positively impacted by the successful promotion of the popular “meat-as-a-condiment” Pastrami Burger, Jalapeño Burgertm and Philly Cheesesteak Burgertm, the latest Hand-Scooped Ice Cream Shakes and Malts mint chip flavor and the introduction of the Smoked Sausage Breakfast Sandwich. AUV for the trailing-13 periods ended January 31, 2007, reached $1,440, a 7.4% increase over the prior year. During the same period, the average guest check increased by 4.3%.
Revenue from company-operated restaurants increased $6,703, or 1.2%, to $574,663 during fiscal 2006 as compared to fiscal 2005, despite the inclusion of a 53rd week in fiscal 2005. This increase resulted primarily from a 2.2% increase in same-store sales driven by a 5.6% increase in the average guest check, partially offset by a decrease in transaction counts.
41
CKE RESTAURANTS, INC. AND SUBSIDIARIES
Management’s Discussion and Analysis — (Continued)
(Dollars in thousands)
The changes in restaurant operating costs as a percent of company-operated revenue are explained as follows:
| | | | | | | | | |
| | | 2007 | | | 2006 | |
| |
| Restaurant operating costs as a percent of company-operated revenue for the prior year | | | 76.6 | % | | | 78.9 | % |
| Increase (decrease) in workers’ compensation expense | | | 0.6 | | | | (1.6 | ) |
| Decrease in labor costs, excluding workers’ compensation | | | (0.5 | ) | | | (0.4 | ) |
| Increase (decrease) in general liability expense | | | 0.2 | | | | (0.3 | ) |
| Decrease in food and packaging costs | | | (0.2 | ) | | | (0.3 | ) |
| Increase in depreciation and amortization expense | | | 0.1 | | | | 0.1 | |
| Increase in repair and maintenance expense | | | — | | | | 0.1 | |
| (Decrease) increase in utilities expense | | | (0.1 | ) | | | 0.2 | |
| (Decrease) increase in rent expense, property taxes and licenses | | | (0.1 | ) | | | 0.1 | |
| (Decrease) increase in asset retirement expense | | | (0.1 | ) | | | 0.1 | |
| Decrease in equipment lease expense | | | — | | | | (0.2 | ) |
| Other, net | | | (0.2 | ) | | | (0.1 | ) |
| | | | | | | | | |
| Restaurant operating costs as a percent of company-operated revenue for the current year | | | 76.3 | % | | | 76.6 | % |
| | | | | | | | | |
Workers’ compensation expense increased by $3,272 during fiscal 2007 as compared to fiscal 2006 due to the impact of favorable claims reserves adjustments recorded in fiscal 2006, as a result of actuarial analyses of outstanding claims reserves, that did not recur to the same extent in the current year, partially offset by the benefit of greater sales leverage and continued favorable actuarial trends in claim frequency and severity. Workers’ compensation expense decreased by $8,720 during fiscal 2006 as compared to fiscal 2005. The significant decrease in workers’ compensation expense during fiscal 2006 can be largely attributed to favorable actuarial trends related to maturation of various policy periods, within the context of a more favorable, post-reform environment.
Labor costs, excluding workers’ compensation, as a percent of company-operated revenue decreased during fiscal 2007 as compared to fiscal 2006, and in fiscal 2006 as compared to fiscal 2005, mainly due to more effective management of direct labor costs and the benefit of greater sales leverage.
General liability expense increased by $1,101 during fiscal 2007 as compared to fiscal 2006 due to the impact of favorable actuarial adjustments recorded in fiscal 2006 that did not recur to the same extent in the current year. General liability expense decreased by $1,635 during fiscal 2006 as compared with fiscal 2005 due to favorable loss development trends, which resulted in reduced actuarially estimated ultimate losses.
Food and packaging costs as a percent of company-operated revenue decreased during fiscal 2007 as compared to the prior year due primarily to decreases in the cost of several commodities such as beef, pork, poultry and cheese, which were partially offset by an increase in packaging costs and in distribution costs related to the relocation of our main distribution center. Food and packaging costs decreased as a percent of company-operated revenue in fiscal 2006 from fiscal 2005, primarily due to decreases in the cost of several commodities, including bacon, poultry, cheese and frying oil.
Utilities expense as a percent of company-operated revenue decreased during fiscal 2007 as compared to fiscal 2006 mainly due to decreases in the prices of electricity and natural gas. Utilities expense as a percent of company-operated revenue increased during fiscal 2006 as compared to fiscal 2005 mainly due to increases in the prices of electricity and natural gas.
Equipment lease expense as a percent of company-operated revenue decreased during fiscal 2006 as compared to fiscal 2005 mainly due to the expiration of certain operating leases inpoint-of-sale equipment, which was replaced with purchased equipment.
42
CKE RESTAURANTS, INC. AND SUBSIDIARIES
Management’s Discussion and Analysis — (Continued)
(Dollars in thousands)
Franchised and Licensed Restaurants
Total franchised and licensed restaurants and other revenue increased by $12,250, or 5.4%, to $240,348 in fiscal 2007, as compared to the prior year. Franchise royalties grew $3,468, or 13.2%, during fiscal 2007 as compared to fiscal 2006 due to the net increase of 73 domestic and international franchised restaurants during the trailing-13 periods ended January 31, 2007, and the impact of a 5.4% increase in franchise-operated same-store sales. Food, paper and supplies sales to franchisees increased by $8,311, or 4.6%, due to the increase in the franchise store base over the comparable prior year period, and the food purchasing volume impact of the increase in franchise same-store sales.
Total franchised and licensed restaurants and other revenue increased by $3,229, or 1.4%, to $228,098 in fiscal 2006, as compared to the prior year, despite the inclusion of a 53rd week in fiscal 2005, mainly due to an increase of $2,918, or 1.7%, in sales of food, paper and supplies to franchisees. This increase is primarily due to a net increase of 22 domestic franchised restaurants during fiscal 2006, as well as the impact of a slight increase in franchise-operated same-store sales. Franchise royalties also grew $798, or 3.1%, during fiscal 2006 due to a net increase of 35 domestic and international franchised restaurants and the increase in same store sales discussed above. Franchise fees, which are included in other franchise revenue, increased $717, or 74.1%, also due to the opening of new franchise units discussed above and the renewal of franchise agreements. Rental income decreased $1,204, or 5.4%, due to the expiration of certain leases on property we had previously sublet to franchisees. For most of these leases, the franchisees directly negotiated lease renewals with the landlord.
Total franchised and licensed operating and other expenses increased by $11,861, or 6.0%, to $208,832 in fiscal 2007, as compared to fiscal 2006. This increase is primarily due to higher distribution center costs of $11,122, or 6.4%, which can be attributed mainly to the increase in the cost of food, paper and supplies due to a corresponding increase in sales to franchisees and an increase in costs related to the relocation of our main distribution center.
Total franchised and licensed operating and other expenses increased by $3,562, or 1.8%, to $196,971 in fiscal 2006, as compared to fiscal 2005, primarily due to an increase of $2,786, or 1.6%, in the cost of food, paper and supplies sold to franchisees. Franchising administrative expense increased by $603, or 15.1%, primarily as a result of increased provision for doubtful accounts due to prior year recoveries of bad debts that did not recur in fiscal 2006.
Although not required to do so, approximately 86.8% of Carl’s Jr. franchised and licensed restaurants purchase food, paper and other supplies from us.
Hardee’s
During fiscal 2007, we opened four and closed 43 company-operated restaurants. During the same period, we also terminated our franchise agreement, leases and subleases with one franchisee and acquired 61 of their restaurants, of which we subsequently closed 19 and currently operate 42 as company-operated restaurants. During the same period, we acquired 11 restaurants from the lender of a former franchisee. Hardee’s franchisees and licensees opened 22 and closed 70 restaurants; they also divested 72 restaurants (including those divested by a lender of a former franchisee) to us, of which we closed 19. As of January 31, 2007, 2006 and 2005, the Hardee’s system consisted of the following:
| | | | | | | | | | | | | | | | | | | | | | | | | | | | | | | | | | | | | | | | | |
| | | Restaurant Portfolio | | | Fiscal Year Revenue | |
| | | | | | | | | | | | 2007-2006
| | | 2006-2005
| | | | | | | | | | | | 2007-2006
| | | 2006-2005
| |
| | | 2007 | | | 2006 | | | 2005 | | | Change | | | Change | | | 2007 | | | 2006 | | | 2005 | | | Change | | | Change | |
| |
| Company | | | 696 | | | | 663 | | | | 677 | | | | 33 | | | | (14 | ) | | $ | 634,264 | | | $ | 587,082 | | | $ | 601,068 | | | $ | 47,182 | | | $ | (13,986 | ) |
| Franchised and licensed | | | 1,210 | | | | 1,330 | | | | 1,357 | | | | (120 | ) | | | (27 | ) | | | 72,620 | | | | 74,427 | | | | 72,104 | | | | (1,807 | ) | | | 2,323 | |
| | | | | | | | | | | | | | | | | | | | | | | | | | | | | | | | | | | | | | | | | |
| Total | | | 1,906 | | | | 1,993 | | | | 2,034 | | | | (87 | ) | | | (41 | ) | | $ | 706,884 | | | $ | 661,509 | | | $ | 673,172 | | | $ | 45,375 | | | $ | (11,663 | ) |
| | | | | | | | | | | | | | | | | | | | | | | | | | | | | | | | | | | | | | | | | |
43
CKE RESTAURANTS, INC. AND SUBSIDIARIES
Management’s Discussion and Analysis — (Continued)
(Dollars in thousands)
Company-Operated Restaurants
Revenue from company-operated restaurants increased $47,182 or 8.0%, to $634,264 in fiscal 2007 from fiscal 2006. The increase is mostly due to an increase in same-store sales of 4.8% and a net increase of 33 restaurants during the fiscal year. Same-store sales in fiscal 2006 were significantly affected by three named tropical storms and hurricanes that occurred during the third fiscal quarter, which contributed to record high gasoline prices during late summer. We believe these factors had a negative impact on consumers’ discretionary spending in the prior fiscal year. AUV for the trailing-13 periods ended January 31, 2007, reached $916, an increase of 4.8% over the similar period ended January 31, 2006. During the same period, the average guest check increased by 2.7% due to the introduction of several new premium products such as our Philly Cheesesteak Thickburger, Smoked Sausage Biscuit, Jalapeño Thickburger, and our new Monster Biscuit, as well as the continued promotion of premium products such as our Hand-Scooped Ice Cream Shakes & Malts, Monster Thickburger and Loaded Breakfast Burritotm.
Revenue from company-operated Hardee’s restaurants decreased $13,986, or 2.3%, to $587,082 in fiscal 2006 from fiscal 2005, primarily due to the inclusion of a 53rd week in fiscal 2005, a net decrease of 14 restaurants and to a reduction of 0.2% in same-store sales.
The changes in restaurant operating costs as a percent of company-operated revenue are explained as follows:
| | | | | | | | | |
| | | 2007 | | | 2006 | |
| |
| Restaurant operating costs as a percent of company-operated revenue for the prior year | | | 84.5 | % | | | 85.7 | % |
| Decrease in labor costs, excluding workers’ compensation | | | (1.0 | ) | | | (0.2 | ) |
| Decrease in food and packaging costs | | | (0.9 | ) | | | (0.3 | ) |
| Decrease in depreciation and amortization expense | | | (0.7 | ) | | | (0.3 | ) |
| (Decrease) increase in rent expense, property taxes and licenses | | | (0.4 | ) | | | 0.1 | |
| Increase (decrease) in workers’ compensation expense | | | 0.3 | | | | (0.7 | ) |
| Increase (decrease) in general liability expense | | | 0.3 | | | | (0.4 | ) |
| (Decrease) increase in utilities expense | | | (0.1 | ) | | | 0.4 | |
| Other, net | | | (0.1 | ) | | | 0.2 | |
| | | | | | | | | |
| Restaurant operating costs as a percent of company-operated revenue for the current year | | | 81.9 | % | | | 84.5 | % |
| | | | | | | | | |
Labor costs, excluding workers’ compensation, decreased as a percent of company-operated revenue in fiscal 2007 as compared to fiscal 2006 primarily due to the benefit of greater sales leverage. Labor costs, excluding workers’ compensation, decreased as a percent of company-operated revenue in fiscal 2006 as compared to fiscal 2005 mainly due to the benefit of adjustments to our labor management system that were designed to use labor more efficiently, partially offset by the impact of a slight decrease in same-store sales.
Food and packaging costs as a percent of company-operated revenue decreased during fiscal 2007 as compared to fiscal 2006 partially due to reduced costs for beef, pork, poultry and cheese. These reductions were partially offset by slightly higher packaging costs and increased vending expenses due to the reopening of two toll road restaurants with company-operated gift shops. Food and packaging costs as a percent of company-operated revenue decreased in fiscal 2006, as compared to fiscal 2005, partially due to reduced costs for pork, cheese and frying oil, as well as a rebate of food costs that we received from our major supplier that resulted from a reconciliation of pricing differences.
Depreciation and amortization expense as a percent of company-operated revenue decreased during fiscal 2007 as compared to fiscal 2006 primarily due to the expiration of certain equipment capital leases during fiscal
44
CKE RESTAURANTS, INC. AND SUBSIDIARIES
Management’s Discussion and Analysis — (Continued)
(Dollars in thousands)
2006, as well as the continued use of certain fully depreciated assets and the benefit of greater sales leverage, partially offset by additional depreciation related to the purchase of 36 restaurant locations in March 2006. Depreciation expense decreased in fiscal 2006, as compared to fiscal 2005, due to the expiration of certainpoint-of-sale equipment capital leases during fiscal 2006, as well as the continued use of certain fully depreciated assets, partially offset by increased depreciation for new company-operated restaurants and the impact of a slight reduction in same-store sales.
Rent, property taxes and license expense decreased as a percent of company-operated revenue in fiscal 2007, as compared to fiscal 2006, primarily due to the March 2006 purchase of 36 restaurant locations that we had previously leased from a commercial lessor and, to a lesser extent, the benefit of greater sales leverage.
Workers’ compensation expense increased by $2,032 during fiscal 2007 as compared to fiscal 2006 due to the impact of favorable claims reserves adjustments recorded in the prior year, as a result of actuarial analyses of outstanding claims reserves, which did not recur to the same extent in the current year. The impact of these increases was partially offset by the benefit of greater sales leverage during the current year. Workers’ compensation expense decreased by $4,091 in fiscal 2006, as compared to fiscal 2005, mainly due to favorable loss development trends which resulted in reduced actuarially estimated ultimate losses.
General liability expense increased by $2,145 during fiscal 2007 as compared to fiscal 2006 due to the impact of favorable actuarial adjustments recorded in fiscal 2006 that did not recur to the same extent in the current year. General liability expense decreased by $2,638 during fiscal 2006 as compared with fiscal 2005 due to favorable loss development trends, which resulted in reduced actuarially estimated ultimate losses.
Utilities expense as a percent of company-operated revenue decreased during fiscal 2007 as compared to fiscal 2006 mostly due to the benefit of greater sales leverage and the normalization of rates that had spiked in fiscal 2006 after Hurricane Katrina. Utilities expense increased as a percent of company-operated revenue in fiscal 2006, as compared to fiscal 2005, due mainly to higher prices for natural gas and electricity.
Franchised and Licensed Restaurants
Total franchised and licensed restaurants and other revenue decreased $1,807, or 2.4%, to $72,620 during fiscal 2007 as compared to fiscal 2006. The decrease is primarily due to a $7,463, or 30.5%, decrease in distribution center revenues related to reduced franchise remodel activity in the current fiscal year and the ice cream equipment rollout in the prior year, partially offset by franchise royalties, which increased by $5,496, or 13.1%, and franchise rental income, which increased $305, or 4.3%. The increase in royalty revenue is mainly due to a 4.3% increase in franchise-operated same-store sales and greater collections of previously unrecognized royalties, partially offset by the reduction in the number of franchise restaurants discussed above. During fiscal 2007, we collected $4,747 of previously unrecognized royalties from significantly past due franchisees, compared to $1,621 of collections in the prior year. We expect minimal collections of previously unrecognized royalties in fiscal 2008. The increase in rental income is primarily due to collection of previously unrecognized rental income, partially offset by a decrease due to the termination of a franchise agreement with a franchisee that had previously leased ten of our owned locations and subleased 51 of our leased locations.
Total franchised and licensed restaurants and other revenue increased $2,323, or 3.2%, in fiscal 2006 from fiscal 2005. The increase was primarily due to a $6,277, or 34.5%, increase in distribution center revenues related to equipment sales to franchisees and increased franchise remodel activity, partially offset by franchise royalties, which decreased by $1,364, or 3.1%, and franchise rental income, which decreased $2,864, or 28.7%. The $1,364 decrease in royalty revenue was primarily due to a reduction in the number of franchise restaurants and a 2.2% decline in domestic franchise-operated same-store sales, partially offset by an increase in international royalties. The decrease in rental income was primarily due a $2,144 reduction in rent collections from financially troubled
45
CKE RESTAURANTS, INC. AND SUBSIDIARIES
Management’s Discussion and Analysis — (Continued)
(Dollars in thousands)
franchisees during fiscal 2006 and the expiration of certain leases on property we previously sublet to franchisees that are now leased directly from the landlord.
Total franchised and licensed restaurants and other expenses decreased by $8,765, or 24.3%, to $27,293 in fiscal 2007, as compared to fiscal 2006, mainly due to a decrease of $7,090, or 28.4%, in the cost of equipment sales as the result of a corresponding decrease in equipment sales to franchisees and the closure of several franchise restaurant locations. Decreases of $842, or 14.1%, in rent expense and $833, or 16.1%, in administrative expenses also contributed to the reduction in franchising expense.
Total franchised and licensed restaurants and other expenses increased by $6,381, or 21.5%, to $36,058 in fiscal 2006, as compared to fiscal 2005, primarily due to an increase of $6,551, or 35.6%, in the cost of equipment sold to franchisees, which was a direct result of the increased distribution center revenues.
La Salsa
During fiscal 2007, we opened two and closed six company-operated restaurants; during the same period La Salsa franchisees and licensees opened two and closed four restaurants. As of January 31, 2007, 2006 and 2005, the La Salsa system consisted of the following:
| | | | | | | | | | | | | | | | | | | | | | | | | | | | | | | | | | | | | | | | | |
| | | Restaurant Portfolio | | | Fiscal Year Revenue | |
| | | | | | | | | | | | 2007-2006
| | | 2006-2005
| | | | | | | | | | | | 2007-2006
| | | 2006-2005
| |
| | | 2007 | | | 2006 | | | 2005 | | | Change | | | Change | | | 2007 | | | 2006 | | | 2005 | | | Change | | | Change | |
| |
| Company | | | 55 | | | | 59 | | | | 62 | | | | (4 | ) | | | (3 | ) | | $ | 44,460 | | | $ | 47,277 | | | $ | 46,950 | | | $ | (2,817 | ) | | $ | 327 | |
| Franchised and licensed | | | 41 | | | | 43 | | | | 39 | | | | (2 | ) | | | 4 | | | | 1,879 | | | | 1,879 | | | | 1,844 | | | | — | | | | 35 | |
| | | | | | | | | | | | | | | | | | | | | | | | | | | | | | | | | | | | | | | | | |
| Total | | | 96 | | | | 102 | | | | 101 | | | | (6 | ) | | | 1 | | | $ | 46,339 | | | $ | 49,156 | | | $ | 48,794 | | | $ | (2,817 | ) | | $ | 362 | |
| | | | | | | | | | | | | | | | | | | | | | | | | | | | | | | | | | | | | | | | | |
Revenue from company-operated La Salsa restaurants decreased $2,817, or 6.0%, during fiscal 2007 as compared to the prior year, primarily due to the impact of closing six company-operated restaurants, partially offset by 1.2% increase in company-operated same-store sales, resulting from the net impact of a 6.8% increase in average guest check and a 4.5% decrease in transaction counts, and the opening of two new company-operated restaurants.
Revenue from company-operated La Salsa restaurants increased $327, or 0.7%, during fiscal 2006 as compared to the prior year, despite the inclusion of a 53rd week in fiscal 2005, primarily due to a 2.6% increase in company-operated same-store sales, partially offset by the impact of closing three company-operated restaurants. The increase in same-store sales resulted primarily from a 5.2% increase in the average guest check, partially offset by a 1.7% decrease in transaction counts.
Restaurant operating costs as a percent of company-operated revenue were 93.5% and 95.0% for fiscal 2007 and fiscal 2006, respectively. Food and packaging costs decreased by 1.0% as a percent of company-operated revenue for fiscal 2007 as compared to fiscal 2006 primarily due to reduced costs for dairy, avocado and seafood products. Payroll and employee benefits remained flat as a percent of company-operated revenue for fiscal 2007. Occupancy and other costs decreased 0.5% as a percent of company-operated revenue for fiscal 2007 as compared to fiscal 2006, mainly due to lower depreciation and asset retirement expense.
Restaurant operating costs as a percent of company-operated revenue were 95.0% and 97.6% for fiscal 2006 and fiscal 2005, respectively. Operating costs decreased by 1.7% as a percent of company-operated revenue due to reduced depreciation and amortization expense that resulted from the impairment of 16 La Salsa restaurants during fiscal 2006. Workers’ compensation and general liability expenses decreased 1.6% as a percent of company-operated revenue as a result of favorable actuarial claims development trends. Since our company-operated La Salsa restaurants are located predominantly in California, our workers’ compensation expense was favorably impacted by California legislative reform. These cost reductions were partially offset by a 0.4% increase in asset retirement expense due to the retirement of certainpoint-of-sale equipment.
46
CKE RESTAURANTS, INC. AND SUBSIDIARIES
Management’s Discussion and Analysis — (Continued)
(Dollars in thousands)
Consolidated Expenses
Consolidated Variable Interest Entities
We consolidate the results of one franchise variable interest entity (“VIE”), which operates five Hardee’s restaurants. We do not possess any ownership interest in the franchise VIE. Retail sales and operating expenses of the franchise VIE are included within franchised and licensed restaurants and other. The assets and liabilities of, and minority interest in, this entity are included in our accompanying Consolidated Balance Sheets, and are not significant to our consolidated financial position. The results of operations of this entity are included within our accompanying Consolidated Statements of Income and are not significant to our consolidated results of operations. The minority interest in the income or loss of this franchise entity is classified in other income (expense), net, in our accompanying Consolidated Statements of Income, and in other long-term liabilities in the accompanying Consolidated Balance Sheets. We have no rights to the assets, nor do we have any obligation with respect to the liabilities, of this franchise entity. None of our assets serve as collateral for the creditors of this franchisee or any of our other franchisees. (See Note 1 of Notes to Consolidated Financial Statements for further discussion of the franchise VIE.)
We also consolidate the Hardee’s cooperative advertising funds, which consist of the Hardee’s National Advertising Fund and approximately 82 local advertising cooperative funds because we have determined we are the primary beneficiaries of these funds. Each of these funds is a separate non-profit association with all the proceeds segregated and managed by a third-party accounting service company. The group of funds has been reported in our accompanying Consolidated Balance Sheets as advertising fund assets, restricted, and advertising fund liabilities within current assets and current liabilities, respectively. The funds are reported as of the latest practicable date, which is the last day of the calendar quarter immediately preceding the balance sheet date.
Advertising Expense
Advertising expense increased $1,289, or 1.8%, to $72,253 in fiscal 2007 from fiscal 2006. Advertising expense, as a percent of company-operated revenue, decreased by 0.2% to 5.7% in fiscal 2007 as compared to fiscal 2006. Advertising expense decreased $875, or 1.2%, to $70,964 during fiscal 2006 from fiscal 2005. Advertising expense, as a percent of company-operated revenue, remained constant at 5.9% in fiscal 2006 as compared to fiscal 2005.
General and Administrative Expenses
General and administrative expenses increased $9,213, or 6.5%, to $150,315 in fiscal 2007 from fiscal 2006. This increase was mainly due to an increase of $8,180 in share-based compensation expense, as a result of the adoption of SFAS 123R and issuance of additional options and awards; higher management bonus expense of $4,650, based on our performance relative to executive management and operations bonus criteria; increased information technologies expense primarily related to higher consulting fees related to various systems implementations and upgrades; increases in our accrued liability for litigation; and increases in professional services and various other expenses. These increases were partially offset by the fact that general and administrative expenses for fiscal 2006 included $11,000 to purchase and retire the outstanding options of our retired Chairman of the Board of Directors, and there was no comparable expense in the current year period. General and administrative expenses were 9.5% of total revenue in fiscal 2007, as compared to 9.3% in fiscal 2006.
General and administrative expenses increased $2,386 or 1.7% to $141,102 during fiscal 2006, as compared to the prior fiscal year. This increase is primarily due to an $11,000 charge incurred in fiscal 2006 to purchase and cancel the options of our former Chairman, partially offset by the impact of legal settlement charges incurred during fiscal 2005 that did not recur in fiscal 2006. General and administrative expenses were 9.3% of total revenue in fiscal 2006, as compared to 9.1% in fiscal 2005.
47
CKE RESTAURANTS, INC. AND SUBSIDIARIES
Management’s Discussion and Analysis — (Continued)
(Dollars in thousands)
Facility Action Charges
Facility action charges arise from closure of company-operated restaurants, sublease of closed facilities at amounts below our primary lease obligation, impairment of long-lived assets to be disposed of or held and used, gains or losses upon disposal of surplus property, and discount amortization for obligations related to closed or subleased facilities to their future costs.
Net facility action charges increased $521 or 6.5%, to $8,546 during fiscal 2007, as compared to the prior fiscal year. The increase is mainly due to an increase of $2,615 in new decisions to close restaurants, of which $1,948 relates to Hardee’s restaurants that we acquired from a terminated franchisee and subsequently decided to close; an increase in unfavorable dispositions of surplus properties of $1,087; and an increase in asset impairments of $453, which were mostly offset by an increase in gains on sales of closed restaurants of $3,459.
Facility action charges decreased $6,295 or 44.0%, to $8,025 during fiscal 2006, as compared to the prior fiscal year. The decrease was primarily due to a $4,290 reduction in charges required to establish liabilities for remaining lease payments for Hardee’s restaurants that closed during fiscal 2006 as compared to fiscal 2005. In addition, asset impairment charges decreased by $3,708 in fiscal 2006 as compared to fiscal 2005, primarily as a result of lower impairments at Carl’s Jr. and La Salsa. The foregoing decreases were partially offset by a decrease of $1,621 in favorable dispositions of closed restaurants, as there were fewer previously closed restaurants to be disposed of.
See Note 5 of Notes to Consolidated Financial Statements included herein for additional detail of the components of facility action charges.
Interest Expense
Interest expense for fiscal 2007, 2006 and 2005 was as follows:
| | | | | | | | | | | | | |
| | | 2007 | | | 2006 | | | 2005 | |
| |
| Facility | | $ | 6,895 | | | $ | 7,522 | | | $ | 6,310 | |
| Senior subordinated notes due 2009 | | | — | | | | — | | | | 7,855 | |
| Capital lease obligations | | | 5,665 | | | | 6,257 | | | | 6,950 | |
| 2004 convertible subordinated notes | | | — | | | | — | | | | 73 | |
| 2023 convertible subordinated notes | | | 2,553 | | | | 4,200 | | | | 4,258 | |
| Amortization of loan fees | | | 3,096 | | | | 3,312 | | | | 3,637 | |
| Write-off of unamortized loan fees, term loan due July 2, 2008 | | | 242 | | | | 500 | | | | 1,452 | |
| Write-off of unamortized loan fees, term loan repaid June 2, 2004 | | | — | | | | — | | | | 664 | |
| Write-off of unamortized loan fees, senior subordinated notes due 2009 | | | — | | | | — | | | | 3,068 | |
| Letter of credit fees and other | | | 1,300 | | | | 1,225 | | | | 2,481 | |
| | | | | | | | | | | | | |
| Total interest expense | | $ | 19,751 | | | $ | 23,016 | | | $ | 36,748 | |
| | | | | | | | | | | | | |
The decrease from 2006 to 2007 was primarily due to lower average borrowings, further reduction of our capital lease obligations and the conversion of a significant portion of our 2023 Convertible Notes into shares of our common stock during fiscal year 2007.
The decrease from 2005 to 2006 was primarily due to lower average borrowings, lower interest rates upon refinancing our Senior Notes with a lower cost bank term loan, and further amortization of our capital lease obligations, as well as the write-off in fiscal 2005 of unamortized loan fees related to our Senior Notes, for which there was no comparable write-off in fiscal 2006.
48
CKE RESTAURANTS, INC. AND SUBSIDIARIES
Management’s Discussion and Analysis — (Continued)
(Dollars in thousands)
Conversion Inducement Expense
During fiscal 2007, we recorded conversion inducement expense of $6,406 as a result of payments made, in response to unsolicited offers, to induce the holders of $89,833 of our 2023 Convertible Notes to convert their notes into 10,224,424 shares of our common stock, respectively. No comparable expense was recorded during fiscal 2006 or 2005, and we do not expect to incur comparable conversion inducement expense in future periods.
Other Income (Expense), Net
Other income (expense), net, consists of the following:
| | | | | | | | | | | | | |
| | | Fiscal Year Ended January 31, | |
| | | 2007 | | | 2006 | | | 2005 | |
| |
| Premium incurred upon early redemption of debt | | $ | — | | | $ | — | | | $ | (9,126 | ) |
| Interest income on notes receivable from franchisees, disposition properties and capital leases | | | 1,042 | | | | 1,116 | | | | 1,784 | |
| Rental income from properties leased to third parties, net | | | 1,813 | | | | 1,352 | | | | 2,060 | |
| Other, net | | | 881 | | | | (81 | ) | | | 2,320 | |
| | | | | | | | | | | | | |
| Total other income (expense), net | | $ | 3,736 | | | $ | 2,387 | | | $ | (2,962 | ) |
| | | | | | | | | | | | | |
Income Taxes
We recorded income tax expense for the fiscal year ended January 31, 2007 of $31,899, which is comprised of current provisions for foreign income taxes of $1,124 and federal and state income taxes of $4,814, and a deferred tax provision of $25,961. During the fourth quarter of fiscal 2007, we determined that we would more likely than not realize future tax benefits from certain of our deferred tax assets for which we previously maintained a valuation allowance. This determination was based on a number of factors, including our ability, for the first time in several years, to utilize more foreign tax credits than we generated in fiscal 2007 and our projected future foreign source income. As a result of our analysis, we reduced our valuation allowance by $4,884 at January 31, 2007, resulting in a net deferred tax asset of $109,779.
We recorded income tax benefit for the fiscal year ended January 31, 2006 of $123,888, which is comprised of current provisions for foreign income taxes of $905 and federal and state income taxes of $685, and a benefit from deferred taxes of $125,478, as restated. During the fourth quarter of fiscal 2006, after considering a number of factors, including a three-year history of cumulative earnings, expected utilization of net operating loss (“NOL”) carryforwards in fiscal 2006, and estimated taxable income in future years, we determined we would more likely than not realize substantial future tax benefits from our deferred tax assets. As a result of this analysis, we reduced our valuation allowance by $159,959 at January 31, 2006, resulting in a net deferred tax asset of $135,740, as restated. Of the total tax benefit from the reversal of the valuation allowance, $11,971 was recorded to additional paid-in capital for the tax benefit from the exercise of stock options during both the current and prior years. We generated income for tax purposes during fiscal 2006, before utilization of NOL carryforwards.
Our effective rate differs from the federal statutory rate primarily as a result of changes in our valuation allowance, the impact of state income taxes and certain expenses that are nondeductible for income tax purposes. During fiscal 2008, we expect our effective tax rate to be approximately 40%. As a result of our income tax credit carryforwards and expected reversals of temporary differences, we expect that our cash requirements for U.S. federal and state income taxes will be approximately 15% to 20% of our taxable earnings in fiscal 2008. This rate results primarily from U.S. federal tax reduced by available alternative minimum tax (“AMT”) and general business tax credits.
49
CKE RESTAURANTS, INC. AND SUBSIDIARIES
Management’s Discussion and Analysis — (Continued)
(Dollars in thousands)
Our actual cash requirements for income taxes could vary significantly from our expectations for a number of reasons, including, but not limited to, unanticipated fluctuations in our deferred tax assets and liabilities, unexpected gains from significant transactions, unexpected outcomes of income tax audits, and changes in tax law. We expect to continue to incur foreign taxes on our income earned outside the U.S., which we expect to result in a credit against our U.S. federal income tax liability.
During fiscal 2007, we utilized all of our federal NOL carryforwards and a portion of our federal tax credit carryforwards. At January 31, 2007, we have federal AMT credit, general business tax credit and foreign tax credit carryforwards of approximately $18,446. Our AMT credits will be carried forward until utilized, and our general business tax credits and foreign tax credits would expire, if unused, in varying amounts in the years 2012 through 2027. At January 31, 2007, we have state NOL carryforwards in the amount of approximately $329,207, which expire in varying amounts in the years 2008 through 2027. As of January 31, 2007, we have recognized $859 of net deferred tax assets related to our state NOL carryforwards, which represents our expected future tax savings from such NOL carryforwards.
We have recognized a net deferred tax asset of $109,779 as of January 31, 2007, which resulted from our net deferred tax assets and valuation allowance of approximately $137,036 and $27,257, respectively.
Fiscal Fourth Quarter 2007 Compared with Fiscal Fourth Quarter 2006
Carl’s Jr.
Company-Operated Restaurants
Company-operated restaurant revenue decreased by $2,092, or 1.5%, for the fourth quarter of fiscal 2007 as compared to the fourth quarter of fiscal 2006, due mainly to the divestiture of 40 company-operated restaurants to franchisees. This decrease was partially offset by the addition of two company-operated restaurants and a 2.8% increase in same-store sales.
The changes in the restaurant operating costs as a percent of company-operated revenue from the fiscal fourth quarter 2006 to the fiscal fourth quarter 2007 are explained as follows:
| | | | | |
| Restaurant operating costs as a percent of company-operated revenue for the prior year | | | 73.7 | % |
| Increase in workers’ compensation expense | | | 2.7 | |
| Increase in depreciation and amortization expense | | | 0.6 | |
| Increase in general liability insurance expense | | | 0.5 | |
| Decrease in utilities expense | | | (0.5 | ) |
| Increase in rent and property taxes | | | 0.4 | |
| Decrease in labor costs, excluding workers’ compensation | | | (0.4 | ) |
| Increase in banking expenses | | | 0.1 | |
| Increase in equipment lease expense | | | 0.1 | |
| Increase in repairs and maintenance expense | | | 0.1 | |
| | | | | |
| Restaurant operating costs as a percent of company-operated revenue for the current year | | | 77.3 | % |
| | | | | |
Workers’ compensation expense increased by $3,578 during the fourth quarter of fiscal 2007 as compared to the fourth quarter of fiscal 2006, due to the impact of a favorable claims reserves adjustment recorded in the prior year period, as a result of a quarterly actuarial analysis of outstanding claims reserves, that did not recur to the same extent in the current year period, partially offset by the benefit of sales leverage and continued favorable actuarial trends in claim frequency and severity.
50
CKE RESTAURANTS, INC. AND SUBSIDIARIES
Management’s Discussion and Analysis — (Continued)
(Dollars in thousands)
Depreciation expense increased as a percent of company-operated revenue during the fourth quarter of fiscal 2007 as compared to the fourth quarter of fiscal 2006 primarily due to the addition of new assets related to the rollout of new POS software and related hardware and the addition of new assets for newly opened and newly remodeled restaurants.
General liability expense increased by $614 or 0.5% as a percent of company-operated revenue during the fourth quarter of fiscal 2007 as compared to fiscal 2006 as a result of favorable actuarial adjustments recorded in the prior year period that did not recur to the same extent in the current year period.
Utilities expense as a percent of company-operated revenue decreased during the fourth quarter of fiscal 2007 as compared to the fourth quarter of fiscal 2006 mainly due to decreases in the prices of electricity and natural gas.
Rent and property tax expense increased as a percent of company-operated revenue in the fourth quarter of fiscal 2007 as compared to fiscal 2006, primarily due to rental rate increases resulting from Consumer Price Index related rental adjustments.
Labor costs, excluding workers’ compensation, as a percent of company-operated revenue decreased during the fourth quarter of fiscal 2007 compared to fiscal 2006, mainly due to more effective management of direct labor costs and the benefit of greater sales leverage.
Banking expenses increased as a percent of company-operated revenue in the fourth quarter of fiscal 2007 from the fourth quarter of fiscal 2006 primarily due to increased credit card usage by our guests during the fourth quarter of fiscal 2007.
Franchised and Licensed Restaurants
Total franchised and licensed restaurants and other revenue increased $746, or 1.4%, in the fourth quarter of fiscal 2007 from the comparable fiscal 2006 period primarily due to an increase of $750, or 11.6%, in royalties received from franchisees and licensees due to new franchised and licensed restaurants coupled with an increase in AUV. Food, paper and supplies sales to franchisees increased by $311, or 0.7%, due to the increase in the franchise store base over the comparable prior year period, and the food purchasing volume impact of the increase in franchise same-store sales.
Total franchised and licensed restaurants and other expenses increased $1,896, or 4.0%, in the fourth quarter of fiscal 2007 from the comparable fiscal 2006 period due primarily to an increase in distribution center costs of $1,699, or 4.1%, which can be attributed mainly to increases in the cost of food, paper and supplies as a result of a corresponding increase in sales to franchisees and an increase in costs related to the relocation of our main distribution center.
Hardee’s
Company-Operated Restaurants
Revenue from company-operated restaurants increased $14,005 or 10.7%, in the fourth quarter of fiscal 2007 compared to the fourth quarter of fiscal 2006. $9,467 of this increase arose as a result of the net increase in the number of company-operated restaurants from prior year and a 4.8% increase in same-store sales.
51
CKE RESTAURANTS, INC. AND SUBSIDIARIES
Management’s Discussion and Analysis — (Continued)
(Dollars in thousands)
The changes in the restaurant operating costs as a percent of company-operated revenue from the fiscal fourth quarter 2006 to the fiscal fourth quarter 2007 are explained as follows:
| | | | | |
| Restaurant operating costs as a percent of company-operated revenue | | | 84.4 | % |
| Increase in general liability insurance expense | | | 1.4 | |
| Decrease in labor costs, excluding workers’ compensation | | | (1.2 | ) |
| Decrease in food and packaging costs | | | (1.1 | ) |
| Decrease in utilities expense | | | (0.7 | ) |
| Decrease in rent and property taxes | | | (0.5 | ) |
| Decrease in depreciation and amortization expense | | | (0.5 | ) |
| Increase in repair and maintenance expense | | | 0.4 | |
| Increase in asset retirement expense | | | 0.3 | |
| Increase in workers’ compensation expense | | | 0.3 | |
| Other, net | | | 0.1 | |
| | | | | |
| Restaurant operating costs as a percent of company-operated revenue for the current year | | | 82.9 | % |
| | | | | |
General liability expense increased by $1,970 during the fourth quarter of fiscal 2007 as compared to the fourth quarter of fiscal 2006 as a result of favorable actuarial adjustments recorded in the prior year period that did not recur to the same extent in the current year period.
Labor costs, excluding workers’ compensation, decreased as a percent of company-operated revenue in the fourth quarter of fiscal 2007 as compared to the fourth quarter of fiscal 2006 mainly due to the benefit of greater sales leverage.
Food and packaging costs as a percent of company-operated revenue decreased in the fourth quarter of fiscal 2007 as compared to the fourth quarter of fiscal 2006 primarily due to reduced costs for beef, pork, poultry and cheese.
Utilities expense as a percent of company-operated revenue decreased in the fourth quarter of fiscal 2007 as compared to the fourth quarter of fiscal 2006 mostly due to the benefit of greater sales leverage and the normalization of rates that had spiked in fiscal 2006 after Hurricane Katrina.
Rent and property tax expense as a percent of company-operated revenue decreased in the fourth quarter of fiscal 2007 as compared to the fourth quarter of fiscal 2006 due to the March 2006 purchase of 36 restaurant locations that had previously been leased from a commercial lessor and the benefit of greater sales leverage.
Depreciation and amortization expense as a percent of company-operated revenue decreased in the fourth quarter of fiscal 2007 as compared to the fourth quarter of fiscal 2006 primarily due to the expiration of certain equipment capital leases during fiscal 2006, as well as the continued use of certain fully depreciated assets and the benefit of greater sales leverage, partially offset by additional depreciation related to the purchase of 36 restaurant locations in March 2006.
Repair and maintenance costs increased as a percent of company-operated revenue in the fourth quarter of fiscal 2007 as compared to the fourth quarter of fiscal 2006 mainly due to higher repairs and maintenance costs for the restaurants acquired in connection with the termination of a franchise agreement. There were also higher maintenance costs for a new POS system support contract, while no similar costs were incurred during the same prior year period.
Asset retirement expense as a percent of company-operated revenue increased in the fourth quarter of fiscal 2007 as compared to the fourth quarter of fiscal 2006 mainly due to increased write-offs for a restaurant that closed
52
CKE RESTAURANTS, INC. AND SUBSIDIARIES
Management’s Discussion and Analysis — (Continued)
(Dollars in thousands)
during the quarter so that it could be demolished and rebuilt in early fiscal 2008. There were no similar costs in the prior year period.
Workers’ compensation expense increased by $518 during the fourth quarter of fiscal 2007 as compared to the fourth quarter of fiscal 2006, due to the impact of a favorable claims reserves adjustment recorded in the prior year period, as a result of a quarterly actuarial analysis of outstanding claims reserves, that did not recur to the same extent in the current year period, partially offset by the benefit of greater sales leverage and continued favorable actuarial trends in claim frequency and severity.
Franchised and Licensed Restaurants
Total franchised and licensed restaurants and other revenue decreased by $1,037, or 6.7%, in the fourth quarter of fiscal 2007 from the fourth quarter of fiscal 2006 as a result of a $1,381, or 28.5%, decrease in distribution center revenues related to reduced franchise remodel activity in the current fiscal year and the ice cream equipment rollout in the prior year, partially offset by franchise royalties, which increased by $375, or 4.1%.
Total franchised and licensed restaurants and other expenses decreased $1,800 or 23.7% during the fourth quarter of fiscal 2007 from the fourth quarter of fiscal 2006 primarily due to a $1,265, or 25.9%, decrease in the cost of equipment sales due to a corresponding decrease in equipment sales and the closure of several franchised restaurant locations.
La Salsa
Revenue from company-operated La Salsa restaurants decreased $916, or 8.9%, during the fourth quarter of fiscal 2007 as compared to the prior year quarter, primarily due to the impact of a reduction in the number of company-operated restaurants and a slight decrease in same-store sales.
La Salsa restaurant operating costs as a percent of company-operated revenue increased to 98.8% in the fourth quarter of fiscal 2007, from 98.1% in the fourth quarter of fiscal 2006. Payroll and employee benefits costs increased 1.4% as a percent of company-operated revenue due to an increase in worker’s compensation costs as a result of a favorable claims reserve adjustment recorded in the prior year period, as a result of a quarterly actuarial analysis of outstanding claims reserves that did not recur to the same extent in the current year period, offset by a reduction in direct labor and associated employee benefit costs. Occupancy and other operating costs increased 0.4% as a percent of company-operated revenue due to increases in general and liability insurance, utility rates and repairs and maintenance costs, partially offset by a reduction in depreciation expense. These cost increases were offset by a 1.1% decrease in food and packaging costs, as a percent of company-operated revenue, due to reduced costs for dairy, poultry and avocados.
Accounting Pronouncements Not Yet Adopted
In February 2006, the FASB issued SFAS 155,Accounting for Certain Hybrid Financial Instruments — an amendment of FASB Statements No. 133 and 140.SFAS 155 allows financial instruments that contain an embedded derivative and that otherwise would require bifurcation to be accounted for as a whole on a fair value basis, at the holders’ election. SFAS 155 also clarifies and amends certain other provisions of SFAS 133,Accounting for Derivative Instruments and Hedging Activities and SFAS 140,Accounting for Transfers and Servicing of Financial Assets and Extinguishments of Liabilities — a replacement of FASB Statement 125. This statement is effective for all financial instruments acquired or issued in fiscal years beginning after September 15, 2006, which for us is the beginning of fiscal 2008. We are currently evaluating the impact of SFAS 155 on our consolidated financial position and results of operations.
In March 2006, the FASB issued SFAS 156,Accounting for Servicing of Financial Assets — an amendment of FASB Statement No. 140.SFAS 156 provides guidance on the accounting for servicing assets and liabilities when an
53
CKE RESTAURANTS, INC. AND SUBSIDIARIES
Management’s Discussion and Analysis — (Continued)
(Dollars in thousands)
entity undertakes an obligation to service a financial asset by entering into a servicing contract. This statement is effective for all transactions in fiscal years beginning after September 15, 2006, which for us is the beginning of fiscal 2008. We are currently evaluating the impact of SFAS 156 on our consolidated financial position and results of operations.
In June 2006, the FASB issued FIN 48,Accounting for Uncertainty in Income Taxes — an interpretation of FASB Statement No. 109, which clarifies the accounting for uncertainty in income taxes recognized in financial statements. FIN 48 prescribes a recognition threshold and measurement attribute for the financial statement recognition and measurement of a tax position taken or expected to be taken in a tax return. FIN 48 requires the recognition, in the financial statements, of the impact of a tax position, if that position is more likely than not of being sustained on audit, based on the technical merits of the position. FIN 48 also provides guidance on derecognition, classification, interest and penalties, accounting in interim periods and disclosure. FIN 48 is effective for fiscal years beginning after December 15, 2006, which for us is the beginning of fiscal 2008. We are currently evaluating the impact of FIN 48 on our consolidated financial position and results of operations.
In June 2006, the FASB ratified Emerging Issues Task Force (“EITF”) consensus06-3,How Taxes Collected from Customers and Remitted to Governmental Authorities Should Be Presented in the Income Statement (That is, Gross versus Net Presentation).This EITF addresses the presentation of taxes in the income statement. Gross or net presentation may be elected for each different type of tax, but similar taxes should be presented consistently. Taxes within the scope of this EITF would include taxes that are imposed on a revenue transaction between a seller and a customer, for example, sales taxes, use taxes, value-added taxes, and some types of excise taxes. EITF06-3 is effective for interim and annual periods beginning after December 15, 2006, which for us is the first quarter of fiscal 2008. We are currently evaluating the impact of EITF06-3 on our consolidated financial position and results of operations.
In September 2006, the FASB issued SFAS 157,Fair Value Measurements.SFAS 157 establishes a framework for measuring fair value under GAAP and expands disclosures about fair value measurement. SFAS 157 also creates consistency and comparability in fair value measurements among the many accounting pronouncements that require fair value measurements but does not require any new fair value measurements. SFAS 157 is effective for fiscal years (including interim periods) beginning after November 15, 2007, which for us is the first quarter of fiscal 2009. We are currently evaluating the impact of SFAS 157 on our consolidated financial position and results of operations.
In February 2007, the FASB issued SFAS 159,The Fair Value Option for Financial Assets and Financial Liabilities — Including an amendment of FASB Statement No. 115. This standard amends SFAS 115,Accounting for Certain Investment in Debt and Equity Securities, with respect to accounting for a transfer to the trading category for all entities withavailable-for-sale and trading securities electing the fair value option. This standard allows companies to elect fair value accounting for many financial instruments and other items that currently are not required to be accounted as such, allows different applications for electing the option for a single item or groups of items, and requires disclosures to facilitate comparisons of similar assets and liabilities that are accounted for differently in relation to the fair value option. SFAS 159 is effective for fiscal years beginning after November 15, 2007, which for us is fiscal 2009. We are currently evaluating the impact of SFAS 159 on our consolidated financial position and results of operations.
Impact of Inflation
Inflation has an impact on food and packaging, construction, occupancy, labor and benefit, and general and administrative costs, all of which can significantly affect our operations. Historically, consistent with the industry, we have been able to pass along to our customers, through price increases, higher costs arising from these inflationary factors.
54
CKE RESTAURANTS, INC. AND SUBSIDIARIES
Management’s Discussion and Analysis — (Continued)
(Dollars in thousands)
Seasonality
Our business is affected by seasonality. Average restaurant sales are normally higher in the summer months than during the winter months for each of our restaurant concepts. In comparison with our Carl’s Jr. and La Salsa restaurant concepts, inclement weather has a greater impact on restaurant sales at our Hardee’s restaurants, because a significant number of them are located in areas that experience severe winter conditions, principally in the Midwest and certain East Coast locations.
Competition
As discussed above in “Business” in Item 1 of this Annual Report onForm 10-K, the foodservice industry is intensively competitive. We compete with a diverse group of food service companies (major restaurant chains, casual dining restaurants, nutrition-oriented restaurants and prepared food stores), making it difficult to attribute specific results of operations to the actions of any of our competitors.
Liquidity and Capital Resources
We currently finance our business through cash flow from operations and borrowings under the Facility. We believe our most significant use of cash during the next 12 months will be for capital expenditures. We amended and restated the Facility on June 2, 2004, and amended the Facility again on November 4, 2004, April 21, 2005, and January 22, 2007 (see below). Subsequent to fiscal 2007, on March 27, 2007, we amended and restated the Facility. The full text of the contractual requirements imposed by the Amended Facility is set forth in the Seventh Amended and Restated Credit Agreement, dated as of March 27, 2007, which we are filing with the Securities and Exchange Commission concurrently with this Annual Report onForm 10-K, and in the ancillary loan documents described therein.
We anticipate that existing cash balances, borrowing capacity under the Amended Facility, and cash provided by operations will be sufficient to service existing debt and to meet our operating and capital requirements for at least the next 12 months. We have no potential mandatory payments of principal on our 4% Convertible Subordinated Notes due 2023 until October 1, 2008.
We, and the restaurant industry in general, maintain relatively low levels of accounts receivable and inventories, and vendors grant trade credit for purchases such as food and supplies. We also continually invest in our business through the addition of new sites and the refurbishment of existing sites, which are reflected as long-term assets and not as part of working capital. As a result, we typically maintain current liabilities in excess of current assets, resulting in a working capital deficit. As of January 31, 2007, our current ratio was 0.82 to 1.
The Facility provided for a $480,000 senior secured credit facility consisting of a $250,000 revolving credit facility and a $230,000 term loan. The Amended Facility provides for $320,000 senior secured credit facility consisting of a $200,000 revolving credit facility and a $120,000 term loan. The revolving credit facility matures on March 27, 2012. The principal amount of the term loan is scheduled to be repaid in quarterly installments of $300, with the remaining principal balance scheduled to mature on March 27, 2013.
During the fiscal year ended January 31, 2007, we voluntarily prepaid $28,112 of the $230,000 term loan, in addition to the $816 regularly scheduled principal payments. As of January 31, 2007, we had (i) borrowings outstanding under the term loan portion of the Facility of $69,821, (ii) borrowings outstanding under the revolving portion of the Facility of $45,500, (iii) outstanding letters of credit under the revolving portion of the Facility of $57,263, and (iv) availability under the revolving portion of the Facility of $147,237.
The terms of the Facility included certain restrictive covenants. Among other things, these covenants restricted our ability to incur debt, incur liens on our assets, make any significant change in our corporate structure or the nature of our business, dispose of assets in the collateral pool securing the Facility, prepay certain debt, engage in a
55
CKE RESTAURANTS, INC. AND SUBSIDIARIES
Management’s Discussion and Analysis — (Continued)
(Dollars in thousands)
change of control transaction without the member banks’ consents and make investments or acquisitions. The Facility was collateralized by a lien on all of our personal property assets and liens on certain restaurant properties. The Amended Facility contains reduced restrictions under the covenants and modifies our collateral pool and various other items.
As of January 31, 2007, the applicable interest rate on the term loan was LIBOR plus 2.00%, or 7.375%, per annum. For the revolving portion of the Facility, the applicable rate was Prime plus 1.00%, or 9.25%, per annum. Under the terms of the Facility, we were permitted to lock in favorable rates for the revolving portion based on LIBOR plus 2.25% over terms ranging from 30 to 90 days. As of January 31, 2007 we had $43,500 in borrowings outstanding under the revolving portion of the Facility that we locked in at a rate of approximately 7.625%. We also incurred fees on outstanding letters of credit under the Facility at a rate equal to the applicable margin for LIBOR revolving loans, which was 2.25% per annum as of January 31, 2007. Under the Amended Facility, the applicable interest rate on the term loan portion is LIBOR plus 1.375% per annum. For the revolving portion of the Amended Facility, the applicable interest rate is Prime plus 0.50% per annum. Under the terms of the Amended Facility, we are permitted to lock in favorable rates for the revolving portion based on LIBOR plus 1.50% over terms ranging from 30 to 90 days. We also incur fees on outstanding letters of credit under the Amended Facility at a per annum rate equal to 1.50% times the stated amounts.
The Facility required us to enter into interest rate protection agreements in an aggregate notional amount of at least $70,000 for a term of at least three years. Pursuant to this requirement, on July 26, 2004, we entered into two interest rate cap agreements in an aggregate notional amount of $70,000. Under the terms of each agreement, if LIBOR exceeds 5.375% on the measurement date for any quarterly period, we will receive payments equal to the amount LIBOR exceeds 5.375%, multiplied by (i) the notional amount of the agreement and (ii) the fraction of a year represented by the quarterly period. The agreements expire on July 28, 2007. The agreements were not designated as cash flow hedges under the provisions of SFAS 133. Accordingly, the change in the fair value of the interest rate cap premiums is recognized quarterly in interest expense in our accompanying Consolidated Statements of Income. During the year ended January 31, 2007, we recognized a charge of $43 to interest expense to reduce the carrying value of the interest rate cap premiums to their fair value of $13 at January 31, 2007. As a matter of policy, we do not enter into derivative instruments unless there is an underlying exposure. However, the remaining outstanding principal balance of our term loan is now less than the notional amount of our existing interest rate caps as a result of voluntary prepayments and regularly scheduled principal payments. We are no longer required to enter into interest rate protection agreements under the Amended Facility.
We are permitted to repurchase our common stockand/or pay dividends in an aggregate amount up to $263,441, calculated under the Amended Facility, using balances as of January 31, 2007. In addition, the amount that we may spend to repurchase our common stockand/or pay dividends is increased each year by a portion of excess cash flow (as defined in the Amended Facility) during the term of the Amended Facility.
During the fiscal year ended January 31, 2007, we declared cash dividends of $0.16 per share of common stock, for a total of $10,397. As of January 31, 2007, dividends payable of $2,694 have been included in other current liabilities in our accompanying Consolidated Balance Sheet. These dividends were subsequently paid on February 20, 2007.
Subject to the terms of the Amended Facility, we may make annual capital expenditures in the amount of $85,000, plus 80% of the amount of actual Adjusted EBITDA (as defined in the Amended Facility) in excess of $150,000. We may also carry forward certain unused capital expenditure amounts to the following year. Based on these terms, assuming Adjusted EBITDA in fiscal 2008 as calculated under the definition in the Amended Facility is equal to Adjusted EBITDA in fiscal 2007 as calculated under the definition in the Amended Facility, the Amended Facility would permit us to make capital expenditures of $135,154 in fiscal 2008, which could increase or decrease based on our performance versus the Adjusted EBITDA formula described above.
56
CKE RESTAURANTS, INC. AND SUBSIDIARIES
Management’s Discussion and Analysis — (Continued)
(Dollars in thousands)
The Facility contained financial performance covenants, which included a minimum fixed charge coverage ratio and maximum leverage ratios. In addition, we were required under the Facility to generate a minimum Adjusted EBITDA, as defined, of at least $125,000 on a trailing-13 period basis. The calculation of our Adjusted EBITDA is included under the caption “Presentation of Non-GAAP Measurements,” in Item 7 of this Annual Report onForm 10-K. We were in compliance with these covenants and all other requirements of the Facility as of January 31, 2007. The Amended Facility eliminated certain financial performance covenants, such as minimum Adjusted EBITDA, minimum fixed charge coverage ratio, and adjusted leverage ratio.
The full text of the contractual requirements imposed by the Facility is set forth in the Sixth Amended and Restated Credit Agreement, dated as of June 2, 2004, and the amendments thereto, which we have filed with the Securities and Exchange Commission, and in the ancillary loan documents described therein. The full text of the contractual requirements imposed by the Amended Facility is set forth in the Seventh Amended and Restated Credit Agreement, dated as of March 27, 2007, which we are filing with the Securities and Exchange Commission concurrently with this Annual Report onForm 10-K, and in the ancillary loan documents described therein. Subject to cure periods in certain instances, the lenders under our Amended Facility may demand repayment of borrowings prior to stated maturity upon certain events of default, including, but not limited to, if we breach the terms of the agreement, suffer a material adverse change, engage in a change of control transaction, suffer certain adverse legal judgments, in the event of specified events of insolvency or if we default on other significant obligations. In the event the Amended Facility is declared accelerated by the lenders (which can occur only upon certain events of default under the Amended Facility), our 2023 Convertible Notes (described below) may also become accelerated under certain circumstances and after all cure periods have expired.
The 2023 Convertible Notes bear interest at 4.0% annually, payable in semiannual installments due April 1 and October 1 each year, are unsecured general obligations of ours, and are contractually subordinate in right of payment to certain other of our obligations, including the Facility. On October 1 of 2008, 2013 and 2018, the holders of the 2023 Convertible Notes have the right to require us to repurchase all or a portion of the notes at 100% of the face value plus accrued interest. On October 1, 2008 and thereafter, we have the right to call all or a portion of the notes at 100% of the face value plus accrued interest. The 2023 Convertible Notes became convertible into our common stock effective July 1, 2004, and will remain convertible throughout the remainder of their term.
During fiscal 2007, in response to unsolicited offers from the holders of $89,833 of the 2023 Convertible Notes, we made cash payments to the holders, comprised of accrued interest through the dates of conversion and inducements for the holders to convert in lieu of payment of future interest on the converted notes. The inducement payments were $6,406, and are included in the conversion inducement expense in our accompanying Consolidated Statements of Income for the year ended January 31, 2007. Pursuant to their terms, these notes converted into an aggregate of 10,224,424 shares of our common stock. As a result of these conversions, as of January 31, 2007, bank indebtedness and other long-term debt decreased $89,833; other assets, net, decreased $1,356; common stock increased $102; and additional paid-in capital increased $88,375. As of January 31, 2007, the remaining $15,167 of 2023 Convertible Notes are convertible into our common stock at a conversion price of approximately $8.79 per share, based on a conversion rate of 113.8160 shares per $1 of the notes.
The terms of the Amended Facility are not dependent on any change in our credit rating. We believe the key Company-specific factors affecting our ability to maintain our existing debt financing relationships and to access such capital in the future are our present and expected levels of profitability and cash flows from operations, asset collateral bases and the level of our equity capital relative to our debt obligations. In addition, as noted above, our existing debt agreements include significant restrictions on future financings including, among others, limits on the amount of indebtedness we may incur or which may be secured by any of our assets.
Pursuant to the Stock Repurchase Plan authorized by our Board of Directors, as modified during fiscal 2007, we are allowed to repurchase up to an aggregate of $200,000 of our common stock. During fiscal 2007, we repurchased 4,607,437 shares of our common stock at an average price of $17.58 per share, for a total cost,
57
CKE RESTAURANTS, INC. AND SUBSIDIARIES
Management’s Discussion and Analysis — (Continued)
(Dollars in thousands)
including trading commissions, of $81,057, of which we retired 4,589,137 shares. As of January 31, 2007, we had 18,300 shares of common stock that had been repurchased but not yet retired and are shown as common stock held in treasury on the accompanying Consolidated Balance Sheet. These shares were retired subsequent to January 31, 2007. There was no common stock held in treasury at January 31, 2006.
Based on the Board of Directors’ authorization and the amount of cumulative repurchase of our common stock that we have already made thereunder, we are permitted to make additional repurchases of our common stock up to $109,387 under the Stock Repurchase Plan as of January 31, 2007. As part of our Stock Repurchase Plan, we have implemented a share repurchase plan pursuant toRule 10b5-1 of the Exchange Act, under which we are allowed to repurchase $5,000 of our common stock in the open market each fiscal quarter through the quarter ending January 28, 2008.Rule 10b5-1 allows us to repurchase our common stock when we might otherwise be prevented from doing so under insider trading laws or because of self-imposed trading blackout periods.
During the fiscal year ended January 31, 2007, cash provided by operating activities was $164,145, an increase of $47,972, or 41.3%, over the prior year. This increase is primarily attributable to increases of $151,439 and $8,120 in non-cash charges related to deferred income taxes and share-based compensation expense, respectively, partially offset by a $130,967 decrease in net income from fiscal 2006 (as restated). The remaining fluctuation is attributable primarily to changes in operating assets and liabilities, including accounts receivable, accounts payable and other liability accounts. Working capital account balances can vary significantly from quarter to quarter, depending upon the timing of large customer receipts and payments to vendors, but they are not anticipated to be a significant source or use of cash over the long term.
Cash used in investing activities during the fiscal year ended January 31, 2007 totaled $92,528, which principally consisted of purchases of property and equipment, partially offset by proceeds from the sale of property and equipment. Capital expenditures for the fiscal years ended January 31, 2007 and 2006 were as follows:
| | | | | | | | | |
| | | 2007 | | | 2006 | |
| |
| New restaurants (including restaurants under development) | | | | | | | | |
| Carl’s Jr. | | $ | 14,514 | | | $ | 8,739 | |
| Hardee’s | | | 3,362 | | | | 13,118 | |
| La Salsa | | | 1,701 | | | | 173 | |
| Remodels/Dual-branding (including construction in process) | | | | | | | | |
| Carl’s Jr. | | | 10,428 | | | | 3,417 | |
| Hardee’s | | | 4,977 | | | | 5,251 | |
| La Salsa | | | 328 | | | | 131 | |
| Other restaurant additions | | | | | | | | |
| Carl’s Jr. | | | 25,388 | | | | 11,712 | |
| Hardee’s | | | 42,442 | | | | 19,889 | |
| La Salsa | | | 455 | | | | 588 | |
| Corporate/other | | | 13,673 | | | | 5,458 | |
| | | | | | | | | |
| Total | | $ | 117,268 | | | $ | 68,476 | |
| | | | | | | | | |
Capital expenditures for the fiscal year ended January 31, 2007, increased $48,792, or 71.3%, over the prior year mainly due to the acquisition of real property at 36 restaurant locations that we had previously leased from a commercial lessor, the purchase of 11 restaurant properties from a former franchisee’s lender, the rollout of new POS software and related hardware at our restaurants and additions, which include a new warehouse management software system and other leasehold improvements, related to the relocation of our main distribution center, partially offset by a decrease in new construction. We currently anticipate capital expenditures for fiscal 2008 will
58
CKE RESTAURANTS, INC. AND SUBSIDIARIES
Management’s Discussion and Analysis — (Continued)
(Dollars in thousands)
be between $110,000 and $125,000. Based on our current capital spending projections, we expect capital expenditures for the next five fiscal years to be approximately $650,000.
Cash used in financing activities during the fiscal year ended January 31, 2007, was $74,280, which principally consisted of payment of $80,697 for the repurchase of common stock, repayment of $28,928 of term loans under the Facility (of which $28,112 represented voluntary prepayment thereof), repayment of $4,937 of capital lease obligations, and payment of $10,126 of dividends, partially offset by net borrowings of $37,500 under the revolving portion of the Facility and receipts from the exercise of stock options and warrants of $10,327. We currently anticipate that quarterly dividends and common stock repurchases will be at least $35,000 during fiscal 2008.
Long-Term Obligations
Contractual Cash Obligations
The following table presents our long-term contractual cash obligations as of January 31, 2007:
| | | | | | | | | | | | | | | | | | | | | |
| | | Payments Due by Periods | |
| | | | | | Less Than
| | | | | | | | | After
| |
| | | Total | | | One Year | | | 1-3 Years | | | 3-5 Years | | | 5 Years | |
| |
| Long-term debt(1)(2) | | $ | 131,609 | | | $ | 1,500 | | | $ | 2,586 | | | $ | 2,450 | | | $ | 125,073 | |
| Capital lease obligations(3)(4) | | | 72,316 | | | | 10,476 | | | | 20,093 | | | | 17,177 | | | | 24,570 | |
| Operating leases(3) | | | 609,714 | | | | 84,152 | | | | 147,571 | | | | 112,225 | | | | 265,766 | |
| Unconditional purchase obligations(5) | | | 43,796 | | | | 40,844 | | | | 2,922 | | | | 30 | | | | — | |
| | | | | | | | | | | | | | | | | | | | | |
| Total contractual cash obligations | | $ | 857,435 | | | $ | 136,972 | | | $ | 173,172 | | | $ | 131,882 | | | $ | 415,409 | |
| | | | | | | | | | | | | | | | | | | | | |
| | |
| (1) | | Assumes holders of the 2023 Convertible Notes do not exercise redemption rights in October 2008. |
| |
| (2) | | Gives effect to the terms of the Amended Facility. |
| |
| (3) | | The amounts reported above as operating leases and capital lease obligations include leases contained in the estimated liability for closing restaurants and leases for which we are the obligee to the property owner and sublease to franchisees. Additional information regarding operating leases and capital lease obligations can be found in Note 8 of Notes to Consolidated Financial Statements. |
| |
| (4) | | Represents the undiscounted value of capital lease payments. |
| |
| (5) | | Unconditional purchase obligations include contracts for goods and services, primarily related to system restaurant operations and contractual commitments for marketing and sponsorship arrangements. |
The following table presents our other commercial commitments including letters of credit and guarantees. The specific commitments are discussed previously in Item 7, as well as in Note 27 of Notes to Consolidated Financial Statements.
Other Commercial Commitments
| | | | | | | | | | | | | | | | | |
| | | Amount of Commitment Expirations Per Period | |
| | | Total
| | | | | | | | | | |
| | | Amounts
| | | Less Than
| | | 1-3
| | | 3-5
| |
| | | Committed | | | One Year | | | Years | | | Years | |
| |
| Standby letters of credit under our Facility | | $ | 57,263 | | | $ | 44,447 | | | $ | 12,816 | | | $ | — | |
| Guarantees | | | 369 | | | | 151 | | | | 218 | | | | — | |
| | | | | | | | | | | | | | | | | |
| Total other commercial commitments | | $ | 57,632 | | | $ | 44,598 | | | $ | 13,034 | | | $ | — | |
| | | | | | | | | | | | | | | | | |
59
| |
| Item 7A. | Quantitative and Qualitative Disclosures About Market Risk |
Interest Rate Risk
Our principal exposure to financial market risks relates to the impact that interest rate changes could have on the Facility. As of January 31, 2007, we had $115,321 of borrowings and $57,263 of letters of credit outstanding under the Facility. Borrowings under the Facility bear interest at the prime rate or LIBOR plus an applicable margin. A hypothetical increase of 100 basis points in short-term interest rates would result in a reduction in our annual pre-tax earnings of $1,153. The estimated reduction is based upon the outstanding balance of the borrowings under the Facility and the weighted-average interest rate for the fiscal year and assumes no change in the volume, index or composition of debt as in effect on January 31, 2007. As of January 31, 2007, a hypothetical increase of 100 basis points in short-term interest rates would also cause the fair value of our convertible subordinated notes due 2023 to decrease approximately $241, and a hypothetical decrease of 100 basis points in short-term interest rates would cause the fair value of our convertible subordinated notes due 2023 to increase approximately $246. The changes in fair value were determined by discounting the projected cash flows assuming redemption on October 1, 2008.
Substantially all of our business is transacted in U.S. dollars. Accordingly, foreign exchange rate fluctuations have not had a significant impact on us and are not expected to in the foreseeable future.
Commodity Price Risk
We purchase certain products which are affected by commodity prices and are, therefore, subject to price volatility caused by weather, market conditions and other factors which are not considered predictable or within our control. Although many of the products purchased are subject to changes in commodity prices, certain purchasing contracts or pricing arrangements contain risk management techniques designed to minimize price volatility. The purchasing contracts and pricing arrangements we use may result in unconditional purchase obligations, which are not reflected in the accompanying Consolidated Balance Sheets. Typically, we use these types of purchasing techniques to control costs as an alternative to directly managing financial instruments to hedge commodity prices. In many cases, we believe we will be able to address material commodity cost increases by adjusting our menu pricing or changing our product delivery strategy. However, increases in commodity prices, without adjustments to our menu prices, could increase restaurant operating costs as a percent of company-operated revenue for our restaurant concepts.
Derivative Financial Instruments
On July 26, 2004, we entered into two interest rate cap agreements in an aggregate notional amount of $70,000. Under the terms of each agreement, if LIBOR exceeds 5.375% on the measurement date for any quarterly period, we will receive payments equal to the amount LIBOR exceeds 5.375%, multiplied by (i) the notional amount of the agreement and (ii) the fraction of a year represented by the quarterly period. The agreements expire on July 28, 2007. The agreements were not designated as cash flow hedges under the terms of SFAS 133. Accordingly, the change in the fair value of the interest rate cap premiums will be recognized quarterly in interest expense in our Consolidated Statements of Income. We recorded interest expense of $43 and $52 during the years ended January 31, 2007 and 2006, respectively, to adjust the carrying value of the interest rate cap premiums to their fair values. The fair values of the interest rate cap premiums are included in other assets, net, in our accompanying Consolidated Balance Sheets, and were $13 and $56 at January 31, 2007 and 2006, respectively. As a matter of policy, we do not enter into derivative instruments unless there is an underlying exposure. However, the remaining outstanding principal balance of our term loan is now less than the notional amount of our existing interest rate caps as a result of voluntary prepayments and regularly scheduled principal payments.
| |
| Item 8. | Financial Statements and Supplementary Data |
See the Index included at Item 15 — Exhibits and Financial Statement Schedules.
| |
| Item 9. | Changes in and Disagreements with Accountants on Accounting and Financial Disclosure |
None.
60
| |
| Item 9A. | Controls and Procedures |
| |
| (a) | Evaluation of Disclosure Controls and Procedures |
We maintain disclosure controls and procedures that are designed to ensure that information required to be disclosed in our reports under the Exchange Act is recorded, processed, summarized and reported within the time periods specified in the SEC’s rules and forms, and that such information is accumulated and communicated to management, including our Chief Executive Officer and Chief Financial Officer, to allow timely decisions regarding required disclosure. In designing and evaluating our disclosure controls and procedures, our management recognized that any system of controls and procedures, no matter how well designed and operated, can provide only reasonable assurance of achieving the desired control objectives, as ours are designed to do, and management necessarily was required to apply its judgment in evaluating the cost-benefit relationship of possible controls and procedures.
In connection with the preparation of this Annual Report onForm 10-K, an evaluation was performed under the supervision and with the participation of our management, including our Chief Executive Officer and Chief Financial Officer, of the effectiveness of the design and operation of our disclosure controls and procedures (as defined inRule 13a-15(e) under the Exchange Act). Based on that evaluation, our Chief Executive Officer and Chief Financial Officer concluded that our disclosure controls and procedures were effective as of the end of the period covered by this Annual Report onForm 10-K to ensure that the information required to be disclosed by us in reports that we file or submit under the Exchange Act is recorded, processed, summarized and reported within the time periods specified in the Securities and Exchange Commission’s rules and forms, and to ensure that the information required to be disclosed by us in reports that we file or submit under the Exchange Act is accumulated and communicated to our management, including our Chief Executive Officer and Chief Financial Officer, as appropriate, to allow timely decisions regarding required disclosures.
| |
| (b) | Management’s Report on Internal Control over Financial Reporting |
Our management is responsible for establishing and maintaining adequate internal control over financial reporting as defined inRule 13a-15(f) under the Exchange Act. Our internal control system is designed to provide reasonable assurance to our management and Board of Directors regarding the preparation and fair presentation of published financial statements. All internal control systems, no matter how well designed, have inherent limitations. Therefore, even those systems determined to be effective can provide only reasonable assurance with respect to the reliability of financial reporting and the preparation of financial statements for external purposes in accordance with generally accepted accounting principles.
Management has assessed the effectiveness of our internal control over financial reporting as of January 31, 2007. In making its assessment of internal control over financial reporting, management used the criteria set forth inInternal Control — Integrated Frameworkissued by the Committee of Sponsoring Organizations of the Treadway Commission (COSO).
Management has concluded that, as of January 31, 2007, our internal control over financial reporting was effective.
Our independent registered public accounting firm, KPMG LLP, has issued an audit report on our assessment of our internal control over financial reporting, which is included herein.
| |
| (c) | Changes in Internal Control over Financial Reporting |
As discussed elsewhere in this Annual Report onForm 10-K, we have restated our Consolidated Financial Statements for the fiscal year ended January 31, 2006 and the notes thereto, as well as Selected Financial Data for the fiscal year ended January 31, 2006. As a result, we have concluded that we had a material weakness in our internal control over financial reporting relating to income taxes as of January 31, 2006. During the year ended January 31, 2007, we implemented improvements to our income tax provision process that include automating certain tax depreciation calculations that were previously done manually and enhancing our internal controls over review and reconciliation procedures related to our income tax provision. We believe that the material weakness that existed as of January 31, 2006 was remediated at January 31, 2007.
61
There have been no other changes in our internal control over financial reporting during the fourth quarter of our fiscal year ended January 31, 2007, that have materially affected, or are reasonably likely to materially affect, our internal control over financial reporting.
| |
| (d) | Report of Independent Registered Public Accounting Firm |
The Board of Directors and Stockholders
CKE Restaurants, Inc.:
We have audited management’s assessment, included in the accompanyingManagement’s Report on Internal Control over Financial Reporting(Item 9A(b)), that CKE Restaurants, Inc. (the Company) maintained effective internal control over financial reporting as of January 31, 2007, based on criteria established inInternal Control — Integrated Frameworkissued by the Committee of Sponsoring Organizations of the Treadway Commission (COSO). The Company’s management is responsible for maintaining effective internal control over financial reporting and for its assessment of the effectiveness of internal control over financial reporting. Our responsibility is to express an opinion on management’s assessment and an opinion on the effectiveness of the Company’s internal control over financial reporting based on our audit.
We conducted our audit in accordance with the standards of the Public Company Accounting Oversight Board (United States). Those standards require that we plan and perform the audit to obtain reasonable assurance about whether effective internal control over financial reporting was maintained in all material respects. Our audit included obtaining an understanding of internal control over financial reporting, evaluating management’s assessment, testing and evaluating the design and operating effectiveness of internal control, and performing such other procedures as we considered necessary in the circumstances. We believe that our audit provides a reasonable basis for our opinion.
A company’s internal control over financial reporting is a process designed to provide reasonable assurance regarding the reliability of financial reporting and the preparation of financial statements for external purposes in accordance with generally accepted accounting principles. A company’s internal control over financial reporting includes those policies and procedures that (1) pertain to the maintenance of records that, in reasonable detail, accurately and fairly reflect the transactions and dispositions of the assets of the company; (2) provide reasonable assurance that transactions are recorded as necessary to permit preparation of financial statements in accordance with generally accepted accounting principles, and that receipts and expenditures of the company are being made only in accordance with authorizations of management and directors of the company; and (3) provide reasonable assurance regarding prevention or timely detection of unauthorized acquisition, use, or disposition of the company’s assets that could have a material effect on the financial statements.
Because of its inherent limitations, internal control over financial reporting may not prevent or detect misstatements. Also, projections of any evaluation of effectiveness to future periods are subject to the risk that controls may become inadequate because of changes in conditions, or that the degree of compliance with the policies or procedures may deteriorate.
In our opinion, management’s assessment that the Company maintained effective internal control over financial reporting as of January 31, 2007, is fairly stated, in all material respects, based on criteria established inInternal Control — Integrated Frameworkissued by the Committee of Sponsoring Organizations of the Treadway Commission (COSO). Also, in our opinion, the Company maintained, in all material respects, effective internal control over financial reporting as of January 31, 2007, based on criteria established inInternal Control — Integrated Frameworkissued by the Committee of Sponsoring Organizations of the Treadway Commission (COSO).
62
We also have audited, in accordance with the standards of the Public Company Accounting Oversight Board (United States), the consolidated balance sheets of CKE Restaurants, Inc. and subsidiaries as of January 31, 2007 and 2006, and the related consolidated statements of income, stockholders’ equity, and cash flows for each of the years in the three-year period ended January 31, 2007, and our report dated March 28, 2007, expressed an unqualified opinion on those consolidated financial statements.
Costa Mesa, California
March 28, 2007
The certifications of our Chief Executive Officer and Chief Financial Officer required under Section 302 of the Sarbanes-Oxley Act of 2002 have been filed as Exhibits 31.1 and 31.2 to the Annual Report onForm 10-K. Additionally, in 2006 our Chief Executive Officer timely submitted to the New York Stock Exchange (“NYSE”) an Annual Chief Executive Officer Certification, as required by the commentary to Section 303A.12(a) of the NYSE Listed Company Manual, indicating that he was not aware of any violations by the Company of the NYSE’s corporate governance listing standards. Such certification was unqualified.
| |
| Item 9B. | Other Information |
Not Applicable.
63
PART III
| |
| Item 10. | Directors and Executive Officers of the Registrant |
The information pertaining to directors and executive officers of the registrant is hereby incorporated by reference from our Proxy Statement to be used in connection with our 2007 Annual Meeting of Stockholders, to be filed with the Commission within 120 days of January 29, 2007. Information concerning the current executive officers is contained in Item 1 of Part I of this Annual Report onForm 10-K.
Code of Ethics and Corporate Governance Information
We have adopted a code of business conduct and ethics (“Code of Conduct”) to help ensure our directors and employees conduct the business of CKE fairly, free of conflicts of interest, and in an ethical and proper manner. We have also adopted a code of ethics (“Code of Ethics”) for our CEO and senior financial officers, including our principal financial officer and principal accounting officer or controller, or persons performing similar functions. The Code of Conduct and the Code of Ethics can be found on our website at www.ckr.com. We will satisfy the disclosure requirement under Item 10 ofForm 8-K, as necessary, regarding any amendment to, or waiver from, any applicable provision (related to elements listed under Item 406(b) ofRegulation S-K) of the Code of Conduct or the Code of Ethics by posting such information on our website.
The Board of Directors has adopted and approved the Code of Conduct, Code of Ethics, Corporate Governance Guidelines, and written charters for its Nominating and Corporate Governance, Audit and Compensation Committees. All of the foregoing documents are available on our website at www.ckr.com, and a copy of the foregoing will be made available (without charge) to any stockholder upon request.
| |
| Item 11. | Executive Compensation |
The information pertaining to executive compensation is hereby incorporated by reference from our Proxy Statement to be used in connection with our 2007 Annual Meeting of Stockholders, to be filed with the Commission within 120 days of January 29, 2007.
| |
| Item 12. | Security Ownership of Certain Beneficial Owners and Management and Related Stockholder Matters |
The information pertaining to security ownership of certain beneficial owners and management and related stockholder matters is hereby incorporated by reference from our Proxy Statement to be used in connection with our 2007 Annual Meeting of Stockholders, to be filed with the Commission within 120 days of January 29, 2007.
64
Equity Compensation Plan Information
Equity compensation plans as of January 31, 2007 were:
| | | | | | | | | | | | | |
| | | | | | | | | Number of Securities
| |
| | | | | | | | | Remaining Available
| |
| | | | | | | | | for Future Issuance
| |
| | | Number of Securities
| | | Weighted-Average
| | | Under Equity
| |
| | | to be Issued Upon
| | | Exercise Price of
| | | Compensation Plans
| |
| | | Exercise of
| | | Outstanding
| | | (Excluding
| |
| | | Outstanding Options,
| | | Options, Warrants
| | | Securities Reflected
| |
Plan Category | | Warrants and Rights | | | and Rights | | | in Column (a)) | |
| | | (a) | | | (b) | | | (c) | |
| |
| Equity compensation plans approved by security holders | | | 5,003,784 | | | $ | 13.74 | | | | 1,210,643 | |
| Equity compensation plans not approved by security holders(1) | | | 370,522 | | | | 8.24 | | | | 93,529 | |
| | | | | | | | | | | | | |
| Total | | | 5,374,306 | | | $ | 13.36 | | | | 1,304,172 | |
| | | | | | | | | | | | | |
| | |
| (1) | | Represents options that are part of a “broad-based plan” as then defined by the New York Stock Exchange. See Note 23 of Notes to Consolidated Financial Statements. |
| |
| Item 13. | Certain Relationships and Related Transactions |
The information pertaining to certain relationships and related transactions of the registrant is hereby incorporated by reference from our Proxy Statement to be used in connection with our 2007 Annual Meeting of Stockholders, to be filed with the Commission within 120 days of January 29, 2007.
| |
| Item 14. | Principal Accountant Fees and Services |
The information pertaining to principal accountant fees and services is hereby incorporated by reference from our Proxy Statement to be used in connection with our 2007 Annual Meeting of Stockholders, to be filed with the Commission within 120 days of January 29, 2007.
65
PART IV
| |
| Item 15. | Exhibits and Financial Statement Schedules |
66
SIGNATURES
Pursuant to the requirements of Section 13 or 15(d) of the Securities Exchange Act of 1934, the registrant has duly caused this report to be signed on its behalf by the undersigned, thereunto duly authorized.
CKE Restaurants, Inc.
Andrew F. Puzder,
President and Chief Executive Officer
Date: March 30, 2007
Pursuant to the requirements of the Securities Exchange Act of 1934, this report has been signed below by the following persons on behalf of the registrant and in the capacities and on the dates indicated.
| | | | | | | |
Signature | | Title | | Date |
| |
/s/ Byron Allumbaugh
Byron Allumbaugh | | Chairman of the Board | | March 30, 2007 |
| | | | | |
/s/ Andrew F. Puzder
Andrew F. Puzder | | President and Chief Executive Officer
(Principal Executive Officer) | | March 30, 2007 |
| | | | | |
/s/ Theodore Abajian
Theodore Abajian | | Executive Vice President, Chief Financial Officer (Principal Financial Officer) | | March 30, 2007 |
| | | | | |
/s/ Peter Churm
Peter Churm | | Director | | March 30, 2007 |
| | | | | |
/s/ Matthew Goldfarb
Matthew Goldfarb | | Director | | March 30, 2007 |
| | | | | |
/s/ Carl L. Karcher
Carl L. Karcher | | Director | | March 30, 2007 |
| | | | | |
/s/ Janet E. Kerr
Janet E. Kerr | | Director | | March 30, 2007 |
| | | | | |
/s/ Daniel D. Lane
Daniel D. Lane | | Director | | March 30, 2007 |
| | | | | |
/s/ Daniel E. Ponder, Jr.
Daniel E. Ponder, Jr. | | Director | | March 30, 2007 |
67
| | | | | | | |
Signature | | Title | | Date |
| |
/s/ Jerold H. Rubinstein
Jerold H. Rubinstein | | Director | | March 30, 2007 |
| | | | | |
/s/ Frank P. Willey
Frank P. Willey | | Director | | March 30, 2007 |
68
REPORT OF INDEPENDENT REGISTERED PUBLIC ACCOUNTING FIRM
The Board of Directors and Stockholders
CKE Restaurants, Inc.:
We have audited the accompanying consolidated balance sheets of CKE Restaurants, Inc. and subsidiaries as of January 31, 2007 and 2006, and the related consolidated statements of income, stockholders’ equity, and cash flows for each of the years in the three-year period ended January 31, 2007. These consolidated financial statements are the responsibility of the Company’s management. Our responsibility is to express an opinion on these consolidated financial statements based on our audits.
We conducted our audits in accordance with the standards of the Public Company Accounting Oversight Board (United States). Those standards require that we plan and perform the audit to obtain reasonable assurance about whether the financial statements are free of material misstatement. An audit includes examining, on a test basis, evidence supporting the amounts and disclosures in the financial statements. An audit also includes assessing the accounting principles used and significant estimates made by management, as well as evaluating the overall financial statement presentation. We believe that our audits provide a reasonable basis for our opinion.
In our opinion, the consolidated financial statements referred to above present fairly, in all material respects, the financial position of CKE Restaurants, Inc. and subsidiaries as of January 31, 2007 and 2006, and the results of their operations and their cash flows for each of the years in the three-year period ended January 31, 2007, in conformity with U.S. generally accepted accounting principles.
As discussed in Note 3 to the consolidated financial statements, the Company adopted Statement of Financial Accounting Standards No. 123 (revised 2004),Share-Based Payment, and changed its method of quantifying errors in fiscal 2007. As discussed in Note 1 to the consolidated financial statements, the consolidated financial statements for fiscal 2006 have been restated.
We also have audited, in accordance with the standards of the Public Company Accounting Oversight Board (United States), the effectiveness of the Company’s internal control over financial reporting as of January 31, 2007, based on criteria established inInternal Control — Integrated Framework issued by the Committee of Sponsoring Organizations of the Treadway Commission (COSO), and our report dated March 28, 2007, expressed an unqualified opinion on management’s assessment of, and the effective operation of, internal control over financial reporting.
/s/ KPMG LLP
Costa Mesa, California
March 28, 2007
69
CKE RESTAURANTS, INC. AND SUBSIDIARIES
CONSOLIDATED BALANCE SHEETS
| | | | | | | | | |
| | | January 31,
| | | January 31,
| |
| | | 2007 | | | 2006 | |
| | | | | | (as restated) | |
| | | (In thousands, except
| |
| | | par values) | |
| |
ASSETS |
Current assets: | | | | | | | | |
| Cash and cash equivalents | | $ | 18,680 | | | $ | 21,343 | |
| Accounts receivable, net | | | 42,804 | | | | 36,153 | |
| Related party trade receivables | | | 4,644 | | | | 4,987 | |
| Inventories, net | | | 21,965 | | | | 20,953 | |
| Prepaid expenses | | | 14,174 | | | | 13,101 | |
| Assets held for sale | | | 3,949 | | | | — | |
| Advertising fund assets, restricted | | | 17,896 | | | | 17,226 | |
| Deferred income tax assets, net | | | 25,998 | | | | 31,820 | |
| Other current assets | | | 2,168 | | | | 2,251 | |
| | | | | | | | | |
| Total current assets | | | 152,278 | | | | 147,834 | |
| Notes receivable, net | | | 775 | | | | 1,968 | |
| Property and equipment, net | | | 488,590 | | | | 460,083 | |
| Property under capital leases, net | | | 25,153 | | | | 29,364 | |
| Deferred income tax assets, net | | | 83,781 | | | | 103,920 | |
| Goodwill | | | 22,649 | | | | 22,649 | |
| Other assets, net | | | 21,196 | | | | 25,519 | |
| | | | | | | | | |
| Total assets | | $ | 794,422 | | | $ | 791,337 | |
| | | | | | | | | |
| |
LIABILITIES AND STOCKHOLDERS’ EQUITY |
Current liabilities: | | | | | | | | |
| Current portion of bank indebtedness and other long-term debt | | $ | 1,500 | | | $ | 9,247 | |
| Current portion of capital lease obligations | | | 5,323 | | | | 4,960 | |
| Accounts payable | | | 64,287 | | | | 53,883 | |
| Advertising fund liabilities | | | 17,896 | | | | 17,226 | |
| Other current liabilities | | | 96,133 | | | | 89,556 | |
| | | | | | | | | |
| Total current liabilities | | | 185,139 | | | | 174,872 | |
| Bank indebtedness and other long-term debt, less current portion | | | 114,942 | | | | 98,731 | |
| Convertible subordinated notes due 2023 | | | 15,167 | | | | 105,000 | |
| Capital lease obligations, less current portion | | | 41,123 | | | | 46,724 | |
| Other long-term liabilities | | | 59,205 | | | | 57,072 | |
| | | | | | | | | |
| Total liabilities | | | 415,576 | | | | 482,399 | |
| | | | | | | | | |
| Subsequent events (Note 11) | | | | | | | | |
| Commitments and contingencies (Notes 8, 10, 11, 12 and 27) | | | | | | | | |
| Stockholders’ equity: | | | | | | | | |
| Preferred stock, $.01 par value; authorized 5,000 shares; none issued or outstanding | | | — | | | | — | |
| Series A Junior Participating Preferred stock, $.01 par value; 1,500 shares authorized; none issued or outstanding | | | — | | | | — | |
| Common stock, $.01 par value; authorized 100,000 shares; 67,247 shares issued and 67,229 shares outstanding as of January 31, 2007 and 59,803 shares issued and outstanding as of January 31, 2006 | | | 672 | | | | 598 | |
| Common stock held in treasury, at cost; 18 shares as of January 31, 2007 and none as of January 31, 2006 | | | (360 | ) | | | — | |
| Additional paid-in capital | | | 501,437 | | | | 472,834 | |
| Unearned compensation on restricted stock | | | — | | | | (1,816 | ) |
| Accumulated deficit | | | (122,903 | ) | | | (162,678 | ) |
| | | | | | | | | |
| Total stockholders’ equity | | | 378,846 | | | | 308,938 | |
| | | | | | | | | |
| Total liabilities and stockholders’ equity | | $ | 794,422 | | | $ | 791,337 | |
| | | | | | | | | |
See Accompanying Notes to Consolidated Financial Statements
70
CKE RESTAURANTS, INC. AND SUBSIDIARIES
CONSOLIDATED STATEMENTS OF INCOME
| | | | | | | | | | | | | |
| | | Fiscal Years Ended January 31, | |
| | | 2007 | | | 2006 | | | 2005 | |
| | | (as restated) | |
| | | (In thousands, except per share amounts) | |
| |
Revenue: | | | | | | | | | | | | |
| Company-operated restaurants | | $ | 1,269,687 | | | $ | 1,209,456 | | | $ | 1,217,273 | |
| Franchised and licensed restaurants and other | | | 318,723 | | | | 308,891 | | | | 302,608 | |
| | | | | | | | | | | | | |
| Total revenue | | | 1,588,410 | | | | 1,518,347 | | | | 1,519,881 | |
| | | | | | | | | | | | | |
Operating costs and expenses: | | | | | | | | | | | | |
| Restaurant operating costs: | | | | | | | | | | | | |
| Food and packaging | | | 364,375 | | | | 354,239 | | | | 359,939 | |
| Payroll and other employee benefits | | | 370,724 | | | | 356,960 | | | | 377,405 | |
| Occupancy and other | | | 276,753 | | | | 270,716 | | | | 273,294 | |
| | | | | | | | | | | | | |
| Total restaurant operating costs | | | 1,011,852 | | | | 981,915 | | | | 1,010,638 | |
| Franchised and licensed restaurants and other | | | 240,952 | | | | 238,461 | | | | 227,588 | |
| Advertising | | | 72,253 | | | | 70,964 | | | | 71,839 | |
| General and administrative | | | 150,315 | | | | 141,102 | | | | 138,716 | |
| Facility action charges, net | | | 8,546 | | | | 8,025 | | | | 14,320 | |
| | | | | | | | | | | | | |
| Total operating costs and expenses | | | 1,483,918 | | | | 1,440,467 | | | | 1,463,101 | |
| | | | | | | | | | | | | |
| Operating income | | | 104,492 | | | | 77,880 | | | | 56,780 | |
| Interest expense | | | (19,751 | ) | | | (23,016 | ) | | | (36,748 | ) |
| Conversion inducement expense | | | (6,406 | ) | | | — | | | | — | |
| Other income (expense), net | | | 3,736 | | | | 2,387 | | | | (2,962 | ) |
| | | | | | | | | | | | | |
| Income before income taxes and discontinued operations | | | 82,071 | | | | 57,251 | | | | 17,070 | |
| Income tax expense (benefit) | | | 31,899 | | | | (123,888 | ) | | | (1,592 | ) |
| | | | | | | | | | | | | |
| Income from continuing operations | | | 50,172 | | | | 181,139 | | | | 18,662 | |
| Discontinued operations: | | | | | | | | | | | | |
| Loss from discontinued operations (net of income tax benefit of $0 for 2005) | | | — | | | | — | | | | (646 | ) |
| | | | | | | | | | | | | |
| Net income | | $ | 50,172 | | | $ | 181,139 | | | $ | 18,016 | |
| | | | | | | | | | | | | |
| Basic income per common share: | | | | | | | | | | | | |
| Continuing operations | | $ | 0.79 | | | $ | 3.06 | | | $ | 0.32 | |
| Discontinued operations | | | — | | | | — | | | | (0.01 | ) |
| | | | | | | | | | | | | |
| Net income | | $ | 0.79 | | | $ | 3.06 | | | $ | 0.31 | |
| | | | | | | | | | | | | |
| Diluted income per common share: | | | | | | | | | | | | |
| Continuing operations | | $ | 0.72 | | | $ | 2.51 | | | $ | 0.31 | |
| Discontinued operations | | | — | | | | — | | | | (0.01 | ) |
| | | | | | | | | | | | | |
| Net income | | $ | 0.72 | | | $ | 2.51 | | | $ | 0.30 | |
| | | | | | | | | | | | | |
| Dividends per common share | | $ | 0.16 | | | $ | 0.16 | | | $ | — | |
| | | | | | | | | | | | | |
| Weighted-average common shares outstanding: | | | | | | | | | | | | |
| Basic | | | 63,562 | | | | 59,226 | | | | 57,615 | |
| Dilutive effect of stock options, warrants, convertible notes and restricted stock | | | 8,815 | | | | 14,024 | | | | 1,968 | |
| | | | | | | | | | | | | |
| Diluted | | | 72,377 | | | | 73,250 | | | | 59,583 | |
| | | | | | | | | | | | | |
See Accompanying Notes to Consolidated Financial Statements
71
CKE RESTAURANTS, INC. AND SUBSIDIARIES
CONSOLIDATED STATEMENTS OF STOCKHOLDERS’ EQUITY
(In thousands)
| | | | | | | | | | | | | | | | | | | | | | | | | | | | | | | | | | | | | |
| | | | | | | | | | | | | | | | | | | | | Officer and
| | | | | | | |
| | | | | | | | | | | | | | | | | | | | | Non-
| | | | | | | |
| | | | | | | | | | | | | | | | | | Unearned
| | | Employee
| | | | | | | |
| | | | | | | | | Common Stock
| | | Additional
| | | Compensation
| | | Director
| | | | | | Total
| |
| | | Common Stock | | | Held in Treasury | | | Paid-In
| | | On Restricted
| | | Notes
| | | Accumulated
| | | Stockholders’
| |
| | | Shares | | | Amount | | | Shares | | | Amount | | | Capital | | | Stock | | | Receivable | | | Deficit | | | Equity | |
| |
Balance at January 31, 2004 | | | 59,216 | | | $ | 592 | | | | (1,585 | ) | | $ | (10,406 | ) | | $ | 464,689 | | | $ | — | | | $ | (2,530 | ) | | $ | (351,687 | ) | | $ | 100,658 | |
| Exercise of stock options | | | 970 | | | | 10 | | | | — | | | | — | | | | 4,013 | | | | — | | | | — | | | | — | | | | 4,023 | |
| Collection of officer and non-employee director notes receivable | | | — | | | | — | | | | — | | | | — | | | | — | | | | — | | | | 2,530 | | | | — | | | | 2,530 | |
| Repurchase and retirement of common stock | | | (2,104 | ) | | | (21 | ) | | | 1,585 | | | | 10,406 | | | | (15,311 | ) | | | — | | | | — | | | | (633 | ) | | | (5,559 | ) |
| Net income | | | — | | | | — | | | | — | | | | — | | | | — | | | | — | | | | — | | | | 18,016 | | | | 18,016 | |
| | | | | | | | | | | | | | | | | | | | | | | | | | | | | | | | | | | | | |
Balance at January 31, 2005 | | | 58,082 | | | | 581 | | | | — | | | | — | | | | 453,391 | | | | — | | | | — | | | | (334,304 | ) | | | 119,668 | |
| Cash dividends declared | | | — | | | | — | | | | — | | | | — | | | | — | | | | — | | | | — | | | | (9,513 | ) | | | (9,513 | ) |
| Issuance of restricted stock awards, net of forfeitures | | | 150 | | | | 1 | | | | — | | | | — | | | | 2,003 | | | | (2,004 | ) | | | — | | | | — | | | | — | |
| Amortization of unearned compensation | | | — | | | | — | | | | — | | | | — | | | | — | | | | 188 | | | | — | | | | — | | | | 188 | |
| Exercise of stock options and warrants | | | 1,868 | | | | 19 | | | | — | | | | — | | | | 9,464 | | | | — | | | | — | | | | — | | | | 9,483 | |
| Tax benefit from exercise of stock options | | | — | | | | — | | | | — | | | | — | | | | 11,971 | | | | — | | | | — | | | | — | | | | 11,971 | |
| Repurchase and retirement of common stock | | | (297 | ) | | | (3 | ) | | | — | | | | — | | | | (3,995 | ) | | | — | | | | — | | | | — | | | | (3,998 | ) |
| Net income (as restated) | | | — | | | | — | | | | — | | | | — | | | | — | | | | — | | | | — | | | | 181,139 | | | | 181,139 | |
| | | | | | | | | | | | | | | | | | | | | | | | | | | | | | | | | | | | | |
Balance at January 31, 2006 (as restated) | | | 59,803 | | | | 598 | | | | — | | | | — | | | | 472,834 | | | | (1,816 | ) | | | — | | | | (162,678 | ) | | | 308,938 | |
| Cash dividends declared | | | — | | | | — | | | | — | | | | — | | | | — | | | | — | | | | — | | | | (10,397 | ) | | | (10,397 | ) |
| Issuance of restricted stock awards, net of forfeitures | | | 634 | | | | 6 | | | | — | | | | — | | | | (6 | ) | | | — | | | | — | | | | — | | | | — | |
| Reclassification of unearned compensation pursuant to SFAS 123R adoption | | | — | | | | — | | | | — | | | | — | | | | (1,816 | ) | | | 1,816 | | | | — | | | | — | | | | — | |
| Exercise of stock options | | | 1,175 | | | | 12 | | | | — | | | | — | | | | 10,315 | | | | — | | | | — | | | | — | | | | 10,327 | |
| Conversion of 2023 Convertible Notes into common stock | | | 10,224 | | | | 102 | | | | — | | | | — | | | | 88,375 | | | | — | | | | — | | | | — | | | | 88,477 | |
| Tax benefit from exercise of stock options | | | — | | | | — | | | | — | | | | — | | | | 4,078 | | | | — | | | | — | | | | — | | | | 4,078 | |
| Share-based compensation expense | | | — | | | | — | | | | — | | | | — | | | | 8,308 | | | | — | | | | — | | | | — | | | | 8,308 | |
| Repurchase and retirement of common stock | | | (4,589 | ) | | | (46 | ) | | | (18 | ) | | | (360 | ) | | | (80,651 | ) | | | — | | | | — | | | | — | | | | (81,057 | ) |
| Net income | | | — | | | | — | | | | — | | | | — | | | | — | | | | — | | | | — | | | | 50,172 | | | | 50,172 | |
| | | | | | | | | | | | | | | | | | | | | | | | | | | | | | | | | | | | | |
Balance at January 31, 2007 | | | 67,247 | | | $ | 672 | | | | (18 | ) | | $ | (360 | ) | | $ | 501,437 | | | $ | — | | | $ | — | | | $ | (122,903 | ) | | $ | 378,846 | |
| | | | | | | | | | | | | | | | | | | | | | | | | | | | | | | | | | | | | |
See Accompanying Notes to Consolidated Financial Statements
72
CKE RESTAURANTS, INC. AND SUBSIDIARIES
CONSOLIDATED STATEMENTS OF CASH FLOWS
(In thousands)
| | | | | | | | | | | | | |
| | | Fiscal Years Ended January 31, | |
| | | 2007 | | | 2006 | | | 2005 | |
| | | (as restated) | |
| |
| Cash flows from operating activities: | | | | | | | | | | | | |
| Net income | | $ | 50,172 | | | $ | 181,139 | | | $ | 18,016 | |
| Adjustments to reconcile net income to net cash provided by operating activities: | | | | | | | | | | | | |
| Depreciation and amortization | | | 62,418 | | | | 64,155 | | | | 66,793 | |
| Amortization of loan fees | | | 3,097 | | | | 3,312 | | | | 3,637 | |
| Share-based compensation expense | | | 8,308 | | | | 188 | | | | — | |
| (Recovery of) provision for losses on accounts and notes receivable | | | (192 | ) | | | 176 | | | | (1,940 | ) |
| Loss on sale of property and equipment, capital leases and extinguishment of debt | | | 3,449 | | | | 3,180 | | | | 9,676 | |
| Facility action charges, net | | | 8,546 | | | | 8,025 | | | | 14,320 | |
| Deferred income taxes | | | 25,961 | | | | (125,478 | ) | | | 295 | |
| Other non-cash charges | | | 77 | | | | 88 | | | | 79 | |
| Net changes in operating assets and liabilities: | | | | | | | | | | | | |
| Estimated liability for closing restaurants and estimated liability for self-insurance | | | (5,204 | ) | | | (13,701 | ) | | | (5,905 | ) |
| Refundable income taxes | | | (4,356 | ) | | | 612 | | | | (3,366 | ) |
| Receivables, inventories, prepaid expenses and other current and non-current assets | | | (3,739 | ) | | | (5,002 | ) | | | 1,766 | |
| Accounts payable and other current and long-term liabilities | | | 15,608 | | | | (521 | ) | | | 8,086 | |
| Operating cash flows of discontinued operations | | | — | | | | — | | | | 765 | |
| | | | | | | | | | | | | |
| Net cash provided by operating activities | | | 164,145 | | | | 116,173 | | | | 112,222 | |
| | | | | | | | | | | | | |
| Cash flows from investing activities: | | | | | | | | | | | | |
| Purchases of property and equipment | | | (117,268 | ) | | | (68,476 | ) | | | (58,621 | ) |
| Proceeds from sales of property and equipment | | | 21,929 | | | | 7,993 | | | | 12,881 | |
| Collections on notes receivable | | | 2,749 | | | | 898 | | | | 1,527 | |
| Increase in cash upon consolidation of variable interest entity | | | — | | | | — | | | | 100 | |
| Disposition of brand, net of cash surrendered | | | — | | | | — | | | | 6,954 | |
| Other investing activities | | | 62 | | | | (454 | ) | | | 132 | |
| Investing cash flows of discontinued operations | | | — | | | | — | | | | (269 | ) |
| | | | | | | | | | | | | |
| Net cash used in investing activities | | | (92,528 | ) | | | (60,039 | ) | | | (37,296 | ) |
| | | | | | | | | | | | | |
| Cash flows from financing activities: | | | | | | | | | | | | |
| Net change in bank overdraft. | | | 2,620 | | | | 108 | | | | (5,018 | ) |
| Borrowings under revolving credit facility | | | 127,000 | | | | 136,500 | | | | 55,000 | |
| Repayments of borrowings under revolving credit facility | | | (89,500 | ) | | | (143,000 | ) | | | (40,500 | ) |
| Proceeds from credit facility term loan | | | — | | | | — | | | | 230,000 | |
| Repayment of credit facility term loan | | | (28,928 | ) | | | (39,902 | ) | | | (115,411 | ) |
| Repayment of senior subordinated notes due 2009 | | | — | | | | — | | | | (200,000 | ) |
| Repayment of convertible subordinated notes due 2004 | | | — | | | | — | | | | (22,319 | ) |
| Repayment of other long-term debt | | | (145 | ) | | | (179 | ) | | | (152 | ) |
| Borrowings by consolidated variable interest entity | | | 38 | | | | 75 | | | | — | |
| Repayments of capital lease obligations | | | (4,937 | ) | | | (5,089 | ) | | | (7,143 | ) |
| Collections on officer and non-employee director notes receivable | | | — | | | | — | | | | 2,530 | |
| Payment of deferred loan fees | | | (2,733 | ) | | | (102 | ) | | | (6,193 | ) |
| Repurchase of common stock | | | (80,697 | ) | | | (3,998 | ) | | | (5,559 | ) |
| Proceeds from exercises of stock options and warrants | | | 10,327 | | | | 9,483 | | | | 4,023 | |
| Tax benefit from exercise of stock options | | | 2,801 | | | | — | | | | — | |
| Dividends paid on common stock | | | (10,126 | ) | | | (7,119 | ) | | | — | |
| Financing cash flows of discontinued operations | | | — | | | | — | | | | (107 | ) |
| | | | | | | | | | | | | |
| Net cash used in financing activities | | | (74,280 | ) | | | (53,223 | ) | | | (110,849 | ) |
| | | | | | | | | | | | | |
| Net (decrease) increase in cash and cash equivalents | | | (2,663 | ) | | | 2,911 | | | | (35,923 | ) |
| Cash and cash equivalents at beginning of year | | | 21,343 | | | | 18,432 | | | | 54,355 | |
| | | | | | | | | | | | | |
| Cash and cash equivalents at end of year | | $ | 18,680 | | | $ | 21,343 | | | $ | 18,432 | |
| | | | | | | | | | | | | |
See Accompanying Notes to Consolidated Financial Statements
73
CKE RESTAURANTS, INC. AND SUBSIDIARIES
NOTES TO CONSOLIDATED FINANCIAL STATEMENTS
Fiscal Years Ended January 31, 2007, 2006 and 2005
(Dollars in thousands, except per share amounts)
Note 1 — Significant Accounting Policies
A summary of certain significant accounting policies is set forth below.
Description of Business
CKE Restaurants, Inc. (“CKE” or the “Company”), through its wholly-owned subsidiaries, owns, operates, franchises and licenses the Carl’s Jr., Hardee’s, Green Burrito and La Salsa restaurant concepts. References to CKE Restaurants, Inc. throughout these Notes to Consolidated Financial Statements are made using the first person notations of “we,” “us” and “our.”
Carl’s Jr. restaurants are primarily located in the Western United States. Hardee’s restaurants are located throughout the Southeastern and Midwestern United States. Green Burrito restaurants are located in California, primarily in dual-branded Carl’s Jr. restaurants. La Salsa restaurants are primarily located in California. As of January 31, 2007, our system-wide restaurant portfolio consisted of:
| | | | | | | | | | | | | | | | | | | | | |
| | | Carl’s Jr. | | | Hardee’s | | | La Salsa | | | Other | | | Total | |
| |
| Company-operated | | | 393 | | | | 696 | | | | 55 | | | | 1 | | | | 1,145 | |
| Franchised and licensed | | | 694 | | | | 1,210 | | | | 41 | | | | 15 | | | | 1,960 | |
| | | | | | | | | | | | | | | | | | | | | |
| Total | | | 1,087 | | | | 1,906 | | | | 96 | | | | 16 | | | | 3,105 | |
| | | | | | | | | | | | | | | | | | | | | |
Basis of Presentation and Fiscal Year
The Consolidated Financial Statements include the accounts of CKE, our wholly-owned subsidiaries, and certain variable interest entities for which we are the primary beneficiary. All significant intercompany transactions are eliminated. Our fiscal year is 52 or 53 weeks, ending on the last Monday in January each year. Fiscal 2007 and 2006 each include 52 weeks of operations. Fiscal 2005 includes 53 weeks of operations. For clarity of presentation, we generally label all years presented as if the fiscal year ended January 31.
Restatement of Previously Issued Financial Statements
In connection with the preparation and review of our income tax provision for fiscal 2007, we identified errors in our income tax provision for fiscal 2006, which resulted primarily from mistakes made in summarizing various computations utilized to determine the cumulative difference between our book and tax bases in our fixed assets.
These errors resulted in an overstatement of our income tax benefit for the fiscal year ended January 31, 2006, by $13,443. For the Consolidated Financial Statements presented herein, we have restated our current and non-current deferred income tax assets; income tax benefit; net income; earnings per share and accumulated deficit as of and for the fiscal year ended January 31, 2006, to reflect the correction of the $13,443 overstatement of income tax benefit noted above. (See Note 20 for additional information.)
74
CKE RESTAURANTS, INC. AND SUBSIDIARIES
NOTES TO CONSOLIDATED FINANCIAL STATEMENTS — (Continued)
The impacts of the restatement on the previously issued Consolidated Financial Statements for fiscal 2006 are summarized as follows:
| | | | | | | | | | | | | |
| | | Previously
| | | | | | | |
| | | Reported | | | Adjustments | | | As Restated | |
| |
Fiscal 2006 | | | | | | | | | | | | |
Consolidated Balance Sheet Data | | | | | | | | | | | | |
| Deferred income tax assets, net | | $ | 31,413 | | | $ | 407 | | | $ | 31,820 | |
| Total current assets | | | 147,427 | | | | 407 | | | | 147,834 | |
| Deferred income tax assets, net | | | 117,770 | | | | (13,850 | ) | | | 103,920 | |
| Total assets | | | 804,780 | | | | (13,443 | ) | | | 791,337 | |
| Accumulated deficit | | | (149,235 | ) | | | (13,443 | ) | | | (162,678 | ) |
| Total stockholders’ equity | | | 322,381 | | | | (13,443 | ) | | | 308,938 | |
| Total liabilities and stockholders’ equity | | | 804,780 | | | | (13,443 | ) | | | 791,337 | |
Consolidated Statement of Income Data | | | | | | | | | | | | |
| Income tax benefit | | | (137,331 | ) | | | 13,443 | | | | (123,888 | ) |
| Income from continuing operations | | | 194,582 | | | | (13,443 | ) | | | 181,139 | |
| Net income | | | 194,582 | | | | (13,443 | ) | | | 181,139 | |
| Basic income per common share: | | | | | | | | | | | | |
| Continuing operations | | | 3.29 | | | | (0.23 | ) | | | 3.06 | |
| Net income | | | 3.29 | | | | (0.23 | ) | | | 3.06 | |
| Diluted income per common share: | | | | | | | | | | | | |
| Continuing operations | | | 2.70 | | | | (0.19 | ) | | | 2.51 | |
| Net income | | | 2.70 | | | | (0.19 | ) | | | 2.51 | |
Consolidated Statement of Cash Flows Data | | | | | | | | | | | | |
| Cash flows from operating activities: | | | | | | | | | | | | |
| Net income | | | 194,582 | | | | (13,443 | ) | | | 181,139 | |
| Adjustments to reconcile net income to net cash provided by operating activities: | | | | | | | | | | | | |
| Deferred income taxes | | | (138,921 | ) | | | 13,443 | | | | (125,478 | ) |
Variable Interest Entities
As required by Financial Accounting Standards Board (“FASB”) Interpretation 46R,Consolidation of Variable Interest Entities — an interpretation of ARB No. 51(“FIN 46R”), we consolidate one franchise entity that operates five Hardee’s restaurants since we have concluded that we are the primary beneficiary of this variable interest entity (“VIE”). The assets and liabilities of, and minority interest in, this VIE have been included in our accompanying Consolidated Balance Sheets and are not significant to our consolidated financial position. The operating results of this VIE have been included in our accompanying Consolidated Statements of Income for the fiscal years ended January 31, 2007, 2006 and 2005, and are not significant to our consolidated results of operations.
We also consolidate a national and approximately 82 local co-operative advertising funds (“Hardee’s Funds”). We have included $17,896 of advertising fund assets, restricted, and advertising fund liabilities in our accompanying Consolidated Balance Sheet as of January 31, 2007, and $17,226 of advertising fund assets, restricted, and advertising fund liabilities in our accompanying Consolidated Balance Sheet as of January 31, 2006. Advertising fund assets, restricted, are comprised primarily of cash and receivables. Advertising fund liabilities are
75
CKE RESTAURANTS, INC. AND SUBSIDIARIES
NOTES TO CONSOLIDATED FINANCIAL STATEMENTS — (Continued)
comprised primarily of accounts payable and deferred obligations. The Hardee’s Funds have been included in our accompanying Consolidated Statements of Income for the fiscal years ended January 31, 2007, 2006 and 2005, on a net basis, whereby, in accordance with Statement of Financial Accounting Standards (“SFAS”) 45,Accounting for Franchise Fee Revenue,we do not reflect franchisee contributions as revenue, but rather as an offset to reported advertising expenses.
Although the VIEs referred to above have been included in our accompanying Consolidated Financial Statements as of and for the fiscal years ended January 31, 2007, 2006 and 2005, we have no rights to the assets, nor do we have any obligation with respect to the liabilities, of these VIEs. None of our assets serve as collateral for the creditors of these VIEs.
Certain of our Carl’s Jr. franchisees, which combine to operate approximately 8.9% of all Carl’s Jr. franchise restaurants, are VIEs in which we hold a significant variable interest, but for which we are not the primary beneficiary. Our significant exposures related to these VIEs relate to the collection of amounts due to us, guarantees of franchisee debt that we provide to third-party lenders (see Note 27), and primary lease obligations or fee property ownership underlying sublease and lease arrangements that we have with these entities (see Note 8).
Cash and Cash Equivalents
For purposes of reporting cash and cash equivalents, highly liquid investments purchased with original maturities of three months or less, are considered cash equivalents. The carrying amounts reported in our accompanying Consolidated Balance Sheets for these instruments approximate their fair values.
Inventories
Inventories are stated at the lower of cost (on afirst-in, first-out basis) or market, and consist primarily of restaurant food, paper, equipment and supplies.
Deferred Financing Costs
Costs related to the issuance of debt are deferred and amortized, utilizing the effective interest method, as a component of interest expense over the terms of the respective debt issues. Upon entering into or modifying our financing arrangements, we account for deferred financing costs in accordance with Emerging Issues Task Force(“EITF”) 98-14,Debtor’s Accounting for Changes in Line of Credit or Revolving-Debt Arrangements, andEITF 96-19,Debtor’s Accounting for a Modification or Exchange of Debt Instruments.
Assets Held for Sale
Assets held for sale consist of individual properties we have decided to divest that we expect to sell within one year. Such assets are classified as current assets upon meeting the requirements of SFAS 144,Accounting for the Impairment or Disposal of Long-Lived Assets. Upon classification of such assets as assets held for sale, we no longer depreciate such assets.
As of January 31, 2007, assets of $3,949 were classified as held for sale in our Carl’s Jr. ($1,316) and Hardee’s ($2,633) operating segments, respectively. There were no assets held for sale as of January 31, 2006.
Property and Equipment
Property and equipment are recorded at cost, less accumulated depreciation, amortization and impairment write-downs. Depreciation is computed using the straight-line method based on the assets’ estimated useful lives, which generally range from three to 40 years. Leasehold improvements are amortized on a straight-line basis over the shorter of the estimated useful lives of the assets or the related lease term, as determined in accordance with
76
CKE RESTAURANTS, INC. AND SUBSIDIARIES
NOTES TO CONSOLIDATED FINANCIAL STATEMENTS — (Continued)
SFAS 13,Accounting for Leases, as amended. In circumstances in which leasehold improvements are made during the course of a lease term such that the exercise of options available to us to extend the lease term becomes reasonably assured, such leasehold improvements may be amortized over periods that include one or more lease option terms.
Capitalized Costs
We have elected to account for construction costs in a manner similar to SFAS 67,Accounting for Costs and Initial Rental Operations of Real Estate Projects. As such, costs that have a future benefit for the project(s) are capitalized. If we subsequently make a determination that a site for which development costs have been capitalized will not be acquired or developed, any previously capitalized development costs are expensed and included in general and administrative expenses.
Goodwill
In accordance with SFAS 142,Goodwill and Other Intangible Assets, goodwill is tested annually for impairment, or more frequently if events or circumstances indicate that the asset might be impaired. We perform our annual impairment test during the first quarter of our fiscal year. An impairment loss is recognized to the extent that the carrying amount exceeds the asset’s fair value. The impairment test is performed at the reporting unit level, which we have determined to be the brand level. The impairment test consists of two steps. First, we determine the fair value of a reporting unit and compare it to its carrying amount. Second, if the carrying amount of a reporting unit exceeds its fair value, an impairment loss is recognized for any excess of the carrying amount of the reporting unit’s goodwill over the implied fair value of that goodwill. The implied fair value of goodwill is determined by allocating the fair value of the reporting unit in a manner similar to a purchase price allocation, in accordance with SFAS 141,Business Combinations. The residual fair value after this allocation is the implied fair value of the reporting unit’s goodwill.
Facility Action Charges
From time to time, we identify under-performing restaurants that have carrying values in excess of their fair values and, as a result, we may record an impairment charge. We may also close or refranchise these or other restaurants and lease or sublease the restaurant property to a franchisee or to a business other than one of our restaurant concepts. The following costs that result from these actions are recorded in our accompanying Consolidated Statements of Income as facility action charges, net:
(i) impairment of long-lived assets for under-performing restaurants to be disposed of or held and used;
(ii) store closure costs, including sublease of closed facilities at amounts below our primary lease obligation;
(iii) gains (losses) on the sale of restaurants; and
(iv) amortization of discount related to estimated liability for closing restaurants.
Considerable management judgment is necessary to estimate future cash flows, including cash flows from continuing use, terminal value, closure costs, expected sublease income and refranchising proceeds. Accordingly, actual results could vary significantly from our estimates.
(i) Impairment of Long-Lived Assets
In accordance with SFAS 144, long-lived assets, such as property, plant and equipment and purchased intangibles subject to amortization, are reviewed for impairment whenever events or changes in circumstances indicate that the carrying amount of an asset may not be recoverable. Recoverability of assets to be held and used is measured by a comparison of the carrying amount of an asset (including the value of associated intangible assets) to
77
CKE RESTAURANTS, INC. AND SUBSIDIARIES
NOTES TO CONSOLIDATED FINANCIAL STATEMENTS — (Continued)
its related estimated undiscounted future cash flows. If the undiscounted future cash flows are less than the carrying value, an impairment charge is recognized to the extent that the carrying amount of the asset exceeds the fair value of the asset. We typically estimate the fair value of assets based on the estimated future cash flows discounted at an estimated weighted-average cost of capital. Upon recording the impairment charge, the estimated fair value becomes the asset’s new cost basis.
For purposes of the recoverability analysis, assets are grouped at the lowest level for which identifiable cash flows are largely independent of the cash flows of other assets and liabilities, which is generally the individual restaurant level for fixed assets, capital lease assets and favorable leases. However, intangible assets, such as trademarks and franchise agreements, are grouped at a higher level, such as the concept level or franchise operations thereof, since we have determined such groupings to be the lowest level at which largely independent cash flows associated with these assets can be identified.
(ii) Store Closure Costs
We typically make decisions to close restaurants based on prospects for estimated future profitability. However, sometimes we are forced to close restaurants due to circumstances beyond our control (e.g., a landlord’s refusal to negotiate a new lease). Our restaurant operators evaluate each restaurant’s performance on a quarterly basis. When restaurants continue to perform poorly, we consider a number of factors, including the demographics of the location and the likelihood of being able to improve an unprofitable restaurant. Based on the operator’s judgment and a financial review, we estimate the future cash flows. If we determine that the restaurant will not, within a reasonable period of time, operate at break-even cash flow or be profitable, and we are not contractually obligated to continue operating the restaurant, we may decide to close the restaurant.
We establish the estimated liability on the actual closure date. Prior to the adoption of SFAS 146,Accounting for Costs Associated with Exit or Disposal Activities, on January 1, 2003, we established the estimated liability when management identified a restaurant for closure, which may or may not have been the actual closure date. The estimated liability for closing restaurants is generally based on the remaining obligation through the end of the lease term, net of estimated sublease revenues, as well as estimated maintenance costs.
The amount of the estimated liability established is the present value of these estimated future net payments. The interest rate used to calculate the present value of these liabilities is based on an estimated credit-adjusted risk-free rate at the time the liability is established, which was 9.0% as of January 31, 2007. The related discount is amortized and shown as an additional component of facility action charges, net, in our accompanying Consolidated Statements of Income.
(iii) Gains (Losses) on the Sale of Restaurants
We record gains and losses on the sale of restaurants as the difference between the net proceeds received and net carrying values of the net assets of the restaurants sold.
(iv) Amortization of Discount Related to Estimated Liability for Closing Restaurants
We record this amortization as a component of facility action charges, net.
Guarantees
We apply FASB Interpretation (“FIN”) 45,Guarantor’s Accounting and Disclosure Requirements for Guarantees, Including Indirect Guarantees of Indebtedness to Others, an interpretation of SFAS 5, SFAS 57 and SFAS 107 and a rescission of FASB Interpretation 34. FIN 45 elaborates on the disclosures to be made by a guarantor in its interim and annual financial statements about its obligations under guarantees issued. FIN 45 also clarifies that a guarantor is required to recognize, at inception of a guarantee, a liability for the fair value of certain
78
CKE RESTAURANTS, INC. AND SUBSIDIARIES
NOTES TO CONSOLIDATED FINANCIAL STATEMENTS — (Continued)
obligations undertaken. The initial recognition and measurement provisions were applicable to certain guarantees issued or modified after December 31, 2002.
Loss Contingencies
As required by SFAS 5,Accounting for Contingencies, we assess each loss contingency to determine estimates of the degree of probability and range of possible settlement. Those contingencies that are deemed to be probable and where the amount of such settlement can be reasonably estimated are accrued in our Consolidated Financial Statements. We do not record liabilities for losses we believe are only reasonably possible to result in an adverse outcome. See Note 27 for further discussion.
Self-Insurance
We are self-insured for a portion of our current and prior years’ losses related to worker’s compensation, general and auto liability insurance programs. We have obtained stop-loss insurance for individual workers’ compensation, general and auto liability claims over $500. Accrued liabilities for self-insurance are recorded based on the present value of actuarial estimates of the amounts of incurred and unpaid losses, based on an estimated risk-free interest rate of 4.5% as of January 31, 2007. These estimates rely on actuarial observations of historical claim loss development. Our actual future loss development may be better or worse than these estimates.
Our actuary provides us with estimated unpaid losses for each insurance category, upon which our analysis is based. As of January 31, 2007, our estimated liability for self-insured workers’ compensation, general and auto liability losses was $37,833.
Leases and Leasehold Improvements
We account for our leases in accordance with SFAS 13, as amended, and other related guidance. At the inception of the lease, each property is evaluated to determine whether the lease is an operating or capital lease. When determining the lease term, we include option periods for which failure to renew the lease imposes a penalty on us in such an amount that a renewal appears, at the inception of the lease, to be reasonably assured. The primary penalty to which we are subject is the economic detriment associated with the existence of leasehold improvements which might be impaired if we choose not to continue the use of the leased property.
We record rent expense for leases that contain scheduled rent increases on a straight-line basis over the term of the lease. The lease term used for straight-line rent expense is calculated from the date we are given control of the leased premises through the end of the lease term, as established in accordance with SFAS 13, which may include a rent holiday period prior to our opening the restaurant on the leased premises. The lease term used for this evaluation also provides the basis for establishing depreciable lives for buildings subject to lease and leasehold improvements, as well as the period over which we record straight-line rent expense. Contingent rentals are generally based on revenue in excess of stipulated amounts, and thus are not considered minimum lease payments and are included in rent expense as they are incurred. We generally do not receive rent concessions or leasehold improvement incentives upon opening a store that is subject to a lease.
Franchise and Licensed Operations
We execute franchise or license agreements for each brand that set out the terms of its arrangement with the franchisee or licensee. Our franchise and certain license agreements require the franchisee or licensee to pay an initial, non-refundable fee and continuing fees based upon a percent of gross sales. Subject to our approval and payment of a renewal fee, a franchisee may generally renew the franchise agreement upon its expiration.
We incur expenses that benefit both our franchisee and licensee communities. These expenses, along with other costs of sales and servicing of franchise and license agreements, are charged to franchised and licensed
79
CKE RESTAURANTS, INC. AND SUBSIDIARIES
NOTES TO CONSOLIDATED FINANCIAL STATEMENTS — (Continued)
restaurants and other expense as incurred. Franchised and licensed restaurants and other revenue also includes rent income from leasing or subleasing restaurants to franchisees. The related occupancy costs are included in franchised and licensed restaurants and other expense. If we lease restaurants to a franchisee that results in a probable loss over the term of the lease, a lease subsidy allowance is established at inception and charged to facility action charges, net.
We monitor the financial condition of certain franchisees and record provisions for estimated losses on receivables when we believe that our franchisees are unable to make their required payments to us. Each quarter, we perform an analysis to estimate bad debts for each franchisee. We then compare the aggregate result of that analysis to the amount recorded in our Consolidated Financial Statements as the allowance for doubtful accounts and adjust the allowance as appropriate. Additionally, we cease accruing royalties and rental income from franchisees that are materially delinquent in paying or in default for other reasons and reverse any royalties and rent income accrued during the fiscal quarter in which such delinquency or default occurs. Over time, our assessment of individual franchisees may change. For instance, we have had some franchisees, who in the past we had determined required an estimated loss equal to the total amount of the receivable, who have paid us in full or established a consistent record of payments (generally six months) such that we determined an allowance was no longer required.
Depending on the facts and circumstances, there are a number of different actions weand/or our franchisees may take to resolve franchise collections issues. These actions may include the purchase of franchise restaurants by us or by other franchisees, a modification to the franchise agreement (which may include a provision to defer certain royalty payments or reduce royalty rates in the future), a restructuring of the franchisee’s businessand/or finances (including the restructuring of leases for which we are the primary obligee — see further discussion below) or, if necessary, the termination of the franchise agreement. The allowance established is based on our assessment of the most likely course of action that will occur.
Revenue Recognition
Revenues for company-operated restaurants are recognized upon the sale of food or beverage to a customer in the restaurant. Revenues from franchised and licensed restaurants include continuing rent and service fees, initial fees and royalties. Continuing fees and royalties are recognized in the period earned. Initial fees are recognized upon the opening of a restaurant, which is when we have performed substantially all initial services required by the franchise agreement. Renewal fees are recognized when a renewal agreement becomes effective. Rental income is recognized in the period earned. Sales of food and equipment to franchisees are recognized at the time of delivery to the franchisees.
Advertising
We utilize a single advertising fund (“Carl’s Jr. Fund”) to administer our Carl’s Jr. advertising programs and the Hardee’s Funds to administer our Hardee’s advertising programs. As the contributions to these cooperatives collectively, are designated and segregated for advertising, we act as an agent for the franchisees and licensees with regard to these contributions. We consolidate the Carl’s Jr. Fund into our financial statements on a net basis, whereby contributions from franchisees, when received, are recorded as offsets to our reported advertising expenses, in accordance with SFAS 45.
We charge Carl’s Jr. and La Salsa marketing costs to expense ratably in relation to revenues over the year in which incurred and, in the case of advertising production costs, when the commercial is first aired. To the extent we participate in Hardee’s advertising cooperatives, our contributions are expensed as incurred.
80
CKE RESTAURANTS, INC. AND SUBSIDIARIES
NOTES TO CONSOLIDATED FINANCIAL STATEMENTS — (Continued)
Income Taxes
Our current provision for income taxes is based on our estimated taxable income in each of the jurisdictions in which we operate, after considering the impact on our taxable income of temporary differences resulting from disparate treatment of items, such as depreciation, estimated liability for closing restaurants, estimated liabilities for self-insurance, tax credits and net operating losses (“NOL”) for tax and financial reporting purposes. Deferred income taxes are provided for the estimated future income tax effect of temporary differences between the financial and tax bases of assets and liabilities using the liability method. Deferred tax assets are also provided for NOL and income tax credit carryforwards. A valuation allowance to reduce the carrying amount of deferred tax assets is established when it is more likely than not that we will not realize some portion or all of the tax benefit of our deferred tax assets. We evaluate, on a quarterly basis, whether it is more likely than not that our deferred income tax assets are realizable. In performing this analysis, we consider all available evidence, both positive and negative, including historical operating results, the estimated timing of future reversals of existing taxable temporary differences, estimated future taxable income exclusive of reversing temporary differences and carryforwards, and potential tax planning strategies that may be employed to prevent an operating loss or tax credit carryforwards from expiring unused. Deferred tax assets and liabilities are measured using enacted tax rates expected to apply to taxable income in the years in which those temporary differences are expected to be recovered or settled. The effect on deferred tax assets and liabilities of a change in tax rates is recognized in income in the period that includes the enactment date.
Estimations
The preparation of financial statements in conformity with U.S. generally accepted accounting principles (“GAAP”) requires management to make estimates and assumptions that affect the reported amounts of assets and liabilities and disclosure of contingent assets and liabilities at the date of the financial statements and the reported amounts of revenue and expenses during the reporting period. Actual results could differ from those estimates.
Our most significant areas of estimation are:
| | |
| | • | estimation of future cash flows used to assess the recoverability of long-lived assets, including goodwill, and to establish the estimated liability for closing restaurants and subsidizing lease payments of franchisees; |
| |
| | • | estimation, using actuarially determined methods, of our self-insured claim losses under our workers’ compensation, general and auto liability insurance programs; |
| |
| | • | determination of appropriate estimated liabilities for loss contingencies; |
| |
| | • | determination of appropriate assumptions to use in evaluating leases for capital versus operating lease treatment, establishing depreciable lives for leasehold improvements and establishing straight-line rent expense periods; |
| |
| | • | estimation of the appropriate allowances associated with franchise and license receivables and liabilities for franchise subleases; |
| |
| | • | determination of the appropriate assumptions to use to estimate the fair value of share-based compensation; and |
| |
| | • | estimation of our net deferred income tax asset valuation allowance and effective tax rate. |
Income Per Share
We present “basic” and “diluted” income per share. Basic income per share represents net income divided by weighted-average shares outstanding. Diluted income per share represents net income plus the interest and fees
81
CKE RESTAURANTS, INC. AND SUBSIDIARIES
NOTES TO CONSOLIDATED FINANCIAL STATEMENTS — (Continued)
relating to any dilutive convertible debt outstanding, divided by weighted-average shares outstanding, including all potentially dilutive securities and excluding all potentially anti-dilutive securities.
The dilutive effect of stock options and warrants is determined using the “treasury stock” method, whereby exercise is assumed at the beginning of the reporting period and proceeds from such exercise, unamortized compensation on share-based awards, and tax benefits arising in connection with share-based compensation, are assumed to be used to purchase our common stock at the average market price during the period. The dilutive effect of convertible debt is determined using the “if-converted” method, whereby interest charges and amortization of debt issuance costs, net of taxes, applicable to the convertible debt are added back to income and the convertible debt is assumed to have been converted at the beginning of the reporting period, with the resulting common shares being included in weighted-average shares.
The table below presents the computation of basic and diluted earnings per share for the fiscal years ended January 31, 2007, 2006 and 2005 as follows:
| | | | | | | | | | | | | |
| | | 2007 | | | 2006 | | | 2005 | |
| | | (as restated) | |
| |
| Net income for computation of basic earnings per share | | $ | 50,172 | | | $ | 181,139 | | | $ | 18,016 | |
| | | | | | | | | | | | | |
| Weighted-average shares for computation of basic earnings per share | | | 63,562 | | | | 59,226 | | | | 57,615 | |
| | | | | | | | | | | | | |
| Basic net income per share | | $ | 0.79 | | | $ | 3.06 | | | $ | 0.31 | |
| | | | | | | | | | | | | |
| Net income for computation of basic earnings per share | | $ | 50,172 | | | $ | 181,139 | | | $ | 18,016 | |
| Add: Interest and amortization costs for Convertible Subordinated Notes due 2023, net of related tax effect | | | 1,880 | | | | 3,070 | | | | — | |
| | | | | | | | | | | | | |
| Net income for computation of diluted earnings per share | | $ | 52,052 | | | $ | 184,209 | | | $ | 18,016 | |
| | | | | | | | | | | | | |
| Weighted-average shares for computation of basic earnings per share | | | 63,562 | | | | 59,226 | | | | 57,615 | |
| Dilutive effect of stock options, warrants and restricted stock | | | 1,509 | | | | 2,181 | | | | 1,968 | |
| Dilutive effect of Convertible Subordinated Notes due 2023 | | | 7,306 | | | | 11,843 | | | | — | |
| | | | | | | | | | | | | |
| Weighted-average shares for computation of diluted earnings per share | | | 72,377 | | | | 73,250 | | | | 59,583 | |
| | | | | | | | | | | | | |
| Diluted net income per share | | $ | 0.72 | | | $ | 2.51 | | | $ | 0.30 | |
| | | | | | | | | | | | | |
The following table presents the number of potentially dilutive shares, in thousands, of our common stock excluded from the computation of diluted income per share as their effect would have been anti-dilutive for the fiscal years ended January 31, 2007, 2006 and 2005:
| | | | | | | | | | | | | |
| | | 2007 | | | 2006 | | | 2005 | |
| |
| Convertible Subordinated Notes due 2023 | | | — | | | | — | | | | 11,811 | |
| Stock Options and Restricted Stock | | | 1,897 | | | | 2,175 | | | | 2,813 | |
| Warrants | | | — | | | | — | | | | 982 | |
Share-Based Compensation
At January 31, 2007, we had several stock-based employee compensation plans in effect, which are described more fully in Note 23. Prior to fiscal 2007, we accounted for our stock-based employee compensation plans under the recognition and measurement principles of Accounting Principles Board Opinion 25,Accounting for Stock
82
CKE RESTAURANTS, INC. AND SUBSIDIARIES
NOTES TO CONSOLIDATED FINANCIAL STATEMENTS — (Continued)
Issued to Employees(“APB 25”), and related Interpretations. We adopted SFAS 123 (revised 2004),Share-Based Payment (“SFAS 123R”), at the beginning of fiscal 2007 using the modified prospective method. See Note 23 for a description of the impact of this adoption on our consolidated financial position and results of operations.
Derivative Financial Instruments
We do not use derivative instruments for trading purposes. Our only free standing current derivative instruments are interest rate cap agreements entered into with financial institutions.
We account for these derivative financial instruments in accordance with SFAS 133,Accounting for Derivative Instruments and Hedging Activities,as amended. SFAS 133 requires that all derivative instruments be recognized in our Consolidated Balance Sheets at fair value. Our interest rate cap agreements are not designated as hedging instruments. Accordingly, the gain or loss as a result of the change in fair value is recognized in the results of operations immediately. See Note 11 for a discussion of our use of interest rate cap agreements.
Credit Risks
Accounts receivable consists primarily of amounts due from franchisees and licensees for initial and continuing fees. In addition, we have notes and lease receivables from certain of our franchisees. The financial condition of these franchisees and licensees is largely dependent upon the underlying business trends of our brands. This concentration of credit risk is mitigated, in part, by the large number of franchisees and licensees of each brand and the short-term nature of the franchise and license fee receivables.
Credit risk from interest rate cap agreements is dependent both on movement in interest rates and the possibility of non-payment by counterparties. We mitigate credit risk by entering into these agreements with high-quality counterparties.
Comprehensive Income
We did not have any items of other comprehensive income requiring reporting under SFAS 130,Reporting Comprehensive Income during fiscal 2007, 2006 and 2005.
Segment Information
Operating segments are defined as components of an enterprise for which separate financial information is available that is evaluated regularly by the chief operating decision maker in deciding how to allocate resources and in assessing performance. Our segments are determined at the brand level (see Note 22).
Reclassifications
Certain prior year amounts in the Consolidated Financial Statements have been reclassified to conform to current year presentation.
Note 2 — Accounting Pronouncements Not Yet Adopted
In February 2006, the FASB issued SFAS 155,Accounting for Certain Hybrid Financial Instruments — an amendment of FASB Statements No. 133 and 140. SFAS 155 allows financial instruments that contain an embedded derivative and that otherwise would require bifurcation to be accounted for as a whole on a fair value basis, at the holders’ election. SFAS 155 also clarifies and amends certain other provisions of SFAS 133 and SFAS 140,Accounting for Transfers and Servicing of Financial Assets and Extinguishments of Liabilities — a replacement of FASB Statement 125.This statement is effective for all financial instruments acquired or issued in fiscal years
83
CKE RESTAURANTS, INC. AND SUBSIDIARIES
NOTES TO CONSOLIDATED FINANCIAL STATEMENTS — (Continued)
beginning after September 15, 2006, which for us is the beginning of fiscal 2008. We are currently evaluating the impact of SFAS 155 on our consolidated financial position and results of operations.
In March 2006, the FASB issued SFAS 156,Accounting for Servicing of Financial Assets — an amendment of FASB Statement No. 140. SFAS 156 provides guidance on the accounting for servicing assets and liabilities when an entity undertakes an obligation to service a financial asset by entering into a servicing contract. This statement is effective for all transactions in fiscal years beginning after September 15, 2006, which for us is the beginning of fiscal 2008. We are currently evaluating the impact of SFAS 156 on our consolidated financial position and results of operations.
In June 2006, the FASB issued FIN 48,Accounting for Uncertainty in Income Taxes — an interpretation of FASB Statement No. 109, which clarifies the accounting for uncertainty in income taxes recognized in financial statements. FIN 48 prescribes a recognition threshold and measurement attribute for the financial statement recognition and measurement of a tax position taken or expected to be taken in a tax return. FIN 48 requires the recognition, in the financial statements, of the impact of a tax position, if that position is more likely than not of being sustained on audit, based on the technical merits of the position. FIN 48 also provides guidance on derecognition, classification, interest and penalties, accounting in interim periods and disclosure. FIN 48 is effective for fiscal years beginning after December 15, 2006, which for us is the beginning of fiscal 2008. We are currently evaluating the impact of FIN 48 on our consolidated financial position and results of operations.
In June 2006, the FASB ratified EITF consensus06-3,How Taxes Collected from Customers and Remitted to Governmental Authorities Should Be Presented in the Income Statement (That Is, Gross versus Net Presentation). This EITF addresses the presentation of taxes in the income statement. Gross or net presentation may be elected for each different type of tax, but similar taxes should be presented consistently. Taxes within the scope of this EITF would include taxes that are imposed on a revenue transaction between a seller and a customer, for example, sales taxes, use taxes, value-added taxes, and some types of excise taxes. Our accounting policy is to present the taxes within the scope of EITF06-3 on a net basis. EITF06-3 is effective for interim and annual periods beginning after December 15, 2006, which for us is the first quarter of fiscal 2008. We are currently evaluating the impact of EITF06-3 on our consolidated results of operations.
In September 2006, the FASB issued SFAS 157,Fair Value Measurements. SFAS 157 establishes a framework for measuring fair value under GAAP and expands disclosures about fair value measurement. SFAS 157 also creates consistency and comparability in fair value measurements among the many accounting pronouncements that require fair value measurements but does not require any new fair value measurements. SFAS 157 is effective for fiscal years (including interim periods) beginning after November 15, 2007, which for us is the first quarter of fiscal 2009. We are currently evaluating the impact of SFAS 157 on our consolidated financial position and results of operations.
In February 2007, the FASB issued SFAS 159,The Fair Value Option for Financial Assets and Financial Liabilities — Including an amendment of FASB Statement No. 115. This standard amends SFAS 115,Accounting for Certain Investment in Debt and Equity Securities, with respect to accounting for a transfer to the trading category for all entities withavailable-for-sale and trading securities electing the fair value option. This standard allows companies to elect fair value accounting for many financial instruments and other items that currently are not required to be accounted as such, allows different applications for electing the option for a single item or groups of items, and requires disclosures to facilitate comparisons of similar assets and liabilities that are accounted for differently in relation to the fair value option. SFAS 159 is effective for fiscal years beginning after November 15, 2007, which for us is fiscal 2009. We are currently evaluating the impact of SFAS 159 on our consolidated financial position and results of operations.
84
CKE RESTAURANTS, INC. AND SUBSIDIARIES
NOTES TO CONSOLIDATED FINANCIAL STATEMENTS — (Continued)
Note 3 — Adoption of New Accounting Pronouncements
In November 2004, the FASB issued SFAS 151,Inventory Costs — an amendment of ARB No. 43, Chapter 4. SFAS 151 clarifies that abnormal amounts of idle facility expense, freight, handling costs, and wasted materials (spoilage) should be recognized as current period charges and requires the allocation of fixed production overheads to inventory based on the normal capacity of the production facilities. Our adoption of SFAS 151 at the beginning of fiscal 2007 did not have a material impact on our consolidated financial position or results of operations.
In December 2004, the FASB issued SFAS 123R which requires that companies recognize compensation expense equal to the fair value of stock options or other share-based payments. We adopted SFAS 123R at the beginning of fiscal 2007 using the modified prospective method. See Note 23 for a description of the impact of this adoption on our consolidated financial position and results of operations.
In May 2005, the FASB issued SFAS 154,Accounting Changes and Error Corrections — a replacement of APB Opinion No. 20 and FASB Statement No. 3. Previously, the cumulative effect of most changes in accounting principles was recognized in the period of the change. SFAS 154 requires companies to recognize changes in accounting principle, including changes required by a new accounting pronouncement when the pronouncement does not include specific transition provisions, retrospectively to prior periods’ financial statements. Our adoption of SFAS 154 at the beginning of fiscal 2007 did not have a material impact on our consolidated financial position or results of operations. We will apply the provisions of SFAS 154 in future periods, when applicable.
In October 2005, the FASB issued FASB Staff Position (“FSP”)FAS 13-1,Accounting for Rental Costs Incurred during a Construction Period,which requires that rental costs associated with ground or building operating leases that are incurred during a construction period must be recognized as rental expense and allocated over the lease term beginning on the date that the lessee is given control of the property. Our adoption of this FSP at the beginning of fiscal 2007 did not have a material impact on our consolidated financial position or results of operations.
In September 2006, the FASB issued SFAS 158,Employers’ Accounting for Defined Benefit Pension and Other Postretirement Plans — an amendment of FASB Statements No. 87, 88, 106 and 132(R). SFAS 158 requires the balance sheet recognition of the funded status of defined benefit pension and other postretirement plans, along with a corresponding after-tax adjustment to stockholders’ equity. Our adoption of SFAS 158 at the end of fiscal 2007 did not have a material impact on our consolidated financial position or results of operations.
In September 2006, the Securities and Exchange Commission (“SEC”) issued Staff Accounting Bulletin (“SAB”) 108,Considering the Effects of Prior Year Misstatements when Quantifying Misstatements in Current Year Financial Statements. SAB 108 provides interpretive guidance on how the effects of the carryover or reversal of prior year misstatements should be considered in quantifying a current year misstatement for the purpose of the materiality assessment. Our adoption of SAB 108 at the end of fiscal 2007 did not have a material impact on our consolidated financial position or results of operations.
Note 4 — Goodwill
As required by SFAS 142, we test goodwill for impairment, at least annually, at the reporting unit level, which we have determined to be the brand level. During the first quarters of fiscal 2007 and 2006, we completed our annual assessments of the valuation of the Carl’s Jr. brand. Those assessments concluded that the fair value of the brand exceeded the carrying value and no impairment was recorded. As of January 31, 2007 and 2006, we had $22,649 in goodwill recorded on our accompanying Consolidated Balance Sheets.
85
CKE RESTAURANTS, INC. AND SUBSIDIARIES
NOTES TO CONSOLIDATED FINANCIAL STATEMENTS — (Continued)
Note 5 — Facility Action Charges, Net
The components of facility action charges (gains) for the fiscal years ended January 31, 2007, 2006 and 2005 are as follows:
| | | | | | | | | | | | | |
| | | 2007 | | | 2006 | | | 2005 | |
| |
Carl’s Jr. | | | | | | | | | | | | |
| New decisions regarding closing restaurants | | $ | 74 | | | $ | — | | | $ | 269 | |
| Unfavorable dispositions of leased and fee surplus properties, net | | | 629 | | | | 846 | | | | 120 | |
| Impairment of assets to be disposed of | | | — | | | | — | | | | 28 | |
| Impairment of assets to be held and used | | | 364 | | | | 1,431 | | | | 2,693 | |
| Gain on sales of restaurants and surplus property, net | | | (651 | ) | | | (732 | ) | | | (611 | ) |
| Amortization of discount related to estimated liability for closing restaurants | | | 248 | | | | 247 | | | | 295 | |
| | | | | | | | | | | | | |
| | | | 664 | | | | 1,792 | | | | 2,794 | |
| | | | | | | | | | | | | |
Hardee’s | | | | | | | | | | | | |
| New decisions regarding closing restaurants | | | 3,038 | | | | 957 | | | | 5,247 | |
| Unfavorable (favorable) dispositions of leased and fee surplus properties, net | | | 4 | | | | (29 | ) | | | (1,364 | ) |
| Impairment of assets to be disposed of | | | 2,148 | | | | 23 | | | | 683 | |
| Impairment of assets to be held and used | | | 680 | | | | 2,521 | | | | 2,428 | |
| (Gain) loss on sales of restaurants and surplus property, net | | | (3,859 | ) | | | 504 | | | | (917 | ) |
| Amortization of discount related to estimated liability for closing restaurants | | | 483 | | | | 677 | | | | 1,011 | |
| | | | | | | | | | | | | |
| | | | 2,494 | | | | 4,653 | | | | 7,088 | |
| | | | | | | | | | | | | |
La Salsa and Other | | | | | | | | | | | | |
| New decisions regarding closing restaurants | | | 617 | | | | 157 | | | | 1,074 | |
| Unfavorable (favorable) dispositions of leased and fee surplus properties, net | | | 1,003 | | | | (268 | ) | | | 172 | |
| Impairment of assets to be disposed of | | | — | | | | — | | | | 755 | |
| Impairment of assets to be held and used | | | 2,574 | | | | 1,338 | | | | 2,434 | |
| Loss (gain) on sales of restaurants and surplus properties, net | | | 1,170 | | | | 347 | | | | (3 | ) |
| Amortization of discount related to estimated liability for closing restaurants | | | 24 | | | | 6 | | | | 6 | |
| | | | | | | | | | | | | |
| | | | 5,388 | | | | 1,580 | | | | 4,438 | |
| | | | | | | | | | | | | |
86
CKE RESTAURANTS, INC. AND SUBSIDIARIES
NOTES TO CONSOLIDATED FINANCIAL STATEMENTS — (Continued)
| | | | | | | | | | | | | |
| | | 2007 | | | 2006 | | | 2005 | |
| |
Total | | | | | | | | | | | | |
| New decisions regarding closing restaurants | | $ | 3,729 | | | $ | 1,114 | | | $ | 6,590 | |
| Unfavorable (favorable) dispositions of leased and fee surplus properties, net | | | 1,636 | | | | 549 | | | | (1,072 | ) |
| Impairment of assets to be disposed of | | | 2,148 | | | | 23 | | | | 1,466 | |
| Impairment of assets to be held and used | | | 3,618 | | | | 5,290 | | | | 7,555 | |
| (Gain) loss on sales of restaurants and surplus property, net | | | (3,340 | ) | | | 119 | | | | (1,531 | ) |
| Amortization of discount related to estimated liability for closing restaurants | | | 755 | | | | 930 | | | | 1,312 | |
| | | | | | | | | | | | | |
| | | $ | 8,546 | | | $ | 8,025 | | | $ | 14,320 | |
| | | | | | | | | | | | | |
Impairment charges recognized in facility action charges were recorded against the following asset categories during the fiscal years ended January 31, 2007, 2006 and 2005:
| | | | | | | | | | | | | |
| | | 2007 | | | 2006 | | | 2005 | |
| |
| Property and equipment | | | | | | | | | | | | |
| Carl’s Jr. | | $ | 332 | | | $ | 980 | | | $ | 2,721 | |
| Hardee’s | | | 2,779 | | | | 2,382 | | | | 2,868 | |
| La Salsa and Other | | | 2,536 | | | | 658 | | | | 3,189 | |
| | | | | | | | | | | | | |
| | | | 5,647 | | | | 4,020 | | | | 8,778 | |
| | | | | | | | | | | | | |
| Property under capital leases | | | | | | | | | | | | |
| Carl’s Jr. | | | — | | | | 451 | | | | — | |
| Hardee’s | | | 49 | | | | 162 | | | | 225 | |
| | | | | | | | | | | | | |
| | | | 49 | | | | 613 | | | | 225 | |
| | | | | | | | | | | | | |
| Favorable lease rights | | | | | | | | | | | | |
| Carl’s Jr. | | | 32 | | | | — | | | | — | |
| Hardee’s | | | — | | | | — | | | | 18 | |
| La Salsa | | | 38 | | | | 680 | | | | — | |
| | | | | | | | | | | | | |
| | | | 70 | | | | 680 | | | | 18 | |
| | | | | | | | | | | | | |
| Total | | | | | | | | | | | | |
| Carl’s Jr. | | | 364 | | | | 1,431 | | | | 2,721 | |
| Hardee’s | | | 2,828 | | | | 2,544 | | | | 3,111 | |
| La Salsa and Other | | | 2,574 | | | | 1,338 | | | | 3,189 | |
| | | | | | | | | | | | | |
| | | $ | 5,766 | | | $ | 5,313 | | | $ | 9,021 | |
| | | | | | | | | | | | | |
87
CKE RESTAURANTS, INC. AND SUBSIDIARIES
NOTES TO CONSOLIDATED FINANCIAL STATEMENTS — (Continued)
The following table summarizes the activity in our estimated liability for closing restaurants for the fiscal years ended January 31, 2005, 2006 and 2007:
| | | | | | | | | | | | | | | | | |
| | | | | | | | | La Salsa
| | | | |
| | | Carl’s Jr. | | | Hardee’s | | | and Other | | | Total | |
| |
| Balance at January 31, 2004 | | $ | 5,008 | | | $ | 17,115 | | | $ | 202 | | | $ | 22,325 | |
| New decisions regarding closing restaurants | | | 269 | | | | 5,247 | | | | 1,074 | | | | 6,590 | |
| Usage | | | (1,478 | ) | | | (8,934 | ) | | | (868 | ) | | | (11,280 | ) |
| Unfavorable (favorable) dispositions of leased and fee surplus properties, net | | | 120 | | | | (1,364 | ) | | | 172 | | | | (1,072 | ) |
| Amortization of discount | | | 295 | | | | 1,011 | | | | 6 | | | | 1,312 | |
| | | | | | | | | | | | | | | | | |
| Balance at January 31, 2005 | | | 4,214 | | | | 13,075 | | | | 586 | | | | 17,875 | |
| New decisions regarding closing restaurants | | | — | | | | 957 | | | | 157 | | | | 1,114 | |
| Usage | | | (1,692 | ) | | | (4,815 | ) | | | (361 | ) | | | (6,868 | ) |
| Unfavorable (favorable) dispositions of leased and fee surplus properties, net | | | 846 | | | | (29 | ) | | | (268 | ) | | | 549 | |
| Amortization of discount | | | 247 | | | | 677 | | | | 6 | | | | 930 | |
| | | | | | | | | | | | | | | | | |
| Balance at January 31, 2006 | | | 3,615 | | | | 9,865 | | | | 120 | | | | 13,600 | |
| New decisions regarding closing restaurants | | | 74 | | | | 3,038 | | | | 617 | | | | 3,729 | |
| Usage | | | (1,380 | ) | | | (4,217 | ) | | | (94 | ) | | | (5,691 | ) |
| Unfavorable dispositions of leased and fee surplus properties, net | | | 629 | | | | 4 | | | | 1,003 | | | | 1,636 | |
| Amortization of discount | | | 248 | | | | 483 | | | | 24 | | | | 755 | |
| | | | | | | | | | | | | | | | | |
| Balance at January 31, 2007 | | | 3,186 | | | | 9,173 | | | | 1,670 | | | | 14,029 | |
| Less current portion, included in other current liabilities | | | 1,036 | | | | 2,829 | | | | 556 | | | | 4,421 | |
| | | | | | | | | | | | | | | | | |
| Long-term portion, included in other long-term liabilities | | $ | 2,150 | | | $ | 6,344 | | | $ | 1,114 | | | $ | 9,608 | |
| | | | | | | | | | | | | | | | | |
Note 6 — Accounts Receivable, Net, and Notes Receivable, Net
Accounts receivable, net as of January 31, 2007 and 2006 consists of the following:
| | | | | | | | | |
| | | 2007 | | | 2006 | |
| |
| Trade receivables | | $ | 34,686 | | | $ | 31,296 | |
| Refundable income taxes | | | 8,253 | | | | 3,896 | |
| Notes receivable, current portion | | | 704 | | | | 3,676 | |
| Other | | | 63 | | | | 118 | |
| Allowance for doubtful accounts | | | (902 | ) | | | (2,833 | ) |
| | | | | | | | | |
| | | $ | 42,804 | | | $ | 36,153 | |
| | | | | | | | | |
88
CKE RESTAURANTS, INC. AND SUBSIDIARIES
NOTES TO CONSOLIDATED FINANCIAL STATEMENTS — (Continued)
The long-term portion of notes receivable, net as of January 31, 2007 and 2006 consists of the following:
| | | | | | | | | |
| | | 2007 | | | 2006 | |
| |
| Franchisees | | $ | 1,243 | | | $ | 5,804 | |
| Employees | | | 36 | | | | 71 | |
| Other | | | 2,282 | | | | 2,350 | |
| Allowance for doubtful accounts | | | (2,786 | ) | | | (6,257 | ) |
| | | | | | | | | |
| | | $ | 775 | | | $ | 1,968 | |
| | | | | | | | | |
The following table summarizes the activity in the allowances for doubtful accounts for the fiscal years ended January 31, 2005, 2006 and 2007:
| | | | | | | | | | | | | |
| | | Accounts
| | | Notes
| | | | |
| | | Receivable | | | Receivable | | | Total | |
| |
| Balance at January 31, 2004 | | $ | 5,580 | | | $ | 6,186 | | | $ | 11,766 | |
| Provision (recovery of provision) | | | (2,835 | ) | | | 895 | | | | (1,940 | ) |
| Charge-offs | | | (334 | ) | | | — | | | | (334 | ) |
| Recoveries | | | 131 | | | | — | | | | 131 | |
| | | | | | | | | | | | | |
| Balance at January 31, 2005 | | | 2,542 | | | | 7,081 | | | | 9,623 | |
| Provision (recovery of provision) | | | 663 | | | | (487 | ) | | | 176 | |
| Charge-offs | | | (441 | ) | | | (337 | ) | | | (778 | ) |
| Recoveries | | | 69 | | | | — | | | | 69 | |
| | | | | | | | | | | | | |
| Balance at January 31, 2006 | | | 2,833 | | | | 6,257 | | | | 9,090 | |
| Provision (recovery of provision) | | | (1,436 | ) | | | 1,244 | | | | (192 | ) |
| Charge-offs | | | (495 | ) | | | (4,715 | ) | | | (5,210 | ) |
| | | | | | | | | | | | | |
| Balance at January 31, 2007 | | $ | 902 | | | $ | 2,786 | | | $ | 3,688 | |
| | | | | | | | | | | | | |
Note 7 — Property and Equipment
Property and equipment consists of the following as of January 31, 2007 and 2006:
| | | | | | | | | | | | | |
| | | Estimated
| | | | | | | |
| | | Useful Life | | | 2007 | | | 2006 | |
| |
| Land | | | | | | $ | 137,561 | | | $ | 129,635 | |
| Leasehold improvements | | | 3-25 years | | | | 212,364 | | | | 198,982 | |
| Buildings and improvements | | | 7-40 years | | | | 283,056 | | | | 261,111 | |
| Equipment, furniture and fixtures | | | 3-10 years | | | | 306,309 | | | | 301,357 | |
| | | | | | | | | | | | | |
| | | | | | | | 939,290 | | | | 891,085 | |
| Less: accumulated depreciation and amortization | | | | | | | (450,700 | ) | | | (431,002 | ) |
| | | | | | | | | | | | | |
| | | | | | | $ | 488,590 | | | $ | 460,083 | |
| | | | | | | | | | | | | |
During fiscal 2007, 2006 and 2005, we capitalized interest costs in the amounts of $841, $617 and $546, respectively.
89
CKE RESTAURANTS, INC. AND SUBSIDIARIES
NOTES TO CONSOLIDATED FINANCIAL STATEMENTS — (Continued)
Note 8 — Leases
We occupy land and buildings under lease agreements expiring on various dates through 2044. Many leases provide for future rent escalations and renewal options. In addition, contingent rentals, determined as a percentage of revenue in excess of specified levels, are often required. Most leases obligate us to pay costs of maintenance, insurance and property taxes.
Property under capital leases consists of the following as of January 31, 2007 and 2006:
| | | | | | | | | |
| | | 2007 | | | 2006 | |
| |
| Buildings | | $ | 69,726 | | | $ | 72,203 | |
| Equipment | | | 312 | | | | 344 | |
| | | | | | | | | |
| | | | 70,038 | | | | 72,547 | |
| Less: accumulated amortization | | | (44,885 | ) | | | (43,183 | ) |
| | | | | | | | | |
| | | $ | 25,153 | | | $ | 29,364 | |
| | | | | | | | | |
Amortization is calculated on a straight-line basis over the respective lease term, including any option periods considered in the determination of the lease term. When determining the lease term, we include option periods for which failure to renew the lease imposes a penalty on us in such an amount that a renewal appears, at the inception of the lease, to be reasonably assured.
Minimum lease payments for all leases, including those in the estimated liability for closing restaurants, automobile and distribution center truck leases, and the present value of net minimum lease payments for capital leases as of January 31, 2007 are as follows:
| | | | | | | | | |
| | | Capital | | | Operating | |
| |
| Fiscal Year: | | | | | | | | |
| 2008 | | $ | 10,476 | | | $ | 84,152 | |
| 2009 | | | 10,286 | | | | 76,915 | |
| 2010 | | | 9,807 | | | | 70,656 | |
| 2011 | | | 9,066 | | | | 61,069 | |
| 2012 | | | 8,111 | | | | 51,156 | |
| Thereafter | | | 24,570 | | | | 265,766 | |
| | | | | | | | | |
| Total minimum lease payments | | | 72,316 | | | $ | 609,714 | |
| | | | | | | | | |
| Less: amount representing interest | | | (25,870 | ) | | | | |
| | | | | | | | | |
| Present value of minimum lease payments (interest rates primarily ranging from 8% to 14%) | | | 46,446 | | | | | |
| Less: current portion | | | (5,323 | ) | | | | |
| | | | | | | | | |
| Capital lease obligations, excluding current portion | | $ | 41,123 | | | | | |
| | | | | | | | | |
Total minimum lease payments have not been reduced for future minimum sublease rentals of $164,843 expected to be received under certain operating subleases.
90
CKE RESTAURANTS, INC. AND SUBSIDIARIES
NOTES TO CONSOLIDATED FINANCIAL STATEMENTS — (Continued)
We have net investments in lease receivables that pertain to finance leases. As of January 31, 2007 and 2006, components of the net investment in leases receivable, included in other current assets and other assets, are as follows:
| | | | | | | | | |
| | | 2007 | | | 2006 | |
| |
| Net minimum lease payments receivable | | $ | 1,017 | | | $ | 1,227 | |
| Less: unearned income | | | (345 | ) | | | (436 | ) |
| | | | | | | | | |
| Net investment | | $ | 672 | | | $ | 791 | |
| | | | | | | | | |
We have leased and subleased land and buildings to others, primarily as a result of the franchising of certain restaurants. Many of these leases provide for fixed payments with contingent rent when revenue exceeds certain levels, while others provide for monthly rentals based on a percentage of revenue. Lessees generally bear the cost of maintenance, insurance and property taxes. The carrying value of assets leased to others as of January 31, 2007 and 2006 is as follows:
| | | | | | | | | |
| | | 2007 | | | 2006 | |
| |
| Land | | $ | 15,461 | | | $ | 15,863 | |
| Leasehold improvements | | | 5,349 | | | | 6,577 | |
| Buildings and improvements | | | 17,198 | | | | 17,909 | |
| Equipment, furniture and fixtures | | | 1,446 | | | | 1,102 | |
| | | | | | | | | |
| | | | 39,454 | | | | 41,451 | |
| Less: accumulated depreciation and amortization | | | (13,404 | ) | | | (14,904 | ) |
| | | | | | | | | |
| | | $ | 26,050 | | | $ | 26,547 | |
| | | | | | | | | |
As of January 31, 2007, minimum future lease and sublease rentals expected to be received including amounts reducing the estimated liability for closing restaurants, are as follows:
| | | | | | | | | |
| | | Capital
| | | Operating
| |
| | | Leases or
| | | Lessor
| |
| | | Subleases | | | Leases | |
| |
| Fiscal Year: | | | | | | | | |
| 2008 | | $ | 142 | | | $ | 28,552 | |
| 2009 | | | 142 | | | | 26,551 | |
| 2010 | | | 142 | | | | 23,066 | |
| 2011 | | | 142 | | | | 19,693 | |
| 2012 | | | 142 | | | | 14,634 | |
| Thereafter | | | 307 | | | | 52,347 | |
| | | | | | | | | |
| Total minimum future rentals | | $ | 1,017 | | | $ | 164,843 | |
| | | | | | | | | |
Total minimum future rentals do not include contingent rentals, which may be received under certain leases.
91
CKE RESTAURANTS, INC. AND SUBSIDIARIES
NOTES TO CONSOLIDATED FINANCIAL STATEMENTS — (Continued)
Aggregate rents under non-cancelable operating leases for the fiscal years ended January 31, 2007, 2006 and 2005 were as follows:
| | | | | | | | | | | | | |
| | | 2007 | | | 2006 | | | 2005 | |
| |
| Minimum rentals | | $ | 92,288 | | | $ | 91,886 | | | $ | 98,730 | |
| Contingent rentals | | | 4,515 | | | | 5,206 | | | | 5,013 | |
| | | | | | | | | | | | | |
| | | | 96,803 | | | | 97,092 | | | | 103,743 | |
| Less: sublease rentals | | | (31,801 | ) | | | (33,221 | ) | | | (36,444 | ) |
| | | | | | | | | | | | | |
| | | $ | 65,002 | | | $ | 63,871 | | | $ | 67,299 | |
| | | | | | | | | | | | | |
During fiscal 2002, we entered into certain sale leaseback transactions relating to restaurant properties we currently operate through which we generated net gains of $5,158. The net gains from such transactions were deferred and are being amortized as a reduction to occupancy and other operating expenses over the terms of the leases.
Rent expense for the fiscal years ended January 31, 2007, 2006 and 2005 was $96,803, $97,092 and $103,743, respectively.
Note 9 — Other Assets
Other assets as of January 31, 2007 and 2006 consist of the following:
| | | | | | | | | |
| | | 2007 | | | 2006 | |
| |
| Intangible assets (see below) | | $ | 15,443 | | | $ | 16,836 | |
| Deferred financing costs | | | 3,697 | | | | 5,708 | |
| Net investment in lease receivables, less current portion | | | 610 | | | | 748 | |
| Other | | | 1,446 | | | | 2,227 | |
| | | | | | | | | |
| | | $ | 21,196 | | | $ | 25,519 | |
| | | | | | | | | |
As of January 31, 2007 and 2006, intangible assets with finite useful lives were primarily comprised of intangible assets obtained through our acquisition of Santa Barbara Restaurant Group, Inc. (“SBRG”) in fiscal 2003 and our Hardee’s acquisition transactions in fiscal 1999 and 1998. Such intangible assets have amortization periods ranging from three to 20 years and are included in other assets, net, in the accompanying Consolidated Balance Sheets.
The table below presents identifiable, definite-lived intangible assets as of January 31, 2007 and 2006:
| | | | | | | | | | | | | | | | | | | | | | | | | | | | | |
| | | | | | January 31, 2007 | | | January 31, 2006 | |
| | | Weighted-
| | | | | | | | | | | | | | | | | | | |
| | | Average
| | | Gross
| | | | | | Net
| | | Gross
| | | | | | Net
| |
| | | Life
| | | Carrying
| | | Accumulated
| | | Carrying
| | | Carrying
| | | Accumulated
| | | Carrying
| |
Intangible Asset | | (Years) | | | Amount | | | Amortization | | | Amount | | | Amount | | | Amortization | | | Amount | |
| |
| Trademarks | | | 20 | | | $ | 17,171 | | | $ | (4,224 | ) | | $ | 12,947 | | | $ | 17,171 | | | $ | (3,365 | ) | | $ | 13,806 | |
| Franchise agreements | | | 20 | | | | 1,780 | | | | (417 | ) | | | 1,363 | | | | 1,780 | | | | (328 | ) | | | 1,452 | |
| Favorable lease agreements | | | 16 | | | | 3,194 | | | | (2,061 | ) | | | 1,133 | | | | 4,034 | | | | (2,456 | ) | | | 1,578 | |
| | | | | | | | | | | | | | | | | | | | | | | | | | | | | |
| | | | | | | $ | 22,145 | | | $ | (6,702 | ) | | $ | 15,443 | | | $ | 22,985 | | | $ | (6,149 | ) | | $ | 16,836 | |
| | | | | | | | | | | | | | | | | | | | | | | | | | | | | |
Amortization expense related to these intangible assets for fiscal 2007, 2006 and 2005 was $1,233, $1,547 and $2,158, respectively. For these assets, amortization expense is expected to be approximately $1,156 in fiscal 2008, $1,083 in fiscal 2009, $1,079 in fiscal 2010, $1,069 in fiscal 2011 and $1,061 in fiscal 2012.
92
CKE RESTAURANTS, INC. AND SUBSIDIARIES
NOTES TO CONSOLIDATED FINANCIAL STATEMENTS — (Continued)
Note 10 — Other Current Liabilities
Other current liabilities as of January 31, 2007 and 2006 consist of the following:
| | | | | | | | | |
| | | 2007 | | | 2006 | |
| |
| Salaries, wages and other benefits | | $ | 37,108 | | | $ | 32,439 | |
| State sales taxes | | | 6,747 | | | | 7,288 | |
| Estimated liability for closing restaurants | | | 4,421 | | | | 4,417 | |
| Accrued interest | | | 856 | | | | 1,924 | |
| Estimated liability for property taxes | | | 4,955 | | | | 4,258 | |
| Estimated liability for litigation | | | 630 | | | | 1,412 | |
| Accrued utilities | | | 4,111 | | | | 3,935 | |
| Estimated liability for self-insurance, current portion | | | 11,182 | | | | 11,141 | |
| Other accrued liabilities | | | 26,123 | | | | 22,742 | |
| | | | | | | | | |
| | | $ | 96,133 | | | $ | 89,556 | |
| | | | | | | | | |
Note 11 — Long-Term Debt and Bank Indebtedness
Long-term debt as of January 31, 2007 and 2006 consists of the following:
| | | | | | | | | |
| | | 2007 | | | 2006 | |
| |
| Borrowings under revolving portion of the Facility | | $ | 45,500 | | | $ | 8,000 | |
| Term loan under the Facility | | | 69,821 | | | | 98,749 | |
| Convertible subordinated notes due 2023, interest at 4.00% | | | 15,167 | | | | 105,000 | |
| Other long-term debt | | | 1,121 | | | | 1,229 | |
| | | | | | | | | |
| | | | 131,609 | | | | 212,978 | |
| Less: current portion | | | (1,500 | ) | | | (9,247 | ) |
| | | | | | | | | |
| | | $ | 130,109 | | | $ | 203,731 | |
| | | | | | | | | |
We amended and restated our senior credit facility (“Facility”) on June 2, 2004, and amended the Facility again on November 4, 2004, April 21, 2005 and January 22, 2007 (see below). Subsequent to fiscal 2007, on March 27, 2007, we amended and restated the Facility (“Amended Facility”) (see below). We have no potential mandatory payments of principal on our remaining $15,167 of 4% Convertible Subordinated Notes due 2023 until October 1, 2008.
The Facility provided for a $480,000 senior secured credit facility consisting of a $250,000 revolving credit facility and a $230,000 term loan. The Amended Facility provides for $320,000 senior secured credit facility consisting of a $200,000 revolving credit facility and a $120,000 term loan. The revolving credit facility matures on March 27, 2012. The principal amount of the term loan is scheduled to be repaid in quarterly installments of $300, with the remaining principal balance scheduled to mature on March 27, 2013.
During the fiscal year ended January 31, 2007, we voluntarily prepaid $28,112 of the $230,000 term loan, in addition to the $816 regularly scheduled principal payments. As of January 31, 2007, we had (i) borrowings outstanding under the term loan portion of the Facility of $69,821, (ii) borrowings outstanding under the revolving portion of the Facility of $45,500, (iii) outstanding letters of credit under the revolving portion of the Facility of $57,263, and (iv) availability under the revolving portion of the Facility of $147,237.
93
CKE RESTAURANTS, INC. AND SUBSIDIARIES
NOTES TO CONSOLIDATED FINANCIAL STATEMENTS — (Continued)
The terms of the Facility included certain restrictive covenants. Among other things, these covenants restricted our ability to incur debt, incur liens on our assets, make any significant change in our corporate structure or the nature of our business, dispose of assets in the collateral pool securing the Facility, prepay certain debt, engage in a change of control transaction without the member banks’ consents and make investments or acquisitions. The Facility was collateralized by a lien on all of our personal property assets and liens on certain restaurant properties. The Amended Facility contains reduced restrictions under the covenants and modifies our collateral pool and various other items.
As of January 31, 2007, the applicable interest rate on the term loan was LIBOR plus 2.00%, or 7.375%, per annum. For the revolving portion of the Facility, the applicable rate was Prime plus 1.00%, or 9.25%, per annum. Under the terms of the Facility, we were permitted to lock in favorable rates for the revolving portion based on LIBOR plus 2.25% over terms ranging from 30 to 90 days. As of January 31, 2007 we had $43,500 in borrowings outstanding under the revolving portion of the Facility that we locked in at a rate of approximately 7.625%. We also incurred fees on outstanding letters of credit under the Facility at a rate equal to the applicable margin for LIBOR revolving loans, which was 2.25% per annum as of January 31, 2007. Under the Amended Facility, the applicable interest rate on the term loan portion is LIBOR plus 1.375% per annum. For the revolving portion of the Amended Facility, the applicable interest rate is Prime plus 0.50% per annum. Under the terms of the Amended Facility, we are permitted to lock in favorable rates for the revolving portion based on LIBOR plus 1.50% over terms ranging from 30 to 90 days. We also incur fees on outstanding letters of credit under the Amended Facility at a per annum rate equal to 1.50% times the stated amounts.
The Facility required us to enter into interest rate protection agreements in an aggregate notional amount of at least $70,000 for a term of at least three years. Pursuant to this requirement, on July 26, 2004, we entered into two interest rate cap agreements in an aggregate notional amount of $70,000. Under the terms of each agreement, if LIBOR exceeds 5.375% on the measurement date for any quarterly period, we will receive payments equal to the amount LIBOR exceeds 5.375%, multiplied by (i) the notional amount of the agreement and (ii) the fraction of a year represented by the quarterly period. The agreements expire on July 28, 2007. The agreements were not designated as cash flow hedges under the provisions of SFAS 133. Accordingly, the change in the fair value of the interest rate cap premiums is recognized quarterly in interest expense in our accompanying Consolidated Statements of Income. During the year ended January 31, 2007, we recognized a charge of $43 to interest expense to reduce the carrying value of the interest rate cap premiums to their fair value of $13 at January 31, 2007. As a matter of policy, we do not enter into derivative instruments unless there is an underlying exposure. However, the remaining outstanding principal balance of our term loan is less than the notional amount of our existing interest rate caps as of January 31, 2007 as a result of voluntary prepayments and regularly scheduled principal payments. We are no longer required to enter into interest rate protection agreements under the Amended Facility.
We are permitted to repurchase our common stockand/or pay dividends in an aggregate amount up to $263,441, calculated under the Amended Facility, using balances as of January 31, 2007. In addition, the amount that we may spend to repurchase our common stockand/or pay dividends is increased each year by a portion of excess cash flow (as defined in the Amended Facility) during the term of the Amended Facility.
During the fiscal year ended January 31, 2007, we declared cash dividends of $0.16 per share of common stock, for a total of $10,397. As of January 31, 2007, dividends payable of $2,694 have been included in other current liabilities in our accompanying Consolidated Balance Sheet. These dividends were subsequently paid on February 20, 2007.
Subject to the terms of the Amended Facility, we may make annual capital expenditures in the amount of $85,000, plus 80% of the amount of our actual Adjusted EBITDA (as defined in the Amended Facility) in excess of $150,000. We may also carry forward certain unused capital expenditure amounts to the following year. Based on these terms, assuming Adjusted EBITDA in fiscal 2008 as calculated under the definition in the Amended Facility is equal to Adjusted EBITDA in fiscal 2007 as calculated under the definition in the Amended Facility, the Amended Facility would permit us to make capital expenditures of $135,154 in fiscal 2008, which could increase or decrease based on our performance versus the Adjusted EBITDA formula described above.
94
CKE RESTAURANTS, INC. AND SUBSIDIARIES
NOTES TO CONSOLIDATED FINANCIAL STATEMENTS — (Continued)
The Facility contained financial performance covenants, which included a minimum fixed charge coverage ratio and maximum leverage ratios. In addition, we were required under the Facility to generate a minimum Adjusted EBITDA, as defined, of at least $125,000 on a trailing-13 period basis. We were in compliance with these covenants and all other requirements of the Facility as of January 31, 2007. The Amended Facility eliminated certain financial performance covenants, such as minimum Adjusted EBITDA, minimum fixed charge coverage ratio, and adjusted leverage ratio.
The full text of the contractual requirements imposed by the Facility is set forth in the Sixth Amended and Restated Credit Agreement, dated as of June 2, 2004, and the amendments thereto, which we have filed with the SEC, and in the ancillary loan documents described therein. The full text of the contractual requirements imposed by the Amended Facility is set forth in the Seventh Amended and Restated Credit Agreement, dated as of March 27, 2007, and in the ancillary loan documents described therein. Subject to cure periods in certain instances, the lenders under our Amended Facility may demand repayment of borrowings prior to stated maturity upon certain events of default, including, but not limited to, if we breach the terms of the agreement, suffer a material adverse change, engage in a change of control transaction, suffer certain adverse legal judgments, in the event of specified events of insolvency or if we default on other significant obligations. In the event the Amended Facility is declared accelerated by the lenders (which can occur only upon certain events of default under the Amended Facility), our 2023 Convertible Notes (described below) may also become accelerated under certain circumstances and after all cure periods have expired.
The 2023 Convertible Notes bear interest at 4.0% annually, payable in semiannual installments due April 1 and October 1 each year, are unsecured general obligations of ours, and are contractually subordinate in right of payment to certain other of our obligations, including the Facility. On October 1 of 2008, 2013 and 2018, the holders of the 2023 Convertible Notes have the right to require us to repurchase all or a portion of the notes at 100% of the face value plus accrued interest. On October 1, 2008 and thereafter, we have the right to call all or a portion of the notes at 100% of the face value plus accrued interest. The 2023 Convertible Notes became convertible into our common stock effective July 1, 2004, and will remain convertible throughout the remainder of their term.
During fiscal 2007, in response to unsolicited offers from the holders of $89,833 of the 2023 Convertible Notes, we made cash payments to the holders, comprised of accrued interest through the dates of conversion and inducements for the holders to convert in lieu of payment of future interest on the converted notes. The inducement payments were $6,406, and are included in the conversion inducement expense in our accompanying Consolidated Statements of Income for the year ended January 31, 2007. Pursuant to their terms, these notes converted into an aggregate of 10,224,424 shares of our common stock. As a result of these conversions, as of January 31, 2007, bank indebtedness and other long-term debt decreased $89,833; other assets, net, decreased $1,356; common stock increased $102; and additional paid-in capital increased $88,375. As of January 31, 2007, the remaining $15,167 of 2023 Convertible Notes are convertible into our common stock at a conversion price of approximately $8.79 per share, based on a conversion rate of 113.8160 shares per $1 of the notes.
The terms of the Amended Facility are not dependent on any change in our credit rating. We believe the key Company-specific factors affecting our ability to maintain our existing debt financing relationships and to access such capital in the future are our present and expected levels of profitability and cash flows from operations, asset collateral bases and the level of our equity capital relative to our debt obligations. In addition, as noted above, our existing debt agreements include significant restrictions on future financings including, among others, limits on the amount of indebtedness we may incur or which may be secured by any of our assets.
95
CKE RESTAURANTS, INC. AND SUBSIDIARIES
NOTES TO CONSOLIDATED FINANCIAL STATEMENTS — (Continued)
Long-term debt matures in fiscal years ending after January 31, 2007 as follows, after giving effect to the terms of the Amended Facility:
| | | | | |
| Fiscal Year: | | | | |
| 2008 | | $ | 1,500 | |
| 2009 | | | 1,364 | |
| 2010 | | | 1,222 | |
| 2011 | | | 1,224 | |
| 2012 | | | 1,226 | |
| Thereafter(1) | | | 125,073 | |
| | | | | |
| | | $ | 131,609 | |
| | | | | |
| | |
| (1) | | Assumes holders of the 2023 Convertible Notes do not exercise redemption rights in October 2008. |
Note 12 — Other Long-Term Liabilities
Other long-term liabilities as of January 31, 2007 and 2006 consist of the following:
| | | | | | | | | |
| | | 2007 | | | 2006 | |
| |
| Estimated liability for closing restaurants | | $ | 9,608 | | | $ | 9,183 | |
| Estimated liability for self-insurance | | | 26,651 | | | | 26,272 | |
| Estimated liability for deferred rent | | | 11,442 | | | | 10,068 | |
| Other | | | 11,504 | | | | 11,549 | |
| | | | | | | | | |
| | | $ | 59,205 | | | $ | 57,072 | |
| | | | | | | | | |
We are self-insured for our primary workers’ compensation, general and auto liability insurance exposures not covered by our stop-loss policy. A total of $37,833 and $37,413 was accrued as of January 31, 2007 and 2006, respectively (including the long-term portions noted in the above table and the current portions included in other current liabilities, as discussed in Note 10), based upon of the present value of an independent actuarial valuation of our workers’ compensation, general and auto liability claims. See Note 1 for further discussion.
Note 13 — Stockholders’ Equity
On January 22, 2007, we amended the Facility to increase the aggregate amount that we are permitted to expend for common stock repurchases and dividend payments by $130,000. During fiscal 2007, we declared aggregate cash dividends of $0.16 per share of common stock, for a total of $10,397.
Pursuant to a program (“Stock Repurchase Plan”) authorized by our Board of Directors, as modified during fiscal 2007, we are allowed to repurchase up to an aggregate of $200,000 of our common stock. During fiscal 2007, we repurchased 4,607,437 shares of our common stock at an average price of $17.58 per share, for a total cost, including trading commissions, of $81,057, of which we retired 4,589,137 shares. As of January 31, 2007, we had 18,300 shares of common stock that had been repurchased, but not yet retired and are shown as common stock held in treasury in the accompanying Consolidated Balance Sheet. These shares were retired subsequent to January 31, 2007. There was no common stock held in treasury at January 31, 2006.
Based on the Board of Directors’ authorization and the amount of cumulative repurchase of our common stock that we have already made thereunder, we are permitted to make additional repurchases of our common stock up to $109,387 under the Stock Repurchase Plan as of January 31, 2007. As part of our Stock Repurchase Plan, we have implemented a share repurchase plan pursuant toRule 10b5-1 of the Securities Exchange Act of 1934, as amended (“Exchange Act”),
96
CKE RESTAURANTS, INC. AND SUBSIDIARIES
NOTES TO CONSOLIDATED FINANCIAL STATEMENTS — (Continued)
under which we are allowed to repurchase $5,000 of our common stock in the open market each fiscal quarter through the quarter ending January 28, 2008.Rule 10b5-1 allows us to repurchase our common stock when we might otherwise be prevented from doing so under insider trading laws or because of self-imposed trading blackout periods.
During fiscal 2006, our Board of Directors approved the adoption of a Stockholder Rights Plan (“Rights Plan”) pursuant to a Rights Agreement between us and Mellon Investor Services, LLC, dated October 17, 2005 (“Rights Agreement”). On December 31, 2006, the Rights expired pursuant to the terms of the Rights Plan. The Rights expired because our Board of Directors determined not to solicit the requisite stockholder approval of the Rights Agreement by December 31, 2006. As a result, the Rights have no further force or effect and the Rights Plan has effectively terminated.
Note 14 — Purchase and Cancellation of Stock Options
During the twelve weeks ended August 15, 2005, we purchased and canceled all of the outstanding options of Mr. William P. Foley, who resigned from the Board of Directors on July 19, 2005, for cash consideration of $11,000, which has been recorded as a component of general and administrative expense in the accompanying Consolidated Statement of Income for the fiscal year ended January 31, 2006. As of July 18, 2005, Mr. Foley held outstanding options to purchase an aggregate of 1,715,512 shares of our common stock, of which options to purchase 1,665,513 shares were vested and exercisable as of such date, and options to purchase 49,999 shares were unvested. The purchase price for Mr. Foley’s options was determined after negotiations between the parties using the Black-Scholes methodology. We retained a third-party valuation specialist to advise us in connection with this option purchase.
Note 15 — Fair Value of Financial Instruments
The following table presents information on our financial instruments as of January 31, 2007 and 2006:
| | | | | | | | | | | | | | | | | |
| | | 2007 | | | 2006 | |
| | | Carrying
| | | Estimated
| | | Carrying
| | | Estimated
| |
| | | Amount | | | Fair Value | | | Amount | | | Fair Value | |
| |
| Financial assets: | | | | | | | | | | | | | | | | |
| Cash and cash equivalents | | $ | 18,680 | | | $ | 18,680 | | | $ | 21,343 | | | $ | 21,343 | |
| Notes receivable, net of allowance for doubtful accounts | | | 944 | | | | 778 | | | | 3,666 | | | | 3,309 | |
| Interest rate cap agreements | | | 13 | | | | 13 | | | | 56 | | | | 56 | |
| Financial liabilities: | | | | | | | | | | | | | | | | |
| Long-term debt, including current portion | | | 131,609 | | | | 150,519 | | | | 212,978 | | | | 316,090 | |
The fair value of cash and cash equivalents approximates its carrying amount due to its short maturity. The estimated fair value of notes receivable was determined by discounting future cash flows using current rates at which similar loans might be made to borrowers with similar credit ratings. The estimated fair value of interest rate cap agreements was based upon market quotes received from the financial institutions that are the counter parties to the agreements. The estimated fair value of long-term debt was determined by discounting future cash flows using rates currently available to us for debt with similar terms and remaining maturities, using market quotes for our 2023 Convertible Notes and using a combination of discounting future cash flows using rates currently available to us for debt with similar terms and remaining maturities.
Note 16 — Related Party Transactions
Certain members of the Board of Directors and the Karcher family are franchisees of CKE. These franchisees regularly pay royalties and purchase food and other products from us on the same terms and conditions as other franchisees.
97
CKE RESTAURANTS, INC. AND SUBSIDIARIES
NOTES TO CONSOLIDATED FINANCIAL STATEMENTS — (Continued)
In fiscal 1994, the Chairman Emeritus was granted future retirement benefits for past services consisting principally of annual cash payments for life and supplemental health benefits. In fiscal 2005, this retirement benefit arrangement was amended to provide payments of $300 in calendar 2005, decreasing annually to $210 per year for calendar 2009 and thereafter. The amended arrangement also includes health benefits and provision of certain administrative support. A total of $1,061 and $1,259 remained accrued in other long-term liabilities as of January 31, 2007 and 2006, respectively, based on actuarial calculations. We anticipate funding these obligations as they become due.
We lease various properties, including certain of our corporate offices and three restaurants from the Chairman Emeritus. Lease payments under these leases for fiscal 2007, 2006 and 2005 amounted to $1,948, 1,836 and $1,756, respectively. This was net of sublease rentals of $0, $0 and $27 in fiscal 2007, 2006 and 2005, respectively.
In fiscal 2006 and 2005, we had several leases with wholly-owned subsidiaries of Fidelity National Financial, Inc, (“FNF”), of which the former Chairman of the Board of CKE is also Chairman of the Board, forpoint-of-sale equipment, a corporate office facility, and expenses associated with the Company’s leased aircraft. We paid $1,884 and $4,468 in fiscal 2006 and 2005, respectively to FNF under these lease agreements. During the second quarter of fiscal 2005, we paid $1,479 to FNF, representing our share of the loss upon FNF’s sale of one of our two leased aircraft.
In fiscal 2001, we entered into an agreement with a wholly-owned subsidiary of FNF to assist in the disposition of surplus real estate properties and negotiate the termination of leases for closed restaurants. The affiliate was paid a fee for each property sold or each lease terminated. We paid this affiliate $652 during fiscal 2005. This contract expired in early fiscal 2006, and there were no payments made to this affiliate during fiscal 2006.
Note 17 — Franchise and License Operations
Franchise arrangements generally provide for initial fees and continuing royalty payments to us based upon a percentage of gross revenue. We generally charge an initial franchise fee for each new franchised restaurant that is added to our system, and in some cases, an area development fee, which grants exclusive rights to develop a specified number of restaurants in a designated geographic area within a specified time period. Similar fees are charged in connection with our international licensing operations. These fees are recognized ratably when substantially all the services required of us are complete and the restaurants covered by these agreements commence operations.
Certain franchisees also purchase food, paper, supplies and equipment from us. Additionally, franchisees may be obligated to remit lease payments for the use of restaurant facilities owned or leased by us, generally for periods up to 20 years. Under the terms of these leases, franchisees are generally required to pay related occupancy costs, which include maintenance, insurance and property taxes.
Revenue from franchised and licensed restaurants for the fiscal years ended January 31, 2007, 2006 and 2005 consisted of the following:
| | | | | | | | | | | | | |
| | | 2007 | | | 2006 | | | 2005 | |
| |
| Royalties | | $ | 79,499 | | | $ | 70,375 | | | $ | 70,857 | |
| Foodservice | | | 187,533 | | | | 179,222 | | | | 176,304 | |
| Equipment sales | | | 16,987 | | | | 24,319 | | | | 18,181 | |
| Rental income | | | 28,797 | | | | 28,089 | | | | 32,157 | |
| Initial fees and other | | | 5,907 | | | | 6,886 | | | | 5,109 | |
| | | | | | | | | | | | | |
| | | $ | 318,723 | | | $ | 308,891 | | | $ | 302,608 | |
| | | | | | | | | | | | | |
98
CKE RESTAURANTS, INC. AND SUBSIDIARIES
NOTES TO CONSOLIDATED FINANCIAL STATEMENTS — (Continued)
Operating costs and expenses for franchised and licensed restaurants for the fiscal years ended January 31, 2007, 2006 and 2005 consisted of the following:
| | | | | | | | | | | | | |
| | | 2007 | | | 2006 | | | 2005 | |
| |
| Foodservice costs of sales | | $ | 185,271 | | | $ | 174,149 | | | $ | 171,363 | |
| Equipment division cost of sales and operating expenses | | | 17,840 | | | | 24,930 | | | | 18,379 | |
| Occupancy and other operating expenses | | | 37,841 | | | | 39,382 | | | | 37,846 | |
| | | | | | | | | | | | | |
| | | $ | 240,952 | | | $ | 238,461 | | | $ | 227,588 | |
| | | | | | | | | | | | | |
Note 18 — Interest Expense
Interest expense for the fiscal years ended January 31, 2007, 2006 and 2005 consisted of the following:
| | | | | | | | | | | | | |
| | | 2007 | | | 2006 | | | 2005 | |
| |
| Facility | | $ | 6,895 | | | $ | 7,522 | | | $ | 6,310 | |
| Senior subordinated notes due 2009 | | | — | | | | — | | | | 7,855 | |
| Capital lease obligations | | | 5,665 | | | | 6,257 | | | | 6,950 | |
| 2004 convertible subordinated notes | | | — | | | | — | | | | 73 | |
| 2023 convertible subordinated notes | | | 2,553 | | | | 4,200 | | | | 4,258 | |
| Amortization of loan fees | | | 3,096 | | | | 3,312 | | | | 3,637 | |
| Write-off of unamortized loan fees, term loan due July 2, 2008 | | | 242 | | | | 500 | | | | 1,452 | |
| Write-off of unamortized loan fees, term loan repaid June 2, 2004 | | | — | | | | — | | | | 664 | |
| Write-off of unamortized loan fees, senior subordinated notes due 2009 | | | — | | | | — | | | | 3,068 | |
| Letter of credit fees and other | | | 1,300 | | | | 1,225 | | | | 2,481 | |
| | | | | | | | | | | | | |
| Total interest expense | | $ | 19,751 | | | $ | 23,016 | | | $ | 36,748 | |
| | | | | | | | | | | | | |
Note 19 — Other Income (Expense), Net
Other income (expense), net, for the fiscal years ended January 31, 2007, 2006 and 2005 consisted of the following:
| | | | | | | | | | | | | |
| | | 2007 | | | 2006 | | | 2005 | |
| |
| Premium incurred upon early redemption of debt | | $ | — | | | $ | — | | | $ | (9,126 | ) |
| Interest income on notes receivable from franchisees, disposition properties and capital leases | | | 1,042 | | | | 1,116 | | | | 1,784 | |
| Rental income from properties leased to third parties, net | | | 1,813 | | | | 1,352 | | | | 2,060 | |
| Other, net | | | 881 | | | | (81 | ) | | | 2,320 | |
| | | | | | | | | | | | | |
| Total other income (expense), net | | $ | 3,736 | | | $ | 2,387 | | | $ | (2,962 | ) |
| | | | | | | | | | | | | |
99
CKE RESTAURANTS, INC. AND SUBSIDIARIES
NOTES TO CONSOLIDATED FINANCIAL STATEMENTS — (Continued)
Note 20 — Income Taxes
Income tax expense (benefit) for the fiscal years ended January 31, 2007, 2006 and 2005 consisted of the following:
| | | | | | | | | | | | | |
| | | 2007 | | | 2006 | | | 2005 | |
| | | (as restated) | |
| |
| Current: | | | | | | | | | | | | |
| Federal | | $ | 4,070 | | | $ | 502 | | | $ | (2,493 | ) |
| State | | | 744 | | | | 183 | | | | (214 | ) |
| Foreign | | | 1,124 | | | | 905 | | | | 820 | |
| | | | | | | | | | | | | |
| | | | 5,938 | | | | 1,590 | | | | (1,887 | ) |
| | | | | | | | | | | | | |
| Deferred: | | | | | | | | | | | | |
| Federal | | | 21,929 | | | | (109,871 | ) | | | 214 | |
| State | | | 4,032 | | | | (15,607 | ) | | | 81 | |
| | | | | | | | | | | | | |
| | | | 25,961 | | | | (125,478 | ) | | | 295 | |
| | | | | | | | | | | | | |
| Total | | $ | 31,899 | | | $ | (123,888 | ) | | $ | (1,592 | ) |
| | | | | | | | | | | | | |
Our federal income tax benefit in fiscal 2005 is comprised primarily of refundable income taxes recorded for the expected benefit from the carryback of certain deductible expenses incurred in fiscal 2001 and fiscal 2003 through 2005.
A reconciliation of income tax expense (benefit) attributable to continuing operations at the federal statutory rate of 35% to our income tax expense (benefit) is as follows:
| | | | | | | | | | | | | |
| | | 2007 | | | 2006 | | | 2005 | |
| | | (as restated) | |
| |
| Income tax expense at statutory rate | | $ | 28,780 | | | $ | 20,038 | | | $ | 5,975 | |
| State income taxes, net of federal income tax benefit | | | 3,104 | | | | (10,025 | ) | | | (86 | ) |
| Tax credits | | | (300 | ) | | | (442 | ) | | | (677 | ) |
| Decrease in valuation allowance, federal | | | (4,842 | ) | | | (136,264 | ) | | | (7,146 | ) |
| Nondeductible compensation | | | 2,390 | | | | 1,793 | | | | 20 | |
| Other, net | | | 2,767 | | | | 1,012 | | | | 322 | |
| | | | | | | | | | | | | |
| | | $ | 31,899 | | | $ | (123,888 | ) | | $ | (1,592 | ) |
| | | | | | | | | | | | | |
100
CKE RESTAURANTS, INC. AND SUBSIDIARIES
NOTES TO CONSOLIDATED FINANCIAL STATEMENTS — (Continued)
Temporary differences and carryforwards gave rise to a significant amount of deferred tax assets and liabilities as follows:
| | | | | | | | | |
| | | 2007 | | | 2006 | |
| | | | | | (as restated) | |
| |
| Estimated liability for closing restaurants | | $ | 5,641 | | | $ | 5,505 | |
| Net operating loss carryforwards | | | 21,761 | | | | 36,509 | |
| Basis difference in fixed assets | | | 13,555 | | | | 9,071 | |
| Goodwill and other intangible assets | | | 32,010 | | | | 38,745 | |
| Reserves and allowances | | | 25,622 | | | | 31,930 | |
| Capital leases | | | 12,583 | | | | 12,107 | |
| Federal and state tax credits | | | 20,275 | | | | 30,170 | |
| Other | | | 5,589 | | | | 1,923 | |
| | | | | | | | | |
| | | | 137,036 | | | | 165,960 | |
| Valuation allowance | | | (27,257 | ) | | | (30,220 | ) |
| | | | | | | | | |
| Net deferred tax asset | | $ | 109,779 | | | $ | 135,740 | |
| | | | | | | | | |
As of January 31, 2005, we maintained a valuation allowance of $190,179 against our net deferred tax assets, since we had determined, based primarily on a history of cumulative losses in recent years and uncertainty regarding the timing and amounts of future taxable income, that realization of our deferred tax assets was not more likely than not. During fiscal 2006, after considering a number of factors, including a three-year history of cumulative earnings, utilization of NOL carryforwards in fiscal 2006, and estimated taxable income in future years, we determined we would more likely than not realize substantial future tax benefits from our deferred tax assets and we reduced our valuation allowance by $159,959 at January 31, 2006, resulting in a net deferred tax asset of $135,740 (see Note 1 — Restatement of Previously Issued Financial Statements). Of the total tax benefit from the reversal of the valuation allowance, $11,971 was recorded to additional paid-in capital for the tax benefit from the exercise of stock options during both the current and prior years.
During the fourth quarter of fiscal 2007, we determined that we would more likely than not realize future tax benefits from certain of our deferred tax assets for which we previously maintained a valuation allowance. This determination was based on a number of factors, including our ability, for the first time in several years, to utilize more foreign tax credits than we generated in fiscal 2007 and our projected future foreign source income. As a result of our analysis, we reduced our valuation allowance by $4,884 at January 31, 2007. As of January 31, 2007, our remaining valuation allowance of $27,257 relates to federal and state capital loss carryforwards and certain state NOL and tax credit carryforwards. Realization of the tax benefit of such deferred tax assets may remain uncertain for the foreseeable future, even though we expect to generate taxable income, since they are subject to various limitation and may only be used to offset income of certain entities or of a certain character.
During fiscal 2007, we utilized all of our federal NOL carryforwards and a portion of our federal tax credit carryforwards. At January 31, 2007, we have federal alternative minimum tax (“AMT”) credit, general business tax credit and foreign tax credit carryforwards of approximately $18,446. Our AMT credits will be carried forward until utilized, and our general business tax credits and foreign tax credits would expire, if unused, in varying amounts in the years 2012 through 2027. At January 31, 2007, we have state NOL carryforwards in the amount of approximately $329,207, which expire in varying amounts in the years 2008 through 2027. As of January 31, 2007, we have recognized $859 of net deferred tax assets related to our state NOL carryforwards, which represents our expected future tax savings from such NOL carryforwards.
101
CKE RESTAURANTS, INC. AND SUBSIDIARIES
NOTES TO CONSOLIDATED FINANCIAL STATEMENTS — (Continued)
Note 21 — Discontinued Operations
In conjunction with the acquisition of SBRG in fiscal 2003, we made the decision to divest Timber Lodge Steakhouse, Inc. (“Timber Lodge”) as the concept did not fit with our core concepts of quick-service and fast-casual restaurants. The sale of Timber Lodge was completed on September 3, 2004.
The results of Timber Lodge included in the accompanying Consolidated Statements of Income as discontinued operations for the fiscal year ended January 31, 2005 are as follows:
| | | | | |
| Revenue | | $ | 24,129 | |
| | | | | |
| Operating loss | | $ | (636 | ) |
| Interest expense | | | 10 | |
| | | | | |
| Net loss | | $ | (646 | ) |
| | | | | |
The operating loss for Timber Lodge for the fiscal year ended January 31, 2005 includes impairment charges of $898, to reduce the carrying value of Timber Lodge to fair value.
Note 22 — Segment Information
We are principally engaged in developing, operating and franchising our Carl’s Jr. and Hardee’s quick-service restaurants and our La Salsa fast-casual restaurants, each of which is considered an operating segment that is managed and evaluated separately. Management evaluates the performance of our segments and allocates resources to them based on several factors, of which the primary financial measure is segment operating income or loss. General and administrative expenses are allocated to each segment based on management’s analysis of the resources applied to each segment. Interest expense related to the Facility and 2023 Convertible Notes and conversion inducement expense related to the 2023 Convertible Notes have been allocated to Hardee’s based on the use of funds. Certain amounts that we do not believe would be proper to allocate to the operating segments are included in “Other” (i.e., gains or losses on sales of long-term investments and the results of operations of consolidated VIEs). The accounting policies of the segments are the same as those described in our summary of significant accounting policies (see Note 1).
102
CKE RESTAURANTS, INC. AND SUBSIDIARIES
NOTES TO CONSOLIDATED FINANCIAL STATEMENTS — (Continued)
| | | | | | | | | | | | | | | | | | | | | |
| | | Carl’s Jr. | | | Hardee’s | | | La Salsa | | | Other | | | Total | |
| |
2007 | | | | | | | | | | | | | | | | | | | | |
| Revenue | | $ | 830,961 | | | $ | 706,884 | | | $ | 46,339 | | | $ | 4,226 | | | $ | 1,588,410 | |
| Segment operating income (loss) | | | 83,525 | | | | 32,547 | | | | (11,381 | ) | | | (199 | ) | | | 104,492 | |
| Interest expense | | | 3,991 | | | | 15,491 | | | | (17 | ) | | | 286 | | | | 19,751 | |
| Total assets | | | 212,480 | | | | 369,954 | | | | 20,958 | | | | 191,030 | | | | 794,422 | |
| Capital expenditures | | | 61,280 | | | | 53,406 | | | | 2,564 | | | | 18 | | | | 117,268 | |
| Goodwill | | | 22,649 | | | | — | | | | — | | | | — | | | | 22,649 | |
| Depreciation and amortization | | | 26,328 | | | | 32,821 | | | | 3,050 | | | | 219 | | | | 62,418 | |
| Income tax expense (benefit) | | | 29,388 | | | | 6,966 | | | | (4,089 | ) | | | (366 | ) | | | 31,899 | |
2006 (as restated) | | | | | | | | | | | | | | | | | | | | |
| Revenue | | $ | 802,761 | | | $ | 661,509 | | | $ | 49,156 | | | $ | 4,921 | | | $ | 1,518,347 | |
| Segment operating income (loss) | | | 82,773 | | | | 13,393 | | | | (7,007 | ) | | | (11,279 | ) | | | 77,880 | |
| Interest expense | | | 4,255 | | | | 18,641 | | | | 28 | | | | 92 | | | | 23,016 | |
| Total assets | | | 195,729 | | | | 359,342 | | | | 24,966 | | | | 211,300 | | | | 791,337 | |
| Capital expenditures | | | 28,754 | | | | 38,601 | | | | 910 | | | | 211 | | | | 68,476 | |
| Goodwill | | | 22,649 | | | | — | | | | — | | | | — | | | | 22,649 | |
| Depreciation and amortization | | | 24,958 | | | | 35,473 | | | | 3,558 | | | | 166 | | | | 64,155 | |
| Income tax expense (benefit) | | | 1,955 | | | | — | | | | (138 | ) | | | (125,705 | ) | | | (123,888 | ) |
2005 | | | | | | | | | | | | | | | | | | | | |
| Revenue | | $ | 792,829 | | | $ | 673,172 | | | $ | 48,794 | | | $ | 5,086 | | | $ | 1,519,881 | |
| Segment operating income (loss) | | | 61,656 | | | | 5,293 | | | | (10,270 | ) | | | 101 | | | | 56,780 | |
| Interest expense | | | 5,071 | | | | 31,510 | | | | (27 | ) | | | 194 | | | | 36,748 | |
| Total assets | | | 219,974 | | | | 362,004 | | | | 29,682 | | | | 57,223 | | | | 668,883 | |
| Capital expenditures | | | 24,773 | | | | 30,056 | | | | 3,705 | | | | 87 | | | | 58,621 | |
| Goodwill | | | 22,649 | | | | — | | | | — | | | | — | | | | 22,649 | |
| Depreciation and amortization | | | 23,875 | | | | 38,782 | | | | 3,965 | | | | 171 | | | | 66,793 | |
| Income tax expense (benefit) | | | 498 | | | | 73 | | | | 2 | | | | (2,165 | ) | | | (1,592 | ) |
Note 23 — Share-Based Compensation
As of the beginning of fiscal 2007, we adopted SFAS 123R using the modified prospective approach. SFAS 123R replaces SFAS 123,Accounting for Stock-Based Compensation, and supersedes APB 25. SFAS 123R requires the cost of all share-based payments to employees, including grants of employee stock options, to be recognized in the financial statements based on their fair values measured at the grant date, or the date of later modification, over the requisite service period. In addition, under the modified prospective approach, SFAS 123R requires unrecognized cost (based on the amounts previously disclosed in pro forma footnote disclosures) related to awards vesting after the date of initial adoption to be recognized in the financial statements over the remaining requisite service period. Therefore, the amount of compensation costs to be recognized over the requisite service period on a prospective basis after January 31, 2006 will include: (i) previously unrecognized compensation cost for all share-based payments granted prior to, but not yet vested as of, January 31, 2006 based on their fair values measured at the grant date, (ii) compensation cost of all share-based payments granted subsequent to January 31, 2006 based on their respective grant date fair value, and (iii) the incremental fair value of awards modified subsequent to January 31, 2006 measured as of the date of such modification.
103
CKE RESTAURANTS, INC. AND SUBSIDIARIES
NOTES TO CONSOLIDATED FINANCIAL STATEMENTS — (Continued)
When recording compensation cost for equity awards, SFAS 123R requires companies to estimate at the date of grant the number of equity awards granted that are expected to be forfeited and to subsequently adjust the estimated forfeitures to reflect actual forfeitures.
For tax purposes, we expect to be entitled to a tax deduction, subject to certain limitations, based on the fair value of certain equity awards when the restrictions lapse or stock options are exercised. SFAS 123R requires that compensation cost be recognized in the financial statements based on the fair value measured at the grant date, or the date of later modification, over the requisite service period. The cumulative compensation cost recognized for certain equity awards pursuant to SFAS 123R and amounts that ultimately will be deductible for tax purposes are temporary differences as prescribed by SFAS 109,Accounting for Income Taxes. The tax effect of compensation deductions for tax purposes in excess of compensation cost recognized in the financial statements, if any, will be recorded as an increase to additional paid-in capital when realized. A deferred tax asset recorded for compensation cost recognized in the financial statements that exceeds the amount that is ultimately realized on the tax return, if any, will be charged to income tax expense when the restrictions lapse or stock options are exercised or expire unless we have an available additional paid-in capital pool, as defined pursuant to SFAS 123R.
SFAS 123R also amends SFAS 95,Statement of Cash Flows, to require companies to change the classification in the statement of cash flows of any tax benefits realized upon the exercise of stock options or issuance of nonvested share unit awards in excess of that which is associated with the expense recognized for financial reporting purposes. These amounts are required to be reported as a financing cash inflow rather than as a reduction of income taxes paid in operating cash flows.
The incremental pre-tax share-based compensation expense recognized pursuant to the adoption of SFAS 123R for the fiscal year ended January 31, 2007 was $4,860. This incremental pre-tax share-based compensation expense had the following effects on the accompanying Consolidated Statement of Income for fiscal 2007:
| | | | | |
| Decrease in income before income taxes | | $ | 4,860 | |
| Decrease in net income | | | 2,999 | |
| Decrease in basic net income per common share | | | 0.05 | |
| Decrease in diluted net income per common share | | | 0.04 | |
Total share-based compensation expense recognized under SFAS 123R, including the incremental pre-tax share-based compensation expense above, was $8,368, with associated tax benefits of $2,068, and was included in general and administrative expense in our accompanying Consolidated Statement of Income for the fiscal year ended January 31, 2007.
Prior to January 31, 2006, we accounted for share-based compensation plans in accordance with the provisions of APB 25, as permitted by SFAS 123, and accordingly, did not recognize compensation expense for stock options with an exercise price equal to or greater than the market price of the underlying stock at the date of grant. Total share-based compensation expense was $188, with associated tax benefits of $72, and was included in general and administrative expense in our accompanying Consolidated Statement of Income for the fiscal year ended January 31, 2006.
104
CKE RESTAURANTS, INC. AND SUBSIDIARIES
NOTES TO CONSOLIDATED FINANCIAL STATEMENTS — (Continued)
Had the fair value-based method prescribed by SFAS 123 been applied, additional compensation expense would have been recognized for the fiscal years ended January 31, 2006 and 2005, and the effect on net income and net income per share would have been as follows:
| | | | | | | | | |
| | | 2006 | | | 2005 | |
| | | (as restated) | | | | |
| |
| Net income, as reported | | $ | 181,139 | | | $ | 18,016 | |
| Add: Stock-based employee compensation expense included in reported net income, net of related tax effects | | | 116 | | | | — | |
| Deduct: Total share-based employee compensation expense determined under fair value based method, net of related tax effects | | | (2,933 | ) | | | (4,651 | ) |
| | | | | | | | | |
| Net income — pro forma | | $ | 178,322 | | | $ | 13,365 | |
| | | | | | | | | |
| Net income per common share: | | | | | | | | |
| Basic — as reported | | $ | 3.06 | | | $ | 0.31 | |
| Basic — pro forma | | | 3.01 | | | | 0.23 | |
| Diluted — as reported | | | 2.51 | | | | 0.30 | |
| Diluted — pro forma | | | 2.43 | | | | 0.22 | |
Employee Stock Purchase Plan
In fiscal 1995, our Board of Directors adopted, and stockholders subsequently approved in fiscal 1996, an Employee Stock Purchase Plan (“ESPP”). Under the terms of the ESPP and subsequent amendments, eligible employees may voluntarily purchase, at current market prices, up to 3,907,500 shares of our common stock through payroll deductions.
Pursuant to the ESPP, employees may contribute an amount between 3% and 15% of their base salaries. We contribute varying amounts as specified in the ESPP. During fiscal 2007, 2006 and 2005, 197,240, 138,281 and 132,502 shares, respectively, were purchased and allocated to employees, based upon their contributions, at an average price of $16.79, $14.10 and $11.46 per share, respectively. We contributed $752 or an equivalent of 45,369 shares for the year ended January 31, 2007, $535 or an equivalent of 37,977 shares for the year ended January 31, 2006 and $482 or an equivalent of 42,536 shares for the year ended January 31, 2005. As of January 31, 2007, 685,708 shares are available for purchase under the ESPP.
Stock Incentive Plans
The 2005 Omnibus Incentive Compensation Plan (“2005 Plan”) that was approved by our stockholders in June 2005 is an “omnibus” stock plan consisting of a variety of equity vehicles to provide flexibility in implementing equity awards, including incentive stock options, non-qualified stock options, restricted stock awards, unrestricted stock grants, stock appreciation rights and stock units. Participants in the 2005 Plan may be granted any one of the equity awards or any combination thereof, as determined by the Compensation Committee of our Board of Directors. A total of 2,500,000 shares were initially available for grant under the 2005 Plan. Options generally have a term of ten years from the date of grant and vest as prescribed by the Compensation Committee. Options are generally granted at a price equal to or greater than the fair market value of the underlying common stock on the date of grant. Restricted stock awards are generally awarded with an exercise price of $0. The 2005 Plan will terminate on March 22, 2015, unless the Board of Directors, at its discretion, terminates the Plan at an earlier date. For restricted stock awards prior to our adoption of SFAS 123R, the difference between the market price of the underlying common stock on the date of grant and the exercise price of restricted stock awards was initially recorded as unearned compensation on restricted stock within the stockholders’ equity section of our accompanying Consolidated Balance Sheet and was being subsequently amortized over the vesting period. The balance of
105
CKE RESTAURANTS, INC. AND SUBSIDIARIES
NOTES TO CONSOLIDATED FINANCIAL STATEMENTS — (Continued)
unearned compensation related to the unearned portion of these awards was eliminated against additional paid-in capital upon our adoption of SFAS 123R as of the beginning of fiscal 2007. As of January 31, 2007, 1,172,500 shares are available for future grants of options or other awards under the 2005 Plan. As of January 31, 2007, 610,000 options were outstanding under the 2005 Plan with exercise prices ranging from $12.71 per share to $16.50 per share.
Our 2001 Stock Incentive Plan (“2001 Plan”) was approved by our Board of Directors in September 2001. The 2001 Plan has been established as a “broad based plan” as defined by the New York Stock Exchange, whereby at least a majority of the options awarded under the 2001 Plan must be awarded to employees of CKE who are not executive officers or directors within the first three years of the 2001 Plan’s existence. Awards granted to eligible employees under the 2001 Plan are not restricted as to any specified form or structure, with such form, vesting and pricing provisions determined by the Compensation Committee of our Board of Directors. Options generally have a term of ten years from the date of grant. Options are generally granted at a price equal to or greater than the fair market value of the underlying common stock on the date of grant. As of January 31, 2007, 93,529 shares are available for future grants of options or other awards under the 2001 Plan. As of January 31, 2007, 370,522 options were outstanding under the 2001 Plan with exercise prices ranging from $5.75 per share to $15.66 per share.
Our 1999 Stock Incentive Plan (“1999 Plan”) was approved by stockholders in June 1999 and amended and again approved in June 2000. Awards granted to eligible employees under the 1999 Plan are not restricted as to any specified form or structure, with such form, vesting and pricing provisions determined by the Compensation Committee of our Board of Directors. Options generally have a term of ten years from the date of grant, except for incentive stock options granted to 10% or greater stockholders of CKE, which have a term of five years from the date of grant. Options are generally at a price equal to or greater than the fair market value of the underlying common stock on the date of grant, except that incentive stock options granted to 10% or greater stockholders of CKE may not be granted at less than 110% of the fair market value of the common stock on the date of grant. Restricted stock awards are generally awarded with an exercise price of $0 per share. As of January 31, 2007, 38,143 shares are available for future grants of options or other awards under the 1999 Plan, as amended, with such amount of available shares increased by 350,000 shares on the date of each annual meeting of stockholders. As of January 31, 2007, 3,028,491 options were outstanding under the 1999 Plan with exercise prices ranging from $2.63 per share to $19.13 per share.
Our 1994 Stock Incentive Plan expired in April 1999 and all outstanding options under the plan are fully vested. Outstanding options generally have a term of five years from the date of grant for the non-employee directors and ten years from the date of grant for employees and were priced at the fair market value of the shares on the date of grant. As of January 31, 2007, there were no shares available for future grants of options or other awards under this plan. As of January 31, 2007, there were 907,205 stock options outstanding under this plan with exercise prices ranging from $17.67 per share to $36.65 per share.
In conjunction with the acquisition of SBRG, we assumed the options outstanding under various SBRG stock plans. As of January 31, 2007, 458,088 of those options were outstanding, with an average exercise price of $5.43 per share. We also assumed warrants to purchase 981,998 shares of our common stock. During the sixteen weeks ended May 23, 2005, approximately 109,838 warrants were exercised. The remaining 872,160 warrants expired on May 1, 2005.
In general, options issued under our stock incentive plans have a term of ten years and vest over a period of three years. We generally issue new shares of common stock for option exercises. The grant date fair value is calculated using a Black-Scholes option valuation model.
106
CKE RESTAURANTS, INC. AND SUBSIDIARIES
NOTES TO CONSOLIDATED FINANCIAL STATEMENTS — (Continued)
The weighted-average assumptions used for grants in the fiscal years ended January 31, 2007, 2006 and 2005 are as follows:
| | | | | | | | | | | | | |
| | | 2007 | | | 2006 | | | 2005 | |
| |
| Annual dividend yield | | | 1.09 | % | | | 1.13 | % | | | — | |
| Expected volatility | | | 48.66 | % | | | 63.6 | % | | | 72.6 | % |
| Risk-free interest rate (matched to the expected term of the outstanding option) | | | 4.76 | % | | | 4.39 | % | | | 3.46 | % |
| Expected life (years) | | | 5.97 | | | | 5.29 | | | | 5.43 | |
| Weighted-average fair value of each option granted | | $ | 8.95 | | | $ | 7.14 | | | $ | 7.15 | |
The assumptions used to determine the fair value of each option granted are highly subjective. Changes in the assumptions used would increase (decrease) the fair value of the options granted in the fiscal years ended January 31, 2007, 2006 and 2005 as follows:
| | | | | | | | | | | | | |
Change in Assumption | | 2007 | | | 2006 | | | 2005 | |
| |
| 10% increase in expected volatility | | $ | 1.23 | | | $ | 0.79 | | | $ | 0.63 | |
| 1% increase in risk-free interest rate | | | 0.28 | | | | 0.15 | | | | 0.11 | |
| 1 year increase in expected life | | | 0.55 | | | | 0.46 | | | | 0.47 | |
| 10% decrease in expected volatility | | | (1.31 | ) | | | (0.86 | ) | | | (0.69 | ) |
| 1% decrease in risk-free interest rate | | | (0.28 | ) | | | (0.15 | ) | | | (0.12 | ) |
| 1 year decrease in expected life | | | (0.65 | ) | | | (0.56 | ) | | | (0.56 | ) |
Transactions under all plans, including assumed warrants, for the fiscal year ended January 31, 2007 are as follows:
Stock options outstanding:
| | | | | | | | | | | | | | | | | |
| | | | | | | | | Weighted-Average
| | | Aggregate
| |
| | | | | | Weighted-Average
| | | Remaining
| | | Intrinsic
| |
| | | Shares | | | Exercise Price | | | Contractual Life | | | Value | |
| |
| Outstanding at January 31, 2006 | | | 6,162,082 | | | $ | 12.08 | | | | 5.67 | | | | | |
| Granted | | | 553,144 | | | | 18.73 | | | | | | | | | |
| Exercised | | | (1,174,891 | ) | | | 8.79 | | | | | | | | | |
| Forfeited | | | (68,470 | ) | | | 13.42 | | | | | | | | | |
| Expired | | | (97,559 | ) | | | 17.84 | | | | | | | | | |
| | | | | | | | | | | | | | | | | |
| Outstanding at January 31, 2007 | | | 5,374,306 | | | $ | 13.36 | | | | 5.38 | | | $ | 39,839 | |
| | | | | | | | | | | | | | | | | |
| Exercisable at January 31, 2007 | | | 3,929,823 | | | $ | 12.65 | | | | 4.12 | | | $ | 33,353 | |
| | | | | | | | | | | | | | | | | |
| Expected to vest at January 31, 2007 | | | 1,313,381 | | | $ | 15.24 | | | | 8.76 | | | $ | 5,968 | |
| | | | | | | | | | | | | | | | | |
The following table summarizes certain stock option exercise activity for the fiscal years ended January 31, 2007, 2006 and 2005:
| | | | | | | | | | | | | |
| | | 2007 | | | 2006 | | | 2005 | |
| |
| Total intrinsic value of stock options exercised | | $ | 11,147 | | | $ | 19,525 | | | $ | 8,609 | |
107
CKE RESTAURANTS, INC. AND SUBSIDIARIES
NOTES TO CONSOLIDATED FINANCIAL STATEMENTS — (Continued)
The following table summarizes information related to stock options outstanding and exercisable at January 31, 2007:
| | | | | | | | | | | | | | | | | | | | | | | | | | | | | |
| | | | | | | Options Outstanding | | Options Exercisable |
| | | (000’s)
| | | | Weighted-Average
| | (000’s)
| | |
Range of
| | Options
| | Weighted-Average
| | Remaining
| | Shares
| | Weighted-Average
|
| Exercise Prices | | Outstanding | | Exercise Price | | Contractual Life | | Exercisable | | Exercise Price |
| |
| $ | 2.04 | | | to | | $ | 3.31 | | | | 693 | | | $ | 2.84 | | | | 3.80 | | | | 693 | | | $ | 2.84 | |
| | 3.38 | | | | | | 6.71 | | | | 662 | | | | 5.52 | | | | 5.57 | | | | 662 | | | | 5.52 | |
| | 8.39 | | | | | | 11.24 | | | | 501 | | | | 10.49 | | | | 4.43 | | | | 493 | | | | 10.52 | |
| | 11.26 | | | | | | 11.26 | | | | 641 | | | | 11.26 | | | | 7.37 | | | | 405 | | | | 11.26 | |
| | 11.50 | | | | | | 13.15 | | | | 679 | | | | 13.08 | | | | 8.57 | | | | 237 | | | | 13.06 | |
| | 13.53 | | | | | | 16.50 | | | | 664 | | | | 15.18 | | | | 5.78 | | | | 393 | | | | 14.82 | |
| | 17.67 | | | | | | 19.13 | | | | 850 | | | | 18.68 | | | | 6.39 | | | | 363 | | | | 18.09 | |
| | 23.66 | | | | | | 36.65 | | | | 684 | | | | 27.59 | | | | 0.79 | | | | 684 | | | | 27.59 | |
| | | | | | | | | | | | | | | | | | | | | | | | | | | | | |
| $ | 2.04 | | | | | $ | 36.65 | | | | 5,374 | | | $ | 13.36 | | | | 5.38 | | | | 3,930 | | | $ | 12.65 | |
| | | | | | | | | | | | | | | | | | | | | | | | | | | | | |
Restricted stock awards:
| | | | | | | | | |
| | | | | | Weighted-Average
| |
| | | | | | Grant Date
| |
| | | Shares | | | Fair Value | |
| |
| Restricted stock awards at January 31, 2006 | | | 150,000 | | | $ | 13.33 | |
| | | | | | | | | |
| Granted | | | 639,349 | | | $ | 18.30 | |
| | | | | | | | | |
| Awards vested | | | (168,337 | ) | | $ | 17.46 | |
| | | | | | | | | |
| Forfeited | | | (5,000 | ) | | $ | 13.53 | |
| | | | | | | | | |
| Restricted stock awards at January 31, 2007 | | | 616,012 | | | $ | 17.36 | |
| | | | | | | | | |
Unvested restricted stock awards as of January 31, 2007 consist of 376,012 restricted stock awards that have vesting periods ranging from two to four years and 240,000 performance-vested restricted stock awards that were awarded to certain key executives, pursuant to their amended employment agreements. Performance-vested awards vest upon the achievement of specific performance goals over specified performance periods. Performance-vested awards as of January 31, 2007 are subject to adjustment based on the final performance relative to the goals, resulting in a minimum award of no shares and a maximum award of 240,000 shares. We begin recognizing the share-based compensation expense related to these awards when we deem the achievement of performance goals to be probable. During the fiscal year ended January 31, 2007, we recognized $2,296 of share-based compensation expense related to performance-vested restricted stock awards.
As of January 31, 2007, there was $7,630 of unamortized compensation expense related to stock options. We expect to recognize this expense over a weighted-average period of 1.80 years. As of January 31, 2007, there was $8,631 of unrecognized compensation expense related to restricted stock awards. We expect to recognize this expense over a weighted-average period of 2.44 years.
108
CKE RESTAURANTS, INC. AND SUBSIDIARIES
NOTES TO CONSOLIDATED FINANCIAL STATEMENTS — (Continued)
Note 24 — Employee Benefit and Retirement Plans
Savings and Profit Sharing Plan
We sponsor a contributory plan (“401(k) Plan”) to provide retirement benefits under the provisions of Section 401(k) of the Internal Revenue Code (“IRC”) for eligible employees other than operations hourly employees and highly compensated employees. Participants may elect to contribute up to 25% of their annual salaries on a pre-tax basis to the 401(k) Plan, subject to the maximum contribution allowed by the IRC. Our matching contributions are determined at the discretion of our Board of Directors. For fiscal 2007, 2006 and 2005, we did not make matching contributions to the 401(k) Plan.
Deferred Compensation Plan
On June 28, 2005, our Board of Directors approved the CKE Restaurants, Inc. Deferred Compensation Plan (“Plan”). Under the Plan, participants may elect to defer, on a pre-tax basis, a portion of their base salary (in an amount not to exceed 80%), quarterly or annual bonus (in an amount not to exceed 100%), or, in the case of non-employee directors, annual stipend and meeting fees (in an amount not to exceed 100%). Any amounts deferred by a participant will be credited to such participant’s deferred compensation account, a bookkeeping device utilized solely for the purpose of determining the benefits payable to a participant under the Plan. The Plan further states that we may make discretionary contributions to a plan participant’s deferred compensation account. Each Plan participant will be vested in the amounts held in such plan participant’s deferred compensation account as follows: (i) one hundred percent (100%) vested at all times with respect to all amounts of deferred compensation; and (ii) vested as determined by the Board of Directors and the Compensation Committee of the Board of Directors with respect to all discretionary contributions that we make. We made no discretionary contributions to Plan participant’s accounts in fiscal 2007 or 2006.
The Plan provides that any amounts deferred under the Plan may not be distributed to a plan participant earlier than: (i) the Plan participant’s separation from service with CKE; (ii) the Plan participant’s retirement from CKE; (iii) the Plan participant’s disability; (iv) the Plan participant’s death; (v) the occurrence of a change in control; (vi) the occurrence of an unforeseeable emergency; or (vii) such other date as set forth in the plan participant’s deferral election, including a date that occurs prior to the Plan participant’s separation from service with CKE. Any amounts distributed to a Plan participant will be paid in a form specified by the Plan participant, or in the form of either a lump sum payment in an amount equal to the Plan participant’s deferred compensation account balance or equal annual installments of the Plan participant’s deferred compensation account balance over a period not to exceed (i) fifteen years in the case of a distribution on or after a Plan participant’s attainment of the normal retirement age set forth in the Plan or (ii) five years in all other cases.
Note 25 — Supplemental Cash Flow Information
The following table presents supplemental cash flow information for the fiscal years ended January 31, 2007, 2006 and 2005:
| | | | | | | | | | | | | |
| | | 2007 | | | 2006 | | | 2005 | |
| |
| Cash paid for: | | | | | | | | | | | | |
| Interest, net of amounts capitalized | | $ | 17,687 | | | $ | 19,777 | | | $ | 32,099 | |
| Income taxes, net of refunds received | | | 5,324 | | | | 1,362 | | | | 5,482 | |
| Non-cash investing and financing activities: | | | | | | | | | | | | |
| Gain recognized on sale and leaseback transactions | | | 368 | | | | 361 | | | | 305 | |
| Dividends declared, not paid | | | 2,694 | | | | 2,394 | | | | — | |
| Capital lease obligations incurred to acquire assets | | | 302 | | | | 344 | | | | — | |
109
CKE RESTAURANTS, INC. AND SUBSIDIARIES
NOTES TO CONSOLIDATED FINANCIAL STATEMENTS — (Continued)
The cash used in financing activities related to the repurchase of common stock for the fiscal year ended January 31, 2007, differs from the repurchase of common stock in the statement of stockholders’ equity, by $360, reflecting the timing difference between the recognition of share repurchase transactions and their settlement for cash. The $360 liability for unsettled repurchases of common stock is included in other current liabilities in the accompanying Consolidated Balance Sheet as of January 31, 2007.
Note 26 — Selected Quarterly Financial Data (Unaudited)
The following table presents summarized quarterly results:
| | | | | | | | | | | | | | | | | |
| | | Quarter | |
| | | 1st | | | 2nd | | | 3rd | | | 4th | |
| |
Fiscal 2007 | | | | | | | | | | | | | | | | |
| Total revenue | | $ | 488,557 | | | $ | 375,965 | | | $ | 364,918 | | | $ | 358,970 | |
| Operating income | | | 33,634 | | | | 33,308 | | | | 24,255 | | | | 13,295 | |
| Net income | | | 16,168 | | | | 14,216 | | | | 9,457 | | | | 10,331 | |
| Basic income per common share | | | 0.27 | | | | 0.24 | | | | 0.14 | | | | 0.15 | |
| Diluted income per common share | | | 0.23 | | | | 0.20 | | | | 0.13 | | | | 0.15 | |
Fiscal 2006 (as restated) | | | | | | | | | | | | | | | | |
| Total revenue | | $ | 465,909 | | | $ | 359,783 | | | $ | 344,113 | | | $ | 348,542 | |
| Operating income | | | 23,148 | | | | 13,209 | | | | 20,984 | | | | 20,539 | |
| Net income | | | 15,999 | | | | 8,448 | | | | 15,823 | | | | 140,869 | |
| Basic income per common share | | | 0.27 | | | | 0.14 | | | | 0.27 | | | | 2.37 | |
| Diluted income per common share | | | 0.24 | | | | 0.13 | | | | 0.23 | | | | 1.95 | |
Quarterly operating results are not necessarily representative of operations for a full year for various reasons, including the seasonal nature of the quick-service restaurant industry and unpredictable adverse weather conditions, which may affect sales volume and food costs. In addition, all quarters have12-week accounting periods, except the first quarters of fiscal 2007 and 2006, which have16-week accounting periods.
Fourth Quarter Adjustment
During the fourth quarter of fiscal 2007, we recorded impairment charges of $2,161 related to assets to be held and used.
Note 27 — Commitments and Contingent Liabilities
In prior years, as part of our refranchising program, we sold restaurants to franchisees. In some cases, these restaurants were on leased sites. We entered into sublease agreements with these franchisees but remained principally liable for the lease obligations. We account for the sublease payments received as franchising rental income and the payments on the leases as rental expense in franchised and licensed restaurants and other expense. As of January 31, 2007, the present value of the lease obligations under the remaining master leases’ primary terms is $106,993. Franchisees may, from time to time, experience financial hardship and may cease payment on the sublease obligation to us. The present value of the exposure to us from franchisees characterized as under financial hardship is $2,198, of which $1,120 is reserved for in our estimated liability for closing restaurants as of January 31, 2007.
Pursuant to the Facility, a letter of creditsub-facility in the amount of $85,000 was established (see Note 11). Several standby letters of credit are outstanding under thissub-facility, which secure our potential workers’ compensation, general and auto liability obligations. We are required to provide letters of credit each year, or set
110
CKE RESTAURANTS, INC. AND SUBSIDIARIES
NOTES TO CONSOLIDATED FINANCIAL STATEMENTS — (Continued)
aside a comparable amount of cash or investment securities in a trust account, based on our existing claims experience. As of January 31, 2007, we had outstanding letters of credit of $57,263, expiring at various dates through November 2007.
As of January 31, 2007, our standby letter of credit agreements with various banks expire as follows:
| | | | | |
| March 2007 | | $ | 26,807 | |
| April 2007 | | | 1,003 | |
| July 2007 | | | 7,279 | |
| November 2007 | | | 8,805 | |
| December 2007 | | | 553 | |
| February 2008 | | | 12,816 | |
| | | | | |
| | | $ | 57,263 | |
| | | | | |
As of January 31, 2007, we had unconditional purchase obligations in the amount of $43,796, which primarily include contracts for goods and services related to restaurant operations and contractual commitments for marketing and sponsorship arrangements.
We have employment agreements with certain key executives (“Agreements”). These Agreements include provisions for lump sum payments to the executives that may be triggered by the termination of employment under certain conditions, as defined in each Agreement. If such provisions were triggered, each affected executive would receive an amount ranging from one to three times his base salary for the remainder of his employment term plus, in some instances, either all of or a pro-rata portion of the bonus in effect for the year in which the termination occurs. Additionally, all options and restricted stock awarded to the affected executives which have not vested as of the date of termination would vest immediately, and restricted stock awards which have not yet been awarded would be awarded immediately. If all of these Agreements had been triggered as of January 31, 2007, we would have been required to make cash payments of approximately $14,650.
We are, from time to time, the subject of complaints or litigation from customers alleging illness, injury or other food quality, health or operational concerns. Adverse publicity resulting from such allegations may materially adversely affect us and our restaurants, regardless of whether such allegations are valid or whether we are liable. We are also, at times, the subject of complaints or allegations from current or former employees, franchisees, vendors, landlords and others.
As of January 31, 2007, we had recorded an accrued liability for contingencies related to litigation in the amount of $630, which relates to certain employment, real estate and other business disputes. Certain of the matters for which we maintain an accrued liability for litigation pose risk of loss significantly above the accrued amounts.
For several years, we offered a program whereby we guaranteed the loan obligations of certain franchisees to independent lending institutions. Franchisees have used the proceeds from such loans to acquire certain equipment and pay the costs of remodeling Carl’s Jr. restaurants. In the event a franchisee defaults under the terms of a program loan, we are obligated, within 15 days following written demand by the lending institution, to purchase such loan or assume the franchisee’s obligation thereunder by executing an assumption agreement and seeking a replacement franchisee for the franchisee in default. By purchasing such loan, we may seek recovery against the defaulting franchisee. As of January 31, 2007, the principal outstanding under program loans guaranteed by us totaled approximately $369, with maturity dates ranging from 2007 through 2009. As of January 31, 2007, we had no accrued liability for expected losses under this program and were not aware of any outstanding loans being in default.
111
EXHIBIT INDEX
| | | | | |
Exhibits | | Description |
| |
| | 3 | .1 | | Certificate of Incorporation of the Company, incorporated herein by reference to Exhibit 3.1 to the Company’sForm S-4 Registration StatementNumber 33-52523. |
| | 3 | .2 | | Certificate of Amendment of Certificate of Incorporation, as filed with the Delaware Secretary of State on December 9, 1997, filed as Exhibit 3.2 to the Company’s Annual Report onForm 10-K for the fiscal year ended January 26, 1998, and is hereby incorporated by reference. |
| | 3 | .3 | | Bylaws of the Company, incorporated herein by reference to Exhibit 3.2 to the Company’sForm S-4 Registration StatementNumber 33-52523. |
| | 3 | .4 | | Certificate of Amendment of Bylaws, incorporated herein by reference to Exhibit 3.4 to the Company’s Annual Report onForm 10-K for the fiscal year ended January 26, 2004. |
| | 3 | .5 | | Certificate of Amendment of Bylaws, incorporated herein by reference to Exhibit 3.5 to the Company’s Current Report onForm 8-K filed December 13, 2006. |
| | 4 | .6 | | Indenture, dated as of September 29, 2003, by and between the Company and J.P. Morgan Trust Company, National Association, as Trustee, filed as Exhibit 4.6 to the Company’s Quarterly Report onForm 10-Q for the quarter ended November 3, 2003, and is hereby incorporated by reference. |
| | 4 | .7 | | Form of Notes (included in Exhibit 4.6). |
| | 4 | .8 | | Registration Rights Agreement, dated as of September 29, 2003, by and among the Company and Citigroup Global Markets, Inc., for itself and the other initial purchasers, filed as Exhibit 4.8 to the Company’s Quarterly Report onForm 10-Q for the quarter ended November 3, 2003, and is hereby incorporated by reference. |
| | 10 | .1 | | Carl Karcher Enterprises, Inc. Profit Sharing Plan, as amended, filed as Exhibit 10.21 to the Company’sForm S-1 Registration Statement Number 2-73695, and is hereby incorporated by reference.(1) |
| | 10 | .4 | | CKE Restaurants, Inc. 1994 Stock Incentive Plan, as amended, incorporated herein by reference to Exhibit 4.1 to the Company’sForm S-8 Registration StatementNumber 333-12399.(1) |
| | 10 | .5 | | CKE Restaurants, Inc. 1999 Stock Incentive Plan, incorporated herein by reference to Exhibit 4.1 to the Company’sForm S-8 Registration StatementNumber 333-83601.(1) |
| | 10 | .7 | | Employment Agreement dated January 1, 1994, by and between Carl Karcher Enterprises, Inc. and Carl N. Karcher, filed as Exhibit 10.89 to the Company’s Annual Report onForm 10-K for fiscal year ended January 31, 1994, and is hereby incorporated by reference.(1) |
| | 10 | .8 | | First Amendment to Employment Agreement dated November 1, 1997, by and between Carl N. Karcher and Carl Karcher Enterprises, Inc., filed as Exhibit 10.8 to the Company’s Annual Report onForm 10-K for fiscal year ended January 26, 1998, and is hereby incorporated by reference.(1) |
| | 10 | .15 | | Employment Agreement dated as of April 9, 1999, by and between the Company and John J. Dunion, filed as Exhibit 10.7 to the Company’s Quarterly Report onForm 10-Q for the quarterly period ended May 17, 1999, and is hereby incorporated by reference.(1) |
| | 10 | .19 | | First Amendment to Settlement and Development Agreement by and between Carl Karcher Enterprises, Inc., CKE Restaurants, Inc. and GB Foods Corporation dated as of February 20, 1997, filed as Exhibit 10.31 to the Company’s Annual Report onForm 10-K for the fiscal year ended January 27, 1997, and is hereby incorporated by reference. |
| | 10 | .48 | | CKE Restaurants, Inc. 2001 Stock Incentive Plan, Incorporated herein by reference to Exhibit 4.1 to the Company’sForm S-8 Registration StatementNumber 333-76884.(1) |
| | 10 | .51 | | Distribution Service Agreement, dated as of November 7, 2003, by and between La Salsa, Inc. and McCabe’s Quality Foods, filed as Exhibit 10.51 to the Company’s Quarterly Report onForm 10-Q for the quarter ended November 3, 2003, and is hereby incorporated by reference. |
| | 10 | .53 | | Employment Agreement, effective as of January 27, 2004, by and between the Company and Theodore Abajian, incorporated herein by reference to the like-numbered exhibit to the Company’s Annual Report onForm 10-K for the fiscal year ended January 26, 2004.(1) |
| | 10 | .54 | | Second Amendment to Employment Agreement, effective as of January 1, 2004, by and between the Company and Carl N. Karcher, incorporated herein by reference to the like-numbered exhibit to the Company’s Annual Report onForm 10-K for the fiscal year ended January 26, 2004.(1) |
112
| | | | | |
Exhibits | | Description |
| |
| | 10 | .55 | | Employment Agreement, effective as of April 4, 2004, by and between the Company and Andrew F. Puzder, incorporated herein by reference to the like-numbered exhibit to the Company’s Annual Report onForm 10-K for the fiscal year ended January 26, 2004.(1) |
| | 10 | .56 | | Employment Agreement, effective as of January 27, 2004, by and between the Company and E. Michael Murphy, incorporated herein by reference to the like-numbered exhibit to the Company’s Annual Report onForm 10-K for the fiscal year ended January 26, 2004.(1) |
| | 10 | .57 | | Employment Agreement, effective as of January 27, 2004, by and between the Company and Brad R. Haley, incorporated herein by reference to the like-numbered exhibit to the Company’s Quarterly Report onForm 10-Q for the quarter ended May 17, 2004.(1) |
| | 10 | .58 | | Sixth Amended and Restated Credit Agreement, dated as of June 2, 2004, by and among the Company, the Lenders party thereto, and BNP Paribas, a bank organized under the laws of France acting through its Chicago Branch (as successor in interest to Paribas), as Agent, incorporated herein by reference to the like-numbered exhibit to the Company’s Quarterly Report onForm 10-Q for the quarter ended May 17, 2004. |
| | 10 | .59 | | Amendment No. 1 to Sixth Amended and Restated Credit Agreement, dated as of November 4, 2004, by and among the Company, BNP Paribas, a bank organized under the laws of France acting through its Chicago branch, as agent, and the lenders party to the Sixth Amended and Restated Credit Agreement, dated as of June 2, 2004, by and among those parties, incorporated herein by reference to Exhibit 10.1 to the Company’s Current Report onForm 8-K filed November 12, 2004. |
| | 10 | .60 | | Amendment to Employment Agreement between the Company and Andrew F. Puzder, effective as of February 1, 2005, incorporated herein by reference to Exhibit 10.60 to the Company’s Annual Report onForm 10-K for the fiscal year ended January 31, 2005.(1) |
| | 10 | .61 | | Amendment No. 2 to Sixth Amended and Restated Credit Agreement, dated as of April 21, 2005, by and among the Company, BNP Paribas, a bank organized under the laws of France acting through its Chicago branch, as agent, and the lenders party to the Sixth Amended and Restated Credit Agreement, dated as of June 2, 2004, by and among those parties, incorporated herein by reference to Exhibit 10.61 to the Company’s Annual Report onForm 10-K for the fiscal year ended January 31, 2005. |
| | 10 | .62 | | CKE Restaurants, Inc. 2005 Omnibus Incentive Compensation Plan, incorporated herein by reference to Annex A of the Company’s Definitive Proxy Statement on Schedule 14A filed May 20, 2005.(1) |
| | 10 | .63 | | CKE Restaurants, Inc. 1994 Employee Stock Purchase Plan, as amended, incorporated herein by reference to Annex B of the Company’s Definitive Proxy Statement on Schedule 14A filed May 20, 2005.(1) |
| | 10 | .64 | | Form of Stock Option Agreement under the 2005 Omnibus Incentive Compensation Plan, incorporated herein by reference to Exhibit 10.2 to the Company’s Current Report onForm 8-K filed June 30, 2005.(1) |
| | 10 | .65 | | Form of Restricted Stock Award Agreement under the 2005 Omnibus Incentive Compensation Plan, incorporated herein by reference to Exhibit 10.3 to the Company’s Current Report onForm 8-K filed June 30, 2005.(1) |
| | 10 | .66 | | Form of Stock Appreciation Rights Award Agreement under the 2005 Omnibus Incentive Compensation Plan, incorporated herein by reference to Exhibit 10.4 to the Company’s Current Report onForm 8-K filed June 30, 2005.(1) |
| | 10 | .67 | | Form of Restricted Stock Unit Award Agreement under the 2005 Omnibus Incentive Compensation Plan, incorporated herein by reference to Exhibit 10.5 to the Company’s Current Report onForm 8-K filed June 30, 2005.(1) |
| | 10 | .68 | | Form of Stock Award Agreement under the 2005 Omnibus Incentive Compensation Plan, incorporated herein by reference to Exhibit 10.6 to the Company’s Current Report onForm 8-K filed June 30, 2005.(1) |
| | 10 | .69 | | CKE Restaurants, Inc. Deferred Compensation Plan, incorporated herein by reference to Exhibit 10.7 to the Company’s Current Report onForm 8-K filed June 30, 2005.(1) |
| | 10 | .70 | | Stock Option Purchase Agreement, dated as of July 19, 2005, by and between the Company and William P. Foley, II, incorporated herein by reference to Exhibit 10.1 to the Company’s Current Report onForm 8-K filed July 19, 2005. |
| | 10 | .71 | | Amendment No. 2 to Employment Agreement between the Company and Andrew F. Puzder, effective as of December 6, 2005, incorporated herein by reference to Exhibit 10.71 to the Company’s Annual Report on Form 10-K for the fiscal year ended January 30, 2006.(1) |
113
| | | | | |
Exhibits | | Description |
| |
| | 10 | .72 | | Amendment No. 1 to Employment Agreement between the Company and E. Michael Murphy, effective as of December 6, 2005, incorporated herein by reference to Exhibit 10.72 to the Company’s Annual Report on Form 10-K for the fiscal year ended January 30, 2006.(1) |
| | 10 | .73 | | Amendment No. 1 to Employment Agreement between the Company and Theodore Abajian, effective as of December 6, 2005, incorporated herein by reference to Exhibit 10.73 to the Company’s Annual Report on Form 10-K for the fiscal year ended January 30, 2006.(1) |
| | 10 | .74 | | Amendment No. 1 to Employment Agreement between the Company and Brad R. Haley, effective as of December 6, 2005, incorporated herein by reference to Exhibit 10.74 to the Company’s Annual Report on Form 10-K for the fiscal year ended January 30, 2006.(1) |
| | 10 | .75 | | Amendment No. 3 to Employment Agreement between the Company and Andrew F. Puzder, effective as of October 12, 2006, incorporated herein by reference to Exhibit 10.1 to the Company’s Current Report onForm 8-K filed October 17, 2006.(1) |
| | 10 | .76 | | Amendment No. 2 to Employment Agreement between the Company and E. Michael Murphy, effective as of October 12, 2006, incorporated herein by reference to Exhibit 10.2 to the Company’s Current Report onForm 8-K filed October 17, 2006.(1) |
| | 10 | .77 | | Amendment No. 2 to Employment Agreement between the Company and Theodore Abajian, effective as of October 12, 2006, incorporated herein by reference to Exhibit 10.3 to the Company’s Current Report onForm 8-K filed October 17, 2006.(1) |
| | 10 | .78 | | Amendment No. 3 to the Sixth Amended and Restated Credit Agreement, dated as of January 22, 2007, by and among the Company, BNP Paribas, a bank organized under the laws of France acting through its Chicago branch, as agent, and the lenders party to the Sixth Amended and Restated Credit Agreement, dated as of June 2, 2004, by and among those parties, incorporated herein by reference to Exhibit 10.1 to the Company’s Current Report onForm 8-K filed January 25, 2007. |
| | 10 | .79 | | Seventh Amended and Restated Credit Agreement, dated as of March 27, 2007, by and among the Company, the Lenders party thereto, and BNP Paribas, a bank organized under the laws of France acting through its Chicago Branch, as Administrative Agent, and Citigroup Global Markets, Inc. and Bank of America, N.A., as Co-Syndication Agents. |
| | 10 | .80 | | Amendment No. 2 to Employment Agreement between the Company and Brad R. Haley, effective as of March 20, 2007.(1) |
| | 11 | .1 | | Computation of Per Share Earnings, included in Note 1 of Notes to Consolidated Financial Statements. |
| | 12 | .1 | | Computation of Ratios. |
| | 14 | .1 | | CKE Restaurants, Inc. Code of Ethics for CEO and Senior Financial Officers, as approved by the Company’s Board of Directors on March 3, 2004, incorporated herein by reference to the like-numbered exhibit to the Company’s Annual Report onForm 10-K for the fiscal year ended January 26, 2004. |
| | 21 | .1 | | Subsidiaries of Company. |
| | 23 | .1 | | Consent of Independent Registered Public Accounting Firm. |
| | 31 | .1 | | Certification of Chief Executive Officer pursuant toRule 13a-14(a)/15d-14(a), as adopted pursuant to Section 302 of the Sarbanes-Oxley Act of 2002. |
| | 31 | .2 | | Certification of Chief Financial Officer pursuant toRule 13a-14(a)/15d-14(a), as adopted pursuant to Section 302 of the Sarbanes-Oxley Act of 2002. |
| | 32 | .1 | | Certification of Chief Executive Officer pursuant to 18 U.S.C. Section 1350, as adopted pursuant to Section 906 of the Sarbanes-Oxley Act of 2002. |
| | 32 | .2 | | Certification of Chief Financial Officer pursuant to 18 U.S.C. Section 1350, as adopted pursuant to Section 906 of the Sarbanes-Oxley Act of 2002. |
| | |
| * | | Schedules or exhibits omitted. The Company shall furnish supplementally to the Securities and Exchange Commission a copy of any omitted schedule or exhibit upon request. |
| |
| (1) | | A management contract or compensatory plan or arrangement required to be filed as an exhibit to this report pursuant to Item 15(c) ofForm 10-K. |
114