UNITED STATES
SECURITIES AND EXCHANGE COMMISSION
Washington, D.C. 20549
FORM N-CSR
CERTIFIED SHAREHOLDER REPORT OF REGISTERED
MANAGEMENT INVESTMENT COMPANIES
Investment Company Act file number | 811-08388 |
|
Morgan Stanley Asia-Pacific Fund, Inc. |
(Exact name of registrant as specified in charter) |
|
1221 Avenue of the Americas 5th Floor New York, NY | | 10020 |
(Address of principal executive offices) | | (Zip code) |
|
Ronald E. Robison 1221 Avenue of the Americas, 5th Floor New York, New York 10020 |
(Name and address of agent for service) |
|
Registrant’s telephone number, including area code: | 1-800-221-6726 | |
|
Date of fiscal year end: | 12/31 | |
|
Date of reporting period: | 6/30/06 | |
| | | | | | | | |
Form N-CSR is to be used by management investment companies to file reports with the Commission not later than 10 days after the transmission to stockholders of any report that is required to be transmitted to stockholders under Rule 30e-1 under the Investment Company Act of 1940 (17 CFR 270.30e-1). The Commission may use the information provided on Form N-CSR in its regulatory, disclosure review, inspection, and policymaking roles.
A registrant is required to disclose the information specified by Form N-CSR, and the Commission will make this information public. A registrant is not required to respond to the collection of information contained in Form N-CSR unless the Form displays a currently valid Office of Management and Budget ("OMB") control number. Please direct comments concerning the accuracy of the information collection burden estimate and any suggestions for reducing the burden to Secretary, Securities and Exchange Commission, 450 Fifth Street, NW, Washington, DC 20549-0609. The OMB has reviewed this collection of information under the clearance requirements of 44 U.S.C. Section 3507.
ITEM 1. REPORTS TO STOCKHOLDERS.
The Fund’s semi-annual report transmitted to shareholders pursuant to Rule 30e-1 under the Investment Company Act of 1940 is as follows:
| | 2006 Semi-Annual Report |
| | |
| | June 30, 2006 |

Morgan Stanley
Asia-Pacific Fund, Inc.
Morgan Stanley
Investment Management Inc.
Investment Adviser
| | Morgan Stanley Asia-Pacific Fund, Inc. |
| | |
Letter to Stockholders | | Overview (unaudited) |
Performance
For the six months ended June 30, 2006, the Morgan Stanley Asia-Pacific Fund, Inc. (the “Fund”) had total returns, based on net asset value and market price per share of 6.81%, net of fees and 1.47%, respectively, compared to 4.95% for its benchmark. The benchmark for the Fund is comprised of two Morgan Stanley Capital International (MSCI) indices; Japan Net and All-Country Asia-Pacific Free ex-Japan Net (together, the “Index”), with each index weighted equally. On June 30, 2006, the closing price of the Fund’s shares on the New York Stock Exchange was $15.75, representing a 14.8% discount to the Fund’s net asset value per share.
Factors Affecting Performance
• For the six month period, stock selection was the primary contributor to the Fund’s performance versus the Index, while country allocation detracted slightly.
• From a top-down perspective, an overweight in Indonesia helped buoy performance but was offset by the Fund’s overweights in Japan and Pakistan, as the two markets underperformed the overall Index. The Fund’s underweight in China, one of the strongest performing markets in the Index, hurt performance.
• From a bottom-up perspective, positive stock selection in Japan was a material contributor to the Fund’s outperformance. Additionally, stock selection scores in Taiwan and Australia were positive but slightly offset by negative selection scores in Thailand.
• The Fund’s overweight bias in select Taiwanese technology, banks and insurance stocks contributed to performance. Our overweight positions in Australian energy, materials, biotechnology and insurance stocks further contributed to the Fund’s outperformance. In Thailand, our relative overweight biases in construction, banks and telecommunications companies hurt performance as there was a broad based market correction in Thailand during this period.
• The Japan portion of the portfolio outperformed the Index for the six months ended June 30, 2006. The portion’s outperformance for the period was driven by both positive sector allocation and stock selection. A minimal allocation in the retailing sector and stock selection in the software and services sector added to relative gains. In the consumer durables and apparel sector, stock selection and an overweight position also contributed positively to relative performance. On the other hand, stock selection in the materials sector, in which the Japan segment was overweighted, detracted.
• The Japanese stock markets were volatile for the six month period. The Nikkei Stock Average Index dropped 4% for the reporting period, having reached its highest level in six years on April 11th then declining to its lowest level since last November. On June 13th small-cap stock market indexes, such as the Tokyo Stock Exchange Mothers Index, declined most among major global stock indexes, plunging 42% during the period as large-cap value stocks generally performed better than small-cap growth stocks. Despite evidence that the Japanese economy was on solid ground, the stock markets dropped severely in May. Both individual and institutional investors sold shares, due mainly to uncertainties about the future of monetary policy in Japan and the U.S., as well as the announcement of lower than expected, more conservative earnings forecasts for the year through May 2007.
Management Strategies
• The health of Asian economies has improved dramatically since the late 1990s and we believe the risk of a new crisis is currently relatively low. At the close of the period, we continued to expect volatility to remain relatively high in the short to medium-term, as oil prices need to correct in order to reflect moderate growth expectations. Moreover, we continued to monitor tightening global liquidity, falling risk appetites and the possible slowing growth in the U.S.
Sincerely,

Ronald E. Robison
President and Principal Executive Officer
The Fund’s assets are managed within the Investment Adviser’s (Morgan Stanley Investment Management Inc.) Global Emerging Markets Equity Team. The team consists of portfolio managers and analysts. The members of the team who are responsible for the day-to-day management of the Fund are John R. Alkire and Kunihiko Sugio, each a Managing Director of the Investment Adviser.
2
| | Morgan Stanley Asia-Pacific Fund, Inc. |
Investment Advisory | | |
Agreement Approval | | June 30, 2006 (unaudited) |
Nature, Extent and Quality of Services
The Board reviewed and considered the nature and extent of the investment advisory services provided by the Investment Adviser under the Advisory Agreement, including portfolio management, investment research and equity and fixed income securities trading. The Board also reviewed and considered the nature and extent of the non-advisory, administrative services provided by the Fund’s Administrator under the Administration Agreement, including accounting, clerical, bookkeeping, compliance, business management and planning, and the provision of supplies, office space and utilities at the Investment Adviser’s expense. (The Investment Adviser and the Administrator together are referred to as the “Adviser” and the Advisory and Administration Agreements together are referred to as the “Management Agreement”). The Board also compared the nature of the services provided by the Adviser with similar services provided by non-affiliated advisers asreported to the Board by Lipper Inc. (“Lipper”).
The Board reviewed and considered the qualifications of the portfolio managers, the senior administrative managers and other key personnel of the Adviser who provide the advisory and administrative services to the Fund. The Board determined that the Adviser’s portfolio managers and key personnel are well qualified by education and/or training and experience to perform the services in an efficient and professional manner. The Board concluded that the nature and extent of the advisory and administrative services provided were necessary and appropriate for the conduct of the business and investment activities of the Fund. The Board also concluded that the overall quality of the advisory and administrative services was satisfactory.
Performance Relative to Comparable Funds Managed by Other Advisers
On a regular basis, the Board reviews the performance of all funds in the Morgan Stanley Fund Complex, including the Fund, compared to their peers, paying specific attention to the underperforming funds. In addition, the Board specifically reviewed the Fund’s performance for the one-, three- and five-year periods ended November 30, 2005, as shown in a report provided by Lipper (the “Lipper Report”), compared to the performance of comparable funds selected by Lipper (the “performance peer group”). The Board also discussed with the Adviser the performance goals and the actual results achieved in managing the Fund. When a fund underperforms its performance peer group, the Board discusses with the Adviser the causes of the underperformance and, where necessary, specific changes to the fund’s investment strategy or investment personnel. The Board concluded that the Fund can reasonably be expected to be competitive with that of its performance peer group based on recent action taken or proposed to be taken by the Adviser with respect to the Fund’s investment strategy and/or investment personnel.
Fees Relative to Other Proprietary Funds Managed by the Adviser with Comparable Investment Strategies
The Board noted that the Adviser did not manage any other proprietary funds with investment strategies comparable to those of the Fund.
Fees and Expenses Relative to Comparable Funds Managed by Other Advisers
The Board reviewed the advisory and administrative fee (together, the “management fee”) rate and total expense ratio of the Fund as compared to the average management fee rate and average total expense ratio for funds, selected by Lipper (the “expense peer group”), managed by other advisers with investment strategies comparable to those of the Fund, as shown in the Lipper Report. The Board concluded that the Fund’s management fee rate and total expense ratio were competitive with those of its expense peer group.
Breakpoints and Economies of Scale
The Board reviewed the structure of the Fund’s management fee schedule under the Management Agreement and noted that it does not include any breakpoints. The Board considered that the Fund is a closed-end fund and, therefore, that the Fund’s assets are not likely to grow with new sales or grow significantly as a result of capital appreciation. The Board concluded that economies of scale for the Fund were not a factor that needed to be considered at the present time.
3
| | Morgan Stanley Asia-Pacific Fund, Inc. |
Investment Advisory | | |
Agreement Approval (cont’d) | | June 30, 2006 (unaudited) |
Profitability of the Adviser and Affiliates
The Board considered information concerning the costs incurred and profits realized by the Adviser and affiliates during the last year from their relationship with the Fund and during the last two years from their relationship with the Morgan Stanley Fund Complex and reviewed with the Adviser the cost allocation methodology used to determine the profitability of the Adviser and affiliates. Based on its review of the information it received, the Board concluded that the profits earned by the Adviser and affiliates were not excessive in light of the advisory, administrative and other services provided to the Fund.
Fall-Out Benefits
The Board considered so-called “fall-out benefits” derived by the Adviser and affiliates from their relationship with the Fund and the Morgan Stanley Fund Complex, such as commissions on the purchase and sale of Fund shares and “float” benefits derived from handling of checks for purchases and sales of Fund shares, through a broker-dealer affiliate of the Adviser and “soft dollar” benefits (discussed in the next section). The Board also considered that an affiliate of the Adviser sold a joint venture that owned an electronic trading system network (“ECN”), which may be used by the Adviser for trading on behalf of the Fund. As part of the sale of the joint venture, the affiliate receives a 10-year payout based on the revenue stream from trading on the ECN. Although the affiliate disgorges the portion of the payout that is comprised of commissions received from trades executed by the Adviser on the ECN to a charitable organization, the Board considered the fact that trades by the Adviser would increase order flow, and, thus, result in a potential fall-out benefit to the affiliate. The Board concluded that the sales commissions were competitive with those of other broker-dealers, the float benefits were relatively small, the affiliate disgorged revenues in connection with the ECN-related revenue and the potential fall-out benefit from increased order flow was relatively small.
Soft Dollar Benefits
The Board considered whether the Adviser realizes any benefits as a result of brokerage transactions executed through “soft dollar” arrangements. Under such arrangements, brokerage commissions paid by the Fund and/or other funds managed by the Adviser would be used to pay for research that a securities broker obtains from third parties, or to pay for both research and execution services from securities brokers who effect transactions for the Fund. The Adviser informed the Board that it does not use Fund commissions to pay for third party research. It does use commissions to pay for research which is bundled with execution services. The Board recognized that the receipt of such research from brokers may reduce the Adviser’s costs but concluded that the receipt of such research strengthens the investment management resources of the Adviser, which may ultimately benefit the Fund and other funds in the Morgan Stanley Fund Complex.
Adviser Financially Sound and Financially Capable of Meeting the Fund’s Needs
The Board considered whether the Adviser is financially sound and has the resources necessary to perform its obligations under the Management Agreement. The Board noted that the Adviser’s operations remain profitable, although increased expenses in recent years have reduced the Adviser’s profitability. The Board concluded that the Adviser has the financial resources necessary to fulfill its obligations under the Management Agreement.
Historical Relationship Between the Fund and the Adviser
The Board also reviewed and considered the historical relationship between the Fund and the Adviser, including the organizational structure of the Adviser, the policies and procedures formulated and adopted by the Adviser for managing the Fund’s operations and the Board’s confidence in the competence and integrity of the senior managers and key personnel of the Adviser. The Board concluded that it is beneficial for the Fund to continue its relationship with the Adviser.
Other Factors and Current Trends
The Board considered the controls and procedures adopted and implemented by the Adviser and monitored by the Fund’s Chief Compliance Officer and concluded that the conduct of business by the Adviser indicates a good faith effort on its part to adhere to high ethical standards in the conduct of the Fund’s business.
General Conclusion
After considering and weighing all of the above factors, the Board concluded that it would be in the best interest of the Fund and its stockholders to approve renewal of the Management Agreement for another year.
4
| Morgan Stanley Asia-Pacific Fund, Inc. |
| |
Portfolio of Investments | June 30, 2006 (unaudited) |
| | | | Value | |
| | Shares | | (000) | |
COMMON STOCKS (96.8%) | | | | | |
(Unless Otherwise Noted) | | | | | |
Australia (10.8%) | | | | | |
Beverages | | | | | |
Foster’s Group Ltd. | | 977,900 | | $ | 3,975 | |
Lion Nathan Ltd. | | 178,700 | | 1,036 | |
McGuigan Simeon Wines Ltd. | | 175,500 | | 326 | |
| | | | 5,337 | |
Biotechnology | | | | | |
CSL Ltd. | | 36,450 | | 1,456 | |
Capital Markets | | | | | |
Macquarie Bank Ltd. | | 38,300 | | 1,964 | |
Commercial Banks | | | | | |
Australia & New Zealand Banking Group Ltd. | | 238,909 | | 4,721 | |
Commonwealth Bank of Australia | | 39,650 | | 1,308 | |
National Australia Bank Ltd. | | 211,650 | | 5,530 | |
Westpac Banking Corp. | | 250,450 | | 4,333 | |
| | | | 15,892 | |
Commercial Services & Supplies | | | | | |
Brambles Industries Ltd. | | 351,100 | | 2,870 | |
Food & Staples Retailing | | | | | |
Metcash Ltd. | | 650,700 | | 1,808 | |
Health Care Providers & Services | | | | | |
DCA Group Ltd. | | 296,700 | | 615 | |
Hotels, Restaurants & Leisure | | | | | |
Tattersall’s Ltd. | | 1,133,300 | | 2,375 | |
UniTAB Ltd. | | 6,450 | | 71 | |
| | | | 2,446 | |
Industrial Conglomerates | | | | | |
Wesfarmers Ltd. | | 101,400 | | 2,662 | |
Insurance | | | | | |
AMP Ltd. | | 766,200 | | 5,198 | |
Insurance Australia Group Ltd. | | 338,100 | | 1,344 | |
QBE Insurance Group Ltd. | | 103,050 | | 1,570 | |
| | | | 8,112 | |
Metals & Mining | | | | | |
BHP Billiton Ltd. | | 479,377 | | 10,330 | |
Rio Tinto Ltd. | | 56,700 | | 3,278 | |
| | | | 13,608 | |
Oil, Gas & Consumable Fuels | | | | | |
Caltex Australia Ltd. | | 133,600 | | 2,343 | |
Origin Energy Ltd. | | 338,100 | | 1,849 | |
| | | | 4,192 | |
Paper & Forest Products | | | | | |
Great Southern Plantations Ltd. | | 235,400 | | 600 | |
Gunns Ltd. | | 627,200 | | | 1,310 | |
| | | | 1,910 | |
Real Estate | | | | | |
Westfield Group | | 235,000 | | 3,026 | |
Textiles, Apparel & Luxury Goods | | | | | |
Billabong International Ltd. | | 315,750 | | 3,602 | |
Transportation Infrastructure | | | | | |
Macquarie Airports | | 411,600 | | 939 | |
Macquarie Infrastructure Group | | 318,800 | | 796 | |
| | | | 1,735 | |
| | | | 71,235 | |
China (4.3%) | | | | | |
Airlines | | | | | |
Air China Ltd., ‘H’ | | 3,980,000 | | 1,666 | |
Commercial Banks | | | | | |
Bank of China Ltd. | | (a)3,243,000 | | 1,472 | |
China Construction Bank, ‘H’ | | (c)19,086,000 | | 8,724 | |
| | | | 10,196 | |
Food Products | | | | | |
Global Bio-Chem Technology Group Co., Ltd. | | 1,502,000 | | 638 | |
Health Care Equipment & Supplies | | | | | |
Moulin Global Eyecare Holdings Ltd. | | (a)(b)(f)1,616,000 | | @— | |
| | | | | |
Household Durables | | | | | |
Grande Holdings Ltd. | | 735,000 | | 402 | |
Insurance | | | | | |
China Life Insurance Co., Ltd., ‘H’ | | 1,454,000 | | 2,294 | |
PICC Property & Casualty Co., Ltd., ‘H’ | | 4,756,000 | | 1,745 | |
Ping An Insurance Group Co. of China Ltd., ‘H’ | | 1,017,000 | | 3,084 | |
| | | | 7,123 | |
Oil, Gas & Consumable Fuels | | | | | |
PetroChina Co., Ltd., ‘H’ | | 1,816,000 | | 1,941 | |
Textiles, Apparel & Luxury Goods | | | | | |
Victory City International Holdings Ltd. | | 3,052,000 | | 992 | |
Wireless Telecommunication Services | | | | | |
China Mobile Hong Kong Ltd. | | 972,000 | | 5,557 | |
| | | | 28,515 | |
Hong Kong (3.9%) | | | | | |
Commercial Banks | | | | | |
Dah Sing Financial Holdings Ltd. | | 53,600 | | 393 | |
Electronic Equipment & Instruments | | | | | |
Kingboard Chemical Holdings Ltd. | | 558,000 | | 1,574 | |
The accompanying notes are an integral part of the financial statements.
5
| | Morgan Stanley Asia-Pacific Fund, Inc. |
| | |
Portfolio of Investments (cont’d) | | June 30, 2006 (unaudited) |
| | | | Value | |
| | Shares | | (000) | |
Hong Kong (cont’d) | | | | | |
Hotels, Restaurants & Leisure | | | | | |
China Travel International Investment Hong Kong Ltd. | | 5,263,000 | | $ | 1,267 | |
Household Durables | | | | | |
Techtronic Industries Co. | | 808,000 | | 1,092 | |
Industrial Conglomerates | | | | | |
Hutchison Whampoa Ltd. | | 206,000 | | 1,881 | |
Real Estate | | | | | |
Cheung Kong Holdings Ltd. | | 192,000 | | 2,081 | |
Great Eagle Holdings Ltd. | | 516,000 | | 1,767 | |
Hysan Development Co., Ltd. | | 477,000 | | 1,345 | |
New World Development Ltd. | | 2,416,800 | | 3,983 | |
Sun Hung Kai Properties Ltd. | | 52,000 | | 530 | |
Swire Pacific Ltd., ‘A’ | | 147,000 | | 1,517 | |
| | | | 11,223 | |
Specialty Retail | | | | | |
Esprit Holdings Ltd. | | 1,005,500 | | 8,208 | |
| | | | 25,638 | |
India (1.4%) | | | | | |
Automobiles | | | | | |
Hero Honda Motors Ltd. | | 52,030 | | 897 | |
Commercial Banks | | | | | |
Punjab National Bank Ltd. | | (b)241,000 | | 1,792 | |
Electrical Equipment | | | | | |
Bharat Heavy Electricals Ltd. | | 156,637 | | 6,632 | |
| | | | 9,321 | |
Indonesia (1.7%) | | | | | |
Commercial Banks | | | | | |
Bank Central Asia Tbk PT | | 4,296,500 | | 1,902 | |
Bank Internasional Indonesia Tbk PT | | 1,395,500 | | 28 | |
Bank Rakyat Indonesia PT | | 6,331,000 | | 2,802 | |
| | | | 4,732 | |
Diversified Telecommunication Services | | | | | |
Telekomunikasi Indonesia Tbk PT | | 2,515,500 | | 1,996 | |
Gas Utilities | | | | | |
Perusahaan Gas Negara PT | | 1,398,500 | | 1,698 | |
Machinery | | | | | |
United Tractors Tbk PT | | 2,223,500 | | 1,296 | |
Multiline Retail | | | | | |
Mitra Adiperkasa Tbk PT | | 5,554,800 | | 498 | |
Real Estate | | | | | |
Kawasan Industries Jababeka Tbk PT | | 63,752,000 | | 895 | |
| | | | 11,115 | |
Japan (53.8%) | | | | | |
Automobiles | | | | | |
Nissan Motor Co., Ltd. | | 979,400 | | | 10,698 | |
Suzuki Motor Corp. | | 307,800 | | 6,657 | |
Toyota Motor Corp. | | 231,200 | | 12,101 | |
Yamaha Motor Co., Ltd. | | 242,400 | | 6,333 | |
| | | | 35,789 | |
Building Products | | | | | |
Daikin Industries Ltd. | | 224,800 | | 7,798 | |
Nippon Sheet Glass Co., Ltd. | | 455,000 | | 2,529 | |
Sanwa Shutter Corp. | | 474,000 | | 2,792 | |
| | | | 13,119 | |
Chemicals | | | | | |
Daicel Chemical Industries Ltd. | | 690,000 | | 5,637 | |
Denki Kagaku Kogyo KK | | 1,102,000 | | 4,584 | |
Kaneka Corp. | | 528,000 | | 4,798 | |
Lintec Corp. | | 170,100 | | 4,452 | |
Mitsubishi Chemical Holdings Corp. | | 821,000 | | 5,129 | |
Nifco, Inc. | | 182,200 | | 3,606 | |
Shin-Etsu Polymer Co., Ltd. | | 287,900 | | 4,151 | |
Teijin Ltd. | | 841,000 | | 5,335 | |
Toyo Ink Manufacturing Co., Ltd. | | 375,000 | | 1,570 | |
| | | | 39,262 | |
Commercial Services & Supplies | | | | | |
Dai Nippon Printing Co., Ltd. | | 306,000 | | 4,733 | |
Nissha Printing Co., Ltd. | | 39,700 | | 1,481 | |
| | | | 6,214 | |
Computers & Peripherals | | | | | |
Fujitsu Ltd. | | 1,206,000 | | 9,347 | |
Mitsumi Electric Co., Ltd. | | 266,300 | | 3,151 | |
NEC Corp. | | 1,331,000 | | 7,095 | |
Toshiba Corp. | | 1,583,000 | | 10,333 | |
| | | | 29,926 | |
Construction & Engineering | | | | | |
Kyudenko Corp. | | 241,000 | | 1,432 | |
Maeda Road Construction Co., Ltd. | | 188,000 | | 1,434 | |
Obayashi Corp. | | 699,000 | | 4,807 | |
Sanki Engineering Co., Ltd. | | 92,000 | | 652 | |
| | | | 8,325 | |
Consumer Finance | | | | | |
Hitachi Capital Corp. | | 225,400 | | 3,939 | |
Diversified Telecommunication Services | | | | | |
Nippon Telegraph & Telephone Corp. | | 967 | | 4,740 | |
Electric Utilities | | | | | |
Tokyo Electric Power Co., Inc. | | 146,300 | | 4,040 | |
The accompanying notes are an integral part of the financial statements.
6
| | Morgan Stanley Asia-Pacific Fund, Inc. |
| | |
Portfolio of Investments (cont’d) | | June 30, 2006 (unaudited) |
| | | | Value | |
| | Shares | | (000) | |
Japan (cont’d) | | | | | |
Electrical Equipment | | | | | |
Furukawa Electric Co., Ltd. | | 959,000 | | $ | 6,201 | |
Electronic Equipment & Instruments | | | | | |
Hitachi Ltd. | | 1,079,000 | | 7,128 | |
Kyocera Corp. | | 91,000 | | 7,045 | |
Ryosan Co., Ltd. | | 118,800 | | 3,115 | |
TDK Corp. | | 86,700 | | 6,591 | |
| | | | 23,879 | |
Food & Staples Retailing | | | | | |
FamilyMart Co., Ltd. | | 170,600 | | 4,919 | |
Food Products | | | | | |
House Foods Corp. | | 136,900 | | 2,069 | |
Nippon Meat Packers, Inc. | | 322,000 | | 3,731 | |
| | | | 5,800 | |
Household Durables | | | | | |
Casio Computer Co., Ltd. | | 344,900 | | 6,585 | |
Matsushita Electric Industrial Co., Ltd. | | 548,000 | | 11,564 | |
Rinnai Corp. | | 86,700 | | 2,296 | |
Sekisui Chemical Co., Ltd. | | 679,000 | | 5,862 | |
Sekisui House Ltd. | | 366,000 | | 5,024 | |
Sony Corp. | | 141,600 | | 6,249 | |
| | | | 37,580 | |
Leisure Equipment & Products | | | | | |
Fuji Photo Film Co., Ltd. | | 197,900 | | 6,640 | |
Yamaha Corp. | | 288,700 | | 5,424 | |
| | | | 12,064 | |
Machinery | | | | | |
Amada Co., Ltd. | | 494,000 | | 5,180 | |
Daifuku Co., Ltd. | | 304,000 | | 5,015 | |
Fuji Machine Manufacturing Co., Ltd. | | 139,300 | | 3,372 | |
Fujitec Co., Ltd. | | 205,000 | | 1,356 | |
Kurita Water Industries Ltd. | | 259,900 | | 5,337 | |
Minebea Co., Ltd. | | 682,000 | | 3,713 | |
Mitsubishi Heavy Industries Ltd. | | 1,682,000 | | 7,261 | |
Tsubakimoto Chain Co. | | 627,000 | | 4,098 | |
| | | | 35,332 | |
Media | | | | | |
Toho Co., Ltd. | | 98,200 | | 1,961 | |
Metals & Mining | | | | | |
Nippon Steel Corp. | | 409,000 | | 1,548 | |
Office Electronics | | | | | |
Canon, Inc. | | 267,300 | | 13,103 | |
Ricoh Co., Ltd. | | 460,000 | | 9,024 | |
| | | | 22,127 | |
Pharmaceuticals | | | | | |
Astellas Pharmaceutical, Inc. | | 173,000 | | | 6,349 | |
Daiichi Sankyo Co., Ltd. | | 267,000 | | 7,350 | |
Ono Pharmaceutical Co., Ltd. | | 115,100 | | 5,602 | |
| | | | 19,301 | |
Real Estate | | | | | |
Mitsubishi Estate Co., Ltd. | | 10,000 | | 212 | |
Road & Rail | | | | | |
East Japan Railway Co. | | 693 | | 5,147 | |
Semiconductors & Semiconductor Equipment | | | | | |
Rohm Co., Ltd. | | 46,000 | | 4,112 | |
Software | | | | | |
Nintendo Co., Ltd. | �� | 64,300 | | 10,788 | |
Textiles, Apparel & Luxury Goods | | | | | |
Nisshinbo Industries, Inc. | | 257,000 | | 2,812 | |
Trading Companies & Distributors | | | | | |
Hitachi High-Technologies Corp. | | 87,100 | | 2,649 | |
Mitsubishi Corp. | | 435,200 | | 8,690 | |
Nagase & Co., Ltd. | | 219,000 | | 2,895 | |
| | | | 14,234 | |
| | | | 353,371 | |
Malaysia (0.7%) | | | | | |
Construction & Engineering | | | | | |
Gamuda Bhd | | 1,602,000 | | 1,500 | |
Road Builder (Malaysia) Holdings Bhd | | 1,062,500 | | 630 | |
| | | | 2,130 | |
Electric Utilities | | | | | |
Tenaga Nasional Bhd | | 585,000 | | 1,465 | |
Real Estate | | | | | |
Bandar Raya Developments Bhd | | 2,589,200 | | 888 | |
| | | | 4,483 | |
Pakistan (0.6%) | | | | | |
Commercial Banks | | | | | |
National Bank of Pakistan | | 383,280 | | 1,372 | |
Diversified Telecommunication Services | | | | | |
Pakistan Telecom Co., Ltd. | | 1,305,400 | | 880 | |
Oil, Gas & Consumable Fuels | | | | | |
Oil & Gas Development Co., Ltd. | | 578,100 | | 1,313 | |
| | | | 3,565 | |
Singapore (3.0%) | | | | | |
Commercial Banks | | | | | |
DBS Group Holdings Ltd. | | 197,000 | | 2,253 | |
Oversea-Chinese Banking Corp. | | 479,400 | | 1,999 | |
United Overseas Bank Ltd. | | 296,000 | | 2,917 | |
| | | | 7,169 | |
The accompanying notes are an integral part of the financial statements.
7
| | Morgan Stanley Asia-Pacific Fund, Inc. |
| | |
Portfolio of Investments (cont’d) | June 30, 2006 (unaudited) |
| | Shares | | Value
(000) | |
Singapore (cont’d) | | | | | |
Computers & Peripherals | | | | | |
Unisteel Technology Ltd. | | 1,413,500 | | $ | 1,634 | |
Hotels, Restaurants & Leisure | | | | | |
City Developments Ltd. | | 261,000 | | 1,542 | |
Industrial Conglomerates | | | | | |
SembCorp Industries Ltd. | | 474,000 | | 970 | |
Media | | | | | |
Singapore Press Holdings Ltd. | | 350,000 | | 911 | |
Real Estate | | | | | |
CapitaLand Ltd. | | 1,181,000 | | 3,358 | |
Suntec REIT | | 2,173,000 | | 1,702 | |
United Industrial Corp. | | 1,627,000 | | 1,521 | |
| | | | 6,581 | |
Semiconductors & Semiconductor Equipment | | | | | |
Chartered Semiconductor Manufacturing Ltd. | | (a)1,047,000 | | 893 | |
| | | | 19,700 | |
South Korea (7.7%) | | | | | |
Auto Components | | | | | |
Hyundai Mobis | | 2,366 | | 200 | |
Automobiles | | | | | |
Hyundai Motor Co. | | 10,640 | | 904 | |
Hyundai Motor Co. (Preference) | | 14,630 | | 732 | |
| | | | 1,636 | |
Beverages | | | | | |
Hite Brewery Co., Ltd. | | 18,760 | | 1,876 | |
Commercial Banks | | | | | |
Kookmin Bank | | (a)31,090 | | 2,556 | |
Pusan Bank | | 28,850 | | 368 | |
Shinhan Financial Group Co., Ltd. | | 54,020 | | 2,534 | |
| | | | 5,458 | |
Construction & Engineering | | | | | |
Doosan Heavy Industries & Construction Co., Ltd. | | 30,820 | | 1,117 | |
GS Engineering & Construction Corp. | | 28,150 | | 1,822 | |
| | | | 2,939 | |
Electronic Equipment & Instruments | | | | | |
LG.Philips LCD Co., Ltd. | | (a)54,530 | | 2,029 | |
Household Durables | | | | | |
Woongjin Coway Co., Ltd. | | 68,530 | | 1,502 | |
Industrial Conglomerates | | | | | |
Orion Corp. | | 8,154 | | 2,217 | |
Insurance | | | | | |
Samsung Fire & Marine Insurance Co., Ltd. | | 11,620 | | 1,562 | |
Internet Software & Services | | | | | |
NHN Corp. | | (a)7,870 | | $ | 2,737 | |
Machinery | | | | | |
Doosan Infracore Co., Ltd. | | 72,700 | | 1,203 | |
Hyundai Heavy Industries Co., Ltd. | | 23,572 | | 2,646 | |
Hyundai Mipo Dockyard Co., Ltd. | | 12,591 | | 1,261 | |
| | | | 5,110 | |
Media | | | | | |
Cheil Communications, Inc. | | 4,919 | | 983 | |
Metals & Mining | | | | | |
Korea Zinc Co., Ltd. | | 24,090 | | 1,889 | |
Multiline Retail | | | | | |
Lotte Shopping Co., Ltd. | | 6,278 | | 2,442 | |
Oil, Gas & Consumable Fuels | | | | | |
S-Oil Corp. | | 13,459 | | 952 | |
SK Corp. | | 28,650 | | 1,842 | |
| | | | 2,794 | |
Personal Products | | | | | |
Amorepacific Corp. | | (a)2,161 | | 933 | |
Pacific Corp. | | 981 | | 161 | |
| | | | 1,094 | |
Semiconductors & Semiconductor Equipment | | | | | |
Hynix Semiconductor, Inc. | | (a)29,100 | | 943 | |
Hynix Semiconductor, Inc., (Registered) GDR | | (a)2,900 | | 94 | |
Samsung Electronics Co., Ltd. | | 9,270 | | 5,892 | |
Samsung Electronics Co., Ltd. (Preference) | | 6,516 | | 3,180 | |
| | ` | | 10,109 | |
Textiles, Apparel & Luxury Goods | | | | | |
Cheil Industries, Inc. | | 40,780 | | 1,423 | |
Tobacco | | | | | |
KT&G Corp. | | 14,620 | | 854 | |
Wireless Telecommunication Services | | | | | |
SK Telecom Co., Ltd. | | 7,674 | | 1,650 | |
| | | | 50,504 | |
Taiwan (7.5%) | | | | | |
Commercial Banks | | | | | |
Chang Hwa Commercial Bank | | 6,567,000 | | 4,655 | |
Chinatrust Financial Holding Co., Ltd. | | 1,914,000 | | 1,587 | |
Taishin Financial Holdings Co., Ltd. | | 2,597,152 | | 1,592 | |
| | | | 7,834 | |
Computers & Peripherals | | | | | |
Catcher Technology Co., Ltd. | | 193,000 | | 2,045 | |
High Tech Computer Corp. | | 42,000 | | 1,154 | |
The accompanying notes are an integral part of the financial statements.
8
| | Morgan Stanley Asia-Pacific Fund, Inc. |
| | |
Portfolio of Investments (cont’d) | | June 30, 2006 (unaudited) |
| | | | Value | |
| | Shares | | (000) | |
Taiwan (cont’d) | | | | | |
Personal Products (cont’d) | | | | | |
Wistron Corp. | | (a)956,000 | | $ | 1,122 | |
| | | | 4,321 | |
Diversified Financial Services | | | | | |
Fubon Financial Holding Co., Ltd. | | 491,180 | | 425 | |
Electrical Equipment | | | | | |
Silitech Technology Corp. | | 1,000 | | 5 | |
Electronic Equipment & Instruments | | | | | |
Delta Electronics, Inc. | | 2,487,519 | | 7,068 | |
Everlight Electronics Co., Ltd. | | 676,000 | | 1,723 | |
Hon Hai Precision Industry Co., Ltd. | | 974,130 | | 6,018 | |
Tripod Technology Corp. | | 524,000 | | 1,780 | |
Unimicron Technology Corp. | | 1,148,000 | | 1,496 | |
| | | | 18,085 | |
Household Durables | | | | | |
Tsann Kuen Enterprise Co., Ltd. | | 681,836 | | 865 | |
Insurance | | | | | |
Cathay Financial Holding Co., Ltd. | | 1,005,000 | | 2,198 | |
Shin Kong Financial Holding Co., Ltd. | | 3,703,647 | | 4,072 | |
| | | | 6,270 | |
Leisure Equipment & Products | | | | | |
Largan Precision Co., Ltd. | | 272,946 | | 5,842 | |
Semiconductors & Semiconductor Equipment | | | | | |
Epistar Corp. | | 573,000 | | 1,787 | |
MediaTek, Inc. | | 410,000 | | 3,799 | |
Novatek Microelectronics Corp., Ltd. | | 60,000 | | 291 | |
| | | | 5,877 | |
| | | | 49,524 | |
Thailand (1.4%) | | | | | |
Commercial Banks | | | | | |
Bangkok Bank PCL (Foreign) | | 359,000 | | 998 | |
Kasikornbank PCL (Foreign) | | 751,000 | | 1,202 | |
Siam Commercial Bank PCL (Foreign) | | (b)809,400 | | 1,221 | |
| | | | 3,421 | |
Construction & Engineering | | | | | |
Italian-Thai Development PCL (Foreign) | | (b)3,216,600 | | 426 | |
Diversified Telecommunication Services | | | | | |
True Corp. PCL (Foreign) | | (a)(b)1,955,200 | | 431 | |
Food & Staples Retailing | | | | | |
CP Seven Eleven PCL | | (b)1,155,700 | | 218 | |
Household Durables | | | | | |
Asian Property Development PCL (Foreign) | | (b)6,812,500 | | | 493 | |
Land & Houses PCL (Foreign) | | 2,365,900 | | 466 | |
| | | | 959 | |
Oil, Gas & Consumable Fuels | | | | | |
PTT Exploration & Production | | (b)301,000 | | 837 | |
PTT PCL (Foreign) | | (b)227,300 | | 1,348 | |
Thai Oil PCL (Foreign) | | (b)120,600 | | 201 | |
| | | | 2,386 | |
Wireless Telecommunication Services | | | | | |
Advanced Info Service PCL (Foreign) | | 401,700 | | 948 | |
Total Access Communication PCL | | (a)116,600 | | 420 | |
| | | | 1,368 | |
| | | | 9,209 | |
TOTAL COMMON STOCKS | | | | | |
(Cost $503,638) | | | | 636,180 | |
INVESTMENT COMPANIES (1.0%) | | | | | |
India (1.0%) | | | | | |
Morgan Stanley Growth Fund | | | | | |
(Cost $1,593) | | (a)(d)8,615,401 | | 6,400 | |
| | Face | | | |
| | Amount | | | |
| | (000) | | | |
SHORT-TERM INVESTMENT (2.0%) | | | | | |
United States (2.0%) | | | | | |
Repurchase Agreement | | | | | |
J.P. Morgan Securities, Inc., 5.10%, dated 6/30/06, due 7/3/06, repurchase price $13,473
(Cost $13,467) | | $ | (e)13,467 | | 13,467 | |
TOTAL INVESTMENTS (99.8%)
(Cost $518,698) | | | | 656,047 | |
OTHER ASSETS IN EXCESS OF LIABILITIES (0.2%) | | | | 1,191 | |
NET ASSETS (100%) | | | | | 657,238 | |
| | | | | | | |
(a) Non-income producing security.
(b) Security was valued at fair value — At June 30, 2006, the Fund held fair valued securities valued at $6,967,000 representing 1.1% of net assets.
(c) 144A security — certain conditions for public sale may exist. Unless otherwise noted, these securities are deemed to be liquid.
The accompanying notes are an integral part of the financial statements.
9
| | Morgan Stanley Asia-Pacific Fund, Inc. |
| | |
Portfolio of Investments (cont’d) | June 30, 2006 (unaudited) |
(d) | | The Morgan Stanley Growth Fund, acquired at a cost of $1,592,902 is advised by an affiliate of the Adviser. During the six months ended June 30, 2006, there were no purchases or sales of this security. The Fund derived no income from this security during the six months ended June 30, 2006. |
(e) | | Represents the Fund’s undivided interest in a joint repurchase agreement which has a total value of $795,967,000. The repurchase agreement was fully collateralized by U.S. government agency securities at the date of this Portfolio of Investments as follows: Federal Home Loan Mortgage Corp., 2.38% to 6.75%, due 7/15/06 to 3/15/31; Federal National Mortgage Association, 2.38% to 7.13%, due 7/15/06 to 1/15/30; Tennessee Valley Authority, 7.13%, due 5/1/30, which had a total value of $811,894,892. The investment in the repurchase agreement is through participation in a joint account with affiliated parties pursuant to exemptive relief received by the Fund from the SEC. |
(f) | | Security has been deemed illiquid — At June 30, 2006. |
@ | | Face Amount/Value is less than $500. |
GDR | | Global Depositary Receipt |
REIT | | Real Estate Investment Trust |
Foreign Currency Exchange Contract Information:
The Fund had the following foreign currency exchange contract(s) open at period end:
| | | | | | | | | | Net | |
Currency
to
Deliver
(000) | | Value
(000) | | Settlement
Date | | In
Exchange
For
(000) | | Value
(000) | | Unrealized
Appreciation
(Depreciation)
(000) | |
AUD | 32 | | $ | 24 | | 7/3/06 | | USD | 24 | | $ | 23 | | $ | (1 | ) |
AUD | 8 | | 6 | | 7/5/06 | | USD | 6 | | 6 | | @— | |
THB | 8,533 | | 224 | | 7/3/06 | | USD | 222 | | 222 | | (2 | ) |
THB | 6,419 | | 168 | | 7/5/06 | | USD | 168 | | 168 | | @— | |
| | $ | 422 | | | | | | $ | 419 | | $ | (3 | ) |
AUD — Australian Dollar
THB — Thai Baht
USD — United States Dollar
Graphic Presentation of Portfolio Holdings
The following graph depicts the Fund’s holdings by industry and/or security type, as a percentage of total investments.
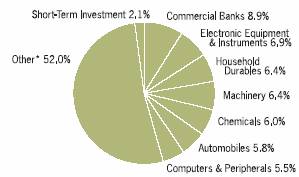
* Industries which do not appear in the above graph, as well as those which represent less than 5% of total investments, if applicable, are included in the category labeled “Other”.
The accompanying notes are an integral part of the financial statements.
10
| | Morgan Stanley Asia-Pacific Fund, Inc. |
| | |
Statement of Assets and Liabilities | Financial Statements |
| | June 30, 2006
(unaudited)
(000) | |
Assets: | | | |
Investments in Securities of Unaffiliated Issuers, at Value (Cost $517,105) | | $ | 649,647 | |
Investment in Security of Affiliated Issuer, at Value (Cost $1,593) | | 6,400 | |
Receivable for Investments Sold | | 2,088 | |
Foreign Currency, at Value (Cost $1,331) | | 1,331 | |
Dividends Receivable | | 1,062 | |
Tax Reclaim Receivable | | 22 | |
Interest Receivable | | 2 | |
Other Assets | | 21 | |
Total Assets | | 660,573 | |
Liabilities: | | | |
Payable For: | | | |
Investments Purchased | | 1,231 | |
Bank Overdraft | | 978 | |
Investment Advisory Fees | | 523 | |
Dividends Declared | | 259 | |
Custodian Fees | | 127 | |
Administration Fees | | 15 | |
Unrealized Depreciation on Foreign Currency Exchange Contracts | | 3 | |
Other Liabilities | | 199 | |
Total Liabilities | | 3,335 | |
Net Assets | | | |
Applicable to 35,538,259 Issued and Outstanding $0.01 Par Value Shares (200,000,000 Shares Authorized) | | $ | 657,238 | |
Net Asset Value Per Share | | $ | 18.49 | |
Net Assets Consist of: | | | |
Common Stock | | $ | 355 | |
Paid-in Capital | | 586,094 | |
Undistributed (Distributions in Excess of) Net Investment Income | | (2,497 | ) |
Accumulated Net Realized Gain (Loss) | | (64,061 | ) |
Unrealized Appreciation (Depreciation) on Investments and Foreign Currency Exchange Contracts and Translations | | 137,347 | |
Net Assets | | $ | 657,238 | |
The accompanying notes are an integral part of the financial statements.
11
| | Morgan Stanley Asia-Pacific Fund, Inc. |
| | |
Statement of Operations | | Financial Statements |
| | Six Months Ended
June 30, 2006
(unaudited)
(000) | |
Investment Income | | | |
Dividends (Net of $440 of Foreign Taxes Withheld) | | $ | 6,103 | |
Interest | | 330 | |
Total Investment Income | | 6,433 | |
Expenses | | | |
Investment Advisory Fees (Note B) | | 3,288 | |
Administration Fees (Note C) | | 264 | |
Custodian Fees (Note D) | | 244 | |
Professional Fees | | 79 | |
Stockholder Servicing Agent Fees | | 26 | |
Stockholder Reporting Expenses | | 26 | |
Directors’ Fees and Expenses | | 5 | |
Other Expenses | | 55 | |
Total Expenses | | 3,987 | |
Waiver of Administration Fees (Note C) | | (172 | ) |
Expense Offset (Note D) | | @— | |
Net Expenses | | 3,815 | |
Net Investment Income (Loss) | | 2,618 | |
Net Realized Gain (Loss) on: | | | |
Investments in Unaffiliated Issuers | | 52,300 | |
Foreign Currency Transactions | | 80 | |
Net Realized Gain (Loss) | | 52,380 | |
Change in Unrealized Appreciation (Depreciation) on: | | | |
Investments | | (13,338 | ) |
Foreign Currency Translations | | (1 | ) |
Change in Unrealized Appreciation (Depreciation) | | (13,339 | ) |
Net Realized Gain (Loss) and Change in Unrealized Appreciation (Depreciation) | | 39,041 | |
Net Increase (Decrease) in Net Assets Resulting from Operations | | $ | 41,659 | |
@ Amount is less than $500.
Statements of Changes in Net Assets
| | Six Months Ended
June 30, 2006
(unaudited)
(000) | | Year Ended
December 31, 2005
(000) | |
Increase (Decrease) in Net Assets | | | | | |
Operations: | | | | | |
Net Investment Income (Loss) | | $ | 2,618 | | $ | 3,941 | |
Net Realized Gain (Loss) | | 52,380 | | 52,210 | |
Change in Unrealized Appreciation (Depreciation) | | (13,339 | ) | 47,880 | |
Net Increase (Decrease) in Net Assets Resulting from Operations | | 41,659 | | 104,031 | |
Distributions from and/or in Excess of: | | | | | |
Net Investment Income | | (259 | ) | (6,550 | ) |
Capital Share Transactions: | | | | | |
Repurchase of 145,406 Shares in 2005 | | — | | (1,770 | ) |
Total Increase (Decrease) | | 41,400 | | 95,711 | |
Net Assets: | | | | | |
Beginning of Period | | 615,838 | | 520,127 | |
End of Period (Including Undistributed (Distributions in Excess of) Net Investment Income of $(2,497) and $(4,856), respectively) | | $ | 657,238 | | $ | 615,838 | |
The accompanying notes are an integral part of the financial statements.
12
| | Morgan Stanley Asia-Pacific Fund, Inc. |
| | |
Selected Per Share Data and Ratios | | Financial Highlights |
| | Six Months Ended | | Year Ended December 31, | |
| | June 30, 2006 | | | |
| | (unaudited) | | 2005 | | 2004 | | 2003 | | 2002 | | 2001 | |
Net Asset Value, Beginning of Period | | $ | 17.33 | | $ | 14.58 | | $ | 12.29 | | $ | 8.57 | | $ | 9.24 | | $ | 10.82 | |
Net Investment Income (Loss) | | 0.07 | † | 0.11 | † | 0.09 | † | 0.05 | † | 0.02 | † | (0.02 | ) |
Net Realized and Unrealized Gain (Loss) on Investments | | 1.10 | | 2.81 | | 2.31 | | 3.75 | | (0.70 | ) | (1.56 | ) |
Total from Investment Operations | | 1.17 | | 2.92 | | 2.40 | | 3.80 | | (0.68 | ) | (1.58 | ) |
Distributions from and/or in Excess of: | | | | | | | | | | | | | |
Net Investment Income | | (0.01 | ) | (0.18 | ) | (0.11 | ) | (0.09 | ) | (0.01 | ) | — | |
Anti-Dilutive Effect of Share Repurchase Program | | — | | 0.01 | | 0.00 | # | 0.01 | | 0.02 | | 0.00 | # |
Net Asset Value, End of Period | | $ | 18.49 | | $ | 17.33 | | $ | 14.58 | | $ | 12.29 | | $ | 8.57 | | $ | 9.24 | |
Per Share Market Value, End of Period | | $ | 15.75 | | $ | 15.53 | | $ | 12.81 | | $ | 10.85 | | $ | 7.20 | | $ | 7.49 | |
TOTAL INVESTMENT RETURN: | | | | | | | | | | | |
Market Value | | 1.47 | %** | 22.58 | % | 19.06 | % | 51.87 | % | (3.77 | )% | (13.78 | )% |
Net Asset Value (1) | | 6.81 | %** | 20.11 | % | 19.63 | % | 44.48 | % | (7.12 | )% | (14.60 | )% |
RATIOS, SUPPLEMENTAL DATA: | | | | | | | | | | | |
Net Assets, End of Period (Thousands) | | $ | 657,238 | | $ | 615,838 | | $ | 520,127 | | $ | 439,774 | | $ | 308,817 | | $ | 397,336 | |
Ratio of Expenses to Average Net Assets(2) | | 1.16 | %* | 1.17 | % | 1.18 | % | 1.26 | % | 1.35 | % | 1.39 | % |
Ratio of Net Investment Income (Loss) to Average Net Assets(2) | | 0.79 | %* | 0.73 | % | 0.66 | % | 0.51 | % | 0.17 | % | 0.19 | % |
Portfolio Turnover Rate | | 23 | %** | 28 | % | 25 | % | 34 | % | 37 | % | 27 | % |
(2) Supplemental Information on the Ratios to Average Net Assets: | | | | | | | |
Ratios Before Expenses Waived by Administrator: | | | | | | | | | |
Ratio of Expenses to Average Net Assets | | 1.21 | % * | 1.22 | % | 1.19 | % | N/A | | N/A | | N/A | |
Ratio of Net Investment Income (Loss) to Average Net Assets | | 0.74 | %* | 0.68 | % | 0.65 | % | N/A | | N/A | | N/A | |
(1) Total investment return based on net asset value per share reflects the effects of changes in net asset value on the performance of the Fund during each period, and assumes dividends and distributions, if any, were reinvested. This percentage is not an indication of the performance of a stockholder’s investment in the Fund based on market value due to differences between the market price of the stock and the net asset value of the Fund.
† Per share amount is based on average shares outstanding.
# Amount is less than $0.005 per share.
* Annualized
** Not Annualized
The accompanying notes are an integral part of the financial statements.
13
| | Morgan Stanley Asia-Pacific Fund, Inc. |
| | |
Notes to Financial Statements | | June 30, 2006 (unaudited) |
The Morgan Stanley Asia-Pacific Fund, Inc. (the “Fund”) was incorporated in Maryland on February 28, 1994, and is registered as a non-diversified, closed-end management investment company under the Investment Company Act of 1940, as amended (the “1940 Act”). The Fund’s investment objective is long-term capital appreciation through investments primarily in equity securities.
A. Accounting Policies: The following significant accounting policies are in conformity with U.S. generally accepted accounting principles. Such policies are consistently followed by the Fund in the preparation of its financial statements. U.S. generally accepted accounting principles may require management to make estimates and assumptions that affect the reported amounts and disclosures in the financial statements. Actual results may differ from those estimates.
1. Security Valuation: Securities listed on a foreign exchange are valued at their closing price. Unlisted securities and listed securities not traded on the valuation date for which market quotations are readily available are valued at the mean between the current bid and asked prices obtained from reputable brokers. Equity securities listed on a U.S. exchange are valued at the latest quoted sales price on the valuation date. Equity securities listed or traded on NASDAQ, for which market quotations are available, are valued at the NASDAQ Official Closing Price. Debt securities purchased with remaining maturities of 60 days or less are valued at amortized cost, if it approximates value.
All other securities and investments for which market values are not readily available, including restricted securities, and those securities for which it is inappropriate to determine prices in accordance with the aforementioned procedures, are valued at fair value as determined in good faith under procedures adopted by the Board of Directors (the “Directors”), although the actual calculations may be done by others. Factors considered in making this determination may include, but are not limited to, information obtained by contacting the issuer, analysts, or the appropriate stock exchange (for exchange-traded securities), analysis of the issuer’s financial statements or other available documents and, if necessary, available information concerning other securities in similar circumstances.
Most foreign markets close before the New York Stock Exchange (NYSE). Occasionally, developments that could affect the closing prices of securities and other assets may occur between the times at which valuations of such securities are determined (that is, close of the foreign market on which the securities trade) and the close of business on the NYSE. If these developments are expected to materially affect the value of the securities, the valuations may be adjusted to reflect the estimated fair value as of the close of the NYSE, as determined in good faith under procedures established by the Directors.
2. Repurchase Agreements: The Fund may enter into repurchase agreements under which the Fund lends excess cash and takes possession of securities with an agreement that the counterparty will repurchase such securities. In connection with transactions in repurchase agreements, a bank as custodian for the Fund takes possession of the underlying securities (collateral), with a market value at least equal to the amount of the repurchase transaction, including principal and accrued interest. To the extent that any repurchase transaction exceeds one business day, the value of the collateral is marked-to-market on a daily basis to determine the adequacy of the collateral. In the event of default on the obligation to repurchase, the Fund has the right to liquidate the collateral and apply the proceeds in satisfaction of the obligation. In the event of default or bankruptcy by the counterparty to the agreement, realization and/or retention of the collateral or proceeds may be subject to legal proceedings.
The Fund, along with other affiliated investment companies, may utilize a joint trading account for the purpose of entering into one or more repurchase agreements.
3. Foreign Currency Translation: The books and records of the Fund are maintained in U.S. dollars. Foreign currency amounts are translated into U.S. dollars at the mean of the bid and asked prices of such currencies against U.S. dollars last quoted by a major bank as follows:
• investments, other assets and liabilities at the prevailing rates of exchange on the valuation date;
• investment transactions and investment income at the prevailing rates of exchange on the dates of such transactions.
Although the net assets of the Fund are presented at the foreign exchange rates and market values at the close of the period, the Fund does not isolate that portion of the results of operations arising as a result of changes in the foreign exchange rates from the fluctuations arising from changes in the market prices of the securities held at period
14
| | Morgan Stanley Asia-Pacific Fund, Inc. |
| | |
Notes to Financial Statements (cont’d) | | June 30, 2006 (unaudited) |
end. Similarly, the Fund does not isolate the effect of changes in foreign exchange rates from the fluctuations arising from changes in the market prices of securities sold during the period. Accordingly, realized and unrealized foreign currency gains (losses) due to securities transactions are included in the reported net realized and unrealized gains (losses) on investment transactions and balances.
Net realized gains (losses) on foreign currency transactions represent net foreign exchange gains (losses) from sales and maturities of foreign currency exchange contracts, disposition of foreign currencies, currency gains or losses realized between the trade and settlement dates on securities transactions, and the difference between the amount of investment income and foreign withholding taxes recorded on the Fund’s books and the U.S. dollar equivalent amounts actually received or paid. Net unrealized currency gains (losses) from valuing foreign currency denominated assets and liabilities at period end exchange rates are reflected as a component of unrealized appreciation (depreciation) on investments and foreign currency translations in the Statement of Assets and Liabilities. The change in net unrealized currency gains (losses) on foreign currency translations for the period is reflected in the Statement of Operations.
A significant portion of the Fund’s net assets consist of securities of issuers located in Asia which are denominated in foreign currencies. Changes in currency exchange rates will affect the value of and investment income from such securities. In general, Asian securities are subject to greater price volatility, limited capitalization and liquidity, and higher rates of inflation than securities of companies based in the United States. In addition, Asian securities may be subject to substantial governmental involvement in the economy and greater social, economic and political uncertainty. Such securities may be concentrated in a limited number of countries and regions and may vary throughout the year.
Prior governmental approval for foreign investments may be required under certain circumstances in some countries, and the extent of foreign investments in domestic companies may be subject to limitation in other countries. Foreign ownership limitations also may be imposed by the charters of individual companies to prevent, among other concerns, violations of foreign investment limitations. As a result, an additional class of shares (identified as “Foreign” in the Portfolio of Investments) may be created and offered for investment. The “local” and “foreign shares” market values may differ. In the absence of trading of the foreign shares in such markets, the Fund values the foreign shares at the closing exchange price of the local shares. Such securities, if any, are identified as fair valued in the Portfolio of Investments.
4. Derivatives: The Fund may use derivatives to achieve its investment objectives. The Fund may engage in transactions in futures contracts on foreign currencies, stock indices, as well as in options, swaps and structured notes. Consistent with the Fund’s investment objectives and policies, the Fund may use derivatives for non-hedging as well as hedging purposes.
Following is a description of derivative instruments that the Fund has utilized and their associated risks:
Foreign Currency Exchange Contracts: The Fund may enter into foreign currency exchange contracts to attempt to protect securities and related receivables and payables against changes in future foreign exchange rates and, in certain situations, to gain exposure to a foreign currency. A foreign currency exchange contract is an agreement between two parties to buy or sell currency at a set price on a future date. The market value of the contract will fluctuate with changes in currency exchange rates. The contract is marked-to-market daily and the change in market value is recorded by the Fund as unrealized gain or loss. The Fund records realized gains or losses when the contract is closed equal to the difference between the value of the contract at the time it was opened and the value at the time it was closed. Risk may arise upon entering into these contracts from the potential inability of counterparties to meet the terms of their contracts and is generally limited to the amount of unrealized gain on the contracts, if any, at the date of default. Risks may also arise from unanticipated movements in the value of a foreign currency relative to the U.S. dollar.
Structured Securities: The Fund may invest in interests in entities organized and operated solely for the purpose of restructuring the investment characteristics of sovereign debt obligations. This type of restructuring involves the deposit with or purchase by an entity of specified instruments and the issuance by that entity of one or more classes of securities (“Structured Securities”) backed by, or representing interests in, the underlying instruments.
15
| | Morgan Stanley Asia-Pacific Fund, Inc. |
| | |
Notes to Financial Statements (cont’d) | | June 30, 2006 (unaudited) |
Structured Securities generally will expose the Fund to credit risks of the underlying instruments as well as of the issuer of the Structured Security. Structured Securities are typically sold in private placement transactions with no active trading market. Investments in Structured Securities may be more volatile than their underlying instruments; however, any loss is limited to the amount of the original investment.
Over-the-Counter Trading: Securities and other derivative instruments that may be purchased or sold by the Fund may consist of instruments not traded on an exchange. The risk of nonperformance by the obligor on such an instrument may be greater, and the ease with which the Fund can dispose of or enter into closing transactions with respect to such an instrument may be less, than in the case of an exchange-traded instrument. In addition, significant spreads may exist between bid and ask prices for derivative instruments that are not traded on an exchange. Derivative instruments not traded on exchanges are also not subject to the same type of government regulation as exchange traded instruments, and many of the protections afforded to participants in a regulated environment may not be available in connection with such transactions.
5. Other: Security transactions are accounted for on the date the securities are purchased or sold. Investments in new Indian securities are made by making applications in the public offerings. The issue price, or a portion thereof, is paid at the time of application and is reflected as share application money on the Statement of Assets and Liabilities, if any. Upon allotment of the securities, this amount plus any remaining amount of issue price is recorded as cost of investments. Realized gains and losses on the sale of investment securities are determined on the specific identified cost basis. Interest income is recognized on the accrual basis. Dividend income and distributions are recorded on the ex-dividend date (except certain dividends which may be recorded as soon as the Fund is informed of such dividends) net of applicable withholding taxes.
B. Investment Advisory Fees: Morgan Stanley Investment Management Inc. (the “Adviser” or “MS Investment Management”) provides investment advisory services to the Fund under the terms of an Investment Advisory and Management Agreement (the “Agreement”). Under the Agreement, the Adviser is paid a fee computed weekly and payable monthly at an annual rate of 1.00% of the Fund’s average weekly net assets.
C. Administration Fees: MS Investment Management also serves as Administrator to the Fund pursuant to an Administration Agreement. Under the Administration Agreement, the administration fee is 0.08% of the Fund’s average weekly net assets. MS Investment Management has agreed to limit the administration fee so that it will be no greater than the previous administration fee of 0.02435% of the Fund’s average weekly net assets plus $24,000 per annum. This waiver is voluntary and may be terminated at any time. For the six months ended June 30, 2006, $172,000 of administration fees were waived pursuant to this arrangement. Under a sub-administration agreement between the Administrator and J.P. Morgan Investor Services Co. (“JPMIS”), a corporate affiliate of JPMorgan Chase Bank, N.A., JPMIS provides certain administrative services to the Fund. For such services, the Administrator pays JPMIS a portion of the fee the Administrator receives from the Fund. An employee of JPMIS is an officer of the Fund. Administration costs (including out-of-pocket expenses) incurred in the ordinary course of providing services under the agreement, except pricing services and extraordinary expenses, will be covered under the administration fee.
D. Custodian Fees: JPMorgan Chase Bank, N.A., (the “Custodian”) and its affiliates serve as Custodian for the Fund. The Custodian holds cash, securities, and other assets of the Fund as required by the 1940 Act. Custody fees are payable monthly based on assets held in custody, investment purchases and sales activity and account maintenance fees, plus reimbursement for certain out-of-pocket expenses.
The Fund has entered into an arrangement with its Custodian whereby credits realized on uninvested cash balances were used to offset a portion of the Fund’s expenses. These custodian credits are shown as “Expense Offset” on the Statement of Operations.
E. Federal Income Taxes: It is the Fund’s intention to continue to qualify as a regulated investment company and distribute all of its taxable income. Accordingly, no provision for Federal income taxes is required in the financial statements.
The Fund may be subject to taxes imposed by countries in which it invests. Such taxes are generally based on income and/or capital gains earned or repatriated. Taxes are accrued and applied to net investment income, net realized gains and net unrealized appreciation as such income and/or gains are earned.
The tax character of distributions paid may differ from the character of distributions shown on the Statements of Changes in Net Assets due to short-term capital gains being treated as
16
| | Morgan Stanley Asia-Pacific Fund, Inc. |
| | |
Notes to Financial Statements (cont’d) | | June 30, 2006 (unaudited) |
ordinary income for tax purposes. The tax character of distributions paid during 2005 and 2004 was as follows:
2005 Distributions | | 2004 Distributions | |
Paid From: | | Paid From: | |
(000) | | (000) | |
| | Long-term | | | | Long-term | |
Ordinary | | Capital | | Ordinary | | Capital | |
Income | | Gain | | Income | | Gain | |
$ | 6,550 | | $ | — | | $ | 3,779 | | $ | — | |
| | | | | | | | | | | |
The amount and character of income and capital gain distributions to be paid by the Fund are determined in accordance with Federal income tax regulations, which may differ from U.S. generally accepted accounting principles. These book/tax differences are considered either temporary or permanent in nature.
Temporary differences are attributable to differing book and tax treatments for the timing of the recognition of gains and losses on certain investment transactions and the timing of the deductibility of certain expenses.
Permanent differences, primarily due to differing treatments of gains and losses related to foreign currency transactions and gains on certain equity securities designated as issued by passive foreign investment companies, resulted in the following reclassifications among the components of net assets at December 31, 2005:
Increase (Decrease) | |
Accumulated | | | | | |
Undistributed | | | | | |
(Distributions in | | | | | |
Excess of) Net | | Accumulated | | | |
Investment | | Net Realized | | Paid-in | |
Income (Loss) | | Gain (Loss) | | Capital | |
(000) | | (000) | | (000) | |
$ | 159 | | $ | (159 | ) | $ | — | |
| | | | | | | | |
At December 31, 2005, the components of distributable earnings on a tax basis were as follows:
Undistributed | | Undistributed | |
Ordinary Income | | Long-term Capital Gain | |
(000) | | (000) | |
$ 256 | | $ — | |
At June 30, 2006, the U.S. Federal income tax cost basis of investments was approximately $518,698,000 and, accordingly, net unrealized appreciation for U.S. Federal income tax purposes was $137,349,000 of which $166,161,000 related to appreciated securities and $28,812,000 related to depreciated securities.
At December 31, 2005, the Fund had a capital loss carryforward for U.S. Federal income tax purposes of approximately $116,169,000 available to offset future capital gains, of which $39,007,000 will expire on December 31, 2006, $73,332,000 will expire on December 31, 2009 and $3,830,000 will expire on December 31, 2010. During the year ended December 31, 2005, the Fund utilized capital loss carryforward for U.S. Federal income tax purposes of approximately $52,056,000.
To the extent that capital loss carryovers are used to offset any future capital gains realized during the carryover period as provided by U.S. Federal income tax regulations, no capital gains tax liability will be incurred by the Fund for gains realized and not distributed. To the extent that capital gains are offset, such gains will not be distributed to the stockholders.
Net capital, currency and passive foreign investment company losses incurred after October 31, and within the taxable year are deemed to arise on the first day of the Fund’s next taxable year. For the year ended December 31, 2005, the Fund deferred to January 3, 2006, for U.S. Federal income tax purposes, post-October currency losses of $87,000.
F. Contractual Obligations: The Fund enters into contracts that contain a variety of indemnifications. The Fund’s maximum exposure under these arrangements is unknown. However, the Fund has not had prior claims or losses pursuant to these contracts and expects the risk of loss to be remote.
G. Other: During the six months ended June 30, 2006, the Fund made purchases and sales totaling approximately $149,705,000 and $155,955,000 respectively, of investment securities other than long-term U.S. Government securities and short-term investments. There were no purchases or sales of long-term U.S. Government securities.
During the six months ended June 30, 2006, the Fund incurred $2,467 of brokerage commissions to Morgan Stanley & Co. Incorporated, an affiliated broker/dealer.
Additionally, during the six months ended June 30, 2006, the Fund paid $1,127 brokerage commissions to China International Capital Corporation (Hong Kong) Limited (CICC), an affiliated broker/dealer.
17
| | Morgan Stanley Asia-Pacific Fund, Inc. |
| | |
Notes to Financial Statements (cont’d) | | June 30, 2006 (unaudited) |
On January 23, 1998, the Fund commenced a share repurchase program for purposes of enhancing stockholder value and reducing the discount at which the Fund’s shares trade from their net asset value. For the six months ended June 30, 2006, the Fund did not repurchase any of its shares. Since the inception of the program, the Fund has repurchased 15,397,432 of its shares at an average discount of 20.37% from net asset value per share. The Fund expects to continue to repurchase its outstanding shares at such time and in such amounts as it believes will further the accomplishment of the foregoing objectives, subject to review by the Directors.
On June 20, 2006 the Officers of the Fund, pursuant to authority granted by the Directors declared a distribution of $0.0073 per share, derived from net investment income, payable on July 14, 2006, to stockholders of record on June 30, 2006.
Reporting to Stockholders
The Fund provides a complete schedule of portfolio holdings in its semi-annual and annual reports within 60 days of the end of the Fund’s second and fourth fiscal quarters. The semi-annual reports and the annual reports are filed electronically with the Securities and Exchange Commission (SEC) on Form N-CSRS and Form N-CSR, respectively. Morgan Stanley also delivers the semi-annual and annual reports to Fund stockholders and makes these reports available on its public website, www.morganstanley.com. Each Morgan Stanley fund also files a complete schedule of portfolio holdings with the SEC for the Fund’s first and third fiscal quarters on Form N-Q. Morgan Stanley does not deliver the reports for the first and third fiscal quarters to stockholders, nor are the reports posted to the Morgan Stanley public website. You may, however, obtain the Form N-Q filings (as well as the Form N-CSR and N-CSRS filings) by accessing the SEC’s website, http:/www.sec.gov. You may also review and copy them at the SEC’s public reference room in Washington, DC. Information on the operation of the SEC’s Public Reference Room may be obtained by calling the SEC at 1(800) SEC-0330. You can also request copies of these materials, upon payment of a duplicating fee, by electronic request at the SEC’s
e-mail address (publicinfo@sec.gov) or by writing the public reference section of the SEC, Washington, DC 20549-0102.
Proxy Voting Policy and Procedures and Proxy Voting Record
A copy of (1) the Fund’s policies and procedures with respect to the voting of proxies relating to the Fund’s portfolio securities; and (2) how the Fund voted proxies relating to portfolio securities during the most recent twelve-month period ended June 30, is available without charge, upon request, by calling 1 (800) 548-7786 or by visiting our website at www.morganstanley.com/im. This information is also available on the Securities and Exchange Commission’s website at www.sec.gov.
18
| | Morgan Stanley Asia-Pacific Fund, Inc. |
| | |
Dividend Reinvestment and Cash Purchase Plan | | |
Pursuant to the Dividend Reinvestment and Cash Purchase Plan (the “Plan”), each stockholder will be deemed to have elected, unless American Stock Transfer & Trust Company (the “Plan Agent”) is otherwise instructed by the stockholder in writing, to have all distributions automatically reinvested in Fund shares. Participants in the Plan have the option of making additional voluntary cash payments to the Plan Agent, annually, in any amount from $100 to $3,000, for investment in Fund shares.
Dividend and capital gain distributions will be reinvested on the reinvestment date in full and fractional shares. If the market price per share equals or exceeds net asset value per share on the reinvestment date, the Fund will issue shares to participants at net asset value or, if net asset value is less than 95% of the market price on the reinvestment date, shares will be issued at 95% of the market price. If net asset value exceeds the market price on the reinvestment date, participants will receive shares valued at market price. The Fund may purchase shares of its Common Stock in the open market in connection with dividend reinvestment requirements at the discretion of the Board of Directors. Should the Fund declare a dividend or capital gain distribution payable only in cash, the Plan Agent will purchase Fund shares for participants in the open market as agent for the participants.
The Plan Agent’s fees for the reinvestment of dividends and distributions will be paid by the Fund. However, each participant’s account will be charged a pro rata share of brokerage commissions incurred on any open market purchases effected on such participant’s behalf. A participant will also pay brokerage commissions incurred on purchases made by voluntary cash payments. Although stockholders in the Plan may receive no cash distributions, participation in the Plan will not relieve participants of any income tax which may be payable on such dividends or distributions.
In the case of stockholders, such as banks, brokers or nominees, that hold shares for others who are the beneficial owners, the Plan Agent will administer the Plan on the basis of the number of shares certified from time to time by the stockholder as representing the total amount registered in the stockholder’s name and held for the account of beneficial owners who are participating in the Plan.
Stockholders who do not wish to have distributions automatically reinvested should notify the Plan Agent in writing. There is no penalty for non-participation or withdrawal from the Plan, and stockholders who have previously withdrawn from the Plan may rejoin at any time. Requests for additional information or any correspondence concerning the Plan should be directed to the Plan Agent at:
Morgan Stanley Asia-Pacific Fund, Inc.
American Stock Transfer & Trust Company
Dividend Reinvestment and Cash Purchase Plan
59 Maiden Lane
New York, New York 10038
1 (800) 278-4353
19
Morgan Stanley Asia-Pacific Fund, Inc.
Directors | |
| |
Michael Nugent | |
| |
Michael Bozic | |
| |
Charles A. Fiumefreddo | |
| |
Edwin J. Garn | |
| |
Wayne E. Hedien | |
| |
James F. Higgins | |
| |
Dr. Manuel H. Johnson | |
| |
Joseph J. Kearns | |
| |
Fergus Reid | |
| |
Officers | |
| |
Michael Nugent | |
Chairman of the Board | |
| |
Ronald E. Robison | |
President and Principal Executive Officer | |
| |
J. David Germany | |
Vice President | |
Dennis F. Shea |
Vice President |
|
Barry Fink |
Vice President |
|
Amy R. Doberman |
Vice President |
|
Stefanie V. Chang Yu |
Vice President |
|
James W. Garrett |
Treasurer and Chief Financial Officer |
|
Carsten Otto |
Chief Compliance Officer |
|
Michael J. Leary |
Assistant Treasurer |
|
Mary E. Mullin |
Secretary |
|
Investment Adviser and Administrator
Morgan Stanley Investment Management Inc.
1221 Avenue of the Americas
New York, New York 10020
Custodian
JPMorgan Chase Bank, N.A.
270 Park Avenue
New York, New York 10017
Stockholder Servicing Agent
American Stock Transfer & Trust Company
59 Maiden Lane
New York, New York 10038
1(800) 278-4353
Legal Counsel
Clifford Chance US LLP
31 West 52nd Street
New York, New York 10019
Independent Registered Public Accounting Firm
Ernst & Young LLP
200 Clarendon Street
Boston, Massachusetts 02116
For additional Fund information, including the Fund’s net asset value per share and information regarding the investments comprising the Fund’s portfolio, please call 1(800) 221-6726 or visit our website at www.morganstanley.com/im.
© 2006 Morgan Stanley
IS06-00688I-Y06/06
Item 2. Code of Ethics.
Not applicable for semiannual reports.
Item 3. Audit Committee Financial Expert.
Not applicable for semiannual reports.
Item 4. Principal Accountant Fees and Services
Not applicable for semiannual reports.
Item 5. Audit Committee of Listed Registrants.
Not applicable for semiannual reports.
Item 6. Schedule of Investments
Refer to Item 1.
Item 7. Disclosure of Proxy Voting Policies and Procedures for Closed-End Management Investment Companies.
Not applicable for semiannual reports.
Item 8. Portfolio Managers of Closed-End Management Investment Companies
Applicable to annual reports filed by closed-end funds.
Item 9. Closed-End Fund Repurchases
Not applicable.
Item 10. Submission of Matters to a Vote of Security Holders
Not applicable.
Item 11. Controls and Procedures
(a) The Fund’s principal executive officer and principal financial officer have concluded that the Fund’s disclosure controls and procedures are sufficient to ensure that information required to be disclosed by the Fund in this Form N-CSR was recorded, processed, summarized and reported within the time periods specified in the Securities and Exchange Commission’s rules and forms, based upon such officers’ evaluation of these controls and procedures as of a date within 90 days of the filing date of the report.
1
(b) There were no changes in the registrant’s internal control over financial reporting that occurred during the second fiscal quarter of the period that has materially affected, or is reasonably likely to materially affect, the registrant’s internal control over financial reporting.
Item 12. Exhibits
(a) Code of Ethics - Not applicable for semiannual reports.
(b) A separate certification for each principal executive officer and principal financial officer of the registrant are attached hereto as part of EX-99.CERT.
2
SIGNATURES
Pursuant to the requirements of the Securities Exchange Act of 1934 and the Investment Company Act of 1940, the registrant has duly caused this report to be signed on its behalf by the undersigned, thereunto duly authorized.
(Registrant) | Morgan Stanley Asia-Pacific Fund, Inc. | |
|
|
By: | /s/ Ronald E. Robison | |
Name: | Ronald E. Robison |
Title: | Principal Executive Officer |
Date: | August 10, 2006 |
| | | | | |
Pursuant to the requirements of the Securities Exchange Act of 1934 and the Investment Company Act of 1940, this report has been signed by the following persons on behalf of the registrant and in the capacities and on the dates indicated.
By: | /s/ Ronald E. Robison | |
Name: | Ronald E. Robison |
Title: | Principal Executive Officer |
Date: | August 10, 2006 |
| |
| |
By: | /s/ James W. Garrett | |
Name: | James W. Garrett |
Title: | Principal Financial Officer |
Date: | August 10, 2006 |
| | | |