UNITED STATES
SECURITIES AND EXCHANGE COMMISSION
Washington, D.C. 20549
FORM N-CSR
CERTIFIED SHAREHOLDER REPORT OF REGISTERED
MANAGEMENT INVESTMENT COMPANIES
Investment Company Act file number | 811-08388 |
|
Morgan Stanley Asia-Pacific Fund, Inc. |
(Exact name of registrant as specified in charter) |
|
522 Fifth Avenue New York, NY | | 10036 |
(Address of principal executive offices) | | (Zip code) |
|
Ronald E. Robison
522 Fifth Avenue New York, New York 10036 |
(Name and address of agent for service) |
|
Registrant’s telephone number, including area code: | 1-800-231-2608 | |
|
Date of fiscal year end: | 12/31 | |
|
Date of reporting period: | 6/30/08 | |
| | | | | | | | |
Form N-CSR is to be used by management investment companies to file reports with the Commission not later than 10 days after the transmission to stockholders of any report that is required to be transmitted to stockholders under Rule 30e-1 under the Investment Company Act of 1940 (17 CFR 270.30e-1). The Commission may use the information provided on Form N-CSR in its regulatory, disclosure review, inspection, and policymaking roles.
A registrant is required to disclose the information specified by Form N-CSR, and the Commission will make this information public. A registrant is not required to respond to the collection of information contained in Form N-CSR unless the Form displays a currently valid Office of Management and Budget (“OMB”) control number. Please direct comments concerning the accuracy of the information collection burden estimate and any suggestions for reducing the burden to Secretary, Securities and Exchange Commission, 450 Fifth Street, NW, Washington, DC 20549-0609. The OMB has reviewed this collection of information under the clearance requirements of 44 U.S.C. Section 3507.
ITEM 1. REPORTS TO STOCKHOLDERS.
The Fund’s semi-annual report transmitted to shareholders pursuant to Rule 30e-1 under the Investment Company Act of 1940 is as follows:
| 2008 Semi-Annual Report |
| |
| June 30, 2008 |

Morgan Stanley
Asia-Pacific Fund, Inc. (APF)
Morgan Stanley
Investment Management Inc.
Investment Adviser
| Morgan Stanley Asia-Pacific Fund, Inc. |
| |
| Overview (unaudited) |
Letter to Stockholders
Performance
For the six months ended June 30, 2008, the Morgan Stanley Asia-Pacific Fund, Inc. (the “Fund”) had total returns, based on net asset value and market value per share (including reinvestment of distributions), of -10.40%, net of fees and -9.99%, respectively, compared to its benchmark which returned -11.74%. The benchmark for the Fund is comprised of two Morgan Stanley Capital International (MSCI) indices; Japan Net and All-Country Asia Pacific Free ex-Japan Net (together, the “Index”), with each index weighted equally. On June 30, 2008, the closing price of the Fund’s shares on the New York Stock Exchange was $17.47, representing a 15.0% discount to the Fund’s net asset value per share. Past performance is no guarantee of future results.
Factors Affecting Performance
• All regional Asian markets posted negative returns in the first six months of the year. Concerns over earnings growth, rising inflation and rising energy prices with falling subsidies in countries that are net oil importers took its toll on market returns. Most markets posted double-digit negative returns, with the exception of Australia, Japan, Singapore, Taiwan and Thailand. The MSCI Asia Pacific Index declined by 11.7% during the period, performing in-line with those of developed and emerging markets, which respectively fell by 11.0% and 11.8% (as represented by the MSCI EAFE (Europe Australasia Far East) Index and MSCI Emerging Markets Index).
• Until the middle of March, the Japanese equity market – along with other developed markets – experienced difficulties, with the credit crisis punctuating stock prices with exceptional volatility and rapidly waning risk appetites among investors globally. In this environment, Japanese equities remained out-of-favor with asset allocators, as well as with domestic institutional and individual investors. In fact, foreign net outflows rose to ¥1.3 trillion in March, the highest level since the stock market crash in 1987. Throughout most of the period, housing starts contracted sharply because of tougher inspection and approval standards for earthquake proofing. The political situation virtually came to a halt with Prime Minister Fukuda’s inability to appoint a new head for the Bank of Japan.
• Starting in the middle of March, however, global equity markets turned upward on the easing of some credit concerns in the U.S. and the emergency bail-out of Bear Stearns. Since then, Japanese equities rose substantially, attracting flows from foreign investors as well as domestic retail clients. Reasons for the re-allocation to Japan included historically attractive relative and absolute valuations, dividend yields significantly higher than 10-year Japanese Government bond yields and banks’ balance sheets viewed more positively than their global counterparts, leading to a consensus that Japan was a relatively “safe haven” compared to other major markets. Another reason might have been that in March over 60% of stocks traded below book value and over 40% of all listed companies remained debt free. Corporations with such cash positions were aggressive in stock buy-backs and provided a vote of confidence to the market. Some momentum on corporate governance emerged when an activist investor succeeded in prompting management changes in a large, publicly-listed Japanese manufacturer. Japan’s rebound for this period reflected its position as the best performing G7 (Group of Seven industrialized nations) country for gross domestic product (GDP) growth and relatively low exposure to U.S. credit market problems, with only 5% of the estimated $390 billion of losses reported by Japanese investors. However, during the last three weeks of the second quarter, stocks declined sharply on fears of global inflation, renewed credit concerns and most importantly a rapidly slowing global economy.
• The re-emergence of inflation in the global emerging markets is the single most important concern in the markets. Earlier in the year, Asian markets, particularly Hong Kong and China, declined as Chinese authorities announced measures to contain inflation, including price controls and strict limits on loan growth. Poor sentiment was further exacerbated by the worsening credit situation in the U.S. and Europe, where banks announced substantial write-offs.
• We believe Asia ex-Japan is in the mature phase of a growth cycle, in which growth will likely become harder to identify, but quality growth will likely continue to perform well. We expect inflation concerns to recede from current levels, but the consumer price index (CPI) will likely not revert to levels seen in 2007. In the short-term, inflation concerns are leading to monetary tightening policies and slower economic growth. In effect, Asian markets, like the broader emerging markets, are experiencing a cyclical bear market within an overall secular bull market, similar in pattern to what the U.S. experienced in 1990 during its long bull run from 1987 to 1994. Longer-term, we believe the secular growth case for emerging markets remains intact.
2
| Morgan Stanley Asia-Pacific Fund, Inc. |
| |
| Overview (unaudited) |
Letter to Stockholders (cont’d)
Management Strategies
• Stock selection in Japan contributed to performance. In Japan, security selection within the technology hardware and equipment, food beverage and tobacco, pharmaceuticals biotechnology and capital goods sectors was positive. The Fund’s overweight to the capital goods sector also boosted returns.
• In Asia ex-Japan, the Fund’s overweight in Australian resource stocks and underweight in Australian banks were positive contributors to performance.
• The Fund’s cash position also contributed to performance as the MSCI Asia Pacific Index fell 11.7% in the first six months of 2008.
• On the other hand, from a top-down perspective, the Fund’s underweight in Japan and Taiwan, as well as the overweight in China detracted from performance.
• Stock selection within Taiwan, Hong Kong and Korea hindered returns. In particular, the Fund’s underweight in Taiwan semiconductors, overweight in Hong Kong real estate and specialty retail, and underweight in Korean semiconductors were detrimental to performance.
• As of June 30, 2008, the Fund was overweight China and Indonesia and underweight Australia, Japan, Taiwan and Hong Kong.
Sincerely,

Ronald E. Robison
President and Principal Executive Officer | | July 2008 |
3
| Morgan Stanley Asia-Pacific Fund, Inc. |
| |
| June 30, 2008 (unaudited) |
Investment Advisory Agreement Approval |
Nature, Extent and Quality of Services
The Board reviewed and considered the nature and extent of the investment advisory services provided by the Investment Adviser under the Advisory Agreement, including portfolio management, investment research and equity and fixed income securities trading. The Board reviewed similar information and factors regarding the Sub-Adviser, to the extent applicable. The Board also reviewed and considered the nature and extent of the non-advisory, administrative services provided by the Fund’s Administrator under the Administration Agreement, including accounting, clerical, bookkeeping, compliance, business management and planning, and the provision of supplies, office space and utilities at the Investment Adviser’s expense. (The Investment Adviser, Sub-Adviser and Administrator together are referred to as the “Adviser” and the Advisory, Sub-Advisory and Administration Agreements together are referred to as the “Management Agreement.”) The Board also compared the nature of the services provided by the Adviser with similar services provided by non-affiliated advisers as reported to the Board by Lipper Inc. (“Lipper”).
The Board reviewed and considered the qualifications of the portfolio managers, the senior administrative managers and other key personnel of the Adviser who provide the advisory and administrative services to the Fund. The Board determined that the Adviser’s portfolio managers and key personnel are well qualified by education and/or training and experience to perform the services in an efficient and professional manner. The Board concluded that the nature and extent of the advisory and administrative services provided were necessary and appropriate for the conduct of the business and investment activities of the Fund. The Board also concluded that the overall quality of the advisory and administrative services was satisfactory.
Performance Relative to Comparable Funds Managed by Other Advisers
On a regular basis, the Board reviews the performance of all funds in the Morgan Stanley Fund Complex, including the Fund, compared to their peers, paying specific attention to the underperforming funds. In addition, the Board specifically reviewed the Fund’s performance for the one-, three- and five-year periods ended December 31, 2007, as shown in a report provided by Lipper (the “Lipper Report”), compared to the performance of comparable funds selected by Lipper (the “performance peer group”). The Board also discussed with the Adviser the performance goals and the actual results achieved in managing the Fund. The Board concluded that the Fund’s performance was competitive with that of its performance peer group.
Fees Relative to Other Proprietary Funds Managed by the Adviser with Comparable Investment Strategies
The Board noted that the Adviser did not manage any other proprietary funds with investment strategies comparable to those of the Fund.
Fees and Expenses Relative to Comparable Funds Managed by Other Advisers
The Board reviewed the advisory and administrative fee (together, the “management fee”) rate and total expense ratio of the Fund as compared to the average management fee rate and average total expense ratio for funds, selected by Lipper (the “expense peer group”), managed by other advisers with investment strategies comparable to those of the Fund, as shown in the Lipper Report. The Board concluded that the Fund’s management fee rate and total expense ratio were competitive with those of its expense peer group.
Breakpoints and Economies of Scale
The Board reviewed the structure of the Fund’s management fee schedule under the Management Agreement and noted that it does not include any breakpoints. The Board considered that the Fund is a closed-end fund and, therefore, that the Fund’s assets are not likely to grow with new sales or grow significantly as a result of capital appreciation. The Board concluded that economies of scale for the Fund were not a factor that needed to be considered at the present time.
Profitability of the Adviser and Affiliates
The Board considered information concerning the costs incurred and profits realized by the Adviser and affiliates during the last year from their relationship with the Fund and during the last two years from their relationship with the Morgan Stanley Fund Complex and reviewed with the Adviser the cost allocation methodology used to determine the profitability of the Adviser and affiliates. Based on its review of the information it received, the Board concluded that the profits earned by the Adviser and affiliates were not excessive in light of the advisory, administrative and other services provided to the Fund.
4
| Morgan Stanley Asia-Pacific Fund, Inc. |
| |
| June 30, 2008 (unaudited) |
Investment Advisory Agreement Approval (cont’d) |
Fall-Out Benefits
The Board considered so-called “fall-out benefits” derived by the Adviser and affiliates from their relationship with the Fund and the Morgan Stanley Fund Complex, such as commissions on the purchase and sale of Fund shares and “float” benefits derived from handling of checks for purchases and sales of Fund shares, through a broker-dealer affiliate of the Adviser and “soft dollar” benefits (discussed in the next section). The Board also considered that, from time to time, the Adviser may, directly or indirectly, effect trades on behalf of certain Morgan Stanley Funds through various electronic communications networks or other alternative trading systems in which the Adviser’s affiliates have ownership interests and/or board seats. The Board concluded that the sales commissions were competitive with those of other broker-dealers and the fall-out benefits were relatively small.
Soft Dollar Benefits
The Board considered whether the Adviser realizes any benefits as a result of brokerage transactions executed through “soft dollar” arrangements. Under such arrangements, brokerage commissions paid by the Fund and/or other funds managed by the Adviser would be used to pay for research that a securities broker obtains from third parties, or to pay for both research and execution services from securities brokers who effect transactions for the Fund. The Board recognized that the receipt of such research from brokers may reduce the Adviser’s costs but concluded that the receipt of such research strengthens the investment management resources of the Adviser, which may ultimately benefit the Fund and other funds in the Morgan Stanley Fund Complex.
Adviser Financially Sound and Financially Capable of Meeting the Fund’s Needs
The Board considered whether the Adviser is financially sound and has the resources necessary to perform its obligations under the Management Agreement. The Board concluded that the Adviser has the financial resources necessary to fulfill its obligations under the Management Agreement.
Historical Relationship Between the Fund and the Adviser
The Board also reviewed and considered the historical relationship between the Fund and the Adviser, including the organizational structure of the Adviser, the policies and procedures formulated and adopted by the Adviser for managing the Fund’s operations and the Board’s confidence in the competence and integrity of the senior managers and key personnel of the Adviser. The Board concluded that it is beneficial for the Fund to continue its relationship with the Adviser.
Other Factors and Current Trends
The Board considered the controls and procedures adopted and implemented by the Adviser and monitored by the Fund’s Chief Compliance Officer and concluded that the conduct of business by the Adviser indicates a good faith effort on its part to adhere to high ethical standards in the conduct of the Fund’s business.
General Conclusion
After considering and weighing all of the above factors, the Board concluded that it would be in the best interest of the Fund and its shareholders to approve renewal of the Management Agreement for another year.
5
| Morgan Stanley Asia-Pacific Fund, Inc. |
| |
| June 30, 2008 (unaudited) |
Portfolio of Investments
| | Shares | | Value
(000) | |
COMMON STOCKS (95.9%) | | | | | |
(Unless Otherwise Noted) | | | | | |
Australia (13.1%) | | | | | |
Air Freight & Logistics | | | | | |
Toll Holdings Ltd. | | 729,962 | | $ 4,213 | |
Airlines | | | | | |
Qantas Airways Ltd. | | 1,151,203 | | 3,355 | |
Chemicals | | | | | |
Incitec Pivot Ltd. | | 90,962 | | 16,132 | |
Orica Ltd. | | 291,764 | | 8,195 | |
| | | | 24,327 | |
Commercial Banks | | | | | |
Commonwealth Bank of Australia | | 19,817 | | 763 | |
Westpac Banking Corp. | | 35,864 | | 688 | |
| | | | 1,451 | |
Construction & Engineering | | | | | |
Leighton Holdings Ltd. | | 65,550 | | 3,195 | |
Diversified Telecommunication Services | | | | | |
Telstra Corp. Ltd. | | 1,254,337 | | 5,098 | |
Food & Staples Retailing | | | | | |
Woolworths Ltd. | | 457,375 | | 10,720 | |
Health Care Equipment & Supplies | | | | | |
Cochlear Ltd. | | 26,500 | | 1,109 | |
Hotels, Restaurants & Leisure | | | | | |
Tatts Group Ltd. | | 738,000 | | 1,663 | |
Insurance | | | | | |
QBE Insurance Group Ltd. | | 388,640 | | 8,346 | |
Metals & Mining | | | | | |
BHP Billiton Ltd. | | 400,344 | | 16,772 | |
Rio Tinto Ltd. | | 34,709 | | 4,509 | |
Straits Resources Ltd. | | 233,986 | | 1,534 | |
| | | | 22,815 | |
Textiles, Apparel & Luxury Goods | | | | | |
Billabong International Ltd. | | 239,520 | | 2,480 | |
Trading Companies & Distributors | | | | | |
Alesco Corp. Ltd. | | 142,740 | | 944 | |
| | | | 89,716 | |
China (12.0%) | | | | | |
Automobiles | | | | | |
Dongfeng Motor Group Co., Ltd., ‘H’ | | 5,629,000 | | 2,252 | |
Commercial Banks | | | | | |
China Citic Bank, ‘H’ | | 2,021,000 | | 1,133 | |
China Construction Bank Corp., ‘H’ | | 20,296,000 | | 16,347 | |
Industrial & Commercial Bank of China, ‘H’ | | 10,823,000 | | 7,398 | |
| | | | 24,878 | |
Independent Power Producers & Energy Traders | | | | | |
China Resources Power Holdings Co. | | 1,220,000 | | 2,973 | |
Datang International Power Generation Co., Ltd., ‘H’ | | 2,020,000 | | 1,199 | |
| | | | 4,172 | |
Industrial Conglomerates | | | | | |
Shanghai Industrial Holdings Ltd. | | 710,000 | | 2,085 | |
Insurance | | | | | |
Ping An Insurance Group Co. of China Ltd., ‘H’ | | 762,500 | | 5,672 | |
Marine | | | | | |
China COSCO Holdings Co., Ltd., ‘H’ | | 4,044,550 | | 9,876 | |
Media | | | | | |
Focus Media Holdings Ltd. ADR | | (a)81,900 | | 2,270 | |
Metals & Mining | | | | | |
Maanshan Iron & Steel, ‘H’ | | 4,967,000 | | 2,886 | |
Oil, Gas & Consumable Fuels | | | | | |
China Coal Energy Co. | | 3,190,000 | | 5,580 | |
Real Estate | | | | | |
Sino-Ocean Land Holdings Ltd. | | 1,322,500 | | 747 | |
Specialty Retail | | | | | |
Belle International Holdings Ltd. | | 160,000 | | 144 | |
GOME Electrical Appliances Holdings Ltd. | | 13,700,000 | | 6,501 | |
| | | | 6,645 | |
Wireless Telecommunication Services | | | | | |
China Mobile Ltd. | | 1,103,000 | | 14,825 | |
| | | | 81,888 | |
Hong Kong (3.1%) | | | | | |
Commercial Banks | | | | | |
Bank of East Asia Ltd. | | 360,600 | | 1,958 | |
Diversified Financial Services | | | | | |
Hong Kong Exchanges & Clearing Ltd. | | 38,000 | | 556 | |
Real Estate | | | | | |
Cheung Kong Holdings Ltd. | | 176,000 | | 2,372 | |
HongKong Land Holdings Ltd. | | 385,000 | | 1,633 | |
New World Development Ltd. | | 1,543,800 | | 3,144 | |
Sino Land Co. | | 148,000 | | 294 | |
Sun Hung Kai Properties Ltd. | | 40,000 | | 543 | |
Wharf Holdings Ltd. | | 925,187 | | 3,874 | |
| | | | 11,860 | |
6 | The accompanying notes are an integral part of the financial statements. |
| Morgan Stanley Asia-Pacific Fund, Inc. |
| |
| June 30, 2008 (unaudited) |
Portfolio of Investments (cont’d)
| | Shares | | Value
(000) | |
Hong Kong (cont’d) | | | | | |
Specialty Retail | | | | | |
Esprit Holdings Ltd. | | 479,000 | | $ 4,976 | |
Transportation Infrastructure | | | | | |
Hopewell Holdings | | 505,000 | | 1,794 | |
| | | | 21,144 | |
India (1.6%) | | | | | |
Electrical Equipment | | | | | |
ABB Ltd. | | 128,800 | | 2,406 | |
Energy Equipment & Services | | | | | |
Aban Offshore Ltd. | | 70,200 | | 4,700 | |
Metals & Mining | | | | | |
National Aluminum Co., Ltd. | | 119,700 | | 977 | |
Welspun-Gujarat Stahl Ltd. | | 391,800 | | 2,766 | |
| | | | 3,743 | |
| | | | 10,849 | |
Indonesia (3.3%) | | | | | |
Automobiles | | | | | |
Astra International Tbk PT | | 1,453,500 | | 3,035 | |
Commercial Banks | | | | | |
Bank Central Asia Tbk PT | | 5,313,000 | | 1,426 | |
Bank Mandiri Persero Tbk PT | | 6,355,000 | | 1,792 | |
Bank Rakyat Indonesia Tbk PT | | 3,775,500 | | 2,089 | |
| | | | 5,307 | |
Construction Materials | | | | | |
Indocement Tunggal Prakarsa Tbk PT | | 1,498,000 | | 885 | |
Diversified Telecommunication Services | | | | | |
Telekomunikasi Indonesia Tbk PT | | 3,250,000 | | 2,573 | |
Gas Utilities | | | | | |
Perusahaan Gas Negara PT | | (a)713,500 | | 1,006 | |
Oil, Gas & Consumable Fuels | | | | | |
Bumi Resources Tbk PT | | 11,203,000 | | 9,964 | |
| | | | 22,770 | |
Japan (46.7%) | | | | | |
Auto Components | | | | | |
Toyoda Gosei Co., Ltd. | | 46,900 | | 1,369 | |
Automobiles | | | | | |
Nissan Motor Co., Ltd. | | 854,600 | | 7,058 | |
Suzuki Motor Corp. | | 249,300 | | 5,893 | |
Toyota Motor Corp. | | 202,500 | | 9,555 | |
Yamaha Motor Co., Ltd. | | 225,100 | | 4,212 | |
| | | | 26,718 | |
Building Products | | | | | |
Daikin Industries Ltd. | | 172,700 | | 8,718 | |
Nippon Sheet Glass Co., Ltd. | | 533,000 | | 2,635 | |
Sanwa Holdings Corp. | | 457,000 | | 1,730 | |
| | | | 13,083 | |
Chemicals | | | | | |
Daicel Chemical Industries Ltd. | | 755,000 | | 4,252 | |
Denki Kagaku Kogyo KK | | 973,000 | | 3,610 | |
Kaneka Corp. | | 580,000 | | 3,949 | |
Lintec Corp. | | 169,800 | | 2,950 | |
Mitsubishi Chemical Holdings Corp. | | 649,000 | | 3,777 | |
Nifco, Inc. | | 143,100 | | 3,376 | |
Shin-Etsu Polymer Co., Ltd. | | 288,600 | | 1,816 | |
Teijin Ltd. | | 960,000 | | 3,291 | |
Toyo Ink Manufacturing Co., Ltd. | | 513,000 | | 1,744 | |
| | | | 28,765 | |
Commercial Services & Supplies | | | | | |
Dai Nippon Printing Co., Ltd. | | 303,000 | | 4,466 | |
Nissha Printing Co., Ltd. | | 58,300 | | 3,354 | |
| | | | 7,820 | |
Computers & Peripherals | | | | | |
Fujitsu Ltd. | | 1,121,000 | | 8,319 | |
Mitsumi Electric Co., Ltd. | | 219,500 | | 4,889 | |
NEC Corp. | | 1,208,000 | | 6,325 | |
Toshiba Corp. | | 1,239,000 | | 9,136 | |
| | | | 28,669 | |
Construction & Engineering | | | | | |
Kyudenko Corp. | | 234,000 | | 1,622 | |
Maeda Road Construction Co., Ltd. | | 181,000 | | 1,273 | |
Obayashi Corp. | | 753,000 | | 3,411 | |
Sanki Engineering Co., Ltd. | | 134,000 | | 1,092 | |
| | | | 7,398 | |
Consumer Finance | | | | | |
Hitachi Capital Corp. | | 196,900 | | 3,171 | |
Diversified Telecommunication Services | | | | | |
Nippon Telegraph & Telephone Corp. | | 852 | | 4,172 | |
Electric Utilities | | | | | |
Tokyo Electric Power Co., Inc. | | | | | |
(The) | | 74,800 | | 1,923 | |
Electrical Equipment | | | | | |
Furukawa Electric Co., Ltd. | | 1,000,000 | | 4,342 | |
The accompanying notes are an integral part of the financial statements. | 7 |
| Morgan Stanley Asia-Pacific Fund, Inc. |
| |
| June 30, 2008 (unaudited) |
Portfolio of Investments (cont’d)
| | Shares | | Value
(000) | |
Japan (cont’d) | | | | | |
Electronic Equipment & Instruments | | | | | |
FUJIFILM Holdings Corp. | | 158,200 | | $ 5,438 | |
Hitachi Ltd. | | 927,000 | | 6,687 | |
Kyocera Corp. | | 76,300 | | 7,186 | |
Ryosan Co., Ltd. | | 104,700 | | 2,248 | |
TDK Corp. | | 76,500 | | 4,582 | |
| | | | 26,141 | |
Food & Staples Retailing | | | | | |
FamilyMart Co., Ltd. | | 138,700 | | 5,669 | |
Food Products | | | | | |
House Foods Corp. | | 118,600 | | 1,910 | |
Nippon Meat Packers, Inc. | | 300,000 | | 4,063 | |
| | | | 5,973 | |
Household Durables | | | | | |
Casio Computer Co., Ltd. | | 359,300 | | 4,091 | |
Matsushita Electric Industrial Co., Ltd. | | 458,000 | | 9,877 | |
Sekisui Chemical Co., Ltd. | | 606,000 | | 4,126 | |
Sekisui House Ltd. | | 346,000 | | 3,229 | |
Sony Corp. | | 125,200 | | 5,471 | |
| | | | 26,794 | |
Leisure Equipment & Products | | | | | |
Yamaha Corp. | | 221,300 | | 4,272 | |
Machinery | | | | | |
Amada Co., Ltd. | | 471,000 | | 3,713 | |
Daifuku Co., Ltd. | | 340,000 | | 3,346 | |
Fuji Machine Manufacturing Co., Ltd. | | 120,400 | | 2,404 | |
Fujitec Co., Ltd. | | 193,000 | | 1,143 | |
Kurita Water Industries Ltd. | | 140,100 | | 5,185 | |
Minebea Co., Ltd. | | 592,000 | | 3,384 | |
Mitsubishi Heavy Industries Ltd. | | 1,470,000 | | 7,005 | |
Tsubakimoto Chain Co. | | 618,000 | | 3,597 | |
| | | | 29,777 | |
Media | | | | | |
Toho Co., Ltd. | | 86,600 | | 1,770 | |
Metals & Mining | | | | | |
Mitsui Mining & Smelting Co., Ltd. | | 978,000 | | 2,883 | |
Nippon Steel Corp. | | 402,000 | | 2,177 | |
| | | | 5,060 | |
Office Electronics | | | | | |
Canon, Inc. | | 214,600 | | 11,035 | |
Ricoh Co., Ltd. | | 456,000 | | 8,228 | |
| | | | 19,263 | |
Pharmaceuticals | | | | | |
Astellas Pharmaceutical, Inc. | | 160,800 | | 6,814 | |
Daiichi Sankyo Co., Ltd. | | 278,700 | | 7,677 | |
Ono Pharmaceutical Co., Ltd. | | 103,200 | | 5,686 | |
| | | | 20,177 | |
Road & Rail | | | | | |
East Japan Railway Co. | | 628 | | 5,116 | |
Semiconductors & Semiconductor Equipment | | | | | |
Rohm Co., Ltd. | | 63,300 | | 3,642 | |
Software | | | | | |
Nintendo Co., Ltd. | | 25,300 | | 14,272 | |
Textiles, Apparel & Luxury Goods | | | | | |
Nisshinbo Industries, Inc. | | 235,000 | | 2,791 | |
Trading Companies & Distributors | | | | | |
Hitachi High-Technologies Corp. | | 121,400 | | 2,813 | |
Marubeni Corp. | | 420,000 | | 3,508 | |
Mitsubishi Corp. | | 390,700 | | 12,878 | |
Nagase & Co., Ltd. | | 199,000 | | 2,097 | |
| | | | 21,296 | |
| | | | 319,443 | |
Malaysia (1.2%) | | | | | |
Construction & Engineering | | | | | |
IJM Corp. Bhd | | 487,250 | | 820 | |
Food Products | | | | | |
IOI Corp Bhd | | 1,087,750 | | 2,480 | |
Kuala Lumpur Kepong Bhd | | 378,500 | | 2,039 | |
| | | | 4,519 | |
Industrial Conglomerates | | | | | |
Sime Darby Bhd | | 981,000 | | 2,777 | |
| | | | 8,116 | |
Pakistan (0.1%) | | | | | |
Construction Materials | | | | | |
Lucky Cement Ltd. GDR | | (a)133,400 | | 735 | |
Philippines (0.3%) | | | | | |
Diversified Financial Services | | | | | |
Ayala Corp. | | 96,468 | | 553 | |
Independent Power Producers & Energy Traders | | | | | |
PNOC Energy Development Corp. | | 2,216,000 | | 257 | |
Wireless Telecommunication Services | | | | | |
Philippines Long Distance Telephone Co. | | 24,900 | | 1,328 | |
| | | | 2,138 | |
8 | The accompanying notes are an integral part of the financial statements. |
| Morgan Stanley Asia-Pacific Fund, Inc. |
| |
| June 30, 2008 (unaudited) |
Portfolio of Investments (cont’d)
| | Shares | | Value
(000) | |
Singapore (2.2%) | | | | | |
Commercial Banks | | | | | |
Oversea-Chinese Banking Corp. | | 500,900 | | $ 3,008 | |
United Overseas Bank Ltd. | | 205,500 | | 2,812 | |
| | | | 5,820 | |
Real Estate | | | | | |
CapitaLand Ltd. | | 380,000 | | 1,592 | |
City Developments Ltd. | | 95,000 | | 758 | |
United Industrial Corp. Ltd. | | 2,734,000 | | 6,009 | |
| | | | 8,359 | |
Transportation Infrastructure | | | | | |
CWT Ltd. | | 1,451,000 | | 890 | |
| | | | 15,069 | |
South Korea (6.2%) | | | | | |
Automobiles | | | | | |
Hyundai Motor Co. | | 94,589 | | 6,420 | |
Building Products | | | | | |
EnE System, Inc. | | (a)18,654 | | 84 | |
Chemicals | | | | | |
LG Chemical Ltd. | | 28,356 | | 2,711 | |
SSCP Co., Ltd. | | (a)59,869 | | 924 | |
| | | | 3,635 | |
Commercial Banks | | | | | |
Kookmin Bank | | 37,130 | | 2,193 | |
Shinhan Financial Group Co., Ltd. | | 46,283 | | 2,093 | |
| | | | 4,286 | |
Construction & Engineering | | | | | |
Hyundai Development Co. | | 28,540 | | 1,446 | |
Samsung Engineering Co., Ltd. | | 15,300 | | 1,145 | |
| | | | 2,591 | |
Electronic Equipment & Instruments | | | | | |
LG Display Co., Ltd. | | 47,192 | | 1,769 | |
Household Durables | | | | | |
LG Electronics, Inc. | | 13,829 | | 1,566 | |
Woongjin Coway Co., Ltd. | | 82,690 | | 2,427 | |
| | | | 3,993 | |
Insurance | | | | | |
Samsung Fire & Marine Insurance Co., Ltd. | | 6,360 | | 1,329 | |
Internet Software & Services | | | | | |
NHN Corp. | | (a)10,213 | | 1,782 | |
Marine | | | | | |
STX Pan Ocean Co., Ltd. | | 476,000 | | 955 | |
Media | | | | | |
Cheil Communications, Inc. | | 6,309 | | 1,496 | |
Metals & Mining | | | | | |
POSCO | | 343 | | 178 | |
Personal Products | | | | | |
Amorepacific Corp. | | 1,198 | | 742 | |
Semiconductors & Semiconductor Equipment | | | | | |
Samsung Electronics Co., Ltd. | | 16,215 | | 9,688 | |
Samsung Electronics Co., Ltd. (Preference) | | 6,391 | | 2,756 | |
| | | | 12,444 | |
Textiles, Apparel & Luxury Goods | | | | | |
Cheil Industries, Inc. | | 20,250 | | 939 | |
| | | | 42,643 | |
Taiwan (5.1%) | | | | | |
Chemicals | | | | | |
Formosa Plastics Corp. | | 324,000 | | 781 | |
Taiwan Fertilizer Co., Ltd. | | 114,000 | | 428 | |
| | | | 1,209 | |
Commercial Banks | | | | | |
Chinatrust Financial Holding Co., Ltd. | | (a)3,854,000 | | 3,720 | |
First Financial Holding Co Ltd. | | 2,644,000 | | 2,901 | |
| | | | 6,621 | |
Computers & Peripherals | | | | | |
Acer, Inc. | | 881,000 | | 1,736 | |
Asustek Computer, Inc. | | 293,716 | | 799 | |
High Tech Computer Corp. | | 112,000 | | 2,509 | |
| | | | 5,044 | |
Construction Materials | | | | | |
Taiwan Cement Corp. | | 858,000 | | 1,159 | |
Diversified Financial Services | | | | | |
Yuanta Financial Holding Co., Ltd. | | (a)1,723,000 | | 1,206 | |
Electronic Equipment & Instruments | | | | | |
AU Optronics Corp. | | 1,326,191 | | 2,084 | |
HON HAI Precision Industry Co., Ltd. | | 195,000 | | 961 | |
| | | | 3,045 | |
Insurance | | | | | |
Cathay Financial Holding Co., Ltd. | | 1,161,000 | | 2,524 | |
Marine | | | | | |
Yang Ming Marine Transport Corp. | | 3,031,579 | | 1,998 | |
Metals & Mining | | | | | |
China Steel Corp. | | 3,154,000 | | 4,868 | |
The accompanying notes are an integral part of the financial statements. | 9 |
| Morgan Stanley Asia-Pacific Fund, Inc. |
| |
| June 30, 2008 (unaudited) |
Portfolio of Investments (cont’d)
| | Shares | | Value
(000) | |
Taiwan (cont’d) | | | | | |
Semiconductors & Semiconductor Equipment | | | | | |
Taiwan Semiconductor Manufacturing Co., Ltd. | | (a)3,186,000 | | $ 6,823 | |
| | | | 34,497 | |
Thailand (1.0%) | | | | | |
Commercial Banks | | | | | |
Bangkok Bank PCL NVDR | | 135,100 | | 481 | |
Kasikornbank PCL (Foreign) | | 1,040,900 | | 2,241 | |
Siam Commercial Bank PCL (Foreign) | | 115,900 | | 269 | |
| | | | 2,991 | |
Household Durables | | | | | |
Land & Houses PCL (Foreign) | | 2,350,900 | | 521 | |
Oil, Gas & Consumable Fuels | | | | | |
Banpu PCL (Foreign) | | 900 | | 15 | |
Banpu PCL NVDR | | 149,500 | | 2,361 | |
PTT PCL (Foreign) | | 65,600 | | 592 | |
| | | | 2,968 | |
Wireless Telecommunication Services | | | | | |
Advanced Info Service PCL NVDR | | 209,000 | | 578 | |
| | | | 7,058 | |
TOTAL COMMON STOCKS | | | | | |
(Cost $555,947) | | | | 656,066 | |
INVESTMENT COMPANY (1.0%) | | | | | |
India (1.0%) | | | | | |
Diversified Financial Services | | | | | |
Morgan Stanley Growth Fund | | | | | |
(Cost $1,254) | | (a)(b)6,860,401 | | 6,761 | |
SHORT-TERM INVESTMENT (5.9%) | | | | | |
United States (5.9%) | | | | | |
Investment Company | | | | | |
Morgan Stanley Institutional Liquidity Money Market Portfolio — Institutional Class (Cost $40,127) | | (b)40,126,955 | | 40,127 | |
TOTAL INVESTMENTS (102.8%) | | | | | |
(Cost $597,328) | | | | 702,954 | |
LIABILITIES IN EXCESS OF OTHER ASSETS (-2.8) | | | | (18,810) | |
NET ASSETS (100.0%) | | | | $684,144 | |
(a) | | Non-income producing security. |
(b) | | See Note G within the Notes to Financial Statements regarding investments in Morgan Stanley Growth Fund and Morgan Stanley Institutional Liquidity Money Market Portfolio — Institutional Class. |
ADR | | American Depositary Receipt |
GDR | | Global Depositary Receipt |
NVDR | | Non-Voting Depositary Receipt |
Foreign Currency Exchange Contract Information:
The Fund had the following foreign currency exchange contract(s) open at period end:
| | | | | | | | | | Net | |
Currency | | | | | | In | | | | Unrealized | |
to | | | | | | Exchange | | | | Appreciation | |
Deliver | | Value | | Settlement | | For | | Value | | (Depreciation) | |
(000) | | (000) | | Date | | (000) | | (000) | | (000) | |
INR 78,753 | | | $1,830 | | | 07/02/08 | | USD 1,834 | | | $1,834 | | | | $ | 4 | | |
| | | | | | | | | | | | | | | | | | |
INR Indian Rupee
USD United States Dollar
Graphic Presentation of Portfolio Holdings
The following graph depicts the Fund’s holdings by industry and/or security type, as a percentage of total investments.
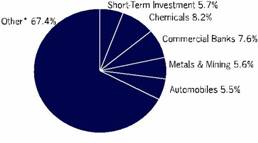
*Industries which do not appear in the above graph, as well as those which represent less than 5% of total investments, if applicable, are included in the category labeled “Other”.
10 | The accompanying notes are an integral part of the financial statements. |
| Morgan Stanley Asia-Pacific Fund, Inc. |
| |
| Financial Statements |
Statement of Assets and Liabilities | | June 30, 2008
(unaudited)
(000) | |
Assets: | | | |
Investments in Securities of Unaffiliated Issuers, at Value (Cost $555,947) | | $ 656,066 | |
Investments in Securities of Affiliated Issuers, at Value (Cost $41,381) | | 46,888 | |
Total Investments in Securities, at Value (Cost $597,328) | | 702,954 | |
Foreign Currency, at Value (Cost $4,347) | | 4,352 | |
Dividends Receivable | | 1,158 | |
Tax Reclaim Receivable | | 5 | |
Unrealized Appreciation on Foreign Currency Exchange Contracts | | 4 | |
Receivable from Affiliate | | 3 | |
Receivable for Investments Sold | | 3 | |
Other Assets | | 23 | |
Total Assets | | 708,502 | |
Liabilities: | | | |
Payable For: | | | |
Dividend Declared | | 21,830 | |
Bank Overdraft | | 1,422 | |
Investment Advisory Fees | | 599 | |
Investments Purchased | | 155 | |
Custodian Fees | | 131 | |
Administration Fees | | 17 | |
Other Liabilites | | 204 | |
Total Liabilities | | 24,358 | |
Net Assets | | | |
Applicable to 33,298,543 Issued and Outstanding $0.01 Par Value Shares (200,000,000 Shares Authorized) | | $ 684,144 | |
Net Asset Value Per Share | | $ 20.55 | |
Net Assets Consist of: | | | |
Common Stock | | $ 333 | |
Paid-in Capital | | 541,955 | |
Undistributed (Distributions in Excess of) Net Investment Income | | (8,265) | |
Accumulated Net Realized Gain (Loss) | | 44,476 | |
Unrealized Appreciation (Depreciation) on Investments and Foreign Currency Exchange Contracts and Translations | | 105,645 | |
Net Assets | | $ 684,144 | |
The accompanying notes are an integral part of the financial statements. | 11 |
| Morgan Stanley Asia-Pacific Fund, Inc. |
| |
| Financial Statements |
Statement of Operations | | Six Months Ended
June 30, 2008
(unaudited)
(000) | |
Investment Income | | | |
Dividends from Securities of Unaffiliated Issuers (Net of $565 of Foreign Taxes Withheld) | | $ 8,199 | |
Dividends from Security of Affiliated Issuer | | 553 | |
Interest from Securities of Unaffiliated Issuers | | @— | |
Total Investment Income | | 8,752 | |
Expenses | | | |
Investment Advisory Fees (Note B) | | 3,683 | |
Administration Fees (Note C) | | 294 | |
Custodian Fees (Note D) | | 271 | |
Professional Fees | | 72 | |
Stockholder Reporting Expenses | | 40 | |
Stockholder Servicing Agent Fees | | 15 | |
Directors’ Fees and Expenses | | 7 | |
Other Expenses | | 41 | |
Total Expenses | | 4,423 | |
Waiver of Administration Fees (Note C) | | (192 | ) |
Rebate from Morgan Stanley Affiliated Cash Sweep (Note G) | | (17 | ) |
Expense Offset (Note D) | | (1 | ) |
Net Expenses | | 4,213 | |
Net Investment Income (Loss) | | 4,539 | |
Net Realized Gain (Loss) on: | | | |
Investments in Unaffiliated Issuers (Net of Country Taxes of $403) | | 43,793 | |
Investments in Affiliated Issuer | | 1,506 | |
Foreign Currency Transactions | | (335 | ) |
Net Realized Gain (Loss) | | 44,964 | |
Change in Unrealized Appreciation (Depreciation) on: | | | |
Investments | | (139,223 | ) |
Foreign Currency Exchange Contracts and Translations | | (40 | ) |
Change in Unrealized Appreciation (Depreciation) | | (139,263 | ) |
Net Realized Gain (Loss) and Change in Unrealized Appreciation (Depreciation) | | (94,299 | ) |
Net Increase (Decrease) in Net Assets Resulting from Operations | | $ (89,760 | ) |
@ Amount is less than $500.
12 | The accompanying notes are an integral part of the financial statements. |
| Morgan Stanley Asia-Pacific Fund, Inc. |
| |
| Financial Statements |
| | Six Months Ended | | | |
| | June 30, 2008 | | Year Ended | |
Statements of Changes in Net Assets | | (unaudited) (000) | | December 31, 2007 (000) | |
Increase (Decrease) in Net Assets | | | | | |
Operations: | | | | | |
Net Investment Income (Loss) | | $ 4,539 | | $ 5,219 | |
Net Realized Gain (Loss) | | 44,964 | | 121,234 | |
Change in Unrealized Appreciation (Depreciation) | | (139,263 | ) | 56,429 | |
Net Increase (Decrease) in Net Assets Resulting from Operations | | (89,760 | ) | 182,882 | |
Distributions from and/or in Excess of: | | | | | |
Net Investment Income | | (3 | ) | (15,594 | ) |
Net Realized Gain | | (21,827 | ) | (69,409 | ) |
Total Distributions | | (21,830 | ) | (85,003 | ) |
Capital Share Transactions: | | | | | |
Repurchase of Shares (673,948 and 1,287,752 shares, respectively) | | (12,818 | ) | (26,799 | ) |
Total Increase (Decrease) | | (124,408 | ) | 71,080 | |
Net Assets: | | | | | |
Beginning of Period | | 808,552 | | 737,472 | |
End of Period (Including Undistributed (Distributions in Excess of) Net Investment Income of $(8,265) and $(12,801), respectively) | | $ 684,144 | | $808,552 | |
The accompanying notes are an integral part of the financial statements. | 13 |
| Morgan Stanley Asia-Pacific Fund, Inc. |
| |
| Financial Statements |
Selected Per Share Data and Ratios
| | Six Months Ended | | | |
| | June 30, 2008 | | Year Ended December 31, | |
| | (unaudited) | | 2007 | | 2006 | | 2005 | | 2004 | | 2003 | |
Net Asset Value, Beginning of Period | | $ 23.80 | | | $ 20.92 | | $ 17.33 | | $ 14.58 | | $ 12.29 | | $ 8.57 | |
Net Investment Income (Loss)† | | 0.14 | | | 0.15 | | 0.13 | | 0.11 | | 0.09 | | 0.05 | |
Net Realized and Unrealized Gain (Loss) on Investments | | (2.77 | ) | | 5.15 | | 3.69 | | 2.81 | | 2.31 | | 3.75 | |
Total from Investment Operations | | (2.63 | ) | | 5.30 | | 3.82 | | 2.92 | | 2.40 | | 3.80 | |
Distributions from and/or in Excess of: | | | | | | | | | | | | | | |
Net Investment Income | | (0.00 | )# | | (0.46 | ) | (0.24 | ) | (0.18 | ) | (0.11 | ) | (0.09 | ) |
Net Realized Gain | | (0.66 | ) | | (2.04 | ) | — | | — | | — | | — | |
Total Distributions | | (0.66 | ) | | (2.50 | ) | (0.24 | ) | (0.18 | ) | (0.11 | ) | (0.09 | ) |
Anti-Dilutive Effect of Share Repurchase Program | | 0.04 | | | 0.08 | | 0.01 | | 0.01 | | 0.00 | # | 0.01 | |
Net Asset Value, End of Period | | $ 20.55 | | | $ 23.80 | | $ 20.92 | | $ 17.33 | | $ 14.58 | | $ 12.29 | |
Per Share Market Value, End of Period | | $ 17.47 | | | $ 20.14 | | $ 19.11 | | $ 15.53 | | $ 12.81 | | $ 10.85 | |
TOTAL INVESTMENT RETURN: | | | | | | | | | | | | | | |
Market Value | | (9.99 | )%* | | 18.62 | % | 24.62 | % | 22.58 | % | 19.06 | % | 51.87 | % |
Net Asset Value (1) | | (10.40 | )%* | | 28.11 | % | 22.27 | % | 20.11 | % | 19.63 | % | 44.48 | % |
RATIOS, SUPPLEMENTAL DATA: | | | | | | | | | | | | | | |
Net Assets, End of Period (Thousands) | | $684,144 | | | $808,552 | | $737,472 | | $615,838 | | $520,127 | | $439,774 | |
Ratio of Expenses to Average Net Assets(2) | | 1.15 | %+** | | 1.13 | %+ | 1.16 | % | 1.17 | % | 1.18 | % | 1.26 | % |
Ratio of Net Investment Income (Loss) to Average Net Assets(2) | | 1.24 | %+** | | 0.63 | %+ | 0.69 | % | 0.73 | % | 0.66 | % | 0.51 | % |
Portfolio Turnover Rate | | 24 | %* | | 48 | % | 43 | % | 28 | % | 25 | % | 34 | % |
(2) Supplemental Information on the Ratios to Average Net Assets: | | | | | | | | | | | | | | |
Ratios Before Expenses Waived by Administrator: | | | | | | | | | | | | | | |
Ratio of Expenses to Average Net Assets | | 1.20 | %+** | | 1.18 | %+ | 1.21 | % | 1.22 | % | 1.19 | % | N/A | |
Ratio of Net Investment Income (Loss) to Average Net Assets | | 1.19 | %+** | | 0.58 | %+ | 0.64 | % | 0.68 | % | 0.65 | % | N/A | |
(1) | | Total investment return based on net asset value per share reflects the effects of changes in net asset value on the performance of the Fund during each period, and assumes dividends and distributions, if any, were reinvested. This percentage is not an indication of the performance of a stockholder’s investment in the Fund based on market value due to differences between the market price of the stock and the net asset value per share of the Fund. |
† | | Per share amounts are based on average shares outstanding. |
# | | Amount is less than $0.005 per share. |
* | | Not Annualized |
** | | Annualized |
+ | | Reflects rebate of certain Fund expenses in connection with the investments in Morgan Stanley Institutional Liquidity Money Market Portfolio — Institutional Class during the period. As a result of such rebate, the expenses as a percentage of its net assets were effected by less than 0.005%. |
| | | | | | | | | | | | | | | | |
14 | The accompanying notes are an integral part of the financial statements. |
| Morgan Stanley Asia-Pacific Fund, Inc. |
| |
| June 30, 2008 (unaudited) |
| |
Notes to Financial Statements | |
The Morgan Stanley Asia-Pacific Fund, Inc. (the “Fund”) was incorporated in Maryland on February 28, 1994, and is registered as a diversified, closed-end management investment company under the Investment Company Act of 1940, as amended (the “1940 Act”). The Fund’s investment objective is long-term capital appreciation through investments primarily in equity securities of Asian-Pacific issuers and in debt securities issued or guaranteed by Asian Pacific governments or governmental entities.
A. Accounting Policies: The following significant accounting policies are in conformity with U.S. generally accepted accounting principles. Such policies are consistently followed by the Fund in the preparation of its financial statements. U.S. generally accepted accounting principles may require management to make estimates and assumptions that affect the reported amounts and disclosures in the financial statements. Actual results may differ from those estimates.
1. Security Valuation: Securities listed on a foreign exchange are valued at their closing price except as noted below. Unlisted securities and listed securities not traded on the valuation date for which market quotations are readily available are valued at the mean between the current bid and asked prices obtained from reputable brokers. Equity securities listed on a U.S. exchange are valued at the latest quoted sales price on the valuation date. Equity securities listed or traded on NASDAQ, for which market quotations are available, are valued at the NASDAQ Official Closing Price. Debt securities purchased with remaining maturities of 60 days or less are valued at amortized cost, if it approximates market value.
All other securities and investments for which market values are not readily available, including restricted securities, and those securities for which it is inappropriate to determine prices in accordance with the aforementioned procedures, are valued at fair value as determined in good faith under procedures adopted by the Board of Directors (the “Directors”), although the actual calculations may be done by others. Factors considered in making this determination may include, but are not limited to, information obtained by contacting the issuer, analysts, or the appropriate stock exchange (for exchange-traded securities), analysis of the issuer’s financial statements or other available documents and, if necessary, available information concerning other securities in similar circumstances.
Most foreign markets close before the New York Stock Exchange (NYSE). Occasionally, developments that could affect the closing prices of securities and other assets may occur between the times at which valuations of such securities are determined (that is, close of the foreign market on which the securities trade) and the close of business on the NYSE. If these developments are expected to materially affect the value of the securities, the valuations may be adjusted to reflect the estimated fair value as of the close of the NYSE, as determined in good faith under procedures established by the Directors.
2. Foreign Currency Translation: The books and records of the Fund are maintained in U.S. dollars. Foreign currency amounts are translated into U.S. dollars at the mean of the bid and asked prices of such currencies against U.S. dollars last quoted by a major bank as follows:
· investments, other assets and liabilities at the prevailing rates of exchange on the valuation date;
· investment transactions and investment income at the prevailing rates of exchange on the dates of such transactions.
Although the net assets of the Fund are presented at the foreign exchange rates and market values at the close of the period, the Fund does not isolate that portion of the results of operations arising as a result of changes in the foreign exchange rates from the fluctuations arising from changes in the market prices of the securities held at period end. Similarly, the Fund does not isolate the effect of changes in foreign exchange rates from the fluctuations arising from changes in the market prices of securities sold during the period. Accordingly, realized and unrealized foreign currency gains (losses) on investments in securities are included in the reported net realized and unrealized gains (losses) on investment transactions and balances.
Net realized gains (losses) on foreign currency transactions represent net foreign exchange gains (losses) from sales and maturities of foreign currency exchange contracts, disposition of foreign currencies, currency gains or losses realized between the trade and settlement dates on securities transactions, and the difference between the amount of investment income and foreign withholding taxes recorded on the Fund’s books and the U.S. dollar equivalent amounts actually received or paid. Net unrealized currency gains (losses) from valuing foreign currency denominated assets and liabilities at period end exchange rates are reflected as a component of unrealized appreciation (depreciation) on investments and foreign currency translations in the Statement of Assets and Liabilities. The change in net unrealized currency gains
15
| Morgan Stanley Asia-Pacific Fund, Inc. |
| |
| June 30, 2008 (unaudited) |
| |
Notes to Financial Statements (cont’d) | |
(losses) on foreign currency translations for the period is reflected in the Statement of Operations.
A significant portion of the Fund’s net assets consist of securities of issuers located in Asia which are denominated in foreign currencies. Changes in currency exchange rates will affect the value of and investment income from such securities. In general, Asian securities are subject to greater price volatility, limited capitalization and liquidity, and higher rates of inflation than securities of companies based in the United States. In addition, Asian securities may be subject to substantial governmental involvement in the economy and greater social, economic and political uncertainty. Such securities may be concentrated in a limited number of countries and regions and may vary throughout the year.
Governmental approval for foreign investments may be required in advance of making an investment under certain circumstances in some countries, and the extent of foreign investments in domestic companies may be subject to limitation in other countries. Foreign ownership limitations also may be imposed by the charters of individual companies to prevent, among other concerns, violations of foreign investment limitations. As a result, an additional class of shares (identified as “Foreign” in the Portfolio of Investments) may be created and offered for investment. The “local” and “foreign shares” market values may differ. In the absence of trading of the foreign shares in such markets, the Fund values the foreign shares at the closing exchange price of the local shares. Such securities, if any, are identified as fair valued in the Portfolio of Investments.
3. Derivatives: The Fund may use derivatives to achieve its investment objectives. The Fund may engage in transactions in futures contracts on foreign currencies, stock indices, as well as in options, swaps and structured products. Consistent with the Fund’s investment objectives and policies, the Fund may use derivatives for non-hedging as well as hedging purposes.
Following is a description of derivative instruments that the Fund has utilized and their associated risks:
Foreign Currency Exchange Contracts: The Fund may enter into foreign currency exchange contracts generally to attempt to protect securities and related receivables and payables against changes in future foreign exchange rates and, in certain situations, to gain exposure to a foreign currency. A foreign currency exchange contract is an agreement between two parties to buy or sell currency at a set price on a future date. The market value of the contract will fluctuate with changes in currency exchange rates. The contract is marked-to-market daily and the change in market value is recorded by the Fund as unrealized gain or loss. The Fund records realized gains or losses when the contract is closed equal to the difference between the value of the contract at the time it was opened and the value at the time it was closed. Risk may arise upon entering into these contracts from the potential inability of counterparties to meet the terms of their contracts and is generally limited to the amount of unrealized gain on the contracts, if any, at the date of default. Risks may also arise from unanticipated movements in the value of a foreign currency relative to the U.S. dollar.
Structured Securities: The Fund may invest in interests in entities organized and operated solely for the purpose of restructuring the investment characteristics of sovereign debt obligations. This type of restructuring involves the deposit with or purchase by an entity of specified instruments and the issuance by that entity of one or more classes of securities (“Structured Securities”) backed by, or representing interests in, the underlying instruments. Structured Securities generally will expose the Fund to credit risks of the underlying instruments as well as of the issuer of the Structured Security. Structured Securities are typically sold in private placement transactions with no active trading market. Investments in Structured Securities may be more volatile than their underlying instruments, however, any loss is limited to the amount of the original investment.
Over-the-Counter Trading: Securities and other derivative instruments that may be purchased or sold by the Fund may consist of instruments not traded on an exchange. The risk of non-performance by the obligor on such an instrument may be greater, and the ease with which the Fund can dispose of or enter into closing transactions with respect to such an instrument may be less, than in the case of an exchange-traded instrument. In addition, significant spreads may exist between bid and ask prices for derivative instruments that are not traded on an exchange. Derivative instruments not traded on exchanges are also not subject to the same type of government regulation as exchange traded instruments, and many of the protections afforded to participants in a regulated environment may not be available in connection with such transactions.
4. New Accounting Pronouncement: On March 19, 2008, Financial Accounting Standards Board released Statement
16
| Morgan Stanley Asia-Pacific Fund, Inc. |
| |
| June 30, 2008 (unaudited) |
| |
Notes to Financial Statements (cont’d) | |
of Financial Accounting Standards No. 161, “Disclosures about Derivative Instruments and Hedging Activities” (“SFAS 161���). SFAS 161 requires qualitative disclosures about objectives and strategies for using derivatives, quantitative disclosures about fair value amounts of and gains and losses on derivative instruments, and disclosures about credit-risk-related contingent features in derivative agreements. The application of SFAS 161 is required for fiscal years beginning after November 15, 2008 and interim periods within those fiscal years. At this time, management is evaluating the implications of SFAS 161 and its impact on the financial statements has not yet been determined.
5. Fair Value Measurement: The Fund adopted Financial Accounting Standards Board Statement of Financial Accounting Standards No. 157, “Fair Value Measurements” (“SFAS 157”), effective January 1, 2008. In accordance with SFAS 157, fair value is defined as the price that the Fund would receive to sell an investment or pay to transfer a liability in a timely transaction with an independent buyer in the principal market, or in the absence of a principal market the most advantageous market for the investment or liability. SFAS 157 establishes a three-tier hierarchy to distinguish between (1) inputs that reflect the assumptions market participants would use in pricing an asset or liability developed based on market data obtained from sources independent of the reporting entity (observable inputs) and (2) inputs that reflect the reporting entity’s own assumptions about the assumptions market participants would use in pricing an asset or liability developed based on the best information available in the circum- stances (unobservable inputs) and to establish classification of fair value measurements for disclosure purposes. Various inputs are used in determining the value of the Fund’s investments. The inputs are summarized in the three broad levels listed below.
Level 1 – quoted prices in active markets for identical securities
Level 2 – other significant observable inputs (including quoted prices for similar investments, interest rates, prepayment speeds, credit risk, etc.)
Level 3 – significant unobservable inputs (including the Fund’s own assumptions in determining the fair value of investments)
The inputs or methodology used for valuing securities are not necessarily an indication of the risk associated with investing in those securities.
The following is a summary of the inputs used as of June 30, 2008 in valuing the Fund’s investments carried at value:
Valuation Inputs | | Investments
in Securities
(000) | | Other
Financial
Instruments*
(000) | |
Level 1- Quoted Prices | | $ | 662,827 | | $ | — | |
Level 2- Other Significant Observable Inputs | | 40,127 | | 4 | |
Level 3- Significant Unobservable Inputs | | — | | — | |
Total | | $ | 702,954 | | $ | 4 | |
*Other financial instruments include forwards.
At June 30, 2008, there were no Level 3 Portfolio investments for which significant unobservable inputs were used to determine fair value.
6. Other: Security transactions are accounted for on the date the securities are purchased or sold. Investments in new Indian securities are made by making applications in the public offerings. The issue price, or a portion thereof, is paid at the time of application and is reflected as share application money on the Statement of Assets and Liabilities, if any. Upon allotment of the securities, this amount plus any remaining amount of issue price is recorded as cost of investments. Realized gains (losses) on the sale of investment securities are determined on the specific identified cost basis. Interest income is recognized on the accrual basis. Dividend income and distributions are recorded on the ex-dividend date (except certain dividends which may be recorded as soon as the Fund is informed of such dividends) net of applicable withholding taxes.
B. Investment Advisory Fees: Morgan Stanley Investment Management Inc. (the “Adviser” or “MS Investment Management”) provides investment advisory services to the Fund under the terms of an Investment Advisory and Management Agreement (the “Agreement”). Under the Agreement, the Adviser is paid a fee computed weekly and payable monthly at an annual rate of 1.00% of the Fund’s average weekly net assets.
C. Administration Fees: MS Investment Management also serves as Administrator to the Fund pursuant to an Administration Agreement. Under the Administration Agreement, the administration fee is 0.08% of the Fund’s average weekly net assets. MS Investment Management has agreed to limit the
17
| Morgan Stanley Asia-Pacific Fund, Inc. |
| |
| June 30, 2008 (unaudited) |
| |
Notes to Financial Statements (cont’d) | |
administration fee so that it will be no greater than the previous administration fee of 0.02435% of the Fund’s average weekly net assets plus $24,000 per annum. This waiver is voluntary and may be terminated at any time. For the six months ended June 30, 2008, approximately $192,000 of administration fees were waived pursuant to this arrangement. Under a sub-administration agreement between the Administrator and JPMorgan Investor Services Co. (“JPMIS”), a corporate affiliate of JPMorgan Chase Bank, N.A., JPMIS provides certain administrative services to the Fund. For such services, the Administrator pays JPMIS a portion of the fee the Administrator receives from the Fund. Administration costs (including out-of-pocket expenses) incurred in the ordinary course of providing services under the agreement, except pricing services and extraordinary expenses, will be covered under the administration fee.
D. Custodian Fees: JPMorgan Chase Bank, N.A., (the “Custodian”) and its affiliates serve as Custodian for the Fund. The Custodian holds cash, securities, and other assets of the Fund as required by the 1940 Act. Custody fees are payable monthly based on assets held in custody, investment purchases and sales activity and account maintenance fees, plus reimbursement for certain out-of-pocket expenses.
The Fund has entered into an arrangement with its Custodian whereby credits realized on uninvested cash balances were used to offset a portion of the Fund’s expenses. These custodian credits are shown as ‘‘Expense Offset” on the Statement of Operations.
E. Federal Income Taxes: It is the Fund’s intention to continue to qualify as a regulated investment company and distribute all of its taxable income. Accordingly, no provision for Federal income taxes is required in the financial statements. The Fund files tax returns with the U.S. Internal Revenue Service and various states. Generally, the tax authorities can examine all tax returns filed for the last three years.
The Fund may be subject to taxes imposed by countries in which it invests. Such taxes are generally based on income and/ or capital gains earned or repatriated. Taxes are accrued and applied to net investment income, net realized gains and net unrealized appreciation as such income and/or gains are earned.
The Fund adopted the provisions of the Financial Accounting Standards Board’s (“FASB”) Interpretation number 48 Accounting for Uncertainty in Income Taxes (the “Interpretation”), on June 30, 2007. The Interpretation is to be applied to all open tax years as of the date of effectiveness. As of June 30, 2008, this did not result in an impact to the Fund’s financial statements.
The tax character of distributions paid may differ from the character of distributions shown on the Statements of Changes in Net Assets due to short-term capital gains being treated as ordinary income for tax purposes. The tax character of distributions paid during fiscal 2007 and 2006 was as follows:
| 2007 Distributions
Paid From:
(000) | | | 2006 Distributions
Paid From:
(000) | | |
| | Long-term | | | | Long-term | |
Ordinary | | Capital | | Ordinary | | Capital | |
Income | | Gain | | Income | | Gain | |
$14,775 | | $70,228 | | $8,341 | | $— | |
| | | | | | | | | | |
The amount and character of income and capital gain distributions to be paid by the Fund are determined in accordance with Federal income tax regulations, which may differ from U.S. generally accepted accounting principles. These book/tax differences are considered either temporary or permanent in nature.
Temporary differences are attributable to differing book and tax treatments for the timing of the recognition of gains (losses) on certain investment transactions and the timing of the deductibility of certain expenses.
Permanent differences, primarily due to differing treatments of gains (losses) related to basis adjustments on certain equity securities designated as issued by passive foreign investment companies and foreign currency transactions, resulted in the following reclassifications among the components of net assets at December 31, 2007:
Increase (Decrease) | | |
Accumulated | | | | | |
Undistributed | | | | | |
(Distributions in | | | | | |
Excess of) Net | | Accumulated | | | |
Investment | | Net Realized | | Paid-in | |
Income (Loss) | | Gain (Loss) | | Capital | |
(000) | | (000) | | (000) | |
$5,913 | | $(5,913) | | $@— | |
| | | | | | | |
@ Amount is less than $500.
At December 31, 2007, the components of distributable earnings on a tax basis were as follows:
Undistributed | | Undistributed |
Ordinary Income | | Long-term Capital Gain |
(000) | | (000) |
$ — | | $21,826 |
At June 30, 2008, the U.S. Federal income tax cost basis of investments was approximately $597,328,000 and, accordingly, net unrealized appreciation for U.S. Federal income tax
18
| Morgan Stanley Asia-Pacific Fund, Inc. |
| |
| June 30, 2008 (unaudited) |
| |
Notes to Financial Statements (cont’d) | |
purposes was $105,626,000 of which $149,065,000 related to appreciated securities and $43,439,000 related to depreciated securities.
During the year ended December 31, 2007, the Fund utilized capital loss carry forward for U.S. Federal income tax purposes of approximately $24,189,000.
F. Contractual Obligations: The Fund enters into contracts that contain a variety of indemnifications. The Fund’s maximum exposure under these arrangements is unknown. However, the Fund has not had prior claims or losses pursuant to these contracts and expects the risk of loss to be remote.
G. Security Transactions and Transactions with Affiliates:
The Fund invests in Morgan Stanley Growth Fund, a closed end management investment company advised by an affiliate of the Adviser. The Morgan Stanley Growth Fund was acquired at a cost of $1,254,150. During the six months ended June 30,2008, the Fund had sold 1,755,000 shares of the investment for a realized gain of $1,506,239.
A summary of the Fund’s transactions in shares of the affiliated issuer during the six months ended June 30, 2008 is as follows:
Market | | | | | | | | Market | |
Value | | | | | | | | Value | |
December | | Purchases | | Sales | | Dividend | | June 30, | |
31, 2007 | | at Cost | | Proceeds | | Income | | 2008 | |
(000) | | (000) | | (000) | | (000) | | (000) | |
$14,144 | | $— | | $ 1,845 | | $— | | $6,761 | |
The Fund invests in the Institutional Class of the Morgan Stanley Institutional Liquidity Money Market Portfolio, an open end management investment company managed by the Adviser. Investment Advisory fees paid by the Fund are reduced by an amount equal to its pro-rata share of advisory and administration fees paid by the Morgan Stanley Institutional Liquidity Money Market Portfolio. For the six months ended June 30, 2008, advisory fees paid were reduced by approximately $17,000 relating to the Fund’s investment in the Morgan Stanley Institutional Liquidity Money Market Portfolio.
A summary of the Fund’s transactions in shares of the affiliated issuer during the six months ended June 30, 2008 is as follows:
Market Value | | | | | | | | | |
December 31, | | Purchases | | Sales | | Dividend | | Market Value | |
2007 | | at Cost | | Proceeds | | Income | | June 30, 2008 | |
(000) | | (000) | | (000) | | (000) | | (000) | |
$49,633 | | $95,918 | | $105,424 | | $553 | | $40,127 | |
During the six months ended June 30, 2008, the Fund made purchases and sales totaling approximately $173,383,000 and $242,071,000 respectively, of investment securities other than long-term U.S. Government securities and short-term investments. There were no purchases or sales of long-term U.S. Government securities.
During the six months ended June 30, 2008, the Fund paid approximately $111,000 of brokerage commissions to Morgan Stanley & Co. Incorporated, an affiliated broker/dealer.
Additionally, during the six months ended June 30, 2008, the Fund paid approximately $48,000 in brokerage commissions to China International Capital Corporation (Hong Kong) Limited (CICC), an affiliated broker/dealer.
H. Other: On January 23, 1998, the Fund commenced a share repurchase program for purposes of enhancing stockholder value and reducing the discount at which the Fund’s shares trade from their net asset value. For the six months ended June 30, 2008, the Fund repurchased 673,948 of its shares at an average discount of 12.95% from net asset value per share. Since the inception of the program, the Fund has repurchased 17,637,148 of its shares at an average discount of 18.75% from net asset value per share. The Fund expects to continue to repurchase its outstanding shares at such time and in such amounts as it believes will further the accomplishment of the foregoing objectives, subject to review by the Directors.
On June 20, 2008, the Officers of the Fund, pursuant to authority granted by the Directors, declared a distribution of $0.0001 per share, derived from net investment income, and $0.6555 per share, derived from capital gains, payable on July 15, 2008, to stockholders of record on June 30, 2008.
I. Supplemental Proxy Information: On June 19, 2008, an annual meeting of the Fund’s stockholders was held for the purpose of voting on the following matter, the results of which were as follows:
Election of Directors by all stockholders:
| | For | | Withhold | |
Kathleen A. Dennis | | 23,276,620 | | 2,414,318 | |
Joseph J. Kearns | | 21,969,837 | | 3,721,101 | |
Michael E. Nugent | | 21,965,075 | 3,725,863 | |
Fergus Reid | | 23,331,839 | | 2,359,099 | |
19
| Morgan Stanley Asia-Pacific Fund, Inc. |
| |
| June 30, 2008 (unaudited) |
| |
Notes to Financial Statements (cont’d) | |
For More Information About Portfolio Holdings
The Fund provides a complete schedule of portfolio holdings in its semi-annual and annual reports within 60 days of the end of the Fund’s second and fourth fiscal quarters. The semi-annual reports and the annual reports are filed electronically with the Securities and Exchange Commission (SEC) on Form N-CSRS and Form N-CSR, respectively. Morgan Stanley also delivers the semi-annual and annual reports to Fund stockholders and makes these reports available on its public website, www.morganstanley.com/msim. Each Morgan Stanley fund also files a complete schedule of portfolio holdings with the SEC for the Fund’s first and third fiscal quarters on Form N-Q. Morgan Stanley does not deliver the reports for the first and third fiscal quarters to stockholders, nor are the reports posted to the Morgan Stanley public website. You may, however, obtain the Form N-Q filings (as well as the Form N-CSR and N-CSRS filings) by accessing the SEC’s website, www.sec.gov. You may also review and copy them at the SEC’s public reference room in Washington, DC. Information on the operation of the SEC’s Public Reference Room may be obtained by calling the SEC at 1(800) SEC-0330. You can also request copies of these materials, upon payment of a duplicating fee, by electronic request at the SEC’s e-mail address (publicinfo@sec.gov) or by writing the public reference section of the SEC, Washington, DC 20549-0102.
In addition to filing a complete schedule of portfolio holdings with the SEC each fiscal quarter, the Fund makes portfolio holdings information available by periodically providing the information on its public website, www.morganstanley.com/msim.
The Fund provides a complete schedule of portfolio holdings on the public website on a calendar-quarter basis approximately 31 calendar days after the close of the calendar quarter. The Fund also provides Top 10 holdings information on the public website approximately 15 business days following the end of each month. You may obtain copies of the Fund’s monthly or calendar-quarter website postings, by calling 1(800) 231-2608.
Proxy Voting Policy and Procedures and Proxy Voting Record
A copy of (1) the Fund’s policies and procedures with respect to the voting of proxies relating to the Fund’s portfolio securities; and (2) how the Fund voted proxies relating to portfolio securities during the most recent twelve-month period ended June 30, is available without charge, upon request, by calling 1(800) 548-7786 or by visiting our website at www.morganstanley.com/msim. This information is also available on the SEC’s website at www.sec.gov.
20
| Morgan Stanley Asia-Pacific Fund, Inc. |
| |
Dividend Reinvestment and Cash Purchase Plan | |
Pursuant to the Dividend Reinvestment and Cash Purchase Plan (the “Plan”), each stockholder will be deemed to have elected, unless Computershare Trust Company, N.A. (the “Plan Agent”) is otherwise instructed by the stockholder in writing, to have all distributions automatically reinvested in Fund shares. Participants in the Plan have the option of making additional voluntary cash payments to the Plan Agent, annually, in any amount from $100 to $3,000, for investment in Fund shares.
Dividend and capital gain distributions will be reinvested on the reinvestment date in full and fractional shares. If the market price per share equals or exceeds net asset value per share on the reinvestment date, the Fund will issue shares to participants at net asset value or, if net asset value is less than 95% of the market price on the reinvestment date, shares will be issued at 95% of the market price. If net asset value exceeds the market price on the reinvestment date, participants will receive shares valued at market price. The Fund may purchase shares of its Common Stock in the open market in connection with dividend reinvestment requirements at the discretion of the Board of Directors. Should the Fund declare a dividend or capital gain distribution payable only in cash, the Plan Agent will purchase Fund shares for participants in the open market as agent for the participants.
The Plan Agent’s fees for the reinvestment of dividends and distributions will be paid by the Fund. However, each participant’s account will be charged a pro rata share of brokerage commissions incurred on any open market purchases effected on such participant’s behalf. A participant will also pay brokerage commissions incurred on purchases made by voluntary cash payments. Although stockholders in the Plan may receive no cash distributions, participation in the Plan will not relieve participants of any income tax which may be payable on such dividends or distributions.
In the case of stockholders, such as banks, brokers or nominees, that hold shares for others who are the beneficial owners, the Plan Agent will administer the Plan on the basis of the number of shares certified from time to time by the stockholder as representing the total amount registered in the stockholder’s name and held for the account of beneficial owners who are participating in the Plan.
Stockholders who do not wish to have distributions automatically reinvested should notify the Plan Agent in writing. There is no penalty for non-participation or withdrawal from the Plan, and stockholders who have previously withdrawn from the Plan may rejoin at any time. Requests for additional information or any correspondence concerning the Plan should be directed to the Plan Agent at:
Morgan Stanley Asia-Pacific Fund, Inc.
Computershare Trust Company, N.A.
P.O. Box 43078
Providence, Rhode Island 02940-3078
1(800) 231-2608
21
| Morgan Stanley Asia-Pacific Fund, Inc. |
| |
Morgan Stanley Institutional Closed-End Funds An Important Notice Concerning Our U.S. Privacy Policy (unaudited) | |
We are required by federal law to provide you with a copy of our Privacy Policy annually.
The following Policy applies to current and former individual investors in Morgan Stanley Institutional closed-end funds. This Policy is not applicable to partnerships, corporations, trusts or other non-individual clients or account holders. Please note that we may amend this Policy at any time, and will inform you of any changes to this Policy as required by law.
We Respect Your Privacy
We appreciate that you have provided us with your personal financial information. We strive to maintain the privacy of such information while we help you achieve your financial objectives. This Policy describes what non-public personal information we collect about you, why we collect it, and when we may share it with others. We hope this Policy will help you understand how we collect and share non-public personal information that we gather about you. Throughout this Policy, we refer to the non-public information that personally identifies you or your accounts as ‘‘personal information.’’
1. What Personal Information Do We Collect About You?
To serve you better and manage our business, it is important that we collect and maintain accurate information about you. We may obtain this information from applications and other forms you submit to us, from your dealings with us, from consumer reporting agencies, from our Web sites and from third parties and other sources.
For example:
· We may collect information such as your name, address, e-mail address, telephone/fax numbers, assets, income and investment objectives through applications and other forms you submit to us.
· We may obtain information about account balances, your use of account(s) and the types of products and services you prefer to receive from us through your dealings and transactions with us and other sources.
· We may obtain information about your creditworthiness and credit history from consumer reporting agencies.
· We may collect background information from and through third-party vendors to verify representations you have made and to comply with various regulatory requirements.
· If you interact with us through our public and private Web sites, we may collect information that you provide directly through online communications (such as an e-mail address). We may also collect information about your Internet service provider, your domain name, your computer’s operating system and Web browser, your use of our Web sites and your product and service preferences, through the use of “cookies.” “Cookies” recognize your computer each time you return to one of our sites, and help to improve our sites’ content and personalize your experience on our sites by, for example, suggesting offerings that may interest you. Please consult the Terms of Use of these sites for more details on our use of cookies.
2. When Do We Disclose Personal Information We Collect About You?
To provide you with the products and services you request, to serve you better and to manage our business, we may disclose personal information we collect about you to our affiliated companies and to non-affiliated third parties as required or permitted by law.
A. Information We Disclose to Our Affiliated Companies. We do not disclose personal information that we collect about you to our affiliated companies except to enable them to provide services on our behalf or as otherwise required or permitted by law.
22
| Morgan Stanley Asia-Pacific Fund, Inc. |
| |
Morgan Stanley Institutional Closed-End Funds An Important Notice Concerning Our U.S. Privacy Policy (cont’d) | |
B. Information We Disclose to Third Parties. We do not disclose personal information that we collect about you to non- affiliated third parties except to enable them to provide services on our behalf, to perform joint marketing agreements with other financial institutions, or as otherwise required or permitted by law. For example, some instances where we may disclose information about you to nonaffiliated third parties include: for servicing and processing transactions, to offer our own products and services, to protect against fraud, for institutional risk control, to respond to judicial process or to perform services on our behalf. When we share personal information with these companies, they are required to limit their use of personal information to the particular purpose for which it was shared and they are not allowed to share personal information with others except to fulfill that limited purpose.
3. How Do We Protect the Security and Confidentiality of Personal Information We Collect About You?
We maintain physical, electronic and procedural security measures to help safeguard the personal information we collect about you. We have internal policies governing the proper handling of client information. Third parties that provide support or marketing services on our behalf may also receive personal information, and we require them to adhere to confidentiality standards with respect to such information.
23
Morgan Stanley Asia-Pacific Fund, Inc.
Directors | |
Michael E. Nugent | Kevin Klingert |
| Vice President |
Frank L. Bowman | |
| Dennis F. Shea |
Michael Bozic | Vice President |
| |
Kathleen A. Dennis | Amy R. Doberman |
| Vice President |
James F. Higgins | |
| Stefanie V. Chang Yu |
Dr. Manuel H. Johnson | Vice President |
| |
Joseph J. Kearns | James W. Garrett |
| Treasurer and Chief |
Michael F. Klein | Financial Officer |
| |
W. Allen Reed | Carsten Otto |
| Chief Compliance Officer |
Fergus Reid | |
| Mary E. Mullin |
Officers | Secretary |
Michael E. Nugent | |
Chairman of the Board and | |
Director | |
| |
Ronald E. Robison | |
President and Principal | |
Executive Officer | |
Investment Adviser and Administrator
Morgan Stanley Investment Management Inc.
522 Fifth Avenue
New York, New York 10036
Custodian
JPMorgan Chase Bank, N.A.
270 Park Avenue
New York, New York 10017
Stockholder Servicing Agent
Computershare Trust Company, N.A.
250 Royall Street
Canton, Massachusetts 02021
Legal Counsel
Clifford Chance US LLP
31 West 52nd Street
New York, New York 10019-6131
Independent Registered Public Accounting Firm
Ernst & Young LLP
200 Clarendon Street
Boston, Massachusetts 02116
For additional Fund information, including the Fund’s net asset value per share and information regarding the investments comprising the Fund’s portfolio, please call 1(800) 231-2608 or visit our website at www.morganstanley.com/msim. All investments involve risks, including the possible loss of principal.
© 2008 Morgan Stanley
CEAPFSAN IU08-04292I-Y06/08
Item 2. Code of Ethics.
Not applicable for semiannual reports.
Item 3. Audit Committee Financial Expert.
Not applicable for semiannual reports.
Item 4. Principal Accountant Fees and Services
Not applicable for semiannual reports.
Item 5. Audit Committee of Listed Registrants.
Not applicable for semiannual reports.
Item 6. Schedule of Investments
(a) Refer to Item 1.
(b) Not used.
Item 7. Disclosure of Proxy Voting Policies and Procedures for Closed-End Management Investment Companies.
Not applicable for semiannual reports.
Item 8. Portfolio Managers of Closed-End Management Investment Companies
Applicable only to annual reports filed by closed-end funds.
Item 9. Closed-End Fund Repurchases
Morgan Stanley Asia-Pacific Fund, Inc.*
| | | | | | TOTAL NUMBER OF
SHARES PURCHASED
AS
PART OF PUBLICLY | | MAXIMUM NUMBER
OF SHARES THAT MAY
YET
BE PURCHASED UNDER | |
Period | | TOTAL NUMBER OF
SHARES PURCHASED | | AVERAGE PRICE
PAID PER SHARE | | ANNOUNCED PLANS
OR PROGRAMS | | THE PLANS OR
PROGRAMS | |
January | | 94,218 | | $ | 18.71 | | 94,218 | | Unlimited | |
February | | 198,607 | | $ | 19.21 | | 198,607 | | Unlimited | |
March | | 161,923 | | $ | 18.32 | | 161,923 | | Unlimited | |
April | | 131,900 | | $ | 19.09 | | 131,900 | | Unlimited | |
May | | 87,300 | | $ | 20.03 | | 87,300 | | Unlimited | |
June | | — | | $ | — | | — | | Unlimited | |
* The Share Repurchase Program commenced on 1/23/1998.
The Fund expects to continue to repurchase its outstanding shares at such time and in such amounts as it believes will further the accomplishment of the foregoing objectives, subject to review by the Board of Directors.
Item 10. Submission of Matters to a Vote of Security Holders
Not applicable.
Item 11. Controls and Procedures
(a) The Fund’s principal executive officer and principal financial officer have concluded that the Fund’s disclosure controls and procedures are sufficient to ensure that information required to be disclosed by the Fund in this Form N-CSR was recorded, processed, summarized and reported within the time periods specified in the Securities and Exchange Commission’s rules and forms, based upon such officers’ evaluation of these controls and procedures as of a date within 90 days of the filing date of the report.
(b) There were no changes in the registrant’s internal control over financial reporting that occurred during the second fiscal quarter of the period that has materially affected, or is reasonably likely to materially affect, the registrant’s internal control over financial reporting.
Item 12. Exhibits
(a) Code of Ethics - Not applicable for semiannual reports.
(b) A separate certification for each principal executive officer and principal financial officer of the registrant are attached hereto as part of EX-99.CERT.
SIGNATURES
Pursuant to the requirements of the Securities Exchange Act of 1934 and the Investment Company Act of 1940, the registrant has duly caused this report to be signed on its behalf by the undersigned, thereunto duly authorized.
(Registrant) | Morgan Stanley Asia-Pacific Fund, Inc. | |
|
|
By: | /s/ Ronald E. Robison | |
Name: | Ronald E. Robison |
Title: | Principal Executive Officer |
Date: | August 15, 2008 |
| | | | | |
Pursuant to the requirements of the Securities Exchange Act of 1934 and the Investment Company Act of 1940, this report has been signed by the following persons on behalf of the registrant and in the capacities and on the dates indicated.
By: | /s/ Ronald E. Robison | |
Name: | Ronald E. Robison |
Title: | Principal Executive Officer |
Date: | August 15, 2008 |
| |
| |
By: | /s/ James W. Garrett | |
Name: | James W. Garrett |
Title: | Principal Financial Officer |
Date: | August 15, 2008 |
| | | |