UNITED STATES
SECURITIES AND EXCHANGE COMMISSION
Washington, D.C. 20549
FORM N-CSR
CERTIFIED SHAREHOLDER REPORT OF REGISTERED
MANAGEMENT INVESTMENT COMPANIES
Investment Company Act File Number: 811-07153
| T. Rowe Price Fixed Income Series, Inc. |
| (Exact name of registrant as specified in charter) |
| 100 East Pratt Street, Baltimore, MD 21202 |
| (Address of principal executive offices) |
| David Oestreicher |
| 100 East Pratt Street, Baltimore, MD 21202 |
| (Name and address of agent for service) |
Registrant’s telephone number, including area code: (410) 345-2000
Date of fiscal year end: December 31
Date of reporting period: December 31, 2017
 |
| Limited-Term Bond Portfolio | December 31, 2017 |
| Highlights |
| ● | Short-term Treasury yields increased more than those on longer-dated maturities as the Federal Reserve raised its federal funds target rate. The yield curve flattened through much of the period amid expectations for further rate increases in line with stronger growth. |
| ● | The Limited-Term Bond Portfolio outperformed the Bloomberg Barclays 1–3 Year U.S. Government/Credit Bond Index during the 12-month period but underperformed the Lipper peer group average. |
| ● | The portfolio’s strategic underweight to U.S. Treasuries and corresponding overweight to investment-grade corporate debt benefited results as investors maintained their willingness to add risk. |
| ● | While future rate increases could pressure shorter-dated securities, we expect that investor demand for high-quality, higher-yielding securities with lower interest rate risk should be supportive. |
The views and opinions in this report were current as of December 31, 2017. They are not guarantees of performance or investment results and should not be taken as investment advice. Investment decisions reflect a variety of factors, and the managers reserve the right to change their views about individual stocks, sectors, and the markets at any time. As a result, the views expressed should not be relied upon as a forecast of the fund’s future investment intent. The report is certified under the Sarbanes-Oxley Act, which requires mutual funds and other public companies to affirm that, to the best of their knowledge, the information in their financial reports is fairly and accurately stated in all material respects.
Manager’s Letter
T. Rowe Price Limited-Term Bond Portfolio
Dear Investor
We maintained our overweight to investment-grade corporate debt, given the possibility that economic growth may get a boost from increased spending and deregulation under the Trump administration. Along with increasing exposure to other market segments with more attractive yields, these allocation decisions helped your portfolio outperform its benchmark as Treasuries and other high-quality bonds underperformed.
Performance
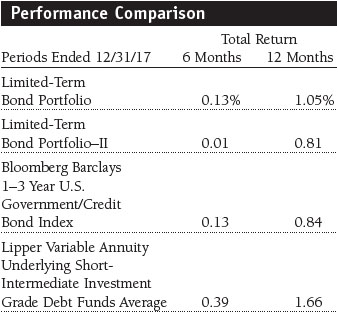
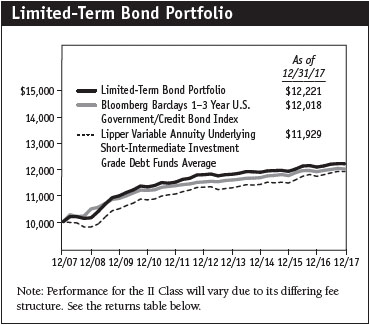
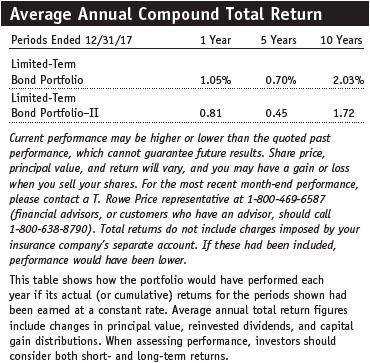
Your portfolio returned 1.05% during the 12 months ended December 31, 2017, outperforming its benchmark, the Bloomberg Barclays 1–3 Year U.S. Government/Credit Bond Index, which returned 0.84%. The portfolio underperformed the 1.66% return of our Lipper peer group average. (Performance for the Portfolio–II was slightly lower, reflecting its different expense ratio.)
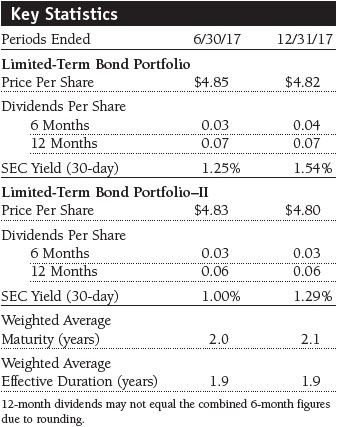
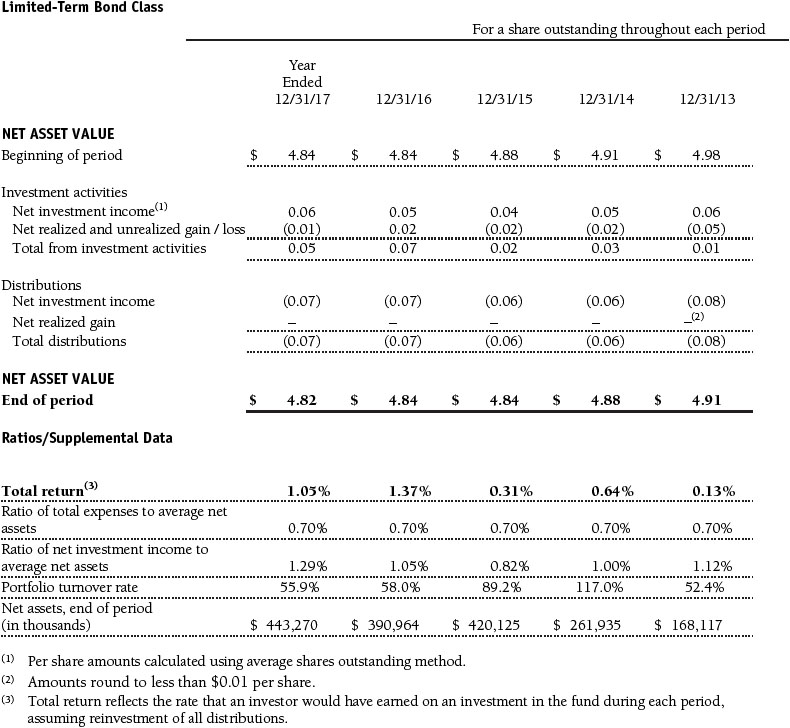
The portfolio’s net asset value ended the reporting period at $4.82, down from $4.84 at the end of 2016. Dividends contributed $0.07 per share during the 12-month period.
Economy and Interest Rates
The U.S. economy grew at an annualized pace of 3.3% in the third quarter and was on track to expand about 2% for the full year 2017. The solid growth, combined with strong employment and signs that inflation could be accelerating, prompted the Federal Reserve to raise its federal funds target rate three times during the period, bringing the fed funds target rate to the 1.25% to 1.50% range. The central bank also indicated that three more rate hikes would likely follow in 2018. Adding to upward rate pressure during the period, the Fed began to slowly unwind its $4.5 trillion balance sheet built up as part of its quantitative easing measures put in place in the aftermath of the 2008 financial crisis.
Short-term Treasury yields increased in the 12-month period ended December 31, 2017, as the market responded to the Fed’s rate hikes and anticipated that interest rate increases would continue at a gradual pace in 2018.
The shorter-term Treasury yield curve, especially between two- and five-year notes, flattened as short-maturity rates increased more than longer-term yields. The yield on the two-year Treasury note began the period at 1.20% and rose to 1.89%, while the yield on the five-year Treasury began the period at 1.93% and rose to 2.20%. (Bond prices and yields move in opposite directions.)
Companies continued to issue debt at a fast pace. However, technical conditions remained healthy with strong demand, especially from foreign buyers, absorbing the supply. Corporate bonds outperformed U.S. Treasuries of similar maturities as credit spreads compressed. Asset-backed securities (ABS) and mortgage-backed securities (MBS) gained modestly. The ABS sector was supported by strong consumer fundamentals, while the MBS sector benefited from the rise in rates that helped mitigate prepayment risk.

Portfolio Review
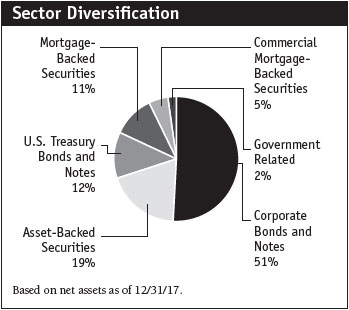
The portfolio’s strategic underweight to U.S. Treasuries and corresponding overweight to investment-grade corporate debt were the top contributors to results. Typically, we underweight lower-yielding Treasury securities and overweight investment-grade corporates for their incremental yield advantage. We maintained our out-of-benchmark exposure in the securitized sector (ABS, commercial mortgage-backed securities, and MBS), which, as noted above, benefited from the strength in the consumer and housing markets during the period.
Our exposure to short-dated corporate debt remained high, with corporate debt composing 51% of the portfolio and out-of-benchmark securitized debt accounting for 35% at the end of the reporting period. While valuations appear stretched in many areas of the markets, we continue to use the insights of our research team to find shorter-maturity securities that can produce value for investors while providing the portfolio with the needed protection—thanks to their short maturity—to withstand risk-related selling.
Security selection marginally detracted from relative results. Our holdings in short-maturity debt within the health care and automotive industries underperformed as companies in the pharmaceutical industry suffered from competitive pressures and auto sales slowed. We sold some debt of Teva Pharmaceutical Finance, which was a detractor from relative performance. In November, Fitch Ratings cut Teva’s credit rating to the below investment-grade category, citing significant operational stress that the Israeli drugmaker faced as it dealt with debt obligations that were almost three times its market value. Ford Motor Credit and General Motors Financial bonds also detracted as vehicle sales declined. Overall in 2017, sales fell 1.8% from 2016. (Please refer to the portfolio of investments for a complete list of the holdings and the amount each represents in the portfolio.)
Our yield curve positioning contributed to relative results. We increased our duration slightly during the period to 1.9 years. Our overweight to 10-year and 20-year bonds benefited results when securities with longer maturities rallied.
While we are primarily a cash bond manager, we occasionally employ the limited use of derivatives in our strategy for duration and curve management purposes. Derivatives may include futures, options, and interest-only mortgages, as well as credit default and interest rate futures. During the period, our use of interest rate futures contributed to performance.
Outlook
While uncertainties surrounding monetary policy and ongoing fiscal implementation could add to market volatility, the solid macroeconomic backdrop should remain supportive for short-term bonds. Ample global liquidity and favorable financial conditions persist despite signs from global central bank officials that years of ultra-loose monetary policy are coming to an end.
We believe that the Fed will continue to tighten monetary policy at a gradual enough pace to ensure that it does not derail the economic expansion and that it will clearly telegraph its moves to investors. While future rate increases could pressure short-term securities, we expect that investor demand for higher-yielding securities with lower duration risk should support the portfolio. Being mindful of this potential volatility, we have positioned the portfolio for a further flattening of the yield curve as short- and long-term rates continue to converge. The portfolio is focused on debt with maturities of 18 months and under. In this way we will be able to reap the benefits of coupon payments, while remaining somewhat protected in the event of a sell-off.
While the backdrop for U.S. corporate bonds remains constructive—buoyed by decent earnings and expectations for economic growth—we will be on the lookout for potential risk-off events. As always, we strive to find value and seek out securities offering reasonable yields without taking on an inordinate level of risk. Our broad diversification and research-driven approach should help us identify short-term bonds whose valuations are disconnected from credit fundamentals while helping to limit exposure to sharp swings in the market.
Thank you for investing with T. Rowe Price.
Respectfully submitted,

Michael Reinartz
President and chairman of the portfolio’s Investment Advisory Committee
January 17, 2018
The committee chairman has day-to-day responsibility for managing the portfolio and works with committee members in developing and executing the portfolio’s investment program.
| Risks of Fixed Income Investing |
Bonds are subject to interest rate risk (the decline in bond prices that usually accompanies a rise in interest rates) and credit risk (the chance that any portfolio holding could have its credit rating downgraded or that a bond issuer will default by failing to make timely payments of interest or principal), potentially reducing the portfolio’s income level and share price. Mortgage-backed securities are subject to prepayment risk, particularly if falling rates lead to heavy refinancing activity, and extension risk, which is an increase in interest rates that causes a portfolio’s average maturity to lengthen unexpectedly due to a drop in mortgage prepayments. This could increase the fund’s sensitivity to rising interest rates and its potential for price declines.
| Glossary |
Bloomberg Barclays 1–3 Year U.S. Government/Credit Bond Index: A total return index that incorporates all bonds in the Treasury Bond Index and the Agency Bond Index, as well as U.S. corporate and some foreign debentures and secured notes, with maturities of one to three years.
Credit spread: The difference between the yield on a corporate bond and a Treasury of a similar maturity.
Duration: A measure of a bond fund’s sensitivity to changes in interest rates. For example, a fund with a duration of two years would fall about 2% in price in response to a one-percentage-point rise in interest rates, and vice versa.
Fed funds rate: The interest rate charged on overnight loans of reserves by one financial institution to another in the United States. The Federal Reserve sets a target federal funds rate to affect the direction of interest rates.
Lipper averages: The averages of available mutual fund performance returns for specified time periods in categories defined by Lipper Inc.
SEC yield (30-day): A method of calculating a portfolio’s yield that assumes all portfolio securities are held until maturity. Yield will vary and is not guaranteed.
Weighted average maturity: A measure of a portfolio’s interest rate sensitivity. In general, the longer the average maturity, the greater the portfolio’s sensitivity to interest rate changes. The weighted average maturity may take into account the interest rate readjustment dates for certain securities.
Yield curve: A graphic depiction of the relationship between yields and maturity dates for a set of similar securities. A security with a longer maturity usually has a higher yield. If a short-term security offers a higher yield, then the curve is said to be “inverted.” If short-and long-term securities are offering equivalent yields, then the curve is said to be “flat.”
Note: Bloomberg Index Services Ltd. Copyright 2017, Bloomberg Index Services Ltd. Used with permission.
Performance and Expenses
T. Rowe Price Limited-Term Bond Portfolio
| Growth of $10,000 |
This chart shows the value of a hypothetical $10,000 investment in the portfolio over the past 10 fiscal year periods or since inception (for portfolios lacking 10-year records). The result is compared with benchmarks, which may include a broad-based market index and a peer group average or index. Market indexes do not include expenses, which are deducted from portfolio returns as well as mutual fund averages and indexes.
Fund Expense Example
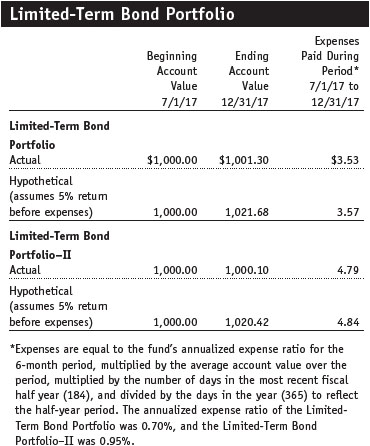
As a mutual fund shareholder, you may incur two types of costs: (1) transaction costs, such as redemption fees or sales loads, and (2) ongoing costs, including management fees, distribution and service (12b-1) fees, and other fund expenses. The following example is intended to help you understand your ongoing costs (in dollars) of investing in the fund and to compare these costs with the ongoing costs of investing in other mutual funds. The example is based on an investment of $1,000 invested at the beginning of the most recent six-month period and held for the entire period.
Shares of the fund are currently offered only through certain insurance companies as an investment medium for both variable annuity contracts and variable life insurance policies. Please note that the fund has two classes of shares: the original share class and II Class. II Class shares are sold through financial intermediaries, which are compensated for distribution, shareholder servicing, and/or certain administrative services under a Board-approved Rule 12b-1 plan.
Actual Expenses
The first line of the following table (Actual) provides information about actual account values and actual expenses. You may use the information on this line, together with your account balance, to estimate the expenses that you paid over the period. Simply divide your account value by $1,000 (for example, an $8,600 account value divided by $1,000 = 8.6), then multiply the result by the number on the first line under the heading “Expenses Paid During Period” to estimate the expenses you paid on your account during this period.
Hypothetical Example for Comparison Purposes
The information on the second line of the table (Hypothetical) is based on hypothetical account values and expenses derived from the fund’s actual expense ratio and an assumed 5% per year rate of return before expenses (not the fund’s actual return). You may compare the ongoing costs of investing in the fund with other funds by contrasting this 5% hypothetical example and the 5% hypothetical examples that appear in the shareholder reports of the other funds. The hypothetical account values and expenses may not be used to estimate the actual ending account balance or expenses you paid for the period.
You should also be aware that the expenses shown in the table highlight only your ongoing costs and do not reflect any transaction costs, such as redemption fees or sales loads. Therefore, the second line of the table is useful in comparing ongoing costs only and will not help you determine the relative total costs of owning different funds. To the extent a fund charges transaction costs, however, the total cost of owning that fund is higher.
Financial Highlights
T. Rowe Price Limited-Term Bond Portfolio
The accompanying notes are an integral part of these financial statements.
Financial Highlights
T. Rowe Price Limited-Term Bond Portfolio

The accompanying notes are an integral part of these financial statements.
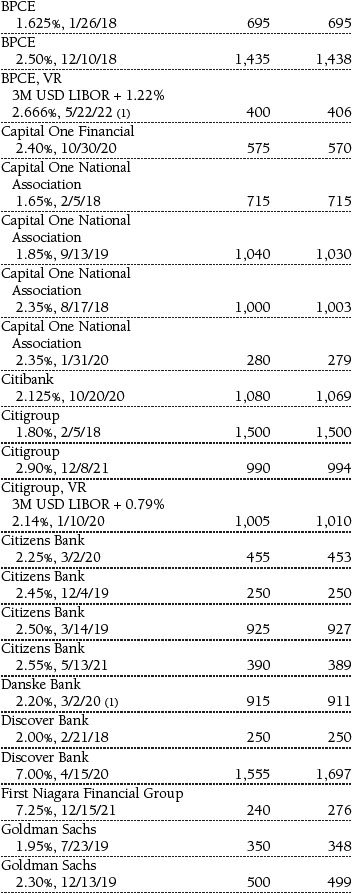
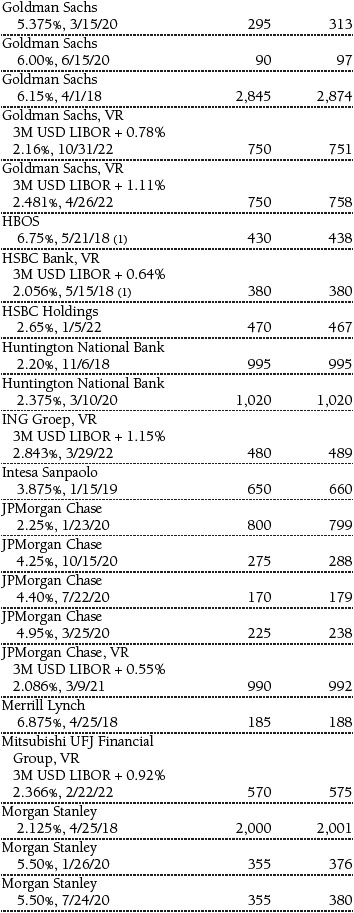
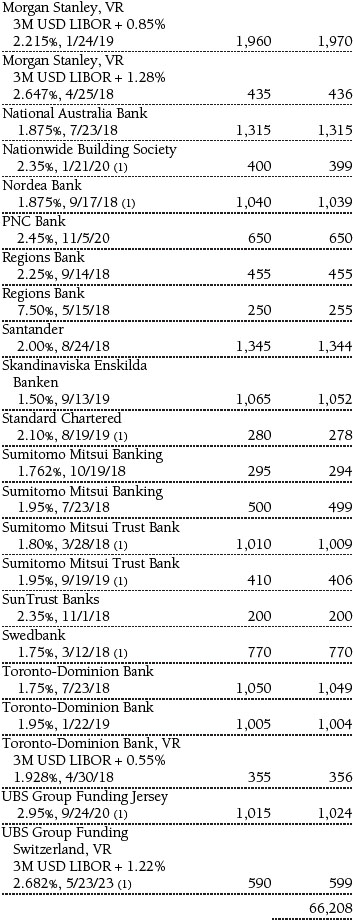
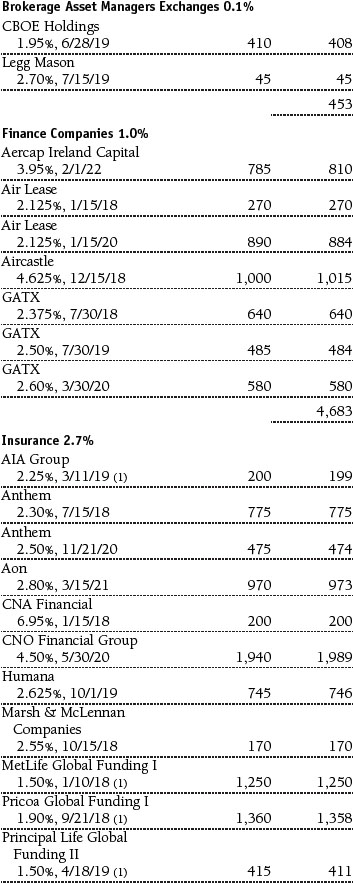
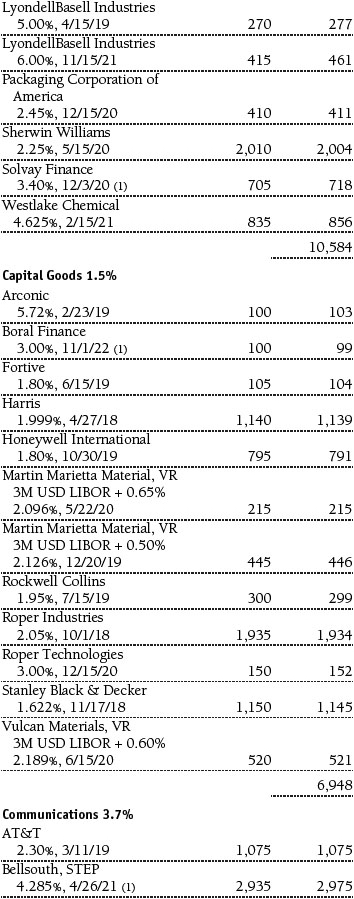
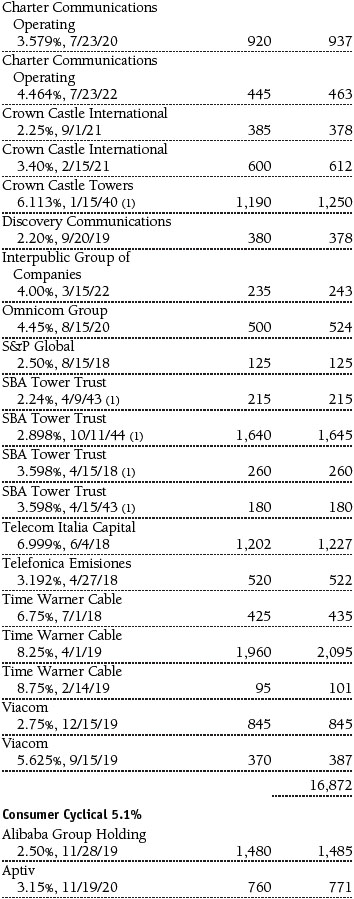
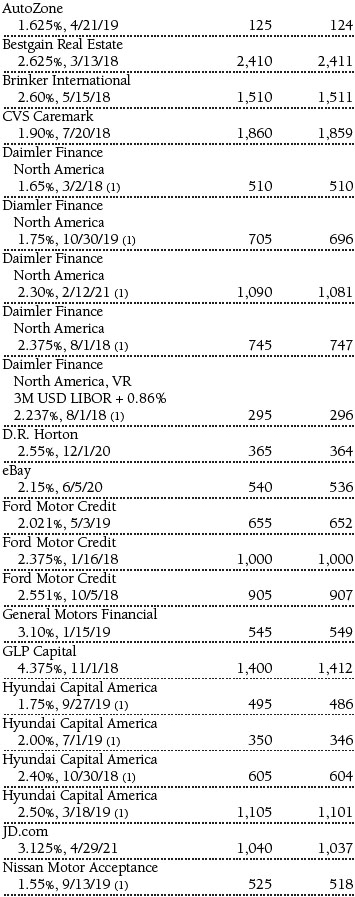
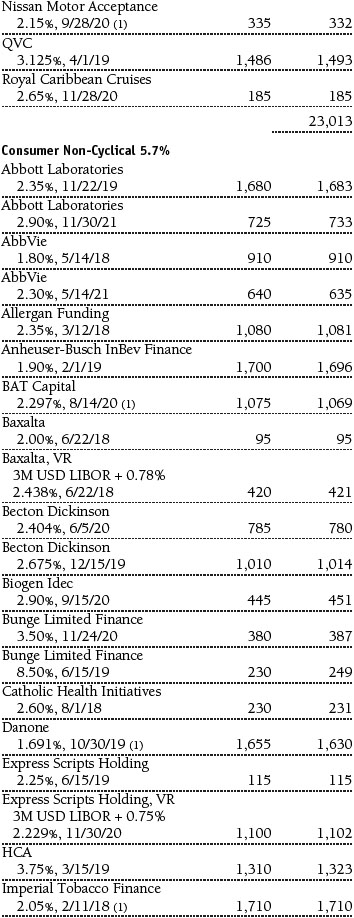
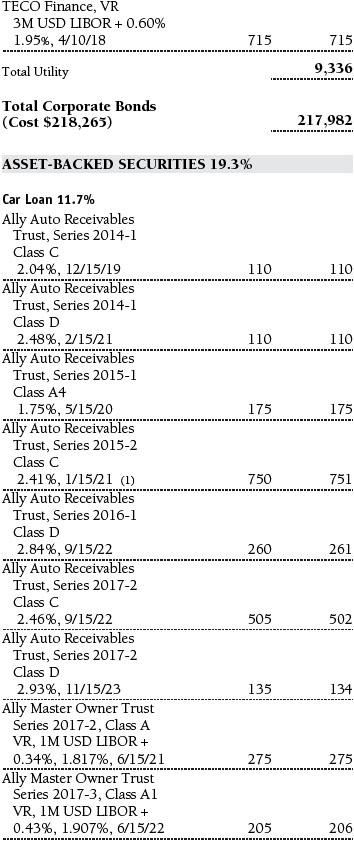
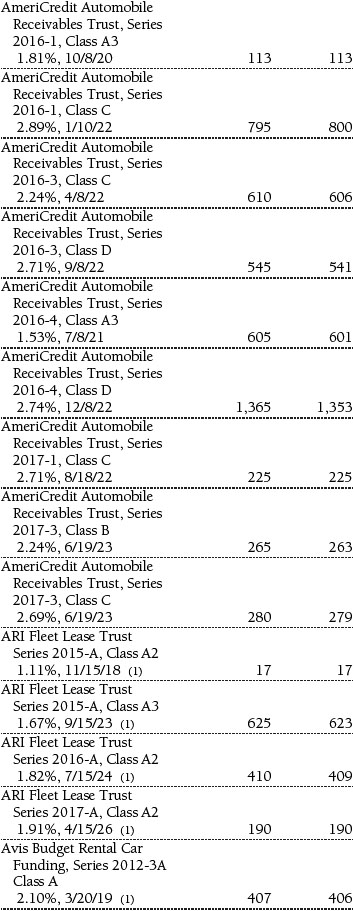
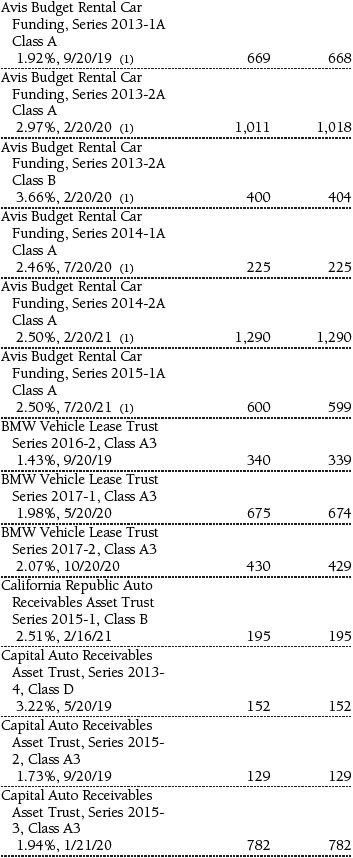
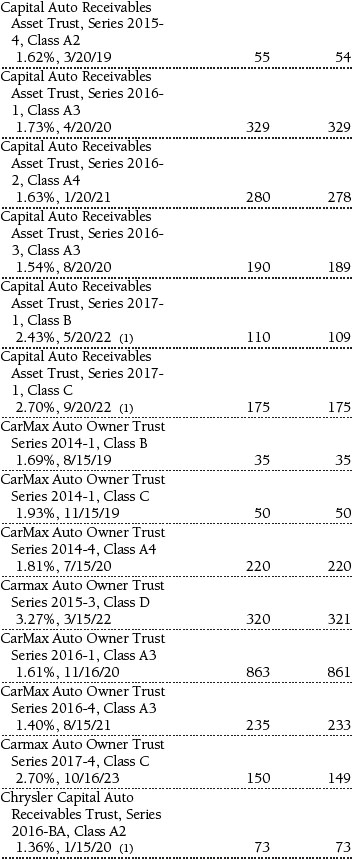
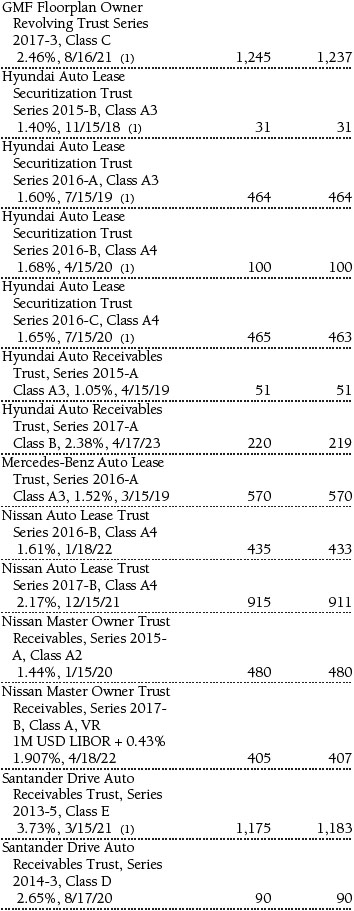
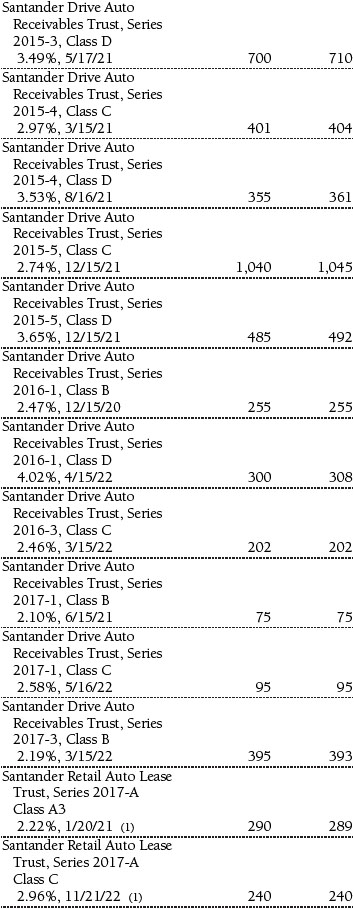
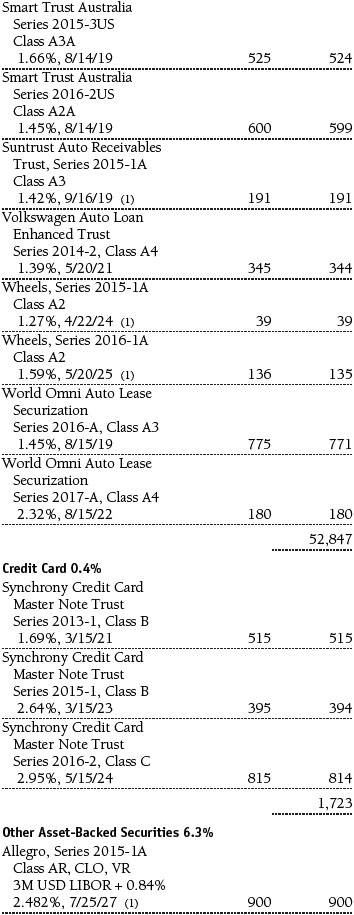
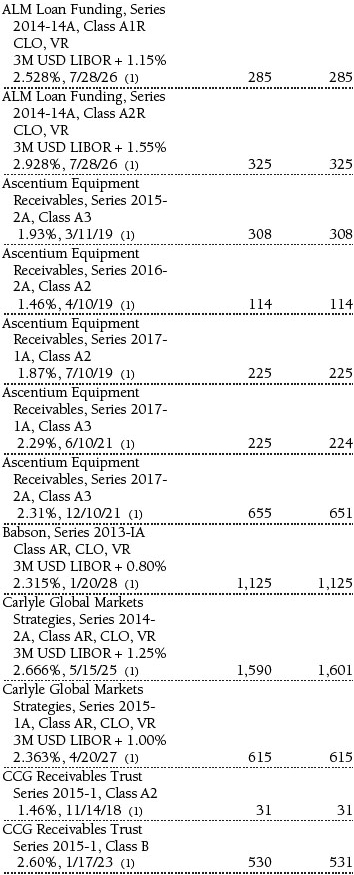
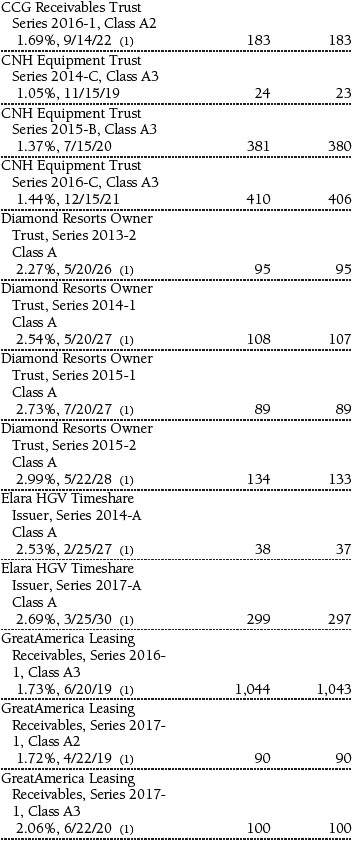
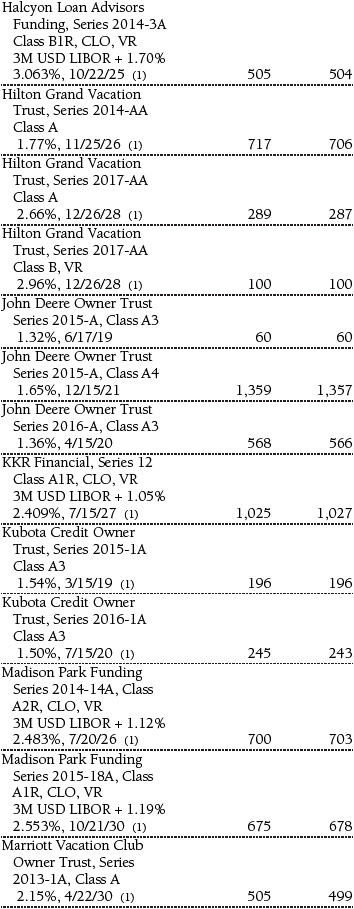
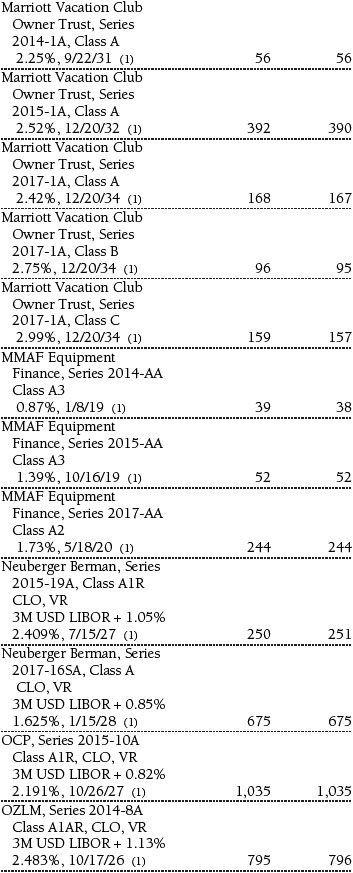
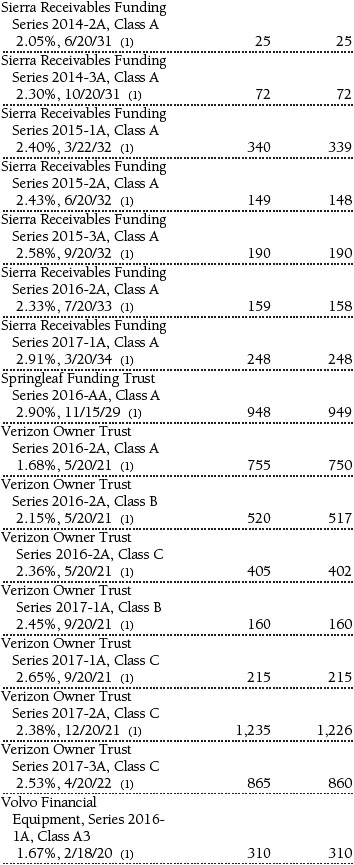
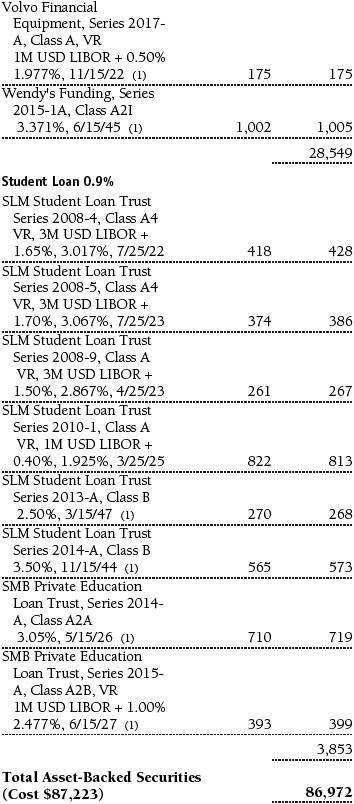
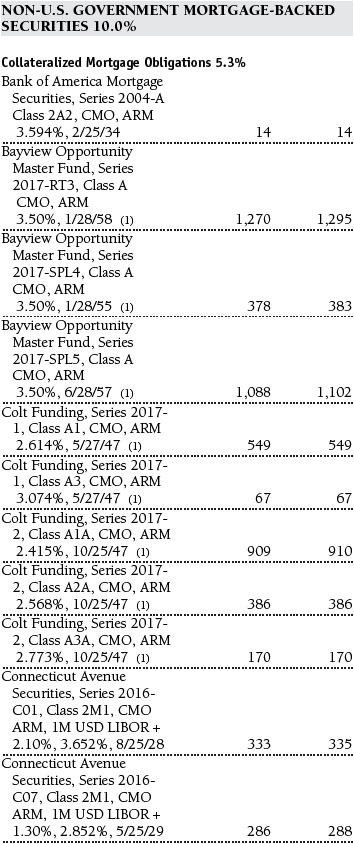
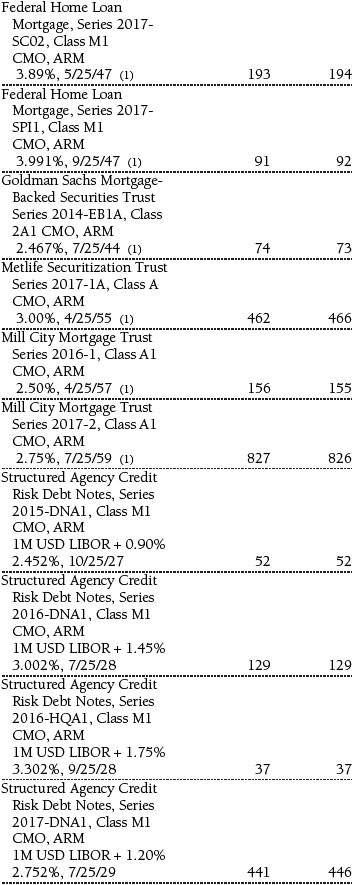
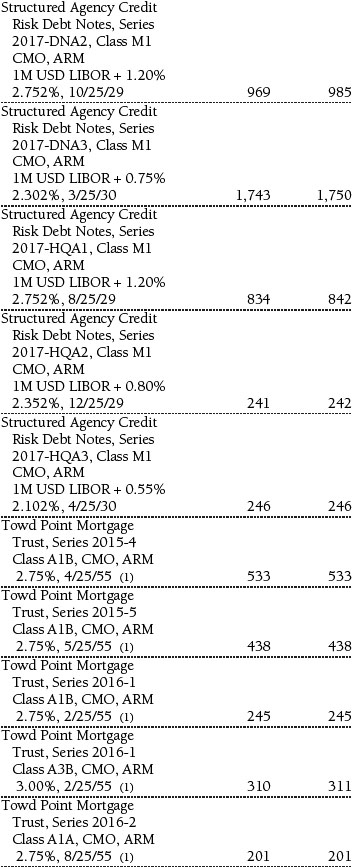
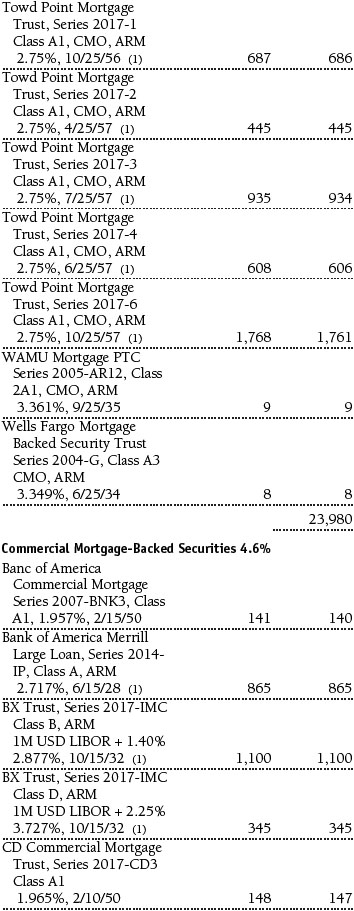
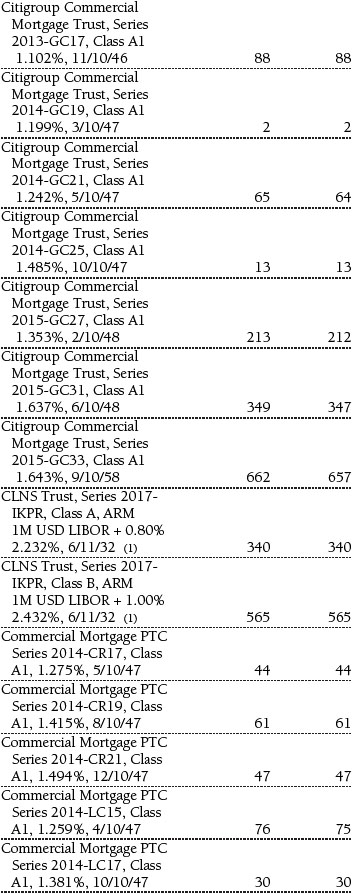
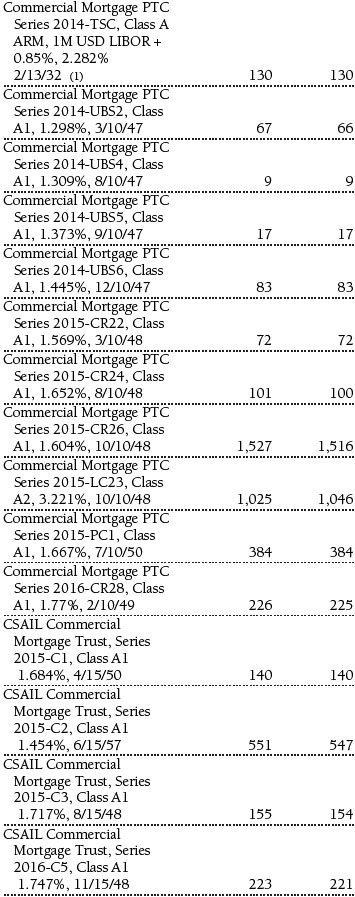
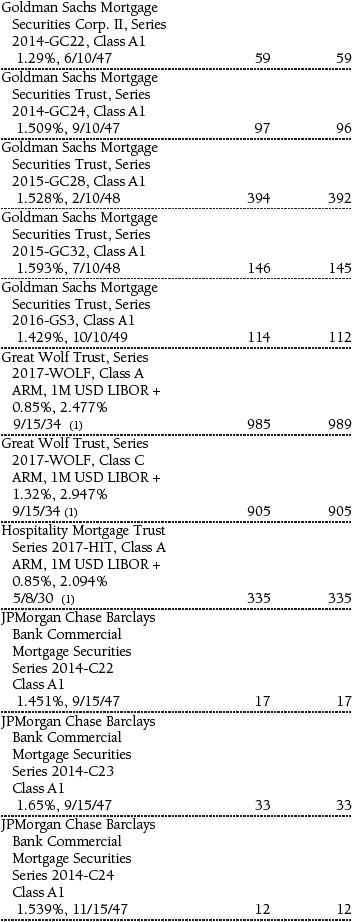
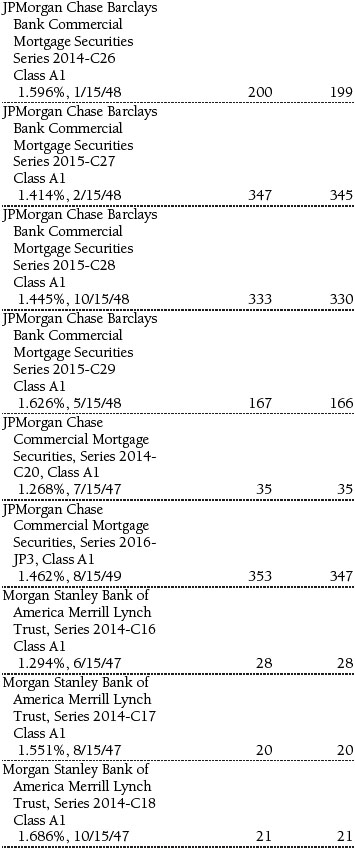
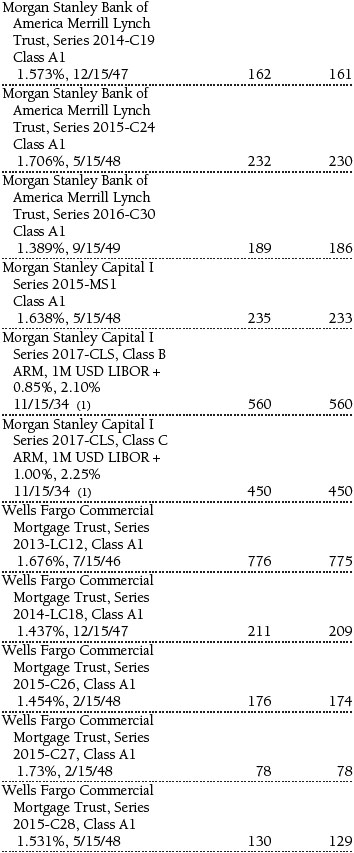
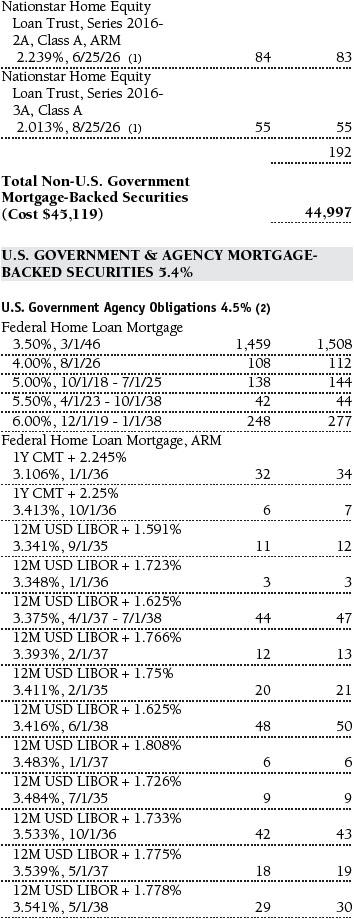
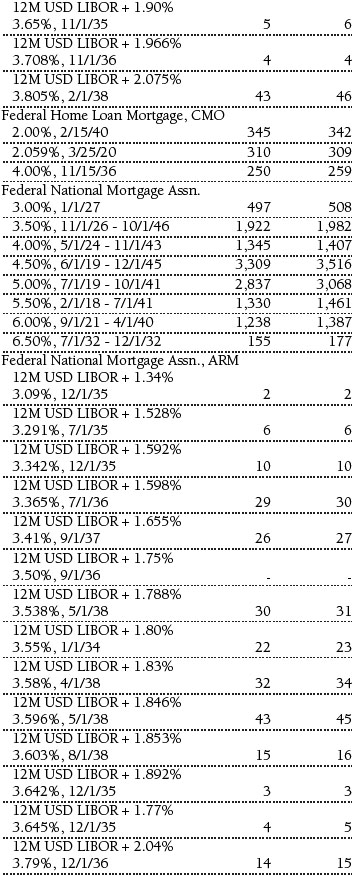
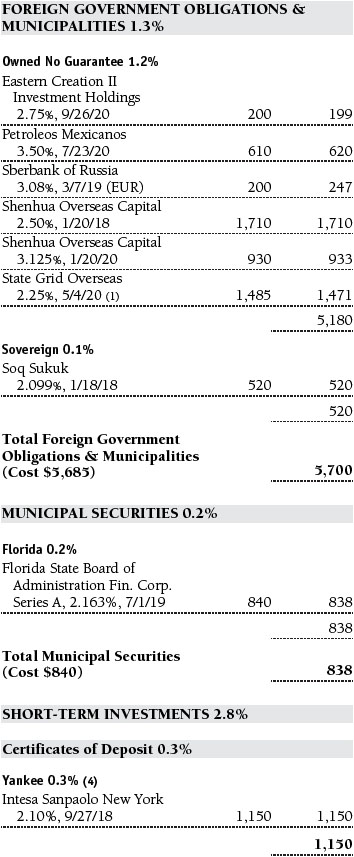
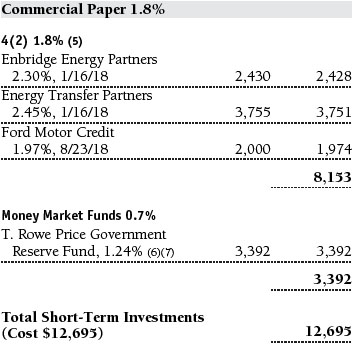
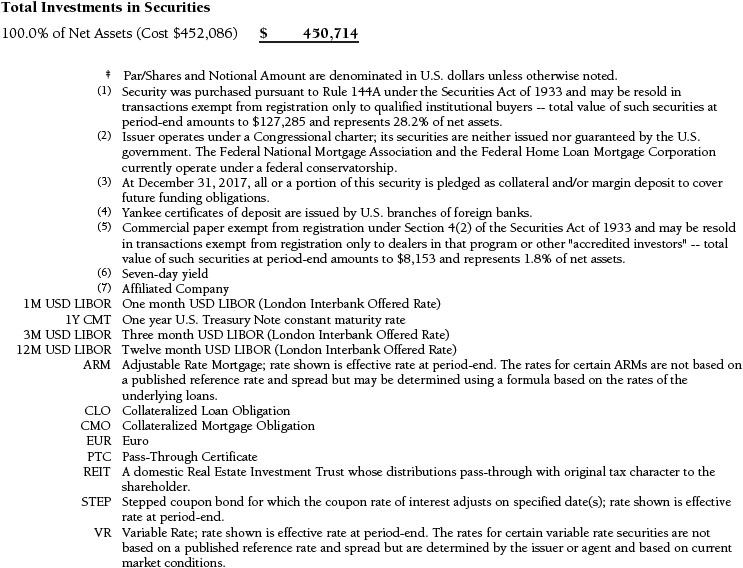
Portfolio of Investments‡
T. Rowe Price Limited-Term Bond Portfolio
December 31, 2017

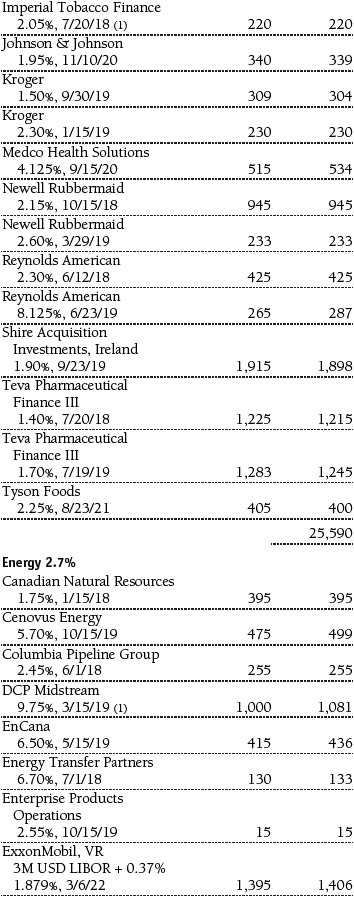
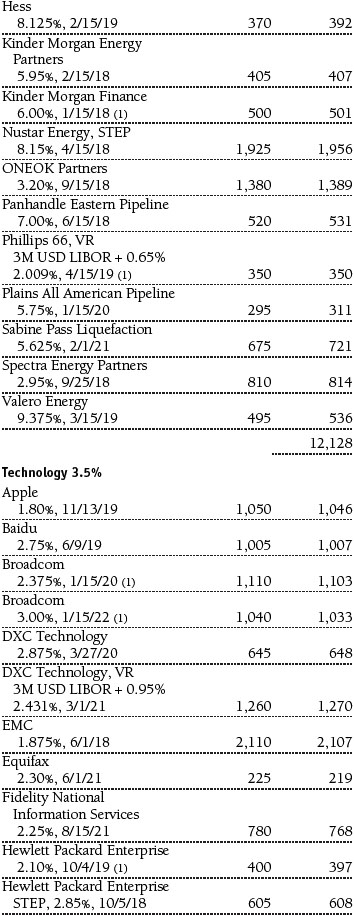
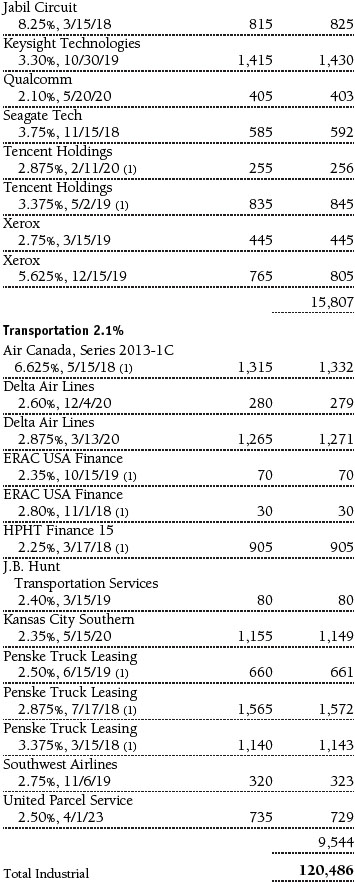
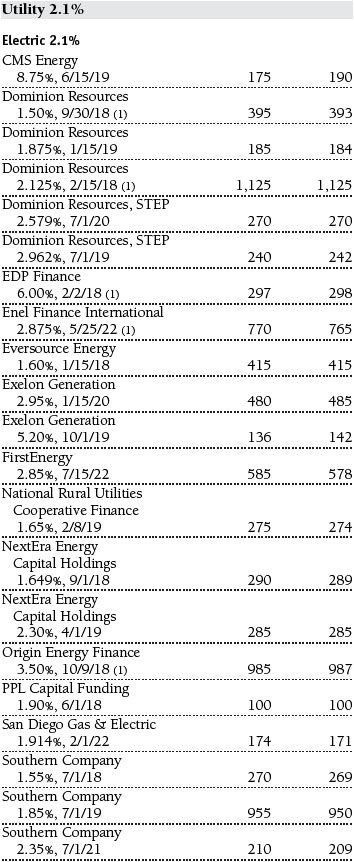


The accompanying notes are an integral part of these financial statements.
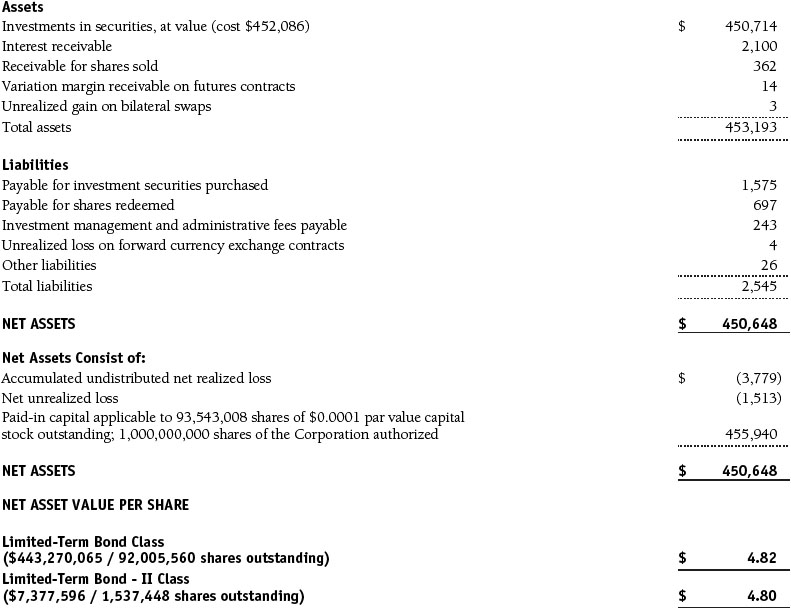
Statement of Assets and Liabilities
T. Rowe Price Limited-Term Bond Portfolio
December 31, 2017
($000s, except shares and per share amounts)
The accompanying notes are an integral part of these financial statements.
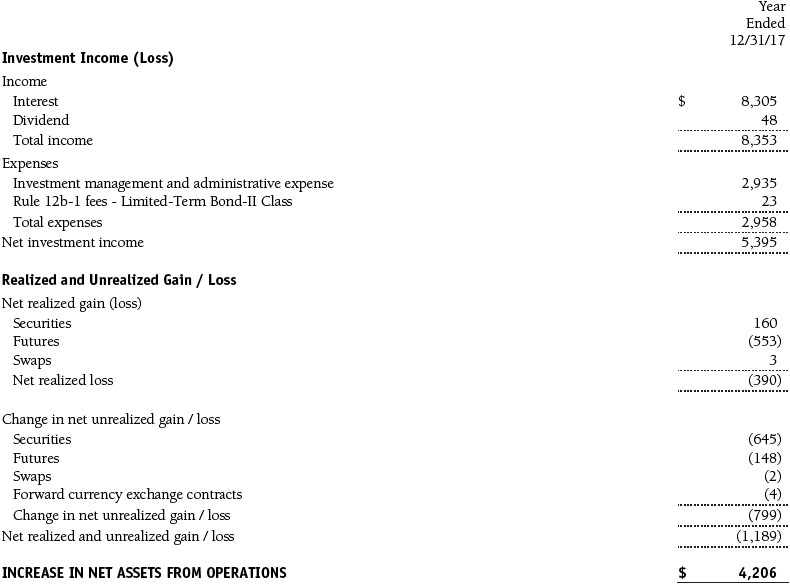
Statement of Operations
T. Rowe Price Limited-Term Bond Portfolio
($000s)
The accompanying notes are an integral part of these financial statements.
Statement of Changes in Net Assets
T. Rowe Price Limited-Term Bond Portfolio
($000s)
The accompanying notes are an integral part of these financial statements.
Notes to Financial Statements
T. Rowe Price Limited-Term Bond Portfolio
December 31, 2017
T. Rowe Price Fixed Income Series, Inc. (the corporation) is registered under the Investment Company Act of 1940 (the 1940 Act). The Limited-Term Bond Portfolio (the fund) is a diversified, open-end management investment company established by the corporation. Shares of the fund currently are offered only through certain insurance companies as an investment medium for both variable annuity contracts and variable life insurance policies. The fund seeks a high level of income consistent with moderate fluctuations in principal value. The fund has two classes of shares: the Limited-Term Bond Portfolio (Limited-Term Bond Class) and the Limited-Term Bond Portfolio–II (Limited-Term Bond-II Class). Limited-Term Bond-II Class shares are sold through financial intermediaries, which it compensates for distribution, shareholder servicing, and/or certain administrative services under a Board-approved Rule 12b-1 plan. Each class has exclusive voting rights on matters related solely to that class; separate voting rights on matters that relate to both classes; and, in all other respects, the same rights and obligations as the other class.
NOTE 1 - SIGNIFICANT ACCOUNTING POLICIES
Basis of Preparation The fund is an investment company and follows accounting and reporting guidance in the Financial Accounting Standards Board (FASB) Accounting Standards Codification Topic 946 (ASC 946). The accompanying financial statements were prepared in accordance with accounting principles generally accepted in the United States of America (GAAP), including, but not limited to, ASC 946. GAAP requires the use of estimates made by management. Management believes that estimates and valuations are appropriate; however, actual results may differ from those estimates, and the valuations reflected in the accompanying financial statements may differ from the value ultimately realized upon sale or maturity.
Investment Transactions, Investment Income, and Distributions Investment transactions are accounted for on the trade date basis. Income and expenses are recorded on the accrual basis. Realized gains and losses are reported on the identified cost basis. Premiums and discounts on debt securities are amortized for financial reporting purposes. Paydown gains and losses are recorded as an adjustment to interest income. Dividends received from mutual fund investments are reflected as dividend income; capital gain distributions are reflected as realized gain/loss. Dividend income and capital gain distributions are recorded on the ex-dividend date. Income tax-related interest and penalties, if incurred, are recorded as income tax expense. Income distributions are declared by each class daily and paid monthly. Distributions to shareholders are recorded on the ex-dividend date. A capital gain distribution may also be declared and paid by the fund annually.
Currency Translation Assets, including investments, and liabilities denominated in foreign currencies are translated into U.S. dollar values each day at the prevailing exchange rate, using the mean of the bid and asked prices of such currencies against U.S. dollars as quoted by a major bank. Purchases and sales of securities, income, and expenses are translated into U.S. dollars at the prevailing exchange rate on the respective date of such transaction. The portion of the results of operations attributable to changes in foreign exchange rates on investments is not bifurcated from the portion attributable to changes in market prices. The effect of changes in foreign currency exchange rates on realized and unrealized security gains and losses is reflected as a component of security gains and losses.
Class Accounting Investment income and investment management and administrative expense are allocated to the classes based upon the relative daily net assets of each class’s settled shares; realized and unrealized gains and losses are allocated based upon the relative daily net assets of each class’s outstanding shares. Limited-Term Bond–II Class pays Rule 12b-1 fees, in an amount not exceeding 0.25% of the class’s average daily net assets.
New Accounting Guidance In March 2017, the FASB issued amended guidance to shorten the amortization period for certain callable debt securities, held at a premium. The guidance is effective for fiscal years and interim periods beginning after December 15, 2018. Adoption will have no effect on the fund’s net assets or results of operations.
On August 1, 2017, the fund implemented amendments to Regulation S-X, issued by the Securities and Exchange Commission, which require standardized, enhanced disclosures, particularly related to derivatives, in investment company financial statements. Adoption had no effect on the fund’s net assets or results of operations.
Indemnification In the normal course of business, the fund may provide indemnification in connection with its officers and directors, service providers, and/or private company investments. The fund’s maximum exposure under these arrangements is unknown; however, the risk of material loss is currently considered to be remote.
NOTE 2 - VALUATION
The fund’s financial instruments are valued and each class’s net asset value (NAV) per share is computed at the close of the New York Stock Exchange (NYSE), normally 4 p.m. ET, each day the NYSE is open for business. However, the NAV per share may be calculated at a time other than the normal close of the NYSE if trading on the NYSE is restricted, if the NYSE closes earlier, or as may be permitted by the SEC.
Fair Value The fund’s financial instruments are reported at fair value, which GAAP defines as the price that would be received to sell an asset or paid to transfer a liability in an orderly transaction between market participants at the measurement date. The T. Rowe Price Valuation Committee (the Valuation Committee) is an internal committee that has been delegated certain responsibilities by the fund’s Board of Directors (the Board) to ensure that financial instruments are appropriately priced at fair value in accordance with GAAP and the 1940 Act. Subject to oversight by the Board, the Valuation Committee develops and oversees pricing-related policies and procedures and approves all fair value determinations. Specifically, the Valuation Committee establishes procedures to value securities; determines pricing techniques, sources, and persons eligible to effect fair value pricing actions; oversees the selection, services, and performance of pricing vendors; oversees valuation-related business continuity practices; and provides guidance on internal controls and valuation-related matters. The Valuation Committee reports to the Board and has representation from legal, portfolio management and trading, operations, risk management, and the fund’s treasurer.
Various valuation techniques and inputs are used to determine the fair value of financial instruments. GAAP establishes the following fair value hierarchy that categorizes the inputs used to measure fair value:
Level 1 – quoted prices (unadjusted) in active markets for identical financial instruments that the fund can access at the reporting date
Level 2 – inputs other than Level 1 quoted prices that are observable, either directly or indirectly (including, but not limited to, quoted prices for similar financial instruments in active markets, quoted prices for identical or similar financial instruments in inactive markets, interest rates and yield curves, implied volatilities, and credit spreads)
Level 3 – unobservable inputs
Observable inputs are developed using market data, such as publicly available information about actual events or transactions, and reflect the assumptions that market participants would use to price the financial instrument. Unobservable inputs are those for which market data are not available and are developed using the best information available about the assumptions that market participants would use to price the financial instrument. GAAP requires valuation techniques to maximize the use of relevant observable inputs and minimize the use of unobservable inputs. When multiple inputs are used to derive fair value, the financial instrument is assigned to the level within the fair value hierarchy based on the lowest-level input that is significant to the fair value of the financial instrument. Input levels are not necessarily an indication of the risk or liquidity associated with financial instruments at that level but rather the degree of judgment used in determining those values.
Valuation Techniques Debt securities generally are traded in the over-the-counter (OTC) market. Securities with remaining maturities of one year or more at the time of acquisition are valued at prices furnished by dealers who make markets in such securities or by an independent pricing service, which considers the yield or price of bonds of comparable quality, coupon, maturity, and type, as well as prices quoted by dealers who make markets in such securities. Securities with remaining maturities of less than one year at the time of acquisition generally use amortized cost in local currency to approximate fair value. However, if amortized cost is deemed not to reflect fair value or the fund holds a significant amount of such securities with remaining maturities of more than 60 days, the securities are valued at prices furnished by dealers who make markets in such securities or by an independent pricing service. Generally, debt securities are categorized in Level 2 of the fair value hierarchy; however, to the extent the valuations include significant unobservable inputs, the securities would be categorized in Level 3.
Investments in mutual funds are valued at the mutual fund’s closing NAV per share on the day of valuation and are categorized in Level 1 of the fair value hierarchy. Financial futures contracts are valued at closing settlement prices and are categorized in Level 1 of the fair value hierarchy. Forward currency exchange contracts are valued using the prevailing forward exchange rate and are categorized in Level 2 of the fair value hierarchy. Swaps are valued at prices furnished by an independent pricing service or independent swap dealers and generally are categorized in Level 2 of the fair value hierarchy; however, if unobservable inputs are significant to the valuation, the swap would be categorized in Level 3. Assets and liabilities other than financial instruments, including short-term receivables and payables, are carried at cost, or estimated realizable value, if less, which approximates fair value.
Thinly traded financial instruments and those for which the above valuation procedures are inappropriate or are deemed not to reflect fair value are stated at fair value as determined in good faith by the Valuation Committee. The objective of any fair value pricing determination is to arrive at a price that could reasonably be expected from a current sale. Financial instruments fair valued by the Valuation Committee are primarily private placements, restricted securities, warrants, rights, and other securities that are not publicly traded.
Subject to oversight by the Board, the Valuation Committee regularly makes good faith judgments to establish and adjust the fair valuations of certain securities as events occur and circumstances warrant. For instance, in determining the fair value of troubled or thinly traded debt instruments, the Valuation Committee considers a variety of factors, which may include, but are not limited to, the issuer’s business prospects, its financial standing and performance, recent investment transactions in the issuer, strategic events affecting the company, market liquidity for the issuer, and general economic conditions and events. In consultation with the investment and pricing teams, the Valuation Committee will determine an appropriate valuation technique based on available information, which may include both observable and unobservable inputs. The Valuation Committee typically will afford greatest weight to actual prices in arm’s length transactions, to the extent they represent orderly transactions between market participants, transaction information can be reliably obtained, and prices are deemed representative of fair value. However, the Valuation Committee may also consider other valuation methods such as a discount or premium from market value of a similar, freely traded security of the same issuer; discounted cash flows; yield to maturity; or some combination. Fair value determinations are reviewed on a regular basis and updated as information becomes available, including actual purchase and sale transactions of the issue. Because any fair value determination involves a significant amount of judgment, there is a degree of subjectivity inherent in such pricing decisions, and fair value prices determined by the Valuation Committee could differ from those of other market participants. Depending on the relative significance of unobservable inputs, including the valuation technique(s) used, fair valued securities may be categorized in Level 2 or 3 of the fair value hierarchy.
Valuation Inputs The following table summarizes the fund’s financial instruments, based on the inputs used to determine their fair values on December 31, 2017:
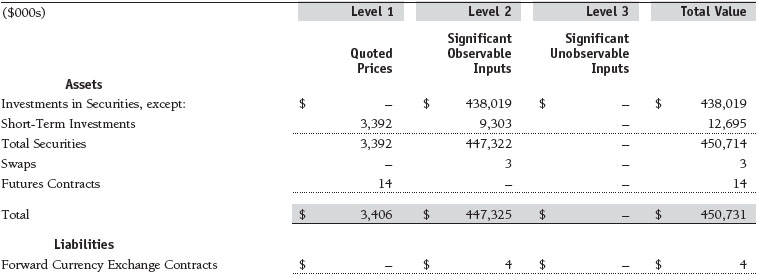
There were no material transfers between Levels 1 and 2 during the year ended December 31, 2017.
NOTE 3 - DERIVATIVE INSTRUMENTS
During the year ended December 31, 2017, the fund invested in derivative instruments. As defined by GAAP, a derivative is a financial instrument whose value is derived from an underlying security price, foreign exchange rate, interest rate, index of prices or rates, or other variable; it requires little or no initial investment and permits or requires net settlement. The fund invests in derivatives only if the expected risks and rewards are consistent with its investment objectives, policies, and overall risk profile, as described in its prospectus and Statement of Additional Information. The fund may use derivatives for a variety of purposes, such as seeking to hedge against declines in principal value, increase yield, invest in an asset with greater efficiency and at a lower cost than is possible through direct investment, or to adjust portfolio duration and credit exposure. The risks associated with the use of derivatives are different from, and potentially much greater than, the risks associated with investing directly in the instruments on which the derivatives are based. The fund at all times maintains sufficient cash reserves, liquid assets, or other SEC-permitted asset types to cover its settlement obligations under open derivative contracts.
The fund values its derivatives at fair value and recognizes changes in fair value currently in its results of operations. Accordingly, the fund does not follow hedge accounting, even for derivatives employed as economic hedges. Generally, the fund accounts for its derivatives on a gross basis. It does not offset the fair value of derivative liabilities against the fair value of derivative assets on its financial statements, nor does it offset the fair value of derivative instruments against the right to reclaim or obligation to return collateral.
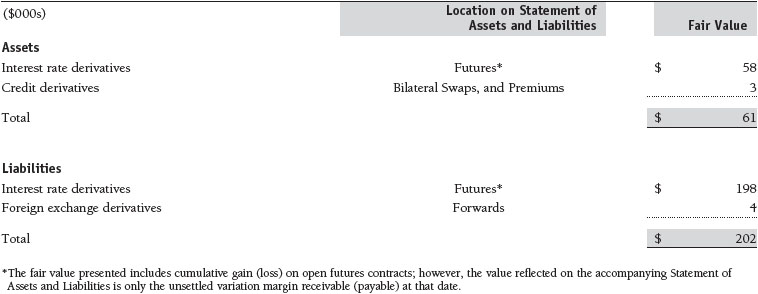
The following table summarizes the fair value of the fund’s derivative instruments held as of December 31, 2017, and the related location on the accompanying Statement of Assets and Liabilities, presented by primary underlying risk exposure:
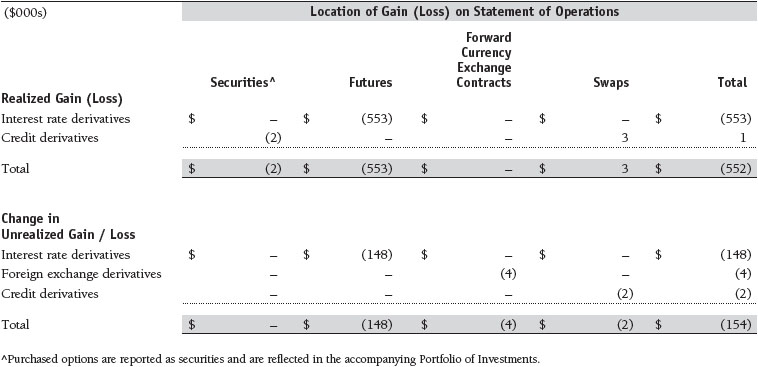
Additionally, the amount of gains and losses on derivative instruments recognized in fund earnings during the year ended December 31, 2017, and the related location on the accompanying Statement of Operations is summarized in the following table by primary underlying risk exposure:
Counterparty Risk and Collateral The fund invests in derivatives in various markets, which expose it to differing levels of counterparty risk. Counterparty risk on exchange-traded and centrally cleared derivative contracts, such as futures, exchange-traded options, and centrally cleared swaps, is minimal because the clearinghouse provides protection against counterparty defaults. For futures and centrally cleared swaps, the fund is required to deposit collateral in an amount specified by the clearinghouse and the clearing firm (margin requirement), and the margin requirement must be maintained over the life of the contract. Each clearinghouse and clearing firm, in its sole discretion, may adjust the margin requirements applicable to the fund.
Derivatives, such as bilateral swaps, forward currency exchange contracts, and OTC options, that are transacted and settle directly with a counterparty (bilateral derivatives) expose the fund to greater counterparty risk. To mitigate this risk, the fund has entered into master netting arrangements (MNAs) with certain counterparties that permit net settlement under specified conditions and, for certain counterparties, also require the exchange of collateral to cover mark-to-market exposure. MNAs may be in the form of International Swaps and Derivatives Association master agreements (ISDAs) or foreign exchange letter agreements (FX letters).
MNAs provide the ability to offset amounts the fund owes a counterparty against amounts the counterparty owes the fund (net settlement). Both ISDAs and FX letters generally allow termination of transactions and net settlement upon the occurrence of contractually specified events, such as failure to pay or bankruptcy. In addition, ISDAs specify other events, the occurrence of which would allow one of the parties to terminate. For example, a downgrade in credit rating of a counterparty would allow the fund to terminate, while a decline in the fund’s net assets of more than a specified percentage would allow the counterparty to terminate. Upon termination, all transactions with that counterparty would be liquidated and a net termination amount settled. ISDAs include collateral agreements whereas FX letters do not. Collateral requirements are determined daily based on the net aggregate unrealized gain or loss on all bilateral derivatives with a counterparty, subject to minimum transfer amounts that typically range from $100,000 to $250,000. Any additional collateral required due to changes in security values is typically transferred the same business day.
Collateral may be in the form of cash or debt securities issued by the U.S. government or related agencies. Cash posted by the fund is reflected as cash deposits in the accompanying financial statements and generally is restricted from withdrawal by the fund; securities posted by the fund are so noted in the accompanying Portfolio of Investments; both remain in the fund’s assets. Collateral pledged by counterparties is not included in the fund’s assets because the fund does not obtain effective control over those assets. For bilateral derivatives, collateral posted or received by the fund is held in a segregated account at the fund’s custodian. While typically not sold in the same manner as equity or fixed income securities, exchange-traded or centrally cleared derivatives may be closed out only on the exchange or clearinghouse where the contracts were traded, and OTC and bilateral derivatives may be unwound with counterparties or transactions assigned to other counterparties to allow the fund to exit the transaction. This ability is subject to the liquidity of underlying positions. As of December 31, 2017, no collateral was pledged by either the fund or counterparties for bilateral derivatives. As of December 31, 2017, securities valued at $220,000 had been posted by the fund for exchange-traded and/or centrally cleared derivatives.
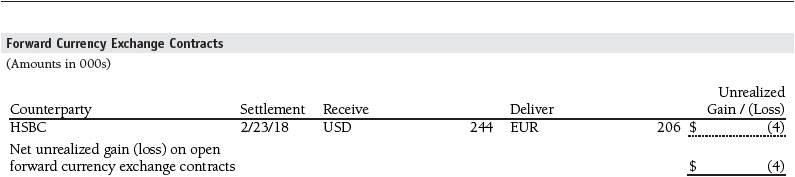
Forward Currency Exchange Contracts The fund is subject to foreign currency exchange rate risk in the normal course of pursuing its investment objectives. It uses forward currency exchange contracts (forwards) primarily to protect its non-U.S. dollar-denominated securities from adverse currency movements. A forward involves an obligation to purchase or sell a fixed amount of a specific currency on a future date at a price set at the time of the contract. Although certain forwards may be settled by exchanging only the net gain or loss on the contract, most forwards are settled with the exchange of the underlying currencies in accordance with the specified terms. Forwards are valued at the unrealized gain or loss on the contract, which reflects the net amount the fund either is entitled to receive or obligated to deliver, as measured by the difference between the forward exchange rates at the date of entry into the contract and the forward rates at the reporting date. Appreciated forwards are reflected as assets and depreciated forwards are reflected as liabilities on the accompanying Statement of Assets and Liabilities. Risks related to the use of forwards include the possible failure of counterparties to meet the terms of the agreements; that anticipated currency movements will not occur, thereby reducing the fund’s total return; and the potential for losses in excess of the fund’s initial investment. During the year ended December 31, 2017, the volume of the fund’s activity in forwards, based on underlying notional amounts, was generally less than 1% of net assets.
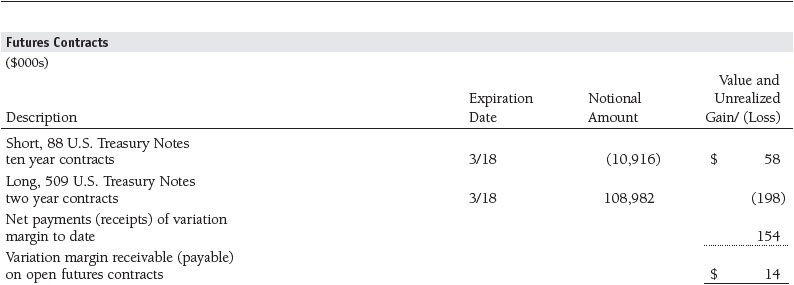
Futures Contracts The fund is subject to interest rate risk in the normal course of pursuing its investment objectives and uses futures contracts to help manage such risk. The fund may enter into futures contracts to manage exposure to interest rate and yield curve movements, security prices, foreign currencies, credit quality, and mortgage prepayments; as an efficient means of adjusting exposure to all or part of a target market; to enhance income; as a cash management tool; or to adjust portfolio duration and credit exposure. A futures contract provides for the future sale by one party and purchase by another of a specified amount of a specific underlying financial instrument at an agreed-upon price, date, time, and place. The fund currently invests only in exchange-traded futures, which generally are standardized as to maturity date, underlying financial instrument, and other contract terms. Payments are made or received by the fund each day to settle daily fluctuations in the value of the contract (variation margin), which reflect changes in the value of the underlying financial instrument. Variation margin is recorded as unrealized gain or loss until the contract is closed. The value of a futures contract included in net assets is the amount of unsettled variation margin; net variation margin receivable is reflected as an asset and net variation margin payable is reflected as a liability on the accompanying Statement of Assets and Liabilities. Risks related to the use of futures contracts include possible illiquidity of the futures markets, contract prices that can be highly volatile and imperfectly correlated to movements in hedged security values and/or interest rates, and potential losses in excess of the fund’s initial investment. During the year ended December 31, 2017, the volume of the fund’s activity in futures, based on underlying notional amounts, was generally between 15% and 25% of net assets.
Options The fund is subject to credit risk in the normal course of pursuing its investment objectives and uses options to help manage such risk. The fund may use options to manage exposure to security prices, interest rates, foreign currencies, and credit quality; as an efficient means of adjusting exposure to all or a part of a target market; to enhance income; as a cash management tool; or to adjust credit exposure. Options are included in net assets at fair value, purchased options are included in Investments in Securities, and written options are separately reflected as a liability on the accompanying Statement of Assets and Liabilities. Premiums on unexercised, expired options are recorded as realized gains or losses; premiums on exercised options are recorded as an adjustment to the proceeds from the sale or cost of the purchase. The difference between the premium and the amount received or paid in a closing transaction is also treated as realized gain or loss. In return for a premium paid, options on swaps give the holder the right, but not the obligation, to enter a specified swap contract on predefined terms. The exercise price of an option on a credit default swap is stated in terms of a specified spread that represents the cost of credit protection on the reference asset, including both the upfront premium to open the position and future periodic payments. The exercise price of an interest rate swap is stated in terms of a fixed interest rate; generally, there is no upfront payment to open the position. Risks related to the use of options include possible illiquidity of the options markets; trading restrictions imposed by an exchange or counterparty; movements in the underlying asset values and credit ratings; and, for written options, potential losses in excess of the fund’s initial investment. During the year ended December 31, 2017, the volume of the fund’s activity in options, based on underlying notional amounts, was generally between 0% and 2% of net assets.
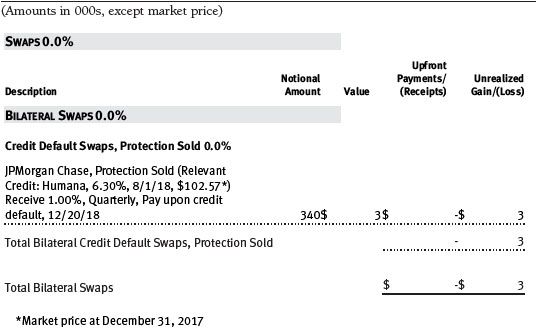
Swaps The fund is subject to credit risk in the normal course of pursuing its investment objectives and uses swap contracts to help manage such risk. The fund may use swaps in an effort to manage exposure to changes in interest rates, inflation rates, and credit quality; to adjust overall exposure to certain markets; to enhance total return or protect the value of portfolio securities; to serve as a cash management tool; or to adjust portfolio duration and credit exposure. Swap agreements can be settled either directly with the counterparty (bilateral swap) or through a central clearinghouse (centrally cleared swap). Fluctuations in the fair value of a contract are reflected in unrealized gain or loss and are reclassified to realized gain or loss upon contract termination or cash settlement. Net periodic receipts or payments required by a contract increase or decrease, respectively, the value of the contract until the contractual payment date, at which time such amounts are reclassified from unrealized to realized gain or loss. For bilateral swaps, cash payments are made or received by the fund on a periodic basis in accordance with contract terms; unrealized gain on contracts and premiums paid are reflected as assets and unrealized loss on contracts and premiums received are reflected as liabilities on the accompanying Statement of Assets and Liabilities. For bilateral swaps, premiums paid or received are amortized over the life of the swap and are recognized as realized gain or loss in the Statement of Operations. For centrally cleared swaps, payments are made or received by the fund each day to settle the daily fluctuation in the value of the contract (variation margin). Accordingly, the value of a centrally cleared swap included in net assets is the unsettled variation margin; net variation margin receivable is reflected as an asset and net variation margin payable is reflected as a liability on the accompanying Statement of Assets and Liabilities.
Credit default swaps are agreements where one party (the protection buyer) agrees to make periodic payments to another party (the protection seller) in exchange for protection against specified credit events, such as certain defaults and bankruptcies related to an underlying credit instrument, or issuer or index of such instruments. Upon occurrence of a specified credit event, the protection seller is required to pay the buyer the difference between the notional amount of the swap and the value of the underlying credit, either in the form of a net cash settlement or by paying the gross notional amount and accepting delivery of the relevant underlying credit. For credit default swaps where the underlying credit is an index, a specified credit event may affect all or individual underlying securities included in the index and will be settled based upon the relative weighting of the affected underlying security(ies) within the index. Generally, the payment risk for the seller of protection is inversely related to the current market price or credit rating of the underlying credit or the market value of the contract relative to the notional amount, which are indicators of the markets’ valuation of credit quality. As of December 31, 2017, the notional amount of protection sold by the fund totaled $340,000 (0.1% of net assets), which reflects the maximum potential amount the fund could be required to pay under such contracts. Risks related to the use of credit default swaps include the possible inability of the fund to accurately assess the current and future creditworthiness of underlying issuers, the possible failure of a counterparty to perform in accordance with the terms of the swap agreements, potential government regulation that could adversely affect the fund’s swap investments, and potential losses in excess of the fund’s initial investment.
During the year ended December 31, 2017, the volume of the fund’s activity in swaps, based on underlying notional amounts, was generally less than 1% of net assets.
NOTE 4 - OTHER INVESTMENT TRANSACTIONS
Consistent with its investment objective, the fund engages in the following practices to manage exposure to certain risks and/or to enhance performance. The investment objective, policies, program, and risk factors of the fund are described more fully in the fund’s prospectus and Statement of Additional Information.
Restricted Securities The fund may invest in securities that are subject to legal or contractual restrictions on resale. Prompt sale of such securities at an acceptable price may be difficult and may involve substantial delays and additional costs.
Collateralized Loan Obligations The fund may invest in collateralized loan obligations (CLOs) which are entities backed by a diversified pool of syndicated bank loans. The cash flows of the CLO can be split into multiple segments, called “tranches” or “classes”, which will vary in risk profile and yield. The riskiest segments, which are the subordinate or “equity” tranches, bear the greatest risk of loss from defaults in the underlying assets of the CLO and serve to protect the other, more senior, tranches. Senior tranches will typically have higher credit ratings and lower yields than the securities underlying the CLO. Despite the protection from the more junior tranches, senior tranches can experience substantial losses.
Mortgage-Backed Securities The fund may invest in mortgage-backed securities (MBS or pass-through certificates) that represent an interest in a pool of specific underlying mortgage loans and entitle the fund to the periodic payments of principal and interest from those mortgages. MBS may be issued by government agencies or corporations, or private issuers. Most MBS issued by government agencies are guaranteed; however, the degree of protection differs based on the issuer. MBS are sensitive to changes in economic conditions that affect the rate of prepayments and defaults on the underlying mortgages; accordingly, the value, income, and related cash flows from MBS may be more volatile than other debt instruments.
Other Purchases and sales of portfolio securities other than short-term and U.S. government securities aggregated $186,115,000 and $158,177,000, respectively, for the year ended December 31, 2017. Purchases and sales of U.S. government securities aggregated $78,651,000 and $61,216,000, respectively, for the year ended December 31, 2017.
NOTE 5 - FEDERAL INCOME TAXES
No provision for federal income taxes is required since the fund intends to continue to qualify as a regulated investment company under Subchapter M of the Internal Revenue Code and distribute to shareholders all of its taxable income and gains. Distributions determined in accordance with federal income tax regulations may differ in amount or character from net investment income and realized gains for financial reporting purposes. Financial reporting records are adjusted for permanent book/tax differences to reflect tax character but are not adjusted for temporary differences.
The fund files U.S. federal, state, and local tax returns as required. The fund’s tax returns are subject to examination by the relevant tax authorities until expiration of the applicable statute of limitations, which is generally three years after the filing of the tax return but which can be extended to six years in certain circumstances. Tax returns for open years have incorporated no uncertain tax positions that require a provision for income taxes.
Reclassifications between income and gain relate primarily to the character of paydown gains and losses on asset-backed securities. For the year ended December 31, 2017, the following reclassifications were recorded to reflect tax character (there was no impact on results of operations or net assets):
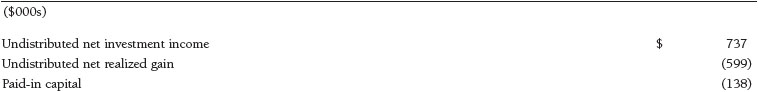
Distributions during the years ended December 31, 2017 and December 31, 2016, totaled $6,132,000 and $5,648,000, respectively, and were characterized as ordinary income for tax purposes. At December 31, 2017, the tax-basis cost of investments, including derivatives, and components of net assets were as follows:
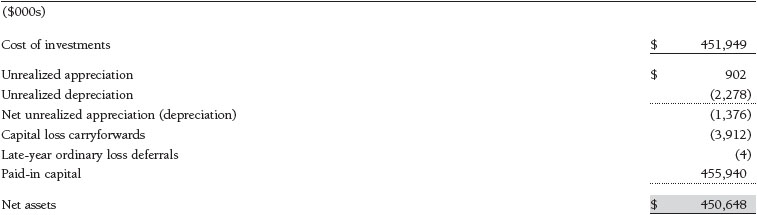
The fund intends to retain realized gains to the extent of available capital loss carryforwards. Net realized capital losses may be carried forward indefinitely to offset future realized capital gains. In accordance with federal tax laws applicable to investment companies, net specified losses realized between November 1 and December 31 are not recognized for tax purposes until the subsequent year (late-year ordinary loss deferrals); however, such losses are recognized for financial reporting purposes in the year realized.
NOTE 6 - RELATED PARTY TRANSACTIONS
The fund is managed by T. Rowe Price Associates, Inc. (Price Associates), a wholly owned subsidiary of T. Rowe Price Group, Inc. (Price Group). The investment management and administrative agreement between the fund and Price Associates provides for an all-inclusive annual fee equal to 0.70% of the fund’s average daily net assets. The fee is computed daily and paid monthly. The all-inclusive fee covers investment management, shareholder servicing, transfer agency, accounting, and custody services provided to the fund, as well as fund directors’ fees and expenses. Interest, taxes, brokerage commissions, and other non-recurring expenses permitted by the investment management agreement are paid directly by the fund.
The fund may invest its cash reserves in certain open-end management investment companies managed by Price Associates and considered affiliates of the fund: the T. Rowe Price Government Reserve Fund or the T. Rowe Price Treasury Reserve Fund, organized as money market funds, or the T. Rowe Price Short-Term Fund, a short-term bond fund (collectively, the Price Reserve Funds). The Price Reserve Funds are offered as short-term investment options to mutual funds, trusts, and other accounts managed by Price Associates or its affiliates and are not available for direct purchase by members of the public. Cash collateral from securities lending is invested in the T. Rowe Price Short-Term Fund. The Price Reserve Funds pay no investment management fees.
The fund may participate in securities purchase and sale transactions with other funds or accounts advised by Price Associates (cross trades), in accordance with procedures adopted by the fund’s Board and Securities and Exchange Commission rules, which require, among other things, that such purchase and sale cross trades be effected at the independent current market price of the security. During the year ended December 31, 2017, the fund had no purchases or sales cross trades with other funds or accounts advised by Price Associates.
Report of Independent Registered Public Accounting Firm
To the Board of Directors of T. Rowe Price Fixed Income Series, Inc. and
Shareholders of T. Rowe Price Limited-Term Bond Portfolio
Opinion on the Financial Statements
We have audited the accompanying statement of assets and liabilities, including the portfolio of investments, of T. Rowe Price Limited-Term Bond Portfolio (one of the portfolios constituting T. Rowe Price Fixed Income Series, Inc., hereafter referred to as the “Fund”) as of December 31, 2017, the related statement of operations for the year ended December 31, 2017, the statement of changes in net assets for each of the two years in the period ended December 31, 2017, including the related notes, and the financial highlights for each of the five years in the period ended December 31, 2017 (collectively referred to as the “financial statements”). In our opinion, the financial statements present fairly, in all material respects, the financial position of the Fund as of December 31, 2017, the results of its operations for the year then ended, the changes in its net assets for each of the two years in the period ended December 31, 2017 and the financial highlights for each of the five years in the period ended December 31, 2017 in conformity with accounting principles generally accepted in the United States of America.
Basis for Opinion
These financial statements are the responsibility of the Fund’s management. Our responsibility is to express an opinion on the Fund’s financial statements based on our audits. We are a public accounting firm registered with the Public Company Accounting Oversight Board (United States) (“PCAOB”) and are required to be independent with respect to the Fund in accordance with the U.S. federal securities laws and the applicable rules and regulations of the Securities and Exchange Commission and the PCAOB.
We conducted our audits of these financial statements in accordance with the standards of the PCAOB. Those standards require that we plan and perform the audit to obtain reasonable assurance about whether the financial statements are free of material misstatement, whether due to error or fraud.
Our audits included performing procedures to assess the risks of material misstatement of the financial statements, whether due to error or fraud, and performing procedures that respond to those risks. Such procedures included examining, on a test basis, evidence regarding the amounts and disclosures in the financial statements. Our audits also included evaluating the accounting principles used and significant estimates made by management, as well as evaluating the overall presentation of the financial statements. Our procedures included confirmation of securities owned as of December 31, 2017 by correspondence with the custodians and brokers; when replies were not received from brokers, we performed other auditing procedures. We believe that our audits provide a reasonable basis for our opinion.
PricewaterhouseCoopers LLP
Baltimore, Maryland
February 7, 2018
We have served as the auditor of one or more investment companies in the T. Rowe Price group of investment companies since 1973.
| Tax Information (Unaudited) for the Tax Year Ended 12/31/17 |
We are providing this information as required by the Internal Revenue Code. The amounts shown may differ from those elsewhere in this report because of differences between tax and financial reporting requirements.
The fund’s distributions to shareholders included $1,000 from short-term capital gains.
| Information on Proxy Voting Policies, Procedures, and Records |
A description of the policies and procedures used by T. Rowe Price funds and portfolios to determine how to vote proxies relating to portfolio securities is available in each fund’s Statement of Additional Information. You may request this document by calling 1-800-225-5132 or by accessing the SEC’s website, sec.gov.
The description of our proxy voting policies and procedures is also available on our corporate website. To access it, please visit the following Web page:
https://www3.troweprice.com/usis/corporate/en/utility/policies.html
Scroll down to the section near the bottom of the page that says, “Proxy Voting Policies.” Click on the Proxy Voting Policies link in the shaded box.
Each fund’s most recent annual proxy voting record is available on our website and through the SEC’s website. To access it through T. Rowe Price, visit the website location shown above, and scroll down to the section near the bottom of the page that says, “Proxy Voting Records.” Click on the Proxy Voting Records link in the shaded box.
| How to Obtain Quarterly Portfolio Holdings |
The fund files a complete schedule of portfolio holdings with the Securities and Exchange Commission for the first and third quarters of each fiscal year on Form N-Q. The fund’s Form N-Q is available electronically on the SEC’s website (sec.gov); hard copies may be reviewed and copied at the SEC’s Public Reference Room, 100 F St. N.E., Washington, DC 20549. For more information on the Public Reference Room, call 1-800-SEC-0330.
| About the Portfolio’s Directors and Officers |
Your fund is overseen by a Board of Directors (Board) that meets regularly to review a wide variety of matters affecting or potentially affecting the fund, including performance, investment programs, compliance matters, advisory fees and expenses, service providers, and business and regulatory affairs. The Board elects the fund’s officers, who are listed in the final table. At least 75% of the Board’s members are independent of T. Rowe Price Associates, Inc. (T. Rowe Price), and its affiliates; “inside” or “interested” directors are employees or officers of T. Rowe Price. The business address of each director and officer is 100 East Pratt Street, Baltimore, Maryland 21202. The Statement of Additional Information includes additional information about the fund directors and is available without charge by calling a T. Rowe Price representative at 1-800-638-5660.
| Independent Directors | ||
| Name (Year of Birth) Year Elected* [Number of T. Rowe Price Portfolios Overseen] | Principal Occupation(s) and Directorships of Public Companies and Other Investment Companies During the Past Five Years | |
| Bruce W. Duncan (1951) 2013 [191] | Chief Executive Officer and Director (2009 to December 2016), Chairman of the Board (January 2016 to present), and President (2009 to September 2016), First Industrial Realty Trust, an owner and operator of industrial properties; Chairman of the Board (2005 to September 2016) and Director (1999 to September 2016), Starwood Hotels & Resorts, a hotel and leisure company; Director, Boston Properties (May 2016 to present); Director, Marriott International, Inc. (September 2016 to present) | |
| Robert J. Gerrard, Jr. (1952) 2013 [191] | Advisory Board Member, Pipeline Crisis/Winning Strategies, a collaborative working to improve opportunities for young African Americans (1997 to present) | |
| Paul F. McBride (1956) 2013 [191] | Advisory Board Member, Vizzia Technologies (2015 to present) | |
| Cecilia E. Rouse, Ph.D. (1963) 2013 [191] | Dean, Woodrow Wilson School (2012 to present); Professor and Researcher, Princeton University (1992 to present); Member of National Academy of Education (2010 to present); Director, MDRC, a nonprofit education and social policy research organization (2011 to present); Research Associate of Labor Studies Program (2011 to 2015) and Board Member (2015 to present), National Bureau of Economic Research (2011 to present); Chair of Committee on the Status of Minority Groups in the Economic Profession (2012 to present); Vice President (2015 to present), American Economic Association | |
| John G. Schreiber (1946) 1994 [191] | Owner/President, Centaur Capital Partners, Inc., a real estate investment company (1991 to present); Cofounder, Partner, and Cochairman of the Investment Committee, Blackstone Real Estate Advisors, L.P. (1992 to 2015); Director, General Growth Properties, Inc. (2010 to 2013); Director, Blackstone Mortgage Trust, a real estate finance company (2012 to 2016); Director and Chairman of the Board, Brixmor Property Group, Inc. (2013 to present); Director, Hilton Worldwide (2013 to present); Director, Hudson Pacific Properties (2014 to 2016) | |
| Mark R. Tercek (1957) 2009 [191] | President and Chief Executive Officer, The Nature Conservancy (2008 to present) | |
| *Each independent director serves until retirement, resignation, or election of a successor. | ||
| Inside Directors | ||
| Name (Year of Birth) Year Elected* [Number of T. Rowe Price Portfolios Overseen] | Principal Occupation(s) and Directorships of Public Companies and Other Investment Companies During the Past Five Years | |
| Edward C. Bernard (1956) 2006 [191] | Director and Vice President, T. Rowe Price; Vice Chairman of the Board, Director, and Vice President, T. Rowe Price Group, Inc.; Chairman of the Board, Director, and Vice President, T. Rowe Price Investment Services, Inc., and T. Rowe Price Services, Inc.; Chairman of the Board and Director, T. Rowe Price Retirement Plan Services, Inc.; Chairman of the Board, Chief Executive Officer, Director, and President, T. Rowe Price International and T. Rowe Price Trust Company; Chairman of the Board, all funds | |
| Edward A. Wiese, CFA (1959) 2015 [56] | Vice President, T. Rowe Price, T. Rowe Price Group, Inc., T. Rowe Price International, and T. Rowe Price Trust Company; Vice President, Fixed Income Series | |
| *Each inside director serves until retirement, resignation, or election of a successor. | ||
| Officers | ||
| Name (Year of Birth) Position Held With Fixed Income Series | Principal Occupation(s) | |
| Darrell N. Braman (1963) Vice President and Secretary | Vice President, Price Hong Kong, Price Singapore, T. Rowe Price, T. Rowe Price Group, Inc., T. Rowe Price International, T. Rowe Price Investment Services, Inc., and T. Rowe Price Services, Inc. | |
| Steven G. Brooks, CFA (1954) Vice President | Vice President, T. Rowe Price and T. Rowe Price Group, Inc. | |
| Jason T. Collins (1971) Vice President | Vice President, T. Rowe Price and T. Rowe Price Group, Inc. | |
| M. Helena Condez (1962) Vice President | Vice President, T. Rowe Price and T. Rowe Price Group, Inc. | |
| Levent Demirekler (1974) Vice President | Vice President, T. Rowe Price | |
| G. Richard Dent (1960) Vice President | Vice President, T. Rowe Price and T. Rowe Price Group, Inc. | |
| Stephanie A. Gentile, CFA (1956) Vice President | Vice President, T. Rowe Price; formerly, Director, Credit Suisse Securities (to 2014) | |
| John R. Gilner (1961) Chief Compliance Officer | Chief Compliance Officer and Vice President, T. Rowe Price; Vice President, T. Rowe Price Group, Inc., and T. Rowe Price Investment Services, Inc. | |
| Michael J. Grogan, CFA (1971) Vice President | Vice President, T. Rowe Price and T. Rowe Price Group, Inc. | |
| Geoffrey M. Hardin (1971) Vice President | Vice President, T. Rowe Price and T. Rowe Price Group, Inc. | |
| Charles B. Hill, CFA (1961) Vice President | Vice President, T. Rowe Price and T. Rowe Price Group, Inc. | |
| Keir R. Joyce, CFA (1972) Vice President | Vice President, T. Rowe Price and T. Rowe Price Group, Inc. | |
| Steven M. Kohlenstein (1987) Vice President | Vice President, T. Rowe Price | |
| Paul J. Krug, CPA (1964) Vice President | Vice President, T. Rowe Price, T. Rowe Price Group, Inc., and T. Rowe Price Trust Company | |
| Marcy M. Lash (1963) Vice President | Vice President, T. Rowe Price and T. Rowe Price Group, Inc. | |
| Alan D. Levenson, Ph.D. (1958) Vice President | Vice President, T. Rowe Price and T. Rowe Price Group, Inc. | |
| Joseph K. Lynagh, CFA (1958) Executive Vice President | Vice President, T. Rowe Price, T. Rowe Price Group, Inc., and T. Rowe Price Trust Company | |
| Catherine D. Mathews (1963) Treasurer and Vice President | Vice President, T. Rowe Price, T. Rowe Price Group, Inc., and T. Rowe Price Trust Company | |
| Andrew C. McCormick (1960) Vice President | Vice President, T. Rowe Price, T. Rowe Price Group, Inc., and T. Rowe Price Trust Company | |
| Cheryl A. Mickel, CFA (1967) President | Director and Vice President, T. Rowe Price Trust Company; Vice President, T. Rowe Price and T. Rowe Price Group, Inc. | |
| David Oestreicher (1967) Vice President | Director, Vice President, and Secretary, T. Rowe Price Investment Services, Inc., T. Rowe Price Retirement Plan Services, Inc., T. Rowe Price Services, Inc., and T. Rowe Price Trust Company; Chief Legal Officer, Vice President, and Secretary, T. Rowe Price Group, Inc.; Vice President and Secretary, T. Rowe Price and T. Rowe Price International; Vice President, Price Hong Kong and Price Singapore | |
| John W. Ratzesberger (1975) Vice President | Vice President, T. Rowe Price, T. Rowe Price Group, Inc., and T. Rowe Price Trust Company; formerly, North American Head of Listed Derivatives Operation, Morgan Stanley (to 2013) | |
| Shannon H. Rauser (1987) Assistant Secretary | Employee, T. Rowe Price | |
| Vernon A. Reid, Jr. (1954) Vice President | Vice President, T. Rowe Price and T. Rowe Price Group, Inc. | |
| Michael F. Reinartz (1973) Executive Vice President | Vice President, T. Rowe Price, T. Rowe Price Group, Inc., and T. Rowe Price Trust Company | |
| Chen Shao (1980) Vice President | Vice President, T. Rowe Price | |
| Douglas D. Spratley, CFA (1969) Vice President | Vice President, T. Rowe Price and T. Rowe Price Group, Inc. | |
| Robert D. Thomas (1971) Vice President | Vice President, T. Rowe Price Group, Inc., and T. Rowe Price International | |
| Megan Warren (1968) Vice President | Vice President, T. Rowe Price, T. Rowe Price Group, Inc., T. Rowe Price Retirement Plan Services, Inc., T. Rowe Price Services, Inc., and T. Rowe Price Trust Company; formerly, Executive Director, JP Morgan Chase (to 2017) | |
| John D. Wells (1960) Vice President | Vice President, T. Rowe Price and T. Rowe Price Group, Inc. | |
| Unless otherwise noted, officers have been employees of T. Rowe Price or T. Rowe Price International for at least 5 years. | ||
Item 2. Code of Ethics.
The registrant has adopted a code of ethics, as defined in Item 2 of Form N-CSR, applicable to its principal executive officer, principal financial officer, principal accounting officer or controller, or persons performing similar functions. A copy of this code of ethics is filed as an exhibit to this Form N-CSR. No substantive amendments were approved or waivers were granted to this code of ethics during the period covered by this report.
Item 3. Audit Committee Financial Expert.
The registrant’s Board of Directors/Trustees has determined that Mr. Bruce W. Duncan qualifies as an audit committee financial expert, as defined in Item 3 of Form N-CSR. Mr. Duncan is considered independent for purposes of Item 3 of Form N-CSR.
Item 4. Principal Accountant Fees and Services.
(a) – (d) Aggregate fees billed for the last two fiscal years for professional services rendered to, or on behalf of, the registrant by the registrant’s principal accountant were as follows:
Audit fees include amounts related to the audit of the registrant’s annual financial statements and services normally provided by the accountant in connection with statutory and regulatory filings. Audit-related fees include amounts reasonably related to the performance of the audit of the registrant’s financial statements and specifically include the issuance of a report on internal controls and, if applicable, agreed-upon procedures related to fund acquisitions. Tax fees include amounts related to services for tax compliance, tax planning, and tax advice. The nature of these services specifically includes the review of distribution calculations and the preparation of Federal, state, and excise tax returns. All other fees include the registrant’s pro-rata share of amounts for agreed-upon procedures in conjunction with service contract approvals by the registrant’s Board of Directors/Trustees.
(e)(1) The registrant’s audit committee has adopted a policy whereby audit and non-audit services performed by the registrant’s principal accountant for the registrant, its investment adviser, and any entity controlling, controlled by, or under common control with the investment adviser that provides ongoing services to the registrant require pre-approval in advance at regularly scheduled audit committee meetings. If such a service is required between regularly scheduled audit committee meetings, pre-approval may be authorized by one audit committee member with ratification at the next scheduled audit committee meeting. Waiver of pre-approval for audit or non-audit services requiring fees of a de minimis amount is not permitted.
(2) No services included in (b) – (d) above were approved pursuant to paragraph (c)(7)(i)(C) of Rule 2-01 of Regulation S-X.
(f) Less than 50 percent of the hours expended on the principal accountant’s engagement to audit the registrant’s financial statements for the most recent fiscal year were attributed to work performed by persons other than the principal accountant’s full-time, permanent employees.
(g) The aggregate fees billed for the most recent fiscal year and the preceding fiscal year by the registrant’s principal accountant for non-audit services rendered to the registrant, its investment adviser, and any entity controlling, controlled by, or under common control with the investment adviser that provides ongoing services to the registrant were $2,169,000 and $2,146,000, respectively.
(h) All non-audit services rendered in (g) above were pre-approved by the registrant’s audit committee. Accordingly, these services were considered by the registrant’s audit committee in maintaining the principal accountant’s independence.
Item 5. Audit Committee of Listed Registrants.
Not applicable.
Item 6. Investments.
(a) Not applicable. The complete schedule of investments is included in Item 1 of this Form N-CSR.
(b) Not applicable.
Item 7. Disclosure of Proxy Voting Policies and Procedures for Closed-End Management Investment Companies.
Not applicable.
Item 8. Portfolio Managers of Closed-End Management Investment Companies.
Not applicable.
Item 9. Purchases of Equity Securities by Closed-End Management Investment Company and Affiliated Purchasers.
Not applicable.
Item 10. Submission of Matters to a Vote of Security Holders.
Not applicable.
Item 11. Controls and Procedures.
(a) The registrant’s principal executive officer and principal financial officer have evaluated the registrant’s disclosure controls and procedures within 90 days of this filing and have concluded that the registrant’s disclosure controls and procedures were effective, as of that date, in ensuring that information required to be disclosed by the registrant in this Form N-CSR was recorded, processed, summarized, and reported timely.
(b) The registrant’s principal executive officer and principal financial officer are aware of no change in the registrant’s internal control over financial reporting that occurred during the registrant’s second fiscal quarter covered by this report that has materially affected, or is reasonably likely to materially affect, the registrant’s internal control over financial reporting.
Item 12. Exhibits.
(a)(1) The registrant’s code of ethics pursuant to Item 2 of Form N-CSR is attached.
(2) Separate certifications by the registrant's principal executive officer and principal financial officer, pursuant to Section 302 of the Sarbanes-Oxley Act of 2002 and required by Rule 30a-2(a) under the Investment Company Act of 1940, are attached.
(3) Written solicitation to repurchase securities issued by closed-end companies: not applicable.
(b) A certification by the registrant's principal executive officer and principal financial officer, pursuant to Section 906 of the Sarbanes-Oxley Act of 2002 and required by Rule 30a-2(b) under the Investment Company Act of 1940, is attached.
SIGNATURES
Pursuant to the requirements of the Securities Exchange Act of 1934 and the Investment Company Act of 1940, the registrant has duly caused this report to be signed on its behalf by the undersigned, thereunto duly authorized.
T. Rowe Price Fixed Income Series, Inc.
| By | /s/ Edward C. Bernard | |||||
| Edward C. Bernard | ||||||
| Principal Executive Officer | ||||||
| Date | February 7, 2018 | |||||
Pursuant to the requirements of the Securities Exchange Act of 1934 and the Investment Company Act of 1940, this report has been signed below by the following persons on behalf of the registrant and in the capacities and on the dates indicated.
| By | /s/ Edward C. Bernard | |||||
| Edward C. Bernard | ||||||
| Principal Executive Officer | ||||||
| Date | February 7, 2018 | |||||
| By | /s/ Catherine D. Mathews | |||||
| Catherine D. Mathews | ||||||
| Principal Financial Officer | ||||||
| Date | February 7, 2018 | |||||