 PSS World Medical Investor Day Conference June 5, 2007 Jacksonville, Florida Exhibit 99.1 |
 David A. Smith Chairman of the Board and Chief Executive Officer Investor Day Conference June 5, 2007 Jacksonville, Florida |
 Max Dupree “The first responsibility of a leader is to define reality.” “The first responsibility of a leader is to define reality.” Peter Drucker “A real leader faces the music even when he doesn’t like the tune.” “A real leader faces the music even when he doesn’t like the tune.” |
                                             Environment |
 Non-durable Medical Product Home Health Care Nursing Home Care Physicians’ Care Admin. and Net Cost of Private Health Insurance Prescription Drugs Hospital Care Source: CMS 1975 Health Expenditures As % of GDP 13.8% 1995 Health Expenditures As % of GDP 14.4% 2006 Health Expenditures As % of GDP 15.6% 2016 Health Expenditures As % of GDP 19.3% National Health Expenditures by type ($bn, chained 2000 dollars) Accelerating to 3x the rate of growth In the next 10 years (2006 - 2016 compared to previous 10 years (1995 - 2005) 24.5% expected total growth 2006-2016 7.6% actual total growth 1995-2005 US Healthcare Spending is Accelerating Expected to Approach 20% of GDP |
 0 20 40 60 80 1900 1910 1920 1930 1940 1950 1960 1970 1980 1990 2000 2010 2020 2030 Aging Population Growth of the Elderly Population (Over 65 years) 1900 to 2030 |
 Play BERNANKE VIDEO HERE (SEN. BROWNBACK AND FED. RESERVE CHAIR) |
    Health Spending Per Capita, U.S. Dollars Health Spending Per Capita, U.S. Dollars Note: See the Figure Notes section at the end of the book for a guide to the country abbreviations Source: OECD (2005c) data. Figure 8J, taken from the Economic Policy Institute’s State of Working America 2006/2007, available at www.epi.org Note: See the Figure Notes section at the end of the book for a guide to the country abbreviations Source: OECD (2005c) data. Figure 8J, taken from the Economic Policy Institute’s State of Working America 2006/2007, available at www.epi.org $0 $0 $1,500 $1,500 $3,000 $3,000 $4,500 $4,500 $6,000 $6,000 65 65 70 70 75 75 80 80 85 85 R 2 = 0.57 R 2 = 0.57 TUR TUR MEX MEX HUN HUN SVK SVK POL POL KOR KOR CZE CZE UK UK USA USA PRT PRT IRL IRL DNK DNK BEL BEL DEU DEU NLD NLD LUX LUX NOR NOR GRC GRC NLZ NLZ ESP ESP JPN JPN FIN FIN AUT AUT ITA ITA AUS AUS FRA FRA CAN CAN SWE SWE ISL ISL CHE CHE Life Expectancy at Birth and Health Spending Per Capita, 2004 |
 Broken System Wall Street Journal, January 2007 |
 Who’s the Largest Payer? |
 Hospital SNF All Other Emergency & Complex Surgery Emergency & Complex Surgery The New-Old Hospital High Acuity The New-Old Hospital High Acuity Surgery Center Doctors Office Agency Mail Order Hospice Surgery Center Doctors Office Agency Mail Order Hospice Assisted Living DME Retailers New Models Assisted Living DME Retailers New Models |
 Solution Services Surgery Centers Doctors Office DME Agency Hospice Assisted Living Retail Disease State General Retail New Models Surgery Centers Doctors Office DME Agency Hospice Assisted Living Retail Disease State General Retail New Models $ |
                   |
 Homeward Bound % of Elderly into Nursing Home Dropping >75 In SNF’s % in SNF’s 1985 11.6 1.1 9.6% 1995 14.9 1.2 8.3% 1997 15.7 1.3 8.1% 1999 16.4 1.3 7.8% 2004 17.9 1.1 6.4% >75 In SNF’s % in SNF’s 1985 11.6 1.1 9.6% 1995 14.9 1.2 8.3% 1997 15.7 1.3 8.1% 1999 16.4 1.3 7.8% 2004 17.9 1.1 6.4% |
 CMS said • At 20% of GDP we can no longer afford real estate for disease management • Competitive bidding will pave the way for American healthcare at home |
 Relatively Flat Occupancy Occupancy rates should be relatively flat in 2006 as benefits of increased capex will be largely offset by increased competition and a shift to shorter LOS. Source: Lehman Brothers, AHCA, Cowles Research Group 84% 85% 86% 87% 88% 89% 90% 91% 92% 93% 94% 1990 1991 1992 1993 1994 1995 1996 1997 1998 1999 2000 2001 2002 2003 2004 2005 SNF Occupancy Rates Nursing Home Patients 1.497 1.505 1.519 1.480 1.469 1.458 1.450 1.441 1.494 1.490 1.380 1.400 1.420 1.440 1.460 1.480 1.500 1.520 1.540 1995 1996 1997 1998 1999 2000 2001 2002 2003 2004 (Patients in millions) |
 Home Health Agencies & Hospice • $7 Billion market growing 10% annually – Home Health 4% - 8% – Hospice 8% - 10% |
 HHA Customer Requirements • Product Availability • On-line Ordering & Inventory Management • Customer Service • Error Free Service • Patient Home Delivery • Flexible Freight Options • Enhanced Reports • Product Formulary • Clinical Consultants |
 “The competitor who solves the customer’s biggest problem wins” “The competitor who solves the customer’s biggest problem wins” |
 Technology Formulary Clinical Logistic Home Health Franchise Home Health Franchise |
                       “…the growing connectivity between the countries of the world.” “…the growing connectivity between the countries of the world.” |
 Rapid Expansion of Wholesaler – Distributor Brands Facing the Forces of Change NAW Publication |
 |
 • Isaac Mizrahi – Clothing, Accessories, Housewares • Mossimo – Clothing • Archer Farms – Foods • Market Pantry – Foods • TruTech – Electronics • Xhiliration – Clothing • Merona – Clothing • Cherokee – Clothing • Michael Grave Design – Housewares • Rx – Custom CearRx Brand Packaging Design • Isaac Mizrahi – Clothing, Accessories, Housewares • Mossimo – Clothing • Archer Farms – Foods • Market Pantry – Foods • TruTech – Electronics • Xhiliration – Clothing • Merona – Clothing • Cherokee – Clothing • Michael Grave Design – Housewares • Rx – Custom CearRx Brand Packaging Design |
 • Quality • Value • Service • $$$ |
 $ Surgery Centers Doctors Office DME Agency Hospice Assisted Living Retail Disease State General Retail New Models Surgery Centers Doctors Office DME Agency Hospice Assisted Living Retail Disease State General Retail New Models |
 35% 35% 65% Strategic Partners 65% Strategic Partners Commodity No brand value Low field support No innovation Commodity No brand value Low field support No innovation Complexity Field support Program support Brand recognition R&D Complexity Field support Program support Brand recognition R&D |
 Amsino |
 Build a Team Build a Team |
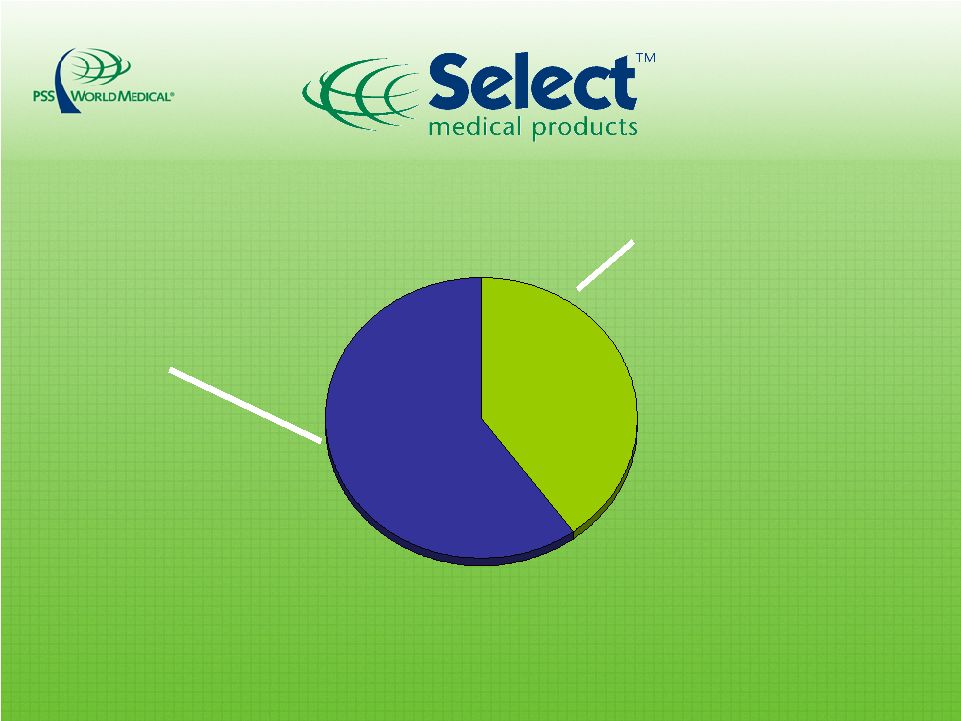 $186,000,000 Importers And US Mfg. Importers And US Mfg. PSS World Medical Tiger Amsino QC Design Innovation New product PSS World Medical Tiger Amsino QC Design Innovation New product 40% 40% 60% 60% |
 Product Reporting Quality Consistency Cost/Value Availability Quality Consistency Cost/Value Availability 2% 2% 98% 98% |
 “The competitor who solves the customer’s biggest problem wins” “The competitor who solves the customer’s biggest problem wins” |
     The NEED - Big & Immediate The NEED - Big & Immediate The OPPORTUNITY - $5.6 Billion by 2015 The OPPORTUNITY - $5.6 Billion by 2015 |
 Bush State of the Union |
 Democrats |
 Tom Scully, Former CMS Director “The CMS Wants Healthcare To Look Like The Banking Industry.” “Complete Visibility And Portability Of Data.” “One Platform Would Be Great. We Reduced To 3 Banks And It Wasn’t Costing Us 20% Of GDP.” “CMS Will Force Physician Automation With Reimbursement.” “1% Or 2% Of GDP Is A Really Big Number.” |
 Deny, Deny, Demand Proof Paluxy Valley Physicians, Glen Rose Texans “Struggling to recap $500,000 of denied or unpaid claims from insurers. Eight doctors left the practice… The insurers out code us, they out smart us and they have more power.” • Insurers begin to hire health recovery teams or software to dig through old claims • Insurers don’t disclose their full list of fees on coding edits, claiming they are proprietary. • Insurers periodically re-interpret national coding standards. |
 Percent Change in Average Physician Income 1995- 2003 Pay is Going Down 10% 5% 0% -5% -10% -15% 10% 5% 0% -5% -10% -15% All Physicians All Physicians Primary Care Primary Care Medical Specialists Medical Specialists Surgical Specialists Surgical Specialists Professional / Technical Workers Professional / Technical Workers -7.1 -7.1 -10.2 -10.2 -2.1 -2.1 -8.2 -8.2 6.9 6.9 Note: Physician income data are based on reported net income from the practice of medicine (after expenses and before taxes). The Bureau of Labor Statistics (BLS) Employment Cost Index of wages and salaries for private sector “professional, technical and specialty” workers was used to calculate estimates for these workers. All inflation-adjusted estimates were calculated using the BLS online inflation calculator (http://146.142.4.24/cgi-bin/cpicalc.pl) Source: Community Tracking Study Physician Survey |
 “…31% of the $1.3 trillion in U.S. outlays for healthcare in 2003 was devoted to administrative paperwork.” -Harvard Medical School & Public Citizen Survey- “…31% of the $1.3 trillion in U.S. outlays for healthcare in 2003 was devoted to administrative paperwork.” -Harvard Medical School & Public Citizen Survey- |
 Expensive staff functions: • Billing • Filling / Charting • Scheduling • Collections • Refill Medications • Pre-certification of tests Doctor’s Survey |
 The Madness – Doctor’s Office Day 0 Day 1 Day 2 Patient Referral – Appointment made for Patient Intake Form Completed – 2 copies Patient Arrives – Signs in at Front Desk Pt. Sign In Log Pre-Register Patient in System – Get PCP Referral Appt. Schedule Encounter Ticket(s) Printed & Medical Records Obtained Lab Form Dr. Form RN Form -Pt. completes & signs registration info & AOB -Make copy of insurance card -Collect co-pay AOB Ins. Card Cash Coll. Log -New Patient? Yes Confirm any changes in insurance & update files -Collect co-pay and/ or deductible Sum Pt. Reim. & Liab. Schedule Patient’s next appointment first treatment appointment Patient Returns for first treatment visit -Patient signs in and co-pay collected Patient Returns for first treatment visit -Patient signs in and co-pay collected Patient receives treatment -Encounter forms completed Patient receives Consultation & treatment plan made -Encounter forms completed Encounter Forms verified against schedule & checked for accuracy -Charge entry occurs at site of service Money bundled & deposited Lab Form Dr. Form RN Form Legend Process Document Report Decision Insurance eligibility & benefits verified -Treatment authorization obtained -Information documented Appt. Schedule Ins. Verification Sum Pt. Reim. & Liab. Business office functions occur Scheduler Front Desk Medical Records Medical Staff Patient Financial Counselor/ Insurance Verification Day 1 & 2 Cash Coll. Log No |
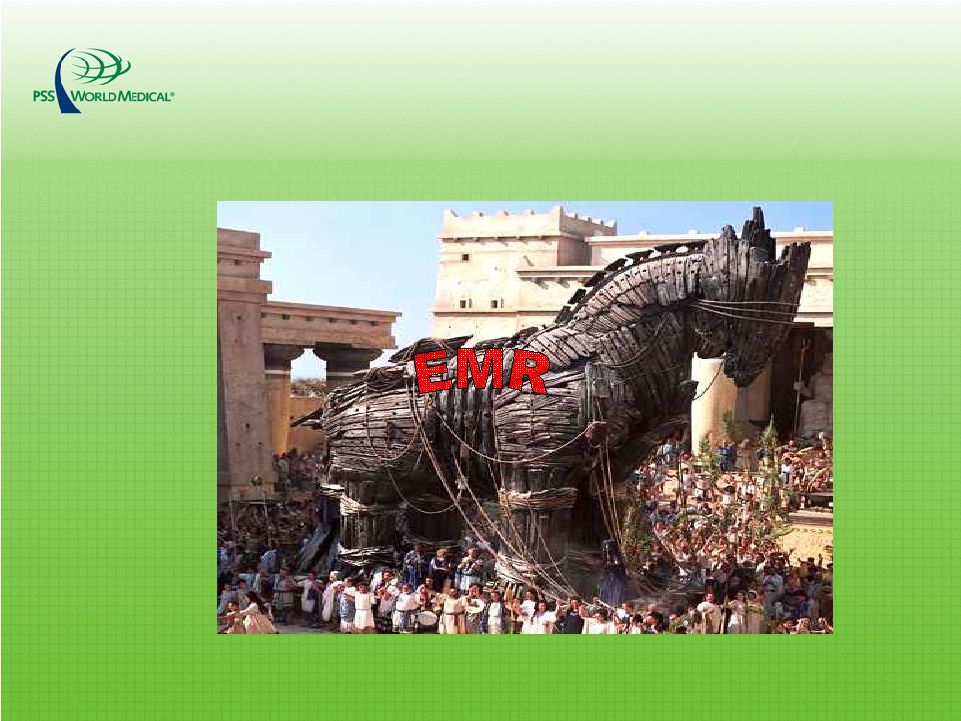 EMR – A Trojan Horse |
 EMR Automating a bad process guarantees bad results faster! |
 • 30% of EMR’s are failing and being pulled out • Not many doctors can install, run and manage software let alone change their process • #1 issue for practice disruption 3-6 months • EMR - No outside paper reduction - actually now two systems EMR Realities |
 70% 215 140,000 70% 215 140,000 15% 46 30,000 15% 46 30,000 15% 46 30,000 15% 46 30,000 Physician Automation Adoption |
 • Install software in 12,000 accounts within 30,000 doctors? • Have at least 3,600 accounts and 9,000 doctors mad at us? • Because no one EMR software company can do all of this – We will have 50 Trojan Horses in our customer accounts If It’s Broken, Then Fix It |
 |
           |
         |
                                   |
 |
         |
 “The competitor who solves the customer’s biggest problem wins” “The competitor who solves the customer’s biggest problem wins” |
 Athena |
                                             Environment |
 |
 2X GROWTH 2X GROWTH CUSTOMER Culture PROFIT Execution ETHICS ETHICS |
 Thank You |