UNITED STATES
SECURITIES AND EXCHANGE COMMISSION
Washington, D.C. 20549
FORM N-CSR
CERTIFIED SHAREHOLDER REPORT OF REGISTERED MANAGEMENT INVESTMENT COMPANIES
Investment Company Act file number 811-08416
Touchstone Variable Series Trust
(Exact name of registrant as specified in charter)
303 Broadway, Suite 1100
Cincinnati, Ohio 45202-4203
(Address of principal executive offices) (Zip code)
E. Blake Moore, Jr.
303 Broadway, Suite 1100
Cincinnati, Ohio 45202-4203
(Name and address of agent for service)
Registrant's telephone number, including area code: 800-638-8194
Date of fiscal year end: December 31
Date of reporting period: December 31, 2021
Form N-CSR is to be used by management investment companies to file reports with the Commission not later than 10 days after the transmission to stockholders of any report that is required to be transmitted to stockholders under Rule 30e-1 under the Investment Company Act of 1940 (17 CFR 270.30e-1). The Commission may use the information provided on Form N-CSR in its regulatory, disclosure review, inspection, and policymaking roles.
A registrant is required to disclose the information specified by Form N-CSR, and the Commission will make this information public. A registrant is not required to respond to the collection of information contained in Form N-CSR unless the Form displays a currently valid Office of Management and Budget ("OMB") control number. Please direct comments concerning the accuracy of the information collection burden estimate and any suggestions for reducing the burden to Secretary, Securities and Exchange Commission, 450 Fifth Street, NW, Washington, DC 20549-0609. The OMB has reviewed this collection of information under the clearance requirements of 44 U.S.C. § 3507.
Item 1. Reports to Stockholders.
| (a) | The Report to Shareholders is attached herewith. |
| Touchstone Variable Series Trust |
| Touchstone Balanced Fund |
| Touchstone Bond Fund |
| Touchstone Common Stock Fund |
| Touchstone Small Company Fund |
This report identifies the Funds' investments on December 31, 2021. These holdings are subject to change. Not all investments in each Fund performed the same, nor is there any guarantee that these investments will perform as well in the future. Market forecasts provided in this report may not occur.
Letter from the President
Dear Shareholder:
We are pleased to provide you with the Touchstone Variable Series Trust Annual Report. Inside you will find key financial information, as well as manager commentaries for the Funds, for the twelve months ended December 31, 2021.
A rising inflation theme defined the economic backdrop in the U.S. and developed markets for much of the 2021 calendar year. The U.S. Federal Reserve (Fed) dropped “transitory” from its official statements during the fourth quarter regarding the nature of inflation’s impact on the U.S. economy. This was fortuitous timing because in November, the Fed’s preferred inflation gauge hit 4.7%, the highest level recorded since 1989. Regarding U.S. labor market conditions, job openings remained at a historic high of 11 million while the labor participation rate was at a 45-year low of 61.8%. Labor shortages have impacted the broader economy through supply chain issues, hospital staffing and various retail segments. Given tight labor market conditions and elevated inflation readings, the Fed communicated its intent to tighten fiscal policy and hinted at raising the overnight Federal Funds rate up to three times in 2022. Outside the U.S., developed market central banks largely acted in unison in terms of maintaining highly accommodative monetary policy, with only the Bank of England implementing a 25 basis points increase in overnight rates.
Over the course of the entire calendar year, economic activity remained strong despite headwinds from the aforementioned inflationary pressures, supply chain disruptions and emerging COVID variants such as Delta in the summer and Omicron later in the year. The combination of a highly accommodative monetary policy by the Fed and Congress passing two separate, trillion dollar-plus fiscal stimulus packages, maintained a high level of liquidity and inexpensive financing, and a general tailwind for the capital markets. Re-emerging pandemic concerns and prospects of tighter monetary conditions dampened capital markets overseas, particularly in developing economies which were also impacted by Chinese regulatory pressure and the feared collapse of Chinese property developer, Evergrande.
U.S. equity markets posted strong returns for 2021. Value equities outperformed their growth counterparts within the small and mid-capitalization ranges. Growth outperformed among the mega-caps due largely to the weight and strength of Information Technology constituents, Apple Inc., Microsoft Corp, and NVIDIA Corp. From a market capitalization perspective, small capitalization stocks, which tend to be more economically sensitive, underperformed mid-caps, while mid-caps underperformed large-caps. From a sector perspective, U.S. equities were led by Energy, Real Estate, Financials, and Information Technology.
As previously noted, the Fed continued its near zero overnight rates and direct purchases of various fixed income securities leading to overall low yields. Low quality fixed income such as non-investment grade corporate credit outperformed investment grade corporate credit. Non-investment grade bonds, municipal bonds, and inflation-protected bonds were among the few fixed income areas to end the year in positive territory.
Markets such as these reaffirm our belief in the importance of the steady hands of financial professionals, trust in your investment strategy, and the risks of trying to time the market. Additionally, we believe that environments that are more volatile create more opportunity for active managers to add value, especially those that are Distinctively Active. We greatly value your continued support. Thank you for including Touchstone as part of your investment plan.
Sincerely,
E. Blake Moore Jr.
President
Touchstone Variable Series Trust
Management's Discussion of Fund Performance (Unaudited)
Touchstone Balanced Fund
Sub-Advised by Fort Washington Investment Advisors, Inc.
Investment Philosophy
The Touchstone Balanced Fund (the “Fund”) seeks to achieve its investment goal of providing investors with capital appreciation and current income by generally investing in a diversified portfolio comprising approximately 60 percent equity securities and 40 percent fixed-income securities.
With respect to equities, the Fund invests primarily in issuers having a market capitalization, at the time of purchase, above $5 billion. Equity securities include common stock and preferred stock. With respect to fixed-income, the Fund invests primarily in bonds, including mortgage-related securities, asset-backed securities, government securities (both U.S. government securities and foreign sovereign debt), and corporate debt securities.
Fund Performance
The Fund (Class I Shares) outperformed its blended benchmark, the 60 percent S&P 500® Index & 40 percent Bloomberg U.S. Aggregate Bond Index, for the 12 month period ended December 31, 2021. The Fund’s total return was 17.07 percent while the total return of the blended benchmark was 15.86 percent.
Market Environment
As we came to the end of 2021, many of the same issues investors faced coming into the year continued to linger as we enter 2022. Markets continue to grapple with the economic impact of COVID-19 as two new variants – Delta and Omicron – reminded us that we are not yet out of the woods with the pandemic. The arrival of the new variants continued to put pressure on supply chains and caused a temporary slowdown in labor demand. In spite of this, the economic recovery persevered on the resiliency of strong consumer spending and business investment. Despite a pullback in growth in the second quarter caused by the Delta variant, consensus estimates of 2021 gross domestic product growth remain above pre-pandemic levels at roughly 6%. In the fourth quarter, the U.S. Federal Reserve Board (Fed) acknowledged that the pace of the economic recovery coupled with persistent supply constraints had pushed inflation beyond levels that warranted a continuation of its asset purchasing program. As we closed out 2021, the Fed made a decidedly hawkish pivot in its policy as it recognized that price increases may be more persistent than initially perceived while stating labor markets had met the requirements towards “substantial further progress.” As a result, the Fed rationalized its decision to accelerate tapering its bond purchases to be completed by the end of March and paved the way to begin raising interest rates in 2022.
To start 2021, the 10 Year Treasury yield jumped almost 80 basis points in the first quarter before eventually ending the year at 1.5%. A notable disconnect throughout 2021 was the level of nominal interest rates versus inflation. Even as inflation reached levels last seen since the late 1980’s, interest rates remained remarkably stable. Thus far, markets seem to be confident that the Fed is taking appropriate measures to tackle inflation without hindering long-term economic growth. As we head into 2022, the speed and aggressiveness at which the Fed eventually pulls back accommodations will shape how risk assets perform.
Amidst this backdrop, fixed income markets faced a challenging year as interest rates were markedly higher, particularly within the intermediate part of the curve, causing the curve to flatten. Emerging Markets lagged all credit markets for the year as COVID-19 and geopolitical events outside the pandemic continued to hamper recovery efforts. However, we believe opportunities in Emerging Markets are likely to persist in countries that were caught in the systemic widening and remain attractive on a country by country basis.
Despite bouts of volatility in interest rates, financial conditions remained extremely accommodative, further bolstering equities. Equity markets continued to march up in 2021 with the S&P 500 ending the year near its all-time high as earnings far outpaced expectations. Mid-Cap equities produced solid returns and outpaced Small-Cap equities. International developed and Emerging Markets equities lagged domestic equites for the year.
Portfolio Review
The Fund began the 12 month period with a slight overweight position to equities versus its strategic benchmark. Over the period, we made two significant changes to positioning. The first such adjustment occurred at the beginning of the second quarter as we eliminated the remaining exposure to High Yield within the fixed income allocation and reallocated proceeds to Investment Grade Credit and Treasuries. The second adjustment came after the end of the third quarter, as we modestly reduced the Fund’s tactical equity target.
Management's Discussion of Fund Performance (Unaudited) (Continued)
Within equities, the Fund’s portfolio was positioned primarily in businesses that have higher returns on capital with barriers to entry. Activity during 2021 moderated relative to 2020, however we continued to find select opportunities that fit our investment process. During the year, new additions for the Fund focused on businesses in the Earnings Power Value and Franchise Value layer. With the slightly elevated risks in our outlook, the portfolio ended the year with a slightly higher cash position relative to year end 2020. We believe our recent moderate reduction in risk in terms of positioning combined with continued disciplined execution of our process will benefit the portfolio going forward.
Within fixed income, we reduced spread risk by trimming half of the Fund's exposure to High Yield to start the 12 month period. Following the end of the first quarter, we eliminated the remaining exposure to High Yield and reallocated proceeds to Investment Grade Credit and Treasuries. At the end of the period the fixed income allocation had a bias to be overweight risk to Securitized Assets, Investment Grade Credit and Emerging Markets Debt. We continue to believe the current macro environment is supportive of risk assets given the strength of the economic recovery and fiscal and monetary policy support.
Outlook and Conclusion
The greatest opportunities for the Fund will be driven by the durability of economic growth, stable inflation, accommodative central bank policy (both domestically and abroad), and decline in COVID-19 risks, which we expect to provide a tailwind to growth moving into 2022. The risk of lingering cases of COVID-19, especially throughout the remaining winter months, creates some near term uncertainty given the possibility of disrupting the momentum and progress made thus far in economic growth. We will continue to closely monitor how this will impact valuations and our assessment for growth going forward. We remain positive on the economy as underlying demand is strong and growth is rebounding. COVID-19 Omicron variant, supply constraints (supply chain and labor), elevated inflation, and tightening policy are risks to monitor over the near-term. Even as the Fed begins tapering asset purchases and contemplates rate hikes, we believe Fed policy will still support the recovery. Amid strong inflation data, labor market conditions will be a key factor for changes in Fed policy over coming months.
We believe consumer demand and business investment supports continued economic growth, and increased productivity could help offset wage gains, lessening inflation pressures. Omicron variant adds new uncertainty, but we believe the underlying fundamentals of the economy are strong.
Our belief in the Fund’s continued overweight position in equities over fixed income is driven by both valuations and an overweight to risk given the economic environment. Within equities, we view the market as fairly valued with earnings likely to be the main driver of returns. Within fixed income, we believe credit valuations are generally fully valued. Solid fundamentals and accommodative policy support current levels. Interest rates reflect growth concern over the new variant. If growth is largely unaffected and inflation remains firm, rates are at risk to rise given potential acceleration of Fed tapering and mid-2022 rate hikes.
We believe the Fund is well positioned given our outlook from both top down sector allocation and security selection.
Management's Discussion of Fund Performance (Unaudited) (Continued)
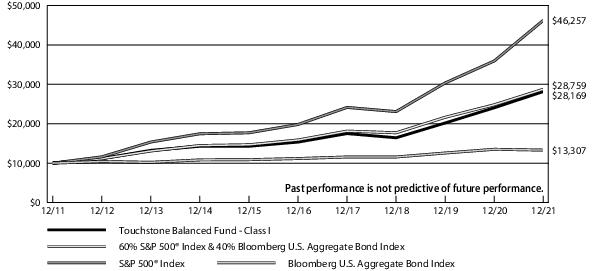
Comparison of the Change in Value of a $10,000 Investment in the Touchstone Balanced Fund Class I, the 60% S&P 500® Index & 40% Bloomberg U.S.Aggregate Bond Index, the S&P 500® Index and the Bloomberg U.S. Aggregate Bond Index
| Average Annual Total Returns |
| Touchstone Balanced Fund | 1 Year | 5 Years | 10 Years |
| Class I | 17.07% | 12.91% | 10.91% |
| Class SC* | 17.07% | 12.91% | 10.91% |
| 60% S&P 500® Index & 40% Bloomberg U.S. Aggregate Bond Index | 15.86% | 12.62% | 11.14% |
| S&P 500® Index | 28.71% | 18.47% | 16.55% |
| Bloomberg U.S. Aggregate Bond Index | -1.54% | 3.57% | 2.90% |
| * | The chart above represents performance of Class I shares only, which will vary from the performance of Class SC shares based on the differences in fees paid by shareholders in the different classes. The inception date of Class SC shares was April 13, 2021. Class SC shares performance was calculated using the historical performance of Class I shares for the periods prior to April 13, 2021. The returns have been restated for fees applicable to Class SC shares. |
Performance information does not reflect fees that are paid by the separate accounts through which shares of the Fund are sold. Inclusion of those fees would reduce figures for all periods.
Note to Chart
S&P 500® Index is a group of 500 widely held stocks and is commonly regarded to be representative of the large capitalization stock universe.
Bloomberg U.S. Aggregate Bond Index is an unmanaged index comprised of U.S. investment grade, fixed rate bond market securities, including government, government agency, corporate and mortgage-backed securities between one and ten years.
Management's Discussion of Fund Performance (Unaudited)
Touchstone Bond Fund
Sub-Advised by Fort Washington Investment Advisors, Inc.
Investment Philosophy
The Touchstone Bond Fund (the “Fund”) seeks to provide as high a level of current income as is consistent with the preservation of capital. Capital appreciation is a secondary goal. Under normal circumstances, the Fund invests at least 80 percent of its assets in bonds. Bonds include mortgage-related securities, asset-backed securities, government securities and corporate debt securities. The Fund primarily invests in investment-grade debt securities, but may invest up to 30 percent of total assets in non-investment-grade debt securities rated as low as B by a Nationally Recognized Statistical Rating Organization (NRSRO).
Fund Performance
The Fund (Class I Shares) outperformed its benchmark, the Bloomberg U.S. Aggregate Bond Index, for the 12-month period ended December 31, 2021. The Fund’s total return was -1.21 percent, while the total return of the benchmark was -1.54 percent.
Market Environment
As we came to the end of 2021, many of the same issues investors faced coming into the year continued to linger as we enter 2022. Markets continue to grapple with the economic impact of COVID-19 as two new variants – Delta and Omicron – reminded us that we are not yet out of the woods with the pandemic. The arrival of the new variants continued to put pressure on supply chains and caused a temporary slowdown in labor demand. In spite of this, the economic recovery persevered on the resiliency of strong consumer spending and business investment. Despite a pullback in growth in the second quarter caused by the Delta variant, consensus estimates of 2021 gross domestic product growth remain above pre-pandemic levels at roughly 6%. In the fourth quarter, the U.S. Federal Reserve Board (Fed) acknowledged that the pace of the economic recovery coupled with persistent supply constraints had pushed inflation beyond levels that warranted a continuation of its asset purchasing program. As we closed out 2021, the Fed made a decidedly hawkish pivot in its policy, as it recognized that price increases may be more persistent than initially perceived while stating labor markets had met the requirements towards “substantial further progress.” As a result, the Fed rationalized its decision to accelerate tapering its bond purchases to be completed by the end of March and paved the way to begin raising interest rates in 2022.
To start 2021, the 10 Year Treasury yield jumped almost 80 basis points in the first quarter before eventually ending the year at 1.5%. A notable disconnect throughout 2021 was the level of nominal interest rates versus inflation. Even as inflation reached levels last seen since the late 1980’s, interest rates remained remarkably stable. Thus far, markets seem to be confident that the Fed is taking appropriate measures to tackle inflation without hindering long-term economic growth. As we head into 2022, the speed and aggressiveness at which the Fed eventually pulls back accommodations will shape how risk assets perform.
Amidst this backdrop, fixed income markets faced a challenging year as interest rates were markedly higher, particularly within the intermediate part of the curve, causing the curve to flatten. Emerging markets lagged all credit markets for the year as COVID and geopolitical events outside the pandemic continued to hamper recovery efforts. However, we believe opportunities in Emerging Markets are likely to persist in countries that were caught in the systemic widening and remain attractive on a country by country basis.
Portfolio Review
The Fund’s overweight position to spread risk versus the benchmark contributed to returns, specifically due to the Fund’s overweight position to High Yield and Investment Grade Credit. High Yield and Investment Grade Credit ended the period with spreads tightened while Emerging Market Debt spreads widened.
Strong selection from Investment Grade Credit and Securitized Assets contributed to returns for the year. Within Investment Grade Credit, the Fund was positioned with overweights to non-defensive sectors, contributing to performance. Within Securitized Assets, outperformance was largely driven by spread effects due to the retracement in out of index sectors (CMBS, ABS and CLOs).
Lastly, interest rate management as well as the Fund's position to be both short and long duration versus the benchmark slightly detracted from performance. The Fund was also positioned to be both over- and underweight the long end of the curve throughout the one year period.
At the start of the twelve month period, we trimmed half of the Fund’s exposure to High Yield. Following the end of the first quarter, we eliminated the remaining exposure to High Yield and relocated proceeds to Investment Grade Credit and Treasuries.
Management's Discussion of Fund Performance (Unaudited) (Continued)
At the end of the period the Fund had a bias to be overweight risk to Securitized Assets, Investment Grade Credit and Emerging Markets Debt. We continue to believe the current macro environment is supportive of risk assets given the strength of the economic recovery and fiscal and monetary policy support.
Outlook and Conclusion
The greatest opportunities for the Fund will be driven by the durability of economic growth, stable inflation, accommodative central bank policy (both domestically and abroad), and decline in COVID risks, which we expect to provide a tailwind to growth moving into 2022. There remains uncertainty as to whether supply constraints and pace of economic growth will result in sustainable, persistent inflation or whether such factors are simply an adjustment in price levels (i.e., transitory inflation). Should inflation prove to be persistent beyond the initial impact from the economic reopening, we believe the Fed would react as necessary to keep inflation under control, likely resulting in headwinds to economic growth.
Our economic outlook supports credit spreads at current levels and a steady move higher in rates and we believe the Fund is well positioned to outperform the benchmark given our outlook. We look for positive returns to continue to stem from our top down management of interest rates, sector allocation and security selection from our credit and structured products investment teams. We believe valuations of rates across the curve generally reflect the improving economic outlook and will remain low for some time given statements issued and policies enacted by the Fed. Risks to lower interest rates come from increased concerns over the global impact of coronavirus and resulting impact on economic data. Risks to higher interest rates include higher than expected inflation, a shift in Fed policy, and expansionary fiscal policy.
Our preference within the Securitized sector remains in high-quality, non-government securities: ABS, CMBS, and Non-Agency RMBS. The recovery in spreads has been broad-based with the exception of hospitality-related CMBS (low occupancy rates) and certain Whole Business ABS credits (low foot traffic), which have lagged. Within Investment Grade Credit, we believe the Fund is positioned to outperform mainly driven by excess carry and downside avoidance. We are generally favoring down in credit for non-cyclical sectors such as utilities, while selectively adding higher quality names in cyclical sectors such as manufacturing and consumer. While we are still positive on risk assets given the long-term economic outlook and expected policy support, valuations have recovered significantly since the March 2020 selloff. Valuations of High Yield spreads ended the year near the 30th percentile on a historical basis, and we think it is appropriate to slightly reduce exposure at these levels. The Fund continues to have a modest allocation to U.S. dollar denominated Emerging Markets debt but we will continue to monitor the impact of COVID-19 and how emerging economies are able to contain the virus and maintain sustainable economic growth.
Management's Discussion of Fund Performance (Unaudited) (Continued)
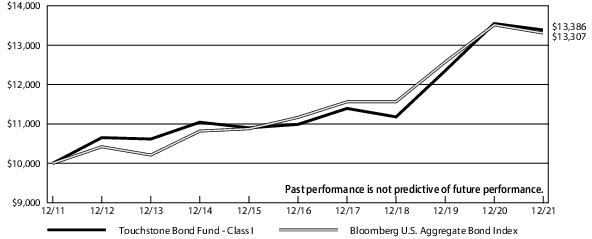
Comparison of the Change in Value of a $10,000 Investment in the Touchstone Bond Fund Class I and the Bloomberg U.S. Aggregate Bond Index
| Average Annual Total Returns |
| Touchstone Bond Fund | 1 Year | 5 Years | 10 Years |
| Class I | -1.21% | 4.02% | 2.96% |
| Class SC* | -1.30% | 3.81% | 2.70% |
| Bloomberg U.S. Aggregate Bond Index | -1.54% | 3.57% | 2.90% |
| * | The chart above represents performance of Class I shares only, which will vary from the performance of Class SC shares based on the differences in fees paid by shareholders in the different classes. The inception date of Class SC shares was July 10, 2019. Class SC shares performance was calculated using the historical performance of Class I shares for the periods prior to July 10, 2019. The returns have been restated for fees applicable to Class SC shares. |
Performance information does not reflect fees that are paid by the separate accounts through which shares of the Fund are sold. Inclusion of those fees would reduce figures for all periods.
Note to Chart
Bloomberg U.S. Aggregate Bond Index is an unmanaged index comprised of U.S. investment grade, fixed rate bond market securities, including government, government agency, corporate and mortgage-backed securities between one and ten years.
Management's Discussion of Fund Performance (Unaudited)
Touchstone Common Stock Fund
Sub-Advised by Fort Washington Investment Advisors, Inc.
Investment Philosophy
The Touchstone Common Stock Fund (the “Fund”) seeks to provide investors with capital appreciation. The Fund invests at least 80 percent of its assets in large capitalization equity securities. The Fund’s sub-advisor, Fort Washington Investment Advisors, Inc., seeks to invest in companies that are trading below what is believed to be the estimate of the companies’ intrinsic value and have a sustainable competitive advantage or a high barrier to entry in place. The barrier(s) to entry can be created through a cost advantage, economies of scale, high customer loyalty or a government barrier (e.g. license or subsidy). Fort Washington believes that the strongest barrier to entry is the combination of economies of scale and high customer loyalty.
Fund Performance
The Fund (Class I Shares) underperformed its benchmark, the S&P 500® Index, for the 12-month period ended December 31, 2021. The Fund’s total return was 27.85 percent while the benchmark’s total return was 28.71 percent.
Market Environment
U.S. equities ended 2021 with strong returns for the year due to accommodative financial conditions, corporate earnings growth, and vaccination progress. Energy led the market higher during the year. The Consumer Staples sector was the worst performer for the period.
Portfolio Review
Within the Fund’s portfolio, the sectors where holdings outperformed relative to the benchmark include Real Estate, Financials, Communication Services, Health Care, and Industrials. Sectors where holdings lagged relative to the benchmark include Information Technology, Energy, Consumer Staples, Materials, and Consumer Discretionary. Stock selection detracted slightly from performance for the period. Sector allocation added to performance primarily due to the Fund having no exposure to Utilities and an underweight position in Consumer Staples.
At the holding level, the three largest contributors were Signature Bank (Financials), Alphabet (Communication Services), and Jones Lang LaSalle (Real Estate). The three largest detractors for the period were Alibaba (Consumer Discretionary), Trip.com (Consumer Discretionary), and JD.com (Consumer Discretionary).
Outlook and Conclusion
Politicians avoided a government shutdown and stripped some of the onerous tax provisions from the Build Back Better bill. Entering 2022 there are several lingering headwinds for investors including anticipated Federal Reserve tightening monetary policy, surging COVID-19 cases, elevated inflation, geopolitical flare-ups, and supply chain issues. One of the key risks we will be monitoring in 2022 is the prospect for a negative inflection in global Purchasing Managers’ Indexes or a slowdown in corporate earnings growth during a period when governments are reducing stimulus. In combination, these factors have historically been challenging for the equity market. We currently view the elevated risks in the global economy and weakening market breadth as indications that volatility is likely to continue. However, we see limited signals of a major market pullback in the indicators we prioritize. In terms of valuation, we believe the U.S. equity market in aggregate continues to be priced around fair value. Financial conditions, although poised to tighten in the coming year, remain quite accommodative by historical standards. Consumer demand is healthy buoyed by high personal savings rates. Corporations are well capitalized to pursue capital expenditures as they seek to manage challenges with labor and supply chains among others. Overall, we believe the strength in the U.S. economy, favorable financial conditions, and fair valuations continue to suggest reasonable returns going forward.
At the end of the year, the Fund continued to emphasize businesses with higher barriers to entry and returns on capital. Activity during 2021 moderated relative to 2020 but we have continued to find select opportunities that fit our investment process. During the year, new additions for the portfolio focused on businesses in the Earnings Power Value and Franchise Value layer. With the limited margin of safety in the equity market and the risks noted in our outlook, the portfolio ended the year with a slightly higher cash position relative to year end 2020. We believe our recent moderate reduction in risk in terms of positioning combined with continued disciplined execution of our process will benefit the portfolio going forward.
Management's Discussion of Fund Performance (Unaudited) (Continued)
Comparison of the Change in Value of a $10,000 Investment in the Touchstone Common Stock Fund Class I and the S&P 500® Index
| Average Annual Total Returns |
| Touchstone Common Stock Fund | 1 Year | 5 Years | 10 Years |
| Class I | 27.85% | 17.83% | 15.53% |
| Class SC* | 27.57% | 17.52% | 15.19% |
| S&P 500® Index | 28.71% | 18.47% | 16.55% |
| * | The chart above represents performance of Class I shares only, which will vary from the performance of Class SC shares based on the differences in fees paid by shareholders in the different classes. The inception date of Class SC shares was July 10, 2019. Class SC shares performance was calculated using the historical performance of Class I shares for the periods prior to July 10, 2019. The returns have been restated for fees applicable to Class SC shares. |
Performance information does not reflect fees that are paid by the separate accounts through which shares of the Fund are sold. Inclusion of those fees would reduce figures for all periods.
Note to Chart
S&P 500® Index is a group of 500 widely held stocks and is commonly regarded to be representative of the large capitalization stock universe.
Management's Discussion of Fund Performance (Unaudited)
Touchstone Small Company Fund
Sub-Advised by Fort Washington Investment Advisors, Inc.
Investment Philosophy
The Touchstone Small Company Fund (the “Fund”) seeks to provide investors with growth of capital by investing primarily in common stocks of small companies that the sub-advisor believes are high quality, have superior business models, solid management teams, sustainable growth potential and are attractively valued.
Fund Performance
The Fund outperformed its benchmark, the Russell 2000® Index, for the 12-month period ended December 31, 2021. The Fund’s total return was 24.18 percent while the return of the benchmark was 14.82 percent.
Market Environment
The Russell 2000® Index posted solid returns for 2021. We believe strong first half returns were driven by a combination of factors. First, the unprecedented fiscal and monetary stimulus in response to the COVID-19 pandemic supported the economy through a phased re-opening of economy activity. Furthermore, developments on the political front with the election of President Biden and Democratic sweep of Congress were well received by equity markets in anticipation of and delivery of the American Rescue plan. Additionally, the COVID-19 vaccine adoption drove market appreciation on hopes of a return to a pre-COVID-19 pandemic way of life. The business cycle experienced a robust V-shaped recovery. Corporate profitability also experienced a V-shaped recovery. In fact, small cap earnings in 2021 were expected to be 45 percent higher than pre-pandemic in 2019. We believe the negative second half returns were also driven by a combination of elements. First, the execution of the ambitious Biden fiscal agenda by Congress did not come to fruition. Second, the surge in economic growth driven by the re-opening and fiscal and monetary stimulus created inflationary pressures. Monetary policy moved from accommodative to tightening as the Federal Reserve tapered bond purchases and discussed future interest rate hikes. Lastly, the return to a pre-pandemic way of life quickly was pushed out, first with the Delta and then Omicron COVID-19 variants which created continued disruption across many sectors.
From a sector perspective, Energy, Real Estate, Financials, Consumer Discretionary, Industrials, Materials, Consumer Staples, and Information Technology outperformed the overall Small Cap market. Utilities, Communication Services, and Health Care underperformed.
Portfolio Review
The Fund’s top contributing sectors were Health Care, Information Technology, Consumer Discretionary, and Industrials. The portfolio’s top four performing stocks were the following: Onto Innovation Inc. (Technology sector), a manufacturer of process control systems for the semiconductor manufacturing industry; Skyline Champion Corp. (Consumer Cyclical sector), a manufacturer of mobile homes and other manufactured housing; Aritzia Inc. (Consumer Cyclical sector), a specialty apparel multi-channel retail company; and Western Alliance Bancorporation (Financial Services sector), a regional bank with national business lending segments as well.
The Fund’s largest detracting sectors were Real Estate and Consumer Staples. The portfolio’s bottom five performing stocks were the following: Cognyte Software Ltd. (Technology sector), a security software provider; Tactile Systems Technology (Healthcare sector), a provider of medical devices to treat chronic diseases at home; 8X8 Inc. (Technology sector), a provider of enterprise communication solutions; Encompass Health Corp. (Healthcare sector), a provider of post-acute health care services; and Addus Homecare Corp. (Healthcare sector), a provider of in-home personal care services.
At the end of the year, the Fund was overweight the following sectors: Consumer Discretionary, Industrials, Information Technology, Materials, and Communication Services. The Fund was underweight the following sectors: Consumer Staples, Energy, Financials, Health Care, Real Estate, and Utilities.
Outlook and Conclusion
We believe that the Small Cap market is focused on where we are in the current economic and corporate earnings cycle, the U.S. Federal Reserve Board and the potential impact of tightening monetary policy, and the confluence of pandemic-related factors impact on both, most recently with the COVID-19 Omicron variant. We remain focused on executing our fundamental stock selection and portfolio management process. We believe that stocks experience a four-stage investment cycle and our research process is focused on the dynamics that apply to each stage of the investment cycle. We believe that excess returns and lower volatility are driven by the ability to successfully identify a stock’s current stage and the potential for it to transition to a different stage of its investment cycle.
Management's Discussion of Fund Performance (Unaudited) (Continued)
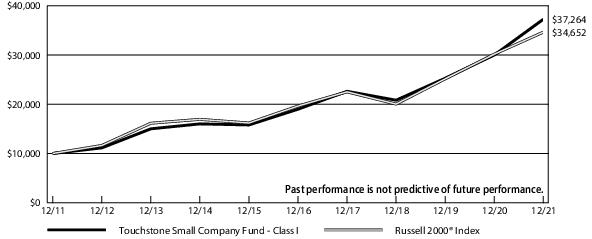
Comparison of the Change in Value of a $10,000 Investment in the Touchstone Small Company Fund Class I and the Russell 2000® Index
| Average Annual Total Returns |
| Touchstone Small Company Fund | 1 Year | 5 Years | 10 Years |
| Class I | 24.18% | 14.42% | 14.06% |
| Russell 2000® Index | 14.82% | 12.02% | 13.23% |
The inception date of the Fund was November 30, 2000.
Performance information does not reflect fees that are paid by the separate accounts through which shares of the Fund are sold. Inclusion of those fees would reduce figures for all periods.
Notes to Chart
Russell 2000® Index measures the performance of the small-cap segment of the U.S. equity universe.
The Frank Russell Company (FRC) is the source and owner of the Russell 2000® Index data contained or reflected in this material and all trademarks and copyrights related thereto. The material may contain confidential information and unauthorized use, disclosure, copying, dissemination or redistribution is strictly prohibited. This is a Touchstone Investments presentation of the data, and FRC is not responsible for the formatting or configuration of this material or for any inaccuracy in the presentation thereof.
Tabular Presentation of Portfolio of Investments (Unaudited)
December 31, 2021
The tables below provide each Fund’s sector allocation and/or credit quality. We hope it will be useful to shareholders as it summarizes key information about each Fund’s investments.
Touchstone Balanced Fund
| Credit Quality*(% of Fixed Income Securities) |
| AAA/Aaa | 49.9% |
| AA/Aa | 4.6 |
| A/A | 14.9 |
| BBB/Baa | 29.8 |
| BB/Ba | 0.8 |
| Total | 100.0% |
| Sector Allocation**(% of Net Assets) |
| Common Stocks | |
| Information Technology | 19.3% |
| Communication Services | 12.2 |
| Health Care | 8.8 |
| Financials | 7.5 |
| Consumer Discretionary | 6.6 |
| Industrials | 6.0 |
| Consumer Staples | 2.4 |
| Real Estate | 1.7 |
| Energy | 1.4 |
| Materials | 1.0 |
| Corporate Bonds | 15.2 |
| U.S. Treasury Obligations | 14.0 |
| Exchange-Traded Fund | 1.7 |
| U.S. Government Mortgage-Backed Obligations | 0.9 |
| Sovereign Government Obligations | 0.2 |
| Short-Term Investment Fund | 1.2 |
| Other Assets/Liabilities (Net) | (0.1) |
| Total | 100.0% |
Touchstone Bond Fund
| Credit Quality*(% of Fixed Income Securities) |
| AAA/Aaa | 52.5% |
| AA/Aa | 6.2 |
| A/A | 10.7 |
| BBB/Baa | 25.8 |
| BB/Ba | 1.1 |
| B/B | 0.7 |
| CC | 0.1 |
| Cash Equivalents | 2.9 |
| Total | 100.0% |
Touchstone Common Stock Fund
| Sector Allocation**(% of Net Assets) |
| Information Technology | 27.7% |
| Communication Services | 18.1 |
| Health Care | 13.3 |
| Financials | 10.9 |
| Consumer Discretionary | 9.8 |
| Industrials | 9.1 |
| Consumer Staples | 3.5 |
| Real Estate | 2.5 |
| Energy | 2.0 |
| Materials | 1.6 |
| Short-Term Investment Fund | 0.0 |
| Other Assets/Liabilities (Net) | 1.5 |
| Total | 100.0% |
* Credit quality ratings are from Standard & Poor's (“S&P”) and Moody's Investors Service (“Moody's”). If agency ratings differ, the higher rating will be used. Where no rating has been assigned, it may be for reasons unrelated to the creditworthiness of the issuer.
** Sector classifications are based upon the Global Industry Classification Standard (GICS®).
Tabular Presentation of Portfolio of Investments (Unaudited) (Continued)
Touchstone Small Company Fund
| Sector Allocation*(% of Net Assets) |
| Consumer Discretionary | 19.6% |
| Industrials | 17.9 |
| Health Care | 17.0 |
| Information Technology | 16.6 |
| Financials | 13.1 |
| Real Estate | 5.8 |
| Materials | 5.6 |
| Communication Services | 3.8 |
| Consumer Staples | 0.1 |
| Short-Term Investment Fund | 1.1 |
| Other Assets/Liabilities (Net) | (0.6) |
| Total | 100.0% |
* Sector classifications are based upon the Global Industry Classification Standard (GICS®).
Portfolio of Investments
Touchstone Balanced Fund – December 31, 2021
| Shares | | | | Market
Value |
| | Common Stocks — 66.9% | |
| | Information Technology — 19.3% | |
| 19,164 | Apple, Inc. | $ 3,402,952 |
| 4,367 | International Business Machines Corp. | 583,693 |
| 13,113 | Microsoft Corp. | 4,410,164 |
| 11,246 | Oracle Corp. | 980,764 |
| 5,146 | salesforce.com, Inc.* | 1,307,753 |
| 8,036 | SS&C Technologies Holdings, Inc. | 658,791 |
| 5,122 | Texas Instruments, Inc. | 965,343 |
| 3,973 | Visa, Inc. - Class A | 860,989 |
| 2,796 | Workday, Inc. - Class A* | 763,811 |
| | | | | 13,934,260 |
| | Communication Services — 12.2% | |
| 1,080 | Alphabet, Inc. - Class C* | 3,125,077 |
| 9,870 | AT&T, Inc. | 242,802 |
| 16,852 | Comcast Corp. - Class A | 848,161 |
| 11,397 | Fox Corp. - Class A | 420,549 |
| 8,455 | Meta Platforms, Inc. - Class A* | 2,843,839 |
| 1,358 | Netflix, Inc.* | ���818,114 |
| 3,151 | Walt Disney Co. (The)* | 488,059 |
| | | | | 8,786,601 |
| | Health Care — 8.8% | |
| 5,185 | AmerisourceBergen Corp. | 689,034 |
| 7,342 | BioMarin Pharmaceutical, Inc.* | 648,666 |
| 17,880 | Bristol-Myers Squibb Co. | 1,114,818 |
| 3,770 | HCA Healthcare, Inc. | 968,588 |
| 8,130 | Johnson & Johnson | 1,390,799 |
| 3,162 | UnitedHealth Group, Inc. | 1,587,767 |
| | | | | 6,399,672 |
| | Financials — 7.5% | |
| 30,076 | Bank of America Corp. | 1,338,081 |
| 6,010 | Berkshire Hathaway, Inc. - Class B* | 1,796,990 |
| 3,795 | Goldman Sachs Group, Inc. (The) | 1,451,778 |
| 2,577 | Signature Bank | 833,582 |
| | | | | 5,420,431 |
| | Consumer Discretionary — 6.6% | |
| 2,126 | Airbnb, Inc. - Class A* | 353,958 |
| 3,142 | Alibaba Group Holding Ltd. (China) ADR* | 373,238 |
| 720 | Amazon.com, Inc.* | 2,400,725 |
| 7,922 | Hilton Worldwide Holdings, Inc.* | 1,235,753 |
| 3,294 | Starbucks Corp. | 385,299 |
| | | | | 4,748,973 |
| | Industrials — 6.0% | |
| 2,047 | Deere & Co. | 701,896 |
| 1,118 | FedEx Corp. | 289,159 |
| 5,052 | Hubbell, Inc. | 1,052,180 |
| 2,174 | Parker-Hannifin Corp. | 691,593 |
| 14,999 | Raytheon Technologies Corp. | 1,290,814 |
| 7,549 | Southwest Airlines Co.* | 323,399 |
| | | | | 4,349,041 |
| | Consumer Staples — 2.4% | |
| 9,646 | Monster Beverage Corp.* | 926,402 |
| 8,556 | Philip Morris International, Inc. | 812,820 |
| | | | | 1,739,222 |
| | Real Estate — 1.7% | |
| 4,451 | Jones Lang LaSalle, Inc.* | 1,198,832 |
| | Energy — 1.4% | |
| 10,485 | Exxon Mobil Corp. | 641,577 |
| 11,589 | Schlumberger NV | 347,091 |
| | | | | 988,668 |
| Shares | | | | Market
Value |
| | | |
| | Materials — 1.0% | |
| 9,297 | DuPont de Nemours, Inc. | $ 751,012 |
| | Total Common Stocks | $48,316,712 |
Principal
Amount | | | | |
| | Corporate Bonds — 15.2% | |
| | Financials — 4.2% | |
| $ 150,000 | AerCap Ireland Capital DAC / AerCap Global Aviation Trust (Ireland), 2.450%, 10/29/26 | 151,329 |
| 130,000 | Allstate Corp. (The), 1.450%, 12/15/30 | 123,037 |
| 60,000 | American Financial Group, Inc., 5.250%, 4/2/30 | 71,560 |
| 112,000 | Ares Capital Corp., 3.250%, 7/15/25 | 115,721 |
| 81,000 | Bank of America Corp., 2.687%, 4/22/32 | 82,294 |
| 82,000 | Bank of America Corp., 3.705%, 4/24/28 | 89,046 |
| 119,000 | Bank of America Corp., MTN, 4.000%, 1/22/25 | 127,130 |
| 94,000 | Bank of Montreal (Canada), 3.803%, 12/15/32 | 100,895 |
| 70,000 | Berkshire Hathaway Finance Corp., 4.250%, 1/15/49 | 86,252 |
| 142,000 | Charles Schwab Corp. (The), 1.150%, 5/13/26 | 140,164 |
| 128,000 | Citigroup, Inc., 0.981%, 5/1/25 | 127,014 |
| 77,000 | Citigroup, Inc., 3.200%, 10/21/26 | 81,642 |
| 45,000 | Citigroup, Inc., 4.750%, 5/18/46 | 55,511 |
| 138,000 | Corestates Capital III, 144a, (3M LIBOR +0.570%), 0.726%, 2/15/27(A) | 134,232 |
| 122,000 | Goldman Sachs Group, Inc. (The), 2.615%, 4/22/32 | 123,015 |
| 55,000 | Goldman Sachs Group, Inc. (The), 3.691%, 6/5/28 | 59,265 |
| 126,000 | Huntington Bancshares, Inc., 2.550%, 2/4/30 | 128,036 |
| 128,000 | JPMorgan Chase & Co., 2.956%, 5/13/31 | 132,663 |
| 100,000 | JPMorgan Chase & Co., 3.509%, 1/23/29 | 107,205 |
| 200,000 | Lloyds Banking Group PLC (United Kingdom), 3.574%, 11/7/28 | 213,750 |
| 112,000 | Mastercard, Inc., 2.000%, 11/18/31 | 111,795 |
| 109,000 | Morgan Stanley, 3.950%, 4/23/27 | 119,925 |
| 77,000 | Northwestern Mutual Life Insurance Co. (The), 144a, 3.850%, 9/30/47 | 87,095 |
| 132,000 | PNC Capital Trust, (3M LIBOR +0.570%), 0.741%, 6/1/28(A) | 128,418 |
| 120,000 | Toronto-Dominion Bank (The) (Canada), MTN, 1.150%, 6/12/25 | 119,043 |
| 197,000 | Truist Bank, Ser A, (3M LIBOR +0.670%), 0.820%, 5/15/27(A) | 191,568 |
| 22,000 | Truist Financial Corp., MTN, 2.850%, 10/26/24 | 22,993 |
| | | | | 3,030,598 |
| | Industrials — 1.5% | |
| 98,000 | Amcor Flexibles North America, Inc., 2.630%, 6/19/30 | 98,449 |
| 29,000 | Boeing Co. (The), 5.040%, 5/1/27 | 32,673 |
| 31,000 | Boeing Co. (The), 5.805%, 5/1/50 | 42,114 |
| 81,000 | Burlington Northern Santa Fe LLC, 5.750%, 5/1/40 | 112,711 |
| 118,000 | CNH Industrial Capital LLC, 1.450%, 7/15/26 | 115,537 |
| 94,000 | FedEx Corp., 5.100%, 1/15/44 | 119,540 |
| 99,000 | John Deere Capital Corp., MTN, 2.450%, 1/9/30 | 102,070 |
| 81,000 | Norfolk Southern Corp., 4.837%, 10/1/41 | 102,335 |
| 103,000 | Roper Technologies, Inc., 2.950%, 9/15/29 | 106,630 |
| 120,000 | Waste Management, Inc., 2.500%, 11/15/50 | 114,636 |
| 117,000 | Xylem, Inc., 1.950%, 1/30/28 | 115,765 |
| | | | | 1,062,460 |
| | Health Care — 1.4% | |
| 84,000 | AbbVie, Inc., 4.450%, 5/14/46 | 101,909 |
| 76,000 | Becton Dickinson and Co., 4.685%, 12/15/44 | 95,652 |
| 67,000 | Bristol-Myers Squibb Co., 5.000%, 8/15/45 | 89,278 |
| 86,000 | CommonSpirit Health, 4.187%, 10/1/49 | 100,414 |
| 100,000 | CommonSpirit Health, 4.200%, 8/1/23 | 104,581 |
| 73,000 | CVS Health Corp., 5.125%, 7/20/45 | 95,178 |
| 104,000 | DH Europe Finance II Sarl, 3.250%, 11/15/39 | 111,315 |
Touchstone Balanced Fund (Continued)
Principal
Amount | | | | MarketValue |
| | Corporate Bonds — 15.2% (Continued) | |
| | Health Care — (Continued) | |
| $ 45,000 | Johnson & Johnson, 2.900%, 1/15/28 | $ 48,016 |
| 93,000 | Mylan, Inc., 4.550%, 4/15/28 | 104,174 |
| 107,000 | UnitedHealth Group, Inc., 3.500%, 8/15/39 | 118,948 |
| | | | | 969,465 |
| | Energy — 1.3% | |
| 200,000 | Aker BP ASA (Norway), 144a, 3.000%, 1/15/25 | 207,343 |
| 78,000 | Boardwalk Pipelines LP, 4.800%, 5/3/29 | 87,427 |
| 65,000 | Canadian Natural Resources Ltd. (Canada), 6.250%, 3/15/38 | 85,708 |
| 74,000 | Cenovus Energy, Inc. (Canada), 5.250%, 6/15/37 | 87,621 |
| 107,000 | Cheniere Energy Partners LP, 144a, 3.250%, 1/31/32 | 108,070 |
| 60,000 | Continental Resources, Inc., 144a, 5.750%, 1/15/31 | 70,657 |
| 18,000 | Diamondback Energy, Inc., 2.875%, 12/1/24 | 18,678 |
| 115,000 | Energy Transfer LP, 4.150%, 9/15/29 | 123,134 |
| 93,000 | NGPL PipeCo LLC, 144a, 7.768%, 12/15/37 | 130,468 |
| 17,000 | Ovintiv Exploration, Inc., 5.375%, 1/1/26 | 18,838 |
| 20,000 | Sabine Pass Liquefaction LLC, 5.000%, 3/15/27 | 22,476 |
| | | | | 960,420 |
| | Consumer Staples — 1.3% | |
| 127,000 | 7-Eleven, Inc., 144a, 0.950%, 2/10/26 | 123,042 |
| 121,000 | Anheuser-Busch Cos. LLC / Anheuser-Busch InBev Worldwide, Inc. (Belgium), 4.900%, 2/1/46 | 153,410 |
| 200,000 | Imperial Brands Finance PLC (United Kingdom), 144a, 4.250%, 7/21/25 | 214,816 |
| 64,000 | Kroger Co. (The), 5.000%, 4/15/42 | 81,430 |
| 96,000 | Mars, Inc., 144a, 3.875%, 4/1/39 | 111,247 |
| 55,000 | PepsiCo, Inc., 1.625%, 5/1/30 | 53,394 |
| 132,000 | Reynolds American, Inc. (United Kingdom), 4.450%, 6/12/25 | 142,525 |
| 65,000 | Starbucks Corp., 3.350%, 3/12/50 | 68,220 |
| | | | | 948,084 |
| | Utilities — 1.2% | |
| 52,000 | American Water Capital Corp., 6.593%, 10/15/37 | 75,165 |
| 102,000 | Cleveland Electric Illuminating Co. (The), 144a, 4.550%, 11/15/30 | 117,187 |
| 74,000 | Duke Energy Progress LLC, 4.150%, 12/1/44 | 87,195 |
| 72,000 | Edison International, 4.125%, 3/15/28 | 76,047 |
| 104,000 | Ohio Power Co., 2.900%, 10/1/51 | 100,694 |
| 126,000 | Pacific Gas and Electric Co., 3.500%, 8/1/50 | 117,121 |
| 89,000 | PacifiCorp., 5.750%, 4/1/37 | 117,350 |
| 188,000 | WEC Energy Group, Inc., (3M LIBOR +2.112%), 2.268%, 5/15/67(A) | 174,605 |
| | | | | 865,364 |
| | Communication Services — 1.1% | |
| 42,000 | Alphabet, Inc., 1.900%, 8/15/40 | 38,369 |
| 76,000 | AT&T, Inc., 3.850%, 6/1/60 | 79,717 |
| 54,000 | AT&T, Inc., 4.500%, 5/15/35 | 62,467 |
| 75,000 | Charter Communications Operating LLC / Charter Communications Operating Capital, 6.484%, 10/23/45 | 102,706 |
| 74,000 | Comcast Corp., 4.000%, 3/1/48 | 85,532 |
| 36,000 | Deutsche Telekom International Finance BV (Germany), 8.750%, 6/15/30 | 52,357 |
| 24,000 | Netflix, Inc., 144a, 4.875%, 6/15/30 | 27,990 |
| 118,000 | T-Mobile USA, Inc., 3.875%, 4/15/30 | 129,225 |
| 141,000 | Verizon Communications, Inc., 2.987%, 10/30/56 | 134,050 |
| 76,000 | ViacomCBS, Inc., 4.950%, 5/19/50 | 97,211 |
| | | | | 809,624 |
| | Information Technology — 1.1% | |
| 67,000 | Apple, Inc., 4.650%, 2/23/46 | 88,165 |
Principal
Amount | | | | MarketValue |
| | | |
| | Information Technology — (Continued) | |
| $ 104,000 | Broadcom, Inc., 4.150%, 11/15/30 | $ 115,458 |
| 104,000 | Fiserv, Inc., 3.500%, 7/1/29 | 111,945 |
| 112,000 | Microchip Technology, Inc., 144a, 0.983%, 9/1/24 | 109,965 |
| 49,000 | Microsoft Corp., 3.500%, 2/12/35 | 56,067 |
| 90,000 | NXP BV / NXP Funding LLC (China), 144a, 5.350%, 3/1/26 | 101,731 |
| 46,000 | Oracle Corp., 2.650%, 7/15/26 | 47,299 |
| 65,000 | Visa, Inc., 4.150%, 12/14/35 | 77,901 |
| 96,000 | VMware, Inc., 1.400%, 8/15/26 | 94,402 |
| | | | | 802,933 |
| | Real Estate — 1.0% | |
| 68,000 | American Homes 4 Rent LP REIT, 4.250%, 2/15/28 | 75,385 |
| 100,000 | Crown Castle International Corp. REIT, 3.650%, 9/1/27 | 107,496 |
| 84,000 | Equinix, Inc. REIT, 2.900%, 11/18/26 | 87,071 |
| 98,000 | Healthcare Realty Trust, Inc. REIT, 2.400%, 3/15/30 | 97,620 |
| 122,000 | Host Hotels & Resorts LP REIT, 4.500%, 2/1/26 | 131,504 |
| 55,000 | Mid-America Apartments LP REIT, 3.750%, 6/15/24 | 57,905 |
| 74,000 | Sabra Health Care LP REIT, 5.125%, 8/15/26 | 81,462 |
| 37,000 | STORE Capital Corp. REIT, 4.500%, 3/15/28 | 40,912 |
| 63,000 | STORE Capital Corp. REIT, 4.625%, 3/15/29 | 70,636 |
| | | | | 749,991 |
| | Consumer Discretionary — 0.9% | |
| 60,000 | Ford Motor Co., 3.250%, 2/12/32 | 61,440 |
| 56,000 | General Motors Financial Co., Inc., 5.650%, 1/17/29 | 66,461 |
| 59,000 | Home Depot, Inc. (The), 5.950%, 4/1/41 | 84,866 |
| 94,000 | Hyundai Capital America, 144a, 2.650%, 2/10/25 | 96,368 |
| 113,000 | Lowe's Cos, Inc., 4.500%, 4/15/30 | 131,294 |
| 142,000 | Procter & Gamble Co. (The), 1.200%, 10/29/30 | 134,448 |
| 95,000 | Walmart, Inc., 2.850%, 7/8/24 | 99,289 |
| | | | | 674,166 |
| | Materials — 0.2% | |
| 83,000 | Sherwin-Williams Co. (The), 4.500%, 6/1/47 | 103,777 |
| | Total Corporate Bonds | $10,976,882 |
| | U.S. Treasury Obligations — 14.0% |
| 1,345,000 | U.S. Treasury Bond, 1.750%, 8/15/41 | | | 1,308,223 |
| 95,000 | U.S. Treasury Bond, 1.875%, 2/15/41 | | | 94,328 |
| 1,990,000 | U.S. Treasury Note, 0.125%, 4/30/23 | | | 1,979,428 |
| 2,375,000 | U.S. Treasury Note, 0.250%, 10/31/25 | | | 2,296,421 |
| 1,725,000 | U.S. Treasury Note, 0.375%, 3/31/22 | | | 1,726,170 |
| 1,650,000 | U.S. Treasury Note, 0.750%, 5/31/26 | | | 1,617,000 |
| 1,106,000 | U.S. Treasury Note, 1.625%, 5/15/31 | | | 1,121,208 |
| | Total U.S. Treasury Obligations | $10,142,778 |
| Shares | | | | |
| | Exchange-Traded Fund — 1.7% | |
| 11,188 | iShares JP Morgan USD Emerging Markets Bond ETF | 1,220,163 |
Principal
Amount | | | | |
| | U.S. Government Mortgage-Backed Obligations — 0.9% |
| $ 135,883 | FHLMC, Pool #G05624, 4.500%, 9/1/39 | | | 150,350 |
| 97,296 | FHLMC, Pool #Q29260, 4.000%, 10/1/44 | | | 106,831 |
| 56,293 | FNMA, Pool #725423, 5.500%, 5/1/34 | | | 63,073 |
| 51,327 | FNMA, Pool #725610, 5.500%, 7/1/34 | | | 58,233 |
| 10,206 | FNMA, Pool #890310, 4.500%, 12/1/40 | | | 11,235 |
| 38,195 | FNMA, Pool #AD9193, 5.000%, 9/1/40 | | | 43,120 |
| 178,685 | FNMA, Pool #AL5718, 3.500%, 9/1/44 | | | 192,440 |
| | Total U.S. Government Mortgage-Backed Obligations | $625,282 |
Touchstone Balanced Fund (Continued)
Principal
Amount | | | | MarketValue |
| | Sovereign Government Obligations — 0.2% |
| $ 146,000 | Peruvian Government International Bond, 2.780%, 12/1/60 | $ 128,117 |
| Shares | | | | |
| | Short-Term Investment Fund — 1.2% | |
| 894,202 | Dreyfus Government Cash Management, Institutional Shares, 0.03%∞Ω | $ 894,202 |
| | Total Investment Securities—100.1%
(Cost $60,698,817) | $72,304,136 |
| | Liabilities in Excess of Other Assets — (0.1%) | (62,284) |
| | Net Assets — 100.0% | $72,241,852 |
| (A) | Variable rate security - Rate reflected is the rate in effect as of December 31, 2021. |
| * | Non-income producing security. |
| ∞ | Open-End Fund. |
| Ω | Represents the 7-Day SEC yield as of December 31, 2021. |
| Portfolio Abbreviations: |
| ADR – American Depositary Receipt |
| DAC – Designated Activity Company |
| ETF – Exchange-Traded Fund |
| FHLMC – Federal Home Loan Mortgage Corporation |
| FNMA – Federal National Mortgage Association |
| LIBOR – London Interbank Offered Rate |
| LLC – Limited Liability Company |
| LP – Limited Partnership |
| MTN – Medium Term Note |
| PLC – Public Limited Company |
| REIT – Real Estate Investment Trust |
| 144a - This is a restricted security that was sold in a transaction qualifying for the exemption under Rule 144a of the Securities Act of 1933. This security may be sold in transactions exempt from registration, normally to qualified institutional buyers. At December 31, 2021, these securities were valued at $1,640,211 or 2.3% of net assets. These securities were deemed liquid pursuant to procedures approved by the Board of Trustees. |
Other Information:
The inputs or methodology used for valuing securities may not be an indication of the risk associated with investing in those securities. For more information on valuation inputs, and their aggregation into the levels used in the table below, please refer to the security valuation section in the accompanying Notes to Financial Statements.
| Valuation Inputs at Reporting Date: |
| Description | Level 1 | Level 2 | Level 3 | Total |
| Common Stocks | $48,316,712 | $— | $— | $48,316,712 |
| Corporate Bonds | — | 10,976,882 | — | 10,976,882 |
| U.S. Treasury Obligations | — | 10,142,778 | — | 10,142,778 |
| Exchange-Traded Fund | 1,220,163 | — | — | 1,220,163 |
| U.S. Government Mortgage-Backed Obligations | — | 625,282 | — | 625,282 |
| Sovereign Government Obligations | — | 128,117 | — | 128,117 |
| Short-Term Investment Fund | 894,202 | — | — | 894,202 |
| Total | $50,431,077 | $21,873,059 | $— | $72,304,136 |
See accompanying Notes to Financial Statements.
Portfolio of Investments
Touchstone Bond Fund – December 31, 2021
Principal
Amount | | | | Market
Value |
| | Corporate Bonds — 34.8% | |
| | Financials — 9.8% | |
| $ 400,000 | AerCap Ireland Capital DAC / AerCap Global Aviation Trust (Ireland), 2.450%, 10/29/26 | $ 403,545 |
| 378,000 | Allstate Corp. (The), 1.450%, 12/15/30 | 357,753 |
| 572,579 | American Financial Group, Inc., 5.250%, 4/2/30 | 682,892 |
| 283,000 | Ares Capital Corp., 3.250%, 7/15/25 | 292,401 |
| 200,000 | Bank of America Corp., 2.687%, 4/22/32 | 203,195 |
| 250,000 | Bank of America Corp., 3.705%, 4/24/28 | 271,481 |
| 401,000 | Bank of America Corp., MTN, 4.000%, 1/22/25 | 428,397 |
| 335,000 | Bank of Montreal (Canada), 3.803%, 12/15/32 | 359,572 |
| 230,000 | Bank of Nova Scotia (The) (Canada), (3M LIBOR +0.620%), 0.834%, 9/19/22(A) | 230,794 |
| 374,000 | Bank of Nova Scotia (The) (Canada), Ser 2, 3.625%, 10/27/81 | 361,299 |
| 176,000 | Berkshire Hathaway Finance Corp., 4.250%, 1/15/49 | 216,863 |
| 204,000 | BNP Paribas SA (France), 144a, 4.625%, 3/13/27 | 226,261 |
| 464,000 | Charles Schwab Corp. (The), 1.150%, 5/13/26 | 458,002 |
| 323,000 | Citigroup, Inc., 0.981%, 5/1/25 | 320,512 |
| 225,000 | Citigroup, Inc., 3.200%, 10/21/26 | 238,563 |
| 141,000 | Citigroup, Inc., 4.750%, 5/18/46 | 173,933 |
| 318,000 | Cooperatieve Rabobank UA (Netherlands), 144a, 1.106%, 2/24/27 | 308,693 |
| 365,000 | Corestates Capital III, 144a, (3M LIBOR +0.570%), 0.726%, 2/15/27(A) | 355,035 |
| 352,000 | Goldman Sachs Group, Inc. (The), 2.615%, 4/22/32 | 354,929 |
| 182,000 | Goldman Sachs Group, Inc. (The), 3.691%, 6/5/28 | 196,113 |
| 205,000 | HSBC Holdings PLC (United Kingdom), 3.900%, 5/25/26 | 221,203 |
| 349,000 | Huntington Bancshares, Inc., 2.550%, 2/4/30 | 354,640 |
| 256,000 | JPMorgan Chase & Co., 2.956%, 5/13/31 | 265,326 |
| 336,000 | JPMorgan Chase & Co., 3.509%, 1/23/29 | 360,208 |
| 343,000 | Lloyds Banking Group PLC (United Kingdom), 3.574%, 11/7/28 | 366,582 |
| 374,000 | Mastercard, Inc., 2.000%, 11/18/31 | 373,314 |
| 311,000 | Morgan Stanley, 3.950%, 4/23/27 | 342,172 |
| 273,000 | Northwestern Mutual Life Insurance Co. (The), 144a, 3.850%, 9/30/47 | 308,791 |
| 356,000 | PNC Capital Trust, (3M LIBOR +0.570%), 0.741%, 6/1/28(A) | 346,340 |
| 304,000 | Toronto-Dominion Bank (The) (Canada), MTN, 1.150%, 6/12/25 | 301,576 |
| 551,000 | Truist Bank, Ser A, (3M LIBOR +0.670%), 0.820%, 5/15/27(A) | 535,806 |
| 210,000 | Truist Financial Corp., MTN, 2.850%, 10/26/24 | 219,480 |
| | | | | 10,435,671 |
| | Industrials — 3.1% | |
| 250,000 | Amcor Flexibles North America, Inc., 2.630%, 6/19/30 | 251,145 |
| 79,000 | Boeing Co. (The), 5.040%, 5/1/27 | 89,007 |
| 91,000 | Boeing Co. (The), 5.805%, 5/1/50 | 123,624 |
| 272,000 | Burlington Northern Santa Fe LLC, 5.750%, 5/1/40 | 378,488 |
| 384,000 | CNH Industrial Capital LLC, 1.450%, 7/15/26 | 375,984 |
| 340,000 | FedEx Corp., 5.100%, 1/15/44 | 432,380 |
| 298,000 | John Deere Capital Corp., MTN, 2.450%, 1/9/30 | 307,240 |
| 243,000 | Norfolk Southern Corp., 4.837%, 10/1/41 | 307,006 |
| 285,000 | Roper Technologies, Inc., 2.950%, 9/15/29 | 295,044 |
| 361,000 | Waste Management, Inc., 2.500%, 11/15/50 | 344,864 |
| 423,000 | Weir Group PLC (The) (United Kingdom), 144a, 2.200%, 5/13/26 | 417,322 |
| | | | | 3,322,104 |
| | Energy — 3.0% | |
| 270,000 | Aker BP ASA (Norway), 144a, 3.000%, 1/15/25 | 279,913 |
| 333,000 | Boardwalk Pipelines LP, 4.800%, 5/3/29 | 373,246 |
Principal
Amount | | | | Market
Value |
| | | |
| | Energy — (Continued) | |
| $ 227,000 | Canadian Natural Resources Ltd. (Canada), 6.250%, 3/15/38 | $ 299,319 |
| 207,000 | Cenovus Energy, Inc. (Canada), 5.250%, 6/15/37 | 245,101 |
| 371,000 | Cheniere Energy Partners LP, 144a, 3.250%, 1/31/32 | 374,710 |
| 200,000 | Continental Resources, Inc., 144a, 5.750%, 1/15/31 | 235,524 |
| 395,000 | Energy Transfer LP, 4.150%, 9/15/29 | 422,940 |
| 193,000 | MC Brazil Downstream Trading SARL (Brazil), 144a, 7.250%, 6/30/31 | 192,131 |
| 251,000 | NGPL PipeCo LLC, 144a, 7.768%, 12/15/37 | 352,124 |
| 203,000 | Ovintiv Exploration, Inc., 5.375%, 1/1/26 | 224,952 |
| 206,000 | Petroleos Mexicanos (Mexico), 6.625%, 6/15/35 | 197,924 |
| | | | | 3,197,884 |
| | Communication Services — 3.0% | |
| 104,000 | Alphabet, Inc., 1.900%, 8/15/40 | 95,009 |
| 266,000 | AT&T, Inc., 3.850%, 6/1/60 | 279,011 |
| 238,000 | AT&T, Inc., 4.500%, 5/15/35 | 275,316 |
| 355,000 | British Telecommunications PLC (United Kingdom), 144a, 3.250%, 11/8/29 | 363,220 |
| 209,000 | Charter Communications Operating LLC / Charter Communications Operating Capital, 6.484%, 10/23/45 | 286,208 |
| 243,000 | Comcast Corp., 4.000%, 3/1/48 | 280,867 |
| 124,000 | Deutsche Telekom International Finance BV (Germany), 8.750%, 6/15/30 | 180,342 |
| 310,000 | Netflix, Inc., 144a, 4.875%, 6/15/30 | 361,537 |
| 335,000 | T-Mobile USA, Inc., 3.875%, 4/15/30 | 366,867 |
| 439,000 | Verizon Communications, Inc., 2.987%, 10/30/56 | 417,362 |
| 190,000 | ViacomCBS, Inc., 4.950%, 5/19/50 | 243,028 |
| | | | | 3,148,767 |
| | Consumer Staples — 2.9% | |
| 380,000 | 7-Eleven, Inc., 144a, 0.950%, 2/10/26 | 368,158 |
| 439,000 | Anheuser-Busch Cos. LLC / Anheuser-Busch InBev Worldwide, Inc. (Belgium), 4.900%, 2/1/46 | 556,588 |
| 434,000 | Imperial Brands Finance PLC (United Kingdom), 144a, 4.250%, 7/21/25 | 466,152 |
| 374,000 | JBS Finance Luxembourg Sarl, 144a, 2.500%, 1/15/27 | 369,796 |
| 213,000 | Kroger Co. (The), 5.000%, 4/15/42 | 271,008 |
| 336,000 | Mars, Inc., 144a, 3.875%, 4/1/39 | 389,363 |
| 454,000 | Reynolds American, Inc. (United Kingdom), 4.450%, 6/12/25 | 490,199 |
| 164,000 | Starbucks Corp., 3.350%, 3/12/50 | 172,126 |
| | | | | 3,083,390 |
| | Information Technology — 2.8% | |
| 344,000 | Apple, Inc., 2.750%, 1/13/25 | 359,508 |
| 234,000 | Apple, Inc., 4.650%, 2/23/46 | 307,919 |
| 330,000 | Broadcom, Inc., 4.150%, 11/15/30 | 366,357 |
| 290,000 | Fiserv, Inc., 3.500%, 7/1/29 | 312,153 |
| 370,000 | Microchip Technology, Inc., 144a, 0.983%, 9/1/24 | 363,279 |
| 148,000 | Microsoft Corp., 3.500%, 2/12/35 | 169,346 |
| 328,000 | NXP BV / NXP Funding LLC (China), 144a, 5.350%, 3/1/26 | 370,751 |
| 174,000 | Oracle Corp., 2.650%, 7/15/26 | 178,913 |
| 220,000 | Visa, Inc., 4.150%, 12/14/35 | 263,665 |
| 332,000 | VMware, Inc., 1.400%, 8/15/26 | 326,474 |
| | | | | 3,018,365 |
| | Health Care — 2.7% | |
| 283,000 | AbbVie, Inc., 4.450%, 5/14/46 | 343,335 |
| 232,000 | Alcon Finance Corp. (Switzerland), 144a, 3.800%, 9/23/49 | 259,261 |
| 221,000 | Becton Dickinson and Co., 4.685%, 12/15/44 | 278,146 |
| 229,000 | Bristol-Myers Squibb Co., 5.000%, 8/15/45 | 305,145 |
Touchstone Bond Fund (Continued)
Principal
Amount | | | | Market
Value |
| | Corporate Bonds — 34.8% (Continued) | |
| | Health Care — (Continued) | |
| $ 263,000 | CommonSpirit Health, 4.187%, 10/1/49 | $ 307,079 |
| 190,000 | CommonSpirit Health, 4.200%, 8/1/23 | 198,703 |
| 240,000 | CVS Health Corp., 5.125%, 7/20/45 | 312,913 |
| 293,000 | DH Europe Finance II Sarl, 3.250%, 11/15/39 | 313,608 |
| 234,000 | Mylan, Inc., 4.550%, 4/15/28 | 262,115 |
| 312,000 | UnitedHealth Group, Inc., 3.500%, 8/15/39 | 346,841 |
| | | | | 2,927,146 |
| | Utilities — 2.6% | |
| 222,000 | American Water Capital Corp., 6.593%, 10/15/37 | 320,896 |
| 349,000 | Cleveland Electric Illuminating Co. (The), 144a, 4.550%, 11/15/30 | 400,961 |
| 93,000 | Duke Energy Progress LLC, 4.150%, 12/1/44 | 109,583 |
| 207,000 | Edison International, 4.125%, 3/15/28 | 218,635 |
| 224,000 | Electricite de France SA (France), 144a, 4.875%, 9/21/38 | 271,605 |
| 85,000 | Fortis, Inc. (Canada), 3.055%, 10/4/26 | 88,529 |
| 338,000 | Ohio Power Co., 2.900%, 10/1/51 | 327,255 |
| 372,000 | Pacific Gas and Electric Co., 3.500%, 8/1/50 | 345,787 |
| 127,000 | PacifiCorp., 5.750%, 4/1/37 | 167,455 |
| 532,000 | WEC Energy Group, Inc., (3M LIBOR +2.112%), 2.268%, 5/15/67(A) | 494,095 |
| | | | | 2,744,801 |
| | Real Estate — 2.2% | |
| 361,000 | Crown Castle International Corp. REIT, 3.650%, 9/1/27 | 388,062 |
| 236,000 | Equinix, Inc. REIT, 2.900%, 11/18/26 | 244,628 |
| 285,000 | Healthcare Realty Trust, Inc. REIT, 2.400%, 3/15/30 | 283,895 |
| 338,000 | Host Hotels & Resorts LP REIT, 4.500%, 2/1/26 | 364,331 |
| 186,000 | Mid-America Apartments LP REIT, 3.750%, 6/15/24 | 195,824 |
| 250,000 | Realty Income Corp. REIT, 4.600%, 2/6/24 | 265,931 |
| 290,000 | Sabra Health Care LP REIT, 5.125%, 8/15/26 | 319,242 |
| 96,000 | STORE Capital Corp. REIT, 4.500%, 3/15/28 | 106,151 |
| 188,000 | STORE Capital Corp. REIT, 4.625%, 3/15/29 | 210,787 |
| | | | | 2,378,851 |
| | Consumer Discretionary — 2.1% | |
| 202,000 | Ford Motor Co., 3.250%, 2/12/32 | 206,848 |
| 169,000 | General Motors Financial Co., Inc., 5.650%, 1/17/29 | 200,571 |
| 227,000 | Home Depot, Inc. (The), 5.950%, 4/1/41 | 326,519 |
| 316,000 | Hyundai Capital America, 144a, 2.650%, 2/10/25 | 323,960 |
| 308,000 | Lowe's Cos, Inc., 4.500%, 4/15/30 | 357,865 |
| 490,000 | Procter & Gamble Co. (The), 1.200%, 10/29/30 | 463,941 |
| 1,334 | United Airlines 2014-2 Class B Pass Through Trust, Ser B, 4.625%, 9/3/22 | 1,357 |
| 333,000 | Walmart, Inc., 2.850%, 7/8/24 | 348,032 |
| | | | | 2,229,093 |
| | Materials — 0.6% | |
| 83,000 | Braskem America Finance Co. (Brazil), 144a, 7.125%, 7/22/41 | 107,174 |
| 176,000 | Braskem Netherlands Finance BV (Brazil), 144a, 5.875%, 1/31/50 | 202,840 |
| 301,000 | Sherwin-Williams Co. (The), 4.500%, 6/1/47 | 376,346 |
| | | | | 686,360 |
| | Total Corporate Bonds | $37,172,432 |
| | U.S. Treasury Obligations — 34.3% |
| 8,875,000 | U.S. Treasury Bond, 1.750%, 8/15/41 | | | 8,632,324 |
| 4,040,000 | U.S. Treasury Bond, 1.875%, 2/15/41 | | | 4,011,436 |
| 9,370,000 | U.S. Treasury Note, 0.125%, 4/30/23 | | | 9,320,222 |
| 2,380,000 | U.S. Treasury Note, 0.250%, 10/31/25 | | | 2,301,255 |
| 4,030,000 | U.S. Treasury Note, 0.375%, 3/31/22 | | | 4,032,734 |
| 4,685,000 | U.S. Treasury Note, 0.750%, 5/31/26 | | | 4,591,300 |
Principal
Amount | | | | Market
Value |
| | U.S. Treasury Obligations — 34.3% (Continued) |
| $ 66,000 | U.S. Treasury Note, 1.250%, 8/15/31 | | | $ 64,608 |
| 3,613,000 | U.S. Treasury Note, 1.625%, 5/15/31 | | | 3,662,679 |
| | Total U.S. Treasury Obligations | $36,616,558 |
| | U.S. Government Mortgage-Backed Obligations — 6.6% |
| 48,279 | FHLMC, Pool #A95946, 4.000%, 1/1/41 | | | 53,041 |
| 37,805 | FHLMC, Pool #A96485, 4.500%, 1/1/41 | | | 41,827 |
| 12,890 | FHLMC, Pool #G03217, 5.500%, 9/1/37 | | | 14,338 |
| 6,506 | FHLMC, Pool #G03781, 6.000%, 1/1/38 | | | 7,490 |
| 254,781 | FHLMC, Pool #G05624, 4.500%, 9/1/39 | | | 281,905 |
| 316,738 | FHLMC, Pool #Q29056, 4.000%, 10/1/44 | | | 347,764 |
| 159,457 | FHLMC, Pool #Q29260, 4.000%, 10/1/44 | | | 175,084 |
| 598,859 | FHLMC REMIC, Pool #QD2143, 2.000%, 12/1/51 | | | 597,865 |
| 3,485 | FNMA, Pool #561741, 7.500%, 1/1/31 | | | 3,902 |
| 211,841 | FNMA, Pool #725423, 5.500%, 5/1/34 | | | 237,355 |
| 190,100 | FNMA, Pool #725610, 5.500%, 7/1/34 | | | 215,676 |
| 4,607 | FNMA, Pool #889734, 5.500%, 6/1/37 | | | 5,265 |
| 28,437 | FNMA, Pool #AB1149, 5.000%, 6/1/40 | | | 32,259 |
| 28,328 | FNMA, Pool #AB1800, 4.000%, 11/1/40 | | | 31,119 |
| 48,869 | FNMA, Pool #AD3795, 4.500%, 4/1/40 | | | 54,038 |
| 68,234 | FNMA, Pool #AD9150, 5.000%, 8/1/40 | | | 77,378 |
| 127,318 | FNMA, Pool #AD9193, 5.000%, 9/1/40 | | | 143,732 |
| 85,679 | FNMA, Pool #AE0548, 4.500%, 11/1/40 | | | 94,739 |
| 70,827 | FNMA, Pool #AE4429, 4.000%, 10/1/40 | | | 77,762 |
| 3,198 | FNMA, Pool #AH2666, 4.000%, 1/1/26 | | | 3,360 |
| 5,783 | FNMA, Pool #AH3493, 4.000%, 2/1/26 | | | 6,089 |
| 113,239 | FNMA, Pool #AJ5457, 4.000%, 11/1/41 | | | 124,356 |
| 105,920 | FNMA, Pool #AL0054, 4.500%, 2/1/41 | | | 117,131 |
| 221,356 | FNMA, Pool #AL5718, 3.500%, 9/1/44 | | | 238,396 |
| 284,143 | FNMA, Pool #AR9195, 3.000%, 3/1/43 | | | 300,364 |
| 94,177 | FNMA, Pool #AS7813, 4.000%, 8/1/46 | | | 102,416 |
| 237,661 | FNMA, Pool #AT2016, 3.000%, 4/1/43 | | | 251,671 |
| 193,845 | FNMA, Pool #BC1158, 3.500%, 2/1/46 | | | 206,916 |
| 363,672 | FNMA, Pool #FM4996, 2.000%, 12/1/50 | | | 363,678 |
| 380,105 | FNMA, Pool #FM5166, 3.000%, 12/1/50 | | | 395,585 |
| 344,464 | FNMA, Pool #FM5279, 3.500%, 11/1/50 | | | 362,856 |
| 278,462 | FNMA, Pool #FM5468, 2.500%, 1/1/36 | | | 288,159 |
| 330,494 | FNMA, Pool #FM5682, 2.500%, 1/1/51 | | | 338,467 |
| 109,401 | FNMA, Pool #MA1175, 3.000%, 9/1/42 | | | 115,565 |
| 73,304 | FNMA, Pool #MA2177, 4.000%, 2/1/35 | | | 79,708 |
| 436,904 | FNMA, Pool #MA4166, 3.000%, 10/1/40 | | | 455,209 |
| 90,437 | GNMA, Pool #4853, 4.000%, 11/20/40 | | | 97,968 |
| 67,746 | GNMA, Pool #4883, 4.500%, 12/20/40 | | | 74,590 |
| 270,022 | GNMA, Pool #5175, 4.500%, 9/20/41 | | | 299,041 |
| 20,947 | GNMA, Pool #736696, 4.500%, 5/15/40 | | | 23,370 |
| 155,215 | GNMA, Pool #AD1745, 3.000%, 2/20/43 | | | 165,295 |
| 100,252 | GNMA, Pool #MA1157, 3.500%, 7/20/43 | | | 107,428 |
| | Total U.S. Government Mortgage-Backed Obligations | $7,010,157 |
| | Asset-Backed Securities — 5.3% |
| 265,000 | Apidos CLO XVIII (Cayman Islands), Ser 2018-18A, Class A1, 144a, (3M LIBOR +1.140%), 1.268%, 10/22/30(A) | | | 265,024 |
| 400,000 | Benefit Street Partners CLO XIX Ltd. (Cayman Islands), Ser 2019-19A, Class B, 144a, (3M LIBOR +2.000%), 2.124%, 1/15/33(A) | | | 400,026 |
| 230,126 | CF Hippolyta LLC, Ser 2020-1, Class A1, 144a, 1.690%, 7/15/60 | | | 228,321 |
| 275,000 | CIFC Funding Ltd. (Cayman Islands), Ser 2016-1A, Class ARR, 144a, (3M LIBOR +1.080%), 1.255%, 10/21/31(A) | | | 274,873 |
| 705,063 | Driven Brands Funding LLC, Ser 2019-1A, Class A2, 144a, 4.641%, 4/20/49 | | | 743,223 |
Touchstone Bond Fund (Continued)
Principal
Amount | | | | Market
Value |
| | Asset-Backed Securities — 5.3% (Continued) |
| $ 350,000 | Driven Brands Funding LLC, Ser 2021-1A, Class A2, 144a, 2.791%, 10/20/51 | | | $ 344,056 |
| 352,822 | Elara HGV Timeshare Issuer LLC, Ser 2019-A, Class B, 144a, 2.910%, 1/25/34 | | | 352,763 |
| 297,750 | Jack In The Box Funding LLC, Ser 2019-1A, Class A2I, 144a, 3.982%, 8/25/49 | | | 299,198 |
| 268,000 | Jersey Mike's Funding, Ser 2019-1A, Class A2, 144a, 4.433%, 2/15/50 | | | 281,338 |
| 241,250 | Jimmy Johns Funding LLC, Ser 2017-1A, Class A2II, 144a, 4.846%, 7/30/47 | | | 254,967 |
| 375,000 | Madison Park Funding XLIX Ltd. (Cayman Islands), Ser 2021-49A, Class B1, 144a, (3M LIBOR +1.700%), 1.819%, 10/19/34(A) | | | 375,105 |
| 275,000 | Madison Park Funding XXXV Ltd. (Cayman Islands), Ser 2019-35A, Class A2AR, 144a, (3M LIBOR +1.200%), 1.331%, 4/20/32(A) | | | 275,050 |
| 289,383 | Mill City Mortgage Loan Trust, Ser 2018-3, Class M3, 144a, 3.250%, 8/25/58(A)(B) | | | 295,960 |
| 350,000 | New Mountain CLO 1 Ltd. (Cayman Islands), Ser CLO-1A, Class AR, 144a, (3M LIBOR +1.200%), 1.317%, 10/15/34(A) | | | 349,998 |
| 286,688 | TAL Advantage VII LLC, Ser 2020-1A, Class A, 144a, 2.050%, 9/20/45 | | | 284,661 |
| 380,000 | Voya CLO Ltd. (Cayman Islands), Ser 2017-4A, Class A1, 144a, (3M LIBOR +1.130%), 1.254%, 10/15/30(A) | | | 380,020 |
| 275,000 | Voya CLO Ltd. (Cayman Islands), Ser 2019-2A, Class A, 144a, (3M LIBOR +1.270%), 1.401%, 7/20/32(A) | | | 275,007 |
| | Total Asset-Backed Securities | $5,679,590 |
| | Commercial Mortgage-Backed Securities — 4.9% |
| 675,000 | BANK, Ser 2018-BN14, Class A3, 3.966%, 9/15/60 | | | 742,924 |
| 750,000 | BHMS, Ser 2018-ATLS, Class A, 144a, (1M LIBOR +1.250%), 1.360%, 7/15/35(A) | | | 749,519 |
| 500,000 | BPR Trust, Ser 2021-KEN, Class B, 144a, (1M LIBOR +1.950%), 2.060%, 2/15/29(A) | | | 499,895 |
| 360,000 | DBUBS Mortgage Trust, Ser 2017-BRBK, Class B, 144a, 3.530%, 10/10/34(A)(B) | | | 372,161 |
| 375,000 | GS Mortgage Securities Corp. II, Ser 2017-SLP, Class B, 144a, 3.772%, 10/10/32 | | | 379,671 |
| 250,000 | GS Mortgage Securities Trust, Ser 2017-FARM, Class B, 144a, 3.541%, 1/10/43(A)(B) | | | 263,335 |
| 315,000 | HONO Mortgage Trust, Ser 2021-LULU, Class B, 144a, (1M LIBOR +1.450%), 1.560%, 10/15/36(A) | | | 314,280 |
| 350,000 | JPMorgan Chase Commercial Mortgage Securities Trust, Ser 2018-MINN, Class A, 144a, (1M LIBOR +1.020%), 2.270%, 11/15/35(A) | | | 351,002 |
| 320,000 | New York City Housing Development Corp., Ser 2014-8SPR, Class B, 3.864%, 2/15/48 | | | 335,588 |
| 675,000 | SG Commercial Mortgage Securities Trust, Ser 2019-787E, Class A, 144a, 4.163%, 2/15/41 | | | 754,645 |
| 481,357 | WFRBS Commercial Mortgage Trust, Ser 2014-C19, Class A3, 3.660%, 3/15/47 | | | 481,572 |
| | Total Commercial Mortgage-Backed Securities | $5,244,592 |
| Shares | | | | |
| | Exchange-Traded Fund — 4.7% | |
| 45,431 | iShares JP Morgan USD Emerging Markets Bond ETF | 4,954,705 |
Principal
Amount | | | | |
| | Non-Agency Collateralized Mortgage Obligations — 3.3% |
| $ 93,080 | Agate Bay Mortgage Trust, Ser 2013-1, Class B3, 144a, 3.580%, 7/25/43(A)(B) | | | 93,831 |
Principal
Amount | | | | MarketValue |
| | Non-Agency Collateralized Mortgage Obligations — 3.3%
(Continued) |
| $ 353,144 | Agate Bay Mortgage Trust, Ser 2015-4, Class B2, 144a, 3.541%, 6/25/45(A)(B) | | | $ 355,793 |
| 322,075 | Agate Bay Mortgage Trust, Ser 2015-7, Class B1, 144a, 3.676%, 10/25/45(A)(B) | | | 325,039 |
| 219,971 | CSMC Trust, Ser 2013-IVR3, Class B2, 144a, 3.378%, 5/25/43(A)(B) | | | 221,565 |
| 278,791 | CSMC Trust, Ser 2015-1, Class B3, 144a, 3.930%, 1/25/45(A)(B) | | | 280,649 |
| 178,513 | CSMC Trust, Ser 2015-WIN1, Class B3, 144a, 3.829%, 12/25/44(A)(B) | | | 178,747 |
| 575 | Deutsche ALT-A Securities, Inc. ALT, Ser 2003-2XS, Class A6, 5.470%, 9/25/33(A)(B) | | | 577 |
| 104,851 | EverBank Mortgage Loan Trust, Ser 2013-1, Class B1, 144a, 3.467%, 3/25/43(A)(B) | | | 105,680 |
| 306,636 | GS Mortgage-Backed Securities Trust, Ser 2021-PJ6, Class A2, 144a, 2.500%, 11/25/51(A)(B) | | | 306,979 |
| 509,634 | JP Morgan Mortgage Trust, Ser 2017-1, Class B2, 144a, 3.469%, 1/25/47(A)(B) | | | 516,015 |
| 80,153 | Residential Asset Securitization Trust, Ser 2006-A1, Class 1A3, 6.000%, 4/25/36 | | | 52,383 |
| 82,157 | Sequoia Mortgage Trust, Ser 2013-10, Class B2, 144a, 3.540%, 8/25/43(A)(B) | | | 82,684 |
| 107,458 | Sequoia Mortgage Trust, Ser 2013-5, Class B1, 144a, 3.505%, 5/25/43(A)(B) | | | 108,385 |
| 453,661 | Sequoia Mortgage Trust, Ser 2018-CH3, Class B1B, 144a, 4.763%, 8/25/48(A)(B) | | | 464,056 |
| 411,130 | Sequoia Mortgage Trust, Ser 2018-CH3, Class B2B, 144a, 4.763%, 8/25/48(A)(B) | | | 419,634 |
| 25,088 | Washington Mutual Mortgage Pass-Through Certificates, Ser 2005-9, Class 2A4, 5.500%, 11/25/35 | | | 25,707 |
| | Total Non-Agency Collateralized Mortgage Obligations | $3,537,724 |
| | Sovereign Government Obligations — 1.8% |
| 210,000 | Bahamas Government International Bond, 144a, 6.000%, 11/21/28 | | | 179,290 |
| 202,000 | Chile Government International Bond, 3.100%, 5/7/41 | | | 197,657 |
| 306,000 | Chile Government International Bond, 3.100%, 1/22/61 | | | 283,772 |
| 206,000 | Colombia Government International Bond, 3.250%, 4/22/32 | | | 185,142 |
| 226,000 | Ecuador Government International Bond, 144a, 5.000%, 7/31/30 | | | 187,297 |
| 210,000 | Egypt Government International Bond, 144a, 5.875%, 2/16/31 | | | 185,783 |
| 210,000 | Ghana Government International Bond, 144a, 7.625%, 5/16/29 | | | 174,783 |
| 205,000 | Nigeria Government International Bond, 144a, 7.625%, 11/28/47 | | | 183,098 |
| 153,000 | Panama Government International Bond, 4.300%, 4/29/53 | | | 164,247 |
| 200,000 | Republic of Uzbekistan International Bond, 144a, 3.700%, 11/25/30 | | | 191,800 |
| | Total Sovereign Government Obligations | $1,932,869 |
| | Agency Collateralized Mortgage Obligations — 0.9% |
| 600,722 | FHLMC REMIC, Ser 3859, Class JB, 5.000%, 5/15/41 | | | 663,787 |
| 16,917 | FNMA REMIC, Ser 2015-51, Class KC, 3.000%, 6/25/45 | | | 17,041 |
| 292,845 | FNMA REMIC, Ser 2017-90, Class KA, 3.000%, 11/25/47 | | | 305,567 |
| | Total Agency Collateralized Mortgage Obligations | $986,395 |
Touchstone Bond Fund (Continued)
| Shares | | | | MarketValue |
| | Short-Term Investment Fund — 3.1% | |
| 3,346,970 | Dreyfus Government Cash Management, Institutional Shares, 0.03%∞Ω | $ 3,346,970 |
| | Total Investment Securities—99.7%
(Cost $104,066,581) | $106,481,992 |
| | Other Assets in Excess of Liabilities — 0.3% | 268,383 |
| | Net Assets — 100.0% | $106,750,375 |
| (A) | Variable rate security - Rate reflected is the rate in effect as of December 31, 2021. |
| (B) | Certain variable rate securities are not based on a published reference rate and spread but are determined by the issuer or agent and are based on current market conditions. These securities do not indicate a reference rate and spread in their description. |
| ∞ | Open-End Fund. |
| Ω | Represents the 7-Day SEC yield as of December 31, 2021. |
| Portfolio Abbreviations: |
| CLO – Collateralized Loan Obligation |
| DAC – Designated Activity Company |
| ETF – Exchange-Traded Fund |
| FHLMC – Federal Home Loan Mortgage Corporation |
| FNMA – Federal National Mortgage Association |
| GNMA – Government National Mortgage Association |
| LIBOR – London Interbank Offered Rate |
| LLC – Limited Liability Company |
| LP – Limited Partnership |
| MTN – Medium Term Note |
| PLC – Public Limited Company |
| REIT – Real Estate Investment Trust |
| REMIC – Real Estate Mortgage Investment Conduit |
| 144a - This is a restricted security that was sold in a transaction qualifying for the exemption under Rule 144a of the Securities Act of 1933. This security may be sold in transactions exempt from registration, normally to qualified institutional buyers. At December 31, 2021, these securities were valued at $21,593,767 or 20.2% of net assets. These securities were deemed liquid pursuant to procedures approved by the Board of Trustees. |
Other Information:
The inputs or methodology used for valuing securities may not be an indication of the risk associated with investing in those securities. For more information on valuation inputs, and their aggregation into the levels used in the table below, please refer to the security valuation section in the accompanying Notes to Financial Statements.
| Valuation Inputs at Reporting Date: |
| Description | Level 1 | Level 2 | Level 3 | Total |
| Corporate Bonds | $— | $37,172,432 | $— | $37,172,432 |
| U.S. Treasury Obligations | — | 36,616,558 | — | 36,616,558 |
| U.S. Government Mortgage-Backed Obligations | — | 7,010,157 | — | 7,010,157 |
| Asset-Backed Securities | — | 5,679,590 | — | 5,679,590 |
| Commercial Mortgage-Backed Securities | — | 5,244,592 | — | 5,244,592 |
| Exchange-Traded Fund | 4,954,705 | — | — | 4,954,705 |
| Non-Agency Collateralized Mortgage Obligations | — | 3,537,724 | — | 3,537,724 |
| Sovereign Government Obligations | — | 1,932,869 | — | 1,932,869 |
| Agency Collateralized Mortgage Obligations | — | 986,395 | — | 986,395 |
| Short-Term Investment Fund | 3,346,970 | — | — | 3,346,970 |
| Total | $8,301,675 | $98,180,317 | $— | $106,481,992 |
See accompanying Notes to Financial Statements.
Portfolio of Investments
Touchstone Common Stock Fund – December 31, 2021
| Shares | | | | Market
Value |
| | Common Stocks — 98.5% | |
| | Information Technology — 27.7% | |
| 95,876 | Apple, Inc. | $ 17,024,701 |
| 22,843 | International Business Machines Corp. | 3,053,196 |
| 66,368 | Microsoft Corp. | 22,320,886 |
| 58,641 | Oracle Corp. | 5,114,082 |
| 27,302 | salesforce.com, Inc.* | 6,938,257 |
| 41,743 | SS&C Technologies Holdings, Inc. | 3,422,091 |
| 25,987 | Texas Instruments, Inc. | 4,897,770 |
| 21,037 | Visa, Inc. - Class A | 4,558,928 |
| 14,663 | Workday, Inc. - Class A* | 4,005,638 |
| | | | | 71,335,549 |
| | Communication Services — 18.1% | |
| 5,368 | Alphabet, Inc. - Class C* | 15,532,791 |
| 88,597 | AT&T, Inc. | 2,179,486 |
| 90,854 | Comcast Corp. - Class A | 4,572,682 |
| 67,213 | Fox Corp. - Class A | 2,480,160 |
| 45,692 | Meta Platforms, Inc. - Class A* | 15,368,504 |
| 7,382 | Netflix, Inc.* | 4,447,212 |
| 13,272 | Walt Disney Co. (The)* | 2,055,700 |
| | | | | 46,636,535 |
| | Health Care — 13.3% | |
| 28,055 | AmerisourceBergen Corp. | 3,728,229 |
| 40,141 | BioMarin Pharmaceutical, Inc.* | 3,546,458 |
| 96,298 | Bristol-Myers Squibb Co. | 6,004,180 |
| 19,749 | HCA Healthcare, Inc. | 5,073,913 |
| 43,542 | Johnson & Johnson | 7,448,730 |
| 16,842 | UnitedHealth Group, Inc. | 8,457,042 |
| | | | | 34,258,552 |
| | Financials — 10.9% | |
| 163,880 | Bank of America Corp. | 7,291,021 |
| 32,185 | Berkshire Hathaway, Inc. - Class B* | 9,623,315 |
| 19,021 | Goldman Sachs Group, Inc. (The) | 7,276,484 |
| 12,091 | Signature Bank | 3,911,076 |
| | | | | 28,101,896 |
| | Consumer Discretionary — 9.8% | |
| 11,205 | Airbnb, Inc. - Class A* | 1,865,520 |
| 17,029 | Alibaba Group Holding Ltd. (China) ADR* | 2,022,875 |
| 3,978 | Amazon.com, Inc.* | 13,264,005 |
| 41,460 | Hilton Worldwide Holdings, Inc.* | 6,467,345 |
| 13,770 | Starbucks Corp. | 1,610,677 |
| | | | | 25,230,422 |
| | Industrials — 9.1% | |
| 10,611 | Deere & Co. | 3,638,406 |
| 7,486 | FedEx Corp. | 1,936,179 |
| 27,193 | Hubbell, Inc. | 5,663,486 |
| 11,136 | Parker-Hannifin Corp. | 3,542,584 |
| Shares | | | | Market
Value |
| | | |
| | Industrials — (Continued) | |
| 79,709 | Raytheon Technologies Corp. | $ 6,859,757 |
| 40,799 | Southwest Airlines Co.* | 1,747,829 |
| | | | | 23,388,241 |
| | Consumer Staples — 3.5% | |
| 48,551 | Monster Beverage Corp.* | 4,662,838 |
| 46,964 | Philip Morris International, Inc. | 4,461,580 |
| | | | | 9,124,418 |
| | Real Estate — 2.5% | |
| 23,427 | Jones Lang LaSalle, Inc.* | 6,309,828 |
| | Energy — 2.0% | |
| 50,133 | Exxon Mobil Corp. | 3,067,638 |
| 67,838 | Schlumberger NV | 2,031,748 |
| | | | | 5,099,386 |
| | Materials — 1.6% | |
| 50,117 | DuPont de Nemours, Inc. | 4,048,451 |
| | Total Common Stocks | $253,533,278 |
| | Short-Term Investment Fund — 0.0% | |
| 11 | Dreyfus Government Cash Management, Institutional Shares, 0.03%∞Ω | 11 |
| | Total Investment Securities—98.5%
(Cost $122,655,353) | $253,533,289 |
| | Other Assets in Excess of Liabilities — 1.5% | 3,782,715 |
| | Net Assets — 100.0% | $257,316,004 |
| * | Non-income producing security. |
| ∞ | Open-End Fund. |
| Ω | Represents the 7-Day SEC yield as of December 31, 2021. |
| Portfolio Abbreviations: |
| ADR – American Depositary Receipt |
Other Information:
The inputs or methodology used for valuing securities may not be an indication of the risk associated with investing in those securities. For more information on valuation inputs, and their aggregation into the levels used in the table below, please refer to the security valuation section in the accompanying Notes to Financial Statements.
| Valuation Inputs at Reporting Date: |
| Description | Level 1 | Level 2 | Level 3 | Total |
| Common Stocks | $253,533,278 | $— | $— | $253,533,278 |
| Short-Term Investment Fund | 11 | — | — | 11 |
| Total | $253,533,289 | $— | $— | $253,533,289 |
See accompanying Notes to Financial Statements.
Portfolio of Investments
Touchstone Small Company Fund – December 31, 2021
| Shares | | | | Market
Value |
| | Common Stocks — 99.5% | |
| | Consumer Discretionary — 19.6% | |
| 36,060 | American Eagle Outfitters, Inc. | $ 913,039 |
| 18,592 | Aritzia, Inc. (Canada)* | 769,431 |
| 29,450 | Foot Locker, Inc. | 1,284,904 |
| 4,300 | Fox Factory Holding Corp.* | 731,430 |
| 35,336 | Frontdoor, Inc.* | 1,295,064 |
| 15,640 | Grand Canyon Education, Inc.* | 1,340,504 |
| 53,410 | Leslie's, Inc.* | 1,263,681 |
| 19,110 | Malibu Boats, Inc. - Class A* | 1,313,430 |
| 8,900 | Oxford Industries, Inc. | 903,528 |
| 9,490 | Skyline Champion Corp.* | 749,520 |
| 26,504 | Steven Madden Ltd. | 1,231,641 |
| 9,678 | Texas Roadhouse, Inc. | 864,052 |
| 3,000 | TopBuild Corp.* | 827,730 |
| 26,916 | Zumiez, Inc.* | 1,291,699 |
| | | | | 14,779,653 |
| | Industrials — 17.9% | |
| 6,447 | ASGN, Inc.* | 795,560 |
| 16,240 | Clean Harbors, Inc. * | 1,620,265 |
| 14,302 | Crane Co. | 1,454,942 |
| 6,150 | Curtiss-Wright Corp. | 852,821 |
| 7,060 | Forward Air Corp. | 854,895 |
| 11,165 | Gibraltar Industries, Inc.* | 744,482 |
| 48,969 | Great Lakes Dredge & Dock Corp.* | 769,793 |
| 7,758 | ITT, Inc. | 792,790 |
| 31,500 | JELD-WEN Holding, Inc.* | 830,340 |
| 4,600 | John Bean Technologies Corp. | 706,376 |
| 17,960 | KBR, Inc. | 855,255 |
| 6,533 | Quanta Services, Inc. | 749,074 |
| 5,317 | Regal Rexnord Corp. | 904,847 |
| 18,139 | SkyWest, Inc.* | 712,863 |
| 21,800 | Zurn Water Solutions Corp. | 793,520 |
| | | | | 13,437,823 |
| | Health Care — 17.0% | |
| 49,650 | Allscripts Healthcare Solutions, Inc.* | 916,042 |
| 20,972 | Anika Therapeutics, Inc.* | 751,427 |
| 1,586 | Bio-Techne Corp. | 820,501 |
| 1,580 | Chemed Corp. | 835,883 |
| 12,823 | Encompass Health Corp. | 836,829 |
| 10,110 | Ensign Group, Inc. (The) | 848,836 |
| 11,068 | Globus Medical, Inc. - Class A* | 799,110 |
| 12,792 | Integra LifeSciences Holdings Corp.* | 856,936 |
| 6,410 | LHC Group, Inc.* | 879,644 |
| 15,497 | NuVasive, Inc.* | 813,282 |
| 4,431 | Omnicell, Inc.* | 799,530 |
| 42,518 | Premier, Inc. - Class A | 1,750,466 |
| 12,400 | Progyny, Inc.* | 624,340 |
| 23,300 | Tactile Systems Technology, Inc.* | 443,399 |
| 12,870 | Vocera Communications, Inc.* | 834,491 |
| | | | | 12,810,716 |
| | Information Technology — 16.6% | |
| 43,400 | 8x8, Inc.* | 727,384 |
| 8,219 | Advanced Energy Industries, Inc. | 748,422 |
| 62,000 | Box, Inc. - Class A* | 1,623,780 |
| 39,831 | Cognyte Software Ltd. (Israel)* | 624,152 |
| 10,890 | CommVault Systems, Inc.* | 750,539 |
| 34,758 | Digi International, Inc.* | 854,004 |
| 5,837 | ExlService Holdings, Inc.* | 845,022 |
| 11,687 | MAXIMUS, Inc. | 931,103 |
| 13,392 | Onto Innovation, Inc.* | 1,355,672 |
| 5,408 | Qualys, Inc.* | 742,086 |
| Shares | | | | Market
Value |
| | | |
| | Information Technology — (Continued) | |
| 4,974 | SPS Commerce, Inc.* | $ 708,049 |
| 23,300 | Tower Semiconductor Ltd. (Israel)* | 924,544 |
| 16,311 | Verint Systems, Inc.* | 856,491 |
| 8,880 | WNS Holdings Ltd. (India) ADR* | 783,394 |
| | | | | 12,474,642 |
| | Financials — 13.1% | |
| 19,000 | Ameris Bancorp | 943,920 |
| 6,000 | Evercore, Inc. - Class A | 815,100 |
| 88,800 | FNB Corp. | 1,077,144 |
| 13,694 | Independent Bank Group, Inc. | 988,022 |
| 23,820 | Pacific Premier Bancorp, Inc. | 953,515 |
| 10,560 | Pinnacle Financial Partners, Inc. | 1,008,480 |
| 11,000 | PJT Partners, Inc. - Class A | 814,990 |
| 72,500 | Valley National Bancorp | 996,875 |
| 20,143 | Webster Financial Corp. | 1,124,785 |
| 10,327 | Western Alliance Bancorp | 1,111,701 |
| | �� | | | 9,834,532 |
| | Real Estate — 5.8% | |
| 12,900 | Agree Realty Corp. REIT | 920,544 |
| 61,045 | Corporate Office Properties Trust REIT | 1,707,429 |
| 25,200 | Healthcare Realty Trust, Inc. REIT | 797,328 |
| 19,900 | STAG Industrial, Inc. REIT | 954,404 |
| | | | | 4,379,705 |
| | Materials — 5.6% | |
| 15,500 | Ashland Global Holdings, Inc. | 1,668,730 |
| 27,700 | Axalta Coating Systems Ltd. * | 917,424 |
| 4,830 | Eagle Materials, Inc. | 804,002 |
| 19,270 | Silgan Holdings, Inc. | 825,527 |
| | | | | 4,215,683 |
| | Communication Services — 3.8% | |
| 25,990 | Cargurus, Inc.* | 874,303 |
| 43,830 | QuinStreet, Inc.* | 797,268 |
| 10,685 | Ziff Davis, Inc.* | 1,184,539 |
| | | | | 2,856,110 |
| | Consumer Staples — 0.1% | |
| 3,595 | Mission Produce, Inc.* | 56,441 |
| | Total Common Stocks | $74,845,305 |
| | Short-Term Investment Fund — 1.1% | |
| 840,909 | Dreyfus Government Cash Management, Institutional Shares, 0.03%∞Ω | 840,909 |
| | Total Investment Securities—100.6%
(Cost $52,234,829) | $75,686,214 |
| | Liabilities in Excess of Other Assets — (0.6%) | (444,938) |
| | Net Assets — 100.0% | $75,241,276 |
| * | Non-income producing security. |
| ∞ | Open-End Fund. |
| Ω | Represents the 7-Day SEC yield as of December 31, 2021. |
| Portfolio Abbreviations: |
| ADR – American Depositary Receipt |
| REIT – Real Estate Investment Trust |
Touchstone Small Company Fund (Continued)
Other Information:
The inputs or methodology used for valuing securities may not be an indication of the risk associated with investing in those securities. For more information on valuation inputs, and their aggregation into the levels used in the table below, please refer to the security valuation section in the accompanying Notes to Financial Statements.
| Valuation Inputs at Reporting Date: |
| Description | Level 1 | Level 2 | Level 3 | Total |
| Common Stocks | $74,845,305 | $— | $— | $74,845,305 |
| Short-Term Investment Fund | 840,909 | — | — | 840,909 |
| Total | $75,686,214 | $— | $— | $75,686,214 |
See accompanying Notes to Financial Statements.
Statements of Assets and Liabilities
December 31, 2021
| | Touchstone
Balanced
Fund | Touchstone
Bond
Fund | Touchstone
Common Stock
Fund | Touchstone
Small Company
Fund |
| Assets | | | | |
| Investments, at cost | $60,698,817 | $104,066,581 | $122,655,353 | $52,234,829 |
| Investments, at market value | $72,304,136 | $106,481,992 | $253,533,289 | $75,686,214 |
| Foreign currency † | — | — | 1,123 | — |
| Dividends and interest receivable | 121,728 | 489,152 | 78,326 | 41,703 |
| Receivable for capital shares sold | — | 461 | — | 1,736 |
| Receivable for investments sold | — | — | 4,265,896 | 102,743 |
| Receivable for securities lending income | 87 | 355 | — | 29 |
| Tax reclaim receivable | — | — | 36,624 | — |
| Total Assets | 72,425,951 | 106,971,960 | 257,915,258 | 75,832,425 |
| |
| Liabilities | | | | |
| Bank overdrafts | — | — | 165,049 | — |
| Payable for capital shares redeemed | 63,624 | 46,260 | 54,384 | 24,827 |
| Payable for investments purchased | — | — | — | 445,883 |
| Payable to Investment Advisor | 35,274 | 31,884 | 97,139 | 35,046 |
| Payable to other affiliates | 9,352 | 30,646 | 85,753 | 9,515 |
| Payable to Trustees | 18,786 | 18,786 | 18,786 | 18,786 |
| Payable for professional services | 32,221 | 27,892 | 28,713 | 23,769 |
| Payable for reports to shareholders | 8,539 | 14,007 | 14,541 | 10,861 |
| Payable for transfer agent services | 3,435 | 39,358 | 109,935 | 15,717 |
| Other accrued expenses and liabilities | 12,868 | 12,752 | 24,954 | 6,745 |
| Total Liabilities | 184,099 | 221,585 | 599,254 | 591,149 |
| Net Assets | $72,241,852 | $106,750,375 | $257,316,004 | $75,241,276 |
| Net assets consist of: | | | | |
| Paid-in capital | 46,754,795 | 102,990,936 | 98,510,231 | 35,501,559 |
| Distributable earnings (deficit) | 25,487,057 | 3,759,439 | 158,805,773 | 39,739,717 |
| Net Assets | $72,241,852 | $106,750,375 | $257,316,004 | $75,241,276 |
| |
| Pricing of Class SC Shares | | | | |
| Net assets applicable to Class SC Shares | $52,471,282 | $65,529,606 | $93,120,584 | $— |
| Shares of beneficial interest outstanding (unlimited number of shares authorized, no par value) | 3,342,773 | 6,335,246 | 6,892,064 | — |
| Net asset value, offering price and redemption price per share | $15.70 | $10.34 | $13.51 | $— |
| |
| Pricing of Class I Shares | | | | |
| Net assets applicable to Class I Shares | $19,770,570 | $41,220,769 | $164,195,420 | $75,241,276 |
| Shares of beneficial interest outstanding (unlimited number of shares authorized, no par value) | 1,259,375 | 3,978,130 | 12,112,119 | 3,934,075 |
| Net asset value, offering price and redemption price per share | $15.70 | $10.36 | $13.56 | $19.13 |
| †Cost of foreign currency: | $— | $— | $1,080 | $— |
See accompanying Notes to Financial Statements.
Statements of Operations For the Year Ended December 31, 2021
| | Touchstone
Balanced
Fund | Touchstone
Bond
Fund | Touchstone
Common Stock
Fund | Touchstone
Small Company
Fund |
| Investment Income | | | | |
| Dividends | $438,269 | $194,232 | $2,717,537 | $585,363 |
| Interest | 286,345 | 2,209,795 | — | — |
| Income from securities loaned | 291 | 940 | 1,780 | 104 |
| Total Investment Income | 724,905 | 2,404,967 | 2,719,317 | 585,467 |
| Expenses | | | | |
| Investment advisory fees | 315,032 | 424,262 | 1,240,528 | 381,613 |
| Administration fees | 74,229 | 138,839 | 331,602 | 99,953 |
| Compliance fees and expenses | 3,038 | 3,038 | 3,038 | 3,038 |
| Custody fees | 37,271 | 51,712 | 24,194 | 9,888 |
| Professional fees | 37,513 | 28,777 | 29,488 | 24,782 |
| Transfer Agent fees, Class SC | 19 | 31,017 | 43,513 | — |
| Transfer Agent fees, Class I | 6,393 | 25,857 | 133,834 | 25,977 |
| Reports to Shareholders, Class SC | 6,017 | 8,703 | 9,350 | — |
| Reports to Shareholders, Class I | 10,867 | 15,545 | 20,637 | 15,190 |
| Shareholder servicing fees, Class SC | 94,026 | 46,044 | 173,932 | — |
| Trustee fees | 23,821 | 23,821 | 23,821 | 23,821 |
| Other expenses | 23,347 | 32,788 | 25,354 | 17,257 |
| Total Expenses | 631,573 | 830,403 | 2,059,291 | 601,519 |
| Fees waived and/or reimbursed by the Advisor and/or Affiliates(A) | (175,490) | (38,593) | (44,492) | (21,468) |
| Net Expenses | 456,083 | 791,810 | 2,014,799 | 580,051 |
| Net Investment Income (Loss) | 268,822 | 1,613,157 | 704,518 | 5,416 |
| Realized and Unrealized Gains (Losses) on Investments | | | | |
| Net realized gains on investments | 13,666,244 | 1,354,275 | 27,739,379 | 17,797,923 |
| Net realized gains on futures contracts | — | 173,965 | — | — |
| Net realized gains on foreign currency transactions | — | — | 314 | 472 |
| Net change in unrealized appreciation (depreciation) on investments(B) | (7,038,457) | (4,403,771) | 32,947,063 | (1,490,854) |
| Net change in unrealized appreciation (depreciation) on foreign currency transactions | — | — | (503) | — |
| Net Realized and Unrealized Gains (Losses) on Investments | 6,627,787 | (2,875,531) | 60,686,253 | 16,307,541 |
| Change in Net Assets Resulting from Operations | $6,896,609 | $(1,262,374) | $61,390,771 | $16,312,957 |
| (A) | See Note 4 in Notes to Financial Statements. |
| (B) | Change in unrealized appreciation (depreciation) does not include net appreciation of $13,379,210 for the Touchstone Balanced Fund in connection with the Fund's reorganization. See Note 9 in the Notes to Financial Statements. |
See accompanying Notes to Financial Statements.
Statements of Changes in Net Assets
| | Touchstone
Balanced
Fund | Touchstone
Bond
Fund | Touchstone
Common Stock
Fund |
| | For the
Year Ended
December 31,
2021 | For the
Year Ended
December 31,
2020 | For the
Year Ended
December 31,
2021 | For the
Year Ended
December 31,
2020 | For the
Year Ended
December 31,
2021 | For the
Year Ended
December 31,
2020 |
| From Operations | | | | | | |
| Net investment income | $268,822 | $144,557 | $1,613,157 | $2,436,828 | $704,518 | $1,205,731 |
| Net realized gains (losses) on investments, futures contracts and foreign currency transactions | 13,666,244 | 829,246 | 1,528,240 | 2,466,744 | 27,739,693 | 8,742,461 |
| Net change in unrealized appreciation (depreciation) on investments and foreign currency transactions | (7,038,457) | 2,066,136 | (4,403,771) | 4,279,852 | 32,946,560 | 35,894,956 |
| Change in Net Assets from Operations | 6,896,609 | 3,039,939 | (1,262,374) | 9,183,424 | 61,390,771 | 45,843,148 |
| |
| Distributions to Shareholders: | | | | | | |
| Distributed earnings, Class SC | (698,791) | — | (1,908,114) | (1,095,780) | (3,301,446) | (2,849,400) |
| Distributed earnings, Class I | (262,011) | (853,726) | (1,234,262) | (654,859) | (6,027,690) | (4,937,726) |
| Total Distributions | (960,802) | (853,726) | (3,142,376) | (1,750,639) | (9,329,136) | (7,787,126) |
| |
| Share Transactions Class SC | | | | | | |
| Proceeds from Shares issued | 604,115 | — | 2,927,604 | 3,519,318 | 823,274 | 592,608 |
| Proceeds from Shares issued in connection with reorganization(A) | 53,069,713 | — | — | — | — | — |
| Reinvestment of distributions | 698,791 | — | 1,908,114 | 1,095,780 | 3,301,445 | 2,849,400 |
| Cost of Shares redeemed | (5,064,608) | — | (2,603,926) | (2,617,540) | (15,003,523) | (14,588,347) |
| Change in Net Assets from Class SC Share Transactions | 49,308,011 | — | 2,231,792 | 1,997,558 | (10,878,804) | (11,146,339) |
| |
| Share Transactions Class I | | | | | | |
| Proceeds from Shares issued | 1,944,429 | 941,388 | 5,704,864 | 2,996,827 | 1,557,603 | 2,019,265 |
| Reinvestment of distributions | 262,011 | 853,726 | 1,234,262 | 654,859 | 6,027,690 | 4,937,726 |
| Cost of Shares redeemed | (3,816,913) | (3,001,190) | (3,373,984) | (5,004,840) | (26,020,897) | (21,380,209) |
| Change in Net Assets from Class I Share Transactions | (1,610,473) | (1,206,076) | 3,565,142 | (1,353,154) | (18,435,604) | (14,423,218) |
| Change in Net Assets from Share Transactions | 47,697,538 | (1,206,076) | 5,796,934 | 644,404 | (29,314,408) | (25,569,557) |
| |
| Total Increase (Decrease) in Net Assets | 53,633,345 | 980,137 | 1,392,184 | 8,077,189 | 22,747,227 | 12,486,465 |
| |
| Net Assets | | | | | | |
| Beginning of period | 18,608,507 | 17,628,370 | 105,358,191 | 97,281,002 | 234,568,777 | 222,082,312 |
| End of period | $72,241,852 | $18,608,507 | $106,750,375 | $105,358,191 | $257,316,004 | $234,568,777 |
| |
| Share Transactions Class SC | | | | | | |
| Shares issued | 39,248 | — | 275,701 | 335,573 | 63,243 | 68,312 |
| Shares issued in connection with reorganization(A) | 3,588,149 | — | — | — | — | — |
| Shares reinvested | 44,724 | — | 184,156 | 101,744 | 246,152 | 264,595 |
| Shares redeemed | (329,348) | — | (244,731) | (256,378) | (1,182,940) | (1,536,646) |
| Change in Class SC Shares Outstanding | 3,342,773 | — | 215,126 | 180,939 | (873,545) | (1,203,739) |
| |
| Share Transactions Class I | | | | | | |
| Shares issued | 129,060 | 75,076 | 537,958 | 286,624 | 121,454 | 211,775 |
| Shares reinvested | 16,769 | 63,156 | 119,005 | 60,748 | 447,227 | 457,240 |
| Shares redeemed | (255,370) | (243,950) | (317,140) | (484,927) | (2,025,128) | (2,247,613) |
| Change in Class I Shares Outstanding | (109,541) | (105,718) | 339,823 | (137,555) | (1,456,447) | (1,578,598) |
| Change in Shares Outstanding | 3,233,232 | (105,718) | 554,949 | 43,384 | (2,329,992) | (2,782,337) |
| (A) | See Note 9 in Notes to Financial Statements. |
See accompanying Notes to Financial Statements.
Statements of Changes in Net Assets (Continued)
Touchstone
Small Company
Fund |
For the
Year Ended
December 31,
2021 | For the
Year Ended
December 31,
2020 |
| | |
| $5,416 | $35,655 |
| 17,798,395 | 394,740 |
| (1,490,854) | 10,708,779 |
| 16,312,957 | 11,139,174 |
| |
| | |
| — | — |
| (1,442,590) | (2,307,257) |
| (1,442,590) | (2,307,257) |
| |
| | |
| — | — |
| — | — |
| — | — |
| — | — |
| — | — |
| |
| | |
| 3,080,895 | 3,874,376 |
| 1,442,590 | 2,307,256 |
| (15,784,972) | (8,011,200) |
| (11,261,487) | (1,829,568) |
| (11,261,487) | (1,829,568) |
| |
| 3,608,880 | 7,002,349 |
| |
| | |
| 71,632,396 | 64,630,047 |
| $75,241,276 | $71,632,396 |
| |
| | |
| — | — |
| — | — |
| — | — |
| — | — |
| — | — |
| |
| | |
| 172,548 | 320,869 |
| 76,638 | 153,118 |
| (874,170) | (635,071) |
| (624,984) | (161,084) |
| (624,984) | (161,084) |
| Touchstone Balanced Fund—Class SC |
| Selected Data for a Share Outstanding Throughout The Period |
| | Period Ended
December 31,
2021(A) |
| |
| Net asset value at beginning of period | $14.67(B) |
| Income (loss) from investment operations: | |
| Net investment income | 0.05(C) |
| Net realized and unrealized gains on investments | 1.18 |
| Total from investment operations | 1.23 |
| Distributions from: | |
| Net investment income | (0.03) |
| Realized capital gains | (0.17) |
| Total distributions | (0.20) |
| Net asset value at end of period | $15.70 |
| Total return(D) | 8.45%(E) |
| Ratios and supplemental data: | |
| Net assets at end of period (000's) | $52,471 |
| Ratio to average net assets: | |
| Net expenses | 0.79%(F) |
| Gross expenses | 1.13%(F) |
| Net investment income | 0.46%(F) |
| Portfolio turnover rate | 132%(G) |
| Touchstone Balanced Fund—Class I |
| Selected Data for a Share Outstanding Throughout Each Period |
| | Year Ended December 31, |
| | 2021 | 2020 | 2019 | 2018 | 2017 |
| Net asset value at beginning of period | $13.59 | $11.95 | $9.86 | $14.85 | $13.02 |
| Income (loss) from investment operations: | | | | | |
| Net investment income | 0.07(C) | 0.12(C) | 0.14(C) | 0.18(C) | 0.14 |
| Net realized and unrealized gains (losses) on investments | 2.24 | 2.16 | 2.11 | (0.92) | 1.69 |
| Total from investment operations | 2.31 | 2.28 | 2.25 | (0.74) | 1.83 |
| Distributions from: | | | | | |
| Net investment income | (0.03) | (0.16) | (0.16) | (0.12) | — |
| Realized capital gains | (0.17) | (0.48) | —(H) | (4.13) | — |
| Total distributions | (0.20) | (0.64) | (0.16) | (4.25) | — |
| Net asset value at end of period | $15.70 | $13.59 | $11.95 | $9.86 | $14.85 |
| Total return(D) | 17.07% | 19.16% | 22.80% | (6.07%) | 14.06% |
| Ratios and supplemental data: | | | | | |
| Net assets at end of period (000's) | $19,771 | $18,609 | $17,628 | $15,971 | $17,964 |
| Ratio to average net assets: | | | | | |
| Net expenses | 0.81% | 0.85% | 0.85% | 0.85% | 0.85% |
| Gross expenses | 1.05% | 1.38% | 1.48% | 1.15% | 0.97% |
| Net investment income | 0.48% | 0.85% | 1.22% | 1.22% | 1.01% |
| Portfolio turnover rate | 132%(G) | 71% | 129% | 140% | 142% |
| (A) | Represents the period from commencement of operations (April 13, 2021) through December 31, 2021. |
| (B) | Net asset value at the beginning of period is based on the net asset value of Class I shares on April 13, 2021. |
| (C) | The net investment income per share was based on average shares outstanding for the period. |
| (D) | Total returns do not include any insurance, sales or administrative charges of variable annuity or life insurance contracts. If these charges were included, the returns would be lower. |
| (E) | Not annualized. |
| (F) | Annualized. |
| (G) | Portfolio turnover excludes the purchases and sales of securities of the Aggressive ETF Fund, the Conservative ETF Fund and the Moderate ETF Fund acquired on April 16, 2021 (See Note 9 in the Notes to Financial Statements). If these transactions were included, portfolio turnover would have been higher. |
| (H) | Less than $0.005 per share. |
See accompanying Notes to Financial Statements.
Financial Highlights (Continued)
| Touchstone Bond Fund—Class SC |
| Selected Data for a Share Outstanding Throughout Each Period |
| | Year Ended December 31, | Period Ended
December 31,
2019(A) |
| | 2021 | 2020 |
| Net asset value at beginning of period | $10.79 | $10.01 | $9.90 |
| Income (loss) from investment operations: | | | |
| Net investment income | 0.16 | 0.24 | 0.11 |
| Net realized and unrealized gains (losses) on investments | (0.30) | 0.72 | 0.13 |
| Total from investment operations | (0.14) | 0.96 | 0.24 |
| Distributions from: | | | |
| Net investment income | (0.25) | (0.18) | (0.13) |
| Realized capital gains | (0.06) | — | — |
| Total distributions | (0.31) | (0.18) | (0.13) |
| Net asset value at end of period | $10.34 | $10.79 | $10.01 |
| Total return(B) | (1.30%) | 9.62% | 2.43%(C) |
| Ratios and supplemental data: | | | |
| Net assets at end of period (000's) | $65,530 | $66,042 | $59,462 |
| Ratio to average net assets: | | | |
| Net expenses | 0.79% | 0.77% | 0.78%(D) |
| Gross expenses | 0.79% | 0.77% | 0.84%(D) |
| Net investment income | 1.47% | 2.39% | 2.29%(D) |
| Portfolio turnover rate | 142% | 168% | 335%(E) |
| Touchstone Bond Fund—Class I |
| Selected Data for a Share Outstanding Throughout Each Period |
| | Year Ended December 31, |
| | 2021 | 2020 | 2019 | 2018 | 2017 |
| Net asset value at beginning of period | $10.81 | $10.02 | $9.19 | $9.60 | $9.26 |
| Income (loss) from investment operations: | | | | | |
| Net investment income | 0.12 | 0.28 | 0.33 | 0.28 | 0.18 |
| Net realized and unrealized gains (losses) on investments | (0.25) | 0.69 | 0.63 | (0.46) | 0.16 |
| Total from investment operations | (0.13) | 0.97 | 0.96 | (0.18) | 0.34 |
| Distributions from: | | | | | |
| Net investment income | (0.26) | (0.18) | (0.13) | (0.23) | — |
| Realized capital gains | (0.06) | — | — | — | — |
| Total distributions | (0.32) | (0.18) | (0.13) | (0.23) | — |
| Net asset value at end of period | $10.36 | $10.81 | $10.02 | $9.19 | $9.60 |
| Total return(B) | (1.21%) | 9.71% | 10.46% | (1.88%) | 3.67% |
| Ratios and supplemental data: | | | | | |
| Net assets at end of period (000's) | $41,221 | $39,316 | $37,819 | $41,808 | $46,922 |
| Ratio to average net assets: | | | | | |
| Net expenses | 0.67% | 0.67% | 0.67% | 0.67% | 0.68% |
| Gross expenses | 0.77% | 0.82% | 0.94% | 0.87% | 0.71% |
| Net investment income | 1.60% | 2.49% | 2.58% | 2.62% | 1.83% |
| Portfolio turnover rate | 142% | 168% | 335%(E) | 431% | 168% |
| (A) | Represents the period from commencement of operations (July 12, 2019) through December 31, 2019. |
| (B) | Total returns do not include any insurance, sales or administrative charges of variable annuity or life insurance contracts. If these charges were included, the returns would be lower. |
| (C) | Not annualized. |
| (D) | Annualized. |
| (E) | Portfolio turnover excludes the purchases and sales of securities of the Touchstone Active Bond Fund acquired on July 12, 2019. If these transactions were included, portfolio turnover would have been higher. |
See accompanying Notes to Financial Statements.
Financial Highlights (Continued)
| Touchstone Common Stock Fund—Class SC |
| Selected Data for a Share Outstanding Throughout Each Period |
| | Year Ended December 31, | Period Ended
December 31,
2019(A) |
| | 2021 | 2020 |
| Net asset value at beginning of period | $10.98 | $9.20 | $8.61 |
| Income (loss) from investment operations: | | | |
| Net investment income | 0.01 | 0.04 | 0.02 |
| Net realized and unrealized gains on investments | 3.01 | 2.11 | 0.72 |
| Total from investment operations | 3.02 | 2.15 | 0.74 |
| Distributions from: | | | |
| Net investment income | (0.05) | (0.06) | (0.05) |
| Realized capital gains | (0.44) | (0.31) | (0.10) |
| Total distributions | (0.49) | (0.37) | (0.15) |
| Net asset value at end of period | $13.51 | $10.98 | $9.20 |
| Total return(B) | 27.57% | 23.48% | 8.60%(C) |
| Ratios and supplemental data: | | | |
| Net assets at end of period (000's) | $93,121 | $85,232 | $82,546 |
| Ratio to average net assets: | | | |
| Net expenses | 0.91% | 0.90% | 0.94%(D) |
| Gross expenses | 0.91% | 0.90% | 0.94%(D) |
| Net investment income | 0.16% | 0.47% | 0.46%(D) |
| Portfolio turnover rate | 6% | 15% | 18%(E) |
| Touchstone Common Stock Fund—Class I |
| Selected Data for a Share Outstanding Throughout Each Period |
| | Year Ended December 31, |
| | 2021 | 2020 | 2019 | 2018 | 2017 |
| Net asset value at beginning of period | $11.01 | $9.21 | $7.28 | $18.74 | $15.52 |
| Income (loss) from investment operations: | | | | | |
| Net investment income | 0.06 | 0.07 | 0.08 | 0.14(F) | 0.22 |
| Net realized and unrealized gains (losses) on investments | 3.00 | 2.10 | 2.00 | (1.00) | 3.11 |
| Total from investment operations | 3.06 | 2.17 | 2.08 | (0.86) | 3.33 |
| Distributions from: | | | | | |
| Net investment income | (0.07) | (0.06) | (0.05) | (0.11) | (—)(G) |
| Realized capital gains | (0.44) | (0.31) | (0.10) | (10.49) | (0.11) |
| Total distributions | (0.51) | (0.37) | (0.15) | (10.60) | (0.11) |
| Net asset value at end of period | $13.56 | $11.01 | $9.21 | $7.28 | $18.74 |
| Total return(B) | 27.85% | 23.68% | 28.58% | (8.05%) | 21.50% |
| Ratios and supplemental data: | | | | | |
| Net assets at end of period (000's) | $164,195 | $149,336 | $139,536 | $124,796 | $158,438 |
| Ratio to average net assets: | | | | | |
| Net expenses | 0.73% | 0.73% | 0.73% | 0.73% | 0.71% |
| Gross expenses | 0.76% | 0.80% | 0.82% | 0.83% | 0.71% |
| Net investment income | 0.34% | 0.64% | 0.82% | 0.77% | 1.21% |
| Portfolio turnover rate | 6% | 15% | 18%(E) | 10% | 84% |
| (A) | Represents the period from commencement of operations (July 12, 2019) through December 31, 2019. |
| (B) | Total returns do not include any insurance, sales or administrative charges of variable annuity or life insurance contracts. If these charges were included, the returns would be lower. |
| (C) | Not annualized. |
| (D) | Annualized. |
| (E) | Portfolio turnover excludes the purchases and sales of securities of the Touchstone Focused Fund and the Touchstone Large Cap Core Equity Fund acquired on July 12, 2019. If these transactions were included, portfolio turnover would have been higher. |
| (F) | The net investment income per share was based on average shares outstanding for the period. |
| (G) | Less than $0.005 per share. |
See accompanying Notes to Financial Statements.
Financial Highlights (Continued)
| Touchstone Small Company Fund—Class I |
| Selected Data for a Share Outstanding Throughout Each Period |
| | Year Ended December 31, |
| | 2021 | 2020 | 2019 | 2018 | 2017 |
| Net asset value at beginning of period | $15.71 | $13.69 | $12.69 | $15.73 | $13.58 |
| Income (loss) from investment operations: | | | | | |
| Net investment income (loss) | —(A)(B) | 0.01 | 0.02 | 0.01 | (0.01) |
| Net realized and unrealized gains (losses) on investments | 3.79 | 2.53 | 2.64 | (1.11) | 2.57 |
| Total from investment operations | 3.79 | 2.54 | 2.66 | (1.10) | 2.56 |
| Distributions from: | | | | | |
| Net investment income | (0.01) | (0.02) | —(A) | — | (0.01) |
| Realized capital gains | (0.36) | (0.50) | (1.66) | (1.94) | (0.40) |
| Total distributions | (0.37) | (0.52) | (1.66) | (1.94) | (0.41) |
| Net asset value at end of period | $19.13 | $15.71 | $13.69 | $12.69 | $15.73 |
| Total return(C) | 24.18% | 18.70% | 21.40% | (7.98%) | 19.12% |
| Ratios and supplemental data: | | | | | |
| Net assets at end of period (000's) | $75,241 | $71,632 | $64,630 | $57,884 | $70,339 |
| Ratio to average net assets: | | | | | |
| Net expenses | 0.76% | 0.76% | 0.76% | 0.76% | 0.76% |
| Gross expenses | 0.79% | 0.87% | 0.85% | 0.84% | 0.76% |
| Net investment income (loss) | 0.01% | 0.06% | 0.13% | 0.05% | (0.06%) |
| Portfolio turnover rate | 67% | 95% | 85% | 68% | 68% |
| (A) | Less than $0.005 per share. |
| (B) | The net investment income (loss) per share was based on average shares outstanding for the period. |
| (C) | Total returns do not include any insurance, sales or administrative charges of variable annuity or life insurance contracts. If these charges were included, the returns would be lower. |
See accompanying Notes to Financial Statements.
Notes to Financial Statements
December 31, 2021
1. Organization
The Touchstone Variable Series Trust (the “Trust”) is registered under the Investment Company Act of 1940, as amended (the “1940 Act”), as an open-end management investment company. The Trust was established as a Massachusetts business trust pursuant to an Agreement and Declaration of Trust dated February 7, 1994. The Trust consists of the following four funds (individually, a “Fund”, and collectively, the “Funds”):
| Touchstone Balanced Fund ("Balanced Fund”) |
| Touchstone Bond Fund ("Bond Fund”) |
| Touchstone Common Stock Fund ("Common Stock Fund”) |
| Touchstone Small Company Fund ("Small Company Fund”) |
Each Fund is diversified with the exception of the Common Stock Fund which is non-diversified.
The Agreement and Declaration of Trust permits the Trust to issue an unlimited number of shares of beneficial interest of each Fund. Shares of beneficial interest of each Fund are available as a funding vehicle for the separate accounts of life insurance companies issuing variable annuity and variable life insurance policies. As of December 31, 2021, the following affiliates of Touchstone Advisors, Inc. (the "Advisor") were invested in the Funds: separate accounts of Western-Southern Life Assurance Company, The Western & Southern Life Insurance Company, Integrity Life Insurance Company, National Integrity Life Insurance Company, and Columbus Life Insurance Company, which are all part of Western & Southern Financial Group, Inc. (“Western & Southern”), and certain supplemental executive retirement plans sponsored by Western & Southern and its affiliates.
The Balanced Fund, Bond Fund and Common Stock Fund offer Class SC shares and Class I shares. The Small Company Fund offers Class I shares. The assets of each Fund are segregated, and a shareholder’s interest is limited to the Fund in which shares are held. The Funds’ prospectus provides a description of each Fund’s investment goal, policies, and strategies along with information on the classes of shares currently being offered.
2. Significant Accounting Policies
The following is a summary of the Funds’ significant accounting policies:
Each Fund is an investment company that follows the accounting and reporting guidance of Accounting Standards Codification Topic 946 applicable to investment companies.
Security valuation and fair value measurements — U.S. generally accepted accounting principles (“U.S. GAAP”) define fair value as the price the Funds would receive to sell an asset or pay to transfer a liability in an orderly transaction between market participants at the measurement date. All investments in securities are recorded at their fair value. The Funds define the term “market value”, as used throughout this report, as the estimated fair value. The Funds use various methods to measure fair value of their portfolio securities on a recurring basis. U.S. GAAP fair value measurement standards require disclosure of a hierarchy that prioritizes inputs to valuation methods. These inputs are summarized in the three broad levels listed below:
• Level 1 − quoted prices in active markets for identical securities
• Level 2 − other significant observable inputs (including quoted prices for similar securities, interest rates, prepayment speeds, credit risk, etc.)
• Level 3 − significant unobservable inputs (including a Fund's own assumptions in determining the fair value of investments)
The inputs or methodology used for valuing securities are not necessarily an indication of the risk associated with investing in those securities.
The aggregate value by input level, as of December 31, 2021, for each Fund’s investments, is included in each Fund’s Portfolio of Investments, which also includes a breakdown of the Fund’s investments by portfolio or sector allocation. The Funds did not hold or transfer any Level 3 categorized securities during the year ended December 31, 2021.
Changes in valuation techniques may result in transfers into or out of an investment’s assigned level within the hierarchy.
The Funds' portfolio securities are valued as of the close of the regular session of trading on the New York Stock Exchange (“NYSE”) (currently 4:00 p.m., Eastern Time or at the time as of which the NYSE establishes official closing prices). Portfolio securities traded on stock exchanges are valued at the last reported sale price, official close price, or last bid price if no sales are reported. Portfolio securities quoted by NASDAQ are valued at the NASDAQ Official Closing Price (“NOCP”) or from the primary exchange on which the security trades. To the extent these securities are actively traded, they are categorized in Level 1 of the fair value hierarchy. Options and futures are valued at the last quoted sales price. If there is no such reported sale on the valuation date, long option positions are valued at the most recent bid price, and short option positions are valued at the most recent ask price
Notes to Financial Statements (Continued)
on the valuation date and are categorized in Level 1. Shares of mutual funds in which the Funds invest are valued at their respective net asset value (“NAV”) as reported by the underlying funds and are categorized in Level 1.
Debt securities held by the Funds are valued at their evaluated bid by an independent pricing service or at their last broker-quoted bid prices as obtained from one or more of the major market makers for such securities. Independent pricing services use information provided by market makers or estimates of market values through accepted market modeling conventions. Observable inputs to the models may include prepayment speeds, pricing spread, yield, trade information, dealer quotes, market color, cash flow models, the securities’ terms and conditions, among others, and are generally categorized in Level 2. Investments in asset-backed and mortgage-backed securities are valued by independent pricing services using models that consider estimated cash flows of each tranche of the security, establish a benchmark yield and develop an estimated tranche specific spread to the benchmark yield based on the unique attributes of the tranche, and are generally categorized in Level 2. Debt securities with remaining maturities of 60 days or less may be valued at amortized cost, provided such amount approximates market value and are categorized in Level 2. While this method provides consistency in valuation (and may only be used if it approximates market value), it may result in periods during which fair value, as determined by amortized cost, is higher or lower than the price that would be received if the Fund sold the investment.
Securities mainly traded on a non-U.S. exchange or denominated in foreign currencies are generally valued according to the preceding closing values on that exchange, translated to U.S. dollars using currency exchange rates as of the close of regular trading on the NYSE, and are generally categorized in Level 1. However, if an event that may change the value of a security occurs after the time that the closing value on the non-U.S. exchange was determined, but before the close of regular trading on the NYSE, the security may be priced based on fair value and is generally categorized in Level 2. This may cause the value of the security, if held on the books of a Fund, to be different from the closing value on the non-U.S. exchange and may affect the calculation of that Fund’s NAV. The Funds may use fair value pricing under the following circumstances, among others:
• If the value of a security has been materially affected by events occurring before the Funds' pricing time but after the close of the primary markets on which the security is traded.
• If the exchange on which a portfolio security is principally traded closes early or if trading in a particular portfolio security was halted during the day and did not resume prior to the Funds' NAV calculation.
• If a security is so thinly traded that reliable market quotations are unavailable due to infrequent trading.
• If the validity of market quotations is not reliable.
Securities held by the Funds that do not have readily available market quotations, significant observable inputs, or securities for which the available market quotations are not reliable, are priced at their estimated fair value using procedures approved by the Funds' Board of Trustees (the “Board”)and are generally categorized in Level 3.
Investment companies — The Funds may invest in securities of other investment companies, including exchange-traded funds (“ETFs”), open-end funds and closed-end funds. Open-end funds are investment companies that issue new shares continuously and redeem shares daily. Closed-end funds are investment companies that typically issue a fixed number of shares that trade on a securities exchange or over-the-counter (“OTC”). An ETF is an investment company that typically seeks to track the performance of an index by holding in its portfolio shares of all the companies, or a representative sample of the companies, that are components of a particular index. ETF shares are traded on a securities exchange based on their market value. The risks of investment in other investment companies typically reflect the risks of the types of securities in which the other investment companies invest. Investments in ETFs and closed-end funds are subject to the additional risk that their shares may trade at a premium or discount to their NAV. When a Fund invests in another investment company, shareholders of the Fund indirectly bear their proportionate share of the other investment company’s fees and expenses, including operating, registration, trustee, licensing, and marketing, as well as their share of the Fund’s fees and expenses.
Collateralized Loan Obligations — The Bond Fund may invest in collateralized loan obligations (“CLOs”). CLOs are types of asset-backed securities. A CLO is an entity that is backed by syndicated bank loans. The cash flows of the CLO can be split into multiple segments, called “tranches,” which will vary in risk profile and yield. The riskiest segment is the subordinated or “equity” tranche. This tranche bears the greatest risk of defaults from the underlying assets in the CLO and serves to protect the other, more senior, tranches from default in all but the most severe circumstances. Since it is shielded from defaults by the more junior tranches, a “senior” tranche will typically have higher credit ratings and lower yields than their underlying securities, and often receive higher ratings from one or more of the nationally recognized rating agencies. Despite the protection from the more junior tranches, senior tranches can experience substantial losses due to actual defaults, increased sensitivity to future defaults and the disappearance of one or more protecting tranches as a result of changes in the credit profile of the underlying pool of assets.
Futures Contracts — The Balanced Fund and the Bond Fund may buy and sell futures contracts and related options to manage their exposure to changing interest rates and securities prices. Some strategies reduce the Funds' exposure to price fluctuations, while others tend to increase its market exposure. Futures and options on futures can be volatile instruments and involve certain risks that could negatively impact the Funds' returns. In order to avoid leveraging and related risks, when the Funds purchase
Notes to Financial Statements (Continued)
futures contracts, the Funds will collateralize their positions by depositing an amount of cash or liquid securities, equal to the market value of the futures positions held, less margin deposits, in a segregated account with their custodian or otherwise “cover” their positions in a manner consistent with the 1940 Act, or the rules of the Securities and Exchange Commission (“SEC”) or interpretations thereunder. Collateral equal to the current fair value of the futures position will be determined on a daily basis.
When the contract is closed, the Funds record a realized gain or loss equal to the difference between the proceeds from (or cost of) the closing transactions and the Funds' basis in the contract. Risks of entering into futures contracts include the possibility that a change in the value of the contract may not correlate with the changes in the value of the underlying instruments. Second, it is possible that a lack of liquidity for futures contracts could exist in the secondary market resulting in an inability to close a futures position prior to its maturity date. Third, the purchase of a futures contract involves the risk that the Funds could lose more than the original margin deposit required to initiate the futures transaction. Finally, the risk exists that losses could exceed amounts disclosed on the Statements of Assets and Liabilities. There is minimal counterparty credit risk involved in entering into futures contracts since they are exchange-traded instruments and the exchange’s clearinghouse, as counterparty to all exchange-traded futures, guarantees the futures against default.
As of December 31, 2021, the Balanced Fund and the Bond Fund did not hold any futures contracts.
Foreign currency translation — The books and records of the Funds are maintained in U.S. dollars and translated into U.S. dollars on the following basis:
| (1) | market value of investment securities, assets and liabilities at the current rate of exchange on the valuation date; and |
| (2) | purchases and sales of investment securities, income, and expenses at the relevant rates of exchange prevailing on the respective dates of such transactions. |
The Funds do not isolate that portion of gains and losses on investments in equity securities that is due to changes in the foreign exchange rates from that which is due to changes in market prices of equity securities.
Real Estate Investment Trusts — The Funds may invest in real estate investment trusts (“REITs”) that involve risks not associated with investing in stocks. Risks associated with investments in REITs include declines in the value of real estate, general and economic conditions, changes in the value of the underlying property and defaults by borrowers. The value of assets in the real estate industry may go through cycles of relative underperformance and outperformance in comparison to equity securities markets in general. Dividend income is recorded using management’s estimate of the income included in distributions received from REIT investments. The actual amounts of income, return of capital and capital gains are only determined by each REIT after its fiscal year-end and may differ from the estimated amount. Estimates of income are adjusted in the Funds to the actual amounts when the amounts are determined.
Derivative instruments and hedging activities — The Balanced Fund and Bond Fund may enter into an International Swaps and Derivatives Association, Inc. Master Agreement (“ISDA Master Agreement” or “MNA”) or similar agreement with certain counterparties. An ISDA Master Agreement is a bilateral agreement between a Fund and a counterparty that governs OTC derivatives and foreign exchange contracts, and typically contains, among other things, collateral posting terms and master netting provisions in the event of a default or termination. Under an ISDA Master Agreement, a party may, under certain circumstances, offset with the counterparty certain derivative financial instruments’ payables or receivables with collateral held or posted and create one single net payment. The provisions of the ISDA Master Agreement typically permit a single net payment in the event of default (close-out netting). These default events include bankruptcy or insolvency of the counterparty. Note, however, that bankruptcy or insolvency laws of a particular jurisdiction may impose restrictions on or prohibitions against the right of offset.
When entering into a derivative transaction, a Fund may be required to post and maintain collateral or margin (including both initial and maintenance margin). Collateral and margin requirements differ by type of derivative. Margin requirements are established by the broker or clearing house for exchange-traded and centrally cleared derivatives (financial futures contracts, options, and centrally cleared swaps). Brokers can ask for margining in excess of the clearing house’s minimum in certain circumstances. Collateral terms are contract specific for OTC derivatives (forward foreign currency contracts, options, and swaps). For derivatives traded under an ISDA Master Agreement, the collateral requirements are typically calculated by netting the marked-to-market amount for each transaction under such agreement and comparing that amount to the value of any collateral currently pledged by the Fund and the counterparty. For financial reporting purposes, cash collateral that has been pledged to cover obligations of the Fund and cash collateral received from the counterparty, if any, are reported separately on the Statements of Assets and Liabilities as cash deposits held at prime broker and due to prime broker, respectively. Non-cash collateral pledged by the Fund, if any, is noted in the Portfolio of Investments. To the extent amounts due to the Fund from its counterparties are not fully collateralized, contractually or otherwise, the Fund bears the risk of loss from counterparty non-performance.
Certain ISDA Master Agreements allow counterparties to OTC derivatives transactions to terminate derivative contracts prior to maturity in the event a Fund’s net assets decline by a stated percentage or the Fund fails to meet the terms of its ISDA Master Agreement, which would cause the Fund (counterparty) to accelerate payment of any net liability owed to the counterparty (Fund).
Notes to Financial Statements (Continued)
For financial reporting purposes, the Funds do not offset derivative assets and derivative liabilities that are subject to netting arrangements in the Statements of Assets and Liabilities.
As of December 31, 2021, the Funds did not hold any assets and liabilities that were subject to a MNA.
The following table sets forth the effect of the Bond Fund's derivative financial instruments by primary risk exposure on the Statements of Operations for the year ended December 31, 2021:
| Fund | Derivatives not accounted for as hedging
instruments under ASC 815 | Realized Gains
(Losses)
on Derivatives | Change in
Unrealized
Appreciation
(Depreciation)
on Derivatives |
| Bond Fund | Futures - Interest Rate Contracts* | $173,965 | $— |
| * | Statements of Operations Location: Net realized gains on futures contracts. |
For the year ended December 31, 2021, the average quarterly notional value of outstanding derivative financial instruments for the Bond Fund was as follows:
| | Bond Fund |
| Interest Rate Contracts: | |
| Futures Contracts - Notional Value | $2,958,240 |
Portfolio securities loaned — The Funds may lend their portfolio securities. Lending portfolio securities exposes the Funds to the risk that the borrower may fail to return the loaned securities or may not be able to provide additional collateral or that the Funds may experience delays in recovery of the loaned securities or loss of rights in the collateral if the borrower fails financially. To minimize these risks, the borrower must agree to maintain cash collateral with the Funds' custodian. The loaned securities are secured by collateral valued at least equal, at all times, to the market value of the loaned securities plus accrued interest, if any. When the collateral falls below specified amounts, the lending agent will use its best effort to obtain additional collateral on the next business day to meet required amounts under the security lending agreement. The cash collateral is reinvested by the Funds' custodian into an approved short-term investment vehicle. The approved short-term investment vehicle is subject to market risk.
As of December 31, 2021, the Funds did not have any securities on loan.
All cash collateral is received, held, and administered by the Funds' custodian for the benefit of the lending Fund in its custody account or other account established for the purpose of holding collateral in cash equivalents.
Funds participating in securities lending receive compensation in the form of fees. Securities lending income is derived from lending long securities from the Funds to creditworthy approved borrowers at rates that are determined based on daily trading volumes, float, short-term interest rates and market liquidity and is shown net of fees on the Statements of Operations. When a Fund lends securities, it retains the interest or dividends on the investment of any cash received as collateral, and the Fund continues to receive interest or dividends on the loaned securities.
Unrealized gain or loss on the market value of the loaned securities that may occur during the term of the loan is recognized by the Fund. The Fund has the right under the lending agreement to recover any loaned securities from the borrower on demand.
When-issued or delayed delivery transactions — Each Fund may purchase or sell securities on a when-issued or delayed delivery basis. These transactions involve a commitment by the Fund to purchase or sell securities for a predetermined price or yield, with payment and delivery taking place beyond the customary settlement period. When delayed delivery purchases are outstanding, the Fund will set aside liquid assets in an amount sufficient to meet the purchase price. When purchasing a security on a delayed delivery basis, the Fund assumes the rights and risks of ownership of the security, including the risk of price and yield fluctuations, and takes such fluctuations into account when determining NAV. The Fund may dispose of or renegotiate a delayed delivery transaction after it is entered into, and may sell when-issued securities before they are delivered, which may result in a capital gain or loss. When the Fund has sold a security on a delayed delivery basis, the Fund does not participate in future gains and losses with respect to the security.
Share valuation — The NAV per share of each class of shares of each Fund is calculated daily by dividing the total value of a Fund’s assets attributable to that class, less liabilities attributable to that class, by the number of outstanding shares of that class.
Investment income — Dividend income from securities is recognized on the ex-dividend date, net of foreign withholding taxes, if any, which are reduced by any amounts reclaimable by the Funds, where applicable. Interest income from securities is recorded on the basis of interest accrued, premium amortized and discount accreted. Realized gains and losses resulting from principal pay
Notes to Financial Statements (Continued)
downs on mortgage-backed and asset-backed securities are included in interest income. Market discounts, original issue discounts and market premiums on debt securities are accreted/amortized to interest income over the life of the security, or to the appropriate call date, as applicable, with a corresponding adjustment in the cost basis of that security.
Distributions to shareholders — Each Fund intends to distribute to its shareholders substantially all of its income and capital gains. Each Fund declares and distributes net investment income, if any, annually, as a dividend to shareholders. Each Fund makes distributions of capital gains, if any, at least annually, net of applicable capital loss carryforwards. Income distributions and capital gain distributions are determined in accordance with income tax regulations. Recognition of the Funds' net investment income from investments in underlying funds is affected by the timing of dividend declarations by the underlying funds.
Allocations — Investment income earned, realized capital gains and losses, and unrealized appreciation and depreciation for a Fund are allocated daily to each class of shares based upon its proportionate share of total net assets of the Fund. Class-specific expenses are charged directly to the class incurring the expense. Common expenses, which are not attributable to a specific class, are allocated daily to each class of shares based upon their proportionate share of total net assets of the Fund. Expenses not directly billed to a Fund are allocated proportionally among all Funds in the Trust, and, if applicable, Touchstone Strategic Trust and Touchstone Funds Group Trust (collectively with the Trust, “Touchstone Fund Complex”), daily in relation to net assets of each Fund or another reasonable measure.
Security transactions — Security transactions are reflected for financial reporting purposes as of the trade date. Realized gains and losses on sales of portfolio securities are calculated using the identified cost basis.
Estimates — The preparation of financial statements in conformity with U.S. GAAP requires management to make estimates and assumptions that affect the reported amounts of assets and liabilities and disclosure of contingent assets and liabilities at the date of the financial statements and the reported amounts of income and expenses during the reporting period. Actual results could differ from those estimates.
LIBOR Transition — Many debt securities, derivatives and other financial instruments in which the Funds may invest, as well as any borrowings made by the Funds from banks or from other lenders, utilize the London Interbank Offered Rate (“LIBOR”) as the reference or benchmark index for interest rate calculations. LIBOR is a measure of the average interest rate at which major global banks can borrow from one another. Plans are underway to phase out the use of LIBOR by June 30, 2023. The ICE Benchmark Administration Limited, the administrator of LIBOR, ceased publishing most LIBOR maturities, including some U.S. LIBOR maturities, on December 31, 2021, and is expected to cease publishing the remaining and most liquid U.S. LIBOR maturities on June 30, 2023. Before then, it is expected that market participants have or will transition to the use of different reference or benchmark indices. However, there is currently no definitive information regarding the future utilization of LIBOR or of any particular replacement index. As such, the potential effect of a transition away from LIBOR on the Funds’ investments cannot yet be determined.
3. Investment Transactions
Investment transactions (excluding short-term investments and U.S. Government securities) were as follows for the year ended December 31, 2021:
| | Balanced
Fund | Bond
Fund | Common Stock
Fund | Small
Company
Fund |
| Purchases of investment securities | $46,757,355 | $23,637,830 | $14,698,433 | $50,101,779 |
| Proceeds from sales and maturities | $60,106,477 | $39,187,423 | $57,297,268 | $62,927,351 |
For the year ended December 31, 2021, purchases and proceeds from sales and maturities in U.S. Government Securities were $23,338,594 and $16,009,824, respectively, for the Balanced Fund, and $125,534,652 and $102,251,522, respectively, for the Bond Fund.
4. Transactions with Affiliates and Other Related Parties
Certain officers of the Trust are also officers of the Advisor, Touchstone Securities, Inc. (the “Underwriter”), or The Bank of New York Mellon (“BNY Mellon”), the Sub-Administrator to the Funds. Such officers receive no compensation from the Trust. The Advisor and the Underwriter are each wholly-owned subsidiaries of Western & Southern.
On behalf of the Funds, the Advisor pays each Independent Trustee a quarterly retainer plus additional retainers to the Lead Independent Trustee and the chairs of each standing committee. Interested Trustees do not receive compensation from the Funds. Each Independent Trustee also receives compensation for each Board meeting and committee meeting attended. Each standing
Notes to Financial Statements (Continued)
committee chair receives additional compensation for each committee meeting that he or she oversees. The Advisor is reimbursed by the Funds for the Independent Trustees’ compensation and out-of-pocket expenses relating to their services. The Funds accrued Trustee-related expenses of $95,284 for the year ended December 31, 2021.
MANAGEMENT & EXPENSE LIMITATION AGREEMENTS
The Advisor provides general investment supervisory services for the Funds, under the terms of an advisory agreement (the “Advisory Agreement”). Under the Advisory Agreement, each Fund pays the Advisor a fee, which is computed and accrued daily and paid monthly, at an annual rate based on average daily net assets of each Fund as shown in the table below.
| Balanced Fund | 0.55% on all assets |
| Bond Fund | 0.40% on the first $300 million
0.35% on such assets over $300 million |
Common Stock Fund
Small Company Fund | 0.50% on the first $200 million
0.45% on the next $300 million
0.40% on such assets over $500 million |
The Advisor has entered into investment sub-advisory agreements with Fort Washington Investment Advisors, Inc. (the “Sub-Advisor”), an affiliate of the Advisor and wholly-owned subsidiary of Western & Southern. The Advisor pays sub-advisory fees to the Sub-Advisor from its advisory fee.
The Advisor entered into an expense limitation agreement (the “Expense Limitation Agreement”) to contractually limit the annual operating expenses of the Funds, excluding: dividend and interest expenses relating to short sales; interest; taxes; brokerage commissions and other transaction costs; portfolio transaction and investment related expenses, including expenses associated with the Funds’ liquidity providers; other expenditures which are capitalized in accordance with U.S. GAAP; the cost of “Acquired Fund Fees and Expenses”, if any; and other extraordinary expenses not incurred in the ordinary course of business. The maximum annual operating expense limit in any year with respect to the Funds is based on a percentage of the average daily net assets of the Funds. The Advisor has agreed to waive a portion of its fees, and to reimburse certain fund expenses in order to maintain the following expense limitations for the Funds:
| | Class SC | Class I | Termination Date |
| Balanced Fund* | 0.79% | 0.79% | April 29, 2022 |
| Bond Fund | 0.97% | 0.67% | April 29, 2022 |
| Common Stock Fund | 1.06% | 0.73% | April 29, 2022 |
| Small Company Fund | — | 0.76% | April 29, 2022 |
| * | Prior to April 13, 2021, the expense limitation for Class I shares was 0.85%. |
The Expense Limitation Agreement can be terminated, with respect to each Fund, by a vote of the Funds’ Board if it deems the termination to be beneficial to the Fund's shareholders.
During the year ended December 31, 2021, the Advisor or its affiliates waived investment advisory fees, administration fees or shareholder servicing fees and other operating expenses of the Funds as follows:
| Fund | Investment
Advisory
Fees Waived | Administration
Fees Waived | Shareholder Servicing
Fees and Operating
Expenses
Reimbursed/
Waived | Total |
| Balanced Fund | $— | $52,363 | $123,127 | $175,490 |
| Bond Fund | — | — | 38,593 | 38,593 |
| Common Stock Fund | — | — | 44,492 | 44,492 |
| Small Company Fund | — | — | 21,468 | 21,468 |
Under the terms of the Expense Limitation Agreement, the Advisor is entitled to recover, subject to approval by the Funds’ Board, such amounts waived or reimbursed for a period of up to three years from the date on which the Advisor reduced its compensation or assumed expenses for the Funds. A Fund will make repayments to the Advisor only if such repayment does not cause the Fund's operating expenses (after the repayment is taken into account) to exceed the Fund's expense limit in place when such amounts were waived or reimbursed by the Advisor and the Fund's current expense limitation.
Notes to Financial Statements (Continued)
As of December 31, 2021, the Advisor may seek recoupment of previously waived fees and reimbursed expenses as follows:
| Fund | Expires on
or before
December 31, 2022 | Expires on
or before
December 31, 2023 | Expires on
or before
December 31, 2024 | Total |
| Balanced Fund | $108,321 | $90,621 | $175,490 | $374,432 |
| Bond Fund | 125,065 | 56,535 | 38,593 | 220,193 |
| Common Stock Fund | 124,593 | 90,446 | 44,492 | 259,531 |
| Small Company Fund | 55,878 | 64,631 | 21,468 | 141,977 |
The Advisor did not recoup any amounts it previously waived or reimbursed during the year ended December 31, 2021.
ADMINISTRATION AGREEMENT
The Advisor entered into an Administration Agreement with the Trust, whereby the Advisor is responsible for: supplying executive and regulatory compliance services; supervising the preparation of tax returns; coordinating the preparation of reports to shareholders and reports to and filings with, the SEC and state securities authorities, as well as materials for meetings of the Board; calculating the daily NAV per share; and maintaining the financial books and records of each Fund.
For its services, the Advisor’s annual administrative fee is:
0.145% on the first $20 billion of the aggregate average daily net assets;
0.11% on the next $10 billion of aggregate average daily net assets;
0.09% on the next $10 billion of aggregate average daily net assets; and
0.07% on the aggregate average daily net assets over $40 billion.
The fee is computed and allocated among the Touchstone Fund Complex on the basis of relative daily net assets and is included in Administration Fees on the Statement of Operations.
The Advisor has engaged BNY Mellon as the Sub-Administrator to the Trust. BNY Mellon provides administrative and accounting services to the Trust and is compensated directly by the Advisor, not the Trust.
TRANSFER AGENT AGREEMENT
Under the terms of the Transfer Agent Agreement between the Trust and BNY Mellon Investment Servicing (U.S.) Inc. ("Transfer Agent"), the Transfer Agent to the Funds maintains the records of each shareholder’s account, answers shareholders’ inquiries concerning their accounts, processes purchases and redemptions of each Fund’s shares, acts as dividend and distribution disbursing agent, and performs other shareholder service functions. For these services, the Transfer Agent receives a monthly fee from each Fund. In addition, each Fund pays out-of-pocket expenses incurred by the Transfer Agent, including, but not limited to, postage and supplies.
The Funds may reimburse the Advisor for fees paid to intermediaries such as banks, broker-dealers, financial advisors or other financial institutions for sub-transfer agency, sub-administration and other services provided to investors whose shares of record are held in omnibus, other group accounts, retirement plans or accounts traded through registered securities clearing agents. These fees, which are included in Transfer Agent fees in the Statements of Operations, may vary based on, for example, the nature of services provided, but generally range up to 0.15% of the assets of the class serviced or maintained by the intermediary or up to $22 per sub-account maintained by the intermediary.
PLANS OF DISTRIBUTION
The Trust has adopted a Shareholder Services Plan under which Class SC shares of each Fund, may directly or indirectly bear expenses for shareholder services provided. Each Fund offering Class SC shares will incur or reimburse expenses for shareholder services at an annual rate not to exceed 0.25% of the average daily net assets.
UNDERWRITING AGREEMENT
The Underwriter acts as exclusive agent for the distribution of the Funds’ shares. The Underwriter receives no compensation under this agreement.
Notes to Financial Statements (Continued)
INTERFUND TRANSACTIONS
Pursuant to Rule 17a-7 under the 1940 Act, the Funds may engage in purchase and sale transactions with funds that have a common investment advisor (or affiliated investment advisors), common Trustees and/or common Officers. During the year ended December 31, 2021, the Funds did not engage in any Rule 17a-7 transactions.
5. Liquidity
Interfund Lending — Pursuant to an Exemptive Order issued by the SEC on March 28, 2017, the Funds, along with certain other funds in the Touchstone Fund Complex, may participate in an interfund lending program. The interfund lending program provides an alternate credit facility that allows the Funds to lend to or borrow from other participating funds in the Touchstone Fund Complex, subject to the conditions of the Exemptive Order. The Funds may not borrow under the facility for leverage purposes and the loans’ duration may be no more than 7 days.
During the year ended December 31, 2021, the following Fund participated as a borrower in the interfund lending program. The daily average amount borrowed, weighted average interest rate and interest expense were as follows:
| Fund | Daily Average
Amount Borrowed | Weighted Average
Interest Rate | Interest
Expense* |
| Balanced Fund | $ 59,031 | 0.67% | $ 401 |
| * | Included in Other expenses in the Statements of Operations. |
6. Federal Tax Information
Federal Income Tax — It is each Fund’s policy to continue to comply with the special provisions of the Internal Revenue Code applicable to regulated investment companies. As provided therein, in any fiscal year in which a Fund so qualifies and distributes at least 90% of its investment company taxable income, the Fund (but not the shareholders) will be relieved of federal income tax on the income distributed. It is each Fund’s policy to distribute all of its taxable income and accordingly, no provision for income taxes has been made.
In order to avoid imposition of the excise tax applicable to regulated investment companies, it is also each Fund’s intention to declare and pay as dividends in each calendar year at least 98% of its investment company taxable income (earned during the calendar year) and 98.2% of its net realized capital gains (earned during the twelve months ending October 31) plus undistributed amounts from prior years.
The tax character of distributions paid for the years ended December 31, 2021 and December 31, 2020 are as follows:
| | Balanced Fund | Bond Fund |
| | Year Ended
December 31,
2021 | Year Ended
December 31,
2020 | Year Ended
December 31,
2021 | Year Ended
December 31,
2020 |
| From ordinary income | $311,042 | $363,954 | $3,142,376 | $1,750,639 |
| From long-term capital gains | 649,760 | 489,772 | — | — |
| Total distributions | $960,802 | $853,726 | $3,142,376 | $1,750,639 |
| | Common Stock Fund | Small Company Fund |
| | Year Ended
December 31,
2021 | Year Ended
December 31,
2020 | Year Ended
December 31,
2021 | Year Ended
December 31,
2020 |
| From ordinary income | $1,512,930 | $1,270,647 | $52,041 | $90,022 |
| From long-term capital gains | 7,816,206 | 6,516,479 | 1,390,549 | 2,217,235 |
| Total distributions | $9,329,136 | $7,787,126 | $1,442,590 | $2,307,257 |
Notes to Financial Statements (Continued)
The following information is computed on a tax basis for each item as of December 31, 2021:
| | Balanced
Fund | Bond
Fund | Common Stock
Fund | Small
Company Fund |
| Tax cost of portfolio investments | $60,720,148 | $104,354,507 | $122,700,628 | $53,290,193 |
| Gross unrealized appreciation on investments | 12,201,564 | 3,009,024 | 134,288,574 | 24,593,383 |
| Gross unrealized depreciation on investments | (617,576) | (881,539) | (3,455,913) | (2,197,362) |
| Net unrealized appreciation (depreciation) on investments | 11,583,988 | 2,127,485 | 130,832,661 | 22,396,021 |
| Gross unrealized appreciation on foreign currency transactions | — | — | 43 | — |
| Net unrealized appreciation (depreciation) on foreign currency transactions | — | — | 43 | — |
| Capital loss carryforwards | — | (855,751) | — | — |
| Undistributed ordinary income | 2,671,109 | 2,080,065 | 1,076,512 | 5,950,388 |
| Undistributed capital gains | 11,231,960 | 415,083 | 26,896,557 | 11,393,308 |
| Other temporary differences | — | (7,443) | — | — |
| Accumulated earnings (deficit) | $25,487,057 | $3,759,439 | $158,805,773 | $39,739,717 |
The difference between the tax cost of portfolio investments and the financial statement cost is primarily due to wash sale loss deferrals and non-taxable distributions from corporate stock.
As of December 31, 2021, the Funds had the following capital loss carryforwards for federal income tax purposes:
| Fund | No Expiration
Short Term | No Expiration
Long Term | Total |
| Bond Fund | $ — | $ 855,751 | $ 855,751 |
The capital loss carryforwards may be utilized in future years to offset net realized capital gains, if any, prior to distributing such gains to shareholders.
During the year ended December 31, 2021, the following Funds utilized capital loss carryforwards:
| Fund | Utilized |
| Bond Fund | $ 826,782 |
Under current laws, certain capital losses realized after October 31 and ordinary losses realized after December 31 may be deferred (and certain ordinary losses after October and/or December 31 may be deferred) and treated as occurring on the first day of the following fiscal year. For the year ended December 31, 2021, the Funds did not elect to defer any losses.
The Funds have analyzed their tax positions taken or to be taken on federal income tax returns for all open tax years (tax years ended December 31, 2018 through 2021) and have concluded that no provision for income tax is required in their financial statements.
Certain reclassifications, the result of permanent differences between financial statement and income tax reporting requirements, have been made to the components of capital as presented on the Statements of Assets and Liabilities. These reclassifications have no impact on the net assets or NAV per share of the Funds. The following reclassifications, which are primarily attributed to various temporary book/tax differences due to mergers, have been made to the following Fund for the year ended December 31, 2021:
| Fund | Paid-In
Capital | Distributable
Earnings |
| Balanced Fund | $ 50,181 | $ (50,181) |
7. Commitments and Contingencies
The Funds indemnify the Trust’s officers and Trustees for certain liabilities that might arise from their performance of their duties to the Funds. Additionally, in the normal course of business, the Funds enter into contracts that contain a variety of representations and warranties and which provide general indemnifications. The Funds' maximum exposure under these arrangements is unknown, as this would involve future claims that may be made against the Funds.
8. Principal Risks
Risks Associated with Foreign Investments – Some of the Funds may invest in the securities of foreign issuers. Investing in securities issued by companies whose principal business activities are outside the U.S. may involve significant risks not present in domestic investments. For example, there is generally less publicly available information about foreign companies, particularly
Notes to Financial Statements (Continued)
those not subject to the disclosure and reporting requirements of the U.S. securities laws. Foreign issuers are generally not bound by uniform accounting, auditing, and financial reporting requirements and standards of practice comparable to those applicable to domestic issuers. Investments in foreign securities also involve the risk of possible adverse changes in investment or exchange control regulations, expropriation or confiscatory taxation, limitations on the removal of funds or other assets of a Fund, political or financial instability or diplomatic and other developments which could affect such investments. Foreign stock markets, while growing in volume and sophistication, are generally not as developed as those in the U.S., and securities of some foreign issuers (particularly those located in developing countries) may be less liquid and more volatile than securities of comparable U.S. companies. In general, there is less overall governmental supervision and regulation of foreign securities markets, broker-dealers, and issuers than in the U.S.
Risks Associated with Sector Concentration – Certain Funds may invest a high percentage of their assets in specific sectors of the market in order to achieve a potentially greater investment return. As a result, these Funds may be more susceptible to economic, political, and regulatory developments in a particular sector of the market, positive or negative, and may experience increased volatility in the Funds' NAVs and magnified effect on the total return.
Risks Associated with Credit – An issuer may be unable to make timely payments of either principal or interest. This may cause the issuer’s securities to decline in value. Credit risk is particularly relevant to those Funds that invest a significant amount of their assets in junk bonds or lower-rated securities.
Risks Associated with Interest Rate Changes – The price of debt securities is generally linked to the prevailing market interest rates. In general, when interest rates rise, the price of debt securities falls, and when interest rates fall, the price of debt securities rises. The price volatility of a debt security also depends on its maturity. Longer-term securities are generally more volatile, so the longer the average maturity or duration of these securities, the greater their price risk. Duration is a measure of the expected life, taking into account any prepayment or call features of the security, that is used to determine the price sensitivity of the security for a given change in interest rates. Specifically, duration is the change in the value of a fixed-income security that will result from a 1% change in interest rates, and generally is stated in years. For example, as a general rule a 1% rise in interest rates means a 1% fall in value for every year of duration. Maturity, on the other hand, is the date on which a fixed-income security becomes due for payment of principal. The negative impact on fixed income securities if interest rates increase as a result could negatively impact a Fund’s NAV.
Risks Associated with Health Crises – An outbreak of respiratory disease caused by COVID-19 was first detected in China in December 2019 and subsequently spread internationally. As of the date of issuance of these financial statements, COVID-19 has resulted in closing borders, enhanced health screenings, healthcare service preparation and delivery, quarantines, cancellations, disruptions to supply chains and customer activity, as well as general concern and uncertainty. The impact of COVID-19 may be short term or may last for an extended period of time and has resulted in a substantial economic downturn. The impact of this outbreak, and other epidemics and pandemics that may arise in the future, has and could continue to negatively affect the worldwide economy, as well as the economies of individual countries, individual companies, including certain Fund service providers and issuers of the Fund's investments and the market in general in significant and unforeseen ways. Any such impact could adversely affect a Fund’s performance, the performance of the securities in which a Fund invests and may lead to losses on your investment in a Fund.
Please see the Funds’ prospectus and statement of additional information for a complete discussion of these and other risks.
9. Fund Reorganizations
Balanced Fund:
The shareholders of the Touchstone Aggressive ETF Fund, Touchstone Conservative ETF Fund and Touchstone Moderate ETF Fund, each a series of the Trust, approved an Agreement and Plan of Reorganization providing for the transfer of all assets and liabilities of the Touchstone Aggressive ETF Fund, Touchstone Conservative ETF Fund and Touchstone Moderate ETF Fund to the Touchstone Balanced Fund. The tax-free reorganization took place on April 16, 2021.
Notes to Financial Statements (Continued)
The following is a summary of shares outstanding, net assets, net asset value per share and unrealized appreciation immediately before and after the tax-free reorganization.
| | Before Reorganization | After
Reorganization |
| | Touchstone
Aggressive ETF Fund | Touchstone
Conservative ETF Fund | Touchstone
Moderate ETF Fund | Touchstone
Balanced Fund | Touchstone
Balanced Fund |
| Class SC | | | | | |
| Shares | 1,487,076(A) | 880,971(B) | 1,220,102(C) | 170 | 3,588,319 |
| Net Assets | $21,994,268 | $13,029,832 | $18,045,613 | $2,521 | $53,072,234 |
| Net Assets Value | $14.79(A) | $14.79(B) | $14.79(C) | $14.79 | $14.79 |
| Class I | | | | | |
| Shares | — | — | — | 1,317,216 | 1,317,216 |
| Net Assets | $— | $— | $— | $19,481,966 | $19,481,966 |
| Net Asset Value | $— | $— | $— | $14.79 | $14.79 |
| Fund Total | | | | | |
| Shares Outstanding | 1,487,076 | 880,971 | 1,220,102 | 1,317,386 | 4,905,535 |
| Net Assets | $21,994,268 | $13,029,832 | $18,045,613 | $19,484,487 | $72,554,200 |
| Unrealized Appreciation (Depreciation) | $6,458,478 | $2,668,289 | $4,252,443 | $6,703,226 | $20,082,436 |
| (A) | Reflects a 1.2829:1 stock split which occurred on the date of the reorganization, April 16, 2021. |
| (B) | Reflects a 0.8118:1 stock split which occurred on the date of the reorganization, April 16, 2021. |
| (C) | Reflects a 0.8538:1 stock split which occurred on the date of the reorganization, April 16, 2021. |
Assuming the reorganization had been completed on January 1, 2021, the Balanced Fund’s results of operations for the year ended December 31, 2021 would have been as follows:
| Net investment income | $325,299 |
| Net realized and unrealized gain(loss) on investments | $9,794,515 |
| Net increase in net assets resulting from operations | $10,119,814 |
Because the combined investment portfolios have been managed as a single portfolio since the reorganization was completed, it is not practical to separate the amounts of revenue and earnings to the Touchstone Balanced Fund’s results of operations that have been included in its statement of operations since the reorganization.
10. Subsequent Events
Subsequent events occurring after the date of this report have been evaluated for potential impact to this report through the date the financial statements were issued. There were no subsequent events that necessitated recognition or disclosure in the Funds’ financial statements.
Report of Independent Registered Public Accounting Firm
To the Shareholders and the Board of Trustees of Touchstone Variable Series Trust
Opinion on the Financial Statements
We have audited the accompanying statements of assets and liabilities of Touchstone Variable Series Trust (the “Trust”) (comprising the Touchstone Balanced Fund, Touchstone Bond Fund, Touchstone Common Stock Fund and Touchstone Small Company Fund (collectively referred to as the “Funds”)), including the portfolios of investments, as of December 31, 2021, and the related statements of operations for the year then ended, the statements of changes in net assets for each of the two years in the period then ended, the financial highlights for each of the five years in the period then ended and the related notes (collectively referred to as the “financial statements”). In our opinion, the financial statements present fairly, in all material respects, the financial position of each of the Funds comprising Touchstone Variable Series Trust at December 31, 2021, the results of their operations for the year then ended, the changes in their net assets for each of the two years in the period then ended and their financial highlights for each of the five years in the period then ended, in conformity with U.S. generally accepted accounting principles.
Basis for Opinion
These financial statements are the responsibility of the Trust’s management. Our responsibility is to express an opinion on each of the Funds’ financial statements based on our audits. We are a public accounting firm registered with the Public Company Accounting Oversight Board (United States) (“PCAOB”) and are required to be independent with respect to the Trust in accordance with the U.S. federal securities laws and the applicable rules and regulations of the Securities and Exchange Commission and the PCAOB.
We conducted our audits in accordance with the standards of the PCAOB. Those standards require that we plan and perform the audit to obtain reasonable assurance about whether the financial statements are free of material misstatement, whether due to error or fraud. The Trust is not required to have, nor were we engaged to perform, an audit of the Trust’s internal control over financial reporting. As part of our audits, we are required to obtain an understanding of internal control over financial reporting but not for the purpose of expressing an opinion on the effectiveness of the Trust’s internal control over financial reporting. Accordingly, we express no such opinion.
Our audits included performing procedures to assess the risks of material misstatement of the financial statements, whether due to error or fraud, and performing procedures that respond to those risks. Such procedures included examining, on a test basis, evidence regarding the amounts and disclosures in the financial statements. Our procedures included confirmation of securities owned as of December 31, 2021, by correspondence with the custodian and brokers or by other appropriate auditing procedures where replies from brokers were not received. Our audits also included evaluating the accounting principles used and significant estimates made by management, as well as evaluating the overall presentation of the financial statements. We believe that our audits provide a reasonable basis for our opinion.
We have served as the auditor of one or more Touchstone Investments’ investment companies since 1999.
Cincinnati, Ohio
February 21, 2022
Dividend Received Deduction
For corporate shareholders, the following ordinary distributions paid during the fiscal year ended December 31, 2021 qualify for the corporate dividends received deduction. The Funds intend to pass through the maximum allowable percentage.
| Balanced Fund | 100.00 % |
| Common Stock Fund | 100.00 % |
| Small Company Fund | 100.00 % |
For the fiscal year ended December 31, 2021, the Funds designated long-term capital gains as follows:
| Balanced Fund | $ 11,231,980 |
| Bond Fund | $ 415,083 |
| Common Stock Fund | $ 26,896,644 |
| Small Company Fund | $ 11,393,309 |
Proxy Voting Guidelines and Proxy Voting Records
The Sub-Advisors are responsible for exercising the voting rights associated with the securities purchased and held by the Funds. A description of the policies and procedures that the Sub-Advisors use in fulfilling this responsibility is available as an appendix to the most recent Statement of Additional Information, which can be obtained without charge by calling toll free 1.800.543.0407 or by visiting the Touchstone website at TouchstoneInvestments.com or on the Securities and Exchange Commission’s (the “Commission”) website sec.gov. Information regarding how those proxies were voted during the most recent twelve-month period ended June 30, which will be filed by August 31 of that year, is also available without charge by calling toll free 1.800.543.0407 or on the Commission’s website at sec.gov.
Quarterly Portfolio Disclosure
Each Fund’s holdings as of the end of the third month of every fiscal quarter will be disclosed on Form N-PORT within 60 days of the end of the fiscal quarter. The complete listing of each Fund’s portfolio holdings is available on the Commission’s website and will be made available to shareholders upon request by calling 1.800.543.0407.
Schedule of Shareholder Expenses
As a shareholder of the Funds, you incur two types of costs: (1) transaction costs, including sales charges (loads) and (2) ongoing costs, including investment advisory fees; shareholder servicing fees; and other Fund expenses. This example is intended to help you understand your ongoing costs (in dollars) of investing in the Funds and to compare these costs with the ongoing costs of investing in other mutual funds.
The example is based on an investment of $1,000 invested at the beginning of the period and held for the entire period (July 1, 2021 through December 31, 2021).
Actual Expenses
The first line for each share class of a Fund in the table below provides information about actual account values and actual expenses. You may use the information in this line, together with the amount you invested, to estimate the expenses that you paid over the period. Simply divide your account value by $1,000 (for example, an $8,600 account value divided by $1,000 = 8.6), then multiply the result by the number in the first line under the heading entitled “Expenses Paid During the Six Months Ended December 31, 2021” to estimate the expenses you paid on your account during this period.
Hypothetical Example for Comparison Purposes
The second line for each share class of a Fund in the table below provides information about hypothetical account values and hypothetical expenses based on the Funds’ actual expense ratio and an assumed rate of return of 5% per year before expenses, which is not the Funds’ actual return. The hypothetical account values and expenses may not be used to estimate the actual ending account balance or expenses you paid for the period. You may use this information to compare the ongoing costs of investing in the Funds and other funds. To do so, compare this 5% hypothetical example with the 5% hypothetical examples that appear in the shareholder reports of the other funds.
Other Items (Unaudited) (Continued)
Please note that the expenses shown in the table below are meant to highlight your ongoing costs only and do not reflect any transactional costs, such as sales charges (loads). Therefore, the second line for each share class of a Fund in the table below is useful in comparing ongoing costs only, and will not help you determine the relative total costs of owning different funds. In addition, if these transactional costs were included, your costs would have been higher.
| | | Net Expense
Ratio
Annualized
December 31,
2021 | Beginning
Account
Value
July 1,
2021 | Ending
Account
Value
December 31,
2021 | Expenses
Paid During
the Six Months
Ended
December 31,
2021* |
| Balanced Fund | | | | | |
| Class SC | Actual | 0.79% | $1,000.00 | $1,050.90 | $4.08 |
| Class SC | Hypothetical | 0.79% | $1,000.00 | $1,021.22 | $4.02 |
| Class I | Actual | 0.81% | $1,000.00 | $1,050.90 | $4.19 |
| Class I | Hypothetical | 0.81% | $1,000.00 | $1,021.12 | $4.13 |
| Bond Fund | | | | | |
| Class SC | Actual | 0.83% | $1,000.00 | $999.00 | $4.18 |
| Class SC | Hypothetical | 0.83% | $1,000.00 | $1,021.02 | $4.23 |
| Class I | Actual | 0.67% | $1,000.00 | $1,000.00 | $3.38 |
| Class I | Hypothetical | 0.67% | $1,000.00 | $1,021.83 | $3.41 |
| Common Stock Fund | | | | | |
| Class SC | Actual | 0.94% | $1,000.00 | $1,078.30 | $4.92 |
| Class SC | Hypothetical | 0.94% | $1,000.00 | $1,020.47 | $4.79 |
| Class I | Actual | 0.73% | $1,000.00 | $1,080.30 | $3.83 |
| Class I | Hypothetical | 0.73% | $1,000.00 | $1,021.53 | $3.72 |
| Small Company Fund | | | | | |
| Class I | Actual | 0.76% | $1,000.00 | $1,241.80 | $4.29 |
| Class I | Hypothetical | 0.76% | $1,000.00 | $1,021.37 | $3.87 |
| * | Expenses are equal to the Fund’s annualized expense ratio, multiplied by the average account value over the period, multiplied by 184/365 (to reflect one-half year period). |
Liquidity Risk Management
The Funds have adopted and implemented a written liquidity risk management program (the “LRM Program”) as required by Rule 22e-4 under the Investment Company Act of 1940. Rule 22e-4 requires that each Fund adopt a program that is reasonably designed to assess and manage the Funds’ liquidity risk, which is the risk that a Fund could not meet redemption requests without significant dilution of remaining investors’ interests in a Fund.
Assessment and management of a Fund’s liquidity risk under the LRM Program takes into consideration certain factors, such as a Fund’s investment strategy and the liquidity of its portfolio investments during normal and reasonably foreseeable stressed conditions, its short- and long-term cash-flow projections during both normal and reasonably foreseeable stressed conditions, and its cash and cash-equivalent holdings and access to other funding sources. As required by the rule, the LRM Program includes policies and procedures for classification of Fund portfolio holdings in four liquidity categories, maintaining certain levels of highly liquid investments, and limiting holdings of illiquid investments.
The Board of Trustees of the Trust approved the appointment of a LRM Program administrator responsible for administering the LRM Program and for carrying out the specific responsibilities set forth in the LRM Program, including reporting to the Board on at least an annual basis regarding the LRM Program’s operation, its adequacy, and the effectiveness of its implementation for the past year (the “Program Administrator Report”). The Board has reviewed the Program Administrator Report covering the period from May 15, 2020 through May 14, 2021 (the “Review Period”). The Program Administrator Report stated that during the Review Period the LRM Program operated and was implemented effectively to manage the Funds’ liquidity risk.
Advisory and Sub-Advisory Agreement Approval Disclosure
At a meeting held on November 18, 2021, the Board of Trustees (the “Board” or “Trustees”) of the Touchstone Variable Series Trust (the “Trust”), and by a separate vote, the Independent Trustees of the Trust, approved the continuance of the Investment Advisory Agreement between the Trust and the Advisor with respect to each Fund of the Trust, and the continuance of the Sub-Advisory Agreement between the Advisor and the Sub-Advisor.
In determining whether to approve the continuation of the Investment Advisory Agreement and the Sub-Advisory Agreements, the Advisor furnished information necessary for a majority of the Independent Trustees to make the determination that the continuance of the Investment Advisory Agreement and each Sub-Advisory Agreement was in the best interests of the respective
Other Items (Unaudited) (Continued)
Funds and their shareholders. The information provided to the Board included: (1) industry data comparing advisory fees and total expense ratios of comparable funds; (2) comparative performance information; (3) the Advisor’s and its affiliates’ revenues and costs of providing services to the Funds; and (4) information about the Advisor’s and Sub-Advisor’s personnel. Prior to voting, the Independent Trustees reviewed the proposed continuance of the Investment Advisory Agreement and the Sub-Advisory Agreements with management and experienced independent legal counsel and received materials from such counsel discussing the legal standards for their consideration of the proposed continuation of the Investment Advisory Agreement and each Sub-Advisory Agreement. The Independent Trustees also reviewed the proposed continuation of the Investment Advisory Agreement and each Sub-Advisory Agreement with independent legal counsel in private sessions at which no representatives of management were present.
In approving the Funds’ Investment Advisory Agreement, the Board considered various factors, among them: (1) the nature, extent and quality of services provided to the Funds, including the personnel providing such services; (2) the Advisor’s compensation and profitability; (3) a comparison of fees and performance with comparable funds; (4) economies of scale; and (5) the terms of the Investment Advisory Agreement. The Board’s analysis of these factors is set forth below. The Independent Trustees were advised by independent legal counsel throughout the process.
Nature, Extent and Quality of Advisor Services. The Board considered the level and depth of knowledge of the Advisor, including the professional experience and qualifications of senior personnel. In evaluating the quality of services provided by the Advisor, the Board took into account its familiarity with the Advisor’s senior management through Board meetings, discussions and reports during the preceding year. The Board also took into account the Advisor’s compliance policies and procedures. The quality of administrative and other services, including the Advisor’s role in coordinating the activities of the Funds’ other service providers, was also considered. The Board also considered the Advisor’s relationship with its affiliates and the resources available to them, as well as any potential conflicts of interest.
The Board discussed the Advisor’s effectiveness in monitoring the performance of the Sub-Advisor, an affiliate of the Advisor, and the Advisor’s timeliness in responding to performance issues. The Board considered the Advisor’s process for monitoring the Sub-Advisor, which includes an examination of both qualitative and quantitative elements of the Sub-Advisor’s organization, personnel, procedures, investment discipline, infrastructure and performance. The Board considered that the Advisor conducts periodic due diligence of the Sub-Advisor, during which the Advisor examines a wide variety of factors, such as the financial condition of the Sub-Advisor, the quality of the Sub-Advisor’s systems, the effectiveness of the Sub-Advisor’s disaster recovery programs, trade allocation and execution procedures, compliance with the Sub-Advisor’s policies and procedures, results of regulatory examinations and any other factors that might affect the quality of services that the Sub-Advisor provides to the Funds. The Board noted that the Advisor’s monitoring processes also include quarterly reviews of compliance certifications, and that any issues arising from such reviews and the Advisor’s due diligence reviews of the Sub-Advisor are reported to the Board.
The Trustees concluded that they were satisfied with the nature, extent and quality of services provided to each Fund by the Advisor under the Investment Advisory Agreement.
Advisor’s Compensation and Profitability. The Board took into consideration the financial condition and profitability of the Advisor and its affiliates (including the Sub-Advisor) and the direct and indirect benefits derived by the Advisor and its affiliates from the Advisor’s relationship with the Funds. The information considered by the Board included operating profit margin information for the Advisor’s business as a whole. The Board noted that the Advisor had waived a portion of advisory fees and administrative fees and/or reimbursed expenses in order to limit each Fund’s net operating expenses. The Board also noted that the Advisor pays the Sub-Advisor’s sub-advisory fees out of the advisory fees the Advisor receives from the Funds. The Board reviewed the profitability of the Advisor’s relationship with the Funds both before and after tax expenses, and also considered whether the Advisor has the financial wherewithal to continue to provide services to the Funds, noting the ongoing commitment of the Advisor’s parent company with respect to providing support and resources as needed. The Board also noted that the Advisor derives benefits to its reputation and other benefits from its association with the Funds. The Board also considered that affiliates of the Advisor may benefit from certain indirect tax benefits, including those relating to dividend received deductions.
The Board recognized that the Advisor should be entitled to earn a reasonable level of profits in exchange for the level of services it provides to each Fund and the entrepreneurial risk that it assumes as Advisor. Based upon their review, the Trustees concluded that the Advisor’s and its affiliates’ level of profitability, if any, from their relationship with each Fund was reasonable and not excessive.
Expenses and Performance. The Board compared the respective advisory fees and total expense ratios for each of the Funds with various comparative data, including the median and average advisory fees and total expense ratios of each Fund’s respective peer group. The Board also considered, among other data, the Funds’ respective performance results during the six-month, twelve-month and thirty-six-month periods ended September 30, 2021 and noted that the Board reviews on a quarterly basis detailed information about each Fund’s performance results, portfolio composition and investment strategies. The Board also took into account current market conditions and their effect on the Funds’ performance.
Other Items (Unaudited) (Continued)
The Board also considered the effect of each Fund’s growth and size on its performance and expenses. The Board noted that the Advisor had waived a portion of the fees and/or reimbursed expenses of the Funds in order to reduce those Funds’ respective operating expenses to targeted levels. The Board noted that the sub-advisory fees under the Sub-Advisory Agreement with respect to each Fund were paid by the Advisor out of the advisory fees it receives from the Fund and considered the impact of such sub-advisory fees on the profitability of the Advisor. In reviewing the respective total expense ratios and performance of each of the Funds, the Board also took into account the nature, extent and quality of the services provided to the Funds by the Advisor and its affiliates.
The Board considered, among other data, the specific factors and related conclusions set forth below with respect to each Fund:
Touchstone Balanced Fund. The Fund’s advisory fee and total expense ratio (net of applicable expense waivers and reimbursements) were each below the median of its peer group. The Board noted that the Advisor was currently waiving and/or reimbursing a portion of the Fund’s fees and/or expenses. The Fund’s performance for each of the six-, twelve- and thirty-six-month periods ended September 30, 2021 was in the 1st quintile of its peer group. Based upon their review, the Trustees concluded that the Fund’s overall performance was satisfactory relative to the performance of funds with similar investment objectives and relevant indices, and that the advisory fee was reasonable in light of the services received by the Fund from the Advisor and the other factors considered.
Touchstone Bond Fund. The Fund’s advisory fee and total expense ratio (net of applicable expense waivers and reimbursements) were at the median and above the median, respectively, of its peer group. The Board noted that the Advisor was currently waiving and/or reimbursing a portion of the Fund’s fees and/or expenses. The Fund’s performance for each of the six- and twelve-month periods ended September 30, 2021 was in the 4th quintile of its peer group, while the Fund’s performance for the thirty-six-month period ended September 30, 2021 was in the 2nd quintile of its peer group. The Board noted management’s discussion of the Fund’s recent performance. Based upon their review, the Trustees concluded that the Fund’s overall performance was satisfactory relative to the performance of funds with similar investment objectives and relevant indices, and that the advisory fee was reasonable in light of the services received by the Fund from the Advisor and the other factors considered.
Touchstone Common Stock Fund. The Fund’s advisory fee and total expense ratio (net of applicable expense waivers and reimbursements) were below the median and above the median, respectively, of its peer group. The Board noted that the Advisor was currently waiving and/or reimbursing a portion of the Fund’s fees and/or expenses. The Fund’s performance for the six-month period ended September 30, 2021 was in the 2nd quintile of its peer group, while the Fund’s performance for the twelve- and thirty-six-month periods ended September 30, 2021 was in the 1st quintile of its peer group. Based upon their review, the Trustees concluded that the Fund’s overall performance was satisfactory relative to the performance of funds with similar investment objectives and relevant indices, and that the advisory fee was reasonable in light of the services received by the Fund from the Advisor and the other factors considered.
Touchstone Small Company Fund. The Fund’s advisory fee and total expense ratio (net of applicable expense waivers and reimbursements) were each below the median of its peer group. The Board noted that the Advisor was currently waiving and/or reimbursing a portion of the Fund’s fees and/or expenses. The Fund’s performance for each of the six- and thirty-six-month periods ended September 30, 2021 was in the 2nd quintile, while the Fund’s performance for the twelve-month period ended September 30, 2021 was in the 1st quintile of its peer group. Based upon their review, the Trustees concluded that the Fund’s overall performance was satisfactory relative to the performance of funds with similar investment objectives and relevant indices, and that the advisory fee was reasonable in light of the services received by the Fund from the Advisor and the other factors considered.
Economies of Scale. The Board considered the effect of each Fund’s current size and potential growth on its performance and expenses. The Board took into account management’s discussion of the Funds’ advisory fee structure. The Board considered the effective advisory fees under the Investment Advisory Agreement as a percentage of assets at different asset levels and possible economies of scale that might be realized if the assets of each Fund increase. The Board noted that the advisory fee schedules for all but one of the Funds contain breakpoints that would reduce the advisory fee rate on assets above specified levels as the respective Fund’s assets increased and considered the necessity of adding breakpoints with respect to the one Fund that currently did not have such breakpoints in its advisory fee schedule. The Board determined that adding breakpoints at specified levels to the advisory fee schedule of the one Fund that currently did not have such breakpoints was not appropriate at that time. The Board also noted that if a Fund’s assets increase over time, the Fund might realize other economies of scale if assets increase proportionally more than certain other expenses. The Board also considered the fact that, under the Investment Advisory Agreement, the advisory fee payable to the Advisor by a Fund was reduced by the total sub-advisory fee paid by the Advisor to the Fund’s Sub-Advisor.
Conclusion. In considering the renewal of the Funds’ Investment Advisory Agreement, the Board, including the Independent Trustees, did not identify any single factor as controlling, and each Trustee may have attributed different weights to the various factors. The Trustees evaluated all information available to them on a Fund-by-Fund basis, and their determinations were made separately with respect to each Fund. The Board reached the following conclusions regarding the Funds’ Investment Advisory Agreement with the Advisor, among others: (a) the Advisor demonstrated that it possesses the capability and resources to perform the duties required of it under the Investment Advisory Agreement; (b) the Advisor maintains an appropriate compliance program;
Other Items (Unaudited) (Continued)
(c) the overall performance of each Fund is satisfactory relative to the performance of funds with similar investment objectives and relevant indices; and (d) each Fund’s advisory fee is reasonable in light of the services received by the Fund from the Advisor and the other factors considered. Based on their conclusions, the Trustees determined with respect to each Fund that continuation of the Investment Advisory Agreement was in the best interests of the Fund and its shareholders.
In approving the applicable Funds’ respective Sub-Advisory Agreements, the Board considered various factors with respect to each Fund and the applicable Sub-Advisory Agreement, among them: (1) the nature, extent and quality of services provided to the Fund, including the personnel providing such services; (2) the Sub-Advisor’s compensation; (3) a comparison of the sub-advisory fee and performance with comparable funds; and (4) the terms of the Sub-Advisory Agreement. The Board’s analysis of these factors is set forth below. The Independent Trustees were advised by independent legal counsel throughout the process.
Nature, Extent and Quality of Services Provided; Investment Personnel. The Board considered information provided by the Advisor regarding the services provided by the Sub-Advisor, including information presented periodically throughout the previous year. The Board noted the affiliation of the Sub-Advisor to with the Advisor, noting any potential conflicts of interest. The Board also noted that, on a periodic basis, the Board meets with portfolio managers of the Sub-Advisor to discuss its respective performance and investment processes and strategies. The Board considered the Sub-Advisor’s level of knowledge and investment style. The Board reviewed the experience and credentials of the applicable investment personnel who are responsible for managing the investment of portfolio securities with respect to the Funds. The Board also noted the Sub-Advisor's brokerage practices.
Sub-Advisor’s Compensation, Profitability and Economies of Scale. The Board also took into consideration the financial condition of the Sub-Advisor and any indirect benefits derived by the Sub-Advisor and its affiliates from the Sub-Advisor’s relationship with the Funds. In considering the profitability to the Sub-Advisor of its relationship with the Funds, the Board noted the undertaking of the Advisor to maintain expense limitations for the Funds and also noted that the sub-advisory fees under the Sub-Advisory Agreements were paid by the Advisor out of the advisory fees that it receives under the Investment Advisory Agreement. As a consequence, the profitability to the Sub-Advisor of its relationship with a Fund was not a substantial factor in the Board’s deliberations. For similar reasons, the Board did not consider the potential economies of scale in the Sub-Advisor’s management of the applicable Fund to be a substantial factor in its consideration, although the Board noted that the sub-advisory fee schedule for all but two of the Funds contained breakpoints that would reduce the sub-advisory fee rate on assets above specified levels as the applicable Fund’s assets increased.
Sub-Advisory Fees and Fund Performance. The Board considered that each Fund pays an advisory fee to the Advisor and that the Advisor pays the sub-advisory fee to the Sub-Advisor out of the advisory fee it receives from the respective Fund. The Board also compared the sub-advisory fees paid by the Advisor to fees charged by the Sub-Advisor to manage comparable institutional separate accounts, as applicable. The Board considered the amount retained by the Advisor and the sub-advisory fee paid to the Sub-Advisor with respect to the various services provided by the Advisor and the Sub-Advisor. The Board reviewed the sub-advisory fee for each Fund in relation to various comparative data, including the median and average sub-advisory fees of each Fund’s peer group, and considered the following information:
Touchstone Balanced Fund. The Fund’s sub-advisory fee was below the median of its peer group. Based upon their review, the Trustees concluded that the sub-advisory fee was reasonable in light of the services received by the Fund from the Sub-Advisor and the other factors considered.
Touchstone Bond Fund. The Fund’s sub-advisory fee was above the median of its peer group. Based upon their review, the Trustees concluded that the sub-advisory fee was reasonable in light of the services received by the Fund from the Sub-Advisor and the other factors considered.
Touchstone Common Stock Fund. The Fund’s sub-advisory fee was above the median of its peer group. Based upon their review, the Trustees concluded that the sub-advisory fee was reasonable in light of the services received by the Fund from the Sub-Advisor and the other factors considered.
Touchstone Small Company Fund. The Fund’s sub-advisory fee was below the median of its peer group. Based upon their review, the Trustees concluded that the sub-advisory fee was reasonable in light of the services received by the Fund from the Sub-Advisor and the other factors considered.
As noted above, the Board considered each Fund’s performance during the six-month, twelve-month and thirty-six-month periods ended September 30, 2021 as compared to each Fund’s peer group and noted that the Board reviews on a quarterly basis detailed information about each Fund’s performance results, portfolio composition and investment strategies. The Board noted the Advisor’s expertise and resources in monitoring the performance, investment style and risk-adjusted performance of the Sub-Advisor. The Board was mindful of the Advisor’s ongoing monitoring of the Sub-Advisor’s performance and the measures undertaken by the Advisor to address any underperformance.
Other Items (Unaudited) (Continued)
Conclusion. In considering the renewal of the Sub-Advisory Agreement with respect to each applicable Fund, the Board, including the Independent Trustees, did not identify any single factor as controlling, and each Trustee may have attributed different weights to the various factors. The Board reached the following conclusions regarding each Sub-Advisory Agreement, among others: (a) the Sub-Advisor is qualified to manage each Fund’s assets in accordance with the Fund’s investment goals and policies; (b) the Sub-Advisor maintains an appropriate compliance program; (c) the overall performance of each Fund is satisfactory relative to the performance of funds with similar investment objectives and relevant indices; (d) each Fund’s sub-advisory fee is reasonable in light of the services received by the Fund from the Sub-Advisor and the other factors considered; and (e) the Sub-Advisor’s investment strategies are appropriate for pursuing the investment goals of each Fund. Based on its conclusions, the Board determined that approval of the Sub-Advisory Agreement with respect to each applicable Fund was in the best interests of the Fund and its shareholders.
Management of the Trust (Unaudited)
Listed below is required information regarding the Trustees and principal officers of the Trust. The Trust’s Statement of Additional Information includes additional information about the Trustees and is available, without charge, upon request by calling 1.800.543.0407 or by visiting the Touchstone website at TouchstoneInvestments.com.
| Interested Trustees1: |
Name
Address
Year of Birth | Position
Held with
Trust | Term of
Office And
Length of
Time Served2 | Principal Occupation(s)
During Past 5 Years | Number
of Funds
Overseen
in the
Touchstone
Fund
Complex3 | Other
Directorships
Held During Past 5 Years4 |
Jill T. McGruder
Touchstone Advisors, Inc.
303 Broadway
Suite 1100
Cincinnati, Ohio 45202
Year of Birth: 1955 | Trustee | Until retirement at age 75 or until she resigns or is removed
Trustee since 1999 | President of Touchstone Funds from 1999 to 2020; Director and CEO of IFS Financial Services, Inc. (a holding company) since 1999; and Senior Vice President and Chief Marketing Officer of Western & Southern Financial Group, Inc. (a financial services company) since 2016. | 36 | Director, Integrity Life Insurance Co. and National Integrity Life Insurance Co. since 2005; Director, Touchstone Securities (the Distributor) since 1999; Director, Touchstone Advisors (the Advisor) since 1999; Director, W&S Brokerage Services, Inc. since 1999; Director, W&S Financial Group Distributors, Inc. since 1999; Director, Insurance Profillment Solutions LLC since 2014; Director, Columbus Life Insurance Co. since 2016; Director, The Lafayette Life Insurance Co. since 2016; Director, Gerber Life Insurance Company since 2019; Director, Western & Southern Agency, Inc. since 2018; and Director, LL Global, Inc. (not-for-profit trade organization with operating divisions LIMRA and LOMA) since 2016. |
E. Blake Moore, Jr.
Touchstone Advisors, Inc.
303 Broadway
Suite 1100
Cincinnati, Ohio 45202
Year of Birth: 1958 | President and Trustee | Until retirement at age 75 or until he resigns or is removed
Trustee since 2021 | President, Touchstone Funds since 2021; Chief Executive Officer of Touchstone Advisors, Inc. and Touchstone Securities, Inc. since 2020; President, Foresters Investment Management Company, Inc. from 2018 to 2020; President, North American Asset Management at Foresters Financial from 2018 to 2020; Managing Director, Head of Americas at UBS Asset Management from 2015 to 2017; and Executive Vice President, Head of Distribution at Mackenzie Investments from 2011 to 2014. | 36 | Trustee, College of Wooster since 2008; and Director, UBS Funds from 2015 to 2017. |
| Independent Trustees: |
Karen Carnahan
c/o Touchstone Advisors, Inc.
303 Broadway
Suite 1100
Cincinnati, Ohio 45202
Year of Birth: 1954 | Trustee | Until retirement at age 75 or until she resigns or is removed
Trustee since 2019 | Retired; formerly Chief Operating Officer of Shred-it (a business services company) from 2014 to 2015; formerly President & Chief Operating Officer of the document management division of Cintas Corporation (a business services company) from 2008 to 2014. | 36 | Director, Cintas Corporation since 2019; Director, Boys & Girls Club of West Chester/Liberty since 2016; and Board of Advisors, Best Upon Request since 2020. |
William C. Gale
c/o Touchstone Advisors, Inc.
303 Broadway
Suite 1100
Cincinnati, Ohio 45202
Year of Birth: 1952 | Trustee | Until retirement at age 75 or until he resigns or is removed
Trustee since 2013 | Retired; formerly Senior Vice President and Chief Financial Officer of Cintas Corporation (a business services company) from 1995 to 2015. | 36 | None. |
Management of the Trust (Unaudited) (Continued)
| Independent Trustees (Continued): |
Name
Address
Year of Birth | Position
Held with
Trust | Term of
Office And
Length of
Time Served2 | Principal Occupation(s)
During Past 5 Years | Number
of Funds
Overseen
in the
Touchstone
Fund
Complex3 | Other
Directorships
Held During Past 5 Years4 |
Susan J. Hickenlooper, CFA(5)
c/o Touchstone Advisors, Inc.
303 Broadway
Suite 1100
Cincinnati, Ohio 45202
Year of Birth: 1946 | Trustee | Until retirement at age 75 or until she resigns or is removed
Trustee since 2009 | Retired from investment management. | 36 | Trustee, Episcopal Diocese of Southern Ohio from 2014 to 2018. |
Susan M. King
c/o Touchstone Advisors, Inc.
303 Broadway
Suite 1100
Cincinnati, Ohio 45202
Year of Birth: 1963 | Trustee | Until retirement at age 75 or until she resigns or is removed
Trustee since 2021 | Formerly, Partner of ID Funds LLC (2020 to 2021); formerly, Senior Vice President, Head of Product and Marketing Strategy of Foresters Financial (2018 to 2020); formerly, Managing Director, Head of Sales Strategy and Marketing, Americas of UBS Asset Management (2015 to 2017); formerly, Director, Allianz Funds, Allianz Funds Multi-Strategy Trust and AllianzGI Institutional Multi-Series Trust (2014 to 2015); and formerly, Director, Alliance Capital Cash Management Offshore Funds (2003 to 2005). | 36 | Trustee, Claremont McKenna College since 2017; Trustee, Israel Cancer Research Fund since 2019; and Board Member of WHAM! (Women's Health Access Matters) since 2021. |
Kevin A. Robie
c/o Touchstone Advisors, Inc.
303 Broadway
Suite 1100
Cincinnati, Ohio 45202
Year of Birth: 1956 | Trustee | Until retirement at age 75 or until he resigns or is removed
Trustee since 2013 | Retired; formerly Vice President of Portfolio Management at Soin LLC (private multinational holding company and family office) from 2004 to 2020. | 36 | Director, SaverSystems, Inc. since 2015; Director, Buckeye EcoCare, Inc. from 2013 to 2018; Director, Turner Property Services Group, Inc. since 2017; Trustee, Dayton Region New Market Fund, LLC (private fund) since 2010; and Trustee, Entrepreneurs Center, Inc. (business incubator) since 2006. |
William H. Zimmer III
c/o Touchstone Advisors, Inc.
303 Broadway
Suite 1100
Cincinnati, Ohio 45202
Year of Birth: 1953 | Trustee | Until retirement at age 75 or until he resigns or is removed
Trustee since 2019 | Independent Treasury Consultant since 2014. | 36 | Director, Deaconess Associations, Inc. (healthcare) since 2001; Trustee, Huntington Funds (mutual funds) from 2006 to 2015; and Director, National Association of Corporate Treasurers from 2011 to 2015. |
(1) Ms. McGruder, as a director of the Advisor and the Distributor, and an officer of affiliates of the Advisor and the Distributor, is an “interested person” of the Trust within the meaning of Section 2(a)(19) of the 1940 Act. Mr. Moore, as an officer of the Advisor and the Distributor, is an “interested person” of the Trust within the meaning of Section 2(a)(19) of the 1940 Act.
(2) Each Trustee is elected to serve until the age of 75 or until he or she sooner resigns or is removed.
(3) As of December 31, 2021, the Touchstone Fund Complex consisted of 4 series of the Trust, 19 series of the Touchstone Strategic Trust, and 13 series of the Touchstone Funds Group Trust.
(4) Each Trustee is also a Trustee of Touchstone Strategic Trust and Touchstone Funds Group Trust.
(5) Upon the recommendation of the Governance Committee, the Board extended the mandatory retirement age for Ms. Hickenlooper for a one-year period to allow her to remain a Trustee of the Trust through December 31, 2022.
Management of the Trust (Unaudited) (Continued)
| Principal Officers: |
Name
Address
Year of Birth | Position(s)
Held with
Trust1 | Term of
Office And
Length of
Time Served | Principal Occupation(s)
During Past 5 Years |
E. Blake Moore, Jr.
Touchstone Advisors, Inc.
303 Broadway
Suite 1100
Cincinnati, Ohio 45202
Year of Birth: 1958 | President and Trustee | Until resignation, removal or disqualification
President since January 2021 | See biography above. |
Timothy D. Paulin
Touchstone Advisors, Inc.
303 Broadway
Suite 1100
Cincinnati, Ohio 45202
Year of Birth: 1963 | Vice President | Until resignation, removal or disqualification
Vice President since 2010 | Senior Vice President of Investment Research and Product Management of Touchstone Advisors, Inc. |
Timothy S. Stearns
Touchstone Advisors, Inc.
303 Broadway
Suite 1100
Cincinnati, Ohio 45202
Year of Birth: 1963 | Chief Compliance Officer | Until resignation, removal or disqualification
Chief Compliance Officer since 2013 | Chief Compliance Officer of Touchstone Advisors, Inc. |
Terrie A. Wiedenheft
Touchstone Advisors, Inc.
303 Broadway
Suite 1100
Cincinnati, Ohio 45202
Year of Birth: 1962 | Controller and Treasurer | Until resignation, removal or disqualification
Controller and Treasurer since 2006 | Senior Vice President, Chief Financial Officer and Chief Operations Officer, of IFS Financial Services, Inc. (a holding company) and Senior Vice President and Chief Administration Officer within the Office of the Chief Marketing Officer of Western & Southern Financial Group (2021 to Present). |
Meredyth A. Whitford-Schultz
Western & Southern
Financial Group
400 Broadway
Cincinnati, Ohio 45202
Year of Birth: 1981 | Secretary | Until resignation, removal or disqualification
Secretary since 2018 | Senior Counsel - Securities/Mutual Funds of Western & Southern Financial Group (2015 to present); Associate at Morgan Lewis & Bockius LLP (law firm) (2014 to 2015); Associate at Bingham McCutchen LLP (law firm) (2008 to 2014). |
(1)Each officer also holds the same office with Touchstone Funds Group Trust and Touchstone Strategic Trust.
PRIVACY PROTECTION POLICY
We Respect Your Privacy
Thank you for your decision to invest with us. Touchstone and its affiliates have always placed a high value on the trust and confidence our clients place in us. We believe that confidence must be earned and validated through time. In today’s world, when technology allows the sharing of information at light speeds, trust must be reinforced by our sincere pledge to take the steps necessary to ensure that the information you share with us is treated with respect and confidentiality.
Our Pledge to Our Clients
• We collect only the information we need to service your account and administer our business.
• We are committed to keeping your information confidential and we place strict limits and controls on the use and sharing of your information.
• We make every effort to ensure the accuracy of your information.
We Collect the Following Nonpublic Personal Information About You:
• Information we receive from you on or in applications or other forms, correspondence, or conversations, including, but not limited to, your name, address, phone number, social security number, assets, income and date of birth; and
• Information about your transactions with us, our affiliates, or others, including, but not limited to, your account number and balance, payment history, parties to transactions, cost basis information, and other financial information.
Categories of Information We Disclose and Parties to Whom We Disclose
We do not disclose any nonpublic personal information about our current or former clients to nonaffiliated third parties, except as required or permitted by law.
We Place Strict Limits and Controls on the Use and Sharing of Your Information
• We restrict access to nonpublic personal information about you to authorized employees who need the information to administer your business.
• We maintain physical, electronic and procedural safeguards that comply with federal standards to protect this information.
• We do not disclose any nonpublic personal information about our current or former clients to anyone, except as required or permitted by law or as described in this document.
• We will not sell your personal information to anyone.
We May Provide Information to Service Your Account
Sometimes it is necessary to provide information about you to various companies such as transfer agents, custodians, broker-dealers and marketing service firms to facilitate the servicing of your account. These organizations have a legitimate business need to see some of your personal information in order for us to provide service to you. We may disclose to these various companies the information that we collect as described above. We require that these companies, including our own subsidiaries and affiliates, strictly maintain the confidentiality of this information and abide by all applicable laws. Companies within our corporate family that may receive this information are financial service providers and insurance companies. We do not permit these associated companies to sell the information for their own purposes, and we never sell our customer information.
This policy is applicable to the following affiliated companies: Touchstone Funds Group Trust, Touchstone Strategic Trust, Touchstone Variable Series Trust, Touchstone Securities, Inc.,* and W&S Brokerage Services, Inc.
*Touchstone Securities, Inc. serves as the underwriter to the Touchstone Funds.
A Member of Western & Southern Financial Group®
The Privacy Protection Policy is not part of the Annual Report.
Item 2. Code of Ethics.
| (a) | The registrant, as of the end of the period covered by this report, has adopted a code of ethics that applies to the registrant’s principal executive officer, principal financial officer, principal accounting officer or controller, or persons performing similar functions, regardless of whether these individuals are employed by the registrant or a third party. |
| (c) | There have been no amendments, during the period covered by this report, to a provision of the code of ethics that applies to the registrant’s principal executive officer, principal financial officer, principal accounting officer or controller, or persons performing similar functions, regardless of whether these individuals are employed by the registrant or a third party, and that relates to any element of the code of ethics description. |
| (d) | The registrant has not granted any waivers, including an implicit waiver, from a provision of the code of ethics that applies to the registrant’s principal executive officer, principal financial officer, principal accounting officer or controller, or persons performing similar functions, regardless of whether these individuals are employed by the registrant or a third party, that relates to one or more of the items set forth in paragraph (b) of this item’s instructions. |
| (f) | A copy of the code of ethics is attached hereto as Exhibit 13(a)(1). |
Item 3. Audit Committee Financial Expert.
The registrant’s Board of Trustees has determined that the registrant has at least one audit committee financial expert serving on its audit committee. Ms. Karen Carnahan is the registrant’s audit committee financial expert and is an independent trustee within the meaning of the Investment Company Act of 1940, as amended (the “1940 Act”).
Item 4. Principal Accountant Fees and Services.
Audit Fees
| (a) | Audit fees for Touchstone Variable Series Trust totaled $77,400 and $124,900 for the fiscal years ending December 31, 2021 and December 31, 2020, respectively, including fees associated with the annual audits and filings of Form N-1A and Form N-CEN. |
Audit-Related Fees
| (b) | The aggregate fees billed in each of the last two fiscal years for assurance and related services by the principal accountant that are reasonably related to the performance of the audit of the registrant's financial statements and are not reported under paragraph (a) of this Item are $6,000 and $0 for the fiscal years ended December 31, 2021 and December 31, 2020, respectively. The fees for 2021 are associated with merger related audit procedures. |
Tax Fees
| (c) | The aggregate fees billed in each of the last two fiscal years for professional services rendered by the principal accountant for tax compliance, tax advice, and tax planning were $26,410 and $29,910 for the fiscal years ended December 31, 2021 and December 31, 2020, respectively. The fees relate to the preparation of federal income and excise tax returns and review of capital gains distribution calculations. |
All Other Fees
| (d) | The aggregate fees billed in each of the last two fiscal years for products and services provided by the principal accountant, other than the services reported in paragraphs (a) through (c) of this Item are $2,550 and $2,986 for the fiscal years ended December 31, 2021 and December 31, 2020, respectively. The fees relate to the PFIC analyzer and Global Withholding Tax Reporter subscriptions. |
| (e)(1) | Disclose the audit committee's pre-approval policies and procedures described in paragraph (c)(7) of Rule 2-01 of Regulation S-X. |
The Audit Committee’s pre-approval policies describe the types of audit, audit-related, tax and other services that have the general pre-approval of the Audit Committee. The pre-approval policies provide that annual audit service fees, tax services not specifically granted pre-approval, services exceeding pre-approved cost levels and other services that have not received general pre-approval will be subject to specific pre-approval by the Audit Committee. The pre-approval policies further provide that the Committee may grant general pre-approval to other audit services (statutory audits and services associated with SEC registration statements, periodic reports and other documents filed with the SEC or other documents issued in connection with securities offerings), audit-related services (accounting consultations related to accounting, financial reporting or disclosure matters not classified as “audit services,” assistance with understanding and implementing new accounting and financial reporting guidance from rulemaking authorities, agreed-upon or expanded audit procedures related to accounting and/or billing records required to respond to or comply with financial, accounting or regulatory reporting matters and assistance with internal control reporting requirements under Form N-CSR), tax services that have historically been provided by the auditor that the Committee believes would not impair the independence of the auditor and are consistent with the SEC’s rules on auditor independence and permissible non-audit services classified as “all other services” that are routine and recurring services.
| (e)(2) | All of the services described in paragraphs (b) through (d) of Item 4 were approved by the Audit Committee. |
| (f) | The percentage of hours expended on the principal accountant's engagement to audit the registrant's financial statements for the most recent fiscal year that were attributed to work performed by persons other than the principal accountant's full-time, permanent employees was less than fifty percent. |
| (g) | The aggregate non-audit fees for Touchstone Variable Series Trust and certain entities*, totaled approximately $528,481 and $766,767 for the fiscal years ended December 31, 2021 and December 31, 2020, respectively. |
* These include the advisors (excluding non-affiliated sub-advisors) and any entity controlling, controlled by or under common control with the advisors that provides ongoing services to the registrant (Funds).
| (h) | The registrant's audit committee of the board of trustees has considered whether the provision of non-audit services that were rendered to the registrant's investment adviser (not including any sub-adviser whose role is primarily portfolio management and is subcontracted with or overseen by another investment adviser), and any entity controlling, controlled by, or under common control with the investment adviser that provides ongoing services to the registrant that were not pre-approved pursuant to paragraph (c)(7)(ii) of Rule 2-01 of Regulation S-X is compatible with maintaining the principal accountant's independence. |
Item 5. Audit Committee of Listed Registrants.
Not applicable.
Item 6. Investments.
| (a) | Schedule of Investments in securities of unaffiliated issuers as of the close of the reporting period is included as part of the report to shareholders filed under Item 1(a) of this form. |
Item 7. Disclosure of Proxy Voting Policies and Procedures for Closed-End Management Investment Companies.
Not applicable.
Item 8. Portfolio Managers of Closed-End Management Investment Companies.
Not applicable.
Item 9. Purchases of Equity Securities by Closed-End Management Investment Company and Affiliated Purchasers.
Not applicable.
Item 10. Submission of Matters to a Vote of Security Holders.
There have been no material changes to the procedures by which the shareholders may recommend nominees to the registrant’s board of trustees, where those changes were implemented after the registrant last provided disclosure in response to the requirements of Item 407(c)(2)(iv) of Regulation S-K (17 CFR 229.407) (as required by Item 22(b)(15) of Schedule 14A (17 CFR 240.14a-101)), or this Item.
Item 11. Controls and Procedures.
| (a) | The registrant’s principal executive and principal financial officers, or persons performing similar functions, have concluded that the registrant’s disclosure controls and procedures (as defined in Rule 30a-3(c) under the Investment Company Act of 1940, as amended (the “1940 Act”) (17 CFR 270.30a-3(c))) are effective, as of a date within 90 days of the filing date of the report that includes the disclosure required by this paragraph, based on their evaluation of these controls and procedures required by Rule 30a-3(b) under the 1940 Act (17 CFR 270.30a-3(b)) and Rules 13a-15(b) or 15d-15(b) under the Securities Exchange Act of 1934, as amended (17 CFR 240.13a-15(b) or 240.15d-15(b)). |
| (b) | There were no changes in the registrant’s internal control over financial reporting (as defined in Rule 30a-3(d) under the 1940 Act (17 CFR 270.30a-3(d))) that occurred during the period covered by this report that has materially affected, or is reasonably likely to materially affect, the registrant’s internal control over financial reporting. |
Item 12. Disclosure of Securities Lending Activities for Closed-End Management Investment Companies.
Not applicable.
Item 13. Exhibits.
SIGNATURES
Pursuant to the requirements of the Securities Exchange Act of 1934 and the Investment Company Act of 1940, the registrant has duly caused this report to be signed on its behalf by the undersigned, thereunto duly authorized.
(Registrant) Touchstone Variable Serires Trust
| By (Signature and Title)* | /s/ E. Blake Moore, Jr. | |
| | E. Blake Moore, Jr., President | |
| | (principal executive officer) | |
Pursuant to the requirements of the Securities Exchange Act of 1934 and the Investment Company Act of 1940, this report has been signed below by the following persons on behalf of the registrant and in the capacities and on the dates indicated.
| By (Signature and Title)* | /s/ E. Blake Moore, Jr. | |
| | E. Blake Moore, Jr., President | |
| | (principal executive officer) | |
| By (Signature and Title)* | /s/ Terrie A. Wiedenheft | |
| | Terrie A. Wiedenheft, Controller and Treasurer | |
| | (principal financial officer) | |
* Print the name and title of each signing officer under his or her signature.