UNITED STATES
SECURITIES AND EXCHANGE COMMISSION
Washington, D.C. 20549
FORM N-CSR
CERTIFIED SHAREHOLDER REPORT OF REGISTERED MANAGEMENT
INVESTMENT COMPANIES
Investment Company Act file number 811-08416
Touchstone Variable Series Trust
(Exact name of registrant as specified in charter)
303 Broadway, Suite 1100
Cincinnati, Ohio 45202-4203
(Address of principal executive offices) (Zip code)
Jill T. McGruder
303 Broadway, Suite 1100
Cincinnati, Ohio 45202-4203
(Name and address of agent for service)
Registrant's telephone number, including area code:800-638-8194
Date of fiscal year end:December 31
Date of reporting period:December 31, 2018
Form N-CSR is to be used by management investment companies to file reports with the Commission not later than 10 days after the transmission to stockholders of any report that is required to be transmitted to stockholders under Rule 30e-1 under the Investment Company Act of 1940 (17 CFR 270.30e-1). The Commission may use the information provided on Form N-CSR in its regulatory, disclosure review, inspection, and policymaking roles.
A registrant is required to disclose the information specified by Form N-CSR, and the Commission will make this information public. A registrant is not required to respond to the collection of information contained in Form N-CSR unless the Form displays a currently valid Office of Management and Budget ("OMB") control number. Please direct comments concerning the accuracy of the information collection burden estimate and any suggestions for reducing the burden to Secretary, Securities and Exchange Commission, 450 Fifth Street, NW, Washington, DC 20549-0609. The OMB has reviewed this collection of information under the clearance requirements of 44 U.S.C. § 3507.
Item 1. Reports to Stockholders.
The Report to Shareholders is attached herewith.
December 31, 2018
Annual Report
Touchstone Variable Series Trust
Touchstone Active Bond Fund
Touchstone Balanced Fund
Touchstone Bond Fund
Touchstone Common Stock Fund
Touchstone Focused Fund
Touchstone Large Cap Core Equity Fund
Touchstone Small Company Fund
Touchstone Aggressive ETF Fund
Touchstone Conservative ETF Fund
Touchstone Moderate ETF Fund
IMPORTANT NOTE: Effective January 1, 2021, as permitted by regulations adopted by the Securities and Exchange Commission, you may not be receiving paper copies of a Fund’s annual or semi-annual shareholder reports by mail, unless you specifically request paper copies of the reports from the insurance company that offers your variable annuity or variable life insurance contract or from your financial intermediary. Instead of delivering paper copies of the report, the insurance company may choose to make the reports available on a website, and the insurance company will notify you by mail each time a shareholder report is posted and provide you with a website link to access the report. Instructions for requesting paper copies will be provided by your insurance company.
If you already elected to receive shareholder reports electronically, you will not be affected by this change and you need not take any action. You may elect to receive shareholder reports and other communications from the insurance company electronically by following the instructions provided by the insurance company.
You may elect to receive all future Fund shareholder reports in paper free of charge from the insurance company. You can inform the insurance company that you wish to continue receiving paper copies of your shareholder reports by following the instructions provided by the insurance company. Your election to receive reports in paper will apply to all portfolio companies available under your contract with the insurance company.

Table of Contents
| | Page | |
| Letter from the President | 3 | |
| Management's Discussion of Fund Performance (Unaudited) | 4 - 29 | |
| Tabular Presentation of Portfolios of Investments (Unaudited) | 30 - 32 | |
| Portfolio of Investments: | | |
| Touchstone Active Bond Fund | 33 | |
| Touchstone Balanced Fund | 39 | |
| Touchstone Bond Fund | 43 | |
| Touchstone Common Stock Fund | 48 | |
| Touchstone Focused Fund | 50 | |
| Touchstone Large Cap Core Equity Fund | 52 | |
| Touchstone Small Company Fund | 53 | |
| Touchstone Aggressive ETF Fund | 55 | |
| Touchstone Conservative ETF Fund | 56 | |
| Touchstone Moderate ETF Fund | 57 | |
| Statements of Assets and Liabilities | 58 - 59 | |
| Statements of Operations | 60 - 61 | |
| Statements of Changes in Net Assets | 62 - 65 | |
| Financial Highlights | 66 - 70 | |
| Notes to Financial Statements | 71 - 85 | |
| Report of Independent Registered Public Accounting Firm | 86 - 87 | |
| Other Items (Unaudited) | 88 - 96 | |
| Management of the Trust (Unaudited) | 97 - 99 | |
| Privacy Protection Policy | 103 | |
This report identifies the Funds' investments on December 31, 2018. These holdings are subject to change. Not all investments in each Fund performed the same, nor is there any guarantee that these investments will perform as well in the future. Market forecasts provided in this report may not occur.
Letter from the President
Dear Shareholder:
We are pleased to provide you with the Touchstone Variable Series Trust Annual Report. Inside you will find key financial information, as well as manager commentaries for the Funds, for the 12 months ended December 31, 2018.
The “synchronized global expansion” that characterized 2017 decoupled in 2018 amid the imposition of tariffs by the U.S. and China, followed by threats of yet more. U.S. economic data was generally strong. Toward year-end, however, some indicators – including home and auto sales and consumer confidence – suggested a slowdown was emerging. Decelerating growth in major economies outside the U.S. became more evident, though none entered recessionary territory. Healthy domestic economic conditions encouraged the U.S. Federal Reserve Board (Fed) to continue normalizing monetary policy with four interest rate increases, yet it also signaled a more patient approach going forward in light of declining inflation expectations. Rising U.S. interest rates, a strong labor market and relatively robust economic conditions attracted global investors to U.S. stocks and bonds and strengthened the U.S. dollar. The Bank of Japan and European Central Bank (ECB) maintained accommodative monetary policies. Hopes of normalizing their respective monetary policies in order to restock their recession-fighting tool-kits faded after mid-year amid weaker growth. The ECB did however fulfill its promise to end its quantitative easing program.
Global macroeconomic concerns led to declines across all broad U.S. and non-U.S. equity indexes. In the U.S., growth-oriented stocks led U.S. equity markets over their value-oriented counterparts, while large capitalization stocks outperformed small- and mid-capitalization stocks. Outside the U.S., emerging market and developed market equities posted double-digit declines. Those declines were compounded for domestic investors in non-U.S. equities due to the U.S. dollar’s strengthening versus most major foreign currencies.
Rising interest rates and widening credit spreads buffeted the fixed income market. The Fed’s rate hikes pushed short-term rates higher over the year, outpacing rising rates on longer maturities. The result was a significantly flatter yield curve, reaching its flattest level since 2007. This gave rise to fears throughout the year of a yield curve inversion1, which historically has been a leading indicator of recessions. While the U.S. Treasury yield curve did not invert, it did finish the year above where it started, creating a headwind for longer maturity bonds. Economic concerns also led to credit spread widening during the year, resulting in negative returns for both investment grade and high yield bonds.
The new year provides a natural point to assess the recent past and consider the future. From a financial perspective, it has been yet another period of challenged returns across many asset classes. This presents a particularly timely juncture to assess your current financial situation and, with the help of your financial advisor, weigh your plans for the year — as well as for the years ahead.
We greatly value your continued support. Thank you for including Touchstone as part of your investment plan.
Sincerely.

Jill T. McGruder
President
Touchstone Variable Series Trust
1A yield curve inversion is defined as when the yield on a 2-year Treasury Bill exceeds the yield on a 10-year Treasury Bond.
Management's Discussion of Fund Performance(Unaudited)
Touchstone Active Bond Fund
Sub-Advised by Fort Washington Investment Advisors, Inc.
Investment Philosophy
The Touchstone Active Bond Fund seeks to provide as high a level of current income as is consistent with the preservation of capital. Capital appreciation is a secondary goal. In deciding what securities to buy and sell for the Fund, the overall investment opportunities and risks in different sectors of the debt securities market are analyzed by focusing on maximizing total return and reducing volatility of the Fund’s portfolio. A disciplined sector allocation process is followed in order to build a broadly diversified portfolio of bonds.
Fund Performance
The Touchstone Active Bond Fund underperformed its benchmark, the Bloomberg Barclays U.S. Aggregate Bond Index, for the 12-month period ended December 31, 2018. The Fund’s total return was -1.62 percent, while the total return of the benchmark was 0.01 percent.
Market Environment
Risk assets continued their brisk pace higher to start 2018 following a strong 2017. However, volatility returned which reflected concerns about inflation and rising interest rates, as well as uncertainty about global trade.
During the year, the U.S. Federal Reserve Board (Fed) increased the federal funds rate a total of four times. Interest rates were driven by concerns about future growth in the U.S., slowing growth outside of the U.S. and continued uncertainty related to trade policies. The effects of the Fed’s rate increases, combined with the sharp decline in long-term rates, led to further flattening of the yield curve and an inversion in certain parts of the curve, mainly in short-term maturities.
Market expectations of additional Fed rate hikes decreased during the fourth quarter, as broad financial conditions reached their tightest levels of the year. Driving these financial conditions were the increased federal funds rate, a stronger U.S. dollar, widening credit spreads and the sharp retreat in equities. Global central bank policies were also less accommodative.
While underlying growth of the U.S. economy began to show signs of further deceleration toward the end of the year, it still remained near trend at approximately 2.0 to 2.5 percent. The strength of the economy was buoyed by the resiliency of labor markets and, as effects from fiscal policy and tax legislation began to fade, it was the most important factor for sustaining the current growth rate. During the period, labor markets were consistently strong in terms of jobs added month to month. Wage growth was also strong and began to show signs of acceleration. Core inflation readings were in line with the Fed’s 2 percent target and were expected to hover around 2 percent in the near term as data indicated solid, but not accelerating inflation.
Within the index, Investment Grade Corporate Bonds, Mortgage-Backed Securities (MBS), Asset-Backed Securities (ABS) and Commercial Mortgage-Backed Securities (CMBS) all underperformed U.S. Treasuries during the period. High Yield bonds also underperformed for the year.
Portfolio Review
The main detractors from Fund performance during the 12-month period were an overweight to Investment Grade bonds and interest rate management, specifically duration positioning and an allocation to Treasury Inflation Protected Securities (TIPS). The Fund’s allocation to U.S. dollar-denominated Emerging Markets bonds also detracted over the period, while security selection was strong within Securitized Assets, particularly ABS. This helped offset some of the losses incurred from the Fund’s allocation to Emerging Markets. The Fund
Management's Discussion of Fund Performance(Unaudited) (Continued)
maintained a modest allocation to U.S. dollar-denominated Emerging Markets bonds during the period as the additional yield relative to Investment Grade Corporate and High Yield bonds remained attractive.
Outlook
Looking ahead, we believe risk assets offer the greatest potential to the Fund, driven by U.S. economic growth, steady inflation, amicable resolutions to trade disputes, and accommodative central bank policies both domestically and abroad. Due to tightening financial conditions, increased market volatility and increases in the federal funds rate, we believe current market conditions could become headwinds to the Fund in 2019. Valuations have adjusted to tighter borrowing costs, the slowdown in global growth and the uncertainty around trade issues. As a result, we believe the potential upside for price appreciation is limited. We have taken advantage of opportunities among securitized assets when possible, where we believe attractive risk/reward profiles can be found in the ABS and Non-Agency MBS sectors. We like these sectors’ close connections to consumer spending, which continues to be healthy.
We believe global central banks need to maintain accommodative policies in order to support ongoing expansion abroad. Rate hikes by the Fed will further tighten financial conditions, which may negatively impact the Fund’s overweight position to risk assets. Further escalation of trade disputes, specifically between the U.S. and China, may also adversely impact risk assets.
We believe current interest rates fully reflect the uncertainty surrounding the economic outlook which has seemed to embrace growth deceleration and a less active Federal Open Market Committee. There is little downside for rates at these levels unless actual economic weakness materializes. As a result, in the near term, the Fund is positioned with a neutral duration and curve relative to the benchmark. We also expect the Fund to hold a modest allocation to U.S. dollar-denominated Emerging Markets bonds because of their additional yield relative to Investment Grade and High Yield bonds.
Management's Discussion of Fund Performance(Unaudited) (Continued)
Comparison of the Change in Value of a $10,000 Investment in the
Touchstone Active Bond Fund and the Bloomberg Barclays U.S. Aggregate Bond Index
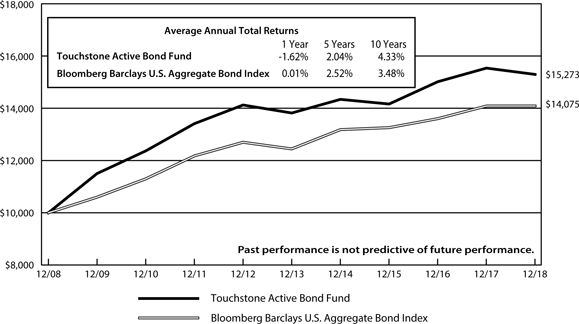
Performance information does not reflect fees that are paid by the separate accounts through which shares of the Fund are sold. Inclusion of those fees would reduce figures for all periods.
The inception date of the Fund was January 1, 1999.
Note to Chart
The Bloomberg Barclays U.S. Aggregate Bond Index is an unmanaged index comprised of U.S. investment grade, fixed rate bond market securities, including government, government agency, corporate and mortgage-backed securities between one and ten years.
Management's Discussion of Fund Performance(Unaudited)
Touchstone Balanced Fund
Sub-Advised by Fort Washington Investment Advisors, Inc.
Investment Philosophy
The Touchstone Balanced Fund seeks to achieve its investment goal of providing investors with capital appreciation and current income by generally investing in a diversified portfolio comprising 60 percent equity securities and 40 percent fixed-income securities. With respect to equities, the Fund invests primarily in issuers having a market capitalization, at the time of purchase, above $5 billion. Equity securities include common stock and preferred stock. With respect to fixed-income, the Fund invests primarily in bonds, including mortgage-related securities, asset-backed securities, government securities (both U.S. government securities and foreign sovereign debt), and corporate debt securities.
Fund Performance
The Touchstone Balanced Fund underperformed both of its benchmarks, the S&P 500® Index and the Bloomberg Barclays U.S. Aggregate Bond Index, for the 12-month period ended December 31, 2018. The Fund’s total return was -6.07 percent while the total return of the S&P 500® Index was -4.38 percent and the total return of the Bloomberg Barclays U.S. Aggregate Bond Index was 0.01 percent.
Market Environment
Risk assets continued their brisk pace higher to start 2018 following a strong 2017. However, volatility returned which reflected concerns about inflation and rising interest rates, as well as uncertainty about global trade.
During the year, the U.S. Federal Reserve Board (Fed) increased the federal funds rate a total of four times. Interest rates were driven by concerns about future growth in the U.S., slowing growth outside of the U.S. and continued uncertainty related to trade policies. The effects of the Fed’s rate increases, combined with the sharp decline in long-term rates led to further flattening of the curve and an inversion in certain parts of the curve, mainly in short-term maturities. Market expectations of additional Fed rate hikes decreased during the fourth quarter, as broad financial conditions reached their tightest levels of the year. Driving these financial conditions were the increased federal funds rate, a stronger U.S. dollar, widening credit spreads and the sharp retreat in equities. Global central bank policies were also less accommodative.
While underlying growth of the U.S. economy began to show signs of further deceleration toward the end of the year, it still remained near trend at approximately 2.0 to 2.5 percent. The strength of the economy was buoyed by the resiliency of labor markets and, as effects from fiscal policy and tax legislation began to fade, it was the most important factor for sustaining the current growth rate. During the period, labor markets were consistently strong in terms of jobs added month to month. Wage growth was also strong and began to show signs of acceleration. Core inflation readings were in line with the Fed’s 2 percent target and were expected to hover around 2 percent in the near term as data indicated solid, but not accelerating inflation.
The major theme surrounding U.S. equities was the return of volatility. For the year, sectors that outperformed the equity benchmark the most included Health Care, Utilities and Information Technology. Energy, Materials and Industrials were the main detractors.
Within fixed income, Investment Grade Corporate bonds, Mortgage-Backed Securities (MBS), Asset-Backed Securities (ABS) and Commercial Mortgage-Backed Securities (CMBS) all underperformed U.S. Treasuries during the period. High Yield bonds also underperformed for the year.
Management's Discussion of Fund Performance(Unaudited) (Continued)
Portfolio Review
Within the equity allocation, stock selection in the Health Care, Industrials and Energy sectors were the largest relative underperformers. Stock selection within the Financials and Information Technology sectors contributed to performance. Sector allocation contributed to relative performance, primarily due to an overweight to the Consumer Discretionary sector and an underweight to the Energy sector.
The primary detractors within the fixed income allocation were an overweight to Investment Grade bonds and interest rate management, specifically duration positioning and an allocation to Treasury Inflation Protected Securities (TIPS). The Fund’s allocation to U.S. dollar-denominated Emerging Markets bonds also detracted over the period, while security selection was strong within Securitized Assets, particularly ABS. This helped offset some of the losses incurred from the Fund’s allocation to Emerging Markets. The Fund’s cash position had a positive impact on performance given the negative moves in the market.
There were no significant changes made to the Fund’s allocation for the year as the Fund maintained a slight overweight to Equities versus Fixed Income. Within Fixed Income, the overall allocation continued to have a modest overweight to risk with the largest overweight position to Investment Grade Credit. The Fund also maintained a modest allocation to U.S. dollar-denominated Emerging Markets debt.
Outlook
Looking ahead, we believe risk assets offer the greatest potential to the Fund, driven by U.S. economic growth, steady inflation, amicable resolutions to trade disputes, and accommodative central bank policies both domestically and abroad. Due to tightening financial conditions, increased market volatility and increases in the federal funds rate, we believe current market conditions could become headwinds to the Fund in 2019. Valuations have adjusted to tighter borrowing costs, the slowdown in global growth and the uncertainty around trade issues. As a result, we believe the potential upside for price appreciation is limited. Within equities, we have taken advantage of opportunities to position the Fund for the later stages of the market cycle. The Fund continues to be skewed toward larger cap, “franchise value” businesses with higher barriers to entry. We also expect to emphasize businesses with lower financial leverage and pricing power to help offset wage inflation. In the Fund’s fixed income holdings, we have taken advantage of opportunities among securitized assets when possible, where we believe attractive risk-reward profiles can be found in the ABS and Non-Agency MBS sectors. We like these sectors’ close connections to consumer spending, which continues to be healthy.
We believe global central banks need to maintain accommodative policies in order to support ongoing expansion abroad. Rate hikes by the Fed will further tighten financial conditions, which may negatively impact the Fund’s overweight position to risk assets. Further escalation of trade disputes, specifically between the U.S. and China, may also adversely impact risk assets.
We believe current rates fully reflect the uncertainty surrounding the economic outlook which has seemed to embrace growth deceleration and a less active Federal Open Market Committee. There is little downside for rates at these levels unless actual economic weakness materializes. As a result, in the near term, the Fund is positioned with a neutral duration and curve relative to the benchmark. We also expect to hold a modest allocation to U.S. dollar-denominated Emerging Markets bonds because of their additional yield relative to Investment Grade and High Yield bonds.
Management's Discussion of Fund Performance(Unaudited) (Continued)
Comparison of the Change in Value of a $10,000 Investment in the
Touchstone Balanced Fund, the Bloomberg Barclays U.S. Aggregate Bond Index and the
S&P 500® Index
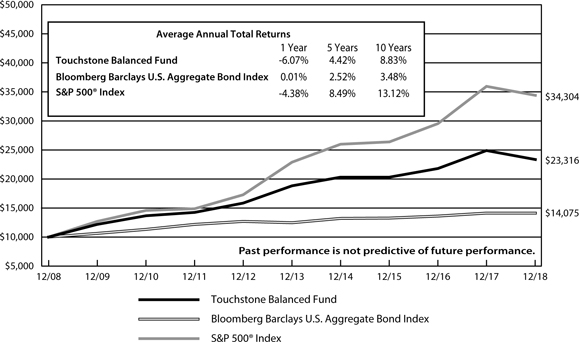
Performance information does not reflect fees that are paid by the separate accounts through which shares of the Fund are sold. Inclusion of those fees would reduce figures for all periods.
The inception date of the Fund was August 1, 2003.
Notes to Chart
S&P 500® Index is a group of 500 widely held stocks and is commonly regarded to be representative of the large capitalization stock universe.
The Bloomberg Barclays U.S. Aggregate Bond Index is an unmanaged index comprised of U.S. investment grade, fixed rate bond market securities, including government, government agency, corporate and mortgage-backed securities between one and ten years.
Management's Discussion of Fund Performance(Unaudited)
Touchstone Bond Fund
Sub-Advised by Fort Washington Investment Advisors, Inc.
Investment Philosophy
The Touchstone Bond Fund seeks to provide as high a level of current income as is consistent with the preservation of capital. Capital appreciation is a secondary goal. Under normal circumstances, the Fund invests at least 80 percent of its assets in bonds. Bonds include mortgage-related securities, asset-backed securities, government securities and corporate debt securities. The Fund primarily invests in investment-grade debt securities, but may invest up to 30 percent of the Fund’s total assets in non-investment-grade debt securities.
Fund Performance
The Touchstone Bond Fund underperformed its benchmark, the Bloomberg Barclays U.S. Aggregate Bond Index, for the 12-month period ended December 31, 2018. The Fund’s total return was -1.88 percent, while the total return of the benchmark was 0.01 percent.
Market Environment
Risk assets continued their brisk pace higher to start 2018 following a strong 2017. However, volatility returned which reflected concerns about inflation and rising interest rates, as well as uncertainty about global trade.
During the year, the U.S. Federal Reserve Board (Fed) increased the federal funds rate a total of four times. Interest rates were driven by concerns about future growth in the U.S., slowing growth outside of the U.S. and continued uncertainty related to trade policies. The effects of the Fed’s rate increases, combined with the sharp decline in long-term rates led to further flattening of the yield curve and an inversion in certain parts of the curve, mainly in short-term maturities.
Market expectations of additional Fed rate hikes decreased during the fourth quarter, as broad financial conditions reached their tightest levels of the year. Driving these financial conditions were the increased federal funds rate, a stronger U.S. dollar, widening credit spreads and the sharp retreat in equities. Global central bank policies were also less accommodative.
While underlying growth of the U.S. economy began to show signs of further deceleration toward the end of the year, it still remained near trend at approximately 2.0 to 2.5 percent. The strength of the economy was buoyed by the resiliency of labor markets and, as effects from fiscal policy and tax legislation began to fade, it was the most important factor for sustaining the current growth rate. During the period, labor markets were consistently strong in terms of jobs added month to month. Wage growth was also strong and began to show signs of acceleration. Core inflation readings were in line with the Fed’s 2 percent target and were expected to hover around 2 percent in the near term as data indicated solid, but not accelerating inflation.
Portfolio Review
The main detractors from Fund performance during the year were an overweight to Investment Grade bonds and interest rate management, specifically duration positioning and an allocation to Treasury Inflation Protected Securities (TIPS). The Fund’s allocation to U.S. dollar-denominated Emerging Markets bonds also detracted over the period, while security selection was strong within Securitized Assets, particularly ABS. This helped offset some of the losses incurred from the Fund’s allocation to Emerging Markets. The Fund maintained a modest allocation to U.S. dollar-denominated Emerging Markets bonds during the period as the additional yield relative to Investment Grade corporate and High Yield bonds remained attractive.
Management's Discussion of Fund Performance (Unaudited) (Continued)
Outlook
Looking ahead, we believe risk assets offer the greatest potential to the Fund, driven by U.S. economic growth, steady inflation, amicable resolutions to trade disputes, and accommodative central bank policies both domestically and abroad. Due to tightening financial conditions, increased market volatility and increases in the federal funds rate, we believe current market conditions could become headwinds to the Fund in 2019. Valuations have adjusted to tighter borrowing costs, the slowdown in global growth and the uncertainty around trade issues. As a result, we believe the potential upside for price appreciation is limited. We have taken advantage of opportunities among securitized assets when possible, where we believe attractive risk/reward profiles can be found in the ABS and Non-Agency MBS sectors. We like these sectors’ close connections to consumer spending, which continues to be healthy.
We believe global central banks need to maintain accommodative policies in order to support ongoing expansion abroad. Rate hikes by the Fed will further tighten financial conditions, which may negatively impact the Fund’s overweight position to risk assets. Further escalation of trade disputes, specifically between the U.S. and China, may also adversely impact risk assets.
We believe current interest rates fully reflect the uncertainty surrounding the economic outlook which has seemed to embrace growth deceleration and a less active Federal Open Market Committee. There is little downside for rates at these levels unless actual economic weakness materializes. As a result, in the near term, the Fund is positioned with a neutral duration and curve relative to the benchmark. We also expect the Fund to hold a modest allocation to U.S. dollar-denominated Emerging Markets bonds because of their additional yield relative to Investment Grade and High Yield bonds.
Management's Discussion of Fund Performance (Unaudited) (Continued)
Comparison of the Change in Value of a $10,000 Investment in the
Touchstone Bond Fund and the Bloomberg Barclays U.S. Aggregate Bond Index
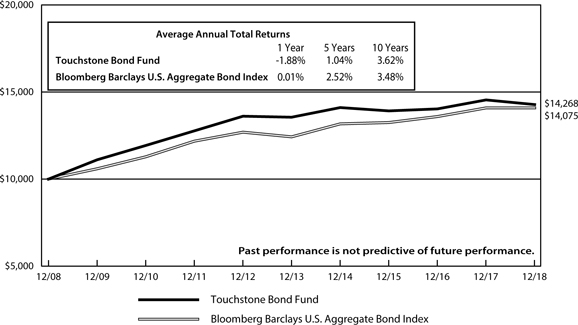
Performance information does not reflect fees that are paid by the separate accounts through which shares of the Fund are sold. Inclusion of those fees would reduce figures for all periods.
The inception date of the Fund was August 1, 2003.
Note to Chart
The Bloomberg Barclays U.S. Aggregate Bond Index is an unmanaged index comprised of U.S. investment grade, fixed rate bond market securities, including government, government agency, corporate and mortgage-backed securities between one and ten years.
Management's Discussion of Fund Performance (Unaudited)
Touchstone Common Stock Fund
Sub-Advised by Fort Washington Investment Advisors, Inc.
Investment Philosophy
The Fund seeks to invest at least 80 percent of its assets in large capitalization equity securities. The Fund’s sub-advisor, Fort Washington Investment Advisors, Inc., seeks to invest in companies that are trading below what is believed to be the estimate of the companies’ intrinsic value and have a sustainable competitive advantage or a high barrier to entry in place. The barrier(s) to entry can be created through a cost advantage, economies of scale, high customer loyalty or a government barrier (e.g. license or subsidy). Fort Washington believes that the strongest barrier to entry is the combination of economies of scale and high customer loyalty.
Fund Performance
The Touchstone Common Stock Fund underperformed its benchmark, the S&P 500® Index, for the 12-month period ended December 31, 2018. The Fund’s total return was -8.05 percent while the benchmark’s total return was -4.38 percent.
Market Environment
In 2018, U.S. equities recorded negative returns for the 12-month period as global growth, trade relations between the U.S. and China, and fiscal tightening by the U.S. Federal Reserve Board (Fed) concerned investors.
The major theme surrounding U.S. equities was the return of volatility. Sectors that outperformed the S&P 500® Index the most during the year included Health Care, Utilities, and Information Technology. Sectors that underperformed the broader index the most included Energy, Materials, and Industrials.
Portfolio Review
Stock selection was the primary cause of relative underperformance. Stock selection within the Materials, Financials, and Information Technology sectors contributed to relative performance. Energy, Health Care, Industrials and Communication Services were among the underperforming sectors.
The Fund’s top contributors to relative performance for the year were Amazon.com, Inc. (Consumer Discretionary sector), Twenty-First Century Fox, Inc. (Communication Services sector), Salesforce.com, Inc. (Information Technology sector), Microsoft Corp. (Information Technology sector), Starbucks Corp. (Consumer Discretionary sector) and Berkshire Hathaway Inc. Class B Shares (Financials sector). Among the stocks that detracted from relative performance were Facebook, Inc. (Communication Services sector), General Electric Co. (Industrials sector), Goldman Sachs Group, Inc. (Financials sector), Stericycle, Inc. (Industrials sector), and JD.com, Inc. (Consumer Discretionary sector).
Outlook and Conclusion
The U.S. stock market recorded a pullback in the fourth quarter that helped produce the first negative year since 2008. Concerns driving the market lower in the fourth quarter included, but were not limited to, lingering trade concerns between the U.S. and China, commentary by the Fed early in the quarter signaling more rate increases and slowing growth in foreign economies. The elevated volatility in the fourth quarter leads to the question of whether this is another transitory market pullback or the end of a bull market. Each of the critical indicators we track signal it is the former. However, there are ongoing items that need to be monitored closely including market and individual company valuations, the state of the global economy, unit labor costs and
Management's Discussion of Fund Performance (Unaudited) (Continued)
market breadth. These are all items we are focused on as the cycle matures. While we do not see signs of a bear market on the immediate horizon, we have taken opportunities to position the Fund for the later stages of the market cycle.
Comparison of the Change in Value of a $10,000 Investment in the
Touchstone Common Stock Fund and the S&P 500® Index
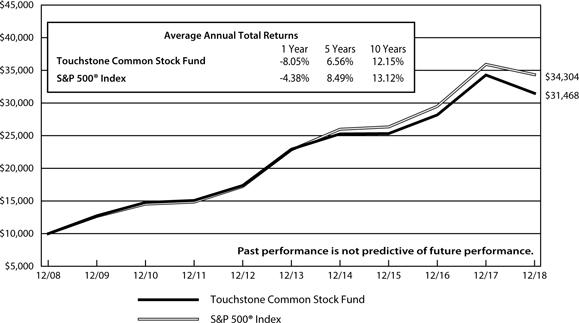
Performance information does not reflect fees that are paid by the separate accounts through which shares of the Fund are sold. Inclusion of those fees would reduce figures for all periods.
The inception date of the Fund was November 30, 2000.
Note to Chart
S&P 500® Index is a group of 500 widely held stocks and is commonly regarded to be representative of the large capitalization stock universe.
Management's Discussion of Fund Performance (Unaudited)
Touchstone Focused Fund
Sub-Advised by Fort Washington Investment Advisors, Inc.
Investment Philosophy
The Touchstone Focused Fund seeks to invest in companies of all capitalizations that are trading below what is believed to be the estimate of their intrinsic value and have a sustainable competitive advantage or a high barrier to entry in place. The barrier(s) to entry can be created through a cost advantage, economies of scale, high customer loyalty or a government barrier (e.g. license or subsidy). Fort Washington believes that the strongest barrier to entry is the combination of economies of scale and high customer loyalty.
Fund Performance
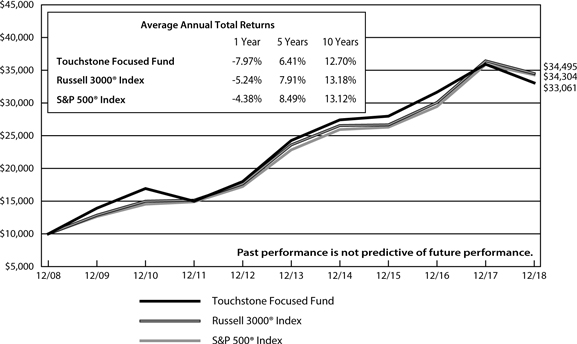
The Touchstone Focused Fund underperformed its primary benchmark, the Russell 3000® Index, and its secondary benchmark, the S&P 500® Index, for the 12-month period ended December 31, 2018. The Fund’s total return was -7.97 percent, while the total return of the Russell 3000® Index was -5.24 percent and the total return of the S&P 500® Index was -4.38 percent.
Market Environment
U.S. equities recorded negative returns for the 12-month period as global growth, trade relations between the U.S. and China, and fiscal tightening by the U.S. Federal Reserve Board (Fed) weighed on investors.
The major theme surrounding U.S. equities was the return of volatility. For the year, the sectors that outperformed the Russell 3000® Index the most included Health Care, Utilities and Information Technology. Energy, Materials and Industrials were the worst performing sectors.
Portfolio Review
The Fund’s stock selection within the Materials, Consumer Discretionary, Information Technology and Financials sectors outperformed relative to the benchmark. Stock selection within Energy, Health Care, Communication Services, and Industrials detracted from relative performance. Sector allocation contributed to relative performance, primarily due to underweights to the Materials, Industrials and Energy sectors. The Fund’s cash position had a positive impact on performance given the negative moves in the market.
Among the individual stocks that contributed to relative performance were Amazon.com,Inc. (Consumer Discretionary sector), Salesforce.com, Inc. (Information Technology sector) and Twenty-First Century Fox, Inc. (Communication Services sector). Amazon.com is an e-commerce retailer and cloud computing software company. The stock rose during the period due to the acceleration of growth in the company’s Amazon Prime subscription service and its Amazon Web Services subsidiary. Salesforce.com, a cloud-based software business, increased primarily due to higher than expected revenue growth and management’s announcement that it raised fiscal year revenue guidance for 2019. Twenty-First Century Fox, a multinational mass media company, moved higher following a proposed acquisition from Walt Disney Co.
Among the individual stocks that detracted from relative performance were Stericycle, Inc. (Industrials sector), JD.com, Inc. (Consumer Discretionary sector) and Goldman Sachs Group Inc. (Financials sector). Stericycle specializes in collecting and disposing of regulated substances - such as medical waste pharmaceuticals - and provides compliance training solutions. The stock underperformed primarily due to weak performance by the company’s core regulated medical waste business as well as softer than expected revenues in its communications solutions business. JD.com, a China-based e-commerce business, moved lower due to concerns about growth and the company’s ongoing investments that have negatively impacted margins. Further, the news cycle surrounding criminal allegations against the company’s CEO also weighed on its stock price.
Management's Discussion of Fund Performance (Unaudited) (Continued)
From a market cap perspective, the Fund maintained underweight positions in small-cap companies - with market caps below $2 billion - and mid-cap companies. The Fund continued to maintain an overweight to large-cap businesses, which includes companies with market caps above $10 billion. The Fund’s market cap allocation contributed to performance as large-cap stocks outperformed the benchmark during the period.
During the period, the Fund initiated positions in Monster Beverage Corp. (Consumer Staples sector), AmerisourceBergen Corp. (Health Care sector), Baidu, Inc. (Communication Services sector), JD.com Inc., Alibaba Group Holding Ltd. (both from the Consumer Discretionary sector), Deere & Co., Inc. and FedEx Corp. (both from the Industrials sector). The Fund exited positions in Mondelez International, Inc. (Consumer Discretionary sector), Bank OZK (Financials sector), Johnson Controls International PLC (Industrials sector), Cisco Systems, Inc. (Information Technology sector) and Nutrien Ltd. (Materials sector).
At the end of the year, the Fund was overweight to the Communication Services, Financials, Consumer Discretionary and Real Estate sectors, and underweight to the Consumer Staples, Energy and Industrials sectors. Allocations to the Health Care and Information Technology sectors were generally matched to that of the benchmark. The Fund did not hold any stocks within the Utilities or Materials sectors at the end of the period.
Outlook
The U.S. stock market recorded a significant pullback in the fourth quarter, which contributed to the first year of negative results since 2008. Events driving the market lower in the fourth quarter included, but were not limited to, concerns surrounding lingering trade concerns between the U.S. and China, commentary by the Fed signaling more rate increases and slowing growth in foreign economies. The elevated volatility in the fourth quarter also led some to question whether this was another transitory market pullback or the end of a bull market. Each of the critical indicators we track signal it was the former. However, we believe there are ongoing items that will need to be monitored closely going forward, including market and individual company valuations, the state of the global economy, unit labor costs and market breadth.
While we do not see signs of a bear market on the immediate horizon, we have taken advantage of opportunities to position the Fund for the later stages of the market cycle. The Fund continues to be skewed toward larger cap, franchise value businesses with higher barriers to entry. We also expect to emphasize businesses with lower financial leverage and pricing power to help offset wage inflation.
Management's Discussion of Fund Performance (Unaudited) (Continued)
Comparison of the Change in Value of a $10,000 Investment in the
Touchstone Focused Fund, the Russell 3000®Index and the S&P 500® Index
Performance information does not reflect fees that are paid by the separate accounts through which shares of the Fund are sold. Inclusion of those fees would reduce figures for all periods.
The inception date of the Fund was November 21, 1994.
Notes to Chart
The Frank Russell Company (FRC) is the source and owner of the Russell 3000® Index data contained or reflected in this material and all trademarks and copyrights related thereto. The material may contain confidential information and unauthorized use, disclosure, copying, dissemination or redistribution is strictly prohibited. This is a Touchstone Investments presentation of the data, and FRC is not responsible for the formatting or configuration of this material or for any inaccuracy in the presentation thereof.
Russell 3000® Index measures the performance of the 3,000 largest U.S. companies based on total market capitalization, which represents approximately 98% of the investable U.S. equity market.
S&P 500® Index is a group of 500 widely held stocks and is commonly regarded to be representative of the large capitalization stock universe.
Management's Discussion of Fund Performance (Unaudited)
Touchstone Large Cap Core Equity Fund
Sub-Advised by The London Company
Investment Philosophy
The Touchstone Large Cap Core Equity Fund seeks long-term capital growth by investing primarily in common stocks of large-cap U.S. listed companies. The Fund seeks to purchase financially stable large-cap companies that it believes are consistently generating high returns on unleveraged operating capital, run by shareholder-oriented management, and trading at a discount to the company’s respective private market values.
Fund Performance
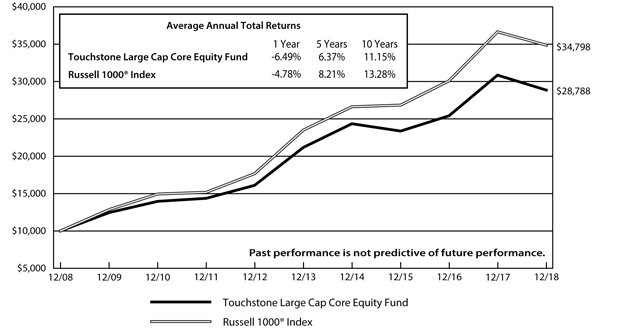
The Touchstone Large Cap Core Equity Fund underperformed its benchmark, the Russell 1000® Index, for the 12-month period ended December 31, 2018. The Fund’s total return was -6.49 percent, while the benchmark’s total return was -4.78 percent.
Market Environment
U.S. equities ended the year lower, but the ride from start to finish was anything but linear as volatility made an impactful return. After ending 2017 with historically low market volatility, January 2018 posted returns that were among the best on record, while December posted some of the worst.
Economic data was mostly positive for the year, but there were areas of potential concern, including housing and the impact of tariffs. While housing starts and existing home sales were relatively stable, growth was limited. Rhetoric surrounding potential trade wars dominated headlines throughout the year and intensified during the fourth quarter. The main risk, in particular, was between the U.S. and China, where a number of tariffs were either announced or already enacted.
In terms of monetary policy, as expected, the U.S. Federal Reserve Board (Fed) increased the federal funds rate by 25 basis points during December, with a new target of 2.25 to 2.5 percent. This marked the fourth rate hike during the 12-month period and ninth rate hike since the Fed began raising rates in December 2015. The Fed also communicated that any additional rate hikes would be dependent on economic data. Thus, following concerns about recent economic data, expectations for three additional rate hikes in 2019 were changed to only two hikes. Further, the pace of inflation continued to trend in the 2 percent range during the year, which was in line with the Fed’s target.
At the end of the 12-month period, all of the major stock indexes posted declines, with large-cap stocks faring better than small-cap stocks. Growth stocks outperformed value stocks for the year, value stocks outperformed growth stocks during the fourth quarter. Benchmark performance was led by the Health Care and Information Technology sectors, while the Energy, Materials, Industrials and Financials sectors lagged.
Portfolio Review
During the 12-month period, stock selection contributed positively to relative Fund performance but was offset by negative sector allocation. At the sector level, an underweight to the Health Care sector and an overweight to the Financials sector had a negative impact on relative performance. This was offset by the positive impact from an overweight to the Consumer Discretionary sector and an underweight to Energy.
Among the individual stocks that contributed to relative Fund performance during the period were O’Reilly Automotive Inc., Nike Inc. (both from the Consumer Discretionary sector), Visa Inc. (Information Technology sector), Progressive Corp. and Berkshire Hathaway Inc. (both from the Financials sector).
O’Reilly Automotive, an automotive parts retailer, outperformed as the company reported better than expected same-store sales and increased guidance. O’Reilly also continued to gain market share in both mature and new
Management's Discussion of Fund Performance (Unaudited) (Continued)
markets, and it remained the gold standard for service and logistics in its industry. Additionally, the average age of cars on the road has continued to rise, which should be a tailwind for the stock in the mid-term. Nike is a retailer of footwear, apparel, sports equipment and accessories. Nike outperformed during the period in which the Fund owned the stock, following a resumption of growth in its North American segment after several quarters of deceleration. The stock was sold from the Fund early during the fourth quarter due to valuation concerns. Visa, a global payments technology company, traded higher during the year which was driven by consistently strong results. In particular, Visa has produced strong cash flow and redistributed extra cash to shareholders. It also has a firm position in the market for global payments with significant barriers to entry. Looking forward, we believe the economic backdrop for Visa should remain strong, driven by healthy economies around the world, and the shift to credit and electronic commerce. Progressive, an insurance provider, outperformed as the company continued to post strong premium growth along with profitable underwriting results, and its combined expense ratio came in lower than expected. Progressive also posted improved top-line growth in both its auto and home insurance policies, and both of its digital and agency platforms increased market share. Berkshire Hathaway, a multinational conglomerate holding company, moved higher during the year following solid operating results across most of its segments. In July, the board of directors amended its share repurchase program to allow for buybacks at such time a repurchase price is believed to be below intrinsic value, which was a revision from the prior program. Going forward, we believe the company offers downside protection, particularly in light of management’s extensive record of superb capital allocation.
Among the individual stocks that detracted from relative Fund performance during the period were FedEx Corp., Southwest Airlines Co. (both from the Industrials sector), Carnival Corp. (Consumer Discretionary sector), Altria Group Inc. (Consumer Staples sector) and BlackRock Inc. (Financials sector). FedEx, a multinational courier delivery service, was generally flat most of the year but fell sharply during the fourth quarter. In general, economically sensitive transportation stocks were hit hard during the quarter based on concerns of macroeconomic weakening. FedEx, in particular, moved lower after its third-quarter results were impacted unexpectedly by weakness in Europe and troubles with its integration of TNT Express NV that caused management to push cost savings targets out several years. Southwest Airlines, a low-cost airline carrier, lagged early in the year resulting from headwinds to its unit revenues and costs. The stock underperformed sharply in the fourth quarter as commentary surrounding its unit costs for 2019 unnerved investors. We view these issues as largely transitory and feel the market overreacted, as the company still expects to expand margins next year. Going forward, we feel that Southwest Airlines is a best-of-breed business with strong management, a good balance sheet and favorable capital allocation policies. Carnival Corp., a cruise ship operator, underperformed as investors grew concerned about the combination of weakening demand from Europe and increasing capacity. The stock fell sharply during the fourth quarter as the market responded negatively to Carnival’s reports of a solid fiscal quarter but disappointing guidance for 2019. Though investor sentiment was depressed, we believe Carnival’s focus on return on capital and its policy of returning excess cash to shareholders should benefit the company going forward. Altria, the owner of multiple tobacco operating companies, struggled in 2018 as volumes continued to decline. During the fourth quarter, the company came under pressure after announcing investments in both Cronos Group Inc. (a Canadian cannabis company) and Juul (a U.S. vaporizer company). In general, the market has viewed the Juul acquisition negatively. However, we believe Altria has historically been an intelligent capital allocator, and we think people are likely underestimating the potential value that the partnership between Altria and Juul could create. BlackRock, a global investment management company, underperformed along with its peers as concerns about asset flows weighed on sentiment. We maintained the Fund’s position as we believe BlackRock is a well-run company with a conservative balance sheet, attractive cash flow profile and shareholder-friendly mindset. Longer term, we believe BlackRock is positioned to benefit from the trend toward passive investing due to its scale and technological leadership.
During the 12-month period, we opportunistically took advantage of market weakness and added to the Fund’s position in Alphabet Inc. (Information Technology sector). We believe Alphabet, a multinational conglomerate
Management's Discussion of Fund Performance (Unaudited) (Continued)
that includes Google Inc. and its internet products, is structurally advantaged with long-term tailwinds from cloud computing and data centers. We also added to FedEx Corp. as a result of the strength in the U.S. economy and the company’s strong position in the package delivery market. Finally, we added to Southwest Airlines Co. because of its attractive valuation and signs of improving traffic and higher pricing. We also feel the company is positioned well in a consolidated industry.
We initiated positions in Albemarle Corp. (Materials sector), The Home Depot Inc. (Consumer Discretionary sector), Martin Marietta Materials Inc. (Materials sector) and Nestle SA (Consumer Staples sector). Albemarle is a specialty chemical company with three reporting segments: lithium, bromine specialties and catalysts. A primary use of lithium is in rechargeable batteries, which is expected to see growing demand over the next several years for electric vehicles, portables and rechargeable consumer electronics. Albemarle also maintains a strong balance sheet and has benefited from growth in its operating cash flow. Further, the company generates attractive earnings margins, which reflects its leadership positions in its markets. Home Depot is the world’s largest home improvement specialty retailer, with industry-leading margins and returns on capital. Home Depot has benefited from strong housing-related tailwinds and is expected to do so for some time and has a solid history of capital allocation. Further, the company has produced strong earnings margins and operating cash flow, as well as a solid balance sheet. We initiated the position in Martin Marietta Materials as a result of our positive view of the aggregates industry in particular, its oligopoly with pricing power, strong return on capital and double-digit operating margins. Looking ahead, we believe the company should benefit from volume growth due to a strong U.S. economy and the need for greater infrastructure spending. Nestle is the largest food company in the world with scale and brand advantages. The company is well diversified among geographies with approximately 60 percent of sales occurring in developed markets and 40 percent in emerging markets, where growth and margins are higher. The company is exposed to many large staple categories and also has a valuable stake in L’Oréal Co. Nestle has a strong balance sheet and solid earnings, and also generates an attractive cash flow. Further, we believe the company has balance sheet flexibility to help weather potential downturns in the market.
Outlook
The combination of solid economic growth, low inflation and relatively low interest rates usually create a positive environment for stocks. We believe this holds true today, but we maintain a more balanced view as valuations have improved in recent months; the broader market now trades at a slight discount to its long-term average. We also believe there are potential risks, including rising debt levels, wage inflation, the impact of increasing tariffs, or the Fed taking a more aggressive stance.
Looking ahead, we will continue to seek companies with strong returns on capital and sustainable competitive advantages. We remain attracted to the return-on-capital metric because it speaks to the ability of the company to generate cash, which is ultimately what potentially lowers risk. We also tend to be attracted to businesses that are overcapitalized and under-levered. We believe an under-levered company has more options available to it if the economy falls into a recession, including changing its capital structure to lower its overall cost of capital. We believe the Fund is well-positioned based on the strength of the companies it owns and the overall valuation of its portfolio.
Management's Discussion of Fund Performance (Unaudited) (Continued)
Comparison of the Change in Value of a $10,000 Investment in the
Touchstone Large Cap Core Equity Fund and the Russell 1000® Index
Performance information does not reflect fees that are paid by the separate accounts through which shares of the Fund are sold. Inclusion of those fees would reduce figures for all periods.
The inception date of the Fund was May 1, 1999.
Notes to Chart
Russell 1000® Index measures the performance of the 1,000 largest companies in the Russell 3000® Index.
The Frank Russell Company (FRC) is the source and owner of the Russell 1000® Index data contained or reflected in this material and all trademarks and copyrights related thereto. The material may contain confidential information and unauthorized use, disclosure, copying, dissemination or redistribution is strictly prohibited. This is a Touchstone Investments presentation of the data, and FRC is not responsible for the formatting or configuration of this material or for any inaccuracy in the presentation thereof.
Management's Discussion of Fund Performance (Unaudited)
Touchstone Small Company Fund
Sub-Advised by Fort Washington Investment Advisors, Inc.
Investment Philosophy
The Fund seeks to provide investors with growth of capital by investing primarily in common stocks of small companies that the sub-advisor believes are high quality, have superior business models, solid management teams, sustainable growth potential and are attractively valued.
Fund Performance
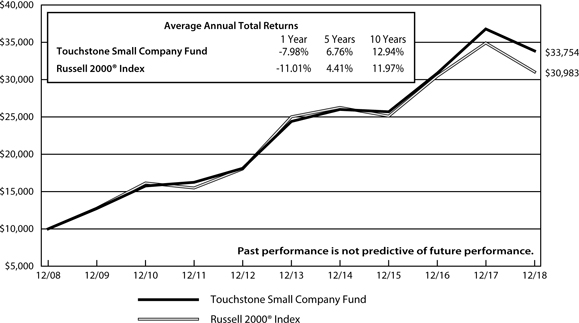
The Touchstone Small Company Fund outperformed its benchmark, the Russell 2000® Index, for the 12-month period ended December 31, 2018. The Fund’s total return was -7.98 percent while the return of the benchmark was -11.01 percent.
Market Environment
Small-cap equity markets experienced a volatile 2018. The year started slow with the benchmark essentially flat in the first quarter. However, the second and third quarters saw strong gains by the Index, culminating in setting an all-time high in the third quarter. In an abrupt turn of events, the benchmark declined significantly in the fourth quarter and entered bear market territory. We believe that the sell-off was driven by a confluence of factors. One was an expectation of higher than expected interest rates from the U.S. Federal Reserve Board (Fed), and as a result tighter financial conditions. Another factor was intensified global trade dispute concerns, particularly with China. China, as well as emerging and developed economies overseas, experienced a significant deceleration in economic conditions and stock market valuations over 2018. Lastly, there was an increased focus on what stage is the U.S. economy currently operating, and when the next recession may occur.
At the sector level, Consumer Staples, Health Care, Information Technology, Communication Services, Consumer Discretionary, and Utilities outperformed the benchmark. The Financials and Real Estate sectors performed in-line with the benchmark. The Energy, Industrials, and Materials sectors all underperformed.
Portfolio Review
The Fund’s top performing sectors were Information Technology, Industrials, and Health Care. The Fund’s bottom three performing sectors were Financials, Communication Services, and Real Estate. The Fund did not hold any stocks in the Utilities sector which negatively impacted performance as the benchmark sector experienced positive returns for the year.
Mergers and acquisitions activity remained a theme in the Fund’s portfolio and continued to benefit relative performance in 2018. The investment process uncovered stocks of companies that have historically been attractive acquisition targets for strategic and financial buyers. In 2018, long-term holding Esterline Technologies Corp. (Industrials sector), a diversified manufacturer of aerospace and industrials products was acquired by TransDigm Group. A number of Information Technology sector holdings were acquired during the year as well. Finisar Inc., a provider of optical solutions to the data and telecommunications markets, was acquired by II-IV Inc.; Microsemi Corporation, a semiconductor manufacturer, was acquired by strategic buyers. Also, VeriFone Systems, Inc., a leading provider of point-of-sale software and hardware, and Blackhawk Network Holdings, a provider of digital and physical gift cards, were both acquired by private equity firms.
The Fund’s top contributors to relative performance were Haemonetics Corporation and Tactile Systems Technology, Inc. (both Health Care sector), and the aforementioned Esterline Technologies (Industrials sector).
The Fund’s largest detractors to relative performance for the year were Knight-Swift Transportation Holdings Inc. (Industrials sector), MEDNAX, Inc. (Health Care sector), and KB Home (Consumer Discretionary sector).
Management's Discussion of Fund Performance (Unaudited) (Continued)
KB Home and Health Care Services Group were sold from the Fund in 2018, as we believed the challenges that the business models experienced would persist in 2019. The Fund maintained positions in MEDNAX, Inc., Knight-Swift Transportation Holdings Inc., and Tivity Health Inc. at the end of the year for their potential.
At the end of the year, the Fund was overweight to Information Technology, Industrials, and Health Care, roughly in line to Consumer Discretionary, and underweight to Consumer Staples, Real Estate, and Financials. The Fund had no exposure to the Energy, Materials, and Utilities sectors. The overall positioning relative to the small-cap index was consistent through the year.
Outlook
The economic backdrop remains favorable for growth in 2019 with the U.S. offering a relative opportunity compared with non-U.S. equity markets. After the sell-off at year end, the valuations in small-cap companies have become more attractive than where they started the year and are already pricing in a recession. Furthermore, we believe that value has more tailwinds than growth in this environment.
We remain focused on executing our fundamental stock selection and portfolio management process. We believe that stocks experience a four stage investment cycle and our research process is focused on the dynamics that apply to each stage of the investment cycle. We believe that excess returns and lower volatility are driven by the ability to successfully identify a stock’s current stage and the potential for it to transition to a different stage of its investment cycle.
Management's Discussion of Fund Performance (Unaudited) (Continued)
Comparison of the Change in Value of a $10,000 Investment in the
Touchstone Small Company Fund and the Russell 2000® Index
Performance information does not reflect fees that are paid by the separate accounts through which shares of the Fund are sold. Inclusion of those fees would reduce figures for all periods.
The inception date of the Fund was November 30, 2000.
Notes to Chart
Russell 2000® Index measures the performance of the small-cap segment of the U.S. equity universe.
The Frank Russell Company (FRC) is the source and owner of the Russell 2000® Index data contained or reflected in this material and all trademarks and copyrights related thereto. The material may contain confidential information and unauthorized use, disclosure, copying, dissemination or redistribution is strictly prohibited. This is a Touchstone Investments presentation of the data, and FRC is not responsible for the formatting or configuration of this material or for any inaccuracy in the presentation thereof.
Management's Discussion of Fund Performance (Unaudited)
Touchstone ETF Funds
Sub-Advised by Wilshire Associates Incorporated
Touchstone Aggressive ETF Fund
Touchstone Conservative ETF Fund
Touchstone Moderate ETF Fund
Investment Philosophy
Three funds which invest in Exchanged-Traded Funds (ETFs) are available for investors seeking “lifestyle” products for their annuity holdings. The three strategic options include: the Conservative, Moderate, and Aggressive ETF Funds. These funds allocate their assets among up to ten ETFs. These ten ETF selections generally do not change dramatically over time. The more conservative fund has a higher bond weighting and the more aggressive fund has a lower bond weighting.
Fund Performance
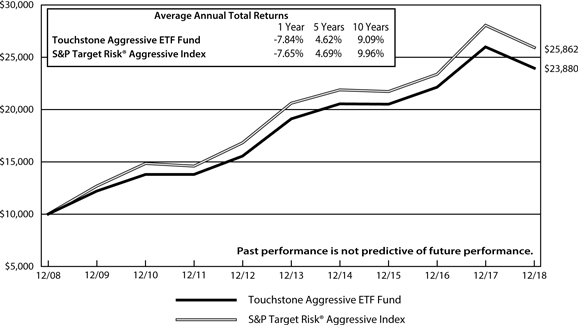
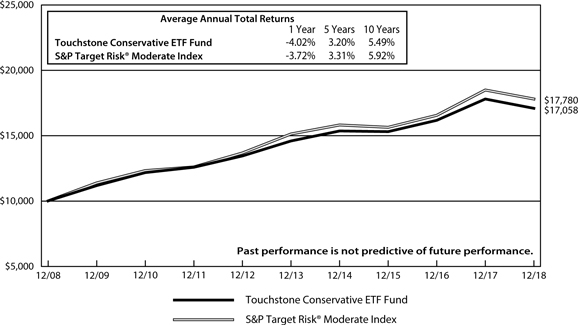
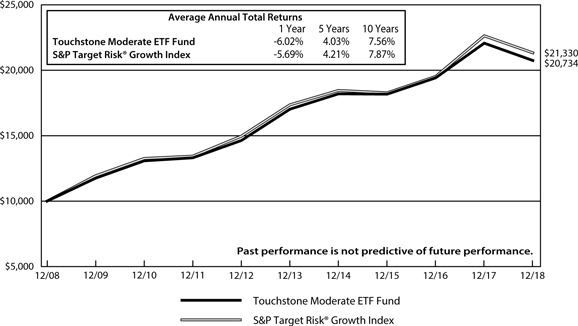
The Touchstone Aggressive ETF Fund underperformed its benchmark, the S&P Target Risk® Aggressive Index, for the 12-month period ended December 31, 2018. The Fund’s total return was -7.84 percent while the total return of the benchmark was -7.65 percent. The Touchstone Conservative ETF Fund underperformed its benchmark, the S&P Target Risk® Moderate Index, for the 12-month period ended December 31, 2018. The Fund’s total return was -4.02 percent while the total return of the benchmark was -3.72 percent. The Touchstone Moderate ETF Fund underperformed its benchmark, the S&P Target Risk® Growth Index, for the 12-month period ended December 31, 2018. The Fund’s total return was -6.02 percent while the total return of the benchmark was -5.69 percent.
Market Environment
The U.S. stock market, represented by the Russell 3000® Index, was down in 2018. Eight of the eleven major sectors declined during 2018, with Health Care, Utilities and Information Technology ending the year with positive returns. The worst performing sectors were Energy and Materials. Large capitalization stocks outperformed small-cap stocks while growth stocks outperformed their value counterparts during the twelve-month period.
Equity markets outside of the U.S. were negative for 2018 in both developed and emerging markets, with double-digit losses across the major indices. Although the European Union began the year in sound economic condition, growth declined steadily throughout the year as gains in unemployment stalled and industrial production reversed course. News out of Japan was grim with a report showing a serious economic contraction during the third quarter that threatened to end Japan’s longest expansion since the 1980s. Emerging Markets underperformed nearly all of the major indices for 2018.
The bellwether 10-year U.S. Treasury yield ended the year at 2.69 percent, up 29 basis points from its 2017 finish of 2.40 percent. The Federal Open Market Committee increased its overnight rate four times in 2018, a total increase of 100 basis points, to a range of 2.25 percent to 2.50 percent. Credit spreads widened during the year within both the investment grade and high yield markets.
Real estate securities declined in the U.S. for the year, but slightly outperformed global real estate. Commodities were down for the one-year period as crude oil fell 25 percent from the close of 2017. Master limited partnership returns remained negative for the year. Finally, gold prices ended 2018 down slightly from last year.
Management's Discussion of Fund Performance (Unaudited) (Continued)
Portfolio Review
The Funds’ investments are determined by an optimization process that considers the long-term historical risk and return profiles of various asset classes. For example, U.S. value equities were boosted relative to growth due to the perceived valuation opportunity and relative attractiveness. During the 2018 market environment, when value underperformed across U.S. stocks, the overweight positioning in the Funds relative to their respective benchmarks detracted from relative performance. Similarly, the overweight of the Funds to credit-sensitive fixed income was a headwind as was the related underweight to investment-grade, foreign fixed income, which outperformed its domestic counterpart.
Thematically, the several changes that occurred during 2018 were similar across all three Funds. Exposure to core and investment grade corporate fixed income was reduced, and a material allocation to short-term fixed income was initiated in order to further reduce portfolio interest rate risk. In addition, an overweight to domestic value equities was initiated, sourced from domestic large-cap blend equities, in order to take advantage of the more attractive valuations for value equities and lower beta1 profile. An overweight to small-cap domestic equities (relative to large-cap) was initiated in order to reduce exposure to the potential negative impacts of a trade war, since small-cap equities generally have had a smaller percentage of their sales attributed to foreign markets. The 2017 tax law changes were also expected to disproportionately benefit profitable small-cap companies, which had less flexibility to declare profits in lower tax foreign markets, rather than in the U.S.
Outlook
After an estimated 25 percent growth in corporate earnings during 2018, earnings are projected to grow less than 10 percent during 2019. Domestic equity markets have priced in reduced growth and on a forward price-earnings (P/E) basis, we believe equities are no longer expensive. Although the Funds remain positioned somewhat conservatively relative to long-term allocation targets, the Funds remain invested in risk assets. We previously pared back credit risk and duration risk, but they are at our target weight for long-only equities. We continue to expect a positive economic growth environment in the near future, and therefore, believe that the current economic landscape warrants low (relative to historical averages) interest rates on the longer end of the curve.
Global economic growth remains positive. While the forward-looking Purchasing Managers’ Index (PMI), which is an indicator of economic health in the manufacturing sector of a country or a region, has fallen in recent quarters, it continues to express positive economic momentum. Although measures of inflation are rising on a global basis, we believe they will remain low by historical standards. Given that global growth and inflation remain moderate, we believe that global central banks will be cautious about tightening monetary policy and will seek to communicate policy changes to the markets well in advance. Given ultra-low foreign developed market bond yields, we favor domestic fixed income over global fixed income; however, we recognize that any weakness in the U.S. dollar could serve to benefit foreign fixed income.
Strong U.S. corporate earnings growth helped propel domestic equity prices upwards early in 2018, but trade concerns weighed on the growth outlook for equities late in the year and led to a sharp sell-off in risk assets. Domestic equities are now mildly cheap in terms of forward P/E ratios. We believe the outlook for continued domestic and foreign gross domestic product (GDP) growth remains positive which reduces the downside risk of a continued equity market sell-off, unless economic growth slows meaningfully and recession fears grow. Rising rates may concern investors who may believe that the increase in interest rates will weigh on corporate earnings going forward. While we acknowledge this risk, we believe that it is important to recognize the potential demand for U.S. Treasury bonds from yield-seeking foreign investors. With respect to credit markets, there is potential that further erosion in the corporate earnings outlook could lead to further spread widening, though credit spreads have already priced in some slowdown and are now trading at what we believe to be more attractive levels.
1Beta is a measure of the volatility of a portfolio relative to its benchmark.
Management's Discussion of Fund Performance (Unaudited) (Continued)
Comparison of the Change in Value of a $10,000 Investment in the
Touchstone Aggressive ETF Fund and the S&P Target Risk® Aggressive Index
Performance information does not reflect fees that are paid by the separate accounts through which shares of the Fund are sold. Inclusion of those fees would reduce figures for all periods.
The inception date of the Fund was July 16, 2004.
Note to Chart
The S&P Target Risk® Aggressive Index is one of four multi-asset class indices that compose the S&P Target Risk Series. The S&P Target Risk® Aggressive Index emphasizes exposure to equities, maximizing opportunities for long-term capital accumulation. It may include small allocations to fixed income to enhance portfolio efficiency.
Management's Discussion of Fund Performance (Unaudited) (Continued)
Comparison of the Change in Value of a $10,000 Investment in the
Touchstone Conservative ETF Fund and the S&P Target Risk® Moderate Index
Performance information does not reflect fees that are paid by the separate accounts through which shares of the Fund are sold. Inclusion of those fees would reduce figures for all periods.
The inception date of the Fund was July 16, 2004.
Note to Chart
The S&P Target Risk® Moderate Index is one of four multi-asset class indices that compose the S&P Target Risk Series. The S&P Target Risk® Moderate Index offers significant exposure to fixed income, while also increasing opportunities for higher returns through equities.
Management's Discussion of Fund Performance (Unaudited) (Continued)
Comparison of the Change in Value of a $10,000 Investment in the
Touchstone Moderate ETF Fund and the S&P Target Risk® Growth Index
Performance information does not reflect fees that are paid by the separate accounts through which shares of the Fund are sold. Inclusion of those fees would reduce figures for all periods.
The inception date of the Fund was July 16, 2004.
Note to Chart
The S&P Target Risk® Growth Index is one of four multi-asset class indices that compose the S&P Target Risk Series. The S&P Target Risk® Growth Index increases exposure to equities, while also providing limited fixed income exposure to diversify risk.
Tabular Presentation of Portfolios of Investments (Unaudited)
December 31, 2018
The illustrations below provide each Fund’s credit quality and/or sector allocation. We hope it will be useful to shareholders as it summarizes key information about each Fund’s investments.
| Touchstone Active Bond Fund | | | |
| Credit Quality* | | (% of Investment Securities) | |
| AAA/Aaa | | | 44.3 | % |
| AA/Aa | | | 5.8 | |
| A/A | | | 11.9 | |
| BBB/Baa | | | 27.2 | |
| BB/Ba | | | 1.0 | |
| CCC | | | 0.5 | |
| Not Rated | | | 7.9 | |
| Cash Equivalents | | | 1.4 | |
| Total | | | 100.0 | % |
| | | | | |
| Touchstone Balanced Fund | | | |
| Credit Quality* | | (% of Fixed Income Securities) | |
| AAA/Aaa | | | 57.0 | % |
| AA/Aa | | | 5.4 | |
| A/A | | | 11.7 | |
| BBB/Baa | | | 25.4 | |
| BB/Ba | | | 0.3 | |
| Not Rated | | | 0.2 | |
| | | | 100.0 | % |
| | | | | |
| Sector Allocation** | | | (% of Net Assets) | |
| Common Stocks | | | | |
| Information Technology | | | 12.6 | % |
| Financials | | | 11.3 | |
| Communication Services | | | 10.6 | |
| Consumer Discretionary | | | 9.0 | |
| Health Care | | | 8.7 | |
| Industrials | | | 4.9 | |
| Real Estate | | | 2.9 | |
| Consumer Staples | | | 2.7 | |
| Energy | | | 2.3 | |
| Corporate Bonds | | | 13.6 | |
| U.S. Treasury Obligations | | | 10.4 | |
| U.S. Government Mortgage-Backed | | | 7.7 | |
| Obligations | | | | |
| Exchange-Traded Fund | | | 1.8 | |
| Sovereign Bonds | | | 0.2 | |
| Preferred Stock | | | 0.1 | |
| Short-Term Investment Fund | | | 1.2 | |
| Other Assets/Liabilities (Net) | | | 0.0 | |
| Total | | | 100.0 | % |
| | | | | |
| * | Credit quality ratings are from Standard & Poor's (“S&P”) and Moody's Investors Service (“Moody's”). If agency ratings differ, the higher rating will be used. Where no rating has been assigned, it may be for reasons unrelated to the creditworthiness of the issuer. |
| ** | Sector Classifications are based upon the Global Industry Classification Standard (GICS®). |
Tabular Presentation of Portfolios of Investments (Unaudited) (Continued)
| Touchstone Bond Fund | | | |
| Credit Quality* | | (% of Investment Securities) | |
| AAA/Aaa | | | 42.7 | % |
| AA/Aa | | | 5.2 | |
| A/A | | | 12.4 | |
| BBB/Baa | | | 27.6 | |
| BB/Ba | | | 1.1 | |
| Not Rated | | | 8.7 | |
| Cash Equivalents | | | 2.3 | |
| Total | | | 100.0 | % |
| | | | | |
| Touchstone Common Stock Fund | | | |
| Sector Allocation** | | (% of Net Assets) | |
| Information Technology | | | 18.7 | % |
| Communication Services | | | 18.3 | |
| Financials | | | 18.0 | |
| Health Care | | | 13.5 | |
| Consumer Discretionary | | | 12.2 | |
| Industrials | | | 6.4 | |
| Real Estate | | | 5.2 | |
| Energy | | | 3.7 | |
| Consumer Staples | | | 3.2 | |
| Short-Term Investment Fund | | | 0.8 | |
| Other Assets/Liabilities (Net) | | | (0.0 | ) |
| Total | | | 100.0 | % |
| | | | | |
| Touchstone Focused Fund | | | |
| Sector Allocation** | | (% of Net Assets) | |
| Information Technology | | | 18.9 | % |
| Financials | | | 16.8 | |
| Health Care | | | 15.8 | |
| Communication Services | | | 15.7 | |
| Consumer Discretionary | | | 12.1 | |
| Industrials | | | 6.4 | |
| Real Estate | | | 5.0 | |
| Energy | | | 3.5 | |
| Consumer Staples | | | 3.3 | |
| Short-Term Investment Fund | | | 2.6 | |
| Other Assets/Liabilities (Net) | | | (0.1 | ) |
| Total | | | 100.0 | % |
| | | | | |
| Touchstone Large Cap Core Equity Fund | | | |
| Sector Allocation** | | (% of Net Assets) | |
| Financials | | | 24.8 | % |
| Consumer Discretionary | | | 20.1 | |
| Information Technology | | | 13.5 | |
| Industrials | | | 13.0 | |
| Materials | | | 8.4 | |
| Consumer Staples | | | 8.0 | |
| Communication Services | | | 7.0 | |
| Energy | | | 2.1 | |
| Health Care | | | 1.9 | |
| Short-Term Investment Fund | | | 1.4 | |
| Other Assets/Liabilities (Net) | | | (0.2 | ) |
| Total | | | 100.0 | % |
| | | | | |
| * | Credit quality ratings are from Standard & Poor's (“S&P”) and Moody's Investors Service (“Moody's”). If agency ratings differ, the higher rating will be used. Where no rating has been assigned, it may be for reasons unrelated to the creditworthiness of the issuer. |
| ** | Sector Classifications are based upon the Global Industry Classification Standard (GICS®). |
Tabular Presentation of Portfolios of Investments (Unaudited) (Continued)
| Touchstone Small Company Fund | | | |
| Sector Allocation* | | (% of Net Assets) | |
| Information Technology | | | 24.1 | % |
| Industrials | | | 22.5 | |
| Health Care | | | 19.8 | |
| Consumer Discretionary | | | 13.8 | |
| Financials | | | 10.1 | |
| Communication Services | | | 2.9 | |
| Consumer Staples | | | 2.1 | |
| Real Estate | | | 1.4 | |
| Short-Term Investment Fund | | | 3.7 | |
| Other Assets/Liabilities (Net) | | | (0.4 | ) |
| Total | | | 100.0 | % |
| | | | | |
| Touchstone Aggressive ETF Fund | | | |
| Sector Allocation | | (% of Net Assets) | |
| Exchange-Traded Funds | | | | |
| Equity Funds | | | 79.8 | % |
| Fixed Income Funds | | | 17.5 | |
| Short-Term Investment Funds | | | 15.9 | |
| Other Assets/Liabilities (Net) | | | (13.2 | ) |
| Total | | | 100.0 | % |
| | | | | |
| Touchstone Conservative ETF Fund | | | |
| Sector Allocation | | (% of Net Assets) | |
| Exchange-Traded Funds | | | | |
| Fixed Income Funds | | | 57.9 | % |
| Equity Funds | | | 39.6 | |
| Short-Term Investment Funds | | | 15.4 | |
| Other Assets/Liabilities (Net) | | | (12.9 | ) |
| Total | | | 100.0 | % |
| | | | | |
| Touchstone Moderate ETF Fund | | | |
| Sector Allocation | | (% of Net Assets) | |
| Exchange-Traded Funds | | | | |
| Equity Funds | | | 59.7 | % |
| Fixed Income Funds | | | 38.0 | |
| Short-Term Investment Funds | | | 15.8 | |
| Other Assets/Liabilities (Net) | | | (13.5 | ) |
| Total | | | 100.0 | % |
| | | | | |
| * | Sector Classifications are based upon the Global Industry Classification Standard (GICS®). |
Portfolio of Investments
Touchstone Active Bond Fund – December 31, 2018
| Principal | | | | | Market | |
| Amount | | | | | Value | |
| | | | | | | |
| | | | | Corporate Bonds — 40.2% | | | | |
| | | | | | | | | |
| | | | | Financials — 10.2% | | | | |
| $ | 38,000 | | | Allstate Corp. (The), Ser B, | | | | |
| | | | | 5.750%, 8/15/53 | | $ | 37,050 | |
| | 218,000 | | | American Express Co., | | | | |
| | | | | 3.000%, 10/30/24 | | | 208,613 | |
| | 144,000 | | | Bank of America Corp., | | | | |
| | | | | 3.705%, 4/24/28 | | | 138,135 | |
| | 245,000 | | | Bank of America Corp. MTN, | | | | |
| | | | | 4.000%, 1/22/25 | | | 238,666 | |
| | 212,000 | | | Bank of Montreal (Canada), | | | | |
| | | | | 3.803%, 12/15/32 | | | 196,312 | |
| | 212,000 | | | Bank of New York Mellon Corp. (The) | | | | |
| | | | | MTN, 2.950%, 1/29/23 | | | 208,663 | |
| | 230,000 | | | Bank of Nova Scotia (The), (Canada), | | | | |
| | | | | (3M LIBOR +0.620%), | | | 227,663 | |
| | | | | 3.424%, 9/19/22(A) | | | | |
| | 200,000 | | | Barclays PLC (United Kingdom), | | | | |
| | | | | 4.610%, 2/15/23 | | | 198,312 | |
| | 210,000 | | | BB&T Corp. MTN, 2.850%, 10/26/24 | | | 201,761 | |
| | 125,000 | | | Citigroup, Inc., 3.300%, 4/27/25 | | | 118,707 | |
| | 320,000 | | | Citigroup, Inc., (3M LIBOR +1.430%), | | | | |
| | | | | 4.168%, 9/1/23(A) | | | 320,177 | |
| | 84,000 | | | Citigroup, Inc., 4.750%, 5/18/46 | | | 77,655 | |
| | 175,000 | | | Fifth Third Bancorp, 2.875%, 7/27/20 | | | 173,991 | |
| | 200,000 | | | GE Capital International Funding Co. | | | | |
| | | | | Unlimited Co. (Ireland), | | | | |
| | | | | 4.418%, 11/15/35 | | | 167,513 | |
| | 223,000 | | | General Motors Financial Co., Inc., | | | | |
| | | | | 3.200%, 7/13/20 | | | 220,232 | |
| | 280,000 | | | Goldman Sachs Group, Inc. (The), (3M | | | | |
| | | | | LIBOR +1.000%), 3.487%, 7/24/23(A) | | | 272,073 | |
| | 110,000 | | | Goldman Sachs Group, Inc. (The), | | | | |
| | | | | 3.691%, 6/5/28 | | | 102,231 | |
| | 115,000 | | | Goldman Sachs Group, Inc. (The), | | | | |
| | | | | 5.250%, 7/27/21 | | | 119,381 | |
| | 200,000 | | | HSBC Holdings PLC (United Kingdom), | | | | |
| | | | | 3.900%, 5/25/26 | | | 191,641 | |
| | 300,000 | | | Huntington Bancshares, Inc., | | | | |
| | | | | 4.000%, 5/15/25 | | | 301,567 | |
| | 155,000 | | | JPMorgan Chase & Co., (3M LIBOR | | | | |
| | | | | +0.730%), 3.207%, 4/23/24(A) | | | 149,753 | |
| | 145,000 | | | JPMorgan Chase & Co., | | | | |
| | | | | 3.250%, 9/23/22 | | | 143,849 | |
| | 205,000 | | | JPMorgan Chase & Co., | | | | |
| | | | | 3.509%, 1/23/29 | | | 194,115 | |
| | 216,000 | | | Lloyds Banking Group PLC (United | | | | |
| | | | | Kingdom), 3.574%, 11/7/28 | | | 192,137 | |
| | 233,000 | | | Morgan Stanley, 3.737%, 4/24/24 | | | 231,016 | |
| | 170,000 | | | Morgan Stanley, 3.950%, 4/23/27 | | | 160,275 | |
| | 155,000 | | | Northwestern Mutual Life Insurance | | | | |
| | | | | Co. (The), 144a, 3.850%, 9/30/47 | | | 140,361 | |
| | 160,000 | | | PNC Bank NA, 2.700%, 11/1/22 | | | 155,480 | |
| | 174,000 | | | Prudential Financial, Inc., | | | | |
| | | | | 5.625%, 6/15/43 | | | 170,403 | |
| | 224,000 | | | Royal Bank of Canada (Canada) MTN, | | | | |
| | | | | 3.200%, 4/30/21 | | | 223,977 | |
| | 215,000 | | | SunTrust Banks, Inc., 4.000%, 5/1/25 | | | 215,691 | |
| | | | | | | | 5,697,400 | |
| | | | | | | | | |
| | | | | Energy — 4.8% | | | | |
| | 234,000 | | | Boardwalk Pipelines LP, | | | | |
| | | | | 4.450%, 7/15/27 | | | 216,053 | |
| | 184,000 | | | Cenovus Energy, Inc. (Canada), | | | | |
| | | | | 4.250%, 4/15/27 | | | 167,591 | |
| | 196,000 | | | Cheniere Corpus Christi Holdings LLC, | | | | |
| | | | | 7.000%, 6/30/24 | | | 206,780 | |
| | 162,000 | | | Columbia Pipeline Group, Inc., | | | | |
| | | | | 4.500%, 6/1/25 | | | 163,167 | |
| | 216,000 | | | Enbridge, Inc. (Canada), (3M LIBOR | | | | |
| | | | | +0.700%), 3.488%, 6/15/20(A) | | | 215,253 | |
| | 215,000 | | | Energy Transfer Partners LP, | | | | |
| | | | | 4.950%, 6/15/28 | | | 210,359 | |
| | 141,000 | | | EOG Resources, Inc., 3.900%, 4/1/35 | | | 133,119 | |
| | 230,000 | | | Kinder Morgan Energy Partners LP, | | | | |
| | | | | 3.500%, 9/1/23 | | | 223,415 | |
| | 198,000 | | | Midcontinent Express Pipeline LLC, | | | | |
| | | | | 144a, 6.700%, 9/15/19 | | | 199,857 | |
| | 154,000 | | | Newfield Exploration Co., | | | | |
| | | | | 5.375%, 1/1/26 | | | 150,920 | |
| | 116,000 | | | NGPL PipeCo LLC, 144a, | | | | |
| | | | | 7.768%, 12/15/37 | | | 132,240 | |
| | 135,000 | | | Petroleos Mexicanos (Mexico), | | | | |
| | | | | 4.500%, 1/23/26 | | | 116,370 | |
| | 76,000 | | | Petroleos Mexicanos (Mexico), 144a, | | | | |
| | | | | 5.350%, 2/12/28 | | | 66,310 | |
| | 155,000 | | | Petroleos Mexicanos (Mexico), 144a, | | | | |
| | | | | 6.350%, 2/12/48 | | | 124,000 | |
| | 210,000 | | | Shell International Finance BV | | | | |
| | | | | (Netherlands), 1.875%, 5/10/21 | | | 204,537 | |
| | 2,200 | | | Transocean Phoenix 2 Ltd. (Cayman | | | | |
| | | | | Islands), 144a, 7.750%, 10/15/24 | | | 2,189 | |
| | 166,000 | | | Valero Energy Corp., 4.350%, 6/1/28 | | | 164,450 | |
| | | | | | | | 2,696,610 | |
| | | | | | | | | |
| | | | | Health Care — 3.9% | | | | |
| | 58,000 | | | Abbott Laboratories, | | | | |
| | | | | 3.750%, 11/30/26 | | | 57,281 | |
| | 174,000 | | | AbbVie, Inc., 4.450%, 5/14/46 | | | 152,205 | |
| | 90,000 | | | Allergan Funding SCS (Luxembourg), | | | | |
| | | | | 3.800%, 3/15/25 | | | 87,860 | |
| | 205,000 | | | Allergan Sales LLC, 144a, | | | | |
| | | | | 5.000%, 12/15/21 | | | 210,924 | |
| | 185,000 | | | Catholic Health Initiatives, | | | | |
| | | | | 4.200%, 8/1/23 | | | 187,609 | |
| | 142,000 | | | Celgene Corp., 5.000%, 8/15/45 | | | 131,305 | |
| | 164,000 | | | Cigna Corp., 144a, 4.375%, 10/15/28 | | | 164,915 | |
| | 200,000 | | | CVS Health Corp., 4.300%, 3/25/28 | | | 195,522 | |
| | 130,000 | | | CVS Health Corp., 5.125%, 7/20/45 | | | 126,543 | |
| | 160,000 | | | Express Scripts Holding Co., | | | | |
| | | | | 3.300%, 2/25/21 | | | 159,413 | |
| | 204,000 | | | Shire Acquisitions Investments Ireland | | | | |
| | | | | DAC (Ireland), 2.400%, 9/23/21 | | | 197,265 | |
Touchstone Active Bond Fund(Continued)
| Principal | | | | | Market | |
| Amount | | | | | Value | |
| | | | | | | |
| | | | | Corporate Bonds — 40.2% (Continued) | | | | |
| | | | | | | | | |
| | | | | Health Care — (Continued) | | | | |
| $ | 138,000 | | | Thermo Fisher Scientific, Inc., | | | | |
| | | | | 3.600%, 8/15/21 | | $ | 138,406 | |
| | 228,000 | | | UnitedHealth Group, Inc., | | | | |
| | | | | 2.375%, 10/15/22 | | | 221,002 | |
| | 140,000 | | | Zimmer Biomet Holdings, Inc., | | | | |
| | | | | 3.150%, 4/1/22 | | | 136,879 | |
| | | | | | | | 2,167,129 | |
| | | | | | | | | |
| | | | | Consumer Staples — 3.5% | | | | |
| | 250,000 | | | Anheuser-Busch Cos. LLC / | | | | |
| | | | | Anheuser-Busch InBev Worldwide, | | | | |
| | | | | Inc., 144a, 4.900%, 2/1/46 | | | 231,846 | |
| | 226,000 | | | Cargill, Inc., 144a, 3.050%, 4/19/21 | | | 225,776 | |
| | 186,000 | | | Conagra Brands, Inc., 4.850%, 11/1/28 | | | 182,907 | |
| | 167,000 | | | General Mills, Inc., (3M LIBOR | | | | |
| | | | | +1.010%), 3.459%, 10/17/23(A) | | | 163,120 | |
| | 200,000 | | | Grupo Bimbo SAB de CV (Mexico), | | | | |
| | | | | 144a, 4.500%, 1/25/22 | | | 203,700 | |
| | 292,000 | | | Imperial Brands Finance PLC (United | | | | |
| | | | | Kingdom), 144a, 4.250%, 7/21/25 | | | 287,206 | |
| | 130,000 | | | Kraft Heinz Foods Co., 6.875%, 1/26/39 | | | 145,045 | |
| | 208,000 | | | Moody's Corp., 2.750%, 12/15/21 | | | 203,985 | |
| | 192,000 | | | Reynolds American, Inc., | | | | |
| | | | | 4.450%, 6/12/25 | | | 185,133 | |
| | 106,000 | | | Tyson Foods, Inc., 3.900%, 9/28/23 | | | 105,852 | |
| | | | | | | | 1,934,570 | |
| | | | | | | | | |
| | | | | Consumer Discretionary — 3.4% | | | | |
| | 210,000 | | | Aptiv PLC (Jersey), 3.150%, 11/19/20 | | | 207,900 | |
| | 230,000 | | | AutoNation, Inc., 5.500%, 2/1/20 | | | 235,014 | |
| | 340,000 | | | BMW US Capital LLC, 144a, | | | | |
| | | | | 3.100%, 4/12/21 | | | 336,732 | |
| | 226,000 | | | Booking Holdings, Inc., 3.600%, 6/1/26 | | | 219,570 | |
| | 224,000 | | | Dollar Tree, Inc., (3M LIBOR +0.700%), | | | | |
| | | | | 3.149%, 4/17/20(A) | | | 222,571 | |
| | 40,000 | | | Ford Motor Co., 4.750%, 1/15/43 | | | 30,847 | |
| | 112,000 | | | Ford Motor Credit Co. LLC, | | | | |
| | | | | 4.140%, 2/15/23 | | | 106,457 | |
| | 146,000 | | | General Motors Financial Co., Inc., | | | | |
| | | | | 4.350%, 4/9/25 | | | 138,328 | |
| | 150,000 | | | Home Depot, Inc. (The), | | | | |
| | | | | 5.950%, 4/1/41 | | | 184,067 | |
| | 224,000 | | | Toyota Motor Credit Corp. MTN, | | | | |
| | | | | 2.950%, 4/13/21 | | | 224,034 | |
| | | | | | | | 1,905,520 | |
| | | | | | | | | |
| | | | | Communication Services — 3.4% | | | | |
| | 195,000 | | | Activision Blizzard, Inc., | | | | |
| | | | | 4.500%, 6/15/47 | | | 174,933 | |
| | 105,000 | | | AT&T, Inc., 3.950%, 1/15/25 | | | 102,675 | |
| | 40,000 | | | AT&T, Inc., 4.350%, 6/15/45 | | | 33,803 | |
| | 125,000 | | | AT&T, Inc., 4.500%, 5/15/35 | | | 112,225 | |
| | 124,000 | | | Charter Communications Operating | | | | |
| | | | | LLC / Charter Communications | | | | |
| | | | | Operating Capital, | | | | |
| | | | | 6.484%, 10/23/45 | | | 127,464 | |
| | 118,000 | | | Comcast Corp., 4.000%, 3/1/48 | | | 107,525 | |
| | 165,000 | | | Comcast Corp., 4.150%, 10/15/28 | | | 167,546 | |
| | 141,000 | | | Cox Communications, Inc., 144a, | | | | |
| | | | | 3.350%, 9/15/26 | | | 130,087 | |
| | 142,000 | | | Interpublic Group of Cos., Inc. (The), | | | | |
| | | | | 3.750%, 10/1/21 | | | 142,886 | |
| | 91,000 | | | Qwest Corp., 6.750%, 12/1/21 | | | 93,043 | |
| | 212,000 | | | Telecom Italia SpA/Milano (Italy), | | | | |
| | | | | 144a, 5.303%, 5/30/24 | | | 201,400 | |
| | 331,000 | | | Verizon Communications, Inc., | | | | |
| | | | | 5.012%, 4/15/49 | | | 329,809 | |
| | 153,000 | | | Warner Media LLC, 3.800%, 2/15/27 | | | 143,560 | |
| | | | | | | | 1,866,956 | |
| | | | | | | | | |
| | | | | Industrials — 2.9% | | | | |
| | 265,000 | | | Burlington Northern Santa Fe LLC, | | | | |
| | | | | 5.750%, 5/1/40 | | | 310,333 | |
| | 200,000 | | | CRH America Finance, Inc., 144a, | | | | |
| | | | | 4.500%, 4/4/48 | | | 177,774 | |
| | 226,000 | | | Eagle Materials, Inc., 4.500%, 8/1/26 | | | 224,386 | |
| | 91,000 | | | Embraer Netherlands Finance BV | | | | |
| | | | | (Netherlands), 5.050%, 6/15/25 | | | 92,025 | |
| | 93,000 | | | Embraer Netherlands Finance BV | | | | |
| | | | | (Netherlands), 5.400%, 2/1/27 | | | 96,023 | |
| | 175,000 | | | FedEx Corp., 5.100%, 1/15/44 | | | 172,281 | |
| | 2,156 | | | United Airlines 2014-2 Class B Pass | | | | |
| | | | | Through Trust, 4.625%, 9/3/22 | | | 2,144 | |
| | 150,000 | | | Vulcan Materials Co., 4.500%, 4/1/25 | | | 149,006 | |
| | 210,000 | | | Wabtec Corp., 4.700%, 9/15/28 | | | 196,950 | |
| | 200,000 | | | Westrock Co., 144a, 4.650%, 3/15/26 | | | 203,056 | |
| | | | | | | | 1,623,978 | |
| | | | | | | | | |
| | | | | Information Technology — 2.8% | | | | |
| | 235,000 | | | Apple, Inc., 2.750%, 1/13/25 | | | 226,601 | |
| | 148,000 | | | Apple, Inc., 4.650%, 2/23/46 | | | 156,664 | |
| | 205,000 | | | Dell International LLC / EMC Corp., | | | | |
| | | | | 144a, 6.020%, 6/15/26 | | | 205,927 | |
| | 175,000 | | | Hewlett Packard Enterprise Co., 144a, | | | | |
| | | | | 2.100%, 10/4/19 | | | 173,028 | |
| | 85,000 | | | Microsoft Corp., 3.500%, 2/12/35 | | | 81,124 | |
| | 210,000 | | | NXP BV / NXP Funding LLC | | | | |
| | | | | (Netherlands), 144a, 5.350%, 3/1/26 | | | 213,570 | |
| | 170,000 | | | Oracle Corp., 2.650%, 7/15/26 | | | 157,549 | |
| | 200,000 | | | QUALCOMM, Inc., 3.450%, 5/20/25 | | | 192,427 | |
| | 134,000 | | | Visa, Inc., 4.150%, 12/14/35 | | | 138,584 | |
| | | | | | | | 1,545,474 | |
| | | | | | | | | |
| | | | | Real Estate — 2.7% | | | | |
| | 208,000 | | | Boston Properties LP REIT, | | | | |
| | | | | 3.200%, 1/15/25 | | | 198,614 | |
| | 185,000 | | | Crown Castle International Corp. REIT, | | | | |
| | | | | 3.650%, 9/1/27 | | | 171,502 | |
| | 114,000 | | | Kimco Realty Corp. REIT, | | | | |
| | | | | 3.125%, 6/1/23 | | | 110,260 | |
| | 61,000 | | | Mid-America Apartments LP, REIT, | | | | |
| | | | | 3.750%, 6/15/24 | | | 60,425 | |
Touchstone Active Bond Fund(Continued)
| Principal | | | | | Market | |
| Amount | | | | | Value | |
| | | | | | | |
| | | | | Corporate Bonds — 40.2% (Continued) | | | | |
| | | | | | | | | |
| | | | | Real Estate — (Continued) | | | | |
| $ | 193,000 | | | Sabra Health Care LP REIT, | | | | |
| | | | | 5.125%, 8/15/26 | | $ | 178,867 | |
| | 205,000 | | | SL Green Operating Partnership LP | | | | |
| | | | | REIT, 3.250%, 10/15/22 | | | 198,071 | |
| | 131,000 | | | Spirit Realty LP REIT, 4.450%, 9/15/26 | | | 125,849 | |
| | 260,000 | | | VEREIT Operating Partnership LP REIT, | | | | |
| | | | | 4.600%, 2/6/24 | | | 262,860 | |
| | 184,000 | | | Welltower, Inc. REIT, 4.250%, 4/1/26 | | | 183,673 | |
| | | | | | | | 1,490,121 | |
| | | | | | | | | |
| | | | | Utilities — 1.4% | | | | |
| | 69,000 | | | DTE Energy Co., 3.700%, 8/1/23 | | | 68,517 | |
| | 200,000 | | | Electricite de France SA (France), 144a, | | | | |
| | | | | 4.500%, 9/21/28 | | | 193,847 | |
| | 128,000 | | | NextEra Energy Capital Holdings, Inc., | | | | |
| | | | | 2.800%, 1/15/23 | | | 123,524 | |
| | 150,000 | | | Oncor Electric Delivery Co. LLC, | | | | |
| | | | | 3.800%, 9/30/47 | | | 141,850 | |
| | 68,000 | | | Pacific Gas & Electric Co., 144a, | | | | |
| | | | | 4.650%, 8/1/28 | | | 62,340 | |
| | 124,000 | | | PacifiCorp., 5.750%, 4/1/37 | | | 148,028 | |
| | 82,000 | | | WEC Energy Group, Inc., (3M LIBOR | | | | |
| | | | | +2.113%), 4.729%, 5/15/67(A) | | | 66,905 | |
| | | | | | | | 805,011 | |
| | | | | | | | | |
| | | | | Materials — 1.2% | | | | |
| | 255,000 | | | DowDuPont, Inc., 4.493%, 11/15/25 | | | 262,542 | |
| | 192,000 | | | Sherwin-Williams Co. (The), | | | | |
| | | | | 4.500%, 6/1/47 | | | 173,139 | |
| | 238,000 | | | Suzano Austria GmbH (Austria), 144a, | | | | |
| | | | | 5.750%, 7/14/26 | | | 242,760 | |
| | | | | | | | 678,441 | |
| | | | | Total Corporate Bonds | | $ | 22,411,210 | |
| | | | | | | | | |
| | | | | U.S. Treasury Obligations — 29.3% | | | | |
| | 2,575,000 | | | U.S. Treasury Inflation Indexed Bonds, | | | | |
| | | | | 1.000%, 2/15/48 | | | 2,502,260 | |
| | 3,030,000 | | | U.S. Treasury Inflation Indexed Notes, | | | | |
| | | | | 0.750%, 7/15/28 | | | 2,987,648 | |
| | 1,895,000 | | | U.S. Treasury Note, 2.500%, 5/31/20 | | | 1,893,297 | |
| | 7,790,000 | | | U.S. Treasury Note, 2.500%, 3/31/23 | | | 7,790,913 | |
| | 209,000 | | | U.S. Treasury Note, 2.875%, 10/31/23 | | | 212,478 | |
| | 920,000 | | | U.S. Treasury Note, 2.875%, 8/15/28 | | | 934,231 | |
| | | | | Total U.S. Treasury Obligations | | $ | 16,320,827 | |
| | | | | | | | | |
| | | | | U.S. Government Mortgage-Backed | | | | |
| | | | | Obligations — 9.9% | | | | |
| | 19,549 | | | FHLMC, Pool #A56988, 5.500%, 2/1/37 | | | 21,068 | |
| | 118,526 | | | FHLMC, Pool #A95946, 4.000%, 1/1/41 | | | 121,956 | |
| | 90,689 | | | FHLMC, Pool #A96485, 4.500%, 1/1/41 | | | 94,956 | |
| | 28,082 | | | FHLMC, Pool #G03217, 5.500%, 9/1/37 | | | 30,090 | |
| | 14,921 | | | FHLMC, Pool #G03781, 6.000%, 1/1/38 | | | 16,283 | |
| | 62,691 | | | FHLMC, Pool #J27931, 3.500%, 4/1/29 | | | 63,620 | |
| | 302,721 | | | FHLMC, Pool #Q51274, | | | | |
| | | | | 4.000%, 10/1/47 | | | 308,768 | |
| | 6,375 | | | FNMA, Pool #561741, 7.500%, 1/1/31 | | | 7,112 | |
| | 9,003 | | | FNMA, Pool #889734, 5.500%, 6/1/37 | | | 9,691 | |
| | 11,563 | | | FNMA, Pool #984256, 5.000%, 6/1/23 | | | 11,867 | |
| | 10,150 | | | FNMA, Pool #995472, 5.000%, 11/1/23 | | | 10,385 | |
| | 65,317 | | | FNMA, Pool #AB1149, 5.000%, 6/1/40 | | | 69,335 | |
| | 61,391 | | | FNMA, Pool #AB1800, 4.000%, 11/1/40 | | | 63,125 | |
| | 101,565 | | | FNMA, Pool #AD3795, 4.500%, 4/1/40 | | | 106,383 | |
| | 142,901 | | | FNMA, Pool #AD9150, 5.000%, 8/1/40 | | | 151,692 | |
| | 198,302 | | | FNMA, Pool #AE0548, 4.500%, 11/1/40 | | | 207,683 | |
| | 157,889 | | | FNMA, Pool #AE4429, 4.000%, 10/1/40 | | | 162,302 | |
| | 12,255 | | | FNMA, Pool #AH2666, 4.000%, 1/1/26 | | | 12,552 | |
| | 21,170 | | | FNMA, Pool #AH3493, 4.000%, 2/1/26 | | | 21,697 | |
| | 263,755 | | | FNMA, Pool #AJ5457, 4.000%, 11/1/41 | | | 271,209 | |
| | 251,949 | | | FNMA, Pool #AL0054, 4.500%, 2/1/41 | | | 263,874 | |
| | 41,901 | | | FNMA, Pool #AL2663, 4.000%, 1/1/26 | | | 42,911 | |
| | 238,118 | | | FNMA, Pool #AS7813, 4.000%, 8/1/46 | | | 243,201 | |
| | 341,407 | | | FNMA, Pool #AS8552, 3.000%, 12/1/36 | | | 337,735 | |
| | 605,013 | | | FNMA, Pool #AS8855, 3.500%, 2/1/37 | | | 612,013 | |
| | 634,257 | | | FNMA, Pool #BH6180, 4.000%, 7/1/47 | | | 646,736 | |
| | 295,405 | | | FNMA, Pool #MA1175, 3.000%, 9/1/42 | | | 290,669 | |
| | 179,084 | | | FNMA, Pool #MA1543, 3.500%, 8/1/33 | | | 182,414 | |
| | 160,957 | | | FNMA, Pool #MA2177, 4.000%, 2/1/35 | | | 166,985 | |
| | 225,629 | | | GNMA, Pool #4853, 4.000%, 11/20/40 | | | 233,039 | |
| | 150,942 | | | GNMA, Pool #4883, 4.500%, 12/20/40 | | | 158,466 | |
| | 65,319 | | | GNMA, Pool #736696, 4.500%, 5/15/40 | | | 68,055 | |
| | 306,484 | | | GNMA, Pool #AD1745, | | | | |
| | | | | 3.000%, 2/20/43 | | | 302,548 | |
| | 227,987 | | | GNMA, Pool #MA1157, | | | | |
| | | | | 3.500%, 7/20/43 | | | 230,583 | |
| | | | | Total U.S. Government | | | | |
| | | | | Mortgage-Backed Obligations | | $ | 5,541,003 | |
| | | | | | | �� | | |
| | Shares | | | | | | | |
| | | | | | | | | |
| | | | | Exchange-Traded Fund — 4.7% | | | | |
| | 25,384 | | | iShares JP Morgan USD Emerging | | | | |
| | | | | Markets Bond ETF | | $ | 2,637,651 | |
| | | | | | | | | |
| | Principal | | | | | | | |
| | Amount | | | | | | | |
| | | | | | | | | |
| | | | | Asset-Backed Securities — 4.4% | | | | |
| $ | 249,353 | | | CWHEQ Home Equity Loan Trust, Ser | | | | |
| | | | | 2007-S1, Class A5, | | | | |
| | | | | 6.018%, 11/25/36(A)(B) | | | 246,806 | |
| | 241,866 | | | Elara HGV Timeshare Issuer LLC, Ser | | | | |
| | | | | 2017-A, Class A, 144a, | | | | |
| | | | | 2.690%, 3/25/30 | | | 239,049 | |
| | 261,688 | | | Jimmy Johns Funding LLC, Ser | | | | |
| | | | | 2017-1A, Class A2I, 144a, | | | | |
| | | | | 3.610%, 7/30/47 | | | 260,947 | |
| | 246,875 | | | Jimmy Johns Funding LLC, Ser | | | | |
| | | | | 2017-1A, Class A2II, 144a, | | | | |
| | | | | 4.846%, 7/30/47 | | | 250,015 | |
| | 155,000 | | | SBA Tower Trust, 144a, | | | | |
| | | | | 2.898%, 10/15/44(A)(B) | | | 154,086 | |
Touchstone Active Bond Fund(Continued)
| Principal | | | | | Market | |
| Amount | | | | | Value | |
| | | | | | | |
| | | | | Asset-Backed Securities — 4.4% (Continued) | | | | |
| $ | 140,645 | | | Sonic Capital LLC, Ser 2016-1A, Class | | | | |
| | | | | A2, 144a, 4.472%, 5/20/46 | | $ | 142,700 | |
| | 94,838 | | | SpringCastle America Funding LLC, | | | | |
| | | | | Ser 2016-AA, Class A, 144a, | | | | |
| | | | | 3.050%, 4/25/29 | | | 93,921 | |
| | 325,000 | | | Towd Point Mortgage Trust, Ser | | | | |
| | | | | 2015-3, Class A2, 144a, | | | | |
| | | | | 4.000%, 3/25/54(A)(B) | | | 329,738 | |
| | 380,000 | | | Voya CLO Ltd. (Cayman Islands), Ser | | | | |
| | | | | 2017-4A, Class A1, 144a, (3M LIBOR | | | | |
| | | | | +1.130%), 3.566%, 10/15/30(A) | | | 373,380 | |
| | 396,000 | | | Wendys Funding LLC, Ser 2018-1A, | | | | |
| | | | | Class A2I, 144a, 3.573%, 3/15/48 | | | 379,503 | |
| | | | | Total Asset-Backed Securities | | $ | 2,470,145 | |
| | | | | | | | | |
| | | | | Non-Agency Collateralized Mortgage | | | | |
| | | | | Obligations — 3.3% | | | | |
| | 243,580 | | | CSMC Trust, Ser 2018-RPL9, Class A, | | | | |
| | | | | 144a, 3.850%, 9/25/57(A)(B) | | | 246,540 | |
| | 4,268 | | | Deutsche ALT-A Securities, Inc. | | | | |
| | | | | Alternate Loan Trust, Ser 2003-2XS, | | | | |
| | | | | Class A6, 5.470%, 9/25/33(A)(B) | | | 4,284 | |
| | 431,181 | | | EverBank Mortgage Loan Trust, Ser | | | | |
| | | | | 2013-1, Class B1, 144a, | | | | |
| | | | | 3.494%, 3/25/43(A)(B) | | | 429,524 | |
| | 144,064 | | | PMT Loan Trust, Ser 2013-J1, Class A11, | | | | |
| | | | | 144a, 3.500%, 9/25/43(A)(B) | | | 142,532 | |
| | 97,994 | | | Residential Asset Securitization Trust, | | | | |
| | | | | Ser 2006-A1, Class 1A3, | | | | |
| | | | | 6.000%, 4/25/36 | | | 72,148 | |
| | 264,479 | | | Sequoia Mortgage Trust, Ser 2013-1, | | | | |
| | | | | Class B1, 3.647%, 2/25/43(A)(B) | | | 265,241 | |
| | 245,150 | | | Sequoia Mortgage Trust, Ser 2013-10, | | | | |
| | | | | Class B2, 144a, 3.560%, 8/25/43(A)(B) | | | 244,310 | |
| | 341,215 | | | Sequoia Mortgage Trust, Ser 2013-5, | | | | |
| | | | | Class B1, 144a, 3.508%, 5/25/43(A)(B) | | | 342,474 | |
| | 67,508 | | | Structured Asset Securities Corp. Trust, | | | | |
| | | | | Ser 2005-17, Class 5A1, | | | | |
| | | | | 5.500%, 10/25/35 | | | 51,606 | |
| | 46,004 | | | Washington Mutual Alternative | | | | |
| | | | | Mortgage Pass-Through | | | | |
| | | | | Certificates, Ser 2005-9, Class 2A4, | | | | |
| | | | | 5.500%, 11/25/35 | | | 42,135 | |
| | | | | Total Non-Agency Collateralized | | | | |
| | | | | Mortgage Obligations | | $ | 1,840,794 | |
| | | | | | | | | |
| | | | | Agency Collateralized Mortgage | | | | |
| | | | | Obligations — 2.4% | | | | |
| | 325,000 | | | FHLMC REMIC, Ser 4092, Class AY, | | | | |
| | | | | 3.000%, 8/15/32 | | | 313,686 | |
| | 89,969 | | | FNMA REMIC, Ser 2015-51, Class KC, | | | | |
| | | | | 3.000%, 6/25/45 | | | 89,473 | |
| | 228,000 | | | FNMA REMIC, Ser 2016-102, Class AY, | | | | |
| | | | | 3.000%, 1/25/37 | | | 219,433 | |
| | 160,000 | | | FNMA REMIC, Ser 2017-83, Class DL, | | | | |
| | | | | 3.000%, 10/25/37 | | | 153,838 | |
| | 554,445 | | | FNMA REMIC, Ser 2017-90, Class KA, | | | | |
| | | | | 3.000%, 11/25/47 | | | 556,288 | |
| | | | | Total Agency Collateralized | | | | |
| | | | | Mortgage Obligations | | $ | 1,332,718 | |
| | | | | | | | | |
| | | | | Sovereign Bonds — 1.2% | | | | |
| | 200,000 | | | Mexico Government International | | | | |
| | | | | Bond, 4.350%, 1/15/47 | | | 171,400 | |
| | 220,000 | | | Province of Alberta Canada, 2.200%, | | | | |
| | | | | 7/26/22 | | | 215,073 | |
| | 208,000 | | | Province of Ontario Canada, 1.875%, | | | | |
| | | | | 5/21/20 | | | 205,638 | |
| | 73,000 | | | Uruguay Government International | | | | |
| | | | | Bond, 4.975%, 4/20/55 | | | 69,424 | |
| | | | | Total Sovereign Bonds | | $ | 661,535 | |
| | | | | | | | | |
| | | | | Commercial Mortgage-Backed Securities — 1.3% | | | | |
| | 360,000 | | | DBUBS Mortgage Trust, Ser | | | | |
| | | | | 2017-BRBK, Class B, 144a, | | | | |
| | | | | 3.530%, 10/10/34(A)(B) | | | 353,191 | |
| | 375,000 | | | GS Mortgage Securities Corp. II, Ser | | | | |
| | | | | 2017-SLP, Class B, 144a, | | | | |
| | | | | 3.772%, 10/10/32 | | | 377,573 | |
| | | | | Total Commercial | | | | |
| | | | | Mortgage-Backed Securities | | $ | 730,764 | |
| | | | | | | | | |
| | | | | Municipal Bond — 0.6% | | | | |
| | | | | | | | | |
| | | | | New York — 0.6% | | | | |
| | 320,000 | | | NY Housing Development Corp., Ref 8 | | | | |
| | | | | Spruce Street Class B, | | | | |
| | | | | 3.864%, 2/15/48(A)(B) | | $ | 320,816 | |
| | | | | | | | | |
| | Shares | | | | | | | |
| | | | | | | | | |
| | | | | Preferred Stock — 0.4% | | | | |
| | | | | | | | | |
| | | | | Utilities — 0.4% | | | | |
| | 8,129 | | | Integrys Holding, Inc., 6.000%, 8/1/73 | | $ | 192,251 | |
| | | | | | | | | |
| | | | | Short-Term Investment Fund — 1.4% | | | | |
| | 760,743 | | | Dreyfus Government Cash | | | | |
| | | | | Management, Institutional Shares, | | | | |
| | | | | 2.29%∞Ω | | $ | 760,743 | |
| | | | | | | | | |
| | | | | Total Investment Securities —99.1% | | | | |
| | | | | (Cost $55,948,145) | | $ | 55,220,457 | |
| | | | | | | | | |
| | | | | Other Assets in | | | | |
| | | | | Excess of Liabilities — 0.9% | | | 528,294 | |
| | | | | Net Assets — 100.0% | | $ | 55,748,751 | |
Touchstone Active Bond Fund(Continued)
| (A) | Variable rate security - Rate reflected is the rate in effect as of December 31, 2018. |
| (B) | Certain variable rate securities are not based on a published reference rate and spread but are determined by the issuer or agent and are based on current market conditions. These securities do not indicate a reference rate and spread in their description. |
| Ω | Represents the 7-day SEC yield as of December 31, 2018. |
Portfolio Abbreviations:
CLO - Collateralized Loan Obligation
DAC - Designated Activity Company
ETF - Exchange-Traded Fund
FHLMC - Federal Home Loan Mortgage Corporation
FNMA - Federal National Mortgage Association
GNMA - Government National Mortgage Association
LIBOR - London Interbank Offered Rate
LLC - Limited Liability Company
LP - Limited Partnership
MTN -Medium Term Note
PLC - Public Limited Company
REIT - Real Estate Investment Trust
REMIC - Real Estate Mortgage Investment Conduit
USD - United States Dollar
144a - This is a restricted security that was sold in a transaction qualifying for the exemption under Rule 144a of the Securities Act of 1933. This security may be sold in transactions exempt from registration, normally to qualified institutional buyers. At December 31, 2018, these securities were valued at $8,489,328 or 15.2% of net assets. These securities were deemed liquid pursuant to procedures approved by the Board of Trustees.
Other Information:
The inputs or methodology used for valuing securities may not be an indication of the risk associated with investing in those securities. For more information on valuation inputs, and their aggregation into the levels used in the table below, please refer to the security valuation section in the accompanying Notes to Financial Statements.
| | | Valuation inputs at Reporting Date: | |
| Description | | Level 1 | | | Level 2 | | | Level 3 | | | Total | |
| Assets: | | | | | | | | | | | | | | | | |
| Corporate Bonds | | $ | — | | | $ | 22,411,210 | | | $ | — | | | $ | 22,411,210 | |
| U.S. Treasury Obligations | | | — | | | | 16,320,827 | | | | — | | | | 16,320,827 | |
| U.S. Government Mortgage-Backed Obligations | | | — | | | | 5,541,003 | | | | — | | | | 5,541,003 | |
| Exchange-Traded Fund | | | 2,637,651 | | | | — | | | | — | | | | 2,637,651 | |
| Asset-Backed Securities | | | — | | | | 2,470,145 | | | | — | | | | 2,470,145 | |
| Non-Agency Collateralized Mortgage Obligations | | | — | | | | 1,840,794 | | | | — | | | | 1,840,794 | |
| Agency Collateralized Mortgage Obligations | | | — | | | | 1,332,718 | | | | — | | | | 1,332,718 | |
| Sovereign Bonds | | | — | | | | 661,535 | | | | — | | | | 661,535 | |
| Commercial Mortgage-Backed Securities | | | — | | | | 730,764 | | | | — | | | | 730,764 | |
| Municipal Bond | | | — | | | | 320,816 | | | | — | | | | 320,816 | |
| Preferred Stock | | | 192,251 | | | | — | | | | — | | | | 192,251 | |
| Short-Term Investment Fund | | | 760,743 | | | | — | | | | — | | | | 760,743 | |
| Other Financial Instruments* | | | | | | | | | | | | | | | | |
| Futures Interest Rate Contracts | | | 84,911 | | | | — | | | | — | | | | 84,911 | |
| Total Assets | | $ | 3,675,556 | | | $ | 51,629,812 | | | $ | — | | | $ | 55,305,368 | |
Touchstone Active Bond Fund(Continued)
| | | Valuation inputs at Reporting Date: | |
| Description | | Level 1 | | | Level 2 | | | Level 3 | | | Total | |
| Liabilities: | | | | | | | | | | | | | | | | |
| Other Financial Instruments* | | | | | | | | | | | | | | | | |
| Futures Interest Rate Contracts | | $ | 98,331 | | | $ | — | | | $ | — | | | $ | 98,331 | |
| Total | | $ | 3,577,225 | | | $ | 51,629,812 | | | $ | — | | | $ | 55,207,037 | |
*Other Financial Instruments are derivative instruments not reflected in total investments. Amounts shown represent unrealized appreciation (depreciation) on futures contracts.
Futures Contracts
At December 31, 2018, $18,889 was segregated with the broker as collateral for futures contracts. The Fund had the following futures contracts, brokered by Wells Fargo, open at December 31, 2018:
| | | | | | | | | | | Value and | |
| | | | | | | | | | | Unrealized | |
| | | Expiration | | | | | Notional | | | Appreciation/ | |
| Description | | Date | | Number of Contracts | | | Amount | | | (Depreciation) | |
| Short Futures: | | | | | | | | | | | | | | |
| 5-Year US Note Futures | | 4/3/2019 | | | 60 | | | $ | 6,782,813 | | | $ | (98,331 | ) |
| Long Futures: | | | | | | | | | | | | | | |
| 2-Year US Note Futures | | 4/3/2019 | | | 67 | | | $ | 14,140,141 | | | | 84,911 | |
| | | | | | | | | | | | | $ | (13,420 | ) |
See accompanying Notes to Financial Statements.
Portfolio of Investments
Touchstone Balanced Fund – December 31, 2018
| | | | | | Market | |
| Shares | | | | | Value | |
| | | | | | | |
| | | | | Common Stocks — 65.0% | | | | |
| | | | | | | | | |
| | | | | Information Technology — 12.6% | | | | |
| | 5,567 | | | Microsoft Corp. | | $ | 565,440 | |
| | 2,869 | | | Apple, Inc. | | | 452,556 | |
| | 2,731 | | | salesforce.com, Inc.* | | | 374,065 | |
| | 7,181 | | | Oracle Corp. | | | 324,222 | |
| | 4,292 | | | Avnet, Inc. | | | 154,941 | |
| | 1,250 | | | International Business Machines Corp. | | | 142,088 | |
| | | | | | | | 2,013,312 | |
| | | | | | | | | |
| | | | | Financials — 11.3% | | | | |
| | 5,011 | | | Berkshire Hathaway, Inc. - Class B* | | | 1,023,146 | |
| | 6,193 | | | Brookfield Asset Management, Inc. | | | | |
| | | | | (Canada) - Class A | | | 237,502 | |
| | 8,450 | | | Bank of America Corp. | | | 208,208 | |
| | 1,128 | | | Goldman Sachs Group, Inc. (The) | | | 188,432 | |
| | 1,435 | | | Signature Bank/NewYork NY | | | 147,532 | |
| | | | | | | | 1,804,820 | |
| | | | | | | | | |
| | | | | Communication Services — 10.6% | | | | |
| | 458 | | | Alphabet, Inc. - Class C* | | | 474,309 | |
| | 2,486 | | | Facebook, Inc. - Class A* | | | 325,890 | |
| | 6,749 | | | Twenty-First Century Fox, Inc. - Class A | | | 324,762 | |
| | 6,110 | | | Comcast Corp. - Class A | | | 208,046 | |
| | 6,447 | | | AT&T, Inc. | | | 183,997 | |
| | 594 | | | Charter Communications, Inc. - Class A* | | | 169,272 | |
| | | | | | | | 1,686,276 | |
| | | | | | | | | |
| | | | | Consumer Discretionary — 9.0% | | | | |
| | 422 | | | Amazon.com, Inc.* | | | 633,831 | |
| | 3,518 | | | Starbucks Corp. | | | 226,559 | |
| | 3,744 | | | Carnival Corp. | | | 184,579 | |
| | 90 | | | Booking Holdings, Inc.* | | | 155,018 | |
| | 4,257 | | | Yum China Holdings, Inc. (China) | | | 142,737 | |
| | 4,760 | | | JD.com, Inc. (China) ADR* | | | 99,627 | |
| | | | | | | | 1,442,351 | |
| | | | | | | | | |
| | | | | Health Care — 8.7% | | | | |
| | 4,311 | | | Novartis AG (Switzerland) ADR | | | 369,927 | |
| | 2,248 | | | Johnson & Johnson | | | 290,104 | |
| | 890 | | | Biogen, Inc.* | | | 267,819 | |
| | 4,994 | | | Bristol-Myers Squibb Co. | | | 259,588 | |
| | 2,668 | | | AmerisourceBergen Corp. | | | 198,499 | |
| | | | | | | | 1,385,937 | |
| | | | | | | | | |
| | | | | Industrials — 4.9% | | | | |
| | 2,069 | | | United Technologies Corp. | | | 220,307 | |
| | 1,543 | | | Union Pacific Corp. | | | 213,289 | |
| | 4,569 | | | Johnson Controls International PLC | | | 135,471 | |
| | 2,887 | | | Stericycle, Inc.* | | | 105,924 | |
| | 13,578 | | | General Electric Co. | | | 102,785 | |
| | | | | | | | 777,776 | |
| | | | | | | | | |
| | | | | Real Estate — 2.9% | | | | |
| | 1,574 | | | Simon Property Group, Inc. REIT | | | 264,416 | |
| | 1,571 | | | Jones Lang LaSalle, Inc. REIT | | | 198,889 | |
| | | | | | | | 463,305 | |
| | | | | | | | | |
| | | | | Consumer Staples — 2.7% | | | | |
| | 3,839 | | | Unilever NV (United Kingdom) | | | 206,538 | |
| | 2,761 | | | Monster Beverage Corp.* | | | 135,896 | |
| | 914 | | | JM Smucker Co. (The) | | | 85,450 | |
| | | | | | | | 427,884 | |
| | | | | | | | | |
| | | | | Energy — 2.3% | | | | |
| | 2,491 | | | Exxon Mobil Corp. | | | 169,861 | |
| | 3,317 | | | Schlumberger Ltd. | | | 119,677 | |
| | 3,229 | | | Halliburton Co. | | | 85,827 | |
| | | | | | | | 375,365 | |
| | | | | Total Common Stocks | | $ | 10,377,026 | |
| | Principal | | | | | | | |
| | Amount | | | | | | | |
| | | | | | | | | |
| | | | | Corporate Bonds — 13.6% | | | | |
| | | | | | | | | |
| | | | | Financials — 3.0% | | | | |
| $ | 3,000 | | | Allstate Corp. (The), Ser B, | | | | |
| | | | | 5.750%, 8/15/53 | | | 2,925 | |
| | 24,000 | | | American Express Co., | | | | |
| | | | | 3.000%, 10/30/24 | | | 22,967 | |
| | 50,000 | | | Bank of America Corp. MTN, | | | | |
| | | | | 4.000%, 1/22/25 | | | 48,707 | |
| | 24,000 | | | Bank of Montreal (Canada), | | | | |
| | | | | 3.803%, 12/15/32 | | | 22,224 | |
| | 24,000 | | | Bank of New York Mellon Corp. (The) | | | | |
| | | | | MTN, 2.950%, 1/29/23 | | | 23,622 | |
| | 22,000 | | | BB&T Corp. MTN, 2.850%, 10/26/24 | | | 21,137 | |
| | 18,000 | | | Citigroup, Inc., 3.300%, 4/27/25 | | | 17,094 | |
| | 11,000 | | | Citigroup, Inc., 4.750%, 5/18/46 | | | 10,169 | |
| | 18,000 | | | Fifth Third Bancorp, 2.875%, 7/27/20 | | | 17,896 | |
| | 20,000 | | | Goldman Sachs Group, Inc. (The), (3M | | | | |
| | | | | LIBOR +1.000%), 3.487%, 7/24/23(A) | | | 19,434 | |
| | 32,000 | | | Goldman Sachs Group, Inc. (The), | | | | |
| | | | | 3.691%, 6/5/28 | | | 29,740 | |
| | 32,000 | | | Huntington Bancshares, Inc./OH, | | | | |
| | | | | 4.000%, 5/15/25 | | | 32,167 | |
| | 10,000 | | | JPMorgan Chase & Co., (3M LIBOR | | | | |
| | | | | +0.730%), 3.207%, 4/23/24(A) | | | 9,661 | |
| | 15,000 | | | JPMorgan Chase & Co., | | | | |
| | | | | 3.250%, 9/23/22 | | | 14,881 | |
| | 25,000 | | | JPMorgan Chase & Co., | | | | |
| | | | | 3.509%, 1/23/29 | | | 23,673 | |
| | 17,000 | | | Morgan Stanley, 3.737%, 4/24/24 | | | 16,855 | |
| | 25,000 | | | Morgan Stanley, 3.950%, 4/23/27 | | | 23,570 | |
| | 18,000 | | | Northwestern Mutual Life Insurance | | | | |
| | | | | Co. (The), 144a, 3.850%, 9/30/47 | | | 16,300 | |
| | 17,000 | | | Prudential Financial, Inc., | | | | |
| | | | | 5.625%, 6/15/43 | | | 16,649 | |
| | 24,000 | | | Royal Bank of Canada (Canada) MTN, | | | | |
| | | | | 3.200%, 4/30/21 | | | 23,998 | |
| | 20,000 | | | SunTrust Banks, Inc., 4.000%, 5/1/25 | | | 20,064 | |
| | 17,000 | | | Visa, Inc., 4.150%, 12/14/35 | | | 17,582 | |
| | 30,000 | | | Wells Fargo & Co., 4.125%, 8/15/23 | | | 30,177 | |
| | | | | | | | 481,492 | |
Touchstone Balanced Fund (Continued)
| Principal | | | | | Market | |
| Amount | | | | | Value | |
| | | | | | | |
| | | | | Corporate Bonds — 13.6% (Continued) | | | | |
| | | | | | | | | |
| | | | | Energy — 1.8% | | | | |
| $ | 23,000 | | | Boardwalk Pipelines LP, | | | | |
| | | | | 4.450%, 7/15/27 | | $ | 21,236 | |
| | 17,000 | | | Cenovus Energy, Inc. (Canada), | | | | |
| | | | | 4.250%, 4/15/27 | | | 15,484 | |
| | 16,000 | | | Columbia Pipeline Group, Inc., | | | | |
| | | | | 4.500%, 6/1/25 | | | 16,115 | |
| | 24,000 | | | Enbridge, Inc. (Canada), (3M LIBOR | | | | |
| | | | | +0.700%), 3.488%, 6/15/20(A) | | | 23,917 | |
| | 21,000 | | | Energy Transfer Partners LP, | | | | |
| | | | | 4.950%, 6/15/28 | | | 20,547 | |
| | 14,000 | | | EOG Resources, Inc., 3.900%, 4/1/35 | | | 13,218 | |
| | 25,000 | | | Kinder Morgan Energy Partners LP, | | | | |
| | | | | 3.500%, 9/1/23 | | | 24,284 | |
| | 23,000 | | | Midcontinent Express Pipeline LLC, | | | | |
| | | | | 144a, 6.700%, 9/15/19 | | | 23,216 | |
| | 16,000 | | | Newfield Exploration Co., | | | | |
| | | | | 5.375%, 1/1/26 | | | 15,680 | |
| | 20,000 | | | NGPL PipeCo LLC, 144a, | | | | |
| | | | | 7.768%, 12/15/37 | | | 22,800 | |
| | 17,000 | | | Petroleos Mexicanos (Mexico), | | | | |
| | | | | 4.500%, 1/23/26 | | | 14,654 | |
| | 5,000 | | | Petroleos Mexicanos (Mexico), | | | | |
| | | | | 5.350%, 2/12/28 | | | 4,363 | |
| | 15,000 | | | Petroleos Mexicanos (Mexico), | | | | |
| | | | | 6.350%, 2/12/48 | | | 12,000 | |
| | 20,000 | | | Sabine Pass Liquefaction LLC, | | | | |
| | | | | 5.000%, 3/15/27 | | | 20,067 | |
| | 20,000 | | | Shell International Finance BV | | | | |
| | | | | (Netherlands), 1.875%, 5/10/21 | | | 19,480 | |
| | 16,000 | | | Valero Energy Corp., 4.350%, 6/1/28 | | | 15,851 | |
| | | | | | | | 282,912 | |
| | | | | | | | | |
| | | | | Consumer Discretionary — 1.4% | | | | |
| | 22,000 | | | Aptiv PLC (Jersey), 3.150%, 11/19/20 | | | 21,780 | |
| | 20,000 | | | AutoNation, Inc., 5.500%, 2/1/20 | | | 20,436 | |
| | 36,000 | | | BMW US Capital LLC, 144a, | | | | |
| | | | | 3.100%, 4/12/21 | | | 35,654 | |
| | 24,000 | | | Booking Holdings, Inc., 3.600%, 6/1/26 | | | 23,317 | |
| | 24,000 | | | Dollar Tree, Inc., (3M LIBOR +0.700%), | | | | |
| | | | | 3.149%, 4/17/20(A) | | | 23,847 | |
| | 7,000 | | | Ford Motor Co., 4.750%, 1/15/43 | | | 5,398 | |
| | 12,000 | | | Ford Motor Credit Co. LLC, | | | | |
| | | | | 4.140%, 2/15/23 | | | 11,406 | |
| | 32,000 | | | General Motors Financial Co., Inc., | | | | |
| | | | | 3.950%, 4/13/24 | | | 30,391 | |
| | 9,000 | | | General Motors Financial Co., Inc., | | | | |
| | | | | 4.350%, 4/9/25 | | | 8,527 | |
| | 20,000 | | | Home Depot, Inc. (The), | | | | |
| | | | | 5.950%, 4/1/41 | | | 24,542 | |
| | 24,000 | | | Toyota Motor Credit Corp. MTN, | | | | |
| | | | | 2.950%, 4/13/21 | | | 24,004 | |
| | | | | | | | 229,302 | |
| | | | | | | | | |
| | | | | Health Care — 1.4% | | | | |
| | 7,000 | | | Abbott Laboratories, | | | | |
| | | | | 3.750%, 11/30/26 | | | 6,913 | |
| | 20,000 | | | AbbVie, Inc., 4.450%, 5/14/46 | | | 17,495 | |
| | 15,000 | | | Allergan Funding SCS (Luxembourg), | | | | |
| | | | | 3.800%, 3/15/25 | | | 14,643 | |
| | 18,000 | | | Allergan Sales LLC, 144a, | | | | |
| | | | | 5.000%, 12/15/21 | | | 18,520 | |
| | 17,000 | | | Celgene Corp., 5.000%, 8/15/45 | | | 15,720 | |
| | 16,000 | | | Cigna Corp., 144a, 4.375%, 10/15/28 | | | 16,089 | |
| | 23,000 | | | CVS Health Corp., 4.300%, 3/25/28 | | | 22,485 | |
| | 13,000 | | | CVS Health Corp., 5.125%, 7/20/45 | | | 12,654 | |
| | 17,000 | | | Express Scripts Holding Co., | | | | |
| | | | | 3.300%, 2/25/21 | | | 16,938 | |
| | 30,000 | | | Johnson & Johnson, 2.900%, 1/15/28 | | | 28,753 | |
| | 14,000 | | | Thermo Fisher Scientific, Inc., | | | | |
| | | | | 3.600%, 8/15/21 | | | 14,041 | |
| | 24,000 | | | UnitedHealth Group, Inc., | | | | |
| | | | | 2.375%, 10/15/22 | | | 23,263 | |
| | 15,000 | | | Zimmer Biomet Holdings, Inc., | | | | |
| | | | | 3.150%, 4/1/22 | | | 14,666 | |
| | | | | | | | 222,180 | |
| | | | | | | | | |
| | | | | Information Technology — 1.2% | | | | |
| | 75,000 | | | Apple, Inc., 2.750%, 1/13/25 | | | 72,319 | |
| | 24,000 | | | Apple, Inc., 4.650%, 2/23/46 | | | 25,405 | |
| | 21,000 | | | Dell International LLC / EMC Corp., | | | | |
| | | | | 144a, 6.020%, 6/15/26 | | | 21,095 | |
| | 11,000 | | | Microsoft Corp., 3.500%, 2/12/35 | | | 10,498 | |
| | 20,000 | | | NXP BV / NXP Funding LLC | | | | |
| | | | | (Netherlands), 144a, 5.350%, 3/1/26 | | | 20,340 | |
| | 20,000 | | | Oracle Corp., 2.650%, 7/15/26 | | | 18,535 | |
| | 18,000 | | | QUALCOMM, Inc., 3.450%, 5/20/25 | | | 17,318 | |
| | | | | | | | 185,510 | |
| | | | | | | | | |
| | | | | Real Estate — 1.0% | | | | |
| | 24,000 | | | Boston Properties LP REIT, | | | | |
| | | | | 3.200%, 1/15/25 | | | 22,917 | |
| | 22,000 | | | Crown Castle International Corp., | | | | |
| | | | | 3.650%, 9/1/27 | | | 20,395 | |
| | 12,000 | | | Kimco Realty Corp. REIT, | | | | |
| | | | | 3.125%, 6/1/23 | | | 11,606 | |
| | 15,000 | | | Mid-America Apartments LP, | | | | |
| | | | | 3.750%, 6/15/24 | | | 14,859 | |
| | 17,000 | | | Sabra Health Care LP REIT, | | | | |
| | | | | 5.125%, 8/15/26 | | | 15,755 | |
| | 25,000 | | | SL Green Operating Partnership LP, | | | | |
| | | | | 3.250%, 10/15/22 | | | 24,155 | |
| | 14,000 | | | Spirit Realty LP REIT, 4.450%, 9/15/26 | | | 13,450 | |
| | 27,000 | | | VEREIT Operating Partnership LP REIT, | | | | |
| | | | | 4.600%, 2/6/24 | | | 27,297 | |
| | 16,000 | | | Welltower, Inc. REIT, 4.250%, 4/1/26 | | | 15,972 | |
| | | | | | | | 166,406 | |
| | | | | | | | | |
| | | | | Communication Services — 1.0% | | | | |
| | 20,000 | | | Activision Blizzard, Inc., | | | | |
| | | | | 4.500%, 6/15/47 | | | 17,942 | |
Touchstone Balanced Fund (Continued)
| Principal | | | | | Market | |
| Amount | | | | | Value | |
| | | | | | | |
| | | | | Corporate Bonds — 13.6% (Continued) | | | | |
| | | | | | | | | |
| | | | | Communication Services — (Continued) | | | | |
| $ | 20,000 | | | AT&T, Inc., 4.350%, 6/15/45 | | $ | 16,901 | |
| | 21,000 | | | Charter Communications Operating | | | | |
| | | | | LLC / Charter Communications | | | | |
| | | | | Operating Capital, | | | | |
| | | | | 6.484%, 10/23/45 | | | 21,587 | |
| | 14,000 | | | Comcast Corp., 4.000%, 3/1/48 | | | 12,757 | |
| | 15,000 | | | Comcast Corp., 4.150%, 10/15/28 | | | 15,232 | |
| | 14,000 | | | Cox Communications, Inc., 144a, | | | | |
| | | | | 3.350%, 9/15/26 | | | 12,916 | |
| | 15,000 | | | Interpublic Group of Cos., Inc. (The), | | | | |
| | | | | 3.750%, 10/1/21 | | | 15,094 | |
| | 13,000 | | | Qwest Corp., 6.750%, 12/1/21 | | | 13,292 | |
| | 25,000 | | | Verizon Communications, Inc., | | | | |
| | | | | 5.012%, 4/15/49 | | | 24,910 | |
| | 15,000 | | | Warner Media LLC, 3.800%, 2/15/27 | | | 14,075 | |
| | | | | | | | 164,706 | |
| | | | | | | | | |
| | | | | Industrials — 1.0% | | | | |
| | 25,000 | | | Burlington Northern Santa Fe LLC, | | | | |
| | | | | 5.750%, 5/1/40 | | | 29,277 | |
| | 23,000 | | | Eagle Materials, Inc., 4.500%, 8/1/26 | | | 22,836 | |
| | 12,000 | | | Embraer Netherlands Finance BV | | | | |
| | | | | (Netherlands), 5.050%, 6/15/25 | | | 12,135 | |
| | 7,000 | | | Embraer Netherlands Finance BV | | | | |
| | | | | (Netherlands), 5.400%, 2/1/27 | | | 7,228 | |
| | 16,000 | | | FedEx Corp., 5.100%, 1/15/44 | | | 15,751 | |
| | 28,000 | | | General Electric Co., 4.125%, 10/9/42 | | | 21,878 | |
| | 25,000 | | | Wabtec Corp., 4.700%, 9/15/28 | | | 23,446 | |
| | 20,000 | | | Westrock Co., 144a, 4.650%, 3/15/26 | | | 20,306 | |
| | | | | | | | 152,857 | |
| | | | | | | | | |
| | | | | Consumer Staples — 0.9% | | | | |
| | 26,000 | | | Anheuser-Busch Cos. LLC / | | | | |
| | | | | Anheuser-Busch InBev Worldwide, | | | | |
| | | | | Inc., 144a, 4.900%, 2/1/46 | | | 24,112 | |
| | 24,000 | | | Cargill, Inc., 144a, 3.050%, 4/19/21 | | | 23,976 | |
| | 20,000 | | | Conagra Brands, Inc., 4.850%, 11/1/28 | | | 19,667 | |
| | 16,000 | | | General Mills, Inc., (3M LIBOR | | | | |
| | | | | +1.010%), 3.459%, 10/17/23(A) | | | 15,628 | |
| | 15,000 | | | Kraft Heinz Foods Co., 6.875%, 1/26/39 | | | 16,736 | |
| | 8,000 | | | Kroger Co. (The), 5.000%, 4/15/42 | | | 7,615 | |
| | 6,000 | | | Moody's Corp., 2.750%, 12/15/21 | | | 5,884 | |
| | 20,000 | | | Reynolds American, Inc., | | | | |
| | | | | 4.450%, 6/12/25 | | | 19,285 | |
| | 10,000 | | | Tyson Foods, Inc., 3.900%, 9/28/23 | | | 9,986 | |
| | | | | | | | 142,889 | |
| | | | | | | | | |
| | | | | Utilities — 0.7% | | | | |
| | 15,000 | | | Duke Energy Progress LLC, | | | | |
| | | | | 4.150%, 12/1/44 | | | 14,562 | |
| | 17,000 | | | Fortis, Inc. (Canada), 3.055%, 10/4/26 | | | 15,519 | |
| | 14,000 | | | NextEra Energy Capital Holdings, Inc., | | | | |
| | | | | 2.800%, 1/15/23 | | | 13,510 | |
| | 16,000 | | | Oncor Electric Delivery Co. LLC, | | | | |
| | | | | 3.800%, 9/30/47 | | | 15,131 | |
| | 7,000 | | | Pacific Gas & Electric Co., 144a, | | | | |
| | | | | 4.650%, 8/1/28 | | | 6,417 | |
| | 27,000 | | | PacifiCorp., 5.750%, 4/1/37 | | | 32,232 | |
| | 8,000 | | | WEC Energy Group, Inc., (3M LIBOR | | | | |
| | | | | +2.113%), 4.729%, 5/15/67(A) | | | 6,527 | |
| | | | | | | | 103,898 | |
| | | | | | | | | |
| | | | | Materials — 0.2% | | | | |
| | 22,000 | | | DowDuPont, Inc., 4.493%, 11/15/25 | | | 22,651 | |
| | 19,000 | | | Sherwin-Williams Co. (The), | | | | |
| | | | | 4.500%, 6/1/47 | | | 17,134 | |
| | | | | | | | 39,785 | |
| | | | | Total Corporate Bonds | | $ | 2,171,937 | |
| | | | | | | | | |
| | | | | U.S. Treasury Obligations — 10.4% | | | | |
| | 260,000 | | | U.S. Treasury Inflation Indexed Bonds, | | | | |
| | | | | 1.000%, 2/15/48 | | | 252,655 | |
| | 315,000 | | | U.S. Treasury Inflation Indexed Notes, | | | | |
| | | | | 0.750%, 7/15/28 | | | 310,597 | |
| | 310,000 | | | U.S. Treasury Note, 2.500%, 5/31/20 | | | 309,722 | |
| | 633,000 | | | U.S. Treasury Note, 2.500%, 3/31/23 | | | 633,074 | |
| | 150,000 | | | U.S. Treasury Note, 2.875%, 8/15/28 | | | 152,320 | |
| | | | | Total U.S. Treasury Obligations | | $ | 1,658,368 | |
| | | | | | | | | |
| | | | | U.S. Government Mortgage-Backed Obligations — 7.7% | | | | |
| | 269,212 | | | FHLMC, Pool #G05624, 4.500%, 9/1/39 | | | 280,752 | |
| | 173,321 | | | FHLMC, Pool #Q29260, | | | | |
| | | | | 4.000%, 10/1/44 | | | 177,152 | |
| | 106,918 | | | FNMA, Pool #725423, 5.500%, 5/1/34 | | | 115,125 | |
| | 102,569 | | | FNMA, Pool #725610, 5.500%, 7/1/34 | | | 110,469 | |
| | 25,969 | | | FNMA, Pool #890310, 4.500%, 12/1/40 | | | 27,201 | |
| | 103,698 | | | FNMA, Pool #AD9193, 5.000%, 9/1/40 | | | 110,074 | |
| | 404,893 | | | FNMA, Pool #AL5718, 3.500%, 9/1/44 | | | 406,799 | |
| | | | | Total U.S. Government Mortgage-Backed Obligations | | $ | 1,227,572 | |
| | Shares | | | | | | | |
| | | | | | | | | |
| | | | | Exchange-Traded Fund — 1.8% | | | | |
| | 2,738 | | | iShares JP Morgan USD Emerging | | | | |
| | | | | Markets Bond ETF | | $ | 284,506 | |
| | Principal | | | | | | | |
| | Amount | | | | | | | |
| | | | | | | | | |
| | | | | Sovereign Bonds — 0.2% | | | | |
| $ | 20,000 | | | Province of Alberta Canada, 2.200%, | | | | |
| | | | | 7/26/22 | | | 19,552 | |
| | 22,000 | | | Province of Ontario Canada, 1.875%, | | | | |
| | | | | 5/21/20 | | | 21,750 | |
| | | | | Total Sovereign Bonds | | $ | 41,302 | |
Touchstone Balanced Fund (Continued)
| | | | | | Market | |
| Shares | | | | | Value | |
| | | | | | | |
| | | | | Preferred Stock — 0.1% | | | | |
| | | | | | | | | |
| | | | | Utilities — 0.1% | | | | |
| | 817 | | | Integrys Holding, Inc., 6.000%, 8/1/73 | | $ | 19,322 | |
| | | | | | | | | |
| | | | | Short-Term Investment Fund — 1.2% | | | | |
| | 196,249 | | | Dreyfus Government Cash | | | | |
| | | | | Management, Institutional Shares, | | | | |
| | | | | 2.29%∞Ω | | $ | 196,249 | |
| | | | | | | | | |
| | | | | Total Investment Securities —100.0% | | | | |
| | | | | (Cost $15,459,158) | | $ | 15,976,282 | |
| | | | | | | | | |
| | | | | Liabilities in Excess of Other Assets — 0.0% | | | (5,595 | ) |
| | | | | Net Assets — 100.0% | | $ | 15,970,687 | |
| (A) | Variable rate security - Rate reflected is the rate in effect as of December 31, 2018. |
| * | Non-income producing security. |
| Ω | Represents the 7-day SEC yield as of December 31, 2018. |
Portfolio Abbreviations:
ADR - American Depositary Receipt
ETF - Exchange-Traded Fund
FHLMC - Federal Home Loan Mortgage Corporation
FNMA - Federal National Mortgage Association
LIBOR - London Interbank Offered Rate
LLC - Limited Liability Company
LP - Limited Partnership
MTN - Medium Term Note
PLC - Public Limited Company
REIT - Real Estate Investment Trust
USD - United States Dollar
144a - This is a restricted security that was sold in a transaction qualifying for the exemption under Rule 144a of the Securities Act of 1933. This security may be sold in transactions exempt from registration, normally to qualified institutional buyers. At December 31, 2018, these securities were valued at $261,741 or 1.6% of net assets. These securities were deemed liquid pursuant to procedures approved by the Board of Trustees.
Other Information:
The inputs or methodology used for valuing securities may not be an indication of the risk associated with investing in those securities. For more information on valuation inputs, and their aggregation into the levels used in the table below, please refer to the security valuation section in the accompanying Notes to Financial Statements.
| | | Valuation inputs at Reporting Date: | |
| Description | | Level 1 | | | Level 2 | | | Level 3 | | | Total | |
| Assets: | | | | | | | | | | | | | | | | |
| Common Stocks | | $ | 10,377,026 | | | $ | — | | | $ | — | | | $ | 10,377,026 | |
| Corporate Bonds | | | — | | | | 2,171,937 | | | | — | | | | 2,171,937 | |
| U.S. Treasury Obligations | | | — | | | | 1,658,368 | | | | — | | | | 1,658,368 | |
| U.S. Government Mortgage-Backed Obligations | | | — | | | | 1,227,572 | | | | — | | | | 1,227,572 | |
| Exchange-Traded Fund | | | 284,506 | | | | — | | | | — | | | | 284,506 | |
| Sovereign Bonds | | | — | | | | 41,302 | | | | — | | | | 41,302 | |
| Preferred Stock | | | 19,322 | | | | — | | | | — | | | | 19,322 | |
| Short-Term Investment Fund | | | 196,249 | | | | — | | | | — | | | | 196,249 | |
| Total | | $ | 10,877,103 | | | $ | 5,099,179 | | | $ | — | | | $ | 15,976,282 | |
See accompanying Notes to Financial Statements.
Portfolio of Investments
Touchstone Bond Fund – December 31, 2018
| Principal | | | | | Market | |
| Amount | | | | | Value | |
| | | | | | | |
| | | | | Corporate Bonds — 42.5% | | | | |
| | | | | | | | | |
| | | | | Financials — 11.7% | | | | |
| $ | 29,000 | | | Allstate Corp. (The), Ser B, | | | | |
| | | | | 5.750%, 8/15/53 | | $ | 28,275 | |
| | 183,000 | | | American Express Co., | | | | |
| | | | | 3.000%, 10/30/24 | | | 175,120 | |
| | 150,000 | | | Bank of America Corp., | | | | |
| | | | | 3.705%, 4/24/28 | | | 143,890 | |
| | 221,000 | | | Bank of America Corp. MTN, | | | | |
| | | | | 4.000%, 1/22/25 | | | 215,286 | |
| | 170,000 | | | Bank of Montreal (Canada), | | | | |
| | | | | 3.803%, 12/15/32 | | | 157,420 | |
| | 170,000 | | | Bank of New York Mellon Corp. (The) | | | | |
| | | | | MTN, 2.950%, 1/29/23 | | | 167,324 | |
| | 175,000 | | | Bank of Nova Scotia (The), (Canada), | | | | |
| | | | | (3M LIBOR +0.620%), | | | | |
| | | | | 3.424%, 9/19/22(A) | | | 173,222 | |
| | 200,000 | | | Barclays PLC (United Kingdom), | | | | |
| | | | | 4.610%, 2/15/23 | | | 198,312 | |
| | 168,000 | | | BB&T Corp. MTN, 2.850%, 10/26/24 | | | 161,409 | |
| | 139,000 | | | Citigroup, Inc., 3.300%, 4/27/25 | | | 132,002 | |
| | 85,000 | | | Citigroup, Inc., 4.750%, 5/18/46 | | | 78,579 | |
| | 142,000 | | | Fifth Third Bancorp, 2.875%, 7/27/20 | | | 141,181 | |
| | 200,000 | | | GE Capital International Funding Co. | | | | |
| | | | | Unlimited Co. (Ireland), | | | | |
| | | | | 4.418%, 11/15/35 | | | 167,513 | |
| | 400,000 | | | Goldman Sachs Group, Inc. (The), (3M | | | | |
| | | | | LIBOR +1.000%), 3.487%, 7/24/23(A) | | | 388,675 | |
| | 99,000 | | | Goldman Sachs Group, Inc. (The), | | | | |
| | | | | 3.691%, 6/5/28 | | | 92,008 | |
| | 147,000 | | | Goldman Sachs Group, Inc. (The), | | | | |
| | | | | 5.250%, 7/27/21 | | | 152,600 | |
| | 238,000 | | | Huntington Bancshares, Inc./OH, | | | | |
| | | | | 4.000%, 5/15/25 | | | 239,243 | |
| | 105,000 | | | JPMorgan Chase & Co., (3M LIBOR | | | | |
| | | | | +0.730%), 3.207%, 4/23/24(A) | | | 101,445 | |
| | 112,000 | | | JPMorgan Chase & Co., | | | | |
| | | | | 3.250%, 9/23/22 | | | 111,111 | |
| | 181,000 | | | JPMorgan Chase & Co., | | | | |
| | | | | 3.509%, 1/23/29 | | | 171,390 | |
| | 200,000 | | | Lloyds Banking Group PLC (United | | | | |
| | | | | Kingdom), 3.574%, 11/7/28 | | | 177,905 | |
| | 120,000 | | | Morgan Stanley, 3.737%, 4/24/24 | | | 118,978 | |
| | 199,000 | | | Morgan Stanley, 3.950%, 4/23/27 | | | 187,616 | |
| | 125,000 | | | Northwestern Mutual Life Insurance | | | | |
| | | | | Co. (The), 144a, 3.850%, 9/30/47 | | | 113,194 | |
| | 250,000 | | | PNC Bank NA, 2.700%, 11/1/22 | | | 242,938 | |
| | 140,000 | | | Prudential Financial, Inc., | | | | |
| | | | | 5.625%, 6/15/43 | | | 137,106 | |
| | 178,000 | | | Royal Bank of Canada (Canada) MTN, | | | | |
| | | | | 3.200%, 4/30/21 | | | 177,982 | |
| | 160,000 | | | SunTrust Banks, Inc., 4.000%, 5/1/25 | | | 160,514 | |
| | 128,000 | | | Visa, Inc., 4.150%, 12/14/35 | | | 132,379 | |
| | 117,000 | | | Wells Fargo & Co., 2.100%, 7/26/21 | | | 113,347 | |
| | 113,000 | | | Wells Fargo & Co., 4.125%, 8/15/23 | | | 113,667 | |
| | | | | | | | 4,871,631 | |
| | | | | | | | | |
| | | | | Energy — 4.4% | | | | |
| | 177,000 | | | Boardwalk Pipelines LP, | | | | |
| | | | | 4.450%, 7/15/27 | | | 163,425 | |
| | 143,000 | | | Cenovus Energy, Inc. (Canada), | | | | |
| | | | | 4.250%, 4/15/27 | | | 130,248 | |
| | 154,000 | | | Cheniere Corpus Christi Holdings LLC, | | | | |
| | | | | 7.000%, 6/30/24 | | | 162,470 | |
| | 127,000 | | | Columbia Pipeline Group, Inc., | | | | |
| | | | | 4.500%, 6/1/25 | | | 127,915 | |
| | 172,000 | | | Enbridge, Inc. (Canada), (3M LIBOR | | | | |
| | | | | +0.700%), 3.488%, 6/15/20(A) | | | 171,405 | |
| | 162,000 | | | Energy Transfer Partners LP, | | | | |
| | | | | 4.950%, 6/15/28 | | | 158,503 | |
| | 105,000 | | | EOG Resources, Inc., 3.900%, 4/1/35 | | | 99,131 | |
| | 185,000 | | | Kinder Morgan Energy Partners LP, | | | | |
| | | | | 3.500%, 9/1/23 | | | 179,704 | |
| | 120,000 | | | Newfield Exploration Co., | | | | |
| | | | | 5.375%, 1/1/26 | | | 117,600 | |
| | 128,000 | | | Petroleos Mexicanos (Mexico), | | | | |
| | | | | 4.500%, 1/23/26 | | | 110,336 | |
| | 165,000 | | | Petroleos Mexicanos (Mexico), | | | | |
| | | | | 5.350%, 2/12/28 | | | 143,962 | |
| | 166,000 | | | Shell International Finance BV | | | | |
| | | | | (Netherlands), 1.875%, 5/10/21 | | | 161,682 | |
| | 128,000 | | | Valero Energy Corp., 4.350%, 6/1/28 | | | 126,805 | |
| | | | | | | | 1,853,186 | |
| | | | | | | | | |
| | | | | Communication Services — 3.9% | | | | |
| | 148,000 | | | Activision Blizzard, Inc., | | | | |
| | | | | 4.500%, 6/15/47 | | | 132,769 | |
| | 60,000 | | | AT&T, Inc., 3.950%, 1/15/25 | | | 58,671 | |
| | 37,000 | | | AT&T, Inc., 4.350%, 6/15/45 | | | 31,267 | |
| | 116,000 | | | AT&T, Inc., 4.500%, 5/15/35 | | | 104,145 | |
| | 167,000 | | | Charter Communications Operating | | | | |
| | | | | LLC / Charter Communications | | | | |
| | | | | Operating Capital, | | | | |
| | | | | 6.484%, 10/23/45 | | | 171,666 | |
| | 94,000 | | | Comcast Corp., 4.000%, 3/1/48 | | | 85,655 | |
| | 125,000 | | | Comcast Corp., 4.150%, 10/15/28 | | | 126,929 | |
| | 110,000 | | | Cox Communications, Inc., 144a, | | | | |
| | | | | 3.350%, 9/15/26 | | | 101,486 | |
| | 112,000 | | | Interpublic Group of Cos., Inc. (The), | | | | |
| | | | | 3.750%, 10/1/21 | | | 112,699 | |
| | 106,000 | | | Qwest Corp., 6.750%, 12/1/21 | | | 108,380 | |
| | 200,000 | | | Telecom Italia SpA/Milano (Italy), | | | | |
| | | | | 144a, 5.303%, 5/30/24 | | | 190,000 | |
| | 62,000 | | | Verizon Communications, Inc., | | | | |
| | | | | 4.672%, 3/15/55 | | | 56,935 | |
| | 125,000 | | | Verizon Communications, Inc., | | | | |
| | | | | 5.012%, 4/15/49 | | | 124,550 | |
| | 260,000 | | | Warner Media LLC, 3.800%, 2/15/27 | | | 243,959 | |
| | | | | | | | 1,649,111 | |
| | | | | | | | | |
| | | | | Health Care — 3.8% | | | | |
| | 49,000 | | | Abbott Laboratories, | | | | |
| | | | | 3.750%, 11/30/26 | | | 48,392 | |
| | 155,000 | | | AbbVie, Inc., 4.450%, 5/14/46 | | | 135,584 | |
Touchstone Bond Fund (Continued)
| Principal | | | | | Market | |
| Amount | | | | | Value | |
| | | | | | | |
| | | | | Corporate Bonds — 42.5% (Continued) | | | | |
| | | | | | | | | |
| | | | | Health Care — (Continued) | | | | |
| $ | 108,000 | | | Allergan Funding SCS (Luxembourg), | | | | |
| | | | | 3.800%, 3/15/25 | | $ | 105,432 | |
| | 100,000 | | | Allergan Sales LLC, 144a, | | | | |
| | | | | 5.000%, 12/15/21 | | | 102,890 | |
| | 131,000 | | | Celgene Corp., 5.000%, 8/15/45 | | | 121,133 | |
| | 128,000 | | | Cigna Corp., 144a, 4.375%, 10/15/28 | | | 128,714 | |
| | 120,000 | | | CVS Health Corp., 4.300%, 3/25/28 | | | 117,313 | |
| | 100,000 | | | CVS Health Corp., 5.125%, 7/20/45 | | | 97,341 | |
| | 136,000 | | | Express Scripts Holding Co., | | | | |
| | | | | 3.300%, 2/25/21 | | | 135,501 | |
| | 39,000 | | | Medtronic Global Holdings SCA | | | | |
| | | | | (Luxembourg), 3.350%, 4/1/27 | | | 38,200 | |
| | 169,000 | | | Shire Acquisitions Investments Ireland | | | | |
| | | | | DAC (Ireland), 2.400%, 9/23/21 | | | 163,420 | |
| | 110,000 | | | Thermo Fisher Scientific, Inc., | | | | |
| | | | | 3.600%, 8/15/21 | | | 110,324 | |
| | 182,000 | | | UnitedHealth Group, Inc., | | | | |
| | | | | 2.375%, 10/15/22 | | | 176,414 | |
| | 118,000 | | | Zimmer Biomet Holdings, Inc., | | | | |
| | | | | 3.150%, 4/1/22 | | | 115,370 | |
| | | | | | | | 1,596,028 | |
| | | | | | | | | |
| | | | | Consumer Discretionary — 3.8% | | | | |
| | 173,000 | | | Aptiv PLC (Jersey), 3.150%, 11/19/20 | | | 171,270 | |
| | 270,000 | | | BMW US Capital LLC, 144a, | | | | |
| | | | | 3.100%, 4/12/21 | | | 267,405 | |
| | 178,000 | | | Booking Holdings, Inc., 3.600%, 6/1/26 | | | 172,935 | |
| | 178,000 | | | Dollar Tree, Inc., (3M LIBOR +0.700%), | | | | |
| | | | | 3.149%, 4/17/20(A) | | | 176,865 | |
| | 47,000 | | | Ford Motor Co., 4.750%, 1/15/43 | | | 36,246 | |
| | 89,000 | | | Ford Motor Credit Co. LLC, | | | | |
| | | | | 4.140%, 2/15/23 | | | 84,595 | |
| | 158,000 | | | General Motors Financial Co., Inc., | | | | |
| | | | | 3.200%, 7/13/20 | | | 156,039 | |
| | 90,000 | | | General Motors Financial Co., Inc., | | | | |
| | | | | 3.950%, 4/13/24 | | | 85,474 | |
| | 98,000 | | | General Motors Financial Co., Inc., | | | | |
| | | | | 4.350%, 4/9/25 | | | 92,851 | |
| | 137,000 | | | Home Depot, Inc. (The), | | | | |
| | | | | 5.950%, 4/1/41 | | | 168,114 | |
| | 178,000 | | | Toyota Motor Credit Corp. MTN, | | | | |
| | | | | 2.950%, 4/13/21 | | | 178,027 | |
| | | | | | | | 1,589,821 | |
| | | | | | | | | |
| | | | | Consumer Staples — 3.7% | | | | |
| | 250,000 | | | Anheuser-Busch Cos. LLC / | | | | |
| | | | | Anheuser-Busch InBev Worldwide, | | | | |
| | | | | Inc., 144a, 4.900%, 2/1/46 | | | 231,846 | |
| | 180,000 | | | Cargill, Inc., 144a, 3.050%, 4/19/21 | | | 179,822 | |
| | 136,000 | | | Conagra Brands, Inc., 4.850%, 11/1/28 | | | 133,739 | |
| | 128,000 | | | General Mills, Inc., (3M LIBOR | | | | |
| | | | | +1.010%), 3.459%, 10/17/23(A) | | | 125,026 | |
| | 160,000 | | | Grupo Bimbo SAB de CV (Mexico), | | | | |
| | | | | 144a, 4.500%, 1/25/22 | | | 162,960 | |
| | 203,000 | | | Imperial Brands Finance PLC (United | | | | |
| | | | | Kingdom), 144a, 4.250%, 7/21/25 | | | 199,667 | |
| | 115,000 | | | Kraft Heinz Foods Co., 6.875%, 1/26/39 | | | 128,309 | |
| | 155,000 | | | Moody's Corp., 2.750%, 12/15/21 | | | 152,008 | |
| | 149,000 | | | Reynolds American, Inc., | | | | |
| | | | | 4.450%, 6/12/25 | | | 143,671 | |
| | 82,000 | | | Tyson Foods, Inc., 3.900%, 9/28/23 | | | 81,886 | |
| | | | | | | | 1,538,934 | |
| | | | | | | | | |
| | | | | Real Estate — 3.1% | | | | |
| | 166,000 | | | Boston Properties LP REIT, | | | | |
| | | | | 3.200%, 1/15/25 | | | 158,509 | |
| | 167,000 | | | Crown Castle International Corp. REIT, | | | | |
| | | | | 3.650%, 9/1/27 | | | 154,816 | |
| | 90,000 | | | Kimco Realty Corp. REIT, | | | | |
| | | | | 3.125%, 6/1/23 | | | 87,048 | |
| | 120,000 | | | Mid-America Apartments LP REIT, | | | | |
| | | | | 3.750%, 6/15/24 | | | 118,868 | |
| | 152,000 | | | Sabra Health Care LP REIT, | | | | |
| | | | | 5.125%, 8/15/26 | | | 140,869 | |
| | 186,000 | | | SL Green Operating Partnership LP | | | | |
| | | | | REIT, 3.250%, 10/15/22 | | | 179,713 | |
| | 101,000 | | | Spirit Realty LP REIT, 4.450%, 9/15/26 | | | 97,028 | |
| | 204,000 | | | VEREIT Operating Partnership LP REIT, | | | | |
| | | | | 4.600%, 2/6/24 | | | 206,244 | |
| | 130,000 | | | Welltower, Inc. REIT, 4.250%, 4/1/26 | | | 129,769 | |
| | | | | | | | 1,272,864 | |
| | | | | | | | | |
| | | | | Industrials — 2.5% | | | | |
| | 200,000 | | | CRH America Finance, Inc., 144a, | | | | |
| | | | | 4.500%, 4/4/48 | | | 177,774 | |
| | 174,000 | | | Eagle Materials, Inc., 4.500%, 8/1/26 | | | 172,757 | |
| | 72,000 | | | Embraer Netherlands Finance BV | | | | |
| | | | | (Netherlands), 5.050%, 6/15/25 | | | 72,811 | |
| | 71,000 | | | Embraer Netherlands Finance BV | | | | |
| | | | | (Netherlands), 5.400%, 2/1/27 | | | 73,308 | |
| | 119,000 | | | Roper Technologies, Inc., | | | | |
| | | | | 3.000%, 12/15/20 | | | 118,227 | |
| | 138,000 | | | Vulcan Materials Co., 4.500%, 4/1/25 | | | 137,086 | |
| | 165,000 | | | Wabtec Corp., 4.700%, 9/15/28 | | | 154,747 | |
| | 152,000 | | | Westrock Co., 144a, 4.650%, 3/15/26 | | | 154,323 | |
| | | | | | | | 1,061,033 | |
| | | | | | | | | |
| | | | | Information Technology — 2.4% | | | | |
| | 148,000 | | | Apple, Inc., 2.750%, 1/13/25 | | | 142,710 | |
| | 185,000 | | | Apple, Inc., 4.650%, 2/23/46 | | | 195,830 | |
| | 162,000 | | | Dell International LLC / EMC Corp., | | | | |
| | | | | 144a, 6.020%, 6/15/26 | | | 162,733 | |
| | 88,000 | | | Microsoft Corp., 3.500%, 2/12/35 | | | 83,988 | |
| | 158,000 | | | NXP BV / NXP Funding LLC | | | | |
| | | | | (Netherlands), 144a, 5.350%, 3/1/26 | | | 160,686 | |
| | 142,000 | | | Oracle Corp., 2.650%, 7/15/26 | | | 131,600 | |
| | 140,000 | | | QUALCOMM, Inc., 3.450%, 5/20/25 | | | 134,699 | |
| | | | | | | | 1,012,246 | |
Touchstone Bond Fund (Continued)
| Principal | | | | | Market | |
| Amount | | | | | Value | |
| | | | | | | |
| | | | | Corporate Bonds — 42.5% (Continued) | | | | |
| | | | | | | | | |
| | | | | Materials — 1.8% | | | | |
| $ | 200,000 | | | Braskem America Finance Co., 144a, | | | | |
| | | | | 7.125%, 7/22/41 | | $ | 216,900 | |
| | 195,000 | | | DowDuPont, Inc., 4.493%, 11/15/25 | | | 200,767 | |
| | 146,000 | | | Sherwin-Williams Co. (The), | | | | |
| | | | | 4.500%, 6/1/47 | | | 131,658 | |
| | 200,000 | | | Suzano Austria GmbH (Austria), 144a, | | | | |
| | | | | 5.750%, 7/14/26 | | | 204,000 | |
| | | | | | | | 753,325 | |
| | | | | | | | | |
| | | | | Utilities — 1.4% | | | | |
| | 54,000 | | | DTE Energy Co., Series D, | | | | |
| | | | | 3.700%, 8/1/23 | | | 53,622 | |
| | 101,000 | | | Duke Energy Progress LLC, | | | | |
| | | | | 4.150%, 12/1/44 | | | 98,052 | |
| | 136,000 | | | Fortis, Inc. (Canada), 3.055%, 10/4/26 | | | 124,153 | |
| | 102,000 | | | NextEra Energy Capital Holdings, Inc., | | | | |
| | | | | 2.800%, 1/15/23 | | | 98,434 | |
| | 123,000 | | | Oncor Electric Delivery Co. LLC, | | | | |
| | | | | 3.800%, 9/30/47 | | | 116,317 | |
| | 54,000 | | | Pacific Gas & Electric Co., 144a, | | | | |
| | | | | 4.650%, 8/1/28 | | | 49,505 | |
| | 62,000 | | | WEC Energy Group, Inc., (3M LIBOR | | | | |
| | | | | +2.113%), 4.729%, 5/15/67(A) | | | 50,586 | |
| | | | | | | | 590,669 | |
| | | | | Total Corporate Bonds | | $ | 17,788,848 | |
| | | | | | | | | |
| | | | | U.S. Government Mortgage-Backed Obligations — 20.1% | | | | |
| | 504,772 | | | FHLMC, Pool #G05624, 4.500%, 9/1/39 | | | 526,409 | |
| | 675,148 | | | FHLMC, Pool #Q29056, | | | | |
| | | | | 4.000%, 10/1/44 | | | 690,046 | |
| | 284,053 | | | FHLMC, Pool #Q29260, | | | | |
| | | | | 4.000%, 10/1/44 | | | 290,333 | |
| | 402,351 | | | FNMA, Pool #725423, 5.500%, 5/1/34 | | | 433,233 | |
| | 379,885 | | | FNMA, Pool #725610, 5.500%, 7/1/34 | | | 409,145 | |
| | 345,660 | | | FNMA, Pool #AD9193, 5.000%, 9/1/40 | | | 366,912 | |
| | 501,584 | | | FNMA, Pool #AL5718, 3.500%, 9/1/44 | | | 503,945 | |
| | 503,582 | | | FNMA, Pool #AR9195, 3.000%, 3/1/43 | | | 495,163 | |
| | 603,791 | | | FNMA, Pool #AS4707, 3.500%, 4/1/45 | | | 606,074 | |
| | 755,981 | | | FNMA, Pool #AS7234, 3.000%, 5/1/46 | | | 737,295 | |
| | 1,306,362 | | | FNMA, Pool #AS8703, 2.500%, 2/1/32 | | | 1,276,292 | |
| | 551,659 | | | FNMA, Pool #AT2016, 3.000%, 4/1/43 | | | 542,171 | |
| | 203,180 | | | FNMA, Pool #AZ7347, 3.000%, 11/1/45 | | | 198,661 | |
| | 688,619 | | | FNMA, Pool #BC1158, 3.500%, 2/1/46 | | | 690,760 | |
| | 591,582 | | | GNMA, Pool #5175, 4.500%, 9/20/41 | | | 620,656 | |
| | 25,966 | | | GNMA, Pool #679437, | | | | |
| | | | | 6.000%, 11/15/22 | | | 25,964 | |
| | | | | Total U.S. Government Mortgage-Backed Obligations | | $ | 8,413,059 | |
| | | | | | | | | |
| | | | | U.S. Treasury Obligations — 16.7% | | | | |
| | 1,995,000 | | | U.S. Treasury Inflation Indexed Bonds, | | | | |
| | | | | 1.000%, 2/15/48 | | | 1,938,644 | |
| | 1,500,000 | | | U.S. Treasury Inflation Indexed Notes, | | | | |
| | | | | 0.750%, 7/15/28 | | | 1,479,033 | |
| | 2,060,000 | | | U.S. Treasury Note, 2.500%, 5/31/20 | | | 2,058,149 | |
| | 1,249,000 | | | U.S. Treasury Note, 2.500%, 3/31/23 | | | 1,249,146 | |
| | 265,000 | | | U.S. Treasury Note, 2.875%, 8/15/28 | | | 269,099 | |
| | | | | Total U.S. Treasury Obligations | | $ | 6,994,071 | |
| | Shares | | | | | | | |
| | | | | | | | | |
| | | | | Exchange-Traded Fund — 5.0% | | | | |
| | 20,047 | | | iShares JP Morgan USD Emerging | | | | |
| | | | | Markets Bond ETF | | $ | 2,083,084 | |
| | Principal | | | | | | | |
| | Amount | | | | | | | |
| | | | | | | | | |
| | | | | Non-Agency Collateralized Mortgage Obligations — 4.5% | | | | |
| $ | 518,348 | | | Agate Bay Mortgage Trust, Ser 2015-7, | | | | |
| | | | | Class B1, 144a, | | | | |
| | | | | 3.766%, 10/25/45(A)(B) | | | 522,718 | |
| | 517,487 | | | CSMC Trust, Ser 2015-1, Class B3, 144a, | | | | |
| | | | | 3.941%, 1/25/45(A)(B) | | | 506,096 | |
| | 349,030 | | | CSMC Trust, Ser 2015-WIN1, Class B3, | | | | |
| | | | | 144a, 3.858%, 12/25/44(A)(B) | | | 347,492 | |
| | 505,488 | | | PMT Loan Trust, Ser 2013-J1, Class A11, | | | | |
| | | | | 144a, 3.500%, 9/25/43(A)(B) | | | 500,114 | |
| | | | | Total Non-Agency Collateralized Mortgage Obligations | | $ | 1,876,420 | |
| | | | | | | | | |
| | | | | Agency Collateralized Mortgage Obligation — 3.0% | | | | |
| | 1,181,402 | | | FHLMC REMIC, Ser 3859 Class JB, | | | | |
| | | | | 5.000%, 5/15/41 | | $ | 1,251,181 | |
| | | | | | | | | |
| | | | | Asset-Backed Securities — 2.5% | | | | |
| | 550,000 | | | Hertz Vehicle Financing II LP, Ser | | | | |
| | | | | 2016-4A, Class A, 144a, | | | | |
| | | | | 2.650%, 7/25/22 | | | 538,486 | |
| | 519,750 | | | Wendys Funding LLC, Ser 2018-1A, | | | | |
| | | | | Class A2I, 144a, 3.573%, 3/15/48 | | | 498,097 | |
| | | | | Total Asset-Backed Securities | | $ | 1,036,583 | |
| | | | | | | | | |
| | | | | Sovereign Bonds — 1.3% | | | | |
| | 200,000 | | | Mexico Government International | | | | |
| | | | | Bond, 4.350%, 1/15/47 | | | 171,400 | |
| | 147,000 | | | Province of Alberta Canada, 2.200%, | | | | |
| | | | | 7/26/22 | | | 143,708 | |
| | 166,000 | | | Province of Ontario Canada, 1.875%, | | | | |
| | | | | 5/21/20 | | | 164,115 | |
| | 57,000 | | | Uruguay Government International | | | | |
| | | | | Bond, 4.975%, 4/20/55 | | | 54,208 | |
| | | | | Total Sovereign Bonds | | $ | 533,431 | |
| | | | | | | | | |
| | | | | Commercial Mortgage-Backed Security — 1.3% | | | | |
| | 550,000 | | | GS Mortgage Securities Trust, Ser | | | | |
| | | | | 2017-FARM, Class B, 144a, | | | | |
| | | | | 3.541%, 1/10/43(A)(B) | | $ | 533,159 | |
Touchstone Bond Fund (Continued)
| | | | | | Market | |
| Shares | | | | | Value | |
| | | | | | | |
| | | | | Preferred Stock — 0.4% | | | | |
| | | | | | | | | |
| | | | | Utilities — 0.4% | | | | |
| | 6,575 | | | Integrys Holding, Inc., 6.000%, 8/1/73 | | $ | 155,499 | |
| | | | | | | | | |
| | | | | Short-Term Investment Fund — 2.3% | | | | |
| | 972,143 | | | Dreyfus Government Cash | | | | |
| | | | | Management, Institutional Shares, | | | | |
| | | | | 2.29%∞Ω | | $ | 972,143 | |
| | | | | Total Investment Securities —99.6% | | | | |
| | | | | (Cost $42,581,176) | | $ | 41,637,478 | |
| | | | | | | | | |
| | | | | Other Assets in | | | | |
| | | | | Excess of Liabilities — 0.4% | | | 170,662 | |
| | | | | Net Assets — 100.0% | | $ | 41,808,140 | |
| (A) | Variable rate security - Rate reflected is the rate in effect as of December 31, 2018. |
| (B) | Certain variable rate securities are not based on a published reference rate and spread but are determined by the issuer or agent and are based on current market conditions. These securities do not indicate a reference rate and spread in their description. |
| Ω | Represents the 7-day SEC yield as of December 31, 2018. |
Portfolio Abbreviations:
DAC - Designated Activity Company
ETF - Exchange-Traded Fund
FHLMC - Federal Home Loan Mortgage Corporation
FNMA - Federal National Mortgage Association
GNMA - Government National Mortgage Association
LIBOR - London Interbank Offered Rate
LLC - Limited Liability Company
LP - Limited Partnership
MTN - Medium Term Note
PLC - Public Limited Company
REIT - Real Estate Investment Trust
REMIC - Real Estate Mortgage Investment Conduit
USD - United States Dollar
144a - This is a restricted security that was sold in a transaction qualifying for the exemption under Rule 144a of the Securities Act of 1933. This security may be sold in transactions exempt from registration, normally to qualified institutional buyers. At December 31, 2018, these securities were valued at $6,250,068 or 14.9% of net assets. These securities were deemed liquid pursuant to procedures approved by the Board of Trustees.
Touchstone Bond Fund (Continued)
Other Information:
The inputs or methodology used for valuing securities may not be an indication of the risk associated with investing in those securities. For more information on valuation inputs, and their aggregation into the levels used in the table below, please refer to the security valuation section in the accompanying Notes to Financial Statements.
| | Valuation inputs at Reporting Date: |
| Description | | Level 1 | | | Level 2 | | | Level 3 | | | Total | |
| Assets: | | | | | | | | | | | | | | | | |
| Corporate Bonds | | $ | — | | | $ | 17,788,848 | | | $ | — | | | $ | 17,788,848 | |
| U.S. Government Mortgage-Backed Obligations | | | — | | | | 8,413,059 | | | | — | | | | 8,413,059 | |
| U.S. Treasury Obligations | | | — | | | | 6,994,071 | | | | — | | | | 6,994,071 | |
| Exchange-Traded Fund | | | 2,083,084 | | | | — | | | | — | | | | 2,083,084 | |
| Non-Agency Collateralized Mortgage Obligations | | | — | | | | 1,876,420 | | | | — | | | | 1,876,420 | |
| Agency Collateralized Mortgage Obligation | | | — | | | | 1,251,181 | | | | — | | | | 1,251,181 | |
| Asset-Backed Securities | | | — | | | | 1,036,583 | | | | — | | | | 1,036,583 | |
| Sovereign Bonds | | | — | | | | 533,431 | | | | — | | | | 533,431 | |
| Commercial Mortgage-Backed Security | | | — | | | | 533,159 | | | | — | | | | 533,159 | |
| Preferred Stock | | | 155,499 | | | | — | | | | — | | | | 155,499 | |
| Short-Term Investment Fund | | | 972,143 | | | | — | | | | — | | | | 972,143 | |
| Total Assets | | $ | 3,210,726 | | | $ | 38,426,752 | | | $ | — | | | $ | 41,637,478 | |
See accompanying Notes to Financial Statements.
Portfolio of Investments
Touchstone Common Stock Fund– December 31, 2018
| | | | | | Market | |
| | | Shares | | | Value | |
| | | | | | | |
| Common Stocks — 99.2% | | | | | | | | |
| | | | | | | | | |
| Information Technology — 18.7% | | | | | | | | |
| Apple, Inc. | | | 30,824 | | | $ | 4,862,178 | |
| Avnet, Inc. | | | 57,279 | | | | 2,067,772 | |
| International Business Machines Corp. | | | 16,156 | | | | 1,836,452 | |
| Microsoft Corp. | | | 63,301 | | | | 6,429,482 | |
| Oracle Corp. | | | 83,358 | | | | 3,763,614 | |
| salesforce.com, Inc.* | | | 31,743 | | | | 4,347,839 | |
| | | | | | | | 23,307,337 | |
| | | | | | | | | |
| Communication Services — 18.3% | | | | | | | | |
| Alphabet, Inc. - Class C* | | | 6,631 | | | | 6,867,130 | |
| AT&T, Inc. | | | 74,611 | | | | 2,129,398 | |
| Baidu, Inc. (China) ADR* | | | 11,052 | | | | 1,752,847 | |
| Charter Communications, Inc. - Class A* | | | 8,604 | | | | 2,451,882 | |
| Comcast Corp. - Class A | | | 78,967 | | | | 2,688,826 | |
| Facebook, Inc. - Class A* | | | 33,041 | | | | 4,331,345 | |
| Twenty-First Century Fox, Inc. - Class A | | | 54,960 | | | | 2,644,675 | |
| | | | | | | | 22,866,103 | |
| | | | | | | | | |
| Financials — 18.0% | | | | | | | | |
| Bank of America Corp. | | | 122,226 | | | | 3,011,649 | |
| Berkshire Hathaway, Inc. - Class B* | | | 63,021 | | | | 12,867,628 | |
| Brookfield Asset Management, Inc. (Canada) - Class A | | | 58,560 | | | | 2,245,776 | |
| Goldman Sachs Group, Inc. (The) | | | 14,583 | | | | 2,436,090 | |
| Signature Bank/NewYork NY | | | 18,654 | | | | 1,917,818 | |
| | | | | | | | 22,478,961 | |
| | | | | | | | | |
| Health Care — 13.5% | | | | | | | | |
| AmerisourceBergen Corp. | | | 35,797 | | | | 2,663,297 | |
| Biogen, Inc.* | | | 10,516 | | | | 3,164,475 | |
| Bristol-Myers Squibb Co. | | | 59,188 | | | | 3,076,592 | |
| Johnson & Johnson | | | 26,239 | | | | 3,386,143 | |
| Novartis AG (Switzerland) ADR | | | 53,993 | | | | 4,633,139 | |
| | | | | | | | 16,923,646 | |
| | | | | | | | | |
| Consumer Discretionary — 12.2% | | | | | | | | |
| Alibaba Group Holding Ltd. (China) | | | | | | | | |
| ADR* | | | 4,221 | | | | 578,572 | |
| Amazon.com, Inc.* | | | 4,009 | | | | 6,021,398 | |
| Booking Holdings, Inc.* | | | 698 | | | | 1,202,249 | |
| Carnival Corp. | | | 48,403 | | | | 2,386,268 | |
| JD.com, Inc. (China) ADR* | | | 34,673 | | | | 725,706 | |
| Starbucks Corp. | | | 39,012 | | | | 2,512,373 | |
| Yum China Holdings, Inc. (China) | | | 53,213 | | | | 1,784,232 | |
| | | | | | | | 15,210,798 | |
| | | | | | | | | |
| Industrials — 6.4% | | | | | | | | |
| Deere & Co. | | | 9,888 | | | | 1,474,993 | |
| FedEx Corp. | | | 6,483 | | | | 1,045,902 | |
| General Electric Co. | | | 85,357 | | | | 646,152 | |
| Stericycle, Inc.* | | | 16,693 | | | | 612,466 | |
| Union Pacific Corp. | | | 15,365 | | | | 2,123,904 | |
| United Technologies Corp. | | | 19,335 | | | | 2,058,791 | |
| | | | | | | | 7,962,208 | |
| | | | | | | | | |
| Real Estate — 5.2% | | | | | | | | |
| Jones Lang LaSalle, Inc. | | | 21,276 | | | | 2,693,542 | |
| Simon Property Group, Inc. REIT | | | 22,774 | | | | 3,825,804 | |
| | | | | | | | 6,519,346 | |
| | | | | | | | | |
| Energy — 3.7% | | | | | | | | |
| Exxon Mobil Corp. | | | 32,202 | | | | 2,195,854 | |
| Halliburton Co. | | | 40,910 | | | | 1,087,388 | |
| Schlumberger Ltd. | | | 36,327 | | | | 1,310,678 | |
| | | | | | | | 4,593,920 | |
| | | | | | | | | |
| Consumer Staples — 3.2% | | | | | | | | |
| JM Smucker Co. (The) | | | 5,060 | | | | 473,059 | |
| Monster Beverage Corp.* | | | 37,858 | | | | 1,863,371 | |
| Unilever NV (United Kingdom) | | | 30,902 | | | | 1,662,528 | |
| | | | | | | | 3,998,958 | |
| Total Common Stocks | | | | | | $ | 123,861,277 | |
| | | | | | | | | |
| Short-Term Investment Fund — 0.8% | | | | | | | | |
| Dreyfus Government Cash | | | | | | | | |
| Management, Institutional Shares, | | | | | | | | |
| 2.29%∞Ω | | | 977,945 | | | $ | 977,945 | |
| | | | | | | | | |
| Total Investment Securities —100.0% | | | | | | | | |
| (Cost $115,035,292) | | | | | | $ | 124,839,222 | |
| | | | | | | | | |
| Liabilities in Excess of Other Assets — (0.0%) | | | | | | | (42,898 | ) |
| | | | | | | | | |
| Net Assets — 100.0% | | | | | | $ | 124,796,324 | |
| * | Non-income producing security. |
| Ω | Represents the 7-day SEC yield as of December 31, 2018. |
Portfolio Abbreviations:
ADR - American Depositary Receipt
REIT - Real Estate Investment Trust
Other Information:
The inputs or methodology used for valuing securities may not be an indication of the risk associated with investing in those securities. For more information on valuation inputs, and their aggregation into the levels used in the table below, please refer to the security valuation section in the accompanying Notes to Financial Statements.
Touchstone Common Stock Fund(Continued)
| | | Valuation inputs at Reporting Date: | |
| Description | | Level 1 | | | Level 2 | | | Level 3 | | | Total | |
| Common Stocks | | $ | 123,861,277 | | | $ | — | | | $ | — | | | $ | 123,861,277 | |
| Short-Term Investment Fund | | | 977,945 | | | | — | | | | — | | | | 977,945 | |
| Total | | $ | 124,839,222 | | | $ | — | | | $ | — | | | $ | 124,839,222 | |
See accompanying Notes to Financial Statements.
Portfolio of Investments
Touchstone Focused Fund – December 31, 2018
| | | | | | Market | |
| | | Shares | | | Value | |
| | | | | | | |
| Common Stocks — 97.5% | | | | | | | | |
| | | | | | | | | |
| Information Technology — 18.9% | | | | | | | | |
| Apple, Inc. | | | 12,655 | | | $ | 1,996,200 | |
| Avnet, Inc. | | | 22,760 | | | | 821,636 | |
| International Business Machines Corp. | | | 7,775 | | | | 883,784 | |
| Microsoft Corp. | | | 26,540 | | | | 2,695,668 | |
| Oracle Corp. | | | 33,035 | | | | 1,491,530 | |
| salesforce.com, Inc.* | | | 12,910 | | | | 1,768,283 | |
| | | | | | | | 9,657,101 | |
| | | | | | | | | |
| Financials — 16.8% | | | | | | | | |
| Bank of America Corp. | | | 53,518 | | | | 1,318,683 | |
| Berkshire Hathaway, Inc. - Class B* | | | 26,428 | | | | 5,396,069 | |
| Goldman Sachs Group, Inc. (The) | | | 6,639 | | | | 1,109,045 | |
| Signature Bank/NewYork NY | | | 7,339 | | | | 754,523 | |
| | | | | | | | 8,578,320 | |
| | | | | | | | | |
| Health Care — 15.8% | | | | | | | | |
| AmerisourceBergen Corp. | | | 14,223 | | | | 1,058,191 | |
| Biogen, Inc.* | | | 4,793 | | | | 1,442,310 | |
| Bio-Rad Laboratories, Inc. - Class A* | | | 2,671 | | | | 620,260 | |
| Bristol-Myers Squibb Co. | | | 24,524 | | | | 1,274,757 | |
| Johnson & Johnson | | | 11,880 | | | | 1,533,114 | |
| Novartis AG (Switzerland) ADR | | | 25,012 | | | | 2,146,280 | |
| | | | | | | | 8,074,912 | |
| | | | | | | | | |
| Communication Services — 15.7% | | | | | | | | |
| Alphabet, Inc. - Class C* | | | 2,327 | | | | 2,409,864 | |
| AT&T, Inc. | | | 31,148 | | | | 888,964 | |
| Baidu, Inc. (China) ADR* | | | 4,428 | | | | 702,281 | |
| Comcast Corp. - Class A | | | 36,862 | | | | 1,255,151 | |
| Facebook, Inc. - Class A* | | | 11,553 | | | | 1,514,483 | |
| Twenty-First Century Fox, Inc. - Class A | | | 26,440 | | | | 1,272,293 | |
| | | | | | | | 8,043,036 | |
| | | | | | | | | |
| Consumer Discretionary — 12.1% | | | | | | | | |
| Alibaba Group Holding Ltd. (China) | | | | | | | | |
| ADR* | | | 1,703 | | | | 233,430 | |
| Amazon.com, Inc.* | | | 1,661 | | | | 2,494,772 | |
| Booking Holdings, Inc.* | | | 281 | | | | 484,000 | |
| Carnival Corp. | | | 20,161 | | | | 993,937 | |
| JD.com, Inc. (China) ADR* | | | 13,015 | | | | 272,404 | |
| Starbucks Corp. | | | 14,801 | | | | 953,184 | |
| Yum China Holdings, Inc. (China) | | | 21,537 | | | | 722,136 | |
| | | | | | | | 6,153,863 | |
| | | | | | | | | |
| Industrials — 6.4% | | | | | | | | |
| Deere & Co. | | | 4,008 | | | | 597,873 | |
| FedEx Corp. | | | 2,651 | | | | 427,686 | |
| General Electric Co. | | | 37,020 | | | | 280,241 | |
| Stericycle, Inc.* | | | 6,825 | | | | 250,409 | |
| Union Pacific Corp. | | | 6,670 | | | | 921,994 | |
| United Technologies Corp. | | | 7,518 | | | | 800,517 | |
| | | | | | | | 3,278,720 | |
| | | | | | | | | |
| Real Estate — 5.0% | | | | | | | | |
| Jones Lang LaSalle, Inc. | | | 8,706 | | | | 1,102,180 | |
| Simon Property Group, Inc. REIT | | | 8,729 | | | | 1,466,385 | |
| | | | | | | | 2,568,565 | |
| | | | | | | | | |
| Energy — 3.5% | | | | | | | | |
| Exxon Mobil Corp. | | | 11,768 | | | | 802,460 | |
| Halliburton Co. | | | 15,184 | | | | 403,591 | |
| Schlumberger Ltd. | | | 16,338 | | | | 589,475 | |
| | | | | | | | 1,795,526 | |
| | | | | | | | | |
| Consumer Staples — 3.3% | | | | | | | | |
| JM Smucker Co. (The) | | | 1,771 | | | | 165,571 | |
| Monster Beverage Corp.* | | | 15,206 | | | | 748,439 | |
| Unilever NV (United Kingdom) | | | 14,039 | | | | 755,298 | |
| | | | | | | | 1,669,308 | |
| Total Common Stocks | | | | | | $ | 49,819,351 | |
| | | | | | | | | |
| Short-Term Investment Fund — 2.6% | | | | | | | | |
| Dreyfus Government Cash Management, Institutional Shares,2.29%∞Ω | | | 1,314,717 | | | $ | 1,314,717 | |
| Total Investment Securities —100.1% | | | | | | | | |
| (Cost $44,492,800) | | | | | | $ | 51,134,068 | |
| | | | | | | | | |
| Liabilities in Excess of Other Assets — (0.1%) | | | | | | | (74,550 | ) |
| | | | | | | | | |
| Net Assets — 100.0% | | | | | | $ | 51,059,518 | |
| * | Non-income producing security. |
| Ω | Represents the 7-day SEC yield as of December 31, 2018. |
Portfolio Abbreviations:
ADR - American Depositary Receipt
REIT - Real Estate Investment Trust
Touchstone Focused Fund (Continued)
Other Information:
The inputs or methodology used for valuing securities may not be an indication of the risk associated with investing in those securities. For more information on valuation inputs, and their aggregation into the levels used in the table below, please refer to the security valuation section in the accompanying Notes to Financial Statements.
| | | Valuation inputs at Reporting Date: | |
| Description | | Level 1 | | | Level 2 | | | Level 3 | | | Total | |
| Common Stocks | | $ | 49,819,351 | | | $ | — | | | $ | — | | | $ | 49,819,351 | |
| Short-Term Investment Fund | | | 1,314,717 | | | | — | | | | — | | | | 1,314,717 | |
| Total | | $ | 51,134,068 | | | $ | — | | | $ | — | | | $ | 51,134,068 | |
See accompanying Notes to Financial Statements.
Portfolio of Investments
Touchstone Large Cap Core Equity Fund – December 31, 2018
| | | | | | Market | |
| | | Shares | | | Value | |
| | | | | | | |
| Common Stocks — 98.8% | | | | | | | | |
| | | | | | | | | |
| Financials — 24.8% | | | | | | | | |
| Alleghany Corp. | | | 1,432 | | | $ | 892,594 | |
| Bank of America Corp. | | | 16,204 | | | | 399,267 | |
| Berkshire Hathaway, Inc. - Class B* | | | 9,979 | | | | 2,037,512 | |
| BlackRock, Inc. | | | 2,252 | | | | 884,631 | |
| Progressive Corp. (The) | | | 23,556 | | | | 1,421,133 | |
| Wells Fargo & Co. | | | 16,442 | | | | 757,647 | |
| | | | | | | | 6,392,784 | |
| | | | | | | | | |
| Consumer Discretionary — 20.1% | | | | | | | | |
| CarMax, Inc.* | | | 15,777 | | | | 989,691 | |
| Carnival Corp. | | | 19,104 | | | | 941,827 | |
| Dollar Tree, Inc.* | | | 13,050 | | | | 1,178,676 | |
| Home Depot, Inc. (The) | | | 4,737 | | | | 813,911 | |
| Lowe's Cos., Inc. | | | 4,097 | | | | 378,399 | |
| O'Reilly Automotive, Inc.* | | | 2,553 | | | | 879,075 | |
| | | | | | | | 5,181,579 | |
| | | | | | | | | |
| Information Technology — 13.5% | | | | | | | | |
| Apple, Inc. | | | 8,298 | | | | 1,308,927 | |
| Cisco Systems, Inc. | | | 18,777 | | | | 813,607 | |
| Visa, Inc. - Class A | | | 10,239 | | | | 1,350,934 | |
| | | | | | | | 3,473,468 | |
| | | | | | | | | |
| Industrials — 13.0% | | | | | | | | |
| Deere & Co. | | | 2,553 | | | | 380,831 | |
| FedEx Corp. | | | 3,361 | | | | 542,230 | |
| General Dynamics Corp. | | | 4,122 | | | | 648,020 | |
| Norfolk Southern Corp. | | | 7,311 | | | | 1,093,287 | |
| Southwest Airlines Co. | | | 14,896 | | | | 692,366 | |
| | | | | | | | 3,356,734 | |
| | | | | | | | | |
| Materials — 8.4% | | | | | | | | |
| Albemarle Corp. | | | 8,421 | | | | 649,006 | |
| Martin Marietta Materials, Inc. | | | 4,164 | | | | 715,667 | |
| NewMarket Corp. | | | 1,948 | | | | 802,751 | |
| | | | | | | | 2,167,424 | |
| | | | | | | | | |
| Consumer Staples — 8.0% | | | | | | | | |
| Altria Group, Inc. | | | 13,717 | | | | 677,483 | |
| Coca-Cola Co. (The) | | | 10,863 | | | | 514,363 | |
| Nestle SA (Switzerland) ADR | | | 10,720 | | | | 867,891 | |
| | | | | | | | 2,059,737 | |
| | | | | | | | | |
| Communication Services — 7.0% | | | | | | | | |
| Alphabet, Inc. - Class C* | | | 1,298 | | | | 1,344,222 | |
| Verizon Communications, Inc. | | | 8,334 | | | | 468,537 | |
| | | | | | | | 1,812,759 | |
| | | | | | | | | |
| Energy — 2.1% | | | | | | | | |
| Chevron Corp. | | | 5,083 | | | | 552,980 | |
| | | | | | | | | |
| Health Care — 1.9% | | | | | | | | |
| Bristol-Myers Squibb Co. | | | 9,622 | | | | 500,152 | |
| Total Common Stocks | | | | | | $ | 25,497,617 | |
| | | | | | | | | |
| Short-Term Investment Fund — 1.4% | | | | | | |
| Dreyfus Government Cash | | | | | | | | |
| Management, Institutional Shares, | | | | | | | | |
| 2.29%∞Ω | | | 353,936 | | | $ | 353,936 | |
| | | | | | | | | |
| Total Investment Securities —100.2% | | | | | | | | |
| (Cost $23,216,653) | | | | | | $ | 25,851,553 | |
| | | | | | | | | |
| Liabilities in Excess of Other Assets — (0.2%) | | | | | | | (41,327 | ) |
| | | | | | | | | |
| Net Assets — 100.0% | | | | | | $ | 25,810,226 | |
| * | Non-income producing security. |
| Ω | Represents the 7-day SEC yield as of December 31, 2018. |
Portfolio Abbreviations:
ADR - American Depositary Receipt
Other Information:
The inputs or methodology used for valuing securities may not be an indication of the risk associated with investing in those securities. For more information on valuation inputs, and their aggregation into the levels used in the table below, please refer to the security valuation section in the accompanying Notes to Financial Statements.
| | | Valuation Inputs at Reporting Date: | |
| Description | | Level 1 | | | Level 2 | | | Level 3 | | | Total | |
| Common Stocks | | $ | 25,497,617 | | | $ | — | | | $ | — | | | $ | 25,497,617 | |
| Short-Term Investment Fund | | | 353,936 | | | | — | | | | — | | | | 353,936 | |
| Total | | $ | 25,851,553 | | | $ | — | | | $ | — | | | $ | 25,851,553 | |
See accompanying Notes to Financial Statements.
Portfolio of Investments
Touchstone Small Company Fund– December 31, 2018
| | | | | | Market | |
| | | Shares | | | Value | |
| | | | | | | |
| Common Stocks — 96.7% | | | | | | | | |
| | | | | | | | | |
| Information Technology — 24.1% | | | | | | | | |
| 8x8, Inc.* | | | 48,000 | | | $ | 865,920 | |
| Aspen Technology, Inc.* | | | 10,723 | | | | 881,216 | |
| Avaya Holdings Corp.* | | | 79,065 | | | | 1,151,186 | |
| Bottomline Technologies (de), Inc.* | | | 15,218 | | | | 730,464 | |
| Carbonite, Inc.* | | | 34,638 | | | | 874,956 | |
| Cision Ltd.* | | | 66,111 | | | | 773,499 | |
| CommVault Systems, Inc.* | | | 14,610 | | | | 863,305 | |
| j2 Global, Inc. | | | 12,485 | | | | 866,209 | |
| MAXIMUS, Inc. | | | 13,187 | | | | 858,342 | |
| NetScout Systems, Inc.* | | | 32,683 | | | | 772,299 | |
| Nice Ltd. (Israel) ADR* | | | 8,268 | | | | 894,680 | |
| Nuance Communications, Inc.* | | | 65,498 | | | | 866,539 | |
| ON Semiconductor Corp.* | | | 35,141 | | | | 580,178 | |
| Open Text Corp. (Canada) | | | 20,214 | | | | 658,976 | |
| Plantronics, Inc. | | | 24,987 | | | | 827,070 | |
| Verint Systems, Inc.* | | | 34,600 | | | | 1,463,926 | |
| | | | | | | | 13,928,765 | |
| | | | | | | | | |
| Industrials — 22.5% | | | | | | | | |
| Clean Harbors, Inc.* | | | 17,500 | | | | 863,625 | |
| Crane Co. | | | 16,682 | | | | 1,204,107 | |
| EnerSys | | | 16,633 | | | | 1,290,887 | |
| Genesee & Wyoming, Inc. - Class A* | | | 10,957 | | | | 811,037 | |
| Hillenbrand, Inc. | | | 22,243 | | | | 843,677 | |
| ITT, Inc. | | | 24,248 | | | | 1,170,451 | |
| Knight-Swift Transportation | | | | | | | | |
| Holdings, Inc. | | | 31,081 | | | | 779,201 | |
| Mobile Mini, Inc. | | | 25,685 | | | | 815,499 | |
| Quanta Services, Inc. | | | 46,933 | | | | 1,412,683 | |
| Regal Beloit Corp. | | | 20,907 | | | | 1,464,535 | |
| SkyWest, Inc. | | | 25,800 | | | | 1,147,326 | |
| Woodward, Inc. | | | 16,761 | | | | 1,245,175 | |
| | | | | | | | 13,048,203 | |
| | | | | | | | | |
| Health Care — 19.8% | | | | | | | | |
| Allscripts Healthcare Solutions, Inc.* | | | 152,000 | | | | 1,465,280 | |
| AngioDynamics, Inc.* | | | 40,599 | | | | 817,258 | |
| Bio-Rad Laboratories, Inc. - Class A* | | | 2,996 | | | | 695,731 | |
| Bio-Techne Corp. | | | 5,036 | | | | 728,810 | |
| Diplomat Pharmacy, Inc.* | | | 1 | | | | 13 | |
| Encompass Health Corp. | | | 11,983 | | | | 739,351 | |
| Globus Medical, Inc. - Class A* | | | 20,068 | | | | 868,543 | |
| Haemonetics Corp.* | | | 8,640 | | | | 864,432 | |
| MEDNAX, Inc.* | | | 25,988 | | | | 857,604 | |
| NuVasive, Inc.* | | | 23,953 | | | | 1,187,111 | |
| Omnicell, Inc.* | | | 12,531 | | | | 767,398 | |
| Orthofix Medical, Inc.* | | | 16,624 | | | | 872,594 | |
| Tactile Systems Technology, Inc.* | | | 16,694 | | | | 760,412 | |
| Tivity Health, Inc.* | | | 32,950 | | | | 817,490 | |
| | | | | | | | 11,442,027 | |
| | | | | | | | | |
| Consumer Discretionary — 13.8% | | | | | | | | |
| Aaron's, Inc. | | | 20,962 | | | | 881,452 | |
| Adtalem Global Education, Inc.* | | | 18,185 | | | | 860,514 | |
| Bloomin' Brands, Inc. | | | 68,772 | | | | 1,230,331 | |
| Brunswick Corp. | | | 4,300 | | | | 199,735 | |
| Dave & Buster's Entertainment, Inc. | | | 18,781 | | | | 836,881 | |
| Dick's Sporting Goods, Inc. | | | 27,697 | | | | 864,146 | |
| G-III Apparel Group Ltd.* | | | 6,000 | | | | 167,340 | |
| Movado Group, Inc. | | | 6,000 | | | | 189,720 | |
| Oxford Industries, Inc. | | | 2,500 | | | | 177,600 | |
| Steven Madden Ltd. | | | 6,100 | | | | 184,586 | |
| Texas Roadhouse, Inc. | | | 13,978 | | | | 834,487 | |
| TopBuild Corp.* | | | 30,800 | | | | 1,386,000 | |
| Williams-Sonoma, Inc. | | | 3,800 | | | | 191,710 | |
| | | | | | | | 8,004,502 | |
| | | | | | | | | |
| Financials — 10.1% | | | | | | | | |
| Chemical Financial Corp. | | | 31,600 | | | | 1,156,876 | |
| Glacier Bancorp, Inc. | | | 14,992 | | | | 593,983 | |
| Heartland Financial USA, Inc. | | | 19,026 | | | | 836,193 | |
| Webster Financial Corp. | | | 24,173 | | | | 1,191,487 | |
| Western Alliance Bancorp* | | | 29,877 | | | | 1,179,843 | |
| WSFS Financial Corp. | | | 22,800 | | | | 864,348 | |
| | | | | | | | 5,822,730 | |
| | | | | | | | | |
| Communication Services — 2.9% | | | | | | | | |
| Care.com, Inc.* | | | 20,000 | | | | 386,200 | |
| Cogent Communications Holdings, Inc. | | | 19,280 | | | | 871,649 | |
| QuinStreet, Inc.* | | | 26,000 | | | | 421,980 | |
| | | | | | | | 1,679,829 | |
| | | | | | | | | |
| Consumer Staples — 2.1% | | | | | | | | |
| Sprouts Farmers Market, Inc.* | | | 51,500 | | | | 1,210,765 | |
| | | | | | | | | |
| Real Estate — 1.4% | | | | | | | | |
| Corporate Office Properties Trust REIT | | | 38,945 | | | | 819,013 | |
| Total Common Stocks | | | | | | $ | 55,955,834 | |
| | | | | | | | | |
| Short-Term Investment Fund — 3.7% | | | | | | | | |
| Dreyfus Government Cash Management, Institutional Shares,2.29%∞Ω | | | 2,159,365 | | | $ | 2,159,366 | |
| | | | | | | | | |
| Total Investment Securities —100.4% | | | | | | | | |
| (Cost $53,872,972) | | | | | | $ | 58,115,200 | |
| | | | | | | | | |
| Liabilities in Excess of Other Assets — (0.4%) | | | | | | | (231,002 | ) |
| | | | | | | | | |
| Net Assets — 100.0% | | | | | | $ | 57,884,198 | |
| * | Non-income producing security. |
| Ω | Represents the 7-day SEC yield as of December 31, 2018. |
Portfolio Abbreviations:
ADR - American Depositary Receipt
REIT - Real Estate Investment Trust
Touchstone Small Company Fund(Continued)
Other Information:
The inputs or methodology used for valuing securities may not be an indication of the risk associated with investing in those securities. For more information on valuation inputs, and their aggregation into the levels used in the table below, please refer to the security valuation section in the accompanying Notes to Financial Statements.
| | | Valuation inputs at Reporting Date: | |
| Description | | Level 1 | | | Level 2 | | | Level 3 | | | Total | |
| Common Stocks | | $ | 55,955,834 | | | $ | — | | | $ | — | | | $ | 55,955,834 | |
| Short-Term Investment Fund | | | 2,159,366 | | | | — | | | | — | | | | 2,159,366 | |
| Total | | $ | 58,115,200 | | | $ | — | | | $ | — | | | $ | 58,115,200 | |
See accompanying Notes to Financial Statements.
Portfolio of Investments
Touchstone Aggressive ETF Fund– December 31, 2018
| | | | | | Market | |
| | | Shares | | | Value | |
| | | | | | | |
| Exchange-Traded Funds — 97.3% | | | | | | | | |
| | | | | | | | | |
| Equity Funds — 79.8% | | | | | | | | |
| iShares Core S&P Small-Cap ETF | | | 8,600 | | | $ | 596,152 | |
| Vanguard Extended Market ETF† | | | 18,575 | | | | 1,853,971 | |
| Vanguard FTSE Developed Markets ETF | | | 88,735 | | | | 3,292,069 | |
| Vanguard FTSE Emerging Markets ETF | | | 33,440 | | | | 1,274,064 | |
| Vanguard S&P 500 ETF | | | 23,710 | | | | 5,448,795 | |
| Vanguard Value ETF | | | 10,300 | | | | 1,008,885 | |
| | | | | | | | 13,473,936 | |
| | | | | | | | | |
| Fixed Income Funds — 17.5% | | | | | | | | |
| iShares Core 1-5 Year USD Bond ETF | | | 7,460 | | | | 366,211 | |
| iShares Core US Aggregate Bond ETF | | | 12,705 | | | | 1,352,956 | |
| iShares Floating Rate Bond ETF | | | 8,940 | | | | 450,218 | |
| iShares iBoxx $ High Yield Corporate Bond ETF† | | | 4,120 | | | | 334,132 | |
| Vanguard Intermediate-Term Corporate Bond ETF | | | 5,510 | | | | 456,559 | |
| | | | | | | | 2,960,076 | |
| | | | | | | | | |
| Total Exchange-Traded Funds | | | | | | $ | 16,434,012 | |
| | | | | | | | | |
| Short-Term Investment Funds — 15.9% | | | | | | | | |
| Dreyfus Government Cash Management, Institutional Shares,2.29%∞Ω | | | 507,163 | | | | 507,163 | |
| Invesco Government & Agency Portfolio, Institutional Class,2.30%**∞Ω | | | 2,189,455 | | | | 2,189,455 | |
| Total Short-Term Investment Funds | | | | | | $ | 2,696,618 | |
| | | | | | | | | |
| Total Investment Securities —113.2% | | | | | | | | |
| (Cost $18,726,802) | | | | | | $ | 19,130,630 | |
| | | | | | | | | |
| Liabilities in Excess of Other Assets — (13.2%) | | | | | | | (2,237,073 | ) |
| | | | | | | | | |
| Net Assets — 100.0% | | | | | | $ | 16,893,557 | |
| ** | Represents collateral for securities loaned. |
| † | All or a portion of the security is on loan. The total market value of the securities on loan as of December 31, 2018 was $2,161,752. |
| Ω | Represents the 7-day SEC yield as of December 31, 2018. |
Portfolio Abbreviations:
ETF - Exchange-Traded Fund
Other Information:
The inputs or methodology used for valuing securities may not be an indication of the risk associated with investing in those securities. For more information on valuation inputs, and their aggregation into the levels used in the table below, please refer to the security valuation section in the accompanying Notes to Financial Statements.
| | | Valuation inputs at Reporting Date: | |
| Description | | Level 1 | | | Level 2 | | | Level 3 | | | Total | |
| Exchange-Traded Funds | | $ | 16,434,012 | | | $ | — | | | $ | — | | | $ | 16,434,012 | |
| Short-Term Investment Funds | | | 2,696,618 | | | | — | | | | — | | | | 2,696,618 | |
| Total | | $ | 19,130,630 | | | $ | — | | | $ | — | | | $ | 19,130,630 | |
See accompanying Notes to Financial Statements.
Portfolio of Investments
Touchstone Conservative ETF Fund– December 31, 2018
| | | | | | Market | |
| | | Shares | | | Value | |
| | | | | | | |
| Exchange-Traded Funds — 97.5% | | | | | | | | |
| | | | | | | | | |
| Fixed Income Funds — 57.9% | | | | | | | | |
| Invesco Senior Loan ETF† | | | 19,410 | | | $ | 422,750 | |
| iShares Core 1-5 Year USD Bond ETF | | | 31,200 | | | | 1,531,608 | |
| iShares Core US Aggregate Bond ETF | | | 41,350 | | | | 4,403,361 | |
| iShares Floating Rate Bond ETF | | | 19,340 | | | | 973,962 | |
| iShares iBoxx $ High Yield Corporate Bond ETF† | | | 9,425 | | | | 764,368 | |
| Vanguard Intermediate-Term Corporate Bond ETF | | | 17,355 | | | | 1,438,035 | |
| Vanguard Total International Bond ETF | | | 6,280 | | | | 340,690 | |
| | | | | | | | 9,874,774 | |
| | | | | | | | | |
| Equity Funds — 39.6% | | | | | | | | |
| iShares Core S&P Small-Cap ETF | | | 5,030 | | | | 348,680 | |
| Vanguard Extended Market ETF† | | | 9,535 | | | | 951,688 | |
| Vanguard FTSE Developed Markets ETF | | | 41,545 | | | | 1,541,320 | |
| Vanguard FTSE Emerging Markets ETF | | | 13,680 | | | | 521,208 | |
| Vanguard S&P 500 ETF | | | 12,535 | | | | 2,880,668 | |
| Vanguard Value ETF | | | 5,065 | | | | 496,117 | |
| | | | | | | | 6,739,681 | |
| | | | | | | | | |
| Total Exchange-Traded Funds | | | | | | $ | 16,614,455 | |
| | | | | | | | | |
| Short-Term Investment Funds — 15.4% | | | | | | | | |
| Dreyfus Government Cash Management, Institutional Shares,2.29%∞Ω | | | 487,935 | | | | 487,935 | |
| Invesco Government & Agency Portfolio, Institutional Class,2.30%**∞Ω | | | 2,146,729 | | | | 2,146,729 | |
| Total Short-Term Investment Funds | | | | | | $ | 2,634,664 | |
| | | | | | | | | |
| Total Investment Securities —112.9% | | | | | | | | |
| (Cost $18,850,931) | | | | | | $ | 19,249,119 | |
| | | | | | | | | |
| Liabilities in Excess of Other Assets — (12.9%) | | | | | | | (2,205,596 | ) |
| | | | | | | | | |
| Net Assets — 100.0% | | | | | | $ | 17,043,523 | |
| ** | Represents collateral for securities loaned. |
| † | All or a portion of the security is on loan. The total market value of the securities on loan as of December 31, 2018 was $2,110,233. |
| Ω | Represents the 7-day SEC yield as of December 31, 2018. |
Portfolio Abbreviations:
ETF - Exchange-Traded Fund
Other Information:
The inputs or methodology used for valuing securities may not be an indication of the risk associated with investing in those securities. For more information on valuation inputs, and their aggregation into the levels used in the table below, please refer to the security valuation section in the accompanying Notes to Financial Statements.
| | | Valuation inputs at Reporting Date: | |
| Description | | Level 1 | | | Level 2 | | | Level 3 | | | Total | |
| Exchange-Traded Funds | | $ | 16,614,455 | | | $ | — | | | $ | — | | | $ | 16,614,455 | |
| Short-Term Investment Funds | | | 2,634,664 | | | | — | | | | — | | | | 2,634,664 | |
| Total | | $ | 19,249,119 | | | $ | — | | | $ | — | | | $ | 19,249,119 | |
See accompanying Notes to Financial Statements.
Portfolio of Investments
Touchstone Moderate ETF Fund– December 31, 2018
| | | | | | Market | |
| | | Shares | | | Value | |
| | | | | | | |
| Exchange-Traded Funds — 97.7% | | | | | | | | |
| | | | | | | | | |
| Equity Funds — 59.7% | | | | | | | | |
| iShares Core S&P Small-Cap ETF | | | 7,990 | | | $ | 553,867 | |
| Vanguard Extended Market ETF† | | | 15,250 | | | | 1,522,102 | |
| Vanguard FTSE Developed Markets ETF | | | 68,005 | | | | 2,522,985 | |
| Vanguard FTSE Emerging Markets ETF | | | 26,980 | | | | 1,027,938 | |
| Vanguard S&P 500 ETF | | | 20,300 | | | | 4,665,143 | |
| Vanguard Value ETF | | | 8,585 | | | | 840,901 | |
| | | | | | | | 11,132,936 | |
| | | | | | | | | |
| Fixed Income Funds — 38.0% | | | | | | | | |
| Invesco Senior Loan ETF† | | | 17,530 | | | | 381,803 | |
| iShares Core 1-5 Year USD Bond ETF | | | 20,720 | | | | 1,017,145 | |
| iShares Core US Aggregate Bond ETF | | | 27,645 | | | | 2,943,916 | |
| iShares Floating Rate Bond ETF | | | 15,880 | | | | 799,717 | |
| iShares iBoxx $ High Yield Corporate Bond ETF† | | | 6,810 | | | | 552,291 | |
| Vanguard Intermediate-Term Corporate Bond ETF | | | 14,695 | | | | 1,217,628 | |
| Vanguard Total International Bond ETF | | | 3,420 | | | | 185,535 | |
| | | | | | | | 7,098,035 | |
| Total Exchange-Traded Funds | | | | | | $ | 18,230,971 | |
| | | | | | | | | |
| Short-Term Investment Funds — 15.8% | | | | | | | | |
| Dreyfus Government Cash Management, Institutional Shares,2.29%∞Ω | | | 485,971 | | | | 485,971 | |
| Invesco Government & Agency Portfolio, Institutional Class,2.30%**∞Ω | | | 2,464,847 | | | | 2,464,847 | |
| Total Short-Term Investment Funds | | | | | | $ | 2,950,818 | |
| | | | | | | | | |
| Total Investment Securities —113.5% | | | | | | | | |
| (Cost $21,012,151) | | | | | | $ | 21,181,789 | |
| | | | | | | | | |
| Liabilities in Excess of Other Assets — (13.5%) | | | | | | | (2,523,091 | ) |
| | | | | | | | | |
| Net Assets — 100.0% | | | | | | $ | 18,658,698 | |
| ** | Represents collateral for securities loaned. |
| † | All or a portion of the security is on loan. The total market value of the securities on loan as of December 31, 2018 was $2,426,833. |
| Ω | Represents the 7-day SEC yield as of December 31, 2018. |
Portfolio Abbreviations:
ETF - Exchange-Traded Fund
Other Information:
The inputs or methodology used for valuing securities may not be an indication of the risk associated with investing in those securities. For more information on valuation inputs, and their aggregation into the levels used in the table below, please refer to the security valuation section in the accompanying Notes to Financial Statements.
| | | Valuation inputs at Reporting Date: | |
| Description | | Level 1 | | | Level 2 | | | Level 3 | | | Total | |
| Exchange-Traded Funds | | $ | 18,230,971 | | | $ | — | | | $ | — | | | $ | 18,230,971 | |
| Short-Term Investment Funds | | | 2,950,818 | | | | — | | | | — | | | | 2,950,818 | |
| Total | | $ | 21,181,789 | | | $ | — | | | $ | — | | | $ | 21,181,789 | |
See accompanying Notes to Financial Statements.
Statements of Assets and Liabilities
December 31, 2018
| | | Touchstone | | | Touchstone | | | Touchstone | |
| | | Active Bond | | | Balanced | | | Bond | |
| | | Fund | | | Fund | | | Fund | |
| Assets | | | | | | | | | | | | |
| Investments, at cost | | $ | 55,948,145 | | | $ | 15,459,158 | | | $ | 42,581,176 | |
| Investments, at market value(A) | | $ | 55,220,457 | | | $ | 15,976,282 | | | $ | 41,637,478 | |
| Cash | | | — | | | | — | | | | — | |
| Cash deposits held at prime broker(B) | | | 18,889 | | | | — | | | | — | |
| Dividends and interest receivable | | | 366,181 | | | | 39,757 | | | | 255,615 | |
| Receivable for capital shares sold | | | 244,503 | | | | — | | | | 2,473 | |
| Receivable for investments sold | | | — | | | | — | | | | — | |
| Securities lending income receivable | | | — | | | | 11 | | | | — | |
| Receivable from other affiliates | | | — | | | | — | | | | — | |
| Tax reclaim receivable | | | — | | | | — | | | | — | |
| Other assets | | | 483 | | | | 148 | | | | 376 | |
| Total Assets | | | 55,850,513 | | | | 16,016,198 | | | | 41,895,942 | |
| | | | | | | | | | | | | |
| Liabilities | | | | | | | | | | | | |
| Payable for return of collateral for securities on loan | | | — | | | | — | | | | — | |
| Payable for capital shares redeemed | | | 7,392 | | | | 2,524 | | | | 26,405 | |
| Payable for variation margin for futures contracts | | | 5,135 | | | | — | | | | — | |
| Payable for investments purchased | | | — | | | | — | | | | — | |
| Payable for custody fees | | | 3,634 | | | | 867 | | | | 897 | |
| Payable to Investment Advisor | | | 18,803 | | | | 1,936 | | | | 2,677 | |
| Payable to other affiliates | | | 18,904 | | | | 118 | | | | 118 | |
| Payable to Trustees | | | 3,608 | | | | 3,608 | | | | 3,608 | |
| Payable for professional services | | | 21,384 | | | | 21,123 | | | | 21,239 | |
| Payable for pricing services | | | 12,988 | | | | 7,160 | | | | 5,524 | |
| Payable for reports to shareholders | | | 3,404 | | | | 4,066 | | | | 14,925 | |
| Payable to Transfer Agent | | | 3,172 | | | | 700 | | | | 9,046 | |
| Other accrued expenses and liabilities | | | 3,338 | | | | 3,409 | | | | 3,363 | |
| Total Liabilities | | | 101,762 | | | | 45,511 | | | | 87,802 | |
| | | | | | | | | | | | | |
| Net Assets | | $ | 55,748,751 | | | $ | 15,970,687 | | | $ | 41,808,140 | |
| | | | | | | | | | | | | |
| Net assets consist of: | | | | | | | | | | | | |
| Paid-in capital | | $ | 57,418,348 | | | $ | 15,223,003 | | | $ | 45,237,578 | |
| Distributable earnings (deficit) | | | (1,669,597 | ) | | | 747,684 | | | | (3,429,438 | ) |
| Net assets applicable to shares outstanding | | $ | 55,748,751 | | | $ | 15,970,687 | | | $ | 41,808,140 | |
| | | | | | | | | | | | | |
| Shares of beneficial interest outstanding (unlimited number of shares authorized, no par value) | | | 5,463,060 | | | | 1,619,101 | | | | 4,547,568 | |
| Net asset value, offering price and redemption price per share | | $ | 10.20 | | | $ | 9.86 | | | $ | 9.19 | |
| (A) Includes market value of securities on loan of: | | $ | — | | | $ | — | | | $ | — | |
| (B) Represents segregated cash for futures contracts. | | | | | | | | | | | | |
See accompanying Notes to Financial Statements.
Statements of Assets and Liabilities(Continued)
| | | | | | | Touchstone | | | | | | | | | Touchstone | | | | |
| Touchstone | | | Touchstone | | | Large Cap | | | Touchstone | | | Touchstone | | | Conservative | | | Touchstone | |
| Common Stock | | | Focused | | | Core Equity | | | Small Company | | | Aggressive ETF | | | ETF | | | Moderate ETF | |
| Fund | | | Fund | | | Fund | | | Fund | | | Fund | | | Fund | | | Fund | |
| | | | | | | | | | | | | | | | | | | | | | | | | | | |
| $ | 115,035,292 | | | $ | 44,492,800 | | | $ | 23,216,653 | | | $ | 53,872,972 | | | $ | 18,726,802 | | | $ | 18,850,931 | | | $ | 21,012,151 | |
| $ | 124,839,222 | | | $ | 51,134,068 | | | $ | 25,851,553 | | | $ | 58,115,200 | | | $ | 19,130,630 | | | $ | 19,249,119 | | | $ | 21,181,789 | |
| | — | | | | — | | | | — | | | | 66 | | | | — | | | | — | | | | — | |
| | — | | | | — | | | | — | | | | — | | | | — | | | | — | | | | — | |
| | 48,382 | | | | 20,052 | | | | 23,772 | | | | 27,934 | | | | — | | | | — | | | | — | |
| | 5,852 | | | | 2,456 | | | | 509 | | | | 34,763 | | | | 30 | | | | — | | | | — | |
| | 62,274 | | | | 25,463 | | | | — | | | | 943,714 | | | | — | | | | — | | | | — | |
| | 121 | | | | — | | | | — | | | | — | | | | 2,328 | | | | 4,638 | | | | 3,743 | |
| | 7,788 | | | | — | | | | — | | | | 13,763 | | | | — | | | | — | | | | — | |
| | — | | | | 7,488 | | | | — | | | | — | | | | — | | | | — | | | | — | |
| | 1,214 | | | | 494 | | | | 246 | | | | 585 | | | | 157 | | | | 157 | | | | 176 | |
| | 124,964,853 | | | | 51,190,021 | | | | 25,876,080 | | | | 59,136,025 | | | | 19,133,145 | | | | 19,253,914 | | | | 21,185,708 | |
| | | | | | | | | | | | | | | | | | | | | | | | | | | |
| | — | | | | — | | | | — | | | | — | | | | 2,189,455 | | | | 2,146,729 | | | | 2,464,847 | |
| | 32,707 | | | | 16,106 | | | | 7,380 | | | | 5,370 | | | | 6,920 | | | | 21,284 | | | | 15,730 | |
| | — | | | | — | | | | — | | | | — | | | | — | | | | — | | | | — | |
| | — | | | | — | | | | — | | | | 1,166,349 | | | | — | | | | — | | | | — | |
| | 842 | | | | 708 | | | | 866 | | | | 1,258 | | | | 503 | | | | 520 | | | | 532 | |
| | 54,277 | | | | 31,625 | | | | 14,581 | | | | 25,806 | | | | 3,662 | | | | 3,664 | | | | 4,077 | |
| | — | | | | 44,514 | | | | 10,820 | | | | — | | | | 8,402 | | | | 7,516 | | | | 11,114 | |
| | 3,608 | | | | 3,608 | | | | 3,608 | | | | 3,608 | | | | 3,608 | | | | 3,608 | | | | 3,608 | |
| | 21,299 | | | | 20,878 | | | | 19,687 | | | | 20,573 | | | | 19,986 | | | | 19,975 | | | | 20,000 | |
| | 854 | | | | 860 | | | | 607 | | | | 1,490 | | | | 203 | | | | 244 | | | | 244 | |
| | 18,943 | | | | 3,314 | | | | 3,540 | | | | 17,700 | | | | 3,404 | | | | 3,404 | | | | 3,404 | |
| | 32,801 | | | | 5,548 | | | | 1,375 | | | | 6,349 | | | | 38 | | | | 38 | | | | 51 | |
| | 3,198 | | | | 3,342 | | | | 3,390 | | | | 3,324 | | | | 3,407 | | | | 3,409 | | | | 3,403 | |
| | 168,529 | | | | 130,503 | | | | 65,854 | | | | 1,251,827 | | | | 2,239,588 | | | | 2,210,391 | | | | 2,527,010 | |
| | | | | | | | | | | | | | | | | | | | | | | | | | | |
| $ | 124,796,324 | | | $ | 51,059,518 | | | $ | 25,810,226 | | | $ | 57,884,198 | | | $ | 16,893,557 | | | $ | 17,043,523 | | | $ | 18,658,698 | |
| | | | | | | | | | | | | | | | | | | | | | | | | | | |
| $ | 111,486,075 | | | $ | 42,697,001 | | | $ | 20,577,347 | | | $ | 46,859,650 | | | $ | 15,164,078 | | | $ | 16,196,426 | | | $ | 17,144,490 | |
| | 13,310,249 | | | | 8,362,517 | | | | 5,232,879 | | | | 11,024,548 | | | | 1,729,479 | | | | 847,097 | | | | 1,514,208 | |
| $ | 124,796,324 | | | $ | 51,059,518 | | | $ | 25,810,226 | | | $ | 57,884,198 | | | $ | 16,893,557 | | | $ | 17,043,523 | | | $ | 18,658,698 | |
| | | | | | | | | | | | | | | | | | | | | | | | | | | |
| | 17,133,446 | | | | 3,018,774 | | | | 1,764,679 | | | | 4,560,876 | | | | 1,145,158 | | | | 1,567,770 | | | | 1,710,560 | |
| $ | 7.28 | | | $ | 16.91 | | | $ | 14.63 | | | $ | 12.69 | | | $ | 14.75 | | | $ | 10.87 | | | $ | 10.91 | |
| $ | — | | | $ | — | | | $ | — | | | $ | — | | | $ | 2,161,752 | | | $ | 2,110,233 | | | $ | 2,426,833 | |
Statements of Operations
For the Year Ended December 31, 2018
| | | Touchstone | | | Touchstone | | | Touchstone | |
| | | Active Bond | | | Balanced | | | Bond | |
| | | Fund | | | Fund | | | Fund | |
| Investment Income | | | | | | | | | | | | |
| Dividends(A) | | $ | 160,449 | | | $ | 196,810 | | | $ | 126,781 | |
| Interest | | | 1,715,366 | | | | 166,413 | | | | 1,331,457 | |
| Income from securities loaned | | | 8 | | | | 37 | | | | 23 | |
| Total Investment Income | | | 1,875,823 | | | | 363,260 | | | | 1,458,261 | |
| | | | | | | | | | | | | |
| Expenses | | | | | | | | | | | | |
| Investment advisory fees | | | 225,533 | | | | 96,315 | | | | 177,303 | |
| Administration fees | | | 81,756 | | | | 25,392 | | | | 64,272 | |
| Compliance fees and expenses | | | 1,386 | | | | 1,386 | | | | 1,386 | |
| Custody fees | | | 35,337 | | | | 6,548 | | | | 6,693 | |
| Professional fees | | | 25,276 | | | | 24,172 | | | | 26,667 | |
| Transfer Agent fees | | | 12,460 | | | | 3,666 | | | | 54,674 | |
| Pricing expense | | | 27,587 | | | | 16,747 | | | | 11,573 | |
| Reports to Shareholders | | | 4,927 | | | | 5,798 | | | | 22,986 | |
| Shareholder servicing fees | | | 37,667 | | | | — | | | | — | |
| Trustee fees | | | 14,546 | | | | 14,546 | | | | 14,546 | |
| Other expenses | | | 7,203 | | | | 6,977 | | | | 7,265 | |
| Total Expenses | | | 473,678 | | | | 201,547 | | | | 387,365 | |
| Fees waived and/or reimbursed by the Advisor and/or Affiliates(B) | | | — | | | | (52,697 | ) | | | (90,383 | ) |
| Fees recouped by the Advisor(B) | | | — | | | | — | | | | — | |
| Net Expenses | | | 473,678 | | | | 148,850 | | | | 296,982 | |
| | | | | | | | | | | | | |
| Net Investment Income | | | 1,402,145 | | | | 214,410 | | | | 1,161,279 | |
| | | | | | | | | | | | | |
| Realized and Unrealized Gains (Losses) on Investments | | | | | | | | | | | | |
| Net realized gains (losses) on investments | | | (1,143,539 | ) | | | 26,223 | | | | (942,261 | ) |
| Net realized losses on futures contracts | | | (110,728 | ) | | | — | | | | — | |
| Net change in unrealized appreciation (depreciation) on investments | | | (1,050,184 | ) | | | (1,254,657 | ) | | | (1,114,860 | ) |
| Net change in unrealized appreciation (depreciation) on foreign currency transactions | | | (9 | ) | | | — | | | | — | |
| Net change in unrealized appreciation (depreciation) on futures contracts | | | (6,334 | ) | | | — | | | | — | |
| | | | | | | | | | | | | |
| Net Realized and Unrealized Gains (Losses) on Investments | | | (2,310,794 | ) | | | (1,228,434 | ) | | | (2,057,121 | ) |
| | | | | | | | | | | | | |
| Change in Net Assets Resulting from Operations | | $ | (908,649 | ) | | $ | (1,014,024 | ) | | $ | (895,842 | ) |
| (A) Net of foreign tax withholding of: | | $ | — | | | $ | — | | | $ | — | |
| (B) See Note 4 in Notes to Financial Statements. | | | | | | | | | | | | |
See accompanying Notes to Financial Statements.
Statements of Operations (Continued)
| | | | | | | Touchstone | | | | | | | | | Touchstone | | | | |
| Touchstone | | | Touchstone | | | Large Cap | | | Touchstone | | | Touchstone | | | Conservative | | | Touchstone | |
| Common Stock | | | Focused | | | Core Equity | | | Small Company | | | Aggressive ETF | | | ETF | | | Moderate ETF | |
| Fund | | | Fund | | | Fund | | | Fund | | | Fund | | | Fund | | | Fund | |
| | | | | | | | | | | | | | | | | | | | | | | | | | | |
| $ | 2,246,034 | | | $ | 938,595 | | | $ | 497,706 | | | $ | 564,119 | | | $ | 443,563 | | | $ | 512,315 | | | $ | 542,758 | |
| | — | | | | — | | | | — | | | | — | | | | — | | | | — | | | | — | |
| | 849 | | | | 291 | | | | — | | | | 1,580 | | | | 11,769 | | | | 20,180 | | | | 17,589 | |
| | 2,246,883 | | | | 938,886 | | | | 497,706 | | | | 565,699 | | | | 455,332 | | | | 532,495 | | | | 560,347 | |
| | | | | | | | | | | | | | | | | | | | | | | | | | | |
| | 747,514 | | | | 418,997 | | | | 200,250 | | | | 347,492 | | | | 48,404 | | | | 47,599 | | | | 54,871 | |
| | 216,779 | | | | 86,792 | | | | 44,671 | | | | 100,773 | | | | 28,074 | | | | 27,608 | | | | 31,825 | |
| | 1,386 | | | | 1,386 | | | | 1,386 | | | | 1,386 | | | | 1,386 | | | | 1,386 | | | | 1,386 | |
| | 6,383 | | | | 14,928 | | | | 10,761 | | | | 7,597 | | | | 2,965 | | | | 3,158 | | | | 4,815 | |
| | 32,815 | | | | 23,881 | | | | 21,204 | | | | 26,712 | | | | 20,926 | | | | 20,873 | | | | 21,069 | |
| | 175,834 | | | | 21,769 | | | | 5,504 | | | | 49,179 | | | | 89 | | | | 88 | | | | 117 | |
| | 1,984 | | | | 1,795 | | | | 1,240 | | | | 3,566 | | | | 398 | | | | 489 | | | | 482 | |
| | 28,682 | | | | 5,415 | | | | 4,922 | | | | 26,741 | | | | 4,921 | | | | 4,921 | | | | 4,921 | |
| | — | | | | 118,804 | | | | 44,728 | | | | — | | | | 48,404 | | | | 47,599 | | | | 48,575 | |
| | 14,546 | | | | 14,546 | | | | 14,546 | | | | 14,546 | | | | 14,546 | | | | 14,546 | | | | 14,546 | |
| | 8,372 | | | | 8,324 | | | | 7,726 | | | | 7,511 | | | | 7,489 | | | | 7,463 | | | | 7,564 | |
| | 1,234,295 | | | | 716,637 | | | | 356,938 | | | | 585,503 | | | | 177,602 | | | | 175,730 | | | | 190,171 | |
| | (142,925 | ) | | | — | | | | (30,376 | ) | | | (57,315 | ) | | | (32,391 | ) | | | (32,932 | ) | | | (25,559 | ) |
| | — | | | | 7,629 | | | | — | | | | — | | | | — | | | | — | | | | — | |
| | 1,091,370 | | | | 724,266 | | | | 326,562 | | | | 528,188 | | | | 145,211 | | | | 142,798 | | | | 164,612 | |
| | 1,155,513 | | | | 214,620 | | | | 171,144 | | | | 37,511 | | | | 310,121 | | | | 389,697 | | | | 395,735 | |
| | | | | | | | | | | | | | | | | | | | | | | | | | | |
| | 2,353,226 | | | | 1,582,345 | | | | 2,431,422 | | | | 7,084,151 | | | | 1,015,976 | | | | 64,256 | | | | 949,343 | |
| | — | | | | — | | | | — | | | | — | | | | — | | | | — | | | | — | |
| | (13,834,239 | ) | | | (5,988,632 | ) | | | (4,368,016 | ) | | | (11,719,149 | ) | | | (2,737,022 | ) | | | (1,186,959 | ) | | | (2,550,390 | ) |
| | — | | | | (51 | ) | | | — | | | | — | | | | — | | | | — | | | | — | |
| | — | | | | — | | | | — | | | | — | | | | — | | | | — | | | | — | |
| | | | | | | | | | | | | | | | | | | | | | | | | | | |
| | (11,481,013 | ) | | | (4,406,338 | ) | | | (1,936,594 | ) | | | (4,634,998 | ) | | | (1,721,046 | ) | | | (1,122,703 | ) | | | (1,601,047 | ) |
| | | | | | | | | | | | | | | | | | | | | | | | | | | |
| $ | (10,325,500 | ) | | $ | (4,191,718 | ) | | $ | (1,765,450 | ) | | $ | (4,597,487 | ) | | $ | (1,410,925 | ) | | $ | (733,006 | ) | | $ | (1,205,312 | ) |
| $ | 86,767 | | | $ | 16,710 | | | $ | — | | | $ | 2,029 | | | $ | — | | | $ | — | | | $ | — | |
Statements of Changes in Net Assets
| | | Touchstone | | | Touchstone | |
| | | Active Bond | | | Balanced | |
| | | Fund | | | Fund | |
| | | For the | | | For the | | | For the | | | For the | |
| | | Year | | | Year | | | Year | | | Year | |
| | | Ended | | | Ended | | | Ended | | | Ended | |
| | | December 31, | | | December 31, | | | December 31, | | | December 31, | |
| | | 2018 | | | 2017 | | | 2018 | | | 2017(A) | |
| From Operations | | | | | | | | | | | | | | | | |
| Net investment income | | $ | 1,402,145 | | | $ | 1,169,110 | | | $ | 214,410 | | | $ | 169,908 | |
| Net realized gains (losses) on investments, foreign currency transactions and futures contracts | | | (1,254,267 | ) | | | 824,610 | | | | 26,223 | | | | 4,772,363 | |
| Net change in unrealized appreciation (depreciation) on investments, foreign currency transactions and futures contracts | | | (1,056,527 | ) | | | (28,864 | ) | | | (1,254,657 | ) | | | (2,726,271 | ) |
| Change in Net Assets from Operations | | | (908,649 | ) | | | 1,964,856 | | | | (1,014,024 | ) | | | 2,216,000 | |
| | | | | | | | | | | | | | | | | |
| Distributions to Shareholders from(B) : | | | | | | | | | | | | | | | | |
| Distributed earnings | | | (1,215,721 | ) | | | — | | | | (4,925,790 | ) | | | — | |
| Net investment income | | | — | | | | (1,484,379 | ) | | | — | | | | — | |
| Net realized gains | | | — | | | | — | | | | — | | | | — | |
| Total Distributions | | | (1,215,721 | ) | | | (1,484,379 | ) | | | (4,925,790 | ) | | | — | |
| | | | | | | | | | | | | | | | | |
| Share Transactions | | | | | | | | | | | | | | | | |
| Proceeds from Shares issued | | | 2,398,497 | | | | 4,755,717 | | | | 987,463 | | | | 2,585,460 | |
| Reinvestment of distributions | | | 1,215,721 | | | | 1,484,379 | | | | 4,925,790 | | | | — | |
| Cost of Shares redeemed | | | (3,109,625 | ) | | | (4,363,557 | ) | | | (1,966,389 | ) | | | (2,825,940 | ) |
| Change in Net Assets from Share Transactions | | | 504,593 | | | | 1,876,539 | | | | 3,946,864 | | | | (240,480 | ) |
| | | | | | | | | | | | | | | | | |
| Total Increase (Decrease) in Net Assets | | | (1,619,777 | ) | | | 2,357,016 | | | | (1,992,950 | ) | | | 1,975,520 | |
| | | | | | | | | | | | | | | | | |
| Net Assets | | | | | | | | | | | | | | | | |
| Beginning of period | | | 57,368,528 | | | | 55,011,512 | | | | 17,963,637 | | | | 15,988,117 | |
| End of period | | $ | 55,748,751 | | | $ | 57,368,528 | | | $ | 15,970,687 | | | $ | 17,963,637 | |
| | | | | | | | | | | | | | | | | |
| Undistributed Net Investment Income(B) | | | N/A | | | $ | 1,214,793 | | | | N/A | | | $ | 192,936 | |
| | | | | | | | | | | | | | | | | |
| Share Transactions | | | | | | | | | | | | | | | | |
| Shares issued | | | 229,548 | | | | 442,714 | | | | 67,923 | | | | 185,445 | |
| Shares reinvested | | | 119,423 | | | | 140,168 | | | | 475,626 | | | | — | |
| Shares redeemed | | | (299,575 | ) | | | (403,875 | ) | | | (134,014 | ) | | | (203,604 | ) |
| Change in Shares Outstanding | | | 49,396 | | | | 179,007 | | | | 409,535 | | | | (18,159 | ) |
| (A) | See Note 9 in Notes to Financial Statements. |
| (B) | The presentation of Distributions to Shareholders and Undistributed Net Investment Income have been updated to reflect the changes prescribed in amendments to Regulation S-X, effective November 5, 2018. The December 31, 2017 presentation was not revised. |
See accompanying Notes to Financial Statements.
Statements of Changes in Net Assets (Continued)
| Touchstone | | | Touchstone | | | Touchstone | |
| Bond | | | Common Stock | | | Focused | |
| Fund | | | Fund | | | Fund | |
| For the | | | For the | | | For the | | | For the | | | For the | | | For the | |
| Year | | | Year | | | Year | | | Year | | | Year | | | Year | |
| Ended | | | Ended | | | Ended | | | Ended | | | Ended | | | Ended | |
| December 31, | | | December 31, | | | December 31, | | | December 31, | | | December 31, | | | December 31, | |
| 2018 | | | 2017(A) | | | 2018 | | | 2017(A) | | | 2018 | | | 2017 | |
| | | | | | | | | | | | | | | | | | | | | | | |
| $ | 1,161,279 | | | $ | 877,747 | | | $ | 1,155,513 | | | $ | 1,871,277 | | | $ | 214,620 | | | $ | 245,941 | |
| | (942,261 | ) | | | 57,822 | | | | 2,353,226 | | | | 76,595,002 | | | | 1,582,345 | | | | 1,521,636 | |
| | (1,114,860 | ) | | | 822,808 | | | | (13,834,239 | ) | | | (48,297,867 | ) | | | (5,988,683 | ) | | | 6,093,467 | |
| | (895,842 | ) | | | 1,758,377 | | | | (10,325,500 | ) | | | 30,168,412 | | | | (4,191,718 | ) | | | 7,861,044 | |
| | | | | | | | | | | | | | | | | | | | | | | |
| | (1,019,953 | ) | | | — | | | | (78,252,461 | ) | | | — | | | | (1,443,640 | ) | | | — | |
| | — | | | | — | | | | — | | | | (17,544 | ) | | | — | | | | (319,068 | ) |
| | — | | | | — | | | | — | | | | (944,237 | ) | | | — | | | | — | |
| | (1,019,953 | ) | | | — | | | | (78,252,461 | ) | | | (961,781 | ) | | | (1,443,640 | ) | | | (319,068 | ) |
| | | | | | | | | | | | | | | | | | | | | | | |
| | 1,866,228 | | | | 3,169,052 | | | | 2,634,209 | | | | 3,579,984 | | | | 2,053,387 | | | | 1,615,348 | |
| | 1,019,953 | | | | — | | | | 78,252,461 | | | | 961,781 | | | | 1,443,640 | | | | 319,068 | |
| | (6,084,112 | ) | | | (6,685,628 | ) | | | (25,949,973 | ) | | | (24,548,603 | ) | | | (8,735,725 | ) | | | (9,770,104 | ) |
| | (3,197,931 | ) | | | (3,516,576 | ) | | | 54,936,697 | | | | (20,006,838 | ) | | | (5,238,698 | ) | | | (7,835,688 | ) |
| | | | | | | | | | | | | | | | | | | | | | | |
| | (5,113,726 | ) | | | (1,758,199 | ) | | | (33,641,264 | ) | | | 9,199,793 | | | | (10,874,056 | ) | | | (293,712 | ) |
| | | | | | | | | | | | | | | | | | | | | | | |
| | 46,921,866 | | | | 48,680,065 | | | | 158,437,588 | | | | 149,237,795 | | | | 61,933,574 | | | | 62,227,286 | |
| $ | 41,808,140 | | | $ | 46,921,866 | | | $ | 124,796,324 | | | $ | 158,437,588 | | | $ | 51,059,518 | | | $ | 61,933,574 | |
| | | | | | | | | | | | | | | | | | | | | | | |
| | N/A | | | $ | 1,019,953 | | | | N/A | | | $ | 1,862,903 | | | | N/A | | | $ | 272,619 | |
| | | | | | | | | | | | | | | | | | | | | | | |
| | 198,321 | | | | 335,983 | | | | 142,207 | | | | 210,424 | | | | 106,416 | | | | 89,251 | |
| | 111,227 | | | | — | | | | 9,951,769 | | | | 54,678 | | | | 81,006 | | | | 16,837 | |
| | (648,688 | ) | | | (707,170 | ) | | | (1,412,961 | ) | | | (1,431,198 | ) | | | (449,637 | ) | | | (550,208 | ) |
| | (339,140 | ) | | | (371,187 | ) | | | 8,681,015 | | | | (1,166,096 | ) | | | (262,215 | ) | | | (444,120 | ) |
Statements of Changes in Net Assets (Continued)
| | | Touchstone | | | Touchstone | |
| | | Large Cap Core | | | Small Company | |
| | | Equity Fund | | | Fund | |
| | | For the | | | For the | | | For the | | | For the | |
| | | Year | | | Year | | | Year | | | Year | |
| | | Ended | | | Ended | | | Ended | | | Ended | |
| | | December 31, | | | December 31, | | | December 31, | | | December 31, | |
| | | 2018 | | | 2017 | | | 2018 | | | 2017(A) | |
| From Operations | | | | | | | | | | | | �� | | | | |
| Net investment income (loss) | | $ | 171,144 | | | $ | 168,697 | | | $ | 37,511 | | | $ | (41,203 | ) |
| Net realized gains on investments | | | 2,431,422 | | | | 913,480 | | | | 7,084,151 | | | | 7,655,355 | |
| Net change in unrealized appreciation (depreciation) on investments | | | (4,368,016 | ) | | | 5,278,278 | | | | (11,719,149 | ) | | | 4,293,327 | |
| Change in Net Assets from Operations | | | (1,765,450 | ) | | | 6,360,455 | | | | (4,597,487 | ) | | | 11,907,479 | |
| | | | | | | | | | | | | | | | | |
| Distributions to Shareholders from(B): | | | | | | | | | | | | | | | | |
| Distributed earnings | | | (1,075,458 | ) | | | — | | | | (7,753,304 | ) | | | — | |
| Net investment income | | | — | | | | (215,126 | ) | | | — | | | | (40,595 | ) |
| Net realized gains | | | — | | | | (490,437 | ) | | | — | | | | (1,801,035 | ) |
| Total Distributions | | | (1,075,458 | ) | | | (705,563 | ) | | | (7,753,304 | ) | | | (1,841,630 | ) |
| | | | | | | | | | | | | | | | | |
| Share Transactions | | | | | | | | | | | | | | | | |
| Proceeds from Shares issued | | | 1,884,064 | | | | 1,723,328 | | | | 3,115,279 | | | | 2,951,421 | |
| Reinvestment of distributions | | | 1,075,458 | | | | 705,563 | | | | 7,753,304 | | | | 1,841,630 | |
| Cost of Shares redeemed | | | (8,273,866 | ) | | | (6,609,878 | ) | | | (10,972,131 | ) | | | (11,622,746 | ) |
| Change in Net Assets from Share Transactions | | | (5,314,344 | ) | | | (4,180,987 | ) | | | (103,548 | ) | | | (6,829,695 | ) |
| | | | | | | | | | | | | | | | | |
| Total Increase (Decrease) in Net Assets | | | (8,155,252 | ) | | | 1,473,905 | | | | (12,454,339 | ) | | | 3,236,154 | |
| | | | | | | | | | | | | | | | | |
| Net Assets | | | | | | | | | | | | | | | | |
| Beginning of period | | | 33,965,478 | | | | 32,491,573 | | | | 70,338,537 | | | | 67,102,383 | |
| End of period | | $ | 25,810,226 | | | $ | 33,965,478 | | | $ | 57,884,198 | | | $ | 70,338,537 | |
| | | | | | | | | | | | | | | | | |
| Undistributed Net Investment Income(B) | | | N/A | | | $ | 168,677 | | | | N/A | | | $ | — | |
| | | | | | | | | | | | | | | | | |
| Share Transactions | | | | | | | | | | | | | | | | |
| Shares issued | | | 109,959 | | | | 119,708 | | | | 190,433 | | | | 203,652 | |
| Shares reinvested | | | 70,900 | | | | 43,312 | | | | 563,467 | | | | 128,069 | |
| Shares redeemed | | | (499,688 | ) | | | (448,031 | ) | | | (664,831 | ) | | | (800,526 | ) |
| Change in Shares Outstanding | | | (318,829 | ) | | | (285,011 | ) | | | 89,069 | | | | (468,805 | ) |
| (A) | See Note 9 in Notes to Financial Statements. |
| (B) | The presentation of Distributions to Shareholders and Undistributed Net Investment Income have been updated to reflect the changes prescribed in amendments to Regulation S-X, effective November 5, 2018. The December 31, 2017 presentation was not revised. |
See accompanying Notes to Financial Statements.
Statements of Changes in Net Assets (Continued)
| Touchstone | | | Touchstone | | | Touchstone | |
| Aggressive ETF | | | Conservative ETF | | | Moderate ETF | |
| Fund | | | Fund | | | Fund | |
| For the | | | For the | | | For the | | | For the | | | For the | | | For the | |
| Year | | | Year | | | Year | | | Year | | | Year | | | Year | |
| Ended | | | Ended | | | Ended | | | Ended | | | Ended | | | Ended | |
| December 31, | | | December 31, | | | December 31, | | | December 31, | | | December 31, | | | December 31, | |
| 2018 | | | 2017 | | | 2018 | | | 2017 | | | 2018 | | | 2017 | |
| | | | | | | | | | | | | | | | | | | | | | | |
| $ | 310,121 | | | $ | 329,440 | | | $ | 389,697 | | | $ | 327,477 | | | $ | 395,735 | | | $ | 407,322 | |
| | 1,015,976 | | | | 522,299 | | | | 64,256 | | | | 280,856 | | | | 949,343 | | | | 618,545 | |
| | (2,737,022 | ) | | | 2,351,512 | | | | (1,186,959 | ) | | | 1,112,874 | | | | (2,550,390 | ) | | | 2,034,617 | |
| | (1,410,925 | ) | | | 3,203,251 | | | | (733,006 | ) | | | 1,721,207 | | | | (1,205,312 | ) | | | 3,060,484 | |
| | | | | | | | | | | | | | | | | | | | | | | |
| | (856,485 | ) | | | — | | | | (612,303 | ) | | | — | | | | (1,029,779 | ) | | | — | |
| | — | | | | (351,189 | ) | | | — | | | | (366,429 | ) | | | — | | | | (468,727 | ) |
| | — | | | | — | | | | — | | | | (1,756,495 | ) | | | — | | | | (3,720,034 | ) |
| | (856,485 | ) | | | (351,189 | ) | | | (612,303 | ) | | | (2,122,924 | ) | | | (1,029,779 | ) | | | (4,188,761 | ) |
| | | | | | | | | | | | | | | | | | | | | | | |
| | 367,839 | | | | 432,285 | | | | 6,001,203 | | | | 2,994,108 | | | | 654,963 | | | | 414,787 | |
| | 856,485 | | | | 351,189 | | | | 612,303 | | | | 2,122,924 | | | | 1,029,779 | | | | 4,188,761 | |
| | (2,447,202 | ) | | | (2,766,183 | ) | | | (5,055,678 | ) | | | (5,339,887 | ) | | | (4,244,729 | ) | | | (4,662,698 | ) |
| | (1,222,878 | ) | | | (1,982,709 | ) | | | 1,557,828 | | | | (222,855 | ) | | | (2,559,987 | ) | | | (59,150 | ) |
| | | | | | | | | | | | | | | | | | | | | | | |
| | (3,490,288 | ) | | | 869,353 | | | | 212,519 | | | | (624,572 | ) | | | (4,795,078 | ) | | | (1,187,427 | ) |
| | | | | | | | | | | | | | | | | | | | | | | |
| | 20,383,845 | | | | 19,514,492 | | | | 16,831,004 | | | | 17,455,576 | | | | 23,453,776 | | | | 24,641,203 | |
| $ | 16,893,557 | | | $ | 20,383,845 | | | $ | 17,043,523 | | | $ | 16,831,004 | | | $ | 18,658,698 | | | $ | 23,453,776 | |
| | | | | | | | | | | | | | | | | | | | | | | |
| | N/A | | | $ | 329,417 | | | | N/A | | | $ | 327,449 | | | | N/A | | | $ | 407,302 | |
| | | | | | | | | | | | | | | | | | | | | | | |
| | 21,831 | | | | 27,391 | | | | 513,937 | | | | 236,683 | | | | 53,409 | | | | 30,330 | |
| | 56,227 | | | | 20,879 | | | | 55,583 | | | | 178,076 | | | | 91,877 | | | | 337,511 | |
| | (143,914 | ) | | | (174,231 | ) | | | (435,181 | ) | | | (414,047 | ) | | | (347,156 | ) | | | (337,079 | ) |
| | (65,856 | ) | | | (125,961 | ) | | | 134,339 | | | | 712 | | | | (201,870 | ) | | | 30,762 | |
Financial Highlights
Touchstone Active Bond Fund
Selected Data for a Share Outstanding Throughout Each Period
| | | Year Ended December 31, | |
| | | 2018 | | | 2017 | | | 2016 | | | 2015 | | | 2014 | |
| Net asset value at beginning of period | | $ | 10.60 | | | $ | 10.51 | | | $ | 10.13 | | | $ | 10.49 | | | $ | 10.37 | |
| Income (loss) from investment operations: | | | | | | | | | | | | | | | | | | | | |
| Net investment income | | | 0.26 | | | | 0.21 | | | | 0.26 | | | | 0.19 | | | | 0.20 | |
| Net realized and unrealized gains (losses) on investments | | | (0.43 | ) | | | 0.16 | | | | 0.35 | | | | (0.32 | ) | | | 0.20 | |
| Total from investment operations | | | (0.17 | ) | | | 0.37 | | | | 0.61 | | | | (0.13 | ) | | | 0.40 | |
| Distributions from: | | | | | | | | | | | | | | | | | | | | |
| Net investment income | | | (0.23 | ) | | | (0.28 | ) | | | (0.23 | ) | | | (0.23 | ) | | | (0.28 | ) |
| Net asset value at end of period | | $ | 10.20 | | | $ | 10.60 | | | $ | 10.51 | | | $ | 10.13 | | | $ | 10.49 | |
| Total return(A) | | | (1.62 | %) | | | 3.54 | % | | | 5.98 | % | | | (1.28 | %) | | | 3.82 | % |
| Ratios and supplemental data: | | | | | | | | | | | | | | | | | | | | |
| Net assets at end of period (000's) | | $ | 55,749 | | | $ | 57,369 | | | $ | 55,012 | | | $ | 52,026 | | | $ | 48,978 | |
| Ratio to average net assets: | | | | | | | | | | | | | | | | | | | | |
| Net expenses | | | 0.84 | % | | | 0.89 | % | | | 0.92 | %(B) | | | 0.97 | %(B) | | | 0.98 | % |
| Gross expenses | | | 0.84 | % | | | 0.89 | % | | | 0.90 | % | | | 0.91 | % | | | 1.01 | % |
| Net investment income | | | 2.49 | % | | | 2.05 | % | | | 2.47 | % | | | 2.10 | % | | | 1.92 | % |
| Portfolio turnover rate | | | 335 | % | | | 482 | % | | | 584 | % | | | 455 | %(C) | | | 287 | % |
Touchstone Balanced Fund
Selected Data for a Share Outstanding Throughout Each Period
| | | Year Ended December 31, | |
| | | 2018 | | | 2017 | | | 2016 | | | 2015 | | | 2014 | |
| Net asset value at beginning of period | | $ | 14.85 | | | $ | 13.02 | | | $ | 12.49 | | | $ | 13.45 | | | $ | 13.53 | |
| Income (loss) from investment operations: | | | 0.18 | (B) | | | 0.14 | | | | 0.15 | (B) | | | 0.20 | (B) | | | 0.18 | (B) |
| Net investment income | | | | | | | | | | | | | | | | | | | | |
| Net realized and unrealized gains (losses) on investments | | | (0.92 | ) | | | 1.69 | | | | 0.78 | | | | (0.19 | ) | | | 0.88 | |
| Total from investment operations | | | (0.74 | ) | | | 1.83 | | | | 0.93 | | | | 0.01 | | | | 1.06 | |
| Distributions from: | | | | | | | | | | | | | | | | | | | | |
| Net investment income | | | (0.12 | ) | | | — | | | | (0.18 | ) | | | (0.25 | ) | | | (0.23 | ) |
| Realized capital gains | | | (4.13 | ) | | | — | | | | (0.20 | ) | | | (0.72 | ) | | | (0.91 | ) |
| Return of capital | | | — | | | | — | | | | (0.02 | ) | | | — | | | | — | |
| Total distributions | | | (4.25 | ) | | | — | | | | (0.40 | ) | | | (0.97 | ) | | | (1.14 | ) |
| Net asset value at end of period | | $ | 9.86 | | | $ | 14.85 | | | $ | 13.02 | | | $ | 12.49 | | | $ | 13.45 | |
| Total return(A) | | | (6.07 | %) | | | 14.06 | % | | | 7.42 | % | | | 0.03 | % | | | 7.81 | % |
| Ratios and supplemental data: | | | | | | | | | | | | | | | | | | | | |
| Net assets at end of period (000's) | | $ | 15,971 | | | $ | 17,964 | | | $ | 15,988 | | | $ | 15,301 | | | $ | 15,963 | |
| Ratio to average net assets: | | | | | | | | | | | | | | | | | | | | |
| Net expenses | | | 0.85 | % | | | 0.85 | % | | | 0.85 | % | | | 0.87 | % | | | 0.90 | % |
| Gross expenses | | | 1.15 | % | | | 0.97 | % | | | 0.88 | % | | | 0.87 | % | | | 0.90 | % |
| Net investment income | | | 1.22 | % | | | 1.01 | % | | | 1.16 | % | | | 1.50 | %(C) | | | 1.31 | % |
| Portfolio turnover rate | | | 140 | % | | | 142 | % | | | 30 | % | | | 38 | % | | | 76 | % |
| (A) | Total returns do not include any insurance, sales or administrative charges of variable annuity or life insurance contracts. If these charges were included, the returns would be lower. |
| (B) | The net investment income per share was based on average shares outstanding for the period. |
| (C) | Includes the impact of special dividends resulting from an acquisition of Covidien plc by Medtronic, Inc. on January 26, 2015 through the formation of a new holding company, Medtronic plc, incorporated in Ireland. These special dividends enhanced the ratio of net investment income by 0.47% for the fiscal year ended December 31, 2015. |
See accompanying Notes to Financial Statements.
Financial Highlights (Continued)
Touchstone Bond Fund
Selected Data for a Share Outstanding Throughout Each Period
| | | Year Ended December 31, | |
| | | 2018 | | | 2017 | | | 2016 | | | 2015 | | | 2014 | |
| Net asset value at beginning of period | | $ | 9.60 | | | $ | 9.26 | | | $ | 9.38 | | | $ | 9.83 | | | $ | 9.75 | |
| Income (loss) from investment operations: | | | | | | | | | | | 0.14 | (A) | | | 0.27 | (A) | | | 0.29 | (A) |
| Net investment income | | | 0.28 | | | | 0.18 | | | | | | | | | | | | | |
| Net realized and unrealized gains (losses) on investments | | | (0.46 | ) | | | 0.16 | | | | (0.06 | ) | | | (0.40 | ) | | | 0.10 | |
| Total from investment operations | | | (0.18 | ) | | | 0.34 | | | | 0.08 | | | | (0.13 | ) | | | 0.39 | |
| Distributions from: | | | | | | | | | | | | | | | | | | | | |
| Net investment income | | | (0.23 | ) | | | — | | | | (0.20 | ) | | | (0.32 | ) | | | (0.31 | ) |
| Net asset value at end of period | | $ | 9.19 | | | $ | 9.60 | | | $ | 9.26 | | | $ | 9.38 | | | $ | 9.83 | |
| Total return(B) | | | (1.88 | %) | | | 3.67 | % | | | 0.81 | % | | | (1.29 | %) | | | 4.01 | % |
| Ratios and supplemental data: | | | | | | | | | | | | | | | | | | | | |
| Net assets at end of period (000's) | | $ | 41,808 | | | $ | 46,922 | | | $ | 48,680 | | | $ | 57,312 | | | $ | 67,067 | |
| Ratio to average net assets: | | | | | | | | | | | | | | | | | | | | |
| Net expenses | | | 0.67 | % | | | 0.68 | % | | | 0.67 | % | | | 0.67 | % | | | 0.65 | % |
| Gross expenses | | | 0.87 | % | | | 0.71 | % | | | 0.67 | % | | | 0.67 | % | | | 0.65 | % |
| Net investment income | | | 2.62 | % | | | 1.83 | % | | | 1.46 | % | | | 2.69 | % | | | 2.90 | % |
| Portfolio turnover rate | | | 431 | % | | | 168 | % | | | 197 | % | | | 117 | % | | | 117 | % |
Touchstone Common Stock Fund
Selected Data for a Share Outstanding Throughout Each Period
| | | Year Ended December 31, | |
| | | 2018 | | | 2017 | | | 2016 | | | 2015 | | | 2014 | |
| Net asset value at beginning of period | | $ | 18.74 | | | $ | 15.52 | | | $ | 15.46 | | | $ | 17.69 | | | $ | 18.39 | |
| Income (loss) from investment operations: | | | 0.14 | (A) | | | 0.22 | | | | 0.25 | (A) | | | 0.44 | (A) | | | 0.30 | (A) |
| Net investment income | | | | | | | | | | | | | | | | | | | | |
| Net realized and unrealized gains (losses) on investments | | | (1.00 | ) | | | 3.11 | | | | 1.49 | | | | (0.39 | ) | | | 1.61 | |
| Total from investment operations | | | (0.86 | ) | | | 3.33 | | | | 1.74 | | | | 0.05 | | | | 1.91 | |
| Distributions from: | | | | | | | | | | | | | | | | | | | | |
| Net investment income | | | (0.11 | ) | | | (— | )(C) | | | (0.27 | ) | | | (0.49 | ) | | | (0.33 | ) |
| Realized capital gains | | | (10.49 | ) | | | (0.11 | ) | | | (1.41 | ) | | | (1.79 | ) | | | (2.28 | ) |
| Total distributions | | | (10.60 | ) | | | (0.11 | ) | | | (1.68 | ) | | | (2.28 | ) | | | (2.61 | ) |
| Net asset value at end of period | | $ | 7.28 | | | $ | 18.74 | | | $ | 15.52 | | | $ | 15.46 | | | $ | 17.69 | |
| Total return(B) | | | (8.05 | %) | | | 21.50 | % | | | 11.26 | % | | | 0.19 | % | | | 10.34 | % |
| Ratios and supplemental data: | | | | | | | | | | | | | | | | | | | | |
| Net assets at end of period (000's) | | $ | 124,796 | | | $ | 158,438 | | | $ | 149,238 | | | $ | 161,148 | | | $ | 198,524 | |
| Ratio to average net assets: | | | | | | | | | | | | | | | | | | | | |
| Net expenses | | | 0.73 | % | | | 0.71 | % | | | 0.73 | % | | | 0.72 | % | | | 0.72 | % |
| Gross expenses | | | 0.83 | % | | | 0.71 | % | | | 0.73 | % | | | 0.72 | % | | | 0.72 | % |
| Net investment income | | | 0.77 | % | | | 1.21 | % | | | 1.58 | % | | | 2.48 | %(D) | | | 1.57 | % |
| Portfolio turnover rate | | | 10 | % | | | 84 | % | | | 6 | % | | | 9 | % | | | 13 | % |
| (A) | The net investment income per share was based on average shares outstanding for the period. |
| (B) | Total returns do not include any insurance, sales or administrative charges of variable annuity or life insurance contracts. If these charges were included, the returns would be lower. |
| (C) | Less than $0.005 per share. |
| (D) | Includes the impact of special dividends resulting from an acquisition of Covidien plc by Medtronic, Inc. on January 26, 2015 through the formation of a new holding company, Medtronic plc, incorporated in Ireland. These special dividends enhanced the ratio of net investment income by 0.47% for the fiscal year ended December 31, 2015. |
See accompanying Notes to Financial Statements.
Financial Highlights (Continued)
Touchstone Focused Fund
Selected Data for a Share Outstanding Throughout Each Period
| | | Year Ended December 31, | |
| | | 2018 | | | 2017 | | | 2016 | | | 2015 | | | 2014 | |
| Net asset value at beginning of period | | $ | 18.88 | | | $ | 16.70 | | | $ | 17.95 | | | $ | 18.64 | | | $ | 18.81 | |
| Income (loss) from investment operations: | | | | | | | | | | | | | | | | | | | | |
| Net investment income (loss) | | | 0.08 | | | | 0.09 | | | | 0.09 | | | | (0.01 | ) | | | (0.08 | ) |
| Net realized and unrealized gains (losses) on investments | | | (1.56 | ) | | | 2.19 | | | | 2.31 | | | | 0.37 | | | | 2.49 | |
| Total from investment operations | | | (1.48 | ) | | | 2.28 | | | | 2.40 | | | | 0.36 | | | | 2.41 | |
| Distributions from: | | | | | | | | | | | | | | | | | | | | |
| Net investment income | | | (0.09 | ) | | | (0.10 | ) | | | — | | | | — | | | | — | |
| Realized capital gains | | | (0.40 | ) | | | — | | | | (3.65 | ) | | | (1.05 | ) | | | (2.58 | ) |
| Total distributions | | | (0.49 | ) | | | (0.10 | ) | | | (3.65 | ) | | | (1.05 | ) | | | (2.58 | ) |
| Net asset value at end of period | | $ | 16.91 | | | $ | 18.88 | | | $ | 16.70 | | | $ | 17.95 | | | $ | 18.64 | |
| Total return(A) | | | (7.97 | %) | | | 13.64 | % | | | 13.11 | % | | | 1.97 | % | | | 13.10 | % |
| Ratios and supplemental data: | | | | | | | | | | | | | | | | | | | | |
| Net assets at end of period (000's) | | $ | 51,060 | | | $ | 61,934 | | | $ | 62,227 | | | $ | 68,317 | | | $ | 25,178 | |
| Ratio to average net assets: | | | | | | | | | | | | | | | | | | | | |
| Net expenses | | | | | | | 1.21 | %(B) | | | 1.21 | %(B) | | | 1.21 | % | | | 1.23 | % |
| Gross expenses | | | 1.21 | %(B) | | | 1.17 | % | | | 1.17 | % | | | 1.32 | % | | | 1.33 | % |
| Net investment income (loss) | | | 0.36 | % | | | 0.40 | % | | | 0.55 | % | | | (0.07 | %) | | | (0.43 | %) |
| Portfolio turnover rate | | | 11 | % | | | 12 | % | | | 21 | % | | | 286 | %(C) | | | 72 | % |
Touchstone Large Cap Core Equity Fund
Selected Data for a Share Outstanding Throughout Each Period
| | | Year Ended December 31, | |
| | | 2018 | | | 2017 | | | 2016 | | | 2015 | | | 2014 | |
| Net asset value at beginning of period | | $ | 16.30 | | | $ | 13.72 | | | $ | 14.07 | | | $ | 14.90 | | | $ | 13.09 | |
| Income (loss) from investment operations: | | | | | | | | | | | | | | | | | | | | |
| Net investment income | | | 0.12 | | | | 0.09 | | | | 0.08 | | | | 0.18 | | | | 0.18 | |
| Net realized and unrealized gains (losses) on investments | | | (1.16 | ) | | | 2.83 | | | | 1.18 | | | | (0.77 | ) | | | 1.78 | |
| Total from investment operations | | | (1.04 | ) | | | 2.92 | | | | 1.26 | | | | (0.59 | ) | | | 1.96 | |
| Distributions from: | | | | | | | | | | | | | | | | | | | | |
| Net investment income | | | (0.10 | ) | | | (0.10 | ) | | | (0.11 | ) | | | (0.24 | ) | | | (0.15 | ) |
| Realized capital gains | | | (0.53 | ) | | | (0.24 | ) | | | (1.50 | ) | | | — | | | | — | |
| Total distributions | | | (0.63 | ) | | | (0.34 | ) | | | (1.61 | ) | | | (0.24 | ) | | | (0.15 | ) |
| Net asset value at end of period | | $ | 14.63 | | | $ | 16.30 | | | $ | 13.72 | | | $ | 14.07 | | | $ | 14.90 | |
| Total return(A) | | | (6.49 | %) | | | 21.32 | % | | | 8.84 | % | | | (4.01 | %) | | | 14.93 | % |
| Ratios and supplemental data: | | | | | | | | | | | | | | | | | | | | |
| Net assets at end of period (000's) | | $ | 25,810 | | | $ | 33,965 | | | $ | 32,492 | | | $ | 29,894 | | | $ | 40,664 | |
| Ratio to average net assets: | | | | | | | | | | | | | | | | | | | | |
| Net expenses | | | 1.06 | % | | | 1.06 | % | | | 1.06 | % | | | 1.06 | % | | | 1.04 | % |
| Gross expenses | | | 1.16 | % | | | 1.15 | % | | | 1.17 | % | | | 1.14 | % | | | 1.16 | % |
| Net investment income | | | 0.56 | % | | | 0.52 | % | | | 0.75 | % | | | 0.73 | % | | | 1.30 | % |
| Portfolio turnover rate | | | 20 | % | | | 12 | % | | | 50 | % | | | 111 | % | | | 41 | % |
| (A) | Total returns do not include any insurance, sales or administrative charges of variable annuity or life insurance contracts. If these charges were included, the returns would be lower. |
| (B) | Net expenses include amounts recouped by the Advisor. |
| (C) | Portfolio turnover excludes the purchases and sales of the Touchstone Baron Small Cap Growth Fund and Touchstone Third Avenue Value Fund acquired on December 7, 2015. If these transactions were included, portfolio turnover would have been higher. |
See accompanying Notes to Financial Statements.
Financial Highlights (Continued)
Touchstone Small Company Fund
Selected Data for a Share Outstanding Throughout Each Period
| | | | | | Year Ended December 31, | | | | |
| | | 2018 | | | 2017 | | | 2016 | | | 2015 | | | 2014 | |
| Net asset value at beginning of period | | $ | 15.73 | | | $ | 13.58 | | | $ | 12.14 | | | $ | 14.63 | | | $ | 16.32 | |
| Income (loss) from investment operations: | | | | | | | | | | | 0.01 | (A) | | | (0.02 | )(A) | | | 0.07 | (A) |
| Net investment income (loss) | | | 0.01 | | | | (0.01 | ) | | | | | | | | | | | | |
| Net realized and unrealized gains (losses) on investments | | | (1.11 | ) | | | 2.57 | | | | 2.44 | | | | (0.15 | ) | | | 1.03 | |
| Total from investment operations | | | (1.10 | ) | | | 2.56 | | | | 2.45 | | | | (0.17 | ) | | | 1.10 | |
| Distributions from: | | | | | | | | | | | | | | | | | | | | |
| Net investment income | | | — | | | | (0.01 | ) | | | (0.01 | ) | | | — | | | | (0.08 | ) |
| Realized capital gains | | | (1.94 | ) | | | (0.40 | ) | | | (1.00 | ) | | | (2.32 | ) | | | (2.71 | ) |
| Total distributions | | | (1.94 | ) | | | (0.41 | ) | | | (1.01 | ) | | | (2.32 | ) | | | (2.79 | ) |
| Net asset value at end of period | | $ | 12.69 | | | $ | 15.73 | | | $ | 13.58 | | | $ | 12.14 | | | $ | 14.63 | |
| Total return(B) | | | (7.98 | %) | | | 19.12 | % | | | 20.23 | % | | | (1.34 | %) | | | 6.68 | % |
| Ratios and supplemental data: | | | | | | | | | | | | | | | | | | | | |
| Net assets at end of period (000's) | | $ | 57,884 | | | $ | 70,339 | | | $ | 67,102 | | | $ | 48,938 | | | $ | 57,935 | |
| Ratio to average net assets: | | | | | | | | | | | | | | | | | | | | |
| Net expenses | | | 0.76 | % | | | 0.76 | % | | | 0.76 | % | | | 0.78 | % | | | 0.78 | % |
| Gross expenses | | | 0.84 | % | | | 0.76 | % | | | 0.76 | % | | | 0.78 | % | | | 0.78 | % |
| Net investment income (loss) | | | 0.05 | % | | | (0.06 | %) | | | 0.08 | % | | | (0.10 | %) | | | 0.45 | % |
| Portfolio turnover rate | | | 68 | % | | | 68 | % | | | 68 | % | | | 77 | % | | | 72 | % |
Touchstone Aggressive ETF Fund
Selected Data for a Share Outstanding Throughout Each Period
| | | | | | Year Ended December 31, | | | | |
| | | 2018 | | | 2017 | | | 2016 | | | 2015 | | | 2014 | |
| Net asset value at beginning of period | | $ | 16.83 | | | $ | 14.60 | | | $ | 13.73 | | | $ | 13.98 | | | $ | 13.28 | |
| Income (loss) from investment operations: | | | | | | | | | | | | | | | | | | | | |
| Net investment income | | | 0.29 | | | | 0.30 | | | | 0.30 | | | | 0.22 | | | | 0.21 | |
| Net realized and unrealized gains (losses) on investments | | | (1.59 | ) | | | 2.22 | | | | 0.79 | | | | (0.23 | ) | | | 0.78 | |
| Total from investment operations | | | (1.30 | ) | | | 2.52 | | | | 1.09 | | | | (0.01 | ) | | | 0.99 | |
| Distributions from: | | | | | | | | | | | | | | | | | | | | |
| Net investment income | | | (0.29 | ) | | | (0.29 | ) | | | (0.22 | ) | | | (0.24 | ) | | | — | |
| Realized capital gains | | | (0.49 | ) | | | — | | | | — | | | | — | | | | (0.29 | ) |
| Total distributions | | | (0.78 | ) | | | (0.29 | ) | | | (0.22 | ) | | | (0.24 | ) | | | (0.29 | ) |
| Net asset value at end of period | | $ | 14.75 | | | $ | 16.83 | | | $ | 14.60 | | | $ | 13.73 | | | $ | 13.98 | |
| Total return(B) | | | (7.84 | )% | | | 17.29 | % | | | 7.96 | % | | | (0.10 | %) | | | 7.49 | % |
| Ratios and supplemental data: | | | | | | | | | | | | | | | | | | | | |
| Net assets at end of period (000's) | | $ | 16,894 | | | $ | 20,384 | | | $ | 19,514 | | | $ | 21,067 | | | $ | 24,099 | |
| Ratio to average net assets: | | | | | | | | | | | | | | | | | | | | |
| Net expenses(C) | | | 0.75 | % | | | 0.75 | % | | | 0.75 | % | | | 0.75 | % | | | 0.75 | % |
| Gross expenses(C) | | | 0.92 | % | | | 0.90 | % | | | 0.90 | % | | | 0.87 | % | | | 0.87 | % |
| Net investment income | | | 1.60 | % | | | 1.64 | % | | | 1.80 | % | | | 1.26 | % | | | 1.42 | % |
| Portfolio turnover rate | | | 21 | % | | | 21 | % | | | 109 | % | | | 7 | % | | | 12 | % |
| (A) | The net investment income per share was based on average shares outstanding for the period. |
| (B) | Total returns do not include any insurance, sales or administrative charges of variable annuity or life insurance contracts. If these charges were included, the returns would be lower. |
| (C) | Ratio does not include expenses of the underlying funds. |
See accompanying Notes to Financial Statements.
Financial Highlights (Continued)
Touchstone Conservative ETF Fund
Selected Data for a Share Outstanding Throughout Each Period
| | | Year Ended December 31, | |
| | | 2018 | | | 2017 | | | 2016 | | | 2015 | | | 2014 | |
| Net asset value at beginning of period | | $ | 11.74 | | | $ | 12.18 | | | $ | 11.84 | | | $ | 12.68 | | | $ | 12.61 | |
| Income (loss) from investment operations: | | | | | | | | | | | | | | | | | | | | |
| Net investment income | | | 0.23 | | | | 0.23 | | | | 0.29 | | | | 0.17 | | | | 0.18 | |
| Net realized and unrealized gains (losses) on investments | | | (0.70 | ) | | | 0.99 | | | | 0.37 | | | | (0.20 | ) | | | 0.48 | |
| Total from investment operations | | | (0.47 | ) | | | 1.22 | | | | 0.66 | | | | (0.03 | ) | | | 0.66 | |
| Distributions from: | | | | | | | | | | | | | | | | | | | | |
| Net investment income | | | (0.21 | ) | | | (0.26 | ) | | | (0.19 | ) | | | (0.19 | ) | | | (0.15 | ) |
| Realized capital gains | | | (0.19 | ) | | | (1.40 | ) | | | (0.13 | ) | | | (0.62 | ) | | | (0.44 | ) |
| Total distributions | | | (0.40 | ) | | | (1.66 | ) | | | (0.32 | ) | | | (0.81 | ) | | | (0.59 | ) |
| Net asset value at end of period | | $ | 10.87 | | | $ | 11.74 | | | $ | 12.18 | | | $ | 11.84 | | | $ | 12.68 | |
| Total return(A) | | | (4.02 | %) | | | 10.06 | % | | | 5.58 | % | | | (0.24 | %) | | | 5.23 | % |
| Ratios and supplemental data: | | | | | | | | | | | | | | | | | | | | |
| Net assets at end of period (000's) | | $ | 17,044 | | | $ | 16,831 | | | $ | 17,456 | | | $ | 19,964 | | | $ | 23,389 | |
| Ratio to average net assets: | | | | | | | | | | | | | | | | | | | | |
| Net expenses(B) | | | 0.75 | % | | | 0.75 | % | | | 0.75 | % | | | 0.75 | % | | | 0.75 | % |
| Gross expenses(B) | | | 0.92 | % | | | 0.93 | % | | | 0.90 | % | | | 0.87 | % | | | 0.89 | % |
| Net investment income | | | 2.05 | % | | | 1.82 | % | | | 1.78 | % | | | 1.13 | % | | | 1.20 | % |
| Portfolio turnover rate | | | 38 | % | | | 31 | % | | | 109 | % | | | 9 | % | | | 13 | % |
Touchstone Moderate ETF Fund
Selected Data for a Share Outstanding Throughout Each Period
| | | Year Ended December 31, | |
| | | 2018 | | | 2017 | | | 2016 | | | 2015 | | | 2014 | |
| Net asset value at beginning of period | | $ | 12.26 | | | $ | 13.10 | | | $ | 13.33 | | | $ | 15.49 | | | $ | 14.72 | |
| Income (loss) from investment operations: | | | | | | | | | | | | | | | | | | | | |
| Net investment income | | | 0.26 | | | | 0.21 | | | | 0.28 | | | | 0.21 | | | | 0.31 | |
| Net realized and unrealized gains (losses) on investments | | | (0.99 | ) | | | 1.56 | | | | 0.64 | | | | (0.24 | ) | | | 0.72 | |
| Total from investment operations | | | (0.73 | ) | | | 1.77 | | | | 0.92 | | | | (0.03 | ) | | | 1.03 | |
| Distributions from: | | | | | | | | | | | | | | | | | | | | |
| Net investment income | | | (0.24 | ) | | | (0.25 | ) | | | (0.22 | ) | | | (0.27 | ) | | | (0.26 | ) |
| Realized capital gains | | | (0.38 | ) | | | (2.36 | ) | | | (0.93 | ) | | | (1.86 | ) | | | — | |
| Total distributions | | | (0.62 | ) | | | (2.61 | ) | | | (1.15 | ) | | | (2.13 | ) | | | (0.26 | ) |
| Net asset value at end of period | | $ | 10.91 | | | $ | 12.26 | | | $ | 13.10 | | | $ | 13.33 | | | $ | 15.49 | |
| Total return(A) | | | (6.02 | %) | | | 13.66 | % | | | 6.85 | % | | | (0.18 | %) | | | 6.96 | % |
| Ratios and supplemental data: | | | | | | | | | | | | | | | | | | | | |
| Net assets at end of period (000's) | | $ | 18,659 | | | $ | 23,454 | | | $ | 24,641 | | | $ | 27,923 | | | $ | 33,200 | |
| Ratio to average net assets: | | | | | | | | | | | | | | | | | | | | |
| Net expenses(B) | | | 0.75 | % | | | 0.75 | % | | | 0.75 | % | | | 0.75 | % | | | 0.75 | % |
| Gross expenses(B) | | | 0.87 | % | | | 0.84 | % | | | 0.82 | % | | | 0.80 | % | | | 0.79 | % |
| Net investment income | | | 1.80 | % | | | 1.72 | % | | | 1.83 | % | | | 1.30 | % | | | 1.41 | % |
| Portfolio turnover rate | | | 20 | % | | | 21 | % | | | 98 | % | | | 9 | % | | | 11 | % |
| (A) | Total returns do not include any insurance, sales or administrative charges of variable annuity or life insurance contracts. If these charges were included, the returns would be lower. |
| (B) | Ratio does not include expenses of the underlying funds. |
See accompanying Notes to Financial Statements.
Notes to Financial Statements
December 31, 2018
1. Organization
The Touchstone Variable Series Trust (the “Trust”) is registered under the Investment Company Act of 1940, as amended (the “1940 Act”), as an open-end management investment company. The Trust was established as a Massachusetts business trust pursuant to an Agreement and Declaration of Trust dated February 7, 1994. The Trust consists of the following ten funds (individually, a “Fund”, and collectively, the “Funds”):
Touchstone Active Bond Fund (“Active Bond Fund”)
Touchstone Balanced Fund (“Balanced Fund”)
Touchstone Bond Fund (“Bond Fund”)
Touchstone Common Stock Fund (“Common Stock Fund”)
Touchstone Focused Fund (“Focused Fund”)
Touchstone Large Cap Core Equity Fund (“Large Cap Core Equity Fund”)
Touchstone Small Company Fund (“Small Company Fund”)
Touchstone Aggressive ETF Fund (“Aggressive ETF Fund”)
Touchstone Conservative ETF Fund (“Conservative ETF Fund”)
Touchstone Moderate ETF Fund (“Moderate ETF Fund”)
Each Fund is diversified with the exception of the Common Stock Fund, Focused Fund and the Large Cap Core Equity Fund which are non-diversified.
The Agreement and Declaration of Trust permits the Trust to issue an unlimited number of shares of beneficial interest of each Fund. Shares of beneficial interest of each Fund are available as a funding vehicle for the separate accounts of life insurance companies issuing variable annuity and variable life insurance policies. As of December 31, 2018, a majority of the outstanding shares of the Active Bond Fund, Focused Fund, Large Cap Core Equity Fund, Aggressive ETF Fund, Conservative ETF Fund and Moderate ETF Fund were issued to separate accounts of Western-Southern Life Assurance Company, The Western & Southern Life Insurance Company, Integrity Life Insurance Company, National Integrity Life Insurance Company, and Columbus Life Insurance Company, which are all part of Western & Southern Financial Group, Inc. (“Western & Southern”), and certain supplemental executive retirement plans sponsored by Western & Southern and its affiliates.
All Funds offer a single class of shares. The assets of each Fund are segregated, and a shareholder’s interest is limited to the Fund in which shares are held. The Funds’ prospectus provides a description of each Fund’s investment goal, policies, and strategies along with information on the class of shares currently being offered.
2. Significant Accounting Policies
The following is a summary of the Funds’ significant accounting policies:
Each Fund is an investment company that follows the accounting and reporting guidance of Accounting Standards Codification Topic 946 applicable to investment companies.
Regulatory Updates —In August 2018, the Securities and Exchange Commission (the “SEC”) released its Final Rules that eliminated or amended disclosure requirements in the financial statements that were redundant or outdated in light of changes in SEC requirements or U.S. generally accepted accounting principles (“U.S. GAAP”). The Final Rules were effective November 5, 2018. Management has evaluated the SEC Final Rules and is complying with the amendments in the current financial statements.
In August 2018, the Financial Accounting Standards Board issued Accounting Standards Update (“ASU”) No. 2018-13, Fair Value Measurement (Topic 820): Disclosure Framework - Changes to the Disclosure Requirements for Fair Value Measurement, which amends and eliminates certain disclosure requirements for fair value as part of its framework project. The ASU is effective for annual and interim periods beginning after December
Notes to Financial Statements(Continued)
15, 2019. The early adoption of the removal or modification of disclosures and delay of adoption of the additional disclosures is permitted. As of December 31, 2018, the Funds have adopted the removal of applicable disclosures.
Security valuation and fair value measurements —U.S. GAAP define fair value as the price the Funds would receive to sell an asset or pay to transfer a liability in an orderly transaction between market participants at the measurement date. All investments in securities are recorded at their fair value. The Funds define the term “market value”, as used throughout this report, as the estimated fair value. The Funds use various methods to measure fair value of their portfolio securities on a recurring basis. U.S. GAAP fair value measurement standards require disclosure of a hierarchy that prioritizes inputs to valuation methods.
These inputs are summarized in the three broad levels listed below:
| · | Level 1 – | quoted prices in active markets for identical securities |
| · | Level 2 – | other significant observable inputs (including quoted prices for similar securities, interest rates, prepayment speeds, credit risk, etc.) |
| · | Level 3 – | significant unobservable inputs (including a Fund’s own assumptions in determining the fair value of investments) |
The inputs or methodology used for valuing securities are not necessarily an indication of the risk associated with investing in those securities.
The aggregate value by input level, as of December 31, 2018, for each Fund’s investments, is included in the Funds’ Portfolio of Investments, which also includes a breakdown of the Funds’ investments by portfolio or sector allocation. The Funds did not hold or transfer any Level 3 categorized securities during the year ended December 31, 2018.
Changes in valuation techniques may result in transfers into or out of an investment’s assigned level within the hierarchy.
During the year ended December 31, 2018, there were no material changes to the valuation policies and techniques.
The Funds’ portfolio securities are valued as of the close of the regular session of trading on the New York Stock Exchange (“NYSE”) (currently 4:00 p.m., Eastern time or at the times as of which the NYSE establishes official closing prices). Portfolio securities traded on stock exchanges are valued at the last reported sale price, official close price, or last bid price if no sales are reported. Portfolio securities quoted by NASDAQ are valued at the NASDAQ Official Closing Price (“NOCP”) or from the primary exchange on which the security trades. To the extent these securities are actively traded, they are categorized in Level 1 of the fair value hierarchy. Options and futures are valued at the last quoted sales price. If there is no such reported sale on the valuation date, long option positions are valued at the most recent bid price, and short option positions are valued at the most recent ask price on the valuation date and are categorized in Level 1. Shares of mutual funds in which the Funds invest are valued at their respective net asset value (“NAV”) as reported by the underlying funds and are categorized in Level 1.
Debt securities held by the Funds are valued at their evaluated bid by an independent pricing service or at their last broker-quoted bid prices as obtained from one or more of the major market makers for such securities. Independent pricing services use information provided by market makers or estimates of market values through accepted market modeling conventions. Observable inputs to the models may include prepayment speeds, pricing spread, yield, trade information, dealer quotes, market color, cash flow models, the securities’ terms and conditions, among others, and are generally categorized in Level 2. Debt securities with remaining maturities
Notes to Financial Statements(Continued)
of 60 days or less may be valued at amortized cost, provided such amount approximates market value and are categorized in Level 2. While this method provides consistency in valuation (and may only be used if it approximates market value), it may result in periods during which fair value, as determined by amortized cost, is higher or lower than the price that would be received if a Fund sold the investment.
Securities mainly traded on a non-U.S. exchange or denominated in foreign currencies are generally valued according to the preceding closing values on that exchange, translated to U.S. dollars using currency exchange rates as of the close of regular trading on the NYSE, and are generally categorized in Level 1. However, if an event that may change the value of a security occurs after the time that the closing value on the non-U.S. exchange was determined, but before the close of regular trading on the NYSE, the security may be priced based on fair value and is generally categorized in Level 2. This may cause the value of the security, if held on the books of a Fund, to be different from the closing value on the non-U.S. exchange and may affect the calculation of that Fund’s NAV.
The Funds may use fair value pricing under the following circumstances, among others:
| · | If the value of a security has been materially affected by events occurring before the Funds’ pricing time but after the close of the primary markets on which the security is traded. |
| · | If the exchange on which a portfolio security is principally traded closes early or if trading in a particular portfolio security was halted during the day and did not resume prior to the Funds’ NAV calculation. |
| · | If a security is so thinly traded that reliable market quotations are unavailable due to infrequent trading. |
| · | If the validity of market quotations is not reliable. |
Securities held by the Funds that do not have readily available market quotations, significant observable inputs, or securities for which the available market quotations are not reliable, are priced at their estimated fair value using procedures approved by the Funds’ Board of Trustees and are generally categorized in Level 3.
Investment companies —The Funds may invest in securities of other investment companies, including exchange-traded funds (“ETFs”), open-end funds and closed-end funds. Open-end funds are investment companies that issue new shares continuously and redeem shares daily. Closed-end funds are investment companies that typically issue a fixed number of shares that trade on a securities exchange or over-the-counter (“OTC”). An ETF is an investment company that typically seeks to track the performance of an index by holding in its portfolio shares of all the companies, or a representative sample of the companies, that are components of a particular index. ETF shares are traded on a securities exchange based on their market value. The risks of investment in other investment companies typically reflect the risks of the types of securities in which the other investment companies invest. Investments in ETFs and closed-end funds are subject to the additional risk that their shares may trade at a premium or discount to their NAV. When a Fund invests in another investment company, shareholders of the Fund indirectly bear their proportionate share of the other investment company’s fees and expenses, including operating, registration, trustee, licensing, and marketing, as well as their share of the Fund’s fees and expenses.
Futures Contracts —The Active Bond Fund may buy and sell futures contracts and related options to manage its exposure to changing interest rates and securities prices. Some strategies reduce the Fund’s exposure to price fluctuations, while others tend to increase its market exposure. Futures and options on futures can be volatile instruments and involve certain risks that could negatively impact the Fund’s return. In order to avoid leveraging and related risks, when the Fund purchases futures contracts, it will collateralize its position by depositing an amount of cash or liquid securities, equal to the market value of the futures positions held, less margin deposits, in a segregated account with its custodian or otherwise “cover” its position in a manner consistent with the 1940 Act, or the rules of the Securities and Exchange Commission (the “SEC”) or interpretations thereunder. Collateral equal to the current fair value of the futures position will be determined on a daily basis.
Notes to Financial Statements(Continued)
When the contract is closed, the Fund records a realized gain or loss equal to the difference between the proceeds from (or cost of ) the closing transactions and the Fund’s basis in the contract. Risks of entering into futures contracts include the possibility that a change in the value of the contract may not correlate with the changes in the value of the underlying instruments. Second, it is possible that a lack of liquidity for futures contracts could exist in the secondary market resulting in an inability to close a futures position prior to its maturity date. Third, the purchase of a futures contract involves the risk that the Fund could lose more than the original margin deposit required to initiate the futures transaction. Finally, the risk exists that losses could exceed amounts disclosed on the Statements of Assets and Liabilities. There is minimal counterparty credit risk involved in entering into futures contracts since they are exchange-traded instruments and the exchange’s clearinghouse, as counterparty to all exchange-traded futures, guarantees the futures against default.
As of December 31, 2018, the Active Bond Fund held futures contracts as shown in the Portfolio of Investments and pledged cash in the amount of $18,889 as collateral to cover open futures contracts.
Foreign currency translation —The books and records of the Funds are maintained in U.S. dollars and translated into U.S. dollars on the following basis:
| (1) | market value of investment securities, assets and liabilities at the current rate of exchange on the valuation date; and |
| (2) | purchases and sales of investment securities, income, and expenses at the relevant rates of exchange prevailing on the respective dates of such transactions. |
The Funds do not isolate that portion of gains and losses on investments in equity securities that is due to changes in the foreign exchange rates from that which is due to changes in market prices of equity securities.
Real Estate Investment Trusts —The Funds may invest in real estate investment trusts (“REITs”) that involve risks not associated with investing in stocks. Risks associated with investments in REITs include declines in the value of real estate, general and economic conditions, changes in the value of the underlying property and defaults by borrowers. The value of assets in the real estate industry may go through cycles of relative under performance and outperformance in comparison to equity securities markets in general. Dividend income is recorded using management’s estimate of the income included in distributions received from REIT investments. The actual amounts of income, return of capital and capital gains are only determined by each REIT after its fiscal year-end and may differ from the estimated amount. Estimates of income are adjusted in the Funds to the actual amounts when the amounts are determined.
Derivative instruments and hedging activities —The Active Bond Fund may enter into an International Swaps and Derivatives Association, Inc. Master Agreement (“ISDA Master Agreement” or “MNA”) or similar agreement with certain counterparties. An ISDA Master Agreement is a bilateral agreement between the Fund and a counterparty that governs OTC derivatives and foreign exchange contracts, and typically contains, among other things, collateral posting terms and master netting provisions in the event of a default or termination. Under an ISDA Master Agreement, a party may, under certain circumstances, offset with the counterparty certain derivative financial instrument’s payables or receivables with collateral held or posted and create one single net payment. The provisions of the ISDA Master Agreement typically permit a single net payment in the event of default (close-out netting). These default events include bankruptcy or insolvency of the counterparty. Note, however, that bankruptcy or insolvency laws of a particular jurisdiction may impose restrictions on or prohibitions against the right of offset.
When entering into a derivative transaction, the Fund may be required to post and maintain collateral or margin (including both initial and maintenance margin). Collateral and margin requirements differ by type of derivative. Margin requirements are established by the broker or clearing house for exchange-traded and centrally cleared derivatives (financial futures contracts, options, and centrally cleared swaps). Brokers can ask for margining in
Notes to Financial Statements(Continued)
excess of the clearing house’s minimum in certain circumstances. Collateral terms are contract specific for OTC derivatives (forward foreign currency contracts, options, and swaps). For derivatives traded under an ISDA Master Agreement, the collateral requirements are typically calculated by netting the marked-to-market amount for each transaction under such agreement and comparing that amount to the value of any collateral currently pledged by the Fund and the counterparty. For financial reporting purposes, cash collateral that has been pledged to cover obligations of the Fund and cash collateral received from the counterparty, if any, are reported separately on the Statements of Assets and Liabilities as cash deposits held at prime broker and due to prime broker, respectively. Non-cash collateral pledged by the Fund, if any, is noted in the Portfolio of Investments. To the extent amounts due to the Fund from its counterparties are not fully collateralized, contractually or otherwise, the Fund bears the risk of loss from counterparty non-performance.
Certain ISDA Master Agreements allow counterparties to OTC derivatives transactions to terminate derivative contracts prior to maturity in the event the Fund’s net assets decline by a stated percentage or the Fund fails to meet the terms of its ISDA Master Agreement, which would cause the Fund (counterparty) to accelerate payment of any net liability owed to the counterparty (Fund).
For financial reporting purposes, the Active Bond Fund does not offset derivative assets and derivative liabilities that are subject to netting arrangements in the Statements of Assets and Liabilities.
As of December 31, 2018, the Active Bond Fund’s assets and liabilities that were subject to a MNA on a gross basis were as follows:
| | | Assets | | | Liabilities | |
| Derivative Financial Instruments: | | | | | | | | |
| Futures Contracts | | $ | 84,911 | | | $ | 98,331 | |
The following table presents the Active Bond Fund’s assets and liabilities net of amounts available for offset under a MNA and net of the related collateral pledged by the Fund as of December 31, 2018:
| | | | | Gross | | | | | | | | | | | | | |
| | | | | Amount of | | | Gross Amount Available | | | Non-Cash | | | Cash | | | | |
| | | | | Recognized | | | for Offset in Statement of | | | Collateral | | | Collateral | | | Net | |
| Counterparty | | Derivative Type | | Assets | | | Assets and Liabilities | | | Received | | | Received | | | Amount(A) | |
| Wells Fargo | | Futures Contracts | | $ | 84,911 | | | $ | (84,911 | ) | | $ | — | | | $ | — | | | $ | — | |
| | | | | Gross | | | | | | | | | | | | | |
| | | | | Amount of | | | Gross Amount Available | | | Non-Cash | | | Cash | | | | |
| | | | | Recognized | | | for Offset in Statement of | | | Collateral | | | Collateral | | | Net | |
| Counterparty | | Derivative Type | | Liabilities | | | Assets and Liabilities | | | Pledged | | | Pledged | | | Amount(B) | |
| Wells Fargo | | Futures Contracts | | $ | 98,331 | | | $ | (84,911 | ) | | $ | — | | | $ | (13,420 | ) | | $ | — | |
| (A) | Net amount represents the net amount receivable from the counterparty in the event of default. |
| (B) | Net amount represents the net amount payable due to the counterparty in the event of default. |
The following table sets forth the fair value of the Active Bond Fund’s derivative financial instruments by primary risk exposure as of December 31, 2018:
Fair Value of Derivative Investments As of December 31, 2018 |
| | | Derivatives not accounted for as hedging | | Asset | | | Liability | |
| Fund | | instruments under ASC 815 | | Derivatives | | | Derivatives | |
| Active Bond Fund | | Futures - Interest Rate Contracts* | | $ | 84,911 | | | $ | 98,331 | |
| * | Statements of Assets and Liabilities Location: Payable for variation margin for futures contracts. Only current day’s variation margin is reported within the payables/receivable of the Statement of Assets and Liabilities. Includes cumulative appreciation/(depreciation) of futures contracts as reported on the Portfolio of Investments. |
Notes to Financial Statements(Continued)
The following table sets forth the effect of the Active Bond Fund’s derivative financial instruments by primary risk exposure on the Statements of Operations for the year ended December 31, 2018:
The Effect of Derivative Investments on the Statements of Operations for the Year Ended December 31, 2018 |
| | | | | | | | Change in | |
| | | | | | | | Unrealized | |
| | | | | Realized Gain | | | Appreciation | |
| | | Derivatives not accounted for as hedging | | (Loss) | | | (Depreciation) | |
| Fund | | instruments under ASC 815 | | on Derivatives | | | on Derivatives | |
| Active Bond Fund | | Futures - Interest Rate Contracts* | | $ | (110,728 | ) | | $ | (6,334 | ) |
| * | Statements of Operations Location: Net realized losses on futures contracts and net change in unrealized appreciation (depreciation) on futures contracts. |
For the year ended December 31, 2018, the average quarterly notional value of outstanding derivative financial instruments was as follows:
| | | Active Bond | |
| | | Fund | |
| Interest rate contracts: | | | | |
| Futures - Notional value | | $ | 5,518,588 | |
Portfolio securities loaned —The Funds may lend their portfolio securities. Lending portfolio securities exposes the Funds to the risk that the borrower may fail to return the loaned securities or may not be able to provide additional collateral or that the Funds may experience delays in recovery of the loaned securities or loss of rights in the collateral if the borrower fails financially. To minimize these risks, the borrower must agree to maintain cash collateral with the Funds’ custodian. The loaned securities are secured by collateral valued at least equal, at all times, to the market value of the loaned securities plus accrued interest, if any. When the collateral falls below specified amounts the lending agent will use its best effort to obtain additional collateral on the next business day to meet required amounts under the security lending agreement. The cash collateral is reinvested by the Funds’ custodian into an approved short-term investment vehicle. The approved short-term investment vehicle is subject to market risk.
As of December 31, 2018, the following Funds loaned securities and received collateral as follows:
| | | | | Market | | | Market | | | | |
| | | | | Value of | | | Value of | | | | |
| | | | | Securities | | | Collateral | | | Net | |
| Fund | | Security Type | | Loaned* | | | Received** | | | Amount*** | |
| Aggressive ETF Fund | | Exchange-Traded Funds | | $ | 2,161,752 | | | $ | 2,189,455 | | | $ | 27,703 | |
| Conservative ETF Fund | | Exchange-Traded Funds | | | 2,110,233 | | | | 2,146,729 | | | | 36,496 | |
| Moderate ETF Fund | | Exchange-Traded Funds | | | 2,426,833 | | | | 2,464,847 | | | | 38,014 | |
| * | The remaining contractual maturity is overnight for all securities. |
| ** | Gross amount of recognized liabilities for securities lending included in the Statements of Assets and Liabilities. |
| *** | Net amount represents the net amount payable due to the borrower in the event of default. |
All cash collateral is received, held, and administered by the Funds’ custodian for the benefit of the lending Fund in its custody account or other account established for the purpose of holding collateral in cash equivalents.
Funds participating in securities lending receive compensation in the form of fees. Securities lending income is derived from lending long securities from the Funds to creditworthy approved borrowers at rates that are determined based on daily trading volumes, float, short-term interest rates and market liquidity and is shown net of fees on the Statements of Operations. When a Fund lends securities, it retains the interest or dividends on
Notes to Financial Statements(Continued)
the investment of any cash received as collateral, and the Fund continues to receive interest or dividends on the loaned securities.
Unrealized gain or loss on the market value of the loaned securities that may occur during the term of the loan is recognized by the Fund. The Fund has the right under the lending agreement to recover any loaned securities from the borrower on demand.
When-issued or delayed delivery transactions —Each Fund may purchase or sell securities on a when-issued or delayed delivery basis. These transactions involve a commitment by the Fund to purchase or sell securities for a predetermined price or yield, with payment and delivery taking place beyond the customary settlement period. When delayed delivery purchases are outstanding, the Fund will set aside liquid assets in an amount sufficient to meet the purchase price. When purchasing a security on a delayed delivery basis, the Fund assumes the rights and risks of ownership of the security, including the risk of price and yield fluctuations, and takes such fluctuations into account when determining NAV. The Fund may dispose of or renegotiate a delayed delivery transaction after it is entered into, and may sell when-issued securities before they are delivered, which may result in a capital gain or loss. When the Fund has sold a security on a delayed delivery basis, the Fund does not participate in future gains and losses with respect to the security.
Share valuation —The NAV per share of each Fund is calculated daily by dividing the total value of a Fund’s assets, less liabilities, by its number of outstanding shares.
Investment income —Dividend income from securities is recognized on the ex-dividend date, net of foreign withholding taxes, if any, which are reduced by any amounts reclaimable by the Funds, where applicable. Interest income from securities is recorded on the basis of interest accrued, premium amortized and discount accreted. Realized gains and losses resulting from principal paydowns on mortgage-backed and asset-backed securities are included in interest income. Market discounts, original issue discount and market premiums on debt securities are accreted/amortized to interest income over the life of the security with a corresponding adjustment in the cost basis of that security.
Distributions to shareholders —Each Fund intends to distribute to its shareholders substantially all of its income and capital gains. Each Fund declares and distributes net investment income, if any, annually, as a dividend to shareholders. Each Fund makes distributions of capital gains, if any, at least annually, net of applicable capital loss carryforwards. Income distributions and capital gain distributions are determined in accordance with income tax regulations. Recognition of the Funds’ net investment income from investments in underlying funds is affected by the timing of dividend declarations by the underlying funds.
Allocations —Expenses not directly billed to a Fund are allocated proportionally among all the Funds in the Trust, and, if applicable, Touchstone Funds Group Trust, Touchstone Institutional Funds Trust and Touchstone Strategic Trust (collectively with the Trust, “Touchstone Fund Complex”), daily in relation to net assets of each Fund or another reasonable measure.
Security transactions —Security transactions are reflected for financial reporting purposes as of the trade date. Realized gains and losses on sales of portfolio securities are calculated using the identified cost basis.
Estimates —The preparation of financial statements in conformity with U.S. GAAP requires management to make estimates and assumptions that affect the reported amounts of assets and liabilities and disclosure of contingent assets and liabilities at the date of the financial statements and the reported amounts of income and expenses during the reporting period. Actual results could differ from those estimates.
Notes to Financial Statements(Continued)
3. Investment Transactions
Investment transactions (excluding short-term investments and U.S. Government securities) were as follows for the year ended December 31, 2018:
| | | Active Bond | | | Balanced | | | Bond | | | Common Stock | |
| | | Fund | | | Fund | | | Fund | | | Fund | |
| Purchases of investment securities | | $ | 17,937,832 | | | $ | 2,219,368 | | | $ | 25,818,346 | | | $ | 14,952,396 | |
| Proceeds from sales and maturities | | $ | 10,380,608 | | | $ | 1,425,080 | | | $ | 15,470,242 | | | $ | 33,049,520 | |
| | | | | | Large Cap | | | Small | | | | |
| | | Focused | | | Core Equity | | | Company | | | Aggressive | |
| | | Fund | | | Fund | | | Fund | | | ETF Fund | |
| Purchases of investment securities | | $ | 6,544,660 | | | $ | 6,127,447 | | | $ | 44,661,779 | | | $ | 3,996,785 | |
| Proceeds from sales and maturities | | $ | 13,196,119 | | | $ | 12,116,264 | | | $ | 52,801,918 | | | $ | 5,587,325 | |
| | | Conservative | | | Moderate | | | | | | | |
| | | ETF Fund | | | ETF Fund | | | | | | | |
| Purchases of investment securities | | $ | 8,401,157 | | | $ | 4,344,638 | | | | | | | | | |
| Proceeds from sales and maturities | | $ | 6,980,391 | | | $ | 7,249,766 | | | | | | | | | |
For the year ended December 31, 2018, purchases and proceeds from sales and maturities in U.S. Government Securities were $167,876,963 and $172,839,641, respectively, for the Active Bond Fund, $21,814,995 and $22,875,448, respectively, for the Balanced Fund, and $158,555,602 and $167,913,347, respectively, for the Bond Fund.
4. Transactions with Affiliates and Other Related Parties
Certain officers of theTrust are also officers of Touchstone Advisors, Inc. (the “Advisor”),Touchstone Securities, Inc. (the “Underwriter”), or The Bank of New York Mellon, the Sub-Administrator to the Funds, and BNY Mellon Investment Servicing (U.S.) Inc., the Transfer Agent to the Funds (collectively referenced to herein as “BNY Mellon”). Such officers receive no compensation from the Trust. The Advisor and the Underwriter are each wholly-owned subsidiaries of Western & Southern.
On behalf of the Funds, the Advisor pays each Independent Trustee a quarterly retainer plus additional retainers to the Lead Independent Trustee and the chairs of each standing committee. Interested Trustees do not receive compensation from the Funds. Each Independent Trustee also receives compensation for each board meeting and committee meeting attended. Each standing committee chair receives additional compensation for each committee meeting that he or she oversees. The Advisor is reimbursed by the Funds for the Independent Trustees’ compensation and out-of-pocket expenses relating to their services. The Funds accrued Trustee-related expenses of $145,460 for the year ended December 31, 2018.
MANAGEMENT & EXPENSE LIMITATION AGREEMENTS
The Advisor provides general investment supervisory services for the Funds, under the terms of an advisory agreement (the “Advisory Agreement”). Under the Advisory Agreement, each Fund pays the Advisor a fee, which is computed and accrued daily and paid monthly, at an annual rate based on average daily net assets of each Fund as shown in the table below.
| Active Bond Fund | 0.40% on the first $300 million |
| | 0.35% on such assets over $300 million |
| Balanced Fund | 0.55% on all assets |
| Bond Fund | 0.40% on all assets |
Notes to Financial Statements(Continued)
| Common Stock Fund | 0.50% on the first $200 million |
| Small Company Fund | 0.45% on the next $300 million |
| | 0.40% on such assets over $500 million |
| Focused Fund | 0.70% on the first $100 million |
| | 0.65% on the next $400 million |
| | 0.60% on such assets over $500 million |
| Large Cap Core Equity Fund | 0.65% on the first $100 million |
| | 0.60% on the next $100 million |
| | 0.55% on the next $100 million |
| | 0.50% on such assets over $300 million |
| Aggressive ETF Fund | 0.25% on the first $50 million |
| Conservative ETF Fund | 0.23% on the next $50 million |
| Moderate ETF Fund | 0.20% on such assets over $100 million |
The Advisor has entered into investment sub-advisory agreements with the following parties (each, a “Sub-Advisor”):
| Fort Washington Investment Advisors, Inc.* | Wilshire Associates Incorporated |
| Active Bond Fund | Aggressive ETF Fund |
| Balanced Fund | Conservative ETF Fund |
| Bond Fund | Moderate ETF Fund |
| Common Stock Fund | |
| Focused Fund | |
| Small Company Fund | |
| The London Company | |
| Large Cap Core Equity Fund | |
| * | Affiliate of the Advisor and wholly-owned subsidiary of Western & Southern. |
The Advisor, not the Funds, pays sub-advisory fees to each Sub-Advisor.
The Advisor entered into an expense limitation agreement (the “Expense Limitation Agreement”) to contractually limit the annual operating expenses of the Funds, excluding: dividend and interest expenses relating to short sales; interest; taxes; brokerage commissions and other transaction costs; portfolio transaction and investment related expenses, including expenses associated with the Funds’ liquidity provider; other expenditures which are capitalized in accordance with U.S. GAAP; the cost of “Acquired Fund Fees and Expenses”, if any; and other extraordinary expenses not incurred in the ordinary course of business. The maximum annual operating expense limit in any year with respect to the Funds is based on a percentage of the average daily net assets of the Funds. The Advisor has agreed to waive a portion of its fees, and to reimburse certain fund expenses in order to maintain the following expense limitations for the Funds:
| Fund | | | |
| Active Bond Fund | | | 0.97 | % |
| Balanced Fund | | | 0.85 | % |
| Bond Fund | | | 0.67 | % |
| Common Stock Fund | | | 0.73 | % |
| Focused Fund | | | 1.21 | % |
| Large Cap Core Equity Fund | | | 1.06 | % |
| Small Company Fund | | | 0.76 | % |
| Aggressive ETF Fund | | | 0.75 | % |
| Conservative ETF Fund | | | 0.75 | % |
| Moderate ETF Fund | | | 0.75 | % |
Notes to Financial Statements(Continued)
These expense limitations will remain in effect for all Funds through at least April 29, 2019, except for the Balanced Fund, Bond Fund, Common Stock Fund and Small Company Fund, which will remain in effect through at least October 26, 2019.
During the year ended December 31, 2018, the Advisor or its affiliates waived investment advisory fees, administration fees or shareholder servicing fees of the Funds as follows:
| | | Investment | | | Administration | | | Shareholder | | | | |
| | | Advisory | | | Fees | | | Servicing | | | | |
| Fund | | Fees Waived | | | Waived | | | Fees Waived | | | Total | |
| Balanced Fund | | $ | 27,305 | | | $ | 25,392 | | | $ | — | | | $ | 52,697 | |
| Bond Fund | | | 26,111 | | | | 64,272 | | | | — | | | | 90,383 | |
| Common Stock Fund | | | — | | | | 142,925 | | | | — | | | | 142,925 | |
| Large Cap Core Equity Fund | | | — | | | | 30,376 | | | | — | | | | 30,376 | |
| Small Company Fund | | | — | | | | 57,315 | | | | — | | | | 57,315 | |
| Aggressive ETF Fund | | | — | | | | 28,074 | | | | 4,317 | | | | 32,391 | |
| Conservative ETF Fund | | | — | | | | 27,608 | | | | 5,324 | | | | 32,932 | |
| Moderate ETF Fund | | | — | | | | 25,559 | | | | — | | | | 25,559 | |
Under the terms of the Expense Limitation Agreement, the Advisor is entitled to recover, subject to approval by the Funds’ Board, such amounts waived or reimbursed for a period of up to three years from the date on which the Advisor reduced its compensation or assumed expenses for the Funds. A Fund will make repayments to the Advisor only if such repayment does not cause the Fund’s operating expenses (after the repayment is taken into account) to exceed the Fund’s expense limit in place when such amounts were waived or reimbursed by the Advisor and the Fund’s current expense limitation.
As of December 31, 2018, the Advisor may seek recoupment of previously waived fees and reimbursed expenses as follows:
| | | Expires on or | | | Expires on or | | | Expires on or | | | | |
| | | before | | | before | | | before | | | | |
| | | December 31, | | | December 31, | | | December 31, | | | | |
| Fund | | 2019 | | | 2020 | | | 2021 | | | Total | |
| Balanced Fund | | $ | — | | | $ | 21,573 | | | $ | 52,697 | | | $ | 74,270 | |
| Bond Fund | | | — | | | | 13,965 | | | | 90,383 | | | | 104,348 | |
| Common Stock Fund | | | — | | | | — | | | | 142,925 | | | | 142,925 | |
| Large Cap Core Equity Fund | | | 30,423 | | | | 30,024 | | | | 30,376 | | | | 90,823 | |
| Small Company Fund | | | — | | | | 538 | | | | 57,315 | | | | 57,853 | |
| Aggressive ETF Fund | | | 28,847 | | | | 29,081 | | | | 28,074 | | | | 86,002 | |
| Conservative ETF Fund | | | 30,025 | | | | 26,021 | | | | 27,608 | | | | 83,654 | |
| Moderate ETF Fund | | | 16,916 | | | | 22,530 | | | | 25,559 | | | | 65,005 | |
For the year ended December 31, 2018, the Advisor recouped previously waived fees or reimbursed expenses from the Focused Fund of $7,629.
ADMINISTRATION AGREEMENT
The Advisor entered into an Administration Agreement with the Trust, whereby the Advisor is responsible for: supplying executive and regulatory compliance services; supervising the preparation of tax returns; coordinating the preparation of reports to shareholders and reports to, and filings with, the SEC and state securities authorities, as well as materials for meetings of the Board; calculating the daily NAV per share; and maintaining the financial books and records of each Fund.
Notes to Financial Statements(Continued)
For its services, the Advisor’s annual administrative fee is:
0.145% on the first $20 billion of the aggregate average daily net assets;
0.11% on the next $10 billion of aggregate average daily net assets;
0.09% on the next $10 billion of aggregate average daily net assets; and
0.07% on the aggregate average daily net assets over $40 billion.
The fee is computed and allocated among the Touchstone Fund Complex (excluding Touchstone Institutional Funds Trust) on the basis of relative daily net assets.
The Advisor has engaged BNY Mellon as the Sub-Administrator to theTrust. BNY Mellon provides administrative and accounting services to the Trust and is compensated directly by the Advisor, not the Trust.
TRANSFER AGENT AGREEMENT
Under the terms of the Transfer Agent Agreement between the Trust and BNY Mellon, BNY Mellon maintains the records of each shareholder’s account, answers shareholders’ inquiries concerning their accounts, processes purchases and redemptions of each Fund’s shares, acts as dividend and distribution disbursing agent, and performs other shareholder service functions. For these services, BNY Mellon receives a monthly fee from each Fund. In addition, each Fund pays out-of-pocket expenses incurred by BNY Mellon, including, but not limited to, postage and supplies.
The Funds may reimburse the Advisor for fees paid to intermediaries such as banks, broker-dealers, financial advisors or other financial institutions for sub-transfer agency, sub-administration and other services provided to investors whose shares of record are held in omnibus, other group accounts, retirement plans or accounts traded through registered securities clearing agents. These fees may vary based on, for example, the nature of services provided, but generally range up to 0.15% of the assets of the class serviced or maintained by the intermediary or up to $22 per sub-account maintained by the intermediary.
PLANS OF DISTRIBUTION
The Trust has adopted a Shareholder Services Plan under which shares of each Fund, except for the Balanced Fund, Bond Fund, Common Stock Fund and Small Company Fund, may directly or indirectly bear expenses for shareholder services provided. Each Fund will incur or reimburse expenses for shareholder services at an annual rate not to exceed 0.25% of the average daily net assets.
UNDERWRITING AGREEMENT
The Underwriter acts as exclusive agent for the distribution of the Funds’ shares. The Underwriter receives no compensation under this agreement.
INTERFUND TRANSACTIONS
Pursuant to Rule 17a-7 under the 1940 Act, the Funds may engage in purchase and sale transactions with funds that have a common investment advisor (or affiliated investment advisors), common Trustees and/or common Officers. During the year ended December 31, 2018, the Funds did not engage in any Rule 17a-7 transactions.
5. Liquidity
Interfund Lending —Pursuant to an Exemptive Order issued by the SEC on March 28, 2017, the Funds, along with certain other funds in the Touchstone Fund Complex, may participate in an interfund lending
Notes to Financial Statements(Continued)
program. The interfund lending program provides an alternate credit facility that allows the Funds to lend to or borrow from other participating funds in the Touchstone Fund Complex, subject to the conditions of the Exemptive Order. The Funds may not borrow under the facility for leverage purposes and the loans’ duration may be no more than 7 days.
During the year ended December 31, 2018, the program was not utilized.
6. Federal Tax Information
Federal Income Tax —It is each Fund’s policy to continue to comply with the special provisions of the Internal Revenue Code applicable to regulated investment companies. As provided therein, in any fiscal year in which a Fund so qualifies and distributes at least 90% of its investment company taxable income, the Fund (but not the shareholders) will be relieved of federal income tax on the income distributed. It is each Fund’s policy to distribute all of its taxable income and accordingly, no provision for income taxes has been made.
The tax character of distributions paid for the years ended December 31, 2018 and 2017 is as follows:
| | | Active Bond | | | Balanced | | | Bond | |
| | | Fund | | | Fund | | | Fund | |
| | | 2018 | | | 2017 | | | 2018 | | | 2017 | | | 2018 | | | 2017 | |
| From ordinary income | | $ | 1,215,721 | | | $ | 1,484,379 | | | $ | 249,571 | | | $ | — | | | $ | 1,019,953 | | | $ | — | |
| From long-term capital gains | | | — | | | | — | | | | 4,676,219 | | | | — | | | | — | | | | — | |
| Total distributions | | $ | 1,215,721 | | | $ | 1,484,379 | | | $ | 4,925,790 | | | $ | — | | | $ | 1,019,953 | | | $ | — | |
| | | Common Stock | | | Focused | | | Large Cap | |
| | | Fund | | | Fund | | | Core Equity Fund | |
| | | 2018 | | | 2017 | | | 2018 | | | 2017 | | | 2018 | | | 2017 | |
| From ordinary income | | $ | 3,054,826 | | | $ | 17,544 | | | $ | 272,621 | | | $ | 319,068 | | | $ | 258,518 | | | $ | 215,126 | |
| From long-term capital gains | | | 75,197,635 | | | | 944,237 | | | | 1,171,019 | | | | — | | | | 816,940 | | | | 490,437 | |
| Total distributions | | $ | 78,252,461 | | | $ | 961,781 | | | $ | 1,443,640 | | | $ | 319,068 | | | $ | 1,075,458 | | | $ | 705,563 | |
| | | Small | | | Aggressive | | | Conservative | | | Moderate | |
| | | Company Fund | | | ETF Fund | | | ETF Fund | | | ETF Fund | |
| | | 2018 | | | 2017 | | | 2018 | | | 2017 | | | 2018 | | | 2017 | | | 2018 | | | 2017 | |
| From ordinary income | | $ | 1,581,187 | | | $ | 193,590 | | | $ | 583,667 | | | $ | 351,189 | | | $ | 565,936 | | | $ | 492,618 | | | $ | 709,444 | | | $ | 608,441 | |
| From long-term capital gains | | | 6,172,117 | | | | 1,648,040 | | | | 272,818 | | | | — | | | | 46,367 | | | | 1,630,306 | | | | 320,335 | | | | 3,580,320 | |
| Total distributions | | $ | 7,753,304 | | | $ | 1,841,630 | | | $ | 856,485 | | | $ | 351,189 | | | $ | 612,303 | | | $ | 2,122,924 | | | $ | 1,029,779 | | | $ | 4,188,761 | |
The following information is computed on a tax basis for each item as of December 31, 2018:
| | | | | | Balanced | | | Bond | |
| | | Active Bond Fund | | | Fund | | | Fund | |
| Tax cost of portfolio investments | | $ | 55,949,028 | | | $ | 15,460,113 | | | $ | 42,585,121 | |
| Gross unrealized appreciation on investments | | | 338,658 | | | | 1,707,355 | | | | 68,527 | |
| Gross unrealized depreciation on investments | | | (1,067,229 | ) | | | (1,191,186 | ) | | | (1,016,170 | ) |
| Net unrealized appreciation (depreciation) on investments | | | (728,571 | ) | | | 516,169 | | | | (947,643 | ) |
| Net unrealized appreciation (depreciation) on derivatives and foreign currency transactions | | | 220 | | | | — | | | | — | |
| Undistributed ordinary income | | | 1,435,298 | | | | 229,302 | | | | 1,256,747 | |
| Undistributed long-term capital gains | | | — | | | | 2,213 | | | | — | |
| Capital loss carryforwards | | | (2,362,180 | ) | | | — | | | | (3,738,542 | ) |
| Other temporary differences | | | (14,364 | ) | | | — | | | | | |
| Distributable earnings (deficit) | | $ | (1,669,597 | ) | | $ | 747,684 | | | $ | (3,429,438 | ) |
Notes to Financial Statements(Continued)
| | | Common Stock | | | Focused | | | Large Cap | |
| | | Fund | | | Fund | | | Core Equity Fund | |
| Tax cost of portfolio investments | | $ | 115,077,105 | | | $ | 44,583,635 | | | $ | 23,224,566 | |
| Gross unrealized appreciation on investments | | | 21,585,938 | | | | 10,827,286 | | | | 3,755,033 | |
| Gross unrealized depreciation on investments | | | (11,823,821 | ) | | | (4,276,853 | ) | | | (1,128,046 | ) |
| Net unrealized appreciation (depreciation) on investments | | | 9,762,117 | | | | 6,550,433 | | | | 2,626,987 | |
| Net unrealized appreciation (depreciation) on foreign | | | | | | | | | | | | |
| currency | | | — | | | | (205 | ) | | | — | |
| Undistributed ordinary income | | | 2,958,913 | | | | 214,618 | | | | 210,592 | |
| Undistributed long-term capital gains | | | 589,219 | | | | 1,597,671 | | | | 2,395,300 | |
| Distributable earnings (deficit) | | $ | 13,310,249 | | | $ | 8,362,517 | | | $ | 5,232,879 | |
| | | Small Company | | | Aggressive | | | Conservative | | | Moderate | |
| | | Fund | | | ETF Fund | | | ETF Fund | | | ETF Fund | |
| Tax cost of portfolio investments | | $ | 54,105,954 | | | $ | 18,726,810 | | | $ | 18,871,702 | | | $ | 21,012,160 | |
| Gross unrealized appreciation on investments | | | 7,640,557 | | | | 878,731 | | | | 648,500 | | | | 731,188 | |
| Gross unrealized depreciation on investments | | | (3,631,311 | ) | | | (474,911 | ) | | | (271,083 | ) | | | (561,559 | ) |
| Net unrealized appreciation (depreciation) on investments | | | 4,009,246 | | | | 403,820 | | | | 377,417 | | | | 169,629 | |
| Undistributed ordinary income | | | 749,335 | | | | 310,116 | | | | 407,801 | | | | 395,726 | |
| Undistributed long-term capital gains | | | 6,265,967 | | | | 1,015,543 | | | | 61,879 | | | | 948,853 | |
| Distributable earnings (deficit) | | $ | 11,024,548 | | | $ | 1,729,479 | | | $ | 847,097 | | | $ | 1,514,208 | |
The difference between the tax cost of portfolio investments and the financial statement cost is primarily due to wash sale loss deferrals and non-taxable distributions from corporate stock.
As of December 31, 2018, the Funds had the following capital loss carryforwards for federal income tax purposes:
| | | No | | | No | | | | |
| | | Expiration | | | Expiration | | | | |
| | | Short Term | | | Long Term | | | Total | |
| Active Bond Fund | | | 631,131 | | | $ | 1,731,049 | | | $ | 2,362,180 | |
| Bond Fund | | | 1,499,349 | | | | 2,239,193 | | | | 3,738,542 | |
The capital loss carryforwards may be utilized in future years to offset net realized capital gains, if any, prior to distributing such gains to shareholders.
Under current laws, certain capital losses realized after October 31 and ordinary losses realized after December 31 may be deferred (and certain ordinary losses after October and/or December 31 may be deferred) and treated as occurring on the first day of the following fiscal year. For the year ended December 31, 2018, the Funds did not elect to defer any losses.
The Funds have analyzed their tax positions taken or to be taken on federal income tax returns for all open tax years (tax years ended December 31, 2015 through 2018) and have concluded that no provision for income tax is required in their financial statements.
Certain reclassifications, the result of permanent differences between financial statement and income tax reporting requirements, have been made to the components of capital. These reclassifications have no impact on the net assets or NAV per share of the Funds. For the year ended December 31, 2018, there were no reclassifications between paid in capital and distributable earnings for the Funds.
7. Commitments and Contingencies
The Funds indemnify theTrust’s officers and Trustees for certain liabilities that might arise from their performance of their duties to the Funds. Additionally, in the normal course of business, the Funds enter into contracts that
Notes to Financial Statements(Continued)
contain a variety of representations and warranties and which provide general indemnifications. The Funds’ maximum exposure under these arrangements is unknown, as this would involve future claims that may be made against the Funds.
8. Principal Risks
Risks Associated with Foreign Investments —Some of the Funds may invest in the securities of foreign issuers. Investing in securities issued by companies whose principal business activities are outside the U.S. may involve significant risks not present in domestic investments. For example, there is generally less publicly available information about foreign companies, particularly those not subject to the disclosure and reporting requirements of the U.S. securities laws. Foreign issuers are generally not bound by uniform accounting, auditing, and financial reporting requirements and standards of practice comparable to those applicable to domestic issuers. Investments in foreign securities also involve the risk of possible adverse changes in investment or exchange control regulations, expropriation or confiscatory taxation, limitations on the removal of funds or other assets of a Fund, political or financial instability or diplomatic and other developments which could affect such investments. Foreign stock markets, while growing in volume and sophistication, are generally not as developed as those in the U.S., and securities of some foreign issuers (particularly those located in developing countries) may be less liquid and more volatile than securities of comparable U.S. companies. In general, there is less overall governmental supervision and regulation of foreign securities markets, broker-dealers, and issuers than in the U.S.
Risks Associated with Sector Concentration —Certain Funds may invest a high percentage of their assets in specific sectors of the market in order to achieve a potentially greater investment return. As a result, these Funds may be more susceptible to economic, political, and regulatory developments in a particular sector of the market, positive or negative, and may experience increased volatility in the Funds’ NAVs and magnified effect on the total return.
Risks Associated with Credit —An issuer may be unable to make timely payments of either principal or interest. This may cause the issuer’s securities to decline in value. Credit risk is particularly relevant to those Funds that invest a significant amount of their assets in junk bonds or lower-rated securities.
Risks Associated with Interest Rate Changes —The price of debt securities is generally linked to the prevailing market interest rates. In general, when interest rates rise, the price of debt securities falls, and when interest rates fall, the price of debt securities rises. The price volatility of a debt security also depends on its maturity. Longer-term securities are generally more volatile, so the longer the average maturity or duration of these securities, the greater their price risk. Duration is a measure of the expected life, taking into account any prepayment or call features of the security, that is used to determine the price sensitivity of the security for a given change in interest rates. Specifically, duration is the change in the value of a fixed-income security that will result from a 1% change in interest rates, and generally is stated in years. For example, as a general rule a 1% rise in interest rates means a 1% fall in value for every year of duration. Maturity, on the other hand, is the date on which a fixed-income security becomes due for payment of principal. The negative impact on fixed income securities if interest rates increase as a result could negatively impact a Fund’s NAV.
Please see the Funds’ prospectus for a complete discussion of these and other risks.
9. Reorganizations
The shareholders of the former series of Sentinel Variable Products Trust (each a “Reorganizing Fund”) approved an Agreement and Plan of Reorganization providing for the transfer of all assets and liabilities of each Reorganizing Fund to the corresponding Touchstone Fund as noted below. The Balanced Fund, Bond Fund, Common Stock Fund and Small Company Fund, each a new series of the Trust, assumed the financial and performance history of the respective Reorganizing Fund. The tax-free mergers took place on October 27, 2017.
Notes to Financial Statements(Continued)
| | | | | | | | Shares | |
| Reorganizing Funds | | Touchstone Funds | | Net Assets | | | Outstanding | |
| Sentinel Variable Products Balanced Fund | | Balanced Fund | | $ | 17,335,447 | | | | 1,196,835 | |
| Sentinel Variable Products Bond Fund | | Bond Fund | | | 47,002,432 | | | | 4,927,906 | |
| Sentinel Variable Products Common Stock Fund | | Common Stock Fund | | | 157,774,597 | | | | 8,668,827 | |
| Sentinel Variable Products Small Company Fund | | Small Company Fund | | | 68,759,207 | | | | 4,596,838 | |
10. Subsequent Events
Subsequent events occurring after the date of this report have been evaluated for potential impact to this report through the date the financial statements were issued.
At a meeting of the Board of Trustees (the “Board”) of the Trust held on February 12, 2019, the Board approved the reorganization of the Active Bond Fund into the Bond Fund, subject to shareholder approval. The reorganization, if approved, is expected to be completed on or about July 12, 2019.
The Board also approved the reorganization of the Large Cap Core Equity Fund and the Focused Fund into the Common Stock Fund, subject to shareholder approval. The reorganization, if approved, is expected to be completed on or about July 12, 2019.
There were no other subsequent events that necessitated recognition or disclosure in the Funds’ financial statements.
Report of Independent Registered Public Accounting Firm
To the Shareholders and the Board of Trustees of Touchstone Variable Series Trust
Opinion on the Financial Statements
We have audited the accompanying statements of assets and liabilities of Touchstone Variable Series Trust (the “Trust”) (comprising the Touchstone Active Bond Fund, Touchstone Balanced Fund, Touchstone Bond Fund, Touchstone Common Stock Fund, Touchstone Focused Fund, Touchstone Large Cap Core Equity Fund, Touchstone Small Company Fund,Touchstone Aggressive ETF Fund, Touchstone Conservative ETF Fund and Touchstone Moderate ETF Fund (collectively referred to as the “Funds”)), including the portfolios of investments, as of December 31, 2018, and the related statements of operations and changes in net assets, and the financial highlights for each of the periods indicated in the table below and the related notes (collectively referred to as the “financial statements”). In our opinion, the financial statements present fairly, in all material respects, the financial position of each of the Funds comprising Touchstone Variable Series Trust at December 31, 2018, and the results of their operations, changes in net assets and financial highlights for each of the periods indicated in the table below, in conformity with U.S. generally accepted accounting principles.
| | | Statements of | |
| Funds comprising the Touchstone | Statement of | changed in net | Financial |
| Variable Series Trust | Operations | assets | Highlights |
| Touchstone Active Bond Fund | For the year ended December 31, 2018 | For each of the two years in the period ended December 31, 2018 | For each of the five years in the period ended December 31, 2018 |
| Touchstone Focused Fund |
| Touchstone Large Cap Core Equity |
| Fund |
| Touchstone Aggressive ETF Fund |
| Touchstone Conservative ETF Fund |
| Touchstone Moderate ETF Fund |
| Touchstone Balanced Fund | For the year ended December 31, 2018 | For each of the two years in the period ended December 31, 2018 | For each of the two years in the period ended December 31, 2018 |
| Touchstone Bond Fund |
| Touchstone Common Stock Fund |
| Touchstone Small Company Fund |
| |
The financial highlights of Touchstone Balanced Fund, Touchstone Bond Fund, Touchstone Common Stock Fund and Touchstone Small Company Fund for each of the three years in the period ended December 31, 2016 were audited by other auditors, whose report dated February 16, 2017 expressed an unqualified opinion on those financial highlights.
Report of Independent Registered Public Accounting Firm(Continued)
Basis for Opinion
These financial statements are the responsibility of the Trust’s management. Our responsibility is to express an opinion on the Funds’ financial statements based on our audits. We are a public accounting firm registered with the Public Company Accounting Oversight Board (United States) (“PCAOB”) and are required to be independent with respect to the Trust in accordance with the U.S. federal securities laws and the applicable rules and regulations of the Securities and Exchange Commission and the PCAOB.
We conducted our audits in accordance with the standards of the PCAOB. Those standards require that we plan and perform the audit to obtain reasonable assurance about whether the financial statements are free of material misstatement, whether due to error or fraud. The Trust is not required to have, nor were we engaged to perform, an audit of the Trust’s internal control over financial reporting. As part of our audits, we are required to obtain an understanding of internal control over financial reporting, but not for the purpose of expressing an opinion on the effectiveness of the Trust’s internal control over financial reporting. Accordingly, we express no such opinion.
Our audits included performing procedures to assess the risks of material misstatement of the financial statements, whether due to error or fraud, and performing procedures that respond to those risks. Such procedures included examining, on a test basis, evidence regarding the amounts and disclosures in the financial statements. Our procedures included confirmation of securities owned as of December 31, 2018, by correspondence with the custodian, transfer agent and brokers or by other appropriate auditing procedures where replies from brokers were not received. Our audits also included evaluating the accounting principles used and significant estimates made by management, as well as evaluating the overall presentation of the financial statements. We believe that our audits provide a reasonable basis for our opinion.

We have served as the auditor of one or more Touchstone Investments’ investment companies since 1999.
Cincinnati, Ohio
February 19, 2019
Other Items(Unaudited)
Dividend Received Deduction
For corporate shareholders, the following ordinary distributions paid during the fiscal year ended December 31, 2018 qualify for the corporate dividends received deduction. The Funds intend to pass through the maximum allowable percentage.
| Balanced Fund | | | 50.23 | % |
| Common Stock Fund | | | 51.89 | % |
| Focused Fund | | | 100.00 | % |
| Large Cap Core Equity Fund | | | 100.00 | % |
| Small Company Fund | | | 25.62 | % |
For the fiscal year ended December 31, 2018, the Funds designated long-term capital gains as follows:
| Balanced Fund | | $ | 4,676,219 | |
| Common Stock Fund | | $ | 75,197,635 | |
| Focused Fund | | $ | 1,598,247 | |
| Large Cap Core Equity Fund | | $ | 2,395,806 | |
| Small Company Fund | | $ | 6,266,337 | |
| Aggressive ETF Fund | | $ | 1,015,984 | |
| Conservative ETF Fund | | $ | 61,891 | |
| Moderate ETF Fund | | $ | 949,352 | |
Proxy Voting Guidelines and Proxy Voting Records
The Sub-Advisors are responsible for exercising the voting rights associated with the securities purchased and held by the Funds. A description of the policies and procedures that the Sub-Advisors use in fulfilling this responsibility is available as an appendix to the most recent Statement of Additional Information, which can be obtained without charge by calling toll free 1.800.543.0407 or by visiting the Touchstone website at TouchstoneInvestments.com or on the Securities and Exchange Commission’s (the Commission) website at sec.gov. Information regarding how those proxies were voted during the most recent twelve-month period ended June 30, which will be filed by August 31 of that year is also available without charge by calling toll free 1.800.543.0407 or on the Commission’s website at sec.gov.
Quarterly Portfolio Disclosure
The Trust files a complete listing of portfolio holdings for each Fund as of the end of the first and third quarters of each fiscal year on Form N-Q. Effective March 2019, this information will be filed on Form N-PORT and will be publicly available 60 days after the end of the period. The complete listing of each Fund’s portfolio holdings is available on the Commission’s website and will be made available to shareholders upon request by calling 1.800.543.0407.
Schedule of Shareholder Expenses
As a shareholder of the Funds, you incur two types of costs: (1) transaction costs and (2) ongoing costs, including investment advisory fees; shareholder servicing fees; and other Fund expenses. This example is intended to help you understand your ongoing costs (in dollars) of investing in the Funds and to compare these costs with the ongoing costs of investing in other mutual funds.
The example is based on an investment of $1,000 invested at the beginning of the period and held for the entire period (July 1, 2018 through December 31, 2018).
Actual Expenses
The first line of the table below for each Fund provides information about actual account values and actual expenses. You may use the information in this line, together with the amount you invested, to estimate the expenses that you paid over the period. Simply divide your account value by $1,000 (for example, an $8,600
Other Items(Unaudited) (Continued)
account value divided by $1,000 = 8.6), then multiply the result by the number in the first line under the heading entitled “Expenses Paid During the six months ended December 31, 2018” to estimate the expenses you paid on your account during this period.
Hypothetical Example for Comparison Purposes
The second line of the table below for each Fund provides information about hypothetical account values and hypothetical expenses based on the Funds’ actual expense ratio and an assumed rate of return of 5% per year before expenses, which is not the Funds’ actual return. The hypothetical account values and expenses may not be used to estimate the actual ending account balance or expenses you paid for the period. You may use this information to compare the ongoing costs of investing in the Funds and other funds. To do so, compare this 5% hypothetical example with the 5% hypothetical examples that appear in the shareholder reports of the other funds.
Please note that the expenses shown in the table below are meant to highlight your ongoing costs only and do not reflect any transactional costs. Therefore, the second line of the table below for each Fund is useful in comparing ongoing costs only, and will not help you determine the relative total costs of owning different funds.
| | | | | | | | | | | | Expenses | |
| | | Net Expense | | | Beginning | | | Ending | | | Paid During | |
| | | Ratio | | | Account | | | Account | | | the Six Months | |
| | | Annualized | | | Value | | | Value | | | Ended | |
| | | December 31, | | | July 1, | | | December 31, | | | December 31, | |
| | | 2018 | | | 2018 | | | 2018 | | | 2018* | |
| Touchstone Active Bond Fund | | | | | | | | | | | | | | | | |
| Actual | | | 0.80 | % | | $ | 1,000.00 | | | $ | 1,003.70 | | | $ | 4.04 | |
| Hypothetical | | | 0.80 | % | | $ | 1,000.00 | | | $ | 1,021.17 | | | $ | 4.08 | |
| | | | | | | | | | | | | | | | | |
| Touchstone Balanced Fund | | | | | | | | | | | | | | | | |
| Actual | | | 0.85 | % | | $ | 1,000.00 | | | $ | 938.10 | | | $ | 4.15 | |
| Hypothetical | | | 0.85 | % | | $ | 1,000.00 | | | $ | 1,020.92 | | | $ | 4.33 | |
| | | | | | | | | | | | | | | | | |
| Touchstone Bond Fund | | | | | | | | | | | | | | | | |
| Actual | | | 0.67 | % | | $ | 1,000.00 | | | $ | 1,005.30 | | | $ | 3.39 | |
| Hypothetical | | | 0.67 | % | | $ | 1,000.00 | | | $ | 1,021.83 | | | $ | 3.41 | |
| | | | | | | | | | | | | | | | | |
| Touchstone Common Stock Fund | | | | | | | | | | | | | | | | |
| Actual | | | 0.73 | % | | $ | 1,000.00 | | | $ | 908.40 | | | $ | 3.51 | |
| Hypothetical | | | 0.73 | % | | $ | 1,000.00 | | | $ | 1,021.53 | | | $ | 3.72 | |
| | | | | | | | | | | | | | | | | |
| Touchstone Focused Fund | | | | | | | | | | | | | | | | |
| Actual | | | 1.21 | % | | $ | 1,000.00 | | | $ | 904.50 | | | $ | 5.81 | |
| Hypothetical | | | 1.21 | % | | $ | 1,000.00 | | | $ | 1,019.11 | | | $ | 6.16 | |
| | | | | | | | | | | | | | | | | |
| Touchstone Large Cap Core Equity Fund | | | | | | | | | | | | | | | | |
| Actual | | | 1.06 | % | | $ | 1,000.00 | | | $ | 944.90 | | | $ | 5.20 | |
| Hypothetical | | | 1.06 | % | | $ | 1,000.00 | | | $ | 1,019.86 | | | $ | 5.40 | |
| | | | | | | | | | | | | | | | | |
| Touchstone Small Company Fund | | | | | | | | | | | | | | | | |
| Actual | | | 0.76 | % | | $ | 1,000.00 | | | $ | 865.20 | | | $ | 3.57 | |
| Hypothetical | | | 0.76 | % | | $ | 1,000.00 | | | $ | 1,021.37 | | | $ | 3.87 | |
| | | | | | | | | | | | | | | | | |
| Touchstone Aggressive ETF Fund** | | | | | | | | | | | | | | | | |
| Actual | | | 0.75 | % | | $ | 1,000.00 | | | $ | 921.60 | | | $ | 3.63 | |
| Hypothetical | | | 0.75 | % | | $ | 1,000.00 | | | $ | 1,021.42 | | | $ | 3.82 | |
Other Items(Unaudited) (Continued)
| | | | | | | | | | | | Expenses | |
| | | Net Expense | | | Beginning | | | Ending | | | Paid During | |
| | | Ratio | | | Account | | | Account | | | the Six Months | |
| | | Annualized | | | Value | | | Value | | | Ended | |
| | | December 31, | | | July 1, | | | December 31, | | | December 31, | |
| | | 2018 | | | 2018 | | | 2018 | | | 2018* | |
| Touchstone Conservative ETF Fund** | | | | | | | | | | | | | | | | |
| Actual | | | 0.75 | % | | $ | 1,000.00 | | | $ | 965.50 | | | $ | 3.72 | |
| Hypothetical | | | 0.75 | % | | $ | 1,000.00 | | | $ | 1,021.42 | | | $ | 3.82 | |
| | | | | | | | | | | | | | | | | |
| Touchstone Moderate ETF Fund** | | | | | | | | | | | | | | | | |
| Actual | | | 0.75 | % | | $ | 1,000.00 | | | $ | 942.90 | | | $ | 3.67 | |
| Hypothetical | | | 0.75 | % | | $ | 1,000.00 | | | $ | 1,021.42 | | | $ | 3.82 | |
| * | Expenses are equal to the Fund’s annualized expense ratio, multiplied by the average account value over the period, multiplied by 184/365 (to reflect one-half year period). |
| ** | The annualized expense ratio for the Fund does not include fees and expenses of the underlying funds in which the Fund invests. |
Advisory and Sub-Advisory Agreement Approval Disclosure
At a meeting held on November 15, 2018, the Board of Trustees (the “Board” or “Trustees”) of the Touchstone Variable Series Trust (the “Trust”), and by a separate vote, the Independent Trustees of the Trust, approved the continuance of the Investment Advisory Agreement between the Trust and the Advisor with respect to each Fund of the Trust, and the continuance of the Sub-Advisory Agreement between the Advisor and each Fund’s respective Sub-Advisor.
In determining whether to approve the continuation of the Investment Advisory Agreement and the Sub-Advisory Agreements, the Advisor furnished information necessary for a majority of the Independent Trustees to make the determination that the continuance of the Investment Advisory Agreement and each Sub-Advisory Agreement was in the best interests of the respective Funds and their shareholders. The information provided to the Board included: (1) industry data comparing advisory fees and total expense ratios of comparable funds; (2) comparative performance information; (3) the Advisor’s and its affiliates’ revenues and costs of providing services to the Funds; and (4) information about the Advisor’s and Sub-Advisors’ personnel. Prior to voting, the Independent Trustees reviewed the proposed continuance of the Investment Advisory Agreement and the Sub-Advisory Agreements with management and experienced independent legal counsel and received materials from such counsel discussing the legal standards for their consideration of the proposed continuation of the Investment Advisory Agreement and each Sub-Advisory Agreement. The Independent Trustees also reviewed the proposed continuation of the Investment Advisory Agreement and each Sub-Advisory Agreement with independent legal counsel in private sessions at which no representatives of management were present.
In approving the Funds’ Investment Advisory Agreement, the Board considered various factors, among them: (1) the nature, extent and quality of services provided to the Funds, including the personnel providing such services; (2) the Advisor’s compensation and profitability; (3) a comparison of fees and performance with comparable funds; (4) economies of scale; and (5) the terms of the Investment Advisory Agreement. The Board’s analysis of these factors is set forth below. The Independent Trustees were advised by independent legal counsel throughout the process.
Nature, Extent and Quality of Advisor Services.The Board considered the level and depth of knowledge of the Advisor, including the professional experience and qualifications of senior personnel. In evaluating the quality of services provided by the Advisor, the Board took into account its familiarity with the Advisor’s senior management through Board meetings, discussions and reports during the preceding year. The Board also took into account the Advisor’s compliance policies and procedures. The quality of administrative and other services, including the Advisor’s role in coordinating the activities of the Funds’ other service providers, was also considered. The
Other Items(Unaudited) (Continued)
Board also considered the Advisor’s relationship with its affiliates and the resources available to them, as well as any potential conflicts of interest.
The Board discussed the Advisor’s effectiveness in monitoring the performance of each Sub-Advisor, including the one that was an affiliate of the Advisor, and the Advisor’s timeliness in responding to performance issues. The Board considered the Advisor’s process for monitoring each of the Sub-Advisors, which includes an examination of both qualitative and quantitative elements of the Sub-Advisor’s organization, personnel, procedures, investment discipline, infrastructure and performance. The Board considered that the Advisor conducts periodic compliance due diligence of each Sub-Advisor, during which the Advisor examines a wide variety of factors, such as the financial condition of the Sub-Advisor, the quality of the Sub-Advisor’s systems, the effectiveness of the Sub-Advisor’s disaster recovery programs, trade allocation and execution procedures, compliance with the Sub-Advisor’s policies and procedures, results of regulatory examinations and any other factors that might affect the quality of services that the Sub-Advisor provides to the applicable Fund(s). The Board noted that the Advisor’s compliance monitoring processes also include quarterly reviews of compliance certifications, and that any issues arising from such reports and the Advisor’s compliance visits to the Sub-Advisors are reported to the Board.
The Trustees concluded that they were satisfied with the nature, extent and quality of services provided to each Fund by the Advisor under the Investment Advisory Agreement.
Advisor’s Compensation and Profitability.The Board took into consideration the financial condition and profitability of the Advisor and its affiliates (including the Sub-Advisor to certain of the Funds) and the direct and indirect benefits derived by the Advisor and its affiliates from the Advisor’s relationship with the Funds. The information considered by the Board included operating profit margin information for the Advisor’s business as a whole. The Board noted that the Advisor had waived a portion of advisory fees and administrative fees and/or reimbursed expenses in order to limit certain Funds’ net operating expenses. The Board also noted that the Advisor pays the Sub-Advisors’ sub-advisory fees out of the advisory fees the Advisor receives from the Funds. The Board reviewed the profitability of the Advisor’s relationship with the Funds both before and after tax expenses, and also considered whether the Advisor has the financial wherewithal to continue to provide services to the Funds, noting the ongoing commitment of the Advisor’s parent company with respect to providing support and resources as needed. The Board also noted that the Advisor derives benefits to its reputation and other benefits from its association with the Funds. The Board also considered that affiliates of the Advisor may benefit from certain indirect tax benefits, including those relating to dividend received deductions.
The Board recognized that the Advisor should be entitled to earn a reasonable level of profits in exchange for the level of services it provides to each Fund and the entrepreneurial risk that it assumes as Advisor. Based upon their review, the Trustees concluded that the Advisor’s and its affiliates’ level of profitability, if any, from their relationship with each Fund was reasonable and not excessive.
Expenses and Performance.The Board compared the respective advisory fees and total expense ratios for each of the Funds with various comparative data, including the median and average advisory fees and total expense ratios of each Fund’s respective peer group. The Board also considered, among other data, the Funds’ respective performance results during the six-month, twelve-month and thirty-seventh periods ended September 30, 2018 and noted that the Board reviews on a quarterly basis detailed information about each Fund’s performance results, portfolio composition and investment strategies. The Board also took into account current market conditions and their effect on the Funds’ performance.
The Board also considered the effect of each Fund’s growth and size on its performance and expenses. The Board noted that the Advisor had waived a portion of the fees and/or reimbursed expenses of certain Funds in order to reduce those Funds’ respective operating expenses to targeted levels. The Board noted that the sub-advisory fees under the Sub-Advisory Agreement with respect to each Fund were paid by the Advisor out of the advisory fees it receives from the Fund and considered the impact of such sub-advisory fees on the profitability of the
Other Items(Unaudited) (Continued)
Advisor. In reviewing the respective total expense ratios and performance of each of the Funds, the Board also took into account the nature, extent and quality of the services provided to the Funds by the Advisor and its affiliates.
The Board considered, among other data, the specific factors and related conclusions set forth below with respect to each Fund:
Touchstone Active Bond Fund. The Fund’s advisory fee and total expense ratio were below the median and above the median, respectively, of its peer group. The Board took into account management’s discussion of the Fund’s expenses, including the impact that the relatively small size of the Fund has upon expenses. The Fund’s performance for the six- and twelve-month periods ended September 30, 2018 was in the 5th quintile of its peer group, while the Fund’s performance for the thirty-six-month period ended September 30, 2018 was in the 2nd quintile of its peer group. The Board noted management’s discussion of the Fund’s performance, including both its recent and long-term performance. Based upon their review, the Trustees concluded that the Fund’s overall performance was satisfactory relative to the performance of funds with similar investment objectives and relevant indices, and that the advisory fee was reasonable in light of the services received by the Fund from the Advisor and the other factors considered.
Touchstone Balanced Fund. The Fund’s advisory fee and total expense ratio (net of applicable expense waivers and reimbursements) were below the median and above the median, respectively, of its peer group. The Board noted that the Advisor was currently waiving and/or reimbursing a portion of the Fund’s fees and/or expenses. The Fund’s performance for the six-, twelve- and thirty-six-month periods ended September 30, 2018 was in the 2nd quintile of its peer group. Based upon their review, the Trustees concluded that the Fund’s overall performance was satisfactory relative to the performance of funds with similar investment objectives and relevant indices, and that the advisory fee was reasonable in light of the services received by the Fund from the Advisor and the other factors considered.
Touchstone Bond Fund The Fund’s advisory fee and total expense ratio (net of applicable expense waivers and reimbursements) were below the median and above the median, respectively, of its peer group. The Board noted that the Advisor was currently waiving and/or reimbursing a portion of the Fund’s fees and/or expenses. The Fund’s performance for the six- and twelve-month periods ended September 30, 2018 was in the 4th quintile of its peer group, while the Fund’s performance for the thirty-six-month period ended September 30, 2018 was in the 5th quintile of its peer group. The Board noted management’s discussion of the Fund’s performance, including both its recent and long-term performance. The Board also took into account that the Fund’s portfolio management team and investment process changed in October 2017. Based upon their review, the Trustees concluded that the Fund’s overall performance was satisfactory relative to the performance of funds with similar investment objectives and relevant indices, and that the advisory fee was reasonable in light of the services received by the Fund from the Advisor and the other factors considered.
Touchstone Common Stock Fund. The Fund’s advisory fee and total expense ratio (net of applicable expense waivers and reimbursements) were below the median of its peer group. The Board noted that the Advisor was currently waiving and/or reimbursing a portion of the Fund’s fees and/or expenses. The Fund’s performance for the six- and twelve-month periods ended September 30, 2018 was in the 4th quintile of its peer group, while the Fund’s performance for the thirty-six-month period ended September 30, 2018 was in the 3rd quintile of its peer group. The Board noted management’s discussion of the Fund’s performance, including both its recent and long-term performance. Based upon their review, the Trustees concluded that the Fund’s overall performance was satisfactory relative to the performance of funds with similar investment objectives and relevant indices, and that the advisory fee was reasonable in light of the services received by the Fund from the Advisor and the other factors considered.
Other Items(Unaudited) (Continued)
Touchstone Focused Fund. The Fund’s advisory fee and total expense ratio were above the median of its peer group. The Fund’s performance for the six-, twelve- and thirty-six-month periods ended September 30, 2018 was in the 5th quintile of its peer group. The Board noted management’s discussion of the Fund’s performance, including both its recent and long-term performance. Based upon their review, the Trustees concluded that the Fund’s overall performance was satisfactory relative to the performance of funds with similar investment objectives and relevant indices, and that the advisory fee was reasonable in light of the services received by the Fund from the Advisor and the other factors considered.
Touchstone Large Cap Core Equity Fund. The Fund’s advisory fee and total expense ratio (net of applicable expense waivers and reimbursements) were above the median of its peer group. The Board noted that the Advisor was currently waiving and/or reimbursing a portion of the Fund’s fees and/or expenses. The Fund’s performance for the six- and thirty-six-month periods ended September 30, 2018 was in the 4th quintile of its peer group, while the Fund’s performance for the twelve-month period ended September 30, 2018 was in the 3rd quintile of its peer group. The Board noted management’s discussion of the Fund’s performance, including both its recent and long-term performance. Based upon their review, the Trustees concluded that the Fund’s overall performance was satisfactory relative to the performance of funds with similar investment objectives and relevant indices, and that the advisory fee was reasonable in light of the services received by the Fund from the Advisor and the other factors considered.
Touchstone Small Company Fund. The Fund’s advisory fee and total expense ratio (net of applicable expense waivers and reimbursements) were below the median of its peer group. The Board noted that the Advisor was currently waiving and/or reimbursing a portion of the Fund’s fees and/or expenses. The Fund’s performance for the six- and twelve-month periods ended September 30, 2018 was in the 3rd quintile of its peer group, while the Fund’s performance for the thirty-six-month period ended September 30, 2018 was in the 2nd quintile of its peer group. Based upon their review, the Trustees concluded that the Fund’s overall performance was satisfactory relative to the performance of funds with similar investment objectives and relevant indices, and that the advisory fee was reasonable in light of the services received by the Fund from the Advisor and the other factors considered.
Touchstone Aggressive ETF Fund. The Fund’s advisory fee and total expense ratio (net of applicable expense waivers and reimbursements) were above the median and below the median, respectively, of its peer group. The Board noted that the Advisor was currently waiving and/or reimbursing a portion of the Fund’s fees and/or expenses. The Fund’s performance for the six-, twelve- and thirty-six-month periods ended September 30, 2018 was in the 3rd quintile of its peer group. Based upon their review, the Trustees concluded that the Fund’s overall performance was satisfactory relative to the performance of funds with similar investment objectives and relevant indices and that the advisory fee was reasonable in light of the services received by the Fund from the Advisor and the other factors considered.
Touchstone Conservative ETF Fund. The Fund’s advisory fee and total expense ratio (net of applicable expense waivers and reimbursements) were above the median and below the median, respectively, of its peer group. The Board noted that the Advisor was currently waiving and/or reimbursing a portion of the Fund’s fees and/or expenses. The Fund’s performance for the six-, twelve- and thirty-six-month periods ended September 30, 2018 was in the 3rd quintile of its peer group. Based upon their review, the Trustees concluded that the Fund’s overall performance was satisfactory relative to the performance of funds with similar investment objectives and relevant indices, and that the advisory fee was reasonable in light of the services received by the Fund from the Advisor and the other factors considered.
Touchstone Moderate ETF Fund. The Fund’s advisory fee and total expense ratio (net of applicable expense waivers and reimbursements) were above the median and below the median, respectively, of its peer group. The Board noted that the Advisor was currently waiving and/or reimbursing a portion of the Fund’s fees and/or
Other Items(Unaudited) (Continued)
expenses. The Fund’s performance for the six-, twelve- and thirty-six-month periods ended September 30, 2018 was in the 4th quintile of its peer group. The Board noted management’s discussion of the Fund’s performance, including both its recent and long-term performance. Based upon their review, the Trustees concluded that the Fund’s overall performance was satisfactory relative to the performance of funds with similar investment objectives and relevant indices, and that the advisory fee was reasonable in light of the services received by the Fund from the Advisor and the other factors considered.
Economies of Scale.The Board considered the effect of each Fund’s current size and potential growth on its performance and expenses. The Board took into account management’s discussion of the Funds’ advisory fee structure. The Board considered the effective advisory fees under the Investment Advisory Agreement as a percentage of assets at different asset levels and possible economies of scale that might be realized if the assets of each Fund increase. The Board noted that the advisory fee schedules for all but two of the Funds contain breakpoints that would reduce the respective advisory fee rate on assets above specified levels as the respective Fund’s assets increased and considered the necessity of adding breakpoints with respect to each Fund that did not currently have such breakpoints in its advisory fee schedule. The Board determined that adding breakpoints at specified levels to the advisory fee schedules of the Funds that currently did not have such breakpoints was not appropriate at that time. The Board also noted that if a Fund’s assets increase over time, the Fund might realize other economies of scale if assets increase proportionally more than certain other expenses. The Board also considered the fact that, under the Investment Advisory Agreement, the advisory fee payable to the Advisor by a Fund was reduced by the total sub-advisory fee paid by the Advisor to the Fund’s Sub-Advisor.
Conclusion.In considering the renewal of the Funds’ Investment Advisory Agreement, the Board, including the Independent Trustees, did not identify any single factor as controlling, and each Trustee may have attributed different weights to the various factors. The Trustees evaluated all information available to them on a Fund-by-Fund basis, and their determinations were made separately with respect to each Fund. The Board reached the following conclusions regarding the Funds’ Investment Advisory Agreement with the Advisor, among others: (a) the Advisor demonstrated that it possesses the capability and resources to perform the duties required of it under the Investment Advisory Agreement; (b) the Advisor maintains an appropriate compliance program; (c) the overall performance of each Fund is satisfactory relative to the performance of funds with similar investment objectives and relevant indices; and (d) each Fund’s advisory fee is reasonable in light of the services received by the Fund from the Advisor and the other factors considered. Based on their conclusions, the Trustees determined with respect to each Fund that continuation of the Investment Advisory Agreement was in the best interests of the Fund and its shareholders.
In approving the applicable Funds’ respective Sub-Advisory Agreements, the Board considered various factors with respect to each Fund and the applicable Sub-Advisory Agreement, among them: (1) the nature, extent and quality of services provided to the Fund, including the personnel providing such services; (2) the Sub-Advisor’s compensation; (3) a comparison of the sub-advisory fee and performance with comparable funds; and (4) the terms of the Sub-Advisory Agreement. The Board’s analysis of these factors is set forth below. The Independent Trustees were advised by independent legal counsel throughout the process.
Nature, Extent and Quality of Services Provided; Investment Personnel.The Board considered information provided by the Advisor regarding the services provided by each Sub-Advisor, including information presented periodically throughout the previous year. The Board noted the affiliation of the Sub-Advisor to certain of the Funds with the Advisor, noting any potential conflicts of interest. The Board also noted that, on a periodic basis, the Board meets with portfolio managers of the Sub-Advisors to discuss their respective performance and investment processes and strategies. The Board considered each Sub-Advisor’s level of knowledge and investment style. The Board reviewed the experience and credentials of the applicable investment personnel who are responsible form an aging the investment of portfolio securities with respect to the Funds. The Board also noted each Sub-Advisor’s brokerage practices.
Other Items(Unaudited) (Continued)
Sub-Advisor’s Compensation, Profitability and Economies of Scale. The Board also took into consideration the financial condition of each Sub-Advisor and any indirect benefits derived by each Sub-Advisor and its affiliates from the Sub-Advisor’s relationship with the Funds. In considering the profitability to each Sub-Advisor of its relationship with the Funds, the Board noted the undertaking of the Advisor to maintain expense limitations for the Funds and also noted that the sub-advisory fees under the Sub-Advisory Agreements were paid by the Advisor out of the advisory fees that it receives under the Investment Advisory Agreement and in addition, with respect to the unaffiliated Sub-Advisors, are negotiated at arm’s length. As a consequence, the profitability to each Sub-Advisor of its relationship with a Fund was not a substantial factor in the Board’s deliberations. For similar reasons, the Board did not consider the potential economies of scale in each Sub-Advisor’s management of the applicable Fund to be a substantial factor in its consideration, although the Board noted that the sub-advisory fee schedule for all but two of the Funds contained breakpoints that would reduce the sub-advisory fee rate on assets above specified levels as the applicable Fund’s assets increased.
Sub-Advisory Fees and Fund Performance.The Board considered that each Fund pays an advisory fee to the Advisor and that the Advisor pays the sub-advisory fee to the Sub-Advisor out of the advisory fee it receives from the respective Fund. The Board also compared the sub-advisory fees paid by the Advisor to fees charged by each Sub-Advisor to manage comparable institutional separate accounts, as applicable. The Board considered the amount retained by the Advisor and the sub-advisory fee paid to each Sub-Advisor with respect to the various services provided by the Advisor and the Sub-Advisor. The Board also noted that the Advisor negotiated the sub-advisory fee with each of the unaffiliated Sub-Advisors at arm’s length. The Board reviewed the sub-advisory fee for each Fund in relation to various comparative data, including the median and average sub-advisory fees of each Fund’s peer group, and considered the following information:
Touchstone Active Bond Fund. The Fund’s sub-advisory fee was above the median of its peer group. Based upon their review, the Trustees concluded that the sub-advisory fee was reasonable in light of the services received by the Fund from the Sub-Advisor and the other factors considered.
Touchstone Balanced Fund. The Fund’s sub-advisory fee was below the median of its peer group. Based upon their review, the Trustees concluded that the sub-advisory fee was reasonable in light of the services received by the Fund from the Sub-Advisor and the other factors considered.
Touchstone Bond Fund. The Fund’s sub-advisory fee was above the median of its peer group. Based upon their review, the Trustees concluded that the sub-advisory fee was reasonable in light of the services received by the Fund from the Sub-Advisor and the other factors considered.
Touchstone Common Stock Fund. The Fund’s sub-advisory fee was above the median of its peer group. Based upon their review, the Trustees concluded that the sub-advisory fee was reasonable in light of the services received by the Fund from the Sub-Advisor and the other factors considered.
Touchstone Focused Fund. The Fund’s sub-advisory fee was above the median of its peer group. Based upon their review, the Trustees concluded that the sub-advisory fee was reasonable in light of the services received by the Fund from the Sub-Advisor and the other factors considered.
Touchstone Large Cap Core Equity Fund. The Fund’s sub-advisory fee was above the median of its peer group. Based upon their review, the Trustees concluded that the sub-advisory fee was reasonable in light of the services received by the Fund from the Sub-Advisor and the other factors considered.
Touchstone Small Company Fund. The Fund’s sub-advisory fee was below the median of its peer group. Based upon their review, the Trustees concluded that the sub-advisory fee was reasonable in light of the services received by the Fund from the Sub-Advisor and the other factors considered.
Other Items(Unaudited) (Continued)
Touchstone Aggressive ETF Fund. The Fund’s sub-advisory fee was above the median of its peer group. Based upon their review, the Trustees concluded that the sub-advisory fee was reasonable in light of the services received by the Fund from the Sub-Advisor and the other factors considered.
Touchstone Conservative ETF Fund. The Fund’s sub-advisory fee was above the median of its peer group. Based upon their review, the Trustees concluded that the sub-advisory fee was reasonable in light of the services received by the Fund from the Sub-Advisor and the other factors considered.
Touchstone Moderate ETF Fund. The Fund’s sub-advisory fee was above the median of its peer group. Based upon their review, the Trustees concluded that the sub-advisory fee was reasonable in light of the services received by the Fund from the Sub-Advisor and the other factors considered.
As noted above, the Board considered each Fund’s performance during the six-month, twelve-month and thirty-six-month periods ended September 30, 2018 as compared to each Fund’s peer group and noted that the Board reviews on a quarterly basis detailed information about each Fund’s performance results, portfolio composition and investment strategies. The Board noted the Advisor’s expertise and resources in monitoring the performance, investment style and risk-adjusted performance of each Sub-Advisor. The Board was mindful of the Advisor’s ongoing monitoring of each Sub-Advisor’s performance and the measures undertaken by the Advisor to address any underperformance.
Conclusion.In considering the renewal of the Sub-Advisory Agreement with respect to each applicable Fund, the Board, including the Independent Trustees, did not identify any single factor as controlling, and each Trustee may have attributed different weights to the various factors. The Board reached the following conclusions regarding each Sub-Advisory Agreement, among others: (a) the Sub-Advisor is qualified to manage each Fund’s assets in accordance with the Fund’s investment goals and policies; (b) the Sub-Advisor maintains an appropriate compliance program; (c) the overall performance of each Fund is satisfactory relative to the performance of funds with similar investment objectives and relevant indices; (d) each Fund’s sub-advisory fee is reasonable in light of the services received by the Fund from the Sub-Advisor and the other factors considered; and (e) the Sub-Advisor’s investment strategies are appropriate for pursuing the investment goals of each Fund. Based on its conclusions, the Board determined that approval of the Sub-Advisory Agreement with respect to each applicable Fund was in the best interests of the Fund and its shareholders.
Management of the Trust(Unaudited)
Listed below is required information regarding the Trustees and principal officers of the Trust. The Trust’s Statement of Additional Information includes additional information about theTrustees and is available, without charge, upon request by calling 1.800.543.0407 or by visiting the Touchstone website at TouchstoneInvestments.com.
Interested Trustee1:
| | | | | | | | | Number | | |
| | | | | | | | | of Funds | | |
| | | | | | | | | Overseen | | |
| | | | | Term of | | | | in the | | |
| Name | | Position(s) | | Office And | | | | Touchstone | | Other |
| Address | | Held with | | Length of | | Principal Occupation(s) | | Fund | | Directorships |
| Year of Birth | | Trust | | Time Served | | During Past 5 Years | | Complex2 | | Held During the Past 5 Years3 |
Jill T. McGruder Touchstone Advisors, Inc. 303 Broadway Suite 1100 Cincinnati, Ohio 45202 Year of Birth: 1955 | | Trustee and President | | Until retirement at age 75 or until she resigns or is removed Trustee since 1999 | | President and CEO of IFS Financial Services, Inc. (a holding company). | | 48 | | IFS Financial Services, Inc. (a holding company) from 1999 to the present; Integrity and National Integrity Life Insurance Co. from 2005 to the present; Touchstone Securities (the Trust’s distributor) from 1999 to the present; Touchstone Advisors, Inc.(the Trust’s investment advisor and administrator) from 1999 to the present; W&S Brokerage Services (a brokerage company) from 1999 to the present; W&S Financial Group Distributors (a distribution company) from 1999 to the present; Cincinnati Analysts, Inc. from 2012 to the present; Columbus Life Insurance Co. from 2016 to the present; The Lafayette Life Insurance Co. from 2016 to the present; Taft Museum of Art from 2007 to the present; YWCA of Greater Cincinnati from 2012 to the present; and LL Global, Inc. from 2016 to the present. |
| Independent Trustees: | | | | | | | | | | |
Phillip R. Cox c/o Touchstone Advisors, Inc. 303 Broadway Suite 1100 Cincinnati, Ohio 45202 Year of Birth: 1947 | | Trustee | | Until retirement at age 75 or until he resigns or is removed Trustee since 1999 | | President and Chief Executive Officer of Cox Financial Corp. (a financial services company) from 1971 to the present. | | 48 | | Director of Cincinnati Bell (a communications company) from 1994 to the present; Bethesda Inc. (a hospital) from 2005 to the present; Timken Co. (a manufacturing company) from 2004 to 2014; TimkenSteel from 2014 to the present; Diebold, Inc. (a technology solutions company) from 2004 to the present; and Ohio Business Alliance for Higher Education and the Economy from 2005 to the present. |
William C. Gale c/o Touchstone Advisors, Inc. 303 Broadway Suite 1100 Cincinnati, Ohio 45202 Year of Birth: 1952 | | Trustee | | Until retirement at age 75 or until he resigns or is removed Trustee since 2013 | | Retired; formerly Senior Vice President and Chief Financial Officer (from 2003 to January 2015) of Cintas Corporation (a business services company). | | 48 | | None. |
Management of the Trust(Unaudited) (Continued)
Independent Trustees (Continued):
| | | | | | | | | Number | | |
| | | | | | | | | of Funds | | |
| | | | | | | | | Overseen | | |
| | | | | Term of | | | | in the | | |
| Name | | Position | | Office And | | | | Touchstone | | Other |
| Address | | Held with | | Length of | | Principal Occupation(s) | | Fund | | Directorships |
| Year of Birth | | Trust | | Time Served | | During Past 5 Years | | Complex2 | | Held During the Past 5 Years3 |
Susan J. Hickenlooper
c/o Touchstone Advisors, Inc.
303 Broadway
Suite 11 00 Cincinnati, Ohio 45202
Year of Birth: 1946 | | Trustee | | Until retirement at age 75 or until she resigns or is removed Trustee since 2009 | | Retired; formerly Financial Analyst for Impact 100 (charitable organization) from November 2012 to 2013. | | 48 | | Trustee of Diocese of Southern Ohio from 2014 to the present; and Trustee of Cincinnati Parks Foundation from 2000 to 2016. |
Kevin A. Robie
c/o Touchstone Advisors, Inc.
303 Broadway Suite 1100 Cincinnati, Ohio 45202 Year of Birth: 1956 | | Trustee | | Until retirement at age 75 or until he resigns or is removed Trustee since 2013 | | Vice President of Portfolio Management at Soin International LLC (a private multinational holding company) from 2004 to the present. | | 48 | | Director of SaverSystems, Inc. from 2015 to the present; Director of Buckeye EcoCare, Inc. (a lawn care company) from 2013 to the present; Trustee of Dayton Region New Market Fund, LLC (a private fund) from 2010 to the present; and Trustee of the Entrepreneurs Center, Inc. (a small business incubator) from 2006 to the present. |
Edward J. VonderBrink
c/o Touchstone Advisors, Inc. 303 Broadway
Suite 1100
Cincinnati, Ohio 45202
Year of Birth: 1944 | | Trustee | | Until retirement at age 75 or until he resigns or is removed Trustee since 2013 | | Consultant, VonderBrink Consulting LLC from 2000 to the present. | | 48 | | Director of Streamline Health Solutions, Inc. (healthcare IT) from 2006 to 2015; Mercy Health from 2013 to the present; Mercy Health Foundation (healthcare nonprofit) from 2008 to the present; Al Neyer Inc. (a construction company) from 2013 to the present; and BASCO Shower Door from 2010 to the present. |
| 1 | Ms. McGruder, as a director of the Advisor and the Distributor, and an officer of affiliates of the Advisor and the Distributor, is an “interested person” of the Trust within the meaning of Section 2(a)(19) of the 1940 Act. |
| 2 | As of December 31, 2018, the Touchstone Fund Complex consists of 10 variable annuity series of the Trust, 15 series of Touchstone Funds Group Trust, 22 series of Touchstone Strategic Trust, and 1 series of Touchstone Institutional Funds Trust. |
| 3 | Each Trustee is also a Trustee of Touchstone Funds Group Trust, Touchstone Institutional Funds Trust, and Touchstone Strategic Trust. |
Management of the Trust(Unaudited) (Continued)
The following is a list of the Principal Officers of the Trust, the length of time served, and principal occupations for the past five years.
Principal Officers:
| | | | Term of | | |
| Name | | Position(s) | | Office and | | |
| Address | | Held with | | Length of | | Principal Occupation(s) |
| Year of Birth | | Trust1 | | Time Served | | During Past 5 Years |
Jill T. McGruder Touchstone Advisors, Inc. 303 Broadway Suite 1100
Cincinnati, Ohio 45202
Year of Birth: 1955 | | President and Trustee | | Until resignation, removal or disqualification President since 2006. | | See biography above. |
Steven M. Graziano
Touchstone Advisors, Inc. 303 Broadway
Suite 1100
Cincinnati, Ohio 45202 Year of Birth: 1954 | | Vice President | | Until resignation, removal or disqualification Vice President since 2009 | | President of Touchstone Advisors, Inc. |
Timothy D. Paulin Touchstone Advisors, Inc. 303 Broadway Suite 1100 Cincinnati, Ohio 45202 Year of Birth: 1963 | | Vice President | | Until resignation, removal or disqualification Vice President since 2010 | | Senior Vice President of Investment Research and Product Management of Touchstone Advisors, Inc. |
Timothy S. Stearns Touchstone Advisors, Inc. 303 Broadway Suite 1100 Cincinnati, Ohio 45202 Year of Birth: 1963 | | Chief Compliance Officer | | Until resignation, removal or disqualification Chief Compliance Officer since 2013 | | Chief Compliance Officer of Touchstone Advisors, Inc.; Chief Compliance Officer of Envestnet Asset Management, Inc. (2009 to 2013). |
Terrie A.Wiedenheft Touchstone Advisors, Inc. 303 Broadway Suite 1100 Cincinnati, Ohio 45202 Year of Birth: 1962 | | Controller and Treasurer | | Until resignation, removal or disqualification Controller and Treasurer since 2006 | | Senior Vice President, Chief Financial Officer, and Chief Operations Officer of IFS Financial Services, Inc. (a holding company). |
Meredyth A. Whitford Western & Southern Financial Group 400 Broadway Cincinnati, Ohio 45202 Year of Birth: 1981 | | Secretary | | Until resignation, removal or disqualification Secretary since 2018 | | Counsel - Securities/Mutual Funds of Western & Southern Financial Group (2015 to present); Associate at Morgan Lewis & Bockius LLP (law firm) (2014 to 2015); Associate at Bingham McCutchen LLP (law firm) (2008 to 2014). |
| 1 | Each officer also holds the same office with Touchstone Funds Group Trust, Touchstone Institutional Funds Trust, and Touchstone Strategic Trust. |
This page intentionally left blank.
This page intentionally left blank.
This page intentionally left blank.
PRIVACY PROTECTION POLICY
We Respect Your Privacy
Thank you for your decision to invest with us. Touchstone and its affiliates have always placed a high value on the trust and confidence our clients place in us. We believe that confidence must be earned and validated through time. In today’s world, when technology allows the sharing of information at light speeds, trust must be reinforced by our sincere pledge to take the steps necessary to ensure that the information you share with us is treated with respect and confidentiality.
Our Pledge to Our Clients
| · | We collect only the information we need to service your account and administer our business. |
| · | We are committed to keeping your information confidential and we place strict limits and controls on the use and sharing of your information. |
| · | We make every effort to ensure the accuracy of your information. |
We Collect the Following Nonpublic Personal Information About You:
| · | Information we receive from you on or in applications or other forms, correspondence, or conversations, including, but not limited to, your name, address, phone number, social security number, assets, income and date of birth; and |
| · | Information about your transactions with us, our affiliates, or others, including, but not limited to, your account number and balance, payment history, parties to transactions, cost basis information, and other financial information. |
Categories of Information We Disclose and Parties to Whom We Disclose
We do not disclose any nonpublic personal information about our current or former clients to nonaffiliated third parties, except as required or permitted by law.
We Place Strict Limits and Controls on the Use and Sharing of Your Information
| · | We restrict access to nonpublic personal information about you to authorized employees who need the information to administer your business. |
| · | We maintain physical, electronic and procedural safeguards that comply with federal standards to protect this information. |
| · | We do not disclose any nonpublic personal information about our current or former clients to anyone, except as required or permitted by law or as described in this document. |
| · | We will not sell your personal information to anyone. |
We May Provide Information to Service Your Account
Sometimes it is necessary to provide information about you to various companies such as transfer agents, custodians, broker-dealers and marketing service firms to facilitate the servicing of your account. These organizations have a legitimate business need to see some of your personal information in order for us to provide service to you. We may disclose to these various companies the information that we collect as described above. We require that these companies, including our own subsidiaries and affiliates, strictly maintain the confidentiality of this information and abide by all applicable laws. Companies within our corporate family that may receive this information are financial service providers and insurance companies. We do not permit these associated companies to sell the information for their own purposes, and we never sell our customer information.
This policy is applicable to the following affiliated companies: Touchstone Funds Group Trust, Touchstone Strategic Trust, Touchstone Variable Series Trust, Touchstone Institutional Funds Trust, Touchstone Securities, Inc.,* and W&S Brokerage Services, Inc.
| * | Touchstone Securities, Inc. serves as the underwriter to the Touchstone Funds. |
A Member of Western & Southern Financial Group®
The Privacy Protection Policy is not part of the Annual Report.

TSF-1006-TVST-AR-1812
Item 2. Code of Ethics.
| (a) | The registrant, as of the end of the period covered by this report, has adopted a code of ethics that applies to the registrant’s principal executive officer, principal financial officer, principal accounting officer or controller, or persons performing similar functions, regardless of whether these individuals are employed by the registrant or a third party. |
| (c) | There have been no amendments, during the period covered by this report, to a provision of the code of ethics that applies to the registrant’s principal executive officer, principal financial officer, principal accounting officer or controller, or persons performing similar functions, regardless of whether these individuals are employed by the registrant or a third party, and that relates to any element of the code of ethics description. |
| (d) | The registrant has not granted any waivers, including an implicit waiver, from a provision of the code of ethics that applies to the registrant’s principal executive officer, principal financial officer, principal accounting officer or controller, or persons performing similar functions, regardless of whether these individuals are employed by the registrant or a third party, that relates to one or more of the items set forth in paragraph (b) of this item’s instructions. |
Item 3. Audit Committee Financial Expert.
The registrant’s Board of Trustees has determined that the registrant has at least one audit committee financial expert serving on its audit committee. Mr. William Gale is the registrant’s audit committee financial expert and is an independent trustee within the meaning of the Investment Company Act of 1940, as amended (the “1940 Act”).
Item 4. Principal Accountant Fees and Services.
Audit Fees
| (a) | Audit fees for Touchstone Variable Series Trust totaled $168,000 and $158,500 for the fiscal years ending December 31, 2018 and December 31, 2017, respectively, including fees associated with the annual audits and filings of Form N1A and Form N-CEN. |
Audit-Related Fees
| (b) | The aggregate fees billed in each of the last two fiscal years for assurance and related services by the principal accountant that are reasonably related to the performance of the audit of the registrant's financial statements and are not reported under paragraph (a) of this Item are $10,500 and $7,092 for the fiscal years ended December 31, 2018 and December 31, 2017, respectively. The fees for 2018 relate to additional audit procedures and review of predecessor auditor work papers. The fees for 2017 relate to the review of the Form N-14 filings for the funds. |
Tax Fees
| (c) | The aggregate fees billed in each of the last two fiscal years for professional services rendered by the principal accountant for tax compliance, tax advice, and tax planning were $32,900 and $31,630 for the fiscal years ended December 31, 2018 and December 31, 2017, respectively. The fees relate to the preparation of federal income and excise tax returns and review of capital gains distribution calculations. |
All Other Fees
| (d) | The aggregate fees billed in each of the last two fiscal years for products and services provided by the principal accountant, other than the services reported in paragraphs (a) through (c) of this Item are $1,493 and $476 for the fiscal years ended December 31, 2018 and December 31, 2017, respectively. The fees relate to the PFIC Analyzer and Global Withholding Tax Reporter subscriptions. |
| (e)(1) | Disclose the audit committee's pre-approval policies and procedures described in paragraph (c)(7) of Rule 2-01 of Regulation S-X. |
The Audit Committee’s pre-approval policies describe the types of audit, audit-related, tax and other services that have the general pre-approval of the Audit Committee. The pre-approval policies provide that annual audit service fees, tax services not specifically granted pre-approval, services exceeding pre-approved cost levels and other services that have not received general pre-approval will be subject to specific pre-approval by the Audit Committee. The pre-approval policies further provide that the Committee may grant general pre-approval to other audit services (statutory audits and services associated with SEC registration statements, periodic reports and other documents filed with the SEC or other documents issued in connection with securities offerings), audit-related services (accounting consultations related to accounting, financial reporting or disclosure matters not classified as “audit services,” assistance with understanding and implementing new accounting and financial reporting guidance from rulemaking authorities, agreed-upon or expanded audit procedures related to accounting and/or billing records required to respond to or comply with financial, accounting or regulatory reporting matters and assistance with internal control reporting requirements under Form N-CSR), tax services that have historically been provided by the auditor that the Committee believes would not impair the independence of the auditor and are consistent with the SEC’s rules on auditor independence and permissible non-audit services classified as “all other services” that are routine and recurring services.
| (e)(2) | All services described in paragraphs (c) through (d) of Item 4 were approved by the Audit Committee. |
| (f) | The percentage of hours expended on the principal accountant's engagement to audit the registrant's financial statements for the most recent fiscal year that were attributed to work performed by persons other than the principal accountant's full-time, permanent employees was less than fifty percent. |
| (g) | The aggregate non-audit fees for Touchstone Variable Series Trust and certain entities*, totaled approximately $849,416 and $39,198 for the fiscal years ended December 31, 2018 and December 31, 2017, respectively. |
* These include the advisors (excluding sub-advisors) and any entity controlling, controlled by or under common control with the advisors that provides ongoing services to the registrant (Funds).
| (h) | The registrant's audit committee of the board of directors has considered whether the provision of non-audit services that were rendered to the registrant's investment adviser (not including any sub-adviser whose role is primarily portfolio management and is subcontracted with or overseen by another investment adviser), and any entity controlling, controlled by, or under common control with the investment adviser that provides ongoing services to the registrant that were not pre-approved pursuant to paragraph (c)(7)(ii) of Rule 2-01 of Regulation S-X is compatible with maintaining the principal accountant's independence. |
Item 5. Audit Committee of Listed Registrants.
Not applicable.
Item 6. Investments.
| (a) | Schedule of Investments in securities of unaffiliated issuers as of the close of the reporting period is included as part of the report to shareholders filed under Item 1 of this form. |
Item 7. Disclosure of Proxy Voting Policies and Procedures for Closed-End Management Investment Companies.
Not applicable.
Item 8. Portfolio Managers of Closed-End Management Investment Companies.
Not applicable.
Item 9. Purchases of Equity Securities by Closed-End Management Investment Company and Affiliated Purchasers.
Not applicable.
Item 10. Submission of Matters to a Vote of Security Holders.
There have been no material changes to the procedures by which the shareholders may recommend nominees to the registrant’s board of trustees, where those changes were implemented after the registrant last provided disclosure in response to the requirements of Item 407(c)(2)(iv) of Regulation S-K (17 CFR 229.407) (as required by Item 22(b)(15) of Schedule 14A (17 CFR 240.14a-101)), or this Item.
Item 11. Controls and Procedures.
| (a) | The registrant’s principal executive and principal financial officers, or persons performing similar functions, have concluded that the registrant’s disclosure controls and procedures (as defined in Rule 30a-3(c) under the Investment Company Act of 1940, as amended (the “1940 Act”) (17 CFR 270.30a-3(c))) are effective, as of a date within 90 days of the filing date of the report that includes the disclosure required by this paragraph, based on their evaluation of these controls and procedures required by Rule 30a-3(b) under the 1940 Act (17 CFR 270.30a-3(b)) and Rules 13a-15(b) or 15d-15(b) under the Securities Exchange Act of 1934, as amended (17 CFR 240.13a-15(b) or 240.15d-15(b)). |
| (b) | There were no changes in the registrant’s internal control over financial reporting (as defined in Rule 30a-3(d) under the 1940 Act (17 CFR 270.30a-3(d))) that occurred during the registrant’s last fiscal quarter that has materially affected, or is reasonably likely to materially affect, the registrant’s internal control over financial reporting. |
Item 12. Disclosure of Securities Lending Activities for Closed-End Management Investment Companies.
Not applicable.
Item 13. Exhibits.
| (a)(1) | Code of ethics, or any amendment thereto, that is the subject of disclosure required by Item 2 is attached hereto. |
| (a)(2) | Certifications pursuant to Rule 30a-2(a) under the 1940 Act and Section 302 of the Sarbanes-Oxley Act of 2002 are attached hereto. |
| (b) | Certifications pursuant to Rule 30a-2(b) under the 1940 Act and Section 906 of the Sarbanes- Oxley Act of 2002 are attached hereto. |
SIGNATURES
Pursuant to the requirements of the Securities Exchange Act of 1934 and the Investment Company Act of 1940, the registrant has duly caused this report to be signed on its behalf by the undersigned, thereunto duly authorized.
(Registrant) Touchstone Variable Series Trust
By (Signature and Title)* /s/ Jill T. McGruder
Jill T. McGruder, President
(principal executive officer)
Date February 25, 2019
Pursuant to the requirements of the Securities Exchange Act of 1934 and the Investment Company Act of 1940, this report has been signed below by the following persons on behalf of the registrant and in the capacities and on the dates indicated.
By (Signature and Title)* /s/ Jill T. McGruder
Jill T. McGruder, President
(principal executive officer)
Date February 25, 2019
By (Signature and Title)* /s/ Terrie A. Wiedenheft
Terrie A. Wiedenheft, Controller and Treasurer
(principal financial officer)
Date February 25, 2019
* Print the name and title of each signing officer under his or her signature.