UNITED STATES
SECURITIES AND EXCHANGE COMMISSION
Washington, D.C. 20549
FORM N-CSR
CERTIFIED SHAREHOLDER REPORT OF REGISTERED MANAGEMENT INVESTMENT COMPANIES
| Investment Company Act file number | 811-08416 |
| Touchstone Variable Series Trust |
| (Exact name of registrant as specified in charter) |
| 303 Broadway, Suite 1100 |
| Cincinnati, Ohio 45202-4203 |
| (Address of principal executive offices) (Zip code) |
| |
| Jill T. McGruder |
| 303 Broadway, Suite 1100 |
| Cincinnati, Ohio 45202-4203 |
| (Name and address of agent for service) |
Registrant's telephone number, including area code: 800-638-8194
Date of fiscal year end: December 31
Date of reporting period: December 31, 2015
Form N-CSR is to be used by management investment companies to file reports with the Commission not later than 10 days after the transmission to stockholders of any report that is required to be transmitted to stockholders under Rule 30e-1 under the Investment Company Act of 1940 (17 CFR 270.30e-1). The Commission may use the information provided on Form N-CSR in its regulatory, disclosure review, inspection, and policymaking roles.
A registrant is required to disclose the information specified by Form N-CSR, and the Commission will make this information public. A registrant is not required to respond to the collection of information contained in Form N-CSR unless the Form displays a currently valid Office of Management and Budget ("OMB") control number. Please direct comments concerning the accuracy of the information collection burden estimate and any suggestions for reducing the burden to Secretary, Securities and Exchange Commission, 100 F Street, NE, Washington, DC 20549. The OMB has reviewed this collection of information under the clearance requirements of 44 U.S.C. § 3507.
Item 1. Reports to Stockholders.
The Report to Shareholders is attached herewith.
December 31, 2015
Annual Report
Touchstone Variable Series Trust
Touchstone Active Bond Fund
Touchstone Focused Fund (formerly known as Touchstone Mid Cap Growth Fund)
Touchstone Large Cap Core Equity Fund
Touchstone Aggressive ETF Fund
Touchstone Conservative ETF Fund
Touchstone Moderate ETF Fund

Table of Contents
This report identifies the Funds' investments on December 31, 2015. These holdings are subject to change. Not all investments in each Fund performed the same, nor is there any guarantee that these investments will perform as well in the future. Market forecasts provided in this report may not occur.
Letter from the President
Dear Shareholder:
We are pleased to provide you with the Touchstone Variable Series Trust Annual Report. Inside you will find key financial information, as well as manager commentaries, for the 12 months ended December 31, 2015.
During the fiscal year, volatility descended on the global markets driven by macroeconomic concerns, diverging monetary policies and the resulting secondary effects. Fears of a Greek default during the second quarter and concerns about an economic slowdown in China during the third quarter clouded the outlook for global economic growth and sparked brief sell-offs in risk assets. Each time, these losses were quickly reversed with the announcement of accommodative central bank action. Meanwhile, investors in the U.S. have spent the year carefully parsing U.S. Federal Reserve Board (Fed) language around the timing and path of potential hikes in short-term rates. Slower economic growth and the divergence in monetary policy between the U.S. and other major economies resulted in weaker commodity prices, further appreciation in the U.S. dollar and poor returns for emerging market equities.
U.S. equity markets exhibited mixed performance during the 12-month period. Amid increased volatility, the U.S. markets generally favored larger capitalization stocks and companies with stronger growth characteristics. Developed non-U.S. equities and emerging market equities, which were already in negative territory, declined further as a U.S. dollar that continued to appreciate erased local currency gains.
Shorter-term interest rates rose throughout the year as the market began to assume a greater likelihood that the Fed would begin to raise rates during the second half of 2015. As a result, by the time the Fed raised rates in December, most of the movement had been priced into the markets. Corporate bonds in general, and particularly those with lower credit quality, struggled as investors demanded increased yields to compensate for the higher credit risk of these securities. Bond returns, as measured by the Barclays U.S. Aggregate Bond Index, were effectively flat as coupon income offset a slight price decline from higher interest rates. Weakness in the energy space contributed to the significant underperformance of high yield bonds relative to other fixed income sectors.
In today’s uncertain market, we believe that focusing on the long-term composition of your investment portfolio is essential to balancing risk and return. We recommend that you work with your financial professional on a regular basis to assess and adjust your asset allocation and diversification strategy as needed to help keep your financial goals on track.
We greatly appreciate your continued support. Thank you for including Touchstone as part of your investment plan.
Sincerely,

Jill T. McGruder
President
Touchstone Variable Series Trust
Management's Discussion of Fund Performance (Unaudited)
Touchstone Active Bond Fund
Sub-Advised by Fort Washington Investment Advisors, Inc.
Investment Philosophy
The Touchstone Active Bond Fund seeks to provide as high a level of current income as is consistent with the preservation of capital. Capital appreciation is a secondary goal. In deciding what securities to buy and sell for the Fund, the overall investment opportunities and risks in different sectors of the debt securities market are analyzed by focusing on maximizing total return and reducing volatility of the Fund’s portfolio. A disciplined sector allocation process is followed in order to build a broadly diversified portfolio of investments.
Fund Performance
The Touchstone Active Bond Fund underperformed its benchmark the Barclays U.S. Aggregate Bond Index for the 12-month period ended December 31, 2015. The Fund’s total return was -1.28 percent, while the benchmark’s total return was 0.55 percent.
Market Environment
Over the past year, U.S. markets experienced significant volatility, primarily as the result of external factors including economic weakness in Europe, China and emerging markets, a sweeping decline in commodities, and divergent central bank action — all amid a backdrop of moderately positive growth in the U.S. Returns were mixed given these factors. During the period, securitized assets (Mortgage-Backed Securities, Asset-Backed Securities and Commercial Mortgage-Backed Securities) outperformed U.S.Treasuries, Investment Grade Corporate bonds and High Yield bonds.
During the first quarter, yields on the U.S. 10-Year Treasury experienced a sharp decline and dipped below 2 percent before rebounding in the second quarter on the back of the recovery in commodities. However, rates dropped yet again in the third quarter but bounced back in the fourth quarter after the U.S. Federal Reserve Board (Fed) raised interest rates for the first time in nearly a decade. Overall, yields on the U.S. 10-Year Treasury were contained to a range of approximately 2.25 percent during the year.
Energy prices rebounded in the first half of 2015, but ended the second half of the year in a steep decline along with other commodities as concerns over growth in China and other geopolitical issues weighed on markets. As commodities continued to fall, many markets that are dependent on China’s exports began to suffer while some fell into mild recessions, including Brazil, Venezuela and Russia. However, the U.S. economy was resilient against these external factors as U.S. labor markets and gross domestic product (GDP) growth continued to show improvement.
Financial conditions also began to tighten over the period as a result of widening corporate credits spreads and a strong U.S. dollar. The strengthening of the U.S. dollar, combined with the decline in oil prices, created headwinds to corporate profits, particularly within the Energy sector and mining space. However, recent data has suggested that consumer savings from low energy prices are beginning to penetrate other parts of the economy, thereby providing support for consumer spending and confidence.
Going forward, the sub-advisor believes interest rates will remain near current levels, and the sub-advisor anticipates the Fed will remain patient in light of current market volatility as it looks to gradually raise interest rates.
Portfolio Review
In general, the Fund underperformed during the 12-month period as a result of an overweight to non-U.S. Treasury sectors. The Fund’s allocation to High Yield bonds was the most significant detractor for the period. The Fund remained overweight to that sector, as the sub-advisor believed High Yield bonds offered adequate
Management's Discussion of Fund Performance (Unaudited) (Continued)
compensation for credit and liquidity risk. The Fund’s overweight to securitized assets contributed positively to returns, while a mostly overweight to Corporate Bonds detracted slightly. Risk premiums across the spectrum of non-U.S.Treasury sectors widened significantly during the period. The Fund’s allocation to non-U.S.Treasury sectors increased over the 12-month-period, as a result of the sub-advisor’s positive macro outlook on U.S. economic growth, accommodative financial conditions, attractive relative valuations of non-U.S.Treasury sectors and neutral market sentiment. The sub-advisor opportunistically increased the Fund’s allocation in Treasury Inflation Protected Securities (TIPS) during the year, which was a main driver of outperformance during the fourth quarter due to increased market-based inflation expectations resulting from continued growth in the U.S. labor markets and the U.S. economy.
There were several tactical shifts in positioning related to interest rate and/or yield curve risk during the period. For much of the 12-month period, the duration of the Fund was neutral relative to the benchmark. Overall, the duration positioning of the Fund had a positive impact on performance during the year. The sub-advisor actively managed its yield curve positioning over the period to take advantage of market volatility. As such, the sub-advisor did not take a definitive position on interest rates and the Fund’s short-term tactical shifts had a positive impact on performance over the period.
Outlook
The Fed is expected to gradually raise interest rates as the economic expansion continues, even though it may generate volatility in the market. The sub-advisor views this as a positive for the U.S. economy and risk assets as investor confidence in the economy improves. The sub-advisor will, however, closely watch global factors in the Middle East, China and other emerging market economies for any impact that might influence the broader economic outlook and affect the strategy’s allocation to risk assets. The sub-advisor believes that interest rates will remain stable in the near-term; however, the sub-advisor also believes markets are anticipating one to two rate increases in 2016. Given this environment and current risk premiums, the sub-advisor believes the Fund is positioned to capture returns through spread tightening as the U.S. economy continues to grow at or above trend.
Looking ahead, the sub-advisor will position the Fund to maintain a neutral bias in terms of interest rate exposure relative to the benchmark, but will actively trade to capture short-term opportunities. The sub-advisor will maintain an allocation to TIPS, as the sub-advisor feels inflation expectations currently priced into the TIPS market are low. The sub-advisor will also maintain an overweight to risk assets, including both Investment Grade bonds and High Yield bonds where appropriate, and other sectors as opportunities arise.
Management's Discussion of Fund Performance (Unaudited) (Continued)
Comparison of the Change in Value of a $10,000 Investment in the
Touchstone Active Bond Fund and the Barclays U.S. Aggregate Bond Index
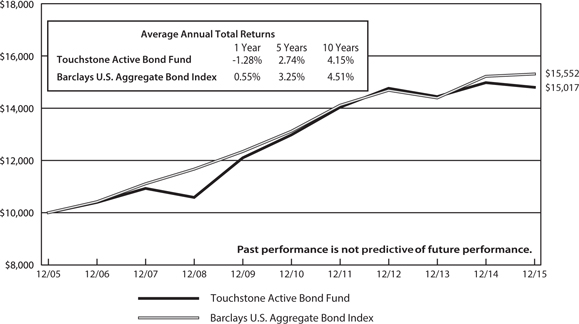
Performance information does not reflect fees that are paid by the separate accounts through which shares of the Fund are sold. Inclusion of those fees would reduce figures for all periods.
The inception date of the Fund was January 1, 1999.
Note to Chart
The Barclays U.S. Aggregate Bond Index is an unmanaged index comprised of U.S. investment grade, fixed rate bond market securities, including government, government agency, corporate and mortgage-backed securities between one and ten years.
Management's Discussion of Fund Performance (Unaudited)
Touchstone Focused Fund
Sub-Advised by Fort Washington Investment Advisors, Inc.
Effective August 31, 2015, Fort Washington Investment Advisors, Inc. was appointed as sub-advisor to the Touchstone Mid Cap Growth Fund. Concurrent with this change, the Fund was renamed the Touchstone Focused Fund and its Principal Investment Strategies, Principal Risks and benchmark index have changed to reflect those of Touchstone Focused Fund’s investment strategy.
Investment Philosophy
The Touchstone Focused Fund seeks capital appreciation by investing in equity securities. It utilizes a distinctive approach centered on linking valuations with barriers to entry. The Fund seeks to invest in businesses that are trading below what is believed to be its estimate of the companies’ intrinsic value. It focuses on businesses that are believed to have a sustainable competitive advantage or a high barrier to entry in place.
Fund Performance
The Touchstone Focused Fund outperformed its benchmark, the Russell 3000® Index, for the 12-month period ended December 31, 2015. The Fund’s total return was 1.97 percent while the benchmark’s total return was 0.48 percent. The Fund’s benchmark prior to August 31, 2015 was the Russell Midcap® Growth Index. The Fund also outperformed this benchmark for the period ended December 31, 2015.
Market Environment
U.S. equity markets finished a volatile 2015 on a positive note as fourth quarter performance was strong. The U.S. Federal Reserve Board (Fed) began to tighten monetary policy while Europe, Japan and China eased. Unemployment fell to 5 percent as the U.S. economy managed to overcome a slowdown abroad. Falling commodity prices led to significant declines in the Energy and Materials sectors throughout the year. The Utilities, Industrials and Financials sectors also posted negative returns. Top performing sectors were Health Care, Consumer Discretionary, Consumer Staples, Information Technology and Telecommunication Services.
Portfolio Review
Most all of the outperformance of the Touchstone Focused Fund can be attributed to stock selection. Sector allocation modestly contributed to performance. Sectors that contributed to relative performance were Consumer Discretionary, Consumer Staples, Financials, Health Care, Information Technology and Materials. Sectors which detracted from relative performance were Industrials, Energy and Telecommunication Services.
General Electric Co. (Industrials sector), Alphabet Inc. (Information Technology sector), and Vulcan Materials Co. (Materials sector) were the top contributors for the 12-month period. Stocks which detracted from performance were Consolidated Energy Inc. (Energy sector), Kennametal Inc. (Industrials sector), and Autodesk Inc. (Information Technology sector).
Outlook
The equity market largely disappointed investors in 2015, finishing up just 1.4 percent as measured by the S&P 500® Index. Yet considering the narrow market leadership, lower earnings quality, a Fed move to raise interest rates and rising credit spreads, a positive return for the market looks like an achievement. Market leadership in 2015 was narrow. The total return for the S&P 500® Index would have been negative without the top three total return contributors. Sector exposure was also important. The Energy and Materials sectors posted negative double-digit returns.
Looking at 2016, the sub-advisor sees emerging markets as a concern to economic and earnings growth. Emerging markets account for a larger percentage of global gross domestic product (GDP) than in the past, indicating
Management's Discussion of Fund Performance (Unaudited) (Continued)
greater risks that fallout from an emerging market downturn could affect the global economy. The sub-advisor sees greater risk to the global economy if the emerging market downturn accelerates.
Due to increased concerns over the quality of the market rally and corporate earnings, along with rising concerns internationally, the sub-advisor has decreased the Fund’s cyclical exposure and operational leverage over the last few quarters. The sub-advisor continues to focus on buying high-quality businesses with solid returns on capital, strong balance sheets and sustainable barriers to entry. The sub-advisor sees each of the recent additions to the Fund fitting that description.
Management's Discussion of Fund Performance (Unaudited) (Continued)
Comparison of the Change in Value of a $10,000 Investment in the
Touchstone Focused Fund, the Russell Midcap® Growth Index
and the Russell 3000® Index
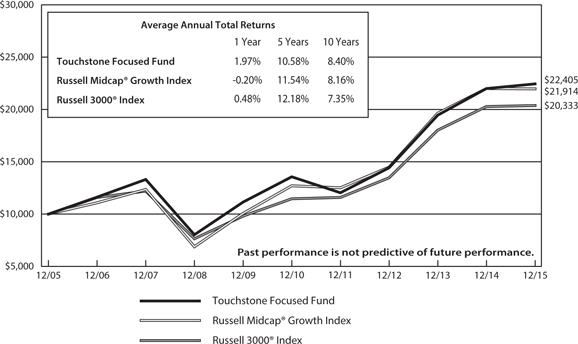
Performance information does not reflect fees that are paid by the separate accounts through which shares of the Fund are sold. Inclusion of those fees would reduce figures for all periods.
The inception date of the Fund was November 21, 1994.
Note to Chart
Russell Midcap® Growth Index measures the performance of those Russell Midcap® companies with higher price-to-book ratios and higher forecasted growth values.
Russell 3000® Index measures the performance of the 3,000 largest U.S. companies based on total market capitalization, which represents approximately 98% of the investable U.S. equity market.
The Frank Russell Company (FRC) is the source and owner of the Index data contained or reflected in this material and all trademarks and copyrights related thereto. The material may contain confidential information and unauthorized use, disclosure, copying, dissemination or redistribution is strictly prohibited. This is a Touchstone Investments presentation of the data, and FRC is not responsible for the formatting or configuration of this material or for any inaccuracy in the presentation thereof.
Management's Discussion of Fund Performance (Unaudited)
Touchstone Large Cap Core Equity Fund
Sub-Advised by London Company of Virginia, LLC d/b/a The London Company
Effective November 30, 2015, London Company of Virginia LLC (“The London Company”) was appointed as sub-advisor to the Touchstone Large Cap Core Equity Fund. Concurrent with this change, the Fund’s Principal Investment Strategies and Principal Risks have changed to reflect those of The London Company’s strategy.
Investment Philosophy
The Touchstone Large Cap Core Equity Fund seeks to provide investors with long-term capital growth by investing primarily in common stocks of large-cap U.S. listed companies. The sub-advisor, The London Company, uses a bottom-up security selection process that screens potential investments against a proprietary quantitative model for return on capital, earnings to value ratio, free cash flow and return on equity. Fund management seeks to purchase financially stable large-cap companies that it believes are consistently generating high returns of unleveraged operating capital, run by shareholder-oriented management and trading at a discount to the company’s respective private market values.
Fund Performance
The Touchstone Large Cap Core Equity Fund underperformed its benchmark, the Russell 1000® Index, for the 12-month period ended December 31, 2015. The Fund’s total return was -4.01 percent while the total return of the benchmark was 0.92 percent for the same period.
Market Environment
U.S. stocks bounced around all year, but ended up close to where they started. The year began with a weak first quarter gross domestic product (GDP) report driven by poor weather and the U.S. dollar. However, economic news improved during the year led by solid consumer spending and stability/improvement in housing. Employment also improved throughout the year with unemployment down to 5 percent by year end and growth in hourly average earnings. New car sales closed the year at over 17 million units, an all-time high. On the negative side, manufacturing activity was weak reflecting the significant drop in oil prices and other commodities. Late in the year, some retailers also reported surprisingly weak same store sales results. Stocks were at their lowest point during a brief drop in August, but rallied during the fourth quarter to close out the year roughly flat.
Among the factors impacting relative performance was size (large-cap stocks outperformed mid- and small-cap stocks), the narrow leadership in the market (the top-five stocks in the S&P 500® Index drove 95 percent of the benchmark’s return for the year) and the continuing strength of growth and high momentum stocks. Growth outperformed value across all market-cap ranges over the year. In the large-cap universe, the Russell 1000® Growth Index rose 5.7 percent while the Russell 1000® Value Index declined 3.8 percent.
Portfolio Review
The Fund’s underperformance relative to the benchmark was driven by negative stock selection during 2015, particularly within the Industrials and Information Technology sectors. Within the Industrials sector, positions in Ryder System Inc. and General Electric Co. were the leading detractors. Ryder System, a provider of logistics and transportation services was added to the Fund in the second quarter. However, Ryder’s stock declined on weaker-than-expected earnings due to lower transportation volumes experienced during the second half of the year. The sub-advisor sold the Ryder position during the fourth quarter. The Fund sold its position in General Electric during the first quarter yet the stock performed strongly during the second half of the year based on the company’s push to sell off divisions such as Appliances and GE Capital. The leading detractor within the Information Technology sector was Hewlett-Packard Inc. (HP). HP’s stock struggled during 2015 due to challenges
Management's Discussion of Fund Performance (Unaudited) (Continued)
the company faced in trying to re-position itself as more of an IT services company rather than relying on personal computer and printer sales.
Stock selection within the Energy sector positively contributed to performance in 2015. The Fund’s holdings in oil refiners Phillips 66 and Marathon Petroleum Corp. benefited from falling oil prices. For these refiners, crude oil is an input cost thus falling prices reduce costs and can potentially lift profit margins. Additionally, Cameron International Corp. positively contributed to the Fund’s performance during the year. During the third quarter Cameron announced it was being acquired by Schlumberger at a large premium, causing the stock price to jump.
Outlook
U.S. stocks finished higher for the year, but continued to show significant volatility. Large caps outpaced smaller issues and growth and momentum outperformed value and defensive holdings. The stylistic headwinds of growth, momentum and a persistent narrowing of return really began in 2014 and impacted us in the fourth quarter of 2014 as well as throughout most of 2015.
The landscape entering 2016 does not look much different than the one we just left behind. Recent economic data has been mixed, although the U.S. economy appears healthy outside of the beleaguered energy/commodity sectors. The U.S. Federal Reserve Board (Fed) recently raised interest rates and there may be further rate hikes in the future. While the sub-advisor believes the U.S. economy is in solid shape, slowing economic growth in China, falling commodity prices and concern over the direction of interest rates may limit significant upside in the near term while leading to greater volatility. In addition, broader market valuations are not what the sub-advisor would describe as cheap. However, the sub-advisor is finding high conviction investment ideas reflecting the positive backdrop of strong corporate balance sheets, below average dividend payout ratios and low interest rates.
The sub-advisor’s focus and the strength of its process have been and remain long term in nature, and its results will deviate from benchmarks over shorter time frames. While impactful, certainly the market-related headwinds were not the only factors working against the sub-advisor. The specific contributors and detractors varied by strategy, but in some cases the sub-advisor felt that the price reactions overcompensated for changes in the fundamental developments, something the sub-advisor views as transitory and not actionable within its longer-term investing horizon.
The sub-advisor’s strategy is to focus on stocks from a bottom-up standpoint, so Fund positioning is a result of that process. The sub-advisor seeks to own companies with strong returns on capital and flexibility to enhance shareholder value using the balance sheet. Low interest rates and relatively high equity risk premiums enable companies to increase shareholder value by adjusting the capital structure of the company. Separately, with elevated cash levels on corporate balance sheets and dividend payout ratios near historic lows, the sub-advisor expects investors to reward companies that wisely deploy capital including higher dividends, share repurchases and merger and acquisition transactions. The sub-advisor believes its more conservative Fund portfolio is well-positioned for a slow growth environment that rewards strong capital allocation.
Management's Discussion of Fund Performance (Unaudited) (Continued)
Comparison of the Change in Value of a $10,000 Investment in the
Touchstone Large Cap Core Equity Fund and the Russell 1000® Index
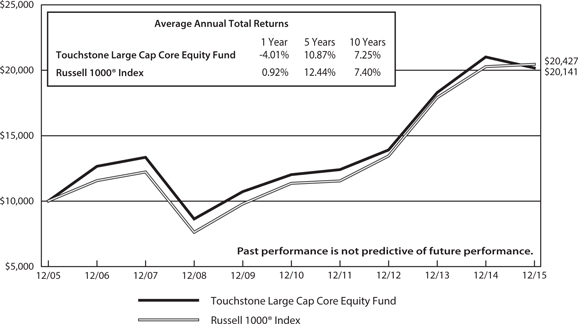
Performance information does not reflect fees that are paid by the separate accounts through which shares of the Fund are sold. Inclusion of those fees would reduce figures for all periods.
The inception date of the Fund was May 1, 1999.
Note to Chart
Russell 1000® Index measures the performance of the 1,000 largest companies in the Russell 3000® Index.
The Frank Russell Company (FRC) is the source and owner of the Index data contained or reflected in this material and all trademarks and copyrights related thereto. The material may contain confidential information and unauthorized use, disclosure, copying, dissemination or redistribution is strictly prohibited. This is a Touchstone Investments presentation of the data, and FRC is not responsible for the formatting or configuration of this material or for any inaccuracy in the presentation thereof.
Management's Discussion of Fund Performance (Unaudited)
Touchstone ETF Funds
Sub-Advised by Todd Asset Management LLC
Touchstone Aggressive ETF Fund
Touchstone Conservative ETF Fund
Touchstone Moderate ETF Fund
Investment Philosophy
Three funds which invest in Exchanged Traded Funds (ETFs) are available for investors seeking “lifestyle” products for their annuity holdings. The three strategic options include: the Conservative, Moderate, and Aggressive ETF Funds. These funds allocate their assets among up to ten ETFs. These ten ETF selections generally do not change dramatically over time. The more conservative fund has a higher bond weighting and the more aggressive fund has a lower bond weighting.
Fund Performance
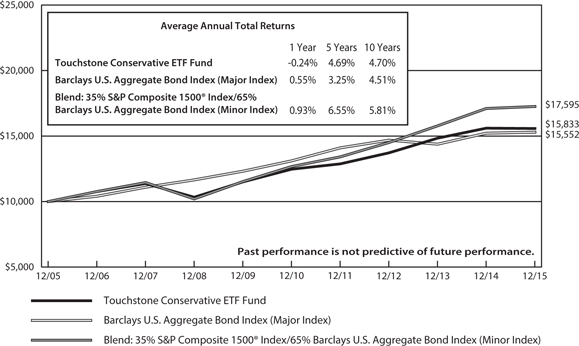
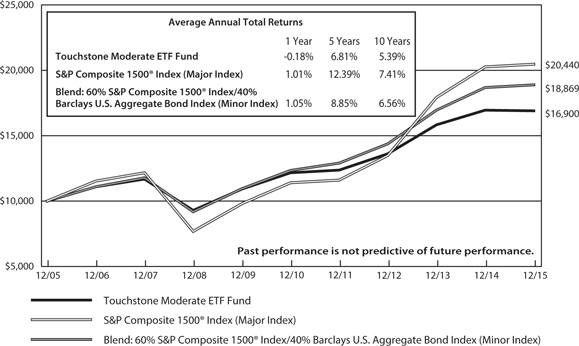
The Touchstone Conservative ETF Fund’s total return was -0.24 percent for the 12-month period ended December 31, 2015. The Fund underperformed its primary benchmark. The total return of its primary benchmark, the Barclays U.S. Aggregate Bond Index, was 0.55 percent. The Touchstone Moderate ETF Fund’s total return was -0.18 percent, and the Touchstone Aggressive ETF Fund’s total return was -0.10 percent. Both of these Funds underperformed their primary benchmark, the S&P Composite 1500® Index. The total return of their primary benchmark was 1.01 percent for the 12-month period ended December 31, 2015. The specific blended benchmark returns were 0.93 percent for the Conservative ETF Fund, 1.05 percent for the Moderate ETF Fund and 1.07 percent for the Aggressive ETF Fund.
Market Environment
The broad U.S. equity market posted positive, but minimal gains for the 12-month period ended December 31, 2015. Though overall returns were positive, a closer examination reveals mixed performance. For example, large caps generally outperformed the broad market, while mid- and small-caps lagged and posted losses for the year. In dollar terms, the non-U.S. developed markets trailed domestic equities as continued dollar appreciation eroded local currency returns. A similar effect further detracted from already negative returns in the emerging markets. U.S. fixed income markets managed slight gains during the year.
Portfolio Review
The Touchstone Conservative ETF Fund, Touchstone Moderate ETF Fund and Touchstone Aggressive ETF Fund underperfomed their benchmarks during 2015. The Funds’ investments are determined by an optimization process that considers the long-term historical risk and return profiles of various asset classes. For instance, non-U.S. equities have been included due to the diversification benefits they provide to the portfolio as a whole. During the current market environment when non-U.S. equities underperformed U.S. stocks, this positioning detracted from performance. Similarly, the Funds’ relative overweight to mid- and small-cap stocks within its equity allocation was detrimental to relative returns. Historically, smaller-capitalization stocks have produced higher returns than large caps, but the market volatility during the year resulted in short-term outperformance for large caps.
Outlook
Despite recent market turmoil, there are several encouraging trends that remain in place for capital markets. First, the labor market continues to improve with unemployment decreasing both in the U.S. and Europe.
Management's Discussion of Fund Performance (Unaudited) (Continued)
This may drive a rebound in consumer demand. For example, U.S. auto sales are near a record pace, while auto registrations are also showing signs of growth in Europe and China. Interest rates remain low globally, and inflation is scarce. While deflation could become a concern, extraordinary actions are being taken by most central banks to keep potential price declines in check. With indications of positive fundamentals for the economy, the sub-advisor believes that the markets could post further gains in 2016 and extend this bull market into an eighth year. This belief is however dependent at least in part on a number of factors including avoidance of geopolitical crises, stabilization in the Chinese economy, and an end to the decline in commodity and energy prices.
Management's Discussion of Fund Performance (Unaudited) (Continued)
Comparison of the Change in Value of a $10,000 Investment in the
Touchstone Aggressive ETF Fund, the S&P Composite 1500® Index (Major Index)
and the Blend: 80% S&P Composite 1500® Index/20% Barclays U.S. Aggregate Bond Index
(Minor Index)
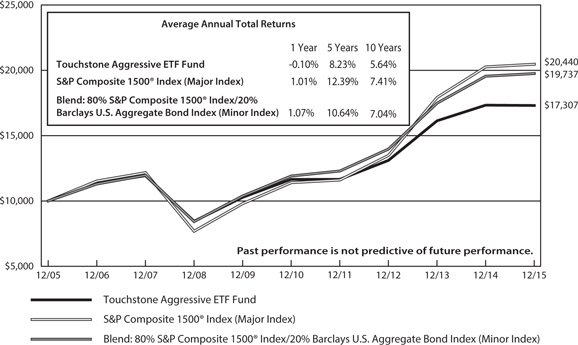
Performance information does not reflect fees that are paid by the separate accounts through which shares of the Fund are sold. Inclusion of those fees would reduce figures for all periods.
The inception date of the Fund was July 16, 2004.
Notes to Chart
S&P Composite 1500® Index is an unmanaged, broad market index representing the large-cap, mid-cap, and small-cap segments of the U.S. equity market.
The Barclays U.S. Aggregate Bond Index is an unmanaged index comprised of U.S. investment grade, fixed rate bond market securities, including government, government agency, corporate and mortgage-backed securities between one and ten years.
Management's Discussion of Fund Performance (Unaudited) (Continued)
Comparison of the Change in Value of a $10,000 Investment in the
Touchstone Conservative ETF Fund, the Barclays U.S. Aggregate Bond Index (Major Index)
and the Blend: 35% S&P Composite 1500® Index /65% Barclays U.S. Aggregate Bond Index
(Minor Index)
Performance information does not reflect fees that are paid by the separate accounts through which shares of the Fund are sold. Inclusion of those fees would reduce figures for all periods.
The inception date of the Fund was July 16, 2004.
Notes to Chart
The Barclays U.S. Aggregate Bond Index is an unmanaged index comprised of U.S. investment grade, fixed rate bond market securities, including government, government agency, corporate and mortgage-backed securities between one and ten years.
S&P Composite 1500® Index is an unmanaged, broad market index representing the large-cap, mid-cap, and small-cap segments of the U.S. equity market.
Management's Discussion of Fund Performance (Unaudited) (Continued)
Comparison of the Change in Value of a $10,000 Investment in the
Touchstone Moderate ETF Fund, the S&P Composite 1500® Index (Major Index)
and the Blend: 60% S&P Composite 1500® Index/40% Barclays U.S. Aggregate Bond Index
(Minor Index)
Performance information does not reflect fees that are paid by the separate accounts through which shares of the Fund are sold. Inclusion of those fees would reduce figures for all periods.
The inception date of the Fund was July 16, 2004.
Notes to Chart
S&P Composite 1500® Index is an unmanaged, broad market index representing the large-cap, mid-cap, and small-cap segments of the U.S. equity market.
The Barclays U.S. Aggregate Bond Index is an unmanaged index comprised of U.S. investment grade, fixed rate bond market securities, including government, government agency, corporate and mortgage-backed securities between one and ten years.
Tabular Presentation of Portfolios of Investments (Unaudited)
December 31, 2015
The illustrations below provide each Fund’s credit quality or sector allocation. We hope it will be useful to shareholders as it summarizes key information about each Fund’s investments.
| Touchstone Active Bond Fund |
| Credit Quality* | | (% of Investment Securities) | |
| AAA/Aaa | | | 43.9 | % |
| AA/Aa | | | 1.9 | |
| A | | | 8.0 | |
| BBB/Baa | | | 27.1 | |
| BB/Ba | | | 9.7 | |
| B | | | 3.6 | |
| CCC | | | 0.9 | |
| Not Rated | | | 0.9 | |
| Other Assets/Liabilities (Net) | | | 4.0 | |
| Total | | | 100.0 | % |
| Touchstone Focused Fund |
| Sector Allocation** | | (% of Net Assets) | |
| Information Technology | | | 21.0 | % |
| Health Care | | | 16.9 | |
| Financials | | | 15.3 | |
| Consumer Discretionary | | | 12.2 | |
| Consumer Staples | | | 11.3 | |
| Industrials | | | 10.2 | |
| Energy | | | 6.5 | |
| Materials | | | 4.0 | |
| Investment Funds | | | 5.1 | |
| Other Assets/Liabilities (Net) | | | (2.5 | ) |
| Total | | | 100.0 | % |
| Touchstone Large Cap Core Equity Fund |
| Sector Allocation** | | (% of Net Assets) | |
| Consumer Discretionary | | | 21.1 | % |
| Financials | | | 18.9 | |
| Information Technology | | | 14.2 | |
| Industrials | | | 12.2 | |
| Health Care | | | 11.2 | |
| Consumer Staples | | | 10.2 | |
| Materials | | | 5.1 | |
| Energy | | | 3.9 | |
| Telecommunication Services | | | 1.9 | |
| Investment Fund | | | 1.5 | |
| Other Assets/Liabilities (Net) | | | (0.2 | ) |
| Total | | | 100.0 | % |
| Touchstone Aggressive ETF Fund |
| Sector Allocation | | (% of Net Assets) | |
| Exchange Traded Funds | | | 98.8 | % |
| Investment Funds | | | 12.3 | |
| Other Assets/Liabilities (Net) | | | (11.1 | ) |
| Total | | | 100.0 | % |
| Touchstone Conservative ETF Fund |
| Sector Allocation | | (% of Net Assets) | |
| Exchange Traded Funds | | | 98.8 | % |
| Investment Funds | | | 4.2 | |
| Other Assets/Liabilities (Net) | | | (3.0 | ) |
| Total | | | 100.0 | % |
| Touchstone Moderate ETF Fund |
| Sector Allocation | | (% of Net Assets) | |
| Exchange Traded Funds | | | 98.8 | % |
| Investment Funds | | | 11.3 | |
| Other Assets/Liabilities (Net) | | | (10.1 | ) |
| Total | | | 100.0 | % |
| * | | Credit quality ratings are from Standard & Poor's (“S&P”) and Moody's Investors Service (“Moody's”). If agency ratings differ, the higher rating will be used. Where no rating has been assigned, it may be for reasons unrelated to the creditworthiness of the issuer. |
| ** | | Sector Classifications are based upon the Global Industry Classification Standard (GICS®). |
Portfolio of Investments
Touchstone Active Bond Fund – December 31, 2015
| Principal | | | | | Market | |
| Amount | | | | | Value | |
| | | | | | | |
| | | | | Corporate Bonds — 55.3% | | | | |
| | | | | | | | | |
| | | | | Financials — 15.4% | | | | |
| $ | 164,000 | | | ACE INA Holdings, Inc., 4.350%, 11/3/45 | | $ | 166,646 | |
| | 22,000 | | | Aircastle Ltd. (Bermuda), 5.500%, 2/15/22 | | | 22,550 | |
| | 134,000 | | | Ally Financial, Inc., 8.000%, 11/1/31 | | | 157,450 | |
| | 300,000 | | | Bank of America Corp., 6.100%, 12/29/49(A)(B) | | | 304,125 | |
| | 245,000 | | | Bank of America Corp. MTN, 4.000%, 1/22/25 | | | 239,837 | |
| | 300,000 | | | Bank of New York Mellon Corp. (The), 4.950%, 12/29/49(A)(B) | | | 294,000 | |
| | 170,000 | | | Bank of Nova Scotia (The) (Canada), 4.500%, 12/16/25 | | | 169,213 | |
| | 155,000 | | | Boston Properties LP, REIT, 3.850%, 2/1/23 | | | 158,173 | |
| | 265,000 | | | Capital One NA/Mclean VA, 1.650%, 2/5/18 | | | 262,378 | |
| | 205,000 | | | CIT Group, Inc., 5.000%, 8/15/22 | | | 210,510 | |
| | 125,000 | | | Citigroup, Inc., 3.300%, 4/27/25 | | | 122,762 | |
| | 300,000 | | | Citigroup, Inc., 5.350%, 4/29/49(A)(B)† | | | 284,250 | |
| | 86,000 | | | Citigroup, Inc., 6.125%, 12/29/49(A) | | | 87,720 | |
| | 17,000 | | | Credit Acceptance Corp., 6.125%, 2/15/21 | | | 16,660 | |
| | 27,000 | | | Credit Acceptance Corp., 144a, 7.375%, 3/15/23 | | | 26,865 | |
| | 250,000 | | | Credit Suisse Group Funding Guernsey Ltd. (Guernsey), 144a, 2.750%, 3/26/20 | | | 247,630 | |
| | 57,000 | | | Crown Castle International Corp., REIT, 5.250%, 1/15/23 | | | 59,921 | |
| | 58,000 | | | CTR Partnership LP / CareTrust Capital Corp. REIT, 5.875%, 6/1/21 | | | 58,508 | |
| | 32,000 | | | Equinix, Inc. REIT, 4.875%, 4/1/20 | | | 33,264 | |
| | 25,000 | | | Equinix, Inc. REIT, 5.375%, 4/1/23 | | | 25,500 | |
| | 175,000 | | | Fifth Third Bancorp, 2.875%, 7/27/20 | | | 174,806 | |
| | 79,000 | | | First Cash Financial Services, Inc., 6.750%, 4/1/21 | | | 77,420 | |
| | 135,000 | | | Ford Motor Credit Co. LLC, 2.375%, 1/16/18 | | | 134,678 | |
| | 155,000 | | | General Electric Capital Corp. MTN, 4.650%, 10/17/21 | | | 171,611 | |
| | 223,000 | | | General Motors Financial Co., Inc., 3.200%, 7/13/20 | | | 219,566 | |
| | 7,000 | | | General Motors Financial Co., Inc., 4.250%, 5/15/23 | | | 6,924 | |
| | 115,000 | | | Goldman Sachs Group, Inc. (The), 5.250%, 7/27/21 | | | 127,146 | |
| | 86,000 | | | Goldman Sachs Group, Inc. (The), 5.375%, 12/31/49(A)(B) | | | 85,462 | |
| | 300,000 | | | Goldman Sachs Group, Inc. (The), 5.700%, 12/29/49(A)(B) | | | 298,125 | |
| | 250,000 | | | Huntington National Bank (The), 2.200%, 11/6/18 | | | 249,309 | |
| | 220,000 | | | Intercontinental Exchange, Inc., 2.750%, 12/1/20 | | | 219,945 | |
| | 57,000 | | | International Lease Finance Corp., 5.875%, 8/15/22 | | | 60,705 | |
| | 40,000 | | | Iron Mountain, Inc. REIT, 144a, 6.000%, 10/1/20 | | | 42,200 | |
| | 145,000 | | | JPMorgan Chase & Co., 3.250%, 9/23/22 | | | 145,837 | |
| | 300,000 | | | JPMorgan Chase & Co., 5.150%, 12/29/49(A)(B) | | | 283,500 | |
| | 48,000 | | | JPMorgan Chase & Co., 5.300%, 12/29/49(A)(B) | | | 47,820 | |
| | 60,000 | | | MetLife, Inc., 5.250%, 12/29/49(A)(B) | | | 61,050 | |
| | 80,000 | | | Morgan Stanley, 3.950%, 4/23/27 | | | 77,646 | |
| | 300,000 | | | Morgan Stanley, 5.450%, 7/29/49(A) | | | 292,875 | |
| | 49,000 | | | MPT Operating Partnership LP / MPT Finance Corp. REIT, 6.375%, 2/15/22 | | | 49,980 | |
| | 74,000 | | | Navient Corp., 5.000%, 10/26/20 | | | 64,935 | |
| | 39,000 | | | Navient Corp., 5.875%, 10/25/24 | | | 31,200 | |
| | 224,000 | | | Navient Corp. MTN, 6.125%, 3/25/24 | | | 182,560 | |
| | 160,000 | | | Omega Healthcare Investors, Inc. REIT, 4.950%, 4/1/24 | | | 161,588 | |
| | 268,000 | | | PHH Corp., 6.375%, 8/15/21 | | | 243,880 | |
| | 160,000 | | | PNC Bank NA, 2.700%, 11/1/22 | | | 155,622 | |
| | 165,000 | | | Prudential Financial, Inc., 5.625%, 6/15/43(A) | | | 168,712 | |
| | 43,000 | | | Quicken Loans, Inc., 144a, 5.750%, 5/1/25 | | | 40,958 | |
| | 130,000 | | | Teachers Insurance & Annuity Association of America, 144a, 6.850%, 12/16/39 | | | 160,729 | |
| | 71,000 | | | Vereit Operating Partnership LP REIT, 4.600%, 2/6/24 | | | 67,272 | |
| | 175,000 | | | Vornado Realty LP REIT, 5.000%, 1/15/22 | | | 185,690 | |
| | 275,000 | | | Wells Fargo & Co., 5.900%, 12/12/49(A)(B) | | | 277,406 | |
| | 285,000 | | | Wells Fargo & Co. MTN, 3.000%, 2/19/25 | | | 277,208 | |
| | 180,000 | | | Welltower Inc. REIT, 6.125%, 4/15/20 | | | 201,612 | |
| | | | | | | | 7,993,939 | |
| | | | | | | | | |
| | | | | Consumer Discretionary — 11.2% | | | | |
| | 42,000 | | | 1011778 BC ULC / New Red Finance, Inc. (Canada), 144a, 4.625%, 1/15/22 | | | 42,105 | |
| | 64,000 | | | Albea Beauty Holdings SA (Luxembourg), 144a, 8.375%, 11/1/19 | | | 66,560 | |
| | 20,000 | | | AMC Networks, Inc., 7.750%, 7/15/21 | | | 21,000 | |
| | 33,000 | | | American Axle & Manufacturing, Inc., 6.250%, 3/15/21 | | | 34,155 | |
| | 9,000 | | | American Builders & Contractors Supply Co., Inc., 144a, 5.750%, 12/15/23 | | | 9,068 | |
| | 230,000 | | | AutoNation, Inc., 5.500%, 2/1/20 | | | 249,060 | |
| | 36,000 | | | Belo Corp., 7.250%, 9/15/27 | | | 36,540 | |
| | 21,000 | | | Cable One, Inc., 144a, 5.750%, 6/15/22 | | | 20,895 | |
| | 104,000 | | | Cablevision Systems Corp., 5.875%, 9/15/22 | | | 88,400 | |
Touchstone Active Bond Fund (Continued)
| Principal | | | | | Market | |
| Amount | | | | | Value | |
| | | | | | | |
| | | | | Corporate Bonds — 55.3% (Continued) | | | | |
| | | | | | | | | |
| | | | | Consumer Discretionary — (Continued) | | | | |
| | | | | | | | | |
| $ | 28,000 | | | CalAtlantic Group Inc., 5.375%, 10/1/22 | | $ | 28,140 | |
| | 17,000 | | | CalAtlantic Group Inc., 8.375%, 1/15/21 | | | 19,720 | |
| | 215,000 | | | CBS Corp., 4.900%, 8/15/44 | | | 195,633 | |
| | 399,000 | | | CCO Holdings LLC / CCO Holdings Capital Corp., 6.625%, 1/31/22 | | | 420,446 | |
| | 124,000 | | | CCO Safari II LLC, 144a, 6.484%, 10/23/45 | | | 124,203 | |
| | 43,000 | | | CCOH Safari LLC, 144a, 5.750%, 2/15/26 | | | 43,108 | |
| | 286,000 | | | Cequel Communications Holdings I LLC / Cequel Capital Corp., 144a, 6.375%, 9/15/20 | | | 279,565 | |
| | 24,000 | | | Churchill Downs, Inc., 144a, 5.375%, 12/15/21 | | | 24,060 | |
| | 52,000 | | | Cogeco Cable, Inc. (Canada), 144a, 4.875%, 5/1/20 | | | 51,870 | |
| | 44,000 | | | CSC Holdings LLC, 8.625%, 2/15/19 | | | 46,860 | |
| | 210,000 | | | Delphi Automotive PLC (Jersey), 3.150%, 11/19/20 | | | 209,728 | |
| | 225,000 | | | Discovery Communications LLC, 3.450%, 3/15/25 | | | 203,688 | |
| | 14,000 | | | DISH DBS Corp., 5.875%, 7/15/22 | | | 13,055 | |
| | 283,000 | | | DISH DBS Corp., 6.750%, 6/1/21 | | | 285,122 | |
| | 35,000 | | | DISH DBS Corp., 7.875%, 9/1/19 | | | 38,062 | |
| | 182,000 | | | Dollar General Corp., 3.250%, 4/15/23 | | | 173,324 | |
| | 22,000 | | | DR Horton, Inc., 3.750%, 3/1/19 | | | 22,000 | |
| | 32,000 | | | DR Horton, Inc., 4.375%, 9/15/22 | | | 31,800 | |
| | 5,000 | | | DR Horton, Inc., 4.750%, 2/15/23 | | | 5,092 | |
| | 205,000 | | | Forest Laboratories, Inc., 144a, 5.000%, 12/15/21 | | | 222,754 | |
| | 51,000 | | | Goodyear Tire & Rubber Co. (The), 8.750%, 8/15/20 | | | 60,562 | |
| | 150,000 | | | Home Depot, Inc., 5.950%, 4/1/41 | | | 186,662 | |
| | 34,000 | | | International Game Technology PLC (United Kingdom), 144a, 5.625%, 2/15/20 | | | 33,490 | |
| | 18,000 | | | International Game Technology PLC (United Kingdom), 144a, 6.250%, 2/15/22 | | | 16,830 | |
| | 24,000 | | | L Brands, Inc., 5.625%, 2/15/22 | | | 25,500 | |
| | 23,000 | | | Lamar Media Corp., 5.875%, 2/1/22 | | | 24,150 | |
| | 16,000 | | | Lennar Corp., 4.750%, 11/15/22 | | | 15,864 | |
| | 64,000 | | | Lennar Corp., 4.750%, 5/30/25 | | | 62,560 | |
| | 17,000 | | | Lennar Corp., 4.875%, 12/15/23 | | | 16,915 | |
| | 19,000 | | | LKQ Corp., 4.750%, 5/15/23 | | | 17,812 | |
| | 40,000 | | | M/I Homes, Inc., 144a, 6.750%, 1/15/21 | | | 39,400 | |
| | 140,000 | | | McDonald's Corp., 2.750%, 12/9/20 | | | 139,904 | |
| | 24,000 | | | Men's Wearhouse, Inc. (The), 7.000%, 7/1/22 | | | 17,040 | |
| | 33,000 | | | Meritage Homes Corp., 7.150%, 4/15/20 | | | 34,732 | |
| | 121,000 | | | MGM Resorts International, 5.250%, 3/31/20 | | | 119,790 | |
| | 290,000 | | | Mondelez International, Inc., 4.125%, 2/9/16 | | | 290,748 | |
| | 52,000 | | | NCL Corp. Ltd. (Bermuda), 144a, 4.625%, 11/15/20 | | | 50,919 | |
| | 19,000 | | | NCL Corp. Ltd. (Bermuda), 144a, 5.250%, 11/15/19 | | | 19,416 | |
| | 20,000 | | | Netflix, Inc., 5.750%, 3/1/24 | | | 20,550 | |
| | 18,000 | | | Netflix, Inc., 144a, 5.500%, 2/15/22 | | | 18,450 | |
| | 74,000 | | | Netflix, Inc., 144a, 5.875%, 2/15/25 | | | 75,850 | |
| | 44,000 | | | Nexstar Broadcasting, Inc., 144a, 6.125%, 2/15/22 | | | 43,120 | |
| | 1,000 | | | Nielsen Finance LLC / Nielsen Finance Co., 4.500%, 10/1/20 | | | 1,015 | |
| | 30,000 | | | Penske Automotive Group, Inc., 5.375%, 12/1/24 | | | 30,300 | |
| | 43,000 | | | Quad/Graphics, Inc., 7.000%, 5/1/22 | | | 26,982 | |
| | 57,000 | | | Quebecor Media, Inc. (Canada), 5.750%, 1/15/23 | | | 57,428 | |
| | 41,000 | | | Reynolds Group Issuer, Inc. / Reynolds Group Issuer LLC / Reynolds Group Issuer Lu, 6.875%, 2/15/21 | | | 42,230 | |
| | 57,000 | | | Royal Caribbean Cruises Ltd. (Liberia), 5.250%, 11/15/22 | | | 58,425 | |
| | 20,000 | | | Sabre GLBL, Inc., 144a, 5.250%, 11/15/23 | | | 19,775 | |
| | 55,000 | | | Sabre GLBL, Inc., 144a, 5.375%, 4/15/23 | | | 54,725 | |
| | 240,000 | | | Scripps Networks Interactive, Inc., 2.750%, 11/15/19 | | | 236,069 | |
| | 85,000 | | | Service Corp. International/US, 8.000%, 11/15/21 | | | 99,875 | |
| | 12,000 | | | Shea Homes LP / Shea Homes Funding Corp., 144a, 6.125%, 4/1/25 | | | 12,330 | |
| | 90,000 | | | Sinclair Television Group, Inc., 5.375%, 4/1/21 | | | 90,225 | |
| | 205,000 | | | Sirius XM Radio, Inc., 144a, 5.250%, 8/15/22 | | | 216,275 | |
| | 108,000 | | | Sirius XM Radio, Inc., 144a, 5.375%, 4/15/25 | | | 108,675 | |
| | 21,000 | | | Sirius XM Radio, Inc., 144a, 5.750%, 8/1/21 | | | 21,630 | |
| | 11,000 | | | Sirius XM Radio, Inc., 144a, 6.000%, 7/15/24 | | | 11,495 | |
| | 34,000 | | | Sonic Automotive, Inc., 7.000%, 7/15/22 | | | 35,955 | |
| | 55,000 | | | Taylor Morrison Communities, Inc. / Monarch Communities Inc., 144a, 5.250%, 4/15/21 | | | 55,000 | |
| | 32,000 | | | TEGNA Inc., 144a, 4.875%, 9/15/21 | | | 32,080 | |
| | 40,000 | | | Time Warner Cable, Inc., 4.500%, 9/15/42 | | | 31,391 | |
| | 30,000 | | | Toll Brothers Finance Corp., 4.875%, 11/15/25 | | | 29,475 | |
| | 34,000 | | | Toll Brothers Finance Corp., 5.875%, 2/15/22 | | | 35,700 | |
Touchstone Active Bond Fund (Continued)
| Principal | | | | | Market | |
| Amount | | | | | Value | |
| | | | | | | |
| | | | | Corporate Bonds — 55.3% (Continued) | | | | |
| | | | | | | | | |
| | | | | Consumer Discretionary — (Continued) | | | | |
| $ | 23,400 | | | Virgin Media Secured Finance PLC (United Kingdom), 144a, 5.375%, 4/15/21 | | $ | 24,160 | |
| | 23,000 | | | Vista Outdoor, Inc., 144a, 5.875%, 10/1/23 | | | 23,575 | |
| | 88,000 | | | ZF North America Capital, Inc., 144a, 4.500%, 4/29/22 | | | 86,020 | |
| | 44,000 | | | ZF North America Capital, Inc., 144a, 4.750%, 4/29/25 | | | 41,910 | |
| | | | | | | | 5,818,997 | |
| | | | | | | | | |
| | | | | Industrials — 5.6% | | | | |
| | 61,000 | | | ADT Corp. (The), 3.500%, 7/15/22 | | | 54,595 | |
| | 13,000 | | | ADT Corp. (The), 6.250%, 10/15/21† | | | 13,579 | |
| | 56,000 | | | AECOM Global II LLC / URS Fox US LP, 3.850%, 4/1/17 | | | 56,000 | |
| | 98,000 | | | AECOM Global II LLC / URS Fox US LP, 5.000%, 4/1/22 | | | 91,998 | |
| | 200,000 | | | Air Lease Corp., 5.625%, 4/1/17 | | | 207,500 | |
| | 4,000 | | | Allegion PLC (Ireland), 5.875%, 9/15/23 | | | 4,080 | |
| | 36,000 | | | Allegion US Holding Co., Inc., 5.750%, 10/1/21 | | | 36,450 | |
| | 46,280 | | | American Airlines 2013-2 Class B Pass Through Trust, 144a, 5.600%, 7/15/20 | | | 47,206 | |
| | 62,000 | | | Amsted Industries, Inc., 144a, 5.000%, 3/15/22 | | | 62,000 | |
| | 17,000 | | | Amsted Industries, Inc., 144a, 5.375%, 9/15/24 | | | 16,660 | |
| | 33,000 | | | Anixter, Inc., 5.125%, 10/1/21 | | | 33,000 | |
| | 34,000 | | | Anixter, Inc., 144a, 5.500%, 3/1/23 | | | 34,170 | |
| | 88,000 | | | Aviation Capital Group Corp., 144a, 2.875%, 9/17/18 | | | 87,495 | |
| | 35,000 | | | Bombardier, Inc. (Canada), 144a, 6.000%, 10/15/22 | | | 24,535 | |
| | 4,000 | | | Bombardier, Inc. (Canada), 144a, 6.125%, 1/15/23 | | | 2,760 | |
| | 27,000 | | | Bombardier, Inc. (Canada), 144a, 7.500%, 3/15/25 | | | 18,900 | |
| | 4,000 | | | Building Materials Corp. of America, 144a, 5.375%, 11/15/24 | | | 3,990 | |
| | 265,000 | | | Burlington Northern Santa Fe LLC, 5.750%, 5/1/40 | | | 296,646 | |
| | 24,000 | | | Case New Holland, Inc., 7.875%, 12/1/17 | | | 25,380 | |
| | 69,000 | | | Cenveo Corp., 144a, 6.000%, 8/1/19 | | | 48,645 | |
| | 70,000 | | | CNH Industrial Capital LLC, 4.375%, 11/6/20 | | | 65,975 | |
| | 30,000 | | | DigitalGlobe, Inc., 144a, 5.250%, 2/1/21 | | | 25,200 | |
| | 175,000 | | | FedEx Corp., 5.100%, 1/15/44 | | | 181,321 | |
| | 119,000 | | | Hornbeck Offshore Services, Inc., 5.000%, 3/1/21 | | | 80,920 | |
| | 7,000 | | | Huntington Ingalls Industries, Inc., 144a, 5.000%, 11/15/25 | | | 7,105 | |
| | 95,000 | | | JB Poindexter & Co., Inc., 144a, 9.000%, 4/1/22 | | | 99,275 | |
| | 96,000 | | | KLX, Inc., 144a, 5.875%, 12/1/22 | | | 91,200 | |
| | 44,000 | | | Martin Midstream Partners LP / Martin Midstream Finance Corp., 7.250%, 2/15/21 | | | 38,720 | |
| | 175,000 | | | Navios Maritime Holdings, Inc. / Navios Maritime Finance II US Inc. (Marshall Islands), 144a, 7.375%, 1/15/22 | | | 87,500 | |
| | 83,000 | | | Nielsen Co. Luxembourg SARL (The) (Luxembourg), 144a, 5.500%, 10/1/21 | | | 85,075 | |
| | 60,000 | | | Orbital ATK, Inc., 5.250%, 10/1/21 | | | 60,300 | |
| | 14,000 | | | Orbital ATK, Inc., 144a, 5.500%, 10/1/23 | | | 14,210 | |
| | 200,000 | | | Republic Services, Inc., 3.550%, 6/1/22 | | | 204,238 | |
| | 206,000 | | | Roper Technologies, Inc., 3.000%, 12/15/20 | | | 205,145 | |
| | 139,000 | | | SBA Tower Trust, 144a, 2.898%, 10/15/19 | | | 135,832 | |
| | 36,000 | | | Stena AB (Sweden), 144a, 7.000%, 2/1/24 | | | 30,600 | |
| | 16,000 | | | United Airlines 2014-2 Class B Pass Through Trust, 4.625%, 9/3/22 | | | 16,040 | |
| | 44,000 | | | United Rentals North America, Inc., 4.625%, 7/15/23 | | | 43,890 | |
| | 216,000 | | | United Rentals North America, Inc., 7.625%, 4/15/22 | | | 230,839 | |
| | 28,071 | | | US Airways 2013-1 Class B Pass Through Trust, 5.375%, 11/15/21 | | | 28,071 | |
| | 45,000 | | | West Corp., 144a, 5.375%, 7/15/22 | | | 38,812 | |
| | | | | | | | 2,935,857 | |
| | | | | | | | | |
| | | | | Energy — 5.3% | | | | |
| | 375,000 | | | Boardwalk Pipelines LP, 3.375%, 2/1/23 | | | 301,524 | |
| | 92,000 | | | Buckeye Partners LP, 4.150%, 7/1/23 | | | 78,825 | |
| | 132,000 | | | California Resources Corp., 5.500%, 9/15/21 | | | 41,580 | |
| | 150,000 | | | Cenovus Energy, Inc. (Canada), 6.750%, 11/15/39 | | | 142,633 | |
| | 65,000 | | | Chesapeake Energy Corp., 144a, 8.000%, 12/15/22 | | | 31,850 | |
| | 50,000 | | | Clayton Williams Energy, Inc., 7.750%, 4/1/19 | | | 38,562 | |
| | 7,000 | | | Cloud Peak Energy Resources LLC / Cloud Peak Energy Finance Corp., 6.375%, 3/15/24 | | | 2,065 | |
| | 32,000 | | | Cloud Peak Energy Resources LLC / Cloud Peak Energy Finance Corp., 8.500%, 12/15/19 | | | 16,000 | |
| | 19,000 | | | CONSOL Energy, Inc., 5.875%, 4/15/22 | | | 11,780 | |
| | 37,000 | | | DCP Midstream LLC, 144a, 5.350%, 3/15/20 | | | 31,821 | |
| | 134,000 | | | Drill Rigs Holdings, Inc. (Marshall Islands), 144a, 6.500%, 10/1/17 | | | 78,725 | |
Touchstone Active Bond Fund (Continued)
| Principal | | | | | Market | |
| Amount | | | | | Value | |
| | | | | | | |
| | | | Corporate Bonds — 55.3% (Continued) | | | |
| | | | | | | |
| | | | | Energy — (Continued) | | | | |
| $ | 156,000 | | | Freeport-McMoRan, Inc., 6.875%, 2/15/23 | | $ | 98,280 | |
| | 316,000 | | | FTS International, Inc., 6.250%, 5/1/22 | | | 88,480 | |
| | 22,000 | | | FTS International, Inc., 144a, 7.837%, 6/15/20(A) | | | 14,965 | |
| | 71,000 | | | Genesis Energy LP / Genesis Energy Finance Corp., 5.750%, 2/15/21 | | | 59,995 | |
| | 18,000 | | | Genesis Energy LP / Genesis Energy Finance Corp., 6.000%, 5/15/23 | | | 14,400 | |
| | 65,000 | | | Genesis Energy LP / Genesis Energy Finance Corp., 6.750%, 8/1/22 | | | 55,250 | |
| | 49,000 | | | Gibson Energy, Inc. (Canada), 144a, 6.750%, 7/15/21 | | | 46,918 | |
| | 236,000 | | | Halliburton Co., 3.375%, 11/15/22 | | | 232,256 | |
| | 122,000 | | | Hess Corp., 5.600%, 2/15/41 | | | 102,836 | |
| | 260,000 | | | Kinder Morgan Energy Partners LP, 3.500%, 9/1/23 | | | 215,570 | |
| | 205,000 | | | Marathon Oil Corp., 2.800%, 11/1/22 | | | 163,408 | |
| | 170,000 | | | Midcontinent Express Pipeline LLC, 144a, 6.700%, 9/15/19 | | | 158,950 | |
| | 20,000 | | | MPLX LP, 144a, 4.875%, 12/1/24 | | | 17,950 | |
| | 13,000 | | | MPLX LP, 144a, 4.875%, 6/1/25 | | | 11,635 | |
| | 25,000 | | | NuStar Logistics LP, 4.800%, 9/1/20 | | | 22,500 | |
| | 16,000 | | | NuStar Logistics LP, 6.750%, 2/1/21 | | | 15,040 | |
| | 40,000 | | | Oasis Petroleum, Inc., 6.875%, 3/15/22 | | | 25,600 | |
| | 135,000 | | | Petroleos Mexicanos (Mexico), 144a, 4.500%, 1/23/26 | | | 118,598 | |
| | 33,000 | | | QEP Resources, Inc., 6.800%, 3/1/20 | | | 29,700 | |
| | 17,000 | | | Rose Rock Midstream LP / Rose Rock Finance Corp., 5.625%, 7/15/22 | | | 12,070 | |
| | 57,000 | | | Rose Rock Midstream LP / Rose Rock Finance Corp., 144a, 5.625%, 11/15/23 | | | 40,470 | |
| | 21,000 | | | Sabine Pass Liquefaction LLC, 5.625%, 2/1/21 | | | 19,320 | |
| | 41,000 | | | Sabine Pass Liquefaction LLC, 144a, 5.625%, 3/1/25 | | | 34,696 | |
| | 21,000 | | | Sanchez Energy Corp., 6.125%, 1/15/23 | | | 11,340 | |
| | 42,000 | | | SemGroup Corp., 7.500%, 6/15/21 | | | 37,590 | |
| | 33,000 | | | Seventy Seven Energy, Inc., 6.500%, 7/15/22 | | | 5,198 | |
| | 17,000 | | | Summit Midstream Holdings LLC / Summit Midstream Finance Corp., 7.500%, 7/1/21 | | | 14,450 | |
| | 90,000 | | | Sunoco Logistics Partners Operations LP, 5.950%, 12/1/25 | | | 85,740 | |
| | 21,000 | | | Tesoro Logistics LP / Tesoro Logistics Finance Corp., 5.875%, 10/1/20 | | | 20,055 | |
| | 249,000 | | | Tullow Oil PLC (United Kingdom), 144a, 6.000%, 11/1/20 | | | 173,055 | |
| | 79,000 | | | Unit Corp., 6.625%, 5/15/21 | | | 56,880 | |
| | | | | | | | 2,778,560 | |
| | | | | | | | | |
| | | | | Telecommunication Services — 4.4% | | | | |
| | 96,000 | | | Altice Financing SA (Luxembourg), 144a, 6.625%, 2/15/23 | | | 94,800 | |
| | 105,000 | | | AT&T, Inc., 3.900%, 3/11/24 | | | 107,214 | |
| | 40,000 | | | AT&T, Inc., 4.350%, 6/15/45 | | | 34,219 | |
| | 125,000 | | | AT&T, Inc., 4.500%, 5/15/35 | | | 115,608 | |
| | 66,000 | | | CenturyLink, Inc., 5.625%, 4/1/20 | | | 65,258 | |
| | 50,000 | | | CenturyLink, Inc., 5.800%, 3/15/22 | | | 45,825 | |
| | 43,000 | | | CenturyLink, Inc., 6.450%, 6/15/21 | | | 41,925 | |
| | 31,000 | | | Cincinnati Bell, Inc., 8.375%, 10/15/20 | | | 31,698 | |
| | 29,000 | | | CommScope, Inc., 144a, 4.375%, 6/15/20 | | | 29,218 | |
| | 52,000 | | | CommScope, Inc., 144a, 5.000%, 6/15/21 | | | 49,855 | |
| | 113,000 | | | Frontier Communications Corp., 6.875%, 1/15/25 | | | 93,084 | |
| | 56,000 | | | Frontier Communications Corp., 8.500%, 4/15/20 | | | 56,140 | |
| | 119,000 | | | Frontier Communications Corp., 144a, 10.500%, 9/15/22 | | | 118,554 | |
| | 36,000 | | | Intelsat Jackson Holdings SA (Luxembourg), 5.500%, 8/1/23 | | | 28,260 | |
| | 19,000 | | | Intelsat Jackson Holdings SA (Luxembourg), 7.250%, 4/1/19 | | | 17,432 | |
| | 200,000 | | | Intelsat Jackson Holdings SA (Luxembourg), 7.250%, 10/15/20 | | | 175,000 | |
| | 28,000 | | | Neptune Finco Corp., 144a, 10.125%, 1/15/23 | | | 29,190 | |
| | 170,000 | | | Qwest Corp., 6.750%, 12/1/21 | | | 178,075 | |
| | 84,000 | | | Sprint Communications Inc., 6.000%, 11/15/22 | | | 59,220 | |
| | 10,000 | | | Telecom Italia Capital SA (Luxembourg), 7.175%, 6/18/19 | | | 11,025 | |
| | 27,000 | | | T-Mobile USA, Inc., 6.000%, 3/1/23 | | | 27,338 | |
| | 21,000 | | | T-Mobile USA, Inc., 6.125%, 1/15/22 | | | 21,578 | |
| | 15,000 | | | T-Mobile USA, Inc., 6.250%, 4/1/21 | | | 15,450 | |
| | 233,000 | | | T-Mobile USA, Inc., 6.731%, 4/28/22 | | | 242,902 | |
| | 83,000 | | | Univision Communications, Inc., 144a, 6.750%, 9/15/22 | | | 86,009 | |
| | 16,000 | | | UPCB Finance IV Ltd. (Cayman Islands), 144a, 5.375%, 1/15/25 | | | 15,080 | |
| | 53,100 | | | UPCB Finance V Ltd. (Cayman Islands), 144a, 7.250%, 11/15/21 | | | 56,419 | |
| | 45,900 | | | UPCB Finance VI Ltd. (Cayman Islands), 144a, 6.875%, 1/15/22 | | | 48,539 | |
| | 275,000 | | | Verizon Communications, Inc., 6.250%, 4/1/37 | | | 308,702 | |
| | 64,000 | | | ViaSat, Inc., 6.875%, 6/15/20 | | | 66,400 | |
| | 44,000 | | | Windstream Corp., 7.750%, 10/15/20† | | | 37,070 | |
| | | | | | | | 2,307,087 | |
| | | | | | | | | |
| | | | | Health Care — 3.2% | | | | |
| | 55,000 | | | Acadia Healthcare Co., Inc., 5.125%, 7/1/22 | | | 51,425 | |
| | 11,000 | | | Acadia Healthcare Co., Inc., 5.625%, 2/15/23 | | | 10,395 | |
| | 90,000 | | | Actavis Funding SCS (Luxembourg), 3.800%, 3/15/25 | | | 89,540 | |
Touchstone Active Bond Fund (Continued)
| Principal | | | | | Market | |
| Amount | | | | | Value | |
| | | | | | | |
| | | | | Corporate Bonds — 55.3% (Continued) | | | | |
| | | | | | | | | |
| | | | | Health Care — (Continued) | | | | |
| $ | 180,000 | | | Celgene Corp., 2.875%, 8/15/20 | | $ | 178,643 | |
| | 36,000 | | | Grifols Worldwide Operations Ltd. (Ireland), 5.250%, 4/1/22 | | | 36,180 | |
| | 129,000 | | | HCA, Inc., 5.375%, 2/1/25 | | | 127,388 | |
| | 28,000 | | | HCA, Inc., 5.875%, 2/15/26 | | | 28,105 | |
| | 86,000 | | | HCA, Inc., 6.500%, 2/15/20 | | | 93,697 | |
| | 44,000 | | | Kindred Healthcare, Inc., 6.375%, 4/15/22 | | | 36,520 | |
| | 14,000 | | | Kindred Healthcare, Inc., 8.000%, 1/15/20 | | | 13,090 | |
| | 41,000 | | | LifePoint Hospitals, Inc., 5.500%, 12/1/21 | | | 41,718 | |
| | 24,000 | | | Mallinckrodt International Finance SA / Mallinckrodt CB LLC (Luxembourg), 144a, 5.500%, 4/15/25 | | | 22,080 | |
| | 31,000 | | | Mallinckrodt International Finance SA / Mallinckrodt CB LLC (Luxembourg), 144a, 5.625%, 10/15/23 | | | 29,450 | |
| | 160,000 | | | Mylan N.V. (Netherlands), 144a, 3.000%, 12/15/18 | | | 159,647 | |
| | 82,000 | | | Ochsner Clinic Foundation, 5.897%, 5/15/45 | | | 88,094 | |
| | 66,000 | | | Quintiles Transnational Corp., 144a, 4.875%, 5/15/23 | | | 66,330 | |
| | 29,000 | | | Select Medical Corp., 6.375%, 6/1/21 | | | 25,375 | |
| | 78,000 | | | Tenet Healthcare Corp., 4.500%, 4/1/21 | | | 76,050 | |
| | 78,000 | | | Tenet Healthcare Corp., 4.750%, 6/1/20 | | | 78,390 | |
| | 105,000 | | | Tenet Healthcare Corp., 6.000%, 10/1/20 | | | 110,512 | |
| | 70,000 | | | Universal Hospital Services, Inc., 7.625%, 8/15/20 | | | 65,712 | |
| | 59,000 | | | Valeant Pharmaceuticals International, 144a, 6.375%, 10/15/20 | | | 56,935 | |
| | 140,000 | | | Valeant Pharmaceuticals International, 144a, 6.750%, 8/15/21 | | | 135,100 | |
| | 29,000 | | | Valeant Pharmaceuticals International (Canada), 144a, 6.750%, 8/15/18 | | | 28,739 | |
| | 18,000 | | | Valeant Pharmaceuticals International, Inc. (Canada), 144a, 5.500%, 3/1/23 | | | 15,840 | |
| | 20,000 | | | Valeant Pharmaceuticals International, Inc. (Canada), 144a, 6.125%, 4/15/25 | | | 17,850 | |
| | | | | | | | 1,682,805 | |
| | | | | | | | | |
| | | | | Materials — 3.0% | | | | |
| | 37,000 | | | A Schulman, Inc., 144a, 6.875%, 6/1/23 | | | 35,428 | |
| | 47,000 | | | Alcoa, Inc., 5.125%, 10/1/24 | | | 42,770 | |
| | 61,000 | | | Aleris International, Inc., 7.625%, 2/15/18 | | | 51,850 | |
| | 140,000 | | | ArcelorMittal (Luxembourg), 6.250%, 8/5/20 | | | 111,825 | |
| | 233,000 | | | ArcelorMittal (Luxembourg), 6.500%, 3/1/21† | | | 187,539 | |
| | 144,000 | | | Cascades, Inc. (Canada), 144a, 5.750%, 7/15/23 | | | 138,240 | |
| | 25,000 | | | Chemours Co. (The), 144a, 6.625%, 5/15/23 | | | 17,500 | |
| | 13,000 | | | Chemours Co. (The), 144a, 7.000%, 5/15/25 | | | 8,872 | |
| | 103,000 | | | Chemtura Corp., 5.750%, 7/15/21 | | | 103,515 | |
| | 35,000 | | | Domtar Corp., 10.750%, 6/1/17 | | | 38,945 | |
| | 9,000 | | | FMG Resources August 2006 Pty Ltd. (Australia), 144a, 9.750%, 3/1/22 | | | 8,235 | |
| | 140,000 | | | Glencore Funding LLC, 144a, 2.500%, 1/15/19 | | | 116,900 | |
| | 73,000 | | | HudBay Minerals, Inc. (Canada), 9.500%, 10/1/20 | | | 53,472 | |
| | 20,000 | | | Huntsman International LLC, 4.875%, 11/15/20 | | | 18,250 | |
| | 165,000 | | | International Paper Co., 5.150%, 5/15/46 | | | 156,978 | |
| | 34,000 | | | JMC Steel Group, Inc., 144a, 8.250%, 3/15/18 | | | 22,631 | |
| | 175,000 | | | LyondellBasell Industries N.V. (Netherlands), 6.000%, 11/15/21 | | | 196,435 | |
| | 9,000 | | | Norbord, Inc. (Canada), 144a, 5.375%, 12/1/20 | | | 9,000 | |
| | 31,000 | | | Norbord, Inc. (Canada), 144a, 6.250%, 4/15/23 | | | 30,612 | |
| | 104,000 | | | Southern Copper Corp., 5.875%, 4/23/45 | | | 79,677 | |
| | 50,000 | | | Steel Dynamics, Inc., 5.250%, 4/15/23 | | | 45,625 | |
| | 53,000 | | | Vulcan Materials Co., 7.500%, 6/15/21 | | | 61,745 | |
| | | | | | | | 1,536,044 | |
| | | | | | | | | |
| | | | | Consumer Staples — 2.9% | | | | |
| | 36,000 | | | B&G Foods, Inc., 4.625%, 6/1/21 | | | 35,640 | |
| | 5,000 | | | Cardtronics, Inc., 5.125%, 8/1/22 | | | 4,825 | |
| | 28,000 | | | Constellation Brands, Inc., 4.750%, 12/1/25 | | | 28,525 | |
| | 107,000 | | | Cott Beverages, Inc., 5.375%, 7/1/22 | | | 104,860 | |
| | 4,000 | | | Cott Beverages, Inc., 6.750%, 1/1/20 | | | 4,130 | |
| | 240,000 | | | CVS Health Corp., 3.875%, 7/20/25 | | | 244,939 | |
| | 49,000 | | | Darling Ingredients, Inc., 5.375%, 1/15/22 | | | 48,265 | |
| | 10,000 | | | Family Tree Escrow LLC, 144a, 5.250%, 3/1/20 | | | 10,325 | |
| | 24,000 | | | Family Tree Escrow LLC, 144a, 5.750%, 3/1/23 | | | 24,840 | |
| | 45,000 | | | Harland Clarke Holdings Corp., 144a, 6.875%, 3/1/20 | | | 37,350 | |
| | 27,000 | | | Harland Clarke Holdings Corp., 144a, 9.750%, 8/1/18 | | | 24,975 | |
| | 85,000 | | | JBS USA LLC / JBS USA Finance, Inc., 144a, 5.750%, 6/15/25 | | | 73,950 | |
| | 165,000 | | | JM Smucker Co. (The), 4.375%, 3/15/45 | | | 160,637 | |
| | 155,000 | | | Kraft Foods Group, Inc., 6.875%, 1/26/39 | | | 183,706 | |
Touchstone Active Bond Fund (Continued)
| Principal | | | | | Market | |
| Amount | | | | | Value | |
| | | | | | | |
| | | | | Corporate Bonds — 55.3% (Continued) | | | | |
| | | | | | | | | |
| | | | | Consumer Staples — (Continued) | | | | |
| $ | 208,000 | | | McGraw Hill Financial, Inc., 3.300%, 8/14/20 | | $ | 209,777 | |
| | 205,000 | | | Mead Johnson Nutrition Co., 3.000%, 11/15/20 | | | 204,938 | |
| | 44,000 | | | Spectrum Brands, Inc., 144a, 5.750%, 7/15/25 | | | 45,100 | |
| | 56,000 | | | TreeHouse Foods, Inc., 4.875%, 3/15/22 | | | 53,340 | |
| | | | | | | | 1,500,122 | |
| | | | | | | | | |
| | | | | Utilities — 2.4% | | | | |
| | 3,000 | | | AES Corp. VA, 8.000%, 6/1/20 | | | 3,300 | |
| | 37,000 | | | Calpine Corp., 144a, 7.875%, 1/15/23 | | | 39,405 | |
| | 264,000 | | | Dominion Resources, Inc. VA, 7.500%, 6/30/66(A) | | | 218,988 | |
| | 84,000 | | | DPL, Inc., 7.250%, 10/15/21 | | | 79,800 | |
| | 140,000 | | | Duke Energy Progress, LLC, 4.150%, 12/1/44 | | | 136,773 | |
| | 145,000 | | | Dynegy, Inc., 5.875%, 6/1/23 | | | 116,362 | |
| | 87,000 | | | Dynegy, Inc., 7.375%, 11/1/22 | | | 75,690 | |
| | 122,000 | | | Electricite de France SA (France), 144a, 4.950%, 10/13/45 | | | 118,456 | |
| | 18,000 | | | GenOn Energy, Inc., 9.500%, 10/15/18 | | | 14,541 | |
| | 48,000 | | | InterGen NV (Netherlands), 144a, 7.000%, 6/30/23 | | | 38,040 | |
| | 101,000 | | | NRG Energy, Inc., 7.875%, 5/15/21 | | | 94,688 | |
| | 124,000 | | | PacifiCorp, 5.750%, 4/1/37 | | | 145,577 | |
| | 165,000 | | | Talen Energy Supply LLC, 6.500%, 5/1/18 | | | 152,625 | |
| | | | | | | | 1,234,245 | |
| | | | | | | | | |
| | | | | Information Technology — 1.9% | | | | |
| | 28,000 | | | CDW LLC / CDW Finance Corp., 5.000%, 9/1/23 | | | 28,420 | |
| | 7,000 | | | CDW LLC / CDW Finance Corp., 6.000%, 8/15/22 | | | 7,385 | |
| | 230,000 | | | Fidelity National Information Services, Inc., 3.625%, 10/15/20 | | | 232,996 | |
| | 212,000 | | | Hewlett Packard Enterprise Co., 144a, 2.450%, 10/5/17 | | | 211,820 | |
| | 29,000 | | | Hughes Satellite Systems Corp., 6.500%, 6/15/19 | | | 31,248 | |
| | 100,000 | | | Intel Corp., 3.300%, 10/1/21 | | | 103,582 | |
| | 85,000 | | | Microsoft Corp., 3.500%, 2/12/35 | | | 78,561 | |
| | 42,000 | | | NCR Corp., 4.625%, 2/15/21 | | | 40,005 | |
| | 51,000 | | | NCR Corp., 5.875%, 12/15/21 | | | 50,235 | |
| | 200,000 | | | QUALCOMM, Inc., 3.450%, 5/20/25 | | | 191,832 | |
| | | | | | | | 976,084 | |
| | | | | Total Corporate Bonds | | $ | 28,763,740 | |
| | | | | | | | | |
| | | | | U.S. Treasury Obligations — 16.1% | | | | |
| | 64,000 | | | U.S. Treasury Bond, 3.000%, 5/15/45 | | | 63,708 | |
| | 530,000 | | | U.S. Treasury Bond, 3.000%, 11/15/45 | | | 528,406 | |
| | 3,115,000 | | | U.S. Treasury Inflation Indexed Bonds, 0.625%, 1/15/24 | | | 3,139,203 | |
| | 1,125,000 | | | U.S. Treasury Inflation Indexed Bonds, 0.750%, 2/15/45 | | | 990,953 | |
| | 2,115,000 | | | U.S. Treasury Note, 0.875%, 11/30/17 | | | 2,108,886 | |
| | 60,000 | | | U.S. Treasury Note, 1.625%, 11/30/20 | | | 59,644 | |
| | 1,500,000 | | | U.S. Treasury Note, 2.250%, 11/15/25 | | | 1,496,660 | |
| | | | | Total U.S. Treasury Obligations | | $ | 8,387,460 | |
| | | | | | | | | |
| | | | | U.S. Government Mortgage-Backed Obligations — 15.2% | | | | |
| | 41,499 | | | FHLMC, Pool #A56988, 5.500%, 2/1/37 | | | 46,027 | |
| | 193,570 | | | FHLMC, Pool #A95946, 4.000%, 1/1/41 | | | 205,136 | |
| | 198,746 | | | FHLMC, Pool #A96485, 4.500%, 1/1/41 | | | 214,484 | |
| | 74,345 | | | FHLMC, Pool #G03217, 5.500%, 9/1/37 | | | 82,859 | |
| | 31,035 | | | FHLMC, Pool #G03781, 6.000%, 1/1/38 | | | 34,899 | |
| | 78,585 | | | FHLMC, Pool #G06031, 5.500%, 3/1/40 | | | 87,412 | |
| | 121,657 | | | FHLMC, Pool #J27931, 3.500%, 4/1/29 | | | 127,683 | |
| | 12,510 | | | FNMA, Pool #254759, 4.500%, 6/1/18 | | | 12,927 | |
| | 10,707 | | | FNMA, Pool #535290, 8.000%, 5/1/30 | | | 12,809 | |
| | 9,406 | | | FNMA, Pool #561741, 7.500%, 1/1/31 | | | 10,958 | |
| | 20,137 | | | FNMA, Pool #889734, 5.500%, 6/1/37 | | | 22,488 | |
| | 72,961 | | | FNMA, Pool #899079, 5.000%, 3/1/37 | | | 80,259 | |
| | 28,622 | | | FNMA, Pool #933806, 5.000%, 5/1/38 | | | 31,480 | |
| | 15,677 | | | FNMA, Pool #974401, 4.500%, 4/1/23 | | | 16,631 | |
| | 21,624 | | | FNMA, Pool #974403, 4.500%, 4/1/23 | | | 23,052 | |
| | 38,739 | | | FNMA, Pool #984256, 5.000%, 6/1/23 | | | 41,665 | |
| | 26,702 | | | FNMA, Pool #995220, 6.000%, 11/1/23 | | | 28,952 | |
| | 27,187 | | | FNMA, Pool #995472, 5.000%, 11/1/23 | | | 29,293 | |
| | 122,511 | | | FNMA, Pool #AB1149, 5.000%, 6/1/40 | | | 135,109 | |
| | 99,197 | | | FNMA, Pool #AB1800, 4.000%, 11/1/40 | | | 105,601 | |
| | 173,174 | | | FNMA, Pool #AD3795, 4.500%, 4/1/40 | | | 187,438 | |
| | 288,946 | | | FNMA, Pool #AD9150, 5.000%, 8/1/40 | | | 319,677 | |
| | 404,205 | | | FNMA, Pool #AE0548, 4.500%, 11/1/40 | | | 437,466 | |
| | 42,983 | | | FNMA, Pool #AE0831, 6.000%, 9/1/39 | | | 48,559 | |
| | 270,008 | | | FNMA, Pool #AE4429, 4.000%, 10/1/40 | | | 286,457 | |
| | 25,251 | | | FNMA, Pool #AH2666, 4.000%, 1/1/26 | | | 26,790 | |
| | 51,137 | | | FNMA, Pool #AH3493, 4.000%, 2/1/26 | | | 54,309 | |
| | 131,393 | | | FNMA, Pool #AI0805, 4.500%, 7/1/41 | | | 141,991 | |
| | 498,496 | | | FNMA, Pool #AJ5457, 4.000%, 11/1/41 | | | 529,786 | |
| | 478,564 | | | FNMA, Pool #AL0054, 4.500%, 2/1/41 | | | 517,823 | |
| | 96,874 | | | FNMA, Pool #AL2663, 4.000%, 1/1/26 | | | 102,744 | |
| | 422,991 | | | FNMA, Pool #AL3318, 3.500%, 3/1/43 | | | 438,042 | |
| | 487,944 | | | FNMA, Pool #AS4442, 3.000%, 2/1/35 | | | 498,287 | |
| | 443,548 | | | FNMA, Pool #MA1175, 3.000%, 9/1/42 | | | 445,141 | |
| | 302,449 | | | FNMA, Pool #MA1543, 3.500%, 8/1/33 | | | 316,229 | |
| | 294,800 | | | FNMA, Pool #MA2177, 4.000%, 2/1/35 | | | 315,117 | |
| | 448,132 | | | GNMA, Pool #4853, 4.000%, 11/20/40 | | | 480,034 | |
| | 302,326 | | | GNMA, Pool #4883, 4.500%, 12/20/40 | | | 329,325 | |
| | 136,602 | | | GNMA, Pool #736696, 4.500%, 5/15/40 | | | 147,539 | |
| | 24,071 | | | GNMA, Pool #748495, 4.000%, 8/15/40 | | | 25,555 | |
| | 11,690 | | | GNMA, Pool #8503, 1.875%, 9/20/24(A) | | | 12,113 | |
| | 468,873 | | | GNMA, Pool #AD1745, 3.000%, 2/20/43 | | | 477,745 | |
| | 414,492 | | | GNMA, Pool #MA1157, 3.500%, 7/20/43 | | | 433,244 | |
| | | | | Total U.S. Government Mortgage-Backed Obligations | | $ | 7,921,135 | |
Touchstone Active Bond Fund (Continued)
| Principal | | | | | Market | |
| Amount | | | | | Value | |
| | | | |
| | | | | Commercial Mortgage-Backed Securities — 2.4% | | | | |
| | | | | | | | | |
| $ | 62,783 | | | Banc of America Merrill Lynch Commercial Mortgage, Inc., Ser 2006-6, Class A3, 5.369%, 10/10/45 | | $ | 62,832 | |
| | 15,788 | | | Banc of America Merrill Lynch Commercial Mortgage, Inc., Ser 2007-2, Class AAB, 5.737%, 4/10/49(A) | | | 15,788 | |
| | 190,414 | | | COMM Mortgage Trust, Ser 2014-SAVA, Class A, 144a, 1.347%, 6/15/34(A) | | | 189,960 | |
| | 53,308 | | | First Union Commercial Mortgage Trust, Ser 1999-C1, Class F, 144a, 5.350%, 10/15/35 | | | 53,698 | |
| | 340,018 | | | Hilton USA Trust, Ser 2013-HLF, Class AFL, 144a, 1.192%, 11/5/30(A) | | | 338,424 | |
| | 270,000 | | | JP Morgan Chase Commercial Mortgage Securities Trust, Ser 2015-CSMO, Class A, 144a, 1.581%, 1/15/32(A) | | | 268,568 | |
| | 325,000 | | | Morgan Stanley Bank of America Merrill Lynch Trust, Ser 2014-C18, Class ASB, 3.621%, 10/15/47 | | | 333,742 | |
| | | | | Total Commercial Mortgage-Backed Securities | | $ | 1,263,012 | |
| | | | | | | | | |
| | | | | Asset-Backed Securities — 2.4% | | | | |
| | 397,000 | | | California Republic Auto Receivables Trust, Ser 2014-2, Class A4, 1.570%, 12/16/19 | | | 393,911 | |
| | 370,000 | | | Capital Auto Receivables Asset Trust, Ser 2014-1, Class A3, 1.320%, 6/20/18 | | | 369,861 | |
| | 302,622 | | | Countrywide Asset-Backed Certificates, Ser 2007-S1, Class A5, 6.018%, 11/25/36(A) | | | 280,045 | |
| | 210,000 | | | Dell Equipment Finance Trust, Ser 2015-1, Class C, 144a, 2.420%, 3/23/20 | | | 208,243 | |
| | | | | Total Asset-Backed Securities | | $ | 1,252,060 | |
| | | | | | | | | |
| | | | | Non-Agency Collateralized Mortgage Obligations — 1.4% | | | | |
| | 309,434 | | | Agate Bay Mortgage Trust, Ser 2015-2, Class A8, 144a, 3.000%, 3/25/45(A) | | | 309,328 | |
| | 28,939 | | | Deutsche ALT-A Securities, Inc. Alternate Loan Trust, Ser 2003-2XS, Class A6, 5.470%, 9/25/33(C) | | | 29,551 | |
| | 58,132 | | | Deutsche ALT-A Securities, Inc. Alternate Loan Trust, Ser 2005-3, Class 4A4, 5.250%, 6/25/35 | | | 58,309 | |
| | 135,477 | | | Residential Asset Securitization Trust, Ser 2006-A1, Class 1A3, 6.000%, 4/25/36 | | | 108,369 | |
| | 122,802 | | | Structured Asset Securities Corp., Ser 2005-17, Class 5A1, 5.500%, 10/25/35 | | | 103,227 | |
| | 85,891 | | | Washington Mutual Alternative Mortgage Pass-Through Certificates, Ser 2005-9, Class 2A4, 5.500%, 11/25/35†† | | | 84,641 | |
| | | | | Total Non-Agency Collateralized Mortgage Obligations | | $ | 693,425 | |
| | | | | | | | | |
| | | | | Municipal Bonds — 0.7% | | | | |
| | | | | | | | | |
| | | | | Illinois — 0.1% | | | | |
| | 35,000 | | | IL St, Pension, UTGO, 5.100%, 6/1/33 | | | 33,098 | |
| | | | | | | | | |
| | | | | New York — 0.6% | | | | |
| | 320,000 | | | NY Housing Development Corp., Ref 8 Spruce Street Class B, 3.864%, 2/15/48(C) | | | 325,661 | |
| | | | | Total Municipal Bonds | | $ | 358,759 | |
| | | | | | | | | |
| | | | | Agency Collateralized Mortgage Obligations — 0.4% | | | | |
| | 12,997 | | | GNMA, Ser 2003-11, Class GJ, 4.000%, 10/17/29 | | | 13,698 | |
| | 175,945 | | | FNMA REMIC, Ser 2015-51, Class KC, 3.000%, 6/25/45 | | | 178,590 | |
| | | | | Total Agency Collateralized Mortgage Obligations | | $ | 192,288 | |
| | | | | | | | | |
| | Shares | | | | | | | |
| | | | | | | | | |
| | | | | Investment Funds — 6.2% | | | | |
| | 2,690,672 | | | Dreyfus Cash Management, Institutional Shares, 0.22%∞Ω | | | 2,690,672 | |
| | 534,600 | | | Invesco Government & Agency Portfolio, Institutional Class, 0.13%**∞Ω | | | 534,600 | |
| | | | | Total Investment Funds | | $ | 3,225,272 | |
| | | | | | | | | |
| | | | | Total Investment Securities —100.1% | | | | |
| | | | | (Cost $53,832,245) | | $ | 52,057,151 | |
| | | | | | | | | |
| | | | | Liabilities in Excess of | | | | |
| | | | | Other Assets — (0.1%) | | | (30,657 | ) |
| | | | | | | | | |
| | | | | Net Assets — 100.0% | | $ | 52,026,494 | |
| (A) | Variable rate security - Rate reflected is the rate in effect as of December 31, 2015. |
| (B) | Perpetual Bond - A Bond with no definite maturity date. |
| (C) | Step Bond - A bond that pays an initial interest rate for the first period and then a higher interest rate for the following periods until maturity. The interest rate shown reflects the rate in effect as of December 31, 2015. |
Touchstone Active Bond Fund (Continued)
| ** | Represents collateral for securities loaned. |
| † | All or a portion of the security is on loan. The total market value of the securities on loan as of December 31, 2015 was $516,488. |
| †† | The issuers and/or sponsors of certain mortgage-backed securities may no longer exist; however, the securities held by the Fund are separate legal entities organized as trusts and publicly traded. The Fund receives principal and interest payments directly from these trusts. |
| Ω | Represents the 7-day SEC yield as of December 31, 2015. |
Portfolio Abbreviations:
FHLMC - Federal Home Loan Mortgage Association
FNMA - Federal National Mortgage Association
GNMA - Government National Mortgage Association
ICE - Intercontinental Exchange, Inc.
LLC - Limited Liability Company
LP - Limited Partnership
MTN -Medium Term Note
PLC - Public Limited Company
REIT - Real Estate Investment Trust
REMIC - Real Estate Mortgage Investment Conduit
UTGO - Unlimited Tax General Obligation
144a - This is a restricted security that was sold in a transaction qualifying for the exemption under Rule 144A of the Securities Act of 1933. This security may be sold in transactions exempt from registration, normally to qualified institutional buyers. At December 31, 2015, these securities were valued at $7,568,033 or 14.5% of net assets. These securities were deemed liquid pursuant to procedures approved by the Board of Trustees.
Other Information:
The inputs or methodology used for valuing securities may not be an indication of the risk associated with investing in those securities. For more information on valuation inputs, and their aggregation into the levels used in the table below, please refer to the security valuation section in the accompanying Notes to Financial Statements.
| Valuation inputs at Reporting Date: | |
| Description | | Level 1 | | | Level 2 | | | Level 3 | | | Total | |
| Corporate Bonds | | $ | — | | | $ | 28,763,740 | | | $ | — | | | $ | 28,763,740 | |
| U.S. Treasury Obligations | | | — | | | | 8,387,460 | | | | — | | | | 8,387,460 | |
| U.S. Government Mortgage-Backed Obligations | | | — | | | | 7,921,135 | | | | — | | | | 7,921,135 | |
| Commercial Mortgage-Backed Securities | | | — | | | | 1,263,012 | | | | — | | | | 1,263,012 | |
| Asset-Backed Securities | | | — | | | | 1,252,060 | | | | — | | | | 1,252,060 | |
| Non-Agency Collateralized Mortgage Obligations | | | — | | | | 693,425 | | | | — | | | | 693,425 | |
| Municipal Bonds | | | — | | | | 358,759 | | | | — | | | | 358,759 | |
| Agency Collateralized Mortgage Obligations | | | — | | | | 192,288 | | | | — | | | | 192,288 | |
| Investment Funds | | | 3,225,272 | | | | — | | | | — | | | | 3,225,272 | |
| Total | | $ | 3,225,272 | | | $ | 48,831,879 | | | $ | — | | | $ | 52,057,151 | |
Other Financial Instruments*
Liabilities
| Swap Agreements Credit Contracts | | $ | — | | | $ | 46,707 | | | $ | — | | | $ | 46,707 | |
*Other Financial Instruments are derivative instruments not reflected in total investments. Amounts shown represent unrealized depreciation of swap agreements.
Touchstone Active Bond Fund (Continued)
Centrally Cleared Credit Default Swaps on Credit Indices - Sell Protection(1)
| | | | | | | | Receive | | | | | | | | | | | | | | |
| | | Termination | | Notional | | | Fixed | | | | | Asset Backed/ | | | | | Upfront | | | Unrealized | |
| Counterparty | | Date | | Amount(2) | | | Rate | | | Clearinghouse | | Credit Indices | | Value(3) | | | Premium Paid | | | (Depreciation) | |
| Wells Fargo | | 6/20/20 | | $ | 2,400,000 | | | | 5.000 | % | | ICE | | MarkitCDX.NA.HY.24 | | $ | 93,801 | | | $ | 140,508 | | | $ | (46,707 | ) |
| (1) | | If the Fund is a seller of protection and a credit event occurs, as defined under the terms of that particular swap agreement, the Fund will either (i) pay to the buyer of protection an amount equal to the notional amount of the swap and take delivery of the referenced obligation or underlying investments comprising the referenced index or (ii) pay a net settlement amount in the form of cash or investments equal to the notional amount of the swap less the recovery value of the referenced obligation or underlying investments comprising the referenced index. |
| (2) | | The maximum potential amount the Fund could be required to pay as a seller of credit protection or receive as a buyer of protection if a credit event occurs as defined under the terms of that particular swap agreement. |
| (3) | | The quoted market prices and resulting values for credit default swap agreements on asset-backed securities and credit indices serve as an indicator of the current status of the payment/performance risk and represent the likelihood of an expected liability (or profit) for the credit derivative had the notional amount of the swap agreement been closed/sold as of the period end. Decreasing market values (sell protection) or increasing market values (buy protection) when compared to the notional amount of the swap, represent a deterioration of the referenced entity's credit soundness and a greater likelihood or risk of default or other credit event occurring as defined under the terms of the agreement. |
See accompanying Notes to Financial Statements.
Portfolio of Investments
Touchstone Focused Fund – December 31, 2015
| | | | | | Market | |
| | | Shares | | | Value | |
| | | | | | | |
| Common Stocks — 97.4% | | | | | | | | |
| | | | | | | | | |
| Information Technology — 21.0% | | | | | | | | |
| Alphabet, Inc. - Class C* | | | 4,440 | | | $ | 3,369,427 | |
| Apple, Inc. | | | 21,472 | | | | 2,260,143 | |
| Avnet, Inc. | | | 35,448 | | | | 1,518,592 | |
| Cisco Systems, Inc. | | | 73,064 | | | | 1,984,053 | |
| International Business Machines Corp. | | | 7,354 | | | | 1,012,058 | |
| Microsoft Corp. | | | 39,476 | | | | 2,190,129 | |
| Oracle Corp. | | | 54,520 | | | | 1,991,616 | |
| | | | | | | | 14,326,018 | |
| | | | | | | | | |
| Health Care — 16.9% | | | | | | | | |
| Abbott Laboratories | | | 53,653 | | | | 2,409,556 | |
| Biogen, Inc.* | | | 3,956 | | | | 1,211,921 | |
| Bio-Rad Laboratories, Inc. - Class A* | | | 12,431 | | | | 1,723,682 | |
| Johnson & Johnson | | | 14,228 | | | | 1,461,500 | |
| Novartis AG ADR | | | 27,920 | | | | 2,402,237 | |
| Owens & Minor, Inc. | | | 65,828 | | | | 2,368,491 | |
| | | | | | | | 11,577,387 | |
| | | | | | | | | |
| Financials — 15.3% | | | | | | | | |
| Bank of America Corp. | | | 120,288 | | | | 2,024,447 | |
| Bank of New York Mellon Corp. (The) | | | 95,305 | | | | 3,928,472 | |
| Berkshire Hathaway, Inc. - Class B* | | | 19,622 | | | | 2,590,889 | |
| Goldman Sachs Group, Inc. (The) | | | 10,789 | | | | 1,944,501 | |
| | | | | | | | 10,488,309 | |
| | | | | | | | | |
| Consumer Discretionary — 12.2% | | | | | | | | |
| Amazon.com, Inc.* | | | 4,067 | | | | 2,748,845 | |
| Carnival Corp. (Panama) | | | 32,932 | | | | 1,794,135 | |
| Priceline Group, Inc. (The)* | | | 989 | | | | 1,260,926 | |
| Royal Caribbean Cruises Ltd. (Liberia) | | | 5,401 | | | | 546,635 | |
| Twenty-First Century Fox, Inc. - Class A | | | 42,035 | | | | 1,141,671 | |
| Vista Outdoor, Inc.* | | | 18,322 | | | | 815,512 | |
| | | | | | | | 8,307,724 | |
| | | | | | | | | |
| Consumer Staples — 11.3% | | | | | | | | |
| JM Smucker Co. (The) | | | 13,368 | | | | 1,648,809 | |
| Mondelez International, Inc. - Class A | | | 80,127 | | | | 3,592,895 | |
| Sysco Corp. | | | 59,835 | | | | 2,453,235 | |
| | | | | | | | 7,694,939 | |
| | | | | | | | | |
| Industrials — 10.2% | | | | | | | | |
| AGCO Corp. | | | 23,001 | | | | 1,044,015 | |
| CSX Corp. | | | 16,037 | | | | 416,160 | |
| General Electric Co. | | | 87,820 | | | | 2,735,593 | |
| Kennametal, Inc. | | | 37,229 | | | | 714,797 | |
| Union Pacific Corp. | | | 13,878 | | | | 1,085,260 | |
| WESCO International, Inc.* | | | 22,225 | | | | 970,788 | |
| | | | | | | | 6,966,613 | |
| | | | | | | | | |
| Energy — 6.5% | | | | | | | | |
| Exxon Mobil Corp. | | | 13,433 | | | | 1,047,102 | |
| Halliburton Co. | | | 32,457 | | | | 1,104,836 | |
| Schlumberger Ltd. (Curacao) | | | 18,156 | | | | 1,266,381 | |
| World Fuel Services Corp. | | | 26,793 | | | | 1,030,459 | |
| | | | | | | | 4,448,778 | |
| Materials — 4.0% | | | | | | | | |
| Agrium, Inc. (Canada)† | | | 16,803 | | | | 1,501,180 | |
| Reliance Steel & Aluminum Co. | | | 21,117 | | | | 1,222,885 | |
| | | | | | | | 2,724,065 | |
| Total Common Stocks | | | | | | $ | 66,533,833 | |
| | | | | | | | | |
| Investment Funds — 5.1% | | | | | | | | |
| Dreyfus Cash Management, Institutional Shares, 0.22%∞Ω | | | 1,928,557 | | | | 1,928,557 | |
| Invesco Government & Agency Portfolio, Institutional Class, 0.13%**∞Ω | | | 1,531,160 | | | | 1,531,160 | |
| Total Investment Funds | | | | | | $ | 3,459,717 | |
| | | | | | | | | |
| Total Investment Securities —102.5% | | | | | | | | |
| (Cost $70,187,278) | | | | | | $ | 69,993,550 | |
| | | | | | | | | |
| Liabilities in Excess of Other Assets — (2.5%) | | | | | | | (1,677,001 | ) |
| | | | | | | | | |
| Net Assets — 100.0% | | | | | | $ | 68,316,549 | |
| * | Non-income producing security. |
| ** | Represents collateral for securities loaned. |
| † | All or a portion of the security is on loan. The total market value of the securities on loan as of December 31, 2015 was $1,486,082. |
| Ω | Represents the 7-day SEC yield as of December 31, 2015. |
Portfolio Abbreviations:
ADR - American Depositary Receipt
Touchstone Focused Fund (Continued)
Other Information:
The inputs or methodology used for valuing securities may not be an indication of the risk associated with investing in those securities. For more information on valuation inputs, and their aggregation into the levels used in the table below, please refer to the security valuation section in the accompanying Notes to Financial Statements.
| Valuation inputs at Reporting Date: | |
| Description | | Level 1 | | | Level 2 | | | Level 3 | | | Total | |
| Common Stocks | | $ | 66,533,833 | | | $ | — | | | $ | — | | | $ | 66,533,833 | |
| Investment Funds | | | 3,459,717 | | | | — | | | | — | | | | 3,459,717 | |
| Total | | $ | 69,993,550 | | | $ | — | | | $ | — | | | $ | 69,993,550 | |
See accompanying Notes to Financial Statements.
Portfolio of Investments
Touchstone Large Cap Core Equity Fund – December 31, 2015
| | | | | | Market | |
| | | Shares | | | Value | |
| | | | | | | |
| Common Stocks — 98.7% | | | | | | | | |
| | | | | | | | | |
| Consumer Discretionary — 21.1% | | | | | | | | |
| CarMax, Inc.* | | | 23,139 | | | $ | 1,248,812 | |
| Carnival Corp. (Panama) | | | 28,020 | | | | 1,526,530 | |
| Dollar Tree, Inc.* | | | 16,532 | | | | 1,276,601 | |
| Lowe's Cos., Inc. | | | 16,997 | | | | 1,292,452 | |
| O'Reilly Automotive, Inc.* | | | 3,750 | | | | 950,325 | |
| | | | | | | | 6,294,720 | |
| | | | | | | | | |
| Financials — 18.9% | | | | | | | | |
| Alleghany Corp.* | | | 2,072 | | | | 990,271 | |
| Bank of America Corp. | | | 50,832 | | | | 855,503 | |
| Berkshire Hathaway, Inc. - Class B* | | | 10,429 | | | | 1,377,045 | |
| BlackRock, Inc. | | | 3,308 | | | | 1,126,440 | |
| Wells Fargo & Co. | | | 23,731 | | | | 1,290,017 | |
| | | | | | | | 5,639,276 | |
| | | | | | | | | |
| Information Technology — 14.2% | | | | | | | | |
| Cisco Systems, Inc. | | | 27,541 | | | | 747,876 | |
| EMC Corp. | | | 31,937 | | | | 820,142 | |
| International Business Machines Corp. | | | 3,605 | | | | 496,120 | |
| Microsoft Corp. | | | 10,322 | | | | 572,664 | |
| Visa, Inc. - Class A | | | 20,581 | | | | 1,596,056 | |
| | | | | | | | 4,232,858 | |
| | | | | | | | | |
| Industrials — 12.2% | | | | | | | | |
| Deere & Co. | | | 10,411 | | | | 794,047 | |
| FedEx Corp. | | | 3,803 | | | | 566,609 | |
| General Dynamics Corp. | | | 9,954 | | | | 1,367,281 | |
| Norfolk Southern Corp. | | | 10,715 | | | | 906,382 | |
| | | | | | | | 3,634,319 | |
| | | | | | | | | |
| Health Care — 11.2% | | | | | | | | |
| Bristol-Myers Squibb Co. | | | 20,793 | | | | 1,430,350 | |
| Eli Lilly & Co. | | | 15,768 | | | | 1,328,612 | |
| Pfizer, Inc. | | | 18,770 | | | | 605,896 | |
| | | | | | | | 3,364,858 | |
| | | | | | | | | |
| Consumer Staples — 10.2% | | | | | | | | |
| Altria Group, Inc. | | | 30,455 | | | | 1,772,786 | |
| Coca-Cola Co. (The) | | | 15,907 | | | | 683,365 | |
| Edgewell Personal Care Co. | | | 7,575 | | | | 593,653 | |
| | | | | | | | 3,049,804 | |
| | | | | | | | | |
| Materials — 5.1% | | | | | | | | |
| Mosaic Co. (The) | | | 16,077 | | | | 443,564 | |
| NewMarket Corp. | | | 2,858 | | | | 1,088,126 | |
| | | | | | | | 1,531,690 | |
| | | | | | | | | |
| Energy — 3.9% | | | | | | | | |
| Chevron Corp. | | | 7,455 | | | | 670,652 | |
| ConocoPhillips | | | 10,905 | | | | 509,154 | |
| | | | | | | | 1,179,806 | |
| | | | | | | | | |
| Telecommunication Services — 1.9% | | | | | | | | |
| Verizon Communications, Inc. | | | 12,217 | | | | 564,670 | |
| Total Common Stocks | | | | | | $ | 29,492,001 | |
| | | | | | | | | |
| Investment Fund — 1.5% | | | | | | | | |
| Dreyfus Cash Management, Institutional Shares, 0.22%∞Ω | | | 460,706 | | | $ | 460,706 | |
| | | | | | | | | |
| Total Investment Securities —100.2% | | | | | | | | |
| (Cost $29,892,240) | | | | | | $ | 29,952,707 | |
| | | | | | | | | |
| Liabilities in Excess of Other Assets — (0.2%) | | | | | | | (58,848 | ) |
| | | | | | | | | |
| Net Assets — 100.0% | | | | | | $ | 29,893,859 | |
| * | Non-income producing security. |
| Ω | Represents the 7-day SEC yield as of December 31, 2015. |
Other Information:
The inputs or methodology used for valuing securities may not be an indication of the risk associated with investing in those securities. For more information on valuation inputs, and their aggregation into the levels used in the table below, please refer to the security valuation section in the accompanying Notes to Financial Statements.
| Valuation Inputs at Reporting Date: | |
| Description | | Level 1 | | | Level 2 | | | Level 3 | | | Total | |
| Common Stocks | | $ | 29,492,001 | | | $ | — | | | $ | — | | | $ | 29,492,001 | |
| Investment Fund | | | 460,706 | | | | — | | | | — | | | | 460,706 | |
| Total | | $ | 29,952,707 | | | $ | — | | | $ | — | | | $ | 29,952,707 | |
See accompanying Notes to Financial Statements.
Portfolio of Investments
Touchstone Aggressive ETF Fund – December 31, 2015
| | | | | | Market | |
| Shares | | | | | Value | |
| | | | | | | |
| | | | | Exchange Traded Funds — 98.8% | | | | |
| | 8,180 | | | iShares Core S&P 500 ETF | | $ | 1,675,837 | |
| | 39,610 | | | iShares Core US Aggregate Bond ETF | | | 4,278,276 | |
| | 42,430 | | | iShares MSCI EAFE Index Fund | | | 2,492,762 | |
| | 53,120 | | | iShares S&P 500 Growth Index Fund | | | 6,151,296 | |
| | 41,680 | | | iShares S&P 500 Value Index Fund | | | 3,689,930 | |
| | 5,010 | | | iShares S&P MidCap 400 Growth Index Fund† | | | 806,410 | |
| | 8,150 | | | iShares S&P MidCap 400 Value Index Fund† | | | 955,180 | |
| | 1,500 | | | iShares S&P SmallCap 600 Growth Index Fund | | | 186,465 | |
| | 5,350 | | | iShares S&P SmallCap 600 Value Index Fund† | | | 578,656 | |
| | | | | Total Exchange Traded Funds | | $ | 20,814,812 | |
| | | | | | | | | |
| | | | | Investment Funds — 12.3% | | | | |
| | 334,407 | | | Dreyfus Cash Management, Institutional Shares, 0.22%∞Ω | | | 334,407 | |
| | 2,254,624 | | | Invesco Government & Agency Portfolio, Institutional Class, 0.13%**∞Ω | | | 2,254,624 | |
| | | | | Total Investment Funds | | $ | 2,589,031 | |
| | | | | | | | | |
| | | | | Total Investment Securities —111.1% | | | | |
| | | | | (Cost $21,332,406) | | $ | 23,403,843 | |
| | | | | | | | | |
| | | | | Liabilities in Excess of Other Assets — (11.1%) | | | (2,336,999 | ) |
| | | | | | | | | |
| | | | | Net Assets — 100.0% | | $ | 21,066,844 | |
| ** | Represents collateral for securities loaned. |
| † | All or a portion of the security is on loan. The total market value of the securities on loan as of December 31, 2015 was $2,185,931. |
| Ω | Represents the 7-day SEC yield as of December 31, 2015. |
Portfolio Abbreviation:
ETF - Exchange Traded Fund
Other Information:
The inputs or methodology used for valuing securities may not be an indication of the risk associated with investing in those securities. For more information on valuation inputs, and their aggregation into the levels used in the table below, please refer to the security valuation section in the accompanying Notes to Financial Statements.
| Valuation inputs at Reporting Date: | |
| Description | | Level 1 | | | Level 2 | | | Level 3 | | | Total | |
| Exchange Traded Funds | | $ | 20,814,812 | | | $ | — | | | $ | — | | | $ | 20,814,812 | |
| Investment Funds | | | 2,589,031 | | | | — | | | | — | | | | 2,589,031 | |
| Total | | $ | 23,403,843 | | | $ | — | | | $ | — | | | $ | 23,403,843 | |
See accompanying Notes to Financial Statements.
Portfolio of Investments
Touchstone Conservative ETF Fund – December 31, 2015
| | | | | | Market | |
| Shares | | | | | Value | |
| | | | | | | |
| | | | | Exchange Traded Funds — 98.8% | | | | |
| | 36,060 | | | iShares Barclays 1-3 Year Treasury Bond Fund | | $ | 3,042,022 | |
| | 3,740 | | | iShares Core S&P 500 ETF | | | 766,214 | |
| | 93,000 | | | iShares Core US Aggregate Bond ETF | | | 10,044,930 | |
| | 18,100 | | | iShares MSCI EAFE Index Fund | | | 1,063,375 | |
| | 21,130 | | | iShares S&P 500 Growth Index Fund | | | 2,446,853 | |
| | 17,170 | | | iShares S&P 500 Value Index Fund | | | 1,520,060 | |
| | 1,060 | | | iShares S&P MidCap 400 Growth Index Fund | | | 170,618 | |
| | 2,860 | | | iShares S&P MidCap 400 Value Index Fund† | | | 335,192 | |
| | 1,430 | | | iShares S&P SmallCap 600 Growth Index Fund | | | 177,763 | |
| | 1,560 | | | iShares S&P SmallCap 600 Value Index Fund† | | | 168,730 | |
| | | | | Total Exchange Traded Funds | | $ | 19,735,757 | |
| | | | | | | | | |
| | | | | Investment Funds — 4.2% | | | | |
| | 353,744 | | | Dreyfus Cash Management, Institutional Shares, 0.22%∞Ω | | | 353,744 | |
| | 481,842 | | | Invesco Government & Agency Portfolio, Institutional Class, 0.13%**∞Ω | | | 481,842 | |
| | | | | Total Investment Funds | | $ | 835,586 | |
| | | | | | | | | |
| | | | | Total Investment Securities —103.0% | | | | |
| | | | | (Cost $18,821,498) | | $ | 20,571,343 | |
| | | | | | | | | |
| | | | | Liabilities in Excess of Other Assets — (3.0%) | | | (607,420 | ) |
| | | | | | | | | |
| | | | | Net Assets — 100.0% | | $ | 19,963,923 | |
| ** | Represents collateral for securities loaned. |
| † | All or a portion of the security is on loan. The total market value of the securities on loan as of December 31, 2015 was $467,222. |
| Ω | Represents the 7-day SEC yield as of December 31, 2015. |
Portfolio Abbreviation:
ETF - Exchange Traded Fund
Other Information:
The inputs or methodology used for valuing securities may not be an indication of the risk associated with investing in those securities. For more information on valuation inputs, and their aggregation into the levels used in the table below, please refer to the security valuation section in the accompanying Notes to Financial Statements.
| Valuation inputs at Reporting Date: | |
| Description | | Level 1 | | | Level 2 | | | Level 3 | | | Total | |
| Exchange Traded Funds | | $ | 19,735,757 | | | $ | — | | | $ | — | | | $ | 19,735,757 | |
| Investment Funds | | | 835,586 | | | | — | | | | — | | | | 835,586 | |
| Total | | $ | 20,571,343 | | | $ | — | | | $ | — | | | $ | 20,571,343 | |
See accompanying Notes to Financial Statements.
Portfolio of Investments
Touchstone Moderate ETF Fund – December 31, 2015
| | | | | | Market | |
| Shares | | | | | Value | |
| | | | | | | |
| | | | | Exchange Traded Funds — 98.8% | | | | |
| | 6,680 | | | iShares Core S&P 500 ETF | | $ | 1,368,532 | |
| | 104,770 | | | iShares Core US Aggregate Bond ETF | | | 11,316,208 | |
| | 42,990 | | | iShares MSCI EAFE Index Fund | | | 2,525,662 | |
| | 52,410 | | | iShares S&P 500 Growth Index Fund | | | 6,069,078 | |
| | 42,650 | | | iShares S&P 500 Value Index Fund | | | 3,775,804 | |
| | 4,860 | | | iShares S&P MidCap 400 Growth Index Fund† | | | 782,266 | |
| | 8,570 | | | iShares S&P MidCap 400 Value Index Fund† | | | 1,004,404 | |
| | 1,990 | | | iShares S&P SmallCap 600 Growth Index Fund | | | 247,377 | |
| | 4,550 | | | iShares S&P SmallCap 600 Value Index Fund† | | | 492,128 | |
| | | | | Total Exchange Traded Funds | | $ | 27,581,459 | |
| | | | | | | | | |
| | | | | Investment Funds — 11.3% | | | | |
| | 888,713 | | | Dreyfus Cash Management, Institutional Shares, 0.22%∞Ω | | | 888,713 | |
| | 2,275,950 | | | Invesco Government & Agency Portfolio, Institutional Class, 0.13%**∞Ω | | | 2,275,950 | |
| | | | | Total Investment Funds | | $ | 3,164,663 | |
| | | | | | | | | |
| | | | | Total Investment Securities —110.1% | | | | |
| | | | | (Cost $27,308,454) | | $ | 30,746,122 | |
| | | | | | | | | |
| | | | | Liabilities in Excess of Other Assets — (10.1%) | | | (2,823,390 | ) |
| | | | | | | | | |
| | | | | Net Assets — 100.0% | | $ | 27,922,732 | |
| ** | Represents collateral for securities loaned. |
| † | All or a portion of the security is on loan. The total market value of the securities on loan as of December 31, 2015 was $2,206,768. |
| Ω | Represents the 7-day SEC yield as of December 31, 2015. |
Portfolio Abbreviation:
ETF - Exchange Traded Fund
Other Information:
The inputs or methodology used for valuing securities may not be an indication of the risk associated with investing in those securities. For more information on valuation inputs, and their aggregation into the levels used in the table below, please refer to the security valuation section in the accompanying Notes to Financial Statements.
| Valuation inputs at Reporting Date: | |
| Description | | Level 1 | | | Level 2 | | | Level 3 | | | Total | |
| Exchange Traded Funds | | $ | 27,581,459 | | | $ | — | | | $ | — | | | $ | 27,581,459 | |
| Investment Funds | | | 3,164,663 | | | | — | | | | — | | | | 3,164,663 | |
| Total | | $ | 30,746,122 | | | $ | — | | | $ | — | | | $ | 30,746,122 | |
See accompanying Notes to Financial Statements.
Statements of Assets and Liabilities
December 31, 2015
| | | | | | | | | Touchstone | |
| | | Touchstone | | | Touchstone | | | Large Cap | |
| | | Active Bond | | | Focused | | | Core Equity | |
| | | Fund | | | Fund | | | Fund | |
| Assets | | | | | | | | | | | | |
| Investments, at cost | | $ | 53,832,245 | | | $ | 70,187,278 | | | $ | 29,892,240 | |
| Investments, at market value (A) | | $ | 52,057,151 | | | $ | 69,993,550 | | | $ | 29,952,707 | |
| Cash | | | 2,111,294 | | | | 2 | | | | — | |
| Cash deposits held at prime broker* | | | 133,043 | | | | — | | | | — | |
| Receivable for variation margin on swap agreements | | | 1,501 | | | | — | | | | — | |
| Dividends and interest receivable | | | 456,082 | | | | 54,501 | | | | 42,526 | |
| Receivable for capital shares sold | | | 29,008 | | | | 6,743 | | | | — | |
| Receivable for investments sold | | | 55,098 | | | | — | | | | — | |
| Securities lending income receivable | | | 106 | | | | 844 | | | | — | |
| Tax reclaim receivable | | | — | | | | 18,892 | | | | — | |
| Total Assets | | | 54,843,283 | | | | 70,074,532 | | | | 29,995,233 | |
| | | | | | | | | | | | | |
| Liabilities | | | | | | | | | | | | |
| Payable for return of collateral for securities on loan | | | 534,600 | | | | 1,531,160 | | | | — | |
| Payable for capital shares redeemed | | | 7,657 | | | | 56,000 | | | | 20,331 | |
| Payable for investments purchased | | | 2,111,201 | | | | — | | | | — | |
| Payable to Investment Advisor | | | 17,715 | | | | 41,932 | | | | 16,751 | |
| Payable to other affiliates | | | 62,118 | | | | 67,386 | | | | 30,428 | |
| Payable to Trustees | | | 11,110 | | | | 14,701 | | | | 7,520 | |
| Payable for professional services | | | 25,511 | | | | 28,729 | | | | 18,648 | |
| Payable for reports to shareholders | | | 3,937 | | | | 2,412 | | | | 4,429 | |
| Other accrued expenses and liabilities | | | 42,940 | | | | 15,663 | | | | 3,267 | |
| Total Liabilities | | | 2,816,789 | | | | 1,757,983 | | | | 101,374 | |
| | | | | | | | | | | | | |
| Net Assets | | $ | 52,026,494 | | | $ | 68,316,549 | | | $ | 29,893,859 | |
| | | | | | | | | | | | | |
| Net assets consist of: | | | | | | | | | | | | |
| Paid-in capital | | $ | 54,368,395 | | | $ | 57,360,347 | | | $ | 26,367,812 | |
| Accumulated net investment income | | | 1,200,431 | | | | — | | | | 266,317 | |
| Accumulated net realized gains (losses) on investments, foreign currency transactions, futures contracts, and swap agreements | | | (1,720,524 | ) | | | 11,151,683 | | | | 3,199,263 | |
| Net unrealized appreciation (depreciation) on investments, foreign currency transactions and swap agreements | | | (1,821,808 | ) | | | (195,481 | ) | | | 60,467 | |
| Net assets applicable to shares outstanding | | $ | 52,026,494 | | | $ | 68,316,549 | | | $ | 29,893,859 | |
| | | | | | | | | | | | | |
| Shares of beneficial interest outstanding (unlimited number of shares authorized, no par value) | | | 5,133,956 | | | | 3,805,692 | | | | 2,125,151 | |
| Net asset value, offering price and redemption price per share | | $ | 10.13 | | | $ | 17.95 | | | $ | 14.07 | |
| (A) Includes market value of securities on loan of: | | $ | 516,488 | | | $ | 1,486,082 | | | $ | — | |
* Represents segregated cash for swap agreements.
See accompanying Notes to Financial Statements.
Statements of Assets and Liabilities (Continued)
| | | | Touchstone | | | | |
| Touchstone | | | Conservative | | | Touchstone | |
| Aggressive ETF | | | ETF | | | Moderate ETF | |
| Fund | | | Fund | | | Fund | |
| | | | | | | | |
| $ | 21,332,406 | | | $ | 18,821,498 | | | $ | 27,308,454 | |
| $ | 23,403,843 | | | $ | 20,571,343 | | | $ | 30,746,122 | |
| | — | | | | — | | | | — | |
| | — | | | | — | | | | — | |
| | — | | | | — | | | | — | |
| | 1,554 | | | | 709 | | | | 1,248 | |
| | — | | | | 230 | | | | 325 | |
| | 63,115 | | | | — | | | | — | |
| | 1,787 | | | | 382 | | | | 1,127 | |
| | — | | | | — | | | | — | |
| | 23,470,299 | | | | 20,572,664 | | | | 30,748,822 | |
| | | | | | | | | | | |
| | | | | | | | | | | |
| | 2,254,624 | | | | 481,842 | | | | 2,275,950 | |
| | 8,864 | | | | 16,965 | | | | 10,799 | |
| | 78,060 | | | | 50,003 | | | | 467,215 | |
| | 4,526 | | | | 4,361 | | | | 5,951 | |
| | 25,248 | | | | 23,497 | | | | 33,326 | |
| | 7,520 | | | | 7,520 | | | | 7,520 | |
| | 18,217 | | | | 18,104 | | | | 18,742 | |
| | 4,425 | | | | 4,423 | | | | 4,422 | |
| | 1,971 | | | | 2,026 | | | | 2,165 | |
| | 2,403,455 | | | | 608,741 | | | | 2,826,090 | |
| | | | | | | | | | | |
| $ | 21,066,844 | | | $ | 19,963,923 | | | $ | 27,922,732 | |
| | | | | | | | | | | |
| | | | | | | | | | | |
| $ | 21,259,728 | | | $ | 17,991,516 | | | $ | 22,700,039 | |
| | 291,861 | | | | 263,973 | | | | 410,192 | |
| | | | | | | | | | | |
| | (2,556,182 | ) | | | (41,411 | ) | | | 1,374,833 | |
| | | | | | | | | | | |
| | 2,071,437 | | | | 1,749,845 | | | | 3,437,668 | |
| $ | 21,066,844 | | | $ | 19,963,923 | | | $ | 27,922,732 | |
| | | | | | | | | | | |
| | 1,534,157 | | | | 1,685,547 | | | | 2,094,661 | |
| $ | 13.73 | | | $ | 11.84 | | | $ | 13.33 | |
| $ | 2,185,931 | | | $ | 467,222 | | | $ | 2,206,768 | |
Statements of Operations
For the Year Ended December 31, 2015
| | | | | | | | | Touchstone | |
| | | Touchstone | | | Touchstone | | | Large Cap | |
| | | Active Bond | | | Focused | | | Core Equity | |
| | | Fund | | | Fund | | | Fund | |
| Investment Income | | | | | | | | | | | | |
| Dividends from affiliated securities | | $ | 189 | | | $ | 37 | | | $ | 40 | |
| Dividends from non-affiliated securities(A) | | | 676 | | | | 307,222 | | | | 654,527 | |
| Interest | | | 1,487,876 | | | | — | | | | — | |
| Income from securities loaned | | | 471 | | | | 1,170 | | | | 304 | |
| Total Investment Income | | | 1,489,212 | | | | 308,429 | | | | 654,871 | |
| | | | | | | | | | | | | |
| Expenses | | | | | | | | | | | | |
| Investment advisory fees | | | 205,738 | | | | 206,429 | | | | 238,263 | |
| Administration fees | | | 70,242 | | | | 41,017 | | | | 53,151 | |
| Compliance fees and expenses | | | 2,315 | | | | 2,315 | | | | 2,315 | |
| Custody fees | | | 31,391 | | | | 12,856 | | | | 6,259 | |
| Professional fees | | | 24,363 | | | | 26,345 | | | | 22,274 | |
| Transfer Agent fees | | | 170 | | | | 5,666 | | | | 121 | |
| Pricing expense | | | 39,695 | | | | 3,376 | | | | 2,426 | |
| Reports to Shareholders | | | 12,352 | | | | 9,136 | | | | 9,475 | |
| Shareholder servicing fees | | | 34,861 | | | | 49,962 | | | | 66,310 | |
| Trustee fees | | | 14,202 | | | | 14,202 | | | | 14,202 | |
| Other expenses | | | 4,665 | | | | 2,760 | | | | 3,048 | |
| Total Expenses | | | 439,994 | | | | 374,064 | | | | 417,844 | |
| Fees waived and/or reimbursed by the Advisor and/or Affiliates(B) | | | — | | | | (31,787 | ) | | | (29,291 | ) |
| Fees recouped by the Advisor(B) | | | 29,901 | | | | — | | | | — | |
| Net Expenses | | | 469,895 | | | | 342,277 | | | | 388,553 | |
| | | | | | | | | | | | | |
| Net Investment Income (Loss) | | | 1,019,317 | | | | (33,848 | ) | | | 266,318 | |
| | | | | | | | | | | | | |
| Realized and Unrealized Gains (Losses) on Investments | | | | | | | | | | | | |
| Net realized gain (loss) on investments | | | (151,383 | ) | | | 11,330,894 | | | | 7,122,645 | |
| Net realized loss on foreign currency transactions | | | — | | | | (581 | ) | | | — | |
| Net realized loss on futures contracts | | | (1,067 | ) | | | — | | | | — | |
| Net realized gain on swap agreements | | | 44,805 | | | | | | | | | |
| Capital gain distributions received | | | — | | | | — | | | | — | |
| Net change in unrealized appreciation (depreciation) on investments(C) | | | (1,432,726 | ) | | | (12,303,833 | ) | | | (9,198,527 | ) |
| Net change in unrealized appreciation (depreciation) on foreign currency transactions | | | (7 | ) | | | (1,753 | ) | | | — | |
| Net change in unrealized appreciation (depreciation) on swap agreements | | | (46,707 | ) | | | — | | | | — | |
| | | | | | | | | | | | | |
| Net Realized and Unrealized Losses on Investments | | | (1,587,085 | ) | | | (975,273 | ) | | | (2,075,882 | ) |
| | | | | | | | | | | | | |
| Change in Net Assets Resulting from Operations | | $ | (567,768 | ) | | $ | (1,009,121 | ) | | $ | (1,809,564 | ) |
| (A) Net of foreign tax withholding of: | | $ | — | | | $ | 4,575 | | | $ | — | |
| (B) | See Note 4 in Notes to Financial Statements. |
| (C) | Change in unrealized appreciation (depreciation) does not include net depreciation of $863,095 for the Active Bond Fund and net appreciation of $7,000,637 for the Focused Fund in connection with the Funds' mergers. See Note 8 in the Notes to Financial Statements. |
See accompanying Notes to Financial Statements.
Statements of Operations (Continued)
| | | | Touchstone | | | | |
| Touchstone | | | Conservative | | | Touchstone | |
| Aggressive ETF | | | ETF | | | Moderate ETF | |
| Fund | | | Fund | | | Fund | |
| | | | | | | | | | | |
| $ | 14 | | | $ | 15 | | | $ | 18 | |
| | 440,442 | | | | 406,339 | | | | 606,752 | |
| | — | | | | — | | | | — | |
| | 15,006 | | | | 6,359 | | | | 13,536 | |
| | 455,462 | | | | 412,713 | | | | 620,306 | |
| | | | | | | | | | | |
| | | | | | | | | | | |
| | 56,681 | | | | 54,761 | | | | 75,788 | |
| | 32,875 | | | | 31,761 | | | | 43,957 | |
| | 2,315 | | | | 2,315 | | | | 2,315 | |
| | 3,735 | | | | 3,792 | | | | 6,516 | |
| | 17,915 | | | | 17,433 | | | | 18,008 | |
| | 103 | | | | 95 | | | | 121 | |
| | 430 | | | | 473 | | | | 430 | |
| | 9,114 | | | | 9,077 | | | | 9,788 | |
| | 56,681 | | | | 54,761 | | | | 69,725 | |
| | 14,202 | | | | 14,202 | | | | 14,202 | |
| | 2,734 | | | | 2,719 | | | | 2,996 | |
| | 196,785 | | | | 191,389 | | | | 243,846 | |
| | (26,742 | ) | | | (27,107 | ) | | | (16,482 | ) |
| | — | | | | — | | | | — | |
| | 170,043 | | | | 164,282 | | | | 227,364 | |
| | | | | | | | | | | |
| | 285,419 | | | | 248,431 | | | | 392,942 | |
| | | | | | | | | | | |
| | | | | | | | | | | |
| | 1,259,937 | | | | 172,117 | | | | 1,919,025 | |
| | — | | | | — | | | | — | |
| | — | | | | — | | | | — | |
| | | | | | | | | | | |
| | 6,444 | | | | 15,544 | | | | 17,253 | |
| | (1,523,602 | ) | | | (454,186 | ) | | | (2,307,265 | ) |
| | — | | | | — | | | | — | |
| | — | | | | — | | | | — | |
| | | | | | | | | | | |
| | (257,221 | ) | | | (266,525 | ) | | | (370,987 | ) |
| | | | | | | | | | | |
| $ | 28,198 | | | $ | (18,094 | ) | | $ | 21,955 | |
| $ | — | | | $ | — | | | $ | — | |
Statements of Changes in Net Assets
| | | Touchstone | | | Touchstone | |
| | | Active Bond | | | Focused | |
| | | Fund | | | Fund | |
| | | For the | | | For the | | | For the | | | For the | |
| | | Year | | | Year | | | Year | | | Year | |
| | | Ended | | | Ended | | | Ended | | | Ended | |
| | | December 31, | | | December 31, | | | December 31, | | | December 31, | |
| | | 2015 | | | 2014 | | | 2015 | | | 2014 | |
| From Operations | | | | | | | | | | | | | | | | |
| Net investment income (loss) | | $ | 1,019,317 | | | $ | 945,872 | | | $ | (33,848 | ) | | $ | (110,113 | ) |
| Net realized gains (losses) on investments, foreign currency transactions, futures contracts, swap agreements and capital gain distributions received | | | (107,645 | ) | | | 498,099 | | | | 11,330,313 | | | | 3,980,434 | |
| Net change in unrealized appreciation (depreciation) on investments, foreign currency transactions and swap agreements | | | (1,479,440 | ) | | | 362,709 | | | | (12,305,586 | ) | | | (828,794 | ) |
| Change in Net Assets from Operations | | | (567,768 | ) | | | 1,806,680 | | | | (1,009,121 | ) | | | 3,041,527 | |
| | | | | | | | | | | | | | | | | |
| Distributions to Shareholders from: | | | | | | | | | | | | | | | | |
| Net investment income | | | (1,124,745 | ) | | | (1,255,946 | ) | | | — | | | | — | |
| Net realized gains | | | — | | | | — | | | | (3,795,395 | ) | | | (3,090,577 | ) |
| Total Distributions | | | (1,124,745 | ) | | | (1,255,946 | ) | | | (3,795,395 | ) | | | (3,090,577 | ) |
| | | | | | | | | | | | | | | | | |
| Share Transactions | | | | | | | | | | | �� | | | | | |
| Proceeds from Shares Issued | | | 2,099,352 | | | | 1,215,844 | | | | 6,448,376 | | | | 4,045,192 | |
| Proceeds from Shares issued in connection with merger(A) | | | 9,850,991 | | | | — | | | | 43,267,093 | | | | — | |
| Reinvestment of distributions | | | 1,124,745 | | | | 1,255,946 | | | | 3,795,395 | | | | 3,090,577 | |
| Cost of Shares redeemed | | | (8,334,522 | ) | | | (2,432,482 | ) | | | (5,567,557 | ) | | | (9,414,931 | ) |
| Change in Net Assets from Share Transactions | | | 4,740,566 | | | | 39,308 | | | | 47,943,307 | | | | (2,279,162 | ) |
| | | | | | | | | | | | | | | | | |
| Total Increase (Decrease) in Net Assets | | | 3,048,053 | | | | 590,042 | | | | 43,138,791 | | | | (2,328,212 | ) |
| | | | | | | | | | | | | | | | | |
| Net Assets | | | | | | | | | | | | | | | | |
| Beginning of period | | | 48,978,441 | | | | 48,388,399 | | | | 25,177,758 | | | | 27,505,970 | |
| End of period | | $ | 52,026,494 | | | $ | 48,978,441 | | | $ | 68,316,549 | | | $ | 25,177,758 | |
| | | | | | | | | | | | | | | | | |
| Accumulated Net Investment Income | | $ | 1,200,431 | | | $ | 1,125,067 | | | $ | — | | | $ | — | |
| | | | | | | | | | | | | | | | | |
| Share Transactions | | | | | | | | | | | | | | | | |
| Shares issued | | | 201,121 | | | | 114,433 | | | | 331,304 | | | | 208,573 | |
| Shares issued in connection with merger(A) | | | 940,916 | | | | — | | | | 2,199,666 | | | | — | |
| Shares reinvested | | | 111,141 | | | | 119,957 | | | | 212,985 | | | | 169,346 | |
| Shares redeemed | | | (790,074 | ) | | | (228,684 | ) | | | (289,223 | ) | | | (489,406 | ) |
| Change in Shares Outstanding | | | 463,104 | | | | 5,706 | | | | 2,454,732 | | | | (111,487 | ) |
(A) See Note 8 in the Notes to Financial Statements.
See accompanying Notes to Financial Statements.
Statements of Changes in Net Assets (Continued)
| Touchstone | | | Touchstone | | | Touchstone | |
| Large Cap | | | Aggressive ETF | | | Conservative ETF | |
| Core Equity Fund | | | Fund | | | Fund | |
| For the | | | For the | | | For the | | | For the | | | For the | | | For the | |
| Year | | | Year | | | Year | | | Year | | | Year | | | Year | |
| Ended | | | Ended | | | Ended | | | Ended | | | Ended | | | Ended | |
| December 31, | | | December 31, | | | December 31, | | | December 31, | | | December 31, | | | December 31, | |
| 2015 | | | 2014 | | | 2015 | | | 2014 | | | 2015 | | | 2014 | |
| | | | | | | | | | | | | | | | | |
| $ | 266,318 | | | $ | 493,823 | | | $ | 285,419 | | | $ | 357,633 | | | $ | 248,431 | | | $ | 296,783 | |
| | | | | | | | | | | | | | | | | | | | | | | |
| | 7,122,645 | | | | 3,879,113 | | | | 1,266,381 | | | | 2,157,621 | | | | 187,661 | | | | 1,080,102 | |
| | | | | | | | | | | | | | | | | | | | | | | |
| | (9,198,527 | ) | | | 763,086 | | | | (1,523,602 | ) | | | (694,101 | ) | | | (454,186 | ) | | | (118,955 | ) |
| | (1,809,564 | ) | | | 5,136,022 | | | | 28,198 | | | | 1,821,153 | | | | (18,094 | ) | | | 1,257,930 | |
| | | | | | | | | | | | | | | | | | | | | | | |
| | | | | | | | | | | | | | | | | | | | | | | |
| | (493,822 | ) | | | (400,191 | ) | | | (361,574 | ) | | | — | | | | (306,716 | ) | | | (274,617 | ) |
| | — | | | | — | | | | — | | | | (497,508 | ) | | | (1,016,272 | ) | | | (784,671 | ) |
| | (493,822 | ) | | | (400,191 | ) | | | (361,574 | ) | | | (497,508 | ) | | | (1,322,988 | ) | | | (1,059,288 | ) |
| | | | | | | | | | | | | | | | | | | | | | | |
| | | | | | | | | | | | | | | | | | | | | | | |
| | 1,059,387 | | | | 4,865,919 | | | | 817,422 | | | | 481,658 | | | | 1,780,423 | | | | 2,050,088 | |
| | — | | | | — | | | | — | | | | — | | | | — | | | | — | |
| | 493,822 | | | | 400,191 | | | | 361,574 | | | | 497,508 | | | | 1,322,988 | | | | 1,059,288 | |
| | (10,020,029 | ) | | | (6,035,151 | ) | | | (3,877,864 | ) | | | (5,025,802 | ) | | | (5,187,843 | ) | | | (5,989,399 | ) |
| | (8,466,820 | ) | | | (769,041 | ) | | | (2,698,868 | ) | | | (4,046,636 | ) | | | (2,084,432 | ) | | | (2,880,023 | ) |
| | | | | | | | | | | | | | | | | | | | | | | |
| | (10,770,206 | ) | | | 3,966,790 | | | | (3,032,244 | ) | | | (2,722,991 | ) | | | (3,425,514 | ) | | | (2,681,381 | ) |
| | | | | | | | | | | | | | | | | | | | | | | |
| | | | | | | | | | | | | | | | | | | | | | | |
| | 40,664,065 | | | | 36,697,275 | | | | 24,099,088 | | | | 26,822,079 | | | | 23,389,437 | | | | 26,070,818 | |
| $ | 29,893,859 | | | $ | 40,664,065 | | | $ | 21,066,844 | | | $ | 24,099,088 | | | $ | 19,963,923 | | | $ | 23,389,437 | |
| | | | | | | | | | | | | | | | | | | | | | | |
| $ | 266,317 | | | $ | 493,821 | | | $ | 291,861 | | | $ | 361,572 | | | $ | 263,973 | | | $ | 306,714 | |
| | | | | | | | | | | | | | | | | | | | | | | |
| | | | | | | | | | | | | | | | | | | | | | | |
| | 71,856 | | | | 337,520 | | | | 57,574 | | | | 35,204 | | | | 139,139 | | | | 159,895 | |
| | — | | | | — | | | | — | | | | — | | | | — | | | | — | |
| | 34,557 | | | | 26,450 | | | | 25,975 | | | | 35,869 | | | | 110,463 | | | | 82,954 | |
| | (710,137 | ) | | | (438,312 | ) | | | (273,008 | ) | | | (366,951 | ) | | | (408,947 | ) | | | (465,371 | ) |
| | (603,724 | ) | | | (74,342 | ) | | | (189,459 | ) | | | (295,878 | ) | | | (159,345 | ) | | | (222,522 | ) |
Statements of Changes in Net Assets (Continued)
| | | Touchstone | |
| | | Moderate ETF | |
| | | Fund | |
| | | For the | | | For the | |
| | | Year | | | Year | |
| | | Ended | | | Ended | |
| | | December 31, | | | December 31, | |
| | | 2015 | | | 2014 | |
| From Operations | | | | | | | | |
| Net investment income | | $ | 392,942 | | | $ | 526,270 | |
| Net realized gains on investments and capital gain distributions received | | | 1,936,278 | | | | 4,778,001 | |
| Net change in unrealized appreciation (depreciation) on investments | | | (2,307,265 | ) | | | (2,819,344 | ) |
| Change in Net Assets from Operations | | | 21,955 | | | | 2,484,927 | |
| | | | | | | | | |
| Distributions to Shareholders from: | | | | | | | | |
| Net investment income | | | (537,287 | ) | | | (541,213 | ) |
| Net realized gains | | | (3,365,183 | ) | | | — | |
| Total Distributions | | | (3,902,470 | ) | | | (541,213 | ) |
| | | | | | | | | |
| Share Transactions | | | | | | | | |
| Proceeds from Shares issued | | | 1,791,911 | | | | 662,471 | |
| Reinvestment of distributions | | | 3,902,470 | | | | 541,213 | |
| Cost of Shares redeemed | | | (7,090,893 | ) | | | (11,635,023 | ) |
| Change in Net Assets from Share Transactions | | | (1,396,512 | ) | | | (10,431,339 | ) |
| | | | | | | | | |
| Total Decrease in Net Assets | | | (5,277,027 | ) | | | (8,487,625 | ) |
| | | | | | | | | |
| Net Assets | | | | | | | | |
| Beginning of period | | | 33,199,759 | | | | 41,687,384 | |
| End of period | | $ | 27,922,732 | | | $ | 33,199,759 | |
| Accumulated Net Investment Income | | $ | 410,192 | | | $ | 537,284 | |
| | | | | | | | | |
| Share Transactions | | | | | | | | |
| Shares issued | | | 120,115 | | | | 43,663 | |
| Shares reinvested | | | 289,220 | | | | 34,649 | |
| Shares redeemed | | | (458,562 | ) | | | (765,731 | ) |
| Change in Shares Outstanding | | | (49,227 | ) | | | (687,419 | ) |
See accompanying Notes to Financial Statements.
Financial Highlights
| Touchstone Active Bond Fund |
| Selected Data for a Share Outstanding Throughout Each Period |
| | | Year Ended December 31, | |
| | | 2015 | | | 2014 | | | 2013 | | | 2012 | | | 2011 | |
| Net asset value at beginning of period | | $ | 10.49 | | | $ | 10.37 | | | $ | 11.00 | | | $ | 11.09 | | | $ | 10.73 | |
| Income (loss) from investment operations: | | | | | | | | | | | | | | | | | | | | |
| Net investment income | | | 0.19 | | | | 0.20 | | | | 0.22 | | | | 0.29 | | | | 0.37 | (A) |
| Net realized and unrealized gains (losses) on Investments | | | (0.32 | ) | | | 0.20 | | | | (0.46 | ) | | | 0.30 | | | | 0.53 | |
| Total from investment operations | | | (0.13 | ) | | | 0.40 | | | | (0.24 | ) | | | 0.59 | | | | 0.90 | |
| Distributions from: | | | | | | | | | | | | | | | | | | | | |
| Net investment income | | | (0.23 | ) | | | (0.28 | ) | | | (0.34 | ) | | | (0.35 | ) | | | (0.30 | ) |
| Realized capital gains | | | — | | | | — | | | | (0.05 | ) | | | (0.33 | ) | | | (0.24 | ) |
| Total distributions | | | (0.23 | ) | | | (0.28 | ) | | | (0.39 | ) | | | (0.68 | ) | | | (0.54 | ) |
| Net asset value at end of period | | $ | 10.13 | | | $ | 10.49 | | | $ | 10.37 | | | $ | 11.00 | | | $ | 11.09 | |
| Total return(B) | | | (1.28 | )% | | | 3.82 | % | | | (2.18 | )% | | | 5.28 | % | | | 8.45 | % |
| Ratios and supplemental data: | | | | | | | | | | | | | | | | | | | | |
| Net assets at end of period (000's) | | $ | 52,026 | | | $ | 48,978 | | | $ | 48,388 | | | $ | 53,085 | | | $ | 54,509 | |
| Ratio to average net assets: | | | | | | | | | | | | | | | | | | | | |
| Net expenses | | | 0.97 | % | | | 0.98 | % | | | 1.00 | % | | | 1.00 | % | | | 0.93 | % |
| Gross expenses | | | 0.91 | % | | | 1.01 | % | | | 1.05 | % | | | 1.00 | % | | | 0.93 | % |
| Net investment income | | | 2.10 | % | | | 1.92 | % | | | 2.01 | % | | | 2.55 | % | | | 3.29 | % |
| Portfolio turnover rate | | | 455 | %(C) | | | 287 | % | | | 508 | % | | | 404 | % | | | 419 | % |
| Touchstone Focused Fund |
| Selected Data for a Share Outstanding Throughout Each Period |
| | | Year Ended December 31, | |
| | | 2015 | | | 2014 | | | 2013 | | | 2012 | | | 2011 | |
| Net asset value at beginning of period | | $ | 18.64 | | | $ | 18.81 | | | $ | 14.20 | | | $ | 11.84 | | | $ | 13.40 | |
| Income (loss) from investment operations: | | | | | | | | | | | | | | | | | | | | |
| Net investment loss | | | (0.01 | ) | | | (0.08 | ) | | | (0.05 | ) | | | (0.01 | ) | | | (0.09 | ) |
| Net realized and unrealized gains (losses) on investments | | | 0.37 | | | | 2.49 | | | | 4.98 | | | | 2.37 | | | | (1.43 | ) |
| Total from investment operations | | | 0.36 | | | | 2.41 | | | | 4.93 | | | | 2.36 | | | | (1.52 | ) |
| Distributions from: | | | | | | | | | | | | | | | | | | | | |
| Net investment income | | | — | | | | — | | | | — | | | | — | | | | (0.04 | ) |
| Realized capital gains | | | (1.05 | ) | | | (2.58 | ) | | | (0.32 | ) | | | — | | | | — | |
| Total distributions | | | (1.05 | ) | | | (2.58 | ) | | | (0.32 | ) | | | — | | | | (0.04 | ) |
| Net asset value at end of period | | $ | 17.95 | | | $ | 18.64 | | | $ | 18.81 | | | $ | 14.20 | | | $ | 11.84 | |
| Total return(B) | | | 1.97 | % | | | 13.10 | % | | | 34.81 | % | | | 19.93 | % | | | (11.33 | )% |
| Ratios and supplemental data: | | | | | | | | | | | | | | | | | | | | |
| Net assets at end of period (000's) | | $ | 68,317 | | | $ | 25,178 | | | $ | 27,506 | | | $ | 22,242 | | | $ | 20,474 | |
| Ratio to average net assets: | | | | | | | | | | | | | | | | | | | | |
| Net expenses | | | 1.21 | % | | | 1.23 | % | | | 1.26 | % | | | 1.26 | % | | | 1.22 | % |
| Gross expenses | | | 1.32 | % | | | 1.33 | % | | | 1.36 | % | | | 1.31 | % | | | 1.25 | % |
| Net investment loss | | | (0.07 | )% | | | (0.43 | )% | | | (0.32 | )% | | | (0.10 | )% | | | (0.63 | )% |
| Portfolio turnover rate | | | 286 | %(D) | | | 72 | % | | | 77 | % | | | 78 | % | | | 141 | % |
| (A) | The net investment income per share is based on average shares outstanding for the period. |
| (B) | Total returns do not include any insurance, sales or administrative charges of variable annuity or life insurance contracts. If these charges were included, the returns would be lower. |
| (C) | Portfolio turnover excludes the purchases and sales of the Touchstone High Yield Fund acquired on December 7, 2015 (See Note 8 in Notes to Financial Statements). If these transactions were included, portfolio turnover would have been higher. |
| (D) | Portfolio turnover excludes the purchases and sales of the Touchstone Baron Small Cap Growth Fund and Touchstone Third Avenue Value Fund acquired on December 7, 2015 (See Note 8 in Notes to Financial Statements). If these transactions were included, portfolio turnover would have been higher. |
See accompanying Notes to Financial Statements.
Financial Highlights (Continued)
| Touchstone Large Cap Core Equity Fund |
| Selected Data for a Share Outstanding Throughout Each Period |
| | | Year Ended December 31, | |
| | | 2015 | | | 2014 | | | 2013 | | | 2012 | | | 2011 | |
| Net asset value at beginning of period | | $ | 14.90 | | | $ | 13.09 | | | $ | 10.09 | | | $ | 9.15 | | | $ | 9.04 | |
| Income (loss) from investment operations: | | | | | | | | | | | | | | | | | | | | |
| Net investment income | | | 0.18 | | | | 0.18 | | | | 0.17 | | | | 0.17 | | | | 0.12 | (A) |
| Net realized and unrealized gains (losses) on investments | | | (0.77 | ) | | | 1.78 | | | | 3.01 | | | | 0.93 | | | | 0.15 | (B) |
| Total from investment operations | | | (0.59 | ) | | | 1.96 | | | | 3.18 | | | | 1.10 | | | | 0.27 | |
| Distributions from: | | | | | | | | | | | | | | | | | | | | |
| Net investment income | | | (0.24 | ) | | | (0.15 | ) | | | (0.18 | ) | | | (0.16 | ) | | | (0.16 | ) |
| Net asset value at end of period | | $ | 14.07 | | | $ | 14.90 | | | $ | 13.09 | | | $ | 10.09 | | | $ | 9.15 | |
| Total return(C) | | | (4.01 | )% | | | 14.93 | % | | | 31.52 | % | | | 12.07 | % | | | 3.02 | % |
| Ratios and supplemental data: | | | | | | | | | | | | | | | | | | | | |
| Net assets at end of period (000's) | | $ | 29,894 | | | $ | 40,664 | | | $ | 36,697 | | | $ | 32,823 | | | $ | 32,477 | |
| Ratio to average net assets: | | | | | | | | | | | | | | | | | | | | |
| Net expenses | | | 1.06 | % | | | 1.04 | % | | | 1.00 | % | | | 1.00 | % | | | 1.00 | % |
| Gross expenses | | | 1.14 | % | | | 1.16 | % | | | 1.21 | % | | | 1.16 | % | | | 1.13 | % |
| Net investment income | | | 0.73 | % | | | 1.30 | % | | | 1.16 | % | | | 1.40 | % | | | 1.29 | % |
| Portfolio turnover rate | | | 111 | % | | | 41 | % | | | 54 | % | | | 39 | % | | | 33 | % |
| Touchstone Aggressive ETF Fund |
| Selected Data for a Share Outstanding Throughout Each Period |
| | | Year Ended December 31, | |
| | | 2015 | | | 2014 | | | 2013 | | | 2012 | | | 2011 | |
| Net asset value at beginning of period | | $ | 13.98 | | | $ | 13.28 | | | $ | 11.13 | | | $ | 10.07 | | | $ | 10.22 | |
| Income (loss) from investment operations: | | | | | | | | | | | | | | | | | | | | |
| Net investment income | | | 0.22 | | | | 0.21 | | | | 0.13 | | | | 0.26 | | | | 0.16 | |
| Net realized and unrealized gains (losses) on investments | | | (0.23 | ) | | | 0.78 | | | | 2.41 | | | | 1.01 | | | | (0.16 | )(B) |
| Total from investment operations | | | (0.01 | ) | | | 0.99 | | | | 2.54 | | | | 1.27 | | | | — | |
| Distributions from: | | | | | | | | | | | | | | | | | | | | |
| Net investment income | | | (0.24 | ) | | | — | | | | (0.33 | ) | | | (0.21 | ) | | | (0.15 | ) |
| Realized capital gains | | | — | | | | (0.29 | ) | | | (0.06 | ) | | | — | | | | — | |
| Total distributions | | | (0.24 | ) | | | (0.29 | ) | | | (0.39 | ) | | | (0.21 | ) | | | (0.15 | ) |
| Net asset value at end of period | | $ | 13.73 | | | $ | 13.98 | | | $ | 13.28 | | | $ | 11.13 | | | $ | 10.07 | |
| Total return(C) | | | (0.10 | )% | | | 7.49 | % | | | 22.91 | % | | | 12.59 | % | | | (0.05 | )% |
| Ratios and supplemental data: | | | | | | | | | | | | | | | | | | | | |
| Net assets at end of period (000's) | | $ | 21,067 | | | $ | 24,099 | | | $ | 26,822 | | | $ | 13,960 | | | $ | 17,910 | |
| Ratio to average net assets: | | | | | | | | | | | | | | | | | | | | |
| Net expenses(D) | | | 0.75 | % | | | 0.75 | % | | | 0.75 | % | | | 0.75 | % | | | 0.75 | % |
| Gross expenses(D) | | | 0.87 | % | | | 0.87 | % | | | 1.09 | % | | | 1.07 | % | | | 1.04 | % |
| Net investment income(D) | | | 1.26 | % | | | 1.42 | % | | | 1.49 | % | | | 1.56 | % | | | 1.50 | % |
| Portfolio turnover rate | | | 7 | % | | | 12 | % | | | 11 | %(E) | | | 11 | % | | | 40 | % |
| (A) | The net investment income per share is based on average shares outstanding for the period. |
| (B) | The amounts shown for a share outstanding throughout the period does not accord with the change in net realized and unrealized gains (losses) on investments for the period due to the timing of purchases and sales of fund shares in relation to fluctuating market values during the period. |
| (C) | Total returns do not include any insurance, sales or administrative charges of variable annuity or life insurance contracts. If these charges were included, the returns would be lower. |
| (D) | Ratio does not include income and expenses of the underlying funds. |
| (E) | Portfolio turnover excludes the purchases and sales of the Touchstone Enhanced ETF Fund acquired on December 13, 2013. If these transactions were included, portfolio turnover would have been higher. |
See accompanying Notes to Financial Statements.
Financial Highlights (Continued)
Touchstone Conservative ETF Fund
Selected Data for a Share Outstanding Throughout Each Period
| | | Year Ended December 31, | |
| | | 2015 | | | 2014 | | | 2013 | | | 2012 | | | 2011 | |
| Net asset value at beginning of period | | $ | 12.68 | | | $ | 12.61 | | | $ | 12.15 | | | $ | 11.77 | | | $ | 11.60 | |
| Income (loss) from investment operations: | | | | | | | | | | | | | | | | | | | | |
| Net investment income | | | 0.17 | | | | 0.18 | | | | 0.12 | | | | 0.20 | | | | 0.22 | |
| Net realized and unrealized gains (losses) on investments | | | (0.20 | ) | | | 0.48 | | | | 0.91 | | | | 0.59 | | | | 0.18 | |
| Total from investment operations | | | (0.03 | ) | | | 0.66 | | | | 1.03 | | | | 0.79 | | | | 0.40 | |
| Distributions from: | | | | | | | | | | | | | | | | | | | | |
| Net investment income | | | (0.19 | ) | | | (0.15 | ) | | | (0.18 | ) | | | (0.21 | ) | | | (0.23 | ) |
| Realized capital gains | | | (0.62 | ) | | | (0.44 | ) | | | (0.39 | ) | | | (0.20 | ) | | | — | |
| Total distributions | | | (0.81 | ) | | | (0.59 | ) | | | (0.57 | ) | | | (0.41 | ) | | | (0.23 | ) |
| Net asset value at end of period | | $ | 11.84 | | | $ | 12.68 | | | $ | 12.61 | | | $ | 12.15 | | | $ | 11.77 | |
| Total return(A) | | | (0.24 | )% | | | 5.23 | % | | | 8.50 | % | | | 6.74 | % | | | 3.44 | % |
| Ratios and supplemental data: | | | | | | | | | | | | | | | | | | | | |
| Net assets at end of period (000's) | | $ | 19,964 | | | $ | 23,389 | | | $ | 26,071 | | | $ | 23,536 | | | $ | 23,169 | |
| Ratio to average net assets: | | | | | | | | | | | | | | | | | | | | |
| Net expenses(B) | | | 0.75 | % | | | 0.75 | % | | | 0.75 | % | | | 0.75 | % | | | 0.75 | % |
| Gross expenses(B) | | | 0.87 | % | | | 0.89 | % | | | 0.99 | % | | | 1.01 | % | | | 0.99 | % |
| Net investment income(B) | | | 1.13 | % | | | 1.20 | % | | | 1.09 | % | | | 1.58 | % | | | 1.76 | % |
| Portfolio turnover rate | | | 9 | % | | | 13 | % | | | 29 | % | | | 22 | % | | | 28 | % |
Touchstone Moderate ETF Fund
Selected Data for a Share Outstanding Throughout Each Period
| | | Year Ended December 31, | |
| | | 2015 | | | 2014 | | | 2013 | | | 2012 | | | 2011 | |
| Net asset value at beginning of period | | $ | 15.49 | | | $ | 14.72 | | | $ | 12.89 | | | $ | 11.96 | | | $ | 11.99 | |
| Income (loss) from investment operations: | | | | | | | | | | | | | | | | | | | | |
| Net investment income | | | 0.21 | | | | 0.31 | | | | 0.23 | | | | 0.27 | | | | 0.21 | |
| Net realized and unrealized gains (losses) on investments | | | (0.24 | ) | | | 0.72 | | | | 1.87 | | | | 0.92 | | | | 0.01 | |
| Total from investment operations | | | (0.03 | ) | | | 1.03 | | | | 2.10 | | | | 1.19 | | | | 0.22 | |
| Distributions from: | | | | | | | | | | | | | | | | | | | | |
| Net investment income | | | (0.27 | ) | | | (0.26 | ) | | | (0.27 | ) | | | (0.26 | ) | | | (0.25 | ) |
| Realized capital gains | | | (1.86 | ) | | | — | | | | — | | | | — | | | | — | |
| Total distributions | | | (2.13 | ) | | | (0.26 | ) | | | (0.27 | ) | | | (0.26 | ) | | | (0.25 | ) |
| Net asset value at end of period | | $ | 13.33 | | | $ | 15.49 | | | $ | 14.72 | | | $ | 12.89 | | | $ | 11.96 | |
| Total return(A) | | | (0.18 | )% | | | 6.96 | % | | | 16.32 | % | | | 9.94 | % | | | 1.84 | % |
| Ratios and supplemental data: | | | | | | | | | | | | | | | | | | | | |
| Net assets at end of period (000's) | | $ | 27,923 | | | $ | 33,200 | | | $ | 41,687 | | | $ | 42,228 | | | $ | 45,165 | |
| Ratio to average net assets: | | | | | | | | | | | | | | | | | | | | |
| Net expenses(B) | | | 0.75 | % | | | 0.75 | % | | | 0.75 | % | | | 0.75 | % | | | 0.75 | % |
| Gross expenses(B) | | | 0.80 | % | | | 0.79 | % | | | 0.92 | % | | | 0.92 | % | | | 0.91 | % |
| Net investment income(B) | | | 1.30 | % | | | 1.41 | % | | | 1.29 | % | | | 1.74 | % | | | 1.73 | % |
| Portfolio turnover rate | | | 9 | % | | | 11 | % | | | 9 | % | | | 9 | % | | | 17 | % |
| (A) | Total returns do not include any insurance, sales or administrative charges of variable annuity or life insurance contracts. If these charges were included, the returns would be lower. |
| (B) | Ratio does not include income and expenses of the underlying funds. |
See accompanying Notes to Financial Statements.
Notes to Financial Statements
December 31, 2015
1. Organization
The Touchstone Variable Series Trust (the “Trust”) is registered under the Investment Company Act of 1940, as amended (the “1940 Act”), as an open-end management investment company. The Trust was established as a Massachusetts business trust pursuant to an Agreement and Declaration of Trust dated February 7, 1994. The Trust consists of the following six funds (individually, a “Fund”, and collectively, the “Funds”):
Touchstone Active Bond Fund (“Active Bond Fund”)
Touchstone Focused Fund (“Focused Fund”) ( formerly known as Touchstone Mid Cap Growth Fund)
Touchstone Large Cap Core Equity Fund (“Large Cap Core Equity Fund”)
Touchstone Aggressive ETF Fund (“Aggressive ETF Fund”)
Touchstone Conservative ETF Fund (“Conservative ETF Fund”)
Touchstone Moderate ETF Fund (“Moderate ETF Fund”)
Each Fund is diversified with the exception of the Focused Fund and the Large Cap Core Equity Fund which are non-diversified.
The Agreement and Declaration of Trust permits the Trust to issue an unlimited number of shares of beneficial interest of each Fund. Shares of beneficial interest of each Fund are available as a funding vehicle for the separate accounts of life insurance companies issuing variable annuity and variable life insurance policies. As of December 31, 2015, outstanding shares were issued to separate accounts of Western-Southern Life Assurance Company, The Western & Southern Life Insurance Company, Integrity Life Insurance Company, National Integrity Life Insurance Company, and Columbus Life Insurance Company, which are all part of Western & Southern Financial Group, Inc. (“Western & Southern”), and the majority of the outstanding shares of the Trust were collectively owned by affiliates of Western & Southern and certain supplemental executive retirement plans sponsored by Western & Southern and its affiliates.
All Funds offer a single class of shares. The assets of each Fund are segregated, and a shareholder’s interest is limited to the Fund in which shares are held. The Funds’ prospectus provides a description of each Fund’s investment goals, policies, and strategies along with information on the class of shares currently being offered.
2. Significant Accounting Policies
The following is a summary of the Funds’ significant accounting policies:
Each Fund is an investment company that follows the accounting and reporting guidance of Accounting Standards Codification Topic 946 applicable to investment companies.
Security valuation and fair value measurements — U.S. generally accepted accounting principles (“U.S. GAAP”) define fair value as the price the Funds would receive to sell an asset or pay to transfer a liability in an orderly transaction between market participants at the measurement date. All investments in securities are recorded at their estimated fair value. The Funds define the term “market value”, as used throughout this report, as the estimated fair value. The Funds use various methods to measure fair value of their portfolio securities on a recurring basis. U.S. GAAP fair value measurement standards require disclosure of a hierarchy that prioritizes inputs to valuation methods. These inputs are summarized in the three broad levels listed below:
| · | Level 1 | – | quoted prices in active markets for identical securities |
| · | Level 2 | – | other significant observable inputs (including quoted prices for similar securities, interest rates, prepayment speeds, credit risk, etc.) |
| · | Level 3 | – | significant unobservable inputs (including a Fund’s own assumptions in determining the fair value of investments) |
Notes to Financial Statements (Continued)
The inputs or methodology used for valuing securities are not necessarily an indication of the risk associated with investing in those securities.
The aggregate value by input level, as of December 31, 2015, for each Fund’s investments, as well as a reconciliation of assets for which significant unobservable inputs (Level 3) were used in determining value, if applicable, is included in the Funds’ Portfolio of Investments, which also includes a breakdown of the Funds’ investments by portfolio or sector allocation. The Funds did not hold any Level 3 categorized securities during the year ended December 31, 2015.
Changes in valuation techniques may result in transfers into or out of an investment’s assigned level within the hierarchy. All transfers in and out of the levels are recognized at the value at the end of the period. During the year ended December 31, 2015, there were no transfers between Levels 1, 2 and 3 for all Funds.
The Funds’ portfolio securities are valued as of the close of the regular session of trading on the New York Stock Exchange (“NYSE”) (currently 4:00 p.m., Eastern time). Portfolio securities traded on stock exchanges are valued at the last reported sale price, official close price, or last bid price if no sales are reported. Portfolio securities quoted by NASDAQ are valued at the NASDAQ Official Closing Price (“NOCP”) or from the primary exchange on which the security trades. To the extent these securities are actively traded, they are categorized in Level 1 of the fair value hierarchy. Shares of open-end mutual funds in which the Funds invest are valued at their respective net asset values (“NAV”) as reported by the underlying funds and are categorized in Level 1.
Debt securities held by the Funds are valued at their evaluated bid by an independent pricing service or at their last broker-quoted bid prices as obtained from one or more of the major market makers for such securities. Independent pricing services use information provided by market makers or estimates of market values through accepted market modeling conventions. Inputs to the models may include prepayment speeds, pricing spread, yield, trade information, dealer quotes, market color, cash flow models, the securities’ terms and conditions, among others, and are generally categorized in Level 2. Debt securities with remaining maturities of 60 days or less may be valued at amortized cost, provided such amount approximates market value and are categorized in Level 2. While this method provides consistency in valuation (and may only be used if it approximates market value), it may result in periods during which value, as determined by amortized cost, is higher or lower than the price that would be received if the Fund sold the investment.
Securities mainly traded on a non-U.S. exchange or denominated in foreign currencies are generally valued according to the preceding closing values on that exchange, translated to U.S. dollars using currency exchange rates as of the close of regular trading on the NYSE, and generally categorized in Level 1. However, if an event that may change the value of a security occurs after the time that the closing value on the non-U.S. exchange was determined, but before the close of regular trading on the NYSE, the security may be priced based on fair value and generally categorized in Level 2. This may cause the value of the security, if held on the books of a Fund to be different from the closing value on the non-U.S. exchange and may affect the calculation of that Fund’s NAV.
The Funds may use fair value pricing under the following circumstances, among others:
| · | If the value of a security has been materially affected by events occurring before the Funds’ pricing time but after the close of the primary markets on which the security is traded. |
| · | If the exchange on which a portfolio security is principally traded closes early or if trading in a particular portfolio security was halted during the day and did not resume prior to the Funds’ NAV calculation. |
| · | If a security is so thinly traded that reliable market quotations are unavailable due to infrequent trading. |
| · | If the validity of market quotations is not reliable. |
Notes to Financial Statements (Continued)
Securities held by the Funds that do not have readily available market quotations, significant observable inputs, or securities for which the available market quotations are not reliable, are priced at their estimated fair value using procedures approved by the Funds’ Board of Trustees and are generally categorized in Level 3.
Investment companies — Certain Funds may invest in securities of other investment companies, including exchange-traded funds (“ETFs”), open-end funds and closed-end funds. Open-end funds are investment companies that issue new shares continuously and redeem shares daily. Closed-end funds are investment companies that typically issue a fixed number of shares that trade on a securities exchange or over-the-counter. An ETF is an investment company that typically seeks to track the performance of an index by holding in its portfolio shares of all the companies, or a representative sample of the companies, that are components of a particular index. ETF shares are traded on a securities exchange based on their market value. The risks of investment in other investment companies typically reflect the risks of the types of securities in which the other investment companies invest. Investments in ETFs and closed-end funds are subject to the additional risk that their shares may trade at a premium or discount to their NAV. When a Fund invests in another investment company, shareholders of the Fund indirectly bear their proportionate share of the other investment company’s fees and expenses, including operating, registration, trustee, licensing, and marketing, as well as their share of the Fund’s fees and expenses.
Futures Contracts — The Active Bond Fund may buy and sell futures contracts and related options to manage its exposure to changing interest rates and securities prices. Some strategies reduce the Fund’s exposure to price fluctuations, while others tend to increase its market exposure. Futures and options on futures can be volatile instruments and involve certain risks that could negatively impact the Fund’s return. In order to avoid leveraging and related risks, when the Fund purchases futures contracts, it will collateralize its position by depositing an amount of cash or liquid securities, equal to the market value of the futures positions held, less margin deposits, in a segregated account with its custodian or otherwise “cover” its position in a manner consistent with the 1940 Act, or the rules of the Securities and Exchange Commission (the “SEC”) or interpretations there under. Collateral equal to the current market value of the futures position will be marked to market on a daily basis.
When the contract is closed, the Fund records a realized gain or loss equal to the difference between the proceeds from (or cost of ) the closing transactions and the Fund’s basis in the contract. Risks of entering into futures contracts include the possibility that a change in the value of the contract may not correlate with the changes in the value of the underlying instruments. Second, it is possible that a lack of liquidity for futures contracts could exist in the secondary market resulting in an inability to close a futures position prior to its maturity date. Third, the purchase of a futures contract involves the risk that the Fund could lose more than the original margin deposit required to initiate the futures transaction. Finally, the risk exists that losses could exceed amounts disclosed on the Statements of Assets and Liabilities. There is minimal counterparty credit risk involved in entering into futures contracts since they are exchange-traded instruments and the exchange’s clearinghouse, as counterparty to all exchange-traded futures, guarantees the futures against default. As of December 31, 2015, Active Bond Fund did not hold any futures contracts.
Swap Contracts — The Active Bond Fund may enter into swap transactions, which are financial instruments that typically involve the exchange of cash flows between two parties on specified dates (settlement dates), where the cash flows are based on agreed-upon prices, rates, indexes, etc. The nominal amount on which the cash flows are calculated is called the notional amount. Swaps are individually negotiated and structured to include exposure to a variety of different types of investments or market factors, such as interest rates, foreign currency rates, mortgage securities, corporate borrowing rates, security prices, indexes or inflation rates.
Swap agreements may increase or decrease the overall volatility of the investments of the Fund and its share price. The performance of swap agreements may be affected by a change in the specific interest rate, currency, or other factors that determine the amounts of payments due to and from the Fund. If a swap agreement calls
Notes to Financial Statements (Continued)
for payments by the Fund, the Fund must be prepared to make such payments when due. In addition, if the counterparty’s creditworthiness declines, the value of a swap agreement would be likely to decline, potentially resulting in losses.
Generally, bilateral swap agreements have a fixed maturity date that will be agreed upon by the parties. The agreement can be terminated before the maturity date only under limited circumstances, such as default by one of the parties or insolvency, among others, and can be transferred by a party only with the prior written consent of the other party. The Fund may be able to eliminate its exposure under a swap agreement either by assignment or by other disposition, or by entering into an offsetting swap agreement with the same party or a similarly creditworthy party. If the counter-party is unable to meet its obligations under the contract, declares bankruptcy, defaults or becomes insolvent, the Fund may not be able to recover the money it expected to receive under the contract.
Centrally cleared swaps are transacted through futures commission merchants that are members of central clearinghouses with the clearinghouses servicing as a central counterparty. Pursuant to rules promulgated under the Dodd-Frank Act, central clearing of swap agreements is currently required for certain market participants trading certain instruments, and central clearing for additional instruments is expected to be implemented by regulators until the majority of the swaps market is ultimately subject to central clearing. For swaps that are centrally cleared, initial margins are posted, and daily changes in fair value are recorded as a payable or receivable on the Statements of Assets and Liabilities as “Receivable/Payable for variation margin on swap agreements” and settled daily. Initial margin is determined by each relevant clearing agency and is segregated at a broker account registered with the CFTC, or the applicable regulator.
A swap agreement can be a form of leverage, which can magnify the Fund’s gains or losses. In order to reduce the risk associated with leveraging, the Fund may cover its current obligations under swap agreements according to guidelines established by the SEC. If the Fund enters into a swap agreement on a net basis, it will segregate assets with a daily value at least equal to the excess, if any, of the Fund’s accrued obligations under the swap agreement over the accrued amount the Fund is entitled to receive under the agreement. If the Fund enters into a swap agreement on other than a net basis, it will segregate assets with a value equal to the full amount of the Fund’s accrued obligations under the agreement.
Swaps other than security-based swaps are included in the definition of “commodity interests” under the Commodity Exchange Act (the “CEA”). Under recent amendments to Rule 4.5 under the CEA, the Fund may be considered a commodity pool if it trades more than a de minimis amount of commodity interests (including swaps). Under such circumstances, the Fund and its investment advisor may be subject to regulation by the Commodity Futures Trading Commission (“CFTC”). The Fund does not intend to trade above the de minimis limitation, and the Active Bond Fund’s investment advisor has claimed an exemption from registering with the CFTC as a commodity pool operator and an exemption from registering with the CFTC as a commodity trading advisor. In addition, the Fund’s investment sub-advisor has also claimed an exemption from registering with CFTC as a commodity trading advisor.
As of December 31, 2015, the Active Bond Fund held a swap agreement with an unrealized depreciation of $46,707 and had cash in the amount of $133,043 held as collateral for the swap agreement.
Foreign currency translation — The books and records of the Funds are maintained in U.S. dollars and translated into U.S. dollars on the following basis:
| (1) | market value of investment securities, assets and liabilities at the current rate of exchange on the valuation date; and |
| (2) | purchases and sales of investment securities, income, and expenses at the relevant rates of exchange prevailing on the respective dates of such transactions. |
Notes to Financial Statements (Continued)
The Funds do not isolate that portion of gains and losses on investments in equity securities that is due to changes in the foreign exchange rates from that which is due to changes in market prices of equity securities.
Real Estate Investment Trusts — The Funds may invest in real estate investment trusts (“REITs”) that involve risks not associated with investing in stocks. Risks include declines in the value of real estate, general and economic conditions, changes in the value of the underlying property and defaults by borrowers. The value of assets in the real estate industry may go through cycles of relative underperformance and outperformance in comparison to equity securities markets in general. Dividend income is recorded using management’s estimate of the income included in distributions received from REIT investments. The actual amounts of income, return of capital and capital gains are only determined by each REIT after its fiscal year-end and may differ from the estimated amount. Estimates of income are adjusted in the Funds to the actual amounts when the amounts are determined.
Derivative instruments and hedging activities — The Active Bond Fund may enter into an International Swaps and Derivatives Association, Inc. Master Agreement (“ISDA Master Agreement” or “MNA”) or similar agreement with certain counterparties. An ISDA Master Agreement is a bilateral agreement between the Fund and a counterparty that governs over-the-counter (“OTC”) derivatives and foreign exchange contracts, and typically contains, among other things, collateral posting terms and master netting provisions in the event of a default or termination. Under an ISDA Master Agreement, a party may, under certain circumstances, offset with the counterparty certain derivative financial instrument’s payables or receivables with collateral held or posted and create one single net payment. The provisions of the ISDA Master Agreement typically permit a single net payment in the event of default (close-out netting). These default events include bankruptcy or insolvency of the counterparty. Note, however, that bankruptcy or insolvency laws of a particular jurisdiction may impose restrictions on or prohibitions against the right of offset.
When entering into a derivative transaction, the Fund may be required to post and maintain collateral or margin (including both initial and maintenance margin). Collateral and margin requirements differ by type of derivative. Margin requirements are established by the broker or clearing house for exchange traded and centrally cleared derivatives (financial futures contracts, options, and centrally cleared swaps). Brokers can ask for margining in excess of the clearing house’s minimum in certain circumstances. Collateral terms are contract specific for OTC derivatives (foreign currency exchange contracts, options, and swaps). For derivatives traded under an ISDA Master Agreement, the collateral requirements are typically calculated by netting the marked-to-market amount for each transaction under such agreement and comparing that amount to the value of any collateral currently pledged by the Fund and the counterparty. For financial reporting purposes, cash collateral that has been pledged to cover obligations of the Fund and cash collateral received from the counterparty, if any, is reported separately on the Statements of Assets and Liabilities as cash pledged as collateral and cash received as collateral, respectively. Non-cash collateral pledged by the Fund, if any, is noted in the Portfolio of Investments. To the extent amounts due to the Fund from its counterparties are not fully collateralized, contractually or otherwise, the Fund bears the risk of loss from counterparty non-performance.
Certain ISDA Master Agreements allow counterparties to OTC derivatives transactions to terminate derivative contracts prior to maturity in the event the Fund’s net assets decline by a stated percentage or the Fund fails to meet the terms of its ISDA Master Agreement, which would cause the Fund (counterparty) to accelerate payment of any net liability owed to the counterparty (Fund).
For financial reporting purposes, the Active Bond Fund does not offset derivative assets and derivative liabilities that are subject to netting arrangements in the Statements of Assets and Liabilities.
As of December 31, 2015, the Funds did not have any assets and liabilities that were subject to netting arrangements in the Statements of Assets and Liabilities.
Notes to Financial Statements (Continued)
The following table sets forth the fair value of the Active Bond Fund’s derivative financial instruments by primary risk exposure as of December 31, 2015:
| Fair Value of Derivative Investments |
| As of December 31, 2015 |
| | | Derivatives not accounted for as hedging | | Asset | | | Liability | |
| Fund | | instruments under ASC 815 | | Derivatives | | | Derivatives | |
| Active Bond Fund | | Swap Agreements - Credit Contracts* | | $ | 1,501 | | | $ | — | |
| * | Statements of Assets and Liabilities Location: Receivable for variation margin on swap agreements. Unrealized appreciation (depreciation) reported in the Portfolio of Investments and other tables in the Notes to the Financial Statements is the cumulative unrealized appreciation (depreciation). |
The following table sets forth the operations of the Active Bond Fund’s derivative financial instruments by primary risk exposure for the year ended December 31, 2015:
| The Effect of Derivative Investments on the Statements of Operations |
| for the Year Ended December 31, 2015 |
| | | | | | | | Change in | |
| | | | | | | | Unrealized | |
| | | | | Realized Gain | | | Appreciation | |
| | | Derivatives not accounted for as hedging | | (Loss) | | | (Depreciation) | |
| Fund | | instruments under ASC 815 | | on Derivatives | | | on Derivatives | |
| Active Bond Fund | | Futures - Interest Rate Contracts* | | $ | (1,067 | ) | | $ | — | |
| | | Swap Agreements - Credit Contracts** | | | 44,805 | | | | (46,707 | ) |
| * | Statements of Operations Location: Net realized loss on futures contracts. |
| ** | Statements of Operations Location: Net realized gain on swap agreements and net change in unrealized appreciation (depreciation) on swap agreements. |
For the year ended December 31, 2015, the average quarterly notional value of derivative financial instruments were as follows:
| | | Active | |
| | | Bond | |
| | | Fund | |
| Interest rate contracts: | | | | |
| Futures Contracts* | | $ | — | |
| Credit contracts: | | | | |
| Credit Default Swaps | | $ | 960,000 | |
| * | The balance at each quarter end was zero. |
Portfolio securities loaned — The Funds may lend their portfolio securities. Lending portfolio securities exposes the Funds to the risk that the borrower may fail to return the loaned securities or may not be able to provide additional collateral or that the Funds may experience delays in recovery of the loaned securities or loss of rights in the collateral if the borrower fails financially. To minimize these risks, the borrower must agree to maintain cash collateral with the Funds’ custodian. The loaned securities are secured by collateral valued at least equal, at all times, to the market value of the loaned securities plus accrued interest, if any. When the collateral falls below specified amounts the lending agent will use its best effort to obtain additional collateral on the next business day to meet required amounts under the security lending agreement. The cash collateral is reinvested by the Funds’ custodian into an approved investment vehicle. The approved investment vehicle is subject to market risk.
Notes to Financial Statements (Continued)
As of December 31, 2015, the following Funds loaned securities and received collateral as follows:
| | | | | Market | | | Market | | | | |
| | | | | Value of | | | Value of | | | | |
| | | | | Securities | | | Collateral | | | | |
| Fund | | Security Type | | Loaned* | | | Received** | | | Net Amount | |
| Active Bond Fund | | Corporate Bonds | | $ | 516,488 | | | $ | 534,600 | | | $ | 18,112 | |
| Focused Fund | | Common Stock | | | 1,486,082 | | | | 1,531,160 | | | | 45,078 | |
| Aggressive ETF Fund | | Exchange Traded Funds | | | 2,185,931 | | | | 2,254,624 | | | | 68,693 | |
| Conservative ETF Fund | | Exchange Traded Funds | | | 467,222 | | | | 481,842 | | | | 14,620 | |
| Moderate ETF Fund | | Exchange Traded Funds | | | 2,206,768 | | | | 2,275,950 | | | | 69,182 | |
* The remaining contractual maturity is overnight for all securities.
** Gross amounts of recognized liabilities for securities lending are included in the Statements of Assets and Liabilities.
All cash collateral is received, held, and administered by the Funds’ custodian for the benefit of the lending Fund in its custody account or other account established for the purpose of holding collateral.
Funds participating in securities lending receive compensation in the form of fees. Securities lending income is derived from lending long securities from the Funds to creditworthy approved borrowers at rates that are determined based on daily trading volumes, float, short-term interest rates and market liquidity. When a Fund lends securities, it retains the interest or dividends on the investment of any cash received as collateral, and the Fund continues to receive interest or dividends on the loaned securities.
Unrealized gain or loss on the market value of the loaned securities that may occur during the term of the loan is recognized by the Fund. The Fund has the right under the lending agreement to recover any loaned securities from the borrower on demand.
When-issued or delayed delivery transactions — Each Fund may purchase or sell securities on a when-issued or delayed delivery basis. These transactions involve a commitment by the Fund to purchase or sell securities for a predetermined price or yield, with payment and delivery taking place beyond the customary settlement period. When delayed delivery purchases are outstanding, the Fund will set aside liquid assets in an amount sufficient to meet the purchase price. When purchasing a security on a delayed delivery basis, the Fund assumes the rights and risks of ownership of the security, including the risk of price and yield fluctuations, and takes such fluctuations into account when determining NAV. The Fund may dispose of or renegotiate a delayed delivery transaction after it is entered into, and may sell when-issued securities before they are delivered, which may result in a capital gain or loss. When the Fund has sold a security on a delayed delivery basis, the Fund does not participate in future gains and losses with respect to the security.
Share valuation — The NAV per share of each Fund is calculated daily by dividing the total value of a Fund’s assets, less liabilities, by its number of outstanding shares.
Investment income — Dividend income from securities is recognized on the ex-dividend date, net of foreign withholding taxes, if any, which are reduced by any amounts reclaimable by the Funds, where applicable. Interest income from securities is recorded on the basis of interest accrued, premium amortized and discount accreted. Realized gains and losses resulting from principal paydowns on mortgage-backed and asset-backed securities are included in interest income.
Distributions to shareholders — Each Fund intends to distribute to its shareholders substantially all of its income and capital gains. Each Fund declares and distributes net investment income, if any, annually as a dividend to shareholders. Each Fund makes distributions of capital gains, if any, at least annually, net of applicable capital loss carryforwards. Income distributions and capital gain distributions are determined in accordance with income tax regulations. Recognition of the Funds’ net investment income from investments in underlying funds is affected by the timing of dividend declarations by underlying funds.
Notes to Financial Statements (Continued)
Allocations — Expenses not directly billed to a Fund are allocated proportionally among all the Funds in the Trust, and, if applicable, Touchstone Funds Group Trust, Touchstone Institutional Funds Trust, Touchstone Investment Trust, Touchstone Strategic Trust,and Touchstone Tax-Free Trust (collectively with the Trust, “Touchstone Fund Complex”), daily in relation to net assets of each Fund or another reasonable measure.
Security transactions — Security transactions are reflected for financial reporting purposes as of the trade date. Realized gains and losses on sales of portfolio securities are calculated using the identified cost basis.
Estimates — The preparation of financial statements in conformity with U.S. GAAP requires management to make estimates and assumptions that affect the reported amounts of assets and liabilities and disclosure of contingent assets and liabilities at the date of the financial statements and the reported amounts of income and expenses during the reporting period. Actual results could differ from those estimates.
3. Investment Transactions
Investment transactions (excluding short-term investments and U.S. Government securities) were as follows for the year ended December 31, 2015:
| | | | | | | | | Large Cap | |
| | | Active Bond | | | Focused | | | Core Equity | |
| | | Fund* | | | Fund* | | | Fund | |
| Purchases of investment securities | | $ | 17,982,582 | | | $ | 79,091,025 | | | $ | 39,229,794 | |
| Proceeds from sales and maturities | | $ | 19,657,146 | | | $ | 78,613,813 | | | $ | 47,313,098 | |
| | | Aggressive | | | Conservative | | | Moderate | |
| | | ETF Fund | | | ETF Fund | | | ETF Fund | |
| Purchases of investment securities | | $ | 1,655,416 | | | $ | 1,974,834 | | | $ | 2,616,671 | |
| Proceeds from sales and maturities | | $ | 4,383,617 | | | $ | 5,073,298 | | | $ | 7,443,995 | |
* The cost of purchases and proceeds from sales and maturities in the Active Bond Fund and the Focused Fund excludes the purchases and sales of the Touchstone High Yield Fund for the Active Bond Fund and the Touchstone Baron Small Cap Growth Fund and the Touchstone Third Avenue Value Fund for the Focused Fund. If these transactions were included, purchases and sales would have been higher.
For the year ended December 31, 2015, purchases and proceeds from sales and maturities in U.S. Government Securities were $188,438,011 and $192,897,348, respectively, for the Active Bond Fund.
4. Transactions with Affiliates and Other Related Parties
Certain officers of the Trust are also officers of Touchstone Advisors, Inc. (the “Advisor”), Touchstone Securities, Inc. (the “Underwriter”) or BNY Mellon Investment Servicing (U.S.) Inc. (“BNY Mellon”), the Sub-Administrator and Transfer Agent to the Funds. Such officers receive no compensation from the Trust. The Advisor and the Underwriter are each wholly-owned, indirect subsidiaries of Western & Southern.
On behalf of the Funds, the Advisor pays each Independent Trustee a quarterly retainer plus additional retainers to the Lead Independent Trustee and the chairs of each standing committee. Interested Trustees do not receive compensation from the Funds. Each Independent Trustee also receives compensation for each board meeting and committee meeting attended. Each standing committee chair receives additional compensation for each committee meeting that he or she oversees. The Advisor is reimbursed by the Funds for the Independent Trustees’ compensation and out-of-pocket expenses relating to their services. The Funds accrued Trustee-related expenses of $85,212 for the year ended December 31, 2015.
MANAGEMENT & EXPENSE LIMITATION AGREEMENTS
The Advisor provides general investment supervisory services for the Funds, under terms of an advisory agreement (the “Advisory Agreement”). Under the Advisory Agreement, each Fund pays the Advisor a fee, which is computed
Notes to Financial Statements (Continued)
and accrued daily and paid monthly, at an annual rate based on average daily net assets of each Fund as shown in the table below.
| Active Bond Fund* | 0.40% on the first $300 million |
| | 0.35% on such assets over $300 million |
| Focused Fund** | 0.70% on the first $100 million |
| | 0.65% on the next $400 million |
| | 0.60% on such assets over $500 million |
| Large Cap Core Equity Fund | 0.65% on the first $100 million |
| | 0.60% on the next $100 million |
| | 0.55% on the next $100 million |
| | 0.50% on such assets over $300 million |
| Aggressive ETF Fund | 0.25% on the first $50 million |
| Conservative ETF Fund | 0.23% on the next $50 million |
| Moderate ETF Fund | 0.20% on such assets over $100 million |
* Prior to March 1, 2015, the Fund paid 0.55% on the first $100 million, 0.50% on the next $100 million, 0.45% on the next $100 million and 0.40% on such assets over $300 million.
** Prior to August 31, 2015, the Fund paid 0.75% on the first $500 million, 0.70% on the next $500 million and 0.65% on such assets over $1 billion.
The Advisor has entered into investment sub-advisory agreements with the following parties (each, a “Sub-Advisor”):
| Fort Washington Investment Advisors, Inc.* | Todd Asset Management, LLC |
| Active Bond Fund | Aggressive ETF Fund |
| Focused Fund** | Conservative ETF Fund |
| | Moderate ETF Fund |
The London Company
Large Cap Core Equity Fund***
* Affiliate of the Advisor and wholly-owned indirect subsidiary of Western & Southern.
** Effective August 31, 2015, Fort Washington Investment Advisors, Inc. became the sub-advisor of the Focused Fund; prior to August 31, 2015, Westfield Capital Management Company, L.P. was the sub-advisor.
*** Effective December 1, 2015, The London Company became the sub-advisor of the Large Cap Core Equity Fund; between September 1, 2015 and December 1, 2015, Russell Implementation Services was the interim sub-advisor; prior to September 1, 2015,Todd Asset Management, LLC was the sub-advisor.
The Advisor, not the Funds, pays sub-advisory fees to each Sub-Advisor.
The Advisor entered into an expense limitation agreement (the “Expense Limitation Agreement”) to contractually limit the annual operating expenses of the Funds, excluding: dividend and interest expenses relating to short sales; interest; taxes; brokerage commissions and other transaction costs; portfolio transactions and investment related expenses; other expenditures which are capitalized in accordance with U.S. GAAP; the cost of “Acquired Fund Fees and Expenses”, if any; and other extraordinary expenses not incurred in the ordinary course of business. The maximum annual operating expense limit in any year with respect to the Funds is based on a percentage of the average daily net assets of the Funds. The Advisor has agreed to separately waive advisory fees and administration fees, and to reimburse expenses in order to maintain the following expense limitations for the Funds:
| Fund | | | |
| Active Bond Fund | | | 0.97 | % |
| Focused Fund | | | 1.21 | % |
| Large Cap Core Equity Fund | | | 1.06 | % |
| Aggressive ETF Fund | | | 0.75 | % |
| Conservative ETF Fund | | | 0.75 | % |
| Moderate ETF Fund | | | 0.75 | % |
Notes to Financial Statements (Continued)
These expense limitations will remain in effect for all Funds through at least April 29, 2016, except for Active Bond Fund, Focused Fund and Large Cap Core Equity Fund which will remain in effect through April 29, 2017.
During the year ended December 31, 2015, the Advisor or its affiliates waived investment advisory fees and administration fees or reimbursed expenses, of the Funds as follows:
| | | Investment | | | Administration | | | Shareholder | | | | |
| | | Advisory | | | Fees | | | Servicing | | | | |
| Fund | | Fees Waived | | | Waived | | | Fees Waived | | | Total | |
| Focused Fund | | $ | — | | | $ | 31,787 | | | $ | — | | | $ | 31,787 | |
| Large Cap Core Equity Fund | | | — | | | | 29,291 | | | | — | | | | 29,291 | |
| Aggressive ETF Fund | | | — | | | | 26,742 | | | | — | | | | 26,742 | |
| Conservative ETF Fund | | | — | | | | 27,107 | | | | — | | | | 27,107 | |
| Moderate ETF Fund | | | — | | | | 16,482 | | | | — | | | | 16,482 | |
Under the terms of the Expense Limitation Agreement, the Advisor is entitled to recover, subject to approval by the Funds’ Board, such amounts waived or reimbursed for a period of up to three years from the year in which the Advisor reduced its compensation or assumed expenses for the Funds. No recoupment will occur unless a Fund’s operating expenses are below the expense limitation amount in effect of the time of waiver or reimbursement.
As of December 31, 2015, the Advisor may seek recoupment of previously waived fees and reimbursed expenses as follows:
| | | Expiration | | | Expiration | | | Expiration | | | | |
| | | December 31, | | | December 31, | | | December 31, | | | | |
| Fund | | 2016 | | | 2017 | | | 2018 | | | Total | |
| Active Bond Fund | | $ | — | | | $ | 11,946 | | | $ | — | | | $ | 11,946 | |
| Focused Fund | | | 25,785 | | | | 26,747 | | | | 31,787 | | | | 84,319 | |
| Large Cap Core Equity Fund | | | 67,964 | | | | 44,995 | | | | 29,291 | | | | 142,250 | |
| Aggressive ETF Fund | | | 30,620 | | | | 29,635 | | | | 26,742 | | | | 86,997 | |
| Conservative ETF Fund | | | 50,398 | | | | 33,583 | | | | 27,107 | | | | 111,088 | |
| Moderate ETF Fund | | | 72,057 | | | | 15,299 | | | | 16,482 | | | | 103,838 | |
For the year ended December 31, 2015, the Advisor recouped previously waived fees or reimbursed expenses from the Active Bond Fund of $29,901.
ADMINISTRATION AGREEMENT
The Advisor entered into an Administration Agreement with the Trust, whereby the Advisor is responsible for: supplying executive and regulatory compliance services; supervising the preparation of tax returns; coordinating the preparation of reports to shareholders and reports to, and filings with, the Securities and Exchange Commission (the “SEC”) and state securities authorities, as well as materials for meetings of the Board; calculating the daily NAV per share; and maintaining the financial books and records of each Fund.
For its services, the Advisor’s annual administrative fee is:
0.145% on the first $20 billion of the aggregate average daily net assets;
0.11% on the next $10 billion of aggregate average daily net assets;
0.09% on the next $10 billion of aggregate average daily net assets; and
0.07% on the aggregate average daily net assets over $40 billion.
The fee is computed and allocated among the Touchstone Fund Complex (excluding Touchstone Institutional Funds Trust) on the basis of relative daily net assets.
Notes to Financial Statements (Continued)
The Advisor has engaged BNY Mellon as the Sub-Administrator to the Trust. BNY Mellon provides administrative and accounting services to the Trust and is compensated directly by the Advisor, not the Trust.
TRANSFER AGENT AGREEMENT
Under the terms of the Transfer Agent Agreement between the Trust and BNY Mellon, BNY Mellon maintains the records of each shareholder’s account, answers shareholders’ inquiries concerning their accounts, processes purchases and redemptions of each Fund’s shares, acts as dividend and distribution disbursing agent, and performs other shareholder service functions. For these services, BNY Mellon receives a monthly fee from each Fund. In addition, each Fund pays out-of-pocket expenses incurred by BNY Mellon, including, but not limited to, postage and supplies.
The Funds may reimburse the Advisor for fees paid to intermediaries such as banks, broker-dealers, financial advisors or other financial institutions for sub-transfer agency, sub-administration and other services provided to investors whose shares of record are held in omnibus, other group accounts, retirement plans or accounts traded through registered securities clearing agents. These fees may vary based on, for example, the nature of services provided, but generally range up to 0.15% of the assets of the class serviced or maintained by the intermediary or up to $22 per sub-account maintained by the intermediary.
PLANS OF DISTRIBUTION
The Trust has adopted a Shareholder Services Plan under which shares of each Fund may directly or indirectly bear expenses for shareholder services provided. Each Fund will incur or reimburse expenses for shareholder services at an annual rate not to exceed 0.25% of the average daily net assets.
UNDERWRITING AGREEMENT
The Underwriter acts as exclusive agent for the distribution of the Funds’ shares. The Underwriter receives no compensation under this agreement.
AFFILIATED INVESTMENTS
Each Fund may have invested in the Touchstone Institutional Money Market Fund through June 19, 2015, subject to compliance with several conditions set forth in an exemptive order received by the Trust from the SEC. To the extent that the Funds were invested in the Touchstone Institutional Money Market Fund, the Advisor and Administrator were paid additional fees from the Touchstone Institutional Money Market Fund that were not waived or reimbursed.
A summary of each Fund’s investment in the Touchstone Institutional Money Market Fund for the year ended December 31, 2015, is as follows:
| | | Share Activity | | | | | | | |
| | | Balance | | | | | | | | | Balance | | | | | | Value | |
| | | 12/31/14 | | | Purchases | | | Sales | | | 12/31/15 | | | Dividends | | | 12/31/15 | |
| Active Bond Fund | | | 1,352,467 | | | | 39,088,807 | | | | (40,441,274 | ) | | | — | | | $ | 189 | | | $ | — | |
| Focused Fund | | | 1,203,959 | | | | 6,795,385 | | | | (7,999,344 | ) | | | — | | | | 37 | | | | — | |
| Large Cap Core Equity Fund | | | — | | | | 3,822,285 | | | | (3,822,285 | ) | | | — | | | | 40 | | | | — | |
| Aggressive ETF Fund | | | 414,640 | | | | 1,820,909 | | | | (2,235,549 | ) | | | — | | | | 14 | | | | — | |
| Conservative ETF Fund | | | 323,485 | | | | 2,810,934 | | | | (3,134,419 | ) | | | — | | | | 15 | | | | — | |
| Moderate ETF Fund | | | 630,629 | | | | 3,369,720 | | | | (4,000,349 | ) | | | — | | | | 18 | | | | — | |
At a meeting of the Board of Trustees (the “Board”) of the Trust held on February 12, 2015, the Board approved an Agreement and Plan of Reorganization between the Institutional Money Market Fund and the Dreyfus
Notes to Financial Statements (Continued)
Cash Management Fund advised by The Dreyfus Corporation (“Dreyfus”), pursuant to which the Institutional Money Market Fund would be reorganized on a tax-free basis with and into the Dreyfus Cash Management Fund.
At a special meeting of shareholders of the Institutional Money Market Fund, held on May 8, 2015, shareholders voted to approve the Agreement and Plan of Reorganization. The reorganization took place on June 19, 2015.
5. Federal Tax Information
Federal income tax — It is each Fund’s policy to continue to comply with the special provisions of the Internal Revenue Code applicable to regulated investment companies. As provided therein, in any fiscal year in which a Fund so qualifies and distributes at least 90% of its investment company taxable income, the Fund (but not the shareholders) will be relieved of federal income tax on the income distributed. It is each Fund’s policy to distribute all of its taxable income and accordingly, no provision for income taxes has been made.
In order to avoid imposition of the excise tax applicable to regulated investment companies, it is also each Fund’s intention to declare and pay as dividends in each calendar year at least 98% of its investment company taxable income (earned during the calendar year) and 98.2% of its net realized capital gains (earned during the twelve months ending October 31) plus undistributed amounts from prior years.
The tax character of distributions paid for the years ended December 31, 2015 and 2014 are as follows:
| | | | | | Focused | | | Large Cap | |
| | | Active Bond Fund | | | Fund | | | Core Equity Fund | |
| | | 2015 | | | 2014 | | | 2015 | | | 2014 | | | 2015 | | | 2014 | |
| From ordinary income | | $ | 1,124,745 | | | $ | 1,255,946 | | | $ | 1,287,736 | | | $ | 692,256 | | | $ | 493,822 | | | $ | 400,191 | |
| From long-term capital gains | | | — | | | | — | | | | 2,507,659 | | | | 2,398,321 | | | | — | | | | — | |
| Total distributions | | $ | 1,124,745 | | | $ | 1,255,946 | | | $ | 3,795,395 | | | $ | 3,090,577 | | | $ | 493,822 | | | $ | 400,191 | |
| | | | | | Aggressive | | | Conservative | | | Moderate | |
| | | | | | ETF Fund | | | ETF Fund | | | ETF Fund | |
| | | 2015 | | | 2014 | | | 2015 | | | 2014 | | | 2015 | | | 2014 | |
| From ordinary income | | $ | 361,574 | | | $ | 5 | | | $ | 348,119 | | | $ | 276,355 | | | $ | 537,287 | | | $ | 541,213 | |
| From long-term capital gains | | | — | | | | 497,503 | | | | 974,869 | | | | 782,933 | | | | 3,365,183 | | | | — | |
| Total distributions | | $ | 361,574 | | | $ | 497,508 | | | $ | 1,322,988 | | | $ | 1,059,288 | | | $ | 3,902,470 | | | $ | 541,213 | |
The following information is computed on a tax basis for each item as of December 31, 2015:
| | | | | | | | | Large Cap | |
| | | | | | Focused | | | Core Equity | |
| | | Active Bond Fund | | | Fund | | | Fund | |
| Tax cost of portfolio investments | | $ | 53,834,300 | | | $ | 70,320,008 | | | $ | 29,908,209 | |
| Gross unrealized appreciation | | | 451,402 | | | | 1,614,961 | | | | 963,543 | |
| Gross unrealized depreciation | | | (2,228,551 | ) | | | (1,941,419 | ) | | | (919,045 | ) |
| Net unrealized appreciation (depreciation) | | | (1,777,149 | ) | | | (326,458 | ) | | | 44,498 | |
| Net unrealized appreciation (depreciation) on foreign currency transactions and swap agreements | | | (7 | ) | | | (1,753 | ) | | | | |
| Accumulated capital losses | | | (1,718,469 | ) | | | — | | | | | |
| Undistributed ordinary income | | | 1,153,724 | | | | 433,564 | | | | 266,317 | |
| Undistributed long-term capital gains | | | — | | | | 10,850,849 | | | | 3,215,232 | |
| Accumulated earnings (deficit) | | $ | (2,341,901 | ) | | $ | 10,956,202 | | | $ | 3,526,047 | |
Notes to Financial Statements (Continued)
| | | Aggressive | | | Conservative | | | Moderate | |
| | | ETF Fund | | | ETF Fund | | | ETF Fund | |
| Tax cost of portfolio investments | | $ | 21,386,345 | | | $ | 19,051,675 | | | $ | 27,542,692 | |
| Gross unrealized appreciation | | | 2,394,362 | | | | 1,749,845 | | | | 3,701,842 | |
| Gross unrealized depreciation | | | (376,864 | ) | | | (230,177 | ) | | | (498,412 | ) |
| Net unrealized appreciation (depreciation) | | | 2,017,498 | | | | 1,519,668 | | | | 3,203,430 | |
| Accumulated capital and other losses | | | (2,502,243 | ) | | | — | | | | — | |
| Undistributed ordinary income | | | 291,861 | | | | 263,973 | | | | 412,701 | |
| Undistributed long-term capital gains | | | — | | | | 188,766 | | | | 1,606,562 | |
| Accumulated earnings (deficit) | | $ | (192,884 | ) | | $ | 1,972,407 | | | $ | 5,222,693 | |
The difference between the tax cost of portfolio investments and the financial statement cost is primarily due to wash sale loss deferrals, partnership investments, passive foreign investment companies (PFICS) and U.S Treasury inflation protection bonds (TIPS).
As of December 31, 2015, the Funds had the following capital loss carryforwards for federal income tax purposes:
| | | Short Term Expiring on* | | | No
Expiration | | | No
Expiration | | | | |
| | | 2016 | | | 2017 | | | 2018 | | | Short Term* | | | Long Term* | | | Total | |
| Active Bond Fund | | $ | 396,333 | | | $ | — | | | $ | — | | | $ | 741,452 | | | $ | 580,624 | | | $ | 1,718,409 | |
| Aggressive ETF Fund | | | 2,502,243 | | | | — | | | | — | | | | — | | | | — | | | | 2,502,243 | |
* The Regulated Investment Company Modernization Act of 2010 (the “Act”) was enacted on December 22, 2010. The Act made changes to several tax rules impacting the Funds. The provisions of the Act first became effective for the Funds’ fiscal year ended December 31, 2012 and are applicable to all subsequent fiscal years. Although the Act provides several benefits, including the unlimited carryover of future capital losses, there may be a greater likelihood that all or a portion of each Fund’s pre-enactment capital loss carryovers may expire without being utilized due to the fact that post-enactment capital losses must be utilized before pre-enactment capital loss carryovers may be utilized. Under the Act, new capital losses may now be carried forward indefinitely, and retain the character of the original loss as compared with pre-enactment law, where capital losses could be carried forward for up to eight years, and carried forward as short-term capital losses, irrespective of the character of the original loss.
The capital loss carryforwards may be utilized in future years to offset net realized capital gains, if any, prior to distributing such gains to shareholders.
During the year ended December 31, 2015, the following Funds utilized capital loss carryforwards.
| Fund | | Amount | |
| Active Bond Fund | | $ | 104,776 | |
| Large Cap Core Equity Fund | | | 3,868,036 | |
| Aggressive ETF Fund | | | 1,220,473 | |
Under current laws, certain capital losses realized after October 31 and ordinary losses realized after December 31 may be deferred (and certain ordinary losses after October and/or December 31 may be deferred) and treated as occurring on the first day of the following fiscal year. For the year ended December 31, 2015, the Funds did not elect to defer any losses.
The Funds have analyzed their tax positions taken on federal income tax returns for all open tax years (tax years ended December 31, 2012 through 2015) and have concluded that no provision for income tax is required in their financial statements.
Notes to Financial Statements (Continued)
Certain reclassifications, the result of permanent differences between financial statement and income tax reporting requirements, have been made to the components of capital. These reclassifications have no impact on the net assets or NAV per share of the Funds. The following reclassifications, which are primarily attributed to TIPS adjustments, swap adjustments, nontaxable distributions from underlying investments, short-term capital gain distributions from underlying mutual funds, investments in partnerships and PFICS have been made to the following Funds for the year ended December 31, 2015:
| | | | | | Accumulated | | | Accumulated | |
| | | Paid-In | | | Net Investment | | | Net Realized | |
| Fund | | Capital | | | Income (Loss) | | | Gains (Losses) | |
| Active Bond Fund | | $ | 595,741 | | | $ | 180,792 | | | $ | (776,533 | ) |
| Focused Fund | | | 51,300 | | | | 33,848 | | | | (85,148 | ) |
| Aggressive ETF Fund | | | — | | | | 6,444 | | | | (6,444 | ) |
| Conservative ETF Fund | | | — | | | | 15,544 | | | | (15,544 | ) |
| Moderate ETF Fund | | | — | | | | 17,253 | | | | (17,253 | ) |
6. Commitments and Contingencies
The Funds indemnify the Trust’s officers and Trustees for certain liabilities that might arise from their performance of their duties to the Funds. Additionally, in the normal course of business, the Funds enter into contracts that contain a variety of representations and warranties and which provide general indemnifications. The Funds’ maximum exposure under these arrangements is unknown, as this would involve future claims that may be made against the Funds.
7. Principal Risks
Risks Associated with Foreign Investments — Some of the Funds may invest in the securities of foreign issuers. Investing in securities issued by companies whose principal business activities are outside the U.S. may involve significant risks not present in domestic investments. For example, there is generally less publicly available information about foreign companies, particularly those not subject to the disclosure and reporting requirements of the U.S. securities laws. Foreign issuers are generally not bound by uniform accounting, auditing, and financial reporting requirements and standards of practice comparable to those applicable to domestic issuers. Investments in foreign securities also involve the risk of possible adverse changes in investment or exchange control regulations, expropriation or confiscatory taxation, limitations on the removal of funds or other assets of the Fund, political or financial instability or diplomatic and other developments which could affect such investments. Foreign stock markets, while growing in volume and sophistication, are generally not as developed as those in the U.S., and securities of some foreign issuers (particularly those located in developing countries) may be less liquid and more volatile than securities of comparable U.S. companies. In general, there is less overall governmental supervision and regulation of foreign securities markets, broker-dealers, and issuers than in the U.S.
Risk Associated with Concentration — Certain Funds invest a high percentage of their assets in specific sectors of the market in order to achieve a potentially greater investment return. As a result, these Funds may be more susceptible to economic, political, and regulatory developments in a particular sector of the market, positive or negative, and may experience increased volatility on the Funds’ NAVs and magnified effect on the total return.
Risks Associated with Credit — An issuer may be unable to make timely payments of either principal or interest. This may cause the issuer’s securities to decline in value. Credit risk is particularly relevant to those Funds that invest a significant amount of their assets in junk bonds or lower-rated securities.
Risks Associated with Interest Rate Changes — As interest rates rise, the value of fixed-income securities a Fund owns will likely decrease. The price of debt securities is generally linked to the prevailing market interest
Notes to Financial Statements (Continued)
rates. In general, when interest rates rise, the price of debt securities falls, and when interest rates fall, the price of debt securities rises. The price volatility of a debt security also depends on its maturity. Longer-term securities are generally more volatile, so the longer the average maturity or duration of these securities, the greater their price risk. Duration is a measure of the expected life, taking into account any prepayment or call features of the security, that is used to determine the price sensitivity of the security for a given change in interest rates. Specifically, duration is the change in the value of a fixed-income security that will result from a 1% change in interest rates, and generally is stated in years. For example, as a general rule a 1% rise in interest rates means a 1% fall in value for every year of duration. Maturity, on the other hand, is the date on which a fixed-income security becomes due for payment of principal. The negative impact on fixed income securities if interest rates increase as a result could negatively impact a Fund’s NAV.
Please see the Funds’ prospectus for a complete discussion of these and other risks.
8. Fund Mergers
Active Bond Fund:
At a meeting held on August 20, 2015, the Board approved an Agreement and Plan of Reorganization providing for the transfer of all assets and liabilities of the Touchstone High Yield Fund to the Touchstone Active Bond Fund. The tax-free merger took place on December 7, 2015.
The following is a summary of shares outstanding, net assets, net asset value per share and unrealized appreciation immediately before and after the reorganization.
| | | | | | After | |
| | | Before Reorganization | | | Reorganization | |
| | | Touchstone | | | Touchstone | | | Touchstone | |
| | | High Yield | | | Active Bond | | | Active Bond | |
| | | Fund | | | Fund | | | Fund | |
| Shares | | | 940,916 | (A) | | | 4,056,823 | | | | 4,997,739 | |
| Net Assets | | $ | 9,850,991 | | | $ | 42,472,967 | | | $ | 52,323,958 | |
| Net Asset Value | | $ | 10.47 | (A) | | $ | 10.47 | | | $ | 10.47 | |
| Shares Outstanding | | | 1,719,933 | | | | 4,056,823 | | | | 4,997,739 | |
| Unrealized Appreciation (Depreciation) | | $ | (863,095 | ) | | $ | (772,263 | ) | | $ | (1,635,358 | ) |
(A) Reflects a 0.5471:1 stock split which occurred on the date of reorganization, December 7, 2015.
Focused Fund:
At a meeting held on August 20, 2015, the Board approved Agreements and Plans of Reorganization providing for the transfer of all assets and liabilities of each of the Touchstone Baron Small Cap Growth Fund and the Touchstone Third Avenue Value Fund to the Touchstone Focused Fund. The tax-free mergers took place on December 7, 2015.
Notes to Financial Statements (Continued)
The following is a summary of shares outstanding, net assets, net asset value per share and unrealized appreciation immediately before and after the reorganizations.
| | | | | | | | | After | |
| | | Before Reorganizations | | | Reorganizations | |
| | | Touchstone | | | Touchstone | | | Touchstone | | | Touchstone | |
| | | Baron Small Cap | | | Third Avenue | | | Focused | | | Focused | |
| | | Growth Fund | | | Value Fund | | | Fund | | | Fund | |
| Shares | | | 1,179,613 | (A) | | | 1,020,053 | (B) | | | 1,423,315 | | | | 3,622,981 | |
| Net Assets | | $ | 23,202,782 | | | $ | 20,064,311 | | | $ | 27,996,474 | | | $ | 71,263,567 | |
| Net Asset Value | | $ | 19.67 | (A) | | $ | 19.67 | (B) | | $ | 19.67 | | | $ | 19.67 | |
| Shares Outstanding | | | 1,769,860 | | | | 1,350,688 | | | | 1,423,315 | | | | 3,622,981 | |
| Unrealized Appreciation (Depreciation) | | $ | 6,775,183 | | | $ | 225,454 | | | $ | 1,218,212 | | | $ | 8,218,849 | |
(A) Reflects a 0.6665:1 stock split which occurred on the date of reorganizations, December 7, 2015.
(B) Reflects a 0.7552:1 stock split which occurred on the date of reorganizations, December 7, 2015.
Assuming the reorganizations had been completed on January 1, 2015, the Active Bond Fund and the Focused Fund results of operations for the year ended December 31, 2015 would have been as follows:
| | | Touchstone | | | Touchstone | |
| | | Active Bond | | | Focused | |
| | | Fund | | | Fund | |
| Net investment income (loss) | | $ | 1,663,749 | | | $ | (36,133 | ) |
| Net realized and unrealized gain (loss) on investments | | | (3,235,147 | ) | | | 3,712,518 | |
| Net increase (decrease) in net assets from operations | | $ | (1,571,398 | ) | | $ | 3,676,385 | |
Because the combined investment portfolios have been managed as a single portfolio since the reorganizations were completed, it is not practical to separate the amounts of revenue and earnings to the Active Bond Fund and the Focused Fund that have been included in their statements of operations since the reorganizations.
9. Subsequent Events
Subsequent events occurring after the date of this report have been evaluated for potential impact to this report through the date financial statements were issued. There were no subsequent events that necessitated recognition or disclosure in the Funds’ financial statements.
Report of Independent Registered Public Accounting Firm
To the Board of Trustees and Shareholders of Touchstone Variable Series Trust
We have audited the accompanying statements of assets and liabilities, including the portfolios of investments, of Touchstone Variable Series Trust (comprising, respectively, the Touchstone Active Bond, Touchstone Focused Fund (formerly, Touchstone Mid Cap Growth Fund), Touchstone Large Cap Core Equity Fund, Touchstone Aggressive ETF Fund, Touchstone Conservative ETF Fund, and Touchstone Moderate ETF Fund) (the “Funds”) as of December 31, 2015, and the related statements of operations for the year then ended, the statements of changes in net assets for each of the two years in the period then ended and the financial highlights for each of the five years in the period then ended. These financial statements and financial highlights are the responsibility of the Funds’ management. Our responsibility is to express an opinion on these financial statements and financial highlights based on our audits.
We conducted our audits in accordance with the standards of the Public Company Accounting Oversight Board (United States). Those standards require that we plan and perform the audit to obtain reasonable assurance about whether the financial statements and financial highlights are free of material misstatement. We were not engaged to perform an audit of the Funds’ internal control over financial reporting. Our audits included consideration of internal control over financial reporting as a basis for designing audit procedures that are appropriate in the circumstances, but not for the purpose of expressing an opinion on the effectiveness of the Funds’ internal control over financial reporting. Accordingly, we express no such opinion. An audit also includes examining, on a test basis, evidence supporting the amounts and disclosures in the financial statements and financial highlights, assessing the accounting principles used and significant estimates made by management, and evaluating the overall financial statement presentation. Our procedures included confirmation of securities owned as of December 31, 2015, by correspondence with the custodian, transfer agent, and brokers or by other appropriate auditing procedures where replies from brokers were not received. We believe that our audits provide a reasonable basis for our opinion.
In our opinion, the financial statements and financial highlights referred to above present fairly, in all material respects, the financial position of each of the respective funds constituting Touchstone Variable Series Trust at December 31, 2015, the results of their operations for the year then ended, the changes in their net assets for each of the two years in the period then ended, and the financial highlights for each of the five years in the period then ended, in conformity with U.S. generally accepted accounting principles.

Cincinnati, Ohio
February 19, 2016
Other Items (Unaudited)
Dividend Received Deduction
For corporate shareholders, the following ordinary distributions paid during the current fiscal year ended December 31, 2015 qualify for the corporate dividends received deduction. The Funds intend to pass through the maximum allowable percentage.
| Focused Fund | | | 14.00 | % |
| Large Cap Core Equity Fund | | | 100.00 | % |
| Aggressive ETF Fund | | | 59.82 | % |
| Conservative ETF Fund | | | 22.76 | % |
| Moderate ETF Fund | | | 42.68 | % |
| Third Avenue Value Fund | | | 21.98 | % |
For the fiscal year ended December 31, 2015, Focused Fund, Large Cap Core Equity Fund, Conservative ETF Fund, and Moderate ETF Fund, designated $10,850,852, $3,215,232, $974,869, and $3,365,183, respectively, as long-term capital gains.
Proxy Voting Guidelines
The Sub-Advisors are responsible for exercising the voting rights associated with the securities purchased and held by the Funds. A description of the policies and procedures that the Sub-Advisors use in fulfilling this responsibility is available as an appendix to the most recent Statement of Additional Information, which can be obtained without charge by calling toll free 1.800.543.0407 or by visiting the Touchstone website at Touchstone Investments.com or on the Securities and Exchange Commission’s (the Commission) website at sec.gov. Information regarding how those proxies were voted during the most recent twelve-month period ended June 30 is also available without charge by calling toll free 1.800.543.0407 or on the Commission’s website at sec.gov.
Quarterly Portfolio Disclosure
The Trust files a complete listing of portfolio holdings for each Fund as of the end of the first and third quarters of each fiscal year on Form N-Q. The complete listing (i) is available on the Commission’s website; (ii) may be reviewed and copied at the Commission’s Public Reference Room in Washington, DC; or (iii) will be made available to shareholders upon request by calling 1.800.543.0407. Information on the operation of the Public Reference Room may be obtained by calling 1.800.SEC.0330.
Schedule of Shareholder Expenses
As a shareholder of the Funds, you incur two types of costs: (1) transaction costs, including reinvested dividends or other distributions; and (2) ongoing costs, including investment advisory fees; shareholder servicing fees; and other Fund expenses. This example is intended to help you understand your ongoing costs (in dollars) of investing in the Funds and to compare these costs with the ongoing costs of investing in other mutual funds.
The example is based on an investment of $1,000 invested at the beginning of the period and held for the entire period (July 1, 2015 through December 31, 2015).
Actual Expenses
The first line of the table below for each Fund provides information about actual account values and actual expenses. You may use the information in this line, together with the amount you invested, to estimate the expenses that you paid over the period. Simply divide your account value by $1,000 (for example, an $8,600 account value divided by $1,000 = 8.6), then multiply the result by the number in the first line under the heading entitled “Expenses Paid During the six months ended December 31, 2015” to estimate the expenses you paid on your account during this period.
Other Items (Unaudited) (Continued)
Hypothetical Example for Comparison Purposes
The second line of the table below for each Fund provides information about hypothetical account values and hypothetical expenses based on the Funds’ actual expense ratio and an assumed rate of return of 5% per year before expenses, which is not the Funds’ actual return. The hypothetical account values and expenses may not be used to estimate the actual ending account balance or expenses you paid for the period. You may use this information to compare the ongoing costs of investing in the Funds and other funds. To do so, compare this 5% hypothetical example with the 5% hypothetical examples that appear in the shareholder reports of the other funds.
Please note that the expenses shown in the table below are meant to highlight your ongoing costs only and do not reflect any transactional costs, such as sales charges (loads), redemption fees, or exchange fees. Therefore, the second line of the table below for each Fund is useful in comparing ongoing costs only, and will not help you determine the relative total costs of owning different funds. In addition, if these transactional costs were included, your costs would have been higher.
| | | | | | | | | | | | Expenses | |
| | | Net Expense | | | Beginning | | | Ending | | | Paid During | |
| | | Ratio | | | Account | | | Account | | | the Six Months | |
| | | Annualized | | | Value | | | Value | | | Ended | |
| | | December 31, | | | July 1, | | | December 31, | | | December 31, | |
| | | 2015 | | | 2015 | | | 2015 | | | 2015* | |
| Touchstone Active Bond Fund | | | | | | | | | | | | | | | | |
| Actual | | | 0.97 | % | | $ | 1,000.00 | | | $ | 984.40 | | | $ | 4.85 | |
| Hypothetical | | | 0.97 | % | | $ | 1,000.00 | | | $ | 1,020.32 | | | $ | 4.94 | |
| | | | | | | | | | | | | | | | | |
| Touchstone Focused Fund | | | | | | | | | | | | | | | | |
| Actual | | | 1.21 | % | | $ | 1,000.00 | | | $ | 977.20 | | | $ | 6.03 | |
| Hypothetical | | | 1.21 | % | | $ | 1,000.00 | | | $ | 1,019.11 | | | $ | 6.16 | |
| | | | | | | | | | | | | | | | | |
| Touchstone Large Cap Core Equity Fund | | | | | | | | | | | | | | | | |
| Actual | | | 1.06 | % | | $ | 1,000.00 | | | $ | 961.20 | | | $ | 5.24 | |
| Hypothetical | | | 1.06 | % | | $ | 1,000.00 | | | $ | 1,019.86 | | | $ | 5.40 | |
| | | | | | | | | | | | | | | | | |
| Touchstone Aggressive ETF Fund** | | | | | | | | | | | | | | | | |
| Actual | | | 0.75 | % | | $ | 1,000.00 | | | $ | 983.50 | | | $ | 3.75 | |
| Hypothetical | | | 0.75 | % | | $ | 1,000.00 | | | $ | 1,021.42 | | | $ | 3.82 | |
| | | | | | | | | | | | | | | | | |
| Touchstone Conservative ETF Fund** | | | | | | | | | | | | | | | | |
| Actual | | | 0.75 | % | | $ | 1,000.00 | | | $ | 993.70 | | | $ | 3.77 | |
| Hypothetical | | | 0.75 | % | | $ | 1,000.00 | | | $ | 1,021.42 | | | $ | 3.82 | |
| | | | | | | | | | | | | | | | | |
| Touchstone Moderate ETF Fund** | | | | | | | | | | | | | | | | |
| Actual | | | 0.75 | % | | $ | 1,000.00 | | | $ | 988.60 | | | $ | 3.76 | |
| Hypothetical | | | 0.75 | % | | $ | 1,000.00 | | | $ | 1,021.42 | | | $ | 3.82 | |
* Expenses are equal to the Fund’s annualized expense ratio, multiplied by the average account value over the period, multiplied by 184/365 (to reflect one-half year period).
** The annualized expense ratio for the Fund does not include fees and expenses of the underlying funds in which the Fund invests.
Shareholder Voting Results
At a meeting held on August 20, 2015, the Board of Trustees (the “Board” or “Trustees”) of the Touchstone Variable Series Trust (the “Trust”), approved the subclassification of the Touchstone Large Cap Core Equity Fund under the Investment Company Act of 1940, as amended from a “diversified” fund to a “non-diversified” fund. At a shareholder meeting held on November 20, 2015, shareholders approved the subclassification change. The results of the voting were as follows:
| | | For | | | Against | | | Abstain | |
| | | | | | | | | | |
| Touchstone Large Cap Core Equity Fund | | | 1,905,270 | | | | 147,336 | | | | 154,988 | |
Other Items (Unaudited) (Continued)
At a meeting held on August 20, 2015, the Board of the Trust approved the reorganization of the Touchstone High Yield Fund into the Touchstone Active Bond Fund, each a series of the Trust. At a shareholder meeting held on November 20, 2015, shareholders of the Touchstone High Yield Fund approved the reorganization. The results of the voting were as follows:
| | | For | | | Against | | | Abstain | |
| | | | | | | | | | |
| Touchstone High Yield Fund | | | 1,529,587 | | | | 28,442 | | | | 17,672 | |
At a meeting held on August 20, 2015, the Board of the Trust approved the reorganization of the Touchstone Baron Small Cap Fund and the Touchstone Third Avenue Value Fund into the Touchstone Focused Fund, each a series of the Trust. At a shareholder meeting held on November 20, 2015, shareholders of each of the Touchstone Baron Small Cap Fund and the Touchstone Third Avenue Value Fund approved the applicable reorganization. The results of the voting were as follows:
| | | For | | | Against | | | Abstain | |
| | | | | | | | | | |
| Touchstone Baron Small Cap Fund | | | 1,034,093 | | | | 22,932 | | | | 77,282 | |
| | | | | | | | | | | | | |
| Touchstone Third Avenue Value Fund | | | 1,024,228 | | | | 80,336 | | | | 38,242 | |
Advisory and Sub-Advisory Agreement Approval Disclosure
At a meeting held on November 19, 2015, the Board of Trustees (the “Board” or “Trustees”) of the Touchstone Variable Series Trust (the “Trust”), and by a separate vote, the Independent Trustees of the Trust, approved the continuance of the Investment Advisory Agreement between the Trust and the Advisor with respect to each Fund of the Trust, and the continuance of each Sub-Advisory Agreement between the Advisor and each Fund’s respective Sub-Advisor, with the exception of the Sub-Advisory Agreement relating to each of Touchstone Focused Fund and Touchstone Large Cap Core Equity Fund, which were not up for renewal because each had been initially approved for a two-year period in May 2015 and August 2015, respectively.
In determining whether to approve the continuation of the Investment Advisory Agreement and the Sub-Advisory Agreements, the Advisor furnished information necessary for a majority of the Independent Trustees to make the determination that the continuance of the Investment Advisory Agreement and each Sub-Advisory Agreement was in the best interests of the respective Funds and their shareholders. The information provided to the Board included: (1) industry data comparing advisory fees and expense ratios of comparable investment companies; (2) comparative performance information; (3) the Advisor’s and its affiliates’ revenues and costs of providing services to the Funds; and (4) information about the Advisor’s and Sub-Advisors’ personnel. Prior to voting, the Independent Trustees reviewed the proposed continuance of the Investment Advisory Agreement and the Sub-Advisory Agreements with management and experienced independent legal counsel and received materials from such counsel discussing the legal standards for their consideration of the proposed continuation of the Investment Advisory Agreement and each Sub-Advisory Agreement. The Independent Trustees also reviewed the proposed continuation of the Investment Advisory Agreement and each Sub-Advisory Agreement with independent legal counsel in private sessions at which no representatives of management were present.
In approving the Funds’ Investment Advisory Agreement, the Board considered various factors, among them: (1) the nature, extent and quality of services provided to the Funds, including the personnel providing such services; (2) the Advisor’s compensation and profitability; (3) a comparison of fees and performance with other
Other Items (Unaudited) (Continued)
advisors; (4) economies of scale; and (5) the terms of the Investment Advisory Agreement. The Board’s analysis of these factors is set forth below. The Independent Trustees were advised by independent legal counsel throughout the process.
Nature, Extent and Quality of Advisor Services. The Board considered the level and depth of knowledge of the Advisor, including the professional experience and qualifications of senior personnel. In evaluating the quality of services provided by the Advisor, the Board took into account its familiarity with the Advisor’s senior management through Board meetings, discussions and reports during the preceding year. The Board also took into account the Advisor’s compliance policies and procedures. The quality of administrative and other services, including the Advisor’s role in coordinating the activities of the Funds’ other service providers, was also considered. The Board also considered the Advisor’s relationship with its affiliates and the resources available to them, as well as any potential conflicts of interest.
The Board discussed the Advisor’s effectiveness in monitoring the performance of each Sub-Advisor, including those that were affiliates of the Advisor, and the Advisor’s timeliness in responding to performance issues. The Board considered the Advisor’s process for monitoring each of the Sub-Advisors, which includes an examination of both qualitative and quantitative elements of the Sub-Advisor’s organization, personnel, procedures, investment discipline, infrastructure and performance. The Board considered that the Advisor conducts regular on-site compliance visits with each Sub-Advisor, during which the Advisor examines a wide variety of factors, such as the financial condition of the Sub-Advisor, the quality of the Sub-Advisor’s systems, the effectiveness of the Sub-Advisor’s disaster recovery programs,t rade allocation and execution procedures, compliance with the Sub-Advisor’s policies and procedures, results of regulatory examinations and any other factors that might affect the quality of services that the Sub-Advisor provides to the applicable Fund(s). The Board noted that the Advisor’s compliance monitoring processes also include quarterly reviews of compliance reports, and that any significant issues arising from such reports and the Advisor’s compliance visits to the Sub-Advisors are reported to the Board.
The Board concluded that they were satisfied with the nature, extent and quality of services provided to each Fund by the Advisor under the Investment Advisory Agreement.
Advisor’s Compensation and Profitability. The Board took into consideration the financial condition and profitability of the Advisor and its affiliates (including the Sub-Advisor to certain of the Funds) and the direct and indirect benefits derived by the Advisor and its affiliates from the Advisor’s relationship with the Funds. The information considered by the Board included operating profit margin information for the Advisor’s business as a whole. The Board noted that the Advisor had waived a portion of advisory fees and administrative fees and/or reimbursed expenses in order to limit certain Funds’ net operating expenses. The Board also noted that the Advisor pays the Sub-Advisors’ sub-advisory fees out of the advisory fees the Advisor receives from the Funds. The Board reviewed the profitability of the Advisor’s relationship with the Funds both before and after tax expenses, and also considered whether the Advisor has the financial wherewithal to continue to provide services to the Funds, noting the ongoing commitment of the Advisor’s parent company with respect to providing support and resources as needed. The Board also noted that the Advisor derives benefits to its reputation and other benefits from its association with the Funds. The Board also considered that affiliates of the Advisor may benefit from certain indirect tax benefits, including those relating to dividend received deductions.
The Board recognized that the Advisor should be entitled to earn a reasonable level of profits in exchange for the level of services it provides to each Fund and the entrepreneurial risk that it assumes as Advisor. Based upon their review, the Board concluded that the Advisor’s and its affiliates’ level of profitability, if any, from their relationship with each Fund was reasonable and not excessive.
Expenses and Performance. The Board compared the respective advisory fees and total expense ratios for each of the Funds with various comparative data, including the median and average advisory fees and total expense ratios of each Fund’s respective peer group. The Board also considered, among other data, the Funds’ respective
Other Items (Unaudited) (Continued)
performance results during the six-month, twelve-month and thirty-six-month periods ended June 30, 2015 and noted that the Board reviews on a quarterly basis detailed information about each Fund’s performance results, portfolio composition and investment strategies. The Board also took into account current market conditions and their effect on the Funds’ performance.
The Board also considered the effect of each Fund’s growth and size on its performance and expenses. The Board noted that the Advisor had waived a portion of the fees and/or reimbursed expenses of certain Funds in order to reduce those Funds’ respective operating expenses to targeted levels. The Board noted that the sub-advisory fees under the Sub-Advisory Agreement with respect to each Fund were paid by the Advisor out of the advisory fees it receives from the Fund and considered the impact of such sub-advisory fees on the profitability of the Advisor. In reviewing the respective expense ratios and performance of each of the Funds, the Board also took into account the nature, extent and quality of the services provided to the Funds by the Advisor and its affiliates.
The Board considered, among other data, the specific factors and related conclusions set forth below with respect to each Fund:
Touchstone Active Bond Fund. The Fund’s advisory fee and total expense ratio (net of applicable expense waivers and reimbursements) were below the median of its peer group. The Board took into account management’s discussion of the Fund’s expenses, including the impact that the relatively small size of the Fund has upon expenses. The Fund’s performance for the six-month period ended June 30, 2015 was in the 2nd quintile of its peer group. The Fund’s performance for the twelve- and thirty-six-month periods ended June 30, 2015 was in the 5th quintile of its peer group. The Board noted management’s discussion of the Fund’s recent performance. Based upon their review, the Board concluded that the Fund’s overall performance was satisfactory relative to the performance of funds with similar investment objectives and relevant indices, and that the advisory fee was reasonable in light of the services received by the Fund from the Advisor and the other factors considered.
Touchstone Conservative ETF Fund. The Fund’s advisory fee and total expense ratio (net of applicable expense waivers and reimbursements) were above the median and below the median, respectively, of its peer group. The Board noted that the Advisor was currently waiving a portion of the Fund’s fees. The Fund’s performance for the six-month period ended June 30, 2015 was in the 4th quintile of its peer group. The Fund’s performance for the twelve-month period ended June 30, 2015 was in the 1st quintile of its peer group, and the Fund’s performance for the thirty-six-month period ended June 30, 2015 was in the 3rd quintile of its peer group. The Board noted management’s discussion of the Fund’s performance, including both its recent and longer-term performance, and management’s continued close monitoring of the Fund’s performance. Based upon their review, the Board concluded that the Fund’s overall performance was satisfactory relative to the performance of funds with similar investment objectives and relevant indices, and that the advisory fee was reasonable in light of the services received by the Fund from the Advisor and the other factors considered.
Touchstone Moderate ETF Fund. The Fund’s advisory fee and total expense ratio (net of applicable expense waivers and reimbursements) were above the median and below the median, respectively, of its peer group. The Board noted that the Advisor was currently waiving a portion of the Fund’s fees. The Fund’s performance for the six- and thirty-six-month periods ended June 30, 2015 was in the 4th quintile of its peer group. The Fund’s performance for the twelve-month period ended June 30, 2015 was in the 3rd quintile of its peer group. The Board took into account management’s discussion of the Fund’s performance. Based upon their review, the Board concluded that the Fund’s overall performance was satisfactory relative to the performance of funds with similar investment objectives and relevant indices, and that the advisory fee was reasonable in light of the services received by the Fund from the Advisor and the other factors considered.
Touchstone Aggressive ETF Fund. The Fund’s advisory fee and total expense ratio (net of applicable expense waivers and reimbursements) were above the median and below the median, respectively, of its peer group. The
Other Items (Unaudited) (Continued)
Board noted that the Advisor was currently waiving a portion of the Fund’s fees. The Fund’s performance for the six-month period ended June 30, 2015 was in the 4th quintile of its peer group. The Fund’s performance for the twelve- and thirty-six-month periods ended June 30, 2015 was in the 2nd quintile of its peer group. Based upon their review, the Board concluded that the Fund’s overall performance was satisfactory relative to the performance of funds with similar investment objectives and relevant indices and that the advisory fee was reasonable in light of the services received by the Fund from the Advisor and the other factors considered.
Economies of Scale. The Board considered the effect of each Fund’s current size and potential growth on its performance and expenses. The Board took into account management’s discussion of the Funds’ advisory fee structure. The Board considered the effective advisory fees under the Investment Advisory Agreement as a percentage of assets at different asset levels and possible economies of scale that might be realized if the assets of each Fund increase. The Board noted that the advisory fee schedules for the Funds contain breakpoints that would reduce the respective advisory fee rate on assets above specified levels as the respective Fund’s assets increased. The Board also noted that if a Fund’s assets increase over time, the Fund might realize other economies of scale if assets increase proportionally more than certain other expenses. The Board also considered the fact that, under the Investment Advisory Agreement, the advisory fee payable to the Advisor by a Fund was reduced by the total sub-advisory fee paid by the Advisor to the Fund’s Sub-Advisor.
Conclusion. In considering the renewal of the Funds’ Investment Advisory Agreement, the Board, including the Independent Trustees, did not identify any single factor as controlling, and each Board may have attributed different weights to the various factors. The Board evaluated all information available to them on a Fund-by-Fund basis, and their determinations were made separately with respect to each Fund. The Board reached the following conclusions regarding the Funds’ Investment Advisory Agreement with the Advisor, among others: (a) the Advisor demonstrated that it possesses the capability and resources to perform the duties required of it under the Investment Advisory Agreement; (b) the Advisor maintains an appropriate compliance program; (c) the overall performance of each Fund is satisfactory relative to the performance of funds with similar investment objectives and relevant indices; and (d) each Fund’s advisory fee is reasonable in light of the services received by the Fund from the Advisor and the other factors considered. Based on their conclusions, the Board determined with respect to each Fund that continuation of the Investment Advisory Agreement was in the best interests of the Fund and its shareholders.
In approving the applicable Funds’ respective Sub-Advisory Agreements, the Board considered various factors with respect to each Fund and the applicable Sub-Advisory Agreement, among them: (1) the nature, extent and quality of services provided to the Fund, including the personnel providing such services; (2) the Sub-Advisor’s compensation; (3) a comparison of the sub-advisory fee and performance with other advisors; and (4) the terms of the Sub-Advisory Agreement. The Board’s analysis of these factors is set forth below. The Independent Trustees were advised by independent legal counsel throughout the process.
Nature, Extent and Quality of Services Provided; Investment Personnel. The Board considered information provided by the Advisor regarding the services provided by each Sub-Advisor, including information presented periodically throughout the previous year. The Board noted the affiliation of the Sub-Advisor to certain of the Funds with the Advisor, noting any potential conflicts of interest. The Board also noted that, on a periodic basis, the Board meets with portfolio managers of the Sub-Advisors to discuss their respective performance and investment processes and strategies. The Board considered each Sub-Advisor’s level of knowledge and investment style. The Board reviewed the experience and credentials of the applicable investment personnel who are responsible for managing the investment of portfolio securities with respect to the Funds.
Sub-Advisor’s Compensation, Profitability and Economies of Scale. The Board also took into consideration the financial condition of each Sub-Advisor and any indirect benefits derived by each Sub-Advisor and its affiliates from the Sub-Advisor’s relationship with the Funds. In considering the profitability to each Sub-Advisor of
Other Items (Unaudited) (Continued)
its relationship with the Funds, the Board noted the undertaking of the Advisor to maintain expense limitations for the Funds and also noted that the sub-advisory fees under the Sub-Advisory Agreements were paid by the Advisor out of the advisory fees that it receives under the Investment Advisory Agreement and in addition, with respect to the unaffiliated Sub-Advisors, are negotiated at arm’s length. As a consequence, the profitability to each Sub-Advisor of its relationship with a Fund was not a substantial factor in the Board’s deliberations. For similar reasons, the Board did not consider the potential economies of scale in each Sub-Advisor’s management of the applicable Fund to be a substantial factor in its consideration, although the Board noted that the sub-advisory fee schedule for the Funds contained breakpoints that would reduce the sub-advisory fee rate on assets above specified levels as the applicable Fund’s assets increased.
Sub-Advisory Fees and Fund Performance. The Board considered that each Fund pays an advisory fee to the Advisor and that the Advisor pays the sub-advisory fee to the Sub-Advisor out of the advisory fee it receives from the respective Fund. The Board also compared the sub-advisory fees paid by the Advisor to fees charged by each Sub-Advisor to manage comparable institutional separate accounts. The Board considered the amount retained by the Advisor and the sub-advisory fee paid to each Sub-Advisor with respect to the various services provided by the Advisor and the Sub-Advisor. The Board also noted that the Advisor negotiated the sub-advisory fee with each of the unaffiliated Sub-Advisors at arm’s length. The Board reviewed the sub-advisory fee for each Fund in relation to various comparative data, including the median and average sub-advisory fees of each Fund’s peer group, and considered the following information:
Touchstone Active Bond Fund. The Fund’s sub-advisory fee was above the median of its peer group. Based upon their review, the Board concluded that the sub-advisory fee was reasonable in light of the services received by the Fund from the Sub-Advisor and the other factors considered.
Touchstone Conservative ETF Fund. The Fund’s sub-advisory fee was below the median of its peer group. Based upon their review, the Board concluded that the sub-advisory fee was reasonable in light of the services received by the Fund from the Sub-Advisor and the other factors considered.
Touchstone Moderate ETF Fund. The Fund’s sub-advisory fee was below the median of its peer group. Based upon their review, the Board concluded that the sub-advisory fee was reasonable in light of the services received by the Fund from the Sub-Advisor and the other factors considered.
Touchstone Aggressive ETF Fund. The Fund’s sub-advisory fee was below the median of its peer group. Based upon their review, the Board concluded that the sub-advisory fee was reasonable in light of the services received by the Fund from the Sub-Advisor and the other factors considered.
As noted above, the Board considered each Fund’s performance during the six-month, twelve-month and thirty-six-month periods ended June 30, 2015 as compared to each Fund’s peer group and noted that the Board reviews on a quarterly basis detailed information about each Fund’s performance results, portfolio composition and investment strategies. The Board noted the Advisor’s expertise and resources in monitoring the performance, investment style and risk-adjusted performance of each Sub-Advisor. The Board was mindful of the Advisor’s ongoing monitoring of each Sub-Advisor’s performance and the measures undertaken by the Advisor to address any underperformance..
Conclusion. In considering the renewal of the Sub-Advisory Agreement with respect to each applicable Fund, the Board, including the Independent Trustees, did not identify any single factor as controlling, and each Trustee may have attributed different weights to the various factors. The Board reached the following conclusions regarding each Sub-Advisory Agreement, among others: (a) the Sub-Advisor is qualified to manage each Fund’s assets in accordance with the Fund’s investment goals and policies; (b) the Sub-Advisor maintains an appropriate compliance program; (c) the performance of each Fund is satisfactory relative to the performance of funds with similar investment objectives and relevant indices; (d) each Fund’s sub-advisory fee is reasonable in light
Other Items (Unaudited) (Continued)
of the services received by the Fund from the Sub-Advisor and the other factors considered; and (e) the Sub-Advisor’s investment strategies are appropriate for pursuing the investment goals of each Fund. Based on its conclusions, the Board determined that approval of the Sub-Advisory Agreement with respect to each applicable Fund was in the best interests of the Fund and its shareholders.
Basis for Board's Approval of Sub-Advisory Agreement and Interim Sub-Advisory Agreement
At an in-person meeting held on August 19, 2015 (the “Meeting”), Touchstone Advisors, Inc. (the “Advisor”) proposed the replacement of the current sub-advisor of the Touchstone Large Cap Core Equity Portfolio (the “Fund”), Todd Asset Management, LLC (“Todd”), to the Board of Trustees (the “Board”) of Touchstone Variable Series Trust, The Board approved replacing Todd with The London Company of Virginia d/b/a The London Company (“TLC”). In connection with this change, the Board also approved, subject to the approval of the Fund’s shareholders, a change in the sub-classification of the Fund from a diversified fund to a non-diversified fund.
The Advisor and TLC provided the Board with various written materials in advance of the Meeting to assist with the Board’s consideration of a new Sub-Advisory Agreement between the Advisor and TLC (the “New Sub-Advisory Agreement”). The Advisor provided written and oral information stating the basis for its recommendation to engage TLC. The information also included details regarding TLC’s: (a) investment philosophy and investment process; (b) investment management services proposed to be provided to the Fund; (c) investment management personnel; (d) operating history, infrastructure and financial condition; (e) proposed sub-advisory fee that would be paid to TLC by the Advisor; and (f) reputation, expertise and resources as an investment advisor. The Board then discussed the written materials that the Board received before the Meeting and all other information that the Board received at the Meeting.
The Board, including the Independent Trustees, voting separately, unanimously determined that the proposal to approve the New Sub-Advisory Agreement for the Fund would be in the best interests of the shareholders and the Fund. In approving the New Sub-Advisory Agreement, the Board considered various factors, among them: (1) the nature, extent and quality of services to be provided by TLC to the Fund, including the personnel who would be providing such services; (2) TLC’s proposed compensation; (3) TLC’s past performance; and (4) the terms of the New Sub-Advisory Agreement. The Board’s analysis of these factors is set forth below. The Independent Trustees were advised by independent legal counsel throughout the process.
Nature, Extent and Quality of Services Provided; Investment Personnel. The Board considered information provided by the Advisor regarding the services to be provided by TLC. The Board considered TLC’s level of knowledge and investment style. The Board reviewed the experience and credentials of the investment personnel who would be responsible for managing the investment of portfolio securities with respect to the Fund. The Board also noted that it is familiar with TLC, as TLC serves as a sub-advisor to the Touchstone Small Cap Fund and Touchstone Mid Cap Fund, each a series of Touchstone Funds Group Trust, and the Touchstone Large Cap Fund, a series of Touchstone Strategic Trust (“TST”). The Board also took into consideration that the Advisor was satisfied with TLC’s in-house risk and compliance teams.
The Board noted that TLC would utilize the identical strategy currently employed for the TST Large Cap Fund in managing the Fund. The Board also noted that the personnel who would manage the Fund would be the same personnel who currently manage the TST Large Cap Fund. Specifically, Stephen Goddard, CFA, will be the portfolio manager for the Fund. The Board noted that Mr. Goddard has managed the TST Large Cap Fund since its inception in July 2014.
TLC’s Compensation. The Board took into consideration the financial condition of TLC and any direct and indirect benefits to be derived by TLC and its affiliates from TLC’s relationship with the Fund. In considering
Other Items (Unaudited) (Continued)
the anticipated level of profitability to TLC and its affiliates, the Board noted the proposed contractual undertaking of the Advisor to maintain expense limitations for the Fund and also noted that the proposed sub-advisory fee under the New Sub-Advisory Agreement would be paid by the Advisor out of the advisory fee that it receives from the Fund, and that the proposed sub-advisory fee is negotiated at arm’s length. As a consequence, the anticipated level of profitability to TLC from its relationship with the Fund was not a substantial factor in the Board’s deliberations. For similar reasons, the Board did not consider potential economies of scale in TLC’s management of the Fund to be a substantial factor in its consideration. The Board noted that the advisory fee and expense limitation for the Fund would not change as a result of the change in sub-advisor. Further, the Board noted that the sub-advisory fee paid to TLC for the Fund will be identical to the sub-advisory paid to TLC for managing the TST Large Cap Fund.
Sub-Advisory Fee and Fund Performance. The Board considered that the Fund would pay an advisory fee to the Advisor and that the Advisor would pay a sub-advisory fee to TLC out of the advisory fee. The Board also considered certain comparative fee information concerning the current sub-advisory fee paid to Todd for managing the Fund. The Board also compared TLC’s proposed sub-advisory fee to the sub-advisory fees paid to Todd, noting that the fee to be paid by the Advisor to TLC would be higher at all asset levels than the sub-advisory fee paid to Todd. However, the Board also noted that the rate of the advisory fee the Fund pays to the Advisor would not change, resulting in no additional investment advisory fees payable by the Fund. The Board considered the amount of the advisory fee to be retained by the Advisor and the amount to be paid to TLC, with respect to the various services to be provided by the Advisor and TLC. The Board also noted that the Advisor negotiated the sub-advisory fee with TLC at arm’s length.
The Board also considered TLC’s investment performance as represented by the TLC Large Cap Core Composite and the Fund’s performance record under Todd’s management. The Board reviewed TLC’s investment performance across various sectors, highlighting the strong returns of the TLC Large Cap Core Composite. The Board was mindful of the Advisor’s focus on the performance of sub-advisors, including TLC, and the Advisor’s ways of addressing underperformance. Based upon their review, the Board concluded that the Fund’s proposed sub-advisory fee was reasonable in light of the services to be received by the Fund from TLC.
Conclusion. The Board reached the following conclusions regarding the New Sub-Advisory Agreement: (a) TLC is qualified to manage the Fund’s assets in accordance with the Fund’s investment goal and policies; (b) TLC maintains an appropriate compliance program; (c) the Fund’s proposed sub-advisory fee is reasonable in light of the services to be provided by TLC; and (d) TLC’s proposed investment strategies are appropriate for pursuing the investment goal of the Fund. In considering the approval of the New Sub-Advisory Agreement, the Board, including the Independent Trustees, did not identify any single factor as controlling, and each Trustee attributed different weights to the various factors. Based on its conclusions, the Board, including a majority of the Independent Trustees, determined that approval of the New Sub-Advisory Agreement was in the best interests of the Fund and its shareholders.
In connection with the approval of TLC as the sub-advisor to the Fund at the Meeting, the Advisor also proposed to the Board the appointment of Russell Implementation Services, Inc. (“Russell”), as the interim sub-advisor to the Fund. The Board approved the appointment of Russell as the interim sub-advisor, effective on or around September 1, 2015, until on or about November 30, 2015.
The Advisor and Russell provided the Board with various written materials in advance of the Meeting to assist with the Board’s consideration of the interim sub-advisory agreement between the Advisor and Russell (the “Interim Sub-Advisory Agreement”). The Advisor provided written and oral information stating the basis for its recommendation to engage Russell as interim sub-advisor. The information also included details regarding Russell’s: (a) investment philosophy and investment process; (b) investment management services proposed to be provided to the Fund; (c) investment management personnel; (d) operating history, infrastructure and
Other Items (Unaudited) (Continued)
financial condition; (e) proposed sub-advisory fee that would be paid to Russell by the Advisor; and (f) reputation, expertise and resources as an interim investment advisor. The Board then discussed the written materials that the Board received before the Meeting and all other information that the Board received at the Meeting.
The Board, including the Independent Trustees, voting separately, unanimously determined that the proposal to approve the Interim Sub-Advisory Agreement would be in the best interests of the shareholders and the Fund. In approving the Interim Sub-Advisory Agreement, the Board considered various factors, among them: (1) the nature, extent, and quality of services to be provided by Russell to the Fund, including the personnel who would be providing such services; (2) Russell’s proposed compensation; (3) Russell’s past performance; and (4) the terms of the Interim Sub-Advisory Agreement. The Board’s analysis of these factors is set forth below. The Independent Trustees were advised by independent legal counsel throughout the process.
Nature, Extent and Quality of Services Provided; Investment Personnel. The Board considered information provided by the Advisor regarding the services to be provided by Russell. The Board considered Russell’s level of knowledge and investment style. The Board reviewed the experience and credentials of the investment personnel who would be responsible for managing the investment of portfolio securities with respect to the Fund. The Board also took into consideration that the Advisor was satisfied with Russell’s in-house risk and compliance teams.
Russell’s Compensation. The Board took into consideration the financial condition of Russell and any direct and indirect benefits to be derived by Russell and its affiliates, from Russell’s relationship with the Fund. In considering the anticipated level of profitability to Russell and its affiliates, the Board noted the proposed contractual undertaking of the Advisor to maintain expense limitations for the Fund and also noted that the proposed interim sub-advisory fee under the Interim Sub-Advisory Agreement would be paid by the Advisor out of the advisory fee that it receives from the Fund, and that the proposed interim sub-advisory fee was negotiated at arm’s length between the Advisor and Russell. As a consequence, the anticipated level of profitability to Russell from its relationship with the Fund was not a substantial factor in the Board’s deliberations. For similar reasons, the Board did not consider potential economies of scale in Russell’s management of the Fund to be a substantial factor in its consideration.
Interim Sub-Advisory Fee and Fund Performance. The considered that the Fund would pay an advisory fee to the Advisor and that the Advisor would pay an interim sub-advisory fee to Russell out of that advisory fee. The Board also took into account the interim sub-advisory fees other Touchstone funds had paid for transition services provided by Russell; noting that the proposed interim sub-advisory fee was comparable to those other fees. The Board also compared Russell’s proposed interim sub-advisory fee to the sub-advisory fee paid to Todd, noting that the proposed interim sub-advisory fee to be paid to Russell was lower than Todd’s sub-advisory fee. The Board considered the amount of the advisory fee to be retained by the Advisor and the amount to be paid to Russell, with respect to the various services to be provided by the Advisor and Russell. The Board also noted that the Advisor negotiated the interim sub-advisory fee with Russell at arm’s length.
The Board also considered Russell’s investment performance and the Fund’s performance record under Todd’s management. The Board also noted that Russell has served as interim sub-advisor for four other Touchstone funds during sub-advisor transitions and that the Advisor was satisfied with Russell’s management of those funds. Based upon their review, the Board concluded that the Fund’s proposed interim sub-advisory fee was reasonable in light of the services to be received by the Fund from Russell.
Conclusion. The Board reached the following conclusions regarding the Interim Sub-Advisory Agreement: (a) Russell is qualified to manage the Fund’s assets in accordance with the Fund’s investment goal and policies; (b) Russell maintains an appropriate compliance program; (c) the Fund’s proposed interim sub-advisory fee is reasonable in relation to the fees paid by other Touchstone funds for transition services; and (d) Russell’s proposed investment strategies are appropriate for pursuing the investment goal of the Fund. In considering the approval of the Interim Sub-Advisory Agreement, the Board, including the Independent Trustees, did not identify any
Other Items (Unaudited) (Continued)
single factor as controlling, and each Trustee may have attributed different weights to the various factors. Based on its conclusions, the Board, including a majority of the Independent Trustees, determined that approval of the Interim Sub-Advisory Agreement was in the best interests of the Fund and its shareholders.
Management of the Trust (Unaudited)
Listed below is required information regarding the Trustees and principal officers of the Trust. The Trust’s Statement of Additional Information includes additional information about the Trustees and is available, without charge, upon request by calling 1.800.543.0407 or by visiting the Touchstone website at Touchstone Investments.com.
Interested Trustee1:
| | | | | | | | | Number | | |
| | | | | | | | | of Funds | | |
| | | | | | | | | Overseen | | |
| | | | | Term of | | | | in the | | |
| Name | | Position(s) | | Office And | | | | Touchstone | | Other |
| Address | | Held with | | Length of | | Principal Occupation(s) | | Fund | | Directorships |
| Age | | Trust | | Time Served | | During Past 5 Years | | Complex2 | | Held During the Past 5 Years3 |
| | | | | | | | | | | |
Jill T. McGruder Touchstone Advisors, Inc. 303 Broadway Suite 1100 Cincinnati, OH 45202 Year of Birth: 1955 | | President and Trustee | | Until retirement at age 75 or until she resigns or is removed Trustee since 1999 | | President and CEO of IFS Financial Services, Inc. (a holding company). | | 39 | | Director of LaRosa’s, Inc. (a restaurant chain) from 1999 to 2011; IFS Financial Services, Inc. (a holding company) from 1999 to the present; Integrity and National Integrity Life Insurance Co. from 2005 to the present; Touchstone Securities (the Trust’s distributor) from 1999 to the present; Touchstone Advisors (the Trust’s investment advisor and administrator) from 1999 to the present; W&S Brokerage Services (a brokerage company) from 1999 to the present; W&S Financial Group Distributors (a distribution company) from 1999 to the present; Every Child Succeeds (a social services agency) from 2007 to the present; Taft Museum of Art from 2007 to the present; and YWCA of Greater Cincinnati from 2012 to the present. |
| Independent Trustees: | | | | | | | | |
| | | | | | | | | |
Phillip R. Cox c/o Touchstone Advisors, Inc. 303 Broadway Suite 1100 Cincinnati, OH 45202 Year of Birth: 1947 | | Trustee | | Until retirement at age 75 or until he resigns or is removed Trustee since 1999 | | President and Chief Executive Officer of Cox Financial Corp. (a financial services company) from 1971 to the present. | | 39 | | Director of Cincinnati Bell (a communications company) from 1994 to the present; Bethesda Inc. (a hospital) from 2005 to the present; Timken Co. (a manufacturing company) from 2004 to the 2014; TimkenSteel from 2014 to the present; Diebold, Inc. (a technology solutions company) from 2004 to the present; and Ohio Business Alliance for Higher Education and the Economy from 2005 to the present. |
| | | | | | | | | | | |
William C. Gale c/o Touchstone Advisors, Inc. 303 Broadway Suite 1100 Cincinnati, OH 45202 Year of Birth: 1952 | | Trustee | | Until retirement at age 75 or until he resigns or is removed Trustee since 2013 | | Senior Vice President and Chief Financial Officer (from 2003 to January 2015) of Cintas Corporation (a business services company). | | 39 | | None. |
| | | | | | | | | | | |
Susan J. Hickenlooper, CFA c/o Touchstone Advisors, Inc. 303 Broadway Suite 1100 Cincinnati, OH 45202 Year of Birth: 1946 | | Trustee | | Until retirement at age 75 or until she resigns or is removed Trustee since 2009 | | Financial Analyst for Impact 100 (charitable organization) from 2012 to 2013. | | 39 | | Trustee of Diocese of Southern Ohio from 2014 to present; and Trustee of Episcopal Retirement Homes Foundation from 1998 to 2011 (a charitable organization). |
Management of the Trust (Unaudited) (Continued)
| Independent Trustees (Continued): |
| | | | | | | | | | | |
| | | | | | | | | Number | | |
| | | | | | | | | of Funds | | |
| | | | | | | | | Overseen | | |
| | | | | Term of | | | | in the | | |
| Name | | Position(s) | | Office And | | | | Touchstone | | Other |
| Address | | Held with | | Length of | | Principal Occupation(s) | | Fund | | Directorships |
| Age | | Trust | | Time Served | | During Past 5 Years | | Complex2 | | Held During the Past 5 Years3 |
| | | | | | | | | | | |
Kevin A. Robie c/oTouchstone Advisors, Inc. 303 Broadway Suite 1100 Cincinnati, OH 45202 Year of Birth: 1956 | | Trustee | | Until retirement at age 75 or until he resigns or is removed Trustee since 2013 | | Vice President of Portfolio Management at Soin International LLC (a multinational holding company) from 2004 to the present. | | 39 | | Director of Buckeye EcoCare, Inc. (a lawn care company) from 2013 to the present; Trustee of Dayton Region New Market Fund, LLC (a private fund) from 2010 to the present; Trustee of the Entrepreneurs Center, Inc. (a small business incubator) from 2006 to the present; and Director of Interventional Imaging, Inc. (a medical device company) from 2004 to 2011. |
| | | | | | | | | | | |
Edward J. VonderBrink c/o Touchstone Advisors, Inc. 303 Broadway Suite 1100 Cincinnati, OH 45202 Year of Birth: 1944 | | Trustee | | Until retirement at age 75 or until he resigns or is removed Trustee since 2013 | | Consultant, VonderBrink Consulting LLC from 2000 to the present. | | 39 | | Director of Streamline Health Solutions, Inc. (healthcare IT) from 2006 to the present; Mercy Health from 2013 to the present; Mercy Health Foundation (healthcare nonprofit) from 2008 to the present; and Al Neyer Inc. (a construction company) from 2013 to the present. |
| 1 | Ms. McGruder, as a director of the Advisor and the Trust's Distributor, and an officer of affiliates of the Advisor and the Distributor, is an “interested person” of the Trust within the meaning of Section 2(a)(19) of the 1940 Act. |
| 2 | As of December 31, 2015, the Touchstone Fund Complex consists of 6 variable annuity series of the Trust, 12 series of Touchstone Funds Group Trust, 2 series of Touchstone Investment Trust, 17 series of Touchstone Strategic Trust, 1 series of Touchstone Tax-Free Trust, and 1 series of Touchstone Institutional Funds Trust. |
| 3 | Each Trustee is also a Trustee of Touchstone Funds Group Trust, Touchstone Institutional Funds Trust, Touchstone Investment Trust, Touchstone Strategic Trust and Touchstone Tax-Free Trust. |
Management of the Trust (Unaudited) (Continued)
The following is a list of the Principal Officers of the Trusts, the length of time served and principal occupations for the past five years.
| Principal Officers: | | | | | | |
| | | | | Term of | | |
| Name | | Position(s) | | Office And | | |
| Address | | Held with | | Length of | | Principal Occupation(s) |
| Age | | Trust1 | | Time Served | | During the Past 5 Years |
| | | | | | | |
Jill T. McGruder Touchstone Advisors, Inc. 303 Broadway Suite 1100 Cincinnati, OH 45202 Year of Birth: 1955 | | President and Trustee | | Until resignation, removal or disqualification President since 2006 | | See biography above. |
| | | | | | | |
Steven M. Graziano Touchstone Advisors, Inc. 303 Broadway Suite 1100 Cincinnati, OH 45202 Year of Birth: 1954 | | Vice President | | Until resignation, removal or disqualification Vice President since 2009 | | President of Touchstone Advisors, Inc. |
| | | | | | | |
Timothy D. Paulin Touchstone Advisors, Inc. 303 Broadway Suite 1100 Cincinnati, OH 45202 Year of Birth: 1963 | | Vice President | | Until resignation, removal or disqualification Vice President since 2010 | | Senior Vice President of Investment Research and Product Management of Touchstone Advisors, Inc.; Director of Product Design of Klein Decisions, Inc. (2003 – 2010). |
| | | | | | | |
Timothy S. Stearns Touchstone Advisors, Inc. 303 Broadway Suite 1100 Cincinnati, OH 45202 Year of Birth: 1963 | | Chief Compliance Officer | | Until resignation, removal or disqualification Chief Compliance Officer since 2013 | | Chief Compliance Officer of Touchstone Advisors, Inc.; Chief Compliance Officer of Envestnet Asset Management, Inc. (2009 to 2013). |
| | | | | | | |
Terrie A. Wiedenheft Touchstone Advisors, Inc. 303 Broadway Suite 1100 Cincinnati, OH 45202 Year of Birth: 1962 | | Controller and Treasurer | | Until resignation, removal or disqualification Controller and Treasurer since 2006 | | Senior Vice President, Chief Financial Officer and Chief Operations Officer of IFS Financial Services, Inc. (a holding company). |
| | | | | | | |
Ellen Blanchard BNY Mellon 201 Washington St., 34th Fl. Boston, MA 02108 Year of Birth: 1973 | | Secretary | | Until resignation, removal or disqualification Secretary since 2015 | | Director and Senior Counsel of BNY Mellon Investment Servicing (US) Inc. |
| 1 | Each officer also holds the same office with Touchstone Funds Group Trust, Touchstone Institutional Funds Trust, Touchstone Investment Trust, Touchstone Strategic Trust and Touchstone Tax-Free Trust. |
PRIVACY PROTECTION POLICY
We Respect Your Privacy
Thank you for your decision to invest with us. Touchstone and its affiliates have always placed a high value on the trust and confidence our clients place in us. We believe that confidence must be earned and validated through time. In today’s world, when technology allows the sharing of information at light speeds, trust must be reinforced by our sincere pledge to take the steps necessary to ensure that the information you share with us is treated with respect and confidentiality.
Our Pledge to Our Clients
| • | We collect only the information we need to service your account and administer our business. |
| • | We are committed to keeping your information confidential and we place strict limits and controls on the use and sharing of your information. |
| • | We make every effort to ensure the accuracy of your information. |
We Collect the Following Nonpublic Personal Information About You:
| • | | Information we receive from you on or in applications or other forms, correspondence, or conversations, including, but not limited to, your name, address, phone number, social security number, assets, income and date of birth; and |
| • | | Information about your transactions with us, our affiliates, or others, including, but not limited to, your account number and balance, payment history, parties to transactions, cost basis information, and other financial information. |
Categories of Information We Disclose and Parties to Whom We Disclose
We do not disclose any nonpublic personal information about our current or former clients to nonaffiliated third parties, except as required or permitted by law.
We Place Strict Limits and Controls on the Use and Sharing of Your Information
| • | We restrict access to nonpublic personal information about you to authorized employees who need the information to administer your business. |
| • | We maintain physical, electronic and procedural safeguards that comply with federal standards to protect this information. |
| • | We do not disclose any nonpublic personal information about our current or former clients to anyone, except as required or permitted by law or as described in this document. |
| • | We will not sell your personal information to anyone. |
We May Provide Information to Service Your Account
Sometimes it is necessary to provide information about you to various companies such as transfer agents, custodians, broker-dealers and marketing service firms to facilitate the servicing of your account. These organizations have a legitimate business need to see some of your personal information in order for us to provide service to you. We may disclose to these various companies the information that we collect as described above. We require that these companies, including our own subsidiaries and affiliates, strictly maintain the confidentiality of this information and abide by all applicable laws. Companies within our corporate family that may receive this information are financial service providers and insurance companies. We do not permit these associated companies to sell the information for their own purposes, and we never sell our customer information.
This policy is applicable to the following affiliated companies: Touchstone Funds Group Trust, Touchstone Investment Trust, Touchstone Strategic Trust, Touchstone Tax-Free Trust, Touchstone Variable Series Trust, Touchstone Institutional Funds Trust, Touchstone Securities, Inc.,* and W&S Brokerage Services, Inc.
* Touchstone Securities, Inc. serves as the underwriter to the Touchstone Funds.
A Member of Western & Southern Financial Group®
The Privacy Protection Policy is not part of the Annual Report.

TSF-1006-TVST-AR-1512
Item 2. Code of Ethics.
| (a) | The registrant, as of the end of the period covered by this report, has adopted a code of ethics that applies to the registrant’s principal executive officer, principal financial officer, principal accounting officer or controller, or persons performing similar functions, regardless of whether these individuals are employed by the registrant or a third party. |
| (c) | There have been no amendments, during the period covered by this report, to a provision of the code of ethics that applies to the registrant’s principal executive officer, principal financial officer, principal accounting officer or controller, or persons performing similar functions, regardless of whether these individuals are employed by the registrant or a third party, and that relates to any element of the code of ethics description. |
| (d) | The registrant has not granted any waivers, including an implicit waiver, from a provision of the code of ethics that applies to the registrant’s principal executive officer, principal financial officer, principal accounting officer or controller, or persons performing similar functions, regardless of whether these individuals are employed by the registrant or a third party, that relates to one or more of the items set forth in paragraph (b) of this item’s instructions. |
Item 3. Audit Committee Financial Expert.
The registrant’s Board of Trustees has determined that the registrant has at least one audit committee financial expert serving on its audit committee. Mr. William Gale is the registrant’s audit committee financial expert and is an independent trustee within the meaning of the Investment Company Act of 1940, as amended (the “1940 Act”).
Item 4. Principal Accountant Fees and Services.
Audit Fees
| (a) | Audit fees for Touchstone Variable Series Trust totaled $89,500 and $130,300 in fiscal 2015 and 2014, respectively, including fees associated with the annual audit and filing of Form N-1A and Form N-SAR. |
Audit-Related Fees
| (b) | Audit-related fees totaled $18,000 and $0 in fiscal 2015 and 2014, respectively. The fees related to issuing consents for N-1A and N-14 filings. |
Tax Fees
| (c) | Fees for tax compliance services totaled $33,980 and $26,600 in fiscal 2015 and 2014, respectively. Fees relate to the preparation of federal income tax returns and review of capital gains distribution calculations. |
All Other Fees
| (d) | The aggregate fees billed in each of the last two fiscal years for products and services provided by the principal accountant, other than the services reported in paragraphs (a) through (c) of this Item are $2,885 for 2015 and $2,352 for 2014, respectively. The fees are related to the PFIC Analyzer and Global Withholding Tax Reporter subscriptions. |
| (e)(1) | Disclose the audit committee's pre-approval policies and procedures described in paragraph (c)(7) of Rule 2-01 of Regulation S-X. |
The Audit Committee’s pre-approval policies describe the types of audit, audit-related, tax and other services that have the general pre-approval of the Audit Committee. The pre-approval policies provide that annual audit service fees, tax services not specifically granted pre-approval, services exceeding pre-approved cost levels and other services that have not received general pre-approval will be subject to specific pre-approval by the Audit Committee. The pre-approval policies further provide that the Committee may grant general pre-approval to other audit services (statutory audits and services associated with SEC registration statements, periodic reports and other documents filed with the SEC or other documents issued in connection with securities offerings), audit-related services (accounting consultations related to accounting, financial reporting or disclosure matters not classified as “audit services,” assistance with understanding and implementing new accounting and financial reporting guidance from rulemaking authorities, agreed-upon or expanded audit procedures related to accounting and/or billing records required to respond to or comply with financial, accounting or regulatory reporting matters and assistance with internal control reporting requirements under Form N-SAR and Form N-CSR), tax services that have historically been provided by the auditor that the Committee believes would not impair the independence of the auditor and are consistent with the SEC’s rules on auditor independence and permissible non-audit services classified as “all other services” that are routine and recurring services.
| (e)(2) | All services described in paragraphs (c) through (d) of Item 4 were approved by the Audit Committee. Not applicable for paragraph (b) of Item 4. |
| (f) | The percentage of hours expended on the principal accountant's engagement to audit the registrant's financial statements for the most recent fiscal year that were attributed to work performed by persons other than the principal accountant's full-time, permanent employees was less than fifty percent. |
| (g) | The aggregate non-audit fees for Touchstone Variable Series Trust and certain entities*, totaled approximately $36,865 and $28,952, in 2015 and 2014, respectively. |
* These include the advisors (excluding sub-advisors) and any entity controlling, controlled by or under common control with the advisors that provides ongoing services to the registrant (Funds).
| (h) | The registrant's audit committee of the board of trustees has considered whether the provision of non-audit services that were rendered to the registrant's investment adviser (not including any sub-adviser whose role is primarily portfolio management and is subcontracted with or overseen by another investment adviser), and any entity controlling, controlled by, or under common control with the investment adviser that provides ongoing services to the registrant that were not pre-approved pursuant to paragraph (c)(7)(ii) of Rule 2-01 of Regulation S-X is compatible with maintaining the principal accountant's independence. |
Item 5. Audit Committee of Listed Registrants.
Not applicable.
Item 6. Investments.
| (a) | Schedule of Investments in securities of unaffiliated issuers as of the close of the reporting period is included as part of the report to shareholders filed under Item 1 of this form. |
Item 7. Disclosure of Proxy Voting Policies and Procedures for Closed-End Management Investment Companies.
Not applicable.
Item 8. Portfolio Managers of Closed-End Management Investment Companies.
Not applicable.
Item 9. Purchases of Equity Securities by Closed-End Management Investment Company and Affiliated Purchasers.
Not applicable.
Item 10. Submission of Matters to a Vote of Security Holders.
There have been no material changes to the procedures by which the shareholders may recommend nominees to the registrant’s board of trustees, where those changes were implemented after the registrant last provided disclosure in response to the requirements of Item 407(c)(2)(iv) of Regulation S-K (17 CFR 229.407) (as required by Item 22(b)(15) of Schedule 14A (17 CFR 240.14a-101)), or this Item.
Item 11. Controls and Procedures.
| (a) | The registrant’s principal executive and principal financial officers, or persons performing similar functions, have concluded that the registrant’s disclosure controls and procedures (as defined in Rule 30a-3(c) under the Investment Company Act of 1940, as amended (the “1940 Act”) (17 CFR 270.30a-3(c))) are effective, as of a date within 90 days of the filing date of the report that includes the disclosure required by this paragraph, based on their evaluation of these controls and procedures required by Rule 30a-3(b) under the 1940 Act (17 CFR 270.30a-3(b)) and Rules 13a-15(b) or 15d-15(b) under the Securities Exchange Act of 1934, as amended (17 CFR 240.13a-15(b) or 240.15d-15(b)). |
| (b) | There were no changes in the registrant’s internal control over financial reporting (as defined in Rule 30a-3(d) under the 1940 Act (17 CFR 270.30a-3(d)) that occurred during the registrant’s second fiscal quarter of the period covered by this report that has materially affected, or is reasonably likely to materially affect, the registrant’s internal control over financial reporting. |
Item 12. Exhibits.
| (a)(1) | Code of ethics, or any amendment thereto, that is the subject of disclosure required by Item 2 is attached hereto. |
| (a)(2) | Certifications pursuant to Rule 30a-2(a) under the 1940 Act and Section 302 of the Sarbanes-Oxley Act of 2002 are attached hereto. |
| (b) | Certifications pursuant to Rule 30a-2(b) under the 1940 Act and Section 906 of the Sarbanes- Oxley Act of 2002 are attached hereto. |
| (12.other) | Not applicable. |
SIGNATURES
Pursuant to the requirements of the Securities Exchange Act of 1934 and the Investment Company Act of 1940, the registrant has duly caused this report to be signed on its behalf by the undersigned, thereunto duly authorized.
| (Registrant) | Touchstone Variable Series Trust | |
| By (Signature and Title)* | /s/ Jill T. McGruder | |
| | Jill T. McGruder, President | |
| | (principal executive officer) | |
Pursuant to the requirements of the Securities Exchange Act of 1934 and the Investment Company Act of 1940, this report has been signed below by the following persons on behalf of the registrant and in the capacities and on the dates indicated.
| By (Signature and Title)* | /s/ Jill T. McGruder | |
| | Jill T. McGruder, President | |
| | (principal executive officer) | |
| By (Signature and Title)* | /s/ Terrie A. Wiedenheft | |
| | Terrie A. Wiedenheft, Controller and Treasurer | |
| | (principal financial officer) | |
* Print the name and title of each signing officer under his or her signature.