UNITED STATES
SECURITIES AND EXCHANGE COMMISSION
Washington, D.C. 20549
FORM N-CSR
CERTIFIED SHAREHOLDER REPORT OF REGISTERED MANAGEMENT INVESTMENT COMPANIES
Investment Company Act file number 811-08416
Touchstone Variable Series Trust
(Exact name of registrant as specified in charter)
303 Broadway, Suite 1100
Cincinnati, Ohio 45202-4203
(Address of principal executive offices) (Zip code)
Jill T. McGruder
303 Broadway, Suite 1100
Cincinnati, Ohio 45202-4203
(Name and address of agent for service)
Registrant's telephone number, including area code: 800-638-8194
Date of fiscal year end: December 31
Date of reporting period: December 31, 2017
Form N-CSR is to be used by management investment companies to file reports with the Commission not later than 10 days after the transmission to stockholders of any report that is required to be transmitted to stockholders under Rule 30e-1 under the Investment Company Act of 1940 (17 CFR 270.30e-1). The Commission may use the information provided on Form N-CSR in its regulatory, disclosure review, inspection, and policymaking roles.
A registrant is required to disclose the information specified by Form N-CSR, and the Commission will make this information public. A registrant is not required to respond to the collection of information contained in Form N-CSR unless the Form displays a currently valid Office of Management and Budget ("OMB") control number. Please direct comments concerning the accuracy of the information collection burden estimate and any suggestions for reducing the burden to Secretary, Securities and Exchange Commission, 450 Fifth Street, NW, Washington, DC 20549-0609. The OMB has reviewed this collection of information under the clearance requirements of 44 U.S.C. § 3507.
Item 1. Reports to Stockholders.
The Report to Shareholders is attached herewith.
December 31, 2017
Annual Report
Touchstone Variable Series Trust
Touchstone Active Bond Fund
Touchstone Balanced Fund
Touchstone Bond Fund
Touchstone Common Stock Fund
Touchstone Focused Fund
Touchstone Large Cap Core Equity Fund
Touchstone Small Company Fund
Touchstone Aggressive ETF Fund
Touchstone Conservative ETF Fund
Touchstone Moderate ETF Fund

Table of Contents
This report identifies the Funds' investments on December 31, 2017. These holdings are subject to change. Not all investments in each Fund performed the same, nor is there any guarantee that these investments will perform as well in the future. Market forecasts provided in this report may not occur.
2
Dear Shareholder:
We are pleased to provide you with the Touchstone Variable Series Trust Annual Report. Inside you will find key financial information, as well as manager commentaries, for the Funds for the 12-months ended December 31, 2017.
Nearly ten years after the 2008 Credit Crisis, the economic recovery finally seemed to have taken hold in calendar year 2017. Economists and market strategists trumpeted the start of a “synchronized global expansion” as economic growth in the U.S., Japan, Europe and China aligned to provide a powerful impetus for a broader acceleration in global growth. While economic strength was synchronized across the world, monetary policies experienced further divergence. The Bank of Japan and the European Central Bank maintained accommodative stances, providing ample stimulus in an effort to sustain recent positive growth trends in gross domestic product after years of economic fragility. Meanwhile, with solid growth entrenched in the U.S., the U.S. Federal Reserve Board (Fed) continued moving toward its goal of monetary policy normalization by raising rates in March, June, and December and announcing plans to reduce the size of its balance sheet.
Global equities posted strong double-digit returns across most broad U.S. and non-U.S. equity indexes. Growth-oriented stocks led U.S. equity markets and outperformed their value-oriented counterparts, while large-capitalization stocks outperformed small- and mid-capitalization stocks. Outside the U.S., emerging market equities generated very strong returns followed closely by developed market equities.
While the Fed’s three rate hikes during the year pushed short-term rates higher, longer-term rates remained mostly range bound. This stable interest rate environment for intermediate to long-term interest rates allowed investment grade corporate bonds to generate solid returns. Non-investment grade bonds benefitted from the low default environment and stronger economic growth to lead the fixed income market.
The new year provides a natural point to assess the recent past and to look toward the future. From a financial perspective, it has been yet another period of strong returns across many asset classes. This makes it a particularly timely juncture to assess your current financial situation and, with the help of your financial advisor, re-assess your plans for the year – and years ahead.
We greatly appreciate your continued support. Thank you for including Touchstone as part of your investment plan.
| Sincerely, | |
 | |
| Jill T. McGruder | |
| President | |
| Touchstone Variable Series Trust |
3
Management's Discussion of Fund Performance (Unaudited)
Touchstone Active Bond Fund
Sub-Advised by Fort Washington Investment Advisors, Inc.
Investment Philosophy
The Touchstone Active Bond Fund seeks to provide as high a level of current income as is consistent with the preservation of capital. Capital appreciation is a secondary goal. In deciding what securities to buy and sell for the Fund, the overall investment opportunities and risks in different sectors of the debt securities market are analyzed by focusing on maximizing total return and reducing volatility of the Fund’s portfolio. A disciplined sector allocation process is followed to build a broadly diversified portfolio of investments.
Fund Performance
The Touchstone Active Bond Fund performed in-line with its benchmark, the Bloomberg Barclays U.S. Aggregate Bond Index, for the 12-month period ended December 31, 2017. The Fund’s total return was 3.54 percent, while the benchmark’s total return was 3.54 percent.
Market Environment
Risk assets performed well in 2017 and did so at extremely low levels of volatility. Performance was driven by a steady increase in optimism surrounding the prospects for both domestic and global economic growth, which has been substantiated with solid underlying fundamentals. Credit spreads tightened over the course of the year, leading to the outperformance of Corporate Bonds over U.S. Treasuries. High Yield issues produced the strongest performance of any fixed income sector, and investment grade corporates also posted solid returns for the year.
The yield curve flattened in 2017 with rates on the front end of the curve rising, and the long end falling. U.S. 10-year Treasury yields essentially started and ended the year with the same yield. This does not mean, however, that yields were stable during the course of the fiscal year, as they moved considerably. The long end of the curve fell considerably and bottomed in September before rebounding as inflation expectations increased amid solid economic growth and improvement in underlying fundamentals. These same factors prompted the U.S. Federal Reserve Board (Fed) to raise its target overnight rate three times during 2017. We believe markets have priced in between two and three additional hikes in 2018, expectations that seem reasonable given the strong underlying fundamentals currently present in the economy. The appointment of Jerome Powell to lead the Fed is unlikely to materially alter the Fed’s path to raise rates. However, the appointment of five new members of the Fed warrants close attention as they have the potential to shift the path put in place by previous members.
Financial conditions continued to be supportive of risk assets and continued economic growth in 2017, ending the year at the easiest levels since 2014. Credit spreads for both investment grade and high yield bonds contracted significantly and are now at multi-year lows. Global central bank policy has remained generally accommodative, but will directionally move less so in developed countries.
Portfolio Review
Overall, the Fund matched the performance of the benchmark during the fiscal year due to its overweight of non-Treasury sectors and security selection. The Fund’s allocation to High Yield over the year contributed to performance as that sector benefited from tightening credit spreads and a low default rate environment. The Fund’s allocation to High Yield was a strong contributor in the first three quarters of the fiscal year. We believed that the sector offered adequate compensation for credit and liquidity risk, though we reduced the position throughout the year as tightening credit spreads reduced the return potential for High Yield issues. By the end of the third quarter, however, credit spreads had contracted to cycle lows, causing us to eliminate the Fund’s
4
Management's Discussion of Fund Performance (Unaudited) (Continued)
exposure to High Yield, as the risk/reward profile was no longer attractive relative to other non-Treasury sectors. Capital was reallocated to the securitized sector, which we believed offered a more attractive risk/reward profile, particularly within the Asset-Backed and Non-Agency Mortgage-Backed sectors. These are closely related to the health of the consumer, which we believe to be strong given the low unemployment rate and reasonable consumer debt levels. The reduction in High Yield exposure is indicative of a broader de-risking in the portfolio, as rich valuations in the fixed income markets have pushed us to reduce our risk target to the low-end of its range. The Fund remains slightly overweight risk assets relative to the benchmark given our positive economic outlook and anticipation of a benign default environment.
Other drivers of relative performance included security selection within investment grade corporate bonds, as well as interest rate risk and yield curve positioning. The Fund was mostly neutral duration relative to the benchmark for the year, however tactical short term shifts had a positive impact on Fund performance. We have opportunistically invested in Treasury Inflation Protected Securities (TIPS) over the past year, which also contributed to returns as inflation expectations increased in the second half of the year.
Outlook
Financial conditions remain stable, economic fundamentals are solid, and recession risk is increasingly low, notwithstanding the age of the credit cycle. Given this backdrop, the Fund continues to be moderately overweight risk assets relative to the benchmark. However, this overweight has declined somewhat in recent quarters as asset prices have increased to reflect the market’s optimistic view of the economy. While we think the potential for significant further tightening is remote, we believe a sustained widening seems unlikely, barring an external shock as the fundamental and technical outlooks remain strong. As such, we remain comfortable with the Fund’s modest overweight to risk given the positive economic outlook and low rate of expected defaults. Global factors will be watched closely for any broader impact which might influence the economic outlook and affect the Fund’s allocation to risk assets.
The economic environment and the outlook for further action from the Fed points to higher rates. However, we believe sustained inflation is needed to support a broader selloff in U.S. Treasuries. In the near term, we have positioned the Fund with a bias toward shorter key rate durations, favoring a steeper yield curve.
5
Management's Discussion of Fund Performance (Unaudited) (Continued)
Comparison of the Change in Value of a $10,000 Investment in the
Touchstone Active Bond Fund and the Bloomberg Barclays U.S. Aggregate Bond Index
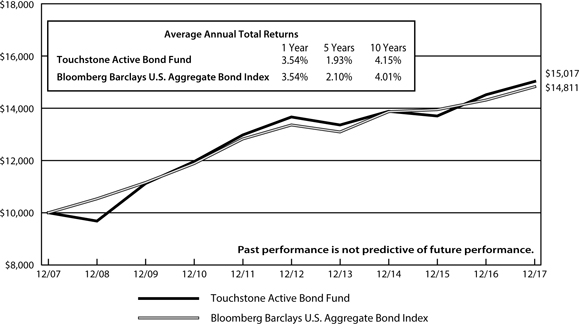
Performance information does not reflect fees that are paid by the separate accounts through which shares of the Fund are sold. Inclusion of those fees would reduce figures for all periods.
The inception date of the Fund was January 1, 1999.
Note to Chart
The Bloomberg Barclays U.S. Aggregate Bond Index is an unmanaged index comprised of U.S. investment grade, fixed rate bond market securities, including government, government agency, corporate and mortgage-backed securities between one and ten years.
6
Management's Discussion of Fund Performance (Unaudited)
Touchstone Balanced Fund
Sub-Advised by Fort Washington Investment Advisors, Inc.
Effective October 28, 2017, the Sentinel Variable Products Balanced Fund was reorganized into the Touchstone Balanced Fund. At that time, Touchstone Advisors, Inc. and Fort Washington Investment Advisors, Inc. were respectively appointed as advisor and sub-advisor to the Fund.
Investment Philosophy
The Fund seeks to achieve its investment goal of providing investors with capital appreciation and current income by generally investing in a diversified portfolio comprising 60% equity securities and 40% fixed-income securities. With respect to equities, the Fund invests primarily in issuers having a market capitalization, at the time of purchase, above $5 billion. Equity securities include common stock and preferred stock. With respect to fixed-income, the Fund will invest primarily in bonds, including mortgage-related securities, asset-backed securities, government securities (both U.S. government securities and foreign sovereign debt), and corporate debt securities.
Fund Performance
The Touchstone Balanced Fund underperformed its first benchmark, the S&P 500® Index, and outperformed its second benchmark, the Bloomberg Barclays U.S. Aggregate Bond Index, for the 12-month period ended December 31, 2017. The Fund’s total return was 14.06 percent while the total return of the S&P 500® Index was 21.83 percent and the total return of the Bloomberg Barclays U.S. Aggregate Bond Index was 3.54 percent.
Market Environment
For the trailing twelve month period ended December 31, 2017, U.S. equities continued the bull market that began in 2009 as the market ended the period near all-time highs. Solid financial conditions and strong profit growth were the key drivers of the market. Consumer and business confidence remained high despite stalled healthcare legislation in the first half of the year. Markets benefited from an added boost in the later stages of 2017 on reports that the White House and Congressional Republican leaders were coalescing around a plan to cut the corporate tax rate. Leading the S&P 500® Index higher was Information Technology, while Health Care, Consumer Discretionary, Materials and Financials sectors also outperformed the broader index over the period. Sectors underperforming the index the most were Energy and Telecommunication Services. Consumer Staples, Utilities, Industrials and Real Estate also lagged.
Within fixed income, U.S. investment grade corporates outperformed U.S. Treasuries and securitized assets. The yield curve flattened over the twelve-month period with short-term rates rising as intermediate- and long-term rates fell. This was driven by the combination of the Fed continuing to gradually raise short-term rates and lower-than-expected inflation subduing the long-end of the yield curve.
Portfolio Review
Among equity sectors, the Fund benefited from stock selection in most sectors with notable success in the Real Estate, Materials and Industrials sectors. The Fund’s stock selection in the Energy and Health Care sectors detracted.
The low interest rate environment and steady economic growth created demand for yield which provided a tailwind to spread sectors. The Fund’s allocations to U.S. Agency bonds were positive contributors to performance, while its underweight to U.S. Corporate Credit detracted. Given the positive move in the market overall, the Fund’s holdings in cash detracted from performance over the period.
7
Management's Discussion of Fund Performance (Unaudited) (Continued)
Outlook
In our view, the equity market is priced at fair value. Three events typically stop a bull market: a credit cycle, higher inflation or an asset bubble. On the credit side, households, corporations, the public sector, and emerging markets are all doing reasonably well at this point. With regard to higher inflation, the balance of power between capital and labor is key. It is labor costs, which comprise approximately 70% of corporate expenses and dominate income statements causing the bulk of profit erosion in the late stages of the business cycle. To address asset bubbles,many investors point to the stocks of Facebook Inc. (Information Technology sector), Apple Inc. (Information Technology sector), Amazon.com Inc. (Consumer Discretionary sector), Netflix Inc. (Consumer Discretionary sector) and Alphabet Inc. (Information Technology sector), the “FAANGs”, as an issue. In our view the FAANGs are undervalued to fairly valued depending on which one you are talking about, plus the makeup of these companies is a far cry from the negative earnings, price-per-click valuation based stocks of the late 1990s. The sectors where below-average discount rates must be used to justify current valuation levels are Consumer Staples, Utilities and part of the Real Estate sector, which are areas where investors typically put their money as a bond substitute. Lastly, the breadth of the market is doing well at this juncture which is a sign of a healthy market. Within fixed income, credit spreads and interest rates are at historically low levels, likely limiting total return potential to income, with little room for price appreciation. Risky assets, such as high yield corporate credit, appear overvalued while “safe haven” assets, such as U.S. Treasuries, provide little return potential with much greater downside risk.
8
Management's Discussion of Fund Performance (Unaudited) (Continued)
Comparison of the Change in Value of a $10,000 Investment in the
Touchstone Balanced Fund, the Bloomberg Barclays U.S. Aggregate Bond Index and the
S&P 500® Index

Performance information does not reflect fees that are paid by the separate accounts through which shares of the Fund are sold. Inclusion of those fees would reduce figures for all periods.
The inception date of the Fund was August 1, 2003.
Notes to Chart
The Bloomberg Barclays U.S. Aggregate Bond Index is an unmanaged index comprised of U.S. investment grade, fixed rate bond market securities, including government, government agency, corporate and mortgage-backed securities between one and ten years.
The S&P 500® Index is a group of 500 widely held stocks and is commonly regarded to be representative of the large capitalization stock universe.
9
Management's Discussion of Fund Performance (Unaudited)
Touchstone Bond Fund
Sub-Advised by Fort Washington Investment Advisors, Inc.
Effective October 28, 2017, the Sentinel Variable Products Bond Fund was reorganized into the Touchstone Bond Fund. At that time,Touchstone Advisors, Inc. and Fort Washington Investment Advisors, Inc. were respectively appointed as advisor and sub-advisor to the Fund.
Investment Philosophy
The Fund seeks to provide as high a level of current income as is consistent with the preservation of capital. Capital appreciation is a secondary goal. Under normal circumstances, the Fund invests at least 80% of its assets in bonds. Bonds include mortgage-related securities, asset-backed securities, government securities and corporate debt securities. The Fund primarily invests in investment-grade debt securities, but may invest up to 30% of the Fund’s total assets in non-investment-grade debt securities.
Fund Performance
The Touchstone Bond Fund outperformed its benchmark, the Bloomberg Barclays U.S. Aggregate Bond Index, for the 12-month period ended December 31, 2017. The Fund’s total return was 3.67 percent, while the benchmark’s total return was 3.54 percent.
Market Environment
The yield curve flattened in 2017 with rates on the front end of the curve rising and on the long end falling. U.S. 10-year Treasury yields started the period at 2.35 percent and essentially ended the year at the same yield, settling at 2.40 percent. This does not mean, however, that yields were stable during the course of the fiscal year, as they moved considerably. The long end of the curve fell considerably and bottomed near 2.00 percent in September 2017 before rebounding as inflation expectations increased amid solid economic growth and improvement in underlying fundamentals. These same factors prompted the Fed to raise its target overnight rate three times during 2017. Markets have priced in between two and three additional hikes in 2018, expectations that seem reasonable given the strong underlying fundamentals currently present in the economy. The appointment of Jerome Powell to lead the Fed is unlikely to materially alter the Fed’s anticipated path to raise rates. However, the appointment of five new members of the Fed warrants close attention, as they have the potential to shift the path put in place by previous members.
Financial conditions continued to be supportive of risk assets and continued economic growth in 2017, ending the year at the easiest levels since 2014. Credit spreads for both investment grade and High Yield Bonds contracted significantly and are now at multi-year lows. Global central bank policy has remained generally accommodative, but will directionally move less so in developed countries.
Portfolio Review
Outperformance for the period was primarily driven by an overweight to corporate bonds, a sector which performed well during the year. Amid an environment of improving economic growth, default rates remained low and credit spreads for corporate bonds tightened.
While returns on cash equivalents improved throughout the year as short-term interest rates increased, cash and cash equivalents still lagged the broader benchmark. As a result, the Fund’s large cash position detracted from relative returns.
With respect to duration, the Fund maintained a barbell approach with large positions in very short maturity securities (e.g., cash and cash equivalents) and longer maturity securities. In aggregate, the Fund had a slightly
10
Management's Discussion of Fund Performance (Unaudited) (Continued)
longer duration relative to the benchmark. With the 10-year Treasury yield relatively unchanged from the start of the fiscal year to the end, this duration positioning was not a significant driver of relative performance.
Outlook
Financial conditions remain stable, economic fundamentals are solid, and recession risk is increasingly low notwithstanding the age of the credit cycle. Given this backdrop, the Fund continued to be moderately overweight risk assets relative to the benchmark. However, this overweight has declined somewhat in recent quarters as asset prices have increased to reflect the market’s optimistic view of the economy. While we think that the potential for significant further tightening is remote, we also believe a sustained widening seems unlikely, barring an external shock as the fundamental and technical outlooks remain strong. As such, we remain comfortable with a modest overweight to risk given the positive economic outlook and low rate of expected defaults. Global factors will be watched closely for any broader impact which might influence the economic outlook and affect the Fund’s allocation to risk assets.
The economic environment and the outlook for further action from the Fed points to higher rates. However, we believe sustained inflation is needed to support a broader selloff in U.S. Treasuries. In the near term, we have positioned the Fund with a bias toward shorter durations, favoring a steeper yield curve.
11
Management's Discussion of Fund Performance (Unaudited) (Continued)
Comparison of the Change in Value of a $10,000 Investment in the
Touchstone Bond Fund and the Bloomberg Barclays U.S. Aggregate Bond Index

Performance information does not reflect fees that are paid by the separate accounts through which shares of the Fund are sold. Inclusion of those fees would reduce figures for all periods.
The inception date of the Fund was August 1, 2003.
Note to Chart
The Bloomberg Barclays U.S. Aggregate Bond Index is an unmanaged index comprised of U.S. investment grade, fixed rate bond market securities, including government, government agency, corporate and mortgage-backed securities between one and ten years.
12
Management's Discussion of Fund Performance (Unaudited)
Touchstone Common Stock Fund
Sub-Advised by Fort Washington Investment Advisors, Inc.
Effective October 28, 2017, the Sentinel Variable Products Common Stock Fund was reorganized into the Touchstone Common Stock Fund. At that time, Touchstone Advisors, Inc. and Fort Washington Investment Advisors, Inc. were respectively appointed as advisor and sub-advisor to the Fund.
Investment Philosophy
The Fund seeks to invest at least 80 percent of its assets in large capitalization equity securities. The Fund’s sub-advisor, Fort Washington Investment Advisors, Inc., seeks to invest in companies that are trading below what is believed to be the estimate of the companies’ intrinsic value and have a sustainable competitive advantage or a high barrier to entry in place. The barrier(s) to entry can be created through a cost advantage, economies of scale, high customer loyalty or a government barrier (e.g. license or subsidy). Fort Washington believes that the strongest barrier to entry is the combination of economies of scale and high customer loyalty.
Fund Performance
The Touchstone Common Stock Fund underperformed its benchmark, the S&P 500® Index, for the 12-month period ended December 31, 2017. The Fund’s total return was 21.50 percent while the benchmark’s total return was 21.83 percent.
Market Environment
For the year, U.S. equities continued the bull market that began in 2009 as the market ended the period near all-time highs. Solid financial conditions and strong profit growth were the key drivers of the market. Consumer and business confidence remained high despite stalled healthcare legislation in the first half of the year. Markets benefited from an added boost in the later stages of 2017 as the White House and Congressional Republican leaders coalesced around a plan for tax reform. Leading the S&P 500® Index higher were the Information Technology, Health Care, Materials, Consumer Discretionary, and Financials sectors. Weaker sectors were Energy, Telecommunication Services, Consumer Staples, Real Estate, and Utilities, while the Industrials sector performed roughly in-line with the benchmark.
Portfolio Review
Sectors in which the Fund outperformed the benchmark included Real Estate, Materials, Industrials, Consumer Staples,Telecommunication Services, and Financials. Consumer Discretionary and Health Care sector positions underperformed while Energy and Information Technology positions performed roughly in-line with the sector. The Fund did not own any Utilities sector stocks during the year. Given the positive move in the market overall, holdings in cash equivalents detracted from performance over the period. Sector allocation was a slight negative to performance primarily due to the overweight in the Energy sector and the aforementioned cash drag.
The Fund’s top contributors for the year were Boeing Co. (Industrials sector), Estee Lauder Co. (Consumer Staples sector), and Equinix, Inc. (Real Estate sector). Boeing, the manufacturer of commercial aircraft, rose significantly during 2017 due to a better-than-expected increase in airplane production and reported large order pipeline. Estee Lauder, the maker of beauty and skin care products, experienced a strong stock price rise during the second half of the year following better-than-expected financial results from its skin care product line. Equinix, a real estate investment trust (REIT) that owns and operates data centers, saw its price rise significantly in the first half of the year following its acquisition of data center properties from Verizon.
The Fund’s top three performance detractors for the year were Amazon.com Inc. and Omnicom Group Inc. (both from the Consumer Discretionary sector), and Merck & Co. (Health Care sector). Amazon.com, an online retail and web services company, experienced strong stock price performance during the year due to
13
Management's Discussion of Fund Performance (Unaudited) (Continued)
better-than-expected reported profit and cash flow figures. However, the Fund bought Amazon.com late in the year during the manager transition and experienced limited participation in the stock. Omnicom Group, an advertising and marketing company primarily operating in traditional media (e.g. print), experienced a decline in its stock price due to a decline within the traditional media market. Merck & Co., a large pharmaceutical company, withdrew its application with the European Union for a lung cancer drug during the fourth quarter. This unexpected news caused a significant, short-term stock sell off in the fourth quarter.
Outlook
While much of the financial media is focused on the latest moves in Bitcoin, the stock market continues to move ahead. The gains were supported by a favorable macroeconomic backdrop. Global economic growth has accelerated at a solid pace, synchronized across major regions. Corporate earnings have enjoyed a strong upturn from their earlier slump in 2015/early 2016 and have outperformed expectations. Plus, inflation has remained low, thereby keeping the Fed and other major central banks in accommodative mode. Finally, we believe passage of the tax reform package will improve corporate cash flows. All these things have combined to fuel higher equity valuations.
In our view, the equity market is priced at fair value. That said, three events that may typically stop a bull market are a credit cycle, higher inflation or an asset bubble. On the credit side, households, corporations, the public sector, and emerging markets are all doing reasonably well at this point. With regard to higher inflation, the balance between capital and labor is key. It is labor costs, which are approximately 70 percent of corporate costs that dominate income statements and cause the bulk of profit erosion in the late stages of the business cycle. Many investors cite the FAANG stocks to make a case for stock valuations being at an asset bubble level. However, our view is that the FAANGs are undervalued to fairly-valued depending on which stock is being analyzed. Plus, the composition of each of these companies is quite different from the negative earnings, price-per-click valuation stocks of the late 1990s. In some circumstances these are winner-take-all industries where scale and network effects allow just a few companies to dominate. But one could argue that the stocks that are potentially overvalued are within the Consumer Staples, Utilities and portions of the Real Estate sectors. More specifically, these stocks operate in more stable, often slower growth parts of the economy and are more sensitive to interest rate changes. Finally, the breadth of the market is broadly doing well at this juncture which is a sign of a healthy market.
14
Management's Discussion of Fund Performance (Unaudited) (Continued)
Comparison of the Change in Value of a $10,000 Investment in the
Touchstone Common Stock Fund and the S&P 500® Index
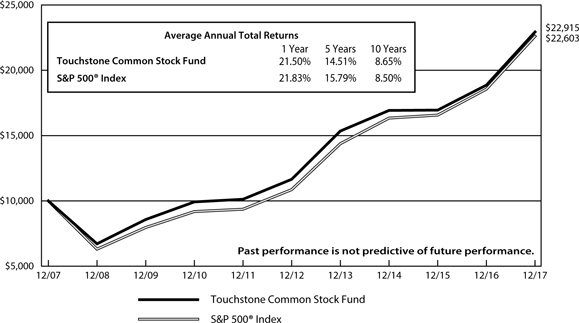
Performance information does not reflect fees that are paid by the separate accounts through which shares of the Fund are sold. Inclusion of those fees would reduce figures for all periods.
The inception date of the Fund was November 30, 2000.
Note to Chart
The S&P 500® Index is a group of 500 widely held stocks and is commonly regarded to be representative of the large capitalization stock universe.
15
Management's Discussion of Fund Performance (Unaudited)
Touchstone Focused Fund
Sub-Advised by Fort Washington Investment Advisors, Inc.
Investment Philosophy
The Touchstone Focused Fund seeks to invest in companies of all capitalizations that are trading below what is believed to be the estimate of their intrinsic value and have a sustainable competitive advantage or a high barrier to entry in place. The barrier(s) to entry can be created through a cost advantage, economies of scale, high customer loyalty or a government barrier (e.g. license or subsidy). Fort Washington believes that the strongest barrier to entry is the combination of economies of scale and high customer loyalty.
Fund Performance
The Touchstone Focused Fund underperformed its benchmarks, the Russell 3000® Index and the S&P 500® Index, for the 12-month period ended December 31, 2017. The Fund’s total return was 13.64 percent while the total return of the Russell 3000® Index was 21.13 percent and the total return of the S&P 500® Index was 21.83 percent.
Market Environment
For the year, U.S. equities continued the bull market that began in 2009 as the market ended the period near all-time highs. Solid financial conditions and strong profit growth were the key drivers of the market. Consumer and business confidence remained high despite stalled healthcare legislation in the first half of the year. Markets benefited from an added boost in the later stages of 2017 as the White House and Congressional Republican leaders coalesced around a plan for tax reform.
Leading the benchmark higher were the Information Technology, Health Care, Materials, Industrials and Consumer Discretionary sectors. The weaker sectors were Energy, Financials and Real Estate.
Portfolio Review
Sectors in which the Fund outperformed the benchmark included Consumer Discretionary and Real Estate. The Industrials, Energy, Consumer Staples, Materials, Telecommunication Services, and Information Technology sectors all underperformed the benchmark. The Financials and Health Care sectors performed approximately in-line with the benchmark over the course of the year. Given the positive move in the market overall, holdings in cash detracted from performance. In sum, sector allocation was slightly positive primarily due to underweights in the Utilities and Consumer Staples sectors.
The Fund’s largest relative contributors were Amazon.com Inc. and Yum China Holdings Inc. (both from the Consumer Discretionary sector), and Jones Lang Lasalle Inc. (Real Estate sector). Amazon.com rose due to acceleration of growth in Prime and Amazon Web Services. Yum China benefited from expansion of its geographic footprint in China and positive results in its existing restaurants. Jones Lang Lasalle rose on higher fee revenue from leasing and property management.
The Fund’s largest detractors to relative performance were General Electric Co. and Vista Outdoor Inc.(both from the Industrials sector), and Avnet Inc. (Information Technology sector). General Electric declined due to weakness in oil, gas, and power end markets combined with the dividend cut and reduced guidance. Vista Outdoor declined due to overcapacity in the ammunition market. Avnet fell as the company had challenges with the implementation of a new Enterprise Resource Planning system that led to customer departures.
From a market cap perspective, the Fund continued to maintain an overweight to larger-cap businesses (companies with a market cap above $10 billion), while maintaining an underweight allocation to both mid-cap (companies with a market cap between $2 billion and $10 billion) and small-cap stocks (companies with a market cap
16
Management's Discussion of Fund Performance (Unaudited) (Continued)
below $2 billion). Collectively, this allocation decision was additive to relative performance as large-cap stocks outperformed mid- and small-cap stocks during the year. Investments made in international companies outperformed the benchmark while domestic holdings lagged.
During the year we increased the weighting to the Information Technology and Consumer Discretionary sectors while we decreased the weight to the Consumer Staples, Energy, Health Care, Industrials sectors and cash holdings. At the end of the year, the Fund had overweight allocations to the Consumer Discretionary and Information Technology sectors and underweight allocations to the Consumer Staples, Materials, and Industrials sectors. The weights to the Energy, Health Care, Financials, Real Estate, and Telecommunication Services sectors were approximately equal to the benchmark. No positions were held in the Utilities sector at the end of the year.
Outlook
While much of the financial media is focused on the latest moves in Bitcoin, the stock market continues to move ahead. The gains were supported by a favorable macroeconomic backdrop. Global economic growth has accelerated at a solid pace, synchronized across major regions. Corporate earnings have enjoyed a strong upturn from their earlier slump in 2015/early 2016 and have outperformed expectations. Plus, inflation has remained low, thereby keeping the Fed and other major central banks in accommodative mode. Finally, we believe passage of the tax reform package will improve corporate cash flows. All these things have combined to fuel higher equity valuations.
In our view, the equity market is priced at fair value. That said, three events that may typically stop a bull market are a credit cycle, higher inflation or an asset bubble. On the credit side, households, corporations, the public sector, and emerging markets are all doing reasonably well at this point. With regard to higher inflation, the balance between capital and labor is key. It is labor costs, which are approximately 70 percent of corporate costs, that dominate income statements and cause the bulk of profit erosion in the late stages of the business cycle. Many investors cite the FAANG stocks to make a case for stock valuations being at an asset bubble level. However, our view is that the FAANGs are undervalued to fairly-valued depending on which stock is being analyzed. Plus, the composition of each of these companies is quite different from the negative earnings, price-per-click valuation stocks of the late 1990s. In some circumstances, we believe these are winner-take-all industries where scale and network effects allow just a few companies to dominate. But one could argue that the stocks that are potentially overvalued are within the Consumer Staples, Utilities and portions of the Real Estate sectors. Specifically, we believe these stocks operate in more stable, often slower growth parts of the economy and are more sensitive to interest rate changes. Finally, the breadth of the market is broadly doing well at this juncture which is a sign of a healthy market.
17
Management's Discussion of Fund Performance (Unaudited) (Continued)
Comparison of the Change in Value of a $10,000 Investment in the
Touchstone Focused Fund, the Russell 3000® Index and the S&P 500® Index
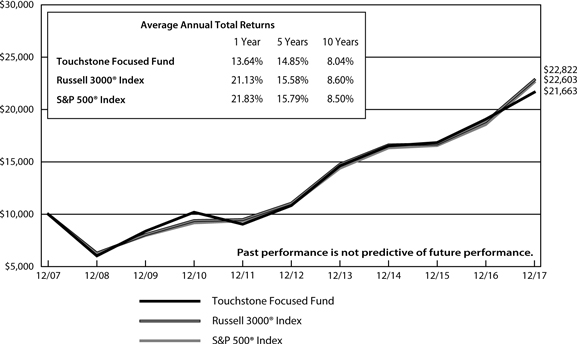
Performance information does not reflect fees that are paid by the separate accounts through which shares of the Fund are sold. Inclusion of those fees would reduce figures for all periods.
The inception date of the Fund was November 21, 1994.
Notes to Chart
The Russell 3000® Index measures the performance of the 3,000 largest U.S. companies based on total market capitalization, which represents approximately 98% of the investable U.S. equity market.
The S&P 500® Index is a group of 500 widely held stocks and is commonly regarded to be representative of the large capitalization stock universe.
The Frank Russell Company (FRC) is the source and owner of the Russell 3000® Index data contained or reflected in this material and all trademarks and copyrights related thereto. The material may contain confidential information and unauthorized use, disclosure, copying, dissemination or redistribution is strictly prohibited. This is a Touchstone Investments presentation of the data, and FRC is not responsible for the formatting or configuration of this material or for any inaccuracy in the presentation thereof.
18
Management's Discussion of Fund Performance (Unaudited)
Touchstone Large Cap Core Equity Fund
Sub-Advised by The London Company
Investment Philosophy
The Touchstone Large Cap Core Equity Fund seeks long-term capital growth by investing primarily in common stocks of large-cap U.S. listed companies. The Fund seeks to purchase financially stable large-cap companies that the sub-advisor believes are consistently generating high returns on unleveraged operating capital, run by shareholder-oriented management, and trading at a discount to the company’s respective private market values.
Fund Performance
The Touchstone Large Cap Core Equity Fund underperformed its benchmark, the Russell 1000® Index, for the 12-month period ended December 31, 2017. The Fund’s total return was 21.32 percent, while the benchmark’s total return was 21.69 percent.
Market Environment
For the trailing twelve months ended December 31, 2017, the stock market was strong and steady. The S&P 500® Index also exhibited twelve straight months of positive returns. Large-capitalization stocks outperformed both mid- and small-capitalization stocks, though all posted solid gains. Growth stocks significantly outpaced value stocks across the market cap spectrum, and cyclical sectors outperformed defensive sectors with the exception of the mid-capitalization segment. We believe the meaningful near-term outperformance of growth compared to value was due, in part, to the continued dominance of a few Information Technology companies known as FAANG stocks, along with other high-flying technology and cloud-focused companies. The dramatic outperformance of these stocks created challenging comparisons for value benchmarks.
During the period, the benchmark was led by the Information Technology, Materials, Consumer Discretionary and Health Care sectors, while the Energy and Telecommunication Services sectors lagged. The Information Technology sector benefited from the revitalization of the FAANG stocks which provided a significant boost to the outperforming sector. Overall, returns were generally outsized for growth stocks and for Information Technology specifically, but performance was conjoined by an unprecedented absence of volatility. In fact, the Chicago Board Options Exchange (CBOE) Volatility Index (VIX) was near record-low territory on a daily basis during the period.
The year ended with strong investor optimism surrounding tax cuts with the passage of a new tax reform bill. Further, there continued to be speculation about the Fed’s plans to normalize rates which could dictate asset levels going forward.
Portfolio Review
The Fund’s sector allocation and stock selection contributed to relative returns during the period. From a sector perspective, the Fund’s underweight to the Energy and Real Estate sectors had a positive impact on relative performance. This was partially offset by the negative impact of an underweight to the Information Technology and Health Care sectors.
Among the individual stocks that contributed to Fund performance during the period were Deere & Co. (Industrials sector), Visa Inc. (Information Technology sector), Dollar Tree Inc. (Consumer Discretionary sector), Progressive Corp. and BlackRock Inc. (both from the Financials sector). Deere & Co. is a manufacturer of agricultural, construction and forestry machinery. The stock moved notably higher during the period reflecting growth in the global economy and optimism that the agriculture cycle is nearing the bottom. Deere’s recent acquisition of the Wirtgen Group is expected to provide a leadership position in the road construction equipment market
19
Management's Discussion of Fund Performance (Unaudited) (Continued)
in Europe. Visa, a payments technology company, moved steadily higher throughout the year along with the Information Technology sector. The company continued to benefit from a global shift toward spending using credit cards and was rewarded for solid growth in a low-growth environment. Visa also hosted an encouraging investor day that outlined its plans for new opportunities to drive long-term expansion of its platform. Visa has historically generated copious cash flow and benefited from significant barriers to entry, a duopoly with Mastercard Inc. and an attractive long-term growth profile. Dollar Tree, a chain of discount variety stores, rallied as the company showed improvement at its Family Dollar stores that were acquired in 2015. Two consecutive quarters of positive same-store sales and margin improvement at Family Dollar along with consistent results at Dollar Tree stores drove the stock. Progressive, an insurance provider, outperformed as the company continued to take market share in the auto insurance market. The company’s attractive pricing also helped drive share gains while its conservative underwriting kept losses to a minimum. The company has been slowly building its homeowner’s insurance business and can now sell joint policies, which we believe should drive policy growth over time. BlackRock, an investment management corporation, moved higher as the company experienced positive asset flows largely driven by its leadership position in the exchange traded funds market. If the trend toward passive investing continues, we believe BlackRock is positioned well for future growth while maintaining a strong balance sheet.
Among the stocks that detracted from Fund performance were O’Reilly Automotive Inc., CarMax Inc. (both from the Consumer Discretionary sector), Alleghany Corp. (Financials sector), NewMarket Corp. (Materials sector) and Alexion Pharmaceuticals Inc. (Health Care sector). O’Reilly Automotive, an auto parts retailer, declined during the period due to softer than expected earnings which management attributed to a warm winter and delays in consumer tax refunds. While same-store sales trends were weaker than expected, the company experienced solid increases in its average ticket (the average size of individual credit card sales). Additionally, the threat of Amazon.com Inc. taking market share in the do-it-yourself retail business has led to concern among investors. Going forward, however, we believe fundamental industry factors remain healthy and demand should remain positive. CarMax, a used-car retailer, ended the year essentially flat after declining during the fourth quarter due to disappointing same-store sales growth. Investors have grown increasingly concerned about weaker auto sales; however, while reports suggest auto sales were down for 2017 versus 2016, the decline was minimal and total sales remained near all-time highs. Going forward, we believe CarMax has been successful at managing its gross profit per used-car sale and we remain attracted to the company’s differentiated store format and ability to add more stores in the U.S. Alleghany, an insurance holding company, ended the period relatively flat despite a strong year in 2016, primarily due to the massive hurricane losses during the third quarter of 2017. We remain attracted to the stock based on the company’s excellent record of book value growth over time despite the vagaries of the insurance underwriting cycle. NewMarket, a petroleum additives company, underperformed which reflected higher raw material costs and lower pricing. We remain attracted to the company’s solid revenue outlook in the market for fuel additives and lubricants, as well as its pricing power in a consolidated industry and excellent history of capital allocation. Alexion Pharmaceuticals, a biopharmaceutical company focused on therapeutic products, for patients with ultra-rare disorders through the development and commercialization of life-transforming therapeutic products declined during the portion of the year in which the Fund owned the stock. Initial optimism surrounding a corporate restructuring and the potential for higher margins gave way to concerns about a competitor in the European market. We were, however, encouraged by the company’s recent patent extensions in the U.S. and Japan, and a decision in Europe is expected within the year. Further, recent insider purchases and cooperation with an activist investor should benefit the company, along with its monopolistic position in the rare disease space.
During the period, the Fund sold its positions in Mosaic Inc. (Materials sector), General Electric Co. (Industrials sector) and Edgewell Personal Care Inc. (Consumer Staples sector). Mosaic was sold after the company hit the Fund’s soft stop loss. With regard to General Electric and Edgewell, confidence waned in each company’s
20
Management's Discussion of Fund Performance (Unaudited) (Continued)
ability to provide suitable downside protection for the Fund. Further, the transition at General Electric has taken longer than expected and new competition from online razor competitors threatened the long-term viability at Edgewell.
The Fund initiated positions in Southwest Airlines Co. (Industrials sector), Alphabet Inc. Class C Shares (Information Technology sector) and Alexion Pharmaceuticals Inc. (Health Care sector). Southwest Airlines is the largest U.S. carrier offering a point-to-point network, which allows the company to avoid more congested hubs and increase airplane utilization. Return on capital has improved significantly in recent years reflecting consolidation in the industry, network optimization and lower fuel prices. We believe the more consolidated industry is a long-term positive for pricing and should lead to higher returns on capital. The company’s balance sheet is also strong with a net cash position. We believe the stock trades at an attractive discount to its intrinsic value, assuming conservative growth. The purchase of Alphabet, or Google as many people know it, reflects our optimism surrounding the company’s competitive advantages and leading market share in its Search, Maps, Ads, YouTube, Android and Chrome divisions. The company generates attractive returns on capital and maintains a strong balance sheet. The stock is not cheap by traditional valuation metrics, but we believe the company’s competitive advantages will persist while its cash flow generation and balance sheet may limit potential downside. We believe Alexion’s focus on ultra-rare diseases should insulate the company from recent industry concerns over drug pricing. Legislatures generally view the Orphan Drug Act as necessary to promote research and development as well as an investment into rare diseases that would be otherwise overlooked. Given that the drugs are lifesaving, Alexion can also make a strong argument that its drugs meet the value-based pricing criteria. Company management also expects growth to come from volume gains with new indications of its drug Soliris. Recent management additions and significant insider purchases provided further confidence in the stock.
Outlook
The U.S. economy continued to expand at a moderate pace with relatively low inflation. Looking ahead, we remain optimistic about the economy and believe there are a number of positives that should support consumer spending in the future, including a strong labor market, solid housing and lower tax rates beginning in 2018. Furthermore, the core rate of inflation remained below the Fed’s target level of two percent.
With regard to monetary policy, the Fed raised the short-term federal funds rate by 25 basis points in December. The consensus view is that another three additional rate hikes will occur in 2018 as the Fed continues to normalize its balance sheet. While we do not expect a big change in long-term rates from the balance sheet normalization process, over time the reversal of quantitative easing could lead to a steepening of the yield curve.
The combination of solid economic growth, low inflation and relatively low interest rates usually creates a positive environment for stocks. We believe this holds true today, but there are risks. We believe the potential risks include relatively high valuations for stocks using traditional metrics, geopolitical turmoil, excessive government stimulus, rising inflation or the Fed taking a more aggressive stance. We believe the risks and rewards are somewhat balanced as they relate to stocks overall, but we will remain cautious and focused on limiting downside in the Fund’s holdings.
Looking ahead, we remain optimistic despite the current market headwinds. We believe the attractive candidates we are vetting today are a result of what the market is providing, and are consistent with our general outlook. Specifically, we believe the Fund’s downside risk can be mitigated by remaining focused on those companies with pricing power, copious cash generation and prudent capital allocation. We seek companies with strong returns on capital and flexibility to enhance shareholder value using the balance sheet. We believe over time that markets will self-correct and as such the Fund’s process is positioned well for a slow growth environment that rewards strong capital allocation.
21
Management's Discussion of Fund Performance (Unaudited) (Continued)
Comparison of the Change in Value of a $10,000 Investment in the
Touchstone Large Cap Core Equity Fund and the Russell 1000® Index
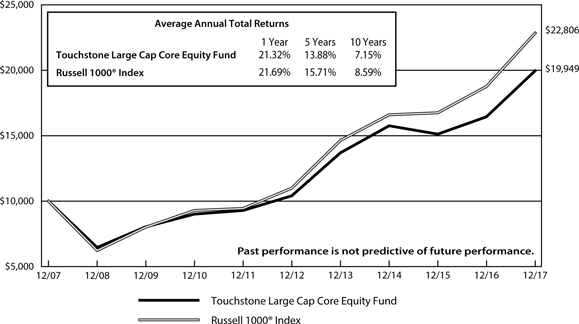
Performance information does not reflect fees that are paid by the separate accounts through which shares of the Fund are sold. Inclusion of those fees would reduce figures for all periods.
The inception date of the Fund was May 1, 1999.
Notes to Chart
The Russell 1000® Index measures the performance of the 1,000 largest companies in the Russell 3000® Index.
The Frank Russell Company (FRC) is the source and owner of the Russell 1000® Index data contained or reflected in this material and all trademarks and copyrights related thereto. The material may contain confidential information and unauthorized use, disclosure, copying, dissemination or redistribution is strictly prohibited. This is a Touchstone Investments presentation of the data, and FRC is not responsible for the formatting or configuration of this material or for any inaccuracy in the presentation thereof.
22
Management's Discussion of Fund Performance (Unaudited)
Touchstone Small Company Fund
Sub-Advised by Fort Washington Investment Advisors, Inc.
Effective October 28, 2017, the Sentinel Variable Products Small Company Fund was reorganized into the Touchstone Small Company Fund. At that time, Touchstone Advisors, Inc. and Fort Washington Investment Advisors, Inc. were respectively appointed as advisor and sub-advisor to the Fund.
Investment Philosophy
The Fund seeks to provide investors with growth of capital by investing primarily in common stocks of small companies that the sub-advisor believes are high quality, have superior business models, solid management teams, sustainable growth potential and are attractively valued.
Fund Performance
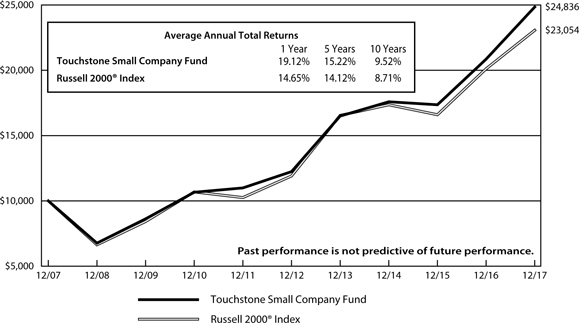
The Touchstone Small Company Fund outperformed its benchmark, the Russell 2000® Index, for the 12-month period ended December 31, 2017. The Fund’s total return was 19.12 percent while the total return of the benchmark was 14.65 percent.
Market Environment
U.S. small-cap equities posted strong returns for calendar year 2017. The small-cap market traded in a narrow range for the majority of the year until mid-August, then rallied into year-end to close near all-time highs.
The overall market and macroeconomic backdrop were favorable for risk assets, including small-cap equities. However, U.S. small-cap companies are only growing earnings in the low single digits. With this relatively low earnings growth rate, we believe market returns have principally been driven by expansion of the market’s increased valuation multiples. Volatility remained low in 2017.
U.S. small-cap sector performance was balanced. The Health Care, Industrials, Information Technology, Materials, and Consumer Discretionary sectors outperformed the benchmark, while Utilities, Financials, Real Estate, Telecommunication Services, and Consumer Staples underperformed the benchmark. Energy was the only sector that declined over the year.
Portfolio Review
The Consumer Discretionary sector was the top contributor to the Fund’s relative returns versus the benchmark during the fiscal year. While a relatively small exposure within the Fund, positioning in the Media industry was an area of particular strength. Solid performance in the Consumer Durables & Apparel and Consumer Services spaces more than offset the relative underperformance of the Fund’s retailing holdings. The Information Technology sector also contributed to relative performance. Semiconductors and Software & Services led the way. Technology hardware and equipment detracted from absolute performance.
Though an area of strong absolute returns during the year, the Fund’s Health Care positioning underperformed on a relative basis versus the benchmark. The underperformance was primarily driven by a lack of exposure to Pharmaceuticals and Biotechnology companies. The Fund historically has had little to no exposure to the Pharma and Biotech industry group, as we believe these companies typically have no earnings and offer a poor fit with our fundamentally based investment discipline. Ultimately, the Fund’s primary performance drag was not specific stocks, but rather an underexposure to the broad market. The Fund’s cash position was driven up by infusions of cash from liquidating several positions that had either been acquired in mergers and acquisitions (M&A) deals or that no longer met out market capitalization criteria detracted from performance. We were cautious in redeploying capital into a market that in our opinion appeared to be stretched from a valuation perspective.
23
Management's Discussion of Fund Performance (Unaudited) (Continued)
Penn National Gaming Inc. (Consumer Discretionary sector), an owner and operator of regional gaming and racing facilities, contributed to performance. Gaming industry trends improved in 2017, and Penn capitalized on the industry tailwind as the continued ramp up of newer properties and business segments performed ahead of expectations. Additionally, speculation (which was eventually confirmed by the company) for potential industry consolidation favorably impacted the stock price.
Tower Semiconductor Ltd. (Information Technology sector), a global leader in specialty semiconductor foundry services, also posted strong returns. The semiconductor industry experienced a strong up-cycle in 2017, with demand acceleration and industry consolidation benefiting all players. We believe Tower outperformed the industry with its focus on specialized niche markets that drove organic growth, with higher earnings and cash flow growth.
The Fund’s bottom two performing stocks were in the challenged retail industry. Tile Shop Holdings Inc. (Consumer Discretionary sector), an operator of specialty flooring stores, executed poorly on new product introductions at the same time it was experiencing a deceleration in sales trends and margin compression. The stock lost more than half of its value during the period. Meanwhile, specialty nutrition store operator Vitamin Shoppe Inc. (Consumer Discretionary sector) declined significantly after missing earnings expectations multiple times during the year. The Fund exited both stocks.
There were no significant changes to the Fund’s positioning during the 12-month period. Sector weights remained consistent, with the Information Technology and Health Care sectors holding the largest weights compared to the benchmark. The Financials sector remained the Fund’s largest underweight.
Outlook
U.S. small-cap equities have experienced significant appreciation off their February 2016 market bottom, achieving all-time highs. We believe much of the recent appreciation has been driven by corporate tax reform. Meaningful corporate tax reform would be a positive development for U.S. small caps given their larger degree of exposure to domestic activity and earnings. M&A activity has historically been a driver of small-cap and Fund returns. The current environment is conducive to M&A activity and we believe companies may gain additional impetus for deal-making considering the new tax plan.
In this environment, we remained focused and will continue to focus on executing our fundamental stock selection and portfolio construction process. We believe that an attractive risk/reward profile can be generated by investing in quality small-cap companies that are poised to benefit from improvements in their business model, leadership teams, and/or industry positioning. We believe disciplined valuation analysis is needed to identify favorable entry and exit points.
24
Management's Discussion of Fund Performance (Unaudited) (Continued)
Comparison of the Change in Value of a $10,000 Investment in the
Touchstone Small Company Fund and the Russell 2000® Index
Performance information does not reflect fees that are paid by the separate accounts through which shares of the Fund are sold. Inclusion of those fees would reduce figures for all periods.
The inception date of the Fund was November 30, 2000.
Notes to Chart
The Russell 2000® Index measures the performance of the small-cap segment of the U.S. equity universe.
The Frank Russell Company (FRC) is the source and owner of the Russell 2000® Index data contained or reflected in this material and all trademarks and copyrights related thereto. The material may contain confidential information and unauthorized use, disclosure, copying, dissemination or redistribution is strictly prohibited. This is a Touchstone Investments presentation of the data, and FRC is not responsible for the formatting or configuration of this material or for any inaccuracy in the presentation thereof.
25
Management's Discussion of Fund Performance (Unaudited)
Touchstone ETF Funds
Sub-Advised by Wilshire Associates Incorporated
Touchstone Aggressive ETF Fund
Touchstone Conservative ETF Fund
Touchstone Moderate ETF Fund
Investment Philosophy
Three funds which invest in Exchange-Traded Funds (ETFs) are available for investors seeking “lifestyle” products for their annuity holdings. The three strategic options include: the Conservative, Moderate, and Aggressive ETF Funds. These funds allocate their assets among up to ten ETFs. These ten ETF selections generally do not change dramatically over time. The more conservative fund has a higher bond weighting and the more aggressive fund has a lower bond weighting.
Fund Performance
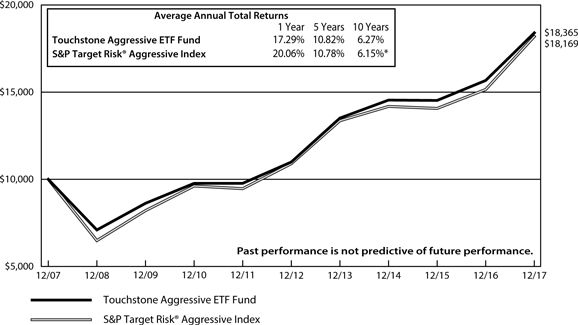
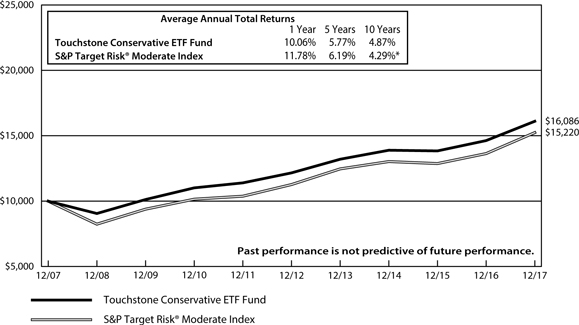
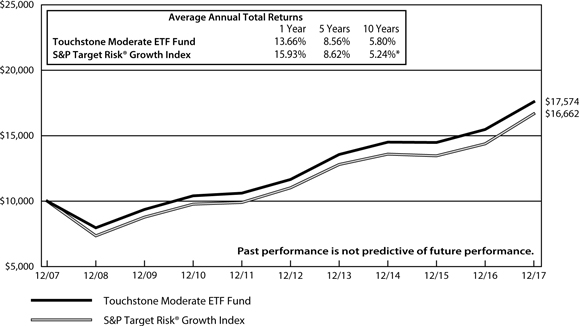
The Touchstone Aggressive ETF Fund underperformed its benchmark, the S&P Target Risk® Aggressive Index, for the 12-month period ended December 31, 2017. The Fund’s total return was 17.29 percent while the total return of the bench mark was 20.06 percent. The Touchstone Conservative ETF Fund underperformed its benchmark, the S&P Target Risk® Moderate Index, for the 12-month period ended December 31, 2017. The Fund’s total return was 10.06 percent while the total return of the benchmark was 11.78 percent. The Touchstone Moderate ETF Fund underperformed its benchmark, the S&P Target Risk® Growth Index, for the 12-month period ended December 31, 2017. The Fund’s total return was 13.66 percent while the total return of the benchmark was 15.93 percent.
Market Environment
The U.S. stock market rose in 2017. Nine of the eleven major sectors produced positive gains, with only Energy and Telecommunications Services ending the year with negative returns. The best performing sectors were Information Technology, Materials and Health Care. Large capitalization stocks outperformed small-caps. Growth stocks led value during the year in both large- and small-capitalization spaces.
Equity markets outside of the U.S. produced strong returns during 2017, in both developed and emerging markets. The U.S. dollar continued to weaken, providing an additional boost for U.S. investors holding foreign currencies. With economic data out of Europe improving, European equities provided strong returns in the second and third quarters of 2017. Japan was one of the strongest developed markets during the fourth quarter due to stimulative policies by both the Bank of Japan and the national government. Japan is now experiencing its strongest economy in more than a decade. Emerging markets led all global equities during 2017 which was the strongest year for broad emerging markets equity since it recovered from the global financial crisis in 2009.
The U.S. Treasury yield curve continued to flatten during the year with short- to intermediate-term rates rising and long-term yields falling. The bellwether 10-year Treasury yield ended the year up slightly from year-end 2016. The Federal Open Market Committee increased its overnight rate three times in 2017, a total increase of 75 basis points and began its balance sheet reduction program. Credit spreads continued to tighten during the year, most noticeably with investment grade credit.
Real estate securities were up in the U.S. during the year with a stronger return globally, due in part to a weakening dollar. Commodities were mixed for the year as crude oil and gold prices rose while natural gas prices and master limited partnership returns were down.
26
Management's Discussion of Fund Performance (Unaudited) (Continued)
Portfolio Review
The Touchstone Conservative ETF Fund, Touchstone Moderate ETF Fund and Touchstone Aggressive ETF Fund underperformed their benchmarks during 2017. The Funds’ investments are determined by an optimization process that considers the long-term historical risk and return profiles of various asset classes. For instance, non-U.S. equities have been included due to the diversification benefits they provided to the Funds as a whole. During the 2017 market environment, when non-U.S. equities outperformed U.S. stocks, the underweight positioning in The Touchstone Funds relative to their respective benchmarks detracted from relative performance. Similarly, the overweight of the Touchstone Funds to Real Estate was a headwind as was their overweight to mid- and small-cap stocks within their U.S. equity allocations.
Several allocation changes occurred since the beginning of 2017. Thematically, those changes were similar across all three Funds. Most notably, the allocation to government fixed income was increased at the expense of investment grade and high yield credit. By adding government fixed income exposure, we added a partial hedge to the equity risk we were adding back to the portfolio. During mid-2017, exposure was initiated to the iShares Floating Rate Bond ETF in order to reduce interest rate risk within the Funds out of concern that a “neutral” duration posture, relative to the Bloomberg Barclays U.S. Aggregate Bond Index was adding materially more interest rate risk than is typical due to the increased duration of the index in recent years.
Exposure to international developed and emerging markets equities was increased substantially during the year due to our increased confidence in the ability of foreign equities to outpace U.S. equities. Every major global economy is growing and the fundamentals have improved rapidly in many regions. Coupled with the potential for U.S. dollar weakening and rapid corporate earnings growth, we believe that foreign equities will continue their recent outperformance versus domestic equities. During the fourth quarter of 2017, exposure to domestic and foreign real estate investment trusts (REITs) was eliminated in exchange for global equity exposure. We believe that REITs are relatively unattractive due to valuation concerns, and eliminating REITs also reduces the Funds’ interest rate sensitivity.
Outlook
Although global equities are not cheap, we believe that there is little risk of a recession in the near term across most of the world’s major economies. We continue to expect a moderating economic growth environment in the foreseeable future, and to believe that the current economic landscape warrants lower interest rates and lower expected returns across asset classes.
Developed markets remain relatively stable in terms of gross domestic product (GDP) growth on a normalized basis, and we are still seeing below average growth in emerging markets, albeit at a faster pace than in developed markets. On a forward looking basis, when we look at the Purchasing Managers Index, which is an indicator of economic health in the manufacturing sector of a country or a region, we continue to witness positive economic momentum in the foreign economies of both the Eurozone and Japan relative to the U.S. On a global basis, measures of inflation are mostly in-line with or slightly below historic averages. Given that global growth and inflation remain moderate, we believe that global central banks will be slower to tighten monetary policy relative to market expectations. Given ultra-low foreign developed market bond yields, we favor domestic fixed income over global fixed income. However, we recognize that further weakness in the U.S. dollar would serve to benefit foreign fixed income.
Although domestic equities remain fully valued, we believe that the outlook for continued domestic and foreign GDP growth is promising and provides comfort that equities are not poised for an imminent selloff. Given elevated forward price-earnings levels, any disappointment in U.S. corporate earnings growth is likely to be interpreted negatively. Investors have noted concerns that the U.S. Federal Reserve Board’s (Fed) decision to gradually shrink its balance sheet introduces additional risk to U.S. Treasury bonds, as this reduction in demand
27
Management's Discussion of Fund Performance (Unaudited) (Continued)
and increase in supply may introduce the additional risk of a significant rise in yields. While we acknowledge this risk, we believe that it is important to recognize the recent recovery in foreign demand for U.S. Treasury bonds following the net selling activity in 2016. The Fed may be stepping away, but foreign buyers have returned. With respect to credit markets, given the further narrowing of corporate bond yield spreads over Treasuries, we remain less favorable on credit.
28
Management's Discussion of Fund Performance (Unaudited) (Continued)
Comparison of the Change in Value of a $10,000 Investment in the
Touchstone Aggressive ETF Fund and the S&P Target Risk® Aggressive Index
*The launch date of the S&P Target Risk® Aggressive Index was September 25, 2008. All information for the index prior to its launch date is back-tested, based on the methodology that was in effect on the launch date. Back-tested performance, which is hypothetical and not actual performance, is subject to inherent limitations because it reflects application of an Index methodology and selection of index constituents in hindsight. No theoretical approach can take into account all of the factors in the markets in general and the impact of decisions that might have been made during the actual operation of an index. Actual returns may differ from, and be lower than, back-tested returns.
Performance information does not reflect fees that are paid by the separate accounts through which shares of the Fund are sold. Inclusion of those fees would reduce figures for all periods.
The inception date of the Fund was July 16, 2004.
Note to Chart
The S&P Target Risk® Aggressive Index is one of four multi-asset class indices that compose the S&P Target Risk Series. The S&P Target Risk® Aggressive Index emphasizes exposure to equities, maximizing opportunities for long-term capital accumulation. It may include small allocations to fixed income to enhance portfolio efficiency.
29
Management's Discussion of Fund Performance (Unaudited) (Continued)
Comparison of the Change in Value of a $10,000 Investment in the
Touchstone Conservative ETF Fund and the S&P Target Risk® Moderate Index
*The launch date of the S&P Target Risk® Moderate Index was September 25, 2008. All information for the index prior to its launch date is back-tested, based on the methodology that was in effect on the launch date. Back-tested performance, which is hypothetical and not actual performance, is subject to inherent limitations because it reflects application of an Index methodology and selection of index constituents in hindsight. No theoretical approach can take into account all of the factors in the markets in general and the impact of decisions that might have been made during the actual operation of an index. Actual returns may differ from, and be lower than, back-tested returns.
Performance information does not reflect fees that are paid by the separate accounts through which shares of the Fund are sold. Inclusion of those fees would reduce figures for all periods.
The inception date of the Fund was July 16, 2004.
Note to Chart
The S&P Target Risk® Moderate Index is one of four multi-asset class indices that compose the S&P Target Risk Series. The S&P Target Risk® Moderate Index offers significant exposure to fixed income, while also increasing opportunities for higher returns through equities.
30
Management's Discussion of Fund Performance (Unaudited) (Continued)
Comparison of the Change in Value of a $10,000 Investment in the
Touchstone Moderate ETF Fund and the S&P Target Risk® Growth Index
*The launch date of the S&P Target Risk® Growth Index was September 25, 2008. All information for the index prior to its launch date is back-tested, based on the methodology that was in effect on the launch date. Back-tested performance, which is hypothetical and not actual performance, is subject to inherent limitations because it reflects application of an Index methodology and selection of index constituents in hindsight. No theoretical approach can take into account all of the factors in the markets in general and the impact of decisions that might have been made during the actual operation of an index. Actual returns may differ from, and be lower than, back-tested returns.
Performance information does not reflect fees that are paid by the separate accounts through which shares of the Fund are sold. Inclusion of those fees would reduce figures for all periods.
The inception date of the Fund was July 16, 2004.
Note to Chart
The S&P Target Risk® Growth Index is one of four multi-asset class indices that compose the S&P Target Risk Series. The S&P Target Risk® Growth Index increases exposure to equities, while also providing limited fixed income exposure to diversify risk.
31
Tabular Presentation of Portfolios of Investments (Unaudited)
December 31, 2017
The illustrations below provide each Fund’s credit quality and/or sector allocation. We hope it will be useful to shareholders as it summarizes key information about each Fund’s investments.
| Touchstone Active Bond Fund | ||||
| Credit Quality* | (% of Investment Securities) | |||
| AAA/Aaa | 52.4 | % | ||
| AA/Aa | 4.9 | |||
| A/A | 10.0 | |||
| BBB/Baa | 20.8 | |||
| BB/Ba | 0.7 | |||
| CCC | 0.8 | |||
| Not Rated | 5.3 | |||
| Cash Equivalents | 5.1 | |||
| Total | 100.0 | % | ||
| Touchstone Balanced Fund | ||||
| Credit Quality* | (% of Fixed Income Securities) | |||
| AAA/Aaa | 71.9 | % | ||
| AA/Aa | 4.4 | |||
| A/A | 6.8 | |||
| BBB/Baa | 16.2 | |||
| BB/Ba | 0.7 | |||
| 100.0 | % | |||
| Sector Allocation** | (% of Net Assets) | |||
| Common Stocks | ||||
| Information Technology | 17.0 | % | ||
| Consumer Discretionary | 11.5 | |||
| Financials | 10.9 | |||
| Health Care | 7.0 | |||
| Industrials | 6.0 | |||
| Energy | 3.4 | |||
| Real Estate | 2.8 | |||
| Consumer Staples | 2.6 | |||
| Telecommunication Services | 1.4 | |||
| Materials | 1.0 | |||
| U.S. Treasury Obligations | 16.5 | |||
| Corporate Bonds | 9.9 | |||
| U.S. Government Mortgage-Backed Obligations | 8.3 | |||
| Sovereign Bonds | 0.1 | |||
| Short-Term Investment Fund | 0.2 | |||
| Other Assets/Liabilities (Net) | 1.4 | |||
| Total | 100.0 | % | ||
| * | Credit quality ratings are from Standard & Poor's (“S&P”) and Moody's Investors Service (“Moody's”). If agency ratings differ, the higher rating will be used. Where no rating has been assigned, it may be for reasons unrelated to the creditworthiness of the issuer. |
| ** | Sector Classifications are based upon the Global Industry Classification Standard (GICS®). |
32
Tabular Presentation of Portfolios of Investments (Unaudited) (Continued)
| Touchstone Bond Fund | ||||
| Credit Quality* | (% of Investment Securities) | |||
| AAA/Aaa | 62.9 | % | ||
| AA/Aa | 3.5 | |||
| A/A | 15.1 | |||
| BBB/Baa | 10.1 | |||
| BB/Ba | 0.2 | |||
| Not Rated | 2.3 | |||
| Cash Equivalents | 5.9 | |||
| Total | 100.0 | % | ||
| Touchstone Common Stock Fund | ||||
| Sector Allocation** | (% of Net Assets) | |||
| Information Technology | 25.7 | % | ||
| Consumer Discretionary | 17.3 | |||
| Financials | 16.2 | |||
| Health Care | 11.3 | |||
| Industrials | 9.0 | |||
| Energy | 5.2 | |||
| Real Estate | 4.4 | |||
| Consumer Staples | 4.0 | |||
| Telecommunication Services | 2.0 | |||
| Materials | 1.8 | |||
| Short-Term Investment Fund | 3.2 | |||
| Other Assets/Liabilities (Net) | (0.1 | ) | ||
| Total | 100.0 | % | ||
| Touchstone Focused Fund | ||||
| Sector Allocation** | (% of Net Assets) | |||
| Information Technology | 25.8 | % | ||
| Financials | 16.5 | |||
| Consumer Discretionary | 16.1 | |||
| Health Care | 14.3 | |||
| Industrials | 8.7 | |||
| Energy | 5.1 | |||
| Real Estate | 4.4 | |||
| Consumer Staples | 3.5 | |||
| Telecommunication Services | 2.2 | |||
| Materials | 1.7 | |||
| Short-Term Investment Funds | 3.6 | |||
| Other Assets/Liabilities (Net) | (1.9 | ) | ||
| Total | 100.0 | % | ||
| Touchstone Large Cap Core Equity Fund | ||||
| Sector Allocation** | (% of Net Assets) | |||
| Financials | 24.8 | % | ||
| Consumer Discretionary | 21.1 | |||
| Industrials | 16.5 | |||
| Information Technology | 15.7 | |||
| Health Care | 8.2 | |||
| Consumer Staples | 5.4 | |||
| Materials | 2.8 | |||
| Energy | 2.3 | |||
| Telecommunication Services | 1.6 | |||
| Short-Term Investment Fund | 1.8 | |||
| Other Assets/Liabilities (Net) | (0.2 | ) | ||
| Total | 100.0 | % | ||
| * | Credit quality ratings are from Standard & Poor's (“S&P”) and Moody's Investors Service (“Moody's”). If agency ratings differ, the higher rating will be used. Where no rating has been assigned, it may be for reasons unrelated to the creditworthiness of the issuer. |
| ** | Sector Classifications are based upon the Global Industry Classification Standard (GICS®). |
33
Tabular Presentation of Portfolios of Investments (Unaudited) (Continued)
| Touchstone Small Company Fund | ||||
| Sector Allocation* | (% of Net Assets) | |||
| Information Technology | 29.6 | % | ||
| Health Care | 20.6 | |||
| Consumer Discretionary | 16.2 | |||
| Industrials | 13.9 | |||
| Financials | 10.5 | |||
| Energy | 2.5 | |||
| Real Estate | 2.5 | |||
| Telecommunication Services | 1.1 | |||
| Materials | 0.9 | |||
| Short-Term Investment Fund | 1.8 | |||
| Other Assets/Liabilities (Net) | 0.4 | |||
| Total | 100.0 | % | ||
| Touchstone Aggressive ETF Fund | ||||
| Sector Allocation | (% of Net Assets) | |||
| Exchange-Traded Funds | ||||
| Equity Funds | 79.9 | % | ||
| Fixed Income Funds | 17.0 | |||
| Short-Term Investment Funds | 3.7 | |||
| Other Assets/Liabilities (Net) | (0.6 | ) | ||
| Total | 100.0 | % | ||
| Touchstone Conservative ETF Fund | ||||
| Sector Allocation | (% of Net Assets) | |||
| Exchange-Traded Funds | ||||
| Fixed Income Funds | 57.1 | % | ||
| Equity Funds | 39.9 | |||
| Short-Term Investment Fund | 3.3 | |||
| Other Assets/Liabilities (Net) | (0.3 | ) | ||
| Total | 100.0 | % | ||
| Touchstone Moderate ETF Fund | ||||
| Sector Allocation | (% of Net Assets) | |||
| Exchange-Traded Funds | ||||
| Equity Funds | 61.9 | % | ||
| Fixed Income Funds | 35.0 | |||
| Short-Term Investment Fund | 3.4 | |||
| Other Assets/Liabilities (Net) | (0.3 | ) | ||
| Total | 100.0 | % | ||
| * | Sector Classifications are based upon the Global Industry Classification Standard (GICS®). |
34
Touchstone Active Bond Fund – December 31, 2017
| Principal | Market | |||||||
| Amount | Value | |||||||
| U.S. Treasury Obligations — 37.8% | ||||||||
| $ | 270,000 | U.S. Treasury Bond, 2.500%, 2/15/46 | $ | 256,932 | ||||
| 137,000 | U.S. Treasury Bond, 2.750%, 8/15/47 | 137,171 | ||||||
| 64,000 | U.S. Treasury Bond, 3.000%, 5/15/45 | 67,213 | ||||||
| 960,000 | U.S. Treasury Bond, 3.000%, 2/15/47 | 1,009,613 | ||||||
| 23,000 | U.S. Treasury Bond, 3.000%, 5/15/47 | 24,181 | ||||||
| 3,785,000 | U.S. Treasury Inflation Indexed Bonds, | |||||||
| 0.375%, 7/15/27 | 3,796,547 | |||||||
| 46,000 | U.S. Treasury Note, 1.125%, 2/28/21 | 44,733 | ||||||
| 1,500,000 | U.S. Treasury Note, 1.250%, 3/31/21 | 1,462,969 | ||||||
| 2,400,000 | U.S. Treasury Note, 1.500%, 10/31/19 | 2,383,500 | ||||||
| 1,235,000 | U.S. Treasury Note, 1.875%, 9/30/22 | 1,217,102 | ||||||
| 6,634,000 | U.S. Treasury Note, 2.000%, 12/31/21 | 6,600,312 | ||||||
| 4,744,000 | U.S. Treasury Note, 2.250%, 8/15/27 | 4,677,288 | ||||||
| Total U.S. Treasury Obligations | $ | 21,677,561 | ||||||
| Corporate Bonds — 32.7% | ||||||||
| Financials — 9.6% | ||||||||
| 218,000 | American Express Co., | |||||||
| 3.000%, 10/30/24 | 217,638 | |||||||
| 156,000 | AvalonBay Communities, Inc. MTN, | |||||||
| 3.200%, 1/15/28 | 155,402 | |||||||
| 144,000 | Bank of America Corp., | |||||||
| 3.705%, 4/24/28 | 147,801 | |||||||
| 245,000 | Bank of America Corp. MTN, | |||||||
| 4.000%, 1/22/25 | 254,889 | |||||||
| 212,000 | Bank of Montreal (Canada), | |||||||
| 3.803%, 12/15/32 | 209,590 | |||||||
| 230,000 | Bank of Nova Scotia (The) (Canada), | |||||||
| (3M LIBOR +0.620%), | ||||||||
| 2.233%, 9/19/22(A) | 230,284 | |||||||
| 200,000 | Barclays PLC (United Kingdom), | |||||||
| 3.250%, 1/12/21 | 201,921 | |||||||
| 208,000 | Boston Properties LP, 3.200%, 1/15/25 | 207,337 | ||||||
| 265,000 | Capital One NA/Mclean VA, | |||||||
| 1.650%, 2/5/18 | 264,993 | |||||||
| 164,000 | Chubb INA Holdings, Inc., | |||||||
| 4.350%, 11/3/45 | 185,172 | |||||||
| 140,000 | Cincinnati Financial Corp., | |||||||
| 6.125%, 11/1/34 | 178,290 | |||||||
| 320,000 | Citigroup, Inc., (3M LIBOR +1.430%), | |||||||
| 2.911%, 9/1/23(A) | 329,383 | |||||||
| 125,000 | Citigroup, Inc., 3.300%, 4/27/25 | 126,166 | ||||||
| 84,000 | Citigroup, Inc., 4.750%, 5/18/46 | 92,597 | ||||||
| 175,000 | Fifth Third Bancorp, 2.875%, 7/27/20 | 176,850 | ||||||
| 130,000 | General Electric Co. MTN, | |||||||
| 4.650%, 10/17/21 | 139,963 | |||||||
| 223,000 | General Motors Financial Co., Inc., | |||||||
| 3.200%, 7/13/20 | 226,027 | |||||||
| 110,000 | Goldman Sachs Group, Inc. (The), | |||||||
| 3.691%, 6/5/28 | 111,590 | |||||||
| 115,000 | Goldman Sachs Group, Inc. (The), | |||||||
| 5.250%, 7/27/21 | 124,636 | |||||||
| 200,000 | HSBC Holdings PLC (United Kingdom), | |||||||
| 3.900%, 5/25/26 | 207,428 | |||||||
| 250,000 | Huntington National Bank (The), | |||||||
| 2.200%, 11/6/18 | 250,222 | |||||||
| 145,000 | JPMorgan Chase & Co., | |||||||
| 3.250%, 9/23/22 | 148,459 | |||||||
| 61,000 | Mid-America Apartments LP, | |||||||
| 3.750%, 6/15/24 | 62,697 | |||||||
| 208,000 | Moody's Corp., 2.750%, 12/15/21 | 208,261 | ||||||
| 170,000 | Morgan Stanley, 3.950%, 4/23/27 | 172,632 | ||||||
| 155,000 | Northwestern Mutual Life Insurance Co. (The), 144a, 3.850%, 9/30/47 | 157,132 | ||||||
| 160,000 | PNC Bank NA, 2.700%, 11/1/22 | 159,213 | ||||||
| 165,000 | Prudential Financial, Inc., | |||||||
| 5.625%, 6/15/43 | 178,695 | |||||||
| 205,000 | SL Green Operating Partnership LP, | |||||||
| 3.250%, 10/15/22 | 204,214 | |||||||
| 225,000 | State Street Corp., (3M LIBOR +1.000%), 2.588%, 6/15/47(A) | 202,779 | ||||||
| 5,532,261 | ||||||||
| Consumer Discretionary — 3.6% | ||||||||
| 205,000 | Allergan Sales LLC, 144a, | |||||||
| 5.000%, 12/15/21 | 219,243 | |||||||
| 204,000 | Amazon.com, Inc., 144a, | |||||||
| 2.800%, 8/22/24 | 203,380 | |||||||
| 146,000 | Anheuser-Busch InBev Finance, Inc., | |||||||
| 4.900%, 2/1/46 | 169,212 | |||||||
| 210,000 | Aptiv PLC (Jersey), 3.150%, 11/19/20 | 213,243 | ||||||
| 230,000 | AutoNation, Inc., 5.500%, 2/1/20 | 242,815 | ||||||
| 190,000 | Comcast Corp., 2.850%, 1/15/23 | 191,521 | ||||||
| 80,000 | Ford Motor Co., 4.750%, 1/15/43 | 81,131 | ||||||
| 150,000 | Home Depot, Inc. (The), | |||||||
| 5.950%, 4/1/41 | 203,134 | |||||||
| 160,000 | Mylan NV (Netherlands), | |||||||
| 3.000%, 12/15/18 | 160,856 | |||||||
| 204,000 | Shire Acquisitions Investments Ireland DAC (Ireland), 2.400%, 9/23/21 | 200,789 | ||||||
| 153,000 | Time Warner, Inc., 3.800%, 2/15/27 | 152,855 | ||||||
| 2,038,179 | ||||||||
| Information Technology — 3.0% | ||||||||
| 198,000 | Activision Blizzard, Inc., 144a, | |||||||
| 6.125%, 9/15/23 | 209,906 | |||||||
| 235,000 | Apple, Inc., 2.750%, 1/13/25 | 232,956 | ||||||
| 148,000 | Apple, Inc., 4.650%, 2/23/46 | 173,313 | ||||||
| 205,000 | Dell International LLC / EMC Corp., 144a, 6.020%, 6/15/26 | 226,037 | ||||||
| 175,000 | Hewlett Packard Enterprise Co., 144a, | |||||||
| 2.100%, 10/4/19 | 173,802 | |||||||
| 85,000 | Microsoft Corp., 3.500%, 2/12/35 | 88,439 | ||||||
| 170,000 | Oracle Corp., 2.650%, 7/15/26 | 165,741 | ||||||
| 129,000 | Oracle Corp., 3.250%, 11/15/27 | 131,189 | ||||||
| 200,000 | QUALCOMM, Inc., 3.450%, 5/20/25 | 200,454 | ||||||
| 134,000 | Visa, Inc., 4.150%, 12/14/35 | 148,775 | ||||||
| 1,750,612 | ||||||||
| Energy — 3.0% | ||||||||
| 184,000 | Cenovus Energy, Inc. (Canada), | |||||||
| 4.250%, 4/15/27 | 183,557 | |||||||
35
Touchstone Active Bond Fund (Continued)
| Principal | Market | |||||||
| Amount | Value | |||||||
| Corporate Bonds — 32.7% (Continued) | ||||||||
| Energy — (Continued) | ||||||||
| $ | 152,000 | Concho Resources, Inc., | ||||||
| 3.750%, 10/1/27 | $ | 153,985 | ||||||
| 141,000 | EOG Resources, Inc., 3.900%, 4/1/35 | 143,915 | ||||||
| 198,000 | Midcontinent Express Pipeline LLC, 144a, 6.700%, 9/15/19 | 206,811 | ||||||
| 135,000 | Petroleos Mexicanos (Mexico), | |||||||
| 4.500%, 1/23/26 | 134,757 | |||||||
| 116,000 | Rockies Express Pipeline LLC, 144a, | |||||||
| 6.875%, 4/15/40 | 130,500 | |||||||
| 190,000 | Sabine Pass Liquefaction LLC, | |||||||
| 5.000%, 3/15/27 | 203,885 | |||||||
| 210,000 | Shell International Finance BV | |||||||
| (Netherlands), 1.875%, 5/10/21 | 206,912 | |||||||
| 2,475 | Transocean Phoenix 2 Ltd. (Cayman Islands), 144a, 7.750%, 10/15/24 | 2,710 | ||||||
| 120,000 | Western Gas Partners LP, | |||||||
| 3.950%, 6/1/25 | 119,987 | |||||||
| 234,000 | Williams Cos., Inc. (The), | |||||||
| 3.700%, 1/15/23 | 232,830 | |||||||
| 1,719,849 | ||||||||
| Health Care — 2.6% | ||||||||
| 198,000 | Abbott Laboratories, | |||||||
| 3.750%, 11/30/26 | 203,320 | |||||||
| 174,000 | AbbVie, Inc., 4.450%, 5/14/46 | 189,138 | ||||||
| 90,000 | Allergan Funding SCS (Luxembourg), | |||||||
| 3.800%, 3/15/25 | 91,624 | |||||||
| 185,000 | Catholic Health Initiatives, | |||||||
| 4.200%, 8/1/23 | 191,576 | |||||||
| 142,000 | Celgene Corp., 5.000%, 8/15/45 | 161,112 | ||||||
| 160,000 | Express Scripts Holding Co., | |||||||
| 3.300%, 2/25/21 | 162,511 | |||||||
| 210,000 | Johnson & Johnson, 2.900%, 1/15/28 | 210,312 | ||||||
| 133,000 | Teva Pharmaceutical Finance Netherlands III BV (Netherlands), | |||||||
| 3.150%, 10/1/26† | 109,811 | |||||||
| 140,000 | Zimmer Biomet Holdings, Inc., | |||||||
| 3.150%, 4/1/22 | 140,343 | |||||||
| 60,000 | Zimmer Biomet Holdings, Inc., | |||||||
| 3.375%, 11/30/21 | 60,792 | |||||||
| 1,520,539 | ||||||||
| Industrials — 2.6% | ||||||||
| 265,000 | Burlington Northern Santa Fe LLC, | |||||||
| 5.750%, 5/1/40 | 345,305 | |||||||
| 175,000 | FedEx Corp., 5.100%, 1/15/44 | 203,655 | ||||||
| 146,000 | Martin Marietta Materials, Inc., (3M LIBOR +0.650%), 2.096%, 5/22/20(A) | 146,777 | ||||||
| 170,000 | Medtronic Global Holdings SCA (Luxembourg), 3.350%, 4/1/27 | 174,432 | ||||||
| 206,000 | Roper Technologies, Inc., | |||||||
| 3.000%, 12/15/20 | 208,452 | |||||||
| 155,000 | SBA Tower Trust, 144a, | |||||||
| 2.898%, 10/8/19 | 155,372 | |||||||
| 250,000 | Siemens Financieringsmaatschappij NV (Netherlands), 144a, | |||||||
| 3.125%, 3/16/24 | 253,688 | |||||||
| 2,433 | United Airlines 2014-2 Class B Pass Through Trust, 4.625%, 9/3/22 | 2,503 | ||||||
| 1,490,184 | ||||||||
| Consumer Staples — 2.5% | ||||||||
| 142,000 | Constellation Brands, Inc., | |||||||
| 2.650%, 11/7/22 | 140,490 | |||||||
| 130,000 | CVS Health Corp., 5.125%, 7/20/45 | 148,992 | ||||||
| 292,000 | Imperial Brands Finance PLC (United Kingdom), 144a, 4.250%, 7/21/25 | 306,174 | ||||||
| 130,000 | Kraft Heinz Foods Co., 6.875%, 1/26/39 | 171,131 | ||||||
| 194,000 | Mead Johnson Nutrition Co., | |||||||
| 4.125%, 11/15/25 | 205,758 | |||||||
| 192,000 | Reynolds American, Inc., | |||||||
| 4.450%, 6/12/25 | 204,719 | |||||||
| 230,000 | Wal-Mart Stores, Inc., | |||||||
| 2.350%, 12/15/22 | 229,192 | |||||||
| 1,406,456 | ||||||||
| Telecommunication Services — 1.9% | ||||||||
| 105,000 | AT&T, Inc., 3.900%, 3/11/24 | 107,760 | ||||||
| 150,000 | AT&T, Inc., 3.900%, 8/14/27 | 151,002 | ||||||
| 40,000 | AT&T, Inc., 4.350%, 6/15/45 | 36,904 | ||||||
| 125,000 | AT&T, Inc., 4.500%, 5/15/35 | 124,258 | ||||||
| 124,000 | Charter Communications Operating LLC / Charter Communications Operating Capital, | |||||||
| 6.484%, 10/23/45 | 144,575 | |||||||
| 170,000 | Qwest Corp., 6.750%, 12/1/21 | 183,070 | ||||||
| 331,000 | Verizon Communications, Inc., | |||||||
| 5.012%, 4/15/49 | 347,149 | |||||||
| 1,094,718 | ||||||||
| Utilities — 1.6% | ||||||||
| 206,000 | Dominion Energy, Inc., | |||||||
| 2.000%, 8/15/21 | 201,302 | |||||||
| 184,000 | Fortis, Inc., (Canada), 3.055%, 10/4/26 | 177,660 | ||||||
| 18,000 | GenOn Energy, Inc., | |||||||
| 9.500%, 10/15/18(B) | 14,310 | |||||||
| 210,000 | NextEra Energy Capital Holdings, Inc., | |||||||
| (3M LIBOR +2.125%), | ||||||||
| 3.713%, 6/15/67(A) | 200,115 | |||||||
| 150,000 | Oncor Electric Delivery Co. LLC, 144a, | |||||||
| 3.800%, 9/30/47 | 155,835 | |||||||
| 124,000 | PacifiCorp., 5.750%, 4/1/37 | 160,096 | ||||||
| 909,318 | ||||||||
| Real Estate — 1.5% | ||||||||
| 185,000 | Crown Castle International Corp., | |||||||
| 3.650%, 9/1/27 | 184,547 | |||||||
| 152,000 | Digital Realty Trust LP, 2.750%, 2/1/23 | 150,664 | ||||||
| 126,000 | Sabra Health Care LP. REIT, | |||||||
| 5.125%, 8/15/26 | 127,764 | |||||||
| 184,000 | Ventas Realty LP, 3.500%, 2/1/25 | 185,369 | ||||||
36
Touchstone Active Bond Fund (Continued)
| Principal | Market | |||||||
| Amount | Value | |||||||
| Corporate Bonds — 32.7% (Continued) | ||||||||
| Real Estate — (Continued) | ||||||||
| $ | 175,000 | Vornado Realty LP REIT, | ||||||
| 5.000%, 1/15/22 | $ | 187,725 | ||||||
| 836,069 | ||||||||
| Materials — 0.8% | ||||||||
| 202,000 | Eagle Materials, Inc., 4.500%, 8/1/26 | 210,585 | ||||||
| 150,000 | Vulcan Materials Co., 4.500%, 4/1/25 | 159,841 | ||||||
| 88,000 | Westlake Chemical Corp., | |||||||
| 4.375%, 11/15/47 | 91,390 | |||||||
| 461,816 | ||||||||
| Total Corporate Bonds | $ | 18,760,001 | ||||||
| U.S. Government Mortgage-Backed Obligations — 11.4% | ||||||||
| 22,742 | FHLMC, Pool #A56988, 5.500%, 2/1/37 | 25,136 | ||||||
| 131,286 | FHLMC, Pool #A95946, 4.000%, 1/1/41 | 137,832 | ||||||
| 105,566 | FHLMC, Pool #A96485, 4.500%, 1/1/41 | 112,550 | ||||||
| 33,153 | FHLMC, Pool #G03217, 5.500%, 9/1/37 | 36,653 | ||||||
| 17,722 | FHLMC, Pool #G03781, 6.000%, 1/1/38 | 19,858 | ||||||
| 76,715 | FHLMC, Pool #J27931, 3.500%, 4/1/29 | 79,570 | ||||||
| 317,661 | FHLMC, Pool #Q51274, 4.000%, 10/1/47 | 332,219 | ||||||
| 1,059 | FNMA, Pool #254759, 4.500%, 6/1/18 | 1,075 | ||||||
| 7,668 | FNMA, Pool #561741, 7.500%, 1/1/31 | 8,598 | ||||||
| 11,280 | FNMA, Pool #889734, 5.500%, 6/1/37 | 12,479 | ||||||
| 18,761 | FNMA, Pool #984256, 5.000%, 6/1/23 | 19,588 | ||||||
| 14,692 | FNMA, Pool #995472, 5.000%, 11/1/23 | 15,499 | ||||||
| 77,697 | FNMA, Pool #AB1149, 5.000%, 6/1/40 | 83,861 | ||||||
| 69,719 | FNMA, Pool #AB1800, 4.000%, 11/1/40 | 73,768 | ||||||
| 118,534 | FNMA, Pool #AD3795, 4.500%, 4/1/40 | 126,889 | ||||||
| 162,814 | FNMA, Pool #AD9150, 5.000%, 8/1/40 | 175,466 | ||||||
| 241,377 | FNMA, Pool #AE0548, 4.500%, 11/1/40 | 258,797 | ||||||
| 192,418 | FNMA, Pool #AE4429, 4.000%, 10/1/40 | 202,205 | ||||||
| 14,897 | FNMA, Pool #AH2666, 4.000%, 1/1/26 | 15,521 | ||||||
| 28,766 | FNMA, Pool #AH3493, 4.000%, 2/1/26 | 30,099 | ||||||
| 329,783 | FNMA, Pool #AJ5457, 4.000%, 11/1/41 | 348,105 | ||||||
| 302,037 | FNMA, Pool #AL0054, 4.500%, 2/1/41 | 323,817 | ||||||
| 55,788 | FNMA, Pool #AL2663, 4.000%, 1/1/26 | 58,118 | ||||||
| 270,994 | FNMA, Pool #AS7813, 4.000%, 8/1/46 | 283,520 | ||||||
| 381,999 | FNMA, Pool #AS8552, 3.000%, 12/1/36 | 388,078 | ||||||
| 692,639 | FNMA, Pool #AS8855, 3.500%, 2/1/37 | 717,082 | ||||||
| 683,421 | FNMA, Pool #BH6180, 4.000%, 7/1/47 | 715,323 | ||||||
| 331,920 | FNMA, Pool #MA1175, 3.000%, 9/1/42 | 333,713 | ||||||
| 211,801 | FNMA, Pool #MA1543, 3.500%, 8/1/33 | 220,375 | ||||||
| 192,653 | FNMA, Pool #MA2177, 4.000%, 2/1/35 | 203,365 | ||||||
| 270,113 | GNMA, Pool #4853, 4.000%, 11/20/40 | 284,291 | ||||||
| 182,748 | GNMA, Pool #4883, 4.500%, 12/20/40 | 193,919 | ||||||
| 72,305 | GNMA, Pool #736696, 4.500%, 5/15/40 | 76,299 | ||||||
| 356,197 | GNMA, Pool #AD1745, 3.000%, 2/20/43 | 360,452 | ||||||
| 269,372 | GNMA, Pool #MA1157, 3.500%, 7/20/43 | 279,971 | ||||||
| Total U.S. Government Mortgage-Backed Obligations | $ | 6,554,091 | ||||||
| Asset-Backed Securities — 4.0% | ||||||||
| 200,000 | Ascentium Equipment Receivables 2016-1 Trust, Ser 2016-1A, Class B, 144a, 2.850%, 7/10/20 | 201,415 | ||||||
| 112,242 | California Republic Auto Receivables Trust, Ser 2014-2, Class A4, 1.570%, 12/16/19 | 112,106 | ||||||
| 255,809 | CWHEQ Home Equity Loan Trust, Ser 2007-S1, Class A5, 6.018%, 11/25/36(A)(C) | 247,003 | ||||||
| 327,828 | Elara HGV Timeshare Issuer LLC, Ser 2017-A, Class A, 144a, 2.840%, 3/25/30 | 325,361 | ||||||
| 149,125 | Sonic Capital LLC, Ser 2016-1A, Class A2, 144a, 4.472%, 5/20/46 | 151,241 | ||||||
| 134,985 | SpringCastle America Funding LLC, Ser 2016-AA, Class A, 144a, 3.050%, 4/25/29 | 135,822 | ||||||
| 325,000 | Towd Point Mortgage Trust, Ser 2015-3, Class A2, 144a, 4.000%, 3/25/54(A)(C) | 328,636 | ||||||
| 380,000 | Voya CLO Ltd. (Cayman Islands), Ser 2017-4A, Class A1, 144a, (3M LIBOR +1.130%), 2.514%, 10/15/30(A) | 380,195 | ||||||
| 400,000 | Wendys Funding LLC, Ser 2018-1A, Class A2I, 144a, 3.573%, 3/15/48 | 400,000 | ||||||
| Total Asset-Backed Securities | $ | 2,281,779 | ||||||
| Non-Agency Collateralized Mortgage Obligations — 3.0% | ||||||||
| 128,831 | Agate Bay Mortgage Trust, Ser 2015-2, Class A8, 144a, 3.000%, 3/25/45(A)(C) | 128,484 | ||||||
| 9,101 | Deutsche ALT-A Securities, Inc. Alternate Loan Trust, Ser 2003-2XS, Class A6, 5.470%, 9/25/33(D) | 9,196 | ||||||
| 458,181 | EverBank Mortgage Loan Trust, Ser 2013-1, Class B1, 144a, 3.480%, 3/25/43(A)(C) | 457,694 | ||||||
| 109,338 | Residential Asset Securitization Trust, Ser 2006-A1, Class 1A3, 6.000%, 4/25/36 | 86,437 | ||||||
| 289,076 | Sequoia Mortgage Trust, Ser 2013-1, Class B1, 3.647%, 2/25/43(A)(C) | 294,011 | ||||||
| 255,468 | Sequoia Mortgage Trust, Ser 2013-10, Class B2, 144a, 3.564%, 8/25/43(A)(C) | 256,453 | ||||||
| 359,210 | Sequoia Mortgage Trust, Ser 2013-5, Class B1, 144a, 3.515%, 5/25/43(A)(C) | 364,879 | ||||||
| 75,647 | Structured Asset Securities Corp. Trust, Ser 2005-17, Class 5A1, 5.500%, 10/25/35 | 60,872 | ||||||
| 53,808 | Washington Mutual Alternative Mortgage Pass-Through Certificates, Ser 2005-9, Class 2A4, 5.500%, 11/25/35†† | 49,496 | ||||||
| Total Non-Agency Collateralized Mortgage Obligations | $ | 1,707,522 | ||||||
37
Touchstone Active Bond Fund (Continued)
| Principal | Market | |||||||
| Amount | Value | |||||||
| Commercial Mortgage-Backed Securities — 1.7% | ||||||||
| $ | 214,000 | 280 Park Avenue 2017-280P Mortgage Trust, Ser 2017-280P, Class A, 144a, (1M LIBOR +0.880%), | ||||||
| 2.357%, 9/15/34(A) | $ | 214,266 | ||||||
| 360,000 | DBUBS Mortgage Trust, Ser 2017-BRBK, Class B, 144a, | |||||||
| 3.647%, 10/10/24(A)(C) | 364,062 | |||||||
| 375,000 | GS Mortgage Securities Corp. II, Ser 2017-SLP, Class B, 144a, | |||||||
| 3.772%, 10/10/32 | 381,300 | |||||||
| Total Commercial Mortgage-Backed Securities | $ | 959,628 | ||||||
| Sovereign Bonds — 1.4% | ||||||||
| 200,000 | Bermuda Government International | |||||||
| Bond, 144a, 3.717%, 1/25/27 | 202,250 | |||||||
| 200,000 | Mexico Government International | |||||||
| Bond, 4.350%, 1/15/47 | 191,000 | |||||||
| 198,000 | Portugal Government International | |||||||
| Bond, 144a, 5.125%, 10/15/24 | 212,438 | |||||||
| 220,000 | Province of Alberta Canada, 2.200%, | |||||||
| 7/26/22 | 216,795 | |||||||
| Total Sovereign Bonds | $ | 822,483 | ||||||
| Agency Collateralized Mortgage Obligations — 1.4% | ||||||||
| 118,153 | FNMA REMIC, Ser 2015-51, Class KC, | |||||||
| 3.000%, 6/25/45 | 119,109 | |||||||
| 695,451 | FNMA REMIC, Ser 2017-90, Class KA, | |||||||
| 3.000%, 11/25/47 | 701,567 | |||||||
| Total Agency Collateralized Mortgage Obligations | $ | 820,676 | ||||||
| Municipal Bond — 0.6% | ||||||||
| New York — 0.6% | ||||||||
| 320,000 | NY Housing Development Corp., Ref 8 Spruce Street Class B, | |||||||
| 3.864%, 2/15/48(D) | $ | 325,011 | ||||||
| Shares | ||||||||
| Preferred Stocks — 0.3% | ||||||||
| Utilities — 0.3% | ||||||||
| 3,945 | Entergy Louisiana LLC, 0.030% | 97,915 | ||||||
| 2,960 | Integrys Holding, Inc., 0.038% | 80,068 | ||||||
| 177,983 | ||||||||
| Total Preferred Stocks | $ | 177,983 | ||||||
| Short-Term Investment Funds — 5.9% | ||||||||
| 3,373,637 | Dreyfus Government Cash Management, Institutional Shares, 1.19%∞Ω | $ | 3,373,637 | |||||
| 38,202 | Invesco Government & Agency Portfolio, Institutional Class, 1.19%**∞Ω | 38,202 | ||||||
| Total Short-Term Investment Funds | $ | 3,411,839 | ||||||
| Total Investment Securities — 100.2% | ||||||||
| (Cost $57,176,078) | $ | 57,498,574 | ||||||
| Liabilities in Excess of | ||||||||
| Other Assets — (0.2%) | (130,046 | ) | ||||||
| Net Assets — 100.0% | $ | 57,368,528 | ||||||
| (A) | Variable rate security - Rate reflected is the rate in effect as of December 31, 2017. |
| (B) | The issuer is in default of certain debt covenants. Income is not being accrued. The total value of such securities as of December 31, 2017 was $14,310 or 0.02% of net assets. |
| (C) | Certain variable rate securities are not based on a published reference rate and spread but are determined by the issuer or agent and are based on current market conditions. These securities do not indicate a reference rate and spread in their description. |
| (D) | Step Bond - A bond that pays an initial interest rate for the first period and then a higher interest rate for the following periods until maturity. The interest rate shown reflects the rate in effect as of December 31, 2017. |
| ** | Represents collateral for securities loaned. |
| † | All or a portion of the security is on loan. The total market value of the securities on loan as of December 31, 2017 was $37,195. |
| †† | The issuers and/or sponsors of certain mortgage-backed securities may no longer exist; however, the securities held by the Fund are separate legal entities organized as trusts and publicly traded. The Fund receives principal and interest payments directly from these trusts. |
| ∞ | Open-End Fund. |
| Ω | Represents the 7-day SEC yield as of December 31, 2017. |
38
Touchstone Active Bond Fund (Continued)
Portfolio Abbreviations:
CLO - Collateralized Loan Obligation
DAC - Designated Activity Company
FHLMC - Federal Home Loan Mortgage Association
FNMA - Federal National Mortgage Association
GNMA - Government National Mortgage Association
LIBOR - London Interbank Offered Rate
LLC - Limited Liability Company
LP - Limited Partnership
MTN -Medium Term Note
PLC - Public Limited Company
REIT - Real Estate Investment Trust
REMIC - Real Estate Mortgage Investment Conduit
144a - This is a restricted security that was sold in a transaction qualifying for the exemption under Rule 144A of the Securities Act of 1933. This security may be sold in transactions exempt from registration, normally to qualified institutional buyers. At December 31, 2017, these securities were valued at $6,905,086 or 12.0% of net assets. These securities were deemed liquid pursuant to procedures approved by the Board of Trustees.
Other Information:
The inputs or methodology used for valuing securities may not be an indication of the risk associated with investing in those securities. For more information on valuation inputs, and their aggregation into the levels used in the table below, please refer to the security valuation section in the accompanying Notes to Financial Statements.
| Valuation inputs at Reporting Date: | ||||||||||||||||
| Description | Level 1 | Level 2 | Level 3 | Total | ||||||||||||
| Assets: | ||||||||||||||||
| U.S. Treasury Obligations | $ | — | $ | 21,677,561 | $ | — | $ | 21,677,561 | ||||||||
| Corporate Bonds | — | 18,760,001 | — | 18,760,001 | ||||||||||||
| U.S. Government Mortgage-Backed Obligations | — | 6,554,091 | — | 6,554,091 | ||||||||||||
| Asset-Backed Securities | — | 2,281,779 | — | 2,281,779 | ||||||||||||
| Non-Agency Collateralized Mortgage Obligations | $ | — | $ | 1,707,522 | $ | — | $ | 1,707,522 | ||||||||
| Commercial Mortgage-Backed Securities | — | 959,628 | — | 959,628 | ||||||||||||
| Sovereign Bonds | — | 822,483 | — | 822,483 | ||||||||||||
| Agency Collateralized Mortgage Obligations | — | 820,676 | — | 820,676 | ||||||||||||
| Municipal Bond | — | 325,011 | — | 325,011 | ||||||||||||
| Preferred Stocks | 177,983 | — | — | 177,983 | ||||||||||||
| Short-Term Investment Funds | 3,411,839 | — | — | 3,411,839 | ||||||||||||
| Other Financial Instruments* | ||||||||||||||||
| Futures Interest Rate Contracts | 7,563 | — | — | 7,563 | ||||||||||||
| Total Assets | $ | 3,597,385 | $ | 53,908,752 | $ | — | $ | 57,506,137 | ||||||||
| Liabilities: | ||||||||||||||||
| Other Financial Instruments* | ||||||||||||||||
| Futures Interest Rate Contracts | (14,649 | ) | — | — | (14,649 | ) | ||||||||||
| Total | $ | 3,582,736 | $ | 53,908,752 | $ | — | $ | 57,491,488 | ||||||||
*Other Financial Instruments are derivative instruments not reflected in total investments. Amounts shown represent unrealized appreciation (depreciation) on futures contracts.
39
Touchstone Active Bond Fund (Continued)
Futures Contracts
At December 31, 2017, $49,625 was segregated with the broker as collateral for futures contracts. The Fund had the following futures contracts, brokered by Wells Fargo, open at December 31, 2017:
| Value and | ||||||||||||||
| Unrealized | ||||||||||||||
| Expiration | Notional | Appreciation/ | ||||||||||||
| Description | Date | Number of Contracts | Amount | (Depreciation) | ||||||||||
| Short Futures: | ||||||||||||||
| US Ultra Bond Futures | 3/1/2018 | 20 | $ | 3,338,438 | $ | (14,649 | ) | |||||||
| Long Futures: | ||||||||||||||
| 10-Year US Ultra Futures | 3/1/2018 | 25 | $ | 3,331,547 | 7,563 | |||||||||
| $ | (7,086 | ) | ||||||||||||
See accompanying Notes to Financial Statements.
40
Portfolio of Investments
Touchstone Balanced Fund – December 31, 2017
| Market | ||||||||
| Shares | Value | |||||||
| Common Stocks — 63.6% | ||||||||
| Information Technology — 17.0% | ||||||||
| 2,869 | Apple, Inc. | $ | 485,521 | |||||
| 458 | Alphabet, Inc. - Class C* | 479,251 | ||||||
| 5,567 | Microsoft Corp. | 476,201 | ||||||
| 2,486 | Facebook, Inc. - Class A* | 438,680 | ||||||
| 7,181 | Oracle Corp. | 339,518 | ||||||
| 2,731 | salesforce.com, Inc.* | 279,190 | ||||||
| 1,250 | International Business Machines Corp. | 191,775 | ||||||
| 4,884 | Cisco Systems, Inc. | 187,057 | ||||||
| 4,292 | Avnet, Inc. | 170,049 | ||||||
| 3,047,242 | ||||||||
| Consumer Discretionary — 11.5% | ||||||||
| 443 | Amazon.com, Inc.* | 518,075 | ||||||
| 158 | Priceline Group, Inc. (The)* | 274,563 | ||||||
| 3,744 | Carnival Corp. (Panama) | 248,489 | ||||||
| 6,110 | Comcast Corp. - Class A | 244,705 | ||||||
| 6,749 | Twenty-First Century Fox, Inc. - Class A | 233,043 | ||||||
| 594 | Charter Communications, Inc. - Class A* | 199,560 | ||||||
| 3,045 | Starbucks Corp. | 174,874 | ||||||
| 4,257 | Yum China Holdings, Inc. | 170,365 | ||||||
| 2,063,674 | ||||||||
| Financials — 10.9% | ||||||||
| 5,011 | Berkshire Hathaway, Inc. - Class B* | 993,280 | ||||||
| 1,128 | Goldman Sachs Group, Inc. (The) | 287,369 | ||||||
| 6,193 | Brookfield Asset Management, Inc. (Canada) - Class A | 269,643 | ||||||
| 8,450 | Bank of America Corp. | 249,444 | ||||||
| 1,095 | Signature Bank/NewYork NY* | 150,300 | ||||||
| 1,950,036 | ||||||||
| Health Care — 7.0% | ||||||||
| 4,311 | Novartis AG ADR | 361,952 | ||||||
| 2,248 | Johnson & Johnson | 314,091 | ||||||
| 4,994 | Bristol-Myers Squibb Co. | 306,032 | ||||||
| 890 | Biogen, Inc.* | 283,527 | ||||||
| 1,265,602 | ||||||||
| Industrials — 6.0% | ||||||||
| 2,069 | United Technologies Corp. | 263,942 | ||||||
| 13,578 | General Electric Co. | 236,936 | ||||||
| 1,543 | Union Pacific Corp. | 206,916 | ||||||
| 2,887 | Stericycle, Inc.* | 196,287 | ||||||
| 4,569 | Johnson Controls International PLC (Ireland) | 174,125 | ||||||
| 1,078,206 | ||||||||
| Energy — 3.4% | ||||||||
| 3,317 | Schlumberger Ltd. (Curacao) | 223,533 | ||||||
| 2,491 | Exxon Mobil Corp. | 208,347 | ||||||
| 3,711 | Halliburton Co. | 181,357 | ||||||
| 613,237 | ||||||||
| Real Estate — 2.8% | ||||||||
| 1,574 | Simon Property Group, Inc. REIT | 270,319 | ||||||
| 1,571 | Jones Lang LaSalle, Inc. REIT | 233,969 | ||||||
| 504,288 | ||||||||
| Consumer Staples — 2.6% | ||||||||
| 3,839 | Unilever NV (Netherlands) | 216,212 | ||||||
| 3,115 | Mondelez International, Inc. - Class A | 133,322 | ||||||
| 914 | JM Smucker Co. (The) | 113,555 | ||||||
| 463,089 | ||||||||
| Telecommunication Services — 1.4% | ||||||||
| 6,447 | AT&T, Inc. | 250,659 | ||||||
| Materials — 1.0% | ||||||||
| 1,594 | Agrium, Inc. (Canada) | 183,310 | ||||||
| Total Common Stocks | $ | 11,419,343 | ||||||
| Principal | ||||||||
| Amount | ||||||||
| U.S. Treasury Obligations — 14.4% | ||||||||
| $ | 184,000 | U.S. Treasury Bond, 2.750%, 8/15/47 | 184,230 | |||||
| 1,065,000 | U.S. Treasury Note, 1.500%, 10/31/19 | 1,057,678 | ||||||
| 650,000 | U.S. Treasury Note, 2.000%, 10/31/22 | 644,338 | ||||||
| 260,000 | U.S. Treasury Note, 2.250%, 8/15/27 | 256,344 | ||||||
| 440,000 | United States Treasury Inflation Indexed Bonds, 0.375%, 7/15/27 | 441,342 | ||||||
| Total U.S. Treasury Obligations | $ | 2,583,932 | ||||||
| Corporate Bonds — 9.9% | ||||||||
| Financials — 2.1% | ||||||||
| 24,000 | American Express Co., | |||||||
| 3.000%, 10/30/24 | 23,960 | |||||||
| 20,000 | AvalonBay Communities, Inc. MTN, | |||||||
| 3.200%, 1/15/28 | 19,923 | |||||||
| 50,000 | Bank of America Corp. MTN, | |||||||
| 4.000%, 1/22/25 | 52,018 | |||||||
| 24,000 | Bank of Montreal (Canada), | |||||||
| 3.803%, 12/15/32 | 23,727 | |||||||
| 24,000 | Boston Properties LP, 3.200%, 1/15/25 | 23,924 | ||||||
| 12,000 | Chubb INA Holdings, Inc., | |||||||
| 4.350%, 11/3/45 | 13,549 | |||||||
| 18,000 | Citigroup, Inc., 3.300%, 4/27/25 | 18,168 | ||||||
| 11,000 | Citigroup, Inc., 4.750%, 5/18/46 | 12,126 | ||||||
| 18,000 | Fifth Third Bancorp, 2.875%, 7/27/20 | 18,190 | ||||||
| 32,000 | Goldman Sachs Group, Inc. (The), | |||||||
| 3.691%, 6/5/28 | 32,463 | |||||||
| 15,000 | JPMorgan Chase & Co., | |||||||
| 3.250%, 9/23/22 | 15,358 | |||||||
| 25,000 | Morgan Stanley, 3.950%, 4/23/27 | 25,387 | ||||||
| 18,000 | Northwestern Mutual Life Insurance Co. (The), 144a, | |||||||
| 3.850%, 9/30/47 | 18,248 | |||||||
| 15,000 | Prudential Financial, Inc., | |||||||
| 5.625%, 6/15/43 | 16,245 | |||||||
| 20,000 | State Street Corp., (3M LIBOR | |||||||
| +1.000%), 2.590%, 6/15/47(A) | 18,025 | |||||||
41
Touchstone Balanced Fund (Continued)
| Principal | Market | |||||||
| Amount | Value | |||||||
| Corporate Bonds — 9.9% (Continued) | ||||||||
| Financials — (Continued) | ||||||||
| $ | 17,000 | Visa, Inc., 4.150%, 12/14/35 | $ | 18,874 | ||||
| 30,000 | Wells Fargo & Co., 4.125%, 8/15/23 | 31,637 | ||||||
| 381,822 | ||||||||
| Information Technology — 1.3% | ||||||||
| 23,000 | Activision Blizzard, Inc., 144a, | |||||||
| 6.125%, 9/15/23 | 24,383 | |||||||
| 75,000 | Apple, Inc., 2.750%, 1/13/25 | 74,348 | ||||||
| 24,000 | Apple, Inc., 4.650%, 2/23/46 | 28,105 | ||||||
| 21,000 | Dell International LLC / EMC Corp., 144a, 6.020%, 6/15/26 | 23,155 | ||||||
| 11,000 | Microsoft Corp., 3.500%, 2/12/35 | 11,445 | ||||||
| 20,000 | Oracle Corp., 2.650%, 7/15/26 | 19,499 | ||||||
| 40,000 | Oracle Corp., 3.250%, 11/15/27 | 40,679 | ||||||
| 18,000 | QUALCOMM, Inc., 3.450%, 5/20/25 | 18,041 | ||||||
| 239,655 | ||||||||
| Consumer Discretionary — 1.2% | ||||||||
| 18,000 | Allergan Sales LLC, 144a, | |||||||
| 5.000%, 12/15/21 | 19,251 | |||||||
| 20,000 | Amazon.com, Inc., 144a, | |||||||
| 2.800%, 8/22/24 | 19,939 | |||||||
| 20,000 | Anheuser-Busch InBev Finance, Inc., | |||||||
| 4.900%, 2/1/46 | 23,180 | |||||||
| 22,000 | Aptiv PLC (Jersey), 3.150%, 11/19/20 | 22,340 | ||||||
| 20,000 | AutoNation, Inc., 5.500%, 2/1/20 | 21,114 | ||||||
| 13,000 | Ford Motor Co., 4.750%, 1/15/43 | 13,184 | ||||||
| 32,000 | General Motors Financial Co., Inc., | |||||||
| 3.950%, 4/13/24 | 32,944 | |||||||
| 20,000 | Home Depot, Inc. (The), | |||||||
| 5.950%, 4/1/41 | 27,085 | |||||||
| 15,000 | Time Warner, Inc., 3.800%, 2/15/27 | 14,986 | ||||||
| 23,000 | Wal-Mart Stores, Inc., | |||||||
| 2.350%, 12/15/22 | 22,919 | |||||||
| 216,942 | ||||||||
| Energy — 1.0% | ||||||||
| 17,000 | Cenovus Energy, Inc. (Canada), | |||||||
| 4.250%, 4/15/27 | 16,959 | |||||||
| 15,000 | Concho Resources, Inc., | |||||||
| 3.750%, 10/1/27 | 15,196 | |||||||
| 14,000 | EOG Resources, Inc., 3.900%, 4/1/35 | 14,289 | ||||||
| 23,000 | Midcontinent Express Pipeline LLC, | |||||||
| 144a, 6.700%, 9/15/19 | 24,023 | |||||||
| 17,000 | Petroleos Mexicanos (Mexico), | |||||||
| 4.500%, 1/23/26 | 16,969 | |||||||
| 20,000 | Rockies Express Pipeline LLC, 144a, | |||||||
| 6.875%, 4/15/40 | 22,500 | |||||||
| 20,000 | Sabine Pass Liquefaction LLC, | |||||||
| 5.000%, 3/15/27 | 21,462 | |||||||
| 20,000 | Shell International Finance BV | |||||||
| (Netherlands), 1.875%, 5/10/21 | 19,706 | |||||||
| 14,000 | Western Gas Partners LP, | |||||||
| 3.950%, 6/1/25 | 13,998 | |||||||
| 20,000 | Williams Cos., Inc. (The), | |||||||
| 3.700%, 1/15/23 | 19,900 | |||||||
| 185,002 | ||||||||
| Health Care — 0.9% | ||||||||
| 22,000 | Abbott Laboratories, | |||||||
| 3.750%, 11/30/26 | 22,591 | |||||||
| 20,000 | AbbVie, Inc., 4.450%, 5/14/46 | 21,740 | ||||||
| 15,000 | Allergan Funding SCS (Luxembourg), | |||||||
| 3.800%, 3/15/25 | 15,271 | |||||||
| 17,000 | Celgene Corp., 5.000%, 8/15/45 | 19,288 | ||||||
| 17,000 | Express Scripts Holding Co., | |||||||
| 3.300%, 2/25/21 | 17,267 | |||||||
| 30,000 | Johnson & Johnson, 2.900%, 1/15/28 | 30,045 | ||||||
| 17,000 | Medtronic Global Holdings SCA | |||||||
| (Luxembourg), 3.350%, 4/1/27 | 17,443 | |||||||
| 15,000 | Zimmer Biomet Holdings, Inc., | |||||||
| 3.150%, 4/1/22 | 15,037 | |||||||
| 5,000 | Zimmer Biomet Holdings, Inc., | |||||||
| 3.375%, 11/30/21 | 5,066 | |||||||
| 163,748 | ||||||||
| Telecommunication Services — 0.8% | ||||||||
| 20,000 | AT&T, Inc., 3.900%, 8/14/27 | 20,134 | ||||||
| 20,000 | AT&T, Inc., 4.350%, 6/15/45 | 18,452 | ||||||
| 21,000 | Charter Communications Operating LLC / Charter Communications Operating Capital, | |||||||
| 6.484%, 10/23/45 | 24,484 | |||||||
| 20,000 | Comcast Corp., 2.850%, 1/15/23 | 20,160 | ||||||
| 25,000 | Qwest Corp., 6.750%, 12/1/21 | 26,922 | ||||||
| 25,000 | Verizon Communications, Inc., | |||||||
| 5.012%, 4/15/49 | 26,220 | |||||||
| 136,372 | ||||||||
| Real Estate — 0.7% | ||||||||
| 22,000 | Crown Castle International Corp., | |||||||
| 3.650%, 9/1/27 | 21,946 | |||||||
| 14,000 | Digital Realty Trust LP, 2.750%, 2/1/23 | 13,877 | ||||||
| 15,000 | Mid-America Apartments LP, | |||||||
| 3.750%, 6/15/24 | 15,417 | |||||||
| 14,000 | Sabra Health Care LP, 5.125%, 8/15/26 | 14,196 | ||||||
| 25,000 | SL Green Operating Partnership LP, | |||||||
| 3.250%, 10/15/22 | 24,904 | |||||||
| 16,000 | Ventas Realty LP, 3.500%, 2/1/25 | 16,119 | ||||||
| 20,000 | Vornado Realty LP, 5.000%, 1/15/22 | 21,454 | ||||||
| 127,913 | ||||||||
| Utilities — 0.7% | ||||||||
| 21,000 | Dominion Energy, Inc., | |||||||
| 2.000%, 8/15/21 | 20,521 | |||||||
| 15,000 | Duke Energy Progress LLC, | |||||||
| 4.150%, 12/1/44 | 16,361 | |||||||
| 17,000 | Fortis, Inc. (Canada), 3.055%, 10/4/26 | 16,414 | ||||||
42
Touchstone Balanced Fund (Continued)
| Principal | Market | |||||||
| Amount | Value | |||||||
| Corporate Bonds — 9.9% (Continued) | ||||||||
| Utilities — (Continued) | ||||||||
| $ | 21,000 | NextEra Energy Capital Holdings, Inc., | ||||||
| (3M LIBOR +2.125%), | ||||||||
| 3.713%, 6/15/67(A) | $ | 20,011 | ||||||
| 16,000 | Oncor Electric Delivery Co. LLC, 144a, | |||||||
| 3.800%, 9/30/47 | 16,622 | |||||||
| 27,000 | PacifiCorp., 5.750%, 4/1/37 | 34,860 | ||||||
| 124,789 | ||||||||
| Consumer Staples — 0.6% | ||||||||
| 15,000 | Constellation Brands, Inc., | |||||||
| 2.650%, 11/7/22 | 14,840 | |||||||
| 13,000 | CVS Health Corp., 5.125%, 7/20/45 | 14,899 | ||||||
| 15,000 | Kraft Heinz Foods Co., 6.875%, 1/26/39 | 19,746 | ||||||
| 8,000 | Kroger Co. (The), 5.000%, 4/15/42 | 8,500 | ||||||
| 14,000 | Mead Johnson Nutrition Co., | |||||||
| 4.125%, 11/15/25 | 14,849 | |||||||
| 6,000 | Moody's Corp., 2.750%, 12/15/21 | 6,008 | ||||||
| 20,000 | Reynolds American, Inc., | |||||||
| 4.450%, 6/12/25 | 21,325 | |||||||
| 100,167 | ||||||||
| Industrials — 0.5% | ||||||||
| 25,000 | Burlington Northern Santa Fe LLC, | |||||||
| 5.750%, 5/1/40 | 32,576 | |||||||
| 20,000 | Eagle Materials, Inc., 4.500%, 8/1/26 | 20,850 | ||||||
| 16,000 | FedEx Corp., 5.100%, 1/15/44 | 18,620 | ||||||
| 15,000 | Roper Technologies, Inc., | |||||||
| 3.000%, 12/15/20 | 15,178 | |||||||
| 87,224 | ||||||||
| Materials — 0.1% | ||||||||
| 10,000 | Westlake Chemical Corp., | |||||||
| 4.375%, 11/15/47 | 10,385 | |||||||
| Total Corporate Bonds | $ | 1,774,019 | ||||||
| U.S. Government Mortgage-Backed Obligations — 8.3% | ||||||||
| 318,407 | FHLMC, Pool #G05624, 4.500%, 9/1/39 | 341,355 | ||||||
| 203,579 | FHLMC, Pool #Q29260, 4.000%, 10/1/44 | 212,930 | ||||||
| 129,779 | FNMA, Pool #725423, 5.500%, 5/1/34 | 144,017 | ||||||
| 121,856 | FNMA, Pool #725610, 5.500%, 7/1/34 | 135,235 | ||||||
| 31,121 | FNMA, Pool #890310, 4.500%, 12/1/40 | 33,361 | ||||||
| 131,070 | FNMA, Pool #AD9193, 5.000%, 9/1/40 | 141,520 | ||||||
| 470,850 | FNMA, Pool #AL5718, 3.500%, 9/1/44 | 486,366 | ||||||
| Total U.S. Government Mortgage-Backed Obligations | $ | 1,494,784 | ||||||
| Sovereign Bonds — 0.1% | ||||||||
| 20,000 | Province of Alberta Canada, 2.200%, | |||||||
| 7/26/22 | $ | 19,709 | ||||||
| U.S. Treasury Bill — 2.1% | ||||||||
| 385,000 | U.S. Treasury Bill, 1.238%, 2/15/18(B) | $ | 384,418 | |||||
| Shares | ||||||||
| Short-Term Investment Fund — 0.2% | ||||||||
| 35,825 | Dreyfus Government Cash Management, Institutional Shares, 1.19%∞Ω | $ | 35,825 | |||||
| Total Investment Securities — 98.6% | ||||||||
| (Cost $15,940,249) | $ | 17,712,030 | ||||||
| Other Assets in | ||||||||
| Excess of Liabilities — 1.4% | 251,607 | |||||||
| Net Assets — 100.0% | $ | 17,963,637 | ||||||
| (A) | Variable rate security - Rate reflected is the rate in effect as of December 31, 2017. |
| (B) | Rate reflects yield at the time of purchase. |
| * | Non-income producing security. |
| ∞ | Open-End Fund. |
| Ω | Represents the 7-day SEC yield as of December 31, 2017. |
Portfolio Abbreviations:
ADR - American Depositary Receipt
FHLMC - Federal Home Loan Mortgage Corporation
FNMA - Federal National Mortgage Association
LIBOR - London Inter Bank Offered Rate
LLC - Limited Liability Company
LP - Limited Partnership
MTN - Medium Term Note
PLC - Public Limited Company
REIT - Real Estate Investment Trust
144a - This is a restricted security that was sold in a transaction qualifying for the exemption under Rule 144A of the Securities Act of 1933. This security may be sold in transactions exempt from registration, normally to qualified institutional buyers. At December 31, 2017, these securities were valued at $168,121 or 0.9% of net assets. These securities were deemed liquid pursuant to procedures approved by the Board of Trustees.
43
Touchstone Balanced Fund (Continued)
Other Information:
The inputs or methodology used for valuing securities may not be an indication of the risk associated with investing in those securities. For more information on valuation inputs, and their aggregation into the levels used in the table below, please refer to the security valuation section in the accompanying Notes to Financial Statements.
Valuation inputs at Reporting Date:
| Description | Level 1 | Level 2 | Level 3 | Total | ||||||||||||
| Common Stocks | $ | 11,419,343 | $ | — | $ | — | $ | 11,419,343 | ||||||||
| U.S. Treasury Obligations | — | 2,583,932 | — | 2,583,932 | ||||||||||||
| Corporate Bonds | — | 1,774,019 | — | 1,774,019 | ||||||||||||
| U.S. Government Mortgage-Backed Obligations | — | 1,494,784 | — | 1,494,784 | ||||||||||||
| Sovereign Bonds | — | 19,709 | — | 19,709 | ||||||||||||
| U.S. Treasury Bill | — | 384,418 | — | 384,418 | ||||||||||||
| Short-Term Investment Fund | 35,825 | — | — | 35,825 | ||||||||||||
| Total | $ | 11,455,168 | $ | 6,256,862 | $ | — | $ | 17,712,030 | ||||||||
See accompanying Notes to Financial Statements.
44
Portfolio of Investments
Touchstone Bond Fund – December 31, 2017
| Principal | Market | |||||||
| Amount | Value | |||||||
| U.S. Treasury Obligations — 32.3% | ||||||||
| $ | 2,950,000 | U.S. Treasury Inflation Indexed Bonds, | ||||||
| 0.375%, 7/15/27 | $ | 2,959,000 | ||||||
| 9,800,000 | U.S. Treasury Note, 1.500%, 10/31/19 | 9,732,625 | ||||||
| 2,510,000 | U.S. Treasury Note, 1.875%, 9/30/22 | 2,473,625 | ||||||
| Total U.S. Treasury Obligations | $ | 15,165,250 | ||||||
| Corporate Bonds — 28.9% | ||||||||
| Industrials — 6.6% | ||||||||
| 410,000 | 3M Co. MTN, 5.700%, 3/15/37 | 543,964 | ||||||
| 510,000 | Burlington Northern Santa Fe LLC, | |||||||
| 4.150%, 4/1/45 | 554,213 | |||||||
| 550,000 | Caterpillar, Inc., 3.803%, 8/15/42 | 589,323 | ||||||
| 166,000 | Eagle Materials, Inc., 4.500%, 8/1/26 | 173,055 | ||||||
| 485,000 | General Electric Co., 4.500%, 3/11/44 | 537,269 | ||||||
| 350,000 | Lockheed Martin Corp., | |||||||
| 3.550%, 1/15/26 | 363,431 | |||||||
| 350,000 | United Technologies Corp., | |||||||
| 2.650%, 11/1/26 | 337,087 | |||||||
| 3,098,342 | ||||||||
| Health Care — 6.0% | ||||||||
| 300,000 | Abbott Laboratories, | |||||||
| 4.900%, 11/30/46 | 343,949 | |||||||
| 290,000 | Express Scripts Holding Co., | |||||||
| 3.400%, 3/1/27 | 284,581 | |||||||
| 175,000 | Johnson & Johnson, 2.900%, 1/15/28 | 175,260 | ||||||
| 350,000 | Medtronic, Inc., 3.500%, 3/15/25 | 363,071 | ||||||
| 475,000 | Medtronic, Inc., 4.625%, 3/15/45 | 553,400 | ||||||
| 480,000 | Pfizer, Inc., 4.400%, 5/15/44 | 550,956 | ||||||
| 470,000 | UnitedHealth Group, Inc., | |||||||
| 4.750%, 7/15/45 | 555,166 | |||||||
| 2,826,383 | ||||||||
| Financials — 5.7% | ||||||||
| 126,000 | AvalonBay Communities, Inc. MTN, | |||||||
| 3.200%, 1/15/28 | 125,517 | |||||||
| 1,400,000 | Bank of America Corp. MTN, | |||||||
| 3.248%, 10/21/27 | 1,389,247 | |||||||
| 170,000 | Bank of Montreal (Canada), | |||||||
| 3.803%, 12/15/32 | 168,067 | |||||||
| 166,000 | Boston Properties LP, 3.200%, 1/15/25 | 165,471 | ||||||
| 350,000 | Chubb INA Holdings, Inc., | |||||||
| 3.350%, 5/3/26 | 357,195 | |||||||
| 350,000 | JPMorgan Chase & Co., | |||||||
| 2.950%, 10/1/26 | 343,784 | |||||||
| 125,000 | Northwestern Mutual Life Insurance Co. (The), 144a, 3.850%, 9/30/47 | 126,719 | ||||||
| 2,676,000 | ||||||||
| Consumer Discretionary — 4.7% | ||||||||
| 350,000 | Amazon.com, Inc., 4.950%, 12/5/44 | 425,448 | ||||||
| 350,000 | Anheuser-Busch InBev Finance, Inc., | |||||||
| 4.900%, 2/1/46 | 405,646 | |||||||
| 350,000 | Comcast Corp., 2.350%, 1/15/27 | 330,539 | ||||||
| 200,000 | General Motors Financial Co., Inc., | |||||||
| 3.200%, 7/6/21 | 201,952 | |||||||
| 100,000 | Home Depot, Inc. (The), | |||||||
| 4.250%, 4/1/46 | 111,680 | |||||||
| 350,000 | McDonald's Corp. MTN, | |||||||
| 3.700%, 1/30/26 | 364,835 | |||||||
| 350,000 | Time Warner, Inc., 3.800%, 2/15/27 | 349,669 | ||||||
| 2,189,769 | ||||||||
| Energy — 2.2% | ||||||||
| 300,000 | Electricite de France SA (France), 144a, | |||||||
| 3.625%, 10/13/25 | 307,358 | |||||||
| 550,000 | EOG Resources, Inc., 3.150%, 4/1/25 | 547,956 | ||||||
| 75,000 | Sabine Pass Liquefaction LLC, | |||||||
| 5.625%, 3/1/25 | 82,726 | |||||||
| 96,000 | Western Gas Partners LP, | |||||||
| 3.950%, 6/1/25 | 95,989 | |||||||
| 1,034,029 | ||||||||
| Information Technology — 2.2% | ||||||||
| 300,000 | Cox Communications, Inc., 144a, | |||||||
| 3.350%, 9/15/26 | 293,173 | |||||||
| 75,000 | First Data Corp., 144a, 5.000%, 1/15/24 | 77,156 | ||||||
| 300,000 | KLA-Tencor Corp., 4.650%, 11/1/24 | 325,409 | ||||||
| 350,000 | Microsoft Corp., 2.400%, 8/8/26 | 337,528 | ||||||
| 1,033,266 | ||||||||
| Consumer Staples — 0.7% | ||||||||
| 350,000 | Walgreens Boots Alliance, Inc., | |||||||
| 3.450%, 6/1/26 | 346,099 | |||||||
| Real Estate — 0.7% | ||||||||
| 300,000 | HCP, Inc., 4.000%, 6/1/25 | 308,810 | ||||||
| Materials — 0.1% | ||||||||
| 70,000 | Westlake Chemical Corp., | |||||||
| 4.375%, 11/15/47 | 72,697 | |||||||
| Total Corporate Bonds | $ | 13,585,395 | ||||||
| U.S. Government Mortgage-Backed Obligations — 21.4% | ||||||||
| 597,014 | FHLMC, Pool #G05624, 4.500%, 9/1/39 | 640,040 | ||||||
| 840,317 | FHLMC, Pool #Q29056, | |||||||
| 4.000%, 10/1/44 | 878,846 | |||||||
| 333,643 | FHLMC, Pool #Q29260, | |||||||
| 4.000%, 10/1/44 | 348,969 | |||||||
| 488,380 | FNMA, Pool #725423, 5.500%, 5/1/34 | 541,958 | ||||||
| 451,317 | FNMA, Pool #725610, 5.500%, 7/1/34 | 500,871 | ||||||
| 436,901 | FNMA, Pool #AD9193, 5.000%, 9/1/40 | 471,732 | ||||||
| 583,291 | FNMA, Pool #AL5718, 3.500%, 9/1/44 | 602,513 | ||||||
| 581,542 | FNMA, Pool #AR9195, 3.000%, 3/1/43 | 584,908 | ||||||
| 643,189 | FNMA, Pool #AS4707, 3.500%, 4/1/45 | 664,948 | ||||||
| 845,155 | FNMA, Pool #AS7234, 3.000%, 5/1/46 | 845,585 | ||||||
| 1,489,877 | FNMA, Pool #AS8703, 2.500%, 2/1/32 | 1,488,815 | ||||||
| 626,399 | FNMA, Pool #AT2016, 3.000%, 4/1/43 | 629,785 | ||||||
| 230,878 | FNMA, Pool #AZ7347, 3.000%, 11/1/45 | 231,101 | ||||||
| 783,192 | FNMA, Pool #BC1158, 3.500%, 2/1/46 | 804,549 | ||||||
| 714,758 | GNMA, Pool #5175, 4.500%, 9/20/41 | 756,982 | ||||||
45
Touchstone Bond Fund (Continued)
| Principal | Market | |||||||
| Amount | Value | |||||||
| U.S. Government Mortgage-Backed Obligations — 21.4% (Continued) | ||||||||
| $ | 31,790 | GNMA, Pool #679437, | ||||||
| 6.000%, 11/15/22 | $ | 31,918 | ||||||
| Total U.S. Government Mortgage-Backed Obligations | $ | 10,023,520 | ||||||
| Agency Collateralized Mortgage Obligation — 3.3% | ||||||||
| 1,439,410 | FHLMC REMIC, Ser 3859 Class JB, | |||||||
| 5.000%, 5/15/41 | $ | 1,552,767 | ||||||
| Commercial Mortgage-Backed Security — 1.2% | ||||||||
| 550,000 | GS Mortgage Securities Trust, Ser 2017-FARM, Class B, 144a, | |||||||
| 3.541%, 1/10/43(A)(B) | $ | 543,769 | ||||||
| Asset-Backed Security — 1.1% | ||||||||
| 525,000 | Wendys Funding LLC, Ser 2018-1A, Class A2I, 144a, 3.573%, 3/15/48 | $ | 525,000 | |||||
| Non-Agency Collateralized Mortgage Obligation — 0.8% | ||||||||
| 358,930 | CSMC Trust, Ser 2015-WIN1, Class B3, 144a, 3.865%, 12/25/44(A)(B) | $ | 363,990 | |||||
| Bank Loan — 0.1% | ||||||||
| 65,859 | J Crew Group Inc., Consenting Amended Initial Loan, (LIBOR +3.220%), 4.848%, 3/5/21(A)(C) | $ | 39,318 | |||||
| U.S. Treasury Bill — 4.7% | ||||||||
| 2,210,000 | U.S. Treasury Bill, 1.238%, 2/15/18(D) | $ | 2,206,657 | |||||
| Shares | ||||||||
| Short-Term Investment Fund — 7.1% | ||||||||
| 3,326,721 | Dreyfus Government Cash Management, Institutional Shares, 1.19%∞Ω | $ | 3,326,721 | |||||
| Total Investment Securities —100.9% | ||||||||
| (Cost $47,161,228) | $ | 47,332,387 | ||||||
| Liabilities in Excess of Other Assets — (0.9%) | (410,521 | ) | ||||||
| Net Assets — 100.0% | $ | 46,921,866 | ||||||
| (A) | Variable rate security - Rate reflected is the rate in effect as of December 31, 2017. |
| (B) | Certain variable rate securities are not based on a published reference rate and spread but are determined by the issuer or agent and are based on current market conditions. These securities do not indicate a reference rate and spread in their description. |
| (C) | Bank loans pay interest at rates which adjust periodically unless otherwise indicated. The interest rates shown are the current interest rates as of December 31, 2017. |
| (D) | Rate reflects yield at the time of purchase. |
| ∞ | Open-End Fund. |
| Ω | Represents the 7-day SEC yield as of December 31, 2017. |
Portfolio Abbreviations:
FHLMC - Federal Home Loan Mortgage Corporation
FNMA - Federal National Mortgage Association
GNMA - Government National Mortgage Association
LLC - Limited Liability Company
LP - Limited Partnership
MTN - Medium Term Note
REMIC - Real Estate Mortgage Investment Conduit
144a - This is a restricted security that was sold in a transaction qualifying for the exemption under Rule 144A of the Securities Act of 1933. This security may be sold in transactions exempt from registration, normally to qualified institutional buyers. At December 31, 2017, these securities were valued at $2,237,165 or 4.8% of net assets. These securities were deemed liquid pursuant to procedures approved by the Board of Trustees.
46
Touchstone Bond Fund (Continued)
Other Information:
The inputs or methodology used for valuing securities may not be an indication of the risk associated with investing in those securities. For more information on valuation inputs, and their aggregation into the levels used in the table below, please refer to the security valuation section in the accompanying Notes to Financial Statements.
| Valuation inputs at Reporting Date: | ||||||||||||||||
| Description | Level 1 | Level 2 | Level 3 | Total | ||||||||||||
| Assets: | ||||||||||||||||
| U.S. Treasury Obligations | $ | — | $ | 15,165,250 | $ | — | $ | 15,165,250 | ||||||||
| Corporate Bonds | — | 13,585,395 | — | 13,585,395 | ||||||||||||
| U.S. Government Mortgage-Backed Obligations | — | 10,023,520 | — | 10,023,520 | ||||||||||||
| Agency Collateralized Mortgage Obligation | — | 1,552,767 | — | 1,552,767 | ||||||||||||
| Commercial Mortgage-Backed Security | — | 543,769 | — | 543,769 | ||||||||||||
| Asset-Backed Security | — | 525,000 | — | 525,000 | ||||||||||||
| Non-Agency Colloratized Mortgage Obgliation | — | 363,990 | — | 363,990 | ||||||||||||
| Bank Loan | — | 39,318 | — | 39,318 | ||||||||||||
| U.S. Treasury Bill | — | 2,206,657 | — | 2,206,657 | ||||||||||||
| Short-Term Investment Fund | 3,326,721 | — | — | 3,326,721 | ||||||||||||
| Total Assets | $ | 3,326,721 | $ | 44,005,666 | $ | — | $ | 47,332,387 | ||||||||
See accompanying Notes to Financial Statements.
47
Portfolio of Investments
Touchstone Common Stock Fund – December 31, 2017
| Market | ||||||||
| Shares | Value | |||||||
| Common Stocks — 96.9% | ||||||||
| Information Technology — 25.7% | ||||||||
| Alphabet, Inc. - Class C* | 6,631 | $ | 6,938,678 | |||||
| Apple, Inc. | 37,096 | 6,277,756 | ||||||
| Avnet, Inc. | 62,085 | 2,459,808 | ||||||
| Cisco Systems, Inc. | 70,627 | 2,705,014 | ||||||
| Facebook, Inc. - Class A* | 32,677 | 5,766,183 | ||||||
| International Business Machines Corp. | 16,156 | 2,478,654 | ||||||
| Microsoft Corp. | 71,954 | 6,154,945 | ||||||
| Oracle Corp. | 92,812 | 4,388,151 | ||||||
| salesforce.com, Inc.* | 35,307 | 3,609,435 | ||||||
| 40,778,624 | ||||||||
| Consumer Discretionary — 17.3% | ||||||||
| Amazon.com, Inc.* | 5,733 | 6,704,572 | ||||||
| Carnival Corp. (Panama) | 48,403 | 3,212,507 | ||||||
| Charter Communications, Inc. - Class A* | 8,604 | 2,890,600 | ||||||
| Comcast Corp. - Class A | 78,967 | 3,162,628 | ||||||
| Priceline Group, Inc. (The)* | 2,059 | 3,578,007 | ||||||
| Starbucks Corp. | 40,732 | 2,339,239 | ||||||
| Twenty-First Century Fox, Inc. - Class A | 97,619 | 3,370,784 | ||||||
| Yum China Holdings, Inc. | 55,026 | 2,202,141 | ||||||
| 27,460,478 | ||||||||
| Financials — 16.2% | ||||||||
| Bank of America Corp. | 122,226 | 3,608,112 | ||||||
| Berkshire Hathaway, Inc. - Class B* | 64,775 | 12,839,700 | ||||||
| Brookfield Asset Management, Inc. (Canada) - Class A | 80,042 | 3,485,029 | ||||||
| Goldman Sachs Group, Inc. (The) | 14,583 | 3,715,165 | ||||||
| Signature Bank/NewYork NY* | 14,754 | 2,025,134 | ||||||
| 25,673,140 | ||||||||
| Health Care — 11.3% | ||||||||
| Biogen, Inc.* | 12,886 | 4,105,093 | ||||||
| Bristol-Myers Squibb Co. | 72,233 | 4,426,438 | ||||||
| Johnson & Johnson | 29,058 | 4,059,984 | ||||||
| Novartis AG ADR | 62,361 | 5,235,830 | ||||||
| 17,827,345 | ||||||||
| Industrials — 9.0% | ||||||||
| General Electric Co. | 175,499 | 3,062,458 | ||||||
| Johnson Controls International PLC (Ireland) | 59,057 | 2,250,662 | ||||||
| Stericycle, Inc.* | 37,322 | 2,537,523 | ||||||
| Union Pacific Corp. | 21,745 | 2,916,004 | ||||||
| United Technologies Corp. | 26,744 | 3,411,732 | ||||||
| 14,178,379 | ||||||||
| Energy — 5.2% | ||||||||
| Exxon Mobil Corp. | 32,202 | 2,693,375 | ||||||
| Halliburton Co. | 53,683 | 2,623,488 | ||||||
| Schlumberger Ltd. (Curacao) | 42,874 | 2,889,279 | ||||||
| 8,206,142 | ||||||||
| Real Estate — 4.4% | ||||||||
| Jones Lang LaSalle, Inc. REIT | 20,315 | 3,025,513 | ||||||
| Simon Property Group, Inc. REIT | 22,774 | 3,911,207 | ||||||
| 6,936,720 | ||||||||
| Consumer Staples — 4.0% | ||||||||
| JM Smucker Co. (The) | 11,820 | 1,468,517 | ||||||
| Mondelez International, Inc. - Class A | 40,278 | 1,723,898 | ||||||
| Unilever NV (Netherlands) | 55,535 | 3,127,731 | ||||||
| 6,320,146 | ||||||||
| Telecommunication Services — 2.0% | ||||||||
| AT&T, Inc. | 83,338 | 3,240,181 | ||||||
| Materials — 1.8% | ||||||||
| Agrium, Inc. (Canada) | 24,588 | 2,827,620 | ||||||
| Total Common Stocks | $ | 153,448,775 | ||||||
| Short-Term Investment Fund — 3.2% | ||||||||
| Dreyfus Government Cash Management, Institutional Shares, 1.19%∞Ω | 5,085,860 | $ | 5,085,860 | |||||
| Total Investment Securities —100.1% | ||||||||
| (Cost $134,896,466) | $ | 158,534,635 | ||||||
| Liabilities in Excess of Other Assets — (0.1%) | (97,047 | ) | ||||||
| Net Assets — 100.0% | $ | 158,437,588 | ||||||
| * | Non-income producing security. |
| ∞ | Open-End Fund. |
| Ω | Represents the 7-day SEC yield as of December 31, 2017. |
Portfolio Abbreviations:
ADR - American Depositary Receipt
PLC - Public Limited Company
REIT - Real Estate Investment Trust
48
Touchstone Common Stock Fund (Continued)
Other Information:
The inputs or methodology used for valuing securities may not be an indication of the risk associated with investing in those securities. For more information on valuation inputs, and their aggregation into the levels used in the table below, please refer to the security valuation section in the accompanying Notes to Financial Statements.
Valuation inputs at Reporting Date:
| Description | Level 1 | Level 2 | Level 3 | Total | ||||||||||||
| Common Stocks | $ | 153,448,775 | $ | — | $ | — | $ | 153,448,775 | ||||||||
| Short-Term Investment Fund | 5,085,860 | — | — | 5,085,860 | ||||||||||||
| Total | $ | 158,534,635 | $ | — | $ | — | $ | 158,534,635 | ||||||||
See accompanying Notes to Financial Statements.
49
Portfolio of Investments
Touchstone Focused Fund – December 31, 2017
| Market | ||||||||
| Shares | Value | |||||||
| Common Stocks — 98.3% | ||||||||
| Information Technology — 25.8% | ||||||||
| Alphabet, Inc. - Class C* | 2,327 | $ | 2,434,973 | |||||
| Apple, Inc. | 14,128 | 2,390,881 | ||||||
| Avnet, Inc. | 26,863 | 1,064,312 | ||||||
| Cisco Systems, Inc. | 26,404 | 1,011,273 | ||||||
| Facebook, Inc. - Class A* | 11,375 | 2,007,233 | ||||||
| International Business Machines Corp. | 7,775 | 1,192,840 | ||||||
| Microsoft Corp. | 28,910 | 2,472,961 | ||||||
| Oracle Corp. | 42,393 | 2,004,341 | ||||||
| salesforce.com, Inc.* | 13,517 | 1,381,843 | ||||||
| 15,960,657 | ||||||||
| Financials — 16.5% | ||||||||
| Bank of America Corp. | 65,540 | 1,934,741 | ||||||
| Bank of the Ozarks | 13,457 | 651,992 | ||||||
| Berkshire Hathaway, Inc. - Class B* | 26,428 | 5,238,558 | ||||||
| Goldman Sachs Group, Inc. (The) | 6,639 | 1,691,352 | ||||||
| Signature Bank/NewYork NY* | 4,924 | 675,868 | ||||||
| 10,192,511 | ||||||||
| Consumer Discretionary — 16.1% | ||||||||
| Amazon.com, Inc.* | 2,418 | 2,827,778 | ||||||
| Carnival Corp. (Panama) | 20,161 | 1,338,086 | ||||||
| Comcast Corp. - Class A | 36,862 | 1,476,323 | ||||||
| Priceline Group, Inc. (The)* | 906 | 1,574,392 | ||||||
| Starbucks Corp. | 12,733 | 731,256 | ||||||
| Twenty-First Century Fox, Inc. - Class A | 41,056 | 1,417,664 | ||||||
| Yum China Holdings, Inc. | 15,110 | 604,702 | ||||||
| 9,970,201 | ||||||||
| Health Care — 14.3% | ||||||||
| Biogen, Inc.* | 4,793 | 1,526,906 | ||||||
| Bio-Rad Laboratories, Inc. - Class A* | 5,525 | 1,318,652 | ||||||
| Bristol-Myers Squibb Co. | 30,612 | 1,875,903 | ||||||
| Johnson & Johnson | 13,293 | 1,857,298 | ||||||
| Novartis AG ADR | 27,148 | 2,279,346 | ||||||
| 8,858,105 | ||||||||
| Industrials — 8.7% | ||||||||
| General Electric Co. | 76,925 | 1,342,341 | ||||||
| Johnson Controls International PLC (Ireland) | 22,838 | 870,356 | ||||||
| Stericycle, Inc.* | 13,842 | 941,118 | ||||||
| Union Pacific Corp. | 9,201 | 1,233,854 | ||||||
| United Technologies Corp. | 7,952 | 1,014,437 | ||||||
| 5,402,106 | ||||||||
| Energy — 5.1% | ||||||||
| Exxon Mobil Corp. | 11,768 | 984,276 | ||||||
| Halliburton Co. | 22,556 | 1,102,312 | ||||||
| Schlumberger Ltd. (Curacao) | 16,338 | 1,101,018 | ||||||
| 3,187,606 | ||||||||
| Real Estate — 4.4% | ||||||||
| Jones Lang LaSalle, Inc. REIT | 8,116 | 1,208,716 | ||||||
| Simon Property Group, Inc. REIT | 8,729 | 1,499,118 | ||||||
| 2,707,834 | ||||||||
| Consumer Staples — 3.5% | ||||||||
| JM Smucker Co. (The) | 4,623 | 574,362 | ||||||
| Mondelez International, Inc. - Class A | 14,839 | 635,109 | ||||||
| Unilever NV (Netherlands) | 17,530 | 987,290 | ||||||
| 2,196,761 | ||||||||
| Telecommunication Services — 2.2% | ||||||||
| AT&T, Inc. | 34,667 | 1,347,853 | ||||||
| Materials — 1.7% | ||||||||
| Agrium, Inc. (Canada)† | 9,341 | 1,074,215 | ||||||
| Total Common Stocks | $ | 60,897,849 | ||||||
| Short-Term Investment Funds — 3.6% | ||||||||
| Dreyfus Government Cash Management, Institutional Shares, 1.19%∞Ω | 1,120,915 | $ | 1,120,915 | |||||
| Invesco Government & Agency Portfolio, Institutional Class, 1.19%**∞Ω | 1,080,974 | 1,080,974 | ||||||
| Total Short-Term Investment Funds | $ | 2,201,889 | ||||||
| Total Investment Securities —101.9% | ||||||||
| (Cost $50,469,838) | $ | 63,099,738 | ||||||
| Liabilities in Excess of Other Assets — (1.9%) | (1,166,164 | ) | ||||||
| Net Assets — 100.0% | $ | 61,933,574 | ||||||
| * | Non-income producing security. |
| ** | Represents collateral for securities loaned. |
| † | All or a portion of the security is on loan. The total market value of the securities on loan as of December 31, 2017 was $1,063,405. |
| ∞ | Open-End Fund. |
| Ω | Represents the 7-day SEC yield as of December 31, 2017. |
Portfolio Abbreviations:
ADR - American Depositary Receipt
PLC - Public Limited Company
REIT - Real Estate Investment Trust
50
Touchstone Focused Fund (Continued)
Other Information:
The inputs or methodology used for valuing securities may not be an indication of the risk associated with investing in those securities. For more information on valuation inputs, and their aggregation into the levels used in the table below, please refer to the security valuation section in the accompanying Notes to Financial Statements.
Valuation inputs at Reporting Date:
| Description | Level 1 | Level 2 | Level 3 | Total | ||||||||||||
| Common Stocks | $ | 60,897,849 | $ | — | $ | — | $ | 60,897,849 | ||||||||
| Short-Term Investment Funds | 2,201,889 | — | — | 2,201,889 | ||||||||||||
| Total | $ | 63,099,738 | $ | — | $ | — | $ | 63,099,738 | ||||||||
See accompanying Notes to Financial Statements.
51
Portfolio of Investments
Touchstone Large Cap Core Equity Fund – December 31, 2017
| Market | ||||||||
| Shares | Value | |||||||
| Common Stocks — 98.4% | ||||||||
| Financials — 24.8% | ||||||||
| Alleghany Corp.* | 1,785 | $ | 1,064,021 | |||||
| Bank of America Corp. | 20,118 | 593,883 | ||||||
| Berkshire Hathaway, Inc. - Class B* | 12,385 | 2,454,955 | ||||||
| BlackRock, Inc. | 2,788 | 1,432,223 | ||||||
| Progressive Corp. (The) | 29,251 | 1,647,416 | ||||||
| Wells Fargo & Co. | 20,406 | 1,238,032 | ||||||
| 8,430,530 | ||||||||
| Consumer Discretionary — 21.1% | ||||||||
| CarMax, Inc.* | 19,576 | 1,255,409 | ||||||
| Carnival Corp. (Panama) | 23,713 | 1,573,832 | ||||||
| Dollar Tree, Inc.* | 16,202 | 1,738,637 | ||||||
| Lowe's Cos., Inc. | 9,095 | 845,289 | ||||||
| NIKE, Inc. - Class B | 15,725 | 983,599 | ||||||
| O'Reilly Automotive, Inc.* | 3,173 | 763,233 | ||||||
| 7,159,999 | ||||||||
| Industrials — 16.5% | ||||||||
| Deere & Co. | 8,811 | 1,379,010 | ||||||
| FedEx Corp. | 3,258 | 813,001 | ||||||
| General Dynamics Corp. | 6,768 | 1,376,950 | ||||||
| Norfolk Southern Corp. | 9,065 | 1,313,518 | ||||||
| Southwest Airlines Co. | 11,220 | 734,349 | ||||||
| 5,616,828 | ||||||||
| Information Technology — 15.7% | ||||||||
| Alphabet, Inc. - Class C* | 1,180 | 1,234,752 | ||||||
| Apple, Inc. | 10,305 | 1,743,915 | ||||||
| Cisco Systems, Inc. | 23,305 | 892,582 | ||||||
| Visa, Inc. - Class A | 12,710 | 1,449,194 | ||||||
| 5,320,443 | ||||||||
| Health Care — 8.2% | ||||||||
| Alexion Pharmaceuticals, Inc.* | 7,690 | 919,647 | ||||||
| Bristol-Myers Squibb Co. | 11,952 | 732,419 | ||||||
| Eli Lilly & Co. | 13,347 | 1,127,288 | ||||||
| 2,779,354 | ||||||||
| Consumer Staples — 5.4% | ||||||||
| Altria Group, Inc. | 17,016 | 1,215,113 | ||||||
| Coca-Cola Co. (The) | 13,480 | 618,462 | ||||||
| 1,833,575 | ||||||||
| Materials — 2.8% | ||||||||
| NewMarket Corp. | 2,413 | 958,902 | ||||||
| Energy — 2.3% | ||||||||
| Chevron Corp. | 6,311 | 790,074 | ||||||
| Telecommunication Services — 1.6% | ||||||||
| Verizon Communications, Inc. | 10,343 | 547,455 | ||||||
| Total Common Stocks | $ | 33,437,160 | ||||||
| Short-Term Investment Fund — 1.8% | ||||||||
| Dreyfus Government Cash Management, Institutional Shares, 1.19%∞Ω | 600,342 | $ | 600,342 | |||||
| Total Investment Securities —100.2% | ||||||||
| (Cost $27,034,586) | $ | 34,037,502 | ||||||
| Liabilities in Excess of Other Assets — (0.2%) | (72,024 | ) | ||||||
| Net Assets — 100.0% | $ | 33,965,478 | ||||||
| * | Non-income producing security. |
| ∞ | Open-End Fund. |
| Ω | Represents the 7-day SEC yield as of December 31, 2017. |
Other Information:
The inputs or methodology used for valuing securities may not be an indication of the risk associated with investing in those securities. For more information on valuation inputs, and their aggregation into the levels used in the table below, please refer to the security valuation section in the accompanying Notes to Financial Statements.
| Valuation Inputs at Reporting Date: | ||||||||||||||||
| Description | Level 1 | Level 2 | Level 3 | Total | ||||||||||||
| Common Stocks | $ | 33,437,160 | $ | — | $ | — | $ | 33,437,160 | ||||||||
| Short-Term Investment Fund | 600,342 | — | — | 600,342 | ||||||||||||
| Total | $ | 34,037,502 | $ | — | $ | — | $ | 34,037,502 | ||||||||
See accompanying Notes to Financial Statements.
52
Portfolio of Investments
Touchstone Small Company Fund – December 31, 2017
| Market | ||||||||
| Shares | Value | |||||||
| Common Stocks — 97.8% | ||||||||
| Information Technology — 29.6% | ||||||||
| 8x8, Inc.* | 60,200 | $ | 848,820 | |||||
| Acxiom Corp.* | 40,863 | 1,126,184 | ||||||
| Aspen Technology, Inc.* | 11,123 | 736,343 | ||||||
| Barracuda Networks, Inc.* | 36,938 | 1,015,795 | ||||||
| Blackhawk Network Holdings, Inc.* | 23,560 | 839,914 | ||||||
| Bottomline Technologies (de), Inc.* | 23,611 | 818,829 | ||||||
| BroadSoft, Inc.* | 15,900 | 872,910 | ||||||
| Carbonite, Inc.* | 38,190 | 958,569 | ||||||
| CommVault Systems, Inc.* | 15,841 | 831,653 | ||||||
| Finisar Corp.* | 44,992 | 915,587 | ||||||
| GrubHub, Inc.* | 9,785 | 702,563 | ||||||
| GTT Communications, Inc.* | 24,023 | 1,127,880 | ||||||
| j2 Global, Inc. | 11,468 | 860,444 | ||||||
| MAXIMUS, Inc. | 13,287 | 951,083 | ||||||
| Microsemi Corp.* | 11,609 | 599,605 | ||||||
| NetScout Systems, Inc.* | 28,483 | 867,307 | ||||||
| Nice Ltd. ADR | 10,768 | 989,687 | ||||||
| Nuance Communications, Inc.* | 42,881 | 701,104 | ||||||
| ON Semiconductor Corp.* | 36,541 | 765,169 | ||||||
| Open Text Corp. (Canada) | 20,214 | 721,033 | ||||||
| Plantronics, Inc. | 18,330 | 923,465 | ||||||
| Tower Semiconductor Ltd. (Israel)* | 24,749 | 843,446 | ||||||
| VeriFone Systems, Inc.* | 52,477 | 929,368 | ||||||
| Verint Systems, Inc.* | 20,300 | 849,555 | ||||||
| 20,796,313 | ||||||||
| Health Care — 20.6% | ||||||||
| Allscripts Healthcare Solutions, Inc.* | 58,600 | 852,630 | ||||||
| Analogic Corp. | 4,955 | 414,981 | ||||||
| AngioDynamics, Inc.* | 48,373 | 804,443 | ||||||
| Bio-Rad Laboratories, Inc. - Class A* | 3,496 | 834,390 | ||||||
| Bio-Techne Corp. | 9,335 | 1,209,349 | ||||||
| Capital Senior Living Corp.* | 52,683 | 710,694 | ||||||
| Diplomat Pharmacy, Inc.* | 38,418 | 771,049 | ||||||
| Globus Medical, Inc. - Class A* | 23,849 | 980,194 | ||||||
| Haemonetics Corp.* | 15,238 | 885,023 | ||||||
| Healthsouth Corp.* | 16,183 | 799,602 | ||||||
| Magellan Health, Inc.* | 9,572 | 924,177 | ||||||
| MEDNAX, Inc.* | 12,500 | 668,000 | ||||||
| Natus Medical, Inc.* | 14,700 | 561,540 | ||||||
| NuVasive, Inc.* | 14,853 | 868,752 | ||||||
| Omnicell, Inc.* | 15,349 | 744,427 | ||||||
| Orthofix International NV (Curacao)* | 16,762 | 916,881 | ||||||
| Owens & Minor, Inc. | 30,082 | 567,948 | ||||||
| Tivity Health, Inc.* | 25,750 | 941,162 | ||||||
| 14,455,242 | ||||||||
| Consumer Discretionary — 16.2% | ||||||||
| Aaron's, Inc. | 22,462 | 895,111 | ||||||
| Adtalem Global Education, Inc.* | 23,585 | 991,749 | ||||||
| Bloomin' Brands, Inc. | 43,076 | 919,242 | ||||||
| Callaway Golf Co. | 58,300 | 812,119 | ||||||
| KB Home | 28,724 | 917,732 | ||||||
| MDC Partners, Inc. - Class A (Canada)* | 66,536 | 648,726 | ||||||
| Meredith Corp. | 12,200 | 805,810 | ||||||
| Penn National Gaming, Inc.* | 29,543 | 925,582 | ||||||
| Planet Fitness, Inc. - Class A* | 26,601 | 921,193 | ||||||
| Regal Entertainment Group, Class A | 36,500 | 839,865 | ||||||
| Sleep Number Corp.* | 24,541 | 922,496 | ||||||
| Texas Roadhouse, Inc. | 16,334 | 860,475 | ||||||
| TRI Pointe Group, Inc.* | 51,542 | 923,633 | ||||||
| 11,383,733 | ||||||||
| Industrials — 13.9% | ||||||||
| Crane Co. | 9,182 | 819,218 | ||||||
| EnerSys | 8,300 | 577,929 | ||||||
| Esterline Technologies Corp.* | 11,868 | 886,540 | ||||||
| Genesee & Wyoming, Inc. - Class A* | 11,357 | 894,137 | ||||||
| Healthcare Services Group, Inc. | 15,967 | 841,780 | ||||||
| Hillenbrand, Inc. | 18,400 | 822,480 | ||||||
| Knight-Swift Transportation Holdings, Inc. | 18,352 | 802,349 | ||||||
| Mobile Mini, Inc. | 24,779 | 854,876 | ||||||
| Quanta Services, Inc.* | 19,833 | 775,669 | ||||||
| Regal Beloit Corp. | 11,307 | 866,116 | ||||||
| SkyWest, Inc. | 16,900 | 897,390 | ||||||
| Woodward, Inc. | 9,761 | 747,107 | ||||||
| 9,785,591 | ||||||||
| Financials — 10.5% | ||||||||
| Chemical Financial Corp. | 16,200 | 866,214 | ||||||
| Evercore, Inc. - Class A | 10,329 | 929,610 | ||||||
| Glacier Bancorp, Inc. | 33,792 | 1,331,067 | ||||||
| Heartland Financial USA, Inc. | 14,900 | 799,385 | ||||||
| Stifel Financial Corp. | 15,541 | 925,622 | ||||||
| Webster Financial Corp. | 15,373 | 863,348 | ||||||
| Western Alliance Bancorp* | 14,499 | 820,933 | ||||||
| WSFS Financial Corp. | 17,100 | 818,235 | ||||||
| 7,354,414 | ||||||||
| Energy — 2.5% | ||||||||
| Carrizo Oil & Gas, Inc.* | 44,932 | 956,153 | ||||||
| Gulfport Energy Corp.* | 65,275 | 832,909 | ||||||
| 1,789,062 | ||||||||
| Real Estate — 2.5% | ||||||||
| Corporate Office Properties Trust REIT | 30,665 | 895,418 | ||||||
| Outfront Media, Inc. REIT | 36,600 | 849,120 | ||||||
| 1,744,538 | ||||||||
| Telecommunication Services — 1.1% | ||||||||
| Cogent Communications Holdings, Inc. | 17,800 | 806,340 | ||||||
| Materials — 0.9% | ||||||||
| Innophos Holdings, Inc. | 14,100 | 658,893 | ||||||
| Total Common Stocks | $ | 68,774,126 | ||||||
53
Touchstone Small Company Fund (Continued)
| Market | ||||||||
| Shares | Value | |||||||
| Short-Term Investment Fund — 1.8% | ||||||||
| Dreyfus Government Cash Management, Institutional Shares, 1.19%∞Ω | 1,296,312 | $ | 1,296,312 | |||||
| Total Investment Securities —99.6% | ||||||||
| (Cost $54,109,061) | $ | 70,070,438 | ||||||
| Other Assets in Excess of Liabilities — 0.4% | 268,099 | |||||||
| Net Assets — 100.0% | $ | 70,338,537 | ||||||
| * | Non-income producing security. |
| ∞ | Open-End Fund. |
| Ω | Represents the 7-day SEC yield as of December 31, 2017. |
Portfolio Abbreviations:
ADR - American Depositary Receipt
REIT - Real Estate Investment Trust
Other Information:
The inputs or methodology used for valuing securities may not be an indication of the risk associated with investing in those securities. For more information on valuation inputs, and their aggregation into the levels used in the table below, please refer to the security valuation section in the accompanying Notes to Financial Statements.
Valuation inputs at Reporting Date:
| Description | Level 1 | Level 2 | Level 3 | Total | ||||||||||||
| Common Stocks | $ | 68,774,126 | $ | — | $ | — | $ | 68,774,126 | ||||||||
| Short-Term Investment Fund | 1,296,312 | — | — | 1,296,312 | ||||||||||||
| Total | $ | 70,070,438 | $ | — | $ | — | $ | 70,070,438 | ||||||||
See accompanying Notes to Financial Statements.
54
Portfolio of Investments
Touchstone Aggressive ETF Fund – December 31, 2017
| Market | ||||||||
| Shares | Value | |||||||
| Exchange-Traded Funds — 96.9% | ||||||||
| Equity Funds — 79.9% | ||||||||
| Vanguard Extended Market ETF† | 19,065 | $ | 2,130,132 | |||||
| Vanguard FTSE Developed Markets ETF | 106,905 | 4,795,758 | ||||||
| Vanguard FTSE Emerging Markets ETF | 29,590 | 1,358,477 | ||||||
| Vanguard S&P 500 ETF | 32,605 | 7,997,681 | ||||||
| 16,282,048 | ||||||||
| Fixed Income Funds — 17.0% | ||||||||
| iShares Core US Aggregate Bond ETF | 16,825 | 1,839,477 | ||||||
| iShares Floating Rate Bond ETF | 10,010 | 508,708 | ||||||
| iShares iBoxx $ High Yield Corporate Bond ETF | 4,660 | 406,632 | ||||||
| Vanguard Intermediate-Term Corporate Bond ETF | 8,110 | 708,733 | ||||||
| 3,463,550 | ||||||||
| Total Exchange-Traded Funds | $ | 19,745,598 | ||||||
| Short-Term Investment Funds — 3.7% | ||||||||
| Dreyfus Government Cash Management, Institutional Shares, 1.19%∞Ω | 706,528 | $ | 706,528 | |||||
| Invesco Government & Agency Portfolio, Institutional Class, 1.19%**∞Ω | 45,880 | 45,880 | ||||||
| Total Short-Term Investment Funds | $ | 752,408 | ||||||
| Total Investment Securities —100.6% | ||||||||
| (Cost $17,357,156) | $ | 20,498,006 | ||||||
| Liabilities in Excess of Other Assets — (0.6%) | (114,161 | ) | ||||||
| Net Assets — 100.0% | $ | 20,383,845 | ||||||
| ** | Represents collateral for securities loaned. |
| † | All or a portion of the security is on loan. The total market value of the securities on loan as of December 31, 2017 was $44,692. |
| ∞ | Open-End Fund. |
| Ω | Represents the 7-day SEC yield as of December 31, 2017. |
Portfolio Abbreviations:
ETF - Exchange-Traded Fund
REIT - Real Estate Investment Trust
Other Information:
The inputs or methodology used for valuing securities may not be an indication of the risk associated with investing in those securities. For more information on valuation inputs, and their aggregation into the levels used in the table below, please refer to the security valuation section in the accompanying Notes to Financial Statements.
Valuation inputs at Reporting Date:
| Description | Level 1 | Level 2 | Level 3 | Total | ||||||||||||
| Exchange-Traded Funds | $ | 19,745,598 | $ | — | $ | — | $ | 19,745,598 | ||||||||
| Short-Term Investment Funds | 752,408 | — | — | 752,408 | ||||||||||||
| Total | $ | 20,498,006 | $ | — | $ | — | $ | 20,498,006 | ||||||||
See accompanying Notes to Financial Statements.
55
Portfolio of Investments
Touchstone Conservative ETF Fund – December 31, 2017
| Market | ||||||||
| Shares | Value | |||||||
| Exchange-Traded Funds — 97.0% | ||||||||
| Fixed Income Funds — 57.1% | ||||||||
| iShares Core US Aggregate Bond ETF | 47,840 | $ | 5,230,347 | |||||
| iShares Floating Rate Bond ETF | 16,525 | 839,801 | ||||||
| iShares iBoxx $ High Yield Corporate Bond ETF | 8,655 | 755,235 | ||||||
| PowerShares Senior Loan Portfolio ETF | 18,340 | 422,554 | ||||||
| Vanguard Intermediate-Term Corporate Bond ETF | 23,115 | 2,020,020 | ||||||
| Vanguard Total International Bond ETF | 6,110 | 332,201 | ||||||
| 9,600,158 | ||||||||
| Equity Funds — 39.9% | ||||||||
| Vanguard Extended Market ETF | 8,240 | 920,655 | ||||||
| Vanguard FTSE Developed Markets ETF | 39,420 | 1,768,381 | ||||||
| Vanguard FTSE Emerging Markets ETF | 11,290 | 518,324 | ||||||
| Vanguard S&P 500 ETF | 14,305 | 3,508,873 | ||||||
| 6,716,233 | ||||||||
| Total Exchange-Traded Funds | $ | 16,316,391 | ||||||
| Short-Term Investment Fund — 3.3% | ||||||||
| Dreyfus Government Cash Management, Institutional Shares, 1.19%∞Ω | 559,919 | $ | 559,919 | |||||
| Total Investment Securities —100.3% | ||||||||
| (Cost $15,291,163) | $ | 16,876,310 | ||||||
| Liabilities in Excess of Other Assets — (0.3%) | (45,306 | ) | ||||||
| Net Assets — 100.0% | $ | 16,831,004 | ||||||
| ∞ | Open-End Fund. |
| Ω | Represents the 7-day SEC yield as of December 31, 2017. |
Portfolio Abbreviations:
ETF - Exchange-Traded Fund
Other Information:
The inputs or methodology used for valuing securities may not be an indication of the risk associated with investing in those securities. For more information on valuation inputs, and their aggregation into the levels used in the table below, please refer to the security valuation section in the accompanying Notes to Financial Statements.
Valuation inputs at Reporting Date:
| Description | Level 1 | Level 2 | Level 3 | Total | ||||||||||||
| Exchange-Traded Funds | $ | 16,316,391 | $ | — | $ | — | $ | 16,316,391 | ||||||||
| Short-Term Investment Fund | 559,919 | — | — | 559,919 | ||||||||||||
| Total | $ | 16,876,310 | $ | — | $ | — | $ | 16,876,310 | ||||||||
See accompanying Notes to Financial Statements.
56
Portfolio of Investments
Touchstone Moderate ETF Fund – December 31, 2017
| Market | ||||||||
| Shares | Value | |||||||
| Exchange-Traded Funds — 96.9% | ||||||||
| Equity Funds — 61.9% | ||||||||
| PowerShares Senior Loan Portfolio ETF | 20,230 | $ | 466,099 | |||||
| Vanguard Extended Market ETF | 16,700 | 1,865,891 | ||||||
| Vanguard FTSE Developed Markets ETF | 86,375 | 3,874,783 | ||||||
| Vanguard FTSE Emerging Markets ETF | 26,210 | 1,203,301 | ||||||
| Vanguard S&P 500 ETF | 28,965 | 7,104,825 | ||||||
| 14,514,899 | ||||||||
| Fixed Income Funds — 35.0% | ||||||||
| iShares Core US Aggregate Bond ETF | 40,885 | 4,469,957 | ||||||
| iShares Floating Rate Bond ETF | 18,490 | 939,662 | ||||||
| iShares iBoxx $ High Yield Corporate Bond ETF | 8,085 | 705,497 | ||||||
| Vanguard Intermediate-Term Corporate Bond ETF | 21,505 | 1,879,322 | ||||||
| Vanguard Total International Bond ETF | 4,190 | 227,810 | ||||||
| 8,222,248 | ||||||||
| Total Exchange-Traded Funds | $ | 22,737,147 | ||||||
| Short-Term Investment Fund — 3.4% | ||||||||
| Dreyfus Government Cash Management, Institutional Shares, 1.19%∞Ω | 794,285 | $ | 794,285 | |||||
| Total Investment Securities —100.3% | ||||||||
| (Cost $20,811,404) | $ | 23,531,432 | ||||||
| Liabilities in Excess of Other Assets — (0.3%) | (77,656 | ) | ||||||
| Net Assets — 100.0% | $ | 23,453,776 | ||||||
| ∞ | Open-End Fund. |
| Ω | Represents the 7-day SEC yield as of December 31, 2017. |
Portfolio Abbreviations:
ETF - Exchange-Traded Fund
REIT - Real Estate Investment Trust
Other Information:
The inputs or methodology used for valuing securities may not be an indication of the risk associated with investing in those securities. For more information on valuation inputs, and their aggregation into the levels used in the table below, please refer to the security valuation section in the accompanying Notes to Financial Statements.
Valuation inputs at Reporting Date:
| Description | Level 1 | Level 2 | Level 3 | Total | ||||||||||||
| Exchange-Traded Funds | $ | 22,737,147 | $ | — | $ | — | $ | 22,737,147 | ||||||||
| Short-Term Investment Fund | 794,285 | — | — | 794,285 | ||||||||||||
| Total | $ | 23,531,432 | $ | — | $ | — | $ | 23,531,432 | ||||||||
See accompanying Notes to Financial Statements.
57
Statements of Assets and Liabilities
December 31, 2017
| Touchstone | Touchstone | Touchstone | ||||||||||
| Active Bond | Balanced | Bond | ||||||||||
| Fund | Fund | Fund | ||||||||||
| Assets | ||||||||||||
| Investments, at cost | $ | 57,176,078 | $ | 15,940,249 | $ | 47,161,228 | ||||||
| Investments, at market value (A) | $ | 57,498,574 | $ | 17,712,030 | $ | 47,332,387 | ||||||
| Cash | 8 | — | 789 | |||||||||
| Cash deposits held at prime broker* | 49,625 | — | — | |||||||||
| Dividends and interest receivable | 362,753 | 38,001 | 211,279 | |||||||||
| Receivable for capital shares sold | 649 | 249,440 | 1,817 | |||||||||
| Receivable for investments sold | — | 382,158 | 2,193,689 | |||||||||
| Securities lending income receivable | 15 | — | — | |||||||||
| Receivable from Investment Advisor | — | 790 | — | |||||||||
| Receivable from other affiliates | — | — | 94 | |||||||||
| Tax reclaim receivable | — | — | — | |||||||||
| Other assets | 860 | 92 | 252 | |||||||||
| Total Assets | 57,912,484 | 18,382,511 | 49,740,307 | |||||||||
| Liabilities | ||||||||||||
| Bank overdrafts | — | — | — | |||||||||
| Payable for return of collateral for securities on loan | 38,202 | — | — | |||||||||
| Payable for capital shares redeemed | 203 | 552 | 28,224 | |||||||||
| Payable for variation margin for futures contracts | 1,539 | — | — | |||||||||
| Payable for investments purchased | 400,000 | 384,419 | 2,731,665 | |||||||||
| Payable to Investment Advisor | 19,211 | — | 14,082 | |||||||||
| Payable to other affiliates | 20,793 | 221 | — | |||||||||
| Payable to Trustees | 7,470 | 3,561 | 3,561 | |||||||||
| Payable for professional services | 20,755 | 22,532 | 22,771 | |||||||||
| Payable for reports to shareholders | 3,085 | 3,508 | 11,933 | |||||||||
| Other accrued expenses and liabilities | 32,698 | 4,081 | 6,205 | |||||||||
| Total Liabilities | 543,956 | 418,874 | 2,818,441 | |||||||||
| Net Assets | $ | 57,368,528 | $ | 17,963,637 | $ | 46,921,866 | ||||||
| Net assets consist of: | ||||||||||||
| Paid-in capital | $ | 56,913,755 | $ | 11,276,139 | $ | 48,435,509 | ||||||
| Accumulated net investment income | 1,214,793 | 192,936 | 1,019,953 | |||||||||
| Accumulated net realized gains (losses) on investments, foreign currency transactions and futures contracts | (1,075,439 | ) | 4,722,781 | (2,704,758 | ) | |||||||
| Net unrealized appreciation on investments, foreign currency transactions and futures contracts | 315,419 | 1,771,781 | 171,162 | |||||||||
| Net assets applicable to shares outstanding | $ | 57,368,528 | $ | 17,963,637 | $ | 46,921,866 | ||||||
| Shares of beneficial interest outstanding (unlimited number of shares authorized, no par value) | 5,413,664 | 1,209,566 | 4,886,708 | |||||||||
| Net asset value, offering price and redemption price per share | $ | 10.60 | $ | 14.85 | $ | 9.60 | ||||||
| (A) Includes market value of securities on loan of: | $ | 37,195 | $ | — | $ | — | ||||||
| * Represents segregated cash for futures contracts. | ||||||||||||
See accompanying Notes to Financial Statements.
58
Statements of Assets and Liabilities (Continued)
| Touchstone | Touchstone | |||||||||||||||||||||||||
| Touchstone | Touchstone | Large Cap | Touchstone | Touchstone | Conservative | Touchstone | ||||||||||||||||||||
| Common Stock | Focused | Core Equity | Small Company | Aggressive ETF | ETF | Moderate ETF | ||||||||||||||||||||
| Fund | Fund | Fund | Fund | Fund | Fund | Fund | ||||||||||||||||||||
| $ | 134,896,466 | $ | 50,469,838 | $ | 27,034,586 | $ | 54,109,061 | $ | 17,357,156 | $ | 15,291,163 | $ | 20,811,404 | |||||||||||||
| $ | 158,534,635 | $ | 63,099,738 | $ | 34,037,502 | $ | 70,070,438 | $ | 20,498,006 | $ | 16,876,310 | $ | 23,531,432 | |||||||||||||
| — | — | — | — | — | — | — | ||||||||||||||||||||
| — | — | — | — | — | — | — | ||||||||||||||||||||
| 85,000 | 33,550 | 26,995 | 17,444 | — | — | — | ||||||||||||||||||||
| — | 249 | — | 10,000 | — | — | — | ||||||||||||||||||||
| — | 18,146 | — | 344,878 | — | — | — | ||||||||||||||||||||
| — | 90 | — | 222 | 484 | 174 | 350 | ||||||||||||||||||||
| — | — | — | — | — | — | — | ||||||||||||||||||||
| — | — | — | — | — | — | — | ||||||||||||||||||||
| — | 7,538 | — | — | — | — | — | ||||||||||||||||||||
| 837 | 933 | 482 | 368 | 304 | 278 | 367 | ||||||||||||||||||||
| 158,620,472 | 63,160,244 | 34,064,979 | 70,443,350 | 20,498,794 | 16,876,762 | 23,532,149 | ||||||||||||||||||||
| 1,120 | — | — | — | — | — | — | ||||||||||||||||||||
| — | 1,080,974 | — | — | 45,880 | — | — | ||||||||||||||||||||
| 50,859 | 1,965 | 23,715 | 24,675 | 19,325 | 851 | 25,038 | ||||||||||||||||||||
| — | — | — | — | — | — | — | ||||||||||||||||||||
| — | — | — | — | — | — | — | ||||||||||||||||||||
| 67,459 | 36,921 | 18,681 | 29,943 | 4,320 | 3,553 | 4,923 | ||||||||||||||||||||
| 19,785 | 70,504 | 25,149 | 8,367 | 14,020 | 9,973 | 16,886 | ||||||||||||||||||||
| 3,561 | 7,470 | 7,470 | 3,561 | 7,470 | 7,470 | 7,470 | ||||||||||||||||||||
| 22,927 | 20,418 | 18,949 | 21,915 | 19,097 | 19,040 | 19,150 | ||||||||||||||||||||
| 14,733 | 3,222 | 3,222 | 14,033 | 3,085 | 3,085 | 3,085 | ||||||||||||||||||||
| 2,440 | 5,196 | 2,315 | 2,319 | 1,752 | 1,786 | 1,821 | ||||||||||||||||||||
| 182,884 | 1,226,670 | 99,501 | 104,813 | 114,949 | 45,758 | 78,373 | ||||||||||||||||||||
| $ | 158,437,588 | $ | 61,933,574 | $ | 33,965,478 | $ | 70,338,537 | $ | 20,383,845 | $ | 16,831,004 | $ | 23,453,776 | |||||||||||||
| $ | 56,549,378 | $ | 47,935,699 | $ | 25,891,691 | $ | 46,963,198 | $ | 16,386,956 | $ | 14,638,598 | $ | 19,704,477 | |||||||||||||
| 1,862,903 | 272,619 | 168,677 | — | 329,417 | 327,449 | 407,302 | ||||||||||||||||||||
| 76,387,138 | 1,095,510 | 902,194 | 7,413,962 | 526,622 | 279,810 | 621,969 | ||||||||||||||||||||
| 23,638,169 | 12,629,746 | 7,002,916 | 15,961,377 | 3,140,850 | 1,585,147 | 2,720,028 | ||||||||||||||||||||
| $ | 158,437,588 | $ | 61,933,574 | $ | 33,965,478 | $ | 70,338,537 | $ | 20,383,845 | $ | 16,831,004 | $ | 23,453,776 | |||||||||||||
| 8,452,431 | 3,280,989 | 2,083,508 | 4,471,807 | 1,211,014 | 1,433,431 | 1,912,430 | ||||||||||||||||||||
| $ | 18.74 | $ | 18.88 | $ | 16.30 | $ | 15.73 | $ | 16.83 | $ | 11.74 | $ | 12.26 | |||||||||||||
| $ | — | $ | 1,063,405 | $ | — | $ | — | $ | 44,692 | $ | — | $ | — | |||||||||||||
59
For the Year Ended December 31, 2017
| Touchstone | Touchstone | Touchstone | ||||||||||
| Active Bond | Balanced | Bond | ||||||||||
| Fund | Fund(B) | Fund(B) | ||||||||||
| Investment Income | ||||||||||||
| Dividends (A) | $ | 37,227 | $ | 214,853 | $ | 58,234 | ||||||
| Interest | 1,635,127 | 98,061 | 1,145,519 | |||||||||
| Income from securities loaned | 1,969 | — | — | |||||||||
| Total Investment Income | 1,674,323 | 312,914 | 1,203,753 | |||||||||
| Expenses | ||||||||||||
| Investment advisory fees | 228,007 | 92,873 | 192,331 | |||||||||
| Administration fees | 82,653 | 18,306 | 51,846 | |||||||||
| Trustee and Compliance fees and expenses | 17,179 | 7,025 | 13,341 | |||||||||
| Custody fees | 40,780 | 6,127 | 12,440 | |||||||||
| Professional fees | 24,682 | 24,014 | 22,712 | |||||||||
| Transfer Agent fees | 157 | 5,141 | 6,206 | |||||||||
| Pricing expense | 55,769 | 2,000 | 4,000 | |||||||||
| Reports to Shareholders | 6,399 | 4,168 | 24,197 | |||||||||
| Shareholder servicing fees | 42,904 | — | — | |||||||||
| Other expenses | 6,683 | 4,925 | 12,898 | |||||||||
| Total Expenses | 505,213 | 164,579 | 339,971 | |||||||||
| Fees waived and/or reimbursed by the Advisor and/or Affiliates(C) | — | (21,573 | ) | (13,965 | ) | |||||||
| Fees recouped by the Advisor(C) | — | — | — | |||||||||
| Net Expenses | 505,213 | 143,006 | 326,006 | |||||||||
| Net Investment Income (Loss) | 1,169,110 | 169,908 | 877,747 | |||||||||
| Realized and Unrealized Gains (Losses) on Investments | ||||||||||||
| Net realized gains on investments | 892,577 | 4,772,347 | 57,822 | |||||||||
| Net realized gain (loss) on foreign currency transactions | — | 16 | — | |||||||||
| Net realized losses on futures contracts | (67,967 | ) | — | — | ||||||||
| Net change in unrealized appreciation (depreciation) on investments | (37,098 | ) | (2,726,272 | ) | 822,808 | |||||||
| Net change in unrealized appreciation (depreciation) on foreign currency transactions | 93 | 1 | — | |||||||||
| Net change in unrealized appreciation (depreciation) on futures contracts | 8,141 | — | — | |||||||||
| Net Realized and Unrealized Gains on Investments | 795,746 | 2,046,092 | 880,630 | |||||||||
| Change in Net Assets Resulting from Operations | $ | 1,964,856 | $ | 2,216,000 | $ | 1,758,377 | ||||||
| (A) Net of foreign tax withholding of: | $ | — | $ | — | $ | — | ||||||
| (B) See Note 9 in Notes to Financial Statements. | ||||||||||||
| (C) See Note 4 in Notes to Financial Statements. | ||||||||||||
See accompanying Notes to Financial Statements.
60
Statements of Operations (Continued)
| Touchstone | Touchstone | |||||||||||||||||||||||||
| Touchstone | Touchstone | Large Cap | Touchstone | Touchstone | Conservative | Touchstone | ||||||||||||||||||||
| Common Stock | Focused | Core Equity | Small Company | Aggressive ETF | ETF | Moderate ETF | ||||||||||||||||||||
| Fund(B) | Fund | Fund | Fund(B) | Fund | Fund | Fund | ||||||||||||||||||||
| $ | 2,957,785 | $ | 992,636 | $ | 513,751 | $ | 471,858 | $ | 472,975 | $ | 455,531 | $ | 577,011 | |||||||||||||
| 5,629 | — | — | 4,221 | — | — | — | ||||||||||||||||||||
| — | 662 | 147 | 612 | 6,891 | 6,538 | 8,374 | ||||||||||||||||||||
| 2,963,414 | 993,298 | 513,898 | 476,691 | 479,866 | 462,069 | 585,385 | ||||||||||||||||||||
| 773,947 | 432,357 | 211,681 | 339,061 | 50,140 | 44,865 | 59,355 | ||||||||||||||||||||
| 167,419 | 89,560 | 47,221 | 73,372 | 29,081 | 26,022 | 34,426 | ||||||||||||||||||||
| 33,216 | 17,179 | 17,179 | 16,408 | 17,179 | 17,179 | 17,179 | ||||||||||||||||||||
| 10,732 | 8,163 | 5,462 | 17,886 | 3,057 | 3,339 | 4,342 | ||||||||||||||||||||
| 32,188 | 22,942 | 20,104 | 24,600 | 19,787 | 19,627 | 19,990 | ||||||||||||||||||||
| 7,507 | 6,641 | 117 | 6,074 | 88 | 88 | 117 | ||||||||||||||||||||
| 80 | 1,777 | 1,317 | 70 | 449 | 516 | 546 | ||||||||||||||||||||
| 27,382 | 6,399 | 6,399 | 21,604 | 6,398 | 6,398 | 6,399 | ||||||||||||||||||||
| — | 133,365 | 62,267 | — | 50,140 | 44,865 | 54,905 | ||||||||||||||||||||
| 39,666 | 4,349 | 3,478 | 19,357 | 3,188 | 3,176 | 3,334 | ||||||||||||||||||||
| 1,092,137 | 722,732 | 375,225 | 518,432 | 179,507 | 166,075 | 200,593 | ||||||||||||||||||||
| — | — | (30,024 | ) | (538 | ) | (29,081 | ) | (31,483 | ) | (22,530 | ) | |||||||||||||||
| — | 24,625 | — | — | — | — | — | ||||||||||||||||||||
| 1,092,137 | 747,357 | 345,201 | 517,894 | 150,426 | 134,592 | 178,063 | ||||||||||||||||||||
| 1,871,277 | 245,941 | 168,697 | (41,203 | ) | 329,440 | 327,477 | 407,322 | |||||||||||||||||||
| 76,594,834 | 1,522,612 | 913,480 | 7,655,355 | 522,299 | 280,856 | 618,545 | ||||||||||||||||||||
| 168 | (976 | ) | — | — | — | — | — | |||||||||||||||||||
| — | — | — | — | — | — | — | ||||||||||||||||||||
| (48,297,867 | ) | 6,092,036 | 5,278,278 | 4,293,327 | 2,351,512 | 1,112,874 | 2,034,617 | |||||||||||||||||||
| — | 1,431 | — | — | — | — | — | ||||||||||||||||||||
| — | — | — | — | — | — | — | ||||||||||||||||||||
| 28,297,135 | 7,615,103 | 6,191,758 | 11,948,682 | 2,873,811 | 1,393,730 | 2,653,162 | ||||||||||||||||||||
| $ | 30,168,412 | $ | 7,861,044 | $ | 6,360,455 | $ | 11,907,479 | $ | 3,203,251 | $ | 1,721,207 | $ | 3,060,484 | |||||||||||||
| $ | 35,255 | $ | 21,366 | $ | — | $ | 2,716 | $ | — | $ | — | $ | — | |||||||||||||
61
Statements of Changes in Net Assets
| Touchstone | Touchstone | |||||||||||||||
| Active Bond | Balanced | |||||||||||||||
| Fund | Fund(A) | |||||||||||||||
| For the | For the | For the | For the | |||||||||||||
| Year | Year | Year | Year | |||||||||||||
| Ended | Ended | Ended | Ended | |||||||||||||
| December 31, | December 31, | December 31, | December 31, | |||||||||||||
| 2017 | 2016 | 2017 | 2016 | |||||||||||||
| From Operations | ||||||||||||||||
| Net investment income | $ | 1,169,110 | $ | 1,342,367 | $ | 169,908 | $ | 179,058 | ||||||||
| Net realized gains (losses) on investments, foreign currency transactions, futures contracts and swap agreements | 824,610 | (434,766 | ) | 4,772,363 | 318,395 | |||||||||||
| Net change in unrealized appreciation (depreciation) on investments, foreign currency transactions, futures contracts and swap agreements | (28,864 | ) | 2,166,091 | (2,726,271 | ) | 607,890 | ||||||||||
| Change in Net Assets from Operations | 1,964,856 | 3,073,692 | 2,216,000 | 1,105,343 | ||||||||||||
| Distributions to Shareholders from: | ||||||||||||||||
| Net investment income | (1,484,379 | ) | (1,153,828 | ) | — | (213,660 | ) | |||||||||
| Net realized gains | — | — | — | (236,237 | ) | |||||||||||
| Return of capital | — | — | — | (23,950 | ) | |||||||||||
| Total Distributions | (1,484,379 | ) | (1,153,828 | ) | — | (473,847 | ) | |||||||||
| Share Transactions | ||||||||||||||||
| Proceeds from Shares issued | 4,755,717 | 3,210,747 | 2,585,460 | 3,170,228 | ||||||||||||
| Reinvestment of distributions | 1,484,379 | 1,153,828 | — | 473,847 | ||||||||||||
| Cost of Shares redeemed | (4,363,557 | ) | (3,299,421 | ) | (2,825,940 | ) | (3,588,832 | ) | ||||||||
| Change in Net Assets from Share Transactions | 1,876,539 | 1,065,154 | (240,480 | ) | 55,243 | |||||||||||
| Total Increase (Decrease) in Net Assets | 2,357,016 | 2,985,018 | 1,975,520 | 686,739 | ||||||||||||
| Net Assets | ||||||||||||||||
| Beginning of period | 55,011,512 | 52,026,494 | 15,988,117 | 15,301,378 | ||||||||||||
| End of period | $ | 57,368,528 | $ | 55,011,512 | $ | 17,963,637 | $ | 15,988,117 | ||||||||
| Accumulated Net Investment Income (Loss) | $ | 1,214,793 | $ | 1,484,261 | $ | 192,936 | $ | (14 | ) | |||||||
| Share Transactions | ||||||||||||||||
| Shares issued | 442,714 | 302,790 | 185,445 | 247,026 | ||||||||||||
| Shares reinvested | 140,168 | 110,203 | — | 36,303 | ||||||||||||
| Shares redeemed | (403,875 | ) | (312,292 | ) | (203,604 | ) | (281,134 | ) | ||||||||
| Change in Shares Outstanding | 179,007 | 100,701 | (18,159 | ) | 2,195 | |||||||||||
(A) See Note 9 in Notes to Financial Statements.
See accompanying Notes to Financial Statements.
62
Statements of Changes in Net Assets (Continued)
| Touchstone | Touchstone | Touchstone | ||||||||||||||||||||
| Bond | Common Stock | Focused | ||||||||||||||||||||
| Fund(A) | Fund(A) | Fund | ||||||||||||||||||||
| For the | For the | For the | For the | For the | For the | |||||||||||||||||
| Year | Year | Year | Year | Year | Year | |||||||||||||||||
| Ended | Ended | Ended | Ended | Ended | Ended | |||||||||||||||||
| December 31, | December 31, | December 31, | December 31, | December 31, | December 31, | |||||||||||||||||
| 2017 | 2016 | 2017 | 2016 | 2017 | 2016 | |||||||||||||||||
| $ | 877,747 | $ | 777,273 | $ | 1,871,277 | $ | 2,398,382 | $ | 245,941 | $ | 330,833 | |||||||||||
| 57,822 | (576,496 | ) | 76,595,002 | 13,797,312 | 1,521,636 | (278,460 | ) | |||||||||||||||
| 822,808 | 306,711 | (48,297,867 | ) | (235,520 | ) | 6,093,467 | 6,731,760 | |||||||||||||||
| 1,758,377 | 507,488 | 30,168,412 | 15,960,174 | 7,861,044 | 6,784,133 | |||||||||||||||||
| — | (1,007,643 | ) | (17,544 | ) | (2,392,966 | ) | (319,068 | ) | — | |||||||||||||
| — | — | (944,237 | ) | (12,343,398 | ) | — | (11,245,439 | ) | ||||||||||||||
| — | (2,706 | ) | — | — | — | — | ||||||||||||||||
| — | (1,010,349 | ) | (961,781 | ) | (14,736,364 | ) | (319,068 | ) | (11,245,439 | ) | ||||||||||||
| 3,169,052 | 3,295,625 | 3,579,984 | 2,882,403 | 1,615,348 | 4,362,079 | |||||||||||||||||
| — | 1,010,349 | 961,781 | 14,736,364 | 319,068 | 11,245,439 | |||||||||||||||||
| (6,685,628 | ) | (12,434,790 | ) | (24,548,603 | ) | (30,753,097 | ) | (9,770,104 | ) | (17,235,475 | ) | |||||||||||
| (3,516,576 | ) | (8,128,816 | ) | (20,006,838 | ) | (13,134,330 | ) | (7,835,688 | ) | (1,627,957 | ) | |||||||||||
| (1,758,199 | ) | (8,631,677 | ) | 9,199,793 | (11,910,520 | ) | (293,712 | ) | (6,089,263 | ) | ||||||||||||
| 48,680,065 | 57,311,742 | 149,237,795 | 161,148,315 | 62,227,286 | 68,316,549 | |||||||||||||||||
| $ | 46,921,866 | $ | 48,680,065 | $ | 158,437,588 | $ | 149,237,795 | $ | 61,933,574 | $ | 62,227,286 | |||||||||||
| $ | 1,019,953 | $ | — | $ | 1,862,903 | $ | (3,938 | ) | $ | 272,619 | $ | 346,722 | ||||||||||
| 335,983 | 345,079 | 210,424 | 180,978 | 89,251 | 230,306 | |||||||||||||||||
| — | 109,180 | 54,678 | 943,110 | 16,837 | 665,017 | |||||||||||||||||
| (707,170 | ) | (1,303,644 | ) | (1,431,198 | ) | (1,931,238 | ) | (550,208 | ) | (975,906 | ) | |||||||||||
| (371,187 | ) | (849,385 | ) | (1,166,096 | ) | (807,150 | ) | (444,120 | ) | (80,583 | ) | |||||||||||
63
Statements of Changes in Net Assets (Continued)
| Touchstone | Touchstone | |||||||||||||||
| Large Cap Core | Small Company | |||||||||||||||
| Equity Fund | Fund(A) | |||||||||||||||
| For the | For the | For the | For the | |||||||||||||
| Year | Year | Year | Year | |||||||||||||
| Ended | Ended | Ended | Ended | |||||||||||||
| December 31, | December 31, | December 31, | December 31, | |||||||||||||
| 2017 | 2016 | 2017 | 2016 | |||||||||||||
| From Operations | ||||||||||||||||
| Net investment income (loss) | $ | 168,697 | $ | 215,223 | $ | (41,203 | ) | $ | 45,102 | |||||||
| Net realized gain on investments | 913,480 | 495,149 | 7,655,355 | 5,874,436 | ||||||||||||
| Net change in unrealized appreciation (depreciation) on investments | 5,278,278 | 1,664,171 | 4,293,327 | 5,355,945 | ||||||||||||
| Change in Net Assets from Operations | 6,360,455 | 2,374,543 | 11,907,479 | 11,275,483 | ||||||||||||
| Distributions to Shareholders from: | ||||||||||||||||
| Net investment income | (215,126 | ) | (266,434 | ) | (40,595 | ) | (41,873 | ) | ||||||||
| Net realized gains | (490,437 | ) | (3,215,261 | ) | (1,801,035 | ) | (4,661,271 | ) | ||||||||
| Total Distributions | (705,563 | ) | (3,481,695 | ) | (1,841,630 | ) | (4,703,144 | ) | ||||||||
| Share Transactions | ||||||||||||||||
| Proceeds from Shares issued | 1,723,328 | 10,605,468 | 2,951,421 | 2,341,669 | ||||||||||||
| Proceeds from Shares issued in connection with reorganization(B) | — | — | — | 15,219,310 | ||||||||||||
| Reinvestment of distributions | 705,563 | 3,481,695 | 1,841,630 | 4,703,144 | ||||||||||||
| Cost of Shares redeemed | (6,609,878 | ) | (10,382,297 | ) | (11,622,746 | ) | (10,671,725 | ) | ||||||||
| Change in Net Assets from Share Transactions | (4,180,987 | ) | 3,704,866 | (6,829,695 | ) | 11,592,398 | ||||||||||
| Total Increase (Decrease) in Net Assets | 1,473,905 | 2,597,714 | 3,236,154 | 18,164,737 | ||||||||||||
| Net Assets | ||||||||||||||||
| Beginning of period | 32,491,573 | 29,893,859 | 67,102,383 | 48,937,646 | ||||||||||||
| End of period | $ | 33,965,478 | $ | 32,491,573 | $ | 70,338,537 | $ | 67,102,383 | ||||||||
| Accumulated Net Investment Income | $ | 168,677 | $ | 215,106 | $ | — | $ | 46,379 | ||||||||
| Share Transactions | ||||||||||||||||
| Shares issued | 119,708 | 742,341 | 203,652 | 182,199 | ||||||||||||
| Shares issued in connection with reorganization(B) | — | — | — | 1,202,525 | ||||||||||||
| Shares reinvested | 43,312 | 249,367 | 128,069 | 346,259 | ||||||||||||
| Shares redeemed | (448,031 | ) | (748,340 | ) | (800,526 | ) | (821,852 | ) | ||||||||
| Change in Shares Outstanding | (285,011 | ) | 243,368 | (468,805 | ) | 909,131 | ||||||||||
(A) See Note 9 in Notes to Financial Statement.
(B) See Note 9 for specific details of the Plan of Reorganization. The reorganization was completed following the close of business on June 17, 2016 by a tax-free exchange of 1,441,342 shares of the Sentinel Variable Products Mid Cap Fund for 1,202,525 shares of the Sentinel Variable Products Small Company Fund (the predecessor fund to the Touchstone Small Company Fund), a merger conversion ratio of 0.83430915.
See accompanying Notes to Financial Statements.
64
Statements of Changes in Net Assets (Continued)
| Touchstone | Touchstone | Touchstone | ||||||||||||||||||||
| Aggressive ETF | Conservative ETF | Moderate ETF | ||||||||||||||||||||
| Fund | Fund | Fund | ||||||||||||||||||||
| For the | For the | For the | For the | For the | For the | |||||||||||||||||
| Year | Year | Year | Year | Year | Year | |||||||||||||||||
| Ended | Ended | Ended | Ended | Ended | Ended | |||||||||||||||||
| December 31, | December 31, | December 31, | December 31, | December 31, | December 31, | |||||||||||||||||
| 2017 | 2016 | 2017 | 2016 | 2017 | 2016 | |||||||||||||||||
| $ | 329,440 | $ | 357,890 | $ | 327,477 | $ | 368,633 | $ | 407,322 | $ | 474,065 | |||||||||||
| 522,299 | 2,413,512 | 280,856 | 1,983,518 | 618,545 | 3,952,489 | |||||||||||||||||
| 2,351,512 | (1,282,099 | ) | 1,112,874 | (1,277,572 | ) | 2,034,617 | (2,752,257 | ) | ||||||||||||||
| 3,203,251 | 1,489,303 | 1,721,207 | 1,074,579 | 3,060,484 | 1,674,297 | |||||||||||||||||
| (351,189 | ) | (291,966 | ) | (366,429 | ) | (264,086 | ) | (468,727 | ) | (410,303 | ) | |||||||||||
| — | — | (1,756,495 | ) | (188,777 | ) | (3,720,034 | ) | (1,609,111 | ) | |||||||||||||
| (351,189 | ) | (291,966 | ) | (2,122,924 | ) | (452,863 | ) | (4,188,761 | ) | (2,019,414 | ) | |||||||||||
| 432,285 | 308,932 | 2,994,108 | 3,943,744 | 414,787 | 705,954 | |||||||||||||||||
| — | — | — | — | — | — | |||||||||||||||||
| 351,189 | 291,966 | 2,122,924 | 452,863 | 4,188,761 | 2,019,414 | |||||||||||||||||
| (2,766,183 | ) | (3,350,587 | ) | (5,339,887 | ) | (7,526,670 | ) | (4,662,698 | ) | (5,661,780 | ) | |||||||||||
| (1,982,709 | ) | (2,749,689 | ) | (222,855 | ) | (3,130,063 | ) | (59,150 | ) | (2,936,412 | ) | |||||||||||
| 869,353 | (1,552,352 | ) | (624,572 | ) | (2,508,347 | ) | (1,187,427 | ) | (3,281,529 | ) | ||||||||||||
| 19,514,492 | 21,066,844 | 17,455,576 | 19,963,923 | 24,641,203 | 27,922,732 | |||||||||||||||||
| $ | 20,383,845 | $ | 19,514,492 | $ | 16,831,004 | $ | 17,455,576 | $ | 23,453,776 | $ | 24,641,203 | |||||||||||
| $ | 329,417 | $ | 357,785 | $ | 327,449 | $ | 368,520 | $ | 407,302 | $ | 473,954 | |||||||||||
| 27,391 | 21,752 | 236,683 | 323,830 | 30,330 | 51,081 | |||||||||||||||||
| — | — | — | — | — | — | |||||||||||||||||
| 20,879 | 20,039 | 178,076 | 36,960 | 337,511 | 151,565 | |||||||||||||||||
| (174,231 | ) | (238,973 | ) | (414,047 | ) | (613,618 | ) | (337,079 | ) | (415,639 | ) | |||||||||||
| (125,961 | ) | (197,182 | ) | 712 | (252,828 | ) | 30,762 | (212,993 | ) | |||||||||||||
65
Touchstone Active Bond Fund
Selected Data for a Share Outstanding Throughout Each Period
| Year Ended December 31, | ||||||||||||||||||||
| 2017 | 2016 | 2015 | 2014 | 2013 | ||||||||||||||||
| Net asset value at beginning of period | $ | 10.51 | $ | 10.13 | $ | 10.49 | $ | 10.37 | $ | 11.00 | ||||||||||
| Income (loss) from investment operations: | ||||||||||||||||||||
| Net investment income | 0.21 | 0.26 | 0.19 | 0.20 | 0.22 | |||||||||||||||
| Net realized and unrealized gains (losses) on investments | 0.16 | 0.35 | (0.32 | ) | 0.20 | (0.46 | ) | |||||||||||||
| Total from investment operations | 0.37 | 0.61 | (0.13 | ) | 0.40 | (0.24 | ) | |||||||||||||
| Distributions from: | ||||||||||||||||||||
| Net investment income | (0.28 | ) | (0.23 | ) | (0.23 | ) | (0.28 | ) | (0.34 | ) | ||||||||||
| Realized capital gains | — | — | — | — | (0.05 | ) | ||||||||||||||
| Total distributions | (0.28 | ) | (0.23 | ) | (0.23 | ) | (0.28 | ) | (0.39 | ) | ||||||||||
| Net asset value at end of period | $ | 10.60 | $ | 10.51 | $ | 10.13 | $ | 10.49 | $ | 10.37 | ||||||||||
| Total return(A) | 3.54 | % | 5.98 | % | (1.28 | %) | 3.82 | % | (2.18 | %) | ||||||||||
| Ratios and supplemental data: | ||||||||||||||||||||
| Net assets at end of period (000's) | $ | 57,369 | $ | 55,012 | $ | 52,026 | $ | 48,978 | $ | 48,388 | ||||||||||
| Ratio to average net assets: | ||||||||||||||||||||
| Net expenses | 0.89 | % | 0.92 | %(B) | 0.97 | %(B) | 0.98 | % | 1.00 | % | ||||||||||
| Gross expenses | 0.89 | % | 0.90 | % | 0.91 | % | 1.01 | % | 1.05 | % | ||||||||||
| Net investment income | 2.05 | % | 2.47 | % | 2.10 | % | 1.92 | % | 2.01 | % | ||||||||||
| Portfolio turnover rate | 482 | % | 584 | % | 455 | %(C) | 287 | % | 508 | % | ||||||||||
Touchstone Balanced Fund
Selected Data for a Share Outstanding Throughout Each Period
| Year Ended December 31, | ||||||||||||||||||||
| 2017 | 2016 | 2015 | 2014 | 2013 | ||||||||||||||||
| Net asset value at beginning of period | $ | 13.02 | $ | 12.49 | $ | 13.45 | $ | 13.53 | $ | 12.13 | ||||||||||
| Income (loss) from investment operations: | ||||||||||||||||||||
| Net investment income | 0.14 | 0.15 | (D) | 0.20 | (D) | 0.18 | (D) | 0.18 | (D) | |||||||||||
| Net realized and unrealized gains (losses) on investments | 1.69 | 0.78 | (0.19 | ) | 0.88 | 2.10 | ||||||||||||||
| Total from investment operations | 1.83 | 0.93 | 0.01 | 1.06 | 2.28 | |||||||||||||||
| Distributions from: | ||||||||||||||||||||
| Net investment income | — | (0.18 | ) | (0.25 | ) | (0.23 | ) | (0.21 | ) | |||||||||||
| Realized capital gains | — | (0.20 | ) | (0.72 | ) | (0.91 | ) | (0.67 | ) | |||||||||||
| Return of capital | — | (0.02 | ) | — | — | — | ||||||||||||||
| Total distributions | — | (0.40 | ) | (0.97 | ) | (1.14 | ) | (0.88 | ) | |||||||||||
| Net asset value at end of period | $ | 14.85 | $ | 13.02 | $ | 12.49 | $ | 13.45 | $ | 13.53 | ||||||||||
| Total return(A) | 14.06 | % | 7.42 | % | 0.03 | % | 7.81 | % | 18.88 | % | ||||||||||
| Ratios and supplemental data: | ||||||||||||||||||||
| Net assets at end of period (000's) | $ | 17,964 | $ | 15,988 | $ | 15,301 | $ | 15,963 | $ | 16,456 | ||||||||||
| Ratio to average net assets: | ||||||||||||||||||||
| Net expenses | 0.85 | % | 0.85 | % | 0.87 | % | 0.90 | % | 0.87 | % | ||||||||||
| Gross expenses | 0.97 | % | 0.88 | % | 0.87 | % | 0.90 | % | 0.87 | % | ||||||||||
| Net investment income | 1.01 | % | 1.16 | % | 1.50 | %(E) | 1.31 | % | 1.37 | % | ||||||||||
| Portfolio turnover rate | 142 | % | 30 | % | 38 | % | 76 | % | 220 | % | ||||||||||
| (A) | Total returns do not include any insurance, sales or administrative charges of variable annuity or life insurance contracts. If these charges were included, the returns would be lower. |
| (B) | Net expenses include amounts recouped by the Advisor. |
| (C) | Portfolio turnover excludes the purchases and sales of the Touchstone High Yield Fund acquired on December 7, 2015. If these transactions were included, portfolio turnover would have been higher. |
| (D) | The net investment income per share was based on average shares outstanding for the period. |
| (E) | Includes the impact of special dividends resulting from an acquisition of Covidien plc by Medtronic, Inc. on January 26, 2015 through the formation of a new holding company, Medtronic plc, incorporated in Ireland. These special dividends enhanced the ratio of net investment income by 0.47% for the fiscal year ended December 31, 2015. |
See accompanying Notes to Financial Statements.
66
Financial Highlights (Continued)
Touchstone Bond Fund
Selected Data for a Share Outstanding Throughout Each Period
| Year Ended December 31, | ||||||||||||||||||||
| 2017 | 2016 | 2015 | 2014 | 2013 | ||||||||||||||||
| Net asset value at beginning of period | $ | 9.26 | $ | 9.38 | $ | 9.83 | $ | 9.75 | $ | 10.10 | ||||||||||
| Income (loss) from investment operations: | ||||||||||||||||||||
| Net investment income | 0.18 | 0.14 | (A) | 0.27 | (A) | 0.29 | (A) | 0.26 | (A) | |||||||||||
| Net realized and unrealized gains (losses) on investments | 0.16 | (0.06 | ) | (0.40 | ) | 0.10 | (0.29 | ) | ||||||||||||
| Total from investment operations | 0.34 | 0.08 | (0.13 | ) | 0.39 | (0.03 | ) | |||||||||||||
| Distributions from: | ||||||||||||||||||||
| Net investment income | — | (0.20 | ) | (0.32 | ) | (0.31 | ) | (0.32 | ) | |||||||||||
| Net asset value at end of period | $ | 9.60 | $ | 9.26 | $ | 9.38 | $ | 9.83 | $ | 9.75 | ||||||||||
| Total return(B) | 3.67 | % | 0.81 | % | (1.29 | %) | 4.01 | % | (0.33 | %) | ||||||||||
| Ratios and supplemental data: | ||||||||||||||||||||
| Net assets at end of period (000's) | $ | 46,922 | $ | 48,680 | $ | 57,312 | $ | 67,067 | $ | 61,664 | ||||||||||
| Ratio to average net assets: | ||||||||||||||||||||
| Net expenses | 0.68 | % | 0.67 | % | 0.67 | % | 0.65 | % | 0.67 | % | ||||||||||
| Gross expenses | 0.71 | % | 0.67 | % | 0.67 | % | 0.65 | % | 0.67 | % | ||||||||||
| Net investment income | 1.83 | % | 1.46 | % | 2.69 | % | 2.90 | % | 2.64 | % | ||||||||||
| Portfolio turnover rate | 168 | % | 197 | % | 117 | % | 117 | % | 256 | % | ||||||||||
Touchstone Common Stock Fund
Selected Data for a Share Outstanding Throughout Each Period
| Year Ended December 31, | ||||||||||||||||||||
| 2017 | 2016 | 2015 | 2014 | 2013 | ||||||||||||||||
| Net asset value at beginning of period | $ | 15.52 | $ | 15.46 | $ | 17.69 | $ | 18.39 | $ | 15.15 | ||||||||||
| Income (loss) from investment operations: | ||||||||||||||||||||
| Net investment income | 0.22 | 0.25 | (A) | 0.44 | (A) | 0.30 | (A) | 0.26 | (A) | |||||||||||
| Net realized and unrealized gains (losses) on investments | 3.11 | 1.49 | (0.39 | ) | 1.61 | 4.52 | ||||||||||||||
| Total from investment operations | 3.33 | 1.74 | 0.05 | 1.91 | 4.78 | |||||||||||||||
| Distributions from: | ||||||||||||||||||||
| Net investment income | (— | )(C) | (0.27 | ) | (0.49 | ) | (0.33 | ) | (0.28 | ) | ||||||||||
| Realized capital gains | (0.11 | ) | (1.41 | ) | (1.79 | ) | (2.28 | ) | (1.26 | ) | ||||||||||
| Total distributions | (0.11 | ) | (1.68 | ) | (2.28 | ) | (2.61 | ) | (1.54 | ) | ||||||||||
| Net asset value at end of period | $ | 18.74 | $ | 15.52 | $ | 15.46 | $ | 17.69 | $ | 18.39 | ||||||||||
| Total return(B) | 21.50 | % | 11.26 | % | 0.19 | % | 10.34 | % | 31.73 | % | ||||||||||
| Ratios and supplemental data: | ||||||||||||||||||||
| Net assets at end of period (000's) | $ | 158,438 | $ | 149,238 | $ | 161,148 | $ | 198,524 | $ | 220,631 | ||||||||||
| Ratio to average net assets: | ||||||||||||||||||||
| Net expenses | 0.71 | % | 0.73 | % | 0.72 | % | 0.72 | % | 0.72 | % | ||||||||||
| Gross expenses | 0.71 | % | 0.73 | % | 0.72 | % | 0.72 | % | 0.72 | % | ||||||||||
| Net investment income | 1.21 | % | 1.58 | % | 2.48 | %(D) | 1.57 | % | 1.49 | % | ||||||||||
| Portfolio turnover rate | 84 | % | 6 | % | 9 | % | 13 | % | 8 | % | ||||||||||
| (A) | The net investment income per share was based on average shares outstanding for the period. |
| (B) | Total returns do not include any insurance, sales or administrative charges of variable annuity or life insurance contracts. If these charges were included, the returns would be lower. |
| (C) | Less than $0.005 per share. |
| (D) | Includes the impact of special dividends resulting from an acquisition of Covidien plc by Medtronic, Inc. on January 26, 2015 through the formation of a new holding company, Medtronic plc, incorporated in Ireland. These special dividends enhanced the ratio of net investment income by 0.47% for the fiscal year ended December 31, 2015. |
See accompanying Notes to Financial Statements.
67
Financial Highlights (Continued)
Touchstone Focused Fund
Selected Data for a Share Outstanding Throughout Each Period
| Year Ended December 31, | ||||||||||||||||||||
| 2017 | 2016 | 2015 | 2014 | 2013 | ||||||||||||||||
| Net asset value at beginning of period | $ | 16.70 | $ | 17.95 | $ | 18.64 | $ | 18.81 | $ | 14.20 | ||||||||||
| Income (loss) from investment operations: | ||||||||||||||||||||
| Net investment income (loss) | 0.09 | 0.09 | (0.01 | ) | (0.08 | ) | (0.05 | ) | ||||||||||||
| Net realized and unrealized gains on investments | 2.19 | 2.31 | 0.37 | 2.49 | 4.98 | |||||||||||||||
| Total from investment operations | 2.28 | 2.40 | 0.36 | 2.41 | 4.93 | |||||||||||||||
| Distributions from: | ||||||||||||||||||||
| Net investment income | (0.10 | ) | — | — | — | — | ||||||||||||||
| Realized capital gains | — | (3.65 | ) | (1.05 | ) | (2.58 | ) | (0.32 | ) | |||||||||||
| Total distributions | (0.10 | ) | (3.65 | ) | (1.05 | ) | (2.58 | ) | (0.32 | ) | ||||||||||
| Net asset value at end of period | $ | 18.88 | $ | 16.70 | $ | 17.95 | $ | 18.64 | $ | 18.81 | ||||||||||
| Total return(A) | 13.64 | % | 13.11 | % | 1.97 | % | 13.10 | % | 34.81 | % | ||||||||||
| Ratios and supplemental data: | ||||||||||||||||||||
| Net assets at end of period (000's) | $ | 61,934 | $ | 62,227 | $ | 68,317 | $ | 25,178 | $ | 27,506 | ||||||||||
| Ratio to average net assets: | ||||||||||||||||||||
| Net expenses | 1.21 | %(B) | 1.21 | %(B) | 1.21 | % | 1.23 | % | 1.26 | % | ||||||||||
| Gross expenses | 1.17 | % | 1.17 | % | 1.32 | % | 1.33 | % | 1.36 | % | ||||||||||
| Net investment income (loss) | 0.40 | % | 0.55 | % | (0.07 | %) | (0.43 | %) | (0.32 | %) | ||||||||||
| Portfolio turnover rate | 12 | % | 21 | % | 286 | %(C) | 72 | % | 77 | % | ||||||||||
Touchstone Large Cap Core Equity Fund
Selected Data for a Share Outstanding Throughout Each Period
| Year Ended December 31, | ||||||||||||||||||||
| 2017 | 2016 | 2015 | 2014 | 2013 | ||||||||||||||||
| Net asset value at beginning of period | $ | 13.72 | $ | 14.07 | $ | 14.90 | $ | 13.09 | $ | 10.09 | ||||||||||
| Income (loss) from investment operations: | ||||||||||||||||||||
| Net investment income | 0.09 | 0.08 | 0.18 | 0.18 | 0.17 | |||||||||||||||
| Net realized and unrealized gains (losses) on investments | 2.83 | 1.18 | (0.77 | ) | 1.78 | 3.01 | ||||||||||||||
| Total from investment operations | 2.92 | 1.26 | (0.59 | ) | 1.96 | 3.18 | ||||||||||||||
| Distributions from: | ||||||||||||||||||||
| Net investment income | (0.10 | ) | (0.11 | ) | (0.24 | ) | (0.15 | ) | (0.18 | ) | ||||||||||
| Realized capital gains | (0.24 | ) | (1.50 | ) | — | — | — | |||||||||||||
| Total distributions | (0.34 | ) | (1.61 | ) | (0.24 | ) | (0.15 | ) | (0.18 | ) | ||||||||||
| Net asset value at end of period | $ | 16.30 | $ | 13.72 | $ | 14.07 | $ | 14.90 | $ | 13.09 | ||||||||||
| Total return(A) | 21.32 | % | 8.84 | % | (4.01 | %) | 14.93 | % | 31.52 | % | ||||||||||
| Ratios and supplemental data: | ||||||||||||||||||||
| Net assets at end of period (000's) | $ | 33,965 | $ | 32,492 | $ | 29,894 | $ | 40,664 | $ | 36,697 | ||||||||||
| Ratio to average net assets: | ||||||||||||||||||||
| Net expenses | 1.06 | % | 1.06 | % | 1.06 | % | 1.04 | % | 1.00 | % | ||||||||||
| Gross expenses | 1.15 | % | 1.17 | % | 1.14 | % | 1.16 | % | 1.21 | % | ||||||||||
| Net investment income | 0.52 | % | 0.75 | % | 0.73 | % | 1.30 | % | 1.16 | % | ||||||||||
| Portfolio turnover rate | 12 | % | 50 | % | 111 | % | 41 | % | 54 | % | ||||||||||
| (A) | Total returns do not include any insurance, sales or administrative charges of variable annuity or life insurance contracts. If these charges were included, the returns would be lower. |
| (B) | Net expenses include amounts recouped by the Advisor. |
| (C) | Portfolio turnover excludes the purchases and sales of the Touchstone Baron Small Cap Growth Fund and Touchstone Third Avenue Value Fund acquired on December 7, 2015. If these transactions were included, portfolio turnover would have been higher. |
See accompanying Notes to Financial Statements.
68
Financial Highlights (Continued)
Touchstone Small Company Fund
Selected Data for a Share Outstanding Throughout Each Period
| Year Ended December 31, | ||||||||||||||||||||
| 2017 | 2016 | 2015 | 2014 | 2013 | ||||||||||||||||
| Net asset value at beginning of period | $ | 13.58 | $ | 12.14 | $ | 14.63 | $ | 16.32 | $ | 14.13 | ||||||||||
| Income (loss) from investment operations: | ||||||||||||||||||||
| Net investment income (loss) | (0.01 | ) | 0.01 | (A) | (0.02 | )(A) | 0.07 | (A) | 0.01 | (A) | ||||||||||
| Net realized and unrealized gains (losses) on investments | 2.57 | 2.44 | (0.15 | ) | 1.03 | 4.88 | ||||||||||||||
| Total from investment operations | 2.56 | 2.45 | (0.17 | ) | 1.10 | 4.89 | ||||||||||||||
| Distributions from: | ||||||||||||||||||||
| Net investment income | (0.01 | ) | (0.01 | ) | — | (0.08 | ) | (0.01 | ) | |||||||||||
| Realized capital gains | (0.40 | ) | (1.00 | ) | (2.32 | ) | (2.71 | ) | (2.69 | ) | ||||||||||
| Total distributions | (0.41 | ) | (1.01 | ) | (2.32 | ) | (2.79 | ) | (2.70 | ) | ||||||||||
| Net asset value at end of period | $ | 15.73 | $ | 13.58 | $ | 12.14 | $ | 14.63 | $ | 16.32 | ||||||||||
| Total return(B) | 19.12 | % | 20.23 | % | (1.34 | %) | 6.68 | % | 34.72 | % | ||||||||||
| Ratios and supplemental data: | ||||||||||||||||||||
| Net assets at end of period (000's) | $ | 70,339 | $ | 67,102 | $ | 48,938 | $ | 57,935 | $ | 62,134 | ||||||||||
| Ratio to average net assets: | ||||||||||||||||||||
| Net expenses | 0.76 | % | 0.76 | % | 0.78 | % | 0.78 | % | 0.80 | % | ||||||||||
| Gross expenses | 0.76 | % | 0.76 | % | 0.78 | % | 0.78 | % | 0.80 | % | ||||||||||
| Net investment income (loss) | (0.06 | %) | 0.08 | % | (0.10 | %) | 0.45 | % | 0.09 | % | ||||||||||
| Portfolio turnover rate | 68 | % | 68 | % | 77 | % | 72 | % | 47 | % | ||||||||||
Touchstone Aggressive ETF Fund
Selected Data for a Share Outstanding Throughout Each Period
| Year Ended December 31, | ||||||||||||||||||||
| 2017 | 2016 | 2015 | 2014 | 2013 | ||||||||||||||||
| Net asset value at beginning of period | $ | 14.60 | $ | 13.73 | $ | 13.98 | $ | 13.28 | $ | 11.13 | ||||||||||
| Income (loss) from investment operations: | ||||||||||||||||||||
| Net investment income | 0.30 | 0.30 | 0.22 | 0.21 | 0.13 | |||||||||||||||
| Net realized and unrealized gains (losses) on investments | 2.22 | 0.79 | (0.23 | ) | 0.78 | 2.41 | ||||||||||||||
| Total from investment operations | 2.52 | 1.09 | (0.01 | ) | 0.99 | 2.54 | ||||||||||||||
| Distributions from: | ||||||||||||||||||||
| Net investment income | (0.29 | ) | (0.22 | ) | (0.24 | ) | — | (0.33 | ) | |||||||||||
| Realized capital gains | — | — | — | (0.29 | ) | (0.06 | ) | |||||||||||||
| Total distributions | (0.29 | ) | (0.22 | ) | (0.24 | ) | (0.29 | ) | (0.39 | ) | ||||||||||
| Net asset value at end of period | $ | 16.83 | $ | 14.60 | $ | 13.73 | $ | 13.98 | $ | 13.28 | ||||||||||
| Total return(B) | 17.29 | % | 7.96 | % | (0.10 | %) | 7.49 | % | 22.91 | % | ||||||||||
| Ratios and supplemental data: | ||||||||||||||||||||
| Net assets at end of period (000's) | $ | 20,384 | $ | 19,514 | $ | 21,067 | $ | 24,099 | $ | 26,822 | ||||||||||
| Ratio to average net assets: | ||||||||||||||||||||
| Net expenses(C) | 0.75 | % | 0.75 | % | 0.75 | % | 0.75 | % | 0.75 | % | ||||||||||
| Gross expenses(C) | 0.90 | % | 0.90 | % | 0.87 | % | 0.87 | % | 1.09 | % | ||||||||||
| Net investment income | 1.64 | % | 1.80 | % | 1.26 | % | 1.42 | % | 1.49 | % | ||||||||||
| Portfolio turnover rate | 21 | % | 109 | % | 7 | % | 12 | % | 11 | %(D) | ||||||||||
| (A) | The net investment income (loss) per share was based on average shares outstanding for the period. |
| (B) | Total returns do not include any insurance, sales or administrative charges of variable annuity or life insurance contracts. If these charges were included, the returns would be lower. |
| (C) | Ratio does not include expenses of the underlying funds. |
| (D) | Portfolio turnover excludes the purchases and sales of the Touchstone Enhanced ETF Fund acquired on December 13, 2013. If these transactions were included, portfolio turnover would have been higher. |
See accompanying Notes to Financial Statements.
69
Financial Highlights (Continued)
Touchstone Conservative ETF Fund
Selected Data for a Share Outstanding Throughout Each Period
| Year Ended December 31, | ||||||||||||||||||||
| 2017 | 2016 | 2015 | 2014 | 2013 | ||||||||||||||||
| Net asset value at beginning of period | $ | 12.18 | $ | 11.84 | $ | 12.68 | $ | 12.61 | $ | 12.15 | ||||||||||
| Income (loss) from investment operations: | ||||||||||||||||||||
| Net investment income | 0.23 | 0.29 | 0.17 | 0.18 | 0.12 | |||||||||||||||
| Net realized and unrealized gains (losses) on investments | 0.99 | 0.37 | (0.20 | ) | 0.48 | 0.91 | ||||||||||||||
| Total from investment operations | 1.22 | 0.66 | (0.03 | ) | 0.66 | 1.03 | ||||||||||||||
| Distributions from: | ||||||||||||||||||||
| Net investment income | (0.26 | ) | (0.19 | ) | (0.19 | ) | (0.15 | ) | (0.18 | ) | ||||||||||
| Realized capital gains | (1.40 | ) | (0.13 | ) | (0.62 | ) | (0.44 | ) | (0.39 | ) | ||||||||||
| Total distributions | (1.66 | ) | (0.32 | ) | (0.81 | ) | (0.59 | ) | (0.57 | ) | ||||||||||
| Net asset value at end of period | $ | 11.74 | $ | 12.18 | $ | 11.84 | $ | 12.68 | $ | 12.61 | ||||||||||
| Total return(A) | 10.06 | % | 5.58 | % | (0.24 | %) | 5.23 | % | 8.50 | % | ||||||||||
| Ratios and supplemental data: | ||||||||||||||||||||
| Net assets at end of period (000's) | $ | 16,831 | $ | 17,456 | $ | 19,964 | $ | 23,389 | $ | 26,071 | ||||||||||
| Ratio to average net assets: | ||||||||||||||||||||
| Net expenses(B) | 0.75 | % | 0.75 | % | 0.75 | % | 0.75 | % | 0.75 | % | ||||||||||
| Gross expenses(B) | 0.93 | % | 0.90 | % | 0.87 | % | 0.89 | % | 0.99 | % | ||||||||||
| Net investment income | 1.82 | % | 1.78 | % | 1.13 | % | 1.20 | % | 1.09 | % | ||||||||||
| Portfolio turnover rate | 31 | % | 109 | % | 9 | % | 13 | % | 29 | % | ||||||||||
Touchstone Moderate ETF Fund
Selected Data for a Share Outstanding Throughout Each Period
| Year Ended December 31, | ||||||||||||||||||||
| 2017 | 2016 | 2015 | 2014 | 2013 | ||||||||||||||||
| Net asset value at beginning of period | $ | 13.10 | $ | 13.33 | $ | 15.49 | $ | 14.72 | $ | 12.89 | ||||||||||
| Income (loss) from investment operations: | ||||||||||||||||||||
| Net investment income | 0.21 | 0.28 | 0.21 | 0.31 | 0.23 | |||||||||||||||
| Net realized and unrealized gains (losses) on investments | 1.56 | 0.64 | (0.24 | ) | 0.72 | 1.87 | ||||||||||||||
| Total from investment operations | 1.77 | 0.92 | (0.03 | ) | 1.03 | 2.10 | ||||||||||||||
| Distributions from: | ||||||||||||||||||||
| Net investment income | (0.25 | ) | (0.22 | ) | (0.27 | ) | (0.26 | ) | (0.27 | ) | ||||||||||
| Realized capital gains | (2.36 | ) | (0.93 | ) | (1.86 | ) | — | — | ||||||||||||
| Total distributions | (2.61 | ) | (1.15 | ) | (2.13 | ) | (0.26 | ) | (0.27 | ) | ||||||||||
| Net asset value at end of period | $ | 12.26 | $ | 13.10 | $ | 13.33 | $ | 15.49 | $ | 14.72 | ||||||||||
| Total return(A) | 13.66 | % | 6.85 | % | (0.18 | %) | 6.96 | % | 16.32 | % | ||||||||||
| Ratios and supplemental data: | ||||||||||||||||||||
| Net assets at end of period (000's) | $ | 23,454 | $ | 24,641 | $ | 27,923 | $ | 33,200 | $ | 41,687 | ||||||||||
| Ratio to average net assets: | ||||||||||||||||||||
| Net expenses(B) | 0.75 | % | 0.75 | % | 0.75 | % | 0.75 | % | 0.75 | % | ||||||||||
| Gross expenses(B) | 0.84 | % | 0.82 | % | 0.80 | % | 0.79 | % | 0.92 | % | ||||||||||
| Net investment income | 1.72 | % | 1.83 | % | 1.30 | % | 1.41 | % | 1.29 | % | ||||||||||
| Portfolio turnover rate | 21 | % | 98 | % | 9 | % | 11 | % | 9 | % | ||||||||||
| (A) | Total returns do not include any insurance, sales or administrative charges of variable annuity or life insurance contracts. If these charges were included, the returns would be lower. |
| (B) | Ratio does not include expenses of the underlying funds. |
See accompanying Notes to Financial Statements.
70
December 31, 2017
1. Organization
The Touchstone Variable Series Trust (the “Trust”) is registered under the Investment Company Act of 1940, as amended (the “1940 Act”), as an open-end management investment company. The Trust was established as a Massachusetts business trust pursuant to an Agreement and Declaration of Trust dated February 7, 1994. The Trust consists of the following ten funds (individually, a “Fund”, and collectively, the “Funds”):
Touchstone Active Bond Fund (“Active Bond Fund”)
Touchstone Balanced Fund (“Balanced Fund”)*
Touchstone Bond Fund (“Bond Fund”)*
Touchstone Common Stock Fund (“Common Stock Fund”)*
Touchstone Focused Fund (“Focused Fund”)
Touchstone Large Cap Core Equity Fund (“Large Cap Core Equity Fund”)
Touchstone Small Company Fund (“Small Company Fund”)*
Touchstone Aggressive ETF Fund (“Aggressive ETF Fund”)
Touchstone Conservative ETF Fund (“Conservative ETF Fund”)
Touchstone Moderate ETF Fund (“Moderate ETF Fund”)
* See Note 9 in Notes to Financial Statements for details on the Reorganizations.
Each Fund is diversified with the exception of the Common Stock Fund, Focused Fund and the Large Cap Core Equity Fund which are non-diversified.
The Agreement and Declaration of Trust permits the Trust to issue an unlimited number of shares of beneficial interest of each Fund. Shares of beneficial interest of each Fund are available as a funding vehicle for the separate accounts of life insurance companies issuing variable annuity and variable life insurance policies. As of December 31, 2017, a majority of the outstanding shares of the Active Bond Fund, Focused Fund, Large Cap Core Equity Fund, Aggressive ETF Fund, Conservative ETF Fund and Moderate ETF Fund were issued to separate accounts of Western-Southern Life Assurance Company, The Western & Southern Life Insurance Company, Integrity Life Insurance Company, National Integrity Life Insurance Company, and Columbus Life Insurance Company, which are all part of Western & Southern Financial Group, Inc. (“Western & Southern”), and certain supplemental executive retirement plans sponsored by Western & Southern and its affiliates.
All Funds offer a single class of shares. The assets of each Fund are segregated, and a shareholder’s interest is limited to the Fund in which shares are held. The Funds’ prospectus provides a description of each Fund’s investment goals, policies, and strategies along with information on the class of shares currently being offered.
2. Significant Accounting Policies
The following is a summary of the Funds’ significant accounting policies:
Each Fund is an investment company that follows the accounting and reporting guidance of Accounting Standards Codification Topic 946 applicable to investment companies.
Security valuation and fair value measurements — U.S. generally accepted accounting principles (“U.S. GAAP”) define fair value as the price the Funds would receive to sell an asset or pay to transfer a liability in an orderly transaction between market participants at the measurement date. All investments in securities are recorded at their fair value. The Funds define the term “market value”, as used throughout this report, as the estimated fair value. The Funds use various methods to measure fair value of their portfolio securities on a recurring basis. U.S. GAAP fair value measurement standards require disclosure of a hierarchy that prioritizes inputs to valuation methods.
71
Notes to Financial Statements (Continued)
These inputs are summarized in the three broad levels listed below:
| · | Level 1 – | quoted prices in active markets for identical securities |
| · | Level 2 – | other significant observable inputs (including quoted prices for similar securities, interest rates, prepayment speeds, credit risk, etc.) |
| · | Level 3 – | significant unobservable inputs (including a Fund’s own assumptions in determining the fair value of investments) |
The inputs or methodology used for valuing securities are not necessarily an indication of the risk associated with investing in those securities.
The aggregate value by input level, as of December 31, 2017, for each Fund’s investments, as well as a reconciliation of assets for which significant unobservable inputs (Level 3) were used in determining value, if applicable, is included in the Funds’ Portfolio of Investments, which also includes a breakdown of the Funds’ investments by portfolio or sector allocation. The Funds did not hold any Level 3 categorized securities during the year ended December 31, 2017.
Changes in valuation techniques may result in transfers into or out of an investment’s assigned level within the hierarchy. All transfers in and out of the levels are recognized at the value at the end of the period. At December 31, 2017, there were no transfers between Levels 1, 2 and 3 for all Funds.
During the year ended December 31, 2017, there were no material changes to the valuation policies and techniques.
The Funds’ portfolio securities are valued as of the close of the regular session of trading on the New York Stock Exchange (“NYSE”) (currently 4:00 p.m., Eastern time). Portfolio securities traded on stock exchanges are valued at the last reported sale price, official close price, or last bid price if no sales are reported. Portfolio securities quoted by NASDAQ are valued at the NASDAQ Official Closing Price (“NOCP”) or from the primary exchange on which the security trades. To the extent these securities are actively traded, they are categorized in Level 1 of the fair value hierarchy. Options and futures are valued at the last quoted sales price. If there is no such reported sale on the valuation date, long option positions are valued at the most recent bid price, and short option positions are valued at the most recent ask price on the valuation date and are categorized in Level 1. Shares of mutual funds in which the Funds invest are valued at their respective net asset values (“NAV”) as reported by the underlying funds and are categorized in Level 1.
Debt securities held by the Funds are valued at their evaluated bid by an independent pricing service or at their last broker-quoted bid prices as obtained from one or more of the major market makers for such securities. Independent pricing services use information provided by market makers or estimates of market values through accepted market modeling conventions. Observable inputs to the models may include prepayment speeds, pricing spread, yield, trade information, dealer quotes, market color, cash flow models, the securities’ terms and conditions, among others, and are generally categorized in Level 2. The Bond Fund’s investments in bank loans are normally valued at the bid quotation obtained from dealers in loans by an independent pricing service in accordance with the Fund’s valuation policies and procedures approved by the Fund’s Board of Trustees (the “Board”), and are generally categorized in Level 2. Debt securities with remaining maturities of 60 days or less may be valued at amortized cost, provided such amount approximates market value and are categorized in Level 2. While this method provides consistency in valuation (and may only be used if it approximates market value), it may result in periods during which fair value, as determined by amortized cost, is higher or lower than the price that would be received if the Fund sold the investment.
Securities mainly traded on a non-U.S. exchange or denominated in foreign currencies are generally valued according to the preceding closing values on that exchange, translated to U.S. dollars using currency exchange
72
Notes to Financial Statements (Continued)
rates as of the close of regular trading on the NYSE, and are generally categorized in Level 1. However, if an event that may change the value of a security occurs after the time that the closing value on the non-U.S. exchange was determined, but before the close of regular trading on the NYSE, the security may be priced based on fair value and generally categorized in Level 2. This may cause the value of the security, if held on the books of a Fund, to be different from the closing value on the non-U.S. exchange and may affect the calculation of that Fund’s NAV.
The Funds may use fair value pricing under the following circumstances, among others:
| · | If the value of a security has been materially affected by events occurring before the Funds’ pricing time but after the close of the primary markets on which the security is traded. |
| · | If the exchange on which a portfolio security is principally traded closes early or if trading in a particular portfolio security was halted during the day and did not resume prior to the Funds’ NAV calculation. |
| · | If a security is so thinly traded that reliable market quotations are unavailable due to infrequent trading. |
| · | If the validity of market quotations is not reliable. |
Securities held by the Funds that do not have readily available market quotations, significant observable inputs, or securities for which the available market quotations are not reliable, are priced at their estimated fair value using procedures approved by the Board and are generally categorized in Level 3.
Bank Loans —The Bond Fund may invest in bank loans, which usually take the form of loan participations and assignments. Loan participations and assignments are agreements to make money available to U.S. or foreign corporations, partnerships or other business entities (the “Borrower”) in a specified amount, at a specified rate and within a specified time. A loan is typically originated, negotiated and structured by a U.S. or foreign bank, insurance company or other financial institution (the “Agent”) for a group of loan investors (“Loan Investors”). The Agent typically administers and enforces the loan on behalf of the other Loan Investors in the syndicate and may hold any collateral on behalf of the Loan Investors. Such loan participations and assignments are typically senior, secured and collateralized in nature. The Fund records an investment when the Borrower withdraws money and records interest as earned. These loans pay interest at rates which are periodically reset by reference to a base lending rate plus a spread. These base lending rates are generally the prime rate offered by a designated U.S. bank or London InterBank Offered Rate (“LIBOR”).
The loans in which the Fund invests may be subject to some restrictions on resale. For example, the Fund may be contractually obligated to receive approval from the Agent and/or Borrower prior to the sale of these investments. The Fund generally has no right to enforce compliance with the terms of the loan agreement with the Borrower. As a result, the Fund assumes the credit risk of the Borrower, the selling participant and any other persons interpositioned between the Fund and the Borrower (“Intermediate Participants”). In the event that the Borrower, selling participant or Intermediate Participants become insolvent or enter into bankruptcy, the Fund may incur certain costs and delays in realizing payment or may suffer a loss of principal and/or interest.
Unfunded commitments represent the remaining obligation of the Fund to the Borrower. At any point in time, up to the maturity date of the issue, the Borrower may demand the unfunded portion. Until demanded by the Borrower, unfunded commitments are not recognized as an asset on the Statement of Assets and Liabilities. Unrealized appreciation/depreciation on unfunded commitments presented on the Statement of Assets and Liabilities represents mark to market of the unfunded portion of the Fund’s bank loans.
As of December 31, 2017 the Fund did not hold any unfunded loan commitments.
Investment companies — The Funds may invest in securities of other investment companies, including exchange-traded funds (“ETFs”), open-end funds and closed-end funds. Open-end funds are investment companies that issue new shares continuously and redeem shares daily. Closed-end funds are investment companies that typically issue a fixed number of shares that trade on a securities exchange or over-the-counter (“OTC”). An
73
Notes to Financial Statements (Continued)
ETF is an investment company that typically seeks to track the performance of an index by holding in its portfolio shares of all the companies, or a representative sample of the companies, that are components of a particular index. ETF shares are traded on a securities exchange based on their market value. The risks of investment in other investment companies typically reflect the risks of the types of securities in which the other investment companies invest. Investments in ETFs and closed-end funds are subject to the additional risk that their shares may trade at a premium or discount to their NAV. When a Fund invests in another investment company, shareholders of the Fund indirectly bear their proportionate share of the other investment company’s fees and expenses, including operating, registration, trustee, licensing, and marketing, as well as their share of the Fund’s fees and expenses.
Futures Contracts — The Active Bond Fund may buy and sell futures contracts and related options to manage its exposure to changing interest rates and securities prices. Some strategies reduce the Fund’s exposure to price fluctuations, while others tend to increase its market exposure. Futures and options on futures can be volatile instruments and involve certain risks that could negatively impact the Fund’s return. In order to avoid leveraging and related risks, when the Fund purchases futures contracts, it will collateralize its position by depositing an amount of cash or liquid securities, equal to the market value of the futures positions held, less margin deposits, in a segregated account with its custodian or otherwise “cover” its position in a manner consistent with the 1940 Act, or the rules of the Securities and Exchange Commission (the “SEC”) or interpretations thereunder. Collateral equal to the current market value of the futures position will be marked to market on a daily basis.
When the contract is closed, the Fund records a realized gain or loss equal to the difference between the proceeds from (or cost of ) the closing transactions and the Fund’s basis in the contract. Risks of entering into futures contracts include the possibility that a change in the value of the contract may not correlate with the changes in the value of the underlying instruments. Second, it is possible that a lack of liquidity for futures contracts could exist in the secondary market resulting in an inability to close a futures position prior to its maturity date. Third, the purchase of a futures contract involves the risk that the Fund could lose more than the original margin deposit required to initiate the futures transaction. Finally, the risk exists that losses could exceed amounts disclosed on the Statements of Assets and Liabilities. There is minimal counterparty credit risk involved in entering into futures contracts since they are exchange-traded instruments and the exchange’s clearinghouse, as counterparty to all exchange-traded futures, guarantees the futures against default. As of December 31, 2017, the Active Bond Fund held futures contracts as shown on the Portfolio of Investments and had cash in the amount of $49,625 held as collateral for futures contracts.
Swap Contracts — The Active Bond Fund may enter into swap transactions to help enhance the value of its portfolio or manage its exposure to different types of investments. Swaps are financial instruments that typically involve the exchange of cash flows between two parties on specified dates (settlement dates), where the cash flows are based on agreed-upon prices, rates, indexes, etc. The nominal amount on which the cash flows are calculated is called the notional amount. Swaps are individually negotiated and structured to include exposure to a variety of different types of investments or market factors, such as interest rates, foreign currency rates, mortgage securities, corporate borrowing rates, security prices, indexes or inflation rates.
Swap agreements may increase or decrease the overall volatility of the investments of the Fund and its share price. The performance of swap agreements may be affected by a change in the specific interest rate, currency, or other factors that determine the amounts of payments due to and from a Fund. If a swap agreement calls for payments by a Fund, the Fund must be prepared to make such payments when due. In addition, if the counterparty’s creditworthiness declines, the value of a swap agreement would be likely to decline, potentially resulting in losses.
Generally, bilateral swap agreements, OTC swaps, have a fixed maturity date that will be agreed upon by the parties. The agreement can be terminated before the maturity date only under limited circumstances, such as
74
Notes to Financial Statements (Continued)
default by one of the parties or insolvency, among others, and can be transferred by a party only with the prior written consent of the other party. The Fund may be able to eliminate its exposure under a swap agreement either by assignment or by other disposition, or by entering into an offsetting swap agreement with the same party or a similarly creditworthy party. If the counterparty is unable to meet its obligations under the contract, declares bankruptcy, defaults or becomes insolvent, a Fund may not be able to recover the money it expected to receive under the contract.
Cleared swaps are transacted through futures commission merchants that are members of central clearinghouses with the clearinghouses serving as a central counterparty. Pursuant to rules promulgated under the Dodd-Frank Act, central clearing of swap agreements is currently required for certain market participants trading certain instruments, and central clearing for additional instruments is expected to be implemented by regulators until the majority of the swaps market is ultimately subject to central clearing.
Swaps are marked-to-market daily based upon values received from third party vendors or quotations from market makers. For OTC swaps, any upfront premiums paid or received are recorded as assets or liabilities, respectively, and are shown as premium paid on swap agreements or premium received on swap agreements in the Statements of Assets and Liabilities. For swaps that are centrally cleared, initial margins, determined by each relevant clearing agency, are posted and segregated at a broker account registered with the Commodity Futures Trading Commission (“CFTC”), or the applicable regulator. The change in value of swaps, including accruals of periodic amounts of interest to be paid or received on swaps, is recorded as unrealized appreciation or depreciation. Daily changes in the value of centrally cleared swaps are recorded in the Statements of Assets and Liabilities as receivable or payable for variation margin on swap agreements and settled daily. Upfront premiums and liquidation payments received or paid are recorded as realized gains or losses at the termination or maturity of the swap. Net periodic payments received or paid by the Fund are recorded as realized gain or loss.
A swap agreement can be a form of leverage, which can magnify the Fund’s gains or losses. In order to reduce the risk associated with leveraging, the Fund may cover its current obligations under swap agreements according to guidelines established by the SEC. If a Fund enters into a swap agreement on a net basis, it will segregate assets with a daily value at least equal to the excess, if any, of the Fund’s accrued obligations under the swap agreement over the accrued amount the Fund is entitled to receive under the agreement. If the Fund enters into a swap agreement on other than a net basis, it will segregate assets with a value equal to the full amount of the Fund’s accrued obligations under the agreement.
As of December 31, 2017, the Active Bond Fund did not hold any swap contracts.
Foreign currency translation — The books and records of the Funds are maintained in U.S. dollars and translated into U.S. dollars on the following basis:
| (1) | market value of investment securities, assets and liabilities at the current rate of exchange on the valuation date; and |
| (2) | purchases and sales of investment securities, income, and expenses at the relevant rates of exchange prevailing on the respective dates of such transactions. |
The Funds do not isolate that portion of gains and losses on investments in equity securities that is due to changes in the foreign exchange rates from that which is due to changes in market prices of equity securities.
Real Estate Investment Trusts — The Funds may invest in real estate investment trusts (“REITs”) that involve risks not associated with investing in stocks. Risks include declines in the value of real estate, general and economic conditions, changes in the value of the underlying property and defaults by borrowers. The value of assets in the real estate industry may go through cycles of relative underperformance and outperformance in comparison
75
Notes to Financial Statements (Continued)
to equity securities markets in general. Dividend income is recorded using management’s estimate of the income included in distributions received from REIT investments. The actual amounts of income, return of capital and capital gains are only determined by each REIT after its fiscal year-end and may differ from the estimated amount. Estimates of income are adjusted in the Funds to the actual amounts when the amounts are determined.
Derivative instruments and hedging activities — The Active Bond Fund may enter into an International Swaps and Derivatives Association, Inc. Master Agreement (“ISDA Master Agreement” or “MNA”) or similar agreement with certain counterparties. An ISDA Master Agreement is a bilateral agreement between the Fund and a counterparty that governs OTC derivatives and foreign exchange contracts, and typically contains, among other things, collateral posting terms and master netting provisions in the event of a default or termination. Under an ISDA Master Agreement, a party may, under certain circumstances, offset with the counterparty certain derivative financial instrument’s payables or receivables with collateral held or posted and create one single net payment. The provisions of the ISDA Master Agreement typically permit a single net payment in the event of default (close-out netting). These default events include bankruptcy or insolvency of the counterparty. Note, however, that bankruptcy or insolvency laws of a particular jurisdiction may impose restrictions on or prohibitions against the right of offset.
When entering into a derivative transaction, the Fund may be required to post and maintain collateral or margin (including both initial and maintenance margin). Collateral and margin requirements differ by type of derivative. Margin requirements are established by the broker or clearing house for exchange-traded and centrally cleared derivatives (financial futures contracts, options, and centrally cleared swaps). Brokers can ask for margining in excess of the clearing house’s minimum in certain circumstances. Collateral terms are contract specific for OTC derivatives (foreign currency exchange contracts, options, and swaps). For derivatives traded under an ISDA Master Agreement, the collateral requirements are typically calculated by netting the marked-to-market amount for each transaction under such agreement and comparing that amount to the value of any collateral currently pledged by the Fund and the counterparty. For financial reporting purposes, cash collateral that has been pledged to cover obligations of the Fund and cash collateral received from the counterparty, if any, are reported separately on the Statements of Assets and Liabilities as cash pledged as collateral and cash received as collateral, respectively. Non-cash collateral pledged by the Fund, if any, is noted in the Portfolio of Investments. To the extent amounts due to the Fund from its counterparties are not fully collateralized, contractually or otherwise, the Fund bears the risk of loss from counterparty non-performance.
Certain ISDA Master Agreements allow counterparties to OTC derivatives transactions to terminate derivative contracts prior to maturity in the event the Fund’s net assets decline by a stated percentage or the Fund fails to meet the terms of its ISDA Master Agreement, which would cause the Fund (counterparty) to accelerate payment of any net liability owed to the counterparty (Fund).
For financial reporting purposes, the Active Bond Fund does not offset derivative assets and derivative liabilities that are subject to netting arrangements in the Statements of Assets and Liabilities.
76
Notes to Financial Statements (Continued)
As of December 31, 2017, the Active Bond Fund’s assets and liabilities that were subject to a MNA on a gross basis were as follows:
| Assets | Liabilities | |||||||
| Derivative Financial Instruments: | ||||||||
| Futures Contracts | $ | 7,563 | $ | 14,649 | ||||
The following table presents the Active Bond Fund’s assets and liabilities net of amounts available for offset under a MNA and net of the related collateral pledged by the Fund as of December 31, 2017:
| Gross | ||||||||||||||||||||||
| Amount of | Gross Amount Available | Non-Cash | Cash | |||||||||||||||||||
| Recognized | for Offset in Statement of | Collateral | Collateral | Net | ||||||||||||||||||
| Counterparty | Derivative Type | Assets | Assets and Liabilities | Received | Received | Amount(A) | ||||||||||||||||
| Wells Fargo | Futures Contracts | $ | 7,563 | $ | (7,563 | ) | $ | — | $ | — | $ | — | ||||||||||
| Gross Amount of | Gross Amount Available | Non-Cash | Cash | |||||||||||||||||||
| Recognized | for Offset in Statement of | Collateral | Collateral | Net | ||||||||||||||||||
| Counterparty | Derivative Type | Liabilities | Assets and Liabilities | Pledged | Pledged | Amount(B) | ||||||||||||||||
| Wells Fargo | Futures Contracts | $ | 14,649 | $ | (7,563 | ) | $ | — | $ | (7,086 | ) | $ | — | |||||||||
| (A) | Net amount represents the net amount receivable from the counterparty in the event of default. |
| (B) | Net amount represents the net amount payable due to the counterparty in the event of default. |
The following table sets forth the fair value of the Active Bond Fund’s derivative financial instruments by primary risk exposure as of December 31, 2017:
| Fair Value of Derivative Investments |
| As of December 31, 2017 |
| Derivatives not accounted for as hedging | Asset | Liability | ||||||||
| Fund | instruments under ASC 815 | Derivatives | Derivatives | |||||||
| Active Bond Fund | Futures - Interest Rate Contracts* | $ | 7,563 | $ | 14,649 | |||||
| * | Statements of Assets and Liabilities Location: Payable for variation margin for futures contracts. Only current day’s variation margin is reported within the payables/receivable of the Statement of Assets and Liabilities. Includes cumulative appreciation/(depreciation) of futures contracts as reported on the Portfolio of Investments and within the components of net assets section of the Statement of Assets and Liabilities. |
The following table sets forth the effect of the Active Bond Fund’s derivative financial instruments by primary risk exposure on the Statements of Operations for the year ended December 31, 2017:
| The Effect of Derivative Investments on the Statements of Operations |
| for the Year Ended December 31, 2017 |
| Change in | ||||||||||
| Unrealized | ||||||||||
| Realized Gain | Appreciation | |||||||||
| Derivatives not accounted for as hedging | (Loss) | (Depreciation) | ||||||||
| Fund | instruments under ASC 815 | on Derivatives | on Derivatives | |||||||
| Active Bond Fund | Futures - Interest Rate Contracts* | $ | (67,967 | ) | $ | 8,141 | ||||
| * | Statements of Operations Location: Net realized losses on futures contracts and net change in unrealized appreciation (depreciation) on futures contracts. |
77
Notes to Financial Statements (Continued)
For the year ended December 31, 2017, the average quarterly notional value of outstanding derivative financial instruments was as follows:
| Active Bond | ||||
| Fund | ||||
| Interest rate contracts: | ||||
| Futures | $ | 3,310,045 | ||
Portfolio securities loaned — The Funds may lend their portfolio securities. Lending portfolio securities exposes the Funds to the risk that the borrower may fail to return the loaned securities or may not be able to provide additional collateral or that the Funds may experience delays in recovery of the loaned securities or loss of rights in the collateral if the borrower fails financially. To minimize these risks, the borrower must agree to maintain cash collateral with the Funds’ custodian. The loaned securities are secured by collateral valued at least equal, at all times, to the market value of the loaned securities plus accrued interest, if any. When the collateral falls below specified amounts the lending agent will use its best effort to obtain additional collateral on the next business day to meet required amounts under the security lending agreement. The cash collateral is reinvested by the Funds’ custodian into an approved short-term investment vehicle. The approved short-term investment vehicle is subject to market risk.
As of December 31, 2017, the following Funds loaned securities and received collateral as follows:
| Market | Market | |||||||||||||
| Value of | Value of | |||||||||||||
| Securities | Collateral | Net | ||||||||||||
| Fund | Security Type | Loaned* | Received** | Amount*** | ||||||||||
| Active Bond Fund | Corporate Bonds | $ | 37,195 | $ | 38,202 | $ | 1,007 | |||||||
| Focused Fund | Common Stocks | 1,063,405 | 1,080,974 | 17,569 | ||||||||||
| Aggressive ETF Fund | Exchange-Traded Funds | 44,692 | 45,880 | 1,188 | ||||||||||
| * | The remaining contractual maturity is overnight for all securities. |
| ** | Gross amount of recognized liabilities for securities lending is included in the Statements of Assets and Liabilities. |
| *** | Net amount represents the net amount payable due to the borrower in the event of default. |
All cash collateral is received, held, and administered by the Funds’ custodian for the benefit of the lending Fund in its custody account or other account established for the purpose of holding collateral in cash equivalents.
Funds participating in securities lending receive compensation in the form of fees. Securities lending income is derived from lending long securities from the Funds to creditworthy approved borrowers at rates that are determined based on daily trading volumes, float, short-term interest rates and market liquidity and is shown net of fees on the Statements of Operations. When a Fund lends securities, it retains the interest or dividends on the investment of any cash received as collateral, and the Fund continues to receive interest or dividends on the loaned securities.
Unrealized gain or loss on the market value of the loaned securities that may occur during the term of the loan is recognized by the Fund. The Fund has the right under the lending agreement to recover any loaned securities from the borrower on demand.
When-issued or delayed delivery transactions — Each Fund may purchase or sell securities on a when-issued or delayed delivery basis. These transactions involve a commitment by the Fund to purchase or sell securities for a predetermined price or yield, with payment and delivery taking place beyond the customary settlement period. When delayed delivery purchases are outstanding, the Fund will set aside liquid assets in an amount sufficient to meet the purchase price. When purchasing a security on a delayed delivery basis, the Fund assumes the rights and risks of ownership of the security, including the risk of price and yield fluctuations, and takes
78
Notes to Financial Statements (Continued)
such fluctuations into account when determining NAV. The Fund may dispose of or renegotiate a delayed delivery transaction after it is entered into, and may sell when-issued securities before they are delivered, which may result in a capital gain or loss. When the Fund has sold a security on a delayed delivery basis, the Fund does not participate in future gains and losses with respect to the security.
Share valuation — The NAV per share of each Fund is calculated daily by dividing the total value of a Fund’s assets, less liabilities, by its number of outstanding shares.
Investment income — Dividend income from securities is recognized on the ex-dividend date, net of foreign withholding taxes, if any, which are reduced by any amounts reclaimable by the Funds, where applicable. Interest income from securities is recorded on the basis of interest accrued, premium amortized and discount accreted. Realized gains and losses resulting from principal paydowns on mortgage-backed and asset-backed securities are included in interest income. Market discounts, original issue discount (“OID”) and market premiums on debt securities are accreted/amortized to interest income over the life of the security with a corresponding adjustment in the cost basis of that security.
Distributions to shareholders — Each Fund intends to distribute to its shareholders substantially all of its income and capital gains. Each Fund declares and distributes net investment income, if any, annually as a dividend to shareholders. Each Fund makes distributions of capital gains, if any, at least annually, net of applicable capital loss carryforwards. Income distributions and capital gain distributions are determined in accordance with income tax regulations. Recognition of the Funds’ net investment income from investments in underlying funds is affected by the timing of dividend declarations by the underlying funds.
Allocations — Expenses not directly billed to a Fund are allocated proportionally among all the Funds in the Trust, and, if applicable, Touchstone Funds Group Trust, Touchstone Institutional Funds Trust and Touchstone Strategic Trust (collectively with the Trust, “Touchstone Fund Complex”), daily in relation to net assets of each Fund or another reasonable measure.
Security transactions — Security transactions are reflected for financial reporting purposes as of the trade date. Realized gains and losses on sales of portfolio securities are calculated using the identified cost basis.
Estimates — The preparation of financial statements in conformity with U.S. GAAP requires management to make estimates and assumptions that affect the reported amounts of assets and liabilities and disclosure of contingent assets and liabilities at the date of the financial statements and the reported amounts of income and expenses during the reporting period. Actual results could differ from those estimates.
3. Investment Transactions
Investment transactions (excluding short-term investments and U.S. Government securities) were as follows for the year ended December 31, 2017:
| Active Bond | Balanced | Bond | Common Stock | |||||||||||||
| Fund | Fund | Fund | Fund | |||||||||||||
| Purchases of investment securities | $ | 17,810,851 | $ | 11,141,434 | $ | 12,295,732 | $ | 126,732,373 | ||||||||
| Proceeds from sales and maturities | $ | 23,971,047 | $ | 9,954,752 | $ | 8,853,419 | $ | 147,950,267 | ||||||||
| Large Cap | Small | |||||||||||||||
| Focused | Core Equity | Company | Aggressive | |||||||||||||
| Fund | Fund | Fund | ETF Fund | |||||||||||||
| Purchases of investment securities | $ | 7,520,770 | $ | 3,916,551 | $ | 43,700,123 | $ | 4,151,530 | ||||||||
| Proceeds from sales and maturities | $ | 14,074,008 | $ | 8,875,783 | $ | 49,001,017 | $ | 6,258,035 | ||||||||
79
Notes to Financial Statements (Continued)
| Conservative | Moderate | |||||||
| ETF Fund | ETF Fund | |||||||
| Purchases of investment securities | $ | 5,492,965 | $ | 4,971,214 | ||||
| Proceeds from sales and maturities | $ | 7,635,248 | $ | 8,854,328 | ||||
For the year ended December 31, 2017, purchases and proceeds from sales and maturities in U.S. Government Securities were $246,743,006 and $240,802,111, respectively, for the Active Bond Fund, $10,679,068 and $9,910,444, respectively, for the Balanced Fund, and $62,004,777 and $48,771,104, respectively, for the Bond Fund.
4. Transactions with Affiliates and Other Related Parties
Certain officers of the Trust are also officers of Touchstone Advisors, Inc. (the “Advisor”), Touchstone Securities, Inc. (the “Underwriter”), or The Bank of New York Mellon, the Sub-Administrator to the Funds and BNY Mellon Investment Servicing (U.S.) Inc., the Transfer Agent to the Funds (collectively referenced to herein as “BNY Mellon”). Such officers receive no compensation from the Trust. The Advisor and the Underwriter are each wholly-owned, indirect subsidiaries of Western & Southern.
On behalf of the Funds, the Advisor pays each Independent Trustee a quarterly retainer plus additional retainers to the Lead Independent Trustee and the chairs of each standing committee. Interested Trustees do not receive compensation from the Funds. Each Independent Trustee also receives compensation for each board meeting and committee meeting attended. Each standing committee chair receives additional compensation for each committee meeting that he or she oversees. The Advisor is reimbursed by the Funds for the Independent Trustees’ compensation and out-of-pocket expenses relating to their services. For the period January 1, 2017 through December 31, 2017, the Funds accrued Trustee-related expenses of $105,744, which are included in the Trustee and Compliance fees and expenses on the Statements of Operations. For the period January 1, 2017 through October 27, 2017, the Sentinel Variable Products Balanced Fund, Sentinel Variable Products Bond Fund, Sentinel Variable Products Common Stock Fund and Sentinel Variable Products Small Company Fund (the “Former Sentinel Funds”) incurred Director related expenses of $54,418 for the Directors of the Sentinel Variable Products Trust (the “Former Board of Directors”) which are included in the Trustee and Compliance fees and expenses on the Statements of Operations.
MANAGEMENT & EXPENSE LIMITATION AGREEMENTS
The Advisor provides general investment supervisory services for the Funds, under terms of an advisory agreement (the “Advisory Agreement”). Under the Advisory Agreement, each Fund pays the Advisor a fee, which is computed and accrued daily and paid monthly, at an annual rate based on average daily net assets of each Fund as shown in the table below.
| Active Bond Fund | 0.40% on the first $300 million |
| 0.35% on such assets over $300 million | |
| Balanced Fund | 0.55% on all assets |
| Bond Fund | 0.40% on all assets |
| Common Stock Fund | 0.50% on the first $200 million |
| Small Company Fund | 0.45% on the next $300 million |
| 0.40% on such assets over $500 million | |
| Focused Fund | 0.70% on the first $100 million |
| 0.65% on the next $400 million | |
| 0.60% on such assets over $500 million |
80
Notes to Financial Statements (Continued)
| Large Cap Core Equity Fund | 0.65% on the first $100 million |
| 0.60% on the next $100 million | |
| 0.55% on the next $100 million | |
| 0.50% on such assets over $300 million | |
| Aggressive ETF Fund | 0.25% on the first $50 million |
| Conservative ETF Fund | 0.23% on the next $50 million |
| Moderate ETF Fund | 0.20% on such assets over $100 million |
Prior to October 28, 2017, Sentinel Asset Management, Inc. (the “Former Advisor”), a subsidiary of NLV Financial Corp., served as the advisor to the Former Sentinel Funds. For its services, each of the Former Sentinel Funds paid the Former Advisor a monthly fee at an annual rate based on average daily net assets of each Fund as shown in the table above.
The Advisor has entered into investment sub-advisory agreements with the following parties (each, a “Sub-Advisor”):
| Fort Washington Investment Advisors, Inc.* | Wilshire Associates Incorporated |
| Active Bond Fund | Aggressive ETF Fund |
| Balanced Fund** | Conservative ETF Fund |
| Bond Fund** | Moderate ETF Fund |
| Common Stock Fund** | |
| Focused Fund | |
| Small Company Fund** | |
| The London Company | |
| Large Cap Core Equity Fund |
| * | Affiliate of the Advisor and wholly-owned indirect subsidiary of Western & Southern. |
| ** | Investment sub-advisory agreement effective October 28, 2017. |
The Advisor, not the Funds, pays sub-advisory fees to each Sub-Advisor.
The Advisor entered into an expense limitation agreement (the “Expense Limitation Agreement”) to contractually limit the annual operating expenses of the Funds, excluding: dividend and interest expenses relating to short sales; interest; taxes; brokerage commissions and other transaction costs; portfolio transaction and investment related expenses, including expenses associated with the Fund’s liquidity provider; other expenditures which are capitalized in accordance with U.S. GAAP; the cost of “Acquired Fund Fees and Expenses”, if any; and other extraordinary expenses not incurred in the ordinary course of business. The maximum annual operating expense limit in any year with respect to the Funds is based on a percentage of the average daily net assets of the Funds. The Advisor has agreed to separately waive advisory fees and administration fees, and to reimburse expenses in order to maintain the following expense limitations for the Funds:
| Fund | ||||
| Active Bond Fund | 0.97 | % | ||
| Balanced Fund* | 0.85 | % | ||
| Bond Fund* | 0.67 | % | ||
| Common Stock Fund* | 0.73 | % | ||
| Focused Fund | 1.21 | % | ||
| Large Cap Core Equity Fund | 1.06 | % | ||
| Small Company Fund* | 0.76 | % | ||
| Aggressive ETF Fund | 0.75 | % | ||
| Conservative ETF Fund | 0.75 | % | ||
| Moderate ETF Fund | 0.75 | % | ||
| * | Effective October 28, 2017. |
81
Notes to Financial Statements (Continued)
These expense limitations will remain in effect for all Funds through at least April 29, 2018, except for the Balanced Fund, Bond Fund, Common Stock Fund and Small Company Fund, which will remain in effect until at least October 27, 2019.
Prior to October 28, 2017, the Former Advisor had contractually agreed to waive fees and/or reimburse certain expenses in order to limit total annual fund operating expenses after fee waiver and/or expense reimbursement for the Balanced Fund on an annualized basis to 0.85%, of the average daily net assets. On October 28, 2017, this arrangement was terminated.
During the year ended December 31, 2017, the Advisor or its affiliates waived investment advisory fees, administration fees or shareholder servicing fees of the Funds as follows:
| Investment | Administration | Shareholder | ||||||||||||||
| Advisory | Fees | Servicing | ||||||||||||||
| Fund | Fees Waived | Waived | Fees Waived | Total | ||||||||||||
| Balanced Fund* | $ | 16,996 | $ | 4,577 | $ | — | $ | 21,573 | ||||||||
| Bond Fund* | 1,838 | 12,127 | — | 13,965 | ||||||||||||
| Large Cap Core Equity Fund | — | 30,024 | — | 30,024 | ||||||||||||
| Small Company Fund* | — | 538 | — | 538 | ||||||||||||
| Aggressive ETF Fund | — | 29,081 | — | 29,081 | ||||||||||||
| Conservative ETF Fund | — | 26,022 | 5,461 | 31,483 | ||||||||||||
| Moderate ETF Fund | — | 22,530 | — | 22,530 | ||||||||||||
| * | Fees waived from October 28, 2017 to December 31, 2017. |
For the period January 1, 2017 through October 27, 2017, the Former Advisor accrued investment advisory fees of the Former Sentinel Funds, which are included in the Investment advisory fees on the Statements of Operations as follows:
| Investment | ||||
| Advisory | ||||
| Fees | ||||
| Fund | Accrued | |||
| Balanced Fund | $ | 75,513 | ||
| Bond Fund | 158,878 | |||
| Common stock Fund | 633,608 | |||
| Small Company Fund | 277,288 | |||
For the period January 1, 2017 through October 27, 2017, the Former Advisor did not waive fees or reimburse expenses.
Under the terms of the Expense Limitation Agreement, the Advisor is entitled to recover, subject to approval by the Funds’ Board, such amounts waived or reimbursed for a period of up to three years from the date on which the Advisor reduced its compensation or assumed expenses for the Funds. No recoupment will occur unless a Fund’s operating expenses are below the expense limitation amount in effect at the time of the waiver or reimbursement and the Fund’s current expense limitation.
As of December 31, 2017, the Advisor may seek recoupment of previously waived fees and reimbursed expenses as follows:
| Expiration | Expiration | Expiration | ||||||||||||||
| December 31, | December 31, | December 31, | ||||||||||||||
| Fund | 2018 | 2019 | 2020 | Total | ||||||||||||
| Balanced Fund | $ | — | $ | — | $ | 21,573 | $ | 21,573 | ||||||||
| Bond Fund | — | — | 13,965 | 13,965 | ||||||||||||
| Focused Fund | 31,787 | — | — | 31,787 | ||||||||||||
| Large Cap Core Equity Fund | 29,291 | 30,423 | 30,024 | 89,738 | ||||||||||||
82
Notes to Financial Statements (Continued)
| Expiration | Expiration | Expiration | ||||||||||||||
| December 31, | December 31, | December 31, | ||||||||||||||
| Fund | 2018 | 2019 | 2020 | Total | ||||||||||||
| Small Company Fund | $ | — | $ | — | $ | 538 | $ | 538 | ||||||||
| Aggressive ETF Fund | 26,742 | 28,846 | 29,081 | 84,669 | ||||||||||||
| Conservative ETF Fund | 27,107 | 30,025 | 26,022 | 83,154 | ||||||||||||
| Moderate ETF Fund | 16,482 | 16,916 | 22,530 | 55,928 | ||||||||||||
For the year ended December 31, 2017, the Advisor recouped previously waived fees or reimbursed expenses from the Focused Fund of $24,625.
For the period January 1, 2017, through October 27, 2017, the Former Advisor did not recoup any amounts it previously waived or reimbursed for the Balanced Fund. Additionally, any amounts previously waived or reimbursed by the Former Advisor are no longer subject to recoupment.
ADMINISTRATION AGREEMENT
The Advisor entered into an Administration Agreement with the Trust, whereby the Advisor is responsible for: supplying executive and regulatory compliance services; supervising the preparation of tax returns; coordinating the preparation of reports to shareholders and reports to, and filings with, the SEC and state securities authorities, as well as materials for meetings of the Board; calculating the daily NAV per share; and maintaining the financial books and records of each Fund.
For its services, the Advisor’s annual administrative fee is:
0.145% on the first $20 billion of the aggregate average daily net assets;
0.11% on the next $10 billion of aggregate average daily net assets;
0.09% on the next $10 billion of aggregate average daily net assets; and
0.07% on the aggregate average daily net assets over $40 billion.
The fee is computed and allocated among the Touchstone Fund Complex (excluding Touchstone Institutional Funds Trust) on the basis of relative daily net assets.
The Advisor has engaged BNY Mellon as the Sub-Administrator to the Trust. BNY Mellon provides administrative and accounting services to the Trust and is compensated directly by the Advisor, not the Trust
Prior to October 28, 2017, Sentinel Administrative Services, Inc. (the “Former Administrator”), a wholly owned subsidiary of the Former Advisor, served as the Administrator to the Former Sentinel Funds. The Former Administrator provided the Former Sentinel Funds with certain transfer agency, fund accounting and financial administration services. For these services, the Former Sentinel Funds paid to the Former Administrator a fixed fee totaling $20,000 per year for transfer agency services and a fee of 0.10% of average daily net assets of the Former Sentinel Funds for fund accounting and administration services. During the period January 1, 2017, through October 27, 2017, the Former Administrator received the following fees, which are included in the Administration fees on the Statements of Operations:
| Fund | ||||
| Balanced Fund | $ | 13,730 | ||
| Bond Fund | 39,719 | |||
| Common stock Fund | 126,721 | |||
| Small Company Fund | 55,458 | |||
83
Notes to Financial Statements (Continued)
TRANSFER AGENT AGREEMENT
Under the terms of the Transfer Agent Agreement between the Trust and BNY Mellon, BNY Mellon maintains the records of each shareholder’s account, answers shareholders’ inquiries concerning their accounts, processes purchases and redemptions of each Fund’s shares, acts as dividend and distribution disbursing agent, and performs other shareholder service functions. For these services, BNY Mellon receives a monthly fee from each Fund. In addition, each Fund pays out-of-pocket expenses incurred by BNY Mellon, including, but not limited to, postage and supplies.
The Funds may reimburse the Advisor for fees paid to intermediaries such as banks, broker-dealers, financial advisors or other financial institutions for sub-transfer agency, sub-administration and other services provided to investors whose shares of record are held in omnibus, other group accounts, retirement plans or accounts traded through registered securities clearing agents. These fees may vary based on, for example, the nature of services provided, but generally range up to 0.15% of the assets of the class serviced or maintained by the intermediary or up to $22 per sub-account maintained by the intermediary.
Prior to October 28, 2017, the Former Administrator served as the Transfer Agent to the Former Sentinel Funds.
PLANS OF DISTRIBUTION
The Trust has adopted a Shareholder Services Plan under which shares of each Fund, except for the Balanced Fund, Bond Fund, Common Stock Fund and Small Company Fund, may directly or indirectly bear expenses for shareholder services provided. Each Fund will incur or reimburse expenses for shareholder services at an annual rate not to exceed 0.25% of the average daily net assets.
UNDERWRITING AGREEMENT
The Underwriter acts as exclusive agent for the distribution of the Funds’ shares. The Underwriter receives no compensation under this agreement.
Prior to October 28, 2017, Sentinel Financial Services Company (the “Former Underwriter”), a company in which the Former Advisor and Former Administrator were partners, acted as the principal underwriter of shares of the Former Sentinel Funds. The Former Underwriter received no compensation under this agreement.
INTERFUND TRANSACTIONS
The Funds may engage in purchase and sale transactions with funds that have a common investment advisor (or affiliated investment advisors), common Trustees and/or common Officers. During the year ended December 31, 2017, the Funds did not engage in any Rule 17a-7 transactions as defined under the 1940 Act.
5. Liquidity
Interfund lending —Pursuant to an Exemptive Order issued by the SEC on March 28, 2017, the Funds, along with certain other funds in the Touchstone Fund Complex, may participate in an interfund lending program. The interfund lending program provides an alternate credit facility that allows the Funds to lend to or borrow from other participating funds in the Touchstone Fund Complex, subject to the conditions of the Exemptive Order. The Funds may not borrow under the facility for leverage purposes and the loans’ duration may be no more than 7 days.
During the year ended December 31, 2017, the program was not utilized.
84
Notes to Financial Statements (Continued)
6. Federal Tax Information
Federal income tax — It is each Fund’s policy to continue to comply with the special provisions of the Internal Revenue Code applicable to regulated investment companies. As provided therein, in any fiscal year in which a Fund so qualifies and distributes at least 90% of its investment company taxable income, the Fund (but not the shareholders) will be relieved of federal income tax on the income distributed. It is each Fund’s policy to distribute all of its taxable income and accordingly, no provision for income taxes has been made.
The tax character of distributions paid for the years ended December 31, 2017 and 2016 is as follows:
| Active Bond | Balanced | Bond | ||||||||||||||||||||||
| Fund | Fund | Fund | ||||||||||||||||||||||
| 2017 | 2016 | 2017 | 2016 | 2017 | 2016 | |||||||||||||||||||
| From ordinary income | $ | 1,484,379 | $ | 1,153,828 | $ | — | $ | 215,074 | $ | — | $ | 1,007,643 | ||||||||||||
| From long-term capital gains | — | — | — | 234,823 | — | — | ||||||||||||||||||
| Return of Capital | — | — | — | 23,950 | — | 2,706 | ||||||||||||||||||
| Total distributions | $ | 1,484,379 | $ | 1,153,828 | $ | — | $ | 473,847 | $ | — | $ | 1,010,349 | ||||||||||||
| Common Stock | Focused | Large Cap | ||||||||||||||||||||||
| Fund | Fund | Core Equity Fund | ||||||||||||||||||||||
| 2017 | 2016 | 2017 | 2016 | 2017 | 2016 | |||||||||||||||||||
| From ordinary income | $ | 17,544 | $ | 2,612,001 | $ | 319,068 | $ | 430,606 | $ | 215,126 | $ | 266,434 | ||||||||||||
| From long-term capital gains | 944,237 | 12,124,363 | — | 10,814,833 | 490,437 | 3,215,261 | ||||||||||||||||||
| Total distributions | $ | 961,781 | $ | 14,736,364 | $ | 319,068 | $ | 11,245,439 | $ | 705,563 | $ | 3,481,695 | ||||||||||||
| Small | Aggressive | Conservative | Moderate | |||||||||||||||||||||||||||||
| Company Fund | ETF Fund | ETF Fund | ETF Fund | |||||||||||||||||||||||||||||
| 2017 | 2016 | 2017 | 2016 | 2017 | 2016 | 2017 | 2016 | |||||||||||||||||||||||||
| From ordinary income | $ | 193,590 | $ | 504,105 | $ | 351,189 | $ | 291,966 | $ | 492,618 | $ | 264,086 | $ | 608,441 | $ | 412,823 | ||||||||||||||||
| From long-term capital gains | 1,648,040 | 4,199,039 | — | — | 1,630,306 | 188,777 | 3,580,320 | 1,606,591 | ||||||||||||||||||||||||
| Total distributions | $ | 1,841,630 | $ | 4,703,144 | $ | 351,189 | $ | 291,966 | $ | 2,122,924 | $ | 452,863 | $ | 4,188,761 | $ | 2,019,414 | ||||||||||||||||
The following information is computed on a tax basis for each item as of December 31, 2017:
| Balanced | Bond | |||||||||||
| Active Bond Fund | Fund | Fund | ||||||||||
| Tax cost of portfolio investments | $ | 57,226,291 | �� | $ | 15,949,862 | $ | 47,207,179 | |||||
| Gross unrealized appreciation on investments | 706,837 | 1,842,520 | 424,224 | |||||||||
| Gross unrealized depreciation on investments | (434,554 | ) | (80,352 | ) | (299,016 | ) | ||||||
| Net unrealized appreciation (depreciation) on investments | 272,283 | 1,762,168 | 125,208 | |||||||||
| Gross unrealized appreciation on derivatives and foreign currency transactions | 9 | — | 3 | |||||||||
| Accumulated capital losses and other losses | (1,033,239 | ) | — | (2,658,807 | ) | |||||||
| Undistributed ordinary income | 1,215,720 | 249,569 | 1,019,953 | |||||||||
| Undistributed long-term capital gains | — | 4,675,761 | — | |||||||||
| Accumulated earnings (deficit) | $ | 454,773 | $ | 6,687,498 | $ | (1,513,643 | ) | |||||
85
Notes to Financial Statements (Continued)
| Common Stock | Focused | Large Cap | ||||||||||
| Fund | Fund | Core Equity Fund | ||||||||||
| Tax cost of portfolio investments | $ | 134,898,463 | $ | 50,544,771 | $ | 27,038,665 | ||||||
| Gross unrealized appreciation on investments | 24,822,038 | 14,208,608 | 7,270,800 | |||||||||
| Gross unrealized depreciation on investments | (1,185,866 | ) | (1,653,641 | ) | (271,963 | ) | ||||||
| Net unrealized appreciation (depreciation) on investments | 23,636,172 | 12,554,967 | 6,998,837 | |||||||||
| Net unrealized appreciation (depreciation) on foreign currency | — | (154 | ) | — | ||||||||
| Undistributed ordinary income | 3,054,818 | 272,619 | 258,516 | |||||||||
| Undistributed long-term capital gains | 75,197,220 | 1,170,443 | 816,434 | |||||||||
| Accumulated earnings (deficit) | $ | 101,888,210 | $ | 13,997,875 | $ | 8,073,787 | ||||||
| Small Company | Aggressive | Conservative | Moderate | |||||||||||||
| Fund | ETF Fund | ETF Fund | ETF Fund | |||||||||||||
| Tax cost of portfolio investments | $ | 54,452,288 | $ | 17,357,156 | $ | 15,295,743 | $ | 20,811,404 | ||||||||
| Gross unrealized appreciation on investments | 17,324,699 | 3,169,188 | 1,603,036 | 2,787,155 | ||||||||||||
| Gross unrealized depreciation on investments | (1,706,549 | ) | (28,338 | ) | (22,469 | ) | (67,127 | ) | ||||||||
| Net unrealized appreciation (depreciation) on investments | 15,618,150 | 3,140,850 | 1,580,567 | 2,720,028 | ||||||||||||
| Undistributed ordinary income | 1,585,442 | 587,404 | 566,839 | 712,191 | ||||||||||||
| Undistributed long-term capital gains | 6,171,747 | 268,635 | 45,000 | 317,080 | ||||||||||||
| Accumulated earnings (deficit) | $ | 23,375,339 | $ | 3,996,889 | $ | 2,192,406 | $ | 3,749,299 | ||||||||
The difference between the tax cost of portfolio investments and the financial statement cost is primarily due to wash sale loss deferrals.
As of December 31, 2017 the Funds had the following capital loss carryforwards for federal income tax purposes:
| No | No | |||||||||||
| Expiration | Expiration | |||||||||||
| Short Term | Long Term | Total | ||||||||||
| Active Bond Fund | $ | — | $ | 1,020,157 | $ | 1,020,157 | ||||||
| Bond Fund | 866,063 | 1,792,744 | 2,658,807 | |||||||||
The capital loss carryforwards may be utilized in future years to offset net realized capital gains, if any, prior to distributing such gains to shareholders.
During the year ended December 31, 2017, the following Funds utilized capital loss carryforwards:
| Fund | Utilized | |||
| Active Bond Fund | $ | 804,177 | ||
| Bond Fund | 12,689 | |||
| Focused Fund | 345,699 | |||
Under current laws, certain capital losses realized after October 31 and ordinary losses realized after December 31 may be deferred (and certain ordinary losses after October and/or December 31 may be deferred) and treated as occurring on the first day of the following fiscal year. For the year ended December 31, 2017, the Funds did not elect to defer any losses.
The Funds have analyzed their tax positions taken on federal income tax returns for all open tax years (tax years ended December 31, 2014 through 2017) and have concluded that no provision for income tax is required in their financial statements.
Certain reclassifications, the result of permanent differences between financial statement and income tax reporting requirements, have been made to the components of capital. These reclassifications have no impact on the net assets or NAV per share of the Funds. The following reclassifications, which are primarily attributed to the tax
86
Notes to Financial Statements (Continued)
treatment of foreign currency gains/losses, paydown gains/losses on mortgage-backed securities, reclassification of non-taxable and/or capital gain distribution, re-designation of dividends paid, short-term capital gains netted against operating loss, qualified late-year losses recognized, TIPS adjustments, non-taxable distributions from underlying investments, short-term capital gain distributions from underlying mutual funds, expiration of capital loss carry-forwards and prior year wash sale deferral have been made to the following Funds for the year ended December 31, 2017:
| Accumulated | Accumulated | |||||||||||
| Paid-In | Net Investment | Net Realized | ||||||||||
| Fund | Capital | Income(Loss) | Gains(Losses) | |||||||||
| Active Bond Fund | $ | — | $ | 45,801 | $ | (45,801 | ) | |||||
| Balanced Fund | 2 | 23,042 | (23,044 | ) | ||||||||
| Bond Fund | 2 | 142,206 | (142,208 | ) | ||||||||
| Common Stock Fund | — | 13,108 | (13,108 | ) | ||||||||
| Focused Fund | — | (976 | ) | 976 | ||||||||
| Small Company Fund | (402 | ) | 35,419 | (35,017 | ) | |||||||
| Aggressive ETF Fund | 2,296 | (6,619 | ) | 4,323 | ||||||||
| Conservative ETF Fund | — | (2,119 | ) | 2,119 | ||||||||
| Moderate ETF Fund | — | (5,247 | ) | 5,247 | ||||||||
7. Commitments and Contingencies
The Funds indemnify the Trust’s officers and Trustees for certain liabilities that might arise from their performance of their duties to the Funds. Additionally, in the normal course of business, the Funds enter into contracts that contain a variety of representations and warranties and which provide general indemnifications. The Funds’ maximum exposure under these arrangements is unknown, as this would involve future claims that may be made against the Funds.
8. Principal Risks
Risks Associated with Concentration — Certain Funds may invest a high percentage of their assets in specific sectors of the market in order to achieve a potentially greater investment return. As a result, these Funds may be more susceptible to economic, political, and regulatory developments in a particular sector of the market, positive or negative, and may experience increased volatility on the Funds’ NAVs and magnified effect on the total return.
Risks Associated with Credit — An issuer may be unable to make timely payments of either principal or interest. This may cause the issuer’s securities to decline in value. Credit risk is particularly relevant to those Funds that invest a significant amount of their assets in junk bonds or lower-rated securities.
Risks Associated with Interest Rate Changes — As interest rates rise, the value of fixed-income securities a Fund owns will likely decrease. The price of debt securities is generally linked to the prevailing market interest rates. In general, when interest rates rise, the price of debt securities falls, and when interest rates fall, the price of debt securities rises. The price volatility of a debt security also depends on its maturity. Longer-term securities are generally more volatile, so the longer the average maturity or duration of these securities, the greater their price risk. Duration is a measure of the expected life, taking into account any prepayment or call features of the security, that is used to determine the price sensitivity of the security for a given change in interest rates. Specifically, duration is the change in the value of a fixed-income security that will result from a 1% change in interest rates, and generally is stated in years. For example, as a general rule a 1% rise in interest rates means a 1% fall in value for every year of duration. Maturity, on the other hand, is the date on which a fixed-income security becomes due for payment of principal. The negative impact on fixed income securities if interest rates increase as a result could negatively impact a Fund’s NAV.
87
Notes to Financial Statements (Continued)
Please see the Funds’ prospectus for a complete discussion of these and other risks.
9. Reorganizations
The shareholders of the Former Sentinel Funds (the “Reorganizing Fund”), each a series of Sentinel Variable Products Trust, approved an Agreement and Plan of Reorganization providing for the transfer of all assets and liabilities of each Reorganizing Fund to the corresponding Touchstone Fund as noted below. The Balanced Fund, Bond Fund, Common Stock Fund and Small Company Fund, each a new series of the Trust, assumed the financial and performance history of the respective Reorganizing Fund. The tax-free mergers took place on October 27, 2017.
| Shares | ||||||||||
| Reorganizing Funds | Touchstone Funds | Net Assets | Outstanding | |||||||
| Sentinel Variable Products Balanced Fund | Balanced Fund | $ | 17,335,447 | 1,196,835 | ||||||
| Sentinel Variable Products Bond Fund | Bond Fund | 47,002,432 | 4,927,906 | |||||||
| Sentinel Variable Products Common Stock Fund | Common Stock Fund | 157,774,597 | 8,668,827 | |||||||
| Sentinel Variable Products Small Company Fund | Small Company Fund | 68,759,207 | 4,596,838 | |||||||
Pursuant to a Plan of Reorganization approved by the Sentinel Variable Products Trust Board of Directors on February 9, 2016, as of the close of business on June 17, 2016, Sentinel Variable Products Small Company Fund (“SVP Small Company Fund”) acquired 100% of the voting equity interests, substantially all of the assets and assumed substantially all of the liabilities of Sentinel Variable Products Mid Cap Fund (“SVP Mid Cap Fund”), in a tax-free reorganization in exchange for shares of the SVP Small Company Fund. The primary reason for the transaction was to combine a smaller Fund into a larger Fund with similar investment strategies and policies. For financial reporting purposes, the net assets received and shares issued by the SVP Small Company Fund were recorded at fair value; however, the SVP Mid Cap Fund’s cost of investments were carried forward to align ongoing reporting of the SVP Small Company Fund’s realized and unrealized gains and losses with amounts distributable to shareholders for tax purposes. The merger conversion ratios, number of shares and the value of shares issued by the SVP Small Company Fund is presented in the Statements of Changes in Net Assets and in the schedule below. Net assets and acquired unrealized appreciation (depreciation) as of the reorganization date were as follows:
| Total | ||||||||||||||||||
| Net Assets of | Acquired | |||||||||||||||||
| Total | Total | Acquiring Fund | Fund Unrealized | |||||||||||||||
| Net Assets of | Net Assets of | After the | Appreciation/ | |||||||||||||||
| Acquiring Fund | Acquired Fund | Acquiring Fund | Acquired Fund | Acquisition | (Depreciation) | |||||||||||||
| SVP Small Company Fund | SVP Mid Cap Fund | $ | 48,493,145 | $ | 15,219,310 | * | $ | 63,712,455 | $ | 859,684 | ||||||||
* The net assets of the SVP Mid Cap Fund were primarily comprised of investments with a fair value of $15,225,965 just prior to the reorganization.
The financial statements reflect the operations of the SVP Small Company Fund for the period prior to the acquisition and the combined fund for the period subsequent to the acquisition. Assuming the acquisition had been completed on January 1, 2016, the beginning of the fiscal annual reporting period of the SVP Small Company Fund, SVP Small Company Fund’s pro forma results of operations for the year ended December 31, 2016 are estimated as follows:
88
Notes to Financial Statements (Continued)
| Increase (Decrease) in Net Assets from Operations | ||||
| Net investment income (loss) | $ | 64,030 | ||
| Net realized gain (loss) on sales of investments and foreign currency transactions | 6,861,199 | |||
| Net change in unrealized appreciation (depreciation) | 4,858,082 | |||
| Net increase (decrease) in net assets from operations | $ | 11,783,311 | ||
Because the combined investment portfolios have been managed as a single integrated portfolio since the acquisition was completed, it is not practicable to separate the amounts of revenue and earnings of SVP Mid Cap Fund that have been included in the SVP Small Company Fund’s statement of operations since June 17, 2016.
10. Subsequent Events
Subsequent events occurring after the date of this report have been evaluated for potential impact to this report through the date the financial statements were issued. There were no subsequent events that necessitated recognition or disclosure in the Fund’s financial statements.
89
Report of Independent Registered Public Accounting Firm
To the Shareholders and the Board of Trustees of Touchstone Variable Series Trust
Opinion on the Financial Statements
We have audited the accompanying statements of assets and liabilities of Touchstone Variable Series Trust (the “Trust”) (comprising the Touchstone Active Bond Fund, Touchstone Balanced Fund, Touchstone Bond Fund, Touchstone Common Stock Fund, Touchstone Focused Fund, Touchstone Large Cap Core Equity Fund, Touchstone Small Company Fund, Touchstone Aggressive ETF Fund, Touchstone Conservative ETF Fund and Touchstone Moderate ETF Fund (collectively referred to as the “Funds”)), including the portfolios of investments, as of December 31, 2017, and the related statements of operations for the year then ended, the statements of changes in net assets for each of the two years in the period then ended and the financial highlights for each of the five years in the period then ended for Touchstone Active Bond Fund, Touchstone Focused Fund, Touchstone Large Cap Core Equity Fund, Touchstone Aggressive ETF Fund, Touchstone Conservative ETF Fund and Touchstone Moderate ETF Fund, the statements of changes in net assets and the financial highlights for the year ended December 31, 2017 for Touchstone Balanced Fund, Touchstone Bond Fund, Touchstone Common Stock Fund and Touchstone Small Company Fund, and the related notes (collectively referred to as the “financial statements”). In our opinion, the financial statements present fairly, in all material respects, the financial position of each of the Funds comprising Touchstone Variable Series Trust at December 31, 2017, the results of operations for the year then ended, the changes in net assets for each of the two years in the period then ended and the financial highlights for each of the five years in the period then ended for Touchstone Active Bond Fund, Touchstone Focused Fund, Touchstone Large Cap Core Equity Fund, Touchstone Aggressive ETF Fund, Touchstone Conservative ETF Fund and Touchstone Moderate ETF Fund, and the changes in net assets and the financial highlights for the year ended December 31, 2017 for Touchstone Balanced Fund, Touchstone Bond Fund, Touchstone Common Stock Fund and Touchstone Small Company Fund, in conformity with U.S. generally accepted accounting principles.
The financial statements and financial highlights of Touchstone Balanced Fund, Touchstone Bond Fund, Touchstone Common Stock Fund and Touchstone Small Company Fund for each of the periods presented through December 31, 2016 were audited by other auditors, whose report dated February 16, 2017 expressed an unqualified opinion on those financial statements and financial highlights.
Basis for Opinion
These financial statements are the responsibility of the Trust’s management. Our responsibility is to express an opinion on the Funds’ financial statements based on our audits. We are a public accounting firm registered with the Public Company Accounting Oversight Board (United States) (“PCAOB”) and are required to be independent with respect to the Trust in accordance with the U.S. federal securities laws and the applicable rules and regulations of the Securities and Exchange Commission and the PCAOB.
We conducted our audits in accordance with the standards of the PCAOB. Those standards require that we plan and perform the audit to obtain reasonable assurance about whether the financial statements are free of material misstatement, whether due to error or fraud. The Trust is not required to have, nor were we engaged to perform, an audit of the Trust’s internal control over financial reporting. As part of our audits, we are required to obtain an understanding of internal control over financial reporting, but not for the purpose of expressing an opinion on the effectiveness of the Trust’s internal control over financial reporting. Accordingly, we express no such opinion.
90
Report of Independent Registered Public Accounting Firm (Continued)
Our audits included performing procedures to assess the risks of material misstatement of the financial statements, whether due to error or fraud, and performing procedures that respond to those risks. Such procedures included examining, on a test basis, evidence regarding the amounts and disclosures in the financial statements. Our procedures included confirmation of securities owned as of December 31, 2017, by correspondence with the custodian, transfer agent and brokers or by other appropriate auditing procedures where replies from brokers were not received. Our audits also included evaluating the accounting principles used and significant estimates made by management, as well as evaluating the overall presentation of the financial statements. We believe that our audits provide a reasonable basis for our opinion.

We have served as the auditor of one or more Touchstone Investments’ investment companies since 1999.
Cincinnati, Ohio
February 16, 2018
91
Dividend Received Deduction
For corporate shareholders, the following ordinary distributions paid during the current fiscal year ended December 31, 2017 qualify for the corporate dividends received deduction. The Funds intend to pass through the maximum allowable percentage.
| Common Stock Fund | 89.45 | % | ||
| Focused Fund | 100.00 | % | ||
| Large Cap Core Equity Fund | 100.00 | % | ||
| Small Company Fund | 95.13 | % | ||
| Aggressive ETF Fund | 50.49 | % | ||
| Conservative ETF Fund | 18.75 | % | ||
| Moderate ETF Fund | 28.57 | % |
For the fiscal year ended December 31, 2017, the Funds designated long-term capital gains as follows:
| Balanced Fund | $ | 4,675,761 | ||
| Common Stock Fund | $ | 75,197,236 | ||
| Focused Fund | $ | 1,170,443 | ||
| Large Cap Core Equity Fund | $ | 816,452 | ||
| Small Company Fund | $ | 6,171,776 | ||
| Aggressive ETF Fund | $ | 268,635 | ||
| Conservative ETF Fund | $ | 1,630,306 | ||
| Moderate ETF Fund | $ | 3,580,320 |
Proxy Voting Guidelines
The Sub-Advisors are responsible for exercising the voting rights associated with the securities purchased and held by the Funds. A description of the policies and procedures that the Sub-Advisors use in fulfilling this responsibility is available as an appendix to the most recent Statement of Additional Information, which can be obtained without charge by calling toll free 1.800.543.0407 or by visiting the Touchstone website at TouchstoneInvestments.com or on the Securities and Exchange Commission’s (the Commission) website at sec.gov. Information regarding how those proxies were voted during the most recent twelve-month period ended June 30 is also available without charge by calling toll free 1.800.543.0407 or on the Commission’s website at sec.gov.
Quarterly Portfolio Disclosure
The Trust files a complete listing of portfolio holdings for each Fund as of the end of the first and third quarters of each fiscal year on Form N-Q. The complete listing (i) is available on the Commission’s website; (ii) may be reviewed and copied at the Commission’s Public Reference Room in Washington, DC; or (iii) will be made available to shareholders upon request by calling 1.800.543.0407. Information on the operation of the Public Reference Room may be obtained by calling 1.800.SEC.0330.
Schedule of Shareholder Expenses
As a shareholder of the Funds, you incur two types of costs: (1) transaction costs, including reinvested dividends or other distributions; and (2) ongoing costs, including investment advisory fees; shareholder servicing fees; and other Fund expenses. This example is intended to help you understand your ongoing costs (in dollars) of investing in the Funds and to compare these costs with the ongoing costs of investing in other mutual funds.
The example is based on an investment of $1,000 invested at the beginning of the period and held for the entire period (July 1, 2017 through December 31, 2017).
92
Other Items (Unaudited) (Continued)
Actual Expenses
The first line of the table below for each Fund provides information about actual account values and actual expenses. You may use the information in this line, together with the amount you invested, to estimate the expenses that you paid over the period. Simply divide your account value by $1,000 (for example, an $8,600 account value divided by $1,000 = 8.6), then multiply the result by the number in the first line under the heading entitled “Expenses Paid During the six months ended December 31, 2017” to estimate the expenses you paid on your account during this period.
Hypothetical Example for Comparison Purposes
The second line of the table below for each Fund provides information about hypothetical account values and hypothetical expenses based on the Funds’ actual expense ratio and an assumed rate of return of 5% per year before expenses, which is not the Funds’ actual return. The hypothetical account values and expenses may not be used to estimate the actual ending account balance or expenses you paid for the period. You may use this information to compare the ongoing costs of investing in the Funds and other funds. To do so, compare this 5% hypothetical example with the 5% hypothetical examples that appear in the shareholder reports of the other funds.
Please note that the expenses shown in the table below are meant to highlight your ongoing costs only and do not reflect any transactional costs, such as sales charges (loads), redemption fees, or exchange fees. Therefore, the second line of the table below for each Fund is useful in comparing ongoing costs only, and will not help you determine the relative total costs of owning different funds. In addition, if these transactional costs were included, your costs would have been higher.
| Expenses | ||||||||||||||||
| Net Expense | Beginning | Ending | Paid During | |||||||||||||
| Ratio | Account | Account | the Six Months | |||||||||||||
| Annualized | Value | Value | Ended | |||||||||||||
| December 31, | July 1, | December 31, | December 31, | |||||||||||||
| 2017 | 2017 | 2017 | 2017* | |||||||||||||
| Touchstone Active Bond Fund | ||||||||||||||||
| Actual | 0.88 | % | $ | 1,000.00 | $ | 1,011.31 | $ | 4.46 | ||||||||
| Hypothetical | 0.88 | % | $ | 1,000.00 | $ | 1,020.77 | $ | 4.48 | ||||||||
| Touchstone Balanced Fund | ||||||||||||||||
| Actual | 0.84 | % | $ | 1,000.00 | $ | 1,072.20 | $ | 4.39 | ||||||||
| Hypothetical | 0.84 | % | $ | 1,000.00 | $ | 1,020.97 | $ | 4.28 | ||||||||
| Touchstone Bond Fund | ||||||||||||||||
| Actual | 0.68 | % | $ | 1,000.00 | $ | 1,014.80 | $ | 3.45 | ||||||||
| Hypothetical | 0.68 | % | $ | 1,000.00 | $ | 1,021.78 | $ | 3.47 | ||||||||
| Touchstone Common Stock Fund | ||||||||||||||||
| Actual | 0.68 | % | $ | 1,000.00 | $ | 1,104.03 | $ | 3.61 | ||||||||
| Hypothetical | 0.68 | % | $ | 1,000.00 | $ | 1,021.78 | $ | 3.47 | ||||||||
| Touchstone Focused Fund | ||||||||||||||||
| Actual | 1.21 | % | $ | 1,000.00 | $ | 1,075.80 | $ | 6.33 | ||||||||
| Hypothetical | 1.21 | % | $ | 1,000.00 | $ | 1,019.11 | $ | 6.16 | ||||||||
| Touchstone Large Cap Core Equity Fund | ||||||||||||||||
| Actual | 1.06 | % | $ | 1,000.00 | $ | 1,126.17 | $ | 5.68 | ||||||||
| Hypothetical | 1.06 | % | $ | 1,000.00 | $ | 1,019.86 | $ | 5.40 | ||||||||
93
Other Items (Unaudited) (Continued)
| Expenses | ||||||||||||||||
| Net Expense | Beginning | Ending | Paid During | |||||||||||||
| Ratio | Account | Account | the Six Months | |||||||||||||
| Annualized | Value | Value | Ended | |||||||||||||
| December 31, | July 1, | December 31, | December 31, | |||||||||||||
| 2017 | 2017 | 2017 | 2017* | |||||||||||||
| Touchstone Small Company Fund | ||||||||||||||||
| Actual | 0.78 | % | $ | 1,000.00 | $ | 1,088.61 | $ | 4.11 | ||||||||
| Hypothetical | 0.78 | % | $ | 1,000.00 | $ | 1,021.27 | $ | 3.97 | ||||||||
| Touchstone Aggressive ETF Fund** | ||||||||||||||||
| Actual | 0.75 | % | $ | 1,000.00 | $ | 1,085.92 | $ | 3.94 | ||||||||
| Hypothetical | 0.75 | % | $ | 1,000.00 | $ | 1,021.42 | $ | 3.82 | ||||||||
| Touchstone Conservative ETF Fund** | ||||||||||||||||
| Actual | 0.75 | % | $ | 1,000.00 | $ | 1,047.29 | $ | 3.87 | ||||||||
| Hypothetical | 0.75 | % | $ | 1,000.00 | $ | 1,021.42 | $ | 3.82 | ||||||||
| Touchstone Moderate ETF Fund** | ||||||||||||||||
| Actual | 0.75 | % | $ | 1,000.00 | $ | 1,067.29 | $ | 3.91 | ||||||||
| Hypothetical | 0.75 | % | $ | 1,000.00 | $ | 1,021.42 | $ | 3.82 | ||||||||
* Expenses are equal to the Fund’s annualized expense ratio, multiplied by the average account value over the period, multiplied by 184/365 (to reflect one-half year period).
** The annualized expense ratio for the Fund does not include fees and expenses of the underlying funds in which the Fund invests.
Advisory and Sub-Advisory Agreement Approval Disclosure
At a meeting held on November 16, 2017, the Board of Trustees (the “Board” or “Trustees”) of the Touchstone Variable Series Trust (the “Trust”), and by a separate vote, the Independent Trustees of the Trust, approved the continuance of the Investment Advisory Agreement between the Trust and the Advisor with respect to the Touchstone Active Bond Fund, the Touchstone Focused Fund, the Touchstone Large Cap Core Equity Fund, the Touchstone Aggressive ETF Fund, the Touchstone Conservative ETF Fund, and the Touchstone Moderate ETF Fund (each, a “Fund” and together, the “Funds”), and the continuance of the Sub-Advisory Agreement between the Advisor and each Fund’s respective Sub-Advisor.
In determining whether to approve the continuation of the Investment Advisory Agreement and the Sub-Advisory Agreements, the Advisor furnished information necessary for a majority of the Independent Trustees to make the determination that the continuance of the Investment Advisory Agreement and each Sub-Advisory Agreement was in the best interests of the respective Funds and their shareholders. The information provided to the Board included: (1) industry data comparing advisory fees and total expense ratios of comparable funds; (2) comparative performance information; (3) the Advisor’s and its affiliates’ revenues and costs of providing services to the Funds; and (4) information about the Advisor’s and Sub-Advisors’ personnel. Prior to voting, the Independent Trustees reviewed the proposed continuance of the Investment Advisory Agreement and the Sub-Advisory Agreements with management and experienced independent legal counsel and received materials from such counsel discussing the legal standards for their consideration of the proposed continuation of the Investment Advisory Agreement and each Sub-Advisory Agreement. The Independent Trustees also reviewed the proposed continuation of the Investment Advisory Agreement and each Sub-Advisory Agreement with independent legal counsel in private sessions at which no representatives of management were present.
In approving the Funds’ Investment Advisory Agreement, the Board considered various factors, among them: (1) the nature, extent and quality of services provided to the Funds, including the personnel providing such services; (2) the Advisor’s compensation and profitability; (3) a comparison of fees and performance with comparable funds; (4) economies of scale; and (5) the terms of the Investment Advisory Agreement. The Board’s analysis of these factors is set forth below. The Independent Trustees were advised by independent legal counsel throughout the process.
94
Other Items (Unaudited) (Continued)
Nature, Extent and Quality of Advisor Services. The Board considered the level and depth of knowledge of the Advisor, including the professional experience and qualifications of senior personnel. In evaluating the quality of services provided by the Advisor, the Board took into account its familiarity with the Advisor’s senior management through Board meetings, discussions and reports during the preceding year. The Board also took into account the Advisor’s compliance policies and procedures. The quality of administrative and other services, including the Advisor’s role in coordinating the activities of the Funds’ other service providers, was also considered. The Board also considered the Advisor’s relationship with its affiliates and the resources available to them, as well as any potential conflicts of interest.
The Board discussed the Advisor’s effectiveness in monitoring the performance of each Sub-Advisor, including those that were affiliates of the Advisor, and the Advisor’s timeliness in responding to performance issues. The Board considered the Advisor’s process for monitoring each of the Sub-Advisors, which includes an examination of both qualitative and quantitative elements of the Sub-Advisor’s organization, personnel, procedures, investment discipline, infrastructure and performance. The Board considered that the Advisor conducts regular on-site compliance visits with each Sub-Advisor, during which the Advisor examines a wide variety of factors, such as the financial condition of the Sub-Advisor, the quality of the Sub-Advisor’s systems, the effectiveness of the Sub-Advisor’s disaster recovery programs, trade allocation and execution procedures, compliance with the Sub-Advisor’s policies and procedures, results of regulatory examinations and any other factors that might affect the quality of services that the Sub-Advisor provides to the applicable Fund(s). The Board noted that the Advisor’s compliance monitoring processes also include quarterly reviews of compliance reports, and that any issues arising from such reports and the Advisor’s compliance visits to the Sub-Advisors are reported to the Board.
The Trustees concluded that they were satisfied with the nature, extent and quality of services provided to each Fund by the Advisor under the Investment Advisory Agreement.
Advisor’s Compensation and Profitability. The Board took into consideration the financial condition and profitability of the Advisor and its affiliates (including the Sub-Advisor to certain of the Funds) and the direct and indirect benefits derived by the Advisor and its affiliates from the Advisor’s relationship with the Funds. The information considered by the Board included operating profit margin information for the Advisor’s business as a whole. The Board noted that the Advisor had waived a portion of advisory fees and administrative fees and/or reimbursed expenses in order to limit certain Funds’ net operating expenses. The Board also noted that the Advisor pays the Sub-Advisors’ sub-advisory fees out of the advisory fees the Advisor receives from the Funds. The Board reviewed the profitability of the Advisor’s relationship with the Funds both before and after tax expenses, and also considered whether the Advisor has the financial wherewithal to continue to provide services to the Funds, noting the ongoing commitment of the Advisor’s parent company with respect to providing support and resources as needed. The Board also noted that the Advisor derives benefits to its reputation and other benefits from its association with the Funds. The Board also considered that affiliates of the Advisor may benefit from certain indirect tax benefits, including those relating to dividend received deductions.
The Board recognized that the Advisor should be entitled to earn a reasonable level of profits in exchange for the level of services it provides to each Fund and the entrepreneurial risk that it assumes as Advisor. Based upon their review, the Trustees concluded that the Advisor’s and its affiliates’ level of profitability, if any, from their relationship with each Fund was reasonable and not excessive.
Expenses and Performance. The Board compared the respective advisory fees and total expense ratios for each of the Funds with various comparative data, including the median and average advisory fees and total expense ratios of each Fund’s respective peer group. The Board also considered, among other data, the Funds’ respective performance results during the six-month, twelve-month and thirty-six-month periods ended June 30, 2017 and noted that the Board reviews on a quarterly basis detailed information about each Fund’s performance
95
Other Items (Unaudited) (Continued)
results, portfolio composition and investment strategies. The Board also took into account current market conditions and their effect on the Funds’ performance.
The Board also considered the effect of each Fund’s growth and size on its performance and expenses. The Board noted that the Advisor had waived a portion of the fees and/or reimbursed expenses of certain Funds in order to reduce those Funds’ respective operating expenses to targeted levels. The Board noted that the sub-advisory fees under the Sub-Advisory Agreement with respect to each Fund were paid by the Advisor out of the advisory fees it receives from the Fund and considered the impact of such sub-advisory fees on the profitability of the Advisor. In reviewing the respective total expense ratios and performance of each of the Funds, the Board also took into account the nature, extent and quality of the services provided to the Funds by the Advisor and its affiliates.
The Board considered, among other data, the specific factors and related conclusions set forth below with respect to each Fund:
Touchstone Active Bond Fund. The Fund’s advisory fee and total expense ratio (net of applicable expense waivers and reimbursements) were below the median and above the median, respectively, of its peer group. The Board took into account management’s discussion of the Fund’s expenses, including the impact that the relatively small size of the Fund has upon expenses. The Fund’s performance for the six-month period ended June 30, 2017 was in the 3rd quintile of its peer group, and the Fund’s performance for the twelve- and thirty-six-month periods ended June 30, 2017 was in the 2nd quintile of its peer group. Based upon their review, the Trustees concluded that the Fund’s overall performance was satisfactory relative to the performance of funds with similar investment objectives and relevant indices, and that the advisory fee was reasonable in light of the services received by the Fund from the Advisor and the other factors considered.
Touchstone Focused Fund. The Fund’s advisory fee and total expense ratio (net of applicable expense waivers and reimbursements) were at the median and above the median, respectively, of its peer group. The Board took into account management’s discussion of the Fund’s expenses, including the impact that the relatively small size of the Fund has upon expenses. The Fund’s performance for the six- and twelve-month periods ended June 30, 2017 was in the 5th quintile of its peer group, and the Fund’s performance for the thirty-six-month period ended June 30, 2017 was in the 3rd quintile of its peer group. The Board noted management’s discussion of the Fund’s performance, including both its recent and long-term performance. Based upon their review, the Trustees concluded that the Fund’s overall performance was satisfactory relative to the performance of funds with similar investment objectives and relevant indices, and that the advisory fee was reasonable in light of the services received by the Fund from the Advisor and the other factors considered.
Touchstone Large Cap Core Equity Fund. The Fund’s advisory fee and total expense ratio (net of applicable expense waivers and reimbursements) were above the median of its peer group. The Board noted that the Advisor was currently waiving and/or reimbursing a portion of the Fund’s fees and/or expenses. The Fund’s performance for the six-month period ended June 30, 2017 was in the 3rd quintile of its peer group. The Fund’s performance for the twelve-month period ended June 30, 2017 was in the 2nd quintile of its peer group, and the Fund’s performance for the thirty-six-month period ended June 30, 2017 was in the 5th quintile of its peer group.
The Board took into account management’s discussion of the Fund’s performance, as well as a change to the Fund’s sub-advisor, which took effect in the fourth quarter 2015. Based upon their review, the Trustees concluded that the Fund’s overall performance was satisfactory relative to the performance of funds with similar investment objectives and relevant indices, and that the advisory fee was reasonable in light of the services received by the Fund from the Advisor and the other factors considered.
Touchstone Aggressive ETF Fund. The Fund’s advisory fee and total expense ratio (net of applicable expense waivers and reimbursements) were at the median and below the median, respectively, of its peer group. The Board noted that the Advisor was currently waiving and/or reimbursing a portion of the Fund’s fees and/or
96
Other Items (Unaudited) (Continued)
expenses. The Fund’s performance for the six- and twelve-month periods ended June 30, 2017 was in the 3rd quintile of its peer group. The Fund’s performance for the thirty-six-month period ended June 30, 2017 was in the 2nd quintile of its peer group. Based upon their review, the Trustees concluded that the Fund’s overall performance was satisfactory relative to the performance of funds with similar investment objectives and relevant indices and that the advisory fee was reasonable in light of the services received by the Fund from the Advisor and the other factors considered.
Touchstone Conservative ETF Fund. The Fund’s advisory fee and total expense ratio (net of applicable expense waivers and reimbursements) were above the median and below the median, respectively, of its peer group. The Board noted that the Advisor was currently waiving and/or reimbursing a portion of the Fund’s fees and/or expenses. The Fund’s performance for the six- and thirty-six-month periods ended June 30, 2017 was in the 2nd quintile of its peer group, and the Fund’s performance for the twelve-month period ended June 30, 2017 was in the 4th quintile of its peer group. The Board noted management’s discussion of the Fund’s performance, including both its recent and long-term performance. Based upon their review, the Trustees concluded that the Fund’s overall performance was satisfactory relative to the performance of funds with similar investment objectives and relevant indices, and that the advisory fee was reasonable in light of the services received by the Fund from the Advisor and the other factors considered.
Touchstone Moderate ETF Fund. The Fund’s advisory fee and total expense ratio (net of applicable expense waivers and reimbursements) were below the median of its peer group. The Board noted that the Advisor was currently waiving and/or reimbursing a portion of the Fund’s fees and/or expenses. The Fund’s performance for the six- and thirty-six-month periods ended June 30, 2017 was in the 2nd quintile of its peer group. The Fund’s performance for the twelve-month period ended June 30, 2017 was in the 4th quintile of its peer group. The Board noted management’s discussion of the Fund’s performance, including both its recent and long-term performance. Based upon their review, the Trustees concluded that the Fund’s overall performance was satisfactory relative to the performance of funds with similar investment objectives and relevant indices, and that the advisory fee was reasonable in light of the services received by the Fund from the Advisor and the other factors considered.
Economies of Scale. The Board considered the effect of each Fund’s current size and potential growth on its performance and expenses. The Board took into account management’s discussion of the Funds’ advisory fee structure. The Board considered the effective advisory fees under the Investment Advisory Agreement as a percentage of assets at different asset levels and possible economies of scale that might be realized if the assets of each Fund increase. The Board noted that the advisory fee schedules for the Funds contain breakpoints that would reduce the respective advisory fee rate on assets above specified levels as the respective Fund’s assets increased. The Board also noted that if a Fund’s assets increase over time, the Fund might realize other economies of scale if assets increase proportionally more than certain other expenses. The Board also considered the fact that, under the Investment Advisory Agreement, the advisory fee payable to the Advisor by a Fund was reduced by the total sub-advisory fee paid by the Advisor to the Fund’s Sub-Advisor.
Conclusion. In considering the renewal of the Funds’ Investment Advisory Agreement, the Board, including the Independent Trustees, did not identify any single factor as controlling, and each Trustee may have attributed different weights to the various factors. The Trustees evaluated all information available to them on a Fund-by-Fund basis, and their determinations were made separately with respect to each Fund. The Board reached the following conclusions regarding the Funds’ Investment Advisory Agreement with the Advisor, among others: (a) the Advisor demonstrated that it possesses the capability and resources to perform the duties required of it under the Investment Advisory Agreement; (b) the Advisor maintains an appropriate compliance program; (c) the overall performance of each Fund is satisfactory relative to the performance of funds with similar investment objectives and relevant indices; and (d) each Fund’s advisory fee is reasonable in light of the services received by the Fund from the Advisor and the other factors considered. Based on their conclusions, the Trustees determined
97
Other Items (Unaudited) (Continued)
with respect to each Fund that continuation of the Investment Advisory Agreement was in the best interests of the Fund and its shareholders.
In approving the applicable Funds’ respective Sub-Advisory Agreements, the Board considered various factors with respect to each Fund and the applicable Sub-Advisory Agreement, among them: (1) the nature, extent and quality of services provided to the Fund, including the personnel providing such services; (2) the Sub-Advisor’s compensation; (3) a comparison of the sub-advisory fee and performance with comparable funds; and (4) the terms of the Sub-Advisory Agreement. The Board’s analysis of these factors is set forth below. The Independent Trustees were advised by independent legal counsel throughout the process.
Nature, Extent and Quality of Services Provided; Investment Personnel. The Board considered information provided by the Advisor regarding the services provided by each Sub-Advisor, including information presented periodically throughout the previous year. The Board noted the affiliation of the Sub-Advisor to certain of the Funds with the Advisor, noting any potential conflicts of interest. The Board also noted that, on a periodic basis, the Board meets with portfolio managers of the Sub-Advisors to discuss their respective performance and investment processes and strategies. The Board considered each Sub-Advisor’s level of knowledge and investment style. The Board reviewed the experience and credentials of the applicable investment personnel who are responsible for managing the investment of portfolio securities with respect to the Funds.
Sub-Advisor’s Compensation, Profitability and Economies of Scale. The Board also took into consideration the financial condition of each Sub-Advisor and any indirect benefits derived by each Sub-Advisor and its affiliates from the Sub-Advisor’s relationship with the Funds. In considering the profitability to each Sub-Advisor of its relationship with the Funds, the Board noted the undertaking of the Advisor to maintain expense limitations for the Funds and also noted that the sub-advisory fees under the Sub-Advisory Agreements were paid by the Advisor out of the advisory fees that it receives under the Investment Advisory Agreement and in addition, with respect to the unaffiliated Sub-Advisors, are negotiated at arm’s length. As a consequence, the profitability to each Sub-Advisor of its relationship with a Fund was not a substantial factor in the Board’s deliberations. For similar reasons, the Board did not consider the potential economies of scale in each Sub-Advisor’s management of the applicable Fund to be a substantial factor in its consideration, although the Board noted that the sub-advisory fee schedule for the Funds contained breakpoints that would reduce the sub-advisory fee rate on assets above specified levels as the applicable Fund’s assets increased.
Sub-Advisory Fees and Fund Performance. The Board considered that each Fund pays an advisory fee to the Advisor and that the Advisor pays the sub-advisory fee to the Sub-Advisor out of the advisory fee it receives from the respective Fund. The Board also compared the sub-advisory fees paid by the Advisor to fees charged by each Sub-Advisor to manage comparable institutional separate accounts, as applicable. The Board considered the amount retained by the Advisor and the sub-advisory fee paid to each Sub-Advisor with respect to the various services provided by the Advisor and the Sub-Advisor. The Board also noted that the Advisor negotiated the sub-advisory fee with each of the unaffiliated Sub-Advisors at arm’s length. The Board reviewed the sub-advisory fee for each Fund in relation to various comparative data, including the median and average sub-advisory fees of each Fund’s peer group, and considered the following information:
Touchstone Active Bond Fund. The Fund’s sub-advisory fee was above the median of its peer group. Based upon their review, the Trustees concluded that the sub-advisory fee was reasonable in light of the services received by the Fund from the Sub-Advisor and the other factors considered.
Touchstone Focused Fund. The Fund’s sub-advisory fee was above the median of its peer group. Based upon their review, the Trustees concluded that the sub-advisory fee was reasonable in light of the services received by the Fund from the Sub-Advisor and the other factors considered.
98
Other Items (Unaudited) (Continued)
Touchstone Large Cap Core Equity Fund. The Fund’s sub-advisory fee was above the median of its peer group. Based upon their review, the Trustees concluded that the sub-advisory fee was reasonable in light of the services received by the Fund from the Sub-Advisor and the other factors considered.
Touchstone Aggressive ETF Fund. The Fund’s sub-advisory fee was at the median of its peer group. Based upon their review, the Trustees concluded that the sub-advisory fee was reasonable in light of the services received by the Fund from the Sub-Advisor and the other factors considered.
Touchstone Conservative ETF Fund. The Fund’s sub-advisory fee was below the median of its peer group. Based upon their review, the Trustees concluded that the sub-advisory fee was reasonable in light of the services received by the Fund from the Sub-Advisor and the other factors considered.
Touchstone Moderate ETF Fund. The Fund’s sub-advisory fee was below the median of its peer group. Based upon their review, the Trustees concluded that the sub-advisory fee was reasonable in light of the services received by the Fund from the Sub-Advisor and the other factors considered.
As noted above, the Board considered each Fund’s performance during the six-month, twelve-month and thirty-six-month periods ended June 30, 2017 as compared to each Fund’s peer group and noted that the Board reviews on a quarterly basis detailed information about each Fund’s performance results, portfolio composition and investment strategies. The Board noted the Advisor’s expertise and resources in monitoring the performance, investment style and risk-adjusted performance of each Sub-Advisor. The Board was mindful of the Advisor’s ongoing monitoring of each Sub-Advisor’s performance and the measures undertaken by the Advisor to address any underperformance.
Conclusion. In considering the renewal of the Sub-Advisory Agreement with respect to each applicable Fund, the Board, including the Independent Trustees, did not identify any single factor as controlling, and each Trustee may have attributed different weights to the various factors. The Board reached the following conclusions regarding each Sub-Advisory Agreement, among others: (a) the Sub-Advisor is qualified to manage each Fund’s assets in accordance with the Fund’s investment goals and policies; (b) the Sub-Advisor maintains an appropriate compliance program; (c) the overall performance of each Fund is satisfactory relative to the performance of funds with similar investment objectives and relevant indices; (d) each Fund’s sub-advisory fee is reasonable in light of the services received by the Fund from the Sub-Advisor and the other factors considered; and (e) the Sub-Advisor’s investment strategies are appropriate for pursuing the investment goals of each Fund. Based on its conclusions, the Board determined that approval of the Sub-Advisory Agreement with respect to each applicable Fund was in the best interests of the Fund and its shareholders.
Advisory and Sub-Advisory Agreement Approval Disclosure
At a meeting held on April 18, 2017, the Board of Trustees (the “Board” or “Trustees”) of the Touchstone Variable Series Trust (the “Trust”), and by a separate vote, the Independent Trustees of the Trust, approved an amendment to the Investment Advisory Agreement between the Trust and the Advisor adding each Fund and also initially approved Sub-Advisory Agreements between the Advisor and Fort Washington Investment Advisors, Inc. (“FWIA” or the “Sub-Advisor”) with respect to the Touchstone Balanced Fund, Touchstone Bond Fund, Touchstone Common Stock Fund and Touchstone Small Company Fund (each a “Fund” and together the “Funds”).
In determining whether to approve the amendment to the Investment Advisory Agreement and the Sub-Advisory Agreements, the Advisor and the Sub-Advisor furnished information necessary for a majority of the Independent Trustees to make the determination that approval of the amendment to the Investment Advisory Agreement and the Sub-Advisory Agreements was in the best interests of the respective Funds and their shareholders. The information provided to the Board included: (1) a comparison of the Funds’ proposed advisory fee and other
99
Other Items (Unaudited) (Continued)
fees and anticipated total expense ratios with those of comparable funds; (2) performance information for investment strategies comparable to those to be used in managing the Funds; (3) the Advisor’s and its affiliates’ estimated revenues and costs of providing services to the Funds; and (4) information about the Advisor’s and Sub-Advisor’s personnel. Prior to voting, the Independent Trustees reviewed the proposed approval of the amendment to the Investment Advisory Agreement and the Sub-Advisory Agreements with management and with experienced independent legal counsel and received materials from such counsel discussing the legal standards for their consideration of the Investment Advisory Agreement and the Sub-Advisory Agreements with respect to the Funds. The Independent Trustees also reviewed the proposed approval of the amendment to the Investment Advisory Agreement and the Sub-Advisory Agreements with independent legal counsel in a private session at which no representatives of management were present.
In approving the amendment to the Investment Advisory Agreement, the Board considered various factors, among them: (1) the nature, extent and quality of services to be provided to the Funds, including the personnel who would be providing such services; (2) the Advisor’s anticipated compensation and profitability; (3) a comparison of total expenses and performance of comparable funds and relevant indexes; (4) anticipated economies of scale; and (5) the terms of the Investment Advisory Agreement. The Board’s analysis of these factors is set forth below. The Independent Trustees were advised by independent legal counsel throughout the process.
Nature, Extent and Quality of Advisor Services. The Board considered the level and depth of knowledge of the Advisor, including the professional experience and qualifications of senior personnel. In evaluating the quality of services to be provided by the Advisor, the Board took into account its familiarity with the Advisor’s senior management through Board meetings, discussions and reports during the preceding year. The Board also took into account the Advisor’s compliance policies and procedures. The quality of administrative and other services provided to other funds managed by the Advisor, including the Advisor’s role in coordinating the activities of those funds’ other service providers, was also considered. The Board also considered the Advisor’s relationship with its affiliates and the resources available to them, as well as any potential conflicts of interest. The Board discussed the Advisor’s effectiveness in monitoring the performance of the Trust’s other sub-advisors, and the Advisor’s timeliness in responding to performance issues. The Board considered the Advisor’s process for monitoring the Sub-Advisor, which would include an examination of both qualitative and quantitative elements of the Sub-Advisor’s organization, personnel, procedures, investment discipline, infrastructure and performance. The Board considered that the Advisor would conduct regular on-site compliance visits with the Sub-Advisor, during which the Advisor would examine a wide variety of factors, such as the financial condition of the Sub-Advisor, the quality of the Sub-Advisor’s systems, the effectiveness of the Sub-Advisor’s disaster recovery programs, trade allocation and execution procedures, compliance with the Sub-Advisor’s policies and procedures, results of regulatory examinations and any other factors that might affect the quality of services that the Sub-Advisor would provide to the Funds. The Board noted that the Advisor’s compliance monitoring processes also would include quarterly reviews of compliance reports, and that any issues arising from such reports and the Advisor’s compliance visits to the Sub-Advisor would be reported to the Board.
The Trustees concluded that they were satisfied with the nature, extent and quality of services provided to each Fund by the Advisor under the Investment Advisory Agreement.
Advisor’s Compensation and Profitability. The Board took into consideration the financial condition and anticipated profitability of the Advisor and its affiliates (including the Sub-Advisor) and the direct and indirect benefits to be derived by the Advisor and its affiliates from the Advisor’s relationship with the Funds. The Board noted that the Advisor had contractually agreed to waive advisory fees and administrative fees and/or reimburse expenses in order to limit the Funds’ net operating expenses and would pay sub-advisory fees out of the advisory fees the Advisor would receive from the Funds. The Board reviewed the anticipated profitability of the Advisor’s relationship with the Funds and also considered whether the Advisor has the financial wherewithal to provide a high level of services to the Funds, noting the ongoing commitment of the Advisor’s parent company with
100
Other Items (Unaudited) (Continued)
respect to providing support and resources as needed. The Board also noted that the Advisor would derive benefits to its reputation and other benefits from its association with the Funds.
The Board recognized that the Advisor should be entitled to earn a reasonable level of profits in exchange for the level of services it would provide to each Fund and the entrepreneurial risk that it would assume as Advisor. Based upon their review, the Trustees concluded that the Advisor’s and its affiliates’ level of profitability, if any, to be derived from their relationship with each Fund was reasonable and not excessive.
Expenses and Performance. The Board compared each Fund’s proposed advisory fees and total expense ratios with those of comparable funds. The Board took into account the Funds’ estimated total expenses after estimated waivers and reimbursements. The Board also took into account that the Advisor had contractually agreed to limit the Funds’ net operating expenses for a period of time following the launch of the Funds.
The Board also considered the effect of each Fund’s potential growth and size on its performance and expenses. The Board noted that the Advisor had agreed to waive a portion of its fees and/or reimburse expenses of the Funds in order to reduce each Fund’s operating expenses to targeted levels. The Board noted that the sub-advisory fees under the Sub-Advisory Agreement with respect to each Fund would be paid by the Advisor out of the advisory fee it would receive from the Fund and considered the impact of such sub-advisory fees on the profitability of the Advisor. In reviewing the proposed total expense ratios and performance of the Funds, the Board also took into account the nature, extent and quality of the services to be provided to the Funds by the Advisor and its affiliates.
The Board considered, among other data, the specific factors set forth below with respect to each Fund:
Touchstone Balanced Fund. The Fund’s proposed advisory fee and total expense ratio (net of applicable expense waivers and reimbursements) were below the median and at the median, respectively, of its peer group. The Board took into account the performance of the two investment strategies the Sub-Advisor proposed to use in combination to manage the Fund relative to its peer group and blended index.
Touchstone Bond Fund. The Fund’s proposed advisory fee and total expense ratio (net of applicable expense waivers and reimbursements) were below the median and above the median, respectively, of its peer group. The Board took into account the performance of the investment strategy the Sub-Advisor proposed to use to manage the Fund relative to its peer group and index. The Board also considered the investment performance of another Touchstone Fund that the Sub-Advisor managed using the same investment strategy to the one proposed to be used for the Fund.
Touchstone Common Stock Fund. The Fund’s proposed advisory fee and total expense ratio (net of applicable expense waivers and reimbursements) were both below the median of its peer group. The Board took into account the performance of the investment strategy the Sub-Advisor proposed to use to manage the Fund relative to its peer group and index. The Board also considered the investment performance of other Touchstone Funds that the Sub-Advisor managed using similar investment strategies to the one proposed to be used for the Fund.
Touchstone Small Company Fund. The Fund’s proposed advisory and total expense ratio (net of applicable expense waivers and reimbursements) were both below the median of its peer group. The Board took into account that the SVP Small Company Fund ( “Small Company”), a series of Sentinel Variable Products Trust, was expected to be merged into the Fund during the fourth quarter of 2017. Accordingly, the Board considered the performance of the retail version of Small Company relative to its peer group and index. The Board took into account that members of Small Company’s portfolio management team were expected to manage the Fund after the merger. In addition, the Board took into consideration certain differences between how Small Company is managed and how the Fund would be managed as well as the impact these differences were expected to have on the Fund’s performance.
101
Other Items (Unaudited) (Continued)
Economies of Scale. The Board considered the effect of each Fund’s potential growth and size on its performance and expenses. The Board took into account management’s discussion of the Funds’ advisory fee structure. The Board considered the proposed advisory fees under the Investment Advisory Agreement as a percentage of assets at different asset levels and possible economies of scale that might be realized if the assets of each Fund increase. The Board noted that the proposed advisory fee schedule for two of the Funds contained breakpoints that would reduce the advisory fee rate on assets above specified levels as each Fund’s assets increased and considered the necessity of adding breakpoints with respect to the two Funds that did not have such breakpoints in their proposed advisory fee schedules. The Board determined that adding breakpoints at specified levels to the advisory fee schedules of the two Funds that currently did not have such breakpoints was not appropriate at that time. The Board also noted that if a Fund’s assets increase over time, the Fund might realize other economies of scale if assets increase proportionally more than certain other expenses. The Board also considered the fact that, under the Investment Advisory Agreement, the advisory fee payable to the Advisor by a Fund would be reduced by the total sub-advisory fee paid by the Advisor to the Fund’s Sub-Advisor.
Conclusion. In considering the approval of the amendment to the Investment Advisory Agreement, the Board, including the Independent Trustees, did not identify any single factor as controlling, and each Trustee may have attributed different weights to the various factors. The Trustees evaluated all information available to them on a Fund-by-Fund basis, and their determinations were made separately with respect to each Fund. The Board reached the following conclusions regarding the Investment Advisory Agreement with the Advisor, among others: (a) the Advisor demonstrated that it possesses the capability and resources to perform the duties required of it under the Investment Advisory Agreement; (b) the Advisor maintains an appropriate compliance program; and (c) each Fund’s proposed advisory fee is reasonable relative to those of similar funds and the services to be provided by the Advisor. Based on their conclusions, the Trustees determined with respect to each Fund that approval of the amendment to the Investment Advisory Agreement was in the best interests of the Fund and its shareholders.
In initially approving the Sub-Advisory Agreements for the Funds, the Board considered various factors with respect to each Fund and the applicable Sub-Advisory Agreement, among them: (1) the nature, extent and quality of services to be provided to the Fund, including the personnel who would be providing such services; (2) the Sub-Advisor’s proposed compensation; (3) a comparison of the performance of comparable funds and relevant indexes; and (4) the terms of the Sub-Advisory Agreement. The Board’s analysis of these factors is set forth below. The Independent Trustees were advised by independent legal counsel throughout the process.
Nature, Extent and Quality of Services Provided; Investment Personnel. The Board considered information provided by the Advisor and the Sub-Advisor regarding the services to be provided by the Sub-Advisor. The Board took into account the affiliation of the Sub-Advisor with the Advisor, noting any potential conflicts of interest. The Board also considered the Sub-Advisor’s level of knowledge and investment style. The Board reviewed the experience and credentials of the applicable investment personnel who would be responsible for managing the investment of portfolio securities with respect to the Funds. In evaluating the quality of services to be provided by the Sub-Advisor, the Board took into account its familiarity with the Sub-Advisor’s personnel through Board meetings, discussions and reports. The Board also took into account the Sub-Advisor’s compliance policies and procedures. The Board also considered the Sub-Advisor’s regulatory and compliance history.
Sub-Advisor’s Compensation. The Board also took into consideration the financial condition of the Sub-Advisor and any indirect benefits to be derived by the Sub-Advisor and its affiliates from the Sub-Advisor’s relationship with the Funds. In considering the anticipated profitability to the Sub-Advisor and its affiliates, the Board noted the proposed contractual undertaking of the Advisor to maintain expense limitations for the Funds and also noted that the sub-advisory fees under the Sub-Advisory Agreements would be paid by the Advisor out of the advisory fees that it would receive under the Investment Advisory Agreement. In addition, the Board
102
Other Items (Unaudited) (Continued)
noted that the sub-advisory fee schedule for two of the Funds contained breakpoints that would reduce the sub-advisory fee rate on assets above specified levels if the Fund’s assets increased.
Sub-Advisory Fees and Fund Performance. The Board considered that each Fund would pay an advisory fee to the Advisor and that the Advisor would pay a sub-advisory fee to the Sub-Advisor out of the advisory fee it would receive from the respective Fund. The Board considered the amount to be retained by the Advisor and the sub-advisory fee to be paid to the Sub-Advisor with respect to the various services to be provided by the Advisor and the Sub-Advisor. The Board compared the proposed sub-advisory fees to be paid by the Advisor to the Sub-Advisor for managing each Fund to the sub-advisory fees paid by the Advisor to the Sub-Advisor for managing other Touchstone Funds. Based on their review, the Trustees concluded that each Fund’s proposed sub-advisory fee was reasonable in light of the quality of services to be provided by the Sub-Advisor to the Fund and the other factors considered.
As noted above, the Board considered the long-term performance of the investment strategies the Sub-Advisor proposed to use in managing the Funds relative to that of comparable funds and relevant indexes. The Board also noted the Advisor’s expertise and resources in monitoring the performance, investment style and risk-adjusted performance of the Trust’s other sub-advisors. The Board was mindful of the Advisor’s focus on the performance of sub-advisors and the Advisor’s ways of addressing underperformance.
Conclusion. In considering the initial approval of the applicable Sub-Advisory Agreement with respect to each Fund, the Board, including the Independent Trustees, did not identify any single factor as controlling, and each Trustee may have attributed different weights to the various factors. The Board reached the following conclusions regarding each Fund’s Sub-Advisory Agreement, among others: (a) the Sub-Advisor is qualified to manage the Fund’s assets in accordance with the Fund’s investment goals and policies; (b) the Sub-Advisor maintains an appropriate compliance program; (c) the Fund’s proposed advisory and sub-advisory fee structure is reasonable relative to those of similar funds and to the services to be provided by the Advisor and the Sub-Advisor; and (d) the Sub-Advisor’s proposed investment strategies are appropriate for pursuing the investment goals of the Fund. Based on its conclusions, the Board determined that approval of the applicable Sub-Advisory Agreement with respect to each Fund was in the best interests of the Fund and its shareholders.
103
Management of the Trust (Unaudited)
Listed below is required information regarding the Trustees and principal officers of the Trust. The Trust’s Statement of Additional Information includes additional information about the Trustees and is available, without charge, upon request by calling 1.800.543.0407 or by visiting the Touchstone website at TouchstoneInvestments.com.
Interested Trustees1:
| Number | ||||||||||
| of Funds | ||||||||||
| Overseen | ||||||||||
| Term of | in the | |||||||||
| Name | Position | Office And | Touchstone | Other | ||||||
| Address | Held with | Length of | Principal Occupation(s) | Fund | Directorships | |||||
| Year of Birth | Trust | Time Served | During Past 5 Years | Complex2 | Held During the Past 5 Years3 | |||||
Jill T. McGruder Touchstone Advisors, Inc. 303 Broadway Suite 1100 Cincinnati, Ohio 45202 Year of Birth: 1955 | Trustee and President | Until retirement at age 75 or until she resigns or is removed Trustee since 1999 | President and CEO of IFS Financial Services, Inc. (a holding company). | 49 | IFS Financial Services, Inc. (a holding company) from 1999 to the present; Integrity and National Integrity Life Insurance Co. from 2005 to the present; Touchstone Securities (the Trust’s distributor) from 1999 to the present; Touchstone Advisors, Inc. (the Trust’s investment advisor and administrator) from 1999 to the present; W&S Brokerage Services (a brokerage company) from 1999 to the present; W&S Financial Group Distributors (a distribution company) from 1999 to the present; Cincinnati Analysts, Inc. from 2012 to the present; Columbus Life Insurance Co. from 2016 to the present; The Lafayette Life Insurance Co. from 2016 to the present; Taft Museum of Art from 2007 to the present; YWCA of Greater Cincinnati from 2012 to the present; and LL Global, Inc. from 2016 to the present. | |||||
| Independent Trustees: | ||||||||||
Phillip R. Cox c/o Touchstone Advisors, Inc. 303 Broadway Suite 1100 Cincinnati, Ohio 45202 Year of Birth: 1947 | Trustee | Until retirement at age 75 or until he resigns or is removed Trustee since 1999 | President and Chief Executive Officer of Cox Financial Corp. (a financial services company) from 1971 to the present. | 49 | Director of Cincinnati Bell (a communications company) from 1994 to the present; Bethesda Inc. (a hospital) from 2005 to the present; Timken Co. (a manufacturing company) from 2004 to 2014; TimkenSteel from 2014 to the present; Diebold, Inc. (a technology solutions company) from 2004 to the present; and Ohio Business Alliance for Higher Education and the Economy from 2005 to the present. | |||||
William C. Gale c/o Touchstone Advisors, Inc. 303 Broadway Suite 1100 Cincinnati, Ohio 45202 Year of Birth: 1952 | Trustee | Until retirement at age 75 or until he resigns or is removed Trustee since 2013 | Retired; formerly Senior Vice President and Chief Financial Officer (from 2003 to January 2015) of Cintas Corporation (a business services company). | 49 | None. | |||||
104
Management of the Trust (Unaudited) (Continued)
Independent Trustees (Continued):
| Number | ||||||||||
| of Funds | ||||||||||
| Overseen | ||||||||||
| Term of | in the | |||||||||
| Name | Position | Office And | Touchstone | Other | ||||||
| Address | Held with | Length of | Principal Occupation(s) | Fund | Directorships | |||||
| Year of Birth | Trust | Time Served | During Past 5 Years | Complex2 | Held During the Past 5 Years3 | |||||
Susan J. Hickenlooper c/o Touchstone Advisors, Inc. 303 Broadway Suite 1100 Cincinnati, Ohio 45202 Year of Birth: 1946 | Trustee | Until retirement at age 75 or until she resigns or is removed Trustee since 2009 | Retired; formerly Financial Analyst for Impact 100 (charitable organization) from November 2012 to 2013. | 49 | Trustee of Diocese of Southern Ohio from 2014 to the present; and Trustee of Cincinnati Parks Foundation from 2000 to 2016. | |||||
Kevin A. Robie c/o Touchstone Advisors, Inc. 303 Broadway Suite 1100 Cincinnati, Ohio 45202 Year of Birth: 1956 | Trustee | Until retirement at age 75 or until he resigns or is removed Trustee since 2013 | Vice President of Portfolio Management at Soin International LLC (a private multinational holding company) from 2004 to the present. | 49 | SaverSystems, Inc. from 2015 to the present; Director of Buckeye EcoCare, Inc. (a lawn care company) from 2013 to the present; Trustee of Dayton Region New Market Fund, LLC (a private fund) from 2010 to the present; and Trustee of the Entrepreneurs Center, Inc. (a small business incubator) from 2006 to the present. | |||||
Edward J. VonderBrink c/o Touchstone Advisors, Inc. 303 Broadway Suite 1100 Cincinnati, Ohio 45202 Year of Birth: 1944 | Trustee | Until retirement at age 75 or until he resigns or is removed Trustee since 2013 | Consultant, VonderBrink Consulting LLC from 2000 to the present. | 49 | Director of Streamline Health Solutions, Inc. (healthcare IT) from 2006 to 2015; Mercy Health from 2013 to the present; Mercy Health Foundation (healthcare nonprofit) from 2008 to the present; Al Neyer Inc. (a construction company) from 2013 to the present; and BASCO Shower Door from 2011 to the present. |
| 1 | Ms. McGruder, as a director of the Advisor and the Distributor, and an officer of affiliates of the Advisor and the Distributor, is an “interested person” of the Trust within the meaning of Section 2(a)(19) of the 1940 Act. |
| 2 | As of December 31, 2017, the Touchstone Fund Complex consists of 10 variable annuity series of the Trust, 13 series of Touchstone Funds Group Trust, 25 series of Touchstone Strategic Trust, and 1 series of Touchstone Institutional Funds Trust. |
| 3 | Each Trustee is also a Trustee of Touchstone Funds Group Trust, Touchstone Institutional Funds Trust, and Touchstone Strategic Trust. |
105
Management of the Trust (Unaudited) (Continued)
Principal Officers:
| Term of | ||||||
| Name | Position | Office and | ||||
| Address | Held with | Length of | Principal Occupation(s) | |||
| Year of Birth | Trust1 | Time Served | During Past 5 Years | |||
Jill T. McGruder Touchstone Advisors, Inc. 303 Broadway Suite 1100 Cincinnati, Ohio 45202 Year of Birth: 1955 | President and Trustee | Until resignation, removal or disqualification President since 2006. | See biography above. | |||
Steven M. Graziano Touchstone Advisors, Inc. 303 Broadway Suite 1100 Cincinnati, Ohio 45202 Year of Birth: 1954 | Vice President | Until resignation, removal or disqualification Vice President since 2009 | President of Touchstone Advisors, Inc. | |||
Timothy D. Paulin Touchstone Advisors, Inc. 303 Broadway Suite 1100 Cincinnati, Ohio 45202 Year of Birth: 1963 | Vice President | Until resignation, removal or disqualification Vice President since 2010 | Senior Vice President of Investment Research and Product Management of Touchstone Advisors, Inc. | |||
Timothy S. Stearns Touchstone Advisors, Inc. 303 Broadway Suite 1100 Cincinnati, Ohio 45202 Year of Birth: 1963 | Chief Compliance Officer | Until resignation, removal or disqualification Chief Compliance Officer since 2013 | Chief Compliance Officer of Touchstone Advisors, Inc.; Chief Compliance Officer of Envestnet Asset Management, Inc. (2009 to 2013). | |||
Terrie A. Wiedenheft Touchstone Advisors, Inc. 303 Broadway Suite 1100 Cincinnati, Ohio 45202 Year of Birth: 1962 | Controller and Treasurer | Until resignation, removal or disqualification Controller and Treasurer since 2006 | Senior Vice President, Chief Financial Officer, and Chief Operations Officer of IFS Financial Services, Inc. (a holding company). | |||
Ellen Blanchard The Bank of New York Mellon 201 Washington Street, 13th Floor Boston, Massachusetts 02108 Year of Birth: 1973 | Secretary | Until resignation, removal or disqualification Secretary since 2015 | Director of The Bank of New York Mellon. |
| 1 | Each officer also holds the same office with Touchstone Funds Group Trust, Touchstone Institutional Funds Trust, and Touchstone Strategic Trust. |
106
We Respect Your Privacy
Thank you for your decision to invest with us. Touchstone and its affiliates have always placed a high value on the trust and confidence our clients place in us. We believe that confidence must be earned and validated through time. In today’s world, when technology allows the sharing of information at light speeds, trust must be reinforced by our sincere pledge to take the steps necessary to ensure that the information you share with us is treated with respect and confidentiality.
Our Pledge to Our Clients
| • | We collect only the information we need to service your account and administer our business. |
| • | We are committed to keeping your information confidential and we place strict limits and controls on the use and sharing of your information. |
| • | We make every effort to ensure the accuracy of your information. |
We Collect the Following Nonpublic Personal Information About You:
| • | Information we receive from you on or in applications or other forms, correspondence, or conversations, including, but not limited to, your name, address, phone number, social security number, assets, income and date of birth; and |
| • | Information about your transactions with us, our affiliates, or others, including, but not limited to, your account number and balance, payment history, parties to transactions, cost basis information, and other financial information. |
Categories of Information We Disclose and Parties to Whom We Disclose
We do not disclose any nonpublic personal information about our current or former clients to nonaffiliated third parties, except as required or permitted by law.
We Place Strict Limits and Controls on the Use and Sharing of Your Information
| • | We restrict access to nonpublic personal information about you to authorized employees who need the information to administer your business. |
| • | We maintain physical, electronic and procedural safeguards that comply with federal standards to protect this information. |
| • | We do not disclose any nonpublic personal information about our current or former clients to anyone, except as required or permitted by law or as described in this document. |
| • | We will not sell your personal information to anyone. |
We May Provide Information to Service Your Account
Sometimes it is necessary to provide information about you to various companies such as transfer agents, custodians, broker-dealers and marketing service firms to facilitate the servicing of your account. These organizations have a legitimate business need to see some of your personal information in order for us to provide service to you. We may disclose to these various companies the information that we collect as described above. We require that these companies, including our own subsidiaries and affiliates, strictly maintain the confidentiality of this information and abide by all applicable laws. Companies within our corporate family that may receive this information are financial service providers and insurance companies. We do not permit these associated companies to sell the information for their own purposes, and we never sell our customer information.
This policy is applicable to the following affiliated companies: Touchstone Funds Group Trust, Touchstone Strategic Trust, Touchstone Variable Series Trust, Touchstone Institutional Funds Trust, Touchstone Securities, Inc.,* and W&S Brokerage Services, Inc.
* Touchstone Securities, Inc. serves as the underwriter to the Touchstone Funds.
A Member of Western & Southern Financial Group®
The Privacy Protection Policy is not part of the Annual Report.
107

TSF-1006-TVST-AR-1712
Item 2. Code of Ethics.
| (a) | The registrant, as of the end of the period covered by this report, has adopted a code of ethics that applies to the registrant’s principal executive officer, principal financial officer, principal accounting officer or controller, or persons performing similar functions, regardless of whether these individuals are employed by the registrant or a third party. |
| (c) | There have been no amendments, during the period covered by this report, to a provision of the code of ethics that applies to the registrant’s principal executive officer, principal financial officer, principal accounting officer or controller, or persons performing similar functions, regardless of whether these individuals are employed by the registrant or a third party, and that relates to any element of the code of ethics description. |
| (d) | The registrant has not granted any waivers, including an implicit waiver, from a provision of the code of ethics that applies to the registrant’s principal executive officer, principal financial officer, principal accounting officer or controller, or persons performing similar functions, regardless of whether these individuals are employed by the registrant or a third party, that relates to one or more of the items set forth in paragraph (b) of this item’s instructions. |
Item 3. Audit Committee Financial Expert.
The registrant’s Board of Trustees has determined that the registrant has at least one audit committee financial expert serving on its audit committee. Mr. William Gale is the registrant’s audit committee financial expert and is an independent trustee within the meaning of the Investment Company Act of 1940, as amended (the “1940 Act”).
Item 4. Principal Accountant Fees and Services.
Audit Fees
| (a) | Audit fees for Touchstone Variable Series Trust totaled $158,500 and $91,900 for the fiscal years ended December 31, 2017 and 2016, respectively, including fees associated with the annual audits and filings of Form N-1A and Form N-SAR. |
Audit-Related Fees
| (b) | Audit-related fees totaled $7,092 and $0 for the fiscal years ended December 31, 2017 and 2016, respectively. The fees relate to the review of the N-14 filings. |
Tax Fees
| (c) | The fees for tax compliance services totaled $31,630 and $18,190 for the fiscal years ended December 31, 2017 and 2016, respectively. The fees relate to the preparation of federal income tax returns and review of capital gains distribution calculations. |
All Other Fees
| (d) | The aggregate fees billed in each of the last two fiscal years ended December 31, 2017 and 2016 for products and services provided by the principal accountant, other than the services reported in paragraphs (a) through (c) of this Item are $476 for 2017 and $309 for 2016, respectively. The fees relate to the PFIC Analyzer and Global Withholding Tax Reporter subscriptions. |
| (e)(1) | Disclose the audit committee's pre-approval policies and procedures described in paragraph (c)(7) of Rule 2-01 of Regulation S-X. |
The Audit Committee’s pre-approval policies describe the types of audit, audit-related, tax and other services that have the general pre-approval of the Audit Committee. The pre-approval policies provide that annual audit service fees, tax services not specifically granted pre-approval, services exceeding pre-approved cost levels and other services that have not received general pre-approval will be subject to specific pre-approval by the Audit Committee. The pre-approval policies further provide that the Committee may grant general pre-approval to other audit services (statutory audits and services associated with SEC registration statements, periodic reports and other documents filed with the SEC or other documents issued in connection with securities offerings), audit-related services (accounting consultations related to accounting, financial reporting or disclosure matters not classified as “audit services,” assistance with understanding and implementing new accounting and financial reporting guidance from rulemaking authorities, agreed-upon or expanded audit procedures related to accounting and/or billing records required to respond to or comply with financial, accounting or regulatory reporting matters and assistance with internal control reporting requirements under Form N-SAR and Form N-CSR), tax services that have historically been provided by the auditor that the Committee believes would not impair the independence of the auditor and are consistent with the SEC’s rules on auditor independence and permissible non-audit services classified as “all other services” that are routine and recurring services.
| (e)(2) | All of the services described in paragraphs (c) through (d) of Item 4 were approved by the Audit Committee. |
| (f) | The percentage of hours expended on the principal accountant's engagement to audit the registrant's financial statements for the most recent fiscal year that were attributed to work performed by persons other than the principal accountant's full-time, permanent employees was less than fifty percent. |
| (g) | The aggregate non-audit fees for Touchstone Variable Series Trust and certain entities*, totaled approximately $39,198 and $18,499, for the fiscal years ended December 31, 2017 and 2016, respectively. |
* These include the advisors (excluding sub-advisors) and any entity controlling, controlled by or under common control with the advisors that provides ongoing services to the registrant (Funds).
| (h) | The registrant's audit committee of the board of directors has considered whether the provision of non-audit services that were rendered to the registrant's investment adviser (not including any sub-adviser whose role is primarily portfolio management and is subcontracted with or overseen by another investment adviser), and any entity controlling, controlled by, or under common control with the investment adviser that provides ongoing services to the registrant that were not pre-approved pursuant to paragraph (c)(7)(ii) of Rule 2-01 of Regulation S-X is compatible with maintaining the principal accountant's independence. |
Item 5. Audit Committee of Listed Registrants.
Not applicable.
Item 6. Investments.
| (a) | Schedule of Investments in securities of unaffiliated issuers as of the close of the reporting period is included as part of the report to shareholders filed under Item 1 of this form. |
| (b) | Not applicable. |
Item 7. Disclosure of Proxy Voting Policies and Procedures for Closed-End Management Investment Companies.
Not applicable.
Item 8. Portfolio Managers of Closed-End Management Investment Companies.
Not applicable.
Item 9. Purchases of Equity Securities by Closed-End Management Investment Company and Affiliated Purchasers.
Not applicable.
Item 10. Submission of Matters to a Vote of Security Holders.
There have been no material changes to the procedures by which the shareholders may recommend nominees to the registrant’s board of trustees, where those changes were implemented after the registrant last provided disclosure in response to the requirements of Item 407(c)(2)(iv) of Regulation S-K (17 CFR 229.407) (as required by Item 22(b)(15) of Schedule 14A (17 CFR 240.14a-101)), or this Item.
Item 11. Controls and Procedures.
| (a) | The registrant’s principal executive and principal financial officers, or persons performing similar functions, have concluded that the registrant’s disclosure controls and procedures (as defined in Rule 30a-3(c) under the Investment Company Act of 1940, as amended (the “1940 Act”) (17 CFR 270.30a-3(c))) are effective, as of a date within 90 days of the filing date of the report that includes the disclosure required by this paragraph, based on their evaluation of these controls and procedures required by Rule 30a-3(b) under the 1940 Act (17 CFR 270.30a-3(b)) and Rules 13a-15(b) or 15d-15(b) under the Securities Exchange Act of 1934, as amended (17 CFR 240.13a-15(b) or 240.15d-15(b)). |
| (b) | There were no changes in the registrant’s internal control over financial reporting (as defined in Rule 30a-3(d) under the 1940 Act (17 CFR 270.30a-3(d))) that occurred during the registrant’s last fiscal quarter that has materially affected, or is reasonably likely to materially affect, the registrant’s internal control over financial reporting. |
Item 12. Disclosure of Securities Lending Activities for Closed-End Management Investment Companies.
Not applicable.
Item 12. Exhibits.
| (a)(1) | Code of ethics, or any amendment thereto, that is the subject of disclosure required by Item 2 is attached hereto. |
| (a)(2) | Certifications pursuant to Rule 30a-2(a) under the 1940 Act and Section 302 of the Sarbanes-Oxley Act of 2002 are attached hereto. |
| (a)(3) | Not applicable. |
| (a)(4) | Not applicable. |
| (b) | Certifications pursuant to Rule 30a-2(b) under the 1940 Act and Section 906 of the Sarbanes- Oxley Act of 2002 are attached hereto. |
SIGNATURES
Pursuant to the requirements of the Securities Exchange Act of 1934 and the Investment Company Act of 1940, the registrant has duly caused this report to be signed on its behalf by the undersigned, thereunto duly authorized.
(Registrant) Touchstone Variable Series Trust
By (Signature and Title)* /s/ Jill T. McGruder
Jill T. McGruder, President
(principal executive officer)
Date 2/28/2018
Pursuant to the requirements of the Securities Exchange Act of 1934 and the Investment Company Act of 1940, this report has been signed below by the following persons on behalf of the registrant and in the capacities and on the dates indicated.
By (Signature and Title)* /s/ Jill T. McGruder
Jill T. McGruder, President
(principal executive officer)
Date 2/28/2018
By (Signature and Title)* /s/ Terrie A. Wiedenheft
Terrie A. Wiedenheft, Controller and Treasurer
(principal financial officer)
Date 2/28/2018
* Print the name and title of each signing officer under his or her signature.