UNITED STATES
SECURITIES AND EXCHANGE COMMISSION
Washington, D.C. 20549
FORM N-CSR
CERTIFIED SHAREHOLDER REPORT OF REGISTERED MANAGEMENT INVESTMENT COMPANIES
| Investment Company Act file number | | 811-08416 | |
| Touchstone Variable Series Trust |
| (Exact name of registrant as specified in charter) |
303 Broadway, Suite 1100
| Cincinnati, Ohio 45202-4203 |
| (Address of principal executive offices) (Zip code) |
Jill T. McGruder
303 Broadway, Suite 1100
| Cincinnati, Ohio 45202-4203 |
| (Name and address of agent for service) |
Registrant's telephone number, including area code: 800-638-8194
Date of fiscal year end: December 31
Date of reporting period: December 31, 2014
Form N-CSR is to be used by management investment companies to file reports with the Commission not later than 10 days after the transmission to stockholders of any report that is required to be transmitted to stockholders under Rule 30e-1 under the Investment Company Act of 1940 (17 CFR 270.30e-1). The Commission may use the information provided on Form N-CSR in its regulatory, disclosure review, inspection, and policymaking roles.
A registrant is required to disclose the information specified by Form N-CSR, and the Commission will make this information public. A registrant is not required to respond to the collection of information contained in Form N-CSR unless the Form displays a currently valid Office of Management and Budget ("OMB") control number. Please direct comments concerning the accuracy of the information collection burden estimate and any suggestions for reducing the burden to Secretary, Securities and Exchange Commission, 100 F Street, NE, Washington, DC 20549. The OMB has reviewed this collection of information under the clearance requirements of 44 U.S.C. § 3507.
Item 1. Reports to Stockholders.
The Report to Shareholders is attached herewith.
December 31, 2014
Annual Report
Touchstone Variable Series Trust
Touchstone Active Bond Fund
Touchstone Baron Small Cap Growth Fund
Touchstone High Yield Fund
Touchstone Large Cap Core Equity Fund
Touchstone Mid Cap Growth Fund
Touchstone Money Market Fund
Touchstone Third Avenue Value Fund
Touchstone Aggressive ETF Fund
Touchstone Conservative ETF Fund
Touchstone Moderate ETF Fund

Table of Contents
| | Page | |
| Letter from the President | 3 | |
| Management’s Discussion of Fund Performance (Unaudited) | 4 - 27 | |
| Tabular Presentation of Portfolios of Investments (Unaudited) | 28 - 29 | |
| Portfolio of Investments | | |
| Touchstone Active Bond Fund | 30 | |
| Touchstone Baron Small Cap Growth Fund | 35 | |
| Touchstone High Yield Fund | 37 | |
| Touchstone Large Cap Core Equity Fund | 42 | |
| Touchstone Mid Cap Growth Fund | 44 | |
| Touchstone Money Market Fund | 46 | |
| Touchstone Third Avenue Value Fund | 49 | |
| Touchstone Aggressive ETF Fund | 51 | |
| Touchstone Conservative ETF Fund | 52 | |
| Touchstone Moderate ETF Fund | 53 | |
| Statements of Assets and Liabilities | 54 - 55 | |
| Statements of Operations | 56 - 57 | |
| Statements of Changes in Net Assets | 58 - 61 | |
| Financial Highlights | 62 - 66 | |
| Notes to Financial Statements | 67 - 80 | |
| Report of Independent Registered Public Accounting Firm | 81 | |
| Other Items (Unaudited) | 82 - 90 | |
| Management of the Trust (Unaudited) | 91 - 93 | |
| Privacy Protection Policy | 95 | |
This report identifies the Funds’ investments on December 31, 2014. These holdings are subject to change. Not all investments in each Fund performed the same, nor is there any guarantee that these investments will perform as well in the future. Market forecasts provided in this report may not occur.
Letter from the President
Dear Shareholder:
We are pleased to provide you with the Touchstone Variable Series Trust Annual Report. Inside you will find key financial information, as well as manager commentaries for the Funds, for the twelve months ended December 31, 2014.
After struggling through an unusually harsh winter, the U.S. economy generated strong growth during 2014. This economic growth and an improving labor market supported the U.S. Federal Reserve Board’s actions to discontinue its Quantitative Easing program. Globally, economic weakness and lower-than-expected inflation pushed central banks outside the U.S. to further loosen monetary policy in an effort to stimulate their economies. This divergence in economic growth, monetary policy, and expected interest rate paths led to a significant appreciation of the dollar.
Equity markets posted solid gains in 2014. Looking across the market capitalization spectrum, smaller- and mid-capitalization company stocks experienced greater volatility and lower returns than their large capitalization counterparts. Outside the U.S., developed and emerging market equities suffered losses as a result of the strong appreciation in the U.S. dollar.
The bond market also performed well in 2014. As yields on intermediate and long-term U.S. Treasuries declined, investment grade corporate bonds benefited from the tailwind of falling interest rates. While high yield securities also generated positive returns, the gains were limited after a lengthy period of strong performance. Non-U.S. fixed income securities faced the same currency headwinds as non-U.S. equities and recorded moderate losses during the year.
After more than five years of robust performance from U.S. stocks and bonds, we continue to believe that diversification is essential to balancing risk and return. We recommend that you work with your financial professional to employ a sound asset allocation strategy to help keep your financial strategy on course. We also believe that it is important to maintain a long-term approach to gain the full potential benefits of investing.
Touchstone is committed to helping investors achieve their financial goals by providing access to a distinctive selection of institutional asset managers who are known and respected for proficiency in their specific areas of expertise.
We greatly appreciate your continued support. Thank you for including Touchstone as part of your investment plan.
Sincerely,

Jill T. McGruder
President
Touchstone Variable Series Trust
Management’s Discussion of Fund Performance (Unaudited)
Touchstone Active Bond Fund
Sub-Advised by Fort Washington Investment Advisors, Inc.
Investment Philosophy
The Touchstone Active Bond Fund seeks to provide as high a level of current income as is consistent with the preservation of capital. Capital appreciation is a secondary goal. In deciding what securities to buy and sell for the Fund, the overall investment opportunities and risks in different sectors of the debt securities market are analyzed by focusing on maximizing total return and reducing volatility of the Fund’s portfolio. A disciplined sector allocation process is followed in order to build a broadly diversified portfolio of bonds.
Fund Performance
The Touchstone Active Bond Fund underperformed its benchmark, the Barclays U.S. Aggregate Bond Index, for the 12-month period ending December 31, 2014. The Fund’s total return was 3.82 percent, while the total return of the benchmark was 5.97 percent.
Market Environment
Over the past year, financial markets were influenced by a divergence in economic performance between the U.S., which registered solid growth, and the eurozone and Japan which were weak. This reinforced expectations that policymakers in the U.S. could begin tightening monetary policies by mid-2015, while the European Central Bank and Bank of Japan would keep monetary policies accommodative for the foreseeable future. Late in 2014, energy commodities fell by nearly 50%, creating significant uncertainty as to the strength of the global economy and further exposing persistent disinflationary forces.
Portfolio Review
The Fund’s underperformance for the year was driven partly by its defensive position in terms of interest rate risk, primarily by under weighting longer-maturity bonds. The Treasury yield curve flattened over the past year, with short-term yields rising modestly and long-term yields falling while prices increased. At a security level, the Fund’s allocations to Treasury Inflation Protected Securities (“TIPS”), High Yield securities and other risk sectors detracted from performance.
TIPS detracted from performance during the year as inflation expectations declined significantly, which accelerated in the fourth quarter due to falling energy prices and renewed global economic concerns. Credit sectors, investment grade and high yield, underperformed Treasuries in 2014, with the majority of the weakness occurring in the fourth quarter. The Fund was generally overweight credit during the year and these allocations modestly detracted from performance. The Fund’s High Yield allocation remained relatively unchanged.
An allocation to preferred stock was added to the Fund. The securities were primarily focused in financial institutions. We believe that Bank/Finance credit quality continued to improve.
Outlook
In our view, the greatest potential will likely be a result of the global factors that have been driving markets over the past few months. The sharp decline in the price of energy commodities has created uncertainty in the markets and will likely continue to drive volatility in spread sectors. Additionally, central bank policy will be on divergent paths in 2015, with the U.S. Federal Reserve Board (“Fed”) expected to begin raising interest rates, while central banks in Europe, Japan and China are expected to add stimulus in 2015. We believe this could likely create volatility and investment opportunities.
Uncertain global economic growth and disinflationary forces represent the greatest concern going forward, in our view. As noted above, there is divergence between the U.S. economy and many other global economies,
Management’s Discussion of Fund Performance (Unaudited) (Continued)
resulting in differing central bank policies. Many economies are experiencing significant disinflationary forces, which declining energy prices may magnify. If central banks are not able to overcome these forces and significantly reduce the probability of persistent low inflation or deflation, the resulting market impact could represent a significant risk. Given our outlook for rising interest rates, returns in the fixed income market, including the Fund, will continue to be challenging over the near- and medium-term. The return of the Fund will largely be contained to the yield of the Fund over the next several quarters.
Interest rates are at risk to rise if labor market conditions and economic growth continue along recent trends and inflation moves closer to the Fed’s two percent target. If these conditions are met, we expect the Fed will begin raising interest rates in mid-2015 which will put upward pressure on interest rates.
Recent inflation data has been somewhat lower than expected and market-based inflation expectations have declined materially. If sustained, these factors may cause the Fed to delay rate hikes. Moreover, increases in long-term interest rates may be contained if inflation or inflation expectations do not rise. Generally, continued strong economic growth and supportive financial conditions should support risk assets into 2015. We have positioned the Fund to maintain a modestly defensive bias in terms of interest rate exposure relative to the benchmark, but will actively trade securities to capture short-term opportunities. We will maintain an overweight to the TIPS sector as we believe it offers long-term value at current valuations as well as an overweight to risk assets, including investment grade corporate bonds and high yield corporate bonds.
Management’s Discussion of Fund Performance (Unaudited) (Continued)
Comparison of the Change in Value of a $10,000 Investment in the
Touchstone Active Bond Fund and the Barclays U.S. Aggregate Bond Index
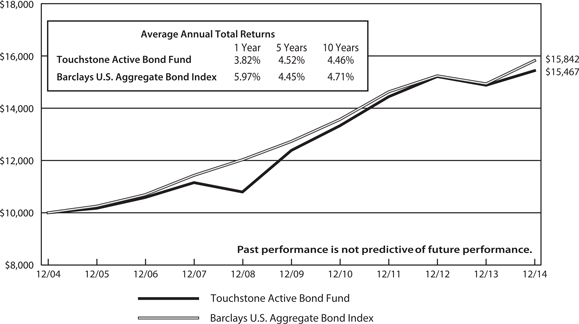
Performance information does not reflect fees that are paid by the separate accounts through which shares of the Fund are sold. Inclusion of those fees would reduce figures for all periods.
The inception date of the Fund was January 1, 1999.
Note to Chart
The Barclays U.S. Aggregate Bond Index is an unmanaged index comprised of U.S. investment grade, fixed rate bond market securities, including government, government agency, corporate and mortgage-backed securities between one and ten years.
Management’s Discussion of Fund Performance (Unaudited)
Touchstone Baron Small Cap Growth Fund
Sub-Advised by BAMCO, Inc.
Investment Philosophy
The Touchstone Baron Small Cap Growth Fund primarily invests in common stocks of small-sized growth companies. The Fund’s sub-advisor, BAMCO, Inc. (“BAMCO”), seeks securities that it believes have (1) favorable price to value characteristics, are well managed, have significant long-term growth prospects and have significant barriers to competition; and (2) the potential to increase in value at least 100 percent over the next four or five years. Securities are selected for their capital appreciation potential and investment income is not a consideration in BAMCO’s stock selection process.
Fund Performance
The Touchstone Baron Small Cap Growth Fund underperformed its benchmark, the Russell 2000® Growth Index, for the 12-month period ended December 31, 2014. The Fund’s total return was 3.85 percent while the total return of the benchmark was 5.60 percent.
Market Environment
Domestic economic news in 2014 was largely positive for the market. After a weak first quarter, in part due to an unusually harsh winter, the U.S. gross domestic product (“GDP”) picked up speed over the rest of the year. Corporate earnings reports were generally positive, U.S. manufacturing maintained its growth path, the housing market showed further signs of recovery and unemployment continued to fall.
While the domestic economy grew steadily stronger over the course of the year, the European economy stalled. Investors fretted over whether the European Central Bank (“ECB”) would undertake full-blown quantitative easing (“QE”) to head off eurozone-wide deflation. Elsewhere, slower-than-expected growth in China and Brazil pressured emerging markets. Russia’s economy also stagnated, weighed down by Western sanctions and lower oil prices later in the year. Though market volatility in 2014 was exacerbated by a series of geopolitical crises, the market quickly recovered the losses generated by investor reaction to each of these events.
The freefall in oil prices dominated business headlines in the last months of the year. Oil prices fell almost 25 percent on average in the fourth quarter, driven down by slower global demand growth and rising oversupply. The price of crude oil dropped to $54 per barrel as of year-end, down 50 percent from its June high and the lowest level since September 2009.
Portfolio Review
Positions in the Energy, Utilities and Materials sectors contributed to the Fund’s relative returns in 2014, while the Health Care, Industrials and Information Technology sectors detracted from relative performance.
The Fund benefited from its exposure within the Energy sector, which is primarily concentrated in Storage & Transportation companies, an industry that is less sensitive to oil price fluctuations. Despite the challenging second half of the year for the Energy sector overall, the Fund holdings managed a modest gain and contributed to relative performance. The largest relative individual contributors in the Energy sector were Sunoco LP and Targa Resources Corp. Sunoco LP (formerly Susser Petroleum Partners LP), a wholesale distributor of motor fuels in Texas, rose after Energy Transfer Partners LP, bought a Sunoco affiliate and announced plans to make Sunoco its home for its retail and gas distribution assets. Targa Resources Corp. benefited from the company’s continued execution on its growth projects and increases to its quarterly and annual guidance.
ITC Holdings Corp. contributed to performance in the Utilities sector. ITC Holdings Corp. is the nation’s largest independent transmission company and benefited from low interest rates and investor demand for the
Management’s Discussion of Fund Performance (Unaudited) (Continued)
comparative safety of Utilities stocks. The key components of our investment thesis – reliability and connection of new electricity generation (including renewables) – remained intact, and we believe ITC is well positioned to benefit.
The Fund had minimal exposure to the Materials sector during the year, which contributed to relative returns as the benchmark generated negative returns in that sector. Outperformance of the only Materials holding, quartz countertop manufacturer CaesarStone Sdot-Yam Ltd., helped relative performance within the sector. CaesarStone outperformed on reports of better-than-expected results and raises in full-year earnings guidance.
Though the Fund’s Health Care holdings produced positive returns during 2014, the Fund was underweight the sector. This lack of exposure to the strong performance of the Health Care sector detracted from returns. The Fund’s performance within the sector was buoyed by the strong performance of Community Health Systems, Inc. (“CHS”) and CFR Pharmaceuticals SA. Shares of the U.S. hospital operator Community Health Systems benefited from higher utilization, an improved payer mix stemming from health care reform and the improving domestic economy. Additionally, CHS acquired Health Management Associates (“HMA”) during 2014. The integration with HMA is going well, and we believe synergies will ultimately exceed management’s initial guidance. Latin American generic drug company CFR Pharmaceuticals experienced gains in May on news that Abbott Laboratories was acquiring CFR.
Performance of the Fund’s Industrials sector holdings was mixed, but poor performance from several investments, including Generac Holdings, Inc. and Colfax Corporation, outweighed gains from other Industrials holdings. Generac, a standby generator manufacturer, fell in 2014 over investor concerns that the current performance of the residential business was not sustainable. Weak spending by telecom customers and below-normal storm activity caused Generac to cut earnings guidance toward year-end. However, our investment thesis remains intact, as we believe the market for standby generators is underpenetrated (only 3 percent of U.S. homes) and Generac will be able to leverage its significant market share to grow its business. Industrial machinery company Colfax fell in 2014 as the company missed earnings and lowered guidance due to execution issues in its fluid handling segment. We believe Colfax will use its solid business system to improve operations at acquired companies, generating shareholder value over time.
Outlook
We think oil prices may remain relatively low for an extended period and, in our view, the steep decline in oil prices is a positive for the U.S. economy. The decrease in oil prices is saving the U.S. economy roughly $365 billion per year, a figure that translates to $1,000 savings per household, per year. Money not spent on oil and gas can be spent elsewhere. We believe energy-intensive manufacturers and other businesses will have lower energy costs, resulting in higher cash flow, and consumers will have more disposable income to spend on goods and services.
Energy investments represent less than five percent of the Fund’s portfolio, and we are not making significant changes to our overall investment approach in this new environment of cheap oil. We take a long-term view to our investments, investing in companies with significant growth opportunities, exceptional management and a strong balance sheet, at what we believe are attractive valuations. We have employed this approach with great success for more than 30 years, by looking through oil price and market fluctuations that can impact stock prices in the near-term in order to see the long-term opportunities a business presents.
Management’s Discussion of Fund Performance (Unaudited) (Continued)
Comparison of the Change in Value of a $10,000 Investment in the
Touchstone Baron Small Cap Growth Fund and the Russell 2000® Growth Index

Performance information does not reflect fees that are paid by the separate accounts through which shares of the Fund are sold. Inclusion of those fees would reduce figures for all periods.
The inception date of the Fund was December 14, 1992.
Note to Chart
The Russell 2000® Growth Index measures the performance of those Russell 2000 companies with higher price-to-book ratios and higher forecasted growth values.
Management’s Discussion of Fund Performance (Unaudited)
Touchstone High Yield Fund
Sub-Advised by Fort Washington Investment Advisors, Inc.
Investment Philosophy
The Touchstone High Yield Fund seeks high current income and capital appreciation by primarily investing in non-investment grade securities. The Fund emphasizes the higher-quality segment of the high yield market. It utilizes a research process designed to maximize risk-adjusted returns by avoiding lower-rated securities.
Fund Performance
The Touchstone High Yield Fund underperformed its benchmark, the BofA Merrill Lynch U.S. High Yield Cash Pay Index, for the 12-month period ended December 31, 2014. The Fund’s total return was 0.62 percent while the benchmark’s total return was 2.45 percent.
Market Environment
For calendar year 2014, High Yield reported its worst performance since 2008. The primary reason was a sharp drop in the price of crude oil, which ended 2014 at approximately $53 a barrel, down 50 percent from its mid-year high. The impact on the High Yield market was meaningful in both direct and indirect ways. Nearly 15 percent of the High Yield market is comprised of Energy issuers, many of which we believe will experience reduced cash flow prospects while oil prices remain low. Indirectly, there are concerns about slowing global growth that may be manifest in the declining price of oil.
Portfolio Review
The Fund was negatively impacted by an overweight allocation to the Energy sector and poor security selection within the sector. Energy has historically exhibited defensive qualities in volatile markets and relatively solid risk-adjusted returns. However, the rather sharp drop in the price of crude oil caused declines in Energy bonds.
Among the Energy issuers that detracted from performance were Key Energy Services Inc., Sandridge Energy Inc. and Bill Barrett Corp. We believe each of these companies has the operational flexibility to withstand low oil prices for some amount of time. However, a prolonged period of low oil prices will present challenges to many Energy issuers.
Contributors to performance included an underweight allocation to Gaming and an overweight allocation to Diversified Media. Within Gaming, security selection contributed positively, due to an underweight position to Caesar’s Entertainment Corp. Additionally, security selection within Diversified Media and Metals & Mining also contributed. Within Metals & Mining the Fund benefitted from a lack of exposure to lower quality coal producers such as Arch Coal Inc., Alpha Natural Resources Inc. and Cliffs Natural Resources Inc.
Within the healthcare industry the Fund’s exposure to HCA Holdings Inc. (“HCA”) was reduced and we added to Tenet Healthcare Corp. While we remain comfortable with HCA we think the value is less attractive. We also added to Community Health Systems Inc. In the Telecommunication Services sector the Fund was underweight Sprint Corp. in favor of an overweight to T-Mobile USA Inc. due operational weakness at Sprint and market share gains at T-Mobile. We consider T-Mobile to be a better operator. We reduced the Fund’s Broadcast Media exposure to Sirius XM Holdings Inc., whose senior notes were upgraded to investment grade, and we added to Sinclair Television Group Inc. We prefer television broadcasters to radio broadcasters and think that Sinclair is a stronger operator within the Media Broadcasting subsector. Lastly, exposure to Sabine Pass LNG LP (Energy sector) was reduced significantly.
Management’s Discussion of Fund Performance (Unaudited) (Continued)
Outlook
Historically, steep declines in oil prices have been associated with above average global growth and favorable performance of risk assets. Conversely, oil price spikes have been associated with global recessions and stock market sell-offs. In the near term, we believe that swings in oil prices may drive the volatility in the High Yield market. While we accept the challenges that $50 oil provides, the Fund is overweight Energy as we think there is relative value within this sector.
We believe that the steep drop in oil prices will give the global economy a much needed boost, as discretionary household income increases. We expect to see increased market volatility in the coming year, considering that the adverse impact on energy producers and their creditors is more concentrated than the favorable impact on consumers and businesses.
We find considerable relative value in High Yield and think that the market appears to be pricing in a higher default rate than we think likely. We believe the Fund is positioned properly within the construct of our philosophy and process.
Management’s Discussion of Fund Performance (Unaudited) (Continued)
Comparison of the Change in Value of a $10,000 Investment in the
Touchstone High Yield Fund and the BofA Merrill Lynch U.S. High Yield Cash Pay Index
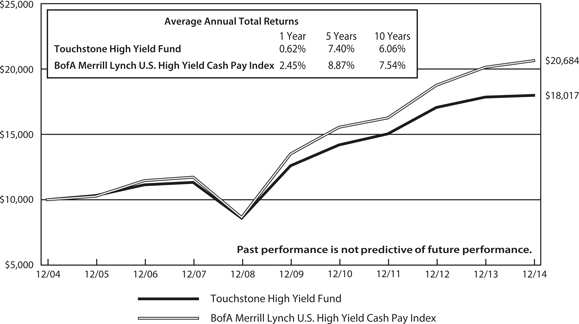
Performance information does not reflect fees that are paid by the separate accounts through which shares of the Fund are sold. Inclusion of those fees would reduce figures for all periods.
The inception date of the Fund was May 1, 1999.
Note to Chart
The BofA Merrill Lynch U.S. High Yield Cash Pay Index is an unmanaged index used as a general measure of market performance consisting of fixed-rate, coupon-bearing bonds with an outstanding par which is greater than or equal to $50 million, a maturity range greater than or equal to one year and must be less than BBB/Baa3 rated but not in default.
Management’s Discussion of Fund Performance (Unaudited)
Touchstone Large Cap Core Equity Fund
Sub-Advised by Todd Asset Management LLC
Investment Philosophy
The Touchstone Large Cap Core Equity Fund primarily invests in common stocks of large capitalization companies. The Fund’s sub-advisor, Todd Asset Management LLC, (“Todd”) selects stocks that it believes are attractively valued with active catalysts in place. Todd uses a database of 4,000 stocks from which to choose the companies that will be selected for the Fund’s portfolio. As a result, the portfolio generally consists of 40-60 positions. Todd’s selection process is expected to cause the Fund’s portfolio to have some of the following characteristics: attractive relative value, unrecognized earnings potential, above-average market capitalization, seasoned management and dominant industry.
Fund Performance
The Touchstone Large Cap Core Equity Fund outperformed its benchmark, the Russell 1000® Index, for the 12-month period ended December 31, 2014. The Fund’s total return was 14.93 percent while the total return of the benchmark was 13.24 percent.
Market Environment
The capital markets produced solid returns during 2014 despite concerning headlines about geopolitical tensions and slowing global economic growth. This was reflected in the relative sector performance. The more defensive Utilities, Health Care, and Consumer Staples sectors were among the best performing sectors, while the more economically sensitive Energy, Materials, Consumer Discretionary, and Industrials sectors were among the worst performers. The second half of the year provided evidence of the variation in the performance of the world’s largest economies. Growth in Europe, Japan, and China slowed, while indicators in the U.S. provided further evidence of a strengthening economic recovery and labor market domestically. This divergence in growth rates globally supported a strong appreciation in the U.S. dollar. The diminishing prospects for global economic growth, in combination with increased oil supplies from North America, led to a rapid decline in oil prices and a major sell-off in the Energy sector late in 2014.
Portfolio Review
The Fund’s outperformance relative to the benchmark was driven by positive stock selection during 2014, particularly within the Consumer Discretionary, Industrials, and Information Technology sectors.
Within the Consumer Discretionary sector, the Fund emphasized companies that benefitted from the positive trends in the automotive, home improvement, retailing and media industries. This positioning contributed to performance, as stocks such as TRW Automotive Holdings Corp., Home Depot Inc., Macy’s Inc., and DirecTV outperformed the broader Consumer Discretionary sector. We believed that the improving U.S. economy and the strengthening labor market would lead to greater spending in these industries after years of deferred spending and pent up demand during and following the recession.
The Information Technology sector was also an area of strength for the Fund, driven by holdings that were focused on consumers as well. With new product cycles underway, and consumers and corporations in better financial shape, companies in the consumer electronic and desktop hardware business benefitted. This trend was reflected in the contributions from positions in Apple Inc., Hewlett Packard Co., and Intel Corp.
Within the Industrials sector, the Fund generated positive relative performance, in part through its positions in railroad and construction companies. The railroads outperformed from a secular move for several years, and 2014 was no exception. Union Pacific Corp. and Norfolk Southern Corp. were among the top performers
Management’s Discussion of Fund Performance (Unaudited) (Continued)
for both the Industrials sector and the Fund overall. United Rentals Inc., a company focused on the rental of construction equipment, also generated positive returns during the year, outperforming the broader Industrials sector.
Stock selection in the Financials and Energy sectors detracted from relative performance during the year. The Energy sector experienced significant declines late in the year as oil prices plunged, with companies most directly exposed to oil price levels experiencing the largest losses. The Fund’s holdings in offshore drilling (Seadrill Ltd. and Atwood Oceanics Inc.) and oil services companies such as Halliburton Co. experienced significant decreases that ultimately detracted from the Fund’s relative performance in the Energy sector. Within the Financials sector, the Fund’s overweight to non-banks caused it to lag the sector during a year in which banks generally outperformed.
Over the past year, we trimmed the Fund’s Financials sector exposure and added to the Information Technology sector. If, as we believe, capital spending picks up and a new product cycle gains traction, we may look to bolster the Fund’s Information Technology sector weight even more. The Fund held overweight positions in the Consumer Discretionary, Financials, Health Care and Industrials sectors. We believe the U.S. economy is in a recovery phase, and we have not seen signs of excess valuations in these sectors. We see unrecognized growth potential at good value within the Health Care sector.
The Fund was underweight the Energy, Consumer Staples, Materials,Telecommunication Services and Utilities sectors, as value has been difficult to find. The Materials and Energy sectors also faced headwinds after overinvestment in new production.
Outlook
Supported by employment growth, high corporate profitability, and the impact of lower energy prices on consumer spending, we believe that the U.S. economic recovery will continue in 2015, offering the potential for further gains in the U.S. equity markets. The end of the Federal Reserve’s policy of quantitative easing, the effects of lower energy prices, and geopolitical instability could lead to greater volatility in stock prices. While this warrants caution, we maintain our long-term investment horizon and believe that our philosophy of investing in companies with attractive valuations, improving fundamentals, and market recognition of those factors is suitably positioned for the year ahead.
Management’s Discussion of Fund Performance (Unaudited) (Continued)
Comparison of the Change in Value of a $10,000 Investment in the
Touchstone Large Cap Core Equity Fund and the Russell 1000® Index
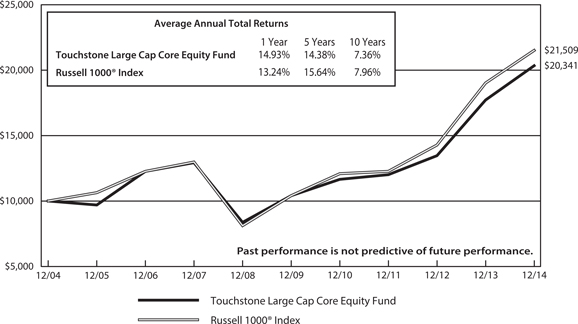
Performance information does not reflect fees that are paid by the separate accounts through which shares of the Fund are sold. Inclusion of those fees would reduce figures for all periods.
The inception date of the Fund was May 1, 1999.
Note to Chart
The Russell 1000® Index measures the performance of the 1,000 largest companies in the Russell 3000® Index. The Russell 3000 Index measures the performance of the largest 3,000 U.S. companies representing approximately 98% of the investable U.S. equity market.
Management’s Discussion of Fund Performance (Unaudited)
Touchstone Mid Cap Growth Fund
Sub-Advised by Westfield Capital Management Company, L.P.
Investment Philosophy
The Touchstone Mid Cap Growth Fund invests primarily in stocks of domestic mid-cap companies that are believed to have a demonstrated record of achievement with excellent prospects for earnings growth over a 1 to 3 year period. Fund management believes that companies that exhibit faster earnings growth offer the best opportunity for superior real rates of return and that reasonably priced stocks of companies with high forecasted earnings potential are best identified through in-depth, fundamental research and first-hand knowledge of company operations derived through on-site visits and meetings with management.
Fund Performance
The Touchstone Mid Cap Growth Fund outperformed its benchmark, the Russell Midcap® Growth Index, for the 12-month period ended December 31, 2014. The Fund’s total return was 13.10 percent while the total return of the benchmark was 11.90 percent.
Market Environment
U.S. equity indices provided positive returns in 2014. This performance came despite the modest expectations from Wall Street’s top strategists at the start of the year and deteriorating economic conditions in the rest of the world. As the year progressed, we saw a significant divergence in sector performance, with commodity-sensitive Energy, Materials, and Industrials sectors underperforming companies within the Health Care and Information Technology sectors. The year ended with a dramatic decline of crude oil prices, which reverberated through the currency markets and the economies of commodity producing nations. After several years of low volatility, we would not be surprised to see increased stock market volatility going forward, driven by investor concerns about the global economy and the U.S. Federal Reserve Board’s monetary policy tightening.
Portfolio Review
The Fund particularly benefitted from investments in the Information Technology, Health Care, Energy, and Consumer Staples sectors. The Consumer Discretionary and Materials sectors were the biggest detractors from returns.
The Information Technology sector contributed positively to relative returns. Stock selection within semi-conductors, communications equipment, and software substantially impacted returns during the year. Skyworks Solutions, Inc., which designs, manufactures, and markets semiconductor products to multimedia platforms and smart phones, was one of the performance highlights within the sector. The company supplies the robust smartphone market and has been gaining market share on leading customer platforms, such as the iPhone and Samsung Galaxy. In addition, the company’s radio frequency semiconductor business is nicely complemented by strong growth in non-mobile Internet-of-Things applications. NXP Semiconductors NV, a broad-based, global IT company specializing in high performance, mixed signal semiconductors, also contributed meaningfully to relative returns. NXP continues to deliver solid quarterly earnings, powered by growth related to automotive, identification, and wireless applications. The company’s robust product cycle, coupled with management’s focus on cost control and profit margins, translates into double-digit organic revenue and earnings growth. Although the Fund was underweight the sector relative to the benchmark, we continued to be active in the space, particularly focusing on areas of secular growth such as Internet, cloud, and security software, as well as segments with stable and predictable growth such as data processing.
Positioning within the Health Care sector also generated positive relative returns during the year. The Fund maintained its long-standing overweight in Health Care. Cubist Pharmaceuticals, Inc. surged in the beginning
Management’s Discussion of Fund Performance (Unaudited) (Continued)
of December, following news that Merck would purchase it. Actavis PLC, a pharmaceutical firm focused on manufacturing generic and over-the-counter products, also contributed to returns. The firm’s acquisitions of Forest Laboratories earlier in the year and Warner Chilcott last year expanded the earnings growth of the company, which is domiciled in Ireland. In November, the company announced it would acquire Allergan Inc., a global multi-specialty health care company. We believe that the acquisition will provide meaningful tax and cost savings, as well as geographic and sales channel revenue synergies. Allergan has a book of products that is diversified across neurology, ophthalmology, and medical aesthetics, and represents a high-visibility cash flow generation machine.
The Fund’s Energy sector stocks added comparative returns. The performance of financial markets overall, and the Energy sector in particular, was dominated by the dramatic decline of crude oil prices in the fourth quarter. The Fund’s largest exposure to Energy is through oil & gas refining companies, which benefitted from falling crude oil prices. Refiners have generally struggled for 30 years in the U.S., but we saw a fundamental shift in the industry driven by shale oil production and management commitment to change. The Fund’s largest Energy holding was the West Coast refiner Tesoro Corporation, which produced the top absolute and relative performance within the sector.
The Consumer Staples sector was also a source of relative strength through positive stock selection within the Packaged Foods and Household Products sub-industries. The food category has become a challenging place to invest given aggressive competition, increased promotional activity, and lower unit volumes. Food and beverage producer WhiteWave Foods Company appreciated during the period and was the sector’s top relative and absolute performer. We believe WhiteWave, which owns well-recognized brands such as Horizon Organic, Silk, and International Delight, represents one of the best growth stories in its category. Though the company trades at a premium to its peer universe, we believe that the robust valuation is justified – WhiteWave delivered a double-digit organic net sales growth in fiscal 2014. Although we remain underweight the sector, we have been constructive in the space. We continue to seek investments that present a growth opportunity in excess of the average growth rate of 2 percent to 3 percent for Consumer Staples companies. As an example of this philosophy, the Fund holds Church & Dwight Co., Inc., which develops, manufactures, and markets a range of household and personal care products. Church & Dwight matched earnings expectations during each quarter of 2014 through a combination of strategic acquisitions and a diversified product range. The company generated double digit earnings per share (“EPS”) growth. Relative returns were also enhanced by Mead Johnson Nutrition Company, a manufacturer of infant and children’s nutrition products. The nutritional market has secular tailwinds from an improving outlook for the U.S. consumer, including job growth and rising incomes. We believe that the company should also benefit from its exposure to rapidly-growing emerging markets.
The Consumer Discretionary sector was the only meaningful detractor from relative returns during 2014. Urban Outfitters, Inc., which operates brand-name clothing stores including Free People and Anthropologie, retreated in the second half of the year, after lowering sales projections for the fourth quarter. Although we still like the company for its long-term positioning, we felt that the merchandise inventory buildup will take several months to resolve and thus, it was sold from the Fund’s portfolio. The Fund also exited an underperforming investment in GameStop Corp., which sells new and used specialty electronic games and PC entertainment software. Shares of the company fell under pressure following an announcement from Sony Corp. that it was planning to launch PlayStation Now, a cloud-based subscription streaming service that would allow gamers to play PlayStation 3 titles across multiple Sony devices. Our concern for GameStop was that this lower cost gaming option could threaten GameStop’s highly profitable used game business. Offsetting the declines in these stocks, the Fund benefitted from gains within Leisure Products and Homebuilding. The recreational vehicle manufacturer Polaris Industries Inc. increased after the company reported earnings results that highlighted acceleration in North American retail sales, as well as market share gains. The company’s motorcycle shipments were up 107% year-over-year,
Management’s Discussion of Fund Performance (Unaudited) (Continued)
driven by the ongoing rollout of its Indian motorcycle brand. Year-over-year revenue growth of the parts, garments, and accessories segment and from its international business also helped the stock’s price during the year.
Outlook
We think the U.S. economy is on solid ground and growing. The housing market has recovered, the employment picture is much improved, and the drop in oil prices is a large stimulus for the U.S. consumer. The U.S. is a consumer-led economy, and the U.S. consumer is benefiting from low interest rates, lower gas prices at the pump, and more disposable income due to an improvement in wages. Global growth has slowed, and we are closely monitoring business activity in Europe and the emerging economies. The U.S. is currently the driver of global growth. We believe that the U.S. dollar will remain strong and 2015 will be another year of positive returns for the U.S. equity markets. Therefore, we are cautious about the market’s near-term prospects. The recent precipitous drop in oil prices raises important questions, particularly for commodity-based economies outside of the U.S. How low is too low for oil? Unprecedented low oil prices for a prolonged period of time, deflation in Europe and Japan, or an economic slowdown in China could easily trigger a growth scare and a stock market pullback. These factors introduce near-term caution into our otherwise constructive outlook on domestic equities this year. From a portfolio positioning standpoint, the current macroeconomic and financial backdrop reinforces our belief in the importance of a bottom-up driven investment process.
Management’s Discussion of Fund Performance (Unaudited) (Continued)
Comparison of the Change in Value of a $10,000 Investment in the
Touchstone Mid Cap Growth Fund and the Russell Midcap® Growth Index
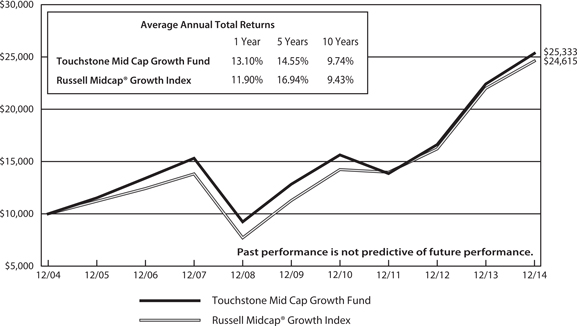
Performance information does not reflect fees that are paid by the separate accounts through which shares of the Fund are sold. Inclusion of those fees would reduce figures for all periods.
The inception date of the Fund was November 21, 1994.
Note to Chart
The Russell Midcap® Growth Index measures the performance of those Russell Midcap® companies with higher price-to-book ratios and higher forecasted growth values.
Management’s Discussion of Fund Performance (Unaudited)
Touchstone Third Avenue Value Fund
Sub-Advised by Third Avenue Management LLC
Investment Philosophy
The Touchstone Third Avenue Value Fund primarily invests in common stocks of well-financed companies (meaning companies believed to have high quality assets and a relative absence of liabilities) at a discount to what the Fund’s sub-advisor, Third Avenue Management LLC (“TAM”), believes is their intrinsic value. TAM analyzes companies from the bottom up, focusing on business fundamentals such as competent management teams and strong long-term growth prospects.
Fund Performance
The Touchstone Third Avenue Value Fund underperformed its benchmark, the Russell 3000® Value Index, for the 12-month period ended December 31, 2014. The Fund’s total return was -2.89 percent while the total return of the benchmark was 12.70 percent.
Market Environment
Market volatility returned to financial markets during the second half of the year. Most financial markets exhibited large swings in prices. U.S. Treasuries and the U.S. dollar continued to appreciate while oil and commodity prices fell. Contrary to consensus expectations at the beginning of the year, the yield on the 10-year U.S. Treasury Bond dropped over the course of the year. Also, during the year, the U.S. dollar appreciated significantly relative to most major currencies, and the price of Brent crude oil fell from over $100 to below $50 a barrel. In spite of increased volatility in the second half of the year, global equity markets had a positive year in local currency terms, with U.S. stocks handily outperforming other developed and emerging equity markets. Due to the strength of the U.S. dollar, non-U.S. market returns, when translated into U.S. dollars, were negative.
Portfolio Review
Most of the Fund’s underperformance can be attributed to its holdings in the Materials, Industrials and Financials sectors. Stock selection within these sectors was negative for the year. Capstone Mining Corp. and POSCO were the largest detractors within the Materials sector. Stock prices declined as a result of these companies’ exposure to commodities. POSCO is the largest steel maker in South Korea and the sixth largest producer in the world. It is also one of the lowest cost integrated steel makers in the world. Capstone Mining is a mid-cap copper mining company headquartered in Vancouver.
Within the Financials sector holdings, Comerica Inc. and Leucadia National Corp. were detractors to relative performance. Comerica, Texas’ largest commercial bank, is a conservative lender and has shown exemplary credit history over many cycles. Comerica’s stock price declined in the last quarter of the year mainly as a result of the drop in oil prices, as the bank is based in Texas, the country’s “energy capital.” Leucadia is an investment holding company whose long term, eclectic investment style has compounded returns for shareholders greatly in excess of the market.
Nexans SA (Industrials sector) and Apache Corp. (Energy sector) are two individual names that also detracted from performance as a result of their exposure to oil. Nexans is a Paris-based global leader in the business of manufacturing cables for specific applications in a number of industries including energy, telecommunications, oil and gas, mining as well as for building applications and local area networks. Apache, an independent energy company, explores for, develops, and produces natural gas, crude oil and natural gas liquids. Despite the impact of what we deem is a short-term demand and supply imbalance in oil, we remain supportive of the Fund’s positions.
Management’s Discussion of Fund Performance (Unaudited) (Continued)
Among the top contributors to performance were: Weyerhaeuser Co. (Financials sector), Cheung Kong Holdings Ltd. (Financials sector), Symantec Corp. (Information Technology sector), Bank of New York Mellon Corp. (Financials sector) and Toyota Industries Corp. (Industrials sector). Weyerhaeuser is a Real Estate Investment Trust (“REIT”) with wood products and wood fiber businesses, and the second largest owner of timberlands in the US. This company is well positioned to benefit from a recovery in the U.S. housing market, albeit slow, continues to expand at a healthy pace. Earlier in the year, Weyerhaeuser merged its home building business, WRECO, with TRI Pointe Homes, obtaining significant value for what had been an underperforming asset. Cheung Kong is a Hong Kong based property owner and developer of real estate in Hong Kong and mainland China, and is the controlling shareholder of Hutchison Whampoa. Symantec is a provider of security and back-up solutions to protect people and content in a digital environment. Bank of New York Mellon is a global financial services company with a focus on investment management and investment services. Toyota Industries is a Japanese conglomerate serving varied industries including textile machinery, automobiles, materials handling, electronics and providing logistics solutions.
New purchases included CBS Corp. and General Motors Co. (both Consumer Discretionary sector). CBS Corp. is a national broadcaster and content creator. CBS is currently trading at a discount to its peers and our conservative estimate of net asset value (“NAV”). Our research suggests it is very likely to continue to grow NAV as it is well positioned to capitalize on a new phase of industry transformation where boundaries between distribution and content are being redefined and likely favor content owners over distributors.
General Motors (“GM”), one of the largest automotive companies in the world, has struggled in the last few years: high profile bankruptcy, pension woes and recalls. Negative sentiment around GM’s stock corresponds to a dated perception of GM. Today, the century old automaker has a clean and strong balance sheet, significantly streamlined operations and is one of the most attractively valued large caps in the U.S.
Outlook
We continue to believe that a recovery of the U.S. economy offers the most opportunity going forward. This would be an environment characterized by rising interest rates and inflation. The expectation is that U.S. interest rates will be higher in the next one to three years and that inflation will be more significant going forward, subject to how the Fed decides to monetize its balance sheet. In this environment, we see less macro-focused and less correlated market movements with renewed investor attention to fundamentals. We would welcome this trend.
We believe the Fund is positioned to benefit from interest rate increases, as illustrated by the holdings in asset sensitive Financials, as well as exposure to Real Estate, particularly the U.S. housing market, and commodities, including timber and steel. In addition, we believe a significant number of positions in the Fund will benefit dramatically from corporate improvements. Conversely, a slowdown in the U.S. could provide a headwind for the Fund by slowing growth in many of the companies held in the Fund and refocusing investor attention on the potential for central bank easing actions.
From a new idea generation standpoint, we continue to evaluate companies and industries that are under stress. As such, we are taking a closer look at some of the Energy names that appear to be oversold and are beginning to look attractive on a three to five-year time horizon. We believe the Fund is positioned to benefit from global economic recovery and, despite generally high valuations across global markets, we continue to find opportunities.
Management’s Discussion of Fund Performance (Unaudited) (Continued)
Comparison of the Change in Value of a $10,000 Investment in the
Touchstone Third Avenue Value Fund and the Russell 3000® Value Index
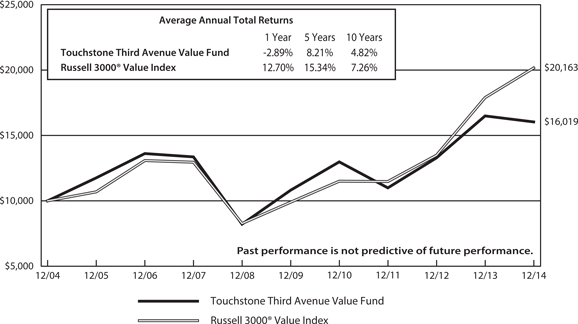
Performance information does not reflect fees that are paid by the separate accounts through which shares of the Fund are sold. Inclusion of those fees would reduce figures for all periods.
The inception date of the Fund was December 14, 1992.
Note to Chart
The Russell 3000® Value Index measures the performance for those Russell 3000® companies with lower price-to book ratios and lower forecasted growth values.
Management’s Discussion of Fund Performance (Unaudited)
Touchstone ETF Funds
Sub-Advised by Todd Asset Management LLC
Touchstone Aggressive ETF Fund
Touchstone Conservative ETF Fund
Touchstone Moderate ETF Fund
Investment Philosophy
Three Funds which invest in Exchanged Traded Funds (ETFs) are available for investors seeking “lifestyle” products for their annuity holdings. The three strategic options include: the Conservative, Moderate, and Aggressive ETF Funds. These funds allocate their assets among up to nine ETFs. These nine ETF selections generally do not change dramatically over time. The more conservative fund has a higher bond weighting and the more aggressive fund has a lower bond weighting.
Fund Performance
The Touchstone Conservative ETF Fund’s total return was 5.23 percent for the 12-month period ended December 31, 2014. The Fund underperformed its benchmark. The total return of its benchmark, the Barclays U.S. Aggregate Bond Index, was 5.97 percent. The Touchstone Moderate ETF Fund’s total return was 6.96 percent, and the Touchstone Aggressive ETF Fund’s total return was 7.49 percent. Both of these Funds underperformed their benchmark, the S&P Composite 1500 Index. The total return of their benchmark was 13.08 percent for the 12-month period ended December 31, 2014. The specific blended benchmark returns were 8.48 percent for the Conservative ETF Fund, 10.27 percent for the Moderate ETF Fund and 11.68 percent for the Aggressive ETF Fund.
Market Environment
The capital markets produced solid returns during 2014 despite concerning headlines about geopolitical tensions and slowing global economic growth. This was reflected in the relative sector weights. The more defensive Utilities, Health Care, and Consumer Staples sectors were among the top performing sectors, while the more economically sensitive Energy, Materials, Consumer Discretionary, and Industrials sectors were among the worst performers. The second half of the year provided evidence of the variation in the performance of the world’s largest economies. Growth in Europe, Japan, and China slowed, while indicators in the U.S. provided further evidence of a strengthening economic recovery and labor market. This divergence in growth rates globally supported a strong appreciation in the U.S. dollar. The diminishing prospects for global economic growth, in combination with increased oil supplies from North America, led to a rapid decline in oil prices and a major sell-off in the Energy sector.
Portfolio Review
Each of the Conservative, Moderate, and Aggressive ETF Funds lagged their respective benchmarks during 2014. The Treasury yield curve flattened, with short-term rates increasing and long-term rates declining. This resulted in the underperformance for the Conservative ETF Fund, as its allocation to the shorter duration Barclays 1-3 Year Treasury underperformed relative to the Barclays Aggregate Bond Index which represents the benchmark’s bond position. The more equity-oriented Moderate and Aggressive ETF Funds also underperformed due to a non-benchmark allocation to international equities. The rapidly appreciating U.S. dollar drove international equities to negative absolute returns and underperformance relative to the benchmark’s allocation to the domestically-focused S&P 1500 Index.
Management’s Discussion of Fund Performance (Unaudited) (Continued)
Outlook
We believe the stock market continues to offer upside potential. Small and mid-caps historically have outperformed large caps during bull markets, therefore we have positioned the Funds to have a modest overweight in these asset classes. While exposure to international equities has detracted from the Funds’ performance in recent periods, we believe that the diversification benefits of these stocks have the potential to enhance risk-adjusted returns.
Management’s Discussion of Fund Performance (Unaudited) (Continued)
Comparison of the Change in Value of a $10,000 Investment in the
Touchstone Aggressive ETF Fund, the S&P Composite 1500 Index (Major Index)
and the Blend: 80% S&P Composite 1500 Index/20% Barclays U.S. Aggregate Bond Index
(Minor Index)
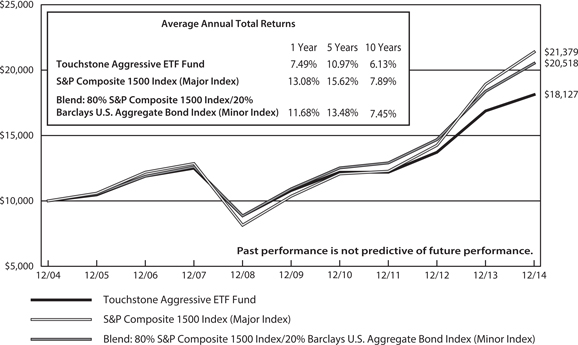
Performance information does not reflect fees that are paid by the separate accounts through which shares of the Fund are sold. Inclusion of those fees would reduce figures for all periods.
The inception date of the Fund was July 16, 2004.
Notes to Chart
S&P Composite 1500 Index is an unmanaged, broad market index representing the large-cap, mid-cap, and small-cap segments of the U.S. equity market.
The Barclays U.S. Aggregate Bond Index is an unmanaged index comprised of U.S. investment grade, fixed rate bond market securities, including government, government agency, corporate and mortgage-backed securities between one and ten years.
Management’s Discussion of Fund Performance (Unaudited) (Continued)
Comparison of the Change in Value of a $10,000 Investment in the
Touchstone Conservative ETF Fund, the Barclays U.S. Aggregate Bond Index (Major Index)
and the Blend: 35% S&P Composite 1500 Index /65% Barclays U.S. Aggregate Bond Index
(Minor Index)
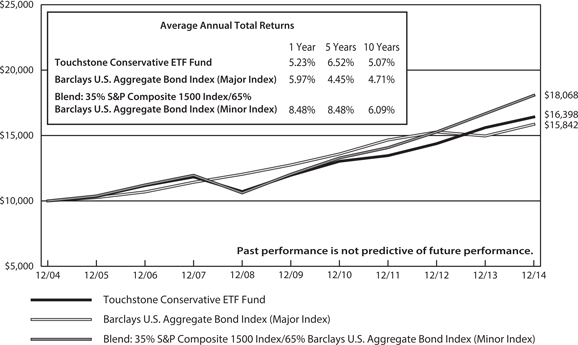
Performance information does not reflect fees that are paid by the separate accounts through which shares of the Fund are sold. Inclusion of those fees would reduce figures for all periods.
The inception date of the Fund was July 16, 2004.
Notes to Chart
The Barclays U.S. Aggregate Bond Index is an unmanaged index comprised of U.S. investment grade, fixed rate bond market securities, including government, government agency, corporate and mortgage-backed securities between one and ten years.
S&P Composite 1500 Index is an unmanaged, broad market index representing the large-cap, mid-cap, and small-cap segments of the U.S. equity market.
Management’s Discussion of Fund Performance (Unaudited) (Continued)
Comparison of the Change in Value of a $10,000 Investment in the
Touchstone Moderate ETF Fund, the S&P Composite 1500 Index (Major Index)
and the Blend: 60% S&P Composite 1500 Index/40% Barclays U.S. Aggregate Bond Index
(Minor Index)
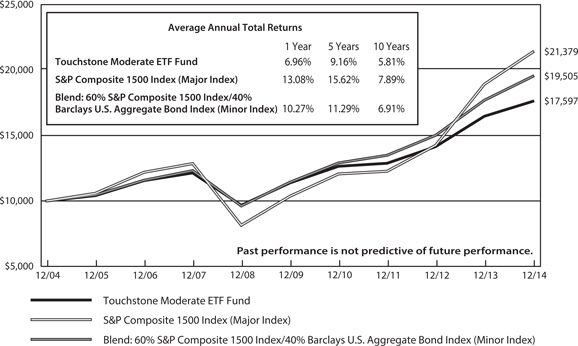
Performance information does not reflect fees that are paid by the separate accounts through which shares of the Fund are sold. Inclusion of those fees would reduce figures for all periods.
The inception date of the Fund was July 16, 2004.
Notes to Chart
S&P Composite 1500 Index is an unmanaged, broad market index representing the large-cap, mid-cap, and small-cap segments of the U.S. equity market.
The Barclays U.S. Aggregate Bond Index is an unmanaged index comprised of U.S. investment grade, fixed rate bond market securities, including government, government agency, corporate and mortgage-backed securities between one and ten years.
Tabular Presentation of Portfolios of Investments (Unaudited)
December 31, 2014
The illustrations below provide each Fund’s credit quality, sector allocation or geographic allocation. We hope it will be useful to shareholders as it summarizes key information about each Fund’s investments.
| Touchstone Active Bond Fund | | | |
| Credit Quality* | | (% of Investment Securities) | |
| AAA/Aaa | | | 49.4 | % |
| AA/Aa | | | 3.7 | |
| A | | | 9.3 | |
| BBB/Baa | | | 18.3 | |
| BB/Ba | | | 8.8 | |
| B | | | 6.8 | |
| CC | | | 0.4 | |
| C or Lower | | | 0.8 | |
| Other Assets/Liabilities (Net) | | | 2.5 | |
| Total | | | 100.0 | % |
| Touchstone Baron Small Cap Growth Fund |
| Sector Allocation** | | (% of Net Assets) | |
| Consumer Discretionary | | | 26.4 | % |
| Financials | | | 22.1 | |
| Industrials | | | 14.7 | |
| Information Technology | | | 13.2 | |
| Consumer Staples | | | 7.1 | |
| Utilities | | | 4.1 | |
| Health Care | | | 3.0 | |
| Energy | | | 2.2 | |
| Telecommunication Services | | | 1.0 | |
| Materials | | | 0.9 | |
| Investment Funds | | | 20.1 | |
| Other Assets/Liabilities (Net) | | | (14.8 | ) |
| Total | | | 100.0 | % |
| Touchstone High Yield Fund | | | |
| Credit Quality* | | (% of Investment Securities) | |
| BBB/Baa | | | 0.9 | % |
| BB/Ba | | | 46.6 | |
| B/B | | | 41.9 | |
| CCC | | | 1.0 | |
| Other Assets/Liabilities (Net) | | | 9.6 | |
| Total | | | 100.0 | % |
| Touchstone Large Cap Core Equity Fund | | | |
| Sector Allocation** | | (% of Net Assets) | |
| Financials | | | 21.0 | % |
| Information Technology | | | 19.4 | |
| Health Care | | | 15.8 | |
| Consumer Discretionary | | | 14.0 | |
| Industrials | | | 13.6 | |
| Energy | | | 6.3 | |
| Consumer Staples | | | 4.9 | |
| Utilities | | | 1.1 | |
| Materials | | | 1.0 | |
| Telecommunication Services | | | 0.5 | |
| Other Assets/Liabilities (Net) | | | 2.4 | |
| Total | | | 100.0 | % |
| * | Credit quality may be rated by Standard & Poor’s, Moody’s and Fitch. If all three agencies rate the bond, the middle or common rating is used; if two of the agencies rate the bond, the lower rating is used; if one agency rates the bond, that rating is used; if none of the agencies rate the bond, the bond will be classified as non-rated. |
| ** | Sector Classifications are based upon the Global Industry Classification Standard (GICS®). |
Tabular Presentation of Portfolios of Investments (Unaudited) (Continued)
| Touchstone Mid Cap Growth Fund | | | |
| Sector Allocation* | | (% of Net Assets) | |
| Consumer Discretionary | | | 20.2 | % |
| Health Care | | | 18.5 | |
| Information Technology | | | 16.8 | |
| Industrials | | | 13.8 | |
| Financials | | | 9.2 | |
| Consumer Staples | | | 6.8 | |
| Materials | | | 6.4 | |
| Energy | | | 6.0 | |
| Investment Funds | | | 7.3 | |
| Other Assets/Liabilities (Net) | | | (5.0 | ) |
| Total | | | 100.0 | % |
| Touchstone Money Market Fund |
| Credit Quality | | (% of Investment Securities) |
| A-1/P-1/MIG1/SP1 | | | 99.4 | % |
| FW1(NR)** | | | 0.6 | |
| Total | | | 100.0 | % |
| Portfolio Allocation* | | (% of Net Assets) | |
| Variable Rate Demand Notes | | | 48.1 | % |
| U.S. Government Agency Obligations | | | 24.9 | |
| Corporate Bonds | | | 12.6 | |
| Commercial Paper | | | 9.7 | |
| Certificate of Deposit | | | 3.5 | |
| Municipal Bonds | | | 1.1 | |
| Other Assets/Liabilities (Net) | | | 0.1 | |
| Total | | | 100.0 | % |
| Touchstone Third Avenue Value Fund | | | |
| Geographic Allocation | | (% of Net Assets) | |
| Common Stocks | | | | |
| United States | | | 72.5 | % |
| France | | | 6.8 | |
| Canada | | | 6.2 | |
| Hong Kong | | | 5.9 | |
| Korea | | | 2.8 | |
| China | | | 1.5 | |
| Investment Funds | | | 8.4 | |
| Other Assets/Liabilities (Net) | | | (4.1 | ) |
| Total | | | 100.0 | % |
| Touchstone Aggressive ETF Fund |
| Sector Allocation* | | (% of Net Assets) | |
| Exchange Traded Funds | | | 98.8 | % |
| Investment Funds | | | 13.5 | |
| Other Assets/Liabilities (Net) | | | (12.3 | ) |
| Total | | | 100.0 | % |
| Touchstone Conservative ETF Fund | | | |
| Sector Allocation* | | (% of Net Assets) | |
| Exchange Traded Funds | | | 98.8 | % |
| Investment Funds | | | 19.3 | |
| Other Assets/Liabilities (Net) | | | (18.1 | ) |
| Total | | | 100.0 | % |
| Touchstone Moderate ETF | | | |
| Sector Allocation* | | (% of Net Assets) | |
| Exchange Traded Funds | | | 98.8 | % |
| Investment Funds | | | 17.7 | |
| Other Assets/Liabilities (Net) | | | (16.5 | ) |
| Total | | | 100.0 | % |
| * | Sector Classifications are based upon the Global Industry Classification Standard (GICS®). |
| ** | Equivalent to Standard & Poor’s and Moody’s highest short-term ratings of A-1 and P-1, respectively, based upon independent research conducted by Fort Washington Investment Advisors, Inc. |
NR - Not Rated
Portfolio of Investments
Touchstone Active Bond Fund – December 31, 2014
| Principal | | | | | Market | |
| Amount | | | | | Value | |
| | | | | | | |
| | | | | Corporate Bonds — 42.7% | | | | |
| | | | | | | | | |
| | | | | Financials — 11.6% | | | | |
| $ | 233,000 | | | AerCap Ireland Capital Ltd. / AerCap | | | | |
| | | | | Global Aviation Trust (Ireland), 144a, | | | | |
| | | | | 4.500%, 5/15/21 | | $ | 235,912 | |
| | 134,000 | | | Ally Financial, Inc., 8.000%, 11/1/31 | | | 170,515 | |
| | 175,000 | | | American Express Credit Corp. MTN, | | | | |
| | | | | 2.375%, 3/24/17 | | | 178,963 | |
| | 300,000 | | | Bank of America Corp., | | | | |
| | | | | 5.200%, 12/29/49(A) | | | 277,125 | |
| | 100,000 | | | Bank of America Corp. MTN, | | | | |
| | | | | 5.000%, 5/13/21 | | | 111,585 | |
| | 155,000 | | | Boston Properties LP, REIT, | | | | |
| | | | | 3.850%, 2/1/23 | | | 160,902 | |
| | 290,000 | | | Caterpillar Financial Services Corp. | | | | |
| | | | | MTN, 5.450%, 4/15/18 | | | 323,672 | |
| | 125,000 | | | Citigroup, Inc., 3.375%, 3/1/23 | | | 126,118 | |
| | 300,000 | | | Citigroup, Inc., 5.350%, 4/29/49(A) | | | 276,750 | |
| | 300,000 | | | Fifth Third Bancorp, | | | | |
| | | | | 4.900%, 12/29/49(A) | | | 290,250 | |
| | 265,000 | | | Ford Motor Credit Co. LLC, | | | | |
| | | | | 2.375%, 1/16/18 | | | 266,536 | |
| | 300,000 | | | General Electric Capital Corp., | | | | |
| | | | | 6.250%, 12/29/49(A) | | | 326,625 | |
| | 155,000 | | | General Electric Capital Corp. MTN | | | | |
| | | | | MTN, 4.650%, 10/17/21 | | | 174,705 | |
| | 115,000 | | | Goldman Sachs Group, Inc. (The), | | | | |
| | | | | 5.250%, 7/27/21 | | | 129,796 | |
| | 300,000 | | | Goldman Sachs Group, Inc. (The), | | | | |
| | | | | 5.700%, 12/29/49(A) | | | 303,450 | |
| | 180,000 | | | Health Care REIT, Inc., 6.125%, 4/15/20 | | | 206,916 | |
| | 160,000 | | | HSBC Bank PLC (United Kingdom), | | | | |
| | | | | 144a, 4.125%, 8/12/20 | | | 173,196 | |
| | 145,000 | | | JPMorgan Chase & Co., | | | | |
| | | | | 3.250%, 9/23/22 | | | 145,845 | |
| | 300,000 | | | JPMorgan Chase & Co., | | | | |
| | | | | 5.150%, 12/29/49(A) | | | 282,600 | |
| | 300,000 | | | Morgan Stanley, 5.450%, 7/29/49(A) | | | 300,540 | |
| | 166,000 | | | Navient LLC MTN, 6.125%, 3/25/24 | | | 163,095 | |
| | 160,000 | | | Omega Healthcare Investors, Inc. REIT, | | | | |
| | | | | 4.950%, 4/1/24 | | | 166,502 | |
| | 231,000 | | | PHH Corp., 6.375%, 8/15/21 | | | 211,654 | |
| | 160,000 | | | PNC Bank NA, 2.700%, 11/1/22 | | | 153,226 | |
| | 250,000 | | | Simon Property Group LP, REIT, | | | | |
| | | | | 2.750%, 2/1/23 | | | 244,776 | |
| | 275,000 | | | Wells Fargo & Co., 5.900%, 12/29/49(A) | | | 277,062 | |
| | | | | | | | 5,678,316 | |
| | | | | | | | | |
| | | | | Consumer Discretionary — 7.4% | | | | |
| | 230,000 | | | AutoNation, Inc., 5.500%, 2/1/20 | | | 252,244 | |
| | 215,000 | | | CBS Corp., 4.900%, 8/15/44 | | | 218,325 | |
| | 233,000 | | | CCO Holdings LLC / CCO Holdings | | | | |
| | | | | Capital Corp., 6.625%, 1/31/22 | | | 247,562 | |
| | 233,000 | | | Cequel Communications Holdings I | | | | |
| | | | | LLC / Cequel Capital Corp., 144a, | | | | |
| | | | | 6.375%, 9/15/20 | | | 241,155 | |
| | 275,000 | | | Comcast Corp., 4.650%, 7/15/42 | | | 300,991 | |
| | 195,000 | | | DIRECTV Holdings LLC / DIRECTV | | | | |
| | | | | Financing Co., Inc., 2.400%, 3/15/17 | | | 198,679 | |
| | 233,000 | | | DISH DBS Corp., 6.750%, 6/1/21 | | | 250,475 | |
| | 205,000 | | | Forest Laboratories, Inc., 144a, | | | | |
| | | | | 5.000%, 12/15/21 | | | 221,979 | |
| | 150,000 | | | Home Depot, Inc., 5.950%, 4/1/41 | | | 195,911 | |
| | 116,000 | | | MGM Resorts International, | | | | |
| | | | | 6.750%, 10/1/20 | | | 121,800 | |
| | 290,000 | | | Mondelez International, Inc., | | | | |
| | | | | 4.125%, 2/9/16 | | | 300,774 | |
| | 175,000 | | | News America, Inc., 6.900%, 3/1/19 | | | 206,352 | |
| | 240,000 | | | Scripps Networks Interactive, Inc., | | | | |
| | | | | 2.750%, 11/15/19 | | | 241,004 | |
| | 214,000 | | | Sirius XM Radio, Inc., 144a, | | | | |
| | | | | 5.250%, 8/15/22 | | | 224,700 | |
| | 175,000 | | | Time Warner Cable, Inc., | | | | |
| | | | | 4.125%, 2/15/21 | | | 187,283 | |
| | 175,000 | | | Viacom, Inc., 6.250%, 4/30/16 | | | 186,953 | |
| | | | | | | | 3,596,187 | |
| | | | | | | | | |
| | | | | Energy — 6.7% | | | | |
| | 185,000 | | | Access Midstream Partners LP / ACMP | | | | |
| | | | | Finance Corp., 5.875%, 4/15/21 | | | 192,862 | |
| | 375,000 | | | Boardwalk Pipelines LP, 3.375%, 2/1/23 | | | 341,614 | |
| | 250,000 | | | BP Capital Markets PLC (United | | | | |
| | | | | Kingdom), 3.994%, 9/26/23 | | | 257,234 | |
| | 150,000 | | | Cenovus Energy, Inc. (Canada), | | | | |
| | | | | 6.750%, 11/15/39 | | | 170,881 | |
| | 115,000 | | | Chesapeake Energy Corp., | | | | |
| | | | | 5.375%, 6/15/21 | | | 114,928 | |
| | 265,000 | | | CNOOC Finance 2012 Ltd. (Virgin | | | | |
| | | | | Islands), 144a, 3.875%, 5/2/22 | | | 269,578 | |
| | 285,000 | | | ConocoPhillips Co., 3.350%, 11/15/24 | | | 287,949 | |
| | 245,000 | | | Continental Resources, Inc./OK, | | | | |
| | | | | 7.125%, 4/1/21 | | | 263,375 | |
| | 215,000 | | | DCP Midstream LLC, 144a, | | | | |
| | | | | 5.350%, 3/15/20 | | | 225,028 | |
| | 231,000 | | | FTS International, Inc., 144a, | | | | |
| | | | | 6.250%, 5/1/22 | | | 168,630 | |
| | 260,000 | | | Kinder Morgan Energy Partners LP, | | | | |
| | | | | 3.500%, 9/1/23 | | | 246,831 | |
| | 233,000 | | | Linn Energy LLC / Linn Energy Finance | | | | |
| | | | | Corp., 8.625%, 4/15/20 | | | 202,710 | |
| | 125,000 | | | Petrobras International Finance Co. - | | | | |
| | | | | Pifco (Cayman Islands), | | | | |
| | | | | 5.375%, 1/27/21 | | | 115,821 | |
| | 156,000 | | | Plains Exploration & Production Co., | | | | |
| | | | | 6.875%, 2/15/23 | | | 173,550 | |
| | 265,000 | | | Suncor Energy, Inc. (Canada), | | | | |
| | | | | 3.600%, 12/1/24 | | | 261,861 | |
| | | | | | | | 3,292,852 | |
| | | | | | | | | |
| | | | | Telecommunication Services — 3.7% | | | | |
| | 113,000 | | | Frontier Communications Corp., | | | | |
| | | | | 6.875%, 1/15/25 | | | 113,000 | |
| | 220,000 | | | Orange SA (France), 2.750%, 2/6/19 | | | 224,086 | |
Touchstone Active Bond Fund (Continued)
| Principal | | | | | Market | |
| Amount | | | | | Value | |
| | | | | | | | | |
| | | | | Corporate Bonds — 42.7% (Continued) | | | | |
| | | | | | | | | |
| | | | | Telecommunication Services — (Continued) | | | | |
| $ | 240,000 | | | SBA Tower Trust, 144a, | | | | |
| | | | | 2.898%, 10/15/44 | | $ | 240,629 | |
| | 161,000 | | | Sprint Nextel Corp., 6.000%, 11/15/22 | | | 148,120 | |
| | 233,000 | | | T-Mobile USA, Inc., 6.731%, 4/28/22 | | | 239,990 | |
| | 233,000 | | | UPCB Finance III Ltd. (Cayman Islands), | | | | |
| | | | | 144a, 6.625%, 7/1/20 | | | 244,650 | |
| | 275,000 | | | Verizon Communications, Inc., | | | | |
| | | | | 6.250%, 4/1/37 | | | 337,492 | |
| | 254,000 | | | Windstream Corp., 6.375%, 8/1/23 | | | 237,490 | |
| | | | | | | | 1,785,457 | |
| | | | | | | | | |
| | | | | Industrials — 3.0% | | | | |
| | 200,000 | | | Air Lease Corp., 5.625%, 4/1/17 | | | 215,500 | |
| | 265,000 | | | Burlington Northern Santa Fe LLC, | | | | |
| | | | | 5.750%, 5/1/40 | | | 326,947 | |
| | 175,000 | | | FedEx Corp., 5.100%, 1/15/44 | | | 202,067 | |
| | 116,000 | | | Navios Maritime Holdings, Inc. / | | | | |
| | | | | Navios Maritime Finance II US Inc. | | | | |
| | | | | (Marshall Islands), 144a, | | | | |
| | | | | 7.375%, 1/15/22 | | | 106,140 | |
| | 200,000 | | | Republic Services, Inc., 3.550%, 6/1/22 | | | 205,323 | |
| | 235,000 | | | Rexel SA (France), 144a, | | | | |
| | | | | 5.250%, 6/15/20 | | | 236,762 | |
| | 175,000 | | | United Rentals North America, Inc., | | | | |
| | | | | 7.625%, 4/15/22 | | | 192,412 | |
| | | | | | | | 1,485,151 | |
| | | | | | | | | |
| | | | | Utilities — 2.5% | | | | |
| | 65,000 | | | CenterPoint Energy, Inc., | | | | |
| | | | | 5.950%, 2/1/17 | | | 70,873 | |
| | 275,000 | | | Dominion Resources, Inc., | | | | |
| | | | | 5.750%, 10/1/54(A) | | | 286,939 | |
| | 145,000 | | | Dynegy, Inc., 5.875%, 6/1/23 | | | 137,750 | |
| | 145,000 | | | Iberdrola International BV, | | | | |
| | | | | 6.750%, 7/15/36 | | | 184,847 | |
| | 145,000 | | | NextEra Energy Capital Holdings, Inc., | | | | |
| | | | | 6.350%, 10/1/66(A) | | | 144,094 | |
| | 230,000 | | | NRG Energy, Inc., 6.625%, 3/15/23 | | | 239,200 | |
| | 165,000 | | | PPL Energy Supply LLC, | | | | |
| | | | | 6.500%, 5/1/18 | | | 173,293 | |
| | | | | | | | 1,236,996 | |
| | | | | | | | | |
| | | | | Consumer Staples — 2.5% | | | | |
| | 190,000 | | | Anheuser-Busch InBev Worldwide, | | | | |
| | | | | Inc., 8.200%, 1/15/39 | | | 293,326 | |
| | 295,000 | | | Cargill, Inc., 144a, 1.900%, 3/1/17 | | | 298,078 | |
| | 155,000 | | | Kraft Foods Group, Inc., | | | | |
| | | | | 6.875%, 1/26/39 | | | 204,872 | |
| | 233,000 | | | Post Holdings, Inc., 7.375%, 2/15/22 | | | 233,000 | |
| | 200,000 | | | Walgreens Boots Alliance, Inc., | | | | |
| | | | | 2.700%, 11/18/19 | | | 201,018 | |
| | | | | | | | 1,230,294 | |
| | | | | | | | | |
| | | | | Materials — 2.0% | | | | |
| | 233,000 | | | ArcelorMittal (Luxembourg), | | | | |
| | | | | 6.000%, 3/1/21 | | | 242,320 | |
| | 155,000 | | | Domtar Corp., 10.750%, 6/1/17 | | | 184,229 | |
| | 175,000 | | | First Quantum Minerals Ltd. (Canada), | | | | |
| | | | | 144a, 7.250%, 10/15/19 | | | 161,875 | |
| | 175,000 | | | Glencore Funding LLC, 144a, | | | | |
| | | | | 2.500%, 1/15/19 | | | 172,318 | |
| | 175,000 | | | LyondellBasell Industries N.V. | | | | |
| | | | | (Netherlands), 6.000%, 11/15/21 | | | 201,418 | |
| | | | | | | | 962,160 | |
| | | | | | | | | |
| | | | | Health Care — 1.9% | | | | |
| | 233,000 | | | CHS / Community Health Systems, | | | | |
| | | | | Inc., 7.125%, 7/15/20 | | | 248,436 | |
| | 186,000 | | | HCA, Inc., 6.500%, 2/15/20 | | | 208,413 | |
| | 31,000 | | | Select Medical Corp., 6.375%, 6/1/21 | | | 31,465 | |
| | 265,000 | | | Valeant Pharmaceuticals International, | | | | |
| | | | | 144a, 6.750%, 8/15/21 | | | 276,925 | |
| | 185,000 | | | Ventas Realty LP, 1.550%, 9/26/16 | | | 185,741 | |
| | | | | | | | 950,980 | |
| | | | | | | | | |
| | | | | Information Technology — 1.4% | | | | |
| | 450,000 | | | Apple, Inc., 1.000%, 5/3/18 | | | 443,322 | |
| | 100,000 | | | Intel Corp., 3.300%, 10/1/21 | | | 104,863 | |
| | 125,000 | | | Oracle Corp., 3.875%, 7/15/20 | | | 134,316 | |
| | | | | | | | 682,501 | |
| | | | | Total Corporate Bonds | | $ | 20,900,894 | |
| | | | | | | | | |
| | | | | U.S. Government Mortgage-Backed Obligations — 21.1% | | | | |
| | 58,705 | | | FHLMC, Pool #A56988, 5.500%, 2/1/37 | | | 65,570 | |
| | 237,519 | | | FHLMC, Pool #A95946, 4.000%, 1/1/41 | | | 253,521 | |
| | 254,772 | | | FHLMC, Pool #A96485, 4.500%, 1/1/41 | | | 277,740 | |
| | 80,905 | | | FHLMC, Pool #G03217, 5.500%, 9/1/37 | | | 90,234 | |
| | 45,992 | | | FHLMC, Pool #G03781, 6.000%, 1/1/38 | | | 51,986 | |
| | 107,246 | | | FHLMC, Pool #G06031, 5.500%, 3/1/40 | | | 119,812 | |
| | 22,484 | | | FNMA, Pool #254759, 4.500%, 6/1/18 | | | 23,621 | |
| | 12,807 | | | FNMA, Pool #535290, 8.000%, 5/1/30 | | | 15,604 | |
| | 9,856 | | | FNMA, Pool #561741, 7.500%, 1/1/31 | | | 11,679 | |
| | 27,593 | | | FNMA, Pool #889734, 5.500%, 6/1/37 | | | 30,833 | |
| | 94,563 | | | FNMA, Pool #899079, 5.000%, 3/1/37 | | | 104,401 | |
| | 40,129 | | | FNMA, Pool #933806, 5.000%, 5/1/38 | | | 44,304 | |
| | 19,429 | | | FNMA, Pool #974401, 4.500%, 4/1/23 | | | 20,892 | |
| | 29,645 | | | FNMA, Pool #974403, 4.500%, 4/1/23 | | | 31,860 | |
| | 51,116 | | | FNMA, Pool #984256, 5.000%, 6/1/23 | | | 55,226 | |
| | 37,454 | | | FNMA, Pool #995220, 6.000%, 11/1/23 | | | 40,937 | |
| | 36,312 | | | FNMA, Pool #995472, 5.000%, 11/1/23 | | | 39,652 | |
| | 158,466 | | | FNMA, Pool #AB1149, 5.000%, 6/1/40 | | | 175,369 | |
| | 115,993 | | | FNMA, Pool #AB1800, 4.000%, 11/1/40 | | | 124,619 | |
| | 584,560 | | | FNMA, Pool #AB5910, 3.000%, 8/1/32 | | | 604,474 | |
| | 95,962 | | | FNMA, Pool #AB5989, 2.500%, 8/1/27 | | | 97,964 | |
| | 222,338 | | | FNMA, Pool #AD3795, 4.500%, 4/1/40 | | | 241,569 | |
| | 345,325 | | | FNMA, Pool #AD9150, 5.000%, 8/1/40 | | | 383,292 | |
| | 526,583 | | | FNMA, Pool #AE0548, 4.500%, 11/1/40 | | | 572,423 | |
| | 62,799 | | | FNMA, Pool #AE0831, 6.000%, 9/1/39 | | | 71,262 | |
| | 304,040 | | | FNMA, Pool #AE4429, 4.000%, 10/1/40 | | | 324,932 | |
| | 33,106 | | | FNMA, Pool #AH2666, 4.000%, 1/1/26 | | | 35,377 | |
| | 60,140 | | | FNMA, Pool #AH3493, 4.000%, 2/1/26 | | | 64,449 | |
| | 176,902 | | | FNMA, Pool #AI0805, 4.500%, 7/1/41 | | | 192,227 | |
Touchstone Active Bond Fund (Continued)
| Principal | | | | | Market | |
| Amount | | | | | Value | |
| | | | | | | |
| | | | | U.S. Government Mortgage-Backed Obligations — 21.1% (Continued) | | | | |
| $ | 150,984 | | | FNMA, Pool #AI2999, 3.500%, 6/1/26 | | $ | 159,693 | |
| | 109,340 | | | FNMA, Pool #AI6697, 3.000%, 9/1/26 | | | 113,909 | |
| | 585,582 | | | FNMA, Pool #AJ5457, 4.000%, 11/1/41 | | | 628,213 | |
| | 610,426 | | | FNMA, Pool #AL0054, 4.500%, 2/1/41 | | | 663,406 | |
| | 127,895 | | | FNMA, Pool #AL2663, 4.000%, 1/1/26 | | | 136,677 | |
| | 474,036 | | | FNMA, Pool #AL3318, 3.500%, 3/1/43 | | | 496,535 | |
| | 385,444 | | | FNMA, Pool #AU3789, 2.500%, 8/1/28 | | | 393,243 | |
| | 344,370 | | | FNMA, Pool #MA0885, | | | | |
| | | | | 3.500%, 10/1/31 | | | 363,486 | |
| | 494,162 | | | FNMA, Pool #MA1175, 3.000%, 9/1/42 | | | 500,906 | |
| | 355,661 | | | FNMA, Pool #MA1543, 3.500%, 8/1/33 | | | 375,314 | |
| | 570,290 | | | GNMA, Pool #4853, 4.000%, 11/20/40 | | | 613,571 | |
| | 388,930 | | | GNMA, Pool #4883, 4.500%, 12/20/40 | | | 427,199 | |
| | 171,676 | | | GNMA, Pool #736696, 4.500%, 5/15/40 | | | 188,197 | |
| | 32,323 | | | GNMA, Pool #748495, 4.000%, 8/15/40 | | | 34,731 | |
| | 14,166 | | | GNMA, Pool #8503, 1.625%, 9/20/24(A) | | | 14,602 | |
| | 524,078 | | | GNMA, Pool #AD1745, | | | | |
| | | | | 3.000%, 2/20/43 | | | 538,229 | |
| | 513,422 | | | GNMA, Pool #MA1157, | | | | |
| | | | | 3.500%, 7/20/43 | | | 539,643 | |
| | | | | Total U.S. Government Mortgage-Backed Obligations | | $ | 10,353,383 | |
| | | | | | | | | |
| | | | | U.S. Treasury Obligations — 21.4% | | | | |
| | 4,230,000 | | | U.S. Treasury Note, 0.500%, 11/30/16 | | | 4,219,425 | |
| | 2,860,000 | | | U.S. Treasury Note, 0.875%, 11/15/17 | | | 2,846,369 | |
| | 165,000 | | | U.S. Treasury Note, 1.500%, 10/31/19 | | | 163,994 | |
| | 2,580,000 | | | United States Treasury Inflation | | | | |
| | | | | Indexed Bonds, 0.625%, 1/15/24 | | | 2,636,845 | |
| | 535,000 | | | United States Treasury Inflation | | | | |
| | | | | Indexed Bonds, 1.375%, 2/15/44 | | | 616,925 | |
| | | | | Total U.S. Treasury Obligations | | $ | 10,483,558 | |
| | | | | | | | | |
| | | | | Asset-Backed Securities — 3.8% | | | | |
| | 397,000 | | | California Republic Auto Receivables | | | | |
| | | | | Trust, Ser 2014-2, Class A4, | | | | |
| | | | | 1.570%, 12/16/19 | | | 395,855 | |
| | 370,000 | | | Capital Auto Receivables Asset Trust, | | | | |
| | | | | Ser 2014-1, Class A3, | | | | |
| | | | | 1.320%, 6/20/18 | | | 371,417 | |
| | 375,000 | | | Chrysler Capital Auto Receivables | | | | |
| | | | | Trust, Ser 2013-AA, Class A3, 144a, | | | | |
| | | | | 0.910%, 4/16/18 | | | 375,783 | |
| | 318,633 | | | Countrywide Asset-Backed | | | | |
| | | | | Certificates, Ser 2007-S1, Class A5, | | | | |
| | | | | 6.018%, 11/25/36(A) | | | 286,603 | |
| | 147,367 | | | Marriott Vacation Club Owner Trust, | | | | |
| | | | | Ser 2009-2A, Class A, 144a, | | | | |
| | | | | 4.809%, 7/20/31 | | | 148,390 | |
| | 275,000 | | | Santander Drive Auto Receivables | | | | |
| | | | | Trust, Ser 2013-5, Class A3, | | | | |
| | | | | 0.820%, 2/15/18 | | | 275,162 | |
| | | | | Total Asset-Backed Securities | | $ | 1,853,210 | |
| | | | | | | | | |
| | | | | Commercial Mortgage-Backed Securities — 3.7% | | | | |
| | 54,274 | | | Banc of America Merrill Lynch | | | | |
| | | | | Commercial Mortgage Trust 2006-2, | | | | |
| | | | | Ser 2006-2, Class A3, | | | | |
| | | | | 5.700%, 5/10/45(A) | | | 54,439 | |
| | 365,000 | | | Banc of America Merrill Lynch | | | | |
| | | | | Commercial Mortgage, Inc., Ser | | | | |
| | | | | 2006-6, Class A3, 5.369%, 10/10/45 | | | 370,363 | |
| | 125,898 | | | Banc of America Merrill Lynch | | | | |
| | | | | Commercial Mortgage, Inc., Ser | | | | |
| | | | | 2007-2, Class AAB, | | | | |
| | | | | 5.562%, 4/10/49(A) | | | 128,402 | |
| | 350,000 | | | COMM Mortgage Trust, Ser | | | | |
| | | | | 2014-SAVA, Class A, 144a, | | | | |
| | | | | 1.311%, 6/15/34(A) | | | 349,812 | |
| | 94,191 | | | First Union Commercial Mortgage | | | | |
| | | | | Trust, Ser 1999-C1, Class F, 144a, | | | | |
| | | | | 5.350%, 10/15/35 | | | 95,015 | |
| | 369,549 | | | Hilton USA Trust, Ser 2013-HLF, Class | | | | |
| | | | | AFL, 144a, 1.157%, 11/5/30 | | | 369,568 | |
| | 325,000 | | | Morgan Stanley Bank of America | | | | |
| | | | | Merrill Lynch Trust, Ser 2014-C18, | | | | |
| | | | | Class ASB, 3.621%, 10/15/47 | | | 339,953 | |
| | 94,929 | | | Wachovia Bank Commercial Mortgage | | | | |
| | | | | Trust, Ser 2007-C34, Class APB, | | | | |
| | | | | 5.617%, 5/15/46†† | | | 95,899 | |
| | | | | Total Commercial Mortgage-Backed Securities | | $ | 1,803,451 | |
| | | | | | | | | |
| | | | | Municipal Bonds — 2.2% | | | | |
| | | | | | | | | |
| | | | | California — 0.4% | | | | |
| | 180,000 | | | California St, UTGO, Ser 2009, | | | | |
| | | | | 5.950%, 4/1/16 | | | 191,783 | |
| | | | | | | | | |
| | | | | Georgia — 0.5% | | | | |
| | 190,000 | | | Municipal Electric Auth. of Georgia | | | | |
| | | | | Rev, Ser 2010, 6.655%, 4/1/57 | | | 250,439 | |
| | | | | | | | | |
| | | | | New York — 0.7% | | | | |
| | 320,000 | | | NY Housing Development Corp., Ref 8 | | | | |
| | | | | Spruce Street Class B, | | | | |
| | | | | 3.864%, 2/15/48 | | | 331,152 | |
| | | | | | | | | |
| | | | | Ohio — 0.6% | | | | |
| | 275,000 | | | JobsOhio Beverage System, Ser B, | | | | |
| | | | | 4.532%, 1/1/35 | | | 295,100 | |
| | | | | Total Municipal Bonds | | $ | 1,068,474 | |
| | | | | | | | | |
| | | | | Non-Agency Collateralized Mortgage Obligations — 1.2% | | | | |
| | 49,330 | | | Deutsche ALT-A Securities, Inc. | | | | |
| | | | | Alternate Loan Trust, Ser 2003-2XS, | | | | |
| | | | | Class A6, 5.470%, 9/25/33(B) | | | 50,318 | |
Touchstone Active Bond Fund (Continued)
| Principal | | | | | Market | |
| Amount | | | | | Value | |
| | | | | | | |
| | | | | Non-Agency Collateralized Mortgage Obligations — 1.2% (Continued) | | | | |
| $ | 172,017 | | | Deutsche ALT-A Securities, Inc. | | | | |
| | | | | Alternate Loan Trust, Ser 2005-3, | | | | |
| | | | | Class 4A4, 5.250%, 6/25/35 | | $ | 174,112 | |
| | 158,209 | | | Residential Asset Securitization Trust, | | | | |
| | | | | Ser 2006-A1, Class 1A3, | | | | |
| | | | | 6.000%, 4/25/36 | | | 129,176 | |
| | 161,989 | | | Structured Asset Securities Corp., Ser | | | | |
| | | | | 2005-17, Class 5A1, | | | | |
| | | | | 5.500%, 10/25/35 | | | 142,492 | |
| | 102,834 | | | Washington Mutual Alternative | | | | |
| | | | | Mortgage Pass-Through | | | | |
| | | | | Certificates, Ser 2005-9, Class 2A4, | | | | |
| | | | | 5.500%, 11/25/35†† | | | 95,516 | |
| | | | | Total Non-Agency Collateralized Mortgage Obligations | | $ | 591,614 | |
| | | | | | | | | |
| | | | | Sovereign Bond — 0.5% | | | | |
| | 275,000 | | | Province of Quebec Canada, 2.625%, | | | | |
| | | | | 2/13/23 | | | 274,663 | |
| | | | | | | | | |
| | | | | Agency Collateralized Mortgage Obligation — 0.0% | | | | |
| | 15,466 | | | GNMA, Ser 2003-11, Class GJ, | | | | |
| | | | | 4.000%, 10/17/29 | | | 16,339 | |
| | | | | | | | | |
| | | | | Investment Fund — 2.8% | | | | |
| | 1,352,467 | | | Touchstone Institutional Money | | | | |
| | | | | Market Fund, 0.01%^∞Ω | | | 1,352,467 | |
| | | | | | | | | |
| | | | | Total Investment Securities —99.4% | | | | |
| | | | | (Cost $48,177,326) | | $ | 48,698,053 | |
| | | | | | | | | |
| | | | | Other Assets in | | | | |
| | | | | Excess of Liabilities — 0.6% | | | 280,388 | |
| | | | | | | | | |
| | | | | Net Assets — 100.0% | | $ | 48,978,441 | |
| (A) | Variable rate security - Rate reflected is the rate in effect as of December 31, 2014. |
| (B) | Step Bond - A bond that pays an initial interest rate for the first period and then a higher interest rate for the following periods until maturity. The interest rate shown reflects the rate in effect at December 31, 2014. |
| ^ | Affiliated Fund. See Note 4 in Notes to Financial Statements. |
| †† | The issuers and/or sponsors of certain mortgage-backed securities may no longer exist; however, the securities held by the Fund are separate legal entities organized as trusts and publicly traded. The Fund receives principal and interest payments directly from these trusts. |
| Ω | Represents the 7-day SEC yield as of December 31, 2014. |
Portfolio Abbreviations:
FHLMC - Federal Home Loan Mortgage Association
FNMA - Federal National Mortgage Association
GNMA - Government National Mortgage Association
LLC - Limited Liability Company
LP - Limited Partnership
MTN -Medium Term Note
PLC - Public Limited Company
REIT - Real Estate Investment Trust
UTGO - Unlimited Tax General Obligation
144a - This is a restricted security that was sold in a transaction qualifying for the exemption under Rule 144A of the Securities Act of 1933. This security may be sold in transactions exempt from registration, normally to qualified institutional buyers. At December 31, 2014, these securities were valued at $4,836,123 or 9.9% of net assets. These securities were deemed liquid pursuant to procedures approved by the Board of Trustees.
Touchstone Active Bond Fund (Continued)
Other Information:
The inputs or methodology used for valuing securities may not be an indication of the risk associated with investing in those securities. For more information on valuation inputs, and their aggregation into the levels used in the table below, please refer to the security valuation section in the accompanying Notes to Financial Statements.
Valuation inputs at Reporting Date:
| Description | | Level 1 | | | Level 2 | | | Level 3 | | | Total | |
| Corporate Bonds | | $ | — | | | $ | 20,900,894 | | | $ | — | | | $ | 20,900,894 | |
| U.S. Government Mortgage-Backed Obligations | | | — | | | | 10,353,383 | | | | — | | | | 10,353,383 | |
| U.S. Treasury Obligations | | | — | | | | 10,483,558 | | | | — | | | | 10,483,558 | |
| Asset-Backed Securities | | | — | | | | 1,853,210 | | | | — | | | | 1,853,210 | |
| Commercial Mortgage-Backed Securities | | | — | | | | 1,803,451 | | | | — | | | | 1,803,451 | |
| Municipal Bonds | | | — | | | | 1,068,474 | | | | — | | | | 1,068,474 | |
| Non-Agency Collateralized Mortgage Obligations | | | — | | | | 591,614 | | | | — | | | | 591,614 | |
| Sovereign Bond | | | — | | | | 274,663 | | | | — | | | | 274,663 | |
| Agency Collateralized Mortgage Obligations | | | — | | | | 16,339 | | | | — | | | | 16,339 | |
| Investment Fund | | | 1,352,467 | | | | — | | | | — | | | | 1,352,467 | |
| | | | | | | | | | | | | | | $ | 48,698,053 | |
See accompanying Notes to Financial Statements.
Portfolio of Investments
Touchstone Baron Small Cap Growth Fund – December 31, 2014
| | | | | | Market | |
| | | Shares | | | Value | |
| | | | | | | |
| Common Stocks — 94.7% | | | | | | | | |
| | | | | | | | | |
| Consumer Discretionary — 26.4% | | | | | | | | |
| Bright Horizons Family Solutions, Inc.* | | | 7,500 | | | $ | 352,575 | |
| Choice Hotels International, Inc. | | | 14,500 | | | | 812,290 | |
| ClubCorp Holdings, Inc. | | | 1,136 | | | | 20,368 | |
| DeVry Education Group, Inc. | | | 5,000 | | | | 237,350 | |
| Dick's Sporting Goods, Inc. | | | 13,000 | | | | 645,450 | |
| Interval Leisure Group, Inc. | | | 12,000 | | | | 250,680 | |
| LKQ Corp.* | | | 9,000 | | | | 253,080 | |
| Lumber Liquidators Holdings, Inc.*† | | | 6,300 | | | | 417,753 | |
| Manchester United PLC - Class A, (United Kingdom)*† | | | 17,018 | | | | 270,586 | |
| Marriott Vacations Worldwide Corp. | | | 8,100 | | | | 603,774 | |
| Morningstar, Inc. | | | 2,000 | | | | 129,420 | |
| Nord Anglia Education, Inc.* | | | 6,500 | | | | 124,020 | |
| Panera Bread Co. - Class A* | | | 1,880 | | | | 328,624 | |
| Penn National Gaming, Inc.* | | | 32,000 | | | | 439,360 | |
| Pinnacle Entertainment, Inc.*† | | | 13,233 | | | | 294,434 | |
| Under Armour, Inc. - Class A* | | | 11,000 | | | | 746,900 | |
| Vail Resorts, Inc. | | | 11,500 | | | | 1,047,995 | |
| | | | | | | | 6,974,659 | |
| | | | | | | | | |
| Financials — 22.1% | | | | | | | | |
| Alexander's, Inc. REIT | | | 716 | | | | 313,021 | |
| Alexandria Real Estate Equities, Inc. REIT | | | 2,500 | | | | 221,850 | |
| American Assets Trust, Inc. REIT | | | 3,700 | | | | 147,297 | |
| Arch Capital Group Ltd. (Bermuda)* | | | 22,000 | | | | 1,300,200 | |
| Artisan Partners Asset Management, Inc. - Class A | | | 5,000 | | | | 252,650 | |
| Carlyle Group LP (The) | | | 12,200 | | | | 335,500 | |
| Cohen & Steers, Inc.† | | | 9,500 | | | | 399,760 | |
| Douglas Emmett, Inc. REIT | | | 15,500 | | | | 440,200 | |
| Financial Engines, Inc.† | | | 10,846 | | | | 396,421 | |
| Gaming and Leisure Properties, Inc. REIT | | | 12,947 | | | | 379,866 | |
| LaSalle Hotel Properties REIT | | | 7,500 | | | | 303,525 | |
| Moelis & Co. | | | 7,500 | | | | 261,975 | |
| Oaktree Capital Group LLC† | | | 7,000 | | | | 362,810 | |
| Primerica, Inc. | | | 13,000 | | | | 705,380 | |
| | | | | | | | 5,820,455 | |
| | | | | | | | | |
| Industrials — 14.7% | | | | | | | | |
| Colfax Corp.* | | | 7,300 | | | | 376,461 | |
| Copart, Inc.* | | | 8,000 | | | | 291,920 | |
| Generac Holdings, Inc.*† | | | 8,000 | | | | 374,080 | |
| Genesee & Wyoming, Inc. - Class A* | | | 12,000 | | | | 1,079,040 | |
| Masonite International Corp.* | | | 3,000 | | | | 184,380 | |
| Middleby Corp.* | | | 9,000 | | | | 891,900 | |
| Rexnord Corp.* | | | 6,721 | | | | 189,599 | |
| Trex Co., Inc.* | | | 6,762 | | | | 287,927 | |
| Valmont Industries, Inc.† | | | 1,500 | | | | 190,500 | |
| | | | | | | | 3,865,807 | |
| | | | | | | | | |
| Information Technology — 13.2% | | | | | | | | |
| Advent Software, Inc. | | | 10,000 | | | | 306,400 | |
| Benefitfocus, Inc.*† | | | 11,750 | | | | 385,870 | |
| Booz Allen Hamilton Holding Corp. | | | 11,770 | | | | 312,258 | |
| Bottomline Technologies de, Inc.* | | | 2,500 | | | | 63,200 | |
| CoStar Group, Inc.* | | | 5,700 | | | | 1,046,691 | |
| Guidewire Software, Inc.* | | | 5,604 | | | | 283,731 | |
| Manhattan Associates, Inc.* | | | 7,600 | | | | 309,472 | |
| Shutterstock, Inc.*† | | | 959 | | | | 66,268 | |
| SS&C Technologies Holdings, Inc. | | | 12,215 | | | | 714,455 | |
| | | | | | | | 3,488,345 | |
| | | | | | | | | |
| Consumer Staples — 7.1% | | | | | | | | |
| Boston Beer Co., Inc. (The) - Class A*† | | | 729 | | | | 211,074 | |
| Church & Dwight Co., Inc. | | | 4,500 | | | | 354,645 | |
| TreeHouse Foods, Inc.* | | | 7,500 | | | | 641,475 | |
| United Natural Foods, Inc.* | | | 8,500 | | | | 657,262 | |
| | | | | | | | 1,864,456 | |
| | | | | | | | | |
| Utilities — 4.1% | | | | | | | | |
| ITC Holdings Corp. | | | 26,500 | | | | 1,071,395 | |
| | | | | | | | | |
| Health Care — 3.0% | | | | | | | | |
| Acadia Pharmaceuticals, Inc.*† | | | 1,100 | | | | 34,925 | |
| Brookdale Senior Living, Inc.* | | | 2,500 | | | | 91,675 | |
| Community Health Systems, Inc.* | | | 9,000 | | | | 485,280 | |
| IDEXX Laboratories, Inc.* | | | 787 | | | | 116,688 | |
| Juno Therapeutics, Inc.* | | | 40 | | | | 2,089 | |
| Neogen Corp.* | | | 1,000 | | | | 49,590 | |
| | | | | | | | 780,247 | |
| | | | | | | | | |
| Energy — 2.2% | | | | | | | | |
| Sunoco LP | | | 1,900 | | | | 94,563 | |
| Targa Resources Corp.† | | | 4,700 | | | | 498,435 | |
| | | | | | | | 592,998 | |
| | | | | | | | | |
| Telecommunication Services — 1.0% | | | | | | | | |
| Iridium Communications, Inc.*† | | | 28,000 | | | | 273,000 | |
| | | | | | | | | |
| Materials — 0.9% | | | | | | | | |
| CaesarStone Sdot - Yam Ltd. (Israel) | | | 4,214 | | | | 252,081 | |
| Total Common Stocks | | | | | | $ | 24,983,443 | |
| | | | | | | | | |
| Investment Funds — 20.1% | | | | | | | | |
| Invesco Government & Agency | | | | | | | | |
| Portfolio, Institutional Class, | | | | | | | | |
| 0.01%**∞Ω | | | 3,848,305 | | | | 3,848,305 | |
| Touchstone Institutional Money Market | | | | | | | | |
| Fund, 0.01%^∞Ω | | | 1,437,513 | | | | 1,437,513 | |
| Total Investment Funds | | | | | | $ | 5,285,818 | |
| | | | | | | | | |
| Total Investment Securities —114.8% | | | | | | | | |
| (Cost $16,680,469) | | | | | | $ | 30,269,261 | |
| | | | | | | | | |
| Liabilities in Excess of Other Assets — (14.8%) | | | | | | | (3,894,508 | ) |
| | | | | | | | | |
| Net Assets — 100.0% | | | | | | $ | 26,374,753 | |
| * | Non-income producing security. |
| ** | Represents collateral for securities loaned. |
Touchstone Baron Small Cap Growth Fund (Continued)
| ^ | Affiliated Fund. See Note 4 in Notes to Financial Statements. |
| † | All or a portion of the security is on loan. The total market value of the securities on loan as of December 31, 2014 was $3,717,756. |
| Ω | Represents the 7-day SEC yield as of December 31, 2014. |
Portfolio Abbreviations:
LLC - Limited Liability Company
LP - Limited Partnership
PLC - Public Limited Company
REIT - Real Estate Investment Trust
Other Information:
The inputs or methodology used for valuing securities may not be an indication of the risk associated with investing in those securities. For more information on valuation inputs, and their aggregation into the levels used in the table below, please refer to the security valuation section in the accompanying Notes to Financial Statements.
Valuation inputs at Reporting Date:
| Description | | Level 1 | | | Level 2 | | | Level 3 | | | Total | |
| Common Stocks | | $ | 24,983,443 | | | $ | — | | | $ | — | | | $ | 24,983,443 | |
| Investment Funds | | | 5,285,818 | | | | — | | | | — | | | | 5,285,818 | |
| | | | | | | | | | | | | | | $ | 30,269,261 | |
See accompanying Notes to Financial Statements.
Portfolio of Investments
Touchstone High Yield Fund – December 31, 2014
| Principal | | | | | Market | |
| Amount | | | | | Value | |
| | | | | | | |
| | | | | Corporate Bonds — 89.3% | | | | |
| | | | | | | | | |
| | | | | Consumer Discretionary — 17.7% | | | | |
| $ | 64,000 | | | Albea Beauty Holdings SA | | | | |
| | | | | (Luxembourg), 144a, | | | | |
| | | | | 8.375%, 11/1/19 | | $ | 67,200 | |
| | 139,000 | | | AMC Networks, Inc., 7.750%, 7/15/21 | | | 148,730 | |
| | 33,000 | | | American Axle & Manufacturing, Inc., | | | | |
| | | | | 6.250%, 3/15/21 | | | 34,650 | |
| | 28,000 | | | CBS Outdoor Americas Capital LLC / | | | | |
| | | | | CBS Outdoor Americas Capital | | | | |
| | | | | Corp., 144a, 5.250%, 2/15/22 | | | 28,210 | |
| | 47,000 | | | CBS Outdoor Americas Capital LLC / | | | | |
| | | | | CBS Outdoor Americas Capital | | | | |
| | | | | Corp., 144a, 5.875%, 3/15/25 | | | 47,352 | |
| | 38,000 | | | CCO Holdings LLC / CCO Holdings | | | | |
| | | | | Capital Corp., 6.500%, 4/30/21 | | | 39,900 | |
| | 35,000 | | | CCO Holdings LLC / CCO Holdings | | | | |
| | | | | Capital Corp., 6.625%, 1/31/22 | | | 37,188 | |
| | 53,000 | | | Cequel Communications Holdings I | | | | |
| | | | | LLC / Cequel Capital Corp., 144a, | | | | |
| | | | | 6.375%, 9/15/20 | | | 54,855 | |
| | 52,000 | | | Cogeco Cable, Inc. (Canada), 144a, | | | | |
| | | | | 4.875%, 5/1/20 | | | 52,000 | |
| | 14,000 | | | DISH DBS Corp., 5.875%, 7/15/22 | | | 14,350 | |
| | 100,000 | | | DISH DBS Corp., 6.750%, 6/1/21 | | | 107,500 | |
| | 35,000 | | | DISH DBS Corp., 7.875%, 9/1/19 | | | 39,725 | |
| | 35,000 | | | DR Horton, Inc., 3.750%, 3/1/19 | | | 34,650 | |
| | 13,000 | | | DR Horton, Inc., 4.375%, 9/15/22 | | | 12,740 | |
| | 32,000 | | | Gannett Co., Inc., 144a, | | | | |
| | | | | 4.875%, 9/15/21 | | | 31,760 | |
| | 20,000 | | | Gannett Co., Inc., 144a, | | | | |
| | | | | 5.500%, 9/15/24 | | | 20,050 | |
| | 126,000 | | | Goodyear Tire & Rubber Co. (The), | | | | |
| | | | | 8.750%, 8/15/20 | | | 145,845 | |
| | 23,000 | | | Lamar Media Corp., 5.875%, 2/1/22 | | | 23,862 | |
| | 61,000 | | | LIN Television Corp., 6.375%, 1/15/21 | | | 60,848 | |
| | 9,000 | | | LIN Television Corp., 144a, | | | | |
| | | | | 5.875%, 11/15/22 | | | 8,910 | |
| | 19,000 | | | LKQ Corp., 4.750%, 5/15/23 | | | 18,240 | |
| | 32,000 | | | Ltd. Brands, Inc., 5.625%, 2/15/22 | | | 34,400 | |
| | 24,000 | | | Men's Wearhouse, Inc. (The), 144a, | | | | |
| | | | | 7.000%, 7/1/22 | | | 24,660 | |
| | 105,000 | | | Meritage Homes Corp., | | | | |
| | | | | 7.150%, 4/15/20 | | | 112,875 | |
| | 121,000 | | | MGM Resorts International, | | | | |
| | | | | 5.250%, 3/31/20 | | | 120,092 | |
| | 19,000 | | | NCL Corp. Ltd. (Bermuda), 144a, | | | | |
| | | | | 5.250%, 11/15/19 | | | 19,142 | |
| | 20,000 | | | Netflix, Inc., 144a, 5.750%, 3/1/24 | | | 20,800 | |
| | 30,000 | | | Penske Automotive Group, Inc., | | | | |
| | | | | 5.375%, 12/1/24 | | | 30,375 | |
| | 163,000 | | | Quebecor Media, Inc. (Canada), | | | | |
| | | | | 5.750%, 1/15/23 | | | 166,668 | |
| | 41,000 | | | Reynolds Group Issuer, Inc. / Reynolds | | | | |
| | | | | Group Issuer LLC / Reynolds Group | | | | |
| | | | | Issuer Lu, 6.875%, 2/15/21 | | | 42,794 | |
| | 57,000 | | | Royal Caribbean Cruises Ltd. (Liberia), | | | | |
| | | | | 5.250%, 11/15/22 | | | 59,850 | |
| | 28,000 | | | Ryland Group, Inc. (The), | | | | |
| | | | | 5.375%, 10/1/22 | | | 27,160 | |
| | 10,000 | | | Service Corp. International/US, | | | | |
| | | | | 5.375%, 1/15/22 | | | 10,250 | |
| | 85,000 | | | Service Corp. International/US, | | | | |
| | | | | 8.000%, 11/15/21 | | | 98,388 | |
| | 87,000 | | | Sinclair Television Group, Inc., | | | | |
| | | | | 5.375%, 4/1/21 | | | 86,348 | |
| | 103,000 | | | Sinclair Television Group, Inc., | | | | |
| | | | | 6.125%, 10/1/22 | | | 104,802 | |
| | 34,000 | | | Sonic Automotive, Inc., | | | | |
| | | | | 7.000%, 7/15/22 | | | 36,550 | |
| | 93,000 | | | Stackpole International Intermediate / | | | | |
| | | | | Stackpole International Powder | | | | |
| | | | | (Luxembourg), 144a, | | | | |
| | | | | 7.750%, 10/15/21 | | | 93,000 | |
| | 17,000 | | | Standard Pacific Corp., | | | | |
| | | | | 8.375%, 1/15/21 | | | 19,252 | |
| | 38,000 | | | Taylor Morrison Communities, Inc. / | | | | |
| | | | | Monarch Communities Inc., 144a, | | | | |
| | | | | 7.750%, 4/15/20 | | | 40,280 | |
| | 41,000 | | | Tenneco, Inc., 6.875%, 12/15/20 | | | 43,358 | |
| | 34,000 | | | Toll Brothers Finance Corp., | | | | |
| | | | | 5.875%, 2/15/22 | | | 36,295 | |
| | 25,000 | | | TRW Automotive, Inc., 144a, | | | | |
| | | | | 4.500%, 3/1/21 | | | 25,125 | |
| | 26,000 | | | Virgin Media Secured Finance PLC | | | | |
| | | | | (United Kingdom), 144a, | | | | |
| | | | | 5.375%, 4/15/21 | | | 26,845 | |
| | 31,000 | | | Weyerhaeuser Real Estate Co., 144a, | | | | |
| | | | | 4.375%, 6/15/19 | | | 30,574 | |
| | 16,000 | | | William Lyon Homes, Inc., | | | | |
| | | | | 5.750%, 4/15/19 | | | 15,960 | |
| | | | | | | | 2,354,408 | |
| | | | | | | | | |
| | | | | Energy — 16.8% | | | | |
| | 50,000 | | | Access Midstream Partners LP / ACMP | | | | |
| | | | | Finance Corp., 4.875%, 5/15/23 | | | 50,750 | |
| | 108,000 | | | Atlas Pipeline Partners LP / Atlas | | | | |
| | | | | Pipeline Finance Corp., | | | | |
| | | | | 6.625%, 10/1/20 | | | 109,890 | |
| | 15,000 | | | Basic Energy Services, Inc., | | | | |
| | | | | 7.750%, 10/15/22 | | | 11,250 | |
| | 13,000 | | | Baytex Energy Corp. (Canada), 144a, | | | | |
| | | | | 5.125%, 6/1/21 | | | 11,050 | |
| | 109,000 | | | Bill Barrett Corp., 7.000%, 10/15/22 | | | 87,745 | |
| | 69,000 | | | Calfrac Holdings LP, 144a, | | | | |
| | | | | 7.500%, 12/1/20 | | | 58,305 | |
| | 132,000 | | | California Resources Corp., 144a, | | | | |
| | | | | 5.500%, 9/15/21 | | | 112,860 | |
| | 131,000 | | | Carrizo Oil & Gas, Inc., 7.500%, 9/15/20 | | | 125,760 | |
| | 50,000 | | | Clayton Williams Energy, Inc., | | | | |
| | | | | 7.750%, 4/1/19 | | | 42,500 | |
Touchstone High Yield Fund (Continued)
| Principal | | | | | Market | |
| Amount | | | | | Value | |
| | | | | | | |
| | | | | Corporate Bonds — 89.3% (Continued) | | | | |
| | | | | | | | | |
| | | | | Energy — (Continued) | | | | |
| $ | 7,000 | | | Cloud Peak Energy Resources LLC / | | | | |
| | | | | Cloud Peak Energy Finance Corp., | | | | |
| | | | | 6.375%, 3/15/24 | | $ | 6,510 | |
| | 32,000 | | | Cloud Peak Energy Resources LLC / | | | | |
| | | | | Cloud Peak Energy Finance Corp., | | | | |
| | | | | 8.500%, 12/15/19 | | | 33,360 | |
| | 19,000 | | | CONSOL Energy, Inc., 144a, | | | | |
| | | | | 5.875%, 4/15/22 | | | 17,670 | |
| | 39,000 | | | Crestwood Midstream Partners LP / | | | | |
| | | | | Crestwood Midstream Finance | | | | |
| | | | | Corp., 6.125%, 3/1/22 | | | 37,245 | |
| | 134,000 | | | Drill Rigs Holdings, Inc. (Marshall | | | | |
| | | | | Islands), 144a, 6.500%, 10/1/17 | | | 110,550 | |
| | 85,000 | | | FTS International, Inc., 144a, | | | | |
| | | | | 6.250%, 5/1/22 | | | 62,050 | |
| | 71,000 | | | Genesis Energy LP / Genesis Energy | | | | |
| | | | | Finance Corp., 5.750%, 2/15/21 | | | 66,030 | |
| | 49,000 | | | Gibson Energy, Inc. (Canada), 144a, | | | | |
| | | | | 6.750%, 7/15/21 | | | 48,878 | |
| | 22,000 | | | Hilcorp Energy I LP / Hilcorp Finance | | | | |
| | | | | Co., 144a, 7.625%, 4/15/21 | | | 22,110 | |
| | 12,000 | | | Hilcorp Energy I LP / Hilcorp Finance | | | | |
| | | | | Co., 144a, 8.000%, 2/15/20 | | | 12,240 | |
| | 122,000 | | | Key Energy Services, Inc., | | | | |
| | | | | 6.750%, 3/1/21 | | | 75,640 | |
| | 58,000 | | | Kinder Morgan, Inc/DE, 144a, | | | | |
| | | | | 5.625%, 11/15/23 | | | 62,085 | |
| | 38,000 | | | Linn Energy LLC / Linn Energy Finance | | | | |
| | | | | Corp., 6.250%, 11/1/19 | | | 32,110 | |
| | 32,000 | | | Linn Energy LLC / Linn Energy Finance | | | | |
| | | | | Corp., 8.625%, 4/15/20 | | | 27,840 | |
| | 125,000 | | | MEG Energy Corp. (Canada), 144a, | | | | |
| | | | | 6.500%, 3/15/21 | | | 114,062 | |
| | 38,000 | | | Northern Blizzard Resources, Inc. | | | | |
| | | | | (Canada), 144a, 7.250%, 2/1/22 | | | 30,780 | |
| | 25,000 | | | NuStar Logistics LP, 4.800%, 9/1/20 | | | 23,500 | |
| | 16,000 | | | NuStar Logistics LP, 6.750%, 2/1/21 | | | 16,920 | |
| | 40,000 | | | Oasis Petroleum, Inc., 6.875%, 3/15/22 | | | 36,400 | |
| | 42,000 | | | Pacific Drilling SA (Luxembourg), 144a, | | | | |
| | | | | 5.375%, 6/1/20 | | | 34,230 | |
| | 170,000 | | | Pacific Drilling V Ltd. (Virgin Islands), | | | | |
| | | | | 144a, 7.250%, 12/1/17 | | | 153,000 | |
| | 31,000 | | | Peabody Energy Corp., | | | | |
| | | | | 6.000%, 11/15/18 | | | 28,132 | |
| | 33,000 | | | QEP Resources, Inc., 6.800%, 3/1/20 | | | 34,155 | |
| | 17,000 | | | Rose Rock Midstream LP / Rose Rock | | | | |
| | | | | Finance Corp., 5.625%, 7/15/22 | | | 15,895 | |
| | 96,000 | | | Sabine Pass Liquefaction LLC, | | | | |
| | | | | 5.625%, 2/1/21 | | | 94,320 | |
| | 21,000 | | | Sanchez Energy Corp., 144a, | | | | |
| | | | | 6.125%, 1/15/23 | | | 17,640 | |
| | 168,000 | | | SandRidge Energy, Inc., | | | | |
| | | | | 8.750%, 1/15/20 | | | 113,400 | |
| | 82,000 | | | SemGroup Corp., 7.500%, 6/15/21 | | | 82,000 | |
| | 33,000 | | | Seventy Seven Energy, Inc., | | | | |
| | | | | 6.500%, 7/15/22 | | | 19,305 | |
| | 21,000 | | | Tesoro Logistics LP / Tesoro Logistics | | | | |
| | | | | Finance Corp., 5.875%, 10/1/20 | | | 21,052 | |
| | 200,000 | | | Tullow Oil PLC (United Kingdom), | | | | |
| | | | | 144a, 6.000%, 11/1/20 | | | 166,000 | |
| | | | | | | | 2,225,219 | |
| | | | | | | | | |
| | | | | Industrials — 11.2% | | | | |
| | 61,000 | | | ADT Corp. (The), 3.500%, 7/15/22 | | | 52,002 | |
| | 13,000 | | | ADT Corp. (The), 6.250%, 10/15/21† | | | 13,358 | |
| | 77,000 | | | Allegion US Holding Co., Inc., | | | | |
| �� | | | | 5.750%, 10/1/21 | | | 81,428 | |
| | 100,000 | | | Alliant Techsystems, Inc., 144a, | | | | |
| | | | | 5.250%, 10/1/21 | | | 100,750 | |
| | 49,729 | | | American Airlines 2013-2 Class B Pass | | | | |
| | | | | Through Trust, 144a, | | | | |
| | | | | 5.600%, 7/15/20 | | | 50,724 | |
| | 66,000 | | | Amsted Industries, Inc., 144a, | | | | |
| | | | | 5.000%, 3/15/22 | | | 64,845 | |
| | 17,000 | | | Amsted Industries, Inc., 144a, | | | | |
| | | | | 5.375%, 9/15/24 | | | 16,532 | |
| | 33,000 | | | Anixter, Inc., 5.125%, 10/1/21 | | | 33,000 | |
| | 35,000 | | | Bombardier, Inc. (Canada), 144a, | | | | |
| | | | | 6.000%, 10/15/22 | | | 35,350 | |
| | 6,000 | | | Bombardier, Inc. (Canada), 144a, | | | | |
| | | | | 6.125%, 1/15/23 | | | 6,120 | |
| | 7,000 | | | Building Materials Corp. of America, | | | | |
| | | | | 144a, 6.750%, 5/1/21 | | | 7,402 | |
| | 120,000 | | | Calcipar SA (Luxembourg), 144a, | | | | |
| | | | | 6.875%, 5/1/18 | | | 120,600 | |
| | 24,000 | | | Case New Holland, Inc., | | | | |
| | | | | 7.875%, 12/1/17 | | | 26,400 | |
| | 69,000 | | | Cenveo Corp., 144a, 6.000%, 8/1/19 | | | 62,445 | |
| | 30,000 | | | DigitalGlobe, Inc., 144a, | | | | |
| | | | | 5.250%, 2/1/21 | | | 28,500 | |
| | 75,000 | | | Dynacast International LLC / Dynacast | | | | |
| | | | | Finance, Inc., 9.250%, 7/15/19 | | | 80,438 | |
| | 95,000 | | | JB Poindexter & Co., Inc., 144a, | | | | |
| | | | | 9.000%, 4/1/22 | | | 102,600 | |
| | 144,000 | | | Martin Midstream Partners LP / Martin | | | | |
| | | | | Midstream Finance Corp., | | | | |
| | | | | 7.250%, 2/15/21 | | | 135,360 | |
| | 59,000 | | | Navios Maritime Holdings, Inc. / | | | | |
| | | | | Navios Maritime Finance II US Inc. | | | | |
| | | | | (Marshall Islands), 144a, | | | | |
| | | | | 7.375%, 1/15/22 | | | 53,985 | |
| | 83,000 | | | Nielsen Co. Luxembourg SARL (The) | | | | |
| | | | | (Luxembourg), 144a, | | | | |
| | | | | 5.500%, 10/1/21 | | | 84,660 | |
| | 25,000 | | | Nielsen Finance LLC / Nielsen Finance | | | | |
| | | | | Co., 4.500%, 10/1/20 | | | 25,125 | |
| | 27,000 | | | Rexel SA (France), 144a, | | | | |
| | | | | 5.250%, 6/15/20 | | | 27,202 | |
| | 7,000 | | | RR Donnelley & Sons Co., | | | | |
| | | | | 7.250%, 5/15/18 | | | 7,735 | |
Touchstone High Yield Fund (Continued)
| Principal | | | | | Market | |
| Amount | | | | | Value | |
| | | | | | | |
| | | | | Corporate Bonds — 89.3% (Continued) | | | | |
| | | | | | | | | |
| | | | | Industrials — (Continued) | | | | |
| $ | 36,000 | | | Stena AB (Sweden), 144a, | | | | |
| | | | | 7.000%, 2/1/24 | | $ | 32,940 | |
| | 16,000 | | | United Airlines 2014-2 Class B Pass | | | | |
| | | | | Through Trust, 4.625%, 9/3/22 | | | 15,680 | |
| | 1,000 | | | United Rentals North America, Inc., | | | | |
| | | | | 7.375%, 5/15/20 | | | 1,080 | |
| | 57,000 | | | United Rentals North America, Inc., | | | | |
| | | | | 7.625%, 4/15/22 | | | 62,672 | |
| | 98,000 | | | URS Corp., 5.000%, 4/1/22 | | | 92,120 | |
| | 29,675 | | | US Airways 2013-1 Class B Pass | | | | |
| | | | | Through Trust, 5.375%, 11/15/21 | | | 30,194 | |
| | 45,000 | | | West Corp., 144a, 5.375%, 7/15/22 | | | 43,088 | |
| | | | | | | | 1,494,335 | |
| | | | | | | | | |
| | | | | Financials — 8.4% | | | | |
| | 11,000 | | | AerCap Ireland Capital Ltd. / AerCap | | | | |
| | | | | Global Aviation Trust (Ireland), 144a, | | | | |
| | | | | 3.750%, 5/15/19 | | | 10,890 | |
| | 6,000 | | | AerCap Ireland Capital Ltd. / AerCap | | | | |
| | | | | Global Aviation Trust (Ireland), 144a, | | | | |
| | | | | 4.500%, 5/15/21 | | | 6,075 | |
| | 39,000 | | | Ally Financial, Inc., 8.000%, 11/1/31 | | | 49,628 | |
| | 22,000 | | | CBRE Services, Inc., 5.210%, 3/15/25 | | | 22,440 | |
| | 208,000 | | | CIT Group, Inc., 5.000%, 8/15/22 | | | 213,720 | |
| | 17,000 | | | Credit Acceptance Corp., 144a, | | | | |
| | | | | 6.125%, 2/15/21 | | | 17,000 | |
| | 73,000 | | | Crown Castle International Corp., REIT, | | | | |
| | | | | 5.250%, 1/15/23 | | | 74,460 | |
| | 58,000 | | | CTR Partnership LP / CareTrust Capital | | | | |
| | | | | Corp. REIT, 5.875%, 6/1/21 | | | 58,725 | |
| | 63,000 | | | First Cash Financial Services, Inc., | | | | |
| | | | | 6.750%, 4/1/21 | | | 65,520 | |
| | 13,000 | | | General Motors Financial Co., Inc., | | | | |
| | | | | 3.500%, 7/10/19 | | | 13,275 | |
| | 72,000 | | | General Motors Financial Co., Inc., | | | | |
| | | | | 4.375%, 9/25/21 | | | 75,150 | |
| | 7,000 | | | International Lease Finance Corp., | | | | |
| | | | | 5.875%, 8/15/22 | | | 7,595 | |
| | 113,000 | | | International Lease Finance Corp., | | | | |
| | | | | 6.250%, 5/15/19 | | | 123,452 | |
| | 49,000 | | | MPT Operating Partnership LP / MPT | | | | |
| | | | | Finance Corp., 6.375%, 2/15/22 | | | 52,062 | |
| | 45,000 | | | MPT Operating Partnership LP / MPT | | | | |
| | | | | Finance Corp., 6.875%, 5/1/21 | | | 48,150 | |
| | 74,000 | | | Navient Corp., 5.000%, 10/26/20 | | | 72,612 | |
| | 58,000 | | | Navient LLC MTN, 6.125%, 3/25/24 | | | 56,985 | |
| | 21,000 | | | Ocwen Financial Corp., 144a, | | | | |
| | | | | 6.625%, 5/15/19 | | | 19,215 | |
| | 26,000 | | | PHH Corp., 6.375%, 8/15/21 | | | 23,822 | |
| | 103,000 | | | PHH Corp., 7.375%, 9/1/19 | | | 103,258 | |
| | | | | | | | 1,114,034 | |
| | | | | | | | | |
| | | | | Materials — 7.7% | | | | |
| | 73,000 | | | Aleris International, Inc., | | | | |
| | | | | 7.625%, 2/15/18 | | | 73,365 | |
| | 190,000 | | | ArcelorMittal (Luxembourg), | | | | |
| | | | | 5.750%, 8/5/20 | | | 197,125 | |
| | 65,000 | | | Cascades, Inc. (Canada), | | | | |
| | | | | 7.875%, 1/15/20 | | | 67,600 | |
| | 103,000 | | | Chemtura Corp., 5.750%, 7/15/21 | | | 100,425 | |
| | 93,000 | | | First Quantum Minerals Ltd. (Canada), | | | | |
| | | | | 144a, 7.000%, 2/15/21 | | | 83,700 | |
| | 2,000 | | | First Quantum Minerals Ltd. (Canada), | | | | |
| | | | | 144a, 7.250%, 10/15/19 | | | 1,850 | |
| | 25,000 | | | First Quantum Minerals Ltd. (Canada), | | | | |
| | | | | 144a, 7.250%, 5/15/22 | | | 22,500 | |
| | 11,000 | | | FMG Resources August 2006 Pty Ltd. | | | | |
| | | | | (Australia), 144a, 6.875%, 4/1/22 | | | 9,158 | |
| | 31,000 | | | HudBay Minerals, Inc. (Canada), | | | | |
| | | | | 9.500%, 10/1/20 | | | 30,070 | |
| | 42,000 | | | HudBay Minerals, Inc. (Canada), 144a, | | | | |
| | | | | 9.500%, 10/1/20 | | | 40,740 | |
| | 20,000 | | | Huntsman International LLC, | | | | |
| | | | | 4.875%, 11/15/20 | | | 19,850 | |
| | 110,000 | | | JMC Steel Group, Inc., 144a, | | | | |
| | | | | 8.250%, 3/15/18 | | | 104,500 | |
| | 139,000 | | | PolyOne Corp., 5.250%, 3/15/23 | | | 138,907 | |
| | 50,000 | | | Steel Dynamics, Inc., 5.250%, 4/15/23 | | | 50,750 | |
| | 25,000 | | | Tembec Industries, Inc. (Canada), | | | | |
| | | | | 144a, 9.000%, 12/15/19 | | | 24,594 | |
| | 53,000 | | | Vulcan Materials Co., 7.500%, 6/15/21 | | | 61,745 | |
| | | | | | | | 1,026,879 | |
| | | | | | | | | |
| | | | | Telecommunication Services — 7.6% | | | | |
| | 66,000 | | | CenturyLink, Inc., 5.625%, 4/1/20 | | | 68,475 | |
| | 22,000 | | | CenturyLink, Inc., 5.800%, 3/15/22 | | | 22,825 | |
| | 17,000 | | | CenturyLink, Inc., 6.450%, 6/15/21 | | | 18,232 | |
| | 31,000 | | | Cincinnati Bell, Inc., 8.375%, 10/15/20 | | | 32,550 | |
| | 68,000 | | | Frontier Communications Corp., | | | | |
| | | | | 6.250%, 9/15/21 | | | 68,340 | |
| | 56,000 | | | Frontier Communications Corp., | | | | |
| | | | | 8.500%, 4/15/20 | | | 62,440 | |
| | 39,000 | | | GCI, Inc., 8.625%, 11/15/19 | | | 40,901 | |
| | 42,000 | | | Intelsat Jackson Holdings SA | | | | |
| | | | | (Luxembourg), 7.250%, 10/15/20 | | | 44,362 | |
| | 75,000 | | | Softbank Corp. (Japan), 144a, | | | | |
| | | | | 4.500%, 4/15/20 | | | 73,875 | |
| | 100,000 | | | Sprint Communications, Inc., 144a, | | | | |
| | | | | 7.000%, 3/1/20 | | | 108,000 | |
| | 67,000 | | | Sprint Communications, Inc., 144a, | | | | |
| | | | | 9.000%, 11/15/18 | | | 76,206 | |
| | 5,000 | | | T-Mobile USA, Inc., 5.250%, 9/1/18 | | | 5,188 | |
| | 27,000 | | | T-Mobile USA, Inc., 6.000%, 3/1/23 | | | 27,068 | |
| | 21,000 | | | T-Mobile USA, Inc., 6.125%, 1/15/22 | | | 21,315 | |
| | 15,000 | | | T-Mobile USA, Inc., 6.250%, 4/1/21 | | | 15,352 | |
| | 7,000 | | | T-Mobile USA, Inc., 6.464%, 4/28/19 | | | 7,280 | |
| | 137,000 | | | T-Mobile USA, Inc., 6.542%, 4/28/20 | | | 141,452 | |
| | 13,000 | | | T-Mobile USA, Inc., 6.836%, 4/28/23 | | | 13,422 | |
| | 59,000 | | | UPCB Finance V Ltd. (Cayman Islands), | | | | |
| | | | | 144a, 7.250%, 11/15/21 | | | 64,531 | |
Touchstone High Yield Fund (Continued)
| Principal | | | | | Market | |
| Amount | | | | | Value | |
| | | | | | | |
| | | | | Corporate Bonds — 89.3% (Continued) | | | | |
| | | | | | | | | |
| | | | | Telecommunication Services — (Continued) | | | | |
| $ | 51,000 | | | UPCB Finance VI Ltd. (Cayman Islands), | | | | |
| | | | | 144a, 6.875%, 1/15/22 | | $ | 55,462 | |
| | 44,000 | | | Windstream Corp., 7.750%, 10/15/20 | | | 45,320 | |
| | | | | | | | 1,012,596 | |
| | | | | | | | | |
| | | | | Health Care — 6.3% | | | | |
| | 63,000 | | | Acadia Healthcare Co., Inc., | | | | |
| | | | | 5.125%, 7/1/22 | | | 62,055 | |
| | 187,000 | | | CHS / Community Health Systems, | | | | |
| | | | | Inc., 7.125%, 7/15/20 | | | 199,389 | |
| | 41,000 | | | Grifols Worldwide Operations Ltd. | | | | |
| | | | | (Ireland), 144a, 5.250%, 4/1/22 | | | 41,931 | |
| | 57,000 | | | HCA, Inc., 6.500%, 2/15/20 | | | 63,868 | |
| | 23,000 | | | Kindred Escrow Corp. II, 144a, | | | | |
| | | | | 8.000%, 1/15/20 | | | 24,438 | |
| | 44,000 | | | Kindred Healthcare, Inc., 144a, | | | | |
| | | | | 6.375%, 4/15/22 | | | 41,910 | |
| | 41,000 | | | LifePoint Hospitals, Inc., | | | | |
| | | | | 5.500%, 12/1/21 | | | 41,922 | |
| | 22,000 | | | Omnicare, Inc., 4.750%, 12/1/22 | | | 22,275 | |
| | 134,000 | | | Select Medical Corp., 6.375%, 6/1/21 | | | 136,010 | |
| | 72,000 | | | Universal Hospital Services, Inc., | | | | |
| | | | | 7.625%, 8/15/20 | | | 61,920 | |
| | 59,000 | | | Valeant Pharmaceuticals International, | | | | |
| | | | | 144a, 6.375%, 10/15/20 | | | 61,655 | |
| | 71,000 | | | Valeant Pharmaceuticals International | | | | |
| | | | | Inc. (Canada), 144a, 6.750%, 8/15/18 | | | 75,528 | |
| | | | | | | | 832,901 | |
| | | | | | | | | |
| | | | | Consumer Staples — 6.1% | | | | |
| | 60,000 | | | ARAMARK Corp., 5.750%, 3/15/20 | | | 61,950 | |
| | 17,000 | | | B&G Foods, Inc., 4.625%, 6/1/21 | | | 16,594 | |
| | 53,000 | | | BI-LO LLC / BI-LO Finance Corp., 144a, | | | | |
| | | | | 9.250%, 2/15/19 | | | 48,760 | |
| | 5,000 | | | Cardtronics, Inc., 144a, 5.125%, 8/1/22 | | | 4,875 | |
| | 99,000 | | | Constellation Brands, Inc., | | | | |
| | | | | 3.750%, 5/1/21 | | | 98,010 | |
| | 6,000 | | | Constellation Brands, Inc., | | | | |
| | | | | 4.250%, 5/1/23 | | | 5,955 | |
| | 57,000 | | | Cott Beverages, Inc., 144a, | | | | |
| | | | | 6.750%, 1/1/20 | | | 57,000 | |
| | 45,000 | | | Harland Clarke Holdings Corp., 144a, | | | | |
| | | | | 6.875%, 3/1/20 | | | 43,875 | |
| | 27,000 | | | Harland Clarke Holdings Corp., 144a, | | | | |
| | | | | 9.750%, 8/1/18 | | | 28,552 | |
| | 100,000 | | | JBS USA LLC / JBS USA Finance, Inc., | | | | |
| | | | | 144a, 7.250%, 6/1/21 | | | 103,000 | |
| | 220,000 | | | Post Holdings, Inc., 7.375%, 2/15/22 | | | 220,000 | |
| | 26,000 | | | Smithfield Foods, Inc., 6.625%, 8/15/22 | | | 27,170 | |
| | 88,000 | | | Smithfield Foods, Inc., 144a, | | | | |
| | | | | 5.250%, 8/1/18 | | | 89,540 | |
| | | | | | | | 805,281 | |
| | | | | | | | | |
| | | | | Information Technology — 4.4% | | | | |
| | 93,000 | | | Activision Blizzard, Inc., 144a, | | | | |
| | | | | 5.625%, 9/15/21 | | | 97,650 | |
| | 22,000 | | | Activision Blizzard, Inc., 144a, | | | | |
| | | | | 6.125%, 9/15/23 | | | 23,705 | |
| | 103,000 | | | Audatex North America, Inc., 144a, | | | | |
| | | | | 6.000%, 6/15/21 | | | 106,090 | |
| | 14,000 | | | Audatex North America, Inc., 144a, | | | | |
| | | | | 6.125%, 11/1/23 | | | 14,455 | |
| | 42,000 | | | Equinix, Inc., 4.875%, 4/1/20 | | | 41,790 | |
| | 75,000 | | | Equinix, Inc., 5.375%, 4/1/23 | | | 75,000 | |
| | 31,000 | | | Hughes Satellite Systems Corp., | | | | |
| | | | | 6.500%, 6/15/19 | | | 33,248 | |
| | 80,000 | | | IAC/InterActiveCorp, 4.875%, 11/30/18 | | | 81,400 | |
| | 51,000 | | | NCR Corp., 5.875%, 12/15/21 | | | 52,402 | |
| | 32,000 | | | Seagate HDD Cayman (Cayman | | | | |
| | | | | Islands), 144a, 4.750%, 1/1/25 | | | 32,965 | |
| | 25,000 | | | ViaSat, Inc., 6.875%, 6/15/20 | | | 26,000 | |
| | | | | | | | 584,705 | |
| | | | | | | | | |
| | | | | Utilities — 3.1% | | | | |
| | 168,000 | | | Calpine Corp., 144a, 7.875%, 1/15/23 | | | 185,220 | |
| | 159,000 | | | DPL, Inc., 7.250%, 10/15/21 | | | 162,180 | |
| | 48,000 | | | InterGen NV (Netherlands), 144a, | | | | |
| | | | | 7.000%, 6/30/23 | | | 45,600 | |
| | 21,000 | | | NRG Energy, Inc., 7.875%, 5/15/21 | | | 22,629 | |
| | | | | | | | 415,629 | |
| | | | | Total Corporate Bonds | | $ | 11,865,987 | |
| Shares | | | | | | | |
| | | | | Investment Funds — 9.5% | | | | |
| | 13,674 | | | Invesco Government & Agency | | | | |
| | | | | Portfolio, Institutional Class, | | | | |
| | | | | 0.01%**∞Ω | | | 13,674 | |
| | 1,242,581 | | | Touchstone Institutional Money | | | | |
| | | | | Market Fund, 0.01%^∞Ω | | | 1,242,581 | |
| | | | | Total Investment Funds | | $ | 1,256,255 | |
| | | | | | | | | |
| | | | | Total Investment Securities —98.8% | | | | |
| | | | | (Cost $13,487,908) | | $ | 13,122,242 | |
| | | | | | | | | |
| | | | | Other Assets in | | | | |
| | | | | Excess of Liabilities — 1.2% | | | 160,772 | |
| | | | | | | | | |
| | | | | Net Assets — 100.0% | | $ | 13,283,014 | |
| ** | Represents collateral for securities loaned. |
| ^ | Affiliated Fund. See Note 4 in Notes to Financial Statements. |
| † | All or a portion of the security is on loan. The total market value of the securities on loan as of December 31, 2014 was $13,224. |
Touchstone High Yield Fund (Continued)
| Ω | Represents the 7-day SEC yield as of December 31, 2014. |
Portfolio Abbreviations:
LLC - Limited Liability Company
LP - Limited Partnership
MTN - Medium Term Note
PLC - Public Limited Company
144a - This is a restricted security that was sold in a transaction qualifying for the exemption under Rule 144A of the Securities Act of 1933. This security may be sold in transactions exempt from registration, normally to qualified institutional buyers. At December 31, 2014, these securities were valued at $4,307,061 or 32.4% of net assets. These securities were deemed liquid pursuant to procedures approved by the Board of Trustees.
Other Information:
The inputs or methodology used for valuing securities may not be an indication of the risk associated with investing in those securities. For more information on valuation inputs, and their aggregation into the levels used in the table below, please refer to the security valuation section in the accompanying Notes to Financial Statements.
Valuation Inputs at Reporting Date:
| Description | | Level 1 | | | Level 2 | | | Level 3 | | | Total | |
| Corporate Bonds | | $ | — | | | $ | 11,865,987 | | | $ | — | | | $ | 11,865,987 | |
| Investment Funds | | | 1,256,255 | | | | — | | | | — | | | | 1,256,255 | |
| | | | | | | | | | | | | | | $ | 13,122,242 | |
See accompanying Notes to Financial Statements.
Portfolio of Investments
Touchstone Large Cap Core Equity Fund – December 31, 2014
| | | | | | Market | |
| | | Shares | | | Value | |
| | | | | | | |
| Common Stocks — 97.6% | | | | | | | | |
| | | | | | | | | |
| Financials — 21.0% | | | | | | | | |
| American Express Co. | | | 4,484 | | | $ | 417,191 | |
| Ameriprise Financial, Inc. | | | 8,840 | | | | 1,169,090 | |
| BlackRock, Inc. | | | 3,360 | | | | 1,201,402 | |
| Citigroup, Inc. | | | 13,420 | | | | 726,156 | |
| Discover Financial Services | | | 12,210 | | | | 799,633 | |
| Goldman Sachs Group, Inc. (The) | | | 4,800 | | | | 930,384 | |
| Invesco Ltd. | | | 9,860 | | | | 389,667 | |
| JPMorgan Chase & Co. | | | 14,350 | | | | 898,023 | |
| Lincoln National Corp. | | | 11,070 | | | | 638,407 | |
| State Street Corp. | | | 6,456 | | | | 506,796 | |
| Wells Fargo & Co. | | | 15,660 | | | | 858,481 | |
| | | | | | | | 8,535,230 | |
| | | | | | | | | |
| Information Technology — 19.4% | | | | | | | | |
| Apple, Inc. | | | 6,950 | | | | 767,141 | |
| Cisco Systems, Inc. | | | 23,280 | | | | 647,533 | |
| EMC Corp. | | | 19,800 | | | | 588,852 | |
| Google, Inc. - Class C* | | | 714 | | | | 375,850 | |
| Google, Inc. - Class A* | | | 714 | | | | 378,891 | |
| Hewlett-Packard Co. | | | 29,910 | | | | 1,200,288 | |
| Intel Corp. | | | 31,766 | | | | 1,152,788 | |
| Oracle Corp. | | | 15,051 | | | | 676,843 | |
| Qualcomm, Inc. | | | 9,736 | | | | 723,677 | |
| Seagate Technology PLC (Ireland) | | | 9,310 | | | | 619,115 | |
| TE Connectivity Ltd. (Switzerland) | | | 12,267 | | | | 775,888 | |
| | | | | | | | 7,906,866 | |
| | | | | | | | | |
| Health Care — 15.8% | | | | | | | | |
| Anthem, Inc. | | | 3,220 | | | | 404,657 | |
| Express Scripts Holding Co.* | | | 13,082 | | | | 1,107,654 | |
| Gilead Sciences, Inc.* | | | 11,330 | | | | 1,067,966 | |
| McKesson Corp. | | | 4,737 | | | | 983,306 | |
| Merck & Co., Inc. | | | 9,940 | | | | 564,493 | |
| Pfizer, Inc. | | | 11,250 | | | | 350,438 | |
| Stryker Corp. | | | 4,520 | | | | 426,372 | |
| UnitedHealth Group, Inc. | | | 9,712 | | | | 981,786 | |
| Zimmer Holdings, Inc. | | | 4,880 | | | | 553,490 | |
| | | | | | | | 6,440,162 | |
| | | | | | | | | |
| Consumer Discretionary — 14.0% | | | | | | | | |
| CBS Corp. - Class B | | | 12,050 | | | | 666,847 | |
| Delphi Automotive PLC (United Kingdom) | | | 13,370 | | | | 972,266 | |
| Gannett Co., Inc. | | | 30,290 | | | | 967,160 | |
| Home Depot, Inc. (The) | | | 11,708 | | | | 1,228,989 | |
| Macy's, Inc. | | | 13,370 | | | | 879,078 | |
| Whirlpool Corp. | | | 5,010 | | | | 970,637 | |
| | | | | | | | 5,684,977 | |
| | | | | | | | | |
| Industrials — 13.6% | | | | | | | | |
| General Electric Co. | | | 29,900 | | | | 755,573 | |
| Illinois Tool Works, Inc. | | | 8,776 | | | | 831,087 | |
| Norfolk Southern Corp. | | | 7,620 | | | | 835,228 | |
| Oshkosh Corp. | | | 7,000 | | | | 340,550 | |
| Union Pacific Corp. | | | 11,334 | | | | 1,350,219 | |
| United Rentals, Inc.* | | | 9,830 | | | | 1,002,758 | |
| United Technologies Corp. | | | 3,725 | | | | 428,375 | |
| | | | | | | | 5,543,790 | |
| | | | | | | | | |
| Energy — 6.3% | | | | | | | | |
| Cameron International Corp.* | | | 8,520 | | | | 425,574 | |
| Chevron Corp. | | | 3,098 | | | | 347,534 | |
| ConocoPhillips | | | 5,575 | | | | 385,010 | |
| Halliburton Co. | | | 9,160 | | | | 360,263 | |
| Marathon Petroleum Corp. | | | 4,240 | | | | 382,702 | |
| Phillips 66 | | | 9,037 | | | | 647,953 | |
| | | | | | | | 2,549,036 | |
| | | | | | | | | |
| Consumer Staples — 4.9% | | | | | | | | |
| Altria Group, Inc. | | | 13,920 | | | | 685,838 | |
| CVS Health Corp. | | | 9,740 | | | | 938,059 | |
| Philip Morris International, Inc. | | | 4,642 | | | | 378,091 | |
| | | | | | | | 2,001,988 | |
| | | | | | | | | |
| Utilities — 1.1% | | | | | | | | |
| NextEra Energy, Inc. | | | 4,080 | | | | 433,663 | |
| | | | | | | | | |
| Materials — 1.0% | | | | | | | | |
| CF Industries Holdings, Inc. | | | 1,450 | | | | 395,183 | |
| | | | | | | | | |
| Telecommunication Services — 0.5% | | | | | | | | |
| Verizon Communications, Inc. | | | 3,930 | | | | 183,845 | |
| Total Common Stocks | | | | | | $ | 39,674,740 | |
| | | | | | | | | |
| Total Investment Securities —97.6% | | | | | | | | |
| (Cost $30,415,746) | | | | | | $ | 39,674,740 | |
| | | | | | | | | |
| Other Assets in Excess of Liabilities — 2.4% | | | | | | | 989,325 | |
| | | | | | | | | |
| Net Assets — 100.0% | | | | | | $ | 40,664,065 | |
* Non-income producing security.
Portfolio Abbreviations:
PLC - Public Limited Company
Touchstone Large Cap Core Equity Fund (Continued)
Other Information:
The inputs or methodology used for valuing securities may not be an indication of the risk associated with investing in those securities. For more information on valuation inputs, and their aggregation into the levels used in the table below, please refer to the security valuation section in the accompanying Notes to Financial Statements.
Valuation Inputs at Reporting Date:
| Description | | Level 1 | | | Level 2 | | | Level 3 | | | Total | |
| Common Stocks | | $ | 39,674,740 | | | $ | — | | | $ | — | | | $ | 39,674,740 | |
| | | | | | | | | | | | | | | $ | 39,674,740 | |
See accompanying Notes to Financial Statements.
Portfolio of Investments
Touchstone Mid Cap Growth Fund – December 31, 2014
| | | | | | Market | |
| | | Shares | | | Value | |
| | | | | | | |
| Common Stocks — 97.7% | | | | | | | | |
| | | | | | | | | |
| Consumer Discretionary — 20.2% | | | | | | | | |
| Allison Transmission Holdings, Inc. | | | 11,680 | | | $ | 395,952 | |
| AMC Networks, Inc. - Class A* | | | 4,710 | | | | 300,357 | |
| BorgWarner, Inc. | | | 6,000 | | | | 329,700 | |
| Deckers Outdoor Corp.* | | | 3,690 | | | | 335,938 | |
| Dollar General Corp.* | | | 3,950 | | | | 279,265 | |
| Hanesbrands, Inc. | | | 2,930 | | | | 327,047 | |
| Jarden Corp.* | | | 10,497 | | | | 502,596 | |
| Liberty Global PLC -Class C (United Kingdom)* | | | 8,750 | | | | 422,712 | |
| Panera Bread Co. - Class A* | | | 1,685 | | | | 294,538 | |
| Polaris Industries, Inc. | | | 2,380 | | | | 359,951 | |
| Starwood Hotels & Resorts Worldwide, Inc. | | | 3,550 | | | | 287,798 | |
| Tiffany & Co. | | | 3,910 | | | | 417,823 | |
| Ulta Salon Cosmetics & Fragrance, Inc.* | | | 3,020 | | | | 386,077 | |
| Whirlpool Corp. | | | 2,375 | | | | 460,132 | |
| | | | | | | | 5,099,886 | |
| | | | | | | | | |
| Health Care — 18.5% | | | | | | | | |
| Allscripts Healthcare Solutions, Inc.* | | | 21,150 | | | | 270,086 | |
| Cooper Cos., Inc. (The) | | | 2,930 | | | | 474,924 | |
| Cubist Pharmaceuticals, Inc.* | | | 6,220 | | | | 626,043 | |
| Endo International PLC (Ireland)*† | | | 7,100 | | | | 512,052 | |
| ICON PLC (Ireland)* | | | 6,460 | | | | 329,395 | |
| Jazz Pharmaceuticals PLC (Ireland)* | | | 3,695 | | | | 604,982 | |
| Mettler-Toledo International, Inc.* | | | 1,455 | | | | 440,079 | |
| MWI Veterinary Supply, Inc.* | | | 2,530 | | | | 429,872 | |
| Quest Diagnostics, Inc. | | | 8,510 | | | | 570,681 | |
| Vertex Pharmaceuticals, Inc.* | | | 3,470 | | | | 412,236 | |
| | | | | | | | 4,670,350 | |
| | | | | | | | | |
| Information Technology — 16.8% | | | | | | | | |
| Akamai Technologies, Inc.* | | | 5,020 | | | | 316,059 | |
| Alliance Data Systems Corp.* | | | 1,775 | | | | 507,739 | |
| Autodesk, Inc.* | | | 8,040 | | | | 482,882 | |
| F5 Networks, Inc.* | | | 2,890 | | | | 377,045 | |
| FEI Co. | | | 2,750 | | | | 248,462 | |
| LinkedIn Corp. - Class A* | | | 1,358 | | | | 311,946 | |
| NICE Systems Ltd. ADR | | | 6,800 | | | | 344,420 | |
| NXP Semiconductors N.V., (Netherlands)* | | | 6,190 | | | | 472,916 | |
| Red Hat, Inc.* | | | 5,420 | | | | 374,739 | |
| Skyworks Solutions, Inc. | | | 5,910 | | | | 429,716 | |
| Total System Services, Inc. | | | 11,020 | | | | 374,239 | |
| | | | | | | | 4,240,163 | |
| | | | | | | | | |
| Industrials — 13.8% | | | | | | | | |
| AMETEK, Inc. | | | 5,060 | | | | 266,308 | |
| Copart, Inc.* | | | 10,400 | | | | 379,496 | |
| IHS, Inc. - Class A* | | | 3,245 | | | | 369,541 | |
| ITT Corp. | | | 6,200 | | | | 250,852 | |
| JB Hunt Transport Services, Inc. | | | 3,510 | | | | 295,718 | |
| Macquarie Infrastructure Co. LLC | | | 3,420 | | | | 243,128 | |
| Nielsen Holdings NV | | | 6,350 | | | | 284,036 | |
| Norfolk Southern Corp. | | | 2,550 | | | | 279,506 | |
| Sensata Technologies Holding N.V. (Netherlands)* | | | 4,840 | | | | 253,664 | |
| TransDigm Group, Inc. | | | 1,425 | | | | 279,799 | |
| United Continental Holdings, Inc.* | | | 8,490 | | | | 567,896 | |
| | | | | | | | 3,469,944 | |
| | | | | | | | | |
| Financials — 9.2% | | | | | | | | |
| Ameriprise Financial, Inc. | | | 2,980 | | | | 394,105 | |
| Aon PLC (United Kingdom) | | | 4,800 | | | | 455,184 | |
| CBRE Group, Inc. - Class A* | | | 13,910 | | | | 476,418 | |
| Crown Castle International Corp. REIT | | | 3,330 | | | | 262,071 | |
| Regions Financial Corp. | | | 33,590 | | | | 354,710 | |
| T Rowe Price Group, Inc. | | | 4,270 | | | | 366,622 | |
| | | | | | | | 2,309,110 | |
| | | | | | | | | |
| Consumer Staples — 6.8% | | | | | | | | |
| Church & Dwight Co., Inc. | | | 6,530 | | | | 514,629 | |
| Constellation Brands, Inc. - Class A* | | | 4,620 | | | | 453,545 | |
| Mead Johnson Nutrition Co. | | | 4,620 | | | | 464,495 | |
| WhiteWave Foods Co.- Class A* | | | 7,820 | | | | 273,622 | |
| | | | | | | | 1,706,291 | |
| | | | | | | | | |
| Materials — 6.4% | | | | | | | | |
| Albemarle Corp.† | | | 2,980 | | | | 179,187 | |
| Celanese Corp. | | | 3,870 | | | | 232,045 | |
| Eastman Chemical Co. | | | 4,077 | | | | 309,281 | |
| MeadWestvaco Corp. | | | 9,370 | | | | 415,934 | |
| Vulcan Materials Co. | | | 7,060 | | | | 464,054 | |
| | | | | | | | 1,600,501 | |
| | | | | | | | | |
| Energy — 6.0% | | | | | | | | |
| CONSOL Energy, Inc. | | | 12,220 | | | | 413,158 | |
| Ensco PLC - Class A (United Kingdom) | | | 5,550 | | | | 166,222 | |
| Forum Energy Technologies, Inc.* | | | 13,860 | | | | 287,318 | |
| Tesoro Corp. | | | 5,200 | | | | 386,620 | |
| Valero Energy Corp. | | | 5,150 | | | | 254,925 | |
| | | | | | | | 1,508,243 | |
| Total Common Stocks | | | | | | $ | 24,604,488 | |
| | | | | | | | | |
| Investment Funds — 7.3% | | | | | | | | |
| Invesco Government & Agency | | | | | | | | |
| Portfolio, Institutional Class, | | | | | | | | |
| 0.01%**∞Ω | | | 633,331 | | | | 633,331 | |
| Touchstone Institutional Money Market | | | | | | | | |
| Fund, 0.01%^∞Ω | | | 1,203,959 | | | | 1,203,959 | |
| Total Investment Funds | | | | | | $ | 1,837,290 | |
| | | | | | | | | |
| Total Investment Securities —105.0% | | | | | | | | |
| (Cost $21,332,310) | | | | | | $ | 26,441,778 | |
| | | | | | | | | |
| Liabilities in Excess of Other Assets — (5.0%) | | | | | | | (1,264,020 | ) |
| | | | | | | | | |
| Net Assets — 100.0% | | | | | | $ | 25,177,758 | |
| * | Non-income producing security. |
Touchstone Mid Cap Growth Fund (Continued)
| ** | Represents collateral for securities loaned. |
| ^ | Affiliated Fund. See Note 4 in Notes to Financial Statements. |
| † | All or a portion of the security is on loan. The total market value of the securities on loan as of December 31, 2014 was $612,721. |
| Ω | Represents the 7-day SEC yield as of December 31, 2014. |
Portfolio Abbreviations:
ADR - American Depositary Receipt
PLC - Public Limited Company
REIT - Real Estate Investment Trust
Other Information:
The inputs or methodology used for valuing securities may not be an indication of the risk associated with investing in those securities. For more information on valuation inputs, and their aggregation into the levels used in the table below, please refer to the security valuation section in the accompanying Notes to Financial Statements.
Valuation inputs at Reporting Date:
| Description | | Level 1 | | | Level 2 | | | Level 3 | | | Total | |
| Common Stocks | | $ | 24,604,488 | | | $ | — | | | $ | — | | | $ | 24,604,488 | |
| Investment Funds | | | 1,837,290 | | | | — | | | | — | | | | 1,837,290 | |
| | | | | | | | | | | | | | | $ | 26,441,778 | |
See accompanying Notes to Financial Statements.
Portfolio of Investments
Touchstone Money Market Fund – December 31, 2014
| Principal | | | | | Interest | | | Maturity | | | |
| Amount | | | | | Rate | | | Date | | Value | |
| | | | | | | | | | | | |
| | | | | Variable Rate Demand Notes(A) — 48.1% | | | | | | | | | | |
| $ | 170,000 | | | Antigo WI IDR (Plaspack USA Proj) Ser 2008 B (LOC: BMO Harris Bank NA) | | | 0.400 | % | | 12/01/18 | | $ | 170,000 | |
| | 210,000 | | | Milwaukee WI Redev Auth (Kubin Nicholson) Ser 2000 B (LOC: BMO Harris Bank NA) | | | 0.400 | | | 08/01/20 | | | 210,000 | |
| | 285,000 | | | IL St Fin Auth Rev (Cmnty Action) Ser 2008 B (LOC: BMO Harris Bank NA) | | | 0.400 | | | 03/01/37 | | | 285,000 | |
| | 1,000,000 | | | Lexington Financial Services LLC US Domestic Ser 2008 | | | 0.320 | | | 01/01/33 | | | 1,000,000 | |
| | 843,000 | | | WAI Enterprises LLC Ser 2004 | | | 0.300 | | | 06/01/24 | | | 843,000 | |
| | 226,000 | | | Fitch Denny Funeral Home, Inc. Ser 2004 | | | 0.290 | | | 09/01/24 | | | 226,000 | |
| | 912,000 | | | Mill Street Village LLC Ser 2006 | | | 0.290 | | | 01/01/37 | | | 912,000 | |
| | 280,000 | | | FBC Chemical Corp. Ser 2000 | | | 0.270 | | | 10/01/15 | | | 280,000 | |
| | 115,000 | | | CA St Infra & Eco Dev BK Rev (Hillview Mental) Ser 2008 B (LOC: Comerica Bank) | | | 0.260 | | | 08/01/33 | | | 115,000 | |
| | 1,515,000 | | | Phoenix Realty IL Spl Account Rev Ser 1999 (LOC: Northern Trust Company) | | | 0.210 | | | 04/01/20 | | | 1,515,000 | |
| | 435,000 | | | Butler Co OH Capital Funding Rev (CCAO Low Cost) Ser 2005 B (LOC: US Bank NA) | | | 0.200 | | | 06/01/35 | | | 435,000 | |
| | 435,000 | | | Lexington-Fayette KY Urban Cnty (Eastland Parkway) Ser 2006 (LOC: Traditional Bank, Inc./FHLB) | | | 0.190 | | | 09/01/27 | | | 435,000 | |
| | 566,000 | | | Hopewell Development Co. Ser 2000 | | | 0.170 | | | 03/01/20 | | | 566,000 | |
| | 1,145,000 | | | WA St HFC (Brittany Pk) Ser 1996 B (LIQ: FNMA) | | | 0.170 | | | 11/01/21 | | | 1,145,000 | |
| | 160,000 | | | Alameda Co CA IDA Rev (Ettore Prods Co) Ser 2005 B (LOC: Comerica Bank) | | | 0.170 | | | 12/01/30 | | | 160,000 | |
| | 1,295,000 | | | Springfield MO IDA (DMP Pptys LLC) Ser 2001 B (LOC: Guaranty Bank) | | | 0.160 | | | 08/01/21 | | | 1,295,000 | |
| | 1,290,000 | | | Sheboygan Falls WI Indl Rev (Adj Dev Htt Inc Proj) Ser 2007 A (LOC: U.S. Bank NA) | | | 0.160 | | | 01/01/32 | | | 1,290,000 | |
| | 350,000 | | | FL St HFC (Hsg Waterford Pointe) Ser 2000 E 2 (LIQ: FNMA) | | | 0.160 | | | 02/15/33 | | | 350,000 | |
| | 240,000 | | | WA St HFC (Whisperwood) Ser 2002 B (LIQ: FNMA) | | | 0.150 | | | 05/15/35 | | | 240,000 | |
| | 240,000 | | | Maricopa Co AZ IDA (San Angelin Apts) Ser 2004 A (LIQ: FNMA) | | | 0.150 | | | 05/15/37 | | | 240,000 | |
| | 865,000 | | | Miarko, Inc. Ser 2007 | | | 0.140 | | | 02/01/27 | | | 865,000 | |
| | 780,000 | | | M&P Richfield LLC Ser 2001 | | | 0.140 | | | 11/01/28 | | | 780,000 | |
| | 1,200,000 | | | Abag CA Fin Auth For Nonprofit (Hsg Gaia Bldg A T) Ser 2000 (LIQ: FNMA) | | | 0.110 | | | 09/15/32 | | | 1,200,000 | |
| | 170,000 | | | Tennis For Charity, Inc. OH Ser 2004 (LOC: JP Morgan Chase Bank NA) | | | 0.080 | | | 12/01/29 | | | 170,000 | |
| | 1,200,000 | | | Allen Co OH Hosp Facs Rev (Catholic Healthcare) Ser 2010 C (LOC: Union Bank NA) | | | 0.040 | | | 06/01/34 | | | 1,200,000 | |
| | 1,000,000 | | | WI St Hlth & Edl Fa (Bay Area Med Ctr Inc) Ser 2008 (LOC: BMO Harris Bank NA) | | | 0.030 | | | 02/01/38 | | | 1,000,000 | |
| | 700,000 | | | NY Ser 2004 (LOC: Bank of NY Mellon) | | | 0.020 | | | 03/01/34 | | | 700,000 | |
| | 980,000 | | | VT St Edl & Hlth Bldg Ser 2008 A (LOC: TD Banknorth NA) | | | 0.010 | | | 10/01/28 | | | 980,000 | |
| | 1,150,000 | | | MS St Business Fin Co (Chevron Usa Inc Proj) Ser 2007 A | | | 0.010 | | | 12/01/30 | | | 1,150,000 | |
| | 1,200,000 | | | OH St Hgr Edu Fac Rev (Case Western Reserve University Proj) Ser 2002 A (SPA: Wells Fargo Bank NA) | | | 0.010 | | | 10/01/31 | | | 1,200,000 | |
| | 350,000 | | | East Baton Rouge Parish LA IDB (ExxonMobil Proj) Ser 2010 A | | | 0.010 | | | 08/01/35 | | | 350,000 | |
| | 600,000 | | | East Baton Rouge Parish LA IDB (ExxonMobil Proj) Ser 2010 B | | | 0.010 | | | 12/01/40 | | | 600,000 | |
| | | | | Total Variable Rate Demand Notes | | | | | | | | $ | 21,907,000 | |
| | | | | | | | | | | | | | | |
| | | | | U.S. Government Agency Obligations — 24.9% | | | | | | | | | | |
| | 2,000,000 | | | Overseas Private Investment Corp.(A)(B) | | | 0.110 | | | 06/15/17 | | | 2,000,000 | |
| | 923,067 | | | Overseas Private Investment Corp.(A)(B) | | | 0.110 | | | 10/20/17 | | | 923,067 | |
| | 1,000,000 | | | Overseas Private Investment Corp.(A)(B) | | | 0.110 | | | 09/15/20 | | | 1,000,000 | |
| | 1,298,246 | | | Overseas Private Investment Corp.(A)(B) | | | 0.110 | | | 03/15/24 | | | 1,298,245 | |
| | 604,081 | | | Overseas Private Investment Corp.(A)(B) | | | 0.110 | | | 03/15/24 | | | 604,081 | |
| | 4,000,000 | | | Overseas Private Investment Corp.(A)(B) | | | 0.110 | | | 07/15/25 | | | 4,000,000 | |
| | 700,000 | | | Overseas Private Investment Corp.(A)(B) | | | 0.110 | | | 09/30/31 | | | 700,000 | |
| | 300,000 | | | Overseas Private Investment Corp.(A)(B) | | | 0.110 | | | 09/30/31 | | | 300,000 | |
| | 300,000 | | | Overseas Private Investment Corp.(A)(B) | | | 0.110 | | | 09/30/31 | | | 300,000 | |
| | 200,000 | | | Overseas Private Investment Corp.(A)(B) | | | 0.110 | | | 09/30/31 | | | 200,000 | |
| | | | | Total U.S. Government Agency Obligations | | | | | | | | $ | 11,325,393 | |
| | | | | | | | | | | | | | | |
| | | | | Corporate Bonds — 12.6% | | | | | | | | | | |
| | 500,000 | | | Bank of Nova Scotia | | | 1.850 | | | 01/12/15 | | | 500,229 | |
Touchstone Money Market Fund (Continued)
| Principal | | | | | Interest | | | Maturity | | | |
| Amount | | | | | Rate | | | Date | | Value | |
| | | | | | | | | | | | |
| | | | | Corporate Bonds — 12.6% (Continued) | | | | | | | | | | |
| $ | 145,000 | | | Credit Suisse USA, Inc. | | | 4.875 | % | | 01/15/15 | | $ | 145,242 | |
| | 164,000 | | | EI du Pont DE Nemours & Co. | | | 3.250 | | | 01/15/15 | | | 164,181 | |
| | 100,000 | | | UBS AG/Stamford CT | | | 3.875 | | | 01/15/15 | | | 100,133 | |
| | 100,000 | | | Bank of Nova Scotia | | | 3.400 | | | 01/22/15 | | | 100,180 | |
| | 200,000 | | | Bank of Tokyo-Mitsubishi UFJ Ltd (The) 144a | | | 3.850 | | | 01/22/15 | | | 200,394 | |
| | 1,300,000 | | | HSBC USA, Inc. MTN | | | 2.375 | | | 02/13/15 | | | 1,303,124 | |
| | 418,000 | | | Procter & Gamble Co. (The) MTN | | | 3.500 | | | 02/15/15 | | | 419,636 | |
| | 1,400,000 | | | Toyota Motor Credit Corp. MTN | | | 1.000 | | | 02/17/15 | | | 1,401,348 | |
| | 200,000 | | | Bank of New York Mellon Corp. (The) MTN | | | 1.200 | | | 02/20/15 | | | 200,094 | |
| | 600,000 | | | US BanCorp. MN MTN | | | 3.150 | | | 03/04/15 | | | 602,951 | |
| | 400,000 | | | Cooperatieve Centrale Raiffeisen-Boerenleenbank BA/Netherlands 144a | | | 3.200 | | | 03/11/15 | | | 402,227 | |
| | 100,000 | | | Credit Suisse/New York NY MTN | | | 3.500 | | | 03/23/15 | | | 100,691 | |
| | 100,000 | | | Caterpillar Financial Services Corp. | | | 1.050 | | | 03/26/15 | | | 100,173 | |
| | | | | Total Corporate Bonds | | | | | | | | $ | 5,740,603 | |
| | | | | | | | | | | | | | | |
| | | | | Commercial Paper — 9.7% | | | | | | | | | | |
| | 1,000,000 | | | Bank of Tokyo-Mitsubishi UFJ Ltd (The)(C) | | | 0.120 | | | 01/02/15 | | | 999,997 | |
| | 1,000,000 | | | Nstar Electric(C) | | | 0.240 | | | 01/06/15 | | | 999,967 | |
| | 400,000 | | | Nstar Electric(C) | | | 0.200 | | | 01/08/15 | | | 399,984 | |
| | 1,000,000 | | | National Rural Utilities(C) | | | 0.140 | | | 01/16/15 | | | 999,942 | |
| | 1,000,000 | | | Nordea Bank(C) | | | 0.150 | | | 01/21/15 | | | 999,917 | |
| | | | | Total Commercial Paper | | | | | | | | $ | 4,399,807 | |
| | | | | | | | | | | | | | | |
| | | | | Certificate of Deposit — 3.5% | | | | | | | | | | |
| | 500,000 | | | Bank of Nova Scotia/Houston(B) | | | 0.290 | | | 02/25/15 | | | 500,000 | |
| | 500,000 | | | Canadian Imperial Bank of Commerce/New York NY(B) | | | 0.215 | | | 03/20/15 | | | 500,000 | |
| | 600,000 | | | Cooperatieve Centrale Raiffeisen-Boerenleenbank BA/NY(B) | | | 0.262 | | | 07/17/15 | | | 600,000 | |
| | | | | Total Certificate of Deposit | | | | | | | | $ | 1,600,000 | |
| | | | | | | | | | | | | | | |
| | | | | Municipal Bonds — 1.1% | | | | | | | | | | |
| | 200,000 | | | Avon OH Wtr Sys Impt Rev BANS Txbl Revenue Notes Ser 2014 | | | 1.000 | | | 02/05/15 | | | 200,086 | |
| | 200,000 | | | Franklin Co OH Spl Oblg Txbl BANS Stadium Fac Proj Ser 2014 | | | 0.800 | | | 03/05/15 | | | 200,137 | |
| | 100,000 | | | Westerville OH Spl Oblg Non-Tax Revenue Txbl Notes Ser 2014 | | | 0.350 | | | 05/05/15 | | | 100,000 | |
| | | | | Total Municipal Bonds | | | | | | | | $ | 500,223 | |
| | | | | | | | | | | | | | | |
| | | | | Total Investment Securities —99.9% | | | | | | | | | | |
| | | | | (Cost $45,473,026) | | | | | | | | $ | 45,473,026 | |
| | | | | | | | | | | | | | | |
| | | | | Other Assets in Excess of Liabilities — 0.1% | | | | | | | | | 28,046 | |
| | | | | | | | | | | | | | | |
| | | | | Net Assets — 100.0% | | | | | | | | $ | 45,501,072 | |
| (A) | Demand Feature - Maturities shown are the final maturities, not the date on which principal could be recovered through the demand feature. |
| | |
| (B) | Variable rate security - Rate reflected is the rate in effect as of December 31, 2014. |
| | |
| (C) | Rate reflects yield at the time of purchase. |
Touchstone Money Market Fund (Continued)
| Portfolio Abbreviations: | | | | |
| | | | | |
| BANS - Bond Anticipation Notes | | IDA - Industrial Development Authority/Agency | | LOC - Letter of Credit |
| | | | | |
| CCAO - County Commissioners' Association of Ohio | | IDB - Industrial Development Board | | MTN - Medium Term Note |
| | | | | |
| FHLB - Federal Home Loan Bank | | IDR - Industrial Development Revenue | | SPA - Stand-by Purchase Agreement |
| | | | | |
| FNMA - Federal National Mortgage Association | | LIQ - Liquidity Facility | | |
| | | | | |
| HFC - Housing Finance Commission | | LLC - Limited Liability Company | | |
144a - This is a restricted security that was sold in a transaction qualifying for the exemption under Rule 144A of the Securities Act of 1933. These securities may be sold in transactions exempt from registration, normally to qualified institutional buyers. At December 31, 2014, these securities were valued at $602,621 or 1.3% of net assets. These securities were deemed liquid pursuant to procedures approved by the Board of Trustees.
Other Information:
The inputs or methodology used for valuing securities may not be an indication of the risk associated with investing in those securities. For more information on valuation inputs, and their aggregation into the levels used in the table below, please refer to the security valuation section in the accompanying Notes to Financial Statements.
Valuation inputs at Reporting Date:
| Description | | Level 1 | | | Level 2 | | | Level 3 | | | Total | |
| Variable Rate Demand Notes | | $ | — | | | $ | 21,907,000 | | | $ | — | | | $ | 21,907,000 | |
| U.S. Government Agency Obligations | | | — | | | | 11,325,393 | | | | — | | | | 11,325,393 | |
| Corporate Bonds | | | — | | | | 5,740,603 | | | | — | | | | 5,740,603 | |
| Commercial Paper | | | — | | | | 4,399,807 | | | | — | | | | 4,399,807 | |
| Certificate of Deposit | | | — | | | | 1,600,000 | | | | — | | | | 1,600,000 | |
| Municipal Bonds | | | — | | | | 500,223 | | | | — | | | | 500,223 | |
| | | | | | | | | | | | | | | $ | 45,473,026 | |
See accompanying Notes to Financial Statements.
Portfolio of Investments
Touchstone Third Avenue Value Fund – December 31, 2014
| | | | | | Market | |
| | | Shares | | | Value | |
| | | | | | | |
| Common Stocks — 95.7% | | | | | | | | |
| | | | | | | | | |
| United States — 72.5% | | | | | | | | |
| | | | | | | | | |
| Consumer Discretionary — 7.7% | | | | | | | | |
| CBS Corp. - Class B | | | 13,000 | | | $ | 719,420 | |
| General Motors Co. | | | 19,200 | | | | 670,272 | |
| Target Corp. | | | 7,246 | | | | 550,044 | |
| | | | | | | | | |
| Energy — 13.4% | | | | | | | | |
| Apache Corp. | | | 13,536 | | | | 848,301 | |
| Bristow Group, Inc. | | | 9,140 | | | | 601,321 | |
| Devon Energy Corp. | | | 14,574 | | | | 892,075 | |
| SEACOR Holdings, Inc.* | | | 8,015 | | | | 591,587 | |
| World Fuel Services Corp. | | | 9,900 | | | | 464,607 | |
| | | | | | | | | |
| Financials — 30.9% | | | | | | | | |
| Bank of New York Mellon Corp. (The) | | | 38,148 | | | | 1,547,664 | |
| Comerica, Inc. | | | 25,314 | | | | 1,185,708 | |
| KeyCorp | | | 76,480 | | | | 1,063,072 | |
| Leucadia National Corp. | | | 34,099 | | | | 764,500 | |
| Loews Corp. | | | 12,444 | | | | 522,897 | |
| Tejon Ranch Co.* | | | 14,900 | | | | 438,953 | |
| Weyerhaeuser Co. REIT | | | 43,755 | | | | 1,570,367 | |
| White Mountains Insurance Group Ltd. | | | 1,145 | | | | 721,476 | |
| | | | | | | | | |
| Health Care — 1.7% | | | | | | | | |
| Brookdale Senior Living, Inc.* | | | 11,500 | | | | 421,705 | |
| | | | | | | | | |
| Industrials — 11.2% | | | | | | | | |
| AGCO Corp.† | | | 14,100 | | | | 637,320 | |
| Barnes Group, Inc. | | | 13,200 | | | | 488,532 | |
| Powell Industries, Inc. | | | 10,650 | | | | 522,596 | |
| Regal-Beloit Corp. | | | 5,000 | | | | 375,999 | |
| UniFirst Corp. MA | | | 3,800 | | | | 461,510 | |
| Valmont Industries, Inc.† | | | 2,783 | | | | 353,441 | |
| | | | | | | | | |
| Information Technology — 6.5% | | | | | | | | |
| DST Systems, Inc. | | | 3,000 | | | | 282,449 | |
| NVIDIA Corp. | | | 31,836 | | | | 638,312 | |
| Symantec Corp. | | | 27,676 | | | | 710,028 | |
| | | | | | | | | |
| Materials — 1.1% | | | | | | | | |
| Westlake Chemical Corp. | | | 4,500 | | | | 274,905 | |
| Total United States | | | | | | | 18,319,061 | |
| | | | | | | | | |
| France — 6.8% | | | | | | | | |
| | | | | | | | | |
| Consumer Discretionary — 1.9% | | | | | | | | |
| Cie Generale des Etablissements Michelin | | | 5,314 | | | | 479,678 | |
| | | | | | | | | |
| Energy — 2.7% | | | | | | | | |
| Total SA | | | 13,303 | | | | 681,541 | |
| | | | | | | | | |
| Industrials — 2.2% | | | | | | | | |
| Nexans SA* | | | 18,264 | | | | 558,910 | |
| Total France | | | | | | | 1,720,129 | |
| | | | | | | | | |
| Canada — 6.2% | | | | | | | | |
| | | | | | | | | |
| Materials — 6.2% | | | | | | | | |
| Canfor Corp.* | | | 33,787 | | | | 861,979 | |
| Canfor Corp.* | | | 2,509 | | | | 63,779 | |
| Capstone Mining Corp.* | | | 364,900 | | | | 637,586 | |
| Total Canada | | | | | | | 1,563,344 | |
| | | | | | | | | |
| Hong Kong — 5.9% | | | | | | | | |
| | | | | | | | | |
| Financials — 3.0% | | | | | | | | |
| Cheung Kong Holdings Ltd. | | | 45,000 | | | | 753,607 | |
| | | | | | | | | |
| Industrials — 2.9% | | | | | | | | |
| Hutchison Whampoa Ltd. | | | 63,000 | | | | 720,189 | |
| Total Hong Kong | | | | | | | 1,473,796 | |
| | | | | | | | | |
| Korea — 2.8% | | | | | | | | |
| | | | | | | | | |
| Materials — 2.8% | | | | | | | | |
| POSCO ADR | | | 10,928 | | | | 697,316 | |
| | | | | | | | | |
| China — 1.5% | | | | | | | | |
| | | | | | | | | |
| Financials — 1.5% | | | | | | | | |
| Pargesa Holding SA | | | 5,019 | | | | 387,296 | |
| Total Common Stocks | | | | | | $ | 24,160,942 | |
| | | | | | | | | |
| Investment Funds — 8.4% | | | | | | | | |
| Invesco Government & Agency | | | | | | | | |
| Portfolio, Institutional Class, | | | | | | | | |
| 0.01%**∞Ω | | | 1,009,915 | | | | 1,009,915 | |
| Touchstone Institutional Money Market | | | | | | | | |
| Fund, 0.01%^∞Ω | | | 1,119,946 | | | | 1,119,946 | |
| Total Investment Funds | | | | | | $ | 2,129,861 | |
| | | | | | | | | |
| Total Investment Securities —104.1% | | | | | | | | |
| (Cost 24,476,909) | | | | | | $ | 26,290,803 | |
| | | | | | | | | |
| Liabilities in Excess of Other Assets — (4.1%) | | | | | | | (1,027,550 | ) |
| | | | | | | | | |
| Net Assets — 100.0% | | | | | | $ | 25,263,253 | |
| * | Non-income producing security. |
| ** | Represents collateral for securities loaned. |
| ^ | Affiliated Fund. See Note 4 in Notes to Financial Statements. |
| † | All or a portion of the security is on loan. The total market value of the securities on loan as of December 31, 2014 was $976,312. |
| Ω | Represents the 7-day SEC yield as of December 31, 2014. |
Touchstone Third Avenue Value Fund (Continued)
Portfolio Abbreviations:
ADR - American Depositary Receipt
REIT - Real Estate Investment Trust
Other Information:
The inputs or methodology used for valuing securities may not be an indication of the risk associated with investing in those securities. For more information on valuation inputs, and their aggregation into the levels used in the table below, please refer to the security valuation section in the accompanying Notes to Financial Statements.
Valuation inputs at Reporting Date:
| Description | | Level 1 | | | Level 2 | | | Level 3 | | | Total | |
| Assets: | | | | | | | | | | | | | | | | |
| Common Stocks | | | | | | | | | | | | | | | | |
| United States | | $ | 18,319,061 | | | $ | — | | | $ | — | | | $ | 18,319,061 | |
| France | | | — | | | | 1,720,129 | | | | — | | | | 1,720,129 | |
| Canada | | | 1,563,344 | | | | — | | | | — | | | | 1,563,344 | |
| Hong Kong | | | — | | | | 1,473,796 | | | | — | | | | 1,473,796 | |
| Korea | | | 697,316 | | | | — | | | | — | | | | 697,316 | |
| China | | | — | | | | 387,296 | | | | — | | | | 387,296 | |
| Investment Funds | | | 2,129,861 | | | | — | | | | — | | | | 2,129,861 | |
| | | | | | | | | | | | | | | $ | 26,290,803 | |
At December 31, 2014, securities valued at $2,714,247 were transferred from Level 1 to Level 2. Transfers from Level 1 to Level 2 are due to the closure of several foreign markets on December 31, 2014.
See accompanying Notes to Financial Statements.
Portfolio of Investments
Touchstone Aggressive ETF Fund – December 31, 2014
| | | | | Market |
| Shares | | | | Value |
| | | | | |
| | | | | Exchange Traded Funds — 98.8% | | | | |
| | 8,340 | | | iShares Core S&P 500 ETF | | $ | 1,725,546 | |
| | 42,500 | | | iShares Core US Aggregate Bond ETF | | | 4,680,100 | |
| | 53,700 | | | iShares MSCI EAFE Index Fund† | | | 3,267,108 | |
| | 57,470 | | | iShares S&P 500 Growth Index Fund | | | 6,413,652 | |
| | 52,400 | | | iShares S&P 500 Value Index Fund† | | | 4,913,548 | |
| | 4,370 | | | iShares S&P MidCap 400 Growth Index Fund† | | | 697,758 | |
| | 7,460 | | | iShares S&P MidCap 400 Value Index Fund† | | | 953,612 | |
| | 3,690 | | | iShares S&P SmallCap 600 Growth Index Fund† | | | 451,619 | |
| | 5,970 | | | iShares S&P SmallCap 600 Value Index Fund† | | | 704,102 | |
| | | | | Total Exchange Traded Funds | | $ | 23,807,045 | |
| | | | | | | | | |
| | | | | Investment Funds — 13.5% | | | | |
| | 2,834,800 | | | Invesco Government & Agency | | | | |
| | | | | Portfolio, Institutional Class, | | | | |
| | | | | 0.01%**∞Ω | | | 2,834,800 | |
| | 414,640 | | | Touchstone Institutional Money | | | | |
| | | | | Market Fund, 0.01%^∞Ω | | | 414,640 | |
| | | | | Total Investment Funds | | $ | 3,249,440 | |
| | | | | | | | | |
| | | | | Total Investment Securities —112.3% | | | | |
| | | | | (Cost $23,461,446) | | $ | 27,056,485 | |
| | | | | | | | | |
| | | | | Liabilities in Excess of | | | | |
| | | | | Other Assets — (12.3%) | | | (2,957,397 | ) |
| | | | | | | | | |
| | | | | Net Assets — 100.0% | | $ | 24,099,088 | |
| ** | Represents collateral for securities loaned. |
| ^ | Affiliated Fund. See Note 4 in Notes to Financial Statements. |
| † | All or a portion of the security is on loan. The total market value of the securities on loan as of December 31, 2014 was $2,756,332. |
| Ω | Represents the 7-day SEC yield as of December 31, 2014. |
Portfolio Abbreviation:
ETF - Exchange Traded Fund
Other Information:
The inputs or methodology used for valuing securities may not be an indication of the risk associated with investing in those securities. For more information on valuation inputs, and their aggregation into the levels used in the table below, please refer to the security valuation section in the accompanying Notes to Financial Statements.
Valuation inputs at Reporting Date:
| Description | | Level 1 | | Level 2 | | Level 3 | | Total |
| Exchange Traded Funds | | $ | 23,807,045 | | | $ | — | | | $ | — | | | $ | 23,807,045 | |
| Investment Funds | | | 3,249,440 | | | | — | | | | — | | | | 3,249,440 | |
| | | | | | | | | | | | | | | $ | 27,056,485 | |
See accompanying Notes to Financial Statements.
Portfolio of Investments
Touchstone Conservative ETF Fund – December 31, 2014
| | | | | Market |
| Shares | | | | Value |
| | | | | | | | | |
| | | | | Exchange Traded Funds — 98.8% | | | | |
| | 40,310 | | | iShares Barclays 1-3 Year Treasury | | | | |
| | | | | Bond Fund† | | $ | 3,404,180 | |
| | 3,400 | | | iShares Core S&P 500 ETF | | | 703,460 | |
| | 105,300 | | | iShares Core US Aggregate Bond ETF | | | 11,595,636 | |
| | 22,990 | | | iShares MSCI EAFE Index Fund† | | | 1,398,712 | |
| | 24,760 | | | iShares S&P 500 Growth Index Fund | | | 2,763,216 | |
| | 23,080 | | | iShares S&P 500 Value Index Fund† | | | 2,164,212 | |
| | 1,360 | | | iShares S&P MidCap 400 Growth Index Fund† | | | 217,151 | |
| | 3,480 | | | iShares S&P MidCap 400 Value Index Fund† | | | 444,848 | |
| | 1,740 | | | iShares S&P SmallCap 600 Growth Index Fund | | | 212,959 | |
| | 1,800 | | | iShares S&P SmallCap 600 Value Index Fund† | | | 212,291 | |
| | | | | Total Exchange Traded Funds | | $ | 23,116,665 | |
| | | | | | | | | |
| | | | | Investment Funds — 19.3% | | | | |
| | 4,181,791 | | | Invesco Government & Agency | | | | |
| | | | | Portfolio, Institutional Class, | | | | |
| | | | | 0.01%**∞Ω | | | 4,181,791 | |
| | 323,485 | | | Touchstone Institutional Money | | | | |
| | | | | Market Fund, 0.01%^∞Ω | | | 323,485 | |
| | | | | Total Investment Funds | | $ | 4,505,276 | |
| | | | | | | | | |
| | | | | Total Investment Securities —118.1% | | | | |
| | | | | (Cost $25,417,910) | | $ | 27,621,941 | |
| | | | | | | | | |
| | | | | Liabilities in Excess of | | | | |
| | | | | Other Assets — (18.1%) | | | (4,232,504 | ) |
| | | | | | | | | |
| | | | | Net Assets — 100.0% | | $ | 23,389,437 | |
| ** | Represents collateral for securities loaned. |
| ^ | Affiliated Fund. See Note 4 in Notes to Financial Statements. |
| † | All or a portion of the security is on loan. The total market value of the securities on loan as of December 31,2014 was $ 4,088,464. |
| Ω | Represents the 7-day SEC yield as of December 31, 2014. |
Portfolio Abbreviation:
ETF - Exchange Traded Fund
Other Information:
The inputs or methodology used for valuing securities may not be an indication of the risk associated with investing in those securities. For more information on valuation inputs, and their aggregation into the levels used in the table below, please refer to the security valuation section in the accompanying Notes to Financial Statements.
Valuation inputs at Reporting Date:
| Description | | Level 1 | | Level 2 | | Level 3 | | Total |
| Exchange Traded Funds | | $ | 23,116,665 | | | $ | — | | | $ | — | | | $ | 23,116,665 | |
| Investment Funds | | | 4,505,276 | | | | — | | | | — | | | | 4,505,276 | |
| | | | | | | | | | | | | | | $ | 27,621,941 | |
See accompanying Notes to Financial Statements.
Portfolio of Investments
Touchstone Moderate ETF Fund – December 31, 2014
| | | | | Market |
| Shares | | | | Value |
| | | | | |
| | | | | Exchange Traded Funds — 98.8% | | | | |
| | 9,940 | | | iShares Core S&P 500 ETF | | $ | 2,056,586 | |
| | 118,100 | | | iShares Core US Aggregate Bond ETF | | | 13,005,172 | |
| | 55,510 | | | iShares MSCI EAFE Index Fund† | | | 3,377,228 | |
| | 60,400 | | | iShares S&P 500 Growth Index Fund | | | 6,740,640 | |
| | 54,210 | | | iShares S&P 500 Value Index Fund | | | 5,083,272 | |
| | 4,010 | | | iShares S&P MidCap 400 Growth Index Fund† | | | 640,277 | |
| | 7,600 | | | iShares S&P MidCap 400 Value Index Fund† | | | 971,508 | |
| | 2,430 | | | iShares S&P SmallCap 600 Growth Index Fund | | | 297,408 | |
| | 5,320 | | | iShares S&P SmallCap 600 Value Index Fund† | | | 627,441 | |
| | | | | Total Exchange Traded Funds | | $ | 32,799,532 | |
| | | | | | | | | |
| | | | | Investment Funds — 17.7% | | | | |
| | 5,246,664 | | | Invesco Government & Agency | | | | |
| | | | | Portfolio, Institutional Class, | | | | |
| | | | | 0.01%**∞Ω | | | 5,246,664 | |
| | 630,629 | | | Touchstone Institutional Money | | | | |
| | | | | Market Fund, 0.01%^∞Ω | | | 630,629 | |
| | | | | Total Investment Funds | | $ | 5,877,293 | |
| | | | | | | | | |
| | | | | Total Investment Securities —116.5% | | | | |
| | | | | (Cost $32,931,892) | | $ | 38,676,825 | |
| | | | | | | | | |
| | | | | Liabilities in Excess of | | | | |
| | | | | Other Assets — (16.5%) | | | (5,477,066 | ) |
| | | | | | | | | |
| | | | | Net Assets — 100.0% | | $ | 33,199,759 | |
| ** | Represents collateral for securities loaned. |
| † | All or a portion of the security is on loan. The total market value of the securities on loan as of December 31, 2014 was $5,102,849. |
| Ω | Represents the 7-day SEC yield as of December 31, 2014. |
Portfolio Abbreviation:
ETF - Exchange Traded Fund
Other Information:
The inputs or methodology used for valuing securities may not be an indication of the risk associated with investing in those securities. For more information on valuation inputs, and their aggregation into the levels used in the table below, please refer to the security valuation section in the accompanying Notes to Financial Statements.
Valuation inputs at Reporting Date:
| Description | | Level 1 | | Level 2 | | Level 3 | | Total |
| Exchange Traded Funds | | $ | 32,799,532 | | | $ | — | | | $ | — | | | $ | 32,799,532 | |
| Investment Funds | | | 5,877,293 | | | | — | | | | — | | | | 5,877,293 | |
| | | | | | | | | | | | | | | $ | 38,676,825 | |
See accompanying Notes to Financial Statements.
Statements of Assets and Liabilities
December 31, 2014
| | | | | Touchstone | | | | |
| | | Touchstone | | Baron Small | | Touchstone | | Touchstone |
| | | Active Bond | | Cap Growth | | High Yield | | Large Cap Core |
| | | Fund | | Fund | | Fund | | Equity Fund |
| Assets | | | | | | | | | | | | | | | | |
| Investments, at cost | | $ | 48,177,326 | | | $ | 16,680,469 | | | $ | 13,487,908 | | | $ | 30,415,746 | |
| Affiliated securities, at market value | | $ | 1,352,467 | | | $ | 1,437,513 | | | $ | 1,242,581 | | | $ | — | |
| Non-affiliated securities, at market value | | | 47,345,586 | | | | 28,831,748 | | | | 11,879,661 | | | | 39,674,740 | |
| Investments, at market value (A) | | $ | 48,698,053 | | | $ | 30,269,261 | | | $ | 13,122,242 | | | $ | 39,674,740 | |
| Cash | | | — | | | | — | | | | — | | | | — | |
| Dividends and interest receivable | | | 352,674 | | | | 18,179 | | | | 213,817 | | | | 59,559 | |
| Receivable for capital shares sold | | | 17 | | | | — | | | | 3,610 | | | | 17 | |
| Receivable for investments sold | | | 33,128 | | | | 5,514 | | | | — | | | | 1,103,367 | |
| Securities lending income receivable | | | — | | | | 1,117 | | | | 10 | | | | 3 | |
| Receivable from Investment Advisor | | | — | | | | — | | | | — | | | | — | |
| Tax reclaim receivable | | | — | | | | — | | | | — | | | | — | |
| Other assets | | | 625 | | | | 315 | | | | 182 | | | | 487 | |
| Total Assets | | | 49,084,497 | | | | 30,294,386 | | | | 13,339,861 | | | | 40,838,173 | |
| | | | | | | | | | | | | | | | | |
| Liabilities | | | | | | | | | | | | | | | | |
| Bank overdrafts | | | — | | | | — | | | | — | | | | 74,223 | |
| Payable for return of collateral for securities on loan | | | — | | | | 3,848,305 | | | | 13,674 | | | | — | |
| Payable for capital shares redeemed | | | 9,025 | | | | 10,773 | | | | 229 | | | | 5,066 | |
| Payable for investments purchased | | | — | | | | — | | | | — | | | | — | |
| Payable to Investment Advisor | | | 22,886 | | | | 23,171 | | | | 3,292 | | | | 22,751 | |
| Payable to other affiliates | | | 33,785 | | | | 5,581 | | | | — | | | | 41,268 | |
| Payable to Trustees | | | 6,061 | | | | 6,061 | | | | 6,061 | | | | 6,061 | |
| Payable for professional services | | | 19,299 | | | | 20,060 | | | | 18,157 | | | | 17,723 | |
| Payable for pricing services | | | 10,177 | | | | 1,200 | | | | 11,993 | | | | 1,016 | |
| Payable for reports to shareholders | | | 3,347 | | | | 3,260 | | | | 3,224 | | | | 3,298 | |
| Other accrued expenses and liabilities | | | 1,476 | | | | 1,222 | | | | 217 | | | | 2,702 | |
| Total Liabilities | | | 106,056 | | | | 3,919,633 | | | | 56,847 | | | | 174,108 | |
| | | | | | | | | | | | | | | | | |
| Net Assets | | $ | 48,978,441 | | | $ | 26,374,753 | | | $ | 13,283,014 | | | $ | 40,664,065 | |
| | | | | | | | | | | | | | | | | |
| Net assets consist of: | | | | | | | | | | | | | | | | |
| Paid-in capital | | $ | 48,168,993 | | | $ | 10,453,486 | | | $ | 13,370,303 | | | $ | 34,834,632 | |
| Accumulated net investment income | | | 1,125,067 | | | | 58,316 | | | | 674,810 | | | | 493,821 | |
| Accumulated net realized gains (losses) on investments and foreign currency transactions | | | (836,346 | ) | | | 2,274,159 | | | | (396,433 | ) | | | (3,923,382 | ) |
| Net unrealized appreciation (depreciation) on investments and foreign currency transactions | | | 520,727 | | | | 13,588,792 | | | | (365,666 | ) | | | 9,258,994 | �� |
| Net assets applicable to shares outstanding | | $ | 48,978,441 | | | $ | 26,374,753 | | | $ | 13,283,014 | | | $ | 40,664,065 | |
| | | | | | | | | | | | | | | | | |
| Shares of beneficial interest outstanding (unlimited number of shares authorized, no par value) | | | 4,670,852 | | | | 1,231,167 | | | | 1,994,366 | | | | 2,728,875 | |
| Net asset value, offering price and redemption price per share | | $ | 10.49 | | | $ | 21.42 | | | $ | 6.66 | | | $ | 14.90 | |
| | | | | | | | | | | | | | | | | |
| (A) Includes market value of securities on loan of: | | $ | — | | | $ | 3,717,756 | | | $ | 13,224 | | | $ | — | |
See accompanying Notes to Financial Statements.
Statements of Assets and Liabilities (Continued)
| Touchstone | | Touchstone | | Touchstone | | Touchstone | | Touchstone | | Touchstone |
| Mid Cap | | Money Market | | Third Avenue | | Aggressive ETF | | Conservative | | Moderate ETF |
| Growth Fund | | Fund | | Value Fund | | Fund | | ETF Fund | | Fund |
| | | | | | | | | | | |
| $ | 21,332,310 | | | $ | 45,473,026 | | | $ | 24,476,909 | | | $ | 23,461,446 | | | $ | 25,417,910 | | | $ | 32,931,892 | |
| $ | 1,203,959 | | | $ | — | | | $ | 1,119,946 | | | $ | 414,640 | | | $ | 323,485 | | | $ | 630,629 | |
| | 25,237,819 | | | | 45,473,026 | | | | 25,170,857 | | | | 26,641,845 | | | | 27,298,456 | | | | 38,046,196 | |
| $ | 26,441,778 | | | $ | 45,473,026 | | | $ | 26,290,803 | | | $ | 27,056,485 | | | $ | 27,621,941 | | | $ | 38,676,825 | |
| | — | | | | 35,239 | | | | — | | | | — | | | | — | | | | — | |
| | 8,555 | | | | 59,981 | | | | 11,985 | | | | — | | | | — | | | | — | |
| | 250 | | | | — | | | | 313 | | | | — | | | | — | | | | — | |
| | — | | | | — | | | | 99,308 | | | | 34,024 | | | | 102,664 | | | | — | |
| | 104 | | | | — | | | | 493 | | | | 1,747 | | | | 1,078 | | | | 1,576 | |
| | — | | | | 1,130 | | | | — | | | | — | | | | — | | | | — | |
| | 357 | | | | — | | | | 14,991 | | | | — | | | | — | | | | — | |
| | 327 | | | | 641 | | | | 388 | | | | 323 | | | | 315 | | | | 480 | |
| | 26,451,371 | | | | 45,570,017 | | | | 26,418,281 | | | | 27,092,579 | | | | 27,725,998 | | | | 38,678,881 | |
| | | | | | | | | | | | | | | | | | | | | | | |
| | | | | | | | | | | | | | | | | | | | | | | |
| | — | | | | — | | | | — | | | | — | | | | — | | | | — | |
| | 633,331 | | | | — | | | | 1,009,915 | | | | 2,834,800 | | | | 4,181,791 | | | | 5,246,664 | |
| | 6,959 | | | | 37,265 | | | | 23,498 | | | | 8,456 | | | | 17,000 | | | | 22,900 | |
| | 565,247 | | | | — | | | | 37,045 | | | | 84,244 | | | | 72,563 | | | | 127,611 | |
| | 15,845 | | | | — | | | | 17,130 | | | | 5,138 | | | | 5,002 | | | | 7,079 | |
| | 20,148 | | | | 423 | | | | 35,100 | | | | 32,975 | | | | 31,972 | | | | 46,481 | |
| | 6,061 | | | | 6,061 | | | | 6,061 | | | | 6,061 | | | | 6,061 | | | | 6,061 | |
| | 18,396 | | | | 18,215 | | | | 18,458 | | | | 17,152 | | | | 17,479 | | | | 18,029 | |
| | 1,211 | | | | 1,047 | | | | 2,462 | | | | 180 | | | | 198 | | | | 180 | |
| | 3,268 | | | | 3,350 | | | | 3,285 | | | | 3,247 | | | | 3,264 | | | | 2,771 | |
| | 3,147 | | | | 2,584 | | | | 2,074 | | | | 1,238 | | | | 1,231 | | | | 1,346 | |
| | 1,273,613 | | | | 68,945 | | | | 1,155,028 | | | | 2,993,491 | | | | 4,336,561 | | | | 5,479,122 | |
| | | | | | | | | | | | | | | | | | | | | | | |
| $ | 25,177,758 | | | $ | 45,501,072 | | | $ | 25,263,253 | | | $ | 24,099,088 | | | $ | 23,389,437 | | | $ | 33,199,759 | |
| | | | | | | | | | | | | | | | | | | | | | | |
| | | | | | | | | | | | | | | | | | | | | | | |
| $ | 16,366,377 | | | $ | 45,501,779 | | | $ | 20,221,486 | | | $ | 23,958,596 | | | $ | 20,075,948 | | | $ | 24,096,551 | |
| | — | | | | 2 | | | | 844,745 | | | | 361,572 | | | | 306,714 | | | | 537,284 | |
| | | | | | | | | | | | | | | | | | | | | | | |
| | 3,701,913 | | | | (709 | ) | | | 2,384,569 | | | | (3,816,119 | ) | | | 802,744 | | | | 2,820,991 | |
| | | | | | | | | | | | | | | | | | | | | | | |
| | 5,109,468 | | | | — | | | | 1,812,453 | | | | 3,595,039 | | | | 2,204,031 | | | | 5,744,933 | |
| $ | 25,177,758 | | | $ | 45,501,072 | | | $ | 25,263,253 | | | $ | 24,099,088 | | | $ | 23,389,437 | | | $ | 33,199,759 | |
| | | | | | | | | | | | | | | | | | | | | | | |
| | | | | | | | | | | | | | | | | | | | | | | |
| | 1,350,960 | | | | 45,491,262 | | | | 1,314,639 | | | | 1,723,616 | | | | 1,844,892 | | | | 2,143,888 | |
| $ | 18.64 | | | $ | 1.00 | | | $ | 19.22 | | | $ | 13.98 | | | $ | 12.68 | | | $ | 15.49 | |
| | | | | | | | | | | | | | | | | | | | | | | |
| $ | 612,721 | | | $ | — | | | $ | 976,312 | | | $ | 2,756,332 | | | $ | 4,088,464 | | | $ | 5,102,849 | |
Statements of Operations
For the Year Ended December 31, 2014
| | | | | Touchstone | | | | Touchstone |
| | | Touchstone | | Baron Small | | Touchstone | | Large Cap |
| | | Active Bond | | Cap Growth | | High Yield | | Core Equity |
| | | Fund | | Fund | | Fund | | Fund |
| Investment Income | | | | | | | | | | | | | | | | |
| Dividends from affiliated securities | | $ | 287 | | | $ | 70 | | | $ | 28 | | | $ | 75 | |
| Dividends from non-affiliated securities(A) | | | 23,750 | | | | 393,768 | | | | 3 | | | | 886,860 | |
| Interest | | | 1,403,285 | | | | — | | | | 820,971 | | | | — | |
| Income from securities loaned | | | 573 | | | | 21,877 | | | | 136 | | | | 1,908 | |
| Total Investment Income | | | 1,427,895 | | | | 415,715 | | | | 821,138 | | | | 888,843 | |
| | | | | | | | | | | | | | | | | |
| Expenses | | | | | | | | | | | | | | | | |
| Investment advisory fees | | | 270,619 | | | | 259,535 | | | | 69,686 | | | | 246,496 | |
| Administration fees | | | 98,407 | | | | 49,435 | | | | 27,874 | | | | 75,845 | |
| Compliance fees and expenses | | | 1,702 | | | | 1,703 | | | | 1,702 | | | | 1,702 | |
| Custody fees | | | 4,567 | | | | 4,147 | | | | 7,565 | | | | 5,922 | |
| Professional fees | | | 29,009 | | | | 20,648 | | | | 18,431 | | | | 19,411 | |
| Transfer Agent fees | | | 175 | | | | 108 | | | | 148 | | | | 148 | |
| Pricing expense | | | 33,321 | | | | 2,915 | | | | 30,021 | | | | 2,414 | |
| Reports to Shareholders | | | 6,725 | | | | 6,172 | | | | 5,908 | | | | 6,410 | |
| Shareholder servicing fees | | | 35,091 | | | | 56,851 | | | | 27,885 | | | | 65,337 | |
| Trustee fees | | | 12,090 | | | | 12,152 | | | | 12,177 | | | | 12,127 | |
| Other expenses | | | 4,927 | | | | 3,886 | | | | 2,733 | | | | 4,203 | |
| Total Expenses | | | 496,633 | | | | 417,552 | | | | 204,130 | | | | 440,015 | |
| Fees waived and/or reimbursed by the Advisor and/or Affiliates(B) | | | (14,610 | ) | | | (74,067 | ) | | | (57,790 | ) | | | (44,995 | ) |
| Net Expenses | | | 482,023 | | | | 343,485 | | | | 146,340 | | | | 395,020 | |
| | | | | | | | | | | | | | | | | |
| Net Investment Income (Loss) | | | 945,872 | | | | 72,230 | | | | 674,798 | | | | 493,823 | |
| | | | | | | | | | | | | | | | | |
| Realized and Unrealized Gains (Losses) on Investments | | | | | | | | | | | | | | | | |
| Net realized gains on investments | | | 498,099 | | | | 2,271,822 | | | | 226,436 | | | | 3,879,113 | |
| Net realized losses on foreign currency | | | — | | | | — | | | | — | | | | — | |
| Capital gain distributions received | | | — | | | | — | | | | — | | | | — | |
| Net change in unrealized appreciation (depreciation) on investments | | | 362,709 | | | | (1,326,624 | ) | | | (754,882 | ) | | | 763,086 | |
| Net change in unrealized depreciation on foreign currency transactions | | | — | | | | — | | | | — | | | | — | |
| | | | | | | | | | | | | | | | | |
| Net Realized and Unrealized Gains (Losses) on Investments | | | 860,808 | | | | 945,198 | | | | (528,446 | ) | | | 4,642,199 | |
| | | | | | | | | | | | | | | | | |
| Change in Net Assets Resulting from Operations | | $ | 1,806,680 | | | $ | 1,017,428 | | | $ | 146,352 | | | $ | 5,136,022 | |
| | | | | | | | | | | | | | | | | |
| (A) Net of foreign tax withholding of: | | $ | — | | | $ | 503 | | | $ | — | | | $ | 2,469 | |
(B) See Note 4 in Notes to Financial Statements.
See accompanying Notes to Financial Statements.
Statements of Operations (Continued)
| Touchstone | | Touchstone | | Touchstone | | | | Touchstone | | |
| Mid Cap | | Money | | Third Avenue | | Touchstone | | Conservative | | Touchstone |
| Growth | | Market | | Value | | Aggressive ETF | | ETF | | Moderate ETF |
| Fund | | Fund | | Fund | | Fund | | Fund | | Fund |
| | | | | | | | | | | |
| $ | 61 | | | $ | — | | | $ | 149 | | | $ | 32 | | | $ | 32 | | | $ | 44 | |
| | 205,167 | | | | — | | | | 1,122,672 | | | | 518,492 | | | | 468,910 | | | | 776,536 | |
| | — | | | | 92,293 | | | | — | | | | — | | | | — | | | | — | |
| | 493 | | | | — | | | | 10,994 | | | | 27,808 | | | | 13,126 | | | | 28,761 | |
| | 205,721 | | | | 92,293 | | | | 1,133,815 | | | | 546,332 | | | | 482,068 | | | | 805,341 | |
| | | | | | | | | | | | | | | | | | | | | | | |
| | | | | | | | | | | | | | | | | | | | | | | |
| | 192,966 | | | | 86,748 | | | | 234,351 | | | | 62,900 | | | | 61,762 | | | | 93,024 | |
| | 51,458 | | | | 96,387 | | | | 58,588 | | | | 50,320 | | | | 49,409 | | | | 74,419 | |
| | 1,702 | | | | 1,702 | | | | 1,702 | | | | 1,702 | | | | 1,702 | | | | 1,702 | |
| | 10,501 | | | | 8,901 | | | | 8,546 | | | | 2,730 | | | | 4,604 | | | | 151 | |
| | 19,479 | | | | 19,229 | | | | 20,016 | | | | 18,064 | | | | 18,530 | | | | 19,689 | |
| | 2,433 | | | | 148 | | | | 148 | | | | 116 | | | | 108 | | | | 148 | |
| | 2,825 | | | | 2,691 | | | | 5,866 | | | | 430 | | | | 473 | | | | 423 | |
| | 6,544 | | | | 6,688 | | | | 6,292 | | | | 6,299 | | | | 6,175 | | | | 5,133 | |
| | 38,593 | | | | 120,483 | | | | 65,180 | | | | 60,699 | | | | 60,948 | | | | 83,299 | |
| | 12,148 | | | | 12,089 | | | | 12,135 | | | | 12,180 | | | | 12,151 | | | | 12,109 | |
| | 3,932 | | | | 3,601 | | | | 4,082 | | | | 2,894 | | | | 3,006 | | | | 4,273 | |
| | 342,581 | | | | 358,667 | | | | 416,906 | | | | 218,334 | | | | 218,868 | | | | 294,370 | |
| | (26,747 | ) | | | (271,164 | ) | | | (44,987 | ) | | | (29,635 | ) | | | (33,583 | ) | | | (15,299 | ) |
| | 315,834 | | | | 87,503 | | | | 371,919 | | | | 188,699 | | | | 185,285 | | | | 279,071 | |
| | | | | | | | | | | | | | | | | | | | | | | |
| | (110,113 | ) | | | 4,790 | | | | 761,896 | | | | 357,633 | | | | 296,783 | | | | 526,270 | |
| | | | | | | | | | | | | | | | | | | | | | | |
| | | | | | | | | | | | | | | | | | | | | | | |
| | 3,980,434 | | | | 178 | | | | 5,628,607 | | | | 2,153,677 | | | | 1,070,169 | | | | 4,766,984 | |
| | — | | | | — | | | | (8,731 | ) | | | — | | | | — | | | | — | |
| | — | | | | — | | | | — | | | | 3,944 | | | | 9,933 | | | | 11,017 | |
| | (828,794 | ) | | | — | | | | (7,285,789 | ) | | | (694,101 | ) | | | (118,955 | ) | | | (2,819,344 | ) |
| | — | | | | — | | | | (2,231 | ) | | | — | | | | — | | | | — | |
| | | | | | | | | | | | | | | | | | | | | | | |
| | 3,151,640 | | �� | | 178 | | | | (1,668,144 | ) | | | 1,463,520 | | | | 961,147 | | | | 1,958,657 | |
| | | | | | | | | | | | | | | | | | | | | | | |
| $ | 3,041,527 | | | $ | 4,968 | | | $ | (906,248 | ) | | $ | 1,821,153 | | | $ | 1,257,930 | | | $ | 2,484,927 | |
| | | | | | | | | | | | | | | | | | | | | | | |
| $ | 2,212 | | | $ | — | | | $ | 39,450 | | | $ | — | | | $ | — | | | $ | — | |
Statements of Changes in Net Assets
| | | Touchstone | | Touchstone |
| | | Active Bond | | Baron Small Cap |
| | | Fund | | Growth Fund |
| | | For the | | For the | | For the | | For the |
| | | Year | | Year | | Year | | Year |
| | | Ended | | Ended | | Ended | | Ended |
| | | December 31, | | December 31, | | December 31, | | December 31, |
| | | 2014 | | 2013 | | 2014 | | 2013 |
| From Operations | | | | | | | | | | | | | | | | |
| Net investment income (loss) | | $ | 945,872 | | | $ | 1,013,930 | | | $ | 72,230 | | | $ | (70,515 | ) |
| Net realized gains (losses) on investments | | | 498,099 | | | | (907,478 | ) | | | 2,271,822 | | | | 994,169 | |
| Net change in unrealized appreciation (depreciation) on investments | | | 362,709 | | | | (1,224,184 | ) | | | (1,326,624 | ) | | | 6,393,682 | |
| Change in Net Assets from Operations | | | 1,806,680 | | | | (1,117,732 | ) | | | 1,017,428 | | | | 7,317,336 | |
| | | | | | | | | | | | | | | | | |
| Distributions to Shareholders from: | | | | | | | | | | | | | | | | |
| Net investment income | | | (1,255,946 | ) | | | (1,555,731 | ) | | | — | | | | (321,114 | ) |
| Net realized gains | | | — | | | | (205,727 | ) | | | (929,298 | ) | | | (2,557,529 | ) |
| Total Distributions | | | (1,255,946 | ) | | | (1,761,458 | ) | | | (929,298 | ) | | | (2,878,643 | ) |
| | | | | | | | | | | | | | | | | |
| Share Transactions | | | | | | | | | | | | | | | | |
| Proceeds from Shares Issued | | | 1,215,844 | | | | 1,357,252 | | | | 5,873,235 | | | | 4,752,286 | |
| Reinvestment of distributions | | | 1,255,946 | | | | 1,761,458 | | | | 929,298 | | | | 2,878,643 | |
| Cost of Shares redeemed | | | (2,432,482 | ) | | | (4,936,290 | ) | | | (6,054,202 | ) | | | (4,656,362 | ) |
| Change in Net Assets from Share Transactions | | | 39,308 | | | | (1,817,580 | ) | | | 748,331 | | | | 2,974,567 | |
| | | | | | | | | | | | | | | | | |
| Total Increase (Decrease) in Net Assets | | | 590,042 | | | | (4,696,770 | ) | | | 836,461 | | | | 7,413,260 | |
| | | | | | | | | | | | | | | | | |
| Net Assets | | | | | | | | | | | | | | | | |
| Beginning of period | | | 48,388,399 | | | | 53,085,169 | | | | 25,538,292 | | | | 18,125,032 | |
| End of period | | $ | 48,978,441 | | | $ | 48,388,399 | | | $ | 26,374,753 | | | $ | 25,538,292 | |
| | | | | | | | | | | | | | | | | |
| Accumulated Net Investment Income | | $ | 1,125,067 | | | $ | 1,255,941 | | | $ | 58,316 | | | $ | 509 | |
| | | | | | | | | | | | | | | | | |
| Share Transactions | | | | | | | | | | | | | | | | |
| Shares issued | | | 114,433 | | | | 125,987 | | | | 281,106 | | | | 233,108 | |
| Shares reinvested | | | 119,957 | | | | 169,340 | | | | 44,872 | | | | 138,747 | |
| Shares redeemed | | | (228,684 | ) | | | (454,562 | ) | | | (288,463 | ) | | | (229,700 | ) |
| Change in Shares Outstanding | | | 5,706 | | | | (159,235 | ) | | | 37,515 | | | | 142,155 | |
See accompanying Notes to Financial Statements.
Statements of Changes in Net Assets (Continued)
| Touchstone | | Touchstone | | Touchstone |
| High Yield | | Large Cap | | Mid Cap Growth |
| Fund | | Core Equity Fund | | Fund |
| For the | | For the | | For the | | For the | | For the | | For the |
| Year | | Year | | Year | | Year | | Year | | Year |
| Ended | | Ended | | Ended | | Ended | | Ended | | Ended |
| December 31, | | December 31, | | December 31, | | December 31, | | December 31, | | December 31, |
| 2014 | | 2013 | | 2014 | | 2013 | | 2014 | | 2013 |
| | | | | | | | | | | |
| $ | 674,798 | | | $ | 1,205,028 | | | $ | 493,823 | | | $ | 395,192 | | | $ | (110,113 | ) | | $ | (79,206 | ) |
| | 226,436 | | | | 796,565 | | | | 3,879,113 | | | | 5,609,500 | | | | 3,980,434 | | | | 3,216,381 | |
| | (754,882 | ) | | | (981,080 | ) | | | 763,086 | | | | 2,881,688 | | | | (828,794 | ) | | | 4,207,913 | |
| | 146,352 | | | | 1,020,513 | | | | 5,136,022 | | | | 8,886,380 | | | | 3,041,527 | | | | 7,345,088 | |
| | | | | | | | | | | | | | | | | | | | | | | |
| | | | | | | | | | | | | | | | | | | | | | | |
| | (1,208,784 | ) | | | (1,954,374 | ) | | | (400,191 | ) | | | (487,271 | ) | | | — | | | | — | |
| | — | | | | — | | | | — | | | | — | | | | (3,090,577 | ) | | | (462,839 | ) |
| | (1,208,784 | ) | | | (1,954,374 | ) | | | (400,191 | ) | | | (487,271 | ) | | | (3,090,577 | ) | | | (462,839 | ) |
| | | | | | | | | | | | | | | | | | | | | | | |
| | | | | | | | | | | | | | | | | | | | | | | |
| | 4,078,462 | | | | 4,227,255 | | | | 4,865,919 | | | | 8,845,364 | | | | 4,045,192 | | | | 4,003,889 | |
| | 1,208,784 | | | | 1,954,374 | | | | 400,191 | | | | 487,271 | | | | 3,090,577 | | | | 462,839 | |
| | (5,805,869 | ) | | | (20,208,392 | ) | | | (6,035,151 | ) | | | (13,856,996 | ) | | | (9,414,931 | ) | | | (6,084,724 | ) |
| | (518,623 | ) | | | (14,026,763 | ) | | | (769,041 | ) | | | (4,524,361 | ) | | | (2,279,162 | ) | | | (1,617,996 | ) |
| | | | | | | | | | | | | | | | | | | | | | | |
| | (1,581,055 | ) | | | (14,960,624 | ) | | | 3,966,790 | | | | 3,874,748 | | | | (2,328,212 | ) | | | 5,264,253 | |
| | | | | | | | | | | | | | | | | | | | | | | |
| | | | | | | | | | | | | | | | | | | | | | | |
| | 14,864,069 | | | | 29,824,693 | | | | 36,697,275 | | | | 32,822,527 | | | | 27,505,970 | | | | 22,241,717 | |
| $ | 13,283,014 | | | $ | 14,864,069 | | | $ | 40,664,065 | | | $ | 36,697,275 | | | $ | 25,177,758 | | | $ | 27,505,970 | |
| | | | | | | | | | | | | | | | | | | | | | | |
| $ | 674,810 | | | $ | 1,208,781 | | | $ | 493,821 | | | $ | 400,189 | | | $ | — | | | $ | — | |
| | | | | | | | | | | | | | | | | | | | | | | |
| | | | | | | | | | | | | | | | | | | | | | | |
| | 548,247 | | | | 519,133 | | | | 337,520 | | | | 735,503 | | | | 208,573 | | | | 246,148 | |
| | 181,499 | | | | 268,827 | | | | 26,450 | | | | 37,425 | | | | 169,346 | | | | 25,699 | |
| | (777,192 | ) | | | (2,470,304 | ) | | | (438,312 | ) | | | (1,222,379 | ) | | | (489,406 | ) | | | (375,722 | ) |
| | (47,446 | ) | | | (1,682,344 | ) | | | (74,342 | ) | | | (449,451 | ) | | | (111,487 | ) | | | (103,875 | ) |
Statements of Changes in Net Assets (Continued)
| | | Touchstone | | Touchstone |
| | | Money Market | | Third Avenue |
| | | Fund | | Value Fund |
| | | For the | | For the | | For the | | For the |
| | | Year | | Year | | Year | | Year |
| | | Ended | | Ended | | Ended | | Ended |
| | | December 31, | | December 31, | | December 31, | | December 31, |
| | | 2014 | | 2013 | | 2014 | | 2013 |
| From Operations | | | | | | | | | | | | | | | | |
| Net investment income | | $ | 4,790 | | | $ | 5,084 | | | $ | 761,896 | | | $ | 244,344 | |
| Net realized gains on investments, foreign currency transactions and capital gain distributions received | | | 178 | | | | 3 | | | | 5,619,876 | | | | 3,231,047 | |
| Net change in unrealized appreciation (depreciation) on investments and foreign currency transactions | | | — | | | | — | | | | (7,288,020 | ) | | | 3,413,464 | |
| Change in Net Assets from Operations | | | 4,968 | | | | 5,087 | | | | (906,248 | ) | | | 6,888,855 | |
| | | | | | | | | | | | | | | | | |
| Distributions to Shareholders from: | | | | | | | | | | | | | | | | |
| Net investment income | | | (4,788 | ) | | | (5,084 | ) | | | (1,486,457 | ) | | | (1,282,581 | ) |
| Net realized gains | | | — | | | | — | | | | — | | | | — | |
| Total Distributions | | | (4,788 | ) | | | (5,084 | ) | | | (1,486,457 | ) | | | (1,282,581 | ) |
| | | | | | | | | | | | | | | | | |
| Share Transactions | | | | | | | | | | | | | | | | |
| Proceeds from Shares issued | | | 32,792,830 | | | | 60,169,956 | | | | 2,661,675 | | | | 846,938 | |
| Proceed from Shares issued in connection with merger(A) | | | — | | | | — | | | | — | | | | — | |
| Reinvestment of distributions | | | 4,788 | | | | 5,084 | | | | 1,486,457 | | | | 1,282,581 | |
| Cost of Shares redeemed | | | (35,721,693 | ) | | | (50,904,880 | ) | | | (8,732,052 | ) | | | (7,115,445 | ) |
| Change in Net Assets from Share Transactions | | | (2,924,075 | ) | | | 9,270,160 | | | | (4,583,920 | ) | | | (4,985,926 | ) |
| | | | | | | | | | | | | | | | | |
| Total Increase (Decrease) in Net Assets | | | (2,923,895 | ) | | | 9,270,163 | | | | (6,976,625 | ) | | | 620,348 | |
| | | | | | | | | | | | | | | | | |
| Net Assets | | | | | | | | | | | | | | | | |
| Beginning of period | | | 48,424,967 | | | | 39,154,804 | | | | 32,239,878 | | | | 31,619,530 | |
| End of period | | $ | 45,501,072 | | | $ | 48,424,967 | | | $ | 25,263,253 | | | $ | 32,239,878 | |
| | | | | | | | | | | | | | | | | |
| Accumulated Net Investment Income | | $ | 2 | | | $ | — | | | $ | 844,745 | | | $ | 15,193 | |
| | | | | | | | | | | | | | | | | |
| Share Transactions | | | | | | | | | | | | | | | | |
| Shares issued | | | 32,792,830 | | | | 60,169,956 | | | | 124,807 | | | | 42,704 | |
| Shares issued in connection with merger(A) | | | — | | | | — | | | | — | | | | — | |
| Shares reinvested | | | 4,788 | | | | 5,084 | | | | 76,425 | | | | 61,485 | |
| Shares redeemed | | | (35,721,693 | ) | | | (50,904,880 | ) | | | (420,944 | ) | | | (366,836 | ) |
| Change in Shares Outstanding | | | (2,924,075 | ) | | | 9,270,160 | | | | (219,712 | ) | | | (262,647 | ) |
(A) See Note 11 in the Notes to Financial Statements.
See accompanying Notes to Financial Statements.
Statements of Changes in Net Assets (Continued)
| Touchstone | | Touchstone | | Touchstone |
| Aggressive ETF | | Conservative ETF | | Moderate ETF |
| Fund | | Fund | | Fund |
| For the | | For the | | For the | | For the | | For the | | For the |
| Year | | Year | | Year | | Year | | Year | | Year |
| Ended | | Ended | | Ended | | Ended | | Ended | | Ended |
| December 31, | | December 31, | | December 31, | | December 31, | | December 31, | | December 31, |
| 2014 | | 2013 | | 2014 | | 2013 | | 2014 | | 2013 |
| | | | | | | | | | | |
| $ | 357,633 | | | $ | 228,002 | | | $ | 296,783 | | | $ | 274,819 | | | $ | 526,270 | | | $ | 541,489 | |
| | 2,157,621 | | | | 657,475 | | | | 1,080,102 | | | | 1,112,128 | | | | 4,778,001 | | | | 2,977,596 | |
| | (694,101 | ) | | | 2,550,972 | | | | (118,955 | ) | | | 640,095 | | | | (2,819,344 | ) | | | 2,833,874 | |
| | 1,821,153 | | | | 3,436,449 | | | | 1,257,930 | | | | 2,027,042 | | | | 2,484,927 | | | | 6,352,959 | |
| | | | | | | | | | | | | | | | | | | | | | | |
| | | | | | | | | | | | | | | | | | | | | | | |
| | — | | | | (478,336 | ) | | | (274,617 | ) | | | (366,365 | ) | | | (541,213 | ) | | | (760,226 | ) |
| | (497,508 | ) | | | (73,559 | ) | | | (784,671 | ) | | | (761,673 | ) | | | — | | | | — | |
| | (497,508 | ) | | | (551,895 | ) | | | (1,059,288 | ) | | | (1,128,038 | ) | | | (541,213 | ) | | | (760,226 | ) |
| | | | | | | | | | | | | | | | | | | | | | | |
| | | | | | | | | | | | | | | | | | | | | | | |
| | 481,658 | | | | 868,311 | | | | 2,050,088 | | | | 7,307,227 | | | | 662,471 | | | | 1,582,714 | |
| | — | | | | 11,138,832 | | | | — | | | | — | | | | — | | | | — | |
| | 497,508 | | | | 551,895 | | | | 1,059,288 | | | | 1,128,038 | | | | 541,213 | | | | 760,226 | |
| | (5,025,802 | ) | | | (2,581,359 | ) | | | (5,989,399 | ) | | | (6,799,621 | ) | | | (11,635,023 | ) | | | (8,476,450 | ) |
| | (4,046,636 | ) | | | 9,977,679 | | | | (2,880,023 | ) | | | 1,635,644 | | | | (10,431,339 | ) | | | (6,133,510 | ) |
| | | | | | | | | | | | | | | | | | | | | | | |
| | (2,722,991 | ) | | | 12,862,233 | | | | (2,681,381 | ) | | | 2,534,648 | | | | (8,487,625 | ) | | | (540,777 | ) |
| | | | | | | | | | | | | | | | | | | | | | | |
| | | | | | | | | | | | | | | | | | | | | | | |
| | 26,822,079 | | | | 13,959,846 | | | | 26,070,818 | | | | 23,536,170 | | | | 41,687,384 | | | | 42,228,161 | |
| $ | 24,099,088 | | | $ | 26,822,079 | | | $ | 23,389,437 | | | $ | 26,070,818 | | | $ | 33,199,759 | | | $ | 41,687,384 | |
| | | | | | | | | | | | | | | | | | | | | | | |
| $ | 361,572 | | | $ | — | | | $ | 306,714 | | | $ | 274,615 | | | $ | 537,284 | | | $ | 541,210 | |
| | | | | | | | | | | | | | | | | | | | | | | |
| | | | | | | | | | | | | | | | | | | | | | | |
| | 35,204 | | | | 70,878 | | | | 159,895 | | | | 583,505 | | | | 43,663 | | | | 113,957 | |
| | — | | | | 859,707 | | | | — | | | | — | | | | — | | | | — | |
| | 35,869 | | | | 41,891 | | | | 82,954 | | | | 89,598 | | | | 34,649 | | | | 51,751 | |
| | (366,951 | ) | | | (207,522 | ) | | | (465,371 | ) | | | (542,147 | ) | | | (765,731 | ) | | | (610,037 | ) |
| | (295,878 | ) | | | 764,954 | | | | (222,522 | ) | | | 130,956 | | | | (687,419 | ) | | | (444,329 | ) |
Financial Highlights
Touchstone Active Bond Fund
| Selected Data for a Share Outstanding Throughout Each Period |
| | | Year Ended December 31, |
| | | 2014 | | 2013 | | 2012 | | 2011 | | 2010 |
| Net asset value at beginning of period | | $ | 10.37 | | | $ | 11.00 | | | $ | 11.09 | | | $ | 10.73 | | | $ | 10.37 | |
| Income (loss) from investment operations: | | | | | | | | | | | | | | | | | | | | |
| Net investment income | | | 0.20 | | | | 0.22 | | | | 0.29 | | | | 0.37 | (A) | | | 0.38 | |
| Net realized and unrealized gains (losses) on investments | | | 0.20 | | | | (0.46 | ) | | | 0.30 | | | | 0.53 | | | | 0.40 | |
| Total from investment operations | | | 0.40 | | | | (0.24 | ) | | | 0.59 | | | | 0.90 | | | | 0.78 | |
| Distributions from: | | | | | | | | | | | | | | | | | | | | |
| Net investment income | | | (0.28 | ) | | | (0.34 | ) | | | (0.35 | ) | | | (0.30 | ) | | | (0.42 | ) |
| Realized capital gains | | | — | | | | (0.05 | ) | | | (0.33 | ) | | | (0.24 | ) | | | — | |
| Total distributions | | | (0.28 | ) | | | (0.39 | ) | | | (0.68 | ) | | | (0.54 | ) | | | (0.42 | ) |
| Net asset value at end of period | | $ | 10.49 | | | $ | 10.37 | | | $ | 11.00 | | | $ | 11.09 | | | $ | 10.73 | |
| Total return(B) | | | 3.82 | % | | | (2.18 | %) | | | 5.28 | % | | | 8.45 | % | | | 7.57 | % |
| Ratios and supplemental data: | | | | | | | | | | | | | | | | | | | | |
| Net assets at end of period (000's) | | $ | 48,978 | | | $ | 48,388 | | | $ | 53,085 | | | $ | 54,509 | | | $ | 40,408 | |
| Ratio to average net assets: | | | | | | | | | | | | | | | | | | | | |
| Net expenses | | | 0.98 | % | | | 1.00 | % | | | 1.00 | % | | | 0.93 | % | | | 0.91 | % |
| Gross expenses | | | 1.01 | % | | | 1.05 | % | | | 1.00 | % | | | 0.93 | % | | | 0.91 | % |
| Net investment income | | | 1.92 | % | | | 2.01 | % | | | 2.55 | % | | | 3.29 | % | | | 3.50 | % |
| Portfolio turnover rate | | | 287 | % | | | 508 | % | | | 404 | % | | | 419 | % | | | 487 | % |
Touchstone Baron Small Cap Growth Fund
| Selected Data for a Share Outstanding Throughout Each Period |
| | | Year Ended December 31, |
| | | 2014 | | 2013 | | 2012 | | 2011 | | 2010 |
| Net asset value at beginning of period | | $ | 21.40 | | | $ | 17.24 | | | $ | 17.55 | | | $ | 16.74 | | | $ | 13.40 | |
| Income (loss) from investment operations: | | | | | | | | | | | | | | | | | | | | |
| Net investment income (loss) | | | 0.06 | | | | (0.09 | ) | | | 0.31 | | | | (0.15 | ) | | | (0.06 | ) |
| Net realized and unrealized gains on investments | | | 0.74 | | | | 6.94 | | | | 3.02 | | | | 0.96 | | | | 3.40 | |
| Total from investment operations | | | 0.80 | | | | 6.85 | | | | 3.33 | | | | 0.81 | | | | 3.34 | |
| Distributions from: | | | | | | | | | | | | | | | | | | | | |
| Net investment income | | | — | | | | (0.27 | ) | | | — | | | | — | | | | — | |
| Realized capital gains | | | (0.78 | ) | | | (2.42 | ) | | | (3.64 | ) | | | — | | | | — | |
| Total distributions | | | (0.78 | ) | | | (2.69 | ) | | | (3.64 | ) | | | — | | | | — | |
| Net asset value at end of period | | $ | 21.42 | | | $ | 21.40 | | | $ | 17.24 | | | $ | 17.55 | | | $ | 16.74 | |
| Total return(B) | | | 3.85 | % | | | 40.43 | % | | | 19.17 | % | | | 4.84 | % | | | 24.93 | % |
| Ratios and supplemental data: | | | | | | | | | | | | | | | | | | | | |
| Net assets at end of period (000's) | | $ | 26,375 | | | $ | 25,538 | | | $ | 18,125 | | | $ | 19,733 | | | $ | 24,581 | |
| Ratio to average net assets: | | | | | | | | | | | | | | | | | | | | |
| Net expenses | | | 1.39 | % | | | 1.55 | % | | | 1.55 | % | | | 1.55 | % | | | 1.55 | % |
| Gross expenses | | | 1.69 | % | | | 1.73 | % | | | 1.69 | % | | | 1.63 | % | | | 1.62 | % |
| Net investment Income (loss) | | | 0.29 | % | | | (0.32 | %) | | | 1.71 | % | | | (0.79 | %) | | | (0.43 | %) |
| Portfolio turnover rate | | | 18 | % | | | 8 | % | | | 15 | % | | | 15 | % | | | 18 | % |
| (A) | The net investment income per share is based on average shares outstanding for the period. |
| (B) | Total returns do not include any insurance, sales or administrative charges of variable annuity or life insurance contracts. If these charges were included, the returns would be lower. |
See accompanying Notes to Financial Statements.
Financial Highlights (Continued)
Touchstone High Yield Fund
| Selected Data for a Share Outstanding Throughout Each Period |
| | | Year Ended December 31, |
| | | 2014 | | 2013 | | 2012 | | 2011 | | 2010 |
| Net asset value at beginning of period | | $ | 7.28 | | | $ | 8.01 | | | $ | 7.59 | | | $ | 7.86 | | | $ | 7.64 | |
| Income (loss) from investment operations: | | | | | | | | | | | | | | | | | | | | |
| Net investment income | | | 0.41 | | | | 0.46 | (A) | | | 0.54 | | | | 0.74 | | | | 0.72 | |
| Net realized and unrealized gains (losses) on investments | | | (0.37 | ) | | | (0.08 | ) | | | 0.48 | | | | (0.26 | ) | | | 0.25 | |
| Total from investment operations | | | 0.04 | | | | 0.38 | | | | 1.02 | | | | 0.48 | | | | 0.97 | |
| Distributions from: | | | | | | | | | | | | | | | | | | | | |
| Net investment income | | | (0.66 | ) | | | (1.11 | ) | | | (0.60 | ) | | | (0.75 | ) | | | (0.75 | ) |
| Net asset value at end of period | | $ | 6.66 | | | $ | 7.28 | | | $ | 8.01 | | | $ | 7.59 | | | $ | 7.86 | |
| Total return(B) | | | 0.62 | % | | | 4.75 | % | | | 13.45 | % | | | 6.08 | % | | | 12.65 | % |
| Ratios and supplemental data: | | | | | | | | | | | | | | | | | | | | |
| Net assets at end of period (000's) | | $ | 13,283 | | | $ | 14,864 | | | $ | 29,825 | | | $ | 27,191 | | | $ | 32,552 | |
| Ratio to average net assets: | | | | | | | | | | | | | | | | | | | | |
| Net expenses | | | 1.05 | % | | | 1.05 | % | | | 1.05 | % | | | 1.05 | % | | | 1.05 | % |
| Gross expenses | | | 1.46 | % | | | 1.26 | % | | | 1.10 | % | | | 1.05 | % | | | 1.05 | % |
| Net investment income | | | 4.84 | % | | | 5.55 | % | | | 6.47 | % | | | 6.96 | % | | | 7.57 | % |
| Portfolio turnover rate | | | 40 | % | | | 52 | % | | | 48 | % | | | 55 | % | | | 56 | % |
Touchstone Large Cap Core Equity Fund
| Selected Data for a Share Outstanding Throughout Each Period |
| | | Year Ended December 31, |
| | | 2014 | | 2013 | | 2012 | | 2011 | | 2010 |
| Net asset value at beginning of period | | $ | 13.09 | | | $ | 10.09 | | | $ | 9.15 | | | $ | 9.04 | | | $ | 8.20 | |
| Income from investment operations: | | | | | | | | | | | | | | | | | | | | |
| Net investment income | | | 0.18 | | | | 0.17 | | | | 0.17 | | | | 0.12 | (A) | | | 0.18 | |
| Net realized and unrealized gains (losses) on investments | | | 1.78 | | | | 3.01 | | | | 0.93 | | | | 0.15 | (C) | | | 0.82 | |
| Total from investment operations | | | 1.96 | | | | 3.18 | | | | 1.10 | | | | 0.27 | | | | 1.00 | |
| Distributions from: | | | | | | | | | | | | | | | | | | | | |
| Net investment income | | | (0.15 | ) | | | (0.18 | ) | | | (0.16 | ) | | | (0.16 | ) | | | (0.16 | ) |
| Net asset value at end of period | | $ | 14.90 | | | $ | 13.09 | | | $ | 10.09 | | | $ | 9.15 | | | $ | 9.04 | |
| Total return(B) | | | 14.93 | % | | | 31.52 | % | | | 12.07 | % | | | 3.02 | % | | | 12.20 | % |
| Ratios and supplemental data: | | | | | | | | | | | | | | | | | | | | |
| Net assets at end of period (000's) | | $ | 40,664 | | | $ | 36,697 | | | $ | 32,823 | | | $ | 32,477 | | | $ | 43,120 | |
| Ratio to average net assets: | | | | | | | | | | | | | | | | | | | | |
| Net expenses | | | 1.04 | % | | | 1.00 | % | | | 1.00 | % | | | 1.00 | % | | | 1.00 | % |
| Gross expenses | | | 1.16 | % | | | 1.21 | % | | | 1.16 | % | | | 1.13 | % | | | 1.04 | % |
| Net investment income | | | 1.30 | % | | | 1.16 | % | | | 1.40 | % | | | 1.29 | % | | | 1.07 | % |
| Portfolio turnover rate | | | 41 | % | | | 54 | % | | | 39 | % | | | 33 | % | | | 33 | % |
| (A) | The net investment income per share is based on average shares outstanding for the period. |
| (B) | Total returns do not include any insurance, sales or administrative charges of variable annuity or life insurance contracts. If these charges were included, the returns would be lower. |
| (C) | The amounts shown for a share outstanding throughout the period does not accord with the change in net realized and unrealized gains (losses) on investments for the period due to the timing of purchases and sales of fund shares in relation to fluctuating market values during the period. |
See accompanying Notes to Financial Statements.
Financial Highlights (Continued)
Touchstone Mid Cap Growth Fund
| Selected Data for a Share Outstanding Throughout Each Period |
| | | Year Ended December 31, |
| | | 2014 | | 2013 | | 2012 | | 2011 | | 2010 |
| Net asset value at beginning of period | | $ | 18.81 | | | $ | 14.20 | | | $ | 11.84 | | | $ | 13.40 | | | $ | 11.04 | |
| Income (loss) from investment operations: | | | | | | | | | | | | | | | | | | | | |
| Net investment income (loss) | | | (0.08 | ) | | | (0.05 | ) | | | (0.01 | ) | | | (0.09 | ) | | | 0.04 | |
| Net realized and unrealized gains (losses) on investments | | | 2.49 | | | | 4.98 | | | | 2.37 | | | | (1.43 | ) | | | 2.35 | |
| Total from investment operations | | | 2.41 | | | | 4.93 | | | | 2.36 | | | | (1.52 | ) | | | 2.39 | |
| Distributions from: | | | | | | | | | | | | | | | | | | | | |
| Net investment income | | | — | | | | — | | | | — | | | | (0.04 | ) | | | (0.03 | ) |
| Realized capital gains | | | (2.58 | ) | | | (0.32 | ) | | | — | | | | — | | | | — | |
| Total distributions | | | (2.58 | ) | | | (0.32 | ) | | | — | | | | (0.04 | ) | | | (0.03 | ) |
| Net asset value at end of period | | $ | 18.64 | | | $ | 18.81 | | | $ | 14.20 | | | $ | 11.84 | | | $ | 13.40 | |
| Total return(A) | | | 13.10 | % | | | 34.81 | % | | | 19.93 | % | | | (11.33 | %) | | | 21.63 | % |
| Ratios and supplemental data: | | | | | | | | | | | | | | | | | | | | |
| Net assets at end of period (000's) | | $ | 25,178 | | | $ | 27,506 | | | $ | 22,242 | | | $ | 20,474 | | | $ | 28,013 | |
| Ratio to average net assets: | | | | | | | | | | | | | | | | | | | | |
| Net expenses | | | 1.23 | % | | | 1.26 | % | | | 1.26 | % | | | 1.22 | % | | | 1.17 | % |
| Gross expenses | | | 1.33 | % | | | 1.36 | % | | | 1.31 | % | | | 1.25 | % | | | 1.27 | % |
| Net investment income (loss) | | | (0.43 | %) | | | (0.32 | %) | | | (0.10 | %) | | | (0.63 | %) | | | 0.31 | % |
| Portfolio turnover rate | | | 72 | % | | | 77 | % | | | 78 | % | | | 141 | % | | | 60 | % |
Touchstone Money Market Fund
| Selected Data for a Share Outstanding Throughout Each Period |
| | | Year Ended December 31, |
| | | 2014 | | 2013 | | 2012 | | 2011 | | 2010 |
| Net asset value at beginning of period | | $ | 1.00 | | | $ | 1.00 | | | $ | 1.00 | | | $ | 1.00 | | | $ | 1.00 | |
| Income (loss) from investment operations: | | | | | | | | | | | | | | | | | | | | |
| Net investment income | | | — | (B) | | | — | (B) | | | — | (B) | | | — | (B) | | | — | (B) |
| Net realized gains (losses) on investments | | | — | (B) | | | — | (B) | | | — | | | | (— | )(B) | | | — | (B) |
| Total from investment operations | | | — | (B) | | | — | (B) | | | — | (B) | | | — | (B) | | | — | (B) |
| Distributions from: | | | | | | | | | | | | | | | | | | | | |
| Net investment income | | | (— | )(B) | | | (— | )(B) | | | (— | )(B) | | | (— | )(B) | | | (— | )(B) |
| Realized capital gains | | | — | | | | — | | | | (— | )(B) | | | (— | )(B) | | | — | |
| Total distributions | | | (— | )(B) | | | (— | )(B) | | | (— | )(B) | | | (— | )(B) | | | (— | )(B) |
| Net asset value at end of period | | $ | 1.00 | | | $ | 1.00 | | | $ | 1.00 | | | $ | 1.00 | | | $ | 1.00 | |
| Total return(A) | | | 0.01 | % | | | 0.01 | % | | | 0.01 | % | | | 0.02 | % | | | 0.19 | % |
| Ratios and supplemental data: | | | | | | | | | | | | | | | | | | | | |
| Net assets at end of period (000's) | | $ | 45,501 | | | $ | 48,425 | | | $ | 39,155 | | | $ | 50,528 | | | $ | 57,032 | |
| Ratio to average net assets: | | | | | | | | | | | | | | | | | | | | |
| Net expenses | | | 0.18 | % | | | 0.23 | % | | | 0.37 | % | | | 0.36 | % | | | 0.53 | % |
| Gross expenses | | | 0.74 | % | | | 0.75 | % | | | 0.73 | % | | | 0.71 | % | | | 0.65 | % |
| Net investment income | | | 0.01 | % | | | 0.01 | % | | | 0.01 | % | | | 0.01 | % | | | 0.02 | % |
| (A) | Total returns do not include any insurance, sales or administrative charges of variable annuity or life insurance contracts. If these charges were included, the returns would be lower. |
| (B) | Less than $0.005 per share. |
See accompanying Notes to Financial Statements.
Financial Highlights (Continued)
Touchstone Third Avenue Value Fund
| Selected Data for a Share Outstanding Throughout Each Period |
| | | Year Ended December 31, |
| | | 2014 | | 2013 | | 2012 | | 2011 | | 2010 |
| Net asset value at beginning of period | | $ | 21.01 | | | $ | 17.60 | | | $ | 14.58 | | | $ | 17.67 | | | $ | 15.61 | |
| Income (loss) from investment operations: | | | | | | | | | | | | | | | | | | | | |
| Net investment income | | | 0.65 | (A) | | | 0.16 | | | | 0.26 | (B) | | | 0.09 | (B) | | | 0.25 | |
| Net realized and unrealized gains (losses) on investments | | | (1.24 | ) | | | 4.12 | | | | 2.76 | | | | (2.80 | ) | | | 2.90 | |
| Total from investment operations | | | (0.59 | ) | | | 4.28 | | | | 3.02 | | | | (2.71 | ) | | | 3.15 | |
| Distributions from: | | | | | | | | | | | | | | | | | | | | |
| Net investment income | | | (1.20 | ) | | | (0.87 | ) | | | — | | | | (0.38 | ) | | | (1.09 | ) |
| Realized capital gains | | | — | | | | — | | | | — | | | | — | | | | — | |
| Total distributions | | | (1.20 | ) | | | (0.87 | ) | | | — | | | | (0.38 | ) | | | (1.09 | ) |
| Net asset value at end of period | | $ | 19.22 | | | $ | 21.01 | | | $ | 17.60 | | | $ | 14.58 | | | $ | 17.67 | |
| Total return(C) | | | (2.89 | %) | | | 24.35 | % | | | 20.71 | % | | | (15.31 | %) | | | 20.20 | % |
| Ratios and supplemental data: | | | | | | | | | | | | | | | | | | | | |
| Net assets at end of period (000's) | | $ | 25,263 | | | $ | 32,240 | | | $ | 31,620 | | | $ | 32,761 | | | $ | 52,578 | |
| Ratio to average net assets: | | | | | | | | | | | | | | | | | | | | |
| Net expenses | | | 1.27 | % | | | 1.17 | % | | | 1.17 | % | | | 1.17 | % | | | 1.17 | % |
| Gross expenses | | | 1.42 | % | | | 1.43 | % | | | 1.39 | % | | | 1.32 | % | | | 1.87 | %(D) |
| Net investment income | | | 2.60 | %(A) | | | 0.78 | % | | | 1.58 | % | | | 0.52 | % | | | 0.93 | % |
| Portfolio turnover rate | | | 63 | % | | | 39 | % | | | 28 | % | | | 4 | % | | | 10 | % |
Touchstone Aggressive ETF Fund
| Selected Data for a Share Outstanding Throughout Each Period |
| | | Year Ended December 31, |
| | | 2014 | | 2013 | | 2012 | | 2011 | | 2010 |
| Net asset value at beginning of period | | $ | 13.28 | | | $ | 11.13 | | | $ | 10.07 | | | $ | 10.22 | | | $ | 9.17 | |
| Income (loss) from investment operations: | | | | | | | | | | | | | | | | | | | | |
| Net investment income | | | 0.21 | | | | 0.13 | | | | 0.26 | | | | 0.16 | | | | 0.14 | |
| Net realized and unrealized gains (losses) on investments | | | 0.78 | | | | 2.41 | | | | 1.01 | | | | (0.16 | )(E) | | | 1.07 | |
| Total from investment operations | | | 0.99 | | | | 2.54 | | | | 1.27 | | | | — | | | | 1.21 | |
| Distributions from: | | | | | | | | | | | | | | | | | | | | |
| Net investment income | | | — | | | | (0.33 | ) | | | (0.21 | ) | | | (0.15 | ) | | | (0.16 | ) |
| Realized capital gains | | | (0.29 | ) | | | (0.06 | ) | | | — | | | | — | | | | — | |
| Total distributions | | | (0.29 | ) | | | (0.39 | ) | | | (0.21 | ) | | | (0.15 | ) | | | (0.16 | ) |
| Net asset value at end of period | | $ | 13.98 | | | $ | 13.28 | | | $ | 11.13 | | | $ | 10.07 | | | $ | 10.22 | |
| Total return(C) | | | 7.49 | % | | | 22.91 | % | | | 12.59 | % | | | (0.05 | %) | | | 13.19 | % |
| Ratios and supplemental data: | | | | | | | | | | | | | | | | | | | | |
| Net assets at end of period (000's) | | $ | 24,099 | | | $ | 26,822 | | | $ | 13,960 | | | $ | 17,910 | | | $ | 19,341 | |
| Ratio to average net assets: | | | | | | | | | | | | | | | | | | | | |
| Net expenses(F) | | | 0.75 | % | | | 0.75 | % | | | 0.75 | % | | | 0.75 | % | | | 0.75 | % |
| Gross expenses(F) | | | 0.87 | % | | | 1.09 | % | | | 1.07 | % | | | 1.04 | % | | | 1.07 | % |
| Net investment income(F) | | | 1.42 | % | | | 1.49 | % | | | 1.56 | % | | | 1.50 | % | | | 1.54 | % |
| Portfolio turnover rate | | | 12 | % | | | 11 | %(G) | | | 11 | % | | | 40 | % | | | 44 | % |
| (A) | Reflects the impact of a corporate action event that resulted in a one-time increase to net investment income. If the corporate action event had not occurred net investment income per share and ratio of net investment income to average net assets would have been lower by $0.25 and 1.14%, respectively. |
| (B) | The net investment income (loss) per share is based on average shares outstanding for the period. |
| (C) | Total returns do not include any insurance, sales or administrative charges of variable annuity or life insurance contracts. If these charges were included, the returns would be lower. |
| (D) | Absent PFIC Tax expenses, the ratio of gross expenses to average net assets would have been 1.37%. |
| (E) | The amounts shown for a share outstanding throughout the period does not accord with the change in net realized and unrealized gains (losses) on investments for the period due to the timing of purchases and sales of fund shares in relation to fluctuating market values during the period. |
| (F) | Ratio does not include income and expenses of the underlying funds. |
| (G) | Portfolio turnover excludes the purchases and sales of the Acquired Fund (see Note 11). If these transactions were included, portfolio turnover would have been higher. |
See accompanying Notes to Financial Statements.
Financial Highlights (Continued)
Touchstone Conservative ETF Fund
| Selected Data for a Share Outstanding Throughout Each Period |
| | | Year Ended December 31, |
| | | 2014 | | 2013 | | 2012 | | 2011 | | 2010 |
| Net asset value at beginning of period | | $ | 12.61 | | | $ | 12.15 | | | $ | 11.77 | | | $ | 11.60 | | | $ | 10.90 | |
| Income from investment operations: | | | | | | | | | | | | | | | | | | | | |
| Net investment income | | | 0.18 | | | | 0.12 | | | | 0.20 | | | | 0.22 | | | | 0.24 | |
| Net realized and unrealized gains on investments | | | 0.48 | | | | 0.91 | | | | 0.59 | | | | 0.18 | | | | 0.72 | |
| Total from investment operations | | | 0.66 | | | | 1.03 | | | | 0.79 | | | | 0.40 | | | | 0.96 | |
| Distributions from: | | | | | | | | | | | | | | | | | | | | |
| Net investment income | | | (0.15 | ) | | | (0.18 | ) | | | (0.21 | ) | | | (0.23 | ) | | | (0.26 | ) |
| Realized capital gains | | | (0.44 | ) | | | (0.39 | ) | | | (0.20 | ) | | | — | | | | — | |
| Total distributions | | | (0.59 | ) | | | (0.57 | ) | | | (0.41 | ) | | | (0.23 | ) | | | (0.26 | ) |
| Net asset value at end of period | | $ | 12.68 | | | $ | 12.61 | | | $ | 12.15 | | | $ | 11.77 | | | $ | 11.60 | |
| Total return(A) | | | 5.23 | % | | | 8.50 | % | | | 6.74 | % | | | 3.44 | % | | | 8.81 | % |
| Ratios and supplemental data: | | | | | | | | | | | | | | | | | | | | |
| Net assets at end of period (000's) | | $ | 23,389 | | | $ | 26,071 | | | $ | 23,536 | | | $ | 23,169 | | | $ | 23,066 | |
| Ratio to average net assets: | | | | | | | | | | | | | | | | | | | | |
| Net expenses(B) | | | 0.75 | % | | | 0.75 | % | | | 0.75 | % | | | 0.75 | % | | | 0.75 | % |
| Gross expenses(B) | | | 0.89 | % | | | 0.99 | % | | | 1.01 | % | | | 0.99 | % | | | 1.00 | % |
| Net investment income(B) | | | 1.20 | % | | | 1.09 | % | | | 1.58 | % | | | 1.76 | % | | | 1.95 | % |
| Portfolio turnover rate | | | 13 | % | | | 29 | % | | | 22 | % | | | 28 | % | | | 21 | % |
Touchstone Moderate ETF Fund
| Selected Data for a Share Outstanding Throughout Each Period |
| | | Year Ended December 31, |
| | | 2014 | | 2013 | | 2012 | | 2011 | | 2010 |
| Net asset value at beginning of period | | $ | 14.72 | | | $ | 12.89 | | | $ | 11.96 | | | $ | 11.99 | | | $ | 11.01 | |
| Income from investment operations: | | | | | | | | | | | | | | | | | | | | |
| Net investment income | | | 0.31 | | | | 0.23 | | | | 0.27 | | | | 0.21 | | | | 0.23 | |
| Net realized and unrealized gains on investments | | | 0.72 | | | | 1.87 | | | | 0.92 | | | | 0.01 | | | | 1.01 | |
| Total from investment operations | | | 1.03 | | | | 2.10 | | | | 1.19 | | | | 0.22 | | | | 1.24 | |
| Distributions from: | | | | | | | | | | | | | | | | | | | | |
| Net investment income | | | (0.26 | ) | | | (0.27 | ) | | | (0.26 | ) | | | (0.25 | ) | | | (0.26 | ) |
| Total distributions | | | (0.26 | ) | | | (0.27 | ) | | | (0.26 | ) | | | (0.25 | ) | | | (0.26 | ) |
| Net asset value at end of period | | $ | 15.49 | | | $ | 14.72 | | | $ | 12.89 | | | $ | 11.96 | | | $ | 11.99 | |
| Total return(A) | | | 6.96 | % | | | 16.32 | % | | | 9.94 | % | | | 1.84 | % | | | 11.25 | % |
| Ratios and supplemental data: | | | | | | | | | | | | | | | | | | | | |
| Net assets at end of period (000's) | | $ | 33,200 | | | $ | 41,687 | | | $ | 42,228 | | | $ | 45,165 | | | $ | 53,492 | |
| Ratio to average net assets: | | | | | | | | | | | | | | | | | | | | |
| Net expenses(B) | | | 0.75 | % | | | 0.75 | % | | | 0.75 | % | | | 0.75 | % | | | 0.75 | % |
| Gross expenses(B) | | | 0.79 | % | | | 0.92 | % | | | 0.92 | % | | | 0.91 | % | | | 0.89 | % |
| Net investment income(B) | | | 1.41 | % | | | 1.29 | % | | | 1.74 | % | | | 1.73 | % | | | 1.79 | % |
| Portfolio turnover rate | | | 11 | % | | | 9 | % | | | 9 | % | | | 17 | % | | | 19 | % |
| (A) | Total returns do not include any insurance, sales or administrative charges of variable annuity or life insurance contracts. If these charges were included, the returns would be lower. |
| (B) | Ratio does not include income and expenses of the underlying funds. |
See accompanying Notes to Financial Statements.
Notes to Financial Statements
December 31, 2014
1. Organization
The Touchstone Variable Series Trust (the “Trust”) is registered under the Investment Company Act of 1940, as amended (the “1940 Act”), as an open-end management investment company. The Trust was established as a Massachusetts business trust pursuant to a Declaration of Trust dated February 7, 1994. The Trust consists of the following ten funds (individually, a “Fund”, and collectively, the “Funds”):
Touchstone Active Bond Fund (“Active Bond Fund”)
Touchstone Baron Small Cap Growth Fund (“Baron Small Cap Growth Fund”)
Touchstone High Yield Fund (“High Yield Fund”)
Touchstone Large Cap Core Equity Fund (“Large Cap Core Equity Fund”)
Touchstone Mid Cap Growth Fund (“Mid Cap Growth Fund”)
Touchstone Money Market Fund (“Money Market Fund”)
Touchstone Third Avenue Value Fund (“Third Avenue Value Fund”)
Touchstone Aggressive ETF Fund (“Aggressive ETF Fund”)
Touchstone Conservative ETF Fund (“Conservative ETF Fund”)
Touchstone Moderate ETF Fund (“Moderate ETF Fund”)
Each Fund is diversified with the exception of the Third Avenue Value Fund, which is non-diversified.
The Declaration of Trust permits the Trust to issue an unlimited number of shares of beneficial interest of each Fund. Shares of beneficial interest of each Fund are available as a funding vehicle for the separate accounts of life insurance companies issuing variable annuity and variable life insurance policies. As of December 31, 2014, outstanding shares were issued to separate accounts of Western-Southern Life Assurance Company, The Western & Southern Life Insurance Company, Integrity Life Insurance Company, National Integrity Life Insurance Company, and Columbus Life Insurance Company, which are all part of Western & Southern Financial Group (“Western & Southern”), and the majority of the outstanding shares of the Trust were collectively owned by affiliates of Western & Southern and certain supplemental executive retirement plans sponsored by Western & Southern and its affiliates.
All Funds offer a single class of shares. The assets of each Fund are segregated, and a shareholder’s interest is limited to the Fund in which shares are held. The Funds’ prospectus provides a description of each Fund’s investment goals, policies, and strategies along with information on the classes of shares currently being offered.
2. Significant Accounting Policies
The following is a summary of the Funds’ significant accounting policies:
Security valuation and fair value measurements— Generally accepted accounting principles in the United States (“U.S. GAAP”) defines fair value as the price the Funds would receive to sell an asset or pay to transfer a liability in an orderly transaction between market participants at the measurement date. All investments in securities are recorded at their estimated fair value. The Funds define the term “market value”, as used throughout this report, as the estimated fair value. The Funds use various methods to measure fair value of its portfolio securities on a recurring basis. U.S. GAAP fair value measurement standards require disclosure of a hierarchy that prioritizes inputs to valuation methods. These inputs are summarized in the three broad levels listed below:
· Level 1 – quoted prices in active markets for identical securities
· Level 2 – other significant observable inputs (including quoted prices for similar securities, interest rates, prepayment speeds, credit risk, etc.)
Notes to Financial Statements (Continued)
· Level 3 – significant unobservable inputs (including a Fund’s own assumptions in determining the fair value of investments)
The inputs or methodology used for valuing securities are not necessarily an indication of the risk associated with investing in those securities. For example, money market instruments are valued using amortized cost, in accordance with rules under the 1940 Act. Generally, amortized cost approximates the current fair value of a security, but since the value is not obtained from a quoted price in an active market, such securities are reflected as Level 2.
The aggregate value by input level, as of December 31, 2014, for the Funds’ investments, as well as a reconciliation of assets for which significant unobservable inputs (Level 3) were used in determining value, if applicable, is included in the Funds’ Portfolio of Investments, which also includes a breakdown of the Funds’ investments by portfolio, geographic or sector allocation. The Funds did not hold any Level 3 categorized securities during the year ended December 31, 2014.
Changes in valuation techniques may result in transfers into or out of an investment’s assigned level within the hierarchy. All transfers in and out of the levels are recognized at the value at the end of the period. During the year ended December 31, 2014, there were no transfers between Levels 1, 2 and 3 for all Funds except as shown in the Portfolio of Investments for the Third Avenue Value Fund.
Investments held by the Touchstone Money Market Fund are valued under the amortized cost method which approximates current market value in accordance with Rule 2a-7 under the 1940 Act. Under this method, investments are valued at cost when purchased and therafter, a constant proportionate accretion of discounts and amortization of premiums are recorded until the maturity of the security.
The Funds’ portfolio securities are valued as of the close of the regular session of trading on the New York Stock Exchange (“NYSE”) (currently 4:00 p.m., Eastern time). Portfolio securities traded on stock exchanges are valued at the last reported sale price, official close price, or last bid price if no sales are reported. Portfolio securities quoted by NASDAQ are valued at the NASDAQ Official Closing Price (“NOCP”) or from the primary exchange on which the security trades. To the extent these securities are actively traded, they are categorized in Level 1 of the fair value hierarchy. Shares of open-end mutual funds in which the Funds invest are valued at their respective net asset values (“NAV”) as reported by the underlying funds and are categorized in Level 1.
Debt securities held by the Funds are valued at their most recent evaluated bid by an independent pricing service or at their last broker-quoted bid prices as obtained from one or more of the major market makers for such securities. Independent pricing services use information provided by market makers or estimates of market values through accepted market modeling conventions. Inputs to the models may include prepayment speeds, pricing spread, yield, trade information, dealer quotes, market color, cash flow models, the securities’ terms and conditions, among others, and are generally categorized in Level 2. Money market instruments and other debt securities with a remaining maturity of less than 60 days are valued at amortized cost, provided such amount approximates market value and are categorized in Level 2. While this method provides consistency in valuation (and may only be used if it approximates market value), it may result in periods during which value, as determined by amortized cost, is higher or lower than the price that would be received if the Fund sold the investment.
Securities mainly traded on a non-U.S. exchange or denominated in foreign currency are generally valued according to the preceding closing values on that exchange, translated to U.S. dollars using currency exchange rates as of the close of regular trading on the NYSE, and generally categorized in Level 1. However, if an event that may change the value of a security occurs after the time that the closing value on the non-U.S. exchange was determined, but before the close of regular trading on the NYSE, the security may be priced based on fair value
Notes to Financial Statements (Continued)
and generally categorized in Level 2. This may cause the value of the security, if held on the books of the Fund to be different from the closing value on the non-U.S. exchange and may affect the calculation of that Fund’s NAV. The Fund may use fair value pricing under the following circumstances, among others.
| · | If the value of a security has been materially affected by events occurring before the Funds’ pricing time but after the close of the primary markets on which the security is traded. |
| · | If the exchange on which a portfolio security is principally traded closes early or if trading in a particular portfolio security was halted during the day and did not resume prior to the Funds’ NAV calculation. |
| · | If a security is so thinly traded that reliable market quotations are unavailable due to infrequent trading. |
| · | If the validity of market quotations is not reliable. |
Securities held by the Fund that do not have readily available market quotations, significant observable inputs, or securities for which the available market quotations are not reliable, are priced at their estimated fair value using procedures approved by the Funds’ Board of Trustees and are generally categorized in Level 3.
Touchstone Money Market Fund— At a meeting of the Board of Trustees (the “Board”) of the Touchstone Variable Series Trust held on November 20, 2014, the Board approved the termination of the Touchstone Money Market Fund. The Touchstone Money Market Fund is available solely through variable insurance products offered by affiliates of the Fund’s investment advisor. The termination of the Fund will be effective on or about April 24, 2015. Prior to that date, the insurance companies will advise the variable insurance product owners of their options.
Investment companies— Certain Funds may invest in securities of other investment companies, including exchange-traded funds (“ETFs”), open-end funds and closed-end funds. Open-end funds are investment companies that issue new shares continuously and redeem shares daily. Closed-end funds are investment companies that typically issue a fixed number of shares that trade on a securities exchange or over-the-counter. An ETF is an investment company that typically seeks to track the performance of an index by holding in its portfolio shares of all the companies, or a representative sample of the companies, that are components of a particular index. ETFs are traded on a securities exchange based on their market value. The risks of investment in other investment companies typically reflect the risks of the types of securities in which investment companies invest. Investments in ETFs and closed-end funds are subject to the additional risk that their shares may trade at a premium or discount to their NAV. When a Fund invests in another investment company, shareholders of the Fund indirectly bear their proportionate share of the other investment company’s fees and expenses, including operating, registration, trustee, licensing, and marketing, as well as their share of the Fund’s fees and expenses.
Foreign currency translation— The books and records of the Funds are maintained in U.S. dollars and translated into U.S. dollars on the following basis:
| (1) | market value of investment securities, assets and liabilities at the current rate of exchange on the valuation date; and |
| (2) | purchases and sales of investment securities, income, and expenses at the relevant rates of exchange prevailing on the respective dates of such transactions. |
The Funds do not isolate that portion of gains and losses on investments in equity securities that is due to changes in the foreign exchange rates from that which is due to changes in market prices of equity securities.
Real Estate Investment Trusts—The Funds may invest in real estate investment trusts (“REITs”) that involve risks not associated with investing in stocks. Risks include declines in the value of real estate, general and economic conditions, changes in the value of the underlying property and defaults by borrowers. The value of assets in the real estate industry may go through cycles of relative underperformance and outperformance in comparison to equity securities markets in general. Dividend income is recorded using management’s estimate of the income
Notes to Financial Statements (Continued)
included in distributions received from REIT investments. The actual amounts of income, return of capital and capital gains are only determined by each REIT after its fiscal year-end and may differ from the estimated amount. Estimates of income are adjusted in the Funds to the actual amounts when the amounts are determined.
Portfolio securities loaned— Each Fund may lend its portfolio securities. Lending portfolio securities exposes a Fund to the risk that the borrower may fail to return the loaned securities or may not be able to provide additional collateral or that the Funds may experience delays in recovery of the loaned securities or loss of rights in the collateral if the borrower fails financially. To minimize these risks, the borrower must agree to maintain cash collateral with the Funds’ custodian. The loaned securities are secured by collateral valued at least equal, at all times, to the market value of the loaned securities plus accrued interest, if any. When the collateral falls below specified amounts the lending agent will use its best effort to obtain additional collateral on the next business day to meet required amounts under the security lending agreement. The cash collateral is reinvested by the Funds’ custodian into an approved investment vehicle. The approved investment vehicle is subject to market risk.
As of December 31, 2014, the following Funds loaned securities and received collateral as follows:
| | | Market Value of | | Market Value of |
| | | Securities | | Collateral |
| Fund | | Loaned | | Received |
| Baron Small Cap Growth Fund | | $ | 3,717,756 | | | $ | 3,848,305 | |
| High Yield Fund | | | 13,224 | | | | 13,674 | |
| Mid Cap Growth Fund | | | 612,721 | | | | 633,331 | |
| Third Avenue Value Fund | | | 976,312 | | | | 1,009,915 | |
| Aggressive ETF Fund | | | 2,756,332 | | | | 2,834,800 | |
| Conservative ETF Fund | | | 4,088,464 | | | | 4,181,791 | |
| Moderate ETF Fund | | | 5,102,849 | | | | 5,246,664 | |
All cash collateral is received, held, and administered by the Funds’ custodian for the benefit of the lending Fund in its custody account or other account established for the purpose of holding collateral.
Funds participating in securities lending receive compensation in the form of fees. Securities lending income is derived from lending long securities from the Funds to creditworthy approved borrowers at rates that are determined based on daily trading volumes, float, short-term interest rates and market liquidity. A lending Fund retains the interest or dividends on the investment of any cash received as collateral. The lending Fund continues to receive interest or dividends on the loaned securities.
Unrealized gain or loss on the market value of the loaned securities that may occur during the term of the loan is recognized by the lending Funds. The lending Fund has the right under the lending agreement to recover the securities from the borrower on demand.
When-issued or delayed delivery transactions— Each Fund may purchase or sell securities on a when-issued or delayed delivery basis. These transactions involve a commitment by the Fund to purchase or sell securities for a predetermined price or yield, with payment and delivery taking place beyond the customary settlement period. When delayed delivery purchases are outstanding, the Fund will set aside liquid assets in an amount sufficient to meet the purchase price. When purchasing a security on a delayed delivery basis, the Fund assumes the rights and risks of ownership of the security, including the risk of price and yield fluctuations, and takes such fluctuations into account when determining NAV. The Fund may dispose of or renegotiate a delayed delivery transaction after it is entered into, and may sell when-issued securities before they are delivered, which may result in a capital gain or loss. When the Fund has sold a security on a delayed delivery basis, the Fund does not participate in future gains and losses with respect to the security.
Notes to Financial Statements (Continued)
Share valuation—The NAV per share of each Fund is calculated daily by dividing the total value of a Fund’s assets, less liabilities, by its number of outstanding shares.
Investment income— Dividend income from securities is recognized on the ex-dividend date, net of foreign withholding taxes, if any, which are reduced by any amounts reclaimable by the Funds, where applicable. Interest income from securities is recorded on the basis of interest accrued, premium amortized and discount accreted. Realized gains and losses resulting from principal paydowns on mortgage-backed and asset-backed securities are included in interest income.
Distributions to shareholders— Each Fund intends to distribute to its shareholders substantially all of its income and capital gains. Each Fund, except the Money Market Fund, declares and distributes net investment income, if any, annually as a dividend to shareholders. The Money Market Fund declares dividends daily and distributes dividends monthly. Each Fund makes distributions of capital gains, if any, at least annually, net of applicable capital loss carryforwards. Income distributions and capital gain distributions are determined in accordance with income tax regulations. Recognition of the Funds’ net investment income that invest in underlying funds is affected by the timing of dividend declarations by underlying funds.
Allocations—Expenses not directly billed to a Fund are allocated proportionally among all the Funds in the Trust, and, if applicable, Touchstone Investment Trust, Touchstone Funds Group Trust, Touchstone Tax-Free Trust, Touchstone Institutional Funds Trust and Touchstone Strategic Trust, daily in relation to net assets of each Fund or another reasonable measure.
Security transactions— Security transactions are reflected for financial reporting purposes as of the trade date. Realized gains and losses on sales of portfolio securities are calculated using the identified cost basis.
Estimates— The preparation of financial statements in conformity with U.S. GAAP requires management to make estimates and assumptions that affect the reported amounts of assets and liabilities and disclosure of contingent assets and liabilities at the date of the financial statements and the reported amounts of income and expenses during the reporting period. Actual results could differ from those estimates.
3. Investment Transactions
Investment transactions (excluding short-term investments and U.S. Government securities) were as follows for the year ended December 31, 2014:
| | | | | Baron Small | | |
| | | Active Bond | | Cap Growth | | High Yield |
| | | Fund | | Fund | | Fund |
| Purchases of investment securities | | $ | 19,102,519 | | | $ | 4,448,076 | | | $ | 5,388,872 | |
| Proceeds from sales and maturities | | $ | 19,927,301 | | | $ | 5,285,486 | | | $ | 7,486,991 | |
| | | Large Cap | | Mid Cap | | Third Avenue |
| | | Core Equity | | Growth | | Value |
| | | Fund | | Fund | | Fund |
| Purchases of investment securities | | $ | 15,163,924 | | | $ | 18,139,517 | | | $ | 17,752,944 | |
| Proceeds from sales and maturities | | $ | 15,759,972 | | | $ | 23,842,362 | | | $ | 22,475,436 | |
| | | Aggressive | | Conservative | | Moderate |
| | | ETF Fund | | ETF Fund | | ETF Fund |
| Purchases of investment securities | | $ | 2,944,861 | | | $ | 3,206,296 | | | $ | 3,990,394 | |
| Proceeds from sales and maturities | | $ | 7,093,000 | | | $ | 6,789,079 | | | $ | 14,280,006 | |
For the year ended December 31, 2014, purchases and proceeds from sales and maturities in U.S. Government Securities were $116,136,273 and $115,250,260 for the Active Bond Fund, respectively.
Notes to Financial Statements (Continued)
4. Transactions with Affiliates and Other Related Parties
Certain officers of the Trust are also officers of Touchstone Advisors, Inc. (the “Advisor”), Touchstone Securities, Inc. (the “Underwriter”) or BNY Mellon Investment Servicing (U.S.) Inc. (“BNY Mellon”), the Sub-Administrator and Transfer Agent to the Funds. Such officers receive no compensation from the Trust. The Advisor and the Underwriter are each wholly-owned, indirect subsidiaries of Western & Southern.
On behalf of the Funds, the Advisor pays each Independent Trustee a quarterly retainer plus additional retainers to the Lead Independent Trustee and the chairs of each standing committee. Interested Trustees do not receive compensation from the Funds. Each Independent Trustee also receives compensation for each board meeting and committee meeting attended. Each standing committee chair receives additional compensation for each committee meeting that he or she oversees. The Advisor is reimbursed by the Funds for the Independent Trustees’ compensation and out-of-pocket expenses relating to their services. The Funds accrued Trustee-related expenses of $121,358 for the year ended December 31, 2014.
MANAGEMENT & EXPENSE LIMITATION AGREEMENTS
The Advisor provides general investment supervisory services for the Funds, under terms of an advisory agreement (the “Advisory Agreement”). Under the Advisory Agreement, each Fund pays the Advisor a fee, which is computed and accrued daily and paid monthly, at an annual rate based on average daily net assets of each fund as shown in the table below.
| Active Bond Fund | 0.55% on the first $100 million |
| | 0.50% on the next $100 million |
| | 0.45% on the next $100 million |
| | 0.40% on such assets in excess of $300 |
| | million |
| Baron Small Cap Growth Fund | 1.05% |
| High Yield Fund | 0.50% on the first $100 million |
| | 0.45% on the next $100 million |
| | 0.40% on the next $100 million |
| | 0.35% on such assets in excess of $300 |
| | million |
| Large Cap Core Equity Fund | 0.65% on the first $100 million |
| | 0.60% on the next $100 million |
| | 0.55% on the next $100 million |
| | 0.50% on such assets in excess of $300 |
| | million |
| Mid Cap Growth Fund | 0.75% on the first $500 million |
| | 0.70% on the next $500 million |
| | 0.65% on such assets in excess of $1 billion |
| Money Market Fund | 0.18% |
| Third Avenue Value Fund | 0.80% on the first $100 million |
| | 0.75% on the next $100 million |
| | 0.70% on the next $100 million |
| | 0.65% on such assets in excess of $300 |
| | million |
| Aggressive ETF Fund | 0.25% on the first $50 million |
| Conservative ETF Fund | 0.23% on the next $50 million |
| Moderate ETF Fund | 0.20% on such assets in excess of $100 |
| | million |
Notes to Financial Statements (Continued)
The Advisor has entered into investment sub-advisory agreements with the following parties (each, a “Sub-Advisor”):
| BAMCO, Inc. | Todd Asset Management, LLC |
| Baron Small Cap Growth Fund | Large Cap Core Equity Fund |
| | Aggressive ETF Fund |
| Fort Washington Investment Advisors, Inc.* | Conservative ETF Fund |
| Active Bond Fund | Moderate ETF Fund |
| High Yield Fund | |
| Money Market Fund | |
| | |
| Third Avenue Management, LLC | Westfield Capital Management Company, L.P. |
| Third Avenue Value Fund | Mid Cap Growth Fund |
* Affiliate of the Advisor and wholly-owned indirect subsidiary of Western & Southern
The Advisor, not the Funds, pays sub-advisory fees to each Sub-Advisor.
The Advisor entered into an amended expense limitation agreement (the “Expense Limitation Agreement”) to contractually limit operating expenses of the Funds, excluding: dividend and interest expenses on short sales; interest; taxes; brokerage commissions; other expenditures which are capitalized in accordance with GAAP; the cost of “Acquired Fund Fees and Expenses”, if any; and other extraordinary expenses not incurred in the ordinary course of business. The maximum operating expense limit in any year with respect to the Funds is based on a percentage of the average daily net assets of the Funds. The Advisor has agreed to separately waive advisory fees and administration fees, and to reimburse expenses in order to maintain the following expense limitations for the Funds:
| Fund | | |
| Active Bond Fund* | | | 0.97 | % |
| Baron Small Cap Growth Fund* | | | 1.31 | % |
| High Yield Fund | | | 1.05 | % |
| Large Cap Core Equity Fund* | | | 1.06 | % |
| Mid Cap Growth Fund* | | | 1.21 | % |
| Money Market Fund | | | 0.75 | % |
| Third Avenue Value Fund* | | | 1.32 | % |
| Aggressive ETF Fund | | | 0.75 | % |
| Conservative ETF Fund | | | 0.75 | % |
| Moderate ETF Fund | | | 0.75 | % |
* Prior to April 29, 2014, the Fund expense limitations were 1.00%, 1.55%, 1.00%, 1.26% and 1.17% for the Active Bond Fund, Baron Small Cap Growth Fund, Large Cap Core Equity Fund, Mid Cap Growth Fund and Third Avenue Value Fund, respectively.
These expense limitations will remain in effect for all Funds through at least April 29, 2015.
For the Money Market Fund, in addition to the above expense caps, the Advisor has voluntarily agreed to temporarily waive all or a portion of their fees, to the extent necessary to maintain the Fund’s yield. There is no guarantee that the Advisor will continue to waive such fees in the future.
Notes to Financial Statements (Continued)
During the year ended December 31, 2014, the Advisor or its affiliates waived investment advisory fees and administration fees or reimbursed expenses, of the Funds as follows:
| | | Investment | | Administration | | Shareholder | | |
| | | Advisory | | Fees | | Servicing | | |
| Fund | | Fees Waived | | Waived | | Fees Waived | | Total |
| Active Bond Fund | | $ | — | | | $ | 14,610 | | | $ | — | | | $ | 14,610 | |
| Baron Small Cap Growth Fund | | | — | | | | 49,435 | | | | 24,632 | | | | 74,067 | |
| High Yield Fund | | | 2,031 | | | | 27,874 | | | | 27,885 | | | | 57,790 | |
| Large Cap Core Equity Fund | | | — | | | | 44,995 | | | | — | | | | 44,995 | |
| Mid Cap Growth Fund | | | — | | | | 26,747 | | | | — | | | | 26,747 | |
| Money Market Fund | | | 54,294 | | | | 96,387 | | | | 120,483 | | | | 271,164 | |
| Third Avenue Value Fund | | | — | | | | 44,987 | | | | — | | | | 44,987 | |
| Aggressive ETF Fund | | | — | | | | 29,635 | | | | — | | | | 29,635 | |
| Conservative ETF Fund | | | — | | | | 33,583 | | | | — | | | | 33,583 | |
| Moderate ETF Fund | | | — | | | | 15,299 | | | | — | | | | 15,299 | |
Under the terms of the Expense Limitation Agreement, the Advisor is entitled to recover, subject to approval by the Funds’ Board, such amounts waived or reimbursed for a period of up to three years from the year in which the Advisor reduced its compensation or assumed expenses for the Funds. No recoupment will occur unless a Fund’s operating expenses are below the expense limitation amount in effect of the time of waiver or reimbursement.
At December 31, 2014, the Advisor may seek recoupment of previously waived fees and reimbursed expenses as follows:
| | | Expiration | | Expiration | | Expiration | | |
| | | December 31, | | December 31, | | December 31, | | |
| Fund | | 2015 | | 2016 | | 2017 | | Total |
| Active Bond Fund | | $ | 1,794 | | | $ | 25,443 | | | $ | 14,610 | | | $ | 41,847 | |
| Baron Small Cap Growth Fund | | | 19,452 | | | | 38,995 | | | | 49,435 | | | | 107,882 | |
| High Yield Fund | | | 13,923 | | | | 43,426 | | | | 29,905 | | | | 87,254 | |
| Large Cap Core Equity Fund | | | 38,996 | | | | 67,963 | | | | 44,995 | | | | 151,954 | |
| Mid Cap Growth Fund | | | 9,780 | | | | 25,785 | | | | 26,747 | | | | 62,312 | |
| Third Avenue Value Fund | | | 50,398 | | | | 63,024 | | | | 44,987 | | | | 158,409 | |
| Aggressive ETF Fund | | | 35,308 | | | | 30,620 | | | | 29,635 | | | | 95,563 | |
| Conservative ETF Fund | | | 41,861 | | | | 50,398 | | | | 33,583 | | | | 125,842 | |
| Moderate ETF Fund | | | 49,581 | | | | 72,057 | | | | 15,299 | | | | 136,937 | |
The Advisor did not recoup any amounts it previously waived or reimbursed during the year ended December 31, 2014.
ADMINISTRATION AGREEMENT
The Advisor entered into an Administration Agreement with the Trust, whereby the Advisor is responsible for: supplying executive and regulatory compliance services; supervising the preparation of tax returns; coordinating the preparation of reports to shareholders and reports to, and filings with, the Securities and Exchange Commission (the “SEC”) and state securities authorities, as well as materials for meetings of the Board; calculating the daily NAV per share; and maintaining the financial books and records of each Fund.
For its services through December 31, 2014, the Advisor received an annual fee of 0.20% of the Trust’s aggregate net assets up to $1 billion, 0.16% of the next $1 billion of aggregate net assets and 0.12% on assets in excess of $2 billion. The fee was computed and allocated among the Funds on the basis of relative daily net assets.
Notes to Financial Statements (Continued)
Beginning January 1, 2015, the Advisor’s annual administrative fee is:
0.145% on the first $20 billion of the aggregate average daily net assets;
0.11% on the next $10 billion of aggregate average daily net assets;
0.09% on the next $10 billion of aggregate average daily net assets; and
0.07% on the aggregate average daily net assets over $40 billion.
The fee is computed and allocated among all Funds in the Trust, Touchstone Investment Trust, Touchstone Strategic Trust, Touchstone Funds Group Trust, and Touchstone Tax-Free Trust (collectively with the Trust, “Touchstone Fund Complex”) on the basis of relative daily net assets.
The Advisor has engaged BNY Mellon as the Sub-Administrator to the Trust. BNY Mellon provides administrative and accounting services to the Trust and is compensated directly by the Advisor, not the Trust.
TRANSFER AGENT AGREEMENT
Under the terms of the Transfer Agent Agreement between the Trust and BNY Mellon, BNY Mellon maintains the records of each shareholder’s account, answers shareholders’ inquiries concerning their accounts, processes purchases and redemptions of each Fund’s shares, acts as dividend and distribution disbursing agent, and performs other shareholder service functions. For these services, BNY Mellon receives a monthly fee per shareholder account from each Fund. In addition, each Fund pays out-of-pocket expenses incurred by BNY Mellon, including, but not limited to, postage and supplies.
The Funds may reimburse the Advisor for fees paid to intermediaries such as banks, broker-dealers, financial advisors or other financial institutions for sub-transfer agency, sub-administration and other services provided to investors whose shares of record are held in omnibus, other group accounts, retirement plans or accounts traded through registered securities clearing agents. These fees may vary based on, for example, the nature of services provided, but generally range up to 0.15% of the assets of the class serviced or maintained by the intermediary or up to $22 per sub-account maintained by the intermediary. Prior to December 1, 2014, the Funds reimbursed the Advisor up to $17 per sub-account maintained by the intermediary.
PLANS OF DISTRIBUTION
The Trust has adopted a Shareholder Services Plan under which shares of each Fund may directly or indirectly bear expenses for shareholder services provided. Each Fund will incur or reimburse expenses for shareholder services at an annual rate not to exceed 0.25% of the average daily net assets.
UNDERWRITING AGREEMENT
The Underwriter acts as exclusive agent for the distribution of the Funds’ shares. The Underwriter receives no compensation under this agreement.
AFFILIATED INVESTMENTS
Each Fund, except the Money Market Fund, may invest in the Touchstone Institutional Money Market Fund, subject to compliance with several conditions set forth in an exemptive order received by the Trust from the SEC. To the extent that the Funds are invested in the Touchstone Institutional Money Market Fund, the Advisor and Administrator will be paid additional fees from the Touchstone Institutional Money Market Fund that will not be waived or reimbursed.
Notes to Financial Statements (Continued)
A summary of each Fund’s investment, as applicable, in the Touchstone Institutional Money Market Fund for the year ended December 31, 2014, is as follows:
| | | Share Activity | | | | |
| | | Balance | | | | | | Balance | | | | Value |
| | | 12/31/13 | | Purchases | | Sales | | 12/31/14 | | Dividends | | 12/31/14 |
| Active Bond Fund | | | 1,520,880 | | | | 49,700,336 | | | | (49,868,749 | ) | | | 1,352,467 | | | $ | 287 | | | $ | 1,352,467 | |
| Baron Small Cap Growth Fund | | | 681,366 | | | | 7,299,910 | | | | (6,543,763 | ) | | | 1,437,513 | | | | 70 | | | | 1,437,513 | |
| High Yield Fund | | | 171,791 | | | | 7,377,178 | | | | (6,306,388 | ) | | | 1,242,581 | | | | 28 | | | | 1,242,581 | |
| Large Cap Core Equity Fund | | | 1,083,500 | | | | 9,371,034 | | | | (10,454,534 | ) | | | — | | | | 75 | | | | — | |
| Mid Cap Growth Fund | | | 399,553 | | | | 15,357,260 | | | | (14,552,854 | ) | | | 1,203,959 | | | | 61 | | | | 1,203,959 | |
| Third Avenue Value Fund | | | 1,502,124 | | | | 14,637,065 | | | | (15,019,243 | ) | | | 1,119,946 | | | | 149 | | | | 1,119,946 | |
| Aggressive ETF Fund | | | 412,367 | | | | 5,035,939 | | | | (5,033,666 | ) | | | 414,640 | | | | 32 | | | | 414,640 | |
| Conservative ETF Fund | | | 424,433 | | | | 5,894,433 | | | | (5,995,381 | ) | | | 323,485 | | | | 32 | | | | 323,485 | |
| Moderate ETF Fund | | | 653,759 | | | | 7,797,865 | | | | (7,820,995 | ) | | | 630,629 | | | | 44 | | | | 630,629 | |
5. Federal Tax Information
Federal income tax—It is each Fund’s policy to continue to comply with the special provisions of the Internal Revenue Code applicable to regulated investment companies. As provided therein, in any fiscal year in which a Fund so qualifies and distributes at least 90% of its investment company taxable income, the Fund (but not the shareholders) will be relieved of federal income tax on the income distributed. It is each Fund’s policy to distribute all of its taxable income and accordingly, no provision for income taxes has been made.
The tax character of distributions paid for the years ended December 31, 2014 and 2013 are as follows:
| | | | | | | Baron Small Cap | | | | | | Large Cap |
| | | Active Bond Fund | | Growth Fund | | High Yield Fund | | Core Equity Fund |
| | | 2014 | | 2013 | | 2014 | | 2013 | | 2014 | | 2013 | | 2014 | | 2013 |
| From ordinary income | | $ | 1,255,946 | | | $ | 1,761,458 | | | $ | — | | | $ | 320,878 | | | $ | 1,208,784 | | | $ | 1,954,374 | | | $ | 400,191 | | | $ | 487,271 | |
| From long-term capital gains | | | — | | | | — | | | | 929,298 | | | | 2,557,765 | | | | — | | | | — | | | | — | | | | — | |
| Total distributions | | $ | 1,255,946 | | | $ | 1,761,458 | | | $ | 929,298 | | | $ | 2,878,643 | | | $ | 1,208,784 | | | $ | 1,954,374 | | | $ | 400,191 | | | $ | 487,271 | |
| | | | | | | Third Avenue |
| | | Mid Cap Growth Fund | | Money Market Fund | | Value Fund |
| | | 2014 | | 2013 | | 2014 | | 2013 | | 2014 | | 2013 |
| From ordinary income | | $ | 692,256 | | | $ | — | | | $ | 4,788 | | | $ | 5,084 | | | $ | 1,486,457 | | | $ | 1,282,581 | |
| From long-term capital gains | | | 2,398,321 | | | | 462,839 | | | | — | | | | — | | | | — | | | | — | |
| Total distributions | | $ | 3,090,577 | | | $ | 462,839 | | | $ | 4,788 | | | $ | 5,084 | | | $ | 1,486,457 | | | $ | 1,282,581 | |
| | | Aggressive | | Conservative | | Moderate |
| | | ETF Fund | | ETF Fund | | ETF Fund |
| | | 2014 | | 2013 | | 2014 | | 2013 | | 2014 | | 2013 |
| From ordinary income | | $ | 5 | | | $ | 467,020 | | | $ | 276,355 | | | $ | 367,724 | | | $ | 541,213 | | | $ | 760,226 | |
| From long-term capital gains | | | 497,503 | | | | 84,875 | | | | 782,933 | | | | 760,314 | | | | — | | | | — | |
| Total distributions | | $ | 497,508 | | | $ | 551,895 | | | $ | 1,059,288 | | | $ | 1,128,038 | | | $ | 541,213 | | | $ | 760,226 | |
Notes to Financial Statements (Continued)
The following information is computed on a tax basis for each item as of December 31, 2014:
| | | | | Baron Small | | | | Large Cap |
| | | Active Bond | | Cap Growth | | High Yield | | Core Equity |
| | | Fund | | Fund | | Fund | | Fund |
| Tax cost of portfolio investments | | $ | 48,178,805 | | | $ | 16,676,918 | | | $ | 13,488,008 | | | $ | 30,471,092 | |
| Gross unrealized appreciation | | | 1,065,941 | | | | 13,678,955 | | | | 167,138 | | | | 9,779,024 | |
| Gross unrealized depreciation | | | (546,693 | ) | | | (86,612 | ) | | | (532,904 | ) | | | (575,376 | ) |
| Net unrealized appreciation (depreciation) | | | 519,248 | | | | 13,592,343 | | | | (365,766 | ) | | | 9,203,648 | |
| Accumulated capital losses | | | (834,867 | ) | | | — | | | | (396,333 | ) | | | (3,868,036 | ) |
| Undistributed ordinary income | | | 1,125,067 | | | | 41,451 | | | | 674,810 | | | | 493,821 | |
| Undistributed long-term capital gains | | | — | | | | 2,287,473 | | | | — | | | | — | |
| Accumulated earnings (deficit) | | $ | 809,448 | | | $ | 15,921,267 | | | $ | (87,289 | ) | | $ | 5,829,433 | |
| | | Mid Cap | | Money Market | | Third Avenue |
| | | Growth Fund | | Fund | | Value Fund |
| Tax cost of portfolio investments | | $ | 21,429,140 | | | $ | 45,473,026 | | | $ | 24,498,482 | |
| Gross unrealized appreciation | | | 5,409,065 | | | | — | | | | 3,085,753 | |
| Gross unrealized depreciation | | | (396,427 | ) | | | — | | | | (1,293,432 | ) |
| Net unrealized appreciation (depreciation) | | | 5,012,638 | | | | — | | | | 1,792,321 | |
| Net unrealized appreciation (depreciation) on foreign currency and translation of other assets and liabilities denominated in foreign currency | | | — | | | | — | | | | (1,441 | ) |
| Accumulated capital losses | | | — | | | | (709 | ) | | | — | |
| Undistributed ordinary income | | | 1,291,087 | | | | 2 | | | | 863,505 | |
| Undistributed long-term capital gains | | | 2,507,656 | | | | — | | | | 2,387,382 | |
| Accumulated earnings (deficit) | | $ | 8,811,381 | | | $ | (707 | ) | | $ | 5,041,767 | |
| | | Aggressive | | Conservative | | Moderate |
| | | ETF Fund | | ETF Fund | | ETF Fund |
| Tax cost of portfolio investments | | $ | 23,554,849 | | | $ | 25,631,431 | | | $ | 33,476,065 | |
| Gross unrealized appreciation | | | 3,697,430 | | | | 2,204,031 | | | | 5,821,369 | |
| Gross unrealized depreciation | | | (195,794 | ) | | | (213,521 | ) | | | (620,609 | ) |
| Net unrealized appreciation (depreciation) | | | 3,501,636 | | | | 1,990,510 | | | | 5,200,760 | |
| Accumulated capital and other losses | | | (3,722,716 | ) | | | — | | | | — | |
| Undistributed ordinary income | | | 361,572 | | | | 348,117 | | | | 537,284 | |
| Undistributed long-term capital gains | | | — | | | | 974,862 | | | | 3,365,164 | |
| Accumulated earnings (deficit) | | $ | 140,492 | | | $ | 3,313,489 | | | $ | 9,103,208 | |
The difference between the tax cost of portfolio investments and the financial statement cost is primarily due to wash sales loss deferrals, investments in passive foreign investment company (“PFIC”) adjustments, and partnership securities.
Notes to Financial Statements (Continued)
As of December 31, 2014, the Funds had the following capital loss carryforwards for federal income tax purposes:
| | | | | No | | No | | |
| | | Short Term Expiring on* | | Expiration | | Expiration | | |
| | | 2016 | | 2017 | | 2018 | | Short Term* | | Long Term* | | Total |
| Active Bond Fund | | $ | — | | | $ | — | | | $ | — | | | $ | 834,867 | | | $ | — | | | $ | 834,867 | |
| High Yield Fund | | | — | | | | 396,333 | | | | — | | | | — | | | | — | | | | 396,333 | |
| Large Cap Core Equity Fund | | | — | | | | 1,406,145 | | | | 2,461,891 | | | | — | | | | — | | | | 3,868,036 | |
| Money Market Fund | | | — | | | | — | | | | — | | | | 709 | | | | — | | | | 709 | |
| Aggressive EFT Fund** | | | 3,722,716 | | | | — | | | | — | | | | — | | | | — | | | | 3,722,716 | |
* The Regulated Investment Company Modernization Act of 2010 (the “Act”) was enacted on December 22, 2010. The Act made changes to several tax rules impacting the Funds. The provisions of the Act first became effective for the Funds’ fiscal year ended December 31, 2012 and are applicable to all subsequent fiscal years. Although the Act provides several benefits, including the unlimited carryover of future capital losses, there may be a greater likelihood that all or a portion of each Fund’s pre-enactment capital loss carryovers may expire without being utilized due to the fact that post-enactment capital losses must be utilized before pre-enactment capital loss carryovers may be utilized. Under the Act, new capital losses may now be carried forward indefinitely, and retain the character of the original loss as compared with pre-enactment law, where capital losses could be carried forward for up to eight years, and carried forward as short-term capital losses, irrespective of the character of the original loss.
** May be subject to limitation.
The capital loss carryforwards may be utilized in future years to offset net realized capital gains, if any, prior to distributing such gains to shareholders.
During the year ended December 31, 2014, the following Funds utilized capital loss carryforwards.
| Fund | | Amount |
| Active Bond fund | | $ | 290,763 | |
| High Yield Fund | | | 226,521 | |
| Large Cap Core Equity Fund | | | 3,774,789 | |
| Money Market Fund | | | 178 | |
| Third Avenue Value Fund | | | 1,678,381 | |
| Aggressive ETF Fund | | | 2,077,659 | |
| Moderate ETF Fund | | | 459,030 | |
Under current laws, certain capital losses realized after October 31 and ordinary losses realized after December 31 may be deferred (and certain ordinary losses after October and/or December 31 may be deferred) and treated as occurring on the first day of the following fiscal year. For the year ended December 31, 2014, the Funds did not elect to defer any losses.
The Funds have analyzed their tax positions taken on federal income tax returns for all open tax years (tax years ended December 31, 2011 through 2014) and have concluded that no provision for income tax is required in their financial statements.
Certain reclassifications, the result of permanent differences between financial statement and income tax reporting requirements, have been made to the components of capital. These reclassifications have no impact on the net assets or NAV per share of the Funds. The following reclassifications, which are primarily attributed to the tax treatment of net investment losses, foreign currency gains/losses, paydown gains/losses on mortgage backed and asset backed securities, investments in partnerships and passive foreign investment companies, trust preferred securities adjustments,TIPs (Treasury Inflation Protected Securities) income adjustment, return of capital adjustments, dividends reclass to ordinary income, and re-designation of dividends paid, have been made to the following Funds for the year ended December 31, 2014:
Notes to Financial Statements (Continued)
| | | | | Accumulated | | Accumulated |
| | | Paid-In | | Net Investment | | Net Realized |
| Fund | | Capital | | Income (Loss) | | Gains (Losses) |
| Active Bond Fund | | $ | — | | | $ | 179,200 | | | $ | (179,200 | ) |
| Baron Small Cap Growth Fund | | | (9,396 | ) | | | (14,423 | ) | | | 23,819 | |
| High Yield | | | — | | | | 15 | | | | (15 | ) |
| Mid Cap Growth Fund | | | — | | | | 110,113 | | | | (110,113 | ) |
| Third Avenue Value Fund | | | — | | | | 1,554,112 | | | | (1,554,112 | ) |
| Aggressive ETF Fund | | | — | | | | 3,939 | | | | (3,939 | ) |
| Conservative ETF Fund | | | — | | | | 9,933 | | | | (9,933 | ) |
| Moderate ETF Fund | | | — | | | | 11,017 | | | | (11,017 | ) |
6. Commitments and Contingencies
The Funds indemnify theTrust’s officers andTrustees for certain liabilities that might arise from their performance of their duties to the Funds. Additionally, in the normal course of business, the Funds enter into contracts that contain a variety of representations and warranties and which provide general indemnifications. The Funds’ maximum exposure under these arrangements is unknown, as this would involve future claims that may be made against the Funds.
7. Risks Associated with Foreign Investments
Some of the Funds may invest in the securities of foreign issuers. Investing in securities issued by companies whose principal business activities are outside the U.S. may involve significant risks not present in domestic investments. For example, there is generally less publicly available information about foreign companies, particularly those not subject to the disclosure and reporting requirements of the U.S. securities laws. Foreign issuers are generally not bound by uniform accounting, auditing, and financial reporting requirements and standards of practice comparable to those applicable to domestic issuers. Investments in foreign securities also involve the risk of possible adverse changes in investment or exchange control regulations, expropriation or confiscatory taxation, limitations on the removal of funds or other assets of the Fund, political or financial instability or diplomatic and other developments which could affect such investments. Foreign stock markets, while growing in volume and sophistication, are generally not as developed as those in the U.S., and securities of some foreign issuers (particularly those located in developing countries) may be less liquid and more volatile than securities of comparable U.S. companies. In general, there is less overall governmental supervision and regulation of foreign securities markets, broker-dealers, and issuers than in the U.S.
8. Risk Associated with Concentration
Certain Funds invest a high percentage of their assets in specific sectors of the market in order to achieve a potentially greater investment return. As a result, these Funds may be more susceptible to economic, political, and regulatory developments in a particular sector of the market, positive or negative, and may experience increased volatility on the Funds’ NAVs and magnified effect on the total return.
9. Risks Associated with Credit
An issuer may be unable to make timely payments of either principal or interest. This may cause the issuer’s securities to decline in value. Credit risk is particularly relevant to those Funds that invest a significant amount of their assets in junk bonds or lower-rated securities.
10. Risks Associated with Interest Rate Changes
As interest rates rise, the value of fixed-income securities a Fund owns will likely decrease. The price of debt securities is generally linked to the prevailing market interest rates. In general, when interest rates rise, the price
Notes to Financial Statements (Continued)
of debt securities falls, and when interest rates fall, the price of debt securities rises. The price volatility of a debt security also depends on its maturity. Longer-term securities are generally more volatile, so the longer the average maturity or duration of these securities, the greater their price risk. Duration is a measure of the expected life, taking into account any prepayment or call features of the security, that is used to determine the price sensitivity of the security for a given change in interest rates. Specifically, duration is the change in the value of a fixed-income security that will result from a 1% change in interest rates, and generally is stated in years. For example, as a general rule a 1% rise in interest rates means a 1% fall in value for every year of duration. Maturity, on the other hand, is the date on which a fixed-income security becomes due for payment of principal. There may be less governmental intervention in the securities markets in the near future. The negative impact on fixed income securities if interest rates increase as a result could negatively impact a Fund’s NAV.
11. Fund Merger
At a meeting held on August 22, 2013, the Board of Trustees of the Trust approved an Agreement and Plan of Reorganization providing for the transfer of all assets and liabilities of the Touchstone Enhanced ETF Fund (the “Acquired Fund”) to the Touchstone Aggressive ETF Fund (the “Acquiring Fund”). The tax-free merger took place on December 13, 2013.
| | | Before Reorganization | | After Reorganization |
| | | Touchstone Enhanced ETF | | Touchstone Aggressive ETF | | Touchstone Aggressive ETF |
| | | Fund | | Fund | | Fund |
| | | | | | | |
| Shares | | | 859,707 | (A) | | | 1,156,285 | | | | 2,015,992 | |
| Net Assets | | $ | 11,138,832 | | | $ | 14,981,565 | | | $ | 26,120,397 | |
| Net Asset Value | | $ | 12.96 | (A) | | $ | 12.96 | | | $ | 12.96 | |
| Shares Outstanding | | | 1,065,116 | | | | 1,156,285 | | | | 2,015,992 | |
| Unrealized Appreciation (Depreciation) | | $ | 431,465 | | | $ | 3,133,157 | | | $ | 3,564,622 | |
(A) Reflects a 0.8071:1 stock split which occurred on the date of reorganization, December 13, 2013.
Assuming this reorganization had been completed on January 1, 2013, the Aggressive ETF Fund results of operations for the period ended December 31, 2013 would have been as follows:
| Net investment income | | $ | 296,494 | |
| Net realized and unrealized gains on investments | | $ | 5,901,580 | |
| Net increase in asset from operations | | $ | 6,198,074 | |
Because the combined investment portfolios have been managed as a single portfolio since the reorganization was completed, it is not practical to separate the amounts of revenue and earnings to the Acquiring Fund that have been included in its statements of operations since the reorganization.
12. Subsequent Events
Subsequent events occurring after the date of this report have been evaluated for potential impact to this report through the date financial statements were issued. There were no subsequent events that necessitated recognition or disclosure in the Funds’ financial statements.
Report of Independent Registered Public Accounting Firm
To the Board of Trustees and Shareholders of Touchstone Variable Series Trust
We have audited the accompanying statements of assets and liabilities, including the portfolios of investments, of Touchstone Variable Series Trust (comprising, respectively, the Touchstone Active Bond (formerly, Touchstone Core Bond Fund), Touchstone Baron Small Cap Growth, Touchstone High Yield, Touchstone Large Cap Core Equity, Touchstone Mid Cap Growth, Touchstone Money Market, Touchstone Third Avenue Value, Touchstone Aggressive ETF, Touchstone Conservative ETF, and Touchstone Moderate ETF Funds (the “Funds”)) as of December 31, 2014, and the related statements of operations for the year then ended, the statements of changes in net assets for each of the two years in the period then ended, and the financial highlights for each of the five years in the period then ended. These financial statements and financial highlights are the responsibility of the Funds’ management. Our responsibility is to express an opinion on these financial statements and financial highlights based on our audits.
We conducted our audits in accordance with the standards of the Public Company Accounting Oversight Board (United States). Those standards require that we plan and perform the audit to obtain reasonable assurance about whether the financial statements and financial highlights are free of material misstatement. We were not engaged to perform an audit of the Funds’ internal control over financial reporting. Our audits included consideration of internal control over financial reporting as a basis for designing audit procedures that are appropriate in the circumstances, but not for the purpose of expressing an opinion on the effectiveness of the Funds’ internal control over financial reporting. Accordingly, we express no such opinion. An audit also includes examining, on a test basis, evidence supporting the amounts and disclosures in the financial statements and financial highlights, assessing the accounting principles used and significant estimates made by management, and evaluating the overall financial statement presentation. Our procedures included confirmation of securities owned as of December 31, 2014, by correspondence with the custodian, transfer agent, and brokers or by other appropriate auditing procedures where replies from brokers were not received. We believe that our audits provide a reasonable basis for our opinion.
In our opinion, the financial statements and financial highlights referred to above present fairly, in all material respects, the financial position of each of the respective funds constituting Touchstone Variable Series Trust at December 31, 2014, the results of their operations for the year then ended, the changes in their net assets for each of the two years in the period then ended, and the financial highlights for each of the five years in the period then ended, in conformity with U.S. generally accepted accounting principles.
Cincinnati, Ohio
February 20, 2015
Other Items (Unaudited)
Dividend Received Deduction
For corporate shareholders, the following ordinary distributions paid during the current fiscal year ended December 31, 2014 qualify for the corporate dividends received deduction. The Funds intend to pass through the maximum allowable percentage for 1099s.
| Large Cap Core Equity Fund | | | 100.00 | % |
| Mid Cap Growth Fund | | | 37.53 | % |
| Third Avenue Value Fund | | | 12.57 | % |
| Aggressive ETF Fund | | | 59.82 | % |
| Conservative ETF Fund | | | 44.20 | % |
| Moderate ETF Fund | | | 62.33 | % |
For the fiscal year ended December 31, 2014, Baron Small Cap Growth Fund, Mid Cap Growth Fund, Third Avenue Value Fund, Conservative ETF Fund, and Moderate ETF Fund, designated $2,287,477, $2,507,666, $2,387,382, $974,866 and $3,365,164, respectively, as long-term capital gains.
Proxy Voting Guidelines
The Sub-Advisors are responsible for exercising the voting rights associated with the securities purchased and held by the Funds. A description of the policies and procedures that the Sub-Advisors use in fulfilling this responsibility is available as an appendix to the most recent Statement of Additional Information, which can be obtained without charge by calling toll free 1.800.543.0407 or by visiting the Touchstone website at www.touchstoneinvestments.com or on the Securities and Exchange Commission’s (the Commission) website at www.sec.gov. Information regarding how those proxies were voted during the most recent twelve-month period ended June 30 is also available without charge by calling toll free 1.800.543.0407 or on the Commission’s website at www.sec.gov.
Quarterly Portfolio Disclosure
The Trust files a complete listing of portfolio holdings for each Fund as of the end of the first and third quarters of each fiscal year on Form N-Q. The complete listing (i) is available on the Commission’s website; (ii) may be reviewed and copied at the Commission’s Public Reference Room in Washington, DC; and (iii) will be made available to shareholders upon request by calling 1.800.543.0407; or (iv) can be obtained on the Touchstone website at www.touchstoneinvestments.com. Information on the operation of the Public Reference Room may be obtained by calling 1.800.SEC.0330.
Schedule of Shareholder Expenses
As a shareholder of the Funds, you incur two types of costs: (1) transaction costs, including reinvested dividends or other distributions; and (2) ongoing costs, including investment advisory fees; shareholder servicing fees; and other Fund expenses. This example is intended to help you understand your ongoing costs (in dollars) of investing in the Funds and to compare these costs with the ongoing costs of investing in other mutual funds.
The example is based on an investment of $1,000 invested at the beginning of the period and held for the entire period (July 1, 2014 through December 31, 2014).
Actual Expenses
The first line of the table below for each Fund provides information about actual account values and actual expenses. You may use the information in this line, together with the amount you invested, to estimate the expenses that you paid over the period. Simply divide your account value by $1,000 (for example, an $8,600 account value divided by $1,000 = 8.6), then multiply the result by the number in the first line under the heading entitled “Expenses Paid During the year ended December 31, 2014” to estimate the expenses you paid on your account during this period.
Other Items (Unaudited) (Continued)
Hypothetical Example for Comparison Purposes
The second line of the table below for each Fund provides information about hypothetical account values and hypothetical expenses based on the Funds’ actual expense ratio and an assumed rate of return of 5% per year before expenses, which is not the Funds’ actual return. The hypothetical account values and expenses may not be used to estimate the actual ending account balance or expenses you paid for the period. You may use this information to compare the ongoing costs of investing in the Funds and other funds. To do so, compare this 5% hypothetical example with the 5% hypothetical examples that appear in the shareholder reports of the other funds.
Please note that the expenses shown in the table below are meant to highlight your ongoing costs only and do not reflect any transactional costs, such as sales charges (loads), redemption fees, or exchange fees. Therefore, the second line of the table below for each Fund is useful in comparing ongoing costs only, and will not help you determine the relative total costs of owning different funds. In addition, if these transactional costs were included, your costs would have been higher.
| | | | | | | | | Expenses |
| | | Net Expense | | Beginning | | Ending | | Paid During |
| | | Ratio | | Account | | Account | | the Six Months |
| | | Annualized | | Value | | Value | | Ended |
| | | December 31, | | July 1, | | December 31, | | December 31, |
| | | 2014 | | 2014 | | 2014 | | 2014* |
| Touchstone Active Bond Fund | | | | | | | | | | | | | | | | |
| Actual | | | 0.97 | % | | $ | 1,000.00 | | | $ | 1,000.60 | | | $ | 4.89 | |
| Hypothetical | | | 0.97 | % | | $ | 1,000.00 | | | $ | 1,020.32 | | | $ | 4.94 | |
| | | | | | | | | | | | | | | | | |
| Touchstone Baron Small Cap Growth Fund | | | | | | | | | | | | | | | | |
| Actual | | | 1.31 | % | | $ | 1,000.00 | | | $ | 1,035.10 | | | $ | 6.72 | |
| Hypothetical | | | 1.31 | % | | $ | 1,000.00 | | | $ | 1,018.60 | | | $ | 6.67 | |
| | | | | | | | | | | | | | | | | |
| Touchstone High Yield Fund | | | | | | | | | | | | | | | | |
| Actual | | | 1.05 | % | | $ | 1,000.00 | | | $ | 958.70 | | | $ | 5.18 | |
| Hypothetical | | | 1.05 | % | | $ | 1,000.00 | | | $ | 1,019.91 | | | $ | 5.35 | |
| | | | | | | | | | | | | | | | | |
| Touchstone Large Cap Core Equity Fund | | | | | | | | | | | | | | | | |
| Actual | | | 1.06 | % | | $ | 1,000.00 | | | $ | 1,063.90 | | | $ | 5.51 | |
| Hypothetical | | | 1.06 | % | | $ | 1,000.00 | | | $ | 1,019.86 | | | $ | 5.40 | |
| | | | | | | | | | | | | | | | | |
| Touchstone Mid Cap Growth Fund | | | | | | | | | | | | | | | | |
| Actual | | | 1.21 | % | | $ | 1,000.00 | | | $ | 1,061.60 | | | $ | 6.29 | |
| Hypothetical | | | 1.21 | % | | $ | 1,000.00 | | | $ | 1,019.11 | | | $ | 6.16 | |
| | | | | | | | | | | | | | | | | |
| Touchstone Money Market Fund | | | | | | | | | | | | | | | | |
| Actual | | | 0.17 | % | | $ | 1,000.00 | | | $ | 1,000.10 | | | $ | 0.86 | |
| Hypothetical | | | 0.17 | % | | $ | 1,000.00 | | | $ | 1,024.35 | | | $ | 0.87 | |
| | | | | | | | | | | | | | | | | |
| Touchstone Third Avenue Value Fund | | | | | | | | | | | | | | | | |
| Actual | | | 1.32 | % | | $ | 1,000.00 | | | $ | 915.30 | | | $ | 6.37 | |
| Hypothetical | | | 1.32 | % | | $ | 1,000.00 | | | $ | 1,018.55 | | | $ | 6.72 | |
| | | | | | | | | | | | | | | | | |
| Touchstone Aggressive ETF Fund | | | | | | | | | | | | | | | | |
| Actual | | | 0.75 | % | | $ | 1,000.00 | | | $ | 1,018.90 | | | $ | 3.82 | |
| Hypothetical | | | 0.75 | % | | $ | 1,000.00 | | | $ | 1,021.42 | | | $ | 3.82 | |
| | | | | | | | | | | | | | | | | |
| Touchstone Conservative ETF Fund | | | | | | | | | | | | | | | | |
| Actual | | | 0.75 | % | | $ | 1,000.00 | | | $ | 1,015.20 | | | $ | 3.81 | |
| Hypothetical | | | 0.75 | % | | $ | 1,000.00 | | | $ | 1,021.42 | | | $ | 3.82 | |
| | | | | | | | | | | | | | | | | |
| Touchstone Moderate ETF Fund | | | | | | | | | | | | | | | | |
| Actual | | | 0.75 | % | | $ | 1,000.00 | | | $ | 1,019.70 | | | $ | 3.82 | |
| Hypothetical | | | 0.75 | % | | $ | 1,000.00 | | | $ | 1,021.42 | | | $ | 3.82 | |
* Expenses are equal to the Fund's annualized expense ratio, multiplied by the average account value over the period, multiplied by 184/365 (to reflect one-half year period).
Other Items (Unaudited) (Continued)
Advisory and Sub-Advisory Agreement Approval Disclosure
At a meeting held on November 20, 2014, the Board of Trustees (the “Board” or “Trustees”) of the Touchstone Variable Series Trust (the “Trust”), and by a separate vote, the Independent Trustees of the Trust, approved the continuance of the Investment Advisory Agreement between the Trust and the Advisor with respect to each Fund of the Trust, and the continuance of each Sub-Advisory Agreement between the Advisor and each Fund’s respective Sub-Advisor.
In determining whether to approve the continuation of the Investment Advisory Agreement and the Sub-Advisory Agreements, the Advisor furnished information necessary for a majority of the Independent Trustees to make the determination that the continuance of the Investment Advisory Agreement and each Sub-Advisory Agreement was in the best interests of the respective Funds and their shareholders. The information provided to the Board included: (1) industry data comparing advisory fees and expense ratios of comparable investment companies; (2) comparative performance information; (3) the Advisor’s and its affiliates’ revenues and costs of providing services to the Funds; and (4) information about the Advisor’s and Sub-Advisors’ personnel. Prior to voting, the Independent Trustees reviewed the proposed continuance of the Investment Advisory Agreement and the Sub-Advisory Agreements with management and experienced independent legal counsel and received materials from such counsel discussing the legal standards for their consideration of the proposed continuation of the Investment Advisory Agreement and each Sub-Advisory Agreement. The Independent Trustees also reviewed the proposed continuation of the Investment Advisory Agreement and each Sub-Advisory Agreement with independent legal counsel in private sessions at which no representatives of management were present.
In approving the Funds’ Investment Advisory Agreement, the Board considered various factors, among them: (1) the nature, extent and quality of services provided to the Funds, including the personnel providing such services; (2) the Advisor’s compensation and profitability; (3) a comparison of fees and performance with other advisers; (4) economies of scale; and (5) the terms of the Investment Advisory Agreement. The Board’s analysis of these factors is set forth below. The Independent Trustees were advised by independent legal counsel throughout the process.
Nature, Extent and Quality of Advisor Services. The Board considered the level and depth of knowledge of the Advisor, including the professional experience and qualifications of senior personnel. In evaluating the quality of services provided by the Advisor, the Board took into account its familiarity with the Advisor’s senior management through Board meetings, discussions and reports during the preceding year. The Board also took into account the Advisor’s compliance policies and procedures. The quality of administrative and other services, including the Advisor’s role in coordinating the activities of the Funds’ other service providers, was also considered. The Board also considered the Advisor’s relationship with its affiliates and the resources available to them, as well as any potential conflicts of interest.
The Board discussed the Advisor’s effectiveness in monitoring the performance of each Sub-Advisor, including those that were affiliates of the Advisor, and the Advisor’s timeliness in responding to performance issues. The Board considered the Advisor’s process for monitoring each of the Sub-Advisors, which includes an examination of both qualitative and quantitative elements of the Sub-Advisor’s organization, personnel, procedures, investment discipline, infrastructure and performance. The Board considered that the Advisor conducts regular on-site compliance visits with each Sub-Advisor, during which the Advisor examines a wide variety of factors, such as the financial condition of the Sub-Advisor, the quality of the Sub-Advisor’s systems, the effectiveness of the Sub-Advisor’s disaster recovery programs, trade allocation and execution procedures, compliance with the Sub-Advisor’s policies and procedures, results of regulatory examinations and any other factors that might affect the quality of services that the Sub-Advisor provides to the applicable Fund(s). The Board noted that the Advisor’s compliance monitoring processes also include quarterly reviews of compliance reports, and that any issues arising from such reports and the Advisor’s compliance visits to the Sub-Advisors are reported to the Board.
Other Items (Unaudited) (Continued)
The Trustees concluded that they were satisfied with the nature, extent and quality of services provided to each Fund by the Advisor under the Investment Advisory Agreement.
Advisor’s Compensation and Profitability. The Board took into consideration the financial condition and profitability of the Advisor and its affiliates (including the Sub-Advisor to certain of the Funds) and the direct and indirect benefits derived by the Advisor and its affiliates from the Advisor’s relationship with the Funds. The information considered by the Board included operating profit margin information for the Advisor’s business as a whole. The Board noted that the Advisor had waived a portion of advisory fees and administrative fees and/or reimbursed expenses in order to limit certain Funds net operating expenses. The Board also noted that the Advisor pays the Sub-Advisors’ sub-advisory fees out of the advisory fees the Advisor receives from the Funds. The Board reviewed the profitability of the Advisor’s relationship with the Funds both before and after tax expenses, and also considered whether the Advisor has the financial wherewithal to continue to provide services to the Funds, noting the ongoing commitment of the Advisor’s parent company with respect to providing support and resources as needed. The Board also noted that the Advisor derives benefits to its reputation and other benefits from its association with the Funds. The Board also considered that affiliates of the Advisor may benefit from certain indirect tax benefits, including those relating to dividend received deductions.
The Board recognized that the Advisor should be entitled to earn a reasonable level of profits in exchange for the level of services it provides to each Fund and the entrepreneurial risk that it assumes as Advisor. Based upon their review, the Trustees concluded that the Advisor’s and its affiliates’ level of profitability, if any, from their relationship with each Fund was reasonable and not excessive.
Expenses and Performance. The Board compared the respective advisory fees and total expense ratios for each of the Funds with various comparative data, including the median and average advisory fees and total expense ratios of each Fund’s respective peer group. The Board also considered, among other data, the Funds’ respective performance results during the six-month, twelve-month and thirty-six-month periods ended June 30, 2014 and noted that the Board reviews on a quarterly basis detailed information about each Fund’s performance results, portfolio composition and investment strategies. The Board also took into account current market conditions and their effect on the Funds’ performance.
The Board also considered the effect of each Fund’s growth and size on its performance and expenses. The Board noted that the Advisor had waived a portion of the fees and/or reimbursed expenses of certain Funds in order to reduce those Funds’ respective operating expenses to targeted levels. The Board noted that the sub-advisory fees under the Sub-Advisory Agreement with respect to each Fund were paid by the Advisor out of the advisory fees it receives from the Fund and considered the impact of such sub-advisory fees on the profitability of the Advisor. In reviewing the respective expense ratios and performance of each of the Funds, the Board also took into account the nature, extent and quality of the services provided to the Funds by the Advisor and its affiliates.
The Board considered, among other data, the specific factors and related conclusions set forth below with respect to each Fund:
Touchstone Baron Small Cap Growth Fund. The Fund’s advisory fee and total expense ratio (net of applicable expense waivers and reimbursements) were above the median of its peer group. The Board noted that the Advisor was currently waiving a portion of the Fund’s fees. The Board took into account management’s discussion of the Fund’s expenses, including the impact that the relatively small size of the Fund has upon expenses. The Fund’s performance for the six- and twelve-month periods ended June 30, 2014 was in the 5th quintile of its peer group. The Fund’s performance for the thirty-six-month period ended June 30, 2014 was in the 1st quintile of its peer group. The Board noted management’s discussion of the Fund’s more recent performance and management’s continued close monitoring of the Fund’s performance. Based upon their review, the Trustees concluded that the Fund’s overall performance was satisfactory relative to the performance of funds with similar investment
Other Items (Unaudited) (Continued)
objectives and relevant indices, and that the advisory fee was reasonable in light of the services received by the Fund from the Advisor and the other factors considered.
Touchstone Active Bond Fund. The Fund’s advisory fee and total expense ratio (net of applicable expense waivers and reimbursements) were above the median of its peer group. The Board took into account management’s discussion of the Fund’s expenses, including the impact that the relatively small size of the Fund has upon expenses. The Fund’s performance for the six-month period ended June 30, 2014 was in the 4th quintile of its peer group. The Fund’s performance for the twelve- and thirty-six-month periods ended June 30, 2014 was in the 3rd quintile of its peer group. The Board noted management’s discussion of the Fund’s recent performance. Based upon their review, the Trustees concluded that the Fund’s overall performance was satisfactory relative to the performance of funds with similar investment objectives and relevant indices, and that the advisory fee was reasonable in light of the services received by the Fund from the Advisor and the other factors considered.
Touchstone High Yield Fund. The Fund’s advisory fee and total expense ratio (net of applicable expense waivers and reimbursements) were below the median and above the median, respectively, of its peer group. The Board noted that the Advisor was currently waiving a portion of the Fund’s fees. The Board took into account management’s discussion of the Fund’s expenses, including the impact that the relatively small size of the Fund has upon expenses. The Fund’s performance for the six- and thirty-six-month periods ended June 30, 2014 was in the 3rd quintile of its peer group. The Fund’s performance for the twelve-month period ended June 30, 2014 was in the 4th quintile of its peer group. The Board noted management’s discussion of the Fund’s performance, particularly in view of current market conditions. Based upon their review, the Trustees concluded that the Fund’s overall performance was satisfactory relative to the performance of funds with similar investment objectives and relevant indices, and that the advisory fee was reasonable in light of the services received by the Fund from the Advisor and the other factors considered.
Touchstone Large Cap Core Equity Fund. The Fund’s advisory fee and total expense ratio (net of applicable expense waivers and reimbursements) were at the median and above the median, respectively, of its peer group. The Board noted that the Advisor was currently waiving a portion of the Fund’s fees. The Fund’s performance for the six-month period ended June 30, 2014 was in the 1st quintile of its peer group. The Fund’s performance for the twelve-month period ended June 30, 2014 was in the 2nd quintile of its peer group. The Fund’s performance for the same thirty-six-month period was in the 3rd quintile of its peer group. Based upon their review, the Trustees concluded that the Fund’s overall performance was satisfactory relative to the performance of funds with similar investment objectives and relevant indices, and that the advisory fee was reasonable in light of the services received by the Fund from the Advisor and the other factors considered.
Touchstone Mid Cap Growth Fund. The Fund’s advisory fee and total expense ratio (net of applicable expense waivers and reimbursements) were at the median and above the median, respectively, of its peer group. The Board noted that the Advisor was currently waiving a portion of the Fund’s fees. The Board took into account management’s discussion of the Fund’s expenses, including the impact that the relatively small size of the Fund has upon expenses. The Fund’s performance for the six- and twelve-month periods ended June 30, 2014 was in the 1st quintile of its peer group, and the Fund’s performance for the thirty-six-month period ended June 30, 2014 was in the 3rd quintile of its peer group. Based upon their review, the Trustees concluded that the Fund’s overall performance was satisfactory relative to the performance of funds with similar investment objectives and relevant indices, and that the advisory fee was reasonable in light of the services received by the Fund from the Advisor and the other factors considered.
Touchstone Money Market Fund. The Fund’s advisory fee and total expense ratio (net of applicable expense waivers and reimbursements) were below the median and at the median, respectively, of its peer group. The Board noted that the Advisor was currently waiving a portion of the Fund’s fees. The Fund performed above its peer group average for the period ended September 30, 2014, placing in the 25th and 50th percentiles of
Other Items (Unaudited) (Continued)
Morningstar-rated money market funds, and below the BofA Merrill Lynch U.S. Treasury Bill 3-month Index for the same periods. The Board noted management’s plans with respect to the Fund. Based upon their review, the Trustees concluded that the Fund’s overall performance was satisfactory relative to the performance of funds with similar investment objectives and relevant indices, and that the advisory fee was reasonable in light of the high quality of services received by the Fund from the Advisor and the other factors considered.
Touchstone Third Avenue Value Fund. The Fund’s advisory fee and total expense ratio (net of applicable expense waivers and reimbursements) were below the median and above the median, respectively, of its peer group. The Board noted that the Advisor was currently waiving a portion of the Fund’s fees. The Fund’s performance for the six-month period ended June 30, 2014 was in the 3rd quintile of its peer group. The Fund’s performance for the twelve-month period ended June 30, 2014 was in the 2nd quintile of its peer group and the Fund’s performance for the thirty-six-month period ended June 30, 2014 was in the 4th quintile of its peer group. The Board noted management’s discussion of the Fund’s performance and management’s continued close monitoring of the Fund’s performance. Based upon their review, the Trustees concluded that the Fund’s overall performance was satisfactory relative to the performance of funds with similar investment objectives and relevant indices, and that the advisory fee was reasonable in light of the services received by the Fund from the Advisor and the other factors considered.
Touchstone Conservative ETF Fund. The Fund’s advisory fee and total expense ratio (net of applicable expense waivers and reimbursements) were above the median and below the median, respectively, of its peer group. The Board noted that the Advisor was currently waiving a portion of the Fund’s fees. The Fund’s performance for the six-month period ended June 30, 2014 was in the 5th quintile of its peer group. The Fund’s performance for the twelve- and thirty-six-month periods ended June 30, 2014 was in the 3rd quintile of its peer group. The Board noted management’s discussion of the Fund’s performance, including both its recent and longer-term performance, and management’s continued close monitoring of the Fund’s performance. Based upon their review, the Trustees concluded that the Fund’s overall performance was satisfactory relative to the performance of funds with similar investment objectives and relevant indices, and that the advisory fee was reasonable in light of the services received by the Fund from the Advisor and the other factors considered.
Touchstone Moderate ETF Fund. The Fund’s advisory fee and total expense ratio (net of applicable expense waivers and reimbursements) were below the median of its peer group. The Board noted that the Advisor was currently waiving a portion of the Fund’s fees. The Fund’s performance for the six-, twelve- and thirty-six-month periods ended June 30, 2014 was in the 3rd quintile of its peer group. The Board took into account management’s discussion of the Fund’s performance. Based upon their review, the Trustees concluded that the Fund’s overall performance was satisfactory relative to the performance of funds with similar investment objectives and relevant indices, and that the advisory fee was reasonable in light of the services received by the Fund from the Advisor and the other factors considered.
Touchstone Aggressive ETF Fund. The Fund’s advisory fee and total expense ratio (net of applicable expense waivers and reimbursements) were at the median and below the median, respectively, of its peer group. The Board noted that the Advisor was currently waiving a portion of the Fund’s fees. The Fund’s performance for the six- and twelve-month periods ended June 30, 2014 was in the 3rd quintile of its peer group. The Fund’s performance for the thirty-six-month period ended June 30, 2014 was in the 2nd quintile of its peer group. Based upon their review, the Trustees concluded that the Fund’s overall performance was satisfactory relative to the performance of funds with similar investment objectives and relevant indices and that the advisory fee was reasonable in light of the services received by the Fund from the Advisor and the other factors considered.
Economies of Scale. The Board considered the effect of each Fund’s current size and potential growth on its performance and expenses. The Board took into account management’s discussion of the Funds’ advisory fee structure. The Board considered the effective advisory fees under the Investment Advisory Agreement as a percentage
Other Items (Unaudited) (Continued)
of assets at different asset levels and possible economies of scale that might be realized if the assets of each Fund increase. The Board noted that the advisory fee schedules for some of the Funds contain breakpoints that would reduce the respective advisory fee rate on assets above specified levels as the respective Fund’s assets increased and considered the necessity of adding breakpoints with respect to the Funds that did not currently have such breakpoints in their advisory fee schedules. The Board determined that adding breakpoints at specified levels to the advisory fee schedule of each Fund that currently did not have such breakpoints was not appropriate at that time. The Board also noted that if a Fund’s assets increase over time, the Fund might realize other economies of scale if assets increase proportionally more than certain other expenses. The Board also considered the fact that, under the Investment Advisory Agreement, the advisory fee payable to the Advisor by a Fund was reduced by the total sub-advisory fee paid by the Advisor to the Fund’s Sub-Advisor.
Conclusion. In considering the renewal of the Funds’ Investment Advisory Agreement, the Board, including the Independent Trustees, did not identify any single factor as controlling, and each Trustee may have attributed different weights to the various factors. The Trustees evaluated all information available to them on a Fund-by-Fund basis, and their determinations were made separately with respect to each Fund. The Board reached the following conclusions regarding the Funds’ Investment Advisory Agreement with the Advisor, among others: (a) the Advisor demonstrated that it possesses the capability and resources to perform the duties required of it under the Investment Advisory Agreement; (b) the Advisor maintains an appropriate compliance program; (c) the overall performance of each Fund is satisfactory relative to the performance of funds with similar investment objectives and relevant indices; and (d) each Fund’s advisory fee is reasonable in light of the services received by the Fund from the Advisor and the other factors considered. Based on their conclusions, the Trustees determined with respect to each Fund that continuation of the Investment Advisory Agreement was in the best interests of the Fund and its shareholders.
In approving the applicable Funds’ respective Sub-Advisory Agreements, the Board considered various factors with respect to each Fund and the applicable Sub-Advisory Agreement, among them: (1) the nature, extent and quality of services provided to the Fund, including the personnel providing such services; (2) the Sub-Advisor’s compensation; (3) a comparison of the sub-advisory fee and performance with other advisers; and (4) the terms of the Sub-Advisory Agreement. The Board’s analysis of these factors is set forth below. The Independent Trustees were advised by independent legal counsel throughout the process.
Nature, Extent and Quality of Services Provided; Investment Personnel. The Board considered information provided by the Advisor regarding the services provided by each Sub-Advisor, including information presented periodically throughout the previous year. The Board noted the affiliation of the Sub-Advisor to certain of the Funds with the Advisor, noting any potential conflicts of interest. The Board also noted that, on a periodic basis, the Board meets with portfolio managers of the Sub-Advisors to discuss their respective performance and investment processes and strategies. The Board considered each Sub-Advisor’s level of knowledge and investment style. The Board reviewed the experience and credentials of the applicable investment personnel who are responsible for managing the investment of portfolio securities with respect to the Funds. The Board also noted each Sub-Advisor’s brokerage practices.
Sub-Advisor’s Compensation, Profitability and Economies of Scale. The Board also took into consideration the financial condition of each Sub-Advisor and any indirect benefits derived by each Sub-Advisor and its affiliates from the Sub-Advisor’s relationship with the Funds. In considering the profitability to each Sub-Advisor of its relationship with the Funds, the Board noted the undertaking of the Advisor to maintain expense limitations for the Funds and also noted that the sub-advisory fees under the Sub-Advisory Agreements were paid by the Advisor out of the advisory fees that it receives under the Investment Advisory Agreement and in addition, with respect to the unaffiliated Sub-Advisors, are negotiated at arm’s length. As a consequence, the profitability to each Sub-Advisor of its relationship with a Fund was not a substantial factor in the Board’s deliberations. For similar reasons, the Board did not consider the potential economies of scale in each Sub-Advisor’s management
Other Items (Unaudited) (Continued)
of the applicable Fund to be a substantial factor in its consideration, although the Board noted that the sub-advisory fee schedule for some of the Funds contained breakpoints that would reduce the sub-advisory fee rate on assets above specified levels as the applicable Fund’s assets increased.
Sub-Advisory Fees and Fund Performance. The Board considered that each Fund pays an advisory fee to the Advisor and that the Advisor pays the sub-advisory fee to the Sub-Advisor out of the advisory fee it receives from the respective Fund. The Board also compared the sub-advisory fees paid by the Advisor to fees charged by each Sub-Advisor to manage comparable institutional separate accounts. The Board considered the amount retained by the Advisor and the sub-advisory fee paid to each Sub-Advisor with respect to the various services provided by the Advisor and the Sub-Advisor. The Board also noted that the Advisor negotiated the sub-advisory fee with each of the unaffiliated Sub-Advisors at arm’s length. The Board reviewed the sub-advisory fee for each Fund in relation to various comparative data, including the median and average sub-advisory fees of each Fund’s peer group, and considered the following information:
Touchstone Baron Small Cap Growth Fund. The Fund’s sub-advisory fee was above the median of its peer group. Based upon their review, the Trustees concluded that the sub-advisory fee was reasonable in light of the services received by the Fund from the Sub-Advisor and the other factors considered.
Touchstone Active Bond Fund. The Fund’s sub-advisory fee was above the median of its peer group. Based upon their review, the Trustees concluded that the sub-advisory fee was reasonable in light of the services received by the Fund from the Sub-Advisor and the other factors considered.
Touchstone High Yield Fund. The Fund’s sub-advisory fee was above the median of its peer group. Based upon their review, the Trustees concluded that the sub-advisory fee was reasonable in light of the services received by the Fund from the Sub-Advisor and the other factors considered.
Touchstone Large Cap Core Equity Fund. The Fund’s sub-advisory fee was above the median of its peer group. Based upon their review, the Trustees concluded that the sub-advisory fee was reasonable in light of the services received by the Fund from the Sub-Advisor and the other factors considered.
Touchstone Mid Cap Growth Fund. The Fund’s sub-advisory fee was above the median of its peer group. Based upon their review, the Trustees concluded that the sub-advisory fee was reasonable in light of the services received by the Fund from the Sub-Advisor and the other factors considered.
Touchstone Money Market Fund. The Fund’s sub-advisory fee was below the median of its peer group. Based upon their review, the Trustees concluded that the sub-advisory fee was reasonable in light of the services received by the Fund from the Sub-Advisor.
Touchstone Third Avenue Value Fund. The Fund’s sub-advisory fee was above the median of its peer group. Based upon their review, the Trustees concluded that the sub-advisory fee was reasonable in light of the services received by the Fund from the Sub-Advisor and the other factors considered.
Touchstone Conservative ETF Fund. The Fund’s sub-advisory fee was at the median of its peer group. Based upon their review, the Trustees concluded that the sub-advisory fee was reasonable in light of the services received by the Fund from the Sub-Advisor and the other factors considered.
Touchstone Moderate ETF Fund. The Fund’s sub-advisory fee was below the median of its peer group. Based upon their review, the Trustees concluded that the sub-advisory fee was reasonable in light of the services received by the Fund from the Sub-Advisor and the other factors considered.
Touchstone Aggressive ETF Fund. The Fund’s sub-advisory fee was below the median of its peer group. Based upon their review, the Trustees concluded that the sub-advisory fee was reasonable in light of the services received by the Fund from the Sub-Advisor and the other factors considered.
Other Items (Unaudited) (Continued)
As noted above, the Board considered each Fund’s performance during the six-month, twelve-month and thirty-six-month periods ended June 30, 2014 or September 30, 2014, as applicable, as compared to each Fund’s peer group and noted that the Board reviews on a quarterly basis detailed information about each Fund’s performance results, portfolio composition and investment strategies. The Board noted the Advisor’s expertise and resources in monitoring the performance, investment style and risk-adjusted performance of each Sub-Advisor. The Board was mindful of the Advisor’s ongoing monitoring of each Sub-Advisor’s performance and the measures undertaken by the Advisor to address any underperformance.
Conclusion. In considering the renewal of the Sub-Advisory Agreement with respect to each applicable Fund, the Board, including the Independent Trustees, did not identify any single factor as controlling, and each Trustee may have attributed different weights to the various factors. The Board reached the following conclusions regarding each Sub-Advisory Agreement, among others: (a) the Sub-Advisor is qualified to manage each Fund’s assets in accordance with the Fund’s investment goals and policies; (b) the Sub-Advisor maintains an appropriate compliance program; (c) the performance of each Fund is satisfactory relative to the performance of funds with similar investment objectives and relevant indices; (d) each Fund’s sub-advisory fee is reasonable in light of the services received by the Fund from the Sub-Advisor and the other factors considered; and (e) the Sub-Advisor’s investment strategies are appropriate for pursuing the investment goals of each Fund. Based on its conclusions, the Board determined that approval of the Sub-Advisory Agreement with respect to each applicable Fund was in the best interests of the Fund and its shareholders.
Management of the Trust (Unaudited)
Listed below is required information regarding the Trustees and principal officers of the Trust. The Trust’s Statement of Additional Information includes additional information about the Trustees and is available, without charge, upon request by calling 1.800.543.0407 or by visiting the Touchstone website at www.touchstoneinvestments.com.
Interested Trustees1:
Name Address Age | | Position(s) Held with Trust | | Term of Office And Length of Time Served | | Principal Occupation(s) During Past 5 Years | | Number of Funds Overseen in the Touchstone Fund Complex2 | | Other Directorships Held During the Past 5 Years3 |
| | | | | | | | | | | |
Jill T. McGruder
Touchstone Advisors, Inc.
303 Broadway Suite 1100
Cincinnati, OH 45202
Year of Birth: 1955 | | Trustee and President | | Until retirement at age 75 or until she resigns or is removed Trustee since 1999 | | President and CEO of IFS Financial Services, Inc. (a holding company). | | 49 | | Director of LaRosa’s, Inc. (a restaurant chain) from 1999 to 2011; IFS Financial Services, Inc. (a holding company) from 1999 to the present; Integrity and National Integrity Life Insurance Co. from 2005 to the present; Touchstone Securities (the Trust’s distributor) from 1999 to the present; Touchstone Advisors (the Trust’s investment advisor and administrator) from 1999 to the present; W&S Brokerage Services (a brokerage company) from 1999 to the present; W&S Financial Group Distributors (a distribution company) from 1999 to the present; Every Child Succeeds (a social services company) from 2007 to the present; Taft Museum of Art from 2007 to the present; and YMCA of Greater Cincinnati from 2012 to the present. |
| | | | | | | | | | | |
| Independent Trustees: | | | | | | |
| | | | | | | | | | | |
Phillip R. Cox
c/o Touchstone Advisors, Inc.
303 Broadway Suite 1100
Cincinnati, OH 45202
Year of Birth: 1947 | | Trustee | | Until retirement at age 75 or until he resigns or is removed Trustee since 1999 | | President and Chief Executive Officer of Cox Financial Corp. (a financial services company) from 1971 to the present. | | 49 | | Director of Cincinnati Bell (a communications company) from 1994 to the present; Bethesda Inc. (a hospital) from 2005 to the present; Timken Co. (a manufacturing company) from 2004 to the 2014; TimkenSteel from 2014 to the present; Diebold, Inc. (a technology solutions company) from 2004 to the present; and Ohio Business Alliance for Higher Education and the Economy from 2005 to the present. |
| | | | | | | | | | | |
William C. Gale
c/o Touchstone Advisors, Inc.
303 Broadway Suite 1100
Cincinnati, OH 45202
Year of Birth: 1952 | | Trustee | | Until retirement at age 75 or until he resigns or is removed Trustee since 2013 | | Senior Vice President and Chief Financial Officer (from 2003 to January 2015) of Cintas Corporation (a business services company). | | 49 | | None. |
| | | | | | | | | | | |
Susan J. Hickenlooper, CFA
c/o Touchstone Advisors, Inc.
303 Broadway Suite 1100
Cincinnati, OH 45202
Year of Birth: 1946 | | Trustee | | Until retirement at age 75 or until she resigns or is removed Trustee since 2009 | | Financial Analyst for Impact 100 (charitable organization) from 2012 to 2013. | | 49 | | Trustee of Diocese of Southern Ohio from 2014 to present; and Trustee of Episcopal Retirement Homes Foundation from 1998 to 2011 (a charitable organization). |
Management of the Trust (Unaudited) (Continued)
Independent Trustees (Continued):
Name
Address
Age | | Position(s)
Held with
Trust | | Term of
Office And
Length of
Time Served | | Principal Occupation(s)
During Past 5 Years | | Number
of Funds
Overseen
in the
Touchstone
Fund
Complex2 | | Other
Directorships
Held During the Past 5 Years3 |
| | | | | | | | | | | |
Kevin A. Robie
c/o Touchstone Advisors, Inc.
303 Broadway Suite 1100
Cincinnati, OH 45202
Year of Birth: 1956 | | Trustee | | Until retirement at age 75 or until he resigns or is removed Trustee since 2013 | | Vice President of Portfolio Management at Soin International LLC (a multinational holding company) from 2004 to the present. | | 49 | | Director of Buckeye EcoCare, Inc. (a lawn care company) from 2013 to the present; Trustee of Dayton Region New Market Fund, LLC (a private fund) from 2010 to the present; Trustee of the Entrepreneurs Center, Inc. (a small business incubator) from 2006 to the present; and Director of Interventional Imaging, Inc. (a medical device company) from 2004 to 2011. |
| | | | | | | | | | | |
Edward J. VonderBrink
c/o Touchstone Advisors, Inc.
303 Broadway Suite 1100
Cincinnati, OH 45202
Year of Birth: 1944 | | Trustee | | Until retirement at age 75 or until he resigns or is removed Trustee since 2013 | | Consultant, VonderBrink Consulting LLC from 2000 to the present. | | 49 | | Director of Streamline Health Solutions, Inc. (healthcare IT) from 2006 to the present; Mercy Health from 2013 to the present; Mercy Health Foundation (healthcare nonprofit) from 2008 to the present; and Al Neyer Inc. (a construction company) from 2013 to the present. |
| 1 | Ms. McGruder, as a director of the Advisor and the Trust's Distributor, and an officer of affiliates of the Advisor and the Distributor, is an “interested person” of the Trust within the meaning of Section 2(a)(19) of the 1940 Act. |
| 2 | As of December 31, 2014, the Touchstone Fund Complex consists of 10 variable annuity series of the Trust, 13 series of Touchstone Funds Group Trust, 4 series of Touchstone Investment Trust, 18 series of Touchstone Strategic Trust, 3 series of Touchstone Tax-Free Trust, and 1 series of Touchstone Institutional Funds Trust. |
| 3 | Each Trustee is also a Trustee of Touchstone Institutional Funds Trust, Touchstone Investment Trust, Touchstone Strategic Trust, Touchstone Tax-Free Trust, and Touchstone Funds Group Trust. |
Management of the Trust (Unaudited) (Continued)
The following is a list of the Officers of the Trusts, the length of time served and principal occupations for the past five years.
Principal Officers:
Name
Address
Age | | Position(s)
Held with
Trust1 | | Term of
Office And
Length of
Time Served | | Principal Occupation(s)
During the Past 5 Years |
| | | | | | | |
Jill T. McGruder
Touchstone Advisors, Inc.
303 Broadway Suite 1100
Cincinnati, OH 45202
Year of Birth: 1955 | | President | | Until resignation, removal or disqualification President since 2006 | | See biography above. |
| | | | | | | |
Steven M. Graziano
Touchstone Advisors, Inc.
303 Broadway Suite 1100
Cincinnati, OH 45202
Year of Birth: 1954 | | Vice President | | Until resignation, removal or disqualification Vice President since 2009 | | President of Touchstone Advisors, Inc. |
| | | | | | | |
Timothy D. Paulin
Touchstone Advisors, Inc.
303 Broadway Suite 1100
Cincinnati, OH 45202
Year of Birth: 1963 | | Vice President | | Until resignation, removal or disqualification Vice President since 2010 | | Vice President of Investment Research and Product Management of Touchstone Advisors, Inc.; Director of Product Design of Klein Decisions, Inc. 2003 – 2010. |
| | | | | | | |
Timothy S. Stearns
Touchstone Advisors, Inc.
303 Broadway Suite 1100
Cincinnati, OH 45202
Year of Birth: 1963 | | Chief Compliance Officer | | Until resignation, removal or disqualification Chief Compliance Officer since 2013 | | Chief Compliance Officer of Touchstone Advisors, Inc.; Chief Compliance Officer of Envestnet Asset Management, Inc. (2009 to 2013). |
| | | | | | | |
Terrie A. Wiedenheft
Touchstone Advisors, Inc.
303 Broadway Suite 1100
Cincinnati, OH 45202
Year of Birth: 1962 | | Controller and Treasurer | | Until resignation, removal or disqualification Controller and Treasurer since 2006 | | Senior Vice President, Chief Financial Officer and Chief Operations Officer of IFS Financial Services, Inc. (a holding company). |
| | | | | | | |
Elizabeth R. Freeman
BNY Mellon
201 Washington St., 34th Fl.
Boston, MA 02108
Year of Birth: 1962 | | Secretary | | Until resignation, removal or disqualification Secretary since 2011 | | Managing Director and Senior Counsel of BNY Mellon Investment Servicing (US) Inc. |
| 1 | Each officer also holds the same office with the Trust, Touchstone Institutional Funds Trust, Touchstone Investment Trust, Touchstone Strategic Trust, Touchstone Tax-Free Trust, and Touchstone Institutional Funds Trust. |
This page intentionally left blank.
PRIVACY PROTECTION POLICY
We Respect Your Privacy
Thank you for your decision to invest with us. Touchstone and its affiliates have always placed a high value on the trust and confidence our clients place in us. We believe that confidence must be earned and validated through time. In today’s world, when technology allows the sharing of information at light speeds, trust must be reinforced by our sincere pledge to take the steps necessary to ensure that the information you share with us is treated with respect and confidentiality.
Our Pledge to Our Clients
| · | We collect only the information we need to service your account and administer our business. |
| · | We are committed to keeping your information confidential and we place strict limits and controls on the use and sharing of your information. |
| · | We make every effort to ensure the accuracy of your information. |
We Collect the Following Nonpublic Personal Information About You:
| · | Information we receive from you on or in applications or other forms, correspondence, or conversations, including, but not limited to, your name, address, phone number, social security number, assets, income and date of birth; and |
| · | Information about your transactions with us, our affiliates, or others, including, but not limited to, your account number and balance, payment history, parties to transactions, cost basis information, and other financial information. |
Categories of Information We Disclose and Parties to Whom We Disclose
We do not disclose any nonpublic personal information about our current or former clients to nonaffiliated third parties, except as required or permitted by law.
We Place Strict Limits and Controls on the Use and Sharing of Your Information
| · | We restrict access to nonpublic personal information about you to authorized employees who need the information to administer your business. |
| · | We maintain physical, electronic and procedural safeguards that comply with federal standards to protect this information. |
| · | We do not disclose any nonpublic personal information about our current or former clients to anyone, except as required or permitted by law or as described in this document. |
| · | We will not sell your personal information to anyone. |
We May Provide Information to Service Your Account
Sometimes it is necessary to provide information about you to various companies such as transfer agents, custodians, broker-dealers and marketing service firms to facilitate the servicing of your account. These organizations have a legitimate business need to see some of your personal information in order for us to provide service to you. We may disclose to these various companies the information that we collect as described above. We require that these companies, including our own subsidiaries and affiliates, strictly maintain the confidentiality of this information and abide by all applicable laws. Companies within our corporate family that may receive this information are financial service providers and insurance companies. We do not permit these associated companies to sell the information for their own purposes, and we never sell our customer information.
This policy is applicable to the following affiliated companies: Touchstone Funds Group Trust, Touchstone Investment Trust, Touchstone Strategic Trust, Touchstone Tax-Free Trust, Touchstone Variable Series Trust, Touchstone Institutional Funds Trust, Touchstone Securities, Inc.,* and W&S Brokerage Services, Inc.
* Touchstone Securities, Inc. serves as the underwriter to the Touchstone Funds.
A Member of Western & Southern Financial Group®
The Privacy Protection Policy is not part of the Annual Report.
TSF-1006-TVST-AR-1412
Item 2. Code of Ethics.
| (a) | The registrant, as of the end of the period covered by this report, has adopted a code of ethics that applies to the registrant’s principal executive officer, principal financial officer, principal accounting officer or controller, or persons performing similar functions, regardless of whether these individuals are employed by the registrant or a third party. |
| (c) | There have been no amendments, during the period covered by this report, to a provision of the code of ethics that applies to the registrant’s principal executive officer, principal financial officer, principal accounting officer or controller, or persons performing similar functions, regardless of whether these individuals are employed by the registrant or a third party, and that relates to any element of the code of ethics description. |
| (d) | The registrant has not granted any waivers, including an implicit waiver, from a provision of the code of ethics that applies to the registrant’s principal executive officer, principal financial officer, principal accounting officer or controller, or persons performing similar functions, regardless of whether these individuals are employed by the registrant or a third party, that relates to one or more of the items set forth in paragraph (b) of this item’s instructions. |
Item 3. Audit Committee Financial Expert.
The registrant’s Board of Trustees has determined that the registrant has at least one audit committee financial expert serving on its audit committee. Mr. William Gale is the registrant’s audit committee financial expert and is an independent trustee within the meaning of the Investment Company Act of 1940, as amended (the “1940 Act”).
Item 4. Principal Accountant Fees and Services.
Audit Fees
| (a) | Audit fees for Touchstone Variable Series Trust totaled $130,300 and $130,300 in fiscal 2014 and 2013, respectively, including fees associated with the annual audits and filings of Form N-1A and Form N-SAR. |
Audit-Related Fees
| (b) | Audit-related fees totaled $0 and $0 in fiscal 2014 and 2013, respectively. |
Tax Fees
| (c) | Fees for tax compliance services totaled $26,600 and $30,500 in fiscal 2014 and 2013, respectively. Fees relate to the preparation of federal income tax returns and review of capital gains distribution calculations. |
All Other Fees
| (d) | The aggregate fees billed in each of the last two fiscal years for products and services provided by the principal accountant, other than the services reported in paragraphs (a) through (c) of this Item are $2,352 for 2014 and $5,147 for 2013, respectively. The fees are related to the PFIC Analyzer and Global Withholding Tax Reporter subscriptions. |
| (e)(1) | Disclose the audit committee's pre-approval policies and procedures described in paragraph (c)(7) of Rule 2-01 of Regulation S-X. |
The Audit Committee’s pre-approval policies describe the types of audit, audit-related, tax and other services that have the general pre-approval of the Audit Committee. The pre-approval policies provide that annual audit service fees, tax services not specifically granted pre-approval, services exceeding pre-approved cost levels and other services that have not received general pre-approval will be subject to specific pre-approval by the Audit Committee. The pre-approval policies further provide that the Committee may grant general pre-approval to other audit services (statutory audits and services associated with SEC registration statements, periodic reports and other documents filed with the SEC or other documents issued in connection with securities offerings), audit-related services (accounting consultations related to accounting, financial reporting or disclosure matters not classified as “audit services,” assistance with understanding and implementing new accounting and financial reporting guidance from rulemaking authorities, agreed-upon or expanded audit procedures related to accounting and/or billing records required to respond to or comply with financial, accounting or regulatory reporting matters and assistance with internal control reporting requirements under Form N-SAR and Form N-CSR), tax services that have historically been provided by the auditor that the Committee believes would not impair the independence of the auditor and are consistent with the SEC’s rules on auditor independence and permissible non-audit services classified as “all other services” that are routine and recurring services.
| (e)(2) | All services described in paragraphs (c) through (d) of Item 4 were approved by the Audit Committee. Not applicable for paragraph (b) of Item 4. |
| (f) | The percentage of hours expended on the principal accountant's engagement to audit the registrant's financial statements for the most recent fiscal year that were attributed to work performed by persons other than the principal accountant's full-time, permanent employees was less than fifty percent. |
| (g) | The aggregate non-audit fees for Touchstone Variable Series Trust and certain entities*, totaled approximately $28,952 and $35,647, in 2014 and 2013, respectively. |
* These include the advisors (excluding sub-advisors) and any entity controlling, controlled by or under common control with the advisors that provides ongoing services to the registrant (Funds).
| (h) | The registrant's audit committee of the board of trustees has considered whether the provision of non-audit services that were rendered to the registrant's investment adviser (not including any sub-adviser whose role is primarily portfolio management and is subcontracted with or overseen by another investment adviser), and any entity controlling, controlled by, or under common control with the investment adviser that provides ongoing services to the registrant that were not pre-approved pursuant to paragraph (c)(7)(ii) of Rule 2-01 of Regulation S-X is compatible with maintaining the principal accountant's independence. |
Item 5. Audit Committee of Listed Registrants.
Not applicable.
Item 6. Investments.
| (a) | Schedule of Investments in securities of unaffiliated issuers as of the close of the reporting period is included as part of the report to shareholders filed under Item 1 of this form. |
Item 7. Disclosure of Proxy Voting Policies and Procedures for Closed-End Management Investment Companies.
Not applicable.
Item 8. Portfolio Managers of Closed-End Management Investment Companies.
Not applicable.
Item 9. Purchases of Equity Securities by Closed-End Management Investment Company and Affiliated Purchasers.
Not applicable.
Item 10. Submission of Matters to a Vote of Security Holders.
There have been no material changes to the procedures by which the shareholders may recommend nominees to the registrant’s board of trustees, where those changes were implemented after the registrant last provided disclosure in response to the requirements of Item 407(c)(2)(iv) of Regulation S-K (17 CFR 229.407) (as required by Item 22(b)(15) of Schedule 14A (17 CFR 240.14a-101)), or this Item.
Item 11. Controls and Procedures.
| (a) | The registrant’s principal executive and principal financial officers, or persons performing similar functions, have concluded that the registrant’s disclosure controls and procedures (as defined in Rule 30a-3(c) under the Investment Company Act of 1940, as amended (the “1940 Act”) (17 CFR 270.30a-3(c))) are effective, as of a date within 90 days of the filing date of the report that includes the disclosure required by this paragraph, based on their evaluation of these controls and procedures required by Rule 30a-3(b) under the 1940 Act (17 CFR 270.30a-3(b)) and Rules 13a-15(b) or 15d-15(b) under the Securities Exchange Act of 1934, as amended (17 CFR 240.13a-15(b) or 240.15d-15(b)). |
| (b) | There were no changes in the registrant’s internal control over financial reporting (as defined in Rule 30a-3(d) under the 1940 Act (17 CFR 270.30a-3(d))) that occurred during the registrant’s second fiscal quarter of the period covered by this report that has materially affected, or is reasonably likely to materially affect, the registrant’s internal control over financial reporting. |
Item 12. Exhibits.
| (a)(1) | Code of ethics, or any amendment thereto, that is the subject of disclosure required by Item 2 is attached hereto. |
| (a)(2) | Certifications pursuant to Rule 30a-2(a) under the 1940 Act and Section 302 of the Sarbanes-Oxley Act of 2002 are attached hereto. |
| (b) | Certifications pursuant to Rule 30a-2(b) under the 1940 Act and Section 906 of the Sarbanes- Oxley Act of 2002 are attached hereto. |
(12.other) Not applicable.
SIGNATURES
Pursuant to the requirements of the Securities Exchange Act of 1934 and the Investment Company Act of 1940, the registrant has duly caused this report to be signed on its behalf by the undersigned, thereunto duly authorized.
| (Registrant) | Touchstone Variable Series Trust |
| By (Signature and Title)* | /s/ Jill T. McGruder |
| | Jill T. McGruder, President |
| | (principal executive officer) |
Pursuant to the requirements of the Securities Exchange Act of 1934 and the Investment Company Act of 1940, this report has been signed below by the following persons on behalf of the registrant and in the capacities and on the dates indicated.
| By (Signature and Title)* | /s/ Jill T. McGruder |
| | Jill T. McGruder, President |
| | (principal executive officer) |
| By (Signature and Title)* | /s/ Terrie A. Wiedenheft |
| | Terrie A. Wiedenheft, Controller and Treasurer |
| | (principal financial officer) |
* Print the name and title of each signing officer under his or her signature.
