UNITED STATES
SECURITIES AND EXCHANGE COMMISSION
Washington, D.C. 20549
FORM N-CSR
CERTIFIED SHAREHOLDER REPORT OF REGISTERED MANAGEMENT INVESTMENT COMPANIES
Investment Company Act file number 811-08416
Touchstone Variable Series Trust
(Exact name of registrant as specified in charter)
303 Broadway, Suite 1100
Cincinnati, Ohio 45202-4203
(Address of principal executive offices) (Zip code)
Jill T. McGruder
303 Broadway, Suite 1100
Cincinnati, Ohio 45202-4203
(Name and address of agent for service)
Registrant's telephone number, including area code: 800-638-8194
Date of fiscal year end: December 31
Date of reporting period: December 31, 2012
Form N-CSR is to be used by management investment companies to file reports with the Commission not later than 10 days after the transmission to stockholders of any report that is required to be transmitted to stockholders under Rule 30e-1 under the Investment Company Act of 1940 (17 CFR 270.30e-1). The Commission may use the information provided on Form N-CSR in its regulatory, disclosure review, inspection, and policymaking roles.
A registrant is required to disclose the information specified by Form N-CSR, and the Commission will make this information public. A registrant is not required to respond to the collection of information contained in Form N-CSR unless the Form displays a currently valid Office of Management and Budget ("OMB") control number. Please direct comments concerning the accuracy of the information collection burden estimate and any suggestions for reducing the burden to Secretary, Securities and Exchange Commission, 100 F Street, NE, Washington, DC 20549. The OMB has reviewed this collection of information under the clearance requirements of 44 U.S.C. § 3507.
Item 1. Reports to Stockholders.
The Report to Shareholders is attached herewith.
December 31, 2012
Annual Report
Touchstone Variable Series Trust
Touchstone Baron Small Cap Growth Fund
Touchstone Core Bond Fund
Touchstone High Yield Fund
Touchstone Large Cap Core Equity Fund
Touchstone Mid Cap Growth Fund
Touchstone Money Market Fund
Touchstone Third Avenue Value Fund
Touchstone Aggressive ETF Fund
Touchstone Conservative ETF Fund
Touchstone Enhanced ETF Fund
Touchstone Moderate ETF Fund

Table of Contents
| | Page |
| Letter from the President | 3 |
| Management's Discussion of Fund Performance (Unaudited) | 4 - 30 |
| Tabular Presentation of Portfolios of Investments (Unaudited) | 31 - 32 |
| Portfolio of Investments: | |
| Touchstone Baron Small Cap Growth Fund | 33 |
| Touchstone Core Bond Fund | 35 |
| Touchstone High Yield Fund | 42 |
| Touchstone Large Cap Core Equity Fund | 46 |
| Touchstone Mid Cap Growth Fund | 48 |
| Touchstone Money Market Fund | 50 |
| Touchstone Third Avenue Value Fund | 53 |
| Touchstone Aggressive ETF Fund | 55 |
| Touchstone Conservative ETF Fund | 56 |
| Touchstone Enhanced ETF Fund | 57 |
| Touchstone Moderate ETF Fund | 58 |
| Statements of Assets and Liabilities | 60 - 61 |
| Statements of Operations | 62 - 63 |
| Statements of Changes in Net Assets | 64 - 67 |
| Financial Highlights | 68 - 73 |
| Notes to Financial Statements | 74 - 85 |
| Report of Independent Registered Public Accounting Firm | 86 |
| Other Items (Unaudited) | 87 - 95 |
| Management of the Trust (Unaudited) | 96 - 98 |
| Privacy Protection Policy | 99 |
Letter from the President
Dear Shareholder:
We are pleased to provide you with the Touchstone Variable Series Trust Annual Report. Inside you will find key financial information, as well as manager commentaries for the Funds, for the twelve months ended December 31, 2012.
The year 2012 was a remarkable one for stock markets around the globe with substantial liquidity driving above average returns in the U.S., developed non-U.S. and select developing markets. Although volatility and fluctuating economic conditions, as well as consumer confidence, persisted throughout the year, financial markets managed to exceed investors’ low expectations. The advance came despite the “Fiscal Cliff ” in the U.S., the damage from Hurricane Sandy in October, an economic deceleration in China and continued weakness out of Europe. Additional monetary easing and an increased investor appetite for risk also helped to drive the rally. In the U.S., housing slowly improved throughout the year, with home values reportedly increasing year-over-year for the first time since 2006 and inventories remained below historical levels, suggesting that prices would continue to rise.
From a market capitalization and style perspective, mid cap stocks outperformed both large- and small-capitalizations, while value outpaced growth, and emerging markets’ performance surpassed non-U.S. developed markets. Within fixed income markets, high yield bonds and corporate bonds significantly outperformed U.S. Treasuries. Interest rates remained low and the Federal Reserve announced that it would keep rates low, at least until unemployment drops to 6.5 percent and inflation projections are no more than 2.5 percent. This replaced the Fed’s earlier view that rates would stay near zero at least through the middle of 2015.
We continue to believe that diversification is essential to balancing risk and return. We recommend that you continue to work with your financial professional to employ a sound asset allocation strategy that invests in a combination of stock, bond and money market mutual funds to help keep your financial strategy on course. It is critical to maintain a long-term approach to gain the full potential benefits of investing.
Touchstone is committed to helping investors achieve their financial goals by providing access to a distinctive selection of institutional asset managers who are known and respected for proficiency in their specific areas of expertise. We hope that you will find the enclosed commentaries helpful.
We greatly appreciate your continued support. Thank you for including Touchstone as part of your investment plan.
Sincerely,

Jill T. McGruder
President
Touchstone Variable Series Trust
Management's Discussion of Fund Performance (Unaudited)
Touchstone Baron Small Cap Growth Fund
Sub-Advised by BAMCO, Inc.
Investment Philosophy
The Touchstone Baron Small Cap Growth Fund primarily invests in common stocks of small-sized growth companies. The Fund’s sub-advisor, BAMCO, Inc. (“BAMCO”), seeks securities that it believes have (1) favorable price to value characteristics, are well managed, have significant long-term growth prospects and have significant barriers to competition; and (2) the potential to increase in value at least 100 percent over the next four or five years. Securities are selected for their capital appreciation potential and investment income is not a consideration in BAMCO’s stock selection process.
Fund Performance
The Touchstone Baron Small Cap Growth Fund outperformed its benchmark, the Russell 2000® Growth Index, for the 12-month period ended December 31, 2012. The Fund’s total return was 19.17 percent while the return of the benchmark was 14.59 percent for the 12-month period ended December 31, 2012.
Market Environment
In 2012, economic conditions remained uncertain and markets were volatile, yet the economy did show positive signs of recovery. The year started on an encouraging note, with uncertainty from Europe and Asia following in the second quarter, along with seesawing consumer confidence. In the third quarter, markets rebounded, as we saw a drop in unemployment and an increase in consumer confidence and housing starts. During the fourth quarter, equities sold off sharply following President Obama’s re-election; they later recovered on optimism that a bipartisan deal could be reached to avert the fiscal cliff, promising economic reports and positive signs on financial stabilization in Europe.
Portfolio Review
The Fund’s investment process hones in on secular growth themes or trends capable of driving strong multi-year growth, seeking companies that are believed to be well run by visionary management teams, with a differentiated long-term strategy, significant competitive advantages, and dominant positions with the opportunity for market share gains. These companies possess what we believe to be strong balance sheets with the ability to reinvest in their businesses to earn high returns.
During the year, the Fund’s favorable stock selection effect and, to a lesser extent, its sector allocations, contributed to relative performance. The Health Care, Industrials, and Consumer Discretionary sectors were the largest contributors to relative and absolute performance for the year.
A combination of strong stock selection and an overweight within the Consumer Discretionary sector made it the top contributing sector. Shares of Lumber Liquidators Holdings, Inc., the leading specialty retailer of hardwood flooring, surged during 2012, after reporting exceptional momentum in its business. This strong move coincided with significant strengthening in the U.S. housing and remodeling markets, as well as the positive traction from merchandizing, sourcing, and advertising initiatives. Another contributor was Dick’s Sporting Goods, Inc., the country’s largest sporting goods retailer, with its shares increasing for the year. The company has grown sales consistently through strong new store productivity, positive same store sales, and improved e-commerce business. Margins have also expanded as a result of additional focus on premium suppliers and additional private label and private branded merchandise. Other notable contributors to relative results in the sector were distributor LKQ Corp. and casino operator Ameristar Casinos, Inc. The largest stock detractor in the sector in 2012 was DeVry, Inc. The company is a provider of diversified post-secondary education emphasizing business, technology, and healthcare. DeVry is experiencing enrollment declines as students, discouraged by
Management's Discussion of Fund Performance (Unaudited) (Continued)
prolonged high unemployment, defer their decision to enroll in college. The lower student count and continued investment spending in growth areas is driving negative operating leverage. Longer term, we are positive on DeVry given its focus on areas which we believe should experience long-term job growth and its solid history of graduate placement.
In the Industrials sector, shares of Generac Holdings, Inc., a leading designer and manufacturer of standby and portable generators for the residential, industrial, and commercial markets, increased sharply during the year, contributing to performance. This was due to a rapid rise in sales due to increased awareness and adoption of its temporary power solutions, which was driven by strong storm activity and corresponding power outages. In addition, Generac paid a dividend to shareholders as a result of a leveraged recapitalization. Strength within the sector was also attributable to the Fund’s investments in industrial machinery stocks, led by Colfax Corp., a diversified global industrial manufacturing and engineering company that provides gas and fluid handling technology products, and Valmont Industries, Inc., a diversified industrial company that produces fabricated metal products for infrastructure. Shares of Colfax outperformed in 2012 as the company completed the acquisition of Charter PLC. We believe the acquisition could create significant value due to the substantial potential for operating margin improvement.
In the Health Care sector, the Fund’s largest contributor to performance was AMERIGROUP Corp., a leading Medicaid HMO. AMERIGROUP’s revenue grew from $1.6 billion in 2003, when the Fund first invested in the company, to $6 billion in 2011. In July, WellPoint, Inc. bid for AMERIGROUP, at a 43 percent premium to the prior day’s close. Subsequently, the position was sold. Another contributor to relative results in the sector was Community Health Systems, Inc. ITC Holdings Corp., the Fund’s only holding in the Utilities sector, outperformed for the year; however, the Fund’s larger exposure to the sector, one of the worst performers in the benchmark, was the largest detractor from relative performance.
The Energy sector was another detractor to Fund performance, led by CARBO Ceramics, Inc. and SM Energy Co. CARBO is the leading supplier of ceramic proppant, which is used in hydraulic fracturing. CARBO’s share price suffered through the first three quarters of the year from a series of downward earnings estimate revisions related to declining demand as drilling shifted from gas to oil, an oversupply of proppants from a flood of Chinese imports, and higher than usual logistics expenses. We believe most of these issues are behind the company, and the stock price rebounded in the quarter. SM Energy is an exploration and productions (E&P) company, with operations largely focused on the Eagle Ford shale and Williston Basin in the U.S. SM Energy’s shares declined in 2012 as a result of several factors. Specifically, the company was conservative in its 2011 reserve bookings; infrastructure challenges caused lower than expected production in the second quarter; and natural gas liquids’ prices declined sharply, hurting the perceived value of SM Energy’s assets. These factors have either been rectified or, we believe will be shortly, and SM Energy’s shares remain valued below our net asset value (NAV) estimates.
Booz Allen Hamilton Holdings Corp., a provider of high-end government Information Technolgy services, and Choice Hotels International Inc., the largest franchisor of hotels in the U.S., distributed special cash dividends during the year due to each company generating strong free-cash-flows.
We believe we have been successful because we invest for the long-term and are less focused on short-term macro events. New purchases accounted for about 8 percent of net assets and complete sales accounted for about 22 percent of net assets at year end.
Outlook
We continue to believe that stock market valuations are attractive. U.S. interest rates remain near historically low levels, and the fixed income markets offer limited inflation-adjusted returns. Investors continue to hold substantial sums in cash, which we believe will eventually be deployed into equities. Regulators are increasing
Management's Discussion of Fund Performance (Unaudited) (Continued)
their efforts to make our financial markets function more efficiently and fairly. We believe this will help restore the faith of individual and institutional investors in capital markets.
Although growth in the U.S. during the next few years will probably be slower than in prior decades, we believe that the competitive advantage of our country’s low cost and plentiful shale energy, at about one-third of the cost of the rest of the world, will boost our nation’s growth, as will the cost of electricity in the U.S., which is now about half that of the rest of the world. We believe a recovering housing market, which has only recently begun to improve, will also propel our nation’s economic growth. About 40 percent of our nation’s jobs lost in the Great Recession were in construction. We think the nascent housing recovery and a greater need for healthcare services will last for many years and will make an important contribution to lowering unemployment.
2013 started well as the fiscal cliff was avoided by a last ditch compromise. Although the market rallied, unfortunately, we believe the deal struck is disappointing in that it accomplished much less in deficit reduction than needed ($600 billion over ten years vs. $2.5 trillion sought). In addition, the deal did not include any spending or entitlement cuts, nor did it address the looming debt ceiling. The budget battles will likely intensify as the next deadline draws near, and the drag on the economy it is causing may linger. We believe that as soon as the government’s issues are addressed, business will strengthen and the markets will continue to perform well. We expect the Fund to outperform the market in normal conditions, and underperform in markets with extreme downward movements, such as those greater than 25 percent. The Fund’s investment philosophy seeks well managed businesses with sustainable competitive advantages and the ability to grow significantly over the long-term. The Fund continues to invest in a diversified portfolio of businesses that we believe have significantly better financial characteristics than its benchmark Index.
The Fund’s businesses typically have significantly higher growth rates, operating profit margins, net margins, EBITDA margins (earnings before interest, taxes, depreciation and amortization), return on invested capital, return on equity, and return on assets. In addition, they have substantially lower standard deviations of earnings growth. We believe they are better managed and contribute in an uncorrelated manner, given that their businesses, clients and competitive advantages are dissimilar.
Management's Discussion of Fund Performance (Unaudited) (Continued)
Comparison of the Change in Value of a $10,000 Investment in the
Touchstone Baron Small Cap Growth Fund and the Russell 2000® Growth Index
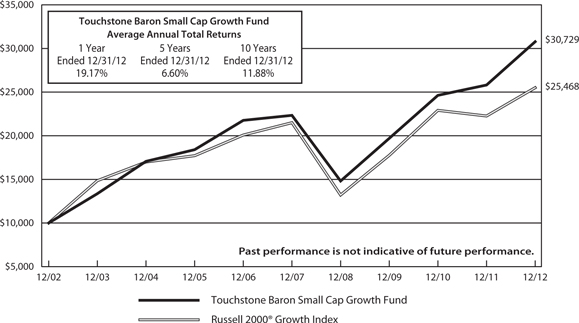
Performance information does not reflect fees that are paid by the separate accounts through which shares of the Fund are sold. Inclusion of those fees would reduce figures for all periods.
The Fund commenced operations on December 14, 1992.
Note to Chart
The Russell 2000® Growth Index measures the performance of those Russell 2000 companies with higher price-to-book ratios and higher forecasted growth values.
Management's Discussion of Fund Performance (Unaudited)
Touchstone Core Bond Fund
Sub-Advised by Fort Washington Investment Advisors, Inc.
Investment Philosophy
The Touchstone Core Bond Fund seeks to provide as high a level of current income as is consistent with the preservation of capital. Capital appreciation is a secondary goal. In deciding what securities to buy and sell for the Fund, the overall investment opportunities and risks in different sectors of the debt securities market are analyzed by focusing on maximizing total return and reducing the volatility of the Fund’s portfolio. A disciplined sector allocation process is followed in order to build a broadly diversified portfolio of bonds.
Fund Performance
The Touchstone Core Bond Fund outperformed its benchmark, the Barclays U.S. Aggregate Bond Index for the 12-month period ended December 31, 2012. The Fund’s total return was 5.28 percent while the total return of the benchmark was 4.21 percent for the 12-month period ended December 31, 2012.
Market Environment
Over the past year, the markets have been influenced by a sluggish economic environment in the U.S., continued stress in the eurozone, and bold central bank action. Asset returns in fixed income were positively influenced by these factors, with broad strength seen in the non-U.S. Treasury sectors of the bond market. Commercial Mortgage-Backed Securities (CMBS), Corporate Bonds, and High Yield Bonds each outperformed U.S. Treasuries. Intermediate interest rates fell slightly over the period, but long-term interest rates were mostly unchanged. There was significant volatility in interest rates, with ongoing concern in the eurozone, uneven U.S. economic data, and aggressive responses by the European Central Bank (ECB) and U.S.Federal Reserve (Fed). At period end, U.S. Treasury yields were up slightly with very limited volatility, as concern in the eurozone diminished and was overshadowed by the U.S. “fiscal cliff.”
In the eurozone, mounting tensions in the Greek, Spanish, and Italian bond markets, along with broader concern over recession, prompted the ECB to unveil a host of new programs, including, most recently, the unlimited securities purchases of troubled countries. For its part, the Fed instituted and then extended a version of “Operation Twist,” in which it extended the maturity of its portfolio in an effort to reduce interest rates. Recently, faced with “grave concern” over the labor market in the U.S. during third quarter, the Fed embarked on a new round of quantitative easing (QE3), focused on mortgage-backed securities (MBS) and U.S. Treasuries. The Fed also indicated that it was likely to maintain an accommodative policy even as the economic recovery continued through year end.
Portfolio Review
In general, the Fund performed well over the past year due to its overweight, relative to the benchmark, of non-U.S. Treasury sectors. The Fund’s overweight in the CMBS sector contributed to performance. The Fund’s Agency MBS sector was underweight and detracted from performance, and Corporate Bonds had little impact. Risk premiums across the spectrum of non-U.S. Treasury sectors tightened significantly in the latter part of the period.
The Fund’s allocation to High Yield contributed to performance. The High Yield market (as represented by the BofA Merrill Lynch U.S. Cash Pay High Yield Index) outperformed during the period.
In terms of interest rate risk and yield curve positioning, we were mostly neutral duration relative to the benchmark for the year and had little impact on the performance of the Fund. We have opportunistically invested in Treasury-Inflation Protected Securities (TIPS) during the period, but this had minimal impact on performance.
Management's Discussion of Fund Performance (Unaudited) (Continued)
The most significant changes to the Fund’s positioning were in the Investment Grade Corporate Bond and High Yield credit sectors. The High Yield market performed well into the beginning of the period, and we subsequently reduced the allocation in the first half of 2012. Risk premiums have narrowed significantly over the past 12 months and, while still representing value in the fixed income market, the attractiveness is reduced in light of the significant risks present in the U.S. and Europe.
In contrast, we determined that the risk premium of the Investment Grade Corporate Bond sector no longer offered adequate compensation for additional credit or liquidity risk. Late in the third quarter, we reduced the Fund’s weight to Investment Grade Corporate Bonds and the Fund is now underweight relative to the benchmark. If the economy continues to grow in a sub-par fashion, Corporate Bonds may underperform due to increased concern over credit quality. In an environment where growth increases significantly and investors allocate away from fixed income, the Investment Grade Corporate Bond sector could experience weakness due to lack of liquidity.
For much of the past year, the duration of the Fund had been neutral relative to the benchmark, but we actively managed its duration in an approximate band of +/-10% versus the benchmark. Over the period, the duration positioning of the Fund had little impact on the performance of the Fund. Currently, the Fund is positioned with slightly less interest rate risk in longer maturities than the benchmark.
Outlook
The biggest opportunities over the near term are likely to be short-term in nature given the overall low level of yields and risk premiums. The Fed’s actions should result in lower overall market volatility, which will require the Fund to be nimble and capture short-term opportunities.
From a top-down perspective, there are likely to be imbalances created in the market with the Fed influencing asset prices that may differ significantly from equilibrium levels. The unwinding of these imbalances will create opportunities; however, that may take several months. For example, while we expect Fed policy to keep rates low over the near-term, long-term interest rates may be especially vulnerable (higher rates) to economic improvement and resultant expectations of higher inflation over the next few quarters. The Fund is positioned with slightly less interest rate risk in longer maturities than its benchmark to reflect this view.
On a sector allocation basis, we continue to see opportunity in CMBS due to the high-quality nature of the bonds we hold, along with the yield and relatively limited interest rate risk. In contrast, we believe that the risk premium of the Investment Grade Corporate Bond sector no longer offers adequate compensation for additional credit or liquidity risk. We recently reduced our weighting to the sector and are now underweight relative to the benchmark. Although we believe High Yield remains an attractive opportunity and continue a weighting to this sector, we believe additional risk premium narrowing may lead us to reduce the exposure.
The evolution of the U.S. economy and the impact on monetary policy will be the biggest driver of volatility in 2013. The Fed is pursuing aggressive policies and the market will have to discern the direction of those policies given the outlook. Going forward, we expect interest rates to remain near current levels. However, recent Fed actions have raised the concern that long-term interest rates may be especially vulnerable (higher rates) to economic improvement and resultant expectations of higher inflation.
Management's Discussion of Fund Performance (Unaudited) (Continued)
Over the near-term, however, the markets are most likely to be influenced by the potential resolution of the debt ceiling/sequester issue, which has the potential to generate significant volatility across all markets. Longer-term, the greatest concern relates to the overall low level of interest rates and risk premiums across the entire bond market. The potential return of fixed income in general will be challenged going forward, and the low level of risk premiums will make it difficult to add alpha1 through overweighting/underweighting sectors relative to the benchmark.
1Alpha is the portion of a fund’s total return that is unique to that fund and is independent of movements in the benchmark.
Management's Discussion of Fund Performance (Unaudited) (Continued)
Comparison of the Change in Value of a $10,000 Investment in the
Touchstone Core Bond Fund and the Barclays U.S. Aggregate Bond Index

Performance information does not reflect fees that are paid by the separate accounts through which shares of the Fund are sold. Inclusion of those fees would reduce figures for all periods.
The Fund commenced operations on October 3, 1994.
Note to Chart
The Barclays U.S. Aggregate Bond Index is an unmanaged index comprised of U.S. investment grade, fixed rate bond market securities, including government, government agency, corporate and mortgage-backed securities between one and ten years.
Management's Discussion of Fund Performance (Unaudited)
Touchstone High Yield Fund
Sub-Advised by Fort Washington Investment Advisors, Inc.
Investment Philosophy
The Touchstone High Yield Fund seeks high current income and capital appreciation by primarily investing in non-investment grade securities. The Fund emphasizes the higher-quality segment of the high yield market. It utilizes a research process designed to maximize risk-adjusted returns by avoiding lower-rated securities.
Fund Performance
The Touchstone High Yield Fund underperformed its benchmark, the BofA Merrill Lynch High Yield Cash Pay Index for the 12-month period ended December 31, 2012. The Fund’s total return was 13.45 percent while the total return of the benchmark was 15.44 percent for the 12-month period ended December 31, 2012.
Market Environment
Investors had good reason to celebrate considering the performance of financial markets in 2012, with most risky assets posting double-digit returns. After surging in the first part of the year, stocks and other risk assets plummeted in the second quarter before staging a strong second-half rally.
While the U.S. economy continued to improve throughout 2012 and posted 3% growth in the third quarter, it grew at only about half that pace in the final quarter. U.S. businesses were cautious about hiring new workers, and they scaled back on investment spending amid uncertainty about U.S. fiscal policy and the health of the global economy.
The global economy slowed to its weakest pace since the onset of recovery in mid-2009. The main drag came from Europe, where the peripheral countries in the eurozone were mired in recession while growth in the core economies faltered. At the same time, growth of the Chinese economy decelerated and Japan’s economy stagnated.
In the U.S., aggregate Gross Domestic Product (GDP) statistics reflected a gradual improvement in private sector spending, including a revival of auto demand and a turnaround in residential housing – sectors that typically lead economic expansions. Residential construction made a positive contribution to GDP for the first time in six years, while home prices posted solid gains in the second half of the year. The increase in spending on big-ticket discretionary items was accompanied by a rebound in consumer confidence to its highest level since the financial crisis and by a stabilization of the personal saving rate at about 4 percent of disposable income.
At the same time, U.S. businesses undertook significant adjustments to improve their balance sheets and restore overall profitability during the period. Corporate profits as a share of GDP soared to post-war highs, and U.S. businesses are sitting on record amounts of cash. The improvement in profitability and balance sheet positions is mirrored in the strong showing of the U.S. stock and corporate bond markets in the past four years.
High Yield bond spreads tightened by more than 160 basis points, generating significant capital appreciation. Lower quality (CCC-rated) securities outperformed while higher quality (BB-rated securities) lagged. Although there were many opportunities for volatility (elections, Europe, concerns over GDP growth, budget negotiations, etc.), the High Yield market continued to attract capital owing to fair valuations and a lack of compelling alternatives. Somewhat surprisingly, the market shrugged off concerns over the “fiscal cliff” and possible sequestration rallying strongly into the end of the year. While spreads do remain reasonable, yields were at an all-time low and the dollar price was approaching a record high at period end.
Management's Discussion of Fund Performance (Unaudited) (Continued)
Portfolio Review
The Fund’s performance lagged the broader indices primarily due to its lack of lower quality (CCC-rated) securities and negative attribution from sector allocation. Attribution from security selection was essentially flat. With respect to sector allocation, the Fund’s underweight exposure to the Banks & Thrifts sector detracted from performance as did its overweight allocation to the Midstream Energy and Metals/Mining sectors. Conversely, the overweight allocation to the Telecommunications sector and underweight allocation to the Utilities sector both contributed to performance.
With respect to security selection, the Fund experienced outperformance within the Energy and Industrials sectors. Expro Finance (Energy sector), an oilfield services company, benefited from asset sales and reduced leverage, while Plains Exploration (Industrials sector) outperformed after competitor Freeport-McMoRan Copper & Gold Inc. announced its intent to purchase the company. The Fund suffered from poor security selection within the Telecommunications and Technology sectors. Sprint Nextel (Telecommunications sector), a Central American wireless provider, exhibited weakness from slowing economies coupled with a heavy capital expenditure program. Kemet Corporation (Technology sector) lagged as a result of a softening semiconductor market.
Outlook
Going forward, with little opportunity to differentiate on the upside due to the high-dollar/low- yield environment, there will be significant opportunity to differentiate on the downside. As such, we have attempted to limit downside risk through the reduction of volatile securities that might be susceptible to company-specific weakness and/or general market volatility. We are well positioned to take advantage of such volatility.
Heavy flows into the market coupled with continued lack of liquidity make the Fund’s portfolio construction and management challenging. Such is particularly true in a “risk-on” environment in which we currently operate given our higher quality philosophy.
We think spreads are fair and we continue to advocate allocations to High Yield. However, we think it is ever more important to understand the limited upside in High Yield. As mentioned above, while spreads do remain reasonable, yields are at an all time low and dollar price is approaching a record high resulting in limited opportunity for capital appreciation. It will be nearly impossible to generate returns in 2013 that are similar to those posted in 2012.
Regardless, with confidence in economic fundamentals, we think the prospects for High Yield in 2013 are attractive, particularly when compared to alternatives, and we have positioned the Fund to be modestly higher in quality. While we acknowledge that downside risk may be greater than upside potential, we consider the likelihood of significant principal erosion to be remote. Further, we think any volatility would be temporary and met with increased asset flows based upon the long-term fundamental outlook for the asset class.
Management's Discussion of Fund Performance (Unaudited) (Continued)
Comparison of the Change in Value of a $10,000 Investment in the
Touchstone High Yield Fund and the BofA Merrill Lynch U.S. High Yield Cash Pay Index
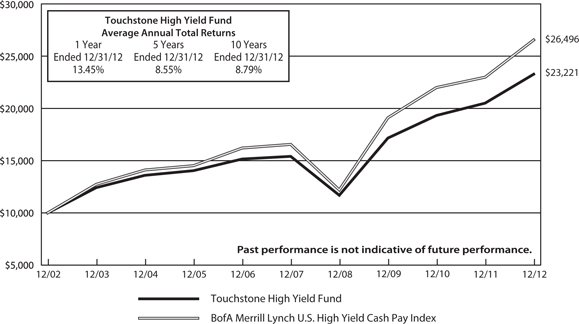
Performance information does not reflect fees that are paid by the separate accounts through which shares of the Fund are sold. Inclusion of those fees would reduce figures for all periods.
The Fund commenced operations on May 1, 1999.
Note to Chart
The BofA Merrill Lynch U.S. High Yield Cash Pay Index is an unmanaged index used as a general measure of market performance consisting of fixed-rate, coupon-bearing bonds with an outstanding par which is greater than or equal to $50 million, a maturity range greater than or equal to one year and must be less than BBB/Baa3 rated but not in default.
Management's Discussion of Fund Performance (Unaudited)
Touchstone Large Cap Core Equity Fund
Sub-Advised by Todd-Veredus Asset Management LLC.
Investment Philosophy
TheTouchstone Large Cap Core Equity Fund primarily invests in common stocks of large capitalization companies. The Fund’s sub-advisor, Todd-Veredus Asset Management LLC (“Todd-Veredus”), selects stocks that it believes are attractively valued with active catalysts in place. Todd-Veredus uses a database of 4,000 stocks from which to choose the companies that will be selected for the Fund’s portfolio. As a result, the portfolio generally consists of 40-60 positions. Todd-Veredus’s selection process is expected to cause the Fund’s portfolio to have some of the following characteristics: attractive relative value, unrecognized earnings potential, above-average market capitalization, seasoned management and dominant industry.
Fund Performance
The Touchstone Large Cap Core Equity Fund underperformed its benchmark, the Russell 1000® Index, for the 12-month period ended December 31, 2012. The Fund’s total return was 12.07 percent while the total return of the benchmark was 16.42 percent for the 12-month period ended December 31, 2012.
Market Environment
The equity market moved forward primarily based on the idea that the world was past the point of highest danger from the financial crisis in Europe. While markets were breathing a sigh of relief with the European Crisis abating, the economy still did not feel positive about economic growth in most parts of the world. The U.S. was the steadiest economy last year, while Europe suffered a recession and most Emerging Market countries saw a significant slowing. One of the byproducts of better U.S. economic growth was that companies with less foreign exposure tended to outperform.
Portfolio Review
The Fund’s emphasis on quality multinational companies without financial problems hurt the Fund during the year, as the market staged a low quality beta1 led rally for the second time in three years. It was a frustrating year because our normally trustworthy multi-factor ranking model saw the lowest ranked stocks outperform all other categories for most of the year.
Stock selection drove most of the Fund’s underperformance, specifically relative performance in the Consumer Discretionary, Health Care and Financials sectors. Stock selection in the Energy, Utilities and Consumer Staples sectors contributed to relative performance. Contributors to performance included Marathon Petroleum Corp. (Energy sector) where improved refining margins helped raise profits. Oracle Corp.’s (Information Technology sector) concerns over sluggish software sales evaporated as new products gained. Aflac Inc.’s (Financials sector) easing European concerns reduced worries. Ensco PLC’s (Energy sector) earnings were revised up as higher day-rates improved. Illinois Tool Works’ (Industrials sector) earnings outlook firmed with recovery end markets.
Detractors from performance included GameStop Corp. (Consumer Discretionary sector) who was hurt by earnings uncertainty related to new product introductions. McDonald’s Corp. (Consumer Discretionary sector) was affected by slowing same store sales and tougher comparables. Coach, Inc. (Consumer Discretionary sector) was impacted by concerns about a slowdown in luxury products. NYSE Euronext, Inc.’s (Financials sector) lower trading volumes weakened the outlook. Intel Corp.’s (Information Technology sector) weaker personal computer sales led to decreased earnings expectations.
Management's Discussion of Fund Performance (Unaudited) (Continued)
Additionally, Consumer Discretionary stocks performed very well for the year, led by the levered homebuilders and auto parts manufacturers. Most of these names have significantly higher volatility than the stocks that are in the Fund’s portfolio.
The Fund is underweight in the Consumer Discretionary, Consumer Staples and Utilities sectors versus the Index. The Fund’s allocation to the Financials sector increased as several recovering banks have started instituting significant cost cutting measures. Additionally, the amount of problem assets on the books is decreasing each quarter, putting the banks on sounder footing to participate in the economic recovery. The Fund’s Health Care sector holdings increased during the year, as we believe the market is willing to look through the patent cliffs and anticipate product pipeline success for many of the larger drug companies.
Outlook
The market’s internal characteristics are acting like an early stage bull market recovering from a financial crisis. That is typically when low quality and Beta1 outperform by this margin. Interestingly, the economy is acting like it is in early stage recovery as well, with autos and housing leading. Perhaps this is an extended cycle like we used to get in the Greenspan era, and a more “normal” recovery can begin after a period of consumer deleveraging.
Political wrangling may have damaged consumer sentiment in the U.S. A higher payroll tax will probably dampen consumer demand in the first half of 2013. Also, U.S. capital spending has been restrained and may remain so if companies favor dividend increases over building productive capacity. Additionally, what was one event became a series of events: the Fiscal Cliff turned into the “Fill in the Blank” Cliffs. We passed the first hurdle with an extension to the tax cuts for people making less than $450,000. Now we face the Debt Ceiling debate, and potentially numerous other mini-cliffs regarding spending, entitlement cuts and the like. However, it looks like the economic expansion will continue, and international economies may be past the worst of their challenges.
With some “normalcy” returning to the market and the crisis atmosphere abating, the Fund’s disciplines may return to favor in 2013. We are skeptical that the end of 2012 marks the end of the secular bear market for equities. The market may still experience modest gains in equity indices.
1Beta is a measure of the volatility of a portfolio relative to its benchmark.
Management's Discussion of Fund Performance (Unaudited) (Continued)
Comparison of the Change in Value of a $10,000 Investment in the
Touchstone Large Cap Core Equity Fund and the Russell 1000® Index
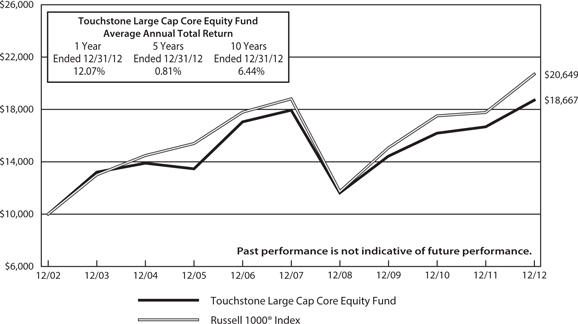
Performance information does not reflect fees that are paid by the separate accounts through which shares of the Fund are sold. Inclusion of those fees would reduce figures for all periods.
The Fund commenced operations on May 1, 1999.
Note to Chart
The Russell 1000® Index measures the performance of the 1,000 largest companies in the Russell 3000® Index.
Management's Discussion of Fund Performance (Unaudited)
Touchstone Mid Cap Growth Fund
Sub-Advised by Westfield Capital Management Company, L.P.
Investment Philosophy
The Touchstone Mid Cap Growth Fund invests primarily in stocks of domestic mid-cap companies that are believed to have a demonstrated record of achievement with excellent prospects for earnings growth over a 1 to 3 year period. Fund management believes that companies that exhibit faster earnings growth offer the best opportunity for superior real rates of return and that reasonably priced stocks of companies with high forecasted earnings potential are best identified through in-depth, fundamental research and first-hand knowledge of company operations derived through on-site visits and meetings with management.
Fund Performance
The Touchstone Mid Cap Growth Fund outperformed its benchmark, the Russell Midcap® Growth Index, for the 12-month period ended December 31, 2012. The Fund’s total return was 19.93 percent while the total return of the benchmark was 15.81 percent for the 12-month period ended December 31, 2012.
Market Environment
Against all odds and economic woes, domestic equities delivered double-digit gains in the past twelve months. The advance came despite the unsettled fiscal outlook in the U.S., an economic deceleration in China, and weakness out of Europe. Interestingly, earnings growth, at roughly 6%, represented a relatively small fraction of the move; multiple expansions – perhaps a reflection of monetary easing and an increased investor appetite for risk – was the driving force behind the rally. In September, the Federal Reserve extended their “extremely low rate” guidance through mid-2015. Concerns about declining U.S. corporate profits persist, as do worries about a host of global macroeconomic setbacks. At the same time, our own bottom-up company checks suggest that domestic economic activity has been relatively resilient. U.S. housing and autos, for example, remain strong, and U.S. non-residential construction appears poised to accelerate. We think that North America has become the fastest growing oil and natural gas producing region of the world. According to the International Energy Agency, the shale-oil boom will help the U.S. overtake Saudi Arabia as the world’s largest oil producer by 2020, transforming not just energy supplies but also U.S. politics and diplomacy. We have been very enthusiastic about U.S. housing and non-residential related investments and least attracted to investments with significant European exposure. We also feel that fears about the Chinese economy are overdone, and we are beginning to identify companies that may benefit from improving economic prospects in that country.
Portfolio Review
The Fund’s outperformance was broad-based, as six of the economic sectors in which the Fund was invested contributed to excess returns. Stock selection within the Energy and Information Technology sectors provided the largest incremental benefit to performance results. Investments in the Health Care, Telecommunication Services, and Consumer Discretionary sectors were areas of relative weakness.
The Energy sector contributed to relative results. We continue to believe that refining stocks represent the best opportunities in the sector. West Coast refiner Tesoro Corp. was the Fund’s best absolute and relative performer during the year. The company’s balance sheet has improved dramatically since we bought the stock in 2011 and, given Tesoro’s tapering capital spending and stronger free cash flow, it is our opinion that the company will likely increase its dividend and redeploy cash through strategic acquisitions. We believe Tesoro’s earnings power should benefit significantly from the company’s acquisition of a California-based refining and marketing operation from oil giant BP PLC. The deal was executed at a very attractive price, considering all the assets it included, such as 800 dealer-operated retail sites, an extensive logistics system, and rights to the ARCO retail brand. The Fund’s other refining holding, Valero Energy Corp., also traded higher during the
Management's Discussion of Fund Performance (Unaudited) (Continued)
year. We think Valero has one of the best future earnings growth potentials among its peers given the company’s advantageous locations in the Gulf Coast region and a scheduled decrease in capital expenditures. Ensco PLC, a provider of offshore petroleum drilling services, also augmented relative returns. The company took advantage of offshore rig supply tightness to expand its contract pipeline, adding two years of backlog visibility. Ensco’s healthy balance sheet and ability to generate free cash flow should allow the company to double its quarterly dividend in the next 12-18 months.
Investments in the Information Technology sector outperformed broadly, generating relative gains. Salesforce.com Inc., a provider of enterprise cloud computing applications, rallied dramatically off its January 2012 lows and was one of the Fund’s best relative and absolute performers during the year. We sold the position on strength in late November, after the company reported third quarter earnings and revenues ahead of consensus expectations. NXP Semiconductors N.V., which manufactures high-performance mixed-signal semiconductors, also contributed meaningfully to relative returns. Similarly to Salesforce, the stock was sold from the Fund after advancing on the heels of a better-then-consensus quarterly earnings report. Alliance Data Systems Corp. was another relative performance driver within the sector. The company administers customer loyalty programs for consumer-based businesses, including many well-known brands such as J. Crew, Victoria’s Secret, and the Air Miles reward program in Canada. Alliance Data also provides transaction-based marketing services through its Epsilon segment. We believe the company is well positioned to benefit from a strengthening economy and improving consumer spending, as well as geographical expansion into less-penetrated markets such as Brazil.
The Materials sector contributed to excess returns. Solutia Inc. and Eastman Chemical Co. provided the bulk of the relative performance benefit. In late January, specialty chemicals producer Solutia announced it had entered into a definitive agreement under which it would be acquired by chemical manufacturer Eastman Chemical at a 42% premium to the company’s prevailing market price. The Fund held the Eastman position given the view that the company possesses good relative top line growth driven by product innovation, a secular shift towards greener packaging plastics, and a recovery in construction markets. In addition, cost synergies from the acquired Solutia business should help drive 8-10% profit growth annually from 2013-2015. Ecolab Inc., a provider of water, hygiene and energy technologies, also augmented relative performance. The stock traded sharply higher in mid-October after the company announced its intention to acquire privately-held specialty chemical company Champion Technologies. The position was sold and the proceeds were used to help fund new positions in chemical manufacturers FMC Corp. and Celanese Corp. We like FMC for its positioning in the crop chemicals category, as well as its exposure to growth in the food and beverage ingredients and lithium end markets. Celanese offers a diverse portfolio of businesses with a blend of stable and growth-oriented segments; additionally, we believe the company’s new ethanol opportunity could add to earnings significantly by 2015-2016.
The Financials sector added to relative results, helped by positive stock selection within consumer finance and regional banks. Discover Financial Services, a provider of credit card services, rose over 60% during the period and was sold at the end of the year, when it reached its internal price target. Commercial bank SunTrust Banks Inc., which was another strong relative performer, was also sold earlier in the year, based on concerns over the company’s mortgage servicing business. In addition to these two trades, three new buys were executed in the sector during the year, and the Fund’s Financials sector weight remains essentially in-line with the Index.
Despite a solid return in aggregate, the Fund’s Health Care sector holdings underperformed its Index’s peers. Investments within the health care equipment sub-industry caused much of the relative performance shortfall. Shares of Hologic Inc. plummeted in late April when the company, which manufactures diagnostics and surgical products, announced that it would acquire molecular diagnostic products manufacturer Genprobe.The announcement came at a time when investors were expecting the company to focus on its mammography launch and share repurchases. Despite the negative reaction to the deal, we view Genprobe as an attractive asset given the company’s growth profile, great products, and strong pipeline. After meeting with both the Hologic and Genprobe management
Management's Discussion of Fund Performance (Unaudited) (Continued)
teams, we felt comfortable in the strategic merits and accretion potential of the deal, as well as Hologic’s underlying fundamentals. We are also enthusiastic about Genprobe’s new product, a three-dimensional mammography system, which has shown reduced recall rates and improved detection. As more data are published, and if reimbursement is expanded, adoption should accelerate, improving investor sentiment and likely rerating the stock’s multiple.
The Telecommunication Services sector detracted from relative results, hurt entirely by the Fund’s investments within the wireless telecommunication services sub-industry. NII Holdings Inc., a provider of mobile communications for businesses in Latin America, reported first quarter earnings and revenues below consensus expectations and posted conservative forward guidance for 2012. Given deteriorating fundamental results and a toughening competitive landscape in Brazil, the stock was sold.
The Consumer Discretionary sector was also an area of relative weakness, detracting from excess returns. GNC Holdings Inc., a retailer of health and wellness products, traded off after announcing a secondary offering and comparable same store sales in the most recent fiscal quarter at 9.8%, which was below Wall Street expectations. The Fund continues to hold the shares, as we believe that mid-single digit category growth, new product innovation, and domestic and international store growth should lead to the stock’s price appreciation. Two underperforming positions within the sector, Lear Corp. and Coach Inc., were sold during the year. Lear, an automotive components supplier, was sold given the company’s European exposure and a limited organic growth profile. Coach, Inc., a producer of accessories and personal leather goods, was sold after we determined that increased competition with other designers such as Michael Kors may still be underestimated.
Outlook
Though we remain in a period of modest global growth, we are excited to have identified clear pockets of strength. U.S. housing and autos remain strong while emerging economies and U.S. non-residential construction appear poised to accelerate. Though we are confident in the outlook for many multi-year investment opportunities, the on-going issues related to the U.S. budget deficit as well as continued sovereign debt issues in Europe suggest that we must remain flexible and opportunistic in our approach. We are focused on building an “all weather” portfolio that is weighted toward the long-term themes that we find most compelling. We believe the Fund is well diversified and is positioned to benefit should the economy accelerate. We also believe many of the Fund’s core holdings, which emphasize solid business models, organic growth and return-of-capital stories, can outperform independent of overall global growth scenarios.
Management's Discussion of Fund Performance (Unaudited) (Continued)
Comparison of the Change in Value of a $10,000 Investment in the
Touchstone Mid Cap Growth Fund and the Russell Midcap® Growth Index
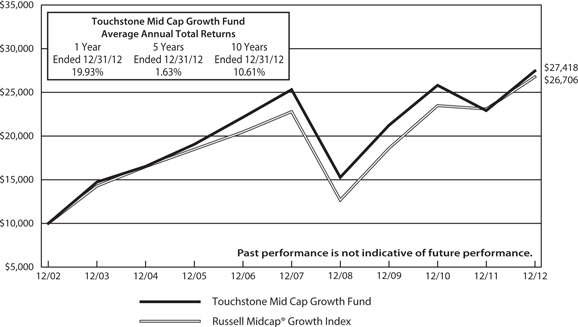
Performance information does not reflect fees that are paid by the separate accounts through which shares of the Fund are sold. Inclusion of those fees would reduce figures for all periods.
The Fund commenced operations on November 21, 1994.
Note to Chart
The Russell Midcap® Growth Index measures the performance of those Russell Midcap companies with higher price-to-book ratios and higher forecasted growth values.
Management's Discussion of Fund Performance (Unaudited)
Touchstone Third Avenue Value Fund
Sub-Advised by Third Avenue Management
Investment Philosophy
The Touchstone Third Avenue Value Fund primarily invests in common stocks of well-financed companies (meaning companies believed to have high quality assets and a relative absence of liabilities) at a discount to what the Fund’s sub-advisor, Third Avenue Management LLC (“TAM”), believes is their intrinsic value. Third Avenue analyzes companies from the bottom up, focusing on business fundamentals such as competent management teams and strong long-term growth prospects.
Fund Performance
The Touchstone Third Avenue Value Fund outperformed its benchmark, the Russell 3000® Value Index, for the 12-month period ended December 31, 2012. The Fund’s total return was 20.71 percent while the total return of the benchmark was 17.55 percent for the 12-month period ended December 31, 2012.
Market Environment
During the year, risk aversion was a priority for some investors, whose concerns over macro events led them to the perceived safety of government bonds and other investments designed to hedge risk. In a continued environment of excess liquidity and ultra-low interest rates, however, investors were rewarded for moving out the risk spectrum into stocks and other higher beta1 assets. Equity markets delivered strong returns worldwide and across market capitalizations even as they climbed a “wall of worry” about continued sovereign debt issues in Europe, a possible slowdown in Hong Kong and China and the “fiscal cliff ” of tax increases and spending cuts that rounded out the year in the United States. The Energy sector was particularly affected by historically low natural gas prices throughout the year, the effects of which have been felt throughout the energy industry, from exploration and production companies to refiners and utilities. Lower energy inputs have also aided manufacturing in America.
Portfolio Review
From the Financials sector, Wheelock & Co. was the Fund’s largest contributor to performance for the year. In June 2012, Wheelock & Company Ltd., announced that its subsidiary, The Wharf Ltd., made a $HK 5.1 billion capital infusion, consisting of common stock and a perpetual security convertible, into Greentown China Holdings Ltd. Founded in 1995, Greentown is a leading China homebuilder with a strong brand name and a 41 million square foot land bank. Through the transaction, Wharf and Greentown will become strategic partners in China, and Wharf will be represented on Greentown’s board. The opportunity was created by the softening of the residential property market over the last year and Greentown’s over-leveraged balance sheet, which we believe serves as a great example of what opportunities can be afforded to the Fund’s companies that maintain strong financial positions.
Another significant performance contributor from the Financials sector for the year was Investor AB, which saw shares climb. Investor AB recently announced the $4 billion sale of Gambro (Information Technology sector), a medical devices company specializing in dialysis machines, to Baxter International Inc. (Health Care sector). We believe the deal is strongly accretive to Investor AB’s net asset value (NAV) and, historically, this has been the type of resource conversion event that has typically driven value creation at the company. In the recent past, we believe Investor AB has benefited not only from improvement in macro events, which has been reflected in the valuations of its listed investments, but also from good performance from its private equity assets. The Fund continues to hold Investor AB as we believe it has ample opportunity for growth, in addition to its dividend income.
Management's Discussion of Fund Performance (Unaudited) (Continued)
The largest detractor to Fund performance for the year from the Energy sector was Pioneer Energy Services Corp. (formerly Pioneer Drilling). Despite the laggard stock performance, Pioneer has reported what we believe are encouraging financial results, including rising revenue from its growing fleet of drilling rigs. During the year, this position was added to the Fund on price weakness.
Throughout the year, appreciating securities were trimmed, such as Henderson Land Development Co., Ltd., Investor AB and Cheung Kong Holdings, Ltd. (all Financials sector). A dozen new positions were added, increasing exposure to the U.S. Financials sector (excluding investment banks) and to the U.S. Energy sector (oil and gas industry). In addition, a dozen securities were sold, some on appreciation, such as Wheelock & Co. Ltd., and others such as Skyline Corp. (Consumer Discretionary sector), and Electronics for Imaging Inc. (Information Technology sector), in order to devote capital to what we believe are better investment ideas.
Outlook
Considerable analytic effort has been spent on the Energy sector as, historically, low natural gas prices have led to mispricings in the industry. We have also paid particular attention to regional banks, such as Comerica Inc., which we believe are available at significant discounts to tangible book value. U.S. high technology companies like Applied Materials Inc., have also been of interest.
We are aware that, should residential housing prices fall in China and Hong Kong, the prices of the Fund’s Hong Kong holdings could be temporarily impacted. We believe that the Fund’s holdings from that region will not be fundamentally affected in the long run as they are well-financed, do not rely on the credit markets in order to function and have diversified revenue streams. Though the fiscal cliff issue in the U.S. was resolved before January 1, 2013, it was not entirely put to rest and we believe there could be another opportunity for policy missteps by the Federal Government in two to three months as the White House and Congress negotiate over a debt ceiling increase. A failure to rationally deal with the debt limit, as seen in the summer of 2011, could result in short-term market disruptions. We believe the Fund’s holdings are in strong financial condition and should ultimately weather such an event and may create buying opportunities for it, made possible given the Fund’s increased cash position.
The Fund maintains a concentrated portfolio of undervalued securities, diversified across regions and industries. We have enhanced our focus on balance sheet strength to help deal with volatility. We believe that, over the long-term, the Fund will generate positive absolute results versus its benchmark.
1Beta is a measure of the volatility of a portfolio relative to its benchmark.
Management's Discussion of Fund Performance (Unaudited) (Continued)
Comparison of the Change in Value of a $10,000 Investment in the
Touchstone Third Avenue Value Fund and the Russell 3000® Value Index

Performance information does not reflect fees that are paid by the separate accounts through which shares of the Fund are sold. Inclusion of those fees would reduce figures for all periods.
The Fund commenced operations on December 14, 1992.
Note to Chart
The Russell 3000® Value Index measures the performance for those Russell 3000® companies with lower price-to book ratios and lower forecasted growth values.
Management's Discussion of Fund Performance (Unaudited)
Touchstone ETF Funds
Sub-Advised by Todd-Veredus Asset Management LLC.
Touchstone Aggressive ETF Fund
Touchstone Conservative ETF Fund
Touchstone Enhanced ETF Fund
Touchstone Moderate ETF Fund
Investment Philosophy
Four Exchanged Traded Funds (ETFs) are available for investors seeking “lifestyle” products for their annuity holdings. The first three strategic options include: the Conservative, Moderate, and Aggressive ETF Funds. These funds allocate their assets among up to nine ETFs. These nine ETF selections, generally do not change dramatically over time, The more conservative funds have higher bond weightings, and the more aggressive funds have lower bond weightings. The fourth option, the Enhanced ETF Fund, employs tactical asset allocation in an effort to generate better returns.
Fund Performance
TheTouchstone Conservative ETF Fund’s total return was 6.74 percent for the 12-month period ended December 31, 2012. The Fund outperformed its benchmark. The total return of its benchmark, the Barclays U.S. Aggregate Bond Index, was 4.21 percent for the 12-month period ended December 31, 2012. The Touchstone Moderate ETF Fund’s total return was 9.94 percent for the 12-month period ended December 31, 2012, the Touchstone Aggressive ETF Fund’s total return was 12.59 percent for the 12-month period ended December 31, 2012, and the Touchstone Enhanced Fund’s total return was 14.11 percent for the 12-month period ended December 31, 2012. All three of these Funds underperformed their benchmark. The total return of the S&P Composite 1500 Index was 16.17% for the 12-month period ended December 31, 2012. The specific blended benchmark returns were 8.41 percent for the Conservative ETF Fund, 11.40 percent for the Moderate ETF Fund, 13.79 percent for the Aggressive ETF Fund and 14.98 percent for the Enhanced ETF Fund for the 12-month period ended December 31, 2012.
Market Environment
While markets were breathing a sigh of relief with the European Crisis abating, the market still did not feel positive about economic growth in most parts of the world. The U.S. was the steadiest economy last year, while Europe suffered a recession and most Emerging Markets saw a significant slowing. One of the byproducts of better U.S. economic growth was that companies with less foreign exposure tended to outperform.
Portfolio Review
The funds were rebalanced on May 1, 2012. In the rebalance, the allocation to bonds is always kept very close to the benchmark exposure for the strategic funds. The funds’ exposure to bonds was reduced during the May rebalancing to adjust for the higher exposure to bonds that had developed during the prior year when bonds outperformed other asset classes slightly higher. During this rebalance, the asset allocation model shifted its equity sector to tilt in favor of value stocks slightly more than growth stocks. It also shifted to lower the amount of international exposure the Funds had. The model retained a relative overweighting in the small and mid capitalization indexes. The Touchstone Enhanced ETF Fund moved to overweight the Large and Small Cap Value, International and Bond sectors in November.
Management's Discussion of Fund Performance (Unaudited) (Continued)
Most of the Touchstone ETF Funds are strategic, therefore they only change once per year. Since the Touchstone Enhanced ETF Fund is tactical, it changes twice per year. Its allocation was changed to favor Large and Small Cap Domestic Value, International Stocks and the Barclays Aggregate Bond index.
Outlook
The market’s internal characteristics act like an early stage bull recovering from a financial crisis. That is typically when low quality and beta1 outperform. Interestingly, the market economy is acting like it is in early stage recovery as well, with autos and housing leading. Perhaps this is an extended cycle like we used to get in the Greenspan era, and a more “normal” recovery can begin after a period of consumer deleveraging. We expect with some “normalcy” returning and the crisis atmosphere abating that our disciplines should return to favor this year. We are skeptical that the end of 2012 marks the end of the secular bear market for equities. We may still see some modest new highs in the S&P Index and Russell 1000® Index.
Political wrangling may have damaged consumer sentiment in the U.S. A higher payroll tax will probably dampen consumer demand in the first half of 2013. Also, U.S. capital spending has been restrained and may remain so if companies favor dividend increases over building productive capacity. Additionally, what was one event became a series of events. The Fiscal Cliff turned into the “Fill in the Blank” Cliffs. We passed the first hurdle with an extension to the tax cuts for people making less than $450,000. Now we face the Debt Ceiling debate, and potentially numerous other mini-cliffs regarding spending, entitlement cuts and the like. However, it looks like the economic expansion will continue, and international economies may be past the worst of their challenges.
The Funds with lower bond allocations and higher stock allocations should outperform those with larger bond holdings and lower stock holdings over the long term. Over shorter periods, when bonds outperform, the more conservative Funds will outperform and vice versa.
As noted above, the strategic funds continue to maintain bond weightings in a static stock/bond split in an effort to produce returns that are more predictable.
1Beta is a measure of the volatility of a portfolio relative to its benchmark.
Management's Discussion of Fund Performance (Unaudited) (Continued)
Comparison of the Change in Value of a $10,000 Investment in the
Touchstone Aggressive ETF Fund, the S&P Composite 1500 Index (Major Index)
and the Blend: 80% S&P Composite 1500 Index/20% Barclays U.S. Aggregate Bond Index
(Minor Index)
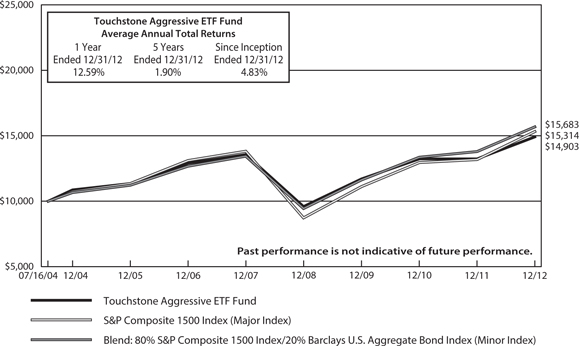
Performance information does not reflect fees that are paid by the separate accounts through which shares of the Fund are sold. Inclusion of those fees would reduce figures for all periods.
The Fund commenced operations on July 16, 2004.
Notes to Chart
S&P Composite 1500 Index is an unmanaged, broad market index representing the large-cap, mid-cap, and small-cap segments of the U.S. equity market.
The Barclays U.S. Aggregate Bond Index is an unmanaged index comprised of U.S. investment grade, fixed rate bond market securities, including government, government agency, corporate and mortgage-backed securities between one and ten years.
Management's Discussion of Fund Performance (Unaudited) (Continued)
Comparison of the Change in Value of a $10,000 Investment in the
Touchstone Conservative ETF Fund, the Barclays U.S. Aggregate Bond Index (Major Index)
and the Blend: 35% S&P Composite 1500 Index (Minor Index)/65% Barclays U.S. Aggregate
Bond Index

Performance information does not reflect fees that are paid by the separate accounts through which shares of the Fund are sold. Inclusion of those fees would reduce figures for all periods.
The Fund commenced operations on July 16, 2004.
Notes to Chart
The Barclays U.S. Aggregate Bond Index is an unmanaged index comprised of U.S. investment grade, fixed rate bond market securities, including government, government agency, corporate and mortgage-backed securities between one and ten years.
S&P Composite 1500 Index is an unmanaged, broad market index representing the large-cap, mid-cap, and small-cap segments of the U.S. equity market.
Management's Discussion of Fund Performance (Unaudited) (Continued)
Comparison of the Change in Value of a $10,000 Investment in the
Touchstone Enhanced ETF Fund, the S&P Composite 1500 Index (Major Index)
and the Blend: 90% S&P Composite 1500 Index/10% Barclays U.S. Aggregate Bond Index
(Minor Index)
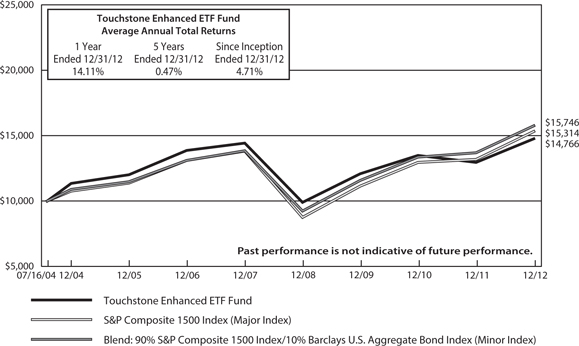
Performance information does not reflect fees that are paid by the separate accounts through which shares of the Fund are sold. Inclusion of those fees would reduce figures for all periods.
The Fund commenced operations on July 16, 2004.
Notes to Chart
S&P Composite 1500 Index is an unmanaged, broad market index representing the large-cap, mid-cap, and small-cap segments of the U.S. equity market.
The Barclays U.S. Aggregate Bond Index is an unmanaged index comprised of U.S. investment grade, fixed rate bond market securities, including government, government agency, corporate and mortgage-backed securities between one and ten years.
Management's Discussion of Fund Performance (Unaudited) (Continued)
Comparison of the Change in Value of a $10,000 Investment in the
Touchstone Moderate ETF Fund, the S&P Composite 1500 Index (Major Index)
and the Blend: 60% S&P Composite 1500 Index/40% Barclays U.S. Aggregate Bond Index
(Minor Index)

Performance information does not reflect fees that are paid by the separate accounts through which shares of the Fund are sold. Inclusion of those fees would reduce figures for all periods.
The Fund commenced operations on July 16, 2004.
Notes to Chart
S&P Composite 1500 Index is an unmanaged, broad market index representing the large-cap, mid-cap, and small-cap segments of the U.S. equity market.
The Barclays U.S. Aggregate Bond Index is an unmanaged index comprised of U.S. investment grade, fixed rate bond market securities, including government, government agency, corporate and mortgage-backed securities between one and ten years.
Tabular Presentation of Portfolios of Investments (Unaudited)
December 31, 2012
The illustrations below provide each Fund’s credit quality and portfolio allocation. We hope it will be useful to shareholders as it summarizes key information about each Fund’s investments.
| Touchstone Baron Small Cap Growth Fund | | | |
| Sector Allocation* | | (% of Net Assets) | |
| Consumer Discretionary | | | 29.1 | % |
| Financials | | | 19.7 | |
| Industrials | | | 16.5 | |
| Information Technology | | | 12.1 | |
| Consumer Staples | | | 7.0 | |
| Health Care | | | 4.3 | |
| Utilities | | | 4.2 | |
| Energy | | | 4.1 | |
| Telecommunication Services | | | 1.8 | |
| Investment Funds | | | 10.5 | |
| Other Assets/Liabilities (Net) | | | (9.3 | ) |
| Total | | | 100.0 | % |
| Touchstone Core Bond Fund | | | |
| Credit Quality** | | (% of Investment Securities) | |
| AAA/Aaa | | | 66.2 | % |
| AA/Aa | | | 0.7 | |
| A | | | 11.9 | |
| BBB/Baa | | | 8.7 | |
| BB/Ba | | | 3.6 | |
| B | | | 4.6 | |
| CCC | | | 1.0 | |
| CC | | | 0.4 | |
| NR | | | 2.9 | |
| Total | | | 100.0 | % |
| Touchstone High Yield Fund | | | |
| Credit Quality** | | (% of Investment Securities) | |
| BB/Ba | | | 38.9 | % |
| B | | | 57.8 | |
| CCC/Caa | | | 1.0 | |
| NR | | | 2.3 | |
| Total | | | 100.0 | % |
| Touchstone Large Cap Core Equity Fund | | | |
| Sector Allocation* | | (% of Net Assets) | |
| Information Technology | | | 18.7 | % |
| Financials | | | 15.9 | |
| Health Care | | | 15.0 | |
| Industrials | | | 14.1 | |
| Energy | | | 11.5 | |
| Consumer Discretionary | | | 9.3 | |
| Consumer Staples | | | 7.3 | |
| Materials | | | 2.6 | |
| Telecommunication Services | | | 2.3 | |
| Utilities | | | 1.0 | |
| Investment Fund | | | 2.7 | |
| Other Assets/Liabilities (Net) | | | (0.4 | ) |
| Total | | | 100.0 | % |
Tabular Presentation of Portfolios of Investments (Unaudited) (Continued)
| Touchstone Mid Cap Growth Fund | | | |
| Sector Allocation* | | (% of Net Assets) | |
| Consumer Discretionary | | | 20.8 | % |
| Information Technology | | | 17.2 | |
| Health Care | | | 16.8 | |
| Energy | | | 11.7 | |
| Industrials | | | 10.8 | |
| Financials | | | 8.4 | |
| Materials | | | 6.1 | |
| Consumer Staples | | | 6.1 | |
| Telecommunication Services | | | 0.5 | |
| Investment Funds | | | 2.0 | |
| Other Assets/Liabilities (Net) | | | (0.4 | ) |
| Total | | | 100.0 | % |
| Touchstone Money Market Fund | | | |
| Credit Quality | | (% of Investment Securities) | |
| A-1/P-1/F-1 | | | 94.3 | % |
| FW1*** | | | 5.7 | |
| Total | | | 100.0 | % |
| Portfolio Allocation* | | (% of Net Assets) | |
| Variable Rate Demand Notes | | | 42.3 | % |
| Repurchase Agreement | | | 15.8 | |
| U.S. Government Agency Obligations | | | 14.2 | |
| Corporate Bonds | | | 14.1 | |
| Municipal Bonds | | | 11.5 | |
| Certificate of Deposit | | | 1.3 | |
| Other Assets/Liabiliaties (Net) | | | 0.8 | |
| Total | | | 100.0 | % |
| TouchStone Third Avenue Value Fund | | | |
| Sector Allocation* | | (% of Net Assets) | |
| Financials | | | 44.5 | % |
| Energy | | | 15.7 | |
| Consumer Discretionary | | | 8.7 | |
| Information Technology | | | 8.7 | |
| Materials | | | 5.9 | |
| Industrials | | | 3.3 | |
| Health Care | | | 2.0 | |
| Telecommunication Services | | | 1.5 | |
| Investment Funds | | | 12.0 | |
| Other Assets/Liabilities (Net) | | | (2.3 | ) |
| Total | | | 100.0 | % |
| Touchstone Aggressive ETF Fund | | | |
| Sector Allocation* | | (% of Net Assets) | |
| Exchange Traded Funds | | | 98.9 | % |
| Investment Funds | | | 4.3 | |
| Other Assets/Liabilities (Net) | | | (3.2 | ) |
| Total | | | 100.0 | % |
| Touchstone Conservative ETF Fund | | | |
| Sector Allocation* | | (% of Net Assets) | |
| Exchange Traded Funds | | | 98.7 | % |
| Investment Funds | | | 14.8 | |
| Other Assets/Liabilities (Net) | | | (13.5 | ) |
| Total | | | 100.0 | % |
| Touchstone Enhanced ETF Fund | | | |
| Sector Allocation* | | (% of Net Assets) | |
| Exchange Traded Funds | | | 98.4 | % |
| Investment Funds | | | 23.6 | |
| Other Assets/Liabilities (Net) | | | (22.0 | ) |
| Total | | | 100.0 | % |
| Touchstone Moderate ETF | | | |
| Sector Allocation* | | (% of Net Assets) | |
| Exchange Traded Funds | | | 98.7 | % |
| Investment Funds | | | 3.2 | |
| Other Assets/Liabilities (Net) | | | (1.9 | ) |
| Total | | | 100.0 | % |
| * | Sector Classifications are based upon the Global Industry Classification Standard (GICS®). |
| ** | Composite of Standard and Poor's, Moody's and Fitch ratings. |
| *** | Equivalent to Standard & Poor's and Moody's highest short-term ratings of A-1 and P-1, respectively, based upon independent research conducted by First Washington Advisors, Inc. |
NR - Not Rated
Portfolio of Investments
Touchstone Baron Small Cap Growth Fund – December 31, 2012
| | | | | | Market | |
| | | Shares | | | Value | |
| Common Stocks — 98.8% | | | | | | | | |
| | | | | | | | | |
| Consumer Discretionary — 29.1% | | | | | | | | |
| Ameristar Casinos, Inc. | | | 15,000 | | | $ | 393,600 | |
| Choice Hotels International, Inc. | | | 14,500 | | | | 487,490 | |
| DeVry, Inc.† | | | 9,000 | | | | 213,570 | |
| Dick's Sporting Goods, Inc. | | | 13,500 | | | | 614,115 | |
| Interval Leisure Group, Inc. | | | 10,000 | | | | 193,900 | |
| LKQ Corp.* | | | 31,000 | | | | 654,100 | |
| Lumber Liquidators Holdings, Inc.†* | | | 4,900 | | | | 258,867 | |
| Morningstar, Inc. | | | 2,000 | | | | 125,660 | |
| Panera Bread Co. - Class A* | | | 1,880 | | | | 298,600 | |
| Penn National Gaming, Inc.* | | | 9,885 | | | | 485,452 | |
| Ralph Lauren Corp. | | | 3,000 | | | | 449,760 | |
| Under Armour, Inc. - Class A* | | | 10,000 | | | | 485,300 | |
| Vail Resorts, Inc. | | | 11,500 | | | | 622,035 | |
| | | | | | | | 5,282,449 | |
| | | | | | | | | |
| Financials — 19.7% | | | | | | | | |
| Alexander's, Inc. REIT | | | 800 | | | | 264,640 | |
| Alexandria Real Estate Equities, Inc. REIT | | | 2,500 | | | | 173,300 | |
| Arch Capital Group Ltd.* | | | 25,000 | | | | 1,100,500 | |
| Carlyle Group LP (The)† | | | 8,200 | | | | 213,446 | |
| Cohen & Steers, Inc.† | | | 9,500 | | | | 289,465 | |
| Douglas Emmett, Inc. REIT | | | 16,000 | | | | 372,800 | |
| Eaton Vance Corp. | | | 8,000 | | | | 254,800 | |
| Financial Engines, Inc.* | | | 1,490 | | | | 41,348 | |
| LaSalle Hotel Properties REIT | | | 7,500 | | | | 190,425 | |
| Oaktree Capital Group LLC | | | 4,993 | | | | 227,132 | |
| Primerica, Inc. | | | 13,000 | | | | 390,130 | |
| Zillow, Inc. - Class A†* | | | 1,700 | | | | 47,175 | |
| | | | | | | | 3,565,161 | |
| | | | | | | | | |
| Industrials — 16.5% | | | | | | | | |
| Colfax Corp.* | | | 7,700 | | | | 310,695 | |
| Copart, Inc.* | | | 15,000 | | | | 442,500 | |
| Generac Holdings, Inc. | | | 15,000 | | | | 514,650 | |
| Genesee & Wyoming, Inc. - Class A* | | | 12,000 | | | | 912,960 | |
| Middleby Corp.* | | | 3,000 | | | | 384,630 | |
| Rexnord Corp.†* | | | 10,021 | | | | 213,447 | |
| Valmont Industries, Inc. | | | 1,500 | | | | 204,825 | |
| | | | | | | | 2,983,707 | |
| | | | | | | | | |
| Information Technology — 12.1% | | | | | | | | |
| Advent Software, Inc.* | | | 9,000 | | | | 192,420 | |
| Booz Allen Hamilton Holding Corp.† | | | 29,000 | | | | 403,680 | |
| CoStar Group, Inc.* | | | 5,700 | | | | 509,409 | |
| Guidewire Software, Inc.* | | | 5,604 | | | | 166,551 | |
| LivePerson, Inc.* | | | 3,200 | | | | 42,047 | |
| MAXIMUS, Inc. | | | 6,000 | | | | 379,320 | |
| RealPage, Inc.* | | | 10,000 | | | | 215,700 | |
| SS&C Technologies Holdings, Inc.* | | | 12,215 | | | | 282,411 | |
| | | | | | | | 2,191,538 | |
| | | | | | | | | |
| Consumer Staples — 7.0% | | | | | | | | |
| Boston Beer Co., Inc. (The) - Class A†* | | | 729 | | | | 98,014 | |
| Church & Dwight Co., Inc. | | | 7,500 | | | | 401,775 | |
| TreeHouse Foods, Inc.* | | | 6,000 | | | | 312,780 | |
| United Natural Foods, Inc.* | | | 8,500 | | | | 455,515 | |
| | | | | | | | 1,268,084 | |
| | | | | | | | | |
| Health Care — 4.3% | | | | | | | | |
| Brookdale Senior Living, Inc.* | | | 2,500 | | | | 63,299 | |
| CFR Pharmaceuticals SA 144a ADR | | | 4,172 | | | | 105,433 | |
| Community Health Systems, Inc. | | | 12,000 | | | | 368,880 | |
| Edwards Lifesciences Corp.* | | | 1,915 | | | | 172,676 | |
| IDEXX Laboratories, Inc.* | | | 787 | | | | 73,034 | |
| | | | | | | | 783,322 | |
| | | | | | | | | |
| Utilities — 4.2% | | | | | | | | |
| ITC Holdings Corp. | | | 10,000 | | | | 769,100 | |
| | | | | | | | | |
| Energy — 4.1% | | | | | | | | |
| CARBO Ceramics, Inc.† | | | 1,000 | | | | 78,340 | |
| MPLX LP* | | | 461 | | | | 14,379 | |
| SEACOR Holdings, Inc. | | | 2,500 | | | | 209,500 | |
| Susser Petroleum Partners LP† | | | 5,861 | | | | 147,463 | |
| Targa Resources Corp. | | | 5,500 | | | | 290,620 | |
| | | | | | | | 740,302 | |
| | | | | | | | | |
| Telecommunication Services — 1.8% | | | | | | | | |
| SBA Communications Corp. - Class A* | | | 4,500 | | | | 319,590 | |
| Total Common Stocks | | | | | | $ | 17,903,253 | |
| | | | | | | | | |
| Investment Fund — 10.5% | | | | | | | | |
| Invesco Government & Agency Portfolio** | | | 1,900,044 | | | | 1,900,044 | |
| | | | | | | | | |
| Total Investment Securities —109.3% | | | | | | | | |
| (Cost $11,281,563) | | | | | | $ | 19,803,297 | |
| | | | | | | | | |
| Liabilities in Excess of Other Assets — (9.3%) | | | | | | | (1,678,265 | ) |
| | | | | | | | | |
| Net Assets — 100.0% | | | | | | $ | 18,125,032 | |
| † | All or a portion of the security is on loan. The total value of the securities on loan as of December 31, 2012 was $1,876,602. |
| * | Non-income producing security. |
| ** | Represents collateral for securities loaned. |
Portfolio Abbreviations:
ADR - American Depositary Receipt
REIT - Real Estate Investment Trust
Touchstone Baron Small Cap Growth Fund (Continued)
144a - This is a restricted security that was sold in a transaction exempt from Rule 144a of the Securities Act of 1933. This security may be sold in transactions exempt from registration, normally to qualified institutional buyers. At December 31, 2012, these securities were valued at $105,433 or 0.6% of net assets. These securities were deemed liquid pursuant to procedures approved by the Board of Trustees.
Other Information:
The inputs or methodology used for valuing securities may not be an indication of the risk associated with investing in those securities. For more information on valuation inputs, and their aggregation into the levels used in the table below, please refer to the security valuation section in the accompanying Notes to Financial Statements.
| | | Valuation inputs at Reporting Date: | |
| Description | | Level 1 | | | Level 2 | | | Level 3 | | | Total | |
| Common Stocks | | $ | 17,903,253 | | | $ | — | | | $ | — | | | $ | 17,903,253 | |
| Investment Fund | | | 1,900,044 | | | | — | | | | — | | | | 1,900,044 | |
| | | | | | | | | | | | | | | $ | 19,803,297 | |
See accompanying Notes to Financial Statements.
Portfolio of Investments
Touchstone Core Bond Fund – December 31, 2012
| Principal | | | | | Market | |
| Amount | | | | | Value | |
| | | | | | | | | |
| | | | | Corporate Bonds — 24.4% | | | | |
| | | | | | | | | |
| | | | | Financials — 6.3% | | | | |
| $ | 5,000 | | | Aircastle Ltd., 144a, 6.250%, 12/1/19 | | $ | 5,212 | |
| | 14,000 | | | Ally Financial, Inc., 8.000%, 11/1/31† | | | 17,675 | |
| | 175,000 | | | American Express Credit Corp. MTN, | | | | |
| | | | | 2.375%, 3/24/17 | | | 183,105 | |
| | 200,000 | | | Bank of America Corp. MTN, | | | | |
| | | | | 5.000%, 5/13/21 | | | 228,330 | |
| | 160,000 | | | Brandywine Operating Partnership LP, | | | | |
| | | | | 5.400%, 11/1/14 | | | 170,902 | |
| | 290,000 | | | Caterpillar Financial Services Corp. | | | | |
| | | | | MTN, 5.450%, 4/15/18 | | | 346,406 | |
| | 15,000 | | | CIT Group, Inc., 5.000%, 8/15/22 | | | 15,995 | |
| | 170,000 | | | Citigroup, Inc., 5.500%, 4/11/13 | | | 171,752 | |
| | 26,000 | | | EDP Finance BV, 144a, 6.000%, 2/2/18 | | | 27,261 | |
| | 210,000 | | | General Electric Capital Corp., | | | | |
| | | | | 5.500%, 1/8/20 | | | 248,579 | |
| | 175,000 | | | Goldman Sachs Group, Inc., | | | | |
| | | | | 7.500%, 2/15/19 | | | 220,195 | |
| | 180,000 | | | Health Care REIT, Inc., 6.125%, 4/15/20 | | | 210,816 | |
| | 160,000 | | | HSBC Bank PLC, 144a, 4.125%, 8/12/20 | | | 178,073 | |
| | 37,000 | | | International Lease Finance Corp., | | | | |
| | | | | 5.875%, 8/15/22 | | | 39,191 | |
| | 165,000 | | | JPMorgan Chase & Co., | | | | |
| | | | | 4.250%, 10/15/20 | | | 183,501 | |
| | 16,000 | | | Liberty Mutual Group, Inc., 144a, | | | | |
| | | | | 10.750%, 6/15/58(A) | | | 23,840 | |
| | 40,000 | | | MetLife, Inc., 10.750%, 8/1/39 | | | 60,400 | |
| | 150,000 | | | Morgan Stanley MTN, 4.100%, 1/26/15 | | | 156,333 | |
| | 48,000 | | | MPT Operating Partnership LP / MPT | | | | |
| | | | | Finance Corp., 6.875%, 5/1/21 | | | 52,080 | |
| | 32,000 | | | Omega Healthcare Investors, Inc., | | | | |
| | | | | 6.750%, 10/15/22 | | | 34,800 | |
| | 28,000 | | | PHH Corp., 7.375%, 9/1/19 | | | 31,080 | |
| | 165,000 | | | Rio Tinto Finance USA PLC, | | | | |
| | | | | 2.875%, 8/21/22 | | | 166,091 | |
| | 15,000 | | | Starz LLC / Starz Finance Corp., 144a, | | | | |
| | | | | 5.000%, 9/15/19 | | | 15,375 | |
| | 170,000 | | | Teachers Insurance & Annuity | | | | |
| | | | | Association of America, 144a, | | | | |
| | | | | 6.850%, 12/16/39 | | | 230,567 | |
| | 275,000 | | | WCI Finance LLC / WEA Finance LLC, | | | | |
| | | | | 144a, 5.700%, 10/1/16 | | | 314,024 | |
| | | | | | | | 3,331,583 | |
| | | | | | | | | |
| | | | | Consumer Discretionary — 4.7% | | | | |
| | 8,000 | | | Albea Beauty Holdings SA, 144a, | | | | |
| | | | | 8.375%, 11/1/19 | | | 8,440 | |
| | 16,000 | | | AMC Networks, Inc., 4.750%, 12/15/22 | | | 16,080 | |
| | 10,000 | | | AMC Networks, Inc., 7.750%, 7/15/21 | | | 11,450 | |
| | 25,000 | | | CCO Holdings LLC / CCO Holdings | | | | |
| | | | | Capital Corp., 7.000%, 1/15/19 | | | 26,969 | |
| | 15,000 | | | CCO Holdings LLC / CCO Holdings | | | | |
| | | | | Capital Corp., 7.875%, 4/30/18 | | | 16,144 | |
| | 31,000 | | | Cequel Communications Holdings I | | | | |
| | | | | LLC / Cequel Capital Corp., 144a, | | | | |
| | | | | 6.375%, 9/15/20 | | | 32,279 | |
| | 170,000 | | | Comcast Corp., 5.700%, 7/1/19 | | | 207,135 | |
| | 36,000 | | | CSC Holdings LLC, 8.625%, 2/15/19 | | | 43,020 | |
| | 195,000 | | | DIRECTV Holdings LLC / DIRECTV | | | | |
| | | | | Financing Co., Inc., 2.400%, 3/15/17 | | | 199,742 | |
| | 12,000 | | | DISH DBS Corp., 4.625%, 7/15/17 | | | 12,510 | |
| | 18,000 | | | DISH DBS Corp., 7.875%, 9/1/19 | | | 21,330 | |
| | 3,000 | | | DISH DBS Corp., 144a, 5.000%, 3/15/23 | | | 3,000 | |
| | 22,000 | | | Entravision Communications Corp., | | | | |
| | | | | 8.750%, 8/1/17 | | | 23,870 | |
| | 28,000 | | | Equinox Holdings, Inc., 144a, | | | | |
| | | | | 9.500%, 2/1/16 | | | 29,540 | |
| | 10,000 | | | Exide Technologies, 8.625%, 2/1/18 | | | 8,475 | |
| | 50,000 | | | Goodyear Tire & Rubber Co., | | | | |
| | | | | 8.750%, 8/15/20 | | | 57,625 | |
| | 150,000 | | | Home Depot, Inc., 5.950%, 4/1/41 | | | 202,541 | |
| | 18,000 | | | International Automotive | | | | |
| | | | | Components Group SA, 144a, | | | | |
| | | | | 9.125%, 6/1/18 | | | 16,695 | |
| | 10,000 | | | Libbey Glass, Inc., 6.875%, 5/15/20 | | | 10,750 | |
| | 38,000 | | | Ltd. Brands, Inc., 5.625%, 2/15/22 | | | 41,325 | |
| | 76,000 | | | Meritage Homes Corp., | | | | |
| | | | | 7.150%, 4/15/20 | | | 83,220 | |
| | 290,000 | | | Mondelez International, Inc., | | | | |
| | | | | 4.125%, 2/9/16 | | | 315,956 | |
| | 175,000 | | | News America, Inc., 6.900%, 3/1/19 | | | 219,321 | |
| | 13,000 | | | Penske Automotive Group, Inc., 144a, | | | | |
| | | | | 5.750%, 10/1/22 | | | 13,390 | |
| | 6,000 | | | Pulte Group, Inc., 6.375%, 5/15/33 | | | 5,985 | |
| | 10,000 | | | Quebecor Media, Inc., 144a, | | | | |
| | | | | 5.750%, 1/15/23 | | | 10,538 | |
| | 9,000 | | | Royal Caribbean Cruises Ltd., | | | | |
| | | | | 5.250%, 11/15/22 | | | 9,518 | |
| | 20,000 | | | Sabre, Inc., 144a, 8.500%, 5/15/19 | | | 21,300 | |
| | 59,000 | | | Service Corp. International, | | | | |
| | | | | 8.000%, 11/15/21 | | | 72,570 | |
| | 35,000 | | | ServiceMaster Co., 8.000%, 2/15/20 | | | 36,488 | |
| | 29,000 | | | Stonemor Operating LLC / | | | | |
| | | | | Cornerstone Family Services of WV | | | | |
| | | | | / Osiris Holding, 10.250%, 12/1/17 | | | 29,870 | |
| | 18,000 | | | Suburban Propane Partners | | | | |
| | | | | LP/Suburban Energy Finance Corp., | | | | |
| | | | | 7.500%, 10/1/18 | | | 19,395 | |
| | 12,000 | | | Tenneco, Inc., 6.875%, 12/15/20 | | | 13,065 | |
| | 31,000 | | | Tenneco, Inc., 7.750%, 8/15/18 | | | 33,635 | |
| | 175,000 | | | Time Warner Cable, Inc., | | | | |
| | | | | 4.125%, 2/15/21 | | | 191,647 | |
| | 7,000 | | | Tomkins LLC / Tomkins, Inc., | | | | |
| | | | | 9.000%, 10/1/18 | | | 7,840 | |
| | 10,000 | | | Tower Automotive Holdings USA LLC | | | | |
| | | | | / TA Holdings Finance, Inc., 144a, | | | | |
| | | | | 10.625%, 9/1/17 | | | 10,950 | |
| | 175,000 | | | Viacom, Inc., 6.250%, 4/30/16 | | | 202,872 | |
| | 70,000 | | | Visteon Corp., 6.750%, 4/15/19 | | | 74,550 | |
| | 150,000 | | | Walt Disney Co. (The) MTN, | | | | |
| | | | | 3.700%, 12/1/42 | | | 150,158 | |
| | | | | | | | 2,511,188 | |
Touchstone Core Bond Fund (Continued)
| Principal | | | | | Market | |
| Amount | | | | | Value | |
| | | | | Corporate Bonds — 24.4% (Continued) | | | | |
| | | | | | | | | |
| | | | | Energy — 4.0% | | | | |
| $ | 19,000 | | | Access Midstream Partners LP / ACMP | | | | |
| | | | | Finance Corp., 4.875%, 5/15/23 | | $ | 19,285 | |
| | 9,000 | | | Access Midstream Partners LP / ACMP | | | | |
| | | | | Finance Corp., 6.125%, 7/15/22 | | | 9,698 | |
| | 5,000 | | | Atlas Pipeline Escrow LLC, 144a, | | | | |
| | | | | 6.625%, 10/1/20 | | | 5,175 | |
| | 11,000 | | | Atlas Pipeline Partners LP / Atlas | | | | |
| | | | | Pipeline Finance Corp., 144a, | | | | |
| | | | | 6.625%, 10/1/20 | | | 11,385 | |
| | 25,000 | | | Basic Energy Services, Inc., 144a, | | | | |
| | | | | 7.750%, 10/15/22 | | | 24,375 | |
| | 13,000 | | | Carrizo Oil & Gas, Inc., 7.500%, 9/15/20 | | | 13,358 | |
| | 26,000 | | | Carrizo Oil & Gas, Inc., | | | | |
| | | | | 8.625%, 10/15/18 | | | 28,080 | |
| | 60,000 | | | Chesapeake Energy Corp., | | | | |
| | | | | 6.625%, 8/15/20 | | | 64,350 | |
| | 10,000 | | | Chesapeake Energy Corp., | | | | |
| | | | | 7.250%, 12/15/18 | | | 10,900 | |
| | 19,000 | | | Cloud Peak Energy Resources LLC / | | | | |
| | | | | Cloud Peak Energy Finance Corp., | | | | |
| | | | | 8.500%, 12/15/19 | | | 20,852 | |
| | 10,000 | | | Consol Energy, Inc., 8.000%, 4/1/17 | | | 10,825 | |
| | 10,000 | | | Consol Energy, Inc., 8.250%, 4/1/20 | | | 10,825 | |
| | 36,000 | | | Copano Energy LLC / Copano Energy | | | | |
| | | | | Finance Corp., 7.125%, 4/1/21 | | | 38,655 | |
| | 51,000 | | | Crestwood Midstream Partners LP / | | | | |
| | | | | Crestwood Midstream Finance | | | | |
| | | | | Corp., 7.750%, 4/1/19 | | | 52,912 | |
| | 32,000 | | | Drill Rigs Holdings, Inc., 144a, | | | | |
| | | | | 6.500%, 10/1/17 | | | 31,840 | |
| | 205,000 | | | El Paso Natural Gas Co., | | | | |
| | | | | 5.950%, 4/15/17 | | | 237,016 | |
| | 175,000 | | | Enterprise Products Operating LLC, | | | | |
| | | | | 3.200%, 2/1/16 | | | 184,911 | |
| | 77,000 | | | Enterprise Products Operating LLC, | | | | |
| | | | | 7.000%, 6/1/67(A) | | | 82,582 | |
| | 27,000 | | | Expro Finance Luxembourg SCA, 144a, | | | | |
| | | | | 8.500%, 12/15/16 | | | 28,215 | |
| | 30,000 | | | Forest Oil Corp., 7.250%, 6/15/19 | | | 30,150 | |
| | 58,000 | | | Genesis Energy LP / Genesis Energy | | | | |
| | | | | Finance Corp., 7.875%, 12/15/18 | | | 61,915 | |
| | 40,000 | | | Hilcorp Energy I LP / Hilcorp Finance | | | | |
| | | | | Co., 144a, 7.625%, 4/15/21 | | | 43,600 | |
| | 46,000 | | | Linn Energy LLC / Linn Energy Finance | | | | |
| | | | | Corp., 8.625%, 4/15/20 | | | 50,140 | |
| | 12,000 | | | MarkWest Energy Partners LP / | | | | |
| | | | | MarkWest Energy Finance Corp., | | | | |
| | | | | 5.500%, 2/15/23 | | | 13,020 | |
| | 76,000 | | | Martin Midstream Partners LP / Martin | | | | |
| | | | | Midstream Finance Corp., | | | | |
| | | | | 8.875%, 4/1/18 | | | 80,940 | |
| | 14,000 | | | Newfield Exploration Co., | | | | |
| | | | | 6.875%, 2/1/20 | | | 14,980 | |
| | 17,000 | | | Pacific Drilling V Ltd., 144a, | | | | |
| | | | | 7.250%, 12/1/17 | | | 17,638 | |
| | 60,000 | | | Peabody Energy Corp., | | | | |
| | | | | 6.000%, 11/15/18 | | | 63,750 | |
| | 250,000 | | | Petrobras International Finance Co. - | | | | |
| | | | | Pifco, 5.375%, 1/27/21 | | | 281,455 | |
| | 170,000 | | | Phillips 66, 144a, 4.300%, 4/1/22 | | | 189,961 | |
| | 44,000 | | | Pioneer Energy Services Corp., | | | | |
| | | | | 9.875%, 3/15/18 | | | 47,850 | |
| | 140,000 | | | Plains All American Pipeline LP / PAA | | | | |
| | | | | Finance Corp., 6.650%, 1/15/37 | | | 183,337 | |
| | 24,000 | | | Plains Exploration & Production Co., | | | | |
| | | | | 6.875%, 2/15/23 | | | 27,420 | |
| | 70,000 | | | Regency Energy Partners LP / | | | | |
| | | | | Regency Energy Finance Corp., | | | | |
| | | | | 6.875%, 12/1/18 | | | 76,300 | |
| | 4,000 | | | SandRidge Energy, Inc., | | | | |
| | | | | 7.500%, 2/15/23 | | | 4,280 | |
| | 33,000 | | | Targa Resources Partners LP / Targa | | | | |
| | | | | Resources Partners Finance Corp., | | | | |
| | | | | 144a, 6.375%, 8/1/22 | | | 35,970 | |
| | 40,000 | | | Tesoro Logistics LP / Tesoro Logistics | | | | |
| | | | | Finance Corp., 144a, | | | | |
| | | | | 5.875%, 10/1/20 | | | 41,500 | |
| | | | | | | | 2,149,445 | |
| | | | | | | | | |
| | | | | Industrials — 2.3% | | | | |
| | 14,000 | | | Accuride Corp., 9.500%, 8/1/18 | | | 13,510 | |
| | 39,000 | | | Amsted Industries, Inc., 144a, | | | | |
| | | | | 8.125%, 3/15/18 | | | 41,730 | |
| | 7,000 | | | Aviation Capital Group Corp., 144a, | | | | |
| | | | | 6.750%, 4/6/21 | | | 7,236 | |
| | 46,000 | | | Belden, Inc., 144a, 5.500%, 9/1/22 | | | 47,265 | |
| | 265,000 | | | Burlington Northern Santa Fe LLC, | | | | |
| | | | | 5.750%, 5/1/40 | | | 326,698 | |
| | 7,000 | | | BWAY Holding Co., 10.000%, 6/15/18 | | | 7,770 | |
| | 16,000 | | | Calcipar SA, 144a, 6.875%, 5/1/18 | | | 16,320 | |
| | 12,000 | | | Chrysler Group LLC / CG Co.-Issuer, | | | | |
| | | | | Inc., 8.250%, 6/15/21 | | | 13,200 | |
| | 7,883 | | | Continental Airlines 2003-ERJ1 Pass | | | | |
| | | | | Through Trust, Ser RJ03, | | | | |
| | | | | 7.875%, 7/2/18 | | | 8,120 | |
| | 22,000 | | | Dynacast International LLC / Dynacast | | | | |
| | | | | Finance, Inc., 9.250%, 7/15/19 | | | 23,540 | |
| | 25,000 | | | Gibraltar Industries, Inc., Ser B, | | | | |
| | | | | 8.000%, 12/1/15 | | | 25,378 | |
| | 14,000 | | | Griffon Corp., 7.125%, 4/1/18 | | | 14,840 | |
| | 20,000 | | | JB Poindexter & Co., Inc., 144a, | | | | |
| | | | | 9.000%, 4/1/22 | | | 20,675 | |
| | 14,000 | | | JM Huber Corp., 144a, | | | | |
| | | | | 9.875%, 11/1/19 | | | 15,540 | |
| | 6,000 | | | Liberty Tire Recycling, 144a, | | | | |
| | | | | 11.000%, 10/1/16 | | | 5,550 | |
| | 14,000 | | | Navios South American Logistics, Inc. | | | | |
| | | | | / Navios Logistics Finance US Inc., | | | | |
| | | | | 9.250%, 4/15/19 | | | 13,738 | |
| | 180,000 | | | Norfolk Southern Corp., | | | | |
| | | | | 5.750%, 4/1/18 | | | 214,967 | |
Touchstone Core Bond Fund (Continued)
| Principal | | | | | Market | |
| Amount | | | | | Value | |
| | | | | Corporate Bonds — 24.4% (Continued) | | | | |
| | | | | | | | | |
| | | | | Industrials — (Continued) | | | | |
| $ | 200,000 | | | Republic Services, Inc., 3.550%, 6/1/22 | | $ | 208,523 | |
| | 4,000 | | | RR Donnelley & Sons Co., | | | | |
| | | | | 7.250%, 5/15/18 | | | 3,860 | |
| | 18,000 | | | Stena AB, 7.000%, 12/1/16 | | | 17,955 | |
| | 16,000 | | | United Rentals North America, Inc., | | | | |
| | | | | 9.250%, 12/15/19 | | | 18,240 | |
| | 175,000 | | | Xstrata Finance Canada Ltd., 144a, | | | | |
| | | | | 3.600%, 1/15/17 | | | 184,295 | |
| | | | | | | | 1,248,950 | |
| | | | | | | | | |
| | | | | Utilities — 2.0% | | | | |
| | 45,000 | | | AES Corp. (The), 8.000%, 10/15/17 | | | 51,975 | |
| | 50,000 | | | Ameren Energy Generating Co., | | | | |
| | | | | 7.000%, 4/15/18† | | | 36,250 | |
| | 18,500 | | | Bruce Mansfield Unit, 6.850%, 6/1/34 | | | 19,277 | |
| | 27,000 | | | Calpine Corp., 144a, 7.500%, 2/15/21 | | | 29,835 | |
| | 13,000 | | | Calpine Corp., 144a, 7.875%, 7/31/20 | | | 14,592 | |
| | 65,000 | | | CenterPoint Energy, Inc., | | | | |
| | | | | 5.950%, 2/1/17 | | | 75,514 | |
| | 155,000 | | | CMS Energy Corp., 8.750%, 6/15/19 | | | 201,658 | |
| | 50,000 | | | InterGen NV, 144a, 9.000%, 6/30/17 | | | 44,750 | |
| | 145,000 | | | NextEra Energy Capital Holdings, Inc., | | | | |
| | | | | 6.350%, 10/1/66(A) | | | 154,788 | |
| | 165,000 | | | PPL Energy Supply LLC, | | | | |
| | | | | 6.500%, 5/1/18 | | | 197,578 | |
| | 195,000 | | | Rockies Express Pipeline LLC, 144a, | | | | |
| | | | | 6.250%, 7/15/13 | | | 199,388 | |
| | 29,000 | | | Sabine Pass LNG LP, 144a, | | | | |
| | | | | 6.500%, 11/1/20 | | | 29,508 | |
| | | | | | | | 1,055,113 | |
| | | | | | | | | |
| | | | | Telecommunication Services — 1.7% | | | | |
| | 125,000 | | | AT&T, Inc., 6.550%, 2/15/39 | | | 164,264 | |
| | 45,000 | | | CenturyLink, Inc., 6.450%, 6/15/21 | | | 49,725 | |
| | 15,000 | | | Crown Castle International Corp., | | | | |
| | | | | 144a, 5.250%, 1/15/23 | | | 16,050 | |
| | 30,000 | | | Frontier Communications Corp., | | | | |
| | | | | 8.125%, 10/1/18 | | | 34,500 | |
| | 40,000 | | | Frontier Communications Corp., | | | | |
| | | | | 8.500%, 4/15/20 | | | 46,000 | |
| | 14,000 | | | MetroPCS Wireless, Inc., | | | | |
| | | | | 7.875%, 9/1/18 | | | 15,155 | |
| | 13,000 | | | Nielsen Finance LLC / Nielsen Finance | | | | |
| | | | | Co., 144a, 4.500%, 10/1/20 | | | 12,935 | |
| | 5,000 | | | NII Capital Corp., 7.625%, 4/1/21 | | | 3,788 | |
| | 7,000 | | | NII Capital Corp., 8.875%, 12/15/19 | | | 5,565 | |
| | 11,000 | | | PAETEC Holding Corp., | | | | |
| | | | | 8.875%, 6/30/17 | | | 11,798 | |
| | 11,000 | | | Sinclair Television Group, Inc., 144a, | | | | |
| | | | | 6.125%, 10/1/22 | | | 11,674 | |
| | 12,000 | | | Sprint Capital Corp., 6.875%, 11/15/28 | | | 12,480 | |
| | 66,000 | | | Sprint Nextel Corp., 144a, | | | | |
| | | | | 9.000%, 11/15/18 | | | 81,510 | |
| | 7,000 | | | TW Telecom Holdings, Inc., | | | | |
| | | | | 8.000%, 3/1/18 | | | 7,665 | |
| | 275,000 | | | Verizon Communications, Inc., | | | | |
| | | | | 6.250%, 4/1/37 | | | 361,514 | |
| | 41,000 | | | Wind Acquisition Finance SA, 144a, | | | | |
| | | | | 11.750%, 7/15/17 | | | 42,948 | |
| | | | | | | | 877,571 | |
| | | | | | | | | |
| | | | | Materials — 1.1% | | | | |
| | 25,000 | | | AK Steel Corp., 7.625%, 5/15/20 | | | 21,750 | |
| | 36,000 | | | Aleris International, Inc., | | | | |
| | | | | 7.625%, 2/15/18 | | | 36,630 | |
| | 12,000 | | | ArcelorMittal, 5.750%, 8/5/20† | | | 12,024 | |
| | 16,000 | | | ArcelorMittal, 7.500%, 10/15/39 | | | 15,040 | |
| | 175,000 | | | Barrick Gold Corp., 3.850%, 4/1/22 | | | 185,242 | |
| | 47,000 | | | Cascades, Inc., 7.875%, 1/15/20 | | | 50,055 | |
| | 57,000 | | | FMG Resources August 2006 Pty Ltd., | | | | |
| | | | | 144a, 6.875%, 4/1/22 | | | 58,282 | |
| | 42,000 | | | HudBay Minerals, Inc., 144a, | | | | |
| | | | | 9.500%, 10/1/20 | | | 44,415 | |
| | 18,000 | | | Koppers, Inc., 7.875%, 12/1/19 | | | 19,800 | |
| | 45,000 | | | Longview Fibre Paper & Packaging, | | | | |
| | | | | Inc., 144a, 8.000%, 6/1/16 | | | 47,250 | |
| | 7,000 | | | Novelis, Inc., 8.375%, 12/15/17 | | | 7,718 | |
| | 9,000 | | | PolyOne Corp., 7.375%, 9/15/20 | | | 9,832 | |
| | 37,000 | | | Tembec Industries, Inc., | | | | |
| | | | | 11.250%, 12/15/18 | | | 39,220 | |
| | 12,000 | | | Texas Industries, Inc., 9.250%, 8/15/20 | | | 12,870 | |
| | 8,000 | | | Vulcan Materials Co., 7.500%, 6/15/21 | | | 9,120 | |
| | | | | | | | 569,248 | |
| | | | | | | | | |
| | | | | Consumer Staples — 1.1% | | | | |
| | 190,000 | | | Anheuser-Busch InBev Worldwide, | | | | |
| | | | | Inc., 8.200%, 1/15/39 | | | 312,032 | |
| | 23,000 | | | BI-LO LLC / BI-LO Finance Corp., 144a, | | | | |
| | | | | 9.250%, 2/15/19 | | | 24,610 | |
| | 20,000 | | | Central Garden and Pet Co., | | | | |
| | | | | 8.250%, 3/1/18 | | | 21,150 | |
| | 37,000 | | | Del Monte Corp., 7.625%, 2/15/19 | | | 38,572 | |
| | 64,000 | | | JBS USA LLC / JBS USA Finance, Inc., | | | | |
| | | | | 144a, 7.250%, 6/1/21 | | | 64,160 | |
| | 20,000 | | | JBS USA LLC / JBS USA Finance, Inc., | | | | |
| | | | | 144a, 8.250%, 2/1/20 | | | 21,200 | |
| | 52,000 | | | Post Holdings, Inc., 144a, | | | | |
| | | | | 7.375%, 2/15/22 | | | 56,972 | |
| | 26,000 | | | Smithfield Foods, Inc., 6.625%, 8/15/22 | | | 28,730 | |
| | | | | | | | 567,426 | |
| | | | | | | | | |
| | | | | Information Technology — 0.6% | | | | |
| | 50,000 | | | Equinix, Inc., 7.000%, 7/15/21 | | | 55,500 | |
| | 17,000 | | | Fidelity National Information Services, | | | | |
| | | | | Inc., 5.000%, 3/15/22 | | | 18,232 | |
| | 5,000 | | | Hughes Satellite Systems Corp., | | | | |
| | | | | 6.500%, 6/15/19 | | | 5,512 | |
| | 100,000 | | | Intel Corp., 3.300%, 10/1/21 | | | 106,036 | |
| | 58,000 | | | Kemet Corp., 10.500%, 5/1/18 | | | 57,202 | |
Touchstone Core Bond Fund (Continued)
| Principal | | | | | Market | |
| Amount | | | | | Value | |
| | | | | Corporate Bonds — 24.4% (Continued) | | | | |
| | | | | | | | | |
| | | | | Information Technology — (Continued) | | | | |
| $ | 80,000 | | | Viasat, Inc., 6.875%, 6/15/20 | | $ | 83,600 | |
| | | | | | | | 326,082 | |
| | | | | | | | | |
| | | | | Health Care — 0.5% | | | | |
| | 17,000 | | | Accellent, Inc., 8.375%, 2/1/17 | | | 17,850 | |
| | 42,000 | | | Apria Healthcare Group, Inc., | | | | |
| | | | | 11.250%, 11/1/14 | | | 43,418 | |
| | 39,000 | | | Capella Healthcare, Inc., | | | | |
| | | | | 9.250%, 7/1/17 | | | 41,828 | |
| | 17,000 | | | CHS/Community Health Systems, Inc., | | | | |
| | | | | 7.125%, 7/15/20 | | | 18,148 | |
| | 23,000 | | | HCA, Inc., 5.875%, 5/1/23 | | | 23,805 | |
| | 56,000 | | | HCA, Inc., 6.500%, 2/15/20 | | | 63,000 | |
| | 12,000 | | | Kindred Healthcare, Inc., | | | | |
| | | | | 8.250%, 6/1/19† | | | 11,670 | |
| | 55,000 | | | ResCare, Inc., 10.750%, 1/15/19 | | | 61,050 | |
| | 12,000 | | | Universal Hospital Services, Inc., 144a, | | | | |
| | | | | 7.625%, 8/15/20 | | | 12,645 | |
| | | | | | | | 293,414 | |
| | | | | | | | | |
| | | | | Technology — 0.1% | | | | |
| | 30,000 | | | Seagate HDD Cayman, 6.875%, 5/1/20 | | | 31,912 | |
| | | | | Total Corporate Bonds | | $ | 12,961,932 | |
| | | | | | | | | |
| | | | | U.S. Treasury Obligations — 34.6% | | | | |
| | 95,000 | | | U.S. Treasury Bond, 2.750%, 8/15/42 | | | 91,734 | |
| | 215,000 | | | U.S. Treasury Bond, 3.000%, 5/15/42 | | | 219,031 | |
| | 1,010,000 | | | U.S. Treasury Bond, 3.125%, 11/15/41 | | | 1,057,186 | |
| | 180,000 | | | U.S. Treasury Bond, 3.125%, 2/15/42 | | | 188,212 | |
| | 2,675,000 | | | U.S. Treasury Note, 0.250%, 3/31/14 | | | 2,676,255 | |
| | 4,455,000 | | | U.S. Treasury Note, 0.250%, 9/30/14 | | | 4,456,042 | |
| | 440,000 | | | U.S. Treasury Note, 0.250%, 9/15/15 | | | 439,037 | |
| | 705,000 | | | U.S. Treasury Note, 1.000%, 3/31/17 | | | 717,613 | |
| | 8,595,000 | | | U.S. Treasury Note, 1.625%, 11/15/22 | | | 8,500,988 | |
| | | | | Total U.S. Treasury Obligations | | $ | 18,346,098 | |
| | | | | | | | | |
| | | | | U.S. Government Mortgage-Backed Obligations — 18.8% | | | | |
| | 167,681 | | | FHLMC, Pool #A56988, 5.500%, 2/1/37 | | | 181,143 | |
| | 363,885 | | | FHLMC, Pool #A95946, 4.000%, 1/1/41 | | | 388,809 | |
| | 341,327 | | | FHLMC, Pool #A96485, 4.500%, 1/1/41 | | | 378,008 | |
| | 286,798 | | | FHLMC, Pool #G03217, 5.500%, 9/1/37 | | | 309,822 | |
| | 137,252 | | | FHLMC, Pool #G03781, 6.000%, 1/1/38 | | | 149,365 | |
| | 293,020 | | | FHLMC, Pool #G06031, 5.500%, 3/1/40 | | | 316,543 | |
| | 55,956 | | | FNMA, Pool #254759, 4.500%, 6/1/18 | | | 60,346 | |
| | 18,757 | | | FNMA, Pool #535290, 8.000%, 5/1/30 | | | 23,110 | |
| | 15,292 | | | FNMA, Pool #561741, 7.500%, 1/1/31 | | | 18,670 | |
| | 75,153 | | | FNMA, Pool #889734, 5.500%, 6/1/37 | | | 81,750 | |
| | 239,361 | | | FNMA, Pool #899079, 5.000%, 3/1/37 | | | 259,287 | |
| | 128,100 | | | FNMA, Pool #933806, 5.000%, 5/1/38 | | | 138,764 | |
| | 43,327 | | | FNMA, Pool #974401, 4.500%, 4/1/23 | | | 46,964 | |
| | 64,575 | | | FNMA, Pool #974403, 4.500%, 4/1/23 | | | 70,217 | |
| | 99,687 | | | FNMA, Pool #984256, 5.000%, 6/1/23 | | | 108,303 | |
| | 75,506 | | | FNMA, Pool #995220, 6.000%, 11/1/23 | | | 82,976 | |
| | 78,877 | | | FNMA, Pool #995472, 5.000%, 11/1/23 | | | 85,410 | |
| | 258,131 | | | FNMA, Pool #AB1149, 5.000%, 6/1/40 | | | 282,177 | |
| | 157,950 | | | FNMA, Pool #AB1800, 4.000%, 11/1/40 | | | 173,586 | |
| | 133,156 | | | FNMA, Pool #AB5989, 2.500%, 8/1/27 | | | 139,342 | |
| | 366,494 | | | FNMA, Pool #AD3795, 4.500%, 4/1/40 | | | 397,166 | |
| | 590,493 | | | FNMA, Pool #AD9150, 5.000%, 8/1/40 | | | 651,091 | |
| | 879,081 | | | FNMA, Pool #AE0548, 4.500%, 11/1/40 | | | 952,651 | |
| | 189,781 | | | FNMA, Pool #AE0831, 6.000%, 9/1/39 | | | 207,774 | |
| | 427,741 | | | FNMA, Pool #AE4429, 4.000%, 10/1/40 | | | 458,991 | |
| | 62,075 | | | FNMA, Pool #AH2666, 4.000%, 1/1/26 | | | 66,490 | |
| | 91,554 | | | FNMA, Pool #AH3493, 4.000%, 2/1/26 | | | 98,093 | |
| | 269,049 | | | FNMA, Pool #AI0805, 4.500%, 7/1/41 | | | 292,070 | |
| | 250,939 | | | FNMA, Pool #AI2999, 3.500%, 6/1/26 | | | 266,353 | |
| | 200,627 | | | FNMA, Pool #AI6697, 3.000%, 9/1/26 | | | 211,918 | |
| | 2,500,000 | | | FNMA, TBA | | | 2,614,062 | |
| | 3,985 | | | GNMA, Pool #434792, 8.000%, 7/15/30 | | | 4,524 | |
| | 334,342 | | | GNMA, Pool #736696, 4.500%, 5/15/40 | | | 369,044 | |
| | 51,983 | | | GNMA, Pool #748495, 4.000%, 8/15/40 | | | 57,403 | |
| | 18,742 | | | GNMA, Pool #8503, 1.750%, 9/20/24(A) | | | 19,477 | |
| | | | | Total U.S. Government Mortgage-Backed Obligations | | $ | 9,961,699 | |
| | | | | | | | | |
| | | | | Commercial Mortgage-Backed Securities — 15.0% | | | | |
| | 280,000 | | | Banc of America Merrill Lynch | | | | |
| | | | | Commercial Mortgage Trust 2006-2, | | | | |
| | | | | Ser 2006-2, Class A3, | | | | |
| | | | | 5.698%, 5/10/45(A) | | | 281,228 | |
| | 187,301 | | | Banc of America Merrill Lynch | | | | |
| | | | | Commercial Mortgage, Inc., Ser | | | | |
| | | | | 2005-4, Class A3, 4.891%, 7/10/45 | | | 187,549 | |
| | 365,000 | | | Banc of America Merrill Lynch | | | | |
| | | | | Commercial Mortgage, Inc., Ser | | | | |
| | | | | 2006-6, Class A3, 5.369%, 10/10/45 | | | 397,573 | |
| | 255,073 | | | Banc of America Merrill Lynch | | | | |
| | | | | Commercial Mortgage, Inc., Ser | | | | |
| | | | | 2007-1, Class AAB, 5.422%, 1/15/49 | | | 268,830 | |
| | 403,629 | | | Banc of America Merrill Lynch | | | | |
| | | | | Commercial Mortgage, Inc., Ser | | | | |
| | | | | 2007-2, Class AAB, | | | | |
| | | | | 5.753%, 4/10/49(A) | | | 437,737 | |
| | 150,000 | | | Banc of America Merrill Lynch | | | | |
| | | | | Commercial Mortgage, Inc., Ser | | | | |
| | | | | 2008-1, Class A3, 6.168%, 2/10/51(A) | | | 159,789 | |
| | 575,000 | | | Bear Stearns Commercial Mortgage | | | | |
| | | | | Securities, Ser 2005-PWR9, Class | | | | |
| | | | | A4A, 4.871%, 9/11/42†† | | | 631,657 | |
| | 294,580 | | | Bear Stearns Commercial Mortgage | | | | |
| | | | | Securities, Ser 2006-PW12, Class | | | | |
| | | | | AAB, 5.687%, 9/11/38(A)†† | | | 298,875 | |
| | 230,000 | | | Bear Stearns Commercial Mortgage | | | | |
| | | | | Securities, Ser 2006-PW13, Class A3, | | | | |
| | | | | 5.518%, 9/11/41†† | | | 238,023 | |
Touchstone Core Bond Fund (Continued)
| Principal | | | | | Market | |
| Amount | | | | | Value | |
| | | | | | | |
| | | | | Commercial Mortgage-Backed Securities — 15.0% (Continued) | | | | |
| $ | 550,000 | | | Bear Stearns Commercial Mortgage | | | | |
| | | | | Securities, Ser 2007-PW16, Class A4, | | | | |
| | | | | 5.715%, 5/11/17(A)†† | | $ | 651,496 | |
| | 135,000 | | | Commercial Mortgage Pass Through | | | | |
| | | | | Certificates, Ser 2005-C6, Class A5A, | | | | |
| | | | | 5.116%, 6/10/44(A) | | | 148,977 | |
| | 245,000 | | | First Union Commercial Mortgage | | | | |
| | | | | Trust, Ser 1999-C1, Class F, 144a, | | | | |
| | | | | 5.350%, 10/15/35 | | | 257,886 | |
| | 234,865 | | | GE Capital Commercial Mortgage | | | | |
| | | | | Corp., Ser 2005-C4, Class ASB, | | | | |
| | | | | 5.275%, 11/10/45(A) | | | 243,341 | |
| | 244,655 | | | Greenwich Capital Commercial | | | | |
| | | | | Funding Corp., Ser 2005-GG3, Class | | | | |
| | | | | A3, 4.569%, 8/10/42 | | | 245,187 | |
| | 269,446 | | | GS Mortgage Securities Corp. II, Ser | | | | |
| | | | | 2006-GG8, Class AAB, | | | | |
| | | | | 5.535%, 11/10/39 | | | 279,461 | |
| | 404,866 | | | JP Morgan Chase Commercial | | | | |
| | | | | Mortgage Securities Corp., Ser | | | | |
| | | | | 2006-CB14, Class A3B, | | | | |
| | | | | 5.493%, 12/12/44(A) | | | 412,769 | |
| | 390,000 | | | LB-UBS Commercial Mortgage Trust, | | | | |
| | | | | Ser 2006-C3, Class A3, | | | | |
| | | | | 5.689%, 3/15/32(A)†† | | | 390,344 | |
| | 601,481 | | | Merrill Lynch/Countrywide | | | | |
| | | | | Commercial Mortgage Trust, Ser | | | | |
| | | | | 2007-5, Class ASB, 5.362%, 8/12/48 | | | 635,971 | |
| | 425,425 | | | Morgan Stanley Capital I, Ser | | | | |
| | | | | 2006-HQ9, Class A3, | | | | |
| | | | | 5.712%, 7/12/44 | | | 431,063 | |
| | 483,550 | | | Morgan Stanley Capital I, Ser | | | | |
| | | | | 2007-T25, Class AAB, | | | | |
| | | | | 5.508%, 11/12/49 | | | 507,257 | |
| | 505,000 | | | Wachovia Bank Commercial Mortgage | | | | |
| | | | | Trust, Ser 2006-C29, Class A3, | | | | |
| | | | | 5.313%, 11/15/48†† | | | 522,228 | |
| | 309,149 | | | Wachovia Bank Commercial Mortgage | | | | |
| | | | | Trust, Ser 2007-C34, Class APB, | | | | |
| | | | | 5.617%, 5/15/46†† | | | 333,911 | |
| | | | | Total Commercial Mortgage-Backed Securities | | $ | 7,961,152 | |
| | | | | | | | | |
| | | | | Commercial Paper — 4.9% | | | | |
| | 650,000 | | | AGL Capital Corp., 0.470%, 2/12/13 | | | 649,747 | |
| | 650,000 | | | DCP Midstream LLC, 0.480%, 2/12/13 | | | 649,747 | |
| | 650,000 | | | National Grid, 0.601%, 2/12/13 | | | 649,747 | |
| | 650,000 | | | Spectra, 0.751%, 2/12/13 | | | 649,685 | |
| | | | | Total Commercial Paper | | $ | 2,598,926 | |
| | | | | | | | | |
| | | | | Non-Agency Collateralized Mortgage Obligations — 2.1% | | | | |
| | 116,084 | | | Deutsche ALT-A Securities, Inc. | | | | |
| | | | | Alternate Loan Trust, Ser 2003-2XS, | | | | |
| | | | | Class A6, 4.970%, 9/25/33(B) | | | 116,021 | |
| | 461,415 | | | Deutsche ALT-A Securities, Inc. | | | | |
| | | | | Alternate Loan Trust, Ser 2005-3, | | | | |
| | | | | Class 4A4, 5.250%, 6/25/35 | | | 469,372 | |
| | 213,606 | | | Residential Asset Securitization Trust, | | | | |
| | | | | Ser 2006-A1, Class 1A3, | | | | |
| | | | | 6.000%, 4/25/36 | | | 177,630 | |
| | 10,987 | | | Residential Funding Mortgage | | | | |
| | | | | Securities I, Ser 2006-S2, Class A2, | | | | |
| | | | | 5.750%, 2/25/36 | | | — | |
| | 244,763 | | | Structured Asset Securities Corp., Ser | | | | |
| | | | | 2005-17, Class 5A1, | | | | |
| | | | | 5.500%, 10/25/35 | | | 226,363 | |
| | 152,044 | | | Washington Mutual Alternative | | | | |
| | | | | Mortgage Pass-Through | | | | |
| | | | | Certificates, Ser 2005-9, Class 2A4, | | | | |
| | | | | 5.500%, 11/25/35†† | | | 131,963 | |
| | | | | Total Non-Agency Collateralized Mortgage Obligations | | $ | 1,121,349 | |
| | | | | | | | | |
| | | | | Agency Collateralized Mortgage Obligations — 0.9% | | | | |
| | 450,000 | | | FHLMC Multifamily Structured Pass | | | | |
| | | | | Through Certificates, Ser K501 Class | | | | |
| | | | | A2, 1.655%, 11/25/16 | | | 463,761 | |
| | 23,366 | | | GNMA, Ser 2003-11, Class GJ, | | | | |
| | | | | 4.000%, 10/17/29 | | | 25,350 | |
| | | | | | | | | |
| | | | | Total Agency Collateralized Mortgage Obligations | | $ | 489,111 | |
| | | | | | | | | |
| | | | | Municipal Bonds — 0.8% | | | | |
| | | | | | | | | |
| | | | | California — 0.4% | | | | |
| | 180,000 | | | California St, UTGO, Ser 2009, | | | | |
| | | | | 5.950%, 4/1/16 | | | 201,902 | |
| | | | | | | | | |
| | | | | Georgia — 0.4% | | | | |
| | 190,000 | | | Municipal Electric Auth. of Georgia | | | | |
| | | | | Rev, Ser 2010, 6.655%, 4/1/57 | | | 225,614 | |
| | | | | Total Municipal Bonds | | $ | 427,516 | |
| Shares | | | | | | |
| | | | | Preferred Stocks — 0.4% | | | | |
| | | | | | | | | |
| | | | | Financials — 0.4% | | | | |
| | 1,363 | | | Ally Financial, Inc., 7.375% | | | 33,911 | |
| | 7,900 | | | Citigroup Capital VIII, 6.950% | | | 199,001 | |
| | | | | Total Preferred Stocks | | $ | 232,912 | |
Touchstone Core Bond Fund (Continued)
| Principal | | | | | Market | |
| Amount | | | | | Value | |
| | | | | | | | | |
| | | | Asset-Backed Security — 0.4% | | | | |
| $ | 364,111 | | | Countrywide Asset-Backed | | | | |
| | | | | Certificates, Ser 2007-S1, Class A5, | | | | |
| | | | | 6.018%, 11/25/36(A) | | $ | 209,508 | |
| Shares | | | | | | |
| | | | Investment Funds — 2.5% | | | | |
| | 80,061 | | | Invesco Government & Agency | | | | |
| | | | | Portfolio** | | $ | 80,061 | |
| | 1,256,823 | | | Touchstone Institutional Money | | | | |
| | | | | Market Fund^ | | | 1,256,823 | |
| | | | | Total Investment Funds | | $ | 1,336,884 | |
| | | | | | | | | |
| | | | | Total Investment Securities —104.8% | | | | |
| | | | | (Cost $54,264,885) | | $ | 55,647,087 | |
| | | | | | | | | |
| | | | | Liabilities in Excess of Other Assets — (4.8%) | | | (2,561,918 | ) |
| | | | | | | | | |
| | | | | Net Assets — 100.0% | | $ | 53,085,169 | |
| (A) | Variable rate security - the rate reflected is the rate in effect as of December 31, 2012. |
| † | All or a portion of the security is on loan. The total value of the securities on loan as of December 31, 2012 was $76,639. |
| (B) | Step Bond. A bond that pays an initial interest rate for the first period and then a higher interest rate for the following periods until maturity. The interest rate shown reflects the rate in effect at December 31, 2012. |
| ** | Represents collateral for securities loaned. |
| ^ | Affiliated Fund. See Note 4 in Notes to Financial Statements. |
| †† | The issuers and/or sponsors of certain mortgage-backed securities may no longer exist; however, the securities held by the Fund are separate legal entities organized as trusts and publicly traded. The Fund receives principal and interest payments directly from these trusts. |
Portfolio Abbreviations:
FHLMC - Federal Home Loan Mortgage Association
FNMA - Federal National Mortgage Association
GNMA - Government National Mortgage Association
LLC - Limited Liability Company
LP - Limited Partnership
MTN -Medium Term Note
PLC - Public Limited Company
REIT - Real Estate Investment Trust
UTGO - Unlimited Tax General Obligation
Other Information:
The inputs or methodology used for valuing securities may not be an indication of the risk associated with investing in those securities. For more information on valuation inputs, and their aggregation into the levels used in the table below, please refer to the security valuation section in the accompanying Notes to Financial Statements.
Touchstone Core Bond Fund (Continued)
| | | Valuation inputs at Reporting Date: | |
| Description | | Level 1 | | | Level 2 | | | Level 3 | | | Total | |
| Corporate Bonds | | $ | — | | | $ | 12,961,932 | | | $ | — | | | $ | 12,961,932 | |
| U.S. Treasury Obligations | | | — | | | | 18,346,098 | | | | — | | | | 18,346,098 | |
| U.S. Government Mortgage-Backed Obligations | | | — | | | | 9,961,699 | | | | — | | | | 9,961,699 | |
| Commercial Mortgage-Backed Securities | | | — | | | | 7,961,152 | | | | — | | | | 7,961,152 | |
| Commercial Paper | | | — | | | | 2,598,926 | | | | — | | | | 2,598,926 | |
| Non-Agency Collateralized Mortgage Obligations | | | — | | | | 1,121,349 | | | | — | | | | 1,121,349 | |
| Agency Collateralized Mortgage Obligations | | | — | | | | 489,111 | | | | — | | | | 489,111 | |
| Municipal Bonds | | | — | | | | 427,516 | | | | — | | | | 427,516 | |
| Preferred Stocks | | | 232,912 | | | | — | | | | — | | | | 232,912 | |
| Asset-Backed Security | | | — | | | | 209,508 | | | | — | | | | 209,508 | |
| Investment Funds | | | 1,336,884 | | | | — | | | | — | | | | 1,336,884 | |
| | | | | | | | | | | | | | | $ | 55,647,087 | |
See accompanying Notes to Financial Statements.
Portfolio of Investments
Touchstone High Yield Fund – December 31, 2012
| Principal | | | | | Market | |
| Amount | | | | | Value | |
| | | | | | | |
| | | | | Corporate Bonds — 97.0% | | | | |
| | | | | | | | | |
| | | | | Energy — 21.6% | | | | |
| $ | 74,000 | | | Access Midstream Partners LP / ACMP | | | | |
| | | | | Finance Corp., 6.125%, 7/15/22 | | $ | 79,735 | |
| | 108,000 | | | Atlas Pipeline Escrow LLC, 144a, | | | | |
| | | | | 6.625%, 10/1/20 | | | 111,780 | |
| | 70,000 | | | Basic Energy Services, Inc., | | | | |
| | | | | 7.750%, 2/15/19 | | | 69,650 | |
| | 178,000 | | | Basic Energy Services, Inc., 144a, | | | | |
| | | | | 7.750%, 10/15/22 | | | 173,550 | |
| | 88,000 | | | Bill Barrett Corp., 7.000%, 10/15/22 | | | 90,640 | |
| | 27,000 | | | Bill Barrett Corp., 7.625%, 10/1/19 | | | 28,485 | |
| | 181,000 | | | Carrizo Oil & Gas, Inc., 7.500%, 9/15/20 | | | 185,978 | |
| | 117,000 | | | Carrizo Oil & Gas, Inc., | | | | |
| | | | | 8.625%, 10/15/18 | | | 126,360 | |
| | 87,000 | | | Chesapeake Energy Corp., | | | | |
| | | | | 6.625%, 8/15/20 | | | 93,308 | |
| | 202,000 | | | Cloud Peak Energy Resources LLC / | | | | |
| | | | | Cloud Peak Energy Finance Corp., | | | | |
| | | | | 8.500%, 12/15/19 | | | 221,695 | |
| | 349,000 | | | Coffeyville Resources LLC / Coffeyville | | | | |
| | | | | Finance, Inc., 144a, 10.875%, 4/1/17 | | | 383,900 | |
| | 66,000 | | | CONSOL Energy, Inc., 8.000%, 4/1/17 | | | 71,445 | |
| | 66,000 | | | CONSOL Energy, Inc., 8.250%, 4/1/20 | | | 71,445 | |
| | 94,000 | | | Crestwood Midstream Partners LP / | | | | |
| | | | | Crestwood Midstream Finance | | | | |
| | | | | Corp., 7.750%, 4/1/19 | | | 97,525 | |
| | 119,000 | | | Crestwood Midstream Partners LP / | | | | |
| | | | | Crestwood Midstream Finance | | | | |
| | | | | Corp., 144a, 7.750%, 4/1/19 | | | 123,462 | |
| | 184,000 | | | Drill Rigs Holdings, Inc., 144a, | | | | |
| | | | | 6.500%, 10/1/17 | | | 183,080 | |
| | 117,000 | | | Enterprise Products Operating LLC, | | | | |
| | | | | 7.000%, 6/1/67(A) | | | 125,482 | |
| | 200,000 | | | Enterprise Products Operating LLC, | | | | |
| | | | | 8.375%, 8/1/66(A) | | | 228,250 | |
| | 323,000 | | | Expro Finance Luxembourg SCA, 144a, | | | | |
| | | | | 8.500%, 12/15/16 | | | 337,535 | |
| | 300,000 | | | Exterran Holdings, Inc., | | | | |
| | | | | 7.250%, 12/1/18 | | | 318,000 | |
| | 238,000 | | | Forest Oil Corp., 7.250%, 6/15/19 | | | 239,190 | |
| | 315,000 | | | Genesis Energy LP / Genesis Energy | | | | |
| | | | | Finance Corp., 7.875%, 12/15/18 | | | 336,262 | |
| | 88,000 | | | Hilcorp Energy I LP / Hilcorp Finance | | | | |
| | | | | Co., 144a, 7.625%, 4/15/21 | | | 95,920 | |
| | 50,000 | | | Hilcorp Energy I LP / Hilcorp Finance | | | | |
| | | | | Co., 144a, 8.000%, 2/15/20 | | | 54,750 | |
| | 95,000 | | | Holly Energy Partners LP / Holly | | | | |
| | | | | Energy Finance Corp., | | | | |
| | | | | 8.250%, 3/15/18 | | | 103,312 | |
| | 332,000 | | | Linn Energy LLC / Linn Energy Finance | | | | |
| | | | | Corp., 8.625%, 4/15/20 | | | 361,880 | |
| | 91,000 | | | MarkWest Energy Partners LP / | | | | |
| | | | | MarkWest Energy Finance Corp., | | | | |
| | | | | 5.500%, 2/15/23 | | | 98,735 | |
| | 215,000 | | | Newfield Exploration Co., | | | | |
| | | | | 5.625%, 7/1/24 | | | 232,200 | |
| | 108,000 | | | Pacific Drilling V Ltd., 144a, | | | | |
| | | | | 7.250%, 12/1/17 | | | 112,050 | |
| | 300,000 | | | Peabody Energy Corp., | | | | |
| | | | | 6.000%, 11/15/18 | | | 318,750 | |
| | 284,000 | | | Pioneer Energy Services Corp., | | | | |
| | | | | 9.875%, 3/15/18 | | | 308,850 | |
| | 193,000 | | | Plains Exploration & Production Co., | | | | |
| | | | | 6.875%, 2/15/23 | | | 220,502 | |
| | 330,000 | | | Regency Energy Partners LP / | | | | |
| | | | | Regency Energy Finance Corp., | | | | |
| | | | | 6.500%, 7/15/21 | | | 361,350 | |
| | 27,000 | | | SandRidge Energy, Inc., | | | | |
| | | | | 7.500%, 2/15/23 | | | 28,890 | |
| | 168,000 | | | SandRidge Energy, Inc., | | | | |
| | | | | 8.750%, 1/15/20 | | | 183,960 | |
| | 250,000 | | | Targa Resources Partners LP / Targa | | | | |
| | | | | Resources Partners Finance Corp., | | | | |
| | | | | 7.875%, 10/15/18 | | | 273,750 | |
| | | | | | | | 6,451,656 | |
| | | | | | | | | |
| | | | | Consumer Discretionary — 15.0% | | | | |
| | 64,000 | | | Albea Beauty Holdings SA, 144a, | | | | |
| | | | | 8.375%, 11/1/19 | | | 67,520 | |
| | 189,000 | | | AMC Networks, Inc., 7.750%, 7/15/21 | | | 216,405 | |
| | 12,000 | | | Asbury Automotive Group, Inc., | | | | |
| | | | | 7.625%, 3/15/17 | | | 12,390 | |
| | 65,000 | | | CCO Holdings LLC / CCO Holdings | | | | |
| | | | | Capital Corp., 6.500%, 4/30/21 | | | 70,119 | |
| | 155,000 | | | CCO Holdings LLC / CCO Holdings | | | | |
| | | | | Capital Corp., 7.000%, 1/15/19 | | | 167,206 | |
| | 163,000 | | | CCO Holdings LLC / CCO Holdings | | | | |
| | | | | Capital Corp., 8.125%, 4/30/20 | | | 182,560 | |
| | 211,000 | | | Cequel Communications Holdings I | | | | |
| | | | | LLC / Cequel Capital Corp., 144a, | | | | |
| | | | | 6.375%, 9/15/20 | | | 219,705 | |
| | 163,000 | | | Clear Channel Worldwide Holdings, | | | | |
| | | | | Inc., 7.625%, 3/15/20 | | | 164,222 | |
| | 27,000 | | | Clear Channel Worldwide Holdings, | | | | |
| | | | | Inc., 7.625%, 3/15/20 | | | 26,932 | |
| | 65,000 | | | CSC Holdings LLC, 8.625%, 2/15/19 | | | 77,675 | |
| | 140,000 | | | DISH DBS Corp., 7.875%, 9/1/19 | | | 165,900 | |
| | 41,000 | | | DISH DBS Corp., 144a, 5.000%, 3/15/23 | | | 41,000 | |
| | 211,000 | | | Entravision Communications Corp., | | | | |
| | | | | 8.750%, 8/1/17 | | | 228,935 | |
| | 196,000 | | | Equinox Holdings, Inc., 144a, | | | | |
| | | | | 9.500%, 2/1/16 | | | 206,780 | |
| | 147,000 | | | Exide Technologies, 8.625%, 2/1/18 | | | 124,582 | |
| | 326,000 | | | Goodyear Tire & Rubber Co. (The), | | | | |
| | | | | 8.750%, 8/15/20 | | | 375,715 | |
| | 127,000 | | | International Automotive | | | | |
| | | | | Components Group SA, 144a, | | | | |
| | | | | 9.125%, 6/1/18 | | | 117,792 | |
| | 50,000 | | | Jarden Corp., 8.000%, 5/1/16 | | | 53,125 | |
| | 106,000 | | | Libbey Glass, Inc., 6.875%, 5/15/20 | | | 113,950 | |
Touchstone High Yield Fund (Continued)
| Principal | | | | | Market | |
| Amount | | | | | Value | |
| | | | | | | |
| | | | | Corporate Bonds — 97.0% (Continued) | | | | |
| | | | | | | | | |
| | | | | Consumer Discretionary — (Continued) | | | | |
| $ | 202,000 | | | Ltd. Brands, Inc., 5.625%, 2/15/22 | | $ | 219,675 | |
| | 105,000 | | | Meritage Homes Corp., | | | | |
| | | | | 7.150%, 4/15/20 | | | 114,975 | |
| | 93,000 | | | Penske Automotive Group, Inc., 144a, | | | | |
| | | | | 5.750%, 10/1/22 | | | 95,790 | |
| | 108,000 | | | PulteGroup, Inc., 6.375%, 5/15/33 | | | 107,730 | |
| | 28,000 | | | PulteGroup, Inc., 7.875%, 6/15/32 | | | 30,450 | |
| | 90,000 | | | Quebecor Media, Inc., 7.750%, 3/15/16 | | | 92,250 | |
| | 32,000 | | | Quebecor Media, Inc., 7.750%, 3/15/16 | | | 32,800 | |
| | 163,000 | | | Quebecor Media, Inc., 144a, | | | | |
| | | | | 5.750%, 1/15/23 | | | 171,761 | |
| | 63,000 | | | Royal Caribbean Cruises Ltd., | | | | |
| | | | | 5.250%, 11/15/22 | | | 66,622 | |
| | 101,000 | | | Sabre, Inc., 144a, 8.500%, 5/15/19 | | | 107,565 | |
| | 93,000 | | | ServiceMaster Co./TN, | | | | |
| | | | | 8.000%, 2/15/20 | | | 96,952 | |
| | 290,000 | | | Stonemor Operating LLC / | | | | |
| | | | | Cornerstone Family Services of WV | | | | |
| | | | | / Osiris Holding, 10.250%, 12/1/17 | | | 298,700 | |
| | 111,000 | | | Suburban Propane Partners | | | | |
| | | | | LP/Suburban Energy Finance Corp., | | | | |
| | | | | 7.500%, 10/1/18 | | | 119,602 | |
| | 41,000 | | | Tenneco, Inc., 6.875%, 12/15/20 | | | 44,640 | |
| | 101,000 | | | Tenneco, Inc., 7.750%, 8/15/18 | | | 109,585 | |
| | 45,000 | | | Tomkins LLC / Tomkins, Inc., | | | | |
| | | | | 9.000%, 10/1/18 | | | 50,400 | |
| | 67,000 | | | Tower Automotive Holdings USA LLC | | | | |
| | | | | / TA Holdings Finance, Inc., 144a, | | | | |
| | | | | 10.625%, 9/1/17 | | | 73,365 | |
| | | | | | | | 4,465,375 | |
| | | | | | | | | |
| | | | | Industrials — 12.1% | | | | |
| | 264,000 | | | Amsted Industries, Inc., 144a, | | | | |
| | | | | 8.125%, 3/15/18 | | | 282,480 | |
| | 326,000 | | | Belden, Inc., 144a, 5.500%, 9/1/22 | | | 334,965 | |
| | 61,000 | | | BWAY Holding Co., 10.000%, 6/15/18 | | | 67,710 | |
| | 120,000 | | | Calcipar SA, 144a, 6.875%, 5/1/18 | | | 122,400 | |
| | 145,000 | | | Case New Holland, Inc., | | | | |
| | | | | 7.875%, 12/1/17 | | | 171,462 | |
| | 400,000 | | | Cenveo Corp., 8.875%, 2/1/18 | | | 380,000 | |
| | 95,000 | | | Chrysler Group LLC / CG Co.-Issuer, | | | | |
| | | | | Inc., 8.250%, 6/15/21 | | | 104,500 | |
| | 121,194 | | | Continental Airlines 2003-ERJ1 Pass | | | | |
| | | | | Through Trust, Ser RJ03, | | | | |
| | | | | 7.875%, 7/2/18 | | | 124,829 | |
| | 222,000 | | | Dynacast International LLC / Dynacast | | | | |
| | | | | Finance, Inc., 9.250%, 7/15/19 | | | 237,540 | |
| | 110,000 | | | Griffon Corp., 7.125%, 4/1/18 | | | 116,600 | |
| | 95,000 | | | JB Poindexter & Co., Inc., 144a, | | | | |
| | | | | 9.000%, 4/1/22 | | | 98,206 | |
| | 173,000 | | | JM Huber Corp., 144a, | | | | |
| | | | | 9.875%, 11/1/19 | | | 192,030 | |
| | 83,000 | | | Liberty Tire Recycling, 144a, | | | | |
| | | | | 11.000%, 10/1/16 | | | 76,775 | |
| | 120,000 | | | Moog, Inc., 7.250%, 6/15/18 | | | 126,150 | |
| | 145,000 | | | Mueller Water Products, Inc., | | | | |
| | | | | 7.375%, 6/1/17 | | | 149,712 | |
| | 134,000 | | | Navios South American Logistics, Inc. | | | | |
| | | | | / Navios Logistics Finance US Inc., | | | | |
| | | | | 9.250%, 4/15/19 | | | 131,488 | |
| | 29,000 | | | RR Donnelley & Sons Co., | | | | |
| | | | | 7.250%, 5/15/18 | | | 27,985 | |
| | 75,000 | | | Stena AB, 7.000%, 12/1/16 | | | 74,812 | |
| | 193,000 | | | Tutor Perini Corp., 7.625%, 11/1/18 | | | 199,272 | |
| | 113,000 | | | United Rentals North America, Inc., | | | | |
| | | | | 9.250%, 12/15/19 | | | 128,820 | |
| | 33,000 | | | United Rentals North America, Inc., | | | | |
| | | | | 144a, 5.750%, 7/15/18 | | | 35,558 | |
| | 157,000 | | | United Rentals North America, Inc., | | | | |
| | | | | 144a, 7.375%, 5/15/20 | | | 172,308 | |
| | 227,000 | | | United Rentals North America, Inc., | | | | |
| | | | | 144a, 7.625%, 4/15/22 | | | 253,672 | |
| | | | | | | | 3,609,274 | |
| | | | | | | | | |
| | | | | Materials — 11.4% | | | | |
| | 79,000 | | | AK Steel Corp., 7.625%, 5/15/20 | | | 68,730 | |
| | 312,000 | | | Aleris International, Inc., | | | | |
| | | | | 7.625%, 2/15/18 | | | 317,460 | |
| | 204,000 | | | ArcelorMittal, 5.750%, 8/5/20† | | | 204,410 | |
| | 290,000 | | | ArcelorMittal, 7.500%, 10/15/39 | | | 272,600 | |
| | 228,000 | | | Cascades, Inc., 7.750%, 12/15/17 | | | 241,110 | |
| | 268,000 | | | Cascades, Inc., 7.875%, 1/15/20 | | | 285,420 | |
| | 500,000 | | | FMG Resources August 2006 Pty Ltd., | | | | |
| | | | | 144a, 6.875%, 4/1/22 | | | 511,250 | |
| | 117,000 | | | HudBay Minerals, Inc., 144a, | | | | |
| | | | | 9.500%, 10/1/20 | | | 123,728 | |
| | 125,000 | | | JMC Steel Group, Inc., 144a, | | | | |
| | | | | 8.250%, 3/15/18 | | | 130,625 | |
| | 211,000 | | | Koppers, Inc., 7.875%, 12/1/19 | | | 232,100 | |
| | 424,000 | | | Longview Fibre Paper & Packaging, | | | | |
| | | | | Inc., 144a, 8.000%, 6/1/16 | | | 445,200 | |
| | 53,000 | | | PolyOne Corp., 7.375%, 9/15/20 | | | 57,902 | |
| | 249,000 | | | Tembec Industries, Inc., | | | | |
| | | | | 11.250%, 12/15/18 | | | 263,940 | |
| | 81,000 | | | US Concrete, Inc., 144a, | | | | |
| | | | | 9.500%, 8/31/15 | | | 101,250 | |
| | 135,000 | | | Vulcan Materials Co., 7.500%, 6/15/21 | | | 153,900 | |
| | | | | | | | 3,409,625 | |
| | | | | | | | | |
| | | | | Telecommunication Services — 10.9% | | | | |
| | 17,000 | | | CenturyLink, Inc., 6.450%, 6/15/21 | | | 18,786 | |
| | 230,000 | | | CenturyLink, Inc., 7.650%, 3/15/42 | | | 240,375 | |
| | 72,000 | | | Cincinnati Bell, Inc., 8.250%, 10/15/17 | | | 77,580 | |
| | 201,000 | | | Cincinnati Bell, Inc., 8.375%, 10/15/20 | | | 217,582 | |
| | 123,000 | | | Crown Castle International Corp., | | | | |
| | | | | 144a, 5.250%, 1/15/23 | | | 131,610 | |
| | 324,000 | | | Frontier Communications Corp., | | | | |
| | | | | 8.500%, 4/15/20 | | | 372,600 | |
| | 250,000 | | | GCI, Inc., 8.625%, 11/15/19 | | | 265,625 | |
Touchstone High Yield Fund (Continued)
| Principal | | | | | Market | |
| Amount | | | | | Value | |
| | | | | | | |
| | | | | Corporate Bonds — 97.0% (Continued) | | | | |
| | | | | | | | | |
| | | | | Telecommunication Services — (Continued) | | | | |
| $ | 55,000 | | | Intelsat Jackson Holdings SA, | | | | |
| | | | | 7.250%, 10/15/20 | | $ | 59,812 | |
| | 114,000 | | | Intelsat Jackson Holdings SA, 144a, | | | | |
| | | | | 7.250%, 10/15/20 | | | 123,690 | |
| | 114,000 | | | MetroPCS Wireless, Inc., | | | | |
| | | | | 7.875%, 9/1/18 | | | 123,405 | |
| | 101,000 | | | Nielsen Finance LLC / Nielsen Finance | | | | |
| | | | | Co., 144a, 4.500%, 10/1/20 | | | 100,495 | |
| | 25,000 | | | NII Capital Corp., 7.625%, 4/1/21 | | | 18,938 | |
| | 96,000 | | | NII Capital Corp., 8.875%, 12/15/19 | | | 76,320 | |
| | 92,000 | | | Sinclair Television Group, Inc., 144a, | | | | |
| | | | | 6.125%, 10/1/22 | | | 97,635 | |
| | 384,000 | | | Sprint Capital Corp., 6.875%, 11/15/28 | | | 399,360 | |
| | 267,000 | | | Sprint Nextel Corp., 144a, | | | | |
| | | | | 9.000%, 11/15/18 | | | 329,745 | |
| | 41,000 | | | TW Telecom Holdings, Inc., | | | | |
| | | | | 8.000%, 3/1/18 | | | 44,895 | |
| | 30,000 | | | Videotron Ltd., 5.000%, 7/15/22 | | | 31,462 | |
| | 94,000 | | | Wind Acquisition Finance SA, 144a, | | | | |
| | | | | 11.750%, 7/15/17 | | | 98,465 | |
| | 114,000 | | | Windstream Corp., 7.500%, 4/1/23 | | | 119,985 | |
| | 250,000 | | | Windstream Corp., 7.750%, 10/15/20 | | | 270,000 | |
| | 29,000 | | | Windstream Corp., 7.875%, 11/1/17 | | | 32,625 | |
| | | | | | | | 3,250,990 | |
| | | | | | | | | |
| | | | | Health Care — 7.9% | | | | |
| | 102,000 | | | Accellent, Inc., 8.375%, 2/1/17 | | | 107,100 | |
| | 294,000 | | | Apria Healthcare Group, Inc., | | | | |
| | | | | 11.250%, 11/1/14 | | | 303,922 | |
| | 205,000 | | | Capella Healthcare, Inc., | | | | |
| | | | | 9.250%, 7/1/17 | | | 219,862 | |
| | 204,000 | | | CHS/Community Health Systems, Inc., | | | | |
| | | | | 7.125%, 7/15/20 | | | 217,770 | |
| | 500,000 | | | HCA Holdings, Inc., 7.750%, 5/15/21 | | | 542,500 | |
| | 58,000 | | | HCA, Inc., 5.875%, 5/1/23 | | | 60,030 | |
| | 100,000 | | | Health Management Associates, Inc., | | | | |
| | | | | 7.375%, 1/15/20 | | | 108,000 | |
| | 82,000 | | | Kindred Healthcare, Inc., | | | | |
| | | | | 8.250%, 6/1/19† | | | 79,745 | |
| | 282,000 | | | Omnicare, Inc., 7.750%, 6/1/20 | | | 313,020 | |
| | 300,000 | | | ResCare, Inc., 10.750%, 1/15/19 | | | 333,000 | |
| | 7,000 | | | Universal Hospital Services, Inc., | | | | |
| | | | | 4.111%, 6/1/15(A) | | | 6,969 | |
| | 42,000 | | | Universal Hospital Services, Inc., 144a, | | | | |
| | | | | 7.625%, 8/15/20 | | | 44,258 | |
| | | | | | | | 2,336,176 | |
| | | | | | | | | |
| | | | | Financials — 5.9% | | | | |
| | 200,000 | | | Ally Financial, Inc., 5.500%, 2/15/17 | | | 213,953 | |
| | 100,000 | | | Ally Financial, Inc., 8.000%, 11/1/31† | | | 126,250 | |
| | 108,000 | | | CIT Group, Inc., 5.000%, 8/15/22 | | | 115,162 | |
| | 107,000 | | | Credit Acceptance Corp., | | | | |
| | | | | 9.125%, 2/1/17 | | | 116,898 | |
| | 22,000 | | | EDP Finance BV, 144a, 6.000%, 2/2/18 | | | 23,067 | |
| | 296,000 | | | International Lease Finance Corp., | | | | |
| | | | | 5.875%, 8/15/22 | | | 313,527 | |
| | 113,000 | | | Liberty Mutual Group, Inc., 144a, | | | | |
| | | | | 10.750%, 6/15/58(A) | | | 168,370 | |
| | 256,000 | | | MPT Operating Partnership LP / MPT | | | | |
| | | | | Finance Corp., 6.875%, 5/1/21 | | | 277,760 | |
| | 147,000 | | | Omega Healthcare Investors, Inc., | | | | |
| | | | | 6.750%, 10/15/22 | | | 159,862 | |
| | 216,000 | | | PHH Corp., 7.375%, 9/1/19 | | | 239,760 | |
| | | | | | | | 1,754,609 | |
| | | | | | | | | |
| | | | | Consumer Staples — 5.3% | | | | |
| | 287,000 | | | BI-LO LLC / BI-LO Finance Corp., 144a, | | | | |
| | | | | 9.250%, 2/15/19 | | | 307,090 | |
| | 169,000 | | | Central Garden and Pet Co., | | | | |
| | | | | 8.250%, 3/1/18 | | | 178,718 | |
| | 222,000 | | | Constellation Brands, Inc., | | | | |
| | | | | 4.625%, 3/1/23 | | | 231,990 | |
| | 160,000 | | | Ingles Markets, Inc., 8.875%, 5/15/17 | | | 170,600 | |
| | 422,000 | | | JBS USA LLC / JBS USA Finance, Inc., | | | | |
| | | | | 144a, 7.250%, 6/1/21 | | | 423,055 | |
| | 58,000 | | | Post Holdings, Inc., 144a, | | | | |
| | | | | 7.375%, 2/15/22 | | | 63,546 | |
| | 189,000 | | | Smithfield Foods, Inc., 6.625%, 8/15/22 | | | 208,845 | |
| | | | | | | | 1,583,844 | |
| | | | | | | | | |
| | | | | Information Technology — 3.3% | | | | |
| | 238,000 | | | Equinix, Inc., 8.125%, 3/1/18 | | | 262,395 | |
| | 89,000 | | | Fidelity National Information Services, | | | | |
| | | | | Inc., 5.000%, 3/15/22 | | | 95,452 | |
| | 31,000 | | | Hughes Satellite Systems Corp., | | | | |
| | | | | 6.500%, 6/15/19 | | | 34,178 | |
| | 439,000 | | | Kemet Corp., 10.500%, 5/1/18 | | | 432,965 | |
| | 152,000 | | | ViaSat, Inc., 144a, 6.875%, 6/15/20 | | | 158,840 | |
| | | | | | | | 983,830 | |
| | | | | | | | | |
| | | | | Utilities — 2.7% | | | | |
| | 135,000 | | | Calpine Corp., 144a, 7.875%, 1/15/23 | | | 152,550 | |
| | 51,000 | | | GenOn Energy, Inc., 7.625%, 6/15/14 | | | 54,442 | |
| | 350,000 | | | InterGen N.V., 144a, 9.000%, 6/30/17 | | | 313,250 | |
| | 85,000 | | | NRG Energy, Inc., 7.875%, 5/15/21 | | | 94,350 | |
| | 197,000 | | | Sabine Pass LNG LP, 144a, | | | | |
| | | | | 6.500%, 11/1/20 | | | 200,448 | |
| | | | | | | | 815,040 | |
| | | | | | | | | |
| | | | | Technology — 0.9% | | | | |
| | 248,000 | | | Seagate HDD Cayman, 6.875%, 5/1/20 | | | 263,810 | |
| | | | | Total Corporate Bonds | | $ | 28,924,229 | |
| | | | | | | | | |
| Shares | | | | | | | |
| | | | | | | | |
| | | | | Preferred Stocks — 0.4% | | | | |
| | | | | | | | | |
| | | | | Financials — 0.4% | | | | |
| | 4,685 | | | Ally Financial, Inc., 0.046% | | $ | 116,564 | |
| | 762 | | | Countrywide Capital V, 0.044% | | | 19,196 | |
| | | | | Total Preferred Stocks | | | 135,760 | |
Touchstone High Yield Fund (Continued)
| | | | | | Market | |
| Shares | | | | | Value | |
| | | | | | | |
| | | | Investment Funds — 2.5% | | | |
| | 388,431 | | | Invesco Government & Agency Portfolio** | | $ | 388,431 | |
| | 356,557 | | | Touchstone Institutional Money Market Fund^ | | | 356,558 | |
| | | | | Total Investment Funds | | $ | 744,989 | |
| | | | | | | | | |
| | | | | Total Investment Securities —99.9% | | | | |
| | | | | (Cost $28,434,682) | | $ | 29,804,978 | |
| | | | | | | | | |
| | | | | Other Assets in Excess of Liabilities — 0.1% | | | 19,715 | |
| | | | | | | | | |
| | | | | Net Assets — 100.0% | | $ | 29,824,693 | |
| (A) | Variable rate security - the rate reflected is the rate in effect as of December 31, 2012. |
| † | All or a portion of the security is on loan. The total value of the securities on loan as of December 31, 2012 was $372,573. |
| ** | Represents collateral for securities loaned. |
| ^ | Affiliated Fund. See Note 4 in Notes to Financial Statements. |
Portfolio Abbreviations:
LLC - Limited Liability Company
LP - Limited Partnership
144A - This is a restricted security that was sold in a transaction exempt from Rule 144A of the Securities Act of 1933. This security may be sold in transactions exempt from registration, normally to qualified institutional buyers. At December 31, 2012, these securities were valued at $8,293,866 or 27.8% of net assets. These securities were deemed liquid pursuant to procedures approved by the Board of Trustees.
Other Information:
The inputs or methodology used for valuing securities may not be an indication of the risk associated with investing in those securities. For more information on valuation inputs, and their aggregation into the levels used in the table below, please refer to the security valuation section in the accompanying Notes to Financial Statements.
| | | Valuation inputs at Reporting Date: | |
| Description | | Level 1 | | | Level 2 | | | Level 3 | | | Total | |
| Corporate Bonds | | $ | — | | | $ | 28,924,229 | | | $ | — | | | $ | 28,924,229 | |
| Preferred Stocks | | | 135,760 | | | | — | | | | — | | | | 135,760 | |
| Investment Funds | | | 744,989 | | | | — | | | | — | | | | 744,989 | |
| | | | | | | | | | | | | | | $ | 29,804,978 | |
See accompanying Notes to Financial Statements.
Portfolio of Investments
Touchstone Large Cap Core Equity Fund – December 31, 2012
| | | | | | Market | |
| | | Shares | | | Value | |
| | | | | | | |
Common Stocks — 97.7% | | | | | | | | |
| | | | | | | | | |
| Information Technology — 18.7% | | | | | | | | |
| Broadcom Corp. - Class A | | | 15,904 | | | $ | 528,172 | |
| Cisco Systems, Inc. | | | 18,070 | | | | 355,076 | |
| EMC Corp.* | | | 11,920 | | | | 301,576 | |
| Google, Inc. - Class A* | | | 1,234 | | | | 875,363 | |
| Intel Corp. | | | 38,726 | | | | 798,917 | |
| International Business Machines Corp. | | | 4,025 | | | | 770,989 | |
| Microsoft Corp. | | | 17,165 | | | | 458,820 | |
| Oracle Corp. | | | 25,751 | | | | 858,023 | |
| Qualcomm, Inc. | | | 13,496 | | | | 837,022 | |
| TE Connectivity Ltd. (Switzerland) | | | 9,127 | | | | 338,794 | |
| | | | | | | | 6,122,752 | |
| | | | | | | | | |
| Financials — 15.9% | | | | | | | | |
| Aflac, Inc. | | | 15,497 | | | | 823,201 | |
| American Express Co. | | | 12,554 | | | | 721,604 | |
| Bank of America Corp. | | | 31,530 | | | | 365,748 | |
| BlackRock, Inc. | | | 4,070 | | | | 841,310 | |
| Capital One Financial Corp. | | | 9,830 | | | | 569,452 | |
| Citigroup, Inc. | | | 8,910 | | | | 352,480 | |
| JPMorgan Chase & Co. | | | 11,880 | | | | 522,364 | |
| State Street Corp. | | | 7,876 | | | | 370,251 | |
| Wells Fargo & Co. | | | 19,090 | | | | 652,496 | |
| | | | | | | | 5,218,906 | |
| | | | | | | | | |
| Health Care — 15.0% | | | | | | | | |
| Abbott Laboratories | | | 7,220 | | | | 472,910 | |
| Bristol-Myers Squibb Co. | | | 10,041 | | | | 327,236 | |
| Covidien PLC (Ireland) | | | 9,920 | | | | 572,781 | |
| Express Scripts Holding Co.* | | | 13,892 | | | | 750,168 | |
| McKesson Corp. | | | 8,437 | | | | 818,052 | |
| Merck & Co., Inc. | | | 7,350 | | | | 300,909 | |
| Novartis AG ADR | | | 5,770 | | | | 365,241 | |
| Pfizer, Inc. | | | 26,250 | | | | 658,350 | |
| UnitedHealth Group, Inc. | | | 11,852 | | | | 642,852 | |
| | | | | | | | 4,908,499 | |
| | | | | | | | | |
| Industrials — 14.1% | | | | | | | | |
| Caterpillar, Inc. | | | 2,420 | | | | 216,784 | |
| Danaher Corp. | | | 9,978 | | | | 557,770 | |
| Eaton Corp. PLC (Ireland) | | | 9,496 | | | | 514,683 | |
| General Electric Co. | | | 36,430 | | | | 764,666 | |
| Illinois Tool Works, Inc. | | | 10,706 | | | | 651,032 | |
| Norfolk Southern Corp. | | | 4,250 | | | | 262,819 | |
| Union Pacific Corp. | | | 7,737 | | | | 972,696 | |
| United Technologies Corp. | | | 8,535 | | | | 699,955 | |
| | | | | | | | 4,640,405 | |
| | | | | | | | | |
| Energy — 11.5% | | | | | | | | |
| Chevron Corp. | | | 4,598 | | | | 497,228 | |
| ConocoPhillips | | | 9,535 | | | | 552,935 | |
| Ensco PLC - Class A (United Kingdom) | | | 18,027 | | | | 1,068,641 | |
| Exxon Mobil Corp. | | | 5,430 | | | | 469,966 | |
| Marathon Oil Corp. | | | 20,733 | | | | 635,674 | |
| Marathon Petroleum Corp. | | | 4,321 | | | | 272,223 | |
| Phillips 66 | | | 5,117 | | | | 271,713 | |
| | | | | | | | 3,768,380 | |
| | | | | | | | | |
| Consumer Discretionary — 9.3% | | | | | | | | |
| Coach, Inc. | | | 9,170 | | | | 509,027 | |
| Genuine Parts Co. | | | 6,212 | | | | 394,959 | |
| Home Depot, Inc. (The) | | | 5,028 | | | | 310,982 | |
| McDonald's Corp. | | | 5,581 | | | | 492,300 | |
| Ross Stores, Inc. | | | 11,278 | | | | 610,704 | |
| Yum! Brands, Inc. | | | 11,239 | | | | 746,270 | |
| | | | | | | | 3,064,242 | |
| Consumer Staples — 7.3% | | | | | | | | |
| Altria Group, Inc. | | | 16,970 | | | | 533,197 | |
| PepsiCo, Inc. | | | 7,087 | | | | 484,963 | |
| Philip Morris International, Inc. | | | 12,332 | | | | 1,031,448 | |
| Walgreen Co. | | | 9,040 | | | | 334,570 | |
| | | | | | | | 2,384,178 | |
| | | | | | | | | |
| Materials — 2.6% | | | | | | | | |
| BHP Billiton Ltd. ADR | | | 2,425 | | | | 190,217 | |
| Praxair, Inc. | | | 6,152 | | | | 673,336 | |
| | | | | | | | 863,553 | |
| | | | | | | | | |
| Telecommunication Services — 2.3% | | | | | | | | |
| AT&T, Inc. | | | 10,645 | | | | 358,843 | |
| Vodafone Group PLC ADR | | | 15,476 | | | | 389,840 | |
| | | | | | | | 748,683 | |
| | | | | | | | | |
| Utilities — 1.0% | | | | | | | | |
| NextEra Energy, Inc. | | | 4,980 | | | | 344,566 | |
| Total Common Stocks | | | | | | $ | 32,064,164 | |
| | | | | | | | | |
| Investment Fund — 2.7% | | | | | | | | |
| Touchstone Institutional Money Market | | | | | | | | |
| Fund^ | | | 874,476 | | | | 874,476 | |
| | | | | | | | | |
| Total Investment Securities —100.4% | | | | | | | | |
| (Cost $27,324,420) | | | | | | $ | 32,938,640 | |
| | | | | | | | | |
| Liabilities in Excess of Other Assets — (0.4%) | | | | | | | (116,113 | ) |
| | | | | | | | | |
| Net Assets — 100.0% | | | | | | $ | 32,822,527 | |
| * | Non-income producing security. |
| ^ | Affiliated Fund. See Note 4 in Notes to Financial Statements. |
Touchstone Large Cap Core Equity Fund (Continued)
Portfolio Abbreviations:
ADR - American Depositary Receipt
PLC - Public Limited Company
Other Information:
The inputs or methodology used for valuing securities may not be an indication of the risk associated with investing in those securities. For more information on valuation inputs, and their aggregation into the levels used in the table below, please refer to the security valuation section in the accompanying Notes to Financial Statements.
| | | Valuation inputs at Reporting Date: | |
| Description | | Level 1 | | | Level 2 | | | Level 3 | | | Total | |
| Common Stocks | | $ | 32,064,164 | | | $ | — | | | $ | — | | | $ | 32,064,164 | |
| Investment Fund | | | 874,476 | | | | — | | | | — | | | | 874,476 | |
| | | | | | | | | | | | | | | $ | 32,938,640 | |
See accompanying Notes to Financial Statements.
Portfolio of Investments
Touchstone Mid Cap Growth Fund – December 31, 2012
| | | | | | Market | |
| | | Shares | | | Value | |
| | | | | | | |
| Common Stocks — 98.4% | | | | | | | | |
| | | | | | | | | |
| Consumer Discretionary — 20.8% | | | | | | | | |
| AMC Networks, Inc.-Class A* | | | 6,330 | | | $ | 313,335 | |
| Bed Bath & Beyond, Inc.* | | | 3,200 | | | | 178,912 | |
| Darden Restaurants, Inc. | | | 4,010 | | | | 180,731 | |
| Discovery Communications, Inc.-Class A* | | | 6,260 | | | | 397,385 | |
| DISH Network Corp.- Class A | | | 4,590 | | | | 167,076 | |
| Dollar General Corp.* | | | 8,210 | | | | 361,979 | |
| Gannett Co., Inc. | | | 11,980 | | | | 215,760 | |
| GNC Holdings, Inc. - Class A | | | 5,360 | | | | 178,381 | |
| Jarden Corp. | | | 6,030 | | | | 311,751 | |
| Mattel, Inc. | | | 11,290 | | | | 413,440 | |
| Mohawk Industries, Inc.* | | | 2,960 | | | | 267,791 | |
| Nordstrom, Inc. | | | 7,190 | | | | 384,665 | |
| NVR, Inc.* | | | 365 | | | | 335,800 | |
| Penn National Gaming, Inc.* | | | 3,200 | | | | 157,152 | |
| Starwood Hotels & Resorts Worldwide, Inc. | | | 4,880 | | | | 279,917 | |
| Tiffany & Co. | | | 4,360 | | | | 250,002 | |
| Wynn Resorts Ltd. | | | 2,060 | | | | 231,729 | |
| | | | | | | | 4,625,806 | |
| | | | | | | | | |
| Information Technology — 17.2% | | | | | | | | |
| Alliance Data Systems Corp.* | | | 4,730 | | | | 684,715 | |
| Altera Corp. | | | 5,820 | | | | 200,441 | |
| Autodesk, Inc.* | | | 8,460 | | | | 299,061 | |
| Check Point Software Technologies Ltd. (Israel)* | | | 8,440 | | | | 402,082 | |
| F5 Networks, Inc.* | | | 2,630 | | | | 255,504 | |
| Gartner, Inc.* | | | 6,130 | | | | 282,103 | |
| Maxim Integrated Products, Inc. | | | 7,280 | | | | 214,032 | |
| NetApp, Inc.* | | | 4,990 | | | | 167,414 | |
| NICE Systems Ltd. (Israel) ADR* | | | 10,260 | | | | 343,505 | |
| Red Hat, Inc.* | | | 7,080 | | | | 374,957 | |
| Skyworks Solutions, Inc.* | | | 12,350 | | | | 250,705 | |
| Teradata Corp.* | | | 3,970 | | | | 245,703 | |
| VeriFone Systems, Inc.* | | | 3,870 | | | | 114,862 | |
| | | | | | | | 3,835,084 | |
| | | | | | | | | |
| Health Care — 16.8% | | | | | | | | |
| Cardinal Health, Inc. | | | 5,580 | | | | 229,784 | |
| Cooper Cos., Inc. (The) | | | 5,470 | | | | 505,866 | |
| CR Bard, Inc. | | | 5,450 | | | | 532,683 | |
| DENTSPLY International, Inc. | | | 14,530 | | | | 575,533 | |
| Hologic, Inc.* | | | 15,820 | | | | 316,875 | |
| IDEXX Laboratories, Inc.* | | | 2,420 | | | | 224,576 | |
| Mettler-Toledo International, Inc.* | | | 2,610 | | | | 504,513 | |
| Vertex Pharmaceuticals, Inc.* | | | 7,850 | | | | 329,229 | |
| Warner Chilcott PLC - Class A | | | 12,670 | | | | 152,547 | |
| Watson Pharmaceuticals, Inc.* | | | 4,260 | | | | 366,360 | |
| | | | | | | | 3,737,966 | |
| | | | | | | | | |
| Energy — 11.7% | | | | | | | | |
| CONSOL Energy, Inc. | | | 11,480 | | | | 368,508 | |
| Denbury Resources, Inc.* | | | 21,345 | | | | 345,789 | |
| Ensco PLC - Class A (United Kingdom) | | | 6,500 | | | | 385,320 | |
| Tesoro Corp. | | | 14,800 | | | | 651,940 | |
| Valero Energy Corp. | | | 15,220 | | | | 519,306 | |
| Weatherford International Ltd.* | | | 29,670 | | | | 332,007 | |
| | | | | | | | 2,602,870 | |
| | | | | | | | | |
| Industrials — 10.8% | | | | | | | | |
| IDEX Corp. | | | 10,380 | | | | 482,981 | |
| IHS, Inc. - Class A* | | | 4,080 | | | | 391,680 | |
| JB Hunt Transport Services, Inc. | | | 5,610 | | | | 334,973 | |
| Stanley Black & Decker, Inc. | | | 6,970 | | | | 515,571 | |
| TransDigm Group, Inc. | | | 2,870 | | | | 391,353 | |
| United Rentals, Inc.* | | | 6,380 | | | | 290,418 | |
| | | | | | | | 2,406,976 | |
| | | | | | | | | |
| Financials — 8.4% | | | | | | | | |
| Ameriprise Financial, Inc. | | | 9,010 | | | | 564,296 | |
| CBRE Group, Inc. - Class A* | | | 19,620 | | | | 390,438 | |
| Plum Creek Timber Co., Inc. REIT | | | 7,760 | | | | 344,311 | |
| Reinsurance Group of America, Inc. | | | 6,400 | | | | 342,528 | |
| Willis Group Holdings PLC | | | 6,780 | | | | 227,333 | |
| | | | | | | | 1,868,906 | |
| | | | | | | | | |
| Materials — 6.1% | | | | | | | | |
| Celanese Corp. | | | 5,080 | | | | 226,212 | |
| Crown Holdings, Inc.* | | | 11,640 | | | | 428,468 | |
| Eastman Chemical Co. | | | 6,738 | | | | 458,494 | |
| FMC Corp. | | | 4,100 | | | | 239,932 | |
| | | | | | | | 1,353,106 | |
| | | | | | | | | |
| Consumer Staples — 6.1% | | | | | | | | |
| Dean Foods Co.* | | | 11,700 | | | | 193,167 | |
| Ralcorp Holdings, Inc.* | | | 8,150 | | | | 730,648 | |
| WhiteWave Foods Co.- Class A†* | | | 7,680 | | | | 119,347 | |
| Whole Foods Market, Inc. | | | 3,340 | | | | 305,042 | |
| | | | | | | | 1,348,204 | |
| | | | | | | | | |
| Telecommunication Services — 0.5% | | | | | | | | |
| SBA Communications Corp. - Class A* | | | 1,570 | | | | 111,502 | |
| Total Common Stocks | | | | | | $ | 21,890,420 | |
| | | | | | | | | |
| Investment Funds — 2.0% | | | | | | | | |
| Invesco Government & Agency Portfolio** | | | 121,632 | | | | 121,632 | |
| Touchstone Institutional Money Market Fund^ | | | 322,864 | | | | 322,864 | |
| Total Investment Funds | | | | | | $ | 444,496 | |
| | | | | | | | | |
| Total Investment Securities —100.4% | | | | | | | | |
| (Cost $20,604,567) | | | | | | $ | 22,334,916 | |
| | | | | | | | | |
| Liabilities in Excess of Other Assets — (0.4%) | | | | | | | (93,199 | ) |
| | | | | | | | | |
| Net Assets — 100.0% | | | | | | $ | 22,241,717 | |
| † | All or a portion of the security is on loan. The total value of the securities on loan as of December 31, 2012 was $118,135. |
Touchstone Mid Cap Growth Fund (Continued)
| * | Non-income producing security. |
| ** | Represents collateral for securities loaned. |
| ^ | Affiliated Fund. See Note 4 in Notes to Financial Statements. |
Portfolio Abbreviations:
ADR - American Depositary Receipt
PLC - Public Limited Company
REIT - Real Estate Investment Trust
Other Information:
The inputs or methodology used for valuing securities may not be an indication of the risk associated with investing in those securities. For more information on valuation inputs, and their aggregation into the levels used in the table below, please refer to the security valuation section in the accompanying Notes to Financial Statements.
| | | Valuation inputs at Reporting Date: | |
| Description | | Level 1 | | | Level 2 | | | Level 3 | | | Total | |
| Common Stocks | | $ | 21,890,420 | | | $ | — | | | $ | — | | | $ | 21,890,420 | |
| Investment Funds | | | 444,496 | | | | — | | | | — | | | | 444,496 | |
| | | | | | | | | | | | | | | $ | 22,334,916 | |
See accompanying Notes to Financial Statements.
Portfolio of Investments
Touchstone Money Market Fund – December 31, 2012
| Principal | | | | | Interest | | | Maturity | | | | |
| Amount | | | | | Rate | | | Date | | | Value | |
| | | | | | | | | | | | | |
| | | | | Corporate Bonds — 14.1% | | | | | | | | | | | | |
| $ | 361,000 | | | General Electric Capital Corp. | | | 2.800 | | | | 01/08/13 | | | $ | 361,155 | |
| | 181,000 | | | General Electric Capital Corp. MTN | | | 5.450 | | | | 01/15/13 | | | | 181,332 | |
| | 700,000 | | | Bank of Nova Scotia | | | 2.250 | | | | 01/22/13 | | | | 700,540 | |
| | 750,000 | | | Toyota Motor Credit Corp. MTN(A) | | | 0.516 | | | | 01/24/13 | | | | 750,000 | |
| | 559,000 | | | General Electric Co. | | | 5.000 | | | | 02/01/13 | | | | 561,099 | |
| | 240,000 | | | Wal-Mart Stores, Inc. | | | 4.250 | | | | 04/15/13 | | | | 242,714 | |
| | 400,000 | | | Credit Suisse/New York MTN | | | 5.000 | | | | 05/15/13 | | | | 406,589 | |
| | 695,000 | | | International Business Machines Corp. | | | 7.500 | | | | 06/15/13 | | | | 716,967 | |
| | 500,000 | | | Bank of Montreal | | | 2.125 | | | | 06/28/13 | | | | 503,949 | |
| | 200,000 | | | National Rural Utilities Cooperative Finance Corp. | | | 5.500 | | | | 07/01/13 | | | | 204,904 | |
| | 125,000 | | | Northern Trust Corp. | | | 5.500 | | | | 08/15/13 | | | | 129,033 | |
| | 225,000 | | | Bank of New York Mellon Corp. (The) | | | 5.125 | | | | 08/27/13 | | | | 232,040 | |
| | 200,000 | | | Canadian Imperial Bank of Commerce | | | 1.450 | | | | 09/13/13 | | | | 201,510 | |
| | 295,000 | | | International Business Machines Corp. | | | 6.500 | | | | 10/15/13 | | | | 309,267 | |
| | | | | Total Corporate Bonds | | | | | | | | | | $ | 5,501,099 | |
| | | | | | | | | | | | | | | | | |
| | | | | Municipal Bonds — 11.5% | | | | | | | | | | | | |
| | 200,000 | | | Warrensville Heights OH BANS LTGO Ser 2012 | | | 1.500 | | | | 01/30/13 | | | | 200,094 | |
| | 300,000 | | | Mason OH EDR (Al Neyer, Inc.) Ser 2012 | | | 1.750 | | | | 01/31/13 | | | | 300,146 | |
| | 500,000 | | | Comal TX Ref Ser A UTGO Ser 2005 Pre-refunded @ $100 | | | 5.000 | | | | 02/01/13 | | | | 501,916 | |
| | 495,000 | | | Indiana Bond Bank Rev, St Fd Ser 2001 Pre-refunded @ $101 | | | 5.375 | | | | 02/01/13 | | | | 502,020 | |
| | 400,000 | | | Miami Twp OH Montgomery Co (Park Acq & Impt) LTGO Ser 2012 | | | 1.375 | | | | 03/28/13 | | | | 400,397 | |
| | 300,000 | | | Fishers IN Redev Auth Lease Rev BANS Ser 2012 | | | 0.750 | | | | 04/12/13 | | | | 300,000 | |
| | 410,000 | | | Bristol CT UTGO BANS Ser 2012 | | | 1.250 | | | | 04/29/13 | | | | 410,684 | |
| | 125,000 | | | WA St Ser D UTGO Ser 2003 Pre-refunded @ $100 | | | 5.000 | | | | 06/01/13 | | | | 127,351 | |
| | 400,000 | | | Muncie IN BANS UTGO Ser 2012 | | | 0.750 | | | | 07/01/13 | | | | 400,000 | |
| | 100,000 | | | Manchester CT BANS UTGO Ser 2012 | | | 1.000 | | | | 07/05/13 | | | | 100,126 | |
| | 390,000 | | | MD St St & Loc Facs UTGO Ser 2003 Pre-refunded @ $100 | | | 5.000 | | | | 08/01/13 | | | | 400,444 | |
| | 110,000 | | | Miami-Dade County School Board Ser D Ser 2003 Pre-refunded @ $100 | | | 5.000 | | | | 08/01/13 | | | | 112,874 | |
| | 300,000 | | | Woodbridge CT BANS UTGO Ser 2012 B | | | 1.000 | | | | 08/23/13 | | | | 300,380 | |
| | 100,000 | | | Pittsburgh PA Public School District UTGO Ser 2003 Pre-refunded @ $100 | | | 4.000 | | | | 09/01/13 | | | | 102,306 | |
| | 150,000 | | | Kentucky State Property & Building Commission Ser 2003 Pre-refunded @ $100 | | | 5.125 | | | | 10/01/13 | | | | 155,168 | |
| | 200,000 | | | AMP OH, Inc. BANS (Var Purp) UTGO Ser 2012 | | | 1.000 | | | | 10/24/13 | | | | 200,325 | |
| | | | | Total Municipal Bonds | | | | | | | | | | $ | 4,514,231 | |
| | | | | | | | | | | | | | | | | |
| | | | | U.S. Government Agency Obligations — 14.2% | | | | | | | | | | | | |
| | 2,000,000 | | | Overseas Private Investment Corp.(A) | | | 0.170 | | | | 01/07/13 | | | | 2,000,000 | |
| | 1,578,947 | | | Overseas Private Investment Corp.(A) | | | 0.170 | | | | 01/07/13 | | | | 1,578,947 | |
| | 947,798 | | | Overseas Private Investment Corp.(A) | | | 0.170 | | | | 01/07/13 | | | | 947,798 | |
| | 521,768 | | | Overseas Private Investment Corp.(A) | | | 0.170 | | | | 01/07/13 | | | | 521,768 | |
| | 500,000 | | | Overseas Private Investment Corp.(A) | | | 0.170 | | | | 01/07/13 | | | | 500,000 | |
| | | | | Total U.S. Government Agency Obligations | | | | | | | | | | $ | 5,548,513 | |
| | | | | | | | | | | | | | | | | |
| | | | | Certificate of Deposit — 1.3% | | | | | | | | | | | | |
| | 500,000 | | | Bank of Nova Scotia/Houston(A) | | | 0.470 | | | | 08/15/13 | | | $ | 500,000 | |
| | | | | | | | | | | | | | | | | |
| | | | | Variable Rate Demand Notes — 42.3% | | | | | | | | | | | | |
| | 890,000 | | | 486 Lesser Street LLC Ser 2007 | | | 0.270 | | | | 01/07/13 | | | | 890,000 | |
| | 100,000 | | | Alameda Co CA IDA Rev (Ettore Prods Co) Ser 2005 B (LOC: Comerica Bank) | | | 0.340 | | | | 01/07/13 | | | | 100,000 | |
| | 495,000 | | | Butler Co OH Capital Funding Rev (CCAO Low Cost) Ser 2005 B (LOC: US Bank NA) | | | 0.260 | | | | 01/07/13 | | | | 495,000 | |
| | 340,000 | | | CA St Enterprise Dev Auth IDR (Tri Tool Inc) Ser 2007 B (LOC: Comerica Bank) | | | 0.409 | | | | 01/07/13 | | | | 340,000 | |
| | 295,000 | | | CA St Infra & Eco Dev BK Rev (Hillview Mental) Ser 2008 B (LOC: Comerica Bank) | | | 0.409 | | | | 01/07/13 | | | | 295,000 | |
Touchstone Money Market Fund (Continued)
| Principal | | | | | Interest | | | Maturity | | | | |
| Amount | | | | | Rate | | | Date | | | Value | |
| | | | | | | | | | | | | | | | | |
| | | | | Variable Rate Demand Notes — 42.3% (Continued) | | | | | | | | | | | | |
| $ | 250,000 | | | Chattanooga TN Hlth Edl & Hsg Fac Bd MFH (Ref Windridge) Ser 2003 B (LIQ: FNMA) | | | 0.340 | | | | 01/07/13 | | | $ | 250,000 | |
| | 152,000 | | | Hopewell Development Co. Ser 2000 | | | 0.260 | | | | 01/07/13 | | | | 152,000 | |
| | 800,000 | | | IL St Dev Fin Auth indl (Toyal America Inc.) Ser 1997 (LOC: Bank of Tokyo-Mitsubishi UFJ) | | | 0.210 | | | | 01/07/13 | | | | 800,000 | |
| | 355,000 | | | IL St Fin Auth Rev (Cmnty Action) Ser 2008 B (LOC: BMO Harris Bank NA) | | | 0.480 | | | | 01/07/13 | | | | 355,000 | |
| | 480,000 | | | Lexington-Fayette KY Urban Cnty (Eastland Parkway) Ser 2006 (LOC: Traditional Bank, Inc./FHLB) | | | 0.280 | | | | 01/07/13 | | | | 480,000 | |
| | 240,000 | | | Maricopa Co AZ IDA (San Angelin Apts) Ser 2004 A (LIQ: FNMA) | | | 0.210 | | | | 01/07/13 | | | | 240,000 | |
| | 1,035,000 | | | Mequon WI IDR ((Gateway Plastics)) Ser 2001 B (LOC: Bank One Wisconsin) | | | 0.300 | | | | 01/07/13 | | | | 1,035,000 | |
| | 945,000 | | | Miarko, Inc. Ser 2007 | | | 0.210 | | | | 01/07/13 | | | | 945,000 | |
| | 941,000 | | | Mill Street Village LLC Ser 2006 | | | 0.360 | | | | 01/07/13 | | | | 941,000 | |
| | 285,000 | | | Milwaukee WI Redev Auth (Kubin Nicholson) Ser 2000 B (LOC: BMO Harris Bank NA) | | | 0.510 | | | | 01/07/13 | | | | 285,000 | |
| | 700,000 | | | NY St HFA (Twr 31) Ser 2006 B (LIQ: FHLMC) | | | 0.190 | | | | 01/07/13 | | | | 700,000 | |
| | 225,000 | | | Pewaukee WI IDR (Schutzman/Leibl) Ser 1999 B (LOC: BMO Harris Bank NA) | | | 0.510 | | | | 01/07/13 | | | | 225,000 | |
| | 1,515,000 | | | Phoenix Realty IL Spl Account Rev (Hsg Brightons Mark) Ser 1999 (LOC: Northern Trust Company) | | | 0.310 | | | | 01/07/13 | | | | 1,515,000 | |
| | 520,000 | | | Springfield MO IDA (DMP Pptys LLC) Ser 2010 (LOC: Guaranty Bank/FHLB) | | | 0.300 | | | | 01/07/13 | | | | 520,000 | |
| | 690,000 | | | WA St HFC (Brittany Pk) Ser 1996 B (LIQ: FNMA) | | | 0.270 | | | | 01/07/13 | | | | 690,000 | |
| | 210,000 | | | WA St HFC (Vintage Burien) Ser 2004 B (LIQ: FNMA) | | | 0.300 | | | | 01/07/13 | | | | 210,000 | |
| | 405,000 | | | Young Men's Christian Association of Metropolitcan Milwaukee, Inc. (The) Ser 2008 | | | 0.210 | | | | 01/07/13 | | | | 405,000 | |
| | 500,000 | | | Chatom AL IDB (PowerSouth Energy Coop) Ser 2012-A (SPA: National Rural Utilities Finance) | | | 0.550 | | | | 05/15/13 | | | | 500,000 | |
| | 760,000 | | | FBC Chemical Corp. Ser 2000 | | | 0.260 | | | | 10/01/15 | | | | 760,000 | |
| | 880,000 | | | Westar Medical Office Building LP Ser 2001 | | | 0.210 | | | | 09/01/21 | | | | 880,000 | |
| | 1,013,000 | | | WAI Enterprises LLC Ser 2004 | | | 0.450 | | | | 06/01/24 | | | | 1,013,000 | |
| | 266,000 | | | Fitch Denny Funeral Home, Inc. Ser 2004 | | | 0.360 | | | | 09/01/24 | | | | 266,000 | |
| | 375,000 | | | Diaz-Upton LLC Ser 2004 | | | 0.260 | | | | 05/01/26 | | | | 375,000 | |
| | 904,000 | | | M&P Richfield LLC Ser 2001 | | | 0.210 | | | | 11/01/28 | | | | 904,000 | |
| | | | | Total Variable Rate Demand Notes | | | | | | | | | | $ | 16,566,000 | |
| | | | | | | | | | | | | | | | | |
| | | | | Repurchase Agreement — 15.8% | | | | | | | | | | | | |
| | 6,200,000 | | | BMO Capital, 0.180%, dated 12/31/12, matures on 01/02/13, repurchase price $6,206,200 (collateralized by U.S. Government Agency Obligation, par value $6,591,418, 4.50%, 12/01/40, total market value $6,324,000) | | | 0.180 | | | | 01/02/13 | | | $ | 6,200,000 | |
| | | | | | | | | | | | | | | | | |
| | | | | Total Investment Securities —99.2% | | | | | | | | | | | | |
| | | | | (Cost $38,829,843) | | | | | | | | | | $ | 38,829,843 | |
| | | | | | | | | | | | | | | | | |
| | | | | Other Assets in Excess of Liabilities — 0.8% | | | | | | | | | | | 324,961 | |
| | | | | | | | | | | | | | | | | |
| | | | | Net Assets — 100.0% | | | | | | | | | | $ | 39,154,804 | |
| (A) | Variable rate security - the rate reflected is the rate in effect as of December 31, 2012. |
Touchstone Money Market Fund (Continued)
Portfolio Abbreviations:
| BANS - Bond Anticipation Notes | | HFC - Housing Finance Commission | | LIQ - Liquidity Agreement |
| CCAO - County Commissioners' Association of Ohio | | IDA - Industrial Development Authority/Agency | | LTGO - Limited Tax General Obligation |
| EDR - Economic Development Revenue | | IDB - Industrial Development Board | | MFH - Multi-Family Housing |
| FHLB - Federal Home Loan Bank | | IDR - Industrial Development Revenue | | MTN - Medium Term Note |
| FHLMC - Federal Home Loan Mortgage Association | | LLC - Limited Liability Company | | SPA - Stand-by Purchase Agreement |
| FNMA - Federal National Mortgage Association | | LOC - Letter of Credit | | UTGO - Unlimited Tax General Obligation |
| HFA - Housing Finance Authority/Agency | | LP - Limited Partnership | | |
Other Information:
The inputs or methodology used for valuing securities may not be an indication of the risk associated with investing in those securities. For more information on valuation inputs, and their aggregation into the levels used in the table below, please refer to the security valuation section in the accompanying Notes to Financial Statements.
| | | Valuation inputs at Reporting Date: | |
| Description | | Level 1 | | | Level 2 | | | Level 3 | | | Total | |
| Corporate Bonds | | $ | — | | | $ | 5,501,099 | | | $ | — | | | $ | 5,501,099 | |
| Municipal Bonds | | | — | | | | 4,514,231 | | | | — | | | | 4,514,231 | |
| U.S. Government Agency Obligations | | | — | | | | 5,548,513 | | | | — | | | | 5,548,513 | |
| Certificate of Deposit | | | — | | | | 500,000 | | | | — | | | | 500,000 | |
| Variable Rate Demand Notes | | | — | | | | 16,566,000 | | | | — | | | | 16,566,000 | |
| Repurchase Agreement | | | — | | | | 6,200,000 | | | | — | | | | 6,200,000 | |
| | | | | | | | | | | | | | | $ | 38,829,843 | |
See accompanying Notes to Financial Statements.
Portfolio of Investments
Touchstone Third Avenue Value Fund – December 31, 2012
| | | | | | Market | |
| | | Shares | | | Value | |
| | | | | | | | | |
| Common Stocks — 90.3% | | | | | | | | |
| United States — 46.3% | | | | | | | | |
| Alleghany Corp.* | | | 79 | | | $ | 26,498 | |
| American Eagle Outfitters, Inc. | | | 15,170 | | | | 311,137 | |
| Applied Materials, Inc. | | | 33,310 | | | | 381,066 | |
| AVX Corp. | | | 74,000 | | | | 797,720 | |
| Bank of New York Mellon Corp. (The) | | | 81,758 | | | | 2,101,181 | |
| Bristow Group, Inc. | | | 15,080 | | | | 809,193 | |
| Broadridge Financial Solutions, Inc. | | | 30,925 | | | | 707,564 | |
| Comerica, Inc. | | | 21,215 | | | | 643,663 | |
| Devon Energy Corp. | | | 25,496 | | | | 1,326,812 | |
| Forest City Enterprises, Inc. - Class A* | | | 60,500 | | | | 977,075 | |
| Investment Technology Group, Inc.* | | | 48,523 | | | | 436,707 | |
| KeyCorp | | | 54,225 | | | | 456,574 | |
| Leucadia National Corp. | | | 57,450 | | | | 1,366,736 | |
| Pioneer Energy Services Corp.* | | | 128,549 | | | | 933,266 | |
| Rofin-Sinar Technologies, Inc.* | | | 19,145 | | | | 415,064 | |
| Tellabs, Inc. | | | 198,450 | | | | 452,465 | |
| Tidewater, Inc. | | | 14,000 | | | | 625,520 | |
| Westwood Holdings Group, Inc. | | | 26,697 | | | | 1,091,907 | |
| White Mountains Insurance Group Ltd. | | | 1,515 | | | | 780,225 | |
| | | | | | | | 14,640,373 | |
| | | | | | | | | |
| Hong Kong — 10.4% | | | | | | | | |
| Cheung Kong Holdings Ltd. | | | 117,000 | | | | 1,820,451 | |
| Hang Lung Group Ltd. | | | 74,000 | | | | 425,724 | |
| Henderson Land Development Co. Ltd. | | | 87,720 | | | | 628,006 | |
| Hutchison Whampoa Ltd. | | | 38,000 | | | | 402,684 | |
| | | | | | | | 3,276,865 | |
| | | | | | | | | |
| Canada — 9.9% | | | | | | | | |
| Brookfield Asset Management, Inc. - | | | | | | | | |
| Class A | | | 39,237 | | | | 1,438,036 | |
| Canfor Corp.* | | | 25,700 | | | | 428,376 | |
| Cenovus Energy, Inc. | | | 19,200 | | | | 643,968 | |
| Encana Corp.† | | | 31,545 | | | | 623,329 | |
| | | | | | | | 3,133,709 | |
| | | | | | | | | |
| Japan — 5.6% | | | | | | | | |
| Toyota Industries Corp. | | | 55,900 | | | | 1,784,663 | |
| | | | | | | | | |
| France — 5.5% | | | | | | | | |
| Nexans SA | | | 14,118 | | | | 631,787 | |
| Sanofi | | | 6,677 | | | | 633,183 | |
| Vivendi SA | | | 21,017 | | | | 475,322 | |
| | | | | | | | 1,740,292 | |
| | | | | | | | | |
| Korea — 4.5% | | | | | | | | |
| POSCO ADR | | | 17,360 | | | | 1,426,124 | |
| | | | | | | | | |
| Sweden — 4.0% | | | | | | | | |
| Investor AB.- Class A | | | 48,786 | | | | 1,249,885 | |
| | | | | | | | | |
| Germany — 2.1% | | | | | | | | |
| Daimler AG | | | 12,315 | | | | 678,013 | |
| | | | | | | | | |
| China — 2.0% | | | | | | | | |
| Pargesa Holding SA | | | 9,102 | | | | 627,304 | |
| Total Common Stocks | | | | | | $ | 28,557,228 | |
| | | | | | | | | |
| Investment Funds — 12.0% | | | | | | | | |
| Invesco Government & Agency Portfolio** | | | 624,000 | | | | 624,000 | |
| Touchstone Institutional Money Market Fund^ | | | 3,163,317 | | | | 3,163,317 | |
| Total Investment Funds | | | | | | $ | 3,787,317 | |
| | | | | | | | | |
| Total Investment Securities —102.3% | | | | | | | | |
| (Cost $26,657,574) | | | | | | $ | 32,344,545 | |
| | | | | | | | | |
| Liabilities in Excess of Other Assets — (2.3%) | | | | | | | (725,015 | ) |
| | | | | | | | | |
| Net Assets — 100.0% | | | | | | $ | 31,619,530 | |
| † | All or a portion of the security is on loan. The total value of the securities on loan as of December 31, 2012 was $616,512. |
| * | Non-income producing security. |
| ** | Represents collateral for securities loaned. |
| ^ | Affiliated Fund. See Note 4 in Notes to Financial Statements. |
Portfolio Abbreviation:
ADR - American Depositary Receipt
Other Information:
The inputs or methodology used for valuing securities may not be an indication of the risk associated with investing in those securities. For more information on valuation inputs, and their aggregation into the levels used in the table below, please refer to the security valuation section in the accompanying Notes to Financial Statements.
Touchstone Third Avenue Value Fund (Continued)
| | | Valuation inputs at Reporting Date: | |
| Description | | Level 1 | | Level 2 | | Level 3 | | Total |
| Common Stocks | | | | | | | | | | | | | | | | |
| United States | | | 14,640,373 | | | | — | | | | — | | | | 14,640,373 | |
| Hong Kong | | | — | | | | 3,276,865 | | | | — | | | | 3,276,865 | |
| Canada | | | 3,133,709 | | | | — | | | | — | | | | 3,133,709 | |
| Japan | | | — | | | | 1,784,663 | | | | — | | | | 1,784,663 | |
| France | | | — | | | | 1,740,292 | | | | — | | | | 1,740,292 | |
| Korea | | | 1,426,124 | | | | — | | | | — | | | | 1,426,124 | |
| Sweden | | | — | | | | 1,249,885 | | | | — | | | | 1,249,885 | |
| Germany | | | — | | | | 678,013 | | | | — | | | | 678,013 | |
| China | | | — | | | | 627,304 | | | | — | | | | 627,304 | |
| Investment Funds | | | 3,787,317 | | | | — | | | | — | | | | 3,787,317 | |
| | | | | | | | | | | | | | | $ | 32,344,545 | |
At December 31, 2012 securities valued at $6,541,911were transferred from Level 1 to Level 2 pursuant to the Fund's fair valuation policy.
See accompanying Notes to Financial Statements.
Portfolio of Investments
Touchstone Aggressive ETF Fund – December 31, 2012
| | | | | | Market | |
| Shares | | | | | Value | |
| | | | | | | | | |
| | | | | Exchange Traded Funds — 98.9% | | | | |
| | 8,560 | | | iShares Core S&P 500 ETF | | $ | 1,224,765 | |
| | 24,750 | | | iShares Core Total US Bond Market ETF | | | 2,749,478 | |
| | 32,690 | | | iShares MSCI EAFE Index Fund | | | 1,857,446 | |
| | 43,180 | | | iShares S&P 500 Growth Index Fund | | | 3,270,453 | |
| | 38,320 | | | iShares S&P 500 Value Index Fund | | | 2,544,065 | |
| | 5,870 | | | iShares S&P MidCap 400 Growth Index Fund | | | 671,587 | |
| | 7,750 | | | iShares S&P MidCap 400/BARRA Value Index Fund | | | 683,084 | |
| | 5,030 | | | iShares S&P SmallCap 600 Value Index Fund† | | | 406,977 | |
| | 4,780 | | | iShares S&P SmallCap 600/BARRA Growth Index Fund | | | 401,711 | |
| | | | | Total Exchange Traded Funds | | $ | 13,809,566 | |
| | | | | | | | | |
| | | | | Investment Funds — 4.3% | | | | |
| | 397,224 | | | Invesco Government & Agency Portfolio** | | | 397,224 | |
| | 197,183 | | | Touchstone Institutional Money Market Fund^ | | | 197,183 | |
| | | | | Total Investment Funds | | $ | 594,407 | |
| | | | | | | | | |
| | | | | Total Investment Securities —103.2% | | | | |
| | | | | (Cost $13,097,270) | | $ | 14,403,973 | |
| | | | | | | | | |
| | | | | Liabilities in Excess of Other Assets — (3.2%) | | | (444,127 | ) |
| | | | | | | | | |
| | | | | Net Assets — 100.0% | | $ | 13,959,846 | |
| † | All or a portion of the security is on loan. The total value of the securities on loan as of December 31, 2012 was $396,783. |
| ** | Represents collateral for securities loaned. |
| ^ | Affiliated Fund. See Note 4 in Notes to Financial Statements. |
Portfolio Abbreviations:
ETF - Exchange Traded Fund
Other Information:
The inputs or methodology used for valuing securities may not be an indication of the risk associated with investing in those securities. For more information on valuation inputs, and their aggregation into the levels used in the table below, please refer to the security valuation section in the accompanying Notes to Financial Statements.
| | | Valuation inputs at Reporting Date: | |
| Description | | Level 1 | | | Level 2 | | | Level 3 | | | Total | |
| | | | | | | | | | | | | |
| Exchange Traded Funds | | $ | 13,809,566 | | | $ | — | | | $ | — | | | $ | 13,809,566 | |
| Investment Funds | | | 594,407 | | | | — | | | | — | | | | 594,407 | |
| | | | | | | | | | | | | | | $ | 14,403,973 | |
See accompanying Notes to Financial Statements.
Portfolio of Investments
Touchstone Conservative ETF Fund – December 31, 2012
| | | | | | Market | |
| Shares | | | | | Value | |
| | | | | | | |
| | | | | Exchange Traded Funds — 98.7% | | | | |
| | 41,040 | | | iShares Barclays 1-3 Year Treasury Bond Fund† | | $ | 3,464,597 | |
| | 8,000 | | | iShares Core S&P 500 ETF | | | 1,144,640 | |
| | 105,210 | | | iShares Core Total US Bond Market ETF | | | 11,687,779 | |
| | 25,420 | | | iShares MSCI EAFE Index Fund | | | 1,444,364 | |
| | 30,280 | | | iShares S&P 500 Growth Index Fund | | | 2,293,407 | |
| | 28,640 | | | iShares S&P 500 Value Index Fund | | | 1,901,410 | |
| | 3,830 | | | iShares S&P MidCap 400 Growth Index Fund | | | 438,190 | |
| | 5,090 | | | iShares S&P MidCap 400/BARRA Value Index Fund | | | 448,633 | |
| | 2,600 | | | iShares S&P SmallCap 600 Value Index Fund† | | | 210,366 | |
| | 2,450 | | | iShares S&P SmallCap 600/BARRA Growth Index Fund | | | 205,898 | |
| | | | | Total Exchange Traded Funds | | $ | 23,239,284 | |
| | | | | | | | | |
| | | | | Investment Funds — 14.8% | | | | |
| | 3,123,228 | | | Invesco Government & Agency Portfolio** | | | 3,123,228 | |
| | 345,921 | | | Touchstone Institutional Money Market Fund^ | | | 345,921 | |
| | | | | Total Investment Funds | | $ | 3,469,149 | |
| | | | | | | | | |
| | | | | Total Investment Securities —113.5% | | | | |
| | | | | (Cost $25,025,542) | | $ | 26,708,433 | |
| | | | | | | | | |
| | | | | Liabilities in Excess of Other Assets — (13.5%) | | | (3,172,263 | ) |
| | | | | | | | | |
| | | | | Net Assets — 100.0% | | $ | 23,536,170 | |
| † | All or a portion of the security is on loan. The total value of the securities on loan as of December 31, 2012 was $3,064,356. |
| ** | Represents collateral for securities loaned. |
| ^ | Affiliated Fund. See Note 4 in Notes to Financial Statements. |
Portfolio Abbreviations:
ETF - Exchange Traded Fund
Other Information:
The inputs or methodology used for valuing securities may not be an indication of the risk associated with investing in those securities. For more information on valuation inputs, and their aggregation into the levels used in the table below, please refer to the security valuation section in the accompanying Notes to Financial Statements.
| | | Valuation inputs at Reporting Date: | |
| Description | | Level 1 | | | Level 2 | | | Level 3 | | | Total | |
| Exchange Traded Funds | | $ | 23,239,284 | | | $ | — | | | $ | — | | | $ | 23,239,284 | |
| Investment Funds | | | 3,469,149 | | | | — | | | | — | | | | 3,469,149 | |
| | | | | | | | | | | | | | | $ | 26,708,433 | |
See accompanying Notes to Financial Statements.
Portfolio of Investments
Touchstone Enhanced ETF Fund – December 31, 2012
| | | | | | Market | |
| Shares | | | | | Value | |
| | | | | | | |
| | | | | Exchange Traded Funds — 98.4% | | | | |
| | 20,880 | | | iShares Core Total US Bond Market ETF | | $ | 2,319,559 | |
| | 43,240 | | | iShares MSCI EAFE Index Fund | | | 2,456,897 | |
| | 3,940 | | | iShares S&P 500 Growth Index Fund | | | 298,416 | |
| | 35,380 | | | iShares S&P 500 Value Index Fund | | | 2,348,878 | |
| | 2,660 | | | iShares S&P MidCap 400 Growth Index Fund | | | 304,331 | |
| | 3,480 | | | iShares S&P MidCap 400/BARRA Value Index Fund | | | 306,727 | |
| | 29,780 | | | iShares S&P SmallCap 600 Value Index Fund† | | | 2,409,500 | |
| | 3,650 | | | iShares S&P SmallCap 600/BARRA Growth Index Fund | | | 306,746 | |
| | | | | Total Exchange Traded Funds | | $ | 10,751,054 | |
| | | | | | | | | |
| | | | | Investment Funds — 23.6% | | | | |
| | 2,387,232 | | | Invesco Government & Agency Portfolio** | | | 2,387,232 | |
| | 192,182 | | | Touchstone Institutional Money Market Fund^ | | | 192,182 | |
| | | | | Total Investment Funds | | $ | 2,579,414 | |
| | | | | | | | | |
| | | | | Total Investment Securities —122.0% | | | | |
| | | | | (Cost $12,981,797) | | $ | 13,330,468 | |
| | | | | | | | | |
| | | | | Liabilities in Excess of Other Assets — (22.0%) | | | (2,405,650 | ) |
| | | | | | | | | |
| | | | | Net Assets — 100.0% | | $ | 10,924,818 | |
| † | All or a portion of the security is on loan. The total value of the securities on loan as of December 31, 2012 was $2,384,580. |
| ** | Represents collateral for securities loaned. |
| ^ | Affiliated Fund. See Note 4 in Notes to Financial Statements. |
Portfolio Abbreviations:
ETF - Exchange Traded Fund
Other Information:
The inputs or methodology used for valuing securities may not be an indication of the risk associated with investing in those securities. For more information on valuation inputs, and their aggregation into the levels used in the table below, please refer to the security valuation section in the accompanying Notes to Financial Statements.
| | | Valuation inputs at Reporting Date: | |
| Description | | Level 1 | | | Level 2 | | | Level 3 | | | Total | |
| | | | | | | | | | | | | |
| Exchange Traded Funds | | $ | 10,751,054 | | | $ | — | | | $ | — | | | $ | 10,751,054 | |
| Investment Funds | | | 2,579,414 | | | | — | | | | — | | | | 2,579,414 | |
| | | | | | | | | | | | | | | $ | 13,330,468 | |
See accompanying Notes to Financial Statements.
Portfolio of Investments
Touchstone Moderate ETF Fund – December 31, 2012
| | | | | | Market | |
| Shares | | | | | Value | |
| | | | | | | |
| | | | | Exchange Traded Funds — 98.7% | | | | |
| | 17,140 | | | iShares Core S&P 500 ETF | | $ | 2,452,391 | |
| | 150,420 | | | iShares Core Total US Bond Market ETF | | | 16,710,158 | |
| | 75,870 | | | iShares MSCI EAFE Index Fund | | | 4,310,933 | |
| | 97,770 | | | iShares S&P 500 Growth Index Fund | | | 7,405,100 | |
| | 90,000 | | | iShares S&P 500 Value Index Fund | | | 5,975,100 | |
| | 14,080 | | | iShares S&P MidCap 400 Growth Index Fund | | | 1,610,893 | |
| | 18,620 | | | iShares S&P MidCap 400/BARRA Value Index Fund | | | 1,641,167 | |
| | 9,800 | | | iShares S&P SmallCap 600 Value Index Fund† | | | 792,917 | |
| | 9,290 | | | iShares S&P SmallCap 600/BARRA Growth Index Fund | | | 780,732 | |
| | | | | Total Exchange Traded Funds | | $ | 41,679,391 | |
| | | | | | | | | |
| | | | | Investment Funds — 3.2% | | | | |
| | 665,091 | | | Invesco Government & Agency Portfolio** | | | 665,091 | |
| | 680,942 | | | Touchstone Institutional Money Market Fund^ | | | 680,942 | |
| | | | | Total Investment Funds | | $ | 1,346,033 | |
| | | | | | | | | |
| | | | | Total Investment Securities —101.9% | | | | |
| | | | | (Cost $37,295,021) | | $ | 43,025,424 | |
| | | | | | | | | |
| | | | | Liabilities in Excess of Other Assets — (1.9%) | | | (797,263 | ) |
| | | | | | | | | |
| | | | | Net Assets — 100.0% | | $ | 42,228,161 | |
| † | All or a portion of the security is on loan. The total value of the securities on loan as of December 31, 2012 was $664,351. |
| ** | Represents collateral for securities loaned. |
| ^ | Affiliated Fund. See Note 4 in Notes to Financial Statements. |
Other Information:
The inputs or methodology used for valuing securities may not be an indication of the risk associated with investing in those securities. For more information on valuation inputs, and their aggregation into the levels used in the table below, please refer to the security valuation section in the accompanying Notes to Financial Statements.
| | | Valuation inputs at Reporting Date: | |
| Description | | Level 1 | | | Level 2 | | | Level 3 | | | Total | |
| | | | | | | | | | | | | | | | |
| Exchange Traded Funds | | $ | 41,679,391 | | | $ | — | | | $ | — | | | $ | 41,679,391 | |
| Investment Funds | | | 1,346,033 | | | | — | | | | — | | | | 1,346,033 | |
| | | | | | | | | | | | | | | $ | 43,025,424 | |
See accompanying Notes to Financial Statements.
This page intentionally left blank.
Statements of Assets and Liabilities
December 31, 2012
| | | Touchstone | | | | | | | | | | |
| | | Baron Small | | | Touchstone | | | Touchstone | | | Touchstone | |
| | | Cap Growth | | | Core Bond | | | High Yield | | | Large Cap Core | |
| | | Fund | | | Fund | | | Fund | | | Equity Fund | |
| Assets | | | | | | | | | | | | |
| Investments, at cost | | $ | 11,281,563 | | | $ | 54,264,885 | | | $ | 28,434,682 | | | $ | 27,324,420 | |
| Affiliated securities, at market value | | $ | — | | | $ | 1,256,823 | | | $ | 356,558 | | | $ | 874,476 | |
| Non-affiliated securities, at market value | | | 19,803,297 | | | | 54,390,264 | | | | 29,448,420 | | | | 32,064,164 | |
| Repurchase Agreement | | | — | | | | — | | | | — | | | | — | |
| Investments, at market value (A) | | $ | 19,803,297 | | | $ | 55,647,087 | | | $ | 29,804,978 | | | $ | 32,938,640 | |
| Cash | | | — | | | | — | | | | — | | | | — | |
| Dividends and interest receivable | | | 6,118 | | | | 296,766 | | | | 505,184 | | | | 52,604 | |
| Receivable for capital shares sold | | | — | | | | 800 | | | | 41 | | | | 246 | |
| Receivable for investments sold | | | 366,636 | | | | — | | | | — | | | | — | |
| Securities lending income receivable | | | 1,897 | | | | 46 | | | | 194 | | | | 5 | |
| Receivable from Investment Advisor | | | — | | | | — | | | | — | | | | — | |
| Tax reclaim receivable | | | — | | | | — | | | | — | | | | — | |
| Other assets | | | 2,905 | | | | 3,458 | | | | 3,096 | | | | 3,175 | |
| Total Assets | | | 20,180,853 | | | | 55,948,157 | | | | 30,313,493 | | | | 32,994,670 | |
| | | | | | | | | | | | | | | | | |
| Liabilities | | | | | | | | | | | | | | | | |
| Bank overdrafts | | | 70,586 | | | | — | | | | — | | | | — | |
| Payable for return of collateral for securities on loan | | | 1,900,044 | | | | 80,061 | | | | 388,431 | | | | — | |
| Payable for capital shares redeemed | | | 15,194 | | | | 52,992 | | | | 7,457 | | | | 77,278 | |
| Payable for investments purchased | | | — | | | | 2,620,065 | | | | — | | | | — | |
| Payable to Investment Advisor | | | 16,004 | | | | 24,667 | | | | 12,535 | | | | 18,094 | |
| Payable to other affiliates | | | 32,509 | | | | 47,046 | | | | 50,135 | | | | 54,772 | |
| Payable to Trustees | | | 1,717 | | | | 1,727 | | | | 1,721 | | | | 1,722 | |
| Payable for professional services | | | 16,577 | | | | 18,713 | | | | 17,918 | | | | 17,067 | |
| Other accrued expenses and liabilities | | | 3,190 | | | | 17,717 | | | | 10,603 | | | | 3,210 | |
| Total Liabilities | | | 2,055,821 | | | | 2,862,988 | | | | 488,800 | | | | 172,143 | |
| | | | | | | | | | | | | | | | | |
| Net Assets | | $ | 18,125,032 | | | $ | 53,085,169 | | | $ | 29,824,693 | | | $ | 32,822,527 | |
| | | | | | | | | | | | | | | | | |
| Net assets consist of: | | | | | | | | | | | | | | | | |
| Paid-in capital | | $ | 6,744,367 | | | $ | 49,947,265 | | | $ | 27,915,689 | | | $ | 40,128,034 | |
| Accumulated net investment income (loss) | | | 318,591 | | | | 1,554,983 | | | | 1,952,715 | | | | 497,085 | |
| Accumulated net realized gains (losses) on investments and foreign currency | | | 2,540,340 | | | | 200,719 | | | | (1,414,007 | ) | | | (13,416,812 | ) |
| Net unrealized appreciation on investments and foreign currency transactions | | | 8,521,734 | | | | 1,382,202 | | | | 1,370,296 | | | | 5,614,220 | |
| Net assets applicable to shares outstanding | | $ | 18,125,032 | | | $ | 53,085,169 | | | $ | 29,824,693 | | | $ | 32,822,527 | |
| | | | | | | | | | | | | | | | | |
| Shares of beneficial interest outstanding (unlimited number of shares authorized, no par value) | | | 1,051,497 | | | | 4,824,381 | | | | 3,724,156 | | | | 3,252,668 | |
| Net asset value, offering price and redemption price per share | | $ | 17.24 | | | $ | 11.00 | | | $ | 8.01 | | | $ | 10.09 | |
| | | | | | | | | | | | | | | | | |
| (A) Includes market value of securities on loan of: | | $ | 1,876,602 | | | $ | 76,639 | | | $ | 372,573 | | | $ | — | |
See accompanying Notes to Financial Statements.
Statements of Assets and Liabilities (Continued)
| Touchstone | | | Touchstone | | | Touchstone | | | Touchstone | | | Touchstone | | | Touchstone | | | Touchstone | |
| Mid Cap | | | Money Market | | | Third Avenue | | | Aggressive ETF | | | Conservative | | | Enhanced ETF | | | Moderate ETF | |
| Growth Fund | | | Fund | | | Value Fund | | | Fund | | | ETF Fund | | | Fund | | | Fund | |
| | | | | | | | | | | | | | | | | | | | | | | | | | | |
| $ | 20,604,567 | | | $ | 38,829,843 | | | $ | 26,657,574 | | | $ | 13,097,270 | | | $ | 25,025,542 | | | $ | 12,981,797 | | | $ | 37,295,021 | |
| $ | 322,864 | | | $ | — | | | $ | 3,163,317 | | | $ | 197,183 | | | $ | 345,921 | | | $ | 192,182 | | | $ | 680,942 | |
| | 22,012,052 | | | | 32,629,843 | | | | 29,181,228 | | | | 14,206,790 | | | | 26,362,512 | | | | 13,138,286 | | | | 42,344,482 | |
| | — | | | | 6,200,000 | | | | — | | | | — | | | | — | | | | — | | | | — | |
| $ | 22,334,916 | | | $ | 38,829,843 | | | $ | 32,344,545 | | | $ | 14,403,973 | | | $ | 26,708,433 | | | $ | 13,330,468 | | | $ | 43,025,424 | |
| | — | | | | 56,079 | | | | — | | | | 2,407 | | | | — | | | | — | | | | 2,407 | |
| | 8,584 | | | | 112,076 | | | | 8,749 | | | | 5,665 | | | | 25,046 | | | | 4,808 | | | | 34,531 | |
| | 235 | | | | 200,337 | | | | — | | | | — | | | | — | | | | 1,151 | | | | 848 | |
| | 143,627 | | | | — | | | | — | | | | — | | | | — | | | | — | | | | — | |
| | 36 | | | | — | | | | 1,006 | | | | 494 | | | | 441 | | | | 1,264 | | | | 1,128 | |
| | — | | | | 54,959 | | | | — | | | | 12,239 | | | | 3,902 | | | | 16,302 | | | | — | |
| | 357 | | | | — | | | | 2,812 | | | | — | | | | — | | | | — | | | | — | |
| | 2,952 | | | | 3,215 | | | | 3,108 | | | | 2,825 | | | | 2,981 | | | | 2,775 | | | | 3,293 | |
| | 22,490,707 | | | | 39,256,509 | | | | 32,360,220 | | | | 14,427,603 | | | | 26,740,803 | | | | 13,356,768 | | | | 43,067,631 | |
| | | | | | | | | | | | | | | | | | | | | | | | | | | |
| | | | | | | | | | | | | | | | | | | | | | | | | | | |
| | — | | | | — | | | | 16 | | | | — | | | | — | | | | — | | | | — | |
| | 121,632 | | | | — | | | | 624,000 | | | | 397,224 | | | | 3,123,228 | | | | 2,387,232 | | | | 665,091 | |
| | 16,075 | | | | 352 | | | | 22,770 | | | | 19,992 | | | | 15,833 | | | | 3,210 | | | | 59,179 | |
| | 50,518 | | | | — | | | | — | | | | 2,407 | | | | — | | | | — | | | | 2,407 | |
| | 14,131 | | | | — | | | | 14,047 | | | | — | | | | — | | | | — | | | | 14,319 | |
| | 23,794 | | | | 78,674 | | | | 56,063 | | | | 27,506 | | | | 44,748 | | | | 21,141 | | | | 76,917 | |
| | 1,718 | | | | 1,723 | | | | 1,721 | | | | 1,716 | | | | 1,718 | | | | 1,715 | | | | 1,725 | |
| | 17,353 | | | | 17,684 | | | | 17,234 | | | | 16,702 | | | | 16,841 | | | | 16,561 | | | | 17,461 | |
| | 3,769 | | | | 3,272 | | | | 4,839 | | | | 2,210 | | | | 2,265 | | | | 2,091 | | | | 2,371 | |
| | 248,990 | | | | 101,705 | | | | 740,690 | | | | 467,757 | | | | 3,204,633 | | | | 2,431,950 | | | | 839,470 | |
| | | | | | | | | | | | | | | | | | | | | | | | | | | |
| $ | 22,241,717 | | | $ | 39,154,804 | | | $ | 31,619,530 | | | $ | 13,959,846 | | | $ | 23,536,170 | | | $ | 10,924,818 | | | $ | 42,228,161 | |
| | | | | | | | | | | | | | | | | | | | | | | | | | | |
| | | | | | | | | | | | | | | | | | | | | | | | | | | |
| $ | 20,276,349 | | | $ | 39,155,694 | | | $ | 29,791,332 | | | $ | 12,631,535 | | | $ | 21,320,327 | | | $ | 18,419,141 | | | $ | 40,661,400 | |
| | — | | | | — | | | | (349,131 | ) | | | 239,018 | | | | 366,161 | | | | 163,363 | | | | 759,947 | |
| | 235,019 | | | | (890 | ) | | | (3,509,680 | ) | | | (217,410 | ) | | | 166,791 | | | | (8,006,357 | ) | | | (4,923,589 | ) |
| | 1,730,349 | | | | — | | | | 5,687,009 | | | | 1,306,703 | | | | 1,682,891 | | | | 348,671 | | | | 5,730,403 | |
| $ | 22,241,717 | | | $ | 39,154,804 | | | $ | 31,619,530 | | | $ | 13,959,846 | | | $ | 23,536,170 | | | $ | 10,924,818 | | | $ | 42,228,161 | |
| | | | | | | | | | | | | | | | | | | | | | | | | | | |
| | | | | | | | | | | | | | | | | | | | | | | | | | | |
| | 1,566,322 | | | | 39,145,177 | | | | 1,796,998 | | | | 1,254,540 | | | | 1,936,458 | | | | 1,262,682 | | | | 3,275,636 | |
| $ | 14.20 | | | $ | 1.00 | | | $ | 17.60 | | | $ | 11.13 | | | $ | 12.15 | | | $ | 8.65 | | | $ | 12.89 | |
| | | | | | | | | | | | | | | | | | | | | | | | | | | |
| $ | 118,135 | | | $ | — | | | $ | 616,512 | | | $ | 396,783 | | | $ | 3,064,356 | | | $ | 2,384,580 | | | $ | 664,351 | |
Statements of Operations
For the Year Ended December 31, 2012
| | | Touchstone | | | | | | | | | Touchstone | |
| | | Baron Small | | | Touchstone | | | Touchstone | | | Large Cap | |
| | | Cap Growth | | | Core Bond | | | High Yield | | | Core Equity | |
| | | Fund | | | Fund | | | Fund | | | Fund | |
| Investment Income | | | | | | | | | | | | | | | | |
| Dividends from affiliated securities | | $ | 633 | | | $ | 2,324 | | | $ | 652 | | | $ | 931 | |
| Dividends from non-affiliated securities(A) | | | 565,217 | | | | 16,239 | | | | 9,305 | | | | 852,284 | |
| Interest | | | — | | | | 1,889,693 | | | | 2,259,989 | | | | — | |
| Income from securities loaned | | | 54,683 | | | | 595 | | | | 2,824 | | | | 3,283 | |
| Total Investment Income | | | 620,533 | | | | 1,908,851 | | | | 2,272,770 | | | | 856,498 | |
| | | | | | | | | | | | | | | | | |
| Expenses | | | | | | | | | | | | | | | | |
| Investment advisory fees | | | 199,712 | | | | 295,231 | | | | 151,099 | | | | 231,533 | |
| Administration fees | | | 38,040 | | | | 107,357 | | | | 60,440 | | | | 71,241 | |
| Compliance fees and expenses | | | 1,480 | | | | 1,480 | | | | 1,480 | | | | 1,480 | |
| Custody fees | | | 640 | | | | 678 | | | | 360 | | | | 485 | |
| Professional fees | | | 17,706 | | | | 23,550 | | | | 20,120 | | | | 20,264 | |
| Transfer Agent fees | | | 102 | | | | 209 | | | | 178 | | | | 170 | |
| Pricing expense | | | 2,976 | | | | 41,416 | | | | 21,656 | | | | 2,648 | |
| Reports to Shareholders | | | 4,543 | | | | 5,872 | | | | 4,742 | | | | 4,696 | |
| Shareholder servicing fees | | | 43,747 | | | | 50,189 | | | | 60,440 | | | | 67,679 | |
| Trustee fees | | | 7,640 | | | | 7,718 | | | | 7,715 | | | | 7,738 | |
| Other expenses | | | 4,392 | | | | 5,545 | | | | 4,599 | | | | 4,814 | |
| Total Expenses | | | 320,978 | | | | 539,245 | | | | 332,829 | | | | 412,748 | |
| Fees waived and/or reimbursed by the Advisor and/or Affiliates(B) | | | (26,164 | ) | | | (1,794 | ) | | | (15,635 | ) | | | (56,542 | ) |
| Net Expenses | | | 294,814 | | | | 537,451 | | | | 317,194 | | | | 356,206 | |
| | | | | | | | | | | | | | | | | |
| Net Investment Income (Loss) | | | 325,719 | | | | 1,371,400 | | | | 1,955,576 | | | | 500,292 | |
| | | | | | | | | | | | | | | | | |
| Realized and Unrealized Gain (Loss) on Investments | | | | | | | | | | | | | | | | |
| Net realized gain on investments | | | 2,561,628 | | | | 393,380 | | | | 343,513 | | | | 3,038,387 | |
| Net realized loss on foreign currency | | | — | | | | — | | | | — | | | | — | |
| Net change in unrealized appreciation (depreciation) on investments | | | 432,908 | | | | 1,033,623 | | | | 1,399,959 | | | | 382,496 | |
| Net change in unrealized appreciation (depreciation) on foreign currency transactions | | | — | | | | — | | | | — | | | | — | |
| | | | | | | | | | | | | | | | | |
| Net Realized and Unrealized Gain on Investments | | | 2,994,536 | | | | 1,427,003 | | | | 1,743,472 | | | | 3,420,883 | |
| | | | | | | | | | | | | | | | | |
| Change in Net Assets Resulting from Operations | | $ | 3,320,255 | | | $ | 2,798,403 | | | $ | 3,699,048 | | | $ | 3,921,175 | |
| | | | | | | | | | | | | | | | | |
| (A) Net of foreign tax withholding of: | | $ | 338 | | | $ | — | | | $ | — | | | $ | 5,985 | |
| | | | | | | | | | | | | | | | | |
| (B) See Note 4 in Notes to Financial Statements. | | | | | | | | | | | | | | | | |
See accompanying Notes to Financial Statements.
Statements of Operations (Continued)
| Touchstone | | | Touchstone | | | Touchstone | | | | | | Touchstone | | | | | | | |
| Mid Cap | | | Money | | | Third Avenue | | | Touchstone | | | Conservative | | | Touchstone | | | Touchstone | |
| Growth | | | Market | | | Value | | | Aggressive ETF | | | ETF | | | Enhanced ETF | | | Moderate ETF | |
| Fund | | | Fund | | | Fund | | | Fund | | | Fund | | | Fund | | | Fund | |
| | | | | | | | | | | | | | | | | | | | | | | | | | | |
| $ | 723 | | | $ | — | | | $ | 3,810 | | | $ | 275 | | | $ | 508 | | | $ | 208 | | | $ | 843 | |
| | 253,741 | | | | — | | | | 876,528 | | | | 347,348 | | | | 539,767 | | | | 233,690 | | | | 1,082,596 | |
| | — | | | | 160,200 | | | | — | | | | — | | | | — | | | | — | | | | — | |
| | 367 | | | | — | | | | 15,868 | | | | 9,681 | | | | 9,083 | | | | 16,661 | | | | 17,049 | |
| | 254,831 | | | | 160,200 | | | | 896,206 | | | | 357,304 | | | | 549,358 | | | | 250,559 | | | | 1,100,488 | |
| | | | | | | | | | | | | | | | | | | | | | | | | | | |
| | | | | | | | | | | | | | | | | | | | | | | | | | | |
| | 164,156 | | | | 76,093 | | | | 260,359 | | | | 61,903 | | | | 94,457 | | | | 45,388 | | | | 176,700 | |
| | 43,775 | | | | 84,512 | | | | 65,090 | | | | 30,951 | | | | 47,229 | | | | 22,694 | | | | 88,350 | |
| | 1,480 | | | | 1,480 | | | | 1,480 | | | | 1,480 | | | | 1,480 | | | | 1,480 | | | | 1,480 | |
| | 3,718 | | | | 755 | | | | 7,342 | | | | 950 | | | | 296 | | | | 701 | | | | 606 | |
| | 19,652 | | | | 20,373 | | | | 21,353 | | | | 16,970 | | | | 17,687 | | | | 16,337 | | | | 20,198 | |
| | 903 | | | | 171 | | | | 178 | | | | 113 | | | | 110 | | | | 112 | | | | 99 | |
| | 2,225 | | | | 4,077 | | | | 4,647 | | | | 480 | | | | 481 | | | | 417 | | | | 426 | |
| | 5,787 | | | | 3,408 | | | | 4,692 | | | | 2,084 | | | | 4,668 | | | | 4,632 | | | | 3,480 | |
| | 32,831 | | | | 105,684 | | | | 75,393 | | | | 38,689 | | | | 59,036 | | | | 28,368 | | | | 101,603 | |
| | 7,687 | | | | 7,531 | | | | 7,703 | | | | 7,699 | | | | 7,724 | | | | 7,719 | | | | 7,661 | |
| | 4,473 | | | | 5,654 | | | | 4,909 | | | | 4,299 | | | | 4,519 | | | | 4,161 | | | | 5,147 | |
| | 286,687 | | | | 309,738 | | | | 453,146 | | | | 165,618 | | | | 237,687 | | | | 132,009 | | | | 405,750 | |
| | (10,905 | ) | | | (153,742 | ) | | | (72,371 | ) | | | (49,551 | ) | | | (60,580 | ) | | | (46,906 | ) | | | (74,437 | ) |
| | 275,782 | | | | 155,996 | | | | 380,775 | | | | 116,067 | | | | 177,107 | | | | 85,103 | | | | 331,313 | |
| | | | | | | | | | | | | | | | | | | | | | | | | | | |
| | (20,951 | ) | | | 4,204 | | | | 515,431 | | | | 241,237 | | | | 372,251 | | | | 165,456 | | | | 769,175 | |
| | | | | | | | | | | | | | | | | | | | | | | | | | | |
| | | | | | | | | | | | | | | | | | | | | | | | | | | |
| | 2,519,228 | | | | — | | | | 4,534,697 | | | | 890,456 | | | | 1,167,912 | | | | 1,626,356 | | | | 1,583,860 | |
| | — | | | | — | | | | (3,131 | ) | | | — | | | | — | | | | — | | | | — | |
| | 1,537,729 | | | | — | | | | 1,061,254 | | | | 855,192 | | | | 16,429 | | | | (279,196 | ) | | | 1,902,492 | |
| | — | | | | — | | | | 40 | | | | — | | | | — | | | | — | | | | (427 | ) |
| | | | | | | | | | | | | | | | | | | | | | | | | | | |
| | 4,056,957 | | | | — | | | | 5,592,860 | | | | 1,745,648 | | | | 1,184,341 | | | | 1,347,160 | | | | 3,485,925 | |
| | | | | | | | | | | | | | | | | | | | | | | | | | | |
| $ | 4,036,006 | | | $ | 4,204 | | | $ | 6,108,291 | | | $ | 1,986,885 | | | $ | 1,556,592 | | | $ | 1,512,616 | | | $ | 4,255,100 | |
| | | | | | | | | | | | | | | | | | | | | | | | | | | |
| $ | 273 | | | $ | — | | | $ | 41,217 | | | $ | — | | | $ | — | | | $ | — | | | $ | — | |
Statements of Changes in Net Assets
| | | Touchstone | | | Touchstone | | | Touchstone | |
| | | Baron Small Cap | | | Core Bond | | | High Yield | |
| | | Growth Fund | | | Fund | | | Fund | |
| | | For the | | | For the | | | For the | | | For the | | | For the | | | For the | |
| | | Year | | | Year | | | Year | | | Year | | | Year | | | Year | |
| | | Ended | | | Ended | | | Ended | | | Ended | | | Ended | | | Ended | |
| | | December 31, | | | December 31, | | | December 31, | | | December 31, | | | December 31, | | | December 31, | |
| | | 2012 | | | 2011 | | | 2012 | | | 2011 | | | 2012 | | | 2011 | |
| From Operations | | | | | | | | | | | | | | | | | | | | | | | | |
| Net investment income (loss) | | $ | 325,719 | | | $ | (176,808 | ) | | $ | 1,371,400 | | | $ | 1,552,106 | | | $ | 1,955,576 | | | $ | 2,080,916 | |
| Net realized gain on investments | | | 2,561,628 | | | | 3,619,009 | | | | 393,380 | | | | 1,837,506 | | | | 343,513 | | | | 1,669,862 | |
| Net change in unrealized appreciation (depreciation) on investments | | | 432,908 | | | | (2,689,719 | ) | | | 1,033,623 | | | | 283,443 | | | | 1,399,959 | | | | (2,092,332 | ) |
| Change in Net Assets from Operations | | | 3,320,255 | | | | 752,482 | | | | 2,798,403 | | | | 3,673,055 | | | | 3,699,048 | | | | 1,658,446 | |
| | | | | | | | | | | | | | | | | | | | | | | | | |
| Distributions to Shareholders from: | | | | | | | | | | | | | | | | | | | | | | | | |
| Net investment income | | | — | | | | — | | | | (1,620,940 | ) | | | (1,448,950 | ) | | | (2,081,108 | ) | | | (2,427,279 | ) |
| Net realized gains | | | (3,241,819 | ) | | | — | | | | (1,510,404 | ) | | | (1,158,170 | ) | | | — | | | | — | |
| Total Distributions | | | (3,241,819 | ) | | | — | | | | (3,131,344 | ) | | | (2,607,120 | ) | | | (2,081,108 | ) | | | (2,427,279 | ) |
| | | | | | | | | | | | | | | | | | | | | | | | | |
| Share Transactions | | | | | | | | | | | | | | | | | | | | | | | | |
| Proceeds from shares sold | | | 2,492,466 | | | | 5,503,958 | | | | 1,859,769 | | | | 20,953,054 | | | | 8,163,689 | | | | 8,370,162 | |
| Reinvestment of distributions | | | 3,241,819 | | | | — | | | | 3,131,344 | | | | 2,607,120 | | | | 2,081,108 | | | | 2,427,279 | |
| Cost of shares redeemed | | | (7,420,866 | ) | | | (11,104,063 | ) | | | (6,081,861 | ) | | | (10,525,655 | ) | | | (9,229,040 | ) | | | (15,389,451 | ) |
| Change in Net Assets from Share Transactions | | | (1,686,581 | ) | | | (5,600,105 | ) | | | (1,090,748 | ) | | | 13,034,519 | | | | 1,015,757 | | | | (4,592,010 | ) |
| | | | | | | | | | | | | | | | | | | | | | | | | |
| Total Increase (Decrease) in Net Assets | | | (1,608,145 | ) | | | (4,847,623 | ) | | | (1,423,689 | ) | | | 14,100,454 | | | | 2,633,697 | | | | (5,360,843 | ) |
| | | | | | | | | | | | | | | | | | | | | | | | | |
| Net Assets | | | | | | | | | | | | | | | | | | | | | | | | |
| Beginning of period | | | 19,733,177 | | | | 24,580,800 | | | | 54,508,858 | | | | 40,408,404 | | | | 27,190,996 | | | | 32,551,839 | |
| End of period | | $ | 18,125,032 | | | $ | 19,733,177 | | | $ | 53,085,169 | | | $ | 54,508,858 | | | $ | 29,824,693 | | | $ | 27,190,996 | |
| | | | | | | | | | | | | | | | | | | | | | | | | |
| Accumulated Net Investment Income | | $ | 318,591 | | | $ | — | | | $ | 1,554,983 | | | $ | 1,616,864 | | | $ | 1,952,715 | | | $ | 2,077,668 | |
| | | | | | | | | | | | | | | | | | | | | | | | | |
| Share Transactions | | | | | | | | | | | | | | | | | | | | | | | | |
| Shares issued | | | 134,351 | | | | 318,816 | | | | 163,664 | | | | 1,849,688 | | | | 1,026,501 | | | | 1,024,340 | |
| Shares reinvested | | | 189,913 | | | | — | | | | 279,832 | | | | 233,202 | | | | 259,814 | | | | 320,222 | |
| Shares redeemed | | | (397,215 | ) | | | (662,862 | ) | | | (535,845 | ) | | | (932,251 | ) | | | (1,143,363 | ) | | | (1,903,922 | ) |
| Change from Share Transactions | | | (72,951 | ) | | | (344,046 | ) | | | (92,349 | ) | | | 1,150,639 | | | | 142,952 | | | | (559,360 | ) |
See accompanying Notes to Financial Statements.
Statements of Changes in Net Assets (Continued)
| Touchstone | | | Touchstone | |
| Large Cap | | | Mid Cap Growth | |
| Core Equity Fund | | | Fund | |
| For the | | | For the | | | For the | | | For the | |
| Year | | | Year | | | Year | | | Year | |
| Ended | | | Ended | | | Ended | | | Ended | |
| December 31, | | | December 31, | | | December 31, | | | December 31, | |
| 2012 | | | 2011 | | | 2012 | | | 2011 | |
| | | | | | | | | | | | | | | |
| $ | 500,292 | | | $ | 523,537 | | | $ | (20,951 | ) | | $ | (160,147 | ) |
| | 3,038,387 | | | | 2,253,119 | | | | 2,519,228 | | | | 2,990,749 | |
| | | | | | | | | | | | | | | |
| | | | | | | | | | | | | | | |
| | 382,496 | | | | (2,788,218 | ) | | | 1,537,729 | | | | (5,540,489 | ) |
| | 3,921,175 | | | | (11,562 | ) | | | 4,036,006 | | | | (2,709,887 | ) |
| | | | | | | | | | | | | | | |
| | | | | | | | | | | | | | | |
| | (524,998 | ) | | | (570,931 | ) | | | — | | | | (72,756 | ) |
| | — | | | | — | | | | — | | | | — | |
| | (524,998 | ) | | | (570,931 | ) | | | — | | | | (72,756 | ) |
| | | | | | | | | | | | | | | |
| | | | | | | | | | | | | | | |
| | 5,213,050 | | | | 6,604,252 | | | | 4,855,173 | | | | 3,010,829 | |
| | 524,998 | | | | 570,931 | | | | — | | | | 72,756 | |
| | (8,788,476 | ) | | | (17,236,172 | ) | | | (7,123,626 | ) | | | (7,839,994 | ) |
| | (3,050,428 | ) | | | (10,060,989 | ) | | | (2,268,453 | ) | | | (4,756,409 | ) |
| | | | | | | | | | | | | | | |
| | | | | | | | | | | | | | | |
| | 345,749 | | | | (10,643,482 | ) | | | 1,767,553 | | | | (7,539,052 | ) |
| | | | | | | | | | | | | | | |
| | | | | | | | | | | | | | | |
| | 32,476,778 | | | | 43,120,260 | | | | 20,474,164 | | | | 28,013,216 | |
| $ | 32,822,527 | | | $ | 32,476,778 | | | $ | 22,241,717 | | | $ | 20,474,164 | |
| | | | | | | | | | | | | | | |
| | | | | | | | | | | | | | | |
| $ | 497,085 | | | $ | 521,791 | | | $ | — | | | $ | — | |
| | | | | | | | | | | | | | | |
| | | | | | | | | | | | | | | |
| | 534,438 | | | | 706,102 | | | | 364,229 | | | | 223,176 | |
| | 52,291 | | | | 62,125 | | | | — | | | | 6,130 | |
| | (885,021 | ) | | | (1,987,578 | ) | | | (527,753 | ) | | | (589,486 | ) |
| | (298,292 | ) | | | (1,219,351 | ) | | | (163,524 | ) | | | (360,180 | ) |
Statements of Changes in Net Assets (Continued)
| | | Touchstone | | | Touchstone | | | Touchstone | |
| | | Money Market | | | Third Avenue | | | Aggressive ETF | |
| | | Fund | | | Value Fund | | | Fund | |
| | | For the | | | For the | | | For the | | | For the | | | For the | | | For the | |
| | | Year | | | Year | | | Year | | | Year | | | Year | | | Year | |
| | | Ended | | | Ended | | | Ended | | | Ended | | | Ended | | | Ended | |
| | | December 31, | | | December 31, | | | December 31, | | | December 31, | | | December 31, | | | December 31, | |
| | | 2012 | | | 2011 | | | 2012 | | | 2011 | | | 2012 | | | 2011 | |
| From Operations | | | | | | | | | | | | | | | | | | | | | | | | |
| Net investment income | | $ | 4,204 | | | $ | 5,608 | | | $ | 515,431 | | | $ | 228,624 | | | $ | 241,237 | | | $ | 256,951 | |
| Net realized gain (loss) on investments and foreign currency transactions | | | — | | | | (590 | ) | | | 4,531,566 | | | | 4,422,348 | | | | 890,456 | | | | 2,466,584 | |
| Net change in unrealized appreciation (depreciation) on investments and foreign currency transactions | | | — | | | | — | | | | 1,061,294 | | | | (11,062,054 | ) | | | 855,192 | | | | (2,413,231 | ) |
| Change in Net Assets from Operations | | | 4,204 | | | | 5,018 | | | | 6,108,291 | | | | (6,411,082 | ) | | | 1,986,885 | | | | 310,304 | |
| | | | | | | | | | | | | | | | | | | | | | | | | |
| Distributions to Shareholders from: | | | | | | | | | | | | | | | | | | | | | | | | |
| Net investment income | | | (4,204 | ) | | | (5,608 | ) | | | — | | | | (840,849 | ) | | | (254,657 | ) | | | (254,769 | ) |
| Net realized gains | | | — | | | | (1,524 | ) | | | — | | | | — | | | | — | | | | — | |
| Total Distributions | | | (4,204 | ) | | | (7,132 | ) | | | — | | | | (840,849 | ) | | | (254,657 | ) | | | (254,769 | ) |
| | | | | | | | | | | | | | | | | | | | | | | | | |
| Share Transactions | | | | | | | | | | | | | | | | | | | | | | | | |
| Proceeds from shares sold | | | 34,014,781 | | | | 60,271,112 | | | | 876,707 | | | | 1,227,361 | | | | 375,117 | | | | 4,349,511 | |
| Reinvestment of distributions | | | 4,204 | | | | 2,409 | | | | — | | | | 840,849 | | | | 254,657 | | | | 254,769 | |
| Cost of shares redeemed | | | (45,392,215 | ) | | | (66,774,904 | ) | | | (8,126,828 | ) | | | (14,632,572 | ) | | | (6,311,934 | ) | | | (6,091,501 | ) |
| Change in Net Assets from Share Transactions | | | (11,373,230 | ) | | | (6,501,383 | ) | | | (7,250,121 | ) | | | (12,564,362 | ) | | | (5,682,160 | ) | | | (1,487,221 | ) |
| | | | | | | | | | | | | | | | | | | | | | | | | |
| Total Increase (Decrease) in Net Assets | | | (11,373,230 | ) | | | (6,503,497 | ) | | | (1,141,830 | ) | | | (19,816,293 | ) | | | (3,949,932 | ) | | | (1,431,686 | ) |
| | | | | | | | | | | | | | | | | | | | | | | | | |
| Net Assets | | | | | | | | | | | | | | | | | | | | | | | | |
| Beginning of period | | | 50,528,034 | | | | 57,031,531 | | | | 32,761,360 | | | | 52,577,653 | | | | 17,909,778 | | | | 19,341,464 | |
| End of period | | $ | 39,154,804 | | | $ | 50,528,034 | | | $ | 31,619,530 | | | $ | 32,761,360 | | | $ | 13,959,846 | | | $ | 17,909,778 | |
| | | | | | | | | | | | | | | | | | | | | | | | | |
| Accumulated Net Investment Income (Loss) | | $ | — | | | $ | (48 | ) | | $ | (349,131 | ) | | $ | (1,586,412 | ) | | $ | 239,018 | | | $ | 253,424 | |
| | | | | | | | | | | | | | | | | | | | | | | | | |
| Share Transactions | | | | | | | | | | | | | | | | | | | | | | | | |
| Shares issued | | | 34,014,781 | | | | 60,271,112 | | | | 54,184 | | | | 74,258 | | | | 34,557 | | | | 433,536 | |
| Shares reinvested | | | 4,204 | | | | 2,409 | | | | — | | | | 57,711 | | | | 23,004 | | | | 25,225 | |
| Shares redeemed | | | (45,392,215 | ) | | | (66,774,904 | ) | | | (503,763 | ) | | | (860,686 | ) | | | (581,622 | ) | | | (572,953 | ) |
| Change from Share Transactions | | | (11,373,230 | ) | | | (6,501,383 | ) | | | (449,579 | ) | | | (728,717 | ) | | | (524,061 | ) | | | (114,192 | ) |
See accompanying Notes to Financial Statements.
Statements of Changes in Net Assets (Continued)
| Touchstone | | | Touchstone | | | Touchstone | |
| Conservative ETF | | | Enhanced ETF | | | Moderate ETF | |
| Fund | | | Fund | | | Fund | |
| For the | | | For the | | | For the | | | For the | | | For the | | | For the | |
| Year | | | Year | | | Year | | | Year | | | Year | | | Year | |
| Ended | | | Ended | | | Ended | | | Ended | | | Ended | | | Ended | |
| December 31, | | | December 31, | | | December 31, | | | December 31, | | | December 31, | | | December 31, | |
| 2012 | | | 2011 | | | 2012 | | | 2011 | | | 2012 | | | 2011 | |
| | | | | | | | | | | | | | | | | | | | | | | |
| $ | 372,251 | | | $ | 409,303 | | | $ | 165,456 | | | $ | 85,961 | | | $ | 769,175 | | | $ | 843,807 | |
| | | | | | | | | | | | | | | | | | | | | | | |
| | | | | | | | | | | | | | | | | | | | | | | |
| | 1,167,912 | | | | 1,215,892 | | | | 1,626,356 | | | | 464,463 | | | | 1,583,860 | | | | 443,087 | |
| | | | | | | | | | | | | | | | | | | | | | | |
| | | | | | | | | | | | | | | | | | | | | | | |
| | 16,429 | | | | (819,585 | ) | | | (279,196 | ) | | | (1,060,650 | ) | | | 1,902,065 | | | | (273,573 | ) |
| | 1,556,592 | | | | 805,610 | | | | 1,512,616 | | | | (510,226 | ) | | | 4,255,100 | | | | 1,013,321 | |
| | | | | | | | | | | | | | | | | | | | | | | |
| | | | | | | | | | | | | | | | | | | | | | | |
| | (400,125 | ) | | | (441,810 | ) | | | (84,834 | ) | | | (103,610 | ) | | | (830,074 | ) | | | (928,782 | ) |
| | (383,118 | ) | | | — | | | | — | | | | — | | | | — | | | | — | |
| | (783,243 | ) | | | (441,810 | ) | | | (84,834 | ) | | | (103,610 | ) | | | (830,074 | ) | | | (928,782 | ) |
| | | | | | | | | | | | | | | | | | | | | | | |
| | | | | | | | | | | | | | | | | | | | | | | |
| | 4,441,109 | | | | 4,130,005 | | | | 126,978 | | | | 624,805 | | | | 1,194,076 | | | | 2,533,306 | |
| | 783,243 | | | | 441,810 | | | | 84,834 | | | | 103,610 | | | | 830,074 | | | | 928,782 | |
| | (5,630,504 | ) | | | (4,832,382 | ) | | | (2,328,017 | ) | | | (2,806,805 | ) | | | (8,385,882 | ) | | | (11,873,326 | ) |
| | (406,152 | ) | | | (260,567 | ) | | | (2,116,205 | ) | | | (2,078,390 | ) | | | (6,361,732 | ) | | | (8,411,238 | ) |
| | | | | | | | | | | | | | | | | | | | | | | |
| | 367,197 | | | | 103,233 | | | | (688,423 | ) | | | (2,692,226 | ) | | | (2,936,706 | ) | | | (8,326,699 | ) |
| | | | | | | | | | | | | | | | | | | | | | | |
| | | | | | | | | | | | | | | | | | | | | | | |
| | 23,168,973 | | | | 23,065,740 | | | | 11,613,241 | | | | 14,305,467 | | | | 45,164,867 | | | | 53,491,566 | |
| $ | 23,536,170 | | | $ | 23,168,973 | | | $ | 10,924,818 | | | $ | 11,613,241 | | | $ | 42,228,161 | | | $ | 45,164,867 | |
| | | | | | | | | | | | | | | | | | | | | | | |
| | | | | | | | | | | | | | | | | | | | | | | |
| $ | 366,161 | | | $ | 398,219 | | | $ | 163,363 | | | $ | 83,581 | | | $ | 759,947 | | | $ | 826,859 | |
| | | | | | | | | | | | | | | | | | | | | | | |
| | | | | | | | | | | | | | | | | | | | | | | |
| | 362,537 | | | | 349,551 | | | | 15,506 | | | | 77,804 | | | | 94,883 | | | | 207,738 | |
| | 64,084 | | | | 37,473 | | | | 9,853 | | | | 13,491 | | | | 64,597 | | | | 77,463 | |
| | (458,352 | ) | | | (407,926 | ) | | | (282,378 | ) | | | (353,337 | ) | | | (660,657 | ) | | | (969,088 | ) |
| | (31,731 | ) | | | (20,902 | ) | | | (257,019 | ) | | | (262,042 | ) | | | (501,177 | ) | | | (683,887 | ) |
Financial Highlights
Touchstone Baron Small Cap Growth Fund
Selected Data for a Share Outstanding Throughout Each Period
| | | Year Ended December 31, | |
| | | 2012 | | | 2011 | | | 2010 | | | 2009 | | | 2008 | |
| Net asset value at beginning of period | | $ | 17.55 | | | $ | 16.74 | | | $ | 13.40 | | | $ | 10.08 | | | $ | 20.52 | |
| Income (loss) from investment operations: | | | | | | | | | | | | | | | | | | | | |
| Net investment income (loss) | | | 0.31 | | | | (0.15 | ) | | | (0.06 | ) | | | (0.08 | ) | | | (0.07 | ) |
| Net realized and unrealized gains (losses) on investments | | | 3.02 | | | | 0.96 | | | | 3.40 | | | | 3.40 | | | | (7.11 | ) |
| Total from investment operations | | | 3.33 | | | | 0.81 | | | | 3.34 | | | | 3.32 | | | | (7.18 | ) |
| Distributions from: | | | | | | | | | | | | | | | | | | | | |
| Realized capital gains | | | (3.64 | ) | | | — | | | | — | | | | — | | | | (3.26 | ) |
| Net asset value at end of period | | $ | 17.24 | | | $ | 17.55 | | | $ | 16.74 | | | $ | 13.40 | | | $ | 10.08 | |
| Total return(A) | | | 19.17 | % | | | 4.84 | % | | | 24.93 | % | | | 32.94 | % | | | (33.64 | %) |
| Ratios and supplemental data: | | | | | | | | | | | | | | | | | | | | |
| Net assets at end of period (000's) | | $ | 18,125 | | | $ | 19,733 | | | $ | 24,581 | | | $ | 20,329 | | | $ | 14,243 | |
| Ratio to average net assets: | | | | | | | | | | | | | | | | | | | | |
| Net expenses | | | 1.55 | % | | | 1.55 | % | | | 1.55 | % | | | 1.55 | % | | | 1.55 | % |
| Gross expenses | | | 1.69 | % | | | 1.63 | % | | | 1.62 | % | | | 1.81 | % | | | 1.84 | % |
| Net investment Income (loss) | | | 1.71 | % | | | (0.79 | %) | | | (0.43 | %) | | | (0.81 | %) | | | (0.51 | %) |
| Portfolio turnover rate | | | 15 | % | | | 15 | % | | | 18 | % | | | 9 | % | | | 7 | % |
Touchstone Core Bond Fund
Selected Data for a Share Outstanding Throughout Each Period
| | | Year Ended December 31, | |
| | | 2012 | | | 2011 | | | 2010 | | | 2009 | | | 2008 | |
| Net asset value at beginning of period | | $ | 11.09 | | | $ | 10.73 | | | $ | 10.37 | | | $ | 9.49 | | | $ | 10.33 | |
| Income (loss) from investment operations: | | | | | | | | | | | | | | | | | | | | |
| Net investment income | | | 0.29 | | | | 0.37 | (B) | | | 0.38 | | | | 0.39 | | | | 0.54 | |
| Net realized and unrealized gains (losses) on investments | | | 0.30 | | | | 0.53 | | | | 0.40 | | | | 1.02 | | | | (0.88 | ) |
| Total from investment operations | | | 0.59 | | | | 0.90 | | | | 0.78 | | | | 1.41 | | | | (0.34 | ) |
| Distributions from: | | | | | | | | | | | | | | | | | | | | |
| Net investment income | | | (0.35 | ) | | | (0.30 | ) | | | (0.42 | ) | | | (0.48 | ) | | | (0.50 | ) |
| Realized capital gains | | | (0.33 | ) | | | (0.24 | ) | | | — | | | | (0.05 | ) | | | — | |
| Total distributions | | | (0.68 | ) | | | (0.54 | ) | | | (0.42 | ) | | | (0.53 | ) | | | (0.50 | ) |
| Net asset value at end of period | | $ | 11.00 | | | $ | 11.09 | | | $ | 10.73 | | | $ | 10.37 | | | $ | 9.49 | |
| Total return(A) | | | 5.28 | % | | | 8.45 | % | | | 7.57 | % | | | 14.90 | % | | | (3.26 | %) |
| Ratios and supplemental data: | | | | | | | | | | | | | | | | | | | | |
| Net assets at end of period (000's) | | $ | 53,085 | | | $ | 54,509 | | | $ | 40,408 | | | $ | 38,586 | | | $ | 35,435 | |
| Ratio to average net assets: | | | | | | | | | | | | | | | | | | | | |
| Net expenses | | | 1.00 | % | | | 0.93 | % | | | 0.91 | % | | | 1.00 | % | | | 1.00 | % |
| Gross expenses | | | 1.00 | % | | | 0.93 | % | | | 0.91 | % | | | 1.02 | % | | | 1.03 | % |
| Net investment income | | | 2.55 | % | | | 3.29 | % | | | 3.50 | % | | | 3.67 | % | | | 4.75 | % |
| Portfolio turnover rate | | | 404 | % | | | 419 | % | | | 487 | % | | | 422 | % | | | 171 | % |
| (A) | Total returns do not include any insurance, sales or administrative charges of variable annuity or life insurance contracts. If these charges were included, the returns would be lower. |
| (B) | The net investment income per share is based on average shares outstanding for the period or year. |
See accompanying Notes to Financial Statements.
Financial Highlights (Continued)
Touchstone High Yield Fund
Selected Data for a Share Outstanding Throughout Each Period
| | | Year Ended December 31, | |
| | | 2012 | | | 2011 | | | 2010 | | | 2009 | | | 2008 | |
| Net asset value at beginning of period | | $ | 7.59 | | | $ | 7.86 | | | | 7.64 | | | $ | 5.52 | | | $ | 7.94 | |
| Income (loss) from investment operations: | | | | | | | | | | | | | | | | | | | | |
| Net investment income | | | 0.54 | | | | 0.74 | | | | 0.72 | | | | 0.67 | | | | 0.21 | |
| Net realized and unrealized gains (losses) on investments | | | 0.48 | | | | (0.26 | ) | | | 0.25 | | | | 1.92 | | | | (2.14 | ) |
| Total from investment operations | | | 1.02 | | | | 0.48 | | | | 0.97 | | | | 2.59 | | | | (1.93 | ) |
| Distributions from: | | | | | | | | | | | | | | | | | | | | |
| Net investment income | | | (0.60 | ) | | | (0.75 | ) | | | (0.75 | ) | | | (0.47 | ) | | | (0.49 | ) |
| Net asset value at end of period | | $ | 8.01 | | | $ | 7.59 | | | | 7.86 | | | $ | 7.64 | | | $ | 5.52 | |
| Total return(A) | | | 13.45 | % | | | 6.08 | % | | | 12.65 | % | | | 46.90 | % | | | (24.31 | %) |
| Ratios and supplemental data: | | | | | | | | | | | | | | | | | | | | |
| Net assets at end of period (000's) | | $ | 29,825 | | | $ | 27,191 | | | | 32,552 | | | $ | 35,038 | | | $ | 29,081 | |
| Ratio to average net assets: | | | | | | | | | | | | | | | | | | | | |
| Net expenses | | | 1.05 | % | | | 1.05 | % | | | 1.05 | % | | | 1.05 | % | | | 1.05 | % |
| Gross expenses | | | 1.10 | % | | | 1.05 | % | | | 1.05 | % | | | 1.05 | % | | | 1.15 | % |
| Net investment income | | | 6.47 | % | | | 6.96 | % | | | 7.57 | % | | | 8.72 | % | | | 8.01 | % |
| Portfolio turnover rate | | | 48 | % | | | 55 | % | | | 56 | % | | | 61 | % | | | 52 | % |
Touchstone Large Cap Core Equity Fund
Selected Data for a Share Outstanding Throughout Each Period
| | | Year Ended December 31, | |
| | | 2012 | | | 2011 | | | 2010 | | | 2009 | | | 2008 | |
| Net asset value at beginning of period | | $ | 9.15 | | | $ | 9.04 | | | | 8.20 | | | $ | 6.69 | | | $ | 11.22 | |
| Income (loss) from investment operations: | | | | | | | | | | | | | | | | | | | | |
| Net investment income (loss) | | | 0.17 | | | | 0.12 | (B) | | | 0.18 | | | | 0.09 | | | | (0.05 | ) |
| Net realized and unrealized gains (losses) on investments | | | 0.93 | | | | 0.15 | (C) | | | 0.82 | | | | 1.52 | | | | (3.92 | ) |
| Total from investment operations | | | 1.10 | | | | 0.27 | | | | 1.00 | | | | 1.61 | | | | (3.97 | ) |
| Distributions from: | | | | | | | | | | | | | | | | | | | | |
| Net investment income | | | (0.16 | ) | | | (0.16 | ) | | | (0.16 | ) | | | (0.10 | ) | | | (0.07 | ) |
| Realized capital gains | | | — | | | | — | | | | — | | | | — | | | | (0.49 | ) |
| Total distributions | | | (0.16 | ) | | | (0.16 | ) | | | (0.16 | ) | | | (0.10 | ) | | | (0.56 | ) |
| Net asset value at end of period | | $ | 10.09 | | | $ | 9.15 | | | | 9.04 | | | $ | 8.20 | | | $ | 6.69 | |
| Total return(A) | | | 12.07 | % | | | 3.02 | % | | | 12.20 | % | | | 24.06 | % | | | (35.20 | %) |
| Ratios and supplemental data: | | | | | | | | | | | | | | | | | | | | |
| Net assets at end of period (000's) | | $ | 32,823 | | | $ | 32,477 | | | $ | 43,120 | | | $ | 63,316 | | | $ | 49,265 | |
| Ratio to average net assets: | | | | | | | | | | | | | | | | | | | | |
| Net expenses | | | 1.00 | % | | | 1.00 | % | | | 1.00 | % | | | 1.00 | % | | | 1.00 | % |
| Gross expenses | | | 1.16 | % | | | 1.13 | % | | | 1.04 | % | | | 1.06 | % | | | 1.10 | % |
| Net investment income (loss) | | | 1.40 | % | | | 1.29 | % | | | 1.07 | % | | | 1.40 | % | | | (1.42 | %) |
| Portfolio turnover rate | | | 39 | % | | | 33 | % | | | 33 | % | | | 38 | % | | | 81 | % |
| (A) | Total returns do not include any insurance, sales or administrative charges of variable annuity or life insurance contracts. If these charges were included, the returns would be lower. |
| (B) | The net investment income per share is based on average shares outstanding for the period or year. |
| (C) | The amounts shown for a share outstanding throughout the period does not accord with the change in net realized and unrealized gains (losses) on investments for the period due to the timing of purchases and sales of fund shares in relation to fluctuating market values during the period. |
See accompanying Notes to Financial Statements.
Financial Highlights (Continued)
Touchstone Mid Cap Growth Fund
Selected Data for a Share Outstanding Throughout Each Period
| | | Year Ended December 31, | |
| | | 2012 | | | 2011 | | | 2010 | | | 2009 | | | 2008 | |
| Net asset value at beginning of period | | $ | 11.84 | | | $ | 13.40 | | | | 11.04 | | | $ | 7.95 | | | $ | 18.55 | |
| Income (loss) from investment operations: | | | | | | | | | | | | | | | | | | | | |
| Net investment income (loss) | | | (0.01 | ) | | | (0.09 | ) | | | 0.04 | | | | 0.03 | | | | 0.02 | |
| Net realized and unrealized gains (losses) on investments | | | 2.37 | | | | (1.43 | ) | | | 2.35 | | | | 3.07 | | | | (7.54 | ) |
| Total from investment operations | | | 2.36 | | | | (1.52 | ) | | | 2.39 | | | | 3.10 | | | | (7.52 | ) |
| Distributions from: | | | | | | | | | | | | | | | | | | | | |
| Net investment income | | | — | | | | (0.04 | ) | | | (0.03 | ) | | | (0.01 | ) | | | — | |
| Realized capital gains | | | — | | | | — | | | | — | | | | — | | | | (3.08 | ) |
| Total distributions | | | — | | | | (0.04 | ) | | | (0.03 | ) | | | (0.01 | ) | | | (3.08 | ) |
| Net asset value at end of period | | $ | 14.20 | | | $ | 11.84 | | | | 13.40 | | | $ | 11.04 | | | $ | 7.95 | |
| Total return(A) | | | 19.93 | % | | | (11.33 | %) | | | 21.63 | % | | | 38.99 | % | | | (39.70 | %) |
| Ratios and supplemental data: | | | | | | | | | | | | | | | | | | | | |
| Net assets at end of period (000's) | | $ | 22,242 | | | $ | 20,474 | | | | 28,013 | | | $ | 25,521 | | | $ | 20,713 | |
| Ratio to average net assets: | | | | | | | | | | | | | | | | | | | | |
| Net expenses | | | 1.26 | % | | | 1.22 | % | | | 1.17 | % | | | 1.16 | % | | | 1.16 | % |
| Gross expenses | | | 1.31 | % | | | 1.25 | % | | | 1.27 | % | | | 1.40 | % | | | 1.36 | % |
| Net investment income (loss) | | | (0.10 | %) | | | (0.63 | %) | | | 0.31 | % | | | 0.26 | % | | | 0.06 | % |
| Portfolio turnover rate | | | 78 | % | | | 141 | % | | | 60 | % | | | 71 | % | | | 73 | % |
Touchstone Money Market Fund
Selected Data for a Share Outstanding Throughout Each Period
| | | Year Ended December 31, | |
| | | 2012 | | | 2011 | | | 2010 | | | 2009 | | | 2008 | |
| Net asset value at beginning of period | | $ | 1.00 | | | $ | 1.00 | | | $ | 1.00 | | | $ | 1.00 | | | $ | 1.00 | |
| Income (loss) from investment operations: | | | | | | | | | | | | | | | | | | | | |
| Net investment income | | | — | (B) | | | — | (B) | | | — | (B) | | | 0.01 | | | | 0.03 | |
| Net realized gains (losses) on investments | | | — | | | | (— | )(B) | | | — | (B) | | | — | (B) | | | — | |
| Total from investment operations | | | — | (B) | | | — | (B) | | | — | (B) | | | 0.01 | | | | 0.03 | |
| Distributions from: | | | | | | | | | | | | | | | | | | | | |
| Net investment income | | | (— | )(B) | | | (— | )(B) | | | (— | )(B) | | | (0.01 | ) | | | (0.03 | ) |
| Realized capital gains | | | — | | | | (— | )(B) | | | (— | )(B) | | | — | | | | — | |
| Total distributions | | | (— | )(B) | | | (— | )(B) | | | (— | )(B) | | | (0.01 | ) | | | (0.03 | ) |
| Net asset value at end of period | | $ | 1.00 | | | $ | 1.00 | | | $ | 1.00 | | | $ | 1.00 | | | $ | 1.00 | |
| Total return(A) | | | 0.01 | % | | | 0.02 | % | | | 0.19 | % | | | 0.88 | % | | | 2.99 | % |
| Ratios and supplemental data: | | | | | | | | | | | | | | | | | | | | |
| Net assets at end of period (000's) | | $ | 39,155 | | | $ | 50,528 | | | $ | 57,032 | | | $ | 79,749 | | | $ | 52,790 | |
| Ratio to average net assets: | | | | | | | | | | | | | | | | | | | | |
| Net expenses | | | 0.37 | % | | | 0.36 | % | | | 0.53 | % | | | 0.71 | %(C) | | | 0.65 | % |
| Gross expenses | | | 0.73 | % | | | 0.71 | % | | | 0.65 | % | | | 0.72 | % | | | 0.65 | % |
| Net investment income | | | 0.01 | % | | | 0.01 | % | | | 0.02 | % | | | 0.80 | % | | | 2.94 | % |
| (A) | Total returns do not include any insurance, sales or administrative charges of variable annuity or life insurance contracts. If these charges were included, the returns would be lower. |
| (B) | Less than $0.005 per share. |
| (C) | Absent money market insurance, the ratio of net expenses to average net assets would have been 0.67%. |
See accompanying Notes to Financial Statements.
Financial Highlights (Continued)
Touchstone Third Avenue Value Fund
Selected Data for a Share Outstanding Throughout Each Period
| | | Year Ended December 31, | |
| | | 2012 | | | 2011 | | | 2010 | | | 2009 | | | 2008 | |
| Net asset value at beginning of period | | $ | 14.58 | | | $ | 17.67 | | | $ | 15.61 | | | $ | 12.93 | | | $ | 26.70 | |
| Income (loss) from investment operations: | | | | | | | | | | | | | | | | | | | | |
| Net investment income | | | 0.26 | (A) | | | 0.09 | (A) | | | 0.25 | | | | 0.26 | | | | 0.23 | |
| Net realized and unrealized gains (losses) on investments | | | 2.76 | | | | (2.80 | ) | | | 2.90 | | | | 3.78 | | | | (10.68 | ) |
| Total from investment operations | | | 3.02 | | | | (2.71 | ) | | | 3.15 | | | | 4.04 | | | | (10.45 | ) |
| Distributions from: | | | | | | | | | | | | | | | | | | | | |
| Net investment income | | | — | | | | (0.38 | ) | | | (1.09 | ) | | | (0.29 | ) | | | (0.31 | ) |
| Realized capital gains | | | — | | | | — | | | | — | | | | (1.07 | ) | | | (3.01 | ) |
| Total distributions | | | — | | | | (0.38 | ) | | | (1.09 | ) | | | (1.36 | ) | | | (3.32 | ) |
| Net asset value at end of period | | $ | 17.60 | | | $ | 14.58 | | | $ | 17.67 | | | $ | 15.61 | | | $ | 12.93 | |
| Total return(B) | | | 20.71 | % | | | (15.31 | %) | | | 20.20 | % | | | 31.39 | % | | | (38.50 | %) |
| Ratios and supplemental data: | | | | | | | | | | | | | | | | | | | | |
| Net assets at end of period (000's) | | $ | 31,620 | | | $ | 32,761 | | | $ | 52,578 | | | $ | 53,505 | | | $ | 58,109 | |
| Ratio to average net assets: | | | | | | | | | | | | | | | | | | | | |
| Net expenses | | | 1.17 | % | | | 1.17 | % | | | 1.17 | % | | | 1.13 | % | | | 1.06 | % |
| Gross expenses | | | 1.39 | % | | | 1.32 | % | | | 1.87 | %(C) | | | 1.34 | % | | | 1.34 | % |
| Net investment income | | | 1.58 | % | | | 0.52 | % | | | 0.93 | % | | | 1.17 | % | | | 1.08 | % |
| Portfolio turnover rate | | | 28 | % | | | 4 | % | | | 10 | % | | | 4 | % | | | 12 | % |
| (A) | The net investment income per share is based on average shares outstanding for the period or year. |
| (B) | Total returns do not include any insurance, sales or administrative charges of variable annuity or life insurance contracts. If these charges were included, the returns would be lower. |
| (C) | Absent PFIC Tax expenses, the ratio of gross expenses to average net assets would have been 1.37%. |
See accompanying Notes to Financial Statements.
Financial Highlights (Continued)
Touchstone Aggressive ETF Fund
Selected Data for a Share Outstanding Throughout Each Period
| | | Year Ended December 31, | |
| | | 2012 | | | 2011 | | | 2010 | | | 2012 | | | 2008 | |
| Net asset value at beginning of period | | $ | 10.07 | | | $ | 10.22 | | | $ | 9.17 | | | $ | 7.80 | | | $ | 12.70 | |
| Income (loss) from investment operations: | | | | | | | | | | | | | | | | | | | | |
| Net investment income (loss) | | | 0.26 | | | | 0.16 | | | | 0.14 | | | | (0.09 | ) | | | 0.26 | |
| Net realized and unrealized gains (losses) on investments | | | 1.01 | | | | (0.16 | )(A) | | | 1.07 | | | | 1.78 | | | | (4.00 | ) |
| Total from investment operations | | | 1.27 | | | | — | | | | 1.21 | | | | 1.69 | | | | (3.74 | ) |
| Distributions from: | | | | | | | | | | | | | | | | | | | | |
| Net investment income | | | (0.21 | ) | | | (0.15 | ) | | | (0.16 | ) | | | (0.20 | ) | | | (0.25 | ) |
| Realized capital gains | | | — | | | | — | | | | — | | | | (0.12 | ) | | | (0.91 | ) |
| Total distributions | | | (0.21 | ) | | | (0.15 | ) | | | (0.16 | ) | | | (0.32 | ) | | | (1.16 | ) |
| Net asset value at end of period | | $ | 11.13 | | | $ | 10.07 | | | $ | 10.22 | | | $ | 9.17 | | | $ | 7.80 | |
| Total return(B) | | | 12.59 | % | | | (0.05 | %) | | | 13.19 | % | | | 21.72 | % | | | (29.12 | %) |
| Ratios and supplemental data: | | | | | | | | | | | | | | | | | | | | |
| Net assets at end of period (000's) | | $ | 13,960 | | | $ | 17,910 | | | $ | 19,341 | | | $ | 17,470 | | | $ | 7,361 | |
| Ratio to average net assets: | | | | | | | | | | | | | | | | | | | | |
| Net expenses(C) | | | 0.75 | % | | | 0.75 | % | | | 0.75 | % | | | 0.75 | % | | | 0.75 | % |
| Gross expenses(C) | | | 1.07 | % | | | 1.04 | % | | | 1.07 | % | | | 1.21 | % | | | 1.25 | % |
| Net investment income (loss)(C) | | | 1.56 | % | | | 1.50 | % | | | 1.54 | % | | | (2.18 | %) | | | 2.15 | % |
| Portfolio turnover rate | | | 11 | % | | | 40 | % | | | 44 | % | | | 45 | % | | | 20 | % |
Touchstone Conservative ETF Fund
Selected Data for a Share Outstanding Throughout Each Period
| | | Year Ended December 31, | |
| | | 2012 | | | 2011 | | | 2010 | | | 2009 | | | 2008 | |
| Net asset value at beginning of period | | $ | 11.77 | | | $ | 11.60 | | | $ | 10.90 | | | $ | 10.17 | | | $ | 11.92 | |
| Income (loss) from investment operations: | | | | | | | | | | | | | | | | | | | | |
| Net investment income (loss) | | | 0.20 | | | | 0.22 | | | | 0.24 | | | | (0.04 | ) | | | 0.53 | |
| Net realized and unrealized gains (losses) on investments | | | 0.59 | | | | 0.18 | | | | 0.72 | | | | 1.24 | | | | (1.67 | ) |
| Total from investment operations | | | 0.79 | | | | 0.40 | | | | 0.96 | | | | 1.20 | | | | (1.14 | ) |
| Distributions from: | | | | | | | | | | | | | | | | | | | | |
| Net investment income | | | (0.21 | ) | | | (0.23 | ) | | | (0.26 | ) | | | (0.36 | ) | | | (0.34 | ) |
| Realized capital gains | | | (0.20 | ) | | | — | | | | — | | | | (0.11 | ) | | | (0.27 | ) |
| Total distributions | | | (0.41 | ) | | | (0.23 | ) | | | (0.26 | ) | | | (0.47 | ) | | | (0.61 | ) |
| Net asset value at end of period | | $ | 12.15 | | | $ | 11.77 | | | $ | 11.60 | | | $ | 10.90 | | | $ | 10.17 | |
| Total return(B) | | | 6.74 | % | | | 3.44 | % | | | 8.81 | % | | | 11.79 | % | | | (9.49 | %) |
| Ratios and supplemental data: | | | | | | | | | | | | | | | | | | | | |
| Net assets at end of period (000's) | | $ | 23,536 | | | $ | 23,169 | | | $ | 23,066 | | | $ | 22,626 | | | $ | 10,835 | |
| Ratio to average net assets: | | | | | | | | | | | | | | | | | | | | |
| Net expenses(C) | | | 0.75 | % | | | 0.75 | % | | | 0.75 | % | | | 0.75 | % | | | 0.75 | % |
| Gross expenses(C) | | | 1.01 | % | | | 0.99 | % | | | 1.00 | % | | | 1.10 | % | | | 1.14 | % |
| Net investment income (loss)(C) | | | 1.58 | % | | | 1.76 | % | | | 1.95 | % | | | (2.61 | %) | | | 3.10 | % |
| Portfolio turnover rate | | | 22 | % | | | 28 | % | | | 21 | % | | | 40 | % | | | 39 | % |
| (A) | The amounts shown for a share outstanding throughout the period does not accord with the change in net realized and unrealized gains (losses) on investments for the period due to the timing of purchases and sales of fund shares in relation to fluctuating market values during the period. |
| (B) | Total returns do not include any insurance, sales or administrative charges of variable annuity or life insurance contracts. If these charges were included, the returns would be lower. |
| (C) | Ratio does not include income and expenses of the underlying funds. |
See accompanying Notes to Financial Statements.
Financial Highlights (Continued)
Touchstone Enhanced ETF Fund
Selected Data for a Share Outstanding Throughout Each Period
| | | Year Ended December 31, | |
| | | 2012 | | | 2011 | | | 2010 | | | 2012 | | | 2008 | |
| Net asset value at beginning of period | | $ | 7.64 | | | $ | 8.03 | | | $ | 7.34 | | | $ | 6.19 | | | $ | 13.88 | |
| Income (loss) from investment operations: | | | | | | | | | | | | | | | | | | | | |
| Net investment income | | | 0.14 | | | | 0.07 | | | | 0.09 | | | | 0.17 | | | | 0.13 | |
| Net realized and unrealized gains (losses) on investments | | | 0.94 | | | | (0.39 | ) | | | 0.75 | | | | 1.20 | | | | (4.69 | ) |
| Total from investment operations | | | 1.08 | | | | (0.32 | ) | | | 0.84 | | | | 1.37 | | | | (4.56 | ) |
| Distributions from: | | | | | | | | | | | | | | | | | | | | |
| Net investment income | | | (0.07 | ) | | | (0.07 | ) | | | (0.15 | ) | | | (0.22 | ) | | | (0.15 | ) |
| Realized capital gains | | | — | | | | — | | | | — | | | | — | | | | (2.98 | ) |
| Total distributions | | | (0.07 | ) | | | (0.07 | ) | | | (0.15 | ) | | | (0.22 | ) | | | (3.13 | ) |
| Net asset value at end of period | | $ | 8.65 | | | $ | 7.64 | | | $ | 8.03 | | | $ | 7.34 | | | $ | 6.19 | |
| Total return(A) | | | 14.11 | % | | | (4.01 | %) | | | 11.50 | % | | | 22.17 | % | | | (31.40 | %) |
| Ratios and supplemental data: | | | | | | | | | | | | | | | | | | | | |
| Net assets at end of period (000's) | | $ | 10,925 | | | $ | 11,613 | | | $ | 14,305 | | | $ | 17,403 | | | $ | 19,557 | |
| Ratio to average net assets: | | | | | | | | | | | | | | | | | | | | |
| Net expenses(B) | | | 0.75 | % | | | 0.75 | % | | | 0.75 | % | | | 0.75 | % | | | 0.75 | % |
| Gross expenses(B) | | | 1.16 | % | | | 1.12 | % | | | 1.07 | % | | | 1.14 | % | | | 1.06 | % |
| Net investment income(B) | | | 1.46 | % | | | 0.65 | % | | | 0.68 | % | | | 1.50 | % | | | 1.54 | % |
| Portfolio turnover rate | | | 98 | % | | | 101 | % | | | 121 | % | | | 75 | % | | | 78 | % |
Touchstone Moderate ETF Fund
Selected Data for a Share Outstanding Throughout Each Period
| | | Year Ended December 31, | |
| | | 2012 | | | 2011 | | | 2010 | | | 2012 | | | 2008 | |
| Net asset value at beginning of period | | $ | 11.96 | | | $ | 11.99 | | | $ | 11.01 | | | $ | 9.67 | | | $ | 12.60 | |
| Income (loss) from investment operations: | | | | | | | | | | | | | | | | | | | | |
| Net investment income | | | 0.27 | | | | 0.21 | | | | 0.23 | | | | 0.19 | | | | 0.17 | |
| Net realized and unrealized gains (losses) on investments | | | 0.92 | | | | 0.01 | | | | 1.01 | | | | 1.50 | | | | (2.74 | ) |
| Total from investment operations | | | 1.19 | | | | 0.22 | | | | 1.24 | | | | 1.69 | | | | (2.57 | ) |
| Distributions from: | | | | | | | | | | | | | | | | | | | | |
| Net investment income | | | (0.26 | ) | | | (0.25 | ) | | | (0.26 | ) | | | (0.35 | ) | | | (0.21 | ) |
| Realized capital gains | | | — | | | | — | | | | — | | | | — | | | | (0.15 | ) |
| Total distributions | | | (0.26 | ) | | | (0.25 | ) | | | (0.26 | ) | | | (0.35 | ) | | | (0.36 | ) |
| Net asset value at end of period | | $ | 12.89 | | | $ | 11.96 | | | $ | 11.99 | | | $ | 11.01 | | | $ | 9.67 | |
| Total return | | | 9.94 | % | | | 1.84 | % | | | 11.25 | % | | | 17.44 | % | | | (20.34 | %) |
| Ratios and supplemental data: | | | | | | | | | | | | | | | | | | | | |
| Net assets at end of period (000's) | | $ | 42,228 | | | $ | 45,165 | | | $ | 53,492 | | | $ | 52,504 | | | $ | 33,476 | |
| Ratio to average net assets: | | | | | | | | | | | | | | | | | | | | |
| Net expenses(B) | | | 0.75 | % | | | 0.75 | % | | | 0.75 | % | | | 0.75 | % | | | 0.75 | % |
| Gross expenses(B) | | | 0.92 | % | | | 0.91 | % | | | 0.89 | % | | | 0.92 | % | | | 0.94 | % |
| Net investment income(B) | | | 1.74 | % | | | 1.73 | % | | | 1.79 | % | | | 2.37 | % | | | 2.85 | % |
| Portfolio turnover rate | | | 9 | % | | | 17 | % | | | 19 | % | | | 24 | % | | | 29 | % |
| (A) | Total returns do not include any insurance, sales or administrative charges of variable annuity or life insurance contracts. If these charges were included, the returns would be lower. |
| (B) | Ratio does not include income and expenses of the underlying funds. |
See accompanying Notes to Financial Statements.
Notes to Financial Statements
December 31, 2012
1. Organization
The Touchstone Variable Series Trust (the “Trust”) is registered under the Investment Company Act of 1940 (the “1940 Act”), as amended, as an open-end management investment company, and was organized as a Massachusetts business trust on February 7, 1994. The Trust consists of the following eleven funds, individually, a “Fund,” and collectively, the “Funds”:
Touchstone Baron Small Cap Growth Fund (“Baron Small Cap Growth Fund”)
Touchstone Core Bond Fund (“Core Bond Fund”)
Touchstone High Yield Fund (“High Yield Fund”)
Touchstone Large Cap Core Equity Fund (“Large Cap Core Equity Fund”)
Touchstone Mid Cap Growth Fund (“Mid Cap Growth Fund”)
Touchstone Money Market Fund (“Money Market Fund”)
Touchstone Third Avenue Value Fund (“Third Avenue Value Fund”)
Touchstone Aggressive ETF Fund (“Aggressive ETF Fund”)
Touchstone Conservative ETF Fund (“Conservative ETF Fund”)
Touchstone Enhanced ETF Fund (“Enhanced ETF Fund”)
Touchstone Moderate ETF Fund (“Moderate ETF Fund”)
Each Fund (except the Third Avenue Value Fund) is an open-end, diversified, management investment company. The Third Avenue Value Fund is an open-end, non-diversified, management investment company.
The Declaration of Trust permits the Trust to issue an unlimited number of shares of beneficial interest of each Fund. Shares of beneficial interest of each Fund are available as a funding vehicle for the separate accounts of life insurance companies issuing variable annuity and variable life insurance policies. As of December 31, 2012, outstanding shares were issued to separate accounts of Western-Southern Life Assurance Company, Integrity Life Insurance Company, National Integrity Life Insurance Company, and Columbus Life Insurance Company, which are all part of The Western & Southern Financial Group (“Western-Southern”), and the majority of the outstanding shares of the Trust were collectively owned by affiliates of Western-Southern and certain supplemental executive retirement plans sponsored by Western-Southern and its affiliates.
All Funds offer a single class of shares. The assets of each Fund are segregated, and a shareholder’s interest is limited to the Fund in which shares are held. The Funds’ prospectus provides a description of each Fund’s investment objectives, policies, and strategies along with information on the classes of shares currently being offered.
2. Significant Accounting Policies
The following is a summary of the Funds’ significant accounting policies:
Security valuation and fair value measurements— All investments in securities are recorded at their estimated fair value. The Funds define the term “market value”, as used throughout this report, as the estimated fair value. The Funds use various methods to measure fair value of their portfolio securities on a recurring basis. Generally accepted accounting principles in the United States (“U.S. GAAP”) establish a hierarchy that prioritizes inputs to valuation methods. These inputs are summarized in the three broad levels listed below:
| · | Level 1 – | quoted prices in active markets for identical securities |
| · | Level 2 – | other significant observable inputs (including quoted prices for similar securities, interest rates, prepayment speeds, credit risk, etc.) |
| · | Level 3 – | significant unobservable inputs (including the Fund’s own assumptions in determining the fair value of investments) |
Notes to Financial Statements (Continued)
The inputs or methodology used for valuing securities are not necessarily an indication of the risk associated with investing in those securities. For example, money market instruments are valued using amortized cost, in accordance with rules under the 1940 Act. Generally, amortized cost approximates the current fair value of a security, but since the value is not obtained from a quoted price in an active market, such securities are reflected as Level 2.
The aggregate value by input level, as of December 31, 2012, for each Fund’s investments, as well as a reconciliation of assets for which significant unobservable inputs (Level 3) were used in determining value, if applicable, is included in each Fund’s Portfolio of Investments, which also includes a breakdown of the Fund’s investments by credit quality and sector allocation. The Funds did not hold any Level 3 categorized securities during the year ended December 31, 2012.
All transfers in and out of the levels are recognized at the value at the end of period. During the year ended December 31, 2012, there were no transfers between Levels 1, 2 and 3 for all Funds except as shown in the Portfolio of Investments for the Third Avenue Value Fund.
The Funds’ portfolio securities are valued as of the close of the regular session of trading on the New York Stock Exchange, (“NYSE”) (currently 4:00 p.m., Eastern time). Portfolio securities traded on stock exchanges are valued at the last sale price, and to the extent these securities are actively traded, they are categorized in Level 1 of the fair value hierarchy. Portfolio securities quoted by NASDAQ are valued at the NASDAQ Official Closing Price (“NOCP”). Securities not traded on a particular day, or for which the last sale price is not readily available, are valued at their last broker-quoted bid prices as obtained from one or more of the major market makers for such securities by an independent pricing service and are categorized in Level 2. Debt securities for which market quotations are readily available are valued at their most recent bid prices as obtained from one or more of the major market makers for such securities by an independent pricing service and are categorized in Level 2. Money market instruments and other debt securities with a remaining maturity of less than 60 days are valued at amortized cost, which approximates market value, and are categorized in Level 2. While this method provides consistency in valuation (and may only be used if it approximates market value), it may result in periods during which value, as determined by amortized cost, is higher or lower than the price that would be received if the Fund sold the investment. Securities for which market quotations or the NOCP are not readily available are fair valued as determined by or under the direction of the Board of Trustees and are categorized in Level 3. Shares of open end mutual funds in which the Funds invest are valued at their respective net asset values (“NAV”) as reported by the underlying funds and are categorized in Level 1. The prices for foreign securities are reported in local currency and translated into U.S. dollars using currency exchange rates.
Level 2 Valuation — Securities mainly traded on a non-U.S. exchange are generally valued according to the preceding closing values on that exchange. However, if an event that may change the value of a security occurs after the time that the closing value on the non-U.S. exchange was determined, but before the close of regular trading on the NYSE, the security may be priced based on fair value. This may cause the value of the security on the books of the Fund to be significantly different from the closing value on the non-U.S. exchange and may affect the calculation of the NAV of the Funds. Any debt securities held by the Fund for which market quotations are not readily available are generally priced at their most recent bid prices as obtained from one or more of the major market makers for such securities.
Level 3 Valuation — Securities held by the Fund that do not have readily available market quotations, or securities for which the available market quotations are not reliable, are priced at their fair value using procedures approved by the Fund’s Board of Trustees. The Fund may use fair value pricing under the following circumstances, among others:
· If the value of a security has been materially affected by events occurring before the Fund’s pricing time but after the close of the primary markets on which the security is traded.
Notes to Financial Statements (Continued)
· If the exchange on which a portfolio security is principally traded closes early or if trading in a particular portfolio security was halted during the day and did not resume prior to the Fund’s NAV calculation.
· If a security is so thinly traded that reliable market quotations are unavailable due to infrequent trading.
· If the validity of market quotations is not reliable.
Certain Funds invest in securities of other investment companies, including exchange traded funds (“ETFs”), open-end funds and closed-end funds. Open-end funds are investment companies that issue new shares continuously and redeem shares daily. Closed-end funds are investment companies that typically issue a fixed number of shares that trade on a securities exchange or over-the-counter. An ETF is an investment company that seeks to track the performance of an index by holding in its portfolio shares of all the companies, or a representative sample of the companies, that are components of a particular index. ETFs are traded on a securities exchange based on their market value. The risks of investment in other investment companies typically reflect the risks of the types of securities in which investment companies invest. Investments in ETFs and closed-end funds are subject to the additional risk that shares of the fund may trade at a premium or discount to their NAV per share. When the Fund invests in another investment company, shareholders of the Fund bear their proportionate share of the other investment company’s fees and expenses, including operating, registration, trustee, licensing and marketing, as well as their share of the Fund’s fees and expenses.
New accounting pronouncements — In December 2011,the Financial Accounting Standards Board issued Accounting Standards Update (“ASU”) No. 2011-11,“Disclosures about Offsetting Assets and Liabilities” ASU No. 2011-11 requires disclosures to make financial statements that are prepared under U.S. GAAP more comparable to those prepared under the International Financial Reporting Standards.The new disclosure requirements mandate that entities disclose both gross and net information about instruments and transactions eligible for offset in the statement of assets and liabilities, as well as instruments and transactions subject to an agreement similar to a master netting arrangement. In addition, ASU No. 2011-11 requires disclosure of collateral received and posted in connection with master netting agreements or similar arrangements. New disclosures are required for annual reporting periods beginning on or after January 1, 2013, and interim periods within those annual periods. Management is evaluating the impact of ASU No. 2011-11 on the financial statements and disclosures.
Delayed delivery transactions— The Funds may purchase or sell securities on a when-issued or delayed delivery basis. These transactions involve a commitment by the Funds to purchase or sell securities for a predetermined price or yield, with payment and delivery taking place beyond the customary settlement period. When delayed delivery purchases are outstanding, the Funds will set aside liquid assets in an amount sufficient to meet the purchase price. When purchasing a security on a delayed delivery basis, the Funds assume the rights and risks of ownership of the security, including the risk of price and yield fluctuations, and take such fluctuations into account when determining NAV. The Funds may dispose of or renegotiate a delayed delivery transaction after it is entered into, and may sell when-issued securities before they are delivered, which may result in a capital gain or loss. When the Funds have sold a security on a delayed delivery basis, the Funds do not participate in future gains and losses with respect to the security.
Foreign currency translation— The books and records of the Funds are maintained in U.S. dollars and translated into U.S. dollars on the following basis:
| (1) | fair value of investment securities, assets and liabilities at the current rate of exchange on the valuation date; and |
| (2) | purchases and sales of investment securities, income and expenses at the relevant rates of exchange prevailing on the respective dates of such transactions. |
Notes to Financial Statements (Continued)
The Funds do not isolate that portion of gains and losses on investments in equity securities that is due to changes in the foreign exchange rates from that which is due to changes in market prices of equity securities.
Forward foreign currency contracts—A forward foreign currency contract is an agreement between two parties to buy and sell a specific currency at a price that is set on the date of the contract. The forward contract calls for delivery of the currency on a future date that is specified in the contract. Risks related to the use of forwards include the possible failure of counterparties to meet the terms of the forward agreement, the failure of the counterparties to timely post collateral, the risk that currency movements will not occur thereby reducing the Fund’s total return, and the potential for losses in excess of the Fund’s initial investment.
The market value of a forward foreign currency contract fluctuates with changes in foreign currency exchange rates. Forward foreign currency contracts are marked to market daily and the change in value is recorded by a Fund as an unrealized gain or loss. Realized gains or losses, equal to the difference between the value of the contract at the time it was opened and the value at the time it was closed, are recorded upon delivery or receipt of the currency.
As of December 31, 2012, there were no open forward foreign currency contracts.
Portfolio securities loaned— Each Fund may lend its portfolio securities. Lending portfolio securities exposes a Fund to the risk that the borrower may fail to return the loaned securities or may not be able to provide additional collateral or that the Fund may experience delays in recovery of the loaned securities or loss of rights in the collateral if the borrower fails financially. To minimize these risks, the borrower must agree to maintain cash collateral with the Funds’ custodian in an amount at least equal to the market value of the loaned securities. The loaned securities are secured by collateral valued at least equal, at all times, to the market value of the securities loaned plus accrued interest, if any. When the collateral falls below specified amounts the lending agent will use its best effort to obtain additional collateral on the next business day to meet required amounts under the security lending agreement. The cash collateral is reinvested by the Funds’ custodian into an approved investment vehicle.
As of December 31, 2012, the following Funds loaned securities and received collateral as follows:
| | | Market Value of | | | Market Value of | |
| | | Securities | | | Collateral | |
| Fund | | Loaned | | | Received | |
| Baron Small Cap Growth Fund | | $ | 1,876,602 | | | $ | 1,900,044 | |
| Core Bond Fund | | | 76,639 | | | | 80,061 | |
| High Yield Fund | | | 372,573 | | | | 388,431 | |
| Mid Cap Growth Fund | | | 118,135 | | | | 121,632 | |
| Third Avenue Value Fund | | | 616,512 | | | | 624,000 | |
| Aggressive ETF Fund | | | 396,783 | | | | 397,224 | |
| Conservative ETF Fund | | | 3,064,356 | | | | 3,123,228 | |
| Enhanced ETF Fund | | | 2,384,580 | | | | 2,387,232 | |
| Moderate ETF Fund | | | 664,351 | | | | 665,091 | |
All collateral received as cash is received, held and administered by the Funds’ custodian for the benefit of the Funds in the applicable custody account or other account established for the purpose of holding collateral.
Funds participating in securities lending receive compensation in the form of fees, or retain a portion of interest or dividends on the investment of any cash received as collateral. The Funds also continue to receive interest or dividends on the securities loaned.
Unrealized gain or loss on the market value of the securities loaned that may occur during the term of the loan is recognized by the Funds. The Funds have the right under the lending agreement to recover the securities from the borrower on demand.
Notes to Financial Statements (Continued)
Share valuation—The NAV per share is calculated daily by dividing the total value of a Fund’s assets, less liabilities, by its number of outstanding shares.
Investment income— Dividend income from securities is recognized on the ex-dividend date, net of foreign withholding taxes, if any, which are reduced by any amounts reclaimable by the Funds, where applicable. Interest income from securities is recorded on the basis of interest accrued, premium amortized and discount accreted.
Distributions to shareholders— Each Fund intends to distribute to its shareholders substantially all of its income and capital gains. Each Fund, except the Money Market Fund, declares and distributes net investment income, if any, annually as a dividend to shareholders. The Money Market Fund declares dividends daily and distributes dividends monthly. Each Fund makes distributions of capital gains, if any, at least annually, net of applicable capital loss carryforwards. Income distributions and capital gain distributions are determined in accordance with income tax regulations.
Security transactions— Security transactions are reflected for financial reporting purposes as of the trade date, which may cause the NAV as stated in the accompanying financial statements to be different than the NAV applied to Fund share transactions. Realized gains and losses on sales of portfolio securities are calculated using the identified cost basis.
Estimates— The preparation of financial statements in conformity with U.S. GAAP requires management to make estimates and assumptions that affect the reported amounts of assets and liabilities and disclosure of contingent assets and liabilities at the date of the financial statements and the reported amounts of income and expenses during the reporting period. Actual results could differ from those estimates.
3. Investment Transactions
Investment transactions (excluding short-term investments and U.S. Government securities) were as follows for the year ended December 31, 2012:
| | | Baron Small | | | | | | | |
| | | Cap Growth | | | Core Bond | | | High Yield | |
| | | Fund | | | Fund | | | Fund | |
| Purchases of investment securities | | $ | 2,727,552 | | | $ | 8,788,287 | | | $ | 14,918,959 | |
| Proceeds from sales and maturities | | $ | 6,452,161 | | | $ | 16,530,187 | | | $ | 13,971,553 | |
| | | Large Cap | | | Mid Cap | | | Third Avenue | |
| | | Core Equity | | | Growth | | | Value | |
| | | Fund | | | Fund | | | Fund | |
| Purchases of investment securities | | $ | 13,414,443 | | | $ | 16,702,837 | | | $ | 8,357,776 | |
| Proceeds from sales and maturities | | $ | 16,799,827 | | | $ | 19,129,193 | | | $ | 16,561,740 | |
| | | Aggressive | | | Conservative | | | Enhanced | | | Moderate | |
| | | ETF Fund | | | ETF Fund | | | ETF Fund | | | ETF Fund | |
| Purchases of investment securities | | $ | 1,645,366 | | | $ | 5,186,205 | | | $ | 10,947,010 | | | $ | 3,907,758 | |
| Proceeds from sales and maturities | | $ | 7,271,278 | | | $ | 5,982,043 | | | $ | 13,017,074 | | | $ | 10,297,710 | |
At the year end December 31, 2012, purchase of investment securities and proceeds from sales and maturities in U.S. Government Securities were $204,710,661 and $199,724,338, respectively for Core Bond Fund.
Notes to Financial Statements (Continued)
4. Transactions with Affiliates and Other Related Parties
Certain officers of the Trust are also officers of Touchstone Advisors, Inc. (the “Advisor”), Touchstone Securities, Inc. (the “Underwriter”) and/or BNY Mellon Investment Servicing (U.S.) Inc. (“BNY Mellon”), the Sub-Administrator and Transfer Agent to the Funds. The Advisor and Underwriter are each wholly owned, indirect subsidiaries of The Western and Southern Life Insurance Company (“Western-Southern”).
MANAGEMENT & EXPENSE LIMITATIONS AGREEMENTS
The Advisor provides general investment supervisory services for the Funds, under terms of an advisory agreement (“Advisory Agreement.”) Under the Advisory Agreement, the Funds pay the Advisor a fee, which is computed and accrued daily and paid monthly, at an annual rate based on average daily net assets as shown in the table below.
| Baron Small Cap Growth Fund | 1.05% |
| Core Bond Fund | 0.55% on the first $100 million |
| | 0.50% of the next $100 million |
| | 0.45% of the next $100 million |
| | 0.40% of such assets in excess of $300 million |
| High Yield Fund | 0.50% on the first $100 million |
| | 0.45% of the next $100 million |
| | 0.40% of the next $100 million |
| | 0.35% of such assets in excess of $300 million |
| Large Cap Core Equity Fund | 0.65% on the first $100 million |
| | 0.60% of the next $100 million |
| | 0.55% of the next $100 million |
| | 0.50% of such assets in excess of $300 million |
| Mid Cap Growth Fund | 0.75% on the first $500 million |
| | 0.70% of the next $500 million |
| | 0.65% of such assets in excess of $1 billion |
| Money Market Fund | 0.18% |
| Third Avenue Value Fund | 0.80% on the first $100 million |
| | 0.75% of the next $100 million |
| | 0.70% of the next $100 million |
| | 0.65% of such assets in excess of $300 million |
| Aggressive ETF Fund | 0.40% on the first $50 million |
| Conservative ETF Fund | 0.38% of the next $50 million |
| Enhanced ETF Fund | 0.36% of such assets in excess of $100 million |
| Moderate ETF Fund | |
The Advisor has entered into investment sub-advisory agreements with the following parties:
| BAMCO, Inc | Todd-Verdus Asset Management, LLC |
| Baron Small Cap Growth Fund | Large Cap Core Equity Fund |
| | Aggressive ETF Fund |
| Fort Washington Investment Advisors, Inc.* | Conservative ETF Fund |
| Core Bond Fund | Enhanced ETF Fund |
| High Yield Fund | Moderate ETF Fund |
| Money Market Fund | |
| | |
| Third Avenue Management, LLC | Westfield Capital Management Company, L.P. |
| Third Avenue Value Fund | Mid Cap Growth Fund |
* Affiliate of the Advisor and Western-Southern
Notes to Financial Statements (Continued)
The Advisor, not the Funds, pays sub-advisory fees to each Sub-Advisor.
The Advisor entered into an expense limitation agreement (“Expense Limitation Agreement”) to contractually limit operating expenses of the Funds, excluding dividend expenses on short sales, interest, taxes, brokerage commissions, other expenditures which are capitalized in accordance with generally accepted accounting principles, the cost of “Acquired Fund Fees and Expenses”, if any, and other extraordinary expenses not incurred in the ordinary course of business. The maximum operating expense limit in any year with respect to the Funds is based on a percentage of the average daily net assets of the Funds. The Advisor has agreed to separately waive class level expenses, administration fees and reimburse expenses in order to maintain expense limitations for the Funds as follows:
Fund
| Baron Small Cap Growth Fund | | | 1.55 | % |
| Core Bond Fund | | | 1.00 | % |
| High Yield Fund | | | 1.05 | % |
| Large Cap Core Equity Fund | | | 1.00 | % |
| Mid Cap Growth Fund | | | 1.26 | % |
| Money Market Fund | | | 0.75 | % |
| Third Avenue Value Fund | | | 1.17 | % |
| Aggressive ETF Fund | | | 0.75 | % |
| Conservative ETF Fund | | | 0.75 | % |
| Enhanced ETF Fund | | | 0.75 | % |
| Moderate ETF Fund | | | 0.75 | % |
These expense limitations will remain in effect until at least April 28, 2013 for all Funds.
During the year ended December 31, 2012, the Advisor waived investment advisory fees and administration fees and/or reimbursed expenses of the Funds as follows:
| | | Investment | | | | |
| | | Adviser | | | Administration | |
| Fund | | Fees Waived | | | Fees Waived | |
| Baron Small Cap Growth Fund | | $ | — | | | $ | 26,164 | |
| Core Bond Fund | | | — | | | | 1,794 | |
| High Yield Fund | | | — | | | | 15,635 | |
| Large Cap Core Equity Fund | | | — | | | | 56,542 | |
| Mid Cap Growth Fund | | | — | | | | 10,905 | |
| Money Market Fund | | | 69,230 | | | | 84,512 | |
| Third Avenue Value Fund | | | 7,281 | | | | 65,090 | |
| Aggressive ETF Fund | | | 18,600 | | | | 30,951 | |
| Conservative ETF Fund | | | 13,351 | | | | 47,229 | |
| Enhanced ETF Fund | | | 24,212 | | | | 22,694 | |
| Moderate ETF Fund | | | — | | | | 74,437 | |
Effective April 29, 2012, under terms of the Expense Limitation Agreement, the Advisor is entitled to recover, subject to approval by the Funds’ Board of Trustees, such amounts waived or reimbursed for a period of up to three years from the year in which the Advisor reduced its compensation and/or assumed expenses for the Funds. No recoupment will occur unless the Fund’s operating expenses are below the expense limitation amount. The Advisor did not recoup any amounts it previously waived or reimbursed during the year ended December 31, 2012.
Notes to Financial Statements (Continued)
At December 31, 2012, the Advisor may seek recoupment of previously waived and reimbursed fees as follows:
| | | Expiration | |
| | | December | |
| Fund | | 31, 2015 | |
| Baron Small Cap Growth Fund | | $ | 19,452 | |
| Core Bond Fund | | | 1,794 | |
| High Yield Fund | | | 13,922 | |
| Large Cap Core Equity Fund | | | 38,996 | |
| Mid Cap Growth Fund | | | 9,780 | |
| Money Market Fund | | | 107,197 | |
| Third Avenue Value Fund | | | 50,398 | |
| Aggressive ETF Fund | | | 35,309 | |
| Conservative ETF Fund | | | 41,861 | |
| Enhanced ETF Fund | | | 31,994 | |
| Moderate ETF Fund | | | 49,581 | |
ADMINISTRATION AGREEMENT
The Advisor entered into an Administration and Accounting Services Agreement with the Trust, whereby the Advisor is responsible for supplying executive and regulatory compliance services, supervising the preparation of tax returns, and coordinating the preparation of reports to shareholders and reports to, and filings with, the Securities and Exchange Commission and state securities authorities, materials for meetings of the Board of Trustees, calculating the daily NAV per share and maintaining the financial books and records of each Fund. For its services, the Advisor receives an annual fee of 0.20% of the Trust’s aggregate net assets up to $1 billion, 0.16% of the next $1 billion of aggregate net assets and 0.12% on assets in excess of $2 billion.
The Advisor has engaged BNY Mellon as the Sub-Administrator to the Trust. BNY Mellon provides administrative and accounting services to the Trust and is compensated directly by the Advisor, not the Trust.
TRANSFER AGENT AGREEMENT
Under the terms of the Transfer Agent Agreement between the Trust and BNY Mellon, BNY Mellon maintains the records of each shareholder’s account, answers shareholders’ inquiries concerning their accounts, processes purchases and redemptions of each Fund’s shares, acts as dividend and distribution disbursing agent and performs other shareholder service functions. For these services, BNY Mellon receives a monthly fee per shareholder account from each Fund. In addition, each Fund pays out-of-pocket expenses incurred by BNY Mellon, including, but not limited to, postage and supplies.
PLANS OF DISTRIBUTION
The Trust has adopted a Shareholder Services Plan under which shares of each Fund may directly or indirectly bear expenses for shareholder services provided. The Fund will incur and/or reimburse expenses for shareholder services at an annual rate not to exceed 0.25% of the average daily net assets.
UNDERWRITING AGREEMENT
The Underwriter acts as exclusive agent for the distribution of the Funds’ shares. The Underwriter receives no compensation under this agreement.
Notes to Financial Statements (Continued)
AFFILIATED INVESTMENTS
Each Fund, except the Money Market Fund, may invest in the Touchstone Institutional Money Market Fund, a series of Touchstone Investment Trust, subject to compliance with several conditions set forth in an order received by the Trust from the Securities and Exchange Commission. To the extent that the other Touchstone Funds are invested in the Touchstone Institutional Money Market Fund, the Advisor and Administrator will be paid additional fees from the Touchstone Institutional Money Market Fund that will not be waived or reimbursed.
A summary of each Fund’s investment, as applicable, in the Touchstone Institutional Money Market Fund for the year ended December 31, 2012, is as follows:
| | | Share Activity | | | | | | | |
| | | Balance | | | | | | | | | Balance | | | | | | Value | |
| | | 12/31/11 | | | Purchases | | | Sales | | | 12/31/12 | | | Dividends | | | 12/31/12 | |
| Baron Small Cap Growth Fund | | | 995,365 | | | | 5,508,141 | | | | (6,503,506 | ) | | | — | | | $ | 633 | | | $ | — | |
| Core Bond Fund | | | 1,017,462 | | | | 57,110,373 | | | | (56,871,012 | ) | | | 1,256,823 | | | | 2,324 | | | | 1,256,823 | |
| High Yield Fund | | | 263,209 | | | | 14,698,728 | | | | (14,605,379 | ) | | | 356,558 | | | | 652 | | | | 356,558 | |
| Large Cap Core Equity Fund | | | 460,371 | | | | 12,312,791 | | | | (11,898,686 | ) | | | 874,476 | | | | 931 | | | | 874,476 | |
| Mid Cap Growth Fund | | | — | | | | 13,568,809 | | | | (13,245,945 | ) | | | 322,864 | | | | 723 | | | | 322,864 | |
| Third Avenue Value Fund | | | 1,377,156 | | | | 13,521,163 | | | | (11,735,002 | ) | | | 3,163,317 | | | | 3,810 | | | | 3,163,317 | |
| Aggressive ETF Fund | | | 355,850 | | | | 3,200,625 | | | | (3,359,292 | ) | | | 197,183 | | | | 275 | | | | 197,183 | |
| Conservative ETF Fund | | | 371,364 | | | | 8,309,129 | | | | (8,334,572 | ) | | | 345,921 | | | | 508 | | | | 345,921 | |
| Enhanced ETF Fund | | | 190,683 | | | | 1,654,141 | | | | (1,652,642 | ) | | | 192,182 | | | | 208 | | | | 192,182 | |
| Moderate ETF Fund | | | 726,842 | | | | 7,160,196 | | | | (7,206,096 | ) | | | 680,942 | | | | 843 | | | | 680,942 | |
5. Federal Tax Information
Federal income tax— It is each Fund’s policy to continue to comply with the special provisions of the Internal Revenue Code applicable to regulated investment companies. As provided therein, in any fiscal year in which a Fund so qualifies and distributes at least 90% of its investment company taxable income, the Fund (but not the shareholders) will be relieved of federal income tax on the income distributed. Accordingly, no provision for income taxes has been made.
The tax character of distributions paid for the years ended December 31, 2012 and December 31, 2011 was as follows:
| | | Baron Small Cap | | | | | | | | | Large Cap | |
| | | Growth Fund | | | Core Bond Fund | | | High Yield Fund | | | Core Equity Fund | |
| | | 2012 | | | 2011 | | | 2012 | | | 2011 | | | 2012 | | | 2011 | | | 2012 | | | 2011 | |
| From ordinary income | | $ | — | | | $ | — | | | $ | 2,816,097 | | | $ | 2,148,434 | | | $ | 2,081,108 | | | $ | 2,427,279 | | | $ | 524,998 | | | $ | 570,931 | |
| From long-term capital gains | | | 3,241,819 | | | | — | | | | 315,247 | | | | 458,686 | | | | — | | | | — | | | | — | | | | — | |
| | | $ | 3,241,819 | | | $ | — | | | $ | 3,131,344 | | | $ | 2,607,120 | | | $ | 2,081,108 | | | $ | 2,427,279 | | | $ | 524,998 | | | $ | 570,931 | |
| | | Mid Cap Growth Fund | | | Money Markey Fund | | | Third Avenue
Value Fund | |
| | | 2012 | | | 2011 | | | 2012 | | | 2011 | | | 2012 | | | 2011 | |
| From ordinary income | | $ | — | | | $ | 72,756 | | | $ | 4,204 | | | $ | 7,132 | | | $ | — | | | $ | 840,849 | |
| From long-term capital gains | | | — | | | | — | | | | — | | | | — | | | | — | | | | — | |
| | | $ | — | | | $ | 72,756 | | | $ | 4,204 | | | $ | 7,132 | | | $ | — | | | $ | 840,849 | |
Notes to Financial Statements (Continued)
| | | Aggressive | | | Conservative | | | Enhanced | | | Moderate | |
| | | ETF Fund | | | ETF Fund | | | ETF Fund | | | ETF Fund | |
| | | 2012 | | | 2011 | | | 2012 | | | 2011 | | | 2012 | | | 2011 | | | 2012 | | | 2011 | |
| From ordinary income | | $ | 254,657 | | | $ | 254,769 | | | $ | 400,125 | | | $ | 441,810 | | | $ | 84,834 | | | $ | 103,610 | | | $ | 830,074 | | | $ | 928,782 | |
| From long-term capital gains | | | — | | | | — | | | | 383,118 | | | | — | | | | — | | | | — | | | | — | | | | — | |
| | | $ | 254,657 | | | $ | 254,769 | | | $ | 783,243 | | | $ | 441,810 | | | $ | 84,834 | | | $ | 103,610 | | | $ | 830,074 | | | $ | 928,782 | |
The following information is computed on a tax basis for each item as of December 31, 2012:
| | | Baron Small | | | | | | | | | Large Cap | |
| | | Cap Growth | | | Core Bond | | | High Yield | | | Core Equity | |
| | | Fund | | | Fund | | | Fund | | | Fund | |
| Tax cost of portfolio investments | | $ | 11,274,435 | | | $ | 54,269,218 | | | $ | 28,434,755 | | | $ | 28,455,523 | |
| Gross unrealized appreciation | | | 8,702,682 | | | | 1,859,891 | | | | 1,549,042 | | | | 5,851,736 | |
| Gross unrealized depreciation | | | (173,820 | ) | | | (482,022 | ) | | | (178,819 | ) | | | (1,368,619 | ) |
| Net unrealized appreciation (depreciation) | | | 8,528,862 | | | | 1,377,869 | | | | 1,370,223 | | | | 4,483,117 | |
| Accumulated capital losses | | | — | | | | — | | | | (1,414,007 | ) | | | (12,285,709 | ) |
| Post-October and Qualified Late-Year losses | | | — | | | | — | | | | — | | | | — | |
| Undistributed ordinary income | | | 318,591 | | | | 1,760,035 | | | | 1,952,788 | | | | 497,085 | |
| Undistributed capital gains | | | 2,533,212 | | | | — | | | | — | | | | — | |
| Accumulated earnings (deficit) | | $ | 11,380,665 | | | $ | 3,137,904 | | | $ | 1,909,004 | | | $ | (7,305,507 | ) |
| | | Mid Cap | | | Money Market | | | Third Avenue | |
| | | Growth Fund | | | Fund | | | Value Fund | |
| Tax cost of portfolio investments | | $ | 20,832,091 | | | $ | 38,829,843 | | | $ | 28,287,959 | |
| Gross unrealized appreciation | | | 2,491,196 | | | | — | | | | 8,400,108 | |
| Gross unrealized depreciation | | | (988,371 | ) | | | — | | | | (4,343,522 | ) |
| Net unrealized appreciation (depreciation) | | | 1,502,825 | | | | — | | | | 4,056,586 | |
| Net unrealized appreciation (depreciation) on foreign currency and translation of other assets and liabilities denominated in foreign currency | | | — | | | | — | | | | 38 | |
| Accumulated capital losses | | | — | | | | (890 | ) | | | (3,509,680 | ) |
| Post-October and Qualified Late-Year losses | | | — | | | | — | | | | — | |
| Undistributed ordinary income | | | — | | | | — | | | | 1,281,254 | |
| Undistributed capital gains | | | 462,543 | | | | | | | | | |
| Accumulated deficit | | $ | 1,965,368 | | | $ | (890 | ) | | $ | 1,828,198 | |
Notes to Financial Statements (Continued)
| | | Aggressive | | | Conservative | | | Enhanced | | | Moderate | |
| | | ETF Fund | | | ETF Fund | | | ETF Fund | | | ETF Fund | |
| Tax cost of portfolio investments | | $ | 13,388,216 | | | $ | 25,620,241 | | | $ | 12,991,476 | | | $ | 39,922,541 | |
| Gross unrealized appreciation | | | 1,306,703 | | | | 1,682,891 | | | | 361,301 | | | | 5,730,403 | |
| Gross unrealized depreciation | | | (290,946 | ) | | | (594,699 | ) | | | (22,309 | ) | | | (2,627,520 | ) |
| Net unrealized appreciation (depreciation) | | | 1,015,757 | | | | 1,088,192 | | | | 338,992 | | | | 3,102,883 | |
| Net unrealized appreciation (depreciation) on foreign currency and translation of other assets and liabilities denominated in foreign currency | | | — | | | | — | | | | — | | | | — | |
| Accumulated capital and other losses | | | — | | | | — | | | | (7,996,678 | ) | | | (2,296,069 | ) |
| Post-October and Qualified Late-Year losses | | | — | | | | — | | | | — | | | | — | |
| Undistributed ordinary income | | | 239,018 | | | | 367,430 | | | | 163,363 | | | | 759,947 | |
| Undistributed long-term capital gains | | | 73,536 | | | | 760,221 | | | | — | | | | — | |
| Accumulated earnings (deficit) | | $ | 1,328,311 | | | $ | 2,215,843 | | | $ | (7,494,323 | ) | | $ | 1,566,761 | |
The difference between the tax cost of portfolio investments and the financial statement cost is primarily due to wash sales loss deferrals, investments in passive foreign investment companies and preferred securities.
As of December 31, 2012, the Funds had the following capital loss carryforwards for federal income tax purposes:
| | | | | | | | | | | | No | | | No | | | | |
| | | | | | | | | | | | Expiration | | | Expiration | | | | |
| | | 2016 | | | 2017 | | | 2018 | | | Short Term* | | | Long Term* | | | Total | |
| High Yield Fund | | $ | — | | | $ | 1,414,007 | | | $ | — | | | $ | — | | | $ | — | | | $ | 1,414,007 | |
| Large Cap Core Equity Fund | | | 1,863,206 | | | | 7,960,612 | | | | 2,461,891 | | | | — | | | | — | | | | 12,285,709 | |
| Money Market Fund | | | — | | | | — | | | | — | | | | 890 | | | | — | | | | 890 | |
| Third Avenue Value Fund | | | — | | | | 3,509,680 | | | | — | | | | — | | | | — | | | | 3,509,680 | |
| Enhanced ETF Fund | | | 1,004,479 | | | | 6,992,199 | | | | — | | | | — | | | | — | | | | 7,996,678 | |
| Moderate ETF Fund | | | — | | | | 1,083,646 | | | | 1,212,423 | | | | — | | | | — | | | | 2,296,069 | |
* The Regulated Investment Company Modernization Act of 2010 (the “Act”) was enacted on December 22, 2010. The Act makes changes to several tax rules impacting the Funds. In general, the provisions of the Act is in effect for the Funds’ fiscal year ending December 31, 2012. Although the Act provides several benefits, including the unlimited carryover of future capital losses, there may be a greater likelihood that all or a portion of each Fund’s pre-enactment capital loss carryovers may expire without being utilized due to the fact that post-enactment capital losses must be utilized before pre-enactment capital loss carryovers may be utilized. Under the Act, new capital losses may now be carried forward indefinitely, and retain the character of the original loss as compared with pre-enactment law, where capital losses could be carried forward for up to eight years, and carried forward as short-term capital losses, irrespective of the character of the original loss.
The capital loss carryforwards may be utilized in future years to offset net realized capital gains, if any, prior to distributing such gains.
During the year ended December 31, 2012, the following Funds utilized capital loss carryforwards:
| Fund | | Amount | |
| High Yield Fund | | $ | 336,871 | |
| Large Cap Core Equity Fund | | | 2,147,145 | |
| Mid Cap Growth Fund | | | 1,566,391 | |
| Third Avenue Value Fund | | | 3,807,137 | |
| Aggressive ETF Fund | | | 279,537 | |
| Enhanced ETF Fund | | | 854,585 | |
| Moderate ETF Fund | | | 752,708 | |
The Funds have analyzed their tax positions taken on Federal income tax returns for all open tax years (tax years ended December 31, 2009 through 2012) and have concluded that no provision for income tax is required in their financial statements.
Notes to Financial Statements (Continued)
Certain reclassifications, the result of permanent differences between financial statement and income tax reporting requirements, have been made to the components of capital. These reclassifications have no impact on the net assets or NAV per share of the Funds and are designed to present the Funds’ capital accounts on a tax basis. The following reclassifications which are primarily attributed to the tax treatment of partnership book reclassification, net investment loss, overdistributions, redesignation of dividends paid, foreign currency gain/loss, paydown gain/loss on mortgage backed and asset backed securities and Passive Foreign Investment Companies have been made to the following Funds for the year ended December 31, 2012:
| | | | | | Accumulated | | | Accumulated | |
| | | Paid-In | | | Net Investment | | | Net Realized | |
| Fund | | Capital | | | Income (Loss) | | | Gains (Losses) | |
| Baron Small Cap Growth Fund | | $ | — | | | $ | (7,128 | ) | | $ | 7,128 | |
| Core Bond Fund | | | — | | | | 187,659 | | | | (187,659 | ) |
| High Yield | | | 1 | | | | 579 | | | | (580 | ) |
| Mid Cap Growth Fund | | | (20,051 | ) | | | 20,951 | | | | (900 | ) |
| Money Market Fund | | | (48 | ) | | | 48 | | | | — | |
| Third Avenue Value Fund | | | (1,387 | ) | | | 721,850 | | | | (720,463 | ) |
| Aggressive ETF Fund | | | — | | | | (986 | ) | | | 986 | |
| Conservative ETF Fund | | | — | | | | (4,184 | ) | | | 4,184 | |
| Enhanced ETF Fund | | | — | | | | (840 | ) | | | 840 | |
| Moderate ETF Fund | | | — | | | | (6,013 | ) | | | 6,013 | |
6. Commitments and Contingencies
The Funds indemnify the Trust’s officers and Trustees for certain liabilities that might arise from their performance of their duties to the Funds. Additionally, in the normal course of business, the Funds enter into contracts that contain a variety of representations and warranties and which provide general indemnifications. The Funds’ maximum exposure under these arrangements is unknown, as this would involve future claims that may be made against the Funds that have not yet occurred. However, based on experience, the Funds expect the risk of loss to be remote.
7. Risks Associated with Foreign Investments
Some of the Funds may invest in the securities of foreign issuers. Investing in securities issued by companies whose principal business activities are outside the U.S. may involve significant risks not present in domestic investments. For example, there is generally less publicly available information about foreign companies, particularly those not subject to the disclosure and reporting requirements of the U.S. securities laws. Foreign issuers are generally not bound by uniform accounting, auditing, and financial reporting requirements and standards of practice comparable to those applicable to domestic issuers. Investments in foreign securities also involve the risk of possible adverse changes in investment or exchange control regulations, expropriation or confiscatory taxation, limitations on the removal of funds or other assets of the Fund, political or financial instability or diplomatic and other developments which could affect such investments. Foreign stock markets, while growing in volume and sophistication, are generally not as developed as those in the U.S., and securities of some foreign issuers (particularly those located in developing countries) may be less liquid and more volatile than securities of comparable U.S. companies. In general, there is less overall governmental supervision and regulation of foreign securities markets, broker-dealers, and issuers than in the U.S.
8. Subsequent Events
Subsequent events occurring after the date of this report have been evaluated for potential impact to this report through the date the financial statements were issued. There were no subsequent events to report that would have a material impact on the Funds’ financial statements.
Report of Independent Registered Public Accounting Firm
To the Board of Trustees and Shareholders of Touchstone Variable Series Trust
We have audited the accompanying statements of assets and liabilities, including the portfolios of investments, of Touchstone Variable Series Trust, comprised of the Baron Small Cap Growth Fund, Core Bond Fund, Mid Cap Growth Fund, High Yield Fund, Large Cap Core Equity Fund, Money Market Fund, Third Avenue Value Fund, Aggressive ETF Fund, Conservative ETF Fund, Enhanced ETF Fund, and Moderate ETF Fund (collectively, the “Funds”), as of December 31, 2012, and the related statements of operations for the year then ended, the statements of changes in net assets for each of the two years in the period then ended, and the financial highlights for each of the five years in the period then ended. These financial statements and financial highlights are the responsibility of the Funds’ management. Our responsibility is to express an opinion on these financial statements and financial highlights based on our audits.
We conducted our audits in accordance with the standards of the Public Company Accounting Oversight Board (United States). Those standards require that we plan and perform the audits to obtain reasonable assurance about whether the financial statements are free of material misstatement. We were not engaged to perform an audit of the Funds’ internal control over financial reporting. Our audits included consideration of internal control over financial reporting as a basis for designing audit procedures that are appropriate in the circumstances, but not for the purpose of expressing an opinion on the effectiveness of the Funds’ internal control over financial reporting. Accordingly, we express no such opinion. An audit also includes examining, on a test basis, evidence supporting the amounts and disclosures in the financial statements, assessing the accounting principles used and significant estimates made by management, and evaluating the overall financial statement presentation. Our procedures included confirmation of securities owned as of December 31, 2012, by correspondence with the custodian, transfer agent, and brokers or by other appropriate auditing procedures where replies from brokers were not received. We believe that our audits provide a reasonable basis for our opinion.
In our opinion, the financial statements and financial highlights referred to above present fairly, in all material respects, the financial position of each of the respective portfolios comprising Touchstone Variable Series Trust at December 31, 2012, the results of their operations for the year then ended, the changes in their net assets for each of the two years in the period then ended, and the financial highlights for each of the five years in the period then ended, in conformity with U.S. generally accepted accounting principles.

Cincinnati, Ohio
February 25, 2013
Other Items (Unaudited)
Dividend Received Deduction
For corporate shareholders, the following ordinary distributions paid during the current fiscal year ended December 31, 2012 qualify for the corporate dividends received deduction. The Funds intend to pass through the maximum allowable percentage for 1099s.
| Large Cap Core Equity Fund | | | 100.00 | % |
| Aggressive ETF Fund | | | 55.78 | % |
| Conservative ETF Fund | | | 22.88 | % |
| Enhance ETF Fund | | | 98.11 | % |
| Moderate ETF Fund | | | 38.46 | % |
For the fiscal year ended December 31, 2012, Baron Small Cap Growth Fund, Core Bond Fund, Mid Cap Growth Fund, Aggressive ETF Fund, and Conservative ETF Fund, designates $3,241,819, $315,247, $462,543, $73,536 and $760,342, respectively, as long-term capital gains.
Proxy Voting Guidelines
The Sub-Advisors are responsible for exercising the voting rights associated with the securities purchased and held by the Funds. A description of the policies and procedures that the Sub-Advisors use in fulfilling this responsibility and information regarding how those proxies were voted during the twelve-month period ended June 30 are available as an exhibit to the most recent Statement of Additional Information, which can be obtained without charge by calling toll free 1.800.543.0407. These items are also available on the Securities and Exchange Commission’s (the Commission) website at http://www.sec.gov.
Quarterly Portfolio Disclosure
The Trust files a complete listing of portfolio holdings for each Fund as of the end of the first and third quarters of each fiscal year on Form N-Q. The complete listing (i) is available on the Commission’s website; (ii) may be reviewed and copied at the Commission’s Public Reference Room in Washington, DC; and (iii) will be made available to shareholders upon request by calling 1.800.543.0407. Information on the operation of the Public Reference Room may be obtained by calling 1.800.SEC.0330.
Schedule of Shareholder Expenses
As a shareholder of the Funds, you incur two types of costs: (1) transaction costs, including reinvested dividends or other distributions; and (2) ongoing costs, including investment advisory fees; shareholder servicing fees; and other Fund expenses. This example is intended to help you understand your ongoing costs (in dollars) of investing in the Funds and to compare these costs with the ongoing costs of investing in other mutual funds.
The example is based on an investment of $1,000 invested at the beginning of the period and held for the entire period (July 1, 2012 through December 31, 2012).
Actual Expenses
The first line for each Fund in the table below provides information about actual account values and actual expenses. You may use the information in this line, together with the amount you invested, to estimate the expenses that you paid over the period. Simply divide your account value by $1,000 (for example, an $8,600 account value divided by $1,000 = 8.6), then multiply the result by the number in the first line under the heading entitled “Expenses Paid During the six months ended December 31, 2012” to estimate the expenses you paid on your account during this period.
Hypothetical Example for Comparison Purposes
The second line for each Fund in the table below provides information about hypothetical account values and hypothetical expenses based on the Funds’ actual expense ratio and an assumed rate of return of 5% per year
Other Items (Unaudited) (Continued)
before expenses, which is not the Funds’ actual return. The hypothetical account values and expenses may not be used to estimate the actual ending account balance or expenses you paid for the period. You may use this information to compare the ongoing costs of investing in the Funds and other funds. To do so, compare this 5% hypothetical example with the 5% hypothetical examples that appear in the shareholder reports of the other funds.
| | | | | | | | | | | | Expenses | |
| | | Net Expense | | | Beginning | | | Ending | | | Paid During | |
| | | Ratio | | | Account | | | Account | | | the Six Months | |
| | | Annualized | | | Value | | | Value | | | Ended | |
| | | December 31, | | | July 1, | | | December 31, | | | December 31, | |
| | | 2012 | | | 2012 | | | 2012 | | | 2012* | |
| Touchstone Baron Small Cap Growth Fund | | | | | | | | | | | | | | | | |
| Actual | | | 1.55 | % | | $ | 1,000.00 | | | $ | 1,115.40 | | | $ | 8.24 | |
| Hypothetical | | | 1.55 | % | | $ | 1,000.00 | | | $ | 1,017.34 | | | $ | 7.86 | |
| | | | | | | | | | | | | | | | | |
| Touchstone Core Bond Fund | | | | | | | | | | | | | | | | |
| Actual | | | 1.00 | % | | $ | 1,000.00 | | | $ | 1,022.40 | | | $ | 5.08 | |
| Hypothetical | | | 1.00 | % | | $ | 1,000.00 | | | $ | 1,020.11 | | | $ | 5.08 | |
| | | | | | | | | | | | | | | | | |
| Touchstone High Yield Fund | | | | | | | | | | | | | | | | |
| Actual | | | 1.05 | % | | $ | 1,000.00 | | | $ | 1,075.00 | | | $ | 5.48 | |
| Hypothetical | | | 1.05 | % | | $ | 1,000.00 | | | $ | 1,019.86 | | | $ | 5.33 | |
| | | | | | | | | | | | | | | | | |
| Touchstone Large Cap Core Equity Fund | | | | | | | | | | | | | | | | |
| Actual | | | 1.00 | % | | $ | 1,000.00 | | | $ | 1,052.80 | | | $ | 5.16 | |
| Hypothetical | | | 1.00 | % | | $ | 1,000.00 | | | $ | 1,020.11 | | | $ | 5.08 | |
| | | | | | | | | | | | | | | | | |
| Touchstone Mid Cap Growth Fund | | | | | | | | | | | | | | | | |
| Actual | | | 1.26 | % | | $ | 1,000.00 | | | $ | 1,074.10 | | | $ | 6.57 | |
| Hypothetical | | | 1.26 | % | | $ | 1,000.00 | | | $ | 1,018.80 | | | $ | 6.39 | |
| | | | | | | | | | | | | | | | | |
| Touchstone Money Market Fund | | | | | | | | | | | | | | | | |
| Actual | | | 0.37 | % | | $ | 1,000.00 | | | $ | 1,000.10 | | | $ | 1.86 | |
| Hypothetical | | | 0.37 | % | | $ | 1,000.00 | | | $ | 1,023.28 | | | $ | 1.88 | |
| | | | | | | | | | | | | | | | | �� |
| Touchstone Third Avenue Value Fund | | | | | | | | | | | | | | | | |
| Actual | | | 1.17 | % | | $ | 1,000.00 | | | $ | 1,126.10 | | | $ | 6.25 | |
| Hypothetical | | | 1.17 | % | | $ | 1,000.00 | | | $ | 1,019.25 | | | $ | 5.94 | |
| | | | | | | | | | | | | | | | | |
| Touchstone Aggressive ETF Fund | | | | | | | | | | | | | | | | |
| Actual | | | 0.75 | % | | $ | 1,000.00 | | | $ | 1,060.60 | | | $ | 3.88 | |
| Hypothetical | | | 0.75 | % | | $ | 1,000.00 | | | $ | 1,021.37 | | | $ | 3.81 | |
| | | | | | | | | | | | | | | | | |
| Touchstone Conservative ETF Fund | | | | | | | | | | | | | | | | |
| Actual | | | 0.75 | % | | $ | 1,000.00 | | | $ | 1,030.60 | | | $ | 3.83 | |
| Hypothetical | | | 0.75 | % | | $ | 1,000.00 | | | $ | 1,021.37 | | | $ | 3.81 | |
| | | | | | | | | | | | | | | | | |
| Touchstone Enhanced ETF Fund | | | | | | | | | | | | | | | | |
| Actual | | | 0.75 | % | | $ | 1,000.00 | | | $ | 1,076.30 | | | $ | 3.91 | |
| Hypothetical | | | 0.75 | % | | $ | 1,000.00 | | | $ | 1,021.37 | | | $ | 3.81 | |
| | | | | | | | | | | | | | | | | |
| Touchstone Moderate ETF Fund | | | | | | | | | | | | | | | | |
| Actual | | | 0.75 | % | | $ | 1,000.00 | | | $ | 1,047.70 | | | $ | 3.86 | |
| Hypothetical | | | 0.75 | % | | $ | 1,000.00 | | | $ | 1,021.37 | | | $ | 3.81 | |
| * | Expenses are equal to the Fund's annualized expense ratio, multiplied by the average account value over the period, multiplied by [184/366] (to reflect one-half year period). |
Other Items (Unaudited) (Continued)
Advisory Agreement Approval Disclosure
At a meeting held on November 15, 2012, the Board of Trustees (the “Board” or “Trustees”) of the Touchstone Variable Series Trust (the “Trust”), and by a separate vote, the Independent Trustees of the Trust, approved the continuance of the Investment Advisory Agreement between the Trust and the Advisor with respect to each Fund of the Trust, and the continuance of each Sub-Advisory Agreement between the Advisor and each Fund’s respective Sub-Advisor.
In determining whether to approve the continuation of the Investment Advisory Agreement and the Sub-Advisory Agreements, the Advisor furnished information necessary for a majority of the Independent Trustees to make the determination that the continuance of the Investment Advisory Agreement and each Sub-Advisory Agreement was in the best interests of the respective Funds and their shareholders. The information provided to the Board included: (1) industry data comparing advisory fees and expense ratios of comparable investment companies; (2) comparative performance information; (3) the Advisor’s and its affiliates’ revenues and costs of providing services to the Funds; and (4) information about the Advisor’s and Sub-Advisors’ personnel. Prior to voting, the Independent Trustees reviewed the proposed continuance of the Investment Advisory Agreement and the Sub-Advisory Agreements with management and experienced independent legal counsel and received materials from such counsel discussing the legal standards for their consideration of the proposed continuation of the Investment Advisory Agreement and each Sub-Advisory Agreement. The Independent Trustees also reviewed the proposed continuation of the Investment Advisory Agreement and each Sub-Advisory Agreement with independent legal counsel in private sessions at which no representatives of management were present.
In approving the Funds’ Investment Advisory Agreement, the Board considered various factors, among them: (1) the nature, extent and quality of services provided to the Funds, including the personnel providing services; (2) the Advisor’s compensation and profitability; (3) a comparison of fees and performance with other advisers; (4) economies of scale; and (5) the terms of the Investment Advisory Agreement. The Board’s analysis of these factors is set forth below. The Independent Trustees were advised by independent legal counsel throughout the process.
Nature, Extent and Quality of Advisor Services. The Board considered the level and depth of knowledge of the Advisor, including the professional experience and qualifications of senior personnel. In evaluating the quality of services provided by the Advisor, the Board took into account its familiarity with the Advisor’s senior management through Board meetings, discussions and reports during the preceding year. The Board also took into account the Advisor’s compliance policies and procedures. The quality of administrative and other services, including the Advisor’s role in coordinating the activities of the Funds’ other service providers, was also considered. The Board also considered the Advisor’s relationship with its affiliates and the resources available to them, as well as any potential conflicts of interest.
The Board discussed the Advisor’s effectiveness in monitoring the performance of each Sub-Advisor, including those that were affiliates of the Advisor, and the Advisor’s timeliness in responding to performance issues. The Board considered the Advisor’s process for monitoring each of the Sub-Advisors, which includes an examination of both qualitative and quantitative elements of the Sub-Advisor’s organization, personnel, procedures, investment discipline, infrastructure and performance. The Board considered that the Advisor conducts regular on-site compliance visits with each Sub-Advisor, during which the Advisor examines a wide variety of factors, such as the financial condition of the Sub-Advisor, the quality of the Sub-Advisor’s systems, the effectiveness of the Sub-Advisor’s disaster recovery programs, trade allocation and execution procedures, compliance with the Sub-Advisor’s policies and procedures, results of regulatory examinations and any other factors that might affect the quality of services that the Sub-Advisor provides to the applicable Fund(s). The Board noted that the Advisor’s compliance monitoring processes also include quarterly reviews of compliance reports, and that any issues arising from such reports and the Advisor’s compliance visits to the Sub-Advisors are reported to the Board.
Other Items (Unaudited) (Continued)
The Trustees concluded that they were satisfied with the nature, extent and quality of services provided to each Fund by the Advisor under the Investment Advisory Agreement.
Advisor’s Compensation and Profitability. The Board took into consideration the financial condition and profitability of the Advisor and its affiliates (including the Sub-Advisor to certain of the Funds) and the direct and indirect benefits derived by the Advisor and its affiliates from the Advisor’s relationship with the Funds. The information considered by the Board included operating profit margin information for the Advisor’s business as a whole. The Board noted that the Advisor waived a portion of the fees of certain Funds. The Board also noted that the Advisor pays the Sub-Advisors’ sub-advisory fees out of the advisory fees the Advisor receives from the Funds. The Board reviewed the profitability of the Advisor’s relationship with the Funds both before and after tax expenses, and also considered whether the Advisor has the financial wherewithal to continue to provide a high level of services to the Funds, noting the ongoing commitment of the Advisor’s parent company with respect to providing support and resources as needed. The Board also noted that the Advisor derives benefits to its reputation and other benefits from its association with the Funds. The Board also considered that affiliates of the Advisor may benefit from certain indirect tax benefits, including those relating to dividend received deductions.
The Board recognized that the Advisor should be entitled to earn a reasonable level of profits in exchange for the level of services it provides to each Fund and the entrepreneurial risk that it assumes as Advisor. Based upon their review, the Trustees concluded that the Advisor’s and its affiliates’ level of profitability, if any, from their relationship with each Fund was reasonable and not excessive.
Expenses and Performance. The Board compared the respective advisory fees and total expense ratios for each of the Funds with various comparative data, including the median and average advisory fees and total expense ratios of each Fund’s respective peer group. The Board also considered, among other data, the Funds’ respective performance results during the six-month, twelve-month and thirty-six-month periods ended June 30, 2012 and noted that the Board reviews on a quarterly basis detailed information about each Fund’s performance results, portfolio composition and investment strategies. The Board also took into account current market conditions and their effect on the Funds’ performance.
The Board also considered the effect of each Fund’s growth and size on its performance and expenses. The Board noted that the Advisor had waived a portion of the fees of certain Funds in order to reduce those Funds’ respective operating expenses to targeted levels. The Board noted that the sub-advisory fees under the Sub-Advisory Agreement with respect to each Fund were paid by the Advisor out of the advisory fees it receives from the Fund and considered the impact of such sub-advisory fees on the profitability of the Advisor. In reviewing the respective expense ratios and performance of each of the Funds, the Board also took into account the nature, extent and quality of the services provided to the Funds by the Advisor and its affiliates.
The Board considered, among other data, the specific factors and related conclusions set forth below with respect to each Fund:
Touchstone Baron Small Cap Growth Fund. The Fund’s advisory fee and total expense ratio (net of applicable expense waivers) were above the median of its peer group. The Board noted that the Advisor was currently waiving a portion of the Fund’s fees. The Board took into account management’s discussion of the Fund’s expenses, including the impact that the relatively small size of the Fund has upon expenses. The Fund’s performance for the six-month period ended June 30, 2012 was in the 4th quintile of its peer group. The Fund’s performance for the twelve-month period ended June 30, 2012 was in the 1st quintile of its peer group, and the Fund’s performance for the thirty-six month period ended June 30, 2012 was in the 2nd quintile of its peer group. The Board noted management’s explanation for the Fund’s short-term underperformance. Based upon their review, the Trustees concluded that the Fund’s overall performance was satisfactory relative to the performance
Other Items (Unaudited) (Continued)
of funds with similar investment objectives and relevant indices, and that the advisory fee was reasonable in light of the high quality of services received by the Fund from the Advisor and the other factors considered.
Touchstone Core Bond Fund. The Fund’s advisory fee and total expense ratio were at the median and below the median, respectively, of its peer group. The Board took into account management’s discussion of the Fund’s expenses, including the impact that the relatively small size of the Fund has upon expenses. The Fund’s performance for the six-month period ended June 30, 2012 was in the 4th quintile of its peer group. The Fund’s performance for the twelve-month period ended June 30, 2012 was in the 1st quintile of its peer group, and the Fund’s performance for the thirty-six-month period ended June 30, 2012 was in the 2nd quintile of its peer group. The Board noted management’s explanation for the Fund’s short-term underperformance. Based upon their review, the Trustees concluded that the Fund’s overall performance was satisfactory relative to the performance of funds with similar investment objectives and relevant indices, and that the advisory fee was reasonable in light of the high quality of services received by the Fund from the Advisor and the other factors considered.
Touchstone High Yield Fund. The Fund’s advisory fee and total expense ratio (net of applicable expense waivers) were below the median and at the median, respectively, of its peer group. The Board noted that the Advisor was currently waiving a portion of the Fund’s fees. The Board took into account management’s discussion of the Fund’s expenses, including the impact that the relatively small size of the Fund has upon expenses. The Fund’s performance for the six-month period ended June 30, 2012 was in the 5th quintile of its peer group. The Fund’s performance for the twelve-month period ended June 30, 2012 was in the 1st quintile of its peer group, and the Fund’s performance for the thirty-six-month period ended June 30, 2012 was in the 3rd quintile of its peer group. The Board noted management’s explanation for the Fund’s short-term underperformance. Based upon their review, the Trustees concluded that the Fund’s overall performance was satisfactory relative to the performance of funds with similar investment objectives and relevant indices, and that the advisory fee was reasonable in light of the high quality of services received by the Fund from the Advisor.
Touchstone Large Cap Core Equity Fund. The Fund’s advisory fee and total expense ratio (net of applicable expense waivers) were below the median of its peer group. The Board noted that the Advisor was currently waiving a portion of the Fund’s fees. The Fund’s performance for the six-month period ended June 30, 2012 was in the 4th quintile of its peer group, and the Fund’s performance for the twelve- and thirty-six-month periods ended June 30, 2012 was in the 3rd quintile of its peer group. The Board noted management’s explanation for the Fund’s underperformance and management’s continued monitoring of the Fund’s performance. Based upon their review, the Trustees concluded that the Fund’s performance was being addressed and that the advisory fee was reasonable in light of the high quality of services received by the Fund from the Advisor.
Touchstone Mid Cap Growth Fund. The Fund’s advisory fee and total expense ratio (net of applicable expense waivers) were at the median and above the median, respectively, of its peer group. The Board noted that the Advisor was currently waiving a portion of the Fund’s fees. The Board also noted the addition of breakpoints to the Fund’s advisory fees, as well as the change in the Fund’s sub-advisory arrangements. The Board took into account management’s discussion of the Fund’s expenses, including the impact that the relatively small size of the Fund has upon expenses. The Fund’s performance for the six-month period ended June 30, 2012 was in the 1st quintile of its peer group. The Fund’s performance for the twelve-month period ended June 30, 2012 was in the 5th quintile of its peer group, and the Fund’s performance for the thirty-six-month period ended June 30, 2012 was in the 4th quintile of its peer group. The Board noted management’s explanation for the Fund’s underperformance and management’s continued monitoring of the Fund’s performance. The Board also noted the recent improvement in the Fund’s performance. Based upon their review, the Trustees concluded that the Fund’s performance was being addressed and that the advisory fee was reasonable in light of the high quality of services received by the Fund from the Advisor and the other factors considered.
Other Items (Unaudited) (Continued)
Touchstone Money Market Fund. The Fund’s advisory fee and total expense ratio (net of applicable expense waivers) were below the median of its peer group. The Board noted that the Advisor was currently waiving a portion of the Fund’s fees. The Fund’s performance for the six-and twelve-month periods ended June 30, 2012 was in the 2nd quintile of its peer group, and the Fund’s performance for the thirty-six-month period ended June 30, 2012 was in the 1st quintile of its peer group. Based upon their review, the Trustees concluded that the Fund’s performance was satisfactory relative to the performance of funds with similar investment objectives and relevant indices and that the advisory fee was reasonable in light of the high quality of services received by the Fund from the Advisor and the other factors considered.
Touchstone Third Avenue Value Fund. The Fund’s advisory fee and total expense ratio (net of applicable expense waivers) were above the median and below the median, respectively, of its peer group. The Board noted that the Advisor was currently waiving a portion of the Fund’s fees. The Board took into account management’s discussion of the Fund’s expenses, including the impact that the relatively small size of the Fund has upon expenses. The Fund’s performance for the six-month period ended June 30, 2012 was in the 2nd quintile of its peer group. The Fund’s performance for the twelve-month period ended June 30, 2012 was in the 5th quintile of its peer group, and the Fund’s performance for the thirty-six-month period ended June 30, 2012 was in the 3rd quintile of its peer group. The Board noted management’s explanation for the Fund’s underperformance and management’s continued monitoring of the Fund’s performance. The Board also noted the recent improvement in the Fund’s performance. Based upon their review, the Trustees concluded that the Fund’s performance was being addressed and that the advisory fee was reasonable in light of the high quality of services received by the Fund from the Advisor and the other factors considered.
Touchstone Conservative ETF Fund. The Fund’s advisory fee and total expense ratio (net of applicable expense waivers) were at the median and below the median, respectively, of its peer group. The Board noted that the Advisor was currently waiving a portion of the Fund’s fees. The Board took into account management’s discussion of the Fund’s expenses, including the impact that the relatively small size of the Fund has upon expenses. The Fund’s performance for the six-month period ended June 30, 2012 was in the 5th quintile of its peer group. The Fund’s performance for the twelve-month period ended June 30, 2012 was in the 2nd quintile of its peer group, and the Fund’s performance for the thirty-six-month period ended June 30, 2012 was in the 4th quintile of its peer group. The Board noted management’s discussion of the Fund’s performance. Based upon their review, the Trustees concluded that the Fund’s overall performance was being addressed and that the advisory fee was reasonable in light of the high quality of services received by the Fund from the Advisor.
Touchstone Moderate ETF Fund. The Fund’s advisory fee and total expense ratio (net of applicable expense waivers) were below the median of its peer group. The Board noted that the Advisor was currently waiving a portion of the Fund’s fees. The Fund’s performance for the six-month period ended June 30, 2012 was in the 4th quintile of its peer group. The Fund’s performance for the twelve-month period ended June 30, 2012 was in the 2nd quintile of its peer group, and the Fund’s performance for the thirty-six-month period ended June 30, 2012 was in the 3rd quintile of its peer group. The Board noted management’s discussion of the Fund’s performance. Based upon their review, the Trustees concluded that the Fund’s overall performance was satisfactory relative to the performance of funds with similar investment objectives and relevant indices, and that the advisory fee was reasonable in light of the high quality of services received by the Fund from the Advisor.
Touchstone Aggressive ETF Fund. The Fund’s advisory fee and total expense ratio (net of applicable expense waivers) were below the median of its peer group. The Board noted that the Advisor was currently waiving a portion of the Fund’s fees. The Fund’s performance for the six- and thirty-six-month periods ended June 30, 2012 was in the 2nd quintile of its peer group, and the Fund’s performance for the twelve-month period ended June 30, 2012 was in the 1st quintile of its peer group. Based upon their review, the Trustees concluded that the Fund’s overall performance was satisfactory relative to the performance of funds with similar investment
Other Items (Unaudited) (Continued)
objectives and relevant indices and that the advisory fee was reasonable in light of the high quality of services received by the Fund from the Advisor.
Touchstone Enhanced ETF Fund. The Fund’s advisory fee and total expense ratio (net of applicable expense waivers) were below the median of its peer group. The Board noted that the Advisor was currently waiving a portion of the Fund’s fees. The Fund’s performance for the six-month period ended June 30, 2012 was in the 4th quintile of its peer group. The Fund’s performance for the twelve-month period ended June 30, 2012 was in the 3rd quintile of its peer group, and the Fund’s performance for the thirty-six-month period ended June 30, 2012 was in the 5th quintile of its peer group. The Board noted management’s explanation for the Fund’s underperformance and management’s continued monitoring of the Fund’s performance. Based upon their review, the Trustees concluded that the Fund’s performance was being addressed and that the advisory fee was reasonable in light of the high quality of services received by the Fund from the Advisor and the other factors considered.
Economies of Scale. The Board considered the effect of each Fund’s current size and potential growth on its performance and expenses. The Board took into account management’s discussion of the Funds’ advisory fee structure. The Board considered the effective advisory fees under the Investment Advisory Agreement as a percentage of assets at different asset levels and possible economies of scale that might be realized if the assets of each Fund increase. The Board noted that the advisory fee schedules for some of the Funds contain breakpoints that would reduce the respective advisory fee rate on assets above specified levels as the respective Fund’s assets increased and considered the necessity of adding breakpoints with respect to the Funds that did not currently have such breakpoints in their advisory fee schedules. The Board determined that adding breakpoints at specified levels to the advisory fee schedule of each Fund that currently did not have such breakpoints was not appropriate at that time. The Board also noted that if a Fund’s assets increase over time, the Fund might realize other economies of scale if assets increase proportionally more than certain other expenses. The Board also considered the fact that, under the Investment Advisory Agreement, the advisory fee payable to the Advisor by a Fund was reduced by the total sub-advisory fee paid by the Advisor to the Fund’s Sub-Advisor.
Conclusion. In considering the renewal of the Funds’ Investment Advisory Agreement, the Board, including the Independent Trustees, did not identify any single factor as controlling, and each Trustee may have attributed different weights to the various factors. TheTrustees evaluated all information available to them on a Fund-by-Fund basis, and their determinations were made separately with respect to each Fund. The Board reached the following conclusions regarding the Funds’ Investment Advisory Agreement with the Advisor, among others: (a) the Advisor demonstrated that it possesses the capability and resources to perform the duties required of it under the Investment Advisory Agreement; (b) the Advisor maintains an appropriate compliance program; (c) the performance of each Fund is satisfactory relative to the performance of funds with similar investment objectives and relevant indices or, as discussed above, is being addressed; and (d) each Fund’s advisory fee is reasonable relative to those of similar funds and the services to be provided by the Advisor. Based on their conclusions, the Trustees determined with respect to each Fund that continuation of the Investment Advisory Agreement was in the best interests of the Fund and its shareholders.
In approving the Funds’ respective Sub-Advisory Agreements, the Board considered various factors with respect to each Fund and the applicable Sub-Advisory Agreement, among them: (1) the nature, extent and quality of services provided to the Fund, including the personnel providing such services; (2) the Sub-Advisor’s compensation; (3) a comparison of the sub-advisory fee and performance with other advisers; and (4) the terms of the Sub-Advisory Agreement. The Board’s analysis of these factors is set forth below. The Independent Trustees were advised by independent legal counsel throughout the process.
Nature, Extent and Quality of Services Provided; Investment Personnel. The Board considered information provided by the Advisor regarding the services provided by each Sub-Advisor, including information presented periodically
Other Items (Unaudited) (Continued)
throughout the previous year. The Board noted the affiliation of the Sub-Advisor to certain of the Funds with the Advisor, noting any potential conflicts of interest. The Board also noted that, on a periodic basis, the Board meets with portfolio managers of the Sub-Advisors to discuss their respective performance and investment processes and strategies. The Board considered each Sub-Advisor’s level of knowledge and investment style. The Board reviewed the experience and credentials of the applicable investment personnel who are responsible for managing the investment of portfolio securities with respect to the Funds. The Board also noted each Sub-Advisor’s brokerage practices.
Sub-Advisor’s Compensation. The Board also took into consideration the financial condition of each Sub-Advisor and any indirect benefits derived by each Sub-Advisor and its affiliates from the Sub-Advisor’s relationship with the Funds. In considering the profitability to each Sub-Advisor of its relationship with the Funds, the Board noted the undertakings of the Advisor to maintain expense limitations for the Funds and also noted that the sub-advisory fees under the Sub-Advisory Agreements were paid by the Advisor out of the advisory fees that it receives under the Investment Advisory Agreement and in addition, with respect to the unaffiliated Sub-Advisors, are negotiated at arm’s length. As a consequence, the profitability to each Sub-Advisor of its relationship with a Fund was not a substantial factor in the Board’s deliberations. For similar reasons, the Board did not consider the potential economies of scale in each Sub-Advisor’s management of the applicable Fund to be a substantial factor in its consideration, although the Board noted that the sub-advisory fee schedule for some of the Funds contained breakpoints that would reduce the sub-advisory fee rate on assets above specified levels as the applicable Fund’s assets increased.
Sub-Advisory Fees and Fund Performance. The Board considered that each Fund pays an advisory fee to the Advisor and that the Advisor pays the sub-advisory fee to the Sub-Advisor out of the advisory fee it receives from the respective Fund. The Board also compared the sub-advisory fees paid by the Advisor to fees charged by the Sub-Advisor to manage comparable institutional separate accounts. The Board considered the amount retained by the Advisor and the sub-advisory fee paid to each Sub-Advisor with respect to the various services provided by the Advisor and the Sub-Advisor. The Board also noted that the Advisor negotiated the sub-advisory fee with each of the unaffiliated Sub-Advisors at arm’s length. The Board reviewed the sub-advisory fee for each Fund in relation to various comparative data, including in most instances the median and average sub-advisory fees of each Fund’s peer group, and considered the following information:
Touchstone Baron Small Cap Growth Fund. The Fund’s sub-advisory fee was above the median of its peer group. Based upon their review, the Trustees concluded that the sub-advisory fee was reasonable in light of the quality of services received by the Fund from the Sub-Advisor and the other factors considered.
Touchstone Core Bond Fund. The Fund’s sub-advisory fee was above the median of its peer group. Based upon their review, the Trustees concluded that the sub-advisory fee was reasonable in light of the quality of services received by the Fund from the Sub-Advisor and the other factors considered.
Touchstone High Yield Fund. The Fund’s sub-advisory fee was at the median of its peer group. Based upon their review, the Trustees concluded that the sub-advisory fee was reasonable in light of the quality of services received by the Fund from the Sub-Advisor and the other factors considered.
Touchstone Large Cap Core Equity Fund. The Fund’s sub-advisory fee was below the median of its peer group. Based upon their review, the Trustees concluded that the sub-advisory fee was reasonable in light of the quality of services received by the Fund from the Sub-Advisor.
Touchstone Mid Cap Growth Fund. The Fund’s sub-advisory fee was at the median of its peer group. The Board took into account the recent addition of breakpoints in the sub-advisory fee for the Fund. Based upon their review, the Trustees concluded that the sub-advisory fee was reasonable in light of the quality of services received by the Fund from the Sub-Advisor and the other factors considered.
Other Items (Unaudited) (Continued)
Touchstone Money Market Fund. The Board considered the subadvisory fees paid to the Sub-Advisor by other Touchstone money market funds. Based upon their review, the Trustees concluded that the sub-advisory fee was reasonable in light of the quality of services received by the Fund from the Sub-Advisor.
Touchstone Third Avenue Value Fund. The Fund’s sub-advisory fee was above the median of its peer group. Based upon their review, the Trustees concluded that the sub-advisory fee was reasonable in light of the quality of services received by the Fund from the Sub-Advisor and the other factors considered.
Touchstone Conservative ETF Fund. The Fund’s sub-advisory fee was below the median of its peer group. Based upon their review, the Trustees concluded that the sub-advisory fee was reasonable in light of the quality of services received by the Fund from the Sub-Advisor and the other factors considered.
Touchstone Moderate ETF Fund. The Fund’s sub-advisory fee was below the median of its peer group. Based upon their review, the Trustees concluded that the sub-advisory fee was reasonable in light of the quality of services received by the Fund from the Sub-Advisor and the other factors considered.
Touchstone Aggressive ETF Fund. The Fund’s sub-advisory fee was below the median of its peer group. Based upon their review, the Trustees concluded that the sub-advisory fee was reasonable in light of the quality of services received by the Fund from the Sub-Advisor and the other factors considered.
Touchstone Enhanced ETF Fund. The Fund’s sub-advisory fee was below the median of its peer group. Based upon their review, the Trustees concluded that the sub-advisory fee was reasonable in light of the quality of services received by the Fund from the Sub-Advisor.
As noted above, the Board considered each Fund’s performance during the six-month, twelve-month and thirty-six-month periods ended June 30, 2012 as compared to each Fund’s peer group and noted that the Board reviews on a quarterly basis detailed information about each Fund’s performance results, portfolio composition and investment strategies. The Board noted the Advisor’s expertise and resources in monitoring the performance, investment style and risk-adjusted performance of each Sub-Advisor. The Board was mindful of the Advisor’s ongoing monitoring of each Sub-Advisor’s performance and the measures undertaken by the Advisor to address any underperformance.
Conclusion. In considering the renewal of the Sub-Advisory Agreement with respect to each Fund, the Board, including the Independent Trustees, did not identify any single factor as controlling, and each Trustee may have attributed different weights to the various factors. The Board reached the following conclusions regarding each Sub-Advisory Agreement, among others: (a) the Sub-Advisor is qualified to manage each Fund’s assets in accordance with the Fund’s investment objectives and policies; (b) the Sub-Advisor maintains an appropriate compliance program; (c) the performance of each Fund is satisfactory relative to the performance of funds with similar investment objectives and relevant indices or, as discussed above, is being addressed; (d) each Fund’s advisory fees are reasonable relative to those of similar funds and the services to be provided by the Advisor and the Sub-Advisor; and (e) the Sub-Advisor’s investment strategies are appropriate for pursuing the investment objectives of each Fund. Based on its conclusions, the Board determined that approval of the Sub-Advisory Agreement with respect to each Fund was in the best interests of the Fund and its shareholders.
Management of the Trust (Unaudited)
Listed below is basic information regarding the Trustees and principal officers of the Trust. The Trust’s Statement of Additional Information includes additional information about the Trustees and is available, without charge, upon request by calling 1.800.543.0407.
Interested Trustees1:
| | | | | Number | |
| | | | | of Funds | |
| | | | | Overseen | |
| | | Term of | | in the | |
| Name | Position(s) | Office2 And | | Touchstone | Other |
| Address | Held with | Length of | Principal Occupation(s) | Fund | Directorships |
| Age | Trust | Time Served | During Past 5 Years | Complex3 | Held During Past 5 Years4 |
| Jill T. McGruder Touchstone Advisors, Inc 303 Broadway Cincinnati, OH Year of Birth: 1955 | President and Trustee | Until retirement at age 75 or until she resigns or is removed Trustee since 1999 | President and CEO of IFS Financial Services, Inc. (a holding company). | 58 | Director of LaRosa’s (a restaurant chain), Capital Analysts Incorporated (an investment advisor and broker- dealer), IFS Financial Services, Inc. (a holding company), Integrity and National Integrity Life Insurance Co., Touchstone Securities (the Trust’s distributor), Touchstone Advisors (the Trust’s investment advisor and administrator), W&S Brokerage Services (a brokerage company) and W&S Financial Group Distributors (a distribution company). |
| Independent Trustees: | | | | | |
| Phillip R. Cox 105 East Fourth Street Cincinnati, OH Year of Birth: 1947 | Trustee | Until retirement at age 75 or until he resigns or is removed Trustee since 1994 | President and Chief Executive Officer of Cox Financial Corp. (a financial services company). | 58 | Director of Cincinnati Bell (a communications company), Bethesda Inc. (a hospital), Timken Co. (a manufacturing company), Diebold (a technology solutions company), and Ohio Business Alliance for Higher Education. Director of Duke Energy from 1994-2008. |
H. Jerome Lerner
c/o Touchstone Advisors, Inc. 303 Broadway Cincinnati, OH Year of Birth: 1938 | Trustee | Until retirement at age 75 or until he resigns or is removed Trustee since 1999 | None | 58 | BASCO Shower Enclosures (a design and manufacturing company) from 2000 to present; Hebrew Union College- Jewish Institute of Religion from 1990 to present. |
Management of the Trust (Unaudited) (Continued)
Independent Trustees (Continued):
| | | | | Number | |
| | | | | of Funds | |
| | | | | Overseen | |
| | | Term of | | in the | |
| Name | Position(s) | Office2 And | | Touchstone | Other |
| Address | Held with | Length of | Principal Occupation(s) | Fund | Directorships |
| Age | Trust | Time Served | During Past 5 Years | Complex3 | Held4 |
Donald C. Siekmann
c/o Touchstone Advisors,
Inc. 303 Broadway
Cincinnati, OH Year of
Birth: 1938 | Trustee | Until retirement at age 75 or until he resigns or is removed Trustee since 2005 | Executive for Duro Bag Manufacturing Co. (a bag manufacturer) from 2003-2008. | 58 | Riverfront Mutual Fund (until 2008). |
John P. Zanotti
c/o Touchstone Advisors, Inc. 303 Broadway Cincinnati, OH Year of Birth: 1948 | Trustee | Until retirement at age 75 or until he resigns or is removed Trustee since 2002 | Chairman of Integrated Media Technologies (a media company) from 2007 to present. | 58 | Cincinnati Children’s Hospital from 1994-2010. |
Susan J. Hickenlooper
c/o Touchstone Advisors, Inc. 303 Broadway Cincinnati, OH Year of Birth: 1946 | Trustee | Until retirement at age 75 or until he resigns or is removed Trustee since 2009 | Financial Analyst for Impact 100 (Charitable Organization) from 11/ 2012 to present. | 58 | Trustee of Gateway Trust (a mutual fund) from 2006 - 2009,Trustee of Cincinnati Parks Foundation (a charitable organization) from 2000 to present, Trustee of Episcopal Retirement Homes Foundation from 1998-2011. |
| 1 | Ms. McGruder, as a director of the Advisor and Touchstone Securities and an officer of various affiliates of the Advisor and Touchstone Securities, is an “interested person” |
| 2 | Each Trustee is elected to serve until the age of 75 or until he or she sooner resigns or is removed. |
| 3 | The Touchstone Fund Complex consists of 11 variable annuity series of the Trust, 22 series of Touchstone Strategic Trust, 3 series of Touchstone Tax-Free Trust, 4 series of Touchstone Investment Trust, 17 series of Touchstone Funds Group Trust, and 1 series of Touchstone Institutional Funds Trust. |
| 4 | Each Trustee is also a Trustee of Touchstone Tax-Free Trust, Touchstone Investment Trust, Touchstone Strategic Trust, Touchstone Funds Group Trust, and Touchstone Institutional Funds Trust. |
Management of the Trust (Unaudited) (Continued)
Principal Officers1:
| | | Term of | |
| Name | Position(s) | Office2 And | |
| Address | Held with | Length of | Other Principal Occupation(s) |
| Age | Trust | Time Served | During Past 5 Years |
| Jill T. McGruder | President | Until resignation, | See biography above. |
| Touchstone Advisors, Inc. | | removal or | |
| 303 Broadway | | disqualification | |
| Cincinnati, OH | | President since | |
| Year of Birth: 1955 | | 2004; President | |
| | | from 2000-2002 | |
| Steven M. Graziano | Vice | Until resignation, | President of Touchstone Advisors, Inc.; Executive Vice |
| Touchstone Advisors, Inc. | President | removal or | President of Pioneer Investment Management, Head of |
| 303 Broadway | | disqualification | Retail Distribution and Strategic Marketing 2007- |
| Cincinnati, OH | | Vice President | 2008; Executive Vice President of Pioneer Investment |
| Year of Birth: 1954 | | since 2009 | Management, Chief Marketing Officer 2002-2007. |
| Timothy D. Paulin | Vice | Until resignation, | Senior Vice President of Investment Research and |
| Touchstone Advisors, Inc. | President | removal or | Product Management of Touchstone Advisors, Inc; |
| 303 Broadway | | disqualification | Principal of Klein Decisions, Inc. 2003-2010. |
| Cincinnati, OH | | Vice President | |
| Year of Birth: 1963 | | since 2010 | |
| Michael Moser3 | Chief | Until resignation, | Vice President and Chief Compliance Officer of the |
| Western & Southern Financial | Compliance | removal or | Western & Southern Financial Group and Chief |
| Group | Officer | disqualification | Compliance Officer of Touchstone Advisors. |
| 400 Broadway | | Chief | |
| Cincinnati, OH | | Compliance | |
| Year of Birth: 1968 | �� | Officer since | |
| | | 2012 | |
| Terrie A. Wiedenheft | Controller | Until resignation, | Chief Operating Officer, Chief Financial Officer, and |
| Touchstone Advisors, Inc. | and | removal or | Senior Vice President of IFS Financial Services, Inc. |
| 303 Broadway | Treasurer | disqualification | |
| Cincinnati, OH | | Controller and | |
| Year of Birth: 1962 | | Treasurer since | |
| | | 2006 | |
| Elizabeth R. Freeman | Secretary | Until resignation, | Managing Director and Senior Counsel at BNY |
| BNY Mellon | | removal or | Mellon Investment Servicing (US) Inc. |
| 201 Washington Street | | disqualification. | |
| Boston, MA | | Secretary since | |
| }Year of Birth: 1962 | | 2011 | |
| 1 | Each officer also holds the same office with Touchstone Funds Group Trust, Touchstone Institutional Funds Trust, Touchstone Investment Trust, Touchstone Tax-Free Trust, and Touchstone Tax-Free Trust. |
| 2 | The Touchstone Fund Complex consists of 11 variable annuity series of the Trust, 3 series of Touchstone Tax-Free Trust, 1 series of Touchstone Institutional Funds Trust, 4 series of Touchstone Investment Trust, 22 series of Touchstone Strategic Trust, and 17 series of Touchstone Funds Group Trust. |
| 3 | Joseph Melcher resigned as Chief Compliance Officer effective September 5, 2012. |
PRIVACY PROTECTION POLICY
We Respect Your Privacy
Thank you for your decision to invest with us. Touchstone and its affiliates have always placed a high value on the trust and confidence our clients place in us. We believe that confidence must be earned and validated through time. In today’s world, when technology allows the sharing of information at light speeds, trust must be reinforced by our sincere pledge to take the steps necessary to ensure that the information you share with us is treated with respect and confidentiality.
Our Pledge to Our Clients
| · | We collect only the information we need to service your account and administer our business. |
| · | We are committed to keeping your information confidential and we place strict limits and controls on the use and sharing of your information. |
| · | We make every effort to ensure the accuracy of your information. |
We Collect the Following Nonpublic Personal Information About You:
| · | Information we receive from you on or in applications or other forms, correspondence, or conversations, including, but not limited to, your name, address, phone number, social security number, assets, income and date of birth; and |
| · | Information about your transactions with us, our affiliates, or others, including, but not limited to, your account number and balance, payment history, parties to transactions, cost basis information, and other financial information. |
Categories of Information We Disclose and Parties to Whom We Disclose
We do not disclose any nonpublic personal information about our current or former clients to nonaffiliated third parties, except as required or permitted by law.
We Place Strict Limits and Controls on the Use and Sharing of Your Information
| · | We restrict access to nonpublic personal information about you to authorized employees who need the information to administer your business. |
| · | We maintain physical, electronic and procedural safeguards that comply with federal standards to protect this information. |
| · | We do not disclose any nonpublic personal information about our current or former clients to anyone, except as required or permitted by law or as described in this document. |
| · | We will not sell your personal information to anyone. |
We May Provide Information to Service Your Account
Sometimes it is necessary to provide information about you to various companies such as transfer agents, custodians, broker-dealers and marketing service firms to facilitate the servicing of your account. These organizations have a legitimate business need to see some of your personal information in order for us to provide service to you. We may disclose to these various companies the information that we collect as described above. We require that these companies, including our own subsidiaries and affiliates, strictly maintain the confidentiality of this information and abide by all applicable laws. Companies within our corporate family that may receive this information are financial service providers and insurance companies. We do not permit these associated companies to sell the information for their own purposes, and we never sell our customer information.
This policy is applicable to the following affiliated companies: Touchstone Funds Group Trust, Touchstone Investment Trust, Touchstone Strategic Trust, Touchstone Tax-Free Trust, Touchstone Variable Series Trust, Touchstone Institutional Funds Trust, Touchstone Securities, Inc.,* and W&S Brokerage Services, Inc.
* Touchstone Securities, Inc. serves as the underwriter to the Touchstone Funds.
A Member of Western & Southern Financial Group®
The Privacy Protection Policy is not part of the Annual Report.

TSF-1006-TVST-AR-1212
Item 2. Code of Ethics.
| (a) | The registrant, as of the end of the period covered by this report, has adopted a code of ethics that applies to the registrant’s principal executive officer, principal financial officer, principal accounting officer or controller, or persons performing similar functions, regardless of whether these individuals are employed by the registrant or a third party. |
| (c) | There have been no amendments, during the period covered by this report, to a provision of the code of ethics that applies to the registrant’s principal executive officer, principal financial officer, principal accounting officer or controller, or persons performing similar functions, regardless of whether these individuals are employed by the registrant or a third party, and that relates to any element of the code of ethics description. |
| (d) | The registrant has not granted any waivers, including an implicit waiver, from a provision of the code of ethics that applies to the registrant’s principal executive officer, principal financial officer, principal accounting officer or controller, or persons performing similar functions, regardless of whether these individuals are employed by the registrant or a third party, that relates to one or more of the items set forth in paragraph (b) of this item’s instructions. |
Item 3. Audit Committee Financial Expert.
The registrant’s Board of Trustees has determined that the registrant has at least one audit committee financial expert serving on its audit committee. Mr. Donald Siekmann is the registrant’s audit committee financial expert and is an independent trustee within the meaning of the Investment Company Act of 1940, as amended (the “1940 Act”).
Item 4. Principal Accountant Fees and Services.
Audit Fees
| (a) | Audit fees for Touchstone Variable Series Trust totaled $143,000 and $143,000 in fiscal 2012 and 2011, respectively, including fees associated with the annual audits and filings of Form N-1A and Form N-SAR. |
Audit-Related Fees
| (b) | Audit-related fees totaled $0 and $7,150 in fiscal 2012 and 2011, respectively. The 2011 fees related to conversion testing from the Trust’s former fund accountant and transfer agent (JPMorgan) to the Trust’s current fund accountant and transfer agent (BNY Mellon). |
Tax Fees
| (c) | Fees for tax compliance services totaled $29,500 and $29,500 in fiscal 2012 and 2011, respectively. Fees for 2012 relate to the preparation of federal income tax returns and review of capital gains distribution calculations. |
All Other Fees
| (d) | There were no fees for all other services to Touchstone Variable Series Trust not included above. |
| (e)(1) | Disclose the audit committee's pre-approval policies and procedures described in paragraph (c)(7) of Rule 2-01 of Regulation S-X. |
The Audit Committee’s pre-approval policies describe the types of audit, audit-related, tax and other services that have the general pre-approval of the Audit Committee. The pre-approval policies provide that annual audit service fees, tax services not specifically granted pre-approval, services exceeding pre-approved cost levels and other services that have not received general pre-approval will be subject to specific pre-approval by the Audit Committee. The pre-approval policies further provide that the Committee may grant general pre-approval to other audit services (statutory audits and services associated with SEC registration statements, periodic reports and other documents filed with the SEC or other documents issued in connection with securities offerings), audit-related services (accounting consultations related to accounting, financial reporting or disclosure matters not classified as “audit services,” assistance with understanding and implementing new accounting and financial reporting guidance from rulemaking authorities, agreed-upon or expanded audit procedures related to accounting and/or billing records required to respond to or comply with financial, accounting or regulatory reporting matters and assistance with internal control reporting requirements under Form N-SAR and Form N-CSR), tax services that have historically been provided by the auditor that the Committee believes would not impair the independence of the auditor and are consistent with the SEC’s rules on auditor independence and permissible non-audit services classified as “all other services” that are routine and recurring services.
| (e)(2) | All services described in paragraphs (c) through (d) of Item 4 were approved by the Audit Committee. Not applicable for paragraph (b) of Item 4. |
| (f) | The percentage of hours expended on the principal accountant's engagement to audit the registrant's financial statements for the most recent fiscal year that were attributed to work performed by persons other than the principal accountant's full-time, permanent employees was less than fifty percent. |
| (g) | The aggregate non-audit fees for Touchstone Variable Series Trust and certain entities*, totaled approximately $71,000 and $61,300, in 2012 and 2011, respectively. |
* These include the advisors (excluding sub-advisors) and any entity controlling, controlled by or under common control with the advisors that provides ongoing services to the registrant (Funds).
| (h) | The registrant's audit committee of the board of trustees has considered whether the provision of non-audit services that were rendered to the registrant's investment adviser (not including any sub-adviser whose role is primarily portfolio management and is subcontracted with or overseen by another investment adviser), and any entity controlling, controlled by, or under common control with the investment adviser that provides ongoing services to the registrant that were not pre-approved pursuant to paragraph (c)(7)(ii) of Rule 2-01 of Regulation S-X is compatible with maintaining the principal accountant's independence. |
Item 5. Audit Committee of Listed registrants.
Not applicable.
Item 6. Investments.
| (a) | Schedule of Investments in securities of unaffiliated issuers as of the close of the reporting period is included as part of the report to shareholders filed under Item 1 of this form. |
Item 7. Disclosure of Proxy Voting Policies and Procedures for Closed-End Management Investment Companies.
Not applicable.
Item 8. Portfolio Managers of Closed-End Management Investment Companies.
Not applicable.
Item 9. Purchases of Equity Securities by Closed-End Management Investment Company and Affiliated Purchasers.
Not applicable.
Item 10. Submission of Matters to a Vote of Security Holders.
There have been no material changes to the procedures by which the shareholders may recommend nominees to the registrant’s board of trustees, where those changes were implemented after the registrant last provided disclosure in response to the requirements of Item 407(c)(2)(iv) of Regulation S-K (17 CFR 229.407) (as required by Item 22(b)(15) of Schedule 14A (17 CFR 240.14a-101)), or this Item.
Item 11. Controls and Procedures.
| (a) | The registrant’s principal executive and principal financial officers, or persons performing similar functions, have concluded that the registrant’s disclosure controls and procedures (as defined in Rule 30a-3(c) under the Investment Company Act of 1940, as amended (the “1940 Act”) (17 CFR 270.30a-3(c))) are effective, as of a date within 90 days of the filing date of the report that includes the disclosure required by this paragraph, based on their evaluation of these controls and procedures required by Rule 30a-3(b) under the 1940 Act (17 CFR 270.30a-3(b)) and Rules 13a-15(b) or 15d-15(b) under the Securities Exchange Act of 1934, as amended (17 CFR 240.13a-15(b) or 240.15d-15(b)). |
| (b) | There were no changes in the registrant’s internal control over financial reporting (as defined in Rule 30a-3(d) under the 1940 Act (17 CFR 270.30a-3(d)) that occurred during the registrant’s second fiscal quarter of the period covered by this report that has materially affected, or is reasonably likely to materially affect, the registrant’s internal control over financial reporting. |
Item 12. Exhibits.
| (a)(1) | Code of ethics, or any amendment thereto, that is the subject of disclosure required by Item 2 is attached hereto. |
| (a)(2) | Certifications pursuant to Rule 30a-2(a) under the 1940 Act and Section 302 of the Sarbanes-Oxley Act of 2002 are attached hereto. |
| (b) | Certifications pursuant to Rule 30a-2(b) under the 1940 Act and Section 906 of the Sarbanes- Oxley Act of 2002 are attached hereto. |
SIGNATURES
Pursuant to the requirements of the Securities Exchange Act of 1934 and the Investment Company Act of 1940, the registrant has duly caused this report to be signed on its behalf by the undersigned, thereunto duly authorized.
| (Registrant) | Touchstone Variable Series Trust | |
| By (Signature and Title)* | /s/ Jill T. McGruder | |
| | Jill T. McGruder, President | |
| | (principal executive officer) | |
Pursuant to the requirements of the Securities Exchange Act of 1934 and the Investment Company Act of 1940, this report has been signed below by the following persons on behalf of the registrant and in the capacities and on the dates indicated.
| By (Signature and Title)* | /s/ Jill T. McGruder | |
| | Jill T. McGruder, President | |
| | (principal executive officer) | |
| By (Signature and Title)* | /s/ Terrie A. Wiedenheft | |
| | Terrie A. Wiedenheft, Controller and Treasurer | |
| | (principal financial officer) | |
* Print the name and title of each signing officer under his or her signature.